TUI AG Financial Year 2004 Interim Report 1 January – 30 June 2004 2nd quarter 2004

Welcome message from author
This document is posted to help you gain knowledge. Please leave a comment to let me know what you think about it! Share it to your friends and learn new things together.
Transcript

TUI AGKarl-Wiechert-Allee 4D-30625 HanoverGermany
TUI AG Financial Year 2004Interim Report 1 January – 30 June 2004
2nd quarter 2004

3 General economic situation
3 Turnover and earnings3 Group5 Tourism8 Logistics9 Other sectors
11 Group profit
13 Financial position
14 Business trend in the divisions
14 Tourism15 Central Europe17 Northern Europe19 Western Europe20 Destinations21 Other tourism
22 Logistics22 Shipping23 Special logistics
25 Other sectors25 Trading25 Divestments
26 Prospects
27 Further information27 Additional key figures
by segments27 Employees28 Corporate Governance
30 Financial statements
34 Notes
Financial Calendar 2004/2005
Interim Report January to September 2004 11 November 2004Annual Press Conference 2005 23 March 2005Interim Report January to March 2005 11 May 20051)
Annual General Meeting 2005 11 May 2005Interim Report January to June 2005 11 August 20051)
Interim Report January to September 2005 1 November 20051)
1) scheduled
Imprint
TUI AGKarl-Wiechert-Allee 4D-30625 Hanover
Phone ++49.0511.566-00Telefax ++49.0511.566-1901E-Mail [email protected] www.tui.com
The german Version of this report is legally binding. The Company cannotbe held responsible for any misunderstandings or misinterpretation arisingfrom this translation. Both versions are available on the web: www.tui.com

1
bTUI shows good business development in 2004Strong improvement in operating results
bUpswing in tourismAt € 100 million, second quarter earnings almost doubled
At least 70 percent increase in earnings for 2004 financial year expected
bGrowth in shipping continuesAt € 79 million, second quarter earnings well above previous year
Further positive development in the second half-year expected
bExtraordinary good earnings in tradingSecond quarter earnings improved to € 39 million
bStrong increase of operating results by divisions
in 2004More than € 420 million (previous year: € 242 million) expected

TUI Group in figures€ million H1 2004 H1 2003 Var. %
TurnoverTourism 5,635 5,457 + 3.3Logistics 1,766 1,853 - 4.7Other 653 1,508 - 56.7Group 8,054 8,818 - 8.7
Earnings by divisions (EBTA)Tourism - 85 - 199 + 57.3Logistics 106 103 + 2.9Other - 97 628 - 115.4Group - 76 532 - 114.3
Earnings before interest, tax, depreciation and amortisation (EBITDA)Tourism 69 - 43 + 260.5Logistics 209 216 - 3.2Other 50 719 - 93.0Group 328 892 - 63.2
Group profit - 36 410 n. m.Results attributableto shareholders of TUI AG - 41 408 n. m.Number of shares million 178.5 178.0 + 0.2Earnings per share € - 0.23 2.29 n. m.
Cash flow from operating activities 826 883 - 6.4
Capital expenditure 293 359 - 18.2
Depreciation/ amortisation 274 448 - 39.0
€ million 30 June 2004 31 Dec 2003 Var. %
AssetsNon-current assets 10,115 10,271 - 1.5Current assets 3,580 2,718 + 31.7Total assets 13,694 12,989 + 5.4
Equity and liabilitiesEquity 2,740 2,767 - 1.0Non-current liabilities 4,927 4,204 - 17.2Current liabilities 6,027 6,018 + 0.2Total equity and liabilities 13,694 12,989 + 5.4
Equity ratio % 20.0 21.3 - 1.3
Net debt 3,288 3,828 - 14.1
Employees No. 66,213 64,257 + 3.0
Interim Report 2nd Quarter 2004
2

General economic situationIn the first half of 2004, the world economy continued on the strong upswing. Major overall conditions which have hitherto been the drivingforce behind this trend are expected to be less favourable in the secondhalf of the year. Nevertheless, stimulating forces are expected to bestrong enough to keep the world economy on the path of expansion.
Regional developmentEconomic expansion was particularly strong in the Asian region, boostedby the strong demand in China. The US saw a consolidation of economicrecovery and strong growth in employment. In the European Union, thepace of expansion continued to pick up but was relatively moderate incomparison with other regions. Exports continued to be the mainstay ofgrowth, while private consumption did not yet provide a major impetus.
Development of the divisionsTourism continued to show an upward trend, as in the first quarter. Theeconomic and political environment continues to brighten so that thesecond half of the year is expected to improve on the difficult previousyear. Regional differences persisted, with markets which had been parti-cularly strongly affected last year recording aboveaverage improvements.
In the logistics division, the positive trend in container shipping conti-nued. Transport volumes grew again, with freight rates maintaining theirhigh levels. This was essentially attributable to persistent growth in theAsian economies and economic activity in the US.
Turnover and earnings
Group turnoverIn the second quarter of 2004, the TUI Group’s turnover totalled € 4.54billion (previous year: € 5.04 billion). In the first half of 2004, Group turn-over totalled € 8.05 billion (previous year: € 8.82 billion). The decline of10.0% in the second quarter or 8.7% in the first half of the year resultedfrom the divestments made in the course of the previous year and in thefirst half of 2004. Adjusted for relevant turnover, Group turnover fromcontinued operations grew by 6.1% in the second quarter and 6.2% inthe first half of the year.
At € 3.30 billion (previous year: € 3.23 billion), tourism reported a 2.1%increase in turnover in the second quarter of 2004. Turnover grew sub-stantially in the Northern Europe sector. In the first half of the year, tour-ism generated an increase in turnover to € 5.63 billion (previous year:
3
Q2, 2004 – Good business development, strong improvement in operating results

€ 5.46 billion), up 3.3%. Due to the structural changes in the division,logistics reported a 9.3% decline in turnover to € 846 million (previousyear: € 953 million) in the second quarter of 2004. As a result, turnoverfor the first half of 2004 dropped by 4.7% to € 1.77 billion (previous year:€ 1.85 billion) year-on-year as the growth in container shipping only partiallyoffset the decline in turnover caused by the divestments in the speciallogistics sector. Other sectors recorded a 56.7% decline in turnover to € 370 million (previous year: € 856 million) in the second quarter of 2004as well as a 56.7% decline in turnover for the first half of 2004 to € 653million (previous year: € 1.51 billion). This was primarily attributable tothe divestment of the AMC Group in October 2003. The turnover of theremaining activities rose.
Group turnover by divisions€ million Q2 2004 Q2 2003 H1 2004 H1 2003 Var. %
Tourism 3,302.8 3,234.9 5,634.8 5,456.9 + 3.3Central Europe 1,342.3 1,356.5 2,156.2 2,186.3 - 1.4Northern Europe 1,212.0 1,095.0 2,060.2 1,822.3 + 13.1Western Europe 590.5 604.2 1,097.8 1,096.7 + 0.1Destinations 86.3 112.3 185.5 222.9 - 16.8Other tourism 71.7 66.9 135.1 128.7 + 5.0Logistics 864.4 953.3 1,765.8 1,852.6 - 4.7Shipping 672.4 577.0 1,247.0 1,105.9 + 12.8Special logistics 192.0 376.3 518.8 746.7 - 30.5Other sectors 370.4 855.8 652.7 1,508.0 - 56.7Trading 251.5 155.3 450.9 316.8 + 42.3Divestments – 591.8 – 1,011.3 –Central operations 118.9 108.7 201.8 179.9 + 12.2Group turnover 4,537.6 5,044.0 8,053.3 8,817.5 - 8.7
Earnings by divisions€ million Q2 2004 Q2 2003 H1 2004 H1 2003 Var. %
Tourism 100 53 - 85 - 199 + 57.3Central Europe 39 0 - 46 - 109 + 57.8Northern Europe 42 29 - 52 - 98 + 46.9Western Europe - 8 - 6 - 19 - 13 - 46.2Destinations 18 24 26 17 + 52.9Other tourism 9 6 6 4 + 50.0Logistics 72 68 106 103 + 2.9Shipping 79 45 104 64 + 62.5Special logistics - 7 23 2 39 - 94.9Other sectors - 39 499 - 97 628 - 115.4Trading 39 – 64 - 1 –Divestments – – – 3 –Central operations - 78 499 - 161 626 - 125.7Earnings by divisions (EBTA) 133 620 - 76 532 - 114.3
Interim Report 2nd Quarter 2004 Economic Situation
4

Adjusted EBTA€ million Q2 2004 Q2 2003 H1 2004 H1 2003 Var. %
Earnings by divisions (EBTA) 133 620 - 76 532 - 114.3Unusual expensesand income 21 649 39 849 –Adjusted EBTA 112 - 29 - 115 - 317 + 63.7
Earnings by divisionsIn the second quarter of 2004, the TUI Group recorded earnings bydivisions (EBTA) of € 133 million (previous year: € 620 million), with theprevious year’s earnings characterised by the unusual income from thedivestment of the energy sector. Earnings by divisions for the first half of2004 totalled € - 76 million (previous year: € 532 million) as unusualexpenses and income were only minor compared with last year.
Disregarding unusual expenses and income, adjusted earnings by divisionstotalled € 112 million (previous year: € - 29 million) in the second quarterof 2004, i.e. positive earnings which were considerably up on the previousyear. This was mainly due to the significant improvement of earnings intourism and the increase in earnings in container shipping. Moreover, theUS steel service companies recorded extraordinarily good quarterly earn-ings again. Adjusted earnings by divisions for the first half of 2004 totalled€ - 115 million (previous year: € - 317 million), an improvement of 63.7%year-on-year.
TourismFollowing the successful start to the new financial year, the upward trendin the tourism division persisted in the second half of the year. At a totalof 5.07 million customers, the TUI Group’s tour operators recorded anincrease of just under 1% year-on-year. Customers totalled € 8.20 millionin the first half of 2004, around 2% growth year-on-year. The turnover ofthe tourism division rose by 2.1% to € 3.30 billion (previous year: € 3.23billion) in the second half of 2004. Accumulated turnover for the first halfof 2004 totalled € 5.63 billion (previous year: 5.46 billion), up 3.3% year-on-year.
In the second quarter of 2004, earnings of the tourism division rose to € 100 million (previous year: € 53 million), up 88.7% on the previousyear. This was primarily attributable to the upturn in Central Europe andNorthern Europe which reported a recovery of business in source marketsGermany, UK and Scandinavia which had been particularly adverselyaffected by the period of weakness in the previous year. Earnings generated
Economic Situation Interim Report 2nd Quarter 2004
5
Adjusted EBTA
Turnover tourism
Earnings tourism

Interim Report 2nd Quarter 2004 Economic Situation
6
by the Western Europe sector fell slightly short of the previous year’s level.This also applied to the destinations sector. Accumulated earnings of thetourism division in the first half of 2004 rose by 57.3% and totalled € - 85million (previous year: € - 199 million).
In the second quarter of 2004, the tour operators in the Central Europesector (Germany, Austria, Switzerland and Hapag-Lloyd Flug) reported adecline of around 1% in customers year-on-year to a total of 2.23 millionguests, with Germany reporting an overall stable number. At € 1.34 billion(previous year: € 1.36 billion), turnover was 1.0% lower than the previousyear. Germany and Austria reported a slight decline in turnover year-on-year while turnover in Switzerland was stable. In the first half of 2004, theCentral Europe sector reported a slight growth in customers to 3.50 million;turnover dropped by 1.4% to € 2.16 billion (previous year: € 2.19 billion).
Due to the good quality of the tour operator business in Germany, and inparticular the increase in utilisation of flight capacities, the earnings inthe Central Europe sector improved substantially to € 39 million (previousyear: € 0 million) in the second quarter of 2004. The growth was almostexclusively attributable to the improvement in earnings in Germany. Switzerland reported a slight increase in earnings, while earnings in Austriaremained on the previous year’s level. Accumulated earnings improved forthe first half of 2004 of the sector to € - 46 million (previous year: € - 109 million).
In the second quarter of 2004, customers travelling with tour operators inthe Northern Europe sector (UK, Ireland, Nordic countries and BritanniaAirways) increased by just under 6% to 1.81 million. Turnover grew by10.7% to € 1.21 billion (previous year: € 1.10 billion). The UK accountedfor around two thirds of this turnover growth. It was attributable both tohigher volumes but also an increase in price levels. The recovery in theNordic countries persisted. It accounted for around one third of thegrowth in turnover. The comparatively small Irish market continued to bedifficult, with turnover roughly matching the previous year’s level. In thefirst half of 2004, customers in the Northern Europe sector rose by morethan 8% to 2.90 million. Turnover generated in that period totalled € 2.06billion (previous year: € 1.82 billion), up 13.1%.
In the second quarter of 2004, the Northern Europe sector generatedturnover of € 42 million (previous year: € 29 million), an increase of44.8%. Continuing on the positive trend reported in the previous year,the Nordic countries made a substantial contribution, as did flight opera-tions in the UK, which increased their profit contribution year-on-year.
Central Europe
Northern Europe

Economic Situation Interim Report 2nd Quarter 2004
7
At € - 52 million (previous year: € - 98 million), the Northern Europesector also reported an overall improvement in performance year-on-year.
In the second quarter of 2004, customers travelling with the tour operatorsof the Western Europe sector (France, Netherlands, Belgium and Corsair)totalled 1.03 million, down around 4% year-on-year. Trends varied in theindividual countries. While Belgium and the Netherlands reported growth,France recorded a decline. However, the turnover generated by the sectoronly fell by 2.3% to € 591 million (previous year: € 604 million). Customersfor the first half of 2004 totalled 1.80 million and hence also fell short ofthe previous year’s level. Total turnover of the sector amounted to € 1.10billion (previous year: € 1.10 billion), up 0.1% year-on-year.
In the Western Europe sector, the development of earnings again showedregional variations in the second quarter of 2004. At € - 8 million (pre-vious year: € - 6 million), earnings were slightly below the previous year’slevel. Belgium and the Netherlands reported improvements in earningswhile France achieved lower quarterly earnings. As a result, earnings bythe sector for the first half of 2004 again were slightly lower than in theprevious year at € - 19 million (previous year: € - 13 million).
In the second quarter of 2004, turnover in the destinations sector (in-coming agencies and hotel companies) totalled € 86 million (previousyear: € 112 million), down 23.2% year-on-year. This was mainly due to adecline in turnover with third parties in hotel companies as capacitieswere increasingly occupied by the Group’s own tour operator customers.At € 186 million (previous year: € 223 million), turnover in the first halfof 2004 therefore did not fully match the previous year’s level.
Earnings by the destinations sector totalled € 18 million (previous year: € 24 million), in the second quarter of 2004. This was equally attributableboth to hotel companies and destination services, supported by good occu-pancy rates. In the first half of 2004, earnings by the sector rose to € 26million (previous year: € 17 million), a 52.9% increase on the previous year.
In the second quarter of 2004, the Other tourism sector (business traveland IT service providers) generated turnover of € 72 million (previousyear: € 67 million). At € 9 million (previous year: € 6 million), earningswere upon the previous year’s level. In the first half of 2004, turnoverexceeded the previous year’s level at € 135 million (previous year: € 129 million). Earnings totalled € 6 million, following € 4 million in thesame quarter last year.
Western Europe
Destinations
Other tourism
Interim Report 2nd Quarter 2004 Economic Situation
8
LogisticsThe logistics division, with its remaining operations, successfully completedthe second quarter of 2004. Container shipping in particular continuedthe positive business trend. At € 864 million (previous year: € 953 milllion),turnover dropped by an arithmetic 9.3% year-on-year. This was attributableto the decline in turnover in special logistics, which was mainly due to thedivestment of Pracht Spedition + Logistik and of the bulk and speciallogistics operations of VTG-Lehnkering with effect from 1 January 2004and 1 April 2004 respectively. On a like-for-like basis, the logistics divisiongenerated a 10.9% increase in turnover, supported above all by growth incontainer shipping. In the first half of 2004, turnover totalled € 1.77 billion(previous year: € 1.85 billion). The remaining business of the divisionachieved an 8.2% increase in turnover in this period.
In the second quarter of 2004, the logistics division generated earningsof € 72 million (previous year: € 68 million), up 5.9%. The significant im-provement in container shipping more than offset the decline in speciallogistics which was mainly attributable to the divestments. Due to thegrowth in shipping, earnings in the first half of 2004 rose to € 106 million(previous year: € 103 million), up 2.9% year-on-year.
The shipping sector reported persistent growth in business volumes. At625,000 standard containers (TEU), the transport volume grew by 20.7%year-on-year in the second quarter of 2004. At 1.17 million TEU, totaltransport volumes grew by 18.8% in the first half of 2004. Boosted byvolume growth at persistently high freight rates, turnover in the secondquarter of 2004 rose to € 672 million (previous year: € 577 million) andthus rose by 16.5% year-on-year. For the first half of 2004, shippingreported growth in turnover of 12.8% to € 1.25 billion (previous year: € 1.11 billion).
Earnings by the shipping sector in the second half of 2004 rose by 75.6%to € 79 million (previous year: € 45 million). This was mainly due to theincrease in transport volumes in container shipping and the developmentof US dollar-denominated freight rates, which again were slightly higheryear-on-year on the main shipping routes. The development of earningswas curbed by the persistently weak US dollar. At € 104 million (previousyear: € 64 million) for the first half year of 2004, the sector recorded a62.5% increase in earnings on the previous year.
In the second quarter of 2004, at € 192 million (previous year: € 376 mil-lion), the special logistics sector reported a significant decline in turnoveryear-on-year, primarily attributable to the divestments of Pracht Spedi-
Turnover logistics
Earnings logistics
Shipping
Special logistics

tion + Logistik and the bulk and special logistics operations of VTG-Lehn-kering. At € 519 million (previous year: € 747 million), the turnover gene-rated in the first half of 2004 there-fore also fell short of the previousyear’s level. Adjusted for the divestment effect, turnover fell by 1.3%, withboth rail logistics of VTG AG and Algeco’s mobile buildings rental businesscontributing to this trend.
The remaining operations of special logistics reported earnings of € - 7million (previous year: € 23 million) for the second quarter of 2004 andof € 2 million (previous year: € 39 million) for the first half of 2004, withthe second quarter characterised by restructuring expenses.
Other sectorsFollowing the divestment of the AMC Group, the trading sector in 2004only comprises the companies of the PNA Group operating in the steelservice business in the US. Against the background of favourable economicactivity in the steel sector, the sector again reported an extraordinarilygood business trend. At 514,000 tons, steel sales increased by 13.0%year-on-year. Price levels also increased. As a result, turnover rose by61.9% to € 252 million (previous year: € 155 million) in the second quarterof 2004. For the first half of 2004, the PNA Group reported turnover of€ 451 million (previous year: € 317 million), up 42.3%.
The positive business trend was also reflected by the earnings of thePNA Group which again rose substantially to € 39 million (previous year:€ 0 million) in the second quarter of 2004 and already totalled € 64 mil-lion (previous year: € - 1 million) for the first half of 2004.
In 2003, the divestments sector comprised the former energy sector andthe AMC Group, included in consolidation until the end of June 2003 andthe end of October 2003 respectively, and hence included in the relevantfigures for the 2003 financial year. The gains on disposal from thesedivestments are reported under central operations in the managementreports for the relevant quarters.
Besides TUI AG with its corporate centre functions, central operationsincluded the Group’s real estate companies, the remaining industrial acti-vities and the newly formed low-cost carriers Hapag-Lloyd Express andThomsonfly.
Central operations reported turnover of € 119 million (previous year: € 109 million) in the second quarter of 2004 and € 202 million (previousyear: € 180 million) in the first half of 2004. Central operations recorded
Economic Situation Interim Report 2nd Quarter 2004
9
Trading
Divestments
Central operations

total earnings of € - 78 million (previous year: € 499 million) in thesecond half of 2004 and € - 161 million (previous year: € 626 million) inthe first half of 2004. A breakdown of turnover and earnings of centraloperations is provided below.
In the past, earnings of central operations were significantly affected byunusual expenses and income, mainly resulting from the divestmentsmade in the respective periods. In the second quarter of 2004 the neteffect totalled only € 21 million (previous year: € 649 million) and a totalof € 39 million (previous year: € 849 million) in the first half of 2004. Theprevious year’s high level of earnings was due to income from the divest-ment of the indirect shareholding in Ruhrgas AG in the first quarter of2003 and Preussag Energie GmbH in the second quarter of 2003. Thedivestments made in the first half of 2004 were only comparatively small.
The costs of central operations, which mainly consisted of the costs ofTUI AG’s corporate centre functions, totalled € - 23 million (previous year:€ - 61 million) in the second quarter of 2004 and stood at € - 67 million(previous year: € - 86 million) for the first half of 2004.
The net interest result of central operations in the second quarter of2004 at € - 53 million (previous year: € - 11 million), was higher than inthe previous year due to the refinancing measures and hence increasedto € - 89 million for the first half of 2004 (previous year: € - 53 million).
Other expenses and income totalled € - 10 million (previous year: € - 68million) in the second quarter of 2004 and € - 1 million (previous year: € - 49 million) in the first half of 2004. They mainly related to the earn-ings of other companies and the measurement of assets in the course ofthe year.
Low-cost carriers Hapag-Lloyd Express (HLX) and Thomsonfly achievedturnover of € 51 million (previous year: € 31 million) in the second quar-ter of 2004 and a total of € 78 million (previous year: € 42 million) in thefirst half of 2004, with the previous year’s turnover being relatively lowdue to the start-up phase of HLX’s business operations. With the launchof the summer schedule, HLX expanded its fleet to eleven aircraft. At atotal of 730,000 passengers carried, the seat load factor achieved a goodlevel of 78% in the second quarter of 2004. Thomsonfly started businessoperations on 31 March 2004 from Coventry airport. Its fleet has mean-while been expanded to a total of four aircraft. In the second quarter of2004, earnings were negative, as expected, and totalled € - 13 million(previous year: € - 20 million), with HLX reporting a year-on-year impro-
Interim Report 2nd Quarter 2004 Economic Situation
10
Unusual expenses and income
Costs of central operations
Net interest result
Other expenses and income
Low-cost carriers

vement in quarterly earnings. In the first half of 2004, start-up costs andearnings of the two low-cost carriers totalled € - 33 million (previousyear: € - 35 million).
Group profitGroup profit for the year totalled € 113 million (previous year: € 506 mil-lion) in the second quarter of 2004 and € - 36 million (previous year: €410 million) for the first half of 2004. While operating results improvedsignificantly in tourism, the core business, as well as in shipping and theremaining trading business, income from divestments declined on theprevious year.
Taxes on income, comprising current income taxes and deferred tax liabi-lities, totalled € 20 million (previous year: € 39 million) in the secondquarter of 2004. Thus, the taxes for the first half of 2004 totalled € - 41million (previous year: € - 27 million). The changes in the tax positionwere attributable to changes in the structure of earnings from currentbusiness operations as well as from deferred taxes.
Depreciation and amortisation of € 126 million (previous year: € 152 mil-lion) for the second quarter of 2004 and the accumulated figure of € 271million (previous year: € 304 million) for the first half of 2004 only includeddepreciation and impairments of other tangible assets. In accordance withthe new IFRS 3 and the revised IAS 38 and 36, amortisation and write-downs of goodwill were no longer offset. In the previous year, they hadtotalled € 75 million in the second quarter and € 149 million in the firsthalf of the year.
Economic Situation Interim Report 2nd Quarter 2004
11
Group profit€ million Q2 2004 Q2 2003 H1 2004 H1 2003 Var. %
Group profit 112.9 506.3 - 35.8 409.9 n. m.Income taxes 19.9 38.6 - 40.6 - 26.5 - 53.2Earnings before tax (EBT) 132.8 544.9 - 76.4 383.4 n. m.Amortisation of goodwill – 75.0 – 148.8 –Earnings before taxeson income and amortisation of goodwill (EBTA) 132.8 619.9 - 76.4 532.2 n. m.Depreciation of property, plant and equipment 126.0 150.0 270.9 300.9 - 10.0Earnings before tax, depreciation and amortisation (EBTDA) 258.8 769.9 194.5 833.1 - 76.7Extended net interest result - 90.5 - 1.2 - 133.1 - 59.1 - 125.2Earnings before interest, tax, depreciation and amortisation (EBITDA) 349.3 771.1 327.6 892.2 - 63.3Operating rental expenses 173.8 168.71) 360.3 337.4 + 6.8Earnings before interest, tax,depreciation, amortisation and rent (EBITDAR) 523.1 939.8 687.9 1,229.6 - 44.1
1) calculated proportionally based on year-end figures
Taxes on income
Depreciation / amortisation

Extended net interest result
Operating rental expenses
Minority interests
Earnings per share
The Group’s extended net interest result stood at € - 90 million (previousyear: € - 1 million) in the second half of 2004 and totalled € - 133 million(previous year: € - 59 million) for the first half of 2004. This was primarilyattributable to the reversal of hedging instruments due to the reductionin borrowings and the refinancing of current and medium-term financialdebt by means of long-term fixed-interest bearing debt components.
Operating rental expenses totalled € 174 million (previous year: € 169million) in the second quarter of 2004 and € 360 million (previous year: € 337 million) in the first half of 2004. € 124 million (previous year: € 117 million) of the total for the second quarter of 2004 and € 256 million(previous year: € 234 million) of the total for the first half of 2004 weredirectly allocatable to operating performance and hence shown undercost of materials. Another € 50 million (previous year: € 52 million) werereported under operating expenses in the second quarter of 2004, withthe relevant figure for the first half of 2004 amounting to € 104 million(previous year: € 103 million).
Minority interests accounted for € + 3 million of Group profit for the year(previous year: € + 5 million) in the second quarter of 2004 and € + 5 million(previous year: € + 2 million) in the first half of 2004. They mainly relatedto shareholdings in hotel companies and the minority shareholders inAlgeco.
Accordingly, the interest in Group profit attributable to TUI AG sharehol-ders amounted to € 110 million (previous year: € 501 million) for thesecond quarter of 2004 and € - 41 million (previous year: € 408 million)for the first half of 2004. Basic earnings per share therefore totalled € + 0.61 for the second half of 2004 and € - 0.23 for the first half of 2004.There were no dilution effects from the outstanding convertible bonds sothat basic and diluted earnings per share were identical.
Interim Report 2nd Quarter 2004 Economic Situation
12
Earnings per shareQ2 2004 Q2 2003 H1 2004 H1 2003 Var. %
Group profit € million + 113 + 506 - 36 + 410 n. m.Minority interests € million + 3 + 5 + 5 + 2 n. m.Interest attributable to TUI AG shareholders € million + 110 + 501 - 41 + 408 n. m.Weighted number of shares units 178,469 178,038 178,469 178,038 + 0.2Basic earnings per share € + 0.61 + 2.81 + 0.23 + 2.29 n. m.Diluted earnings per share € + 0.61 + 2.81 + 0.23 + 2.29 n. m.EPS before amortisation of goodwill € + 0.61 + 3.22 + 0.23 + 3.10 n. m.

Financial positionThe divestments of the 2003 financial year affected not only the consoli-dated profit and loss statement but also a number of balance sheetitems. The consolidated balance sheet was restructured in accordancewith IAS 1 (revised 2003).
Balance sheetThe Group’s balance sheet total only changed slightly. It was up by 5.4%to € 13.7 billion. The development of individual balance sheet itemsresulted both from changes in the group of consolidated companies andthe development of business in the period under review. Equity totalled€ 2.7 billion, with an equity ratio of 20.0%.
Assets and liabilities€ million 30 June 2004 31 Dec 2003
Non-current assets 10,114.6 10,271.4Current assets 3,579.7 2,717.8Assets 13,694.3 12,989.2Group equity 2,739.8 2,766.9Non-current liabilities 4,927.3 4,204.2Current liabilities 6,027.2 6,018.1Liabilities 13,694.3 12,989.2
FinancingAt the end of the second quarter of 2004, the net financial position total-led € 3.3 billion (31 Dec. 2003: € 3.8 billion). The variations mainly resul-ted from the seasonal nature of the tourism business as well as fromproceeds from divestments.
Development of cash and cash equivalents€ million 30 June 2004 30 June 2003 Var. %
Cash and cash equivalentsat the beginning of the period 348.5 366.5 - 4.9Cash inflow from operating activities 826.3 882.9 - 6.4Cash inflow/outflow from investing activities - 16.3 + 1,238.6 n. m.Cash outflow from financing activities - 469.7 - 2,112.7 - 77.8Other changes in cash and cash equivalents 9.4 - 16.5 n. m.Cash and cash equivalentsat the end of the period 698.2 358.8 - 94.6
Economic Situation Interim Report 2nd Quarter 2004
13

Tourism
14
Following the good start to the new financial year, the upward trend inthe tourism division continued in the second quarter of 2004. The num-ber of customers travelling with TUI tour operators rose by 0.6% to 5.07million. Demand largely equalled the capacities on offer. As a result, pricesof the tours sold and hence margins also matched expectations. Demandwas consistently channelled to Group-owned capacities, causing animprovement in utilisation rates, in particular in flight operations. Thecombined effects of these measures gave rise to a year-on-year increasein quarterly earnings to € 100 million, almost double the level generatedlast year.
Developments in Germany, the UK and the Nordic countries, which hadbeen particularly adversely affected in the past, were especially gratifying.The reversal of the trend was particularly obvious in these countries asthey additionally benefited from the fact that the cost containment andrestructuring measures were beginning to pay off.
Tourism€ million Q2 2004 Q2 2003 H1 2004 H1 2003 Var. %
Turnover 3,302.8 3,234.9 5,634.8 5,456.9 + 3.3Earnings by divisions(EBTA) 100 53 - 85 - 199 + 57.3EBITDA1) 166 129 69 - 43 + 260.5Capital expenditure 103.6 114.3 212.6 254.6 - 16.5Employees (30 June) – – 56,564 59,258 - 4.5
1) Earnings before interest, tax, depreciation and amortisation
For the 2003/2004 winter season, covering the period from November toApril, customer numbers and booked turnover were both around 6% upon the previous year’s levels for the Group as a whole. This was alreadyreflected by the positive development of turnover and earnings for thefirst quarter of 2004 and continued in April.
Following the slow start at the beginning of the year, bookings for the2004 summer season which commenced in May improved steadily. As theprimary effects caused by the war in Iraq faded away in the booking sta-tistics for the first half of the year, customer numbers and booked turn-over for the 2004 summer season were 1.9% and 2.5% up on the previousyear’s levels for the Group as a whole as of the beginning of August. Thebooking trend was particularly gratifying in July, a positive sign for thefurther development of the summer season. Weekly bookings received inJuly for departures in the peak holiday season were up on the previousyear’s levels. Accordingly, good utilisation of the flight and hotel capacitieson offer is expected both for this period and for the autumn holiday period.

Business Trend in the Divisions Interim Report 2nd Quarter 2004
15
Booking figuresYear-on-year Winter 2003/2004 Summer 2004variation in % Turnover Customers Turnover Customers
Germany 1.7 6.8 2.5 2.1Switzerland 1.0 4.4 10.5 7.2Austria 4.6 - 0.5 - 1.7 - 5.1Central Europe 1.8 6.4 2.3 1.3UK 11.0 5.5 4.2 2.2Ireland - 11.2 - 6.8 - 16.1 - 13.1Nordic countries 11.4 6.9 8.8 4.3Northern Europe 10.7 5.5 3.5 1.3Netherlands 1.8 2.1 - 0.7 - 1.2Belgium 3.9 4.8 3.6 5.4France 11.3 11.6 0.9 6.8Western Europe 7.1 6.7 1.3 4.0Group 6.1 6.2 2.5 1.9
As at 6 August 2004
Central EuropeThe Central Europe sector (Germany, Austria, Switzerland and Hapag-LloydFlug) continued the development of the previous quarter and reported asignificant improvement in its performance for the second quarter of 2004.A total of 2.23 million customers travelled with tour operators in the sector,just under 1% down on the previous year. Nevertheless, customer numbersfor the first half of 2004 rose by 0.1% to 3.50 million. Following last year’sweakness, the sector generated clearly positive earnings of € 39 millionagain in the second quarter of 2004. The increase in earnings was largelyattributable to the improved quality of the German tour operator businessand the increase in seat load factors in flight operations. Switzerland, too,reported an increase in earnings year-on-year, while earnings in Austriamatched almost the previous year’s level.
Tourism – Central Europe€ million Q2 2004 Q2 2003 H1 2004 H1 2003 Var. %
Turnover 1,342.3 1,356.5 2,156.2 2,186.3 - 1.4Earnings by divisions(EBTA) 39 0 - 46 - 109 + 57.8EBITDA1) 49 18 - 13 - 76 + 82.9Capital expenditure 10.5 15.4 55.9 80.1 - 30.2Employees (30 June) – – 9,443 9,885 - 4.5
1) Earnings before interest, tax, depreciation and amortisation
GermanyDemand for holiday tours picked up gradually for the 2004 summer sea-son. As before, a relatively large number of holidaymakers booked lateand were priceconscious. This benefited in particular the low-cost providers.

Interim Report 2nd Quarter 2004 Business Trend in the Divisions
16
However, at the same time an increasing number of holidaymakers tookadvantage of the benefits offered for early booking and was increasinglyinterested in high-quality offerings. Against this background a total of 1.94million customers travelled with a TUI tour operator in the second quarterof 2004, almost the same number as last year. Holiday destinations in theeastern Mediterranean in particular recorded a positive trend, while theSpanish islands and Greece did not match the previous year’s levels. Air-tours International, the tour operator in the premium segment, reporteda stabilisation of bookings. The 1-2-Fly brand benefited from briskdemand for low-cost tours and strongly expanded its market position. Itrecorded strong demand for tours to Majorca, Egypt and Turkey in parti-cular. The direct marketing activities of Berge & Meer also recorded a gra-tifying trend, in particular in long-haul tours. Last-minute provider L’tur, incontrast, reported a slight decrease in booking figures on the previousyear, in line with the reduced need for the last-minute sales of tours.
Overall, the second quarter of 2004 showed a satisfactory trend for thetour operators. The significant year-on-year reduction in last-minute salesneeds to be highlighted in particular. This was due to an improvement insales of brochure tours, supported by special discounts for early booking,on the one hand, and a more conservative capacity policy, on the other.
TUI Leisure Travel, which comprises the Group’s own distribution, continuedto improve in the second quarter of 2004 and increased both its turnoverand earnings year-on-year. Internet distribution was consolidated. ’TouristikExpress’, a new sales brand, was launched in April. It offers a limited varietyof low-cost tours in specially designed travel shops.
Hapag-Lloyd Flug reported a very positive trend in the second quarter of2004. It recorded very good utilisation of its fleet of 34 aircraft as touroperator customers were increasingly channelled to Group-owned flightcapacities and sales to third parties grew. Average sales revenues thusrose, with the seat-only business now characterised by intensified compe-tition and declining. At 5.3 billion seat kilometres, the capacity on offerwas 8% up on the previous year’s level. The seat load factor was almost83% and hence rose by around one percentage point.
SwitzerlandIn the second quarter of 2004, the situation of the Swiss tour operatorswas satisfactory across the board. At a total of 0.06 million customers,the number was 9% up year-on-year. The flight-only offering of the newtour operator brand FlexTravel in particular showed a positive develop-ment. Direct marketing brand Vögele also continued the positive trend ofthe previous quarter. It recorded very good demand for tours to Egypt,

Business Trend in the Divisions Interim Report 2nd Quarter 2004
17
Turkey and long-haul destinations. Distribution achieved a slight improve-ment in business on the previous year.
AustriaThe development of business in Austria dropped below the previous year’slevel in the second quarter of 2004, with the individual brands reportingdifferent trends. While 1-2-Fly managed to grow, bookings of tours offe-red by GTT and the land-based tours offered by Terra declined. A total of0.24 million customers travelled with the Austrian tour operators in thesecond quarter of 2004, a 9% decline year-on-year. The distribution sec-tor continued to grow. Since the beginning of the 2004 summer season,besides Hungary the new source markets of Slovenia and Slovakia havealso been managed from Austria.
Northern EuropeThe Northern Europe sector (UK, Ireland, Nordic countries, Britannia Air-ways UK and Britannia Airways Nordic) continued to improve year-on-yearin the second quarter of 2004. At 1.81 million, customers travelling withtour operators of this sector grew by 5.6% in this period. Accordingly, thecustomer number for the first half of 2004 rose by 8.4% to 2.90 million.Earnings of the sector were up to € 42 million in the second quarter of2004. This was primarily due to the significant improvement in the Nordiccountries and the gratifying performance of flight operations.
Tourism – Northern Europe€ million Q2 2004 Q2 2003 H1 2004 H1 2003 Var. %
Turnover 1,212.0 1,095.0 2,060.2 1,822.3 + 13.1Earnings by divisions(EBTA) 42 29 - 52 - 98 + 46.9EBITDA1) 65 55 - 3 - 43 + 93.0Capital expenditure 27.5 18.7 44.6 41.5 + 7.5Employees (30 June) – – 18,655 18,607 + 0.3
1) Earnings before interest, tax, depreciation and amortisation
UKBritish tour operators enjoyed a good start to the 2004 summer season,with the late booking trend already observed in the previous season con-tinuing. Bookings exceeded the previous year’s levels in both ThomsonHolidays and the Specialist Holidays Group. Both volumes and averageprices increased. As in the winter season, long-haul destinations recordedstrong growth as the US dollar exchange rate continued to be attractive.Short-haul destinations, in contrast, reported moderate growth levels.Compared with the previous year, budget-priced regions such as Turkey,Egypt and new destinations in Eastern Europe attracted a higher number

Interim Report 2nd Quarter 2004 Business Trend in the Divisions
18
of holidaymakers while demand for tours to Spain declined this summer.In the second quarter of 2004, a total of 1.37 million customers travelledwith British tour operators, an increase of more than 6% year-on-year.Bookings for the 2004/2005 winter season, sold since October 2003, havesold well and currently exceed the previous year’s levels.
The number of tours sold by distribution in the 2004 summer seasonrose year-on-year, with 75% of products sold being Group-owned pro-ducts. Sales of tours for the 2004/2005 winter season are also up on theprevious year’s level. Due to the launch of a new platform for Lunn Poly’swebsite, the number of internet bookings increased substantially. Thisenables distribution to considerably reduce the costs per tour sold.
In the summer season Britannia Airways UK operates 32 aircraft. Due tothe increase in utilisation of existing aircraft, capacity on offer in thesecond quarter of 2004 totalled 6.3 billion seat kilometres, 13% up year-on-year. The seat load factor stood at just under 87% and thus reachedthe previous year’s level.
IrelandBusiness in the small Irish market continued to be difficult. The situationwas characterised by strong price competition, increasing competition bylow-cost airlines and a persistent trend towards late bookings. As a result,TUI Ireland’s bookings for the summer season were down year-on-year.Declines were recorded in particular for Spanish destinations, while long-haul destinations were well booked due to the favourable US dollarexchange rate. In the second quarter of 2004, a total of 0.13 million cus-tomers travelled with the Irish tour operators, a slight increase year-on-year. For the 2004/2005 winter season, TUI Ireland launched only a smallprogramme which was satisfactorily booked so far.
Nordic countriesIn the Nordic countries the TUI Nordic tour operators benefited both fromthe rise in demand for the 2004 summer season and the early launch ofsales of their programmes, providing them with a competitive edge. Book-ings were up on the previous year’s levels with both volumes and averageprices improving year-on-year. A particularly gratifying trend was thestrong growth of business in Sweden, the Nordic market generating thehighest volume. Another major reason for the improvements was theexpansion of programmes in budget-priced destinations such as Turkeyand the Eastern European countries on the Black Sea. In the second quar-ter of 2004, a total of 0.33 million customers travelled with TUI Nordictour operators, an increase of more than 3% year-on-year. Bookings forthe 2004/2005 winter season have started off well so far.

Business Trend in the Divisions Interim Report 2nd Quarter 2004
19
Britannia Airways Nordic will operate six Boeing 737s in the summer sea-son. In the second quarter of 2004, capacity on offer totalled 1.0 billionseat kilometres, an increase of 11% on the previous year. At around 86%,the average seat load factor only dropped slightly below the previousyear’s level.
Western EuropeIn the Western Europe sector (France, Netherlands, Belgium and Corsair),the development of business in the second quarter of 2004 varied bycountry. The total number of customers travelling with the tour operatorsin this sector was 1.03 million, around 4% down year-on-year. Growth inBelgium and the Netherlands was contrasted by a reduction in customernumbers in France. Earnings of the sector totalled € - 8 million and thuswas lower than the previous year’s level.
Tourism – Western Europe€ million Q2 2004 Q2 2003 H1 2004 H1 2003 Var. %
Turnover 590.5 604.2 1,097.8 1,096.7 + 0.1Earnings by divisions(EBTA) - 8 - 6 - 19 - 13 + 46.2EBITDA1) 2 2 - 2 6 - 133.3Capital expenditure 10.9 5.6 17.2 10.9 + 57.8Employees (30 June) – – 6,622 6,385 + 3.7
1) Earnings before interest, tax, depreciation and amortisation
FranceFollowing the initially slow start to the 2004 summer season in Francedue to the air crash near Sharm El Sheik, demand subsequently pickedup again considerably. Consequently, bookings of Nouvelles Frontièresexceeded the previous year’s level. Destinations in Morocco, Egypt andMexico in particular reported high growth rates, while the classic Frenchholiday destinations in the French overseas departments and Greecerecorded a slight decline. The new TUI France brand also achieved a satis-factory level of bookings. A total of 0.37 million customers travelled withFrench tour operators in the second quarter of 2004, a 13% decline year-on-year.
In the 2004 summer season, Corsair operates nine aircraft. The new desti-nations in Morocco, Marrakesh and Fès, met with good acceptance by thecustomers. Total seat kilometres on offer rose by around 4% to 3.20 billionin the second quarter of 2004, with a seat load factor of more than 82%,around 2 percentage points less than last year.
NetherlandsIn the 2004 summer season, TUI Nederland’s business slightly outperformedthe market, which contracted by around 4%. It also achieved a slightincrease in its market share. Bookings differed for individual products.Bookings of city tours and long-haul destinations in particular outperfor-med the market, while bookings of short-haul destinations and land-based tours were slow. In the second quarter of 2004, a total of 0.32 mil-lion customers travelled with TUI Nederland tour operators, an increaseof about 1% year-on-year.
BelgiumTUI Belgium’s tour operators reported strong bookings of long-haul des-tinations and moderate demand for short and medium-haul destinationsfor the 2004 summer season. Exceptions to this trend were primarilyEgypt and Turkey, which reported very good bookings. As the main bro-chures for land-based tours were launched later than last year, bookingsin this segment are currently falling short of the previous year’s level. Incontrast, bookings of short trips and particularly city tours continued togrow. In the second quarter of 2004, a total of 0.34 million customers tra-velled with the Belgian tour operators, an increase of around 3% year-on-year. The development of TUI Airlines Belgium, the new airline, matchedexpectations in the first few months of operation.
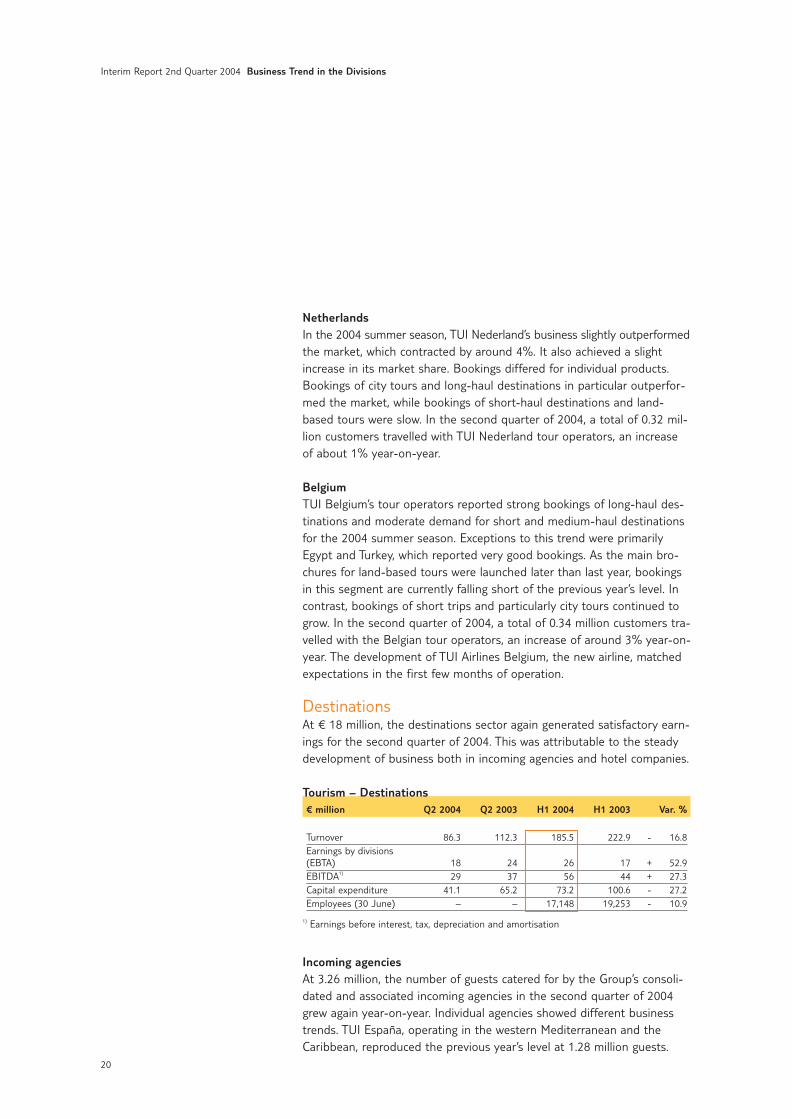
DestinationsAt € 18 million, the destinations sector again generated satisfactory earn-ings for the second quarter of 2004. This was attributable to the steadydevelopment of business both in incoming agencies and hotel companies.
Tourism – Destinations€ million Q2 2004 Q2 2003 H1 2004 H1 2003 Var. %
Turnover 86.3 112.3 185.5 222.9 - 16.8Earnings by divisions(EBTA) 18 24 26 17 + 52.9EBITDA1) 29 37 56 44 + 27.3Capital expenditure 41.1 65.2 73.2 100.6 - 27.2Employees (30 June) – – 17,148 19,253 - 10.9
1) Earnings before interest, tax, depreciation and amortisation
Incoming agenciesAt 3.26 million, the number of guests catered for by the Group’s consoli-dated and associated incoming agencies in the second quarter of 2004grew again year-on-year. Individual agencies showed different businesstrends. TUI España, operating in the western Mediterranean and theCaribbean, reproduced the previous year’s level at 1.28 million guests.
Interim Report 2nd Quarter 2004 Business Trend in the Divisions
20

21
Following the strong demand for destinations in Portugal, the number ofguests serviced by TUI Portugal last year dropped to 0.10 million. In theeastern Mediterranean, Travco benefited from the extremely strongdemand for tours to Egypt and more than doubled the number of guestsserviced in comparison with the previous year to 0.30 million. Tantur alsoreported a persistently positive business trend. The number of guestscatered for rose year-on-year to 0.25 million. The business volume of theremaining agencies totalled 1.33 million guests.
Hotel companiesHotel companies reported an overall satisfactory development of busi-ness in the second quarter of 2004, albeit with regional variations. Themain hotel companies managed to improve their occupancy rates year-on-year. RIU hotels recorded satisfactory occupancy rates in the short-and medium-haul segment and again aboveaverage occupancy rates fortheir long-haul destinations. Grupotels on the Balearic Islands reported aslight decline in occupancy rates due to a reduction in periods of opera-tion. For seasonal reasons, Robinson only operated three quarters of itsclubs in the second quarter; these clubs reported an improvement inoccupancy rates year-on-year. Magic Life reopened all of its clubs in thecourse of the quarter. Clubs in Egypt in particular were well booked. Thisyear’s boom in demand for Egypt also benefited Iberotel, which saw asignificant improvement in occupancy rates in its hotels. Grecotel openedits hotels in the course of the quarter and reported satisfactory occu-pancy rates.
Other tourismTUI Business Travel, which operates under the TQ3 Travel Solutions brand,continued to operate in a difficult business environment in the secondquarter of 2004. It nevertheless managed to improve its earnings.
Tourism – Other tourism€ million Q2 2004 Q2 2003 H1 2004 H1 2003 Var. %
Turnover 71.7 66.9 135.1 128.7 + 5.0Earnings by divisions(EBTA) 9 6 6 4 + 50.0EBITDA1) 21 17 31 26 + 19.2Capital expenditure 13.3 9.4 21.7 21.5 + 0.9Employees (30 June) – – 4,696 5,128 - 8.4
1) Earnings before interest, tax, depreciation and amortisation
Business Trend in the Divisions Interim Report 2nd Quarter 2004

In the second quarter of 2004, the logistics division improved its perfor-mance year-on-year. Container shipping in particular continued its positivebusiness trend. The special logistics sector with its activities remainingfollowing the divestments, in contrast, did not manage to continue theprevious year’s trend and fell short of the previous year’s performance.
Logistics€ million Q2 2004 Q2 2003 H1 2004 H1 2003 Var. %
Turnover 864.4 953.3 1,765.8 1,852.6 - 4.7Earnings by divisions(EBTA) 72 68 106 103 + 2.9EBITDA1) 122 123 209 216 - 3.2Capital expenditure 50.7 37.2 73.5 68.1 + 7.9Employees (30 June) – – 6,077 9,305 - 34.7
1) Earnings before interest, tax, depreciation and amortisation
ShippingIn the second quarter of 2004, container shipping recorded persistentlystrong demand for transport volume and a seasonal increase in demand.In regional terms, transport volumes rose most strongly in the Far Eastshipping area, but the Trans-Pacific and North Atlantic shipping areas alsorecorded significant growth. Freight rates on the high-volume routes inthe major shipping areas remained high, with partial year-on-year impro-vements being achieved.
Shipping€ million Q2 2004 Q2 2003 H1 2004 H1 2003 Var. %
Turnover 672.4 577.0 1,247.0 1,105.9 + 12.8Earnings by divisions(EBTA) 79 45 104 64 + 62.5EBITDA1) 102 66 148 107 + 38.3Capital expenditure 20.5 8.1 23.9 10.8 + 121.3Employees (30 June) – – 3,898 3,887 + 0.3
1) Earnings before interest, tax, depreciation and amortisation
Hapag-Lloyd Container LinieHapag-Lloyd Container Linie continued its positive business trend in thesecond quarter of 2004. This was primarily due to the increase in trans-port volumes of around 21% to 625 million standard containers (TEU). In addition, freight rates continued to develop favourably, exceeding theprevious quarter’s levels but also increasing on a year-on-year basis.However, the development of turnover and earnings was curbed by thepersistently weak US dollar exchange rate. The weakness of the US dollar
22
Logistics

was cushioned by means of currency hedges and positive effects of costsincurred in US dollars.
Transport volumes Hapag-Lloyd Container Linie’000 TEU Q2 2004 Q2 2003 H1 2004 H1 2003 Var. %
Far East 261 206 490 396 + 23.7North Atlantic 160 144 303 267 + 13.5Trans-Pacific 159 130 298 251 + 18.7South America 45 38 83 74 + 12.2Total 625 518 1,174 988 + 18.8
In the Far East shipping area, transport volumes rose by just under 27%year-on-year to 261,000 TEU. This was due to a considerable increase intransport on the routes between Europe and Asia and in inner-Asiantransport. One of the key driving forces behind this development was thestrong Chinese export market. Transport volumes in the North Atlanticshipping area increased by around 11% year-on-year to 160,000 TEU.Strong growth was primarily achieved on the high-volume trade lanesfrom Europe to America. In the Trans-Pacific shipping area, a substantialyear-on-year increase in transport volumes was recorded in particular onthe trade lanes from Asia to America. At 159,000 TEU, transport volumesclimbed by around 22%. At 45,000 TEU, the South America shipping areaalso reported growth in its transport volumes. This was primarily due toan in-crease in inner-American transport.
Hapag-Lloyd KreuzfahrtenThe premium cruise market segment continued to be difficult; neverthe-less, Hapag-Lloyd Kreuzfahrten recorded an improvement in its businessin the second quarter of 2004. Its flagship ‘Europa’ in particular recordeda gratifying increase in bookings. The ‘Hanseatic’ also achieved goodcapacity rates. In comparative terms, the ‘Columbus’ and ‘Bremen’ achievedlower occupancy rates.
Special logisticsFollowing the divestment of Pracht Spedition + Logistik in the first quar-ter of 2004, the bulk and special logistics sector of VTG-Lehnkering AGwas divested in April 2004 as part of the concentration of the logisticsdivision on shipping. The former VTG-Lehnkering AG carries on businessas VTG AG, which only operates in the rail logistics and tank containerlogistics sectors.
23
Business Trend in the Divisions Interim Report 2nd Quarter 2004

24
Following the end of the second quarter of 2004, TUI sold its 66.98%share in Algeco S.A., held by some of its shareholdings, to UK financialinvestor TDR Capital LLP on 16 July 2004. The closing for this trans-action is expected for September 2004.
The divestments had a major impact on turnover and earnings both forthe second quarter of 2004 and the first half of 2004, which thus drop-ped significantly below the previous year’s levels.
Special logistics€ million Q2 2004 Q2 2003 H1 2004 H1 2003 Var. %
Turnover 192.0 376.3 518.8 746.7 - 30.5Earnings by divisions(EBTA) - 7 23 2 39 - 94.9EBITDA1) 20 57 61 109 - 44.0Capital expenditure 30.2 29.1 49.6 57.3 - 13.4Employees (30 June) – – 2,179 5,418 - 59.8
1) Earnings before interest, tax, depreciation and amortisation
VTG AGThe rail and tank container logistics sector recorded an uneven businesstrend. Utilisation of tank cars was stable in the period under review andfell slightly short of the previous quarter’s level for seasonal reasons.Transpetrol, the rail forwarder, reported a largely steady business trend.Overall, utilisation of Transwaggon’s goods and flat wagons was good.Business in the tank container logistics sector continued to be difficult.The forwarding business was adversely affected above all by the imbalanceof transport volumes on the routes to and from Asia.
Algeco GroupIn the mobile buildings rental business, markets continued to see intensecompetition in the second quarter of 2004. This also impacted rental prices, in particular in France and Germany. Southern Europe continuedto record a satisfactory business trend. At 106,000, the number of unitsavailable for rental at the end of June exceeded the previous year’s level.Utilisation rates in most regions matched the previous year’s levels, withGermany recording a slight increase in utilisation in the course of thequarter under review. The sales business dropped slightly below the previous year’s level. This also applied to pallet logistics which saw therealignment of its business continuing.
Interim Report 2nd Quarter 2004 Business Trend in the Divisions

25
Other sectors comprised the trading sector retained by the Group, i.e.the PNA Group, the divested activities, the Group’s central operationswith TUI AG’s corporate centre functions, and the remaining industrialshareholdings.
TradingIn the second quarter of 2004, the US steel service companies of Preus-sag North America, Inc. (PNA) sold a total of 514,000 tons of steel, 13.0%up on the previous year. Accumulated steel sales for the first half of 2004totalled 1,025,000 tons, an increase of more than 13%. The FeralloyGroup in particular but also Infra-Metals and the Delta Steel Groupachieved strong increases in sales.
At the beginning of the second quarter of 2004, the American steel mar-ket continued to be tight. Scarce raw materials, in particular in coke andscrap, caused production bottlenecks for steel manufacturers time andagain. This resulted in persistently high price mark-ups, charged in parti-cular for rolled steel products. The companies of the PNA Group againtook advantage of this market situation in the quarter under review andachieved good margins.
PNA Group€ million Q2 2004 Q2 2003 H1 2004 H1 2003 Var. %
Turnover 251.5 155.3 450.9 316.8 + 42.3Earnings by divisions(EBTA) 39 – 64 - 1 –EBITDA1) 43 4 72 6 –Capital expenditure 0.7 1.0 1.7 2.7 - 37.0Employees (30 June) – – 1,144 1,101 + 3.9
1) Earnings before interest, tax, depreciation and amortisation
DivestmentsThe figures presented in the 2003 financial statements for this sectorincluded the former energy sector and the AMC Group, which were in-cluded in consolidation until the end of June 2003 and the end ofOctober 2003 respectively. The divestments of the logistics division,Pracht Spedition + Logistik and the bulk and special logistics sector ofVTG Lehnkering AG, will continue to be presented in the logistics divisionin the quarterly reports of this year.
Other Sectors

26
With business in the core divisions having already developed better thanexpected in the first half of 2004, the prospects for the 2004 businessyear as a whole are promising.
In tourism, bookings for the current summer season are good. The bookingfigures in the important large source markets of Germany and the UKcontinued to rise, above all due to the strong demand of the past fewweeks. As a consequence, the main holiday periods in the third quarter aswell as October are already very well booked. Noticeable outcomes of thisare improvements in the flight load factor and hotel occupancy rate. Inaddition the upturn in the Nordic countries is having a favourable effecton the overall development of the division. Following the restructuring ofthe business, this sector is once again achieving positive results. All in all,in the second half-year the tourism division can therefore continue thepleasing development already achieved in the previous year’s period andthus generate a result for the 2004 financial year, which will be at least70% better than last year.
For shipping, the prospects after the previous growth figures are likewisegood for the second half-year. The economic situation and our strongcompetitive position are reasons to expect a further growth in transportvolumes. With persistently high freight rates, the positive business devel-opment will go on, so that we anticipate that the 2004 business year willclose with an increased result over the previous year.
Against this background, we can assume that in the 2004 financial yearearnings of the divisions, adjusted for unusual expenses and income, willbe significantly higher than last year and reach at least € 420 million(previous year: € 242 million).
Prospects
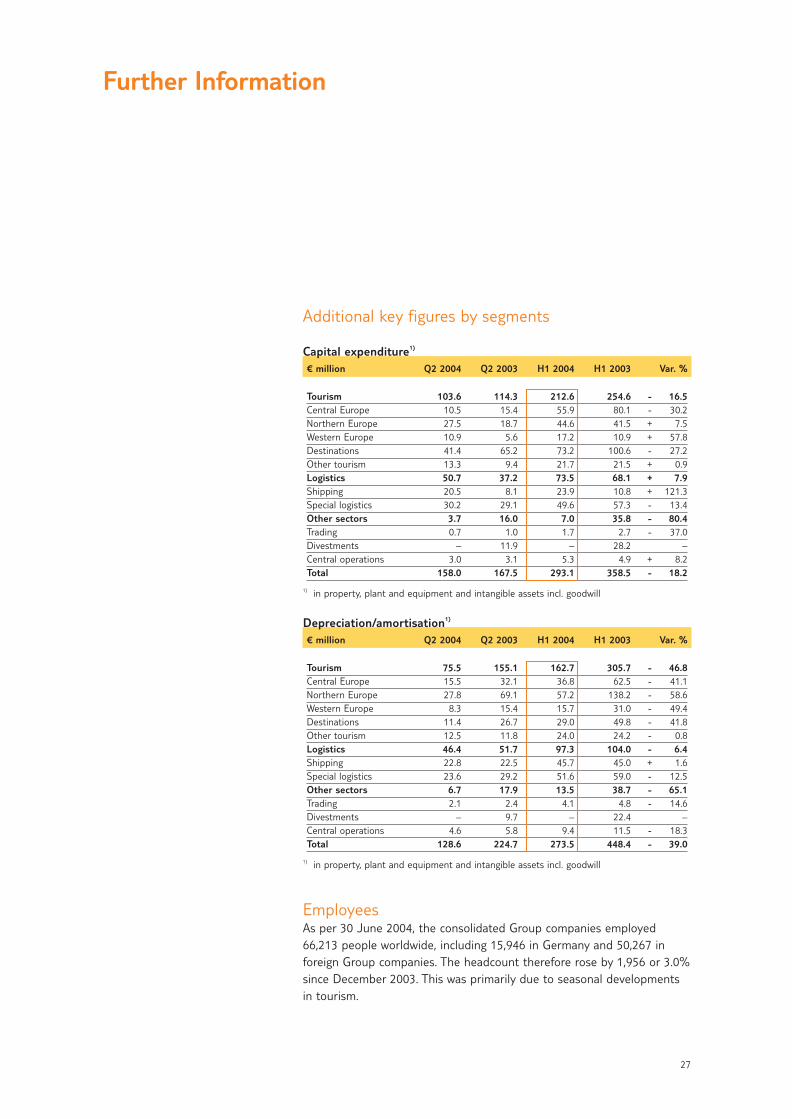
Additional key figures by segments
Capital expenditure1)
€ million Q2 2004 Q2 2003 H1 2004 H1 2003 Var. %
Tourism 103.6 114.3 212.6 254.6 - 16.5Central Europe 10.5 15.4 55.9 80.1 - 30.2Northern Europe 27.5 18.7 44.6 41.5 + 7.5Western Europe 10.9 5.6 17.2 10.9 + 57.8Destinations 41.4 65.2 73.2 100.6 - 27.2Other tourism 13.3 9.4 21.7 21.5 + 0.9Logistics 50.7 37.2 73.5 68.1 + 7.9Shipping 20.5 8.1 23.9 10.8 + 121.3Special logistics 30.2 29.1 49.6 57.3 - 13.4Other sectors 3.7 16.0 7.0 35.8 - 80.4Trading 0.7 1.0 1.7 2.7 - 37.0Divestments – 11.9 – 28.2 –Central operations 3.0 3.1 5.3 4.9 + 8.2Total 158.0 167.5 293.1 358.5 - 18.2
1) in property, plant and equipment and intangible assets incl. goodwill
Depreciation/amortisation1)
€ million Q2 2004 Q2 2003 H1 2004 H1 2003 Var. %
Tourism 75.5 155.1 162.7 305.7 - 46.8Central Europe 15.5 32.1 36.8 62.5 - 41.1Northern Europe 27.8 69.1 57.2 138.2 - 58.6Western Europe 8.3 15.4 15.7 31.0 - 49.4Destinations 11.4 26.7 29.0 49.8 - 41.8Other tourism 12.5 11.8 24.0 24.2 - 0.8Logistics 46.4 51.7 97.3 104.0 - 6.4Shipping 22.8 22.5 45.7 45.0 + 1.6Special logistics 23.6 29.2 51.6 59.0 - 12.5Other sectors 6.7 17.9 13.5 38.7 - 65.1Trading 2.1 2.4 4.1 4.8 - 14.6Divestments – 9.7 – 22.4 –Central operations 4.6 5.8 9.4 11.5 - 18.3Total 128.6 224.7 273.5 448.4 - 39.0
1) in property, plant and equipment and intangible assets incl. goodwill
EmployeesAs per 30 June 2004, the consolidated Group companies employed66,213 people worldwide, including 15,946 in Germany and 50,267 inforeign Group companies. The headcount therefore rose by 1,956 or 3.0%since December 2003. This was primarily due to seasonal developmentsin tourism.
27
Further Information

Employees by divisions€ million 30 June 2004 31 Dec 2003 Var. %
Tourism 56,564 51,708 + 9.4Central Europe 9,443 9,391 + 0.6Northern Europe 18,655 18,033 + 3.4Western Europe 6,622 6,521 + 1.5Destinations 17,148 12,896 + 33.0Other tourism 4,696 4,867 - 3.5Logistics 6,077 9,235 - 34.2Shipping 3,898 3,897 + 0.0Special logistics 2,179 5,338 - 59.2Other sectors 3,572 3,314 + 7.8Trading 1,144 1,104 + 3.6Divestments – – –Central operations 2,428 2,210 + 9.9Total 66,213 64,257 + 3.0
Corporate GovernanceIn the course of the second quarter of 2004, no changes occurred in thecomposition of the boards of TUI AG. The current composition of theExecutive Board and Supervisory Board is stated on the Company’s web-site (www.tui.com), where it is permanently accessible to the public.
TUI AGThe Executive BoardAugust 2004
Interim Report 2nd Quarter 2004 Further Information
28

29
30 Financial statements30 Profit and loss statement31 Balance sheet32 Changes in equity33 Cash flow statement
34 Notes34 Accounting principles34 Group of consolidated
companies35 Discontinuing operations39 Notes on the consolidated
profit and loss statement40 Notes on the consolidated
balance sheet41 Changes in equity41 Contingent liabilities41 Notes on the cash flow
statement42 Segment data

30
Financial Statements
Condensed profit and loss statement of the TUI Group for the period from 1 January to 30 June€ million Q2 2004 Q2 2003 H1 2004 H1 2003
Turnover 4,537.6 5,044.0 8,053.3 8,817.5 Other income 176.4 137.2 337.6 516.2 Change in inventories and other own work capitalised + 12.1 - 13.3 + 24.1 + 35.7 Cost of materials and purchased services 3,196.9 3,758.2 5,701.2 6,486.8 Personnel costs 595.6 650.4 1,210.9 1,288.6 Depreciation and amortisation 129.0 224.7 273.5 448.4 (of which amortisation of goodwill) (0.0) (73.8) (0.0) (146.6)Impairment of fixed assets - 0.4 0.0 0.0 0.0 (of which impairment of goodwill) (0.0) (0.0) (0.0) (0.0)Other expenses 623.7 669.0 1,240.7 1,383.6 (of which other taxes) (10.1) (7.6) (16.6) (16.9)Result from the discontinuance of operations + 30.2 + 668.9 + 48.6 + 668.9 Financial result - 87.3 - 0.4 - 129.7 - 58.3 Earnings from companies measured at equity + 8.6 + 10.8 + 16.0 + 10.8 (of which amortisation of goodwill) (0.0) (1.1) (0.0) (2.2)Earnings before taxes on income + 132.8 + 544.9 - 76.4 + 383.4 Income taxes + 19.9 + 38.6 - 40.6 - 26.5 Group profit + 112.9 + 506.3 - 35.8 + 409.9 Attributable to equity holders of TUI AG + 109.6 + 501.6 - 40.7 + 408.2 Attributable to minority interest + 3.3 + 4.7 + 4.9 + 1.7 Group profit + 112.9 + 506.3 - 35.8 + 409.9
€ Q2 2004 Q2 2003 H1 2004 H1 2003
Earnings per share (basic and diluted) + 0.61 + 2.81 - 0.23 + 2.29 Earnings per share before amortisation of goodwill + 0.61 + 3.22 - 0.23 + 3.10

31
Financial Statements Interim Report 2nd Quarter 2004
Condensed consolidated balance sheet of the TUI Group€ million 30 June 2004 31 Dec 2003
AssetsFixed assets 9,592.6 9,688.1Goodwill 3,938.0 3,807.9Other intangible assets 193.8 198.6Investment property 142.1 149.3Other property. plant and equipment 4,508.5 4,734.7Companies measured at equity 352.9 332.4Other investments 457.3 465.2Non-current receivables 522.0 583.3Other receivables and assets 343.3 395.0Deferred income tax assets 178.7 188.3Non-current assets 10,114.6 10,271.4
Inventories 752.4 532.4Current receivables 2,129.1 1,836.9Trade accounts receivable 1,030.3 898.2Other receivables and assets 1,076.4 916.9Current income tax assets 22.4 21.8
Cash and cash equivalents 698.2 348.5
Current assets 3,579.7 2,717.813,694.3 12,989.2
€ million 30 June 2004 31 Dec 2003
Group equity and liabilitiesGroup equity 2,739.8 2,766.9Subscribed capital 456.2 456.2Reserves and accumulated profits 1,987.0 2,025.6Equity of shareholders in TUI AG 2,443.2 2,481.8Minority interests 296.6 285.1
Non-current provisions 1,163.8 1,287.6Provisions for pensions and similar obligations 610.6 598.3Deferred and current income tax provisions 221.0 329.1Other provisions 332.2 360.2Non-current liabilities 3,763.5 2,916.6Financial liabilities 3,627.4 2,710.2Other liabilities 136.1 206.4Non-current provisions and liabilities 4,927.3 4,204.2
Current provisions 704.3 890.5Provisions for pensions and similar obligations 44.8 46.8Current income tax provisions 61.1 159.2Other provisions 598.4 684.5Current liabilities 5,322.9 5,127.6Financial liabilities 359.3 1,467.1Trade accounts payable 2,403.3 2,036.6Other liabilities 2,560.3 1,623.9Current provisions and liabilities 6,027.2 6,018.1
13,694.3 12,989.2

32
Interim Report 2nd Quarter 2004 Financial Statements
Changes in equity
Condensed statement of changes in equity for the period from 1 January to 30 June 2004Reserves Equity of
and share-Subscribed accumulated holders Minority Group
€ million capital profits in TUI AG interests Equity
Balance as at 1 January 2004 456.2 2,025.6 2,481.8 285.1 2,766.9First-time application of IFRS 3 0.0 11.1 11.1 0.0 11.1Adjusted balance as at 1 January 2004 456.2 2,036.7 2,492.9 285.1 2,778.0Dividend payments 0.0 - 137.4 - 137.4 - 6.4 - 143.8Other changes without effect on net income 0.0 128.4 128.4 13.0 141.4Differences from currency translation (0.0) (117.2) (117.2) (1.7) (118.9)Reserves for change in value of financial instruments (0.0) (36.2) (36.2) (0.0) (36.2)Tax items directly offset against equity (0.0) (- 25.0) (- 25.0) (0.0) (- 25.0)Changes in consolidation (0.0) (0.0) (0.0) (11.3) (11.3)Group profit 0.0 - 40.7 - 40.7 4.9 - 35.8Balance as at 30 June 2004 456.2 1,987.0 2,443.2 296.6 2,739.8
Condensed statement of changes in equity for the period from 1 January to 30 June 2003Reserves Equity of
and share-Subscribed accumulated holders Minority Group
€ million capital profits in TUI AG interests Equity
Balance as at 1 January 2003 455.1 2,455.0 2,910.1 270.4 3,180.5Dividend payments 0.0 - 137.1 - 137.1 - 10.2 - 147.3Other changes without effect on net income 0.0 - 99.1 - 99.1 - 2.3 - 101.4Differences from currency translation (0.0) (- 19.8) (- 19.8) (- 5.9) (- 25.7)Reserves for change in value of financial instruments (0.0) (- 152.7) (- 152.7) (0.0) (- 125.7)Tax items directly offset against equity (0.0) (- 12.6) (- 12.6) (0.0) (- 12.6)Changes in consolidation (0.0) (86.0) (86.0) (3.6) (89.6)Group profit 0.0 408.2 408.2 1.7 409.9Balance as at 30 June 2003 455.1 2,627.0 3,082.1 259.6 3,341.7

Financial Statements Interim Report 2nd Quarter 2004
33
Cash flow statement
Condensed cash flow statement for the period from 1 January to 30 June€ million 2004 2003
Cash inflow from operating activities 826.3 882.9Cash inflow/outflow from investing activities - 16.3 1,238.6Cash outflow from financing activities - 469.7 - 2,112.7Change in funds with cash effect 340.3 8.8Change in cash and cash equival. due to exchange rate fluctuations and other changes in value 9.4 - 16.5Cash and cash equivalents at the beginning of the period 348.5 366.5Cash and cash equivalents at the end of the period 698.2 358.8

Notes
34
Accounting principlesLike the consolidated financial statements for the 2003 financial year, theinterim financial statements as per 30 June 2004 were prepared in accor-dance with the International Financial Reporting Standards (IFRS) –published by the International Accounting Standards Board (IASB) – withthe interim financial statements published in a condensed form compa-red with the consolidated financial statements in accordance with IAS 34‘Interim Financial Reporting’. The only deviation from the historical costprinciple was the accounting method applied in measuring financialinstruments.
Since 1 January 2004, the new IFRS 3 ‘Business Combinations’ and therevised IAS standards 36 ‘Impairment of Assets’ (revised 2004) and IAS38 ‘Intangible Assets’ (revised 2004) have been voluntarily applied priorto their effective dates. These standards have been applied on a prospec-tive basis since the beginning of the current financial year, i.e. currentpurchases of companies are reported in accordance with the new rules,without adjusting the previous year’s financial statements. At the sametime, scheduled amortisation of goodwill has ceased to be effected. Inthe future, goodwill will be regularly reviewed by means of impairmenttests conducted after the termination of the annual planning process.Direct offsetting of goodwill from companies purchased before 1 October1995 is no longer reversed with no effect on the profit and loss state-ment in the framework of a removal from consolidation. Negative good-will was derecognised with a corresponding adjustment to the openingbalance as per 1 January 2004 of revenue reserves.
With the exception of the changes outlined above, the interim financialstatements as per 30 June 2004 were prepared in accordance with thesame accounting and measurement principles as those applied in thepreceding consolidated financial statements. The accounting and measure-ment methods applied are outlined in detail in the notes on the consoli-dated financial statements as per 31 December 2003.
Group of consolidated companiesThe consolidated financial statements included all major subsidiaries inwhich TUI AG was able to directly or indirectly govern the financial oroperating policies such that the Group obtained benefits from the activi-ties of these companies.
The interim financial statements as per 30 June 2004 included a total of54 domestic and 363 foreign subsidiaries, besides TUI AG.

Since 31 December 2003, eight companies have been newly included inthe group of consolidated companies. These companies included newlyestablished or acquired companies and one company spun off in the pre-paration for a divestment transaction.
The additions related to the tourism and logistics divisions and were notsignificant for the presentation of a true and fair view of the financialposition and performance of the Group, neither individually nor whentaken together.
Since 31 December 2003, a total of 23 companies were removed fromconsolidation. Most of the removals, i.e. 15 companies, related to busi-ness unit II (bulk and special logistics). Another three companies of thetourism division were removed from consolidation due to divestmentsand one company due to a merger. The remaining disposals related tothe logistics division and ‘Other sectors’.
Discontinuing operations With the divestment of the domestic activities of the Preussag EnergieGroup to the Gaz de France Group and of the international activities toOMV AG, the operations of the energy sector were completely disconti-nued in the 2003 financial year. The companies were removed from con-solidation as per 31 March 2003 and 30 June 2003, respectively.
With the divestment of the AMC Group, the trading sector partly termi-nated its business activities in the 2003 financial year. The AMC Groupwas sold in the framework of an MBO with effect from 1 November 2003.
The intention to divest the US steel service activities remains unchangedThe trading sector therefore continued to be considered a discontinuingoperation in accordance with IAS 35 at the reporting date.
At its meetings on 21 March 2003 and 21 January 2004, the SupervisoryBoard approved the concept for the realignment of the logistics segment.In the framework of the planned concentration of business on the tou-rism and shipping sectors, the Group will divest its remaining sharehol-dings in the special logistics segment. In this connection Pracht Spedition+ Logistik GmbH was sold to the Swiss forwarding group Kühne undNagel with effect from 1 January 2004.
Furthermore, the bulk and special logistics (UB II) business unit of VTGAG was sold to financial investor Triton Managers Limited in April 2004.
Notes Interim Report 2nd Quarter 2004
35

36
Interim Report 2nd Quarter 2004 Notes
The sale of the Algeco Group to the British financial investor TDR CapitalLLP was published after the reporting date.
Apart from these transactions already completed, the Group intendsadditionally to divest the rail logistics (UB I) business unit of VTG AG.This intention was publicly announced shortly after the decision wastaken. The special logistics sector thus represents another discontinuingoperation in accordance with IAS 35.
In the light of the divestment transactions outlined above, a year-on-yearcomparison of individual items of the profit and loss statement is only oflimited use as the companies will be included in consolidation on a prorata temporis basis until the divestment date.
Material assets and liabilities of the discontinuance of
EnergyThe activities of the energy sector were completely discontinued in the2003 financial year. Therefore assets resp. liabilities of this sector were no longer recognised in the consolidated balance sheets already as at 31. December 2003.
TradingTrading
€ million 30 June 2004 31 Dec 2003
Non-current assets 92.3 92.2Current assets 293.6 209.3Provisions 28.2 16.9Financial liabilities 183.1 155.3Other liabilities 58.5 51.7
Specialist logisticsSpecialist logistics
€ million 30 June 2004 31 Dec 2003
Non-current assets 628.7 934.5Current assets 356.2 362.9Provisions 159.5 205.7Financial liabilities 312.6 478.8Other liabilities 218.2 238.1

37
Material items of the profit and loss statements of the discontinuance of
EnergyEnergy
€ million Q2 2004 Q2 2003 H1 2004 H1 2003
Turnover – 63.5 – 177.0Other income – 2.4 – 6.4Operating expenses – 84.8 – 162.2Financial result – - 0.6 – - 1.0
Earnings before taxes on income – - 19.5 – 20.2Income taxes – - 2.8 – 13.4Earnings after taxes on income – - 16.7 – + 6.8
TradingTrading
€ million Q2 2004 Q2 2003 H1 2004 H1 2003
Turnover 251.5 683.7 450.9 1,151.2Other income 0.2 1.8 0.6 3.3Operating expenses 211.3 685.4 384.1 1,152.4Financial result - 2.0 - 0.5 - 4.2 - 0.9
Earnings before taxes on income 38.9 0.2 64.0 2.0Income taxes 19.0 1.6 28.2 2.8Earnings after taxes on income 19.9 - 1.4 35.8 - 0.8
Specialist logisticsSpecialist logistics
€ million Q2 2004 Q2 2003 H1 2004 H1 2003
Turnover 191.9 375.9 518.7 746.3Other income 9.9 10.7 20.3 26.4Operating expenses 200.9 360.5 526.7 723.4Financial result - 2.0 - 4.3 - 6.4 - 11.1
Earnings before taxes on income - 1.5 22.5 6.9 39.2Income taxes 2.9 8.4 7.7 15.1Earnings after taxes on income - 4.4 14.1 - 0.8 24.1
Notes Interim Report 2nd Quarter 2004

Cash flow from operating, investing and financing activities
Interim Report 2nd Quarter 2004 Notes
38
EnergyEnergy
€ million Q2 2004 Q2 2003 H1 2004 H1 2003
Cash inflow/outflow from operating activities – 29.3 – - 22.4Cash outflow from investing activities – - 10.4 – - 23.1Cash inflow from financing activities – 5.3 – 3.8Change in cash and cash equivalents due to exchange rate fluctuations and other changes in value – – – –Change in cash and cash equivalents – 24.2 – - 41.7
TradingTrading
€ million Q2 2004 Q2 2003 H1 2004 H1 2003
Cash inflow/outflow from operating activities 3.2 32.5 - 18.4 36.8Cash outflow from investing activities - 0.7 - 1.9 - 1.7 - 2.4Cash inflow/outflow from financing activities - 2.3 - 19.8 20.8 - 28.4Change in cash and cash equivalents due to exchange rate fluctuationsand other changes in value - 0.1 - 0.3 – - 4.3Change in cash and cash equivalents 0.1 10.5 0.7 1.7
Specialist logisticsSpecialist logistics
€ million Q2 2004 Q2 2003 H1 2004 H1 2003
Cash inflow from operating activities 43.3 68.8 52.1 87.3Cash inflow/outflow from investing activities 109.4 - 21.1 94.8 - 42.3Cash outflow from financing activities - 152.1 - 32.9 - 154.8 - 37.6Change in cash and cash equivalents due to exchange rate fluctuationsand other changes in value - 2.3 - 0.1 - 2.5 - 0.2Change in cash and cash equivalents - 1.7 14.7 - 10.4 7.2

Notes on the consolidated profit and loss statement Source markets Northern Europe and Central Europe benefited from anincrease in momentum in the operating business year-on-year. As aresult, turnover in particular as well as cost of materials and cost of pur-chased services rose year-on-year in the Northern Europe source market.Opposing effects mainly resulted from changes in the group of consolidatedcompanies in the previous year. Both turnover, cost of materials and pur-chased services as well as other expenses declined year-on-year as thecompanies of the Preussag Energie Group, the AMC Group and PrachtSpedition + Logistik GmbH were no longer included in consolidation in theperiod under review. Moreover, the companies of the bulk and speciallogistics business unit (UB II) of VTG AG were only included in consolida-tion on a pro rata temporis basis until the respective divestment date inthe current financial year.
Other income stated in the previous year’s corresponding interim reportincluded one-off income from the divestment of the indirect shareholdingin Ruhrgas AG.
The decline in expenses for scheduled depreciation/amortisation was primarily attributable to the fact that scheduled amortisation of goodwillhas no longer been effected since 1 January 2004 (previous year: € 148.8million).
The financial result declined year-on-year due to the increase in interestexpenses resulting from the refinancing of current and medium-termfinancial debt by longer-term components. In addition, the financial resultfor the current year was essentially impacted by one-off expenses ofaround € 32 million, primarily resulting from the reversal of the hedgingrelationship of interest derivatives used as cash flow hedges, hithertotaken directly to equity in accordance with IAS 39 ’Financial Instruments:Recognition and Measurement’. This reversal of the hedging relationshiphad been required due to the ongoing reduction in borrowings and therefinancing of current and medium-term financial debt by means of long-term fixed-interest bearing debt components.
Overall, the earnings situation is characterised by the seasonal nature ofthe tourism business. Due to the business cycles, the profit contributionsof the tourism division are mainly made in the second and third quarterof any one year.
In the first half of the 2004 financial year, Group earnings included netunusual income totalling around € 39 million. Unusual income of around
Notes Interim Report 2nd Quarter 2004
39

40
€ 49 million was reported as earnings from discontinuing operations andresulted from the divestment of Pracht Spedition + Logistik GmbH andthe bulk and special logistics business unit (UB II) of VTG AG as well asprovisioning no longer required due to the divestment of the PreussagEnergie Group. Unusual expenses of around € 10 million related to provi-sions for divestments already effected in the past.
Earnings in the previous year’s reference period included net unusual in-come of around € 849 million. This amount included € 669 million carriedas income from discontinuing operations, mainly resulting from thedivestment of the Preussag Energie Group. Around € 200 million relatedto the divestment of the indirect shareholding in Ruhrgas AG, effected asan independent transaction alongside the divestment of the PreussagEnergie Group.
Notes on the consolidated balance sheetIn comparison with 31 December 2003, goodwill rose mainly as a resultof changes in exchange rate parities of the goodwill recognised in thefunctional currencies of the respective subsidiaries, in particular againstBritish pound sterling. In addition goodwill increased due to the finalizationof the complete takeover of the TUI Suisse Group in the first quarter ofthe current financial year and the multistage acquisition of a company inthe rail logistics sector.
The increase in inventories and trade accounts receivable compared with31 December 2003 was primarily related to the tourism division. Inventorieswere affected by the advance payments for tourism services, mainly forthe 2004 summer season, which are customary in the industry. The in-crease in other liabilities was also mainly attributable to the increase inadvance payments received for tourism services.
The reduction in financial liabilities was affected by the Group’s divest-ment programme which brought Group debt further down. However, thepayment of the dividend for the 2003 financial year had an opposite effect.
In the first half of 2004, the TUI Group restructured its refinancing mainlyby means of new non-current refinancing measures. A 3-year borrower’snote loan totalling € 120 million, a 7-year bond totalling € 625 millionand a 5-year bond totalling € 400 million were issued in the capital market.In addition a multi-year syndicated bank facility of € 600 million was sign-ed. On the other hand, the 1999 convertible bond of € 550 million, asyndicated bank loan of € 800 million and bilateral dues to banks wereredeemed.
Interim Report 2nd Quarter 2004 Notes

Changes in equityNet equity changed only slightly compared with 31 December 2003. Apartfrom consolidated earnings, equity was adversely impacted by the dividendof € 137.4 million to be paid out for the 2003 financial year, as resolvedby the Annual General Meeting of TUI AG on 18 May 2003.
Changes in exchange rates – above all against the British pound sterling– taken directly to equity had a positive effect on equity.
Negative goodwill was derecognised with a corresponding adjustment tothe opening balance as per 1 January 2004 of revenue reserves.
By means of a resolution adopted at the Annual General Meeting of TUI AGon 18 June 2004, conditional capital was increased by € 70.0 million to atotal of € 199.0 million as against the last balance sheet date.
Contingent liabilitiesAs per 30 June 2004, the TUI Group recorded contingent liabilities ofaround € 593 million (31 December 2003: around € 676 million). Thedecline in contingent liabilities in the first half of the 2004 financial yearwas primarily attributable to the ongoing scheduled reduction in guaran-tees and warranties in connection with the former activities in the plantengineering and shipbuilding sectors.
Notes on the cash flow statementIn the period under review, cash and cash equivalents rose by € 349.7million to € 698.2 million.
At € 826.3 million, the inflow of cash from operating activities droppedby € 56.6 million year-on-year. This was due to the fact that divestedcompanies were only included in consolidation on a pro rata temporisbasis both for the current and previous financial year. A year-on-yearcomparison of figures is therefore only of limited use .
The outflow of cash from investing activities totalled € 16.3 million. Theprevious year’s high cash inflow was essentially attributable to the divest-ment of the Preussag Energie Group.
Cash and cash equivalents declined by € 469.7 million from the cash out-flow from financing activities. This was due to the redemption of financialliabilities – in particular from current operations – and the interest paid.
Changes in cash and cash equivalents due to exchange rate fluctuationsand other changes in value caused a cash inflow of € 9.4 million.
Notes Interim Report 2nd Quarter 2004
41
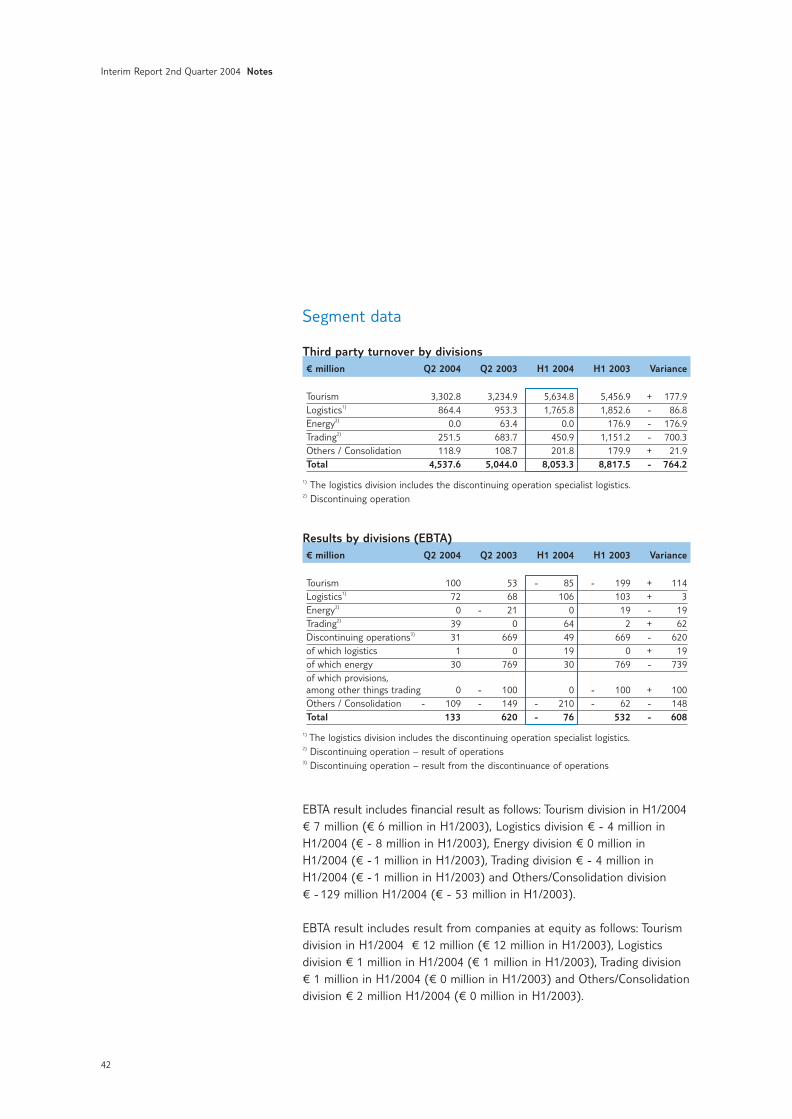
Segment data
Third party turnover by divisions€ million Q2 2004 Q2 2003 H1 2004 H1 2003 Variance
Tourism 3,302.8 3,234.9 5,634.8 5,456.9 + 177.9Logistics1) 864.4 953.3 1,765.8 1,852.6 - 86.8Energy2) 0.0 63.4 0.0 176.9 - 176.9Trading2) 251.5 683.7 450.9 1,151.2 - 700.3Others / Consolidation 118.9 108.7 201.8 179.9 + 21.9Total 4,537.6 5,044.0 8,053.3 8,817.5 - 764.2
1) The logistics division includes the discontinuing operation specialist logistics.2) Discontinuing operation
Results by divisions (EBTA)€ million Q2 2004 Q2 2003 H1 2004 H1 2003 Variance
Tourism 100 53 - 85 - 199 + 114Logistics1) 72 68 106 103 + 3Energy2) 0 - 21 0 19 - 19Trading2) 39 0 64 2 + 62Discontinuing operations3) 31 669 49 669 - 620of which logistics 1 0 19 0 + 19of which energy 30 769 30 769 - 739of which provisions,among other things trading 0 - 100 0 - 100 + 100Others / Consolidation - 109 - 149 - 210 - 62 - 148Total 133 620 - 76 532 - 608
1) The logistics division includes the discontinuing operation specialist logistics.2) Discontinuing operation – result of operations3) Discontinuing operation – result from the discontinuance of operations
EBTA result includes financial result as follows: Tourism division in H1/2004€ 7 million (€ 6 million in H1/2003), Logistics division € - 4 million inH1/2004 (€ - 8 million in H1/2003), Energy division € 0 million inH1/2004 (€ - 1 million in H1/2003), Trading division € - 4 million inH1/2004 (€ - 1 million in H1/2003) and Others/Consolidation division € - 129 million H1/2004 (€ - 53 million in H1/2003).
EBTA result includes result from companies at equity as follows: Tourismdivision in H1/2004 € 12 million (€ 12 million in H1/2003), Logistics division € 1 million in H1/2004 (€ 1 million in H1/2003), Trading division € 1 million in H1/2004 (€ 0 million in H1/2003) and Others/Consolidationdivision € 2 million H1/2004 (€ 0 million in H1/2003).
Interim Report 2nd Quarter 2004 Notes
42

EBTA result excludes amortisation and impairment of goodwill as follows:Tourism division in H1/2004 € 0 million (€ 144 million in H1/2003), Logisticsdivision € 0 million in H1/2004 (€ 2 million in H1/2003) and Others/Consolidation division € 0 million H1/2004 (€ 1 million in H1/2003).
EBTA result includes financial result as follows: Tourism division in Q2/2004€ 8 million (€ 7 million in Q2/2003), Logistics division € - 2 million inQ2/2004 (€ - 2 million in Q2/2003), Energy division € 0 million inQ2/2004 (€ 0 million in Q2/2003), Trading division € - 1 million inQ2/2004 (€ - 1 million in Q2/2003) and Others/Consolidation division € - 92 million Q2/2004 (€ - 3 million in Q2/2003).
EBTA result includes result from companies at equity as follows: Tourismdivision in Q2/2004 € 7 million (€ 12 million in Q2/2003), Logistics division € 0 million in Q2/2004 (€ 1 million in Q2/2003), Trading division€ 1 million in Q2/2004 (€ 0 million in Q2/2003) and Others/Consolidationdivision € 1 million Q2/2004 (€ 0 million in Q2/2003).
EBTA result excludes amortisation and impairment of goodwill as follows:Tourism division in Q2/2004 € 0 million (€ 72 million in Q2/2003), Logistics division € 0 million in Q2/2004 (€ 1 million in Q2/2003) andOthers/Consolidation division € 0 million Q2/2004 (€ 0 million in Q2/2003).
Notes Interim Report 2nd Quarter 2004
43

Future-related statementsThis interim report contains a number of statements related to the futuredevelopment of TUI. These statements are based both on assumptionsand estimates. Although we are convinced that these future-relatedstatements are realistic, we cannot guarantee them, for our assumptionsinvolve risks and uncertainties which may give rise to situations in whichthe actual results differ substantially from the expected ones. The potentialreasons for such differences include market fluctuations, the developmentof world market commodity prices, the development of exchange rates orfundamental changes in the economic environment. TUI does not intendor assume any obligation to update any forward-looking statement toreflect events or circumstances after the date of these materials.
Interim Report 2nd Quarter 2004 Disclaimer
44

3 General economic situation
3 Turnover and earnings3 Group5 Tourism8 Logistics9 Other sectors
11 Group profit
13 Financial position
14 Business trend in the divisions
14 Tourism15 Central Europe17 Northern Europe19 Western Europe20 Destinations21 Other tourism
22 Logistics22 Shipping23 Special logistics
25 Other sectors25 Trading25 Divestments
26 Prospects
27 Further information27 Additional key figures
by segments27 Employees28 Corporate Governance
30 Financial statements
34 Notes
Financial Calendar 2004/2005
Interim Report January to September 2004 11 November 2004Annual Press Conference 2005 23 March 2005Interim Report January to March 2005 11 May 20051)
Annual General Meeting 2005 11 May 2005Interim Report January to June 2005 11 August 20051)
Interim Report January to September 2005 1 November 20051)
1) scheduled
Imprint
TUI AGKarl-Wiechert-Allee 4D-30625 Hanover
Phone ++49.0511.566-00Telefax ++49.0511.566-1901E-Mail [email protected] www.tui.com
The german Version of this report is legally binding. The Company cannotbe held responsible for any misunderstandings or misinterpretation arisingfrom this translation. Both versions are available on the web: www.tui.com

TUI AGKarl-Wiechert-Allee 4D-30625 HanoverGermany
TUI AG Financial Year 2004Interim Report 1 January – 30 June 2004
2nd quarter 2004
Related Documents