INTRODUCTION INTRODUCTION INTRODUCTION INTRODUCTION INTRODUCTION The West Virginia Department of Environmental Protection’s (DEP) Water- shed Assessment Section (WAS) assesses watersheds of the state by monitoring biological integrity, water quality, and habitat condition. Each watershed is monitored on a five-year cycle. Tug Fork watershed was monitored in 1998 and again in 2003. This summary report is based upon data generated from these efforts. DESCRIPTION DESCRIPTION DESCRIPTION DESCRIPTION DESCRIPTION The Tug Fork of Big Sandy River re- ceived its name during the 1756 winter campaign of Cherokees and Virginians against the Shawnees during the French & Indian War. A few companies of soldiers returning home against orders followed the north fork of “Sandy Creek,” as the stream was commonly called. Near starvation, the men boiled their rawhide “tugs” (straps/ laces) used for tying gear to their packs and drank the soup (Brown 1851). This fork became known as the “Tug” Fork, to distinguish it from the Dry Fork. Eventu- ally, the name also was applied to that por- tion of “Sandy Creek” downstream of the forks all the way to the confluence with Levisa Fork. The portion of the Tug Fork water- shed that lies within West Virginia drains lands in McDowell, Mingo, and Wayne counties, and it encompasses a 932 square mile area (Figure 1). Steep-sided hills and mountains with numerous rock cliffs make this watershed one of the most rugged in West Virginia. Almost all the rock strata exposed in the watershed are classified as Pennsylva- nian Age. The alkaline nature of most of the strata has resulted in soils and streams well-buffered against acidic atmospheric deposition. Streams of the Cumberland Moun- tains Subecoregion of the Central Appala- chians Ecoregion (Omernik, et. al. 1992) typically have moderate to steep gradients and substrates composed of significant amounts of sand. The streams within the Tug Fork watershed are no different than other streams in this subecoregion, with alternating riffle/run/pool habitats sporting sand deposits in the pools and slower runs. In the early part of the 20th Century, railroads opened up the watershed for ex- tensive coal mining (Williams 1976). Hu- man population increased dramatically during the first coal boom period and in- adequate sewage disposal has contributed to water quality degradation ever since. Metal-laden mine water from deep and surface mines continues to impact the Tug Fork Watershed A summary of the Watershed Assessment Section’s 1998 & 2003 monitoring efforts Photo by Doug Wood Figure 1. Location map County lines Tug Fork Major roads # Y Major cities # Y # Y Mingo County Wayne County McDowell County Williamson Welch west virginia department of environmental protection

Welcome message from author
This document is posted to help you gain knowledge. Please leave a comment to let me know what you think about it! Share it to your friends and learn new things together.
Transcript

INTRODUCTIONINTRODUCTIONINTRODUCTIONINTRODUCTIONINTRODUCTIONThe West Virginia Department of
Environmental Protection’s (DEP) Water-shed Assessment Section (WAS) assesseswatersheds of the state by monitoringbiological integrity, water quality, andhabitat condition. Each watershed ismonitored on a five-year cycle. Tug Forkwatershed was monitored in 1998 andagain in 2003. This summary report isbased upon data generated from theseefforts.
DESCRIPTIONDESCRIPTIONDESCRIPTIONDESCRIPTIONDESCRIPTIONThe Tug Fork of Big Sandy River re-
ceived its name during the 1756 wintercampaign of Cherokees and Virginiansagainst the Shawnees during the French &Indian War. A few companies of soldiersreturning home against orders followed thenorth fork of “Sandy Creek,” as the stream
was commonly called. Near starvation, themen boiled their rawhide “tugs” (straps/laces) used for tying gear to their packsand drank the soup (Brown 1851). Thisfork became known as the “Tug” Fork, todistinguish it from the Dry Fork. Eventu-ally, the name also was applied to that por-tion of “Sandy Creek” downstream of theforks all the way to the confluence withLevisa Fork.
The portion of the Tug Fork water-shed that lies within West Virginia drainslands in McDowell, Mingo, and Waynecounties, and it encompasses a 932 squaremile area (Figure 1). Steep-sided hills andmountains with numerous rock cliffs makethis watershed one of the most rugged inWest Virginia.
Almost all the rock strata exposed inthe watershed are classified as Pennsylva-
nian Age. The alkaline nature of most ofthe strata has resulted in soils and streamswell-buffered against acidic atmosphericdeposition.
Streams of the Cumberland Moun-tains Subecoregion of the Central Appala-chians Ecoregion (Omernik, et. al. 1992)typically have moderate to steep gradientsand substrates composed of significantamounts of sand. The streams within theTug Fork watershed are no different thanother streams in this subecoregion, withalternating riffle/run/pool habitats sportingsand deposits in the pools and slower runs.
In the early part of the 20th Century,railroads opened up the watershed for ex-tensive coal mining (Williams 1976). Hu-man population increased dramaticallyduring the first coal boom period and in-adequate sewage disposal has contributedto water quality degradation ever since.Metal-laden mine water from deep andsurface mines continues to impact the
Tug Fork WatershedA summary of the Watershed Assessment Section’s 1998 & 2003
monitoring efforts
Photo by Doug Wood
Figure 1. Location map
County linesTug ForkMajor roads
#Y Major cities#Y
#Y
Mingo County
Wayne County
McDowell County
Williamson
Welch
west virginia department of environmental protection

2
An Ecological Assessment of...
streams of the Tug Fork watershed. TheTug Fork watershed has numerous valleyfills (Fig. 16), some represented well in theDEP database, some under-represented(Shank 2004).
ECO-ASSESSMENTECO-ASSESSMENTECO-ASSESSMENTECO-ASSESSMENTECO-ASSESSMENTThe watershed was assessed in
1998 and 2003 using biological, water qual-ity, and habitat evaluation techniques.The evaluation of these three key ecologi-cal components allows the agency to gen-erate a clearer picture of stream healththan single component assessment wouldallow. The sampling techniques and as-sessment methods for each of the compo-nents are presented in the following para-graphs. These techniques and methodsare based upon Rapid Bioassessment Pro-tocols (RBPs) developed for the U.S. Envi-ronmental Protection Agency (EPA) andpublished in a document titled RapidBioassessment Protocols for Use inStreams and Rivers - BenthicMacroinvertebrates and Fish (Plafkin etal. 1989). An updated version of thisdocument can be viewed and downloadedfrom the following website: http://www.epa.gov/owow/monitoring/rbp/download.html. The diversity of applica-tions provided by the RBPs was the pri-mary reason they were adopted by theWatershed Assessment Section for use inassessing watersheds.
BIOLOGICAL SAMPLINGBenthic macroinvertebrates are small
animals without backbones that live onthe bottoms of streams and lakes. Insectscomprise the largest diversity of these ani-
mals, but snails, mussels, aquatic worms,and crayfish are also members of thebenthic community. These animals are im-portant in the processing and cycling ofnutrients, and are major food sources forfish and other aquatic animals. In general,a clean stream has a diverse array ofbenthic organisms that occupy a variety ofecological niches. Polluted streams gener-ally have a lower diversity and often aredevoid of pollution sensitive species.
Benthic macroinvertebrates can becollected using several techniques. TheWatershed Assessment Section used the
EPA’s RBP II with some modifications. Be-cause the vast majority of stream miles inthe state have riffle/run habitat, the “SingleHabitat Approach” was the benthic collec-tion method adopted by the WatershedAssessment Section. In each stream withadequate riffle/run habitat, the WatershedAssessment Section used a rectangular-frame kick-net to capture organisms dis-lodged by kicking and brushing substrateobjects in a specified area (two squaremeters in 1998 and one square meter in2003).
Determining the biological conditionof each site involved calculating and sum-marizing six community metrics basedupon the benthic macroinvertebrate data:♦ Total taxa♦ EPT index (See glossary)♦ % 2 dominant taxa♦ % EPT (See glossary)♦ % Chironomids♦ Hilsenhoff’s biotic index (modified)
The six benthic community metricswere combined into a single index, theWest Virginia Stream Condition Index(WVSCI) developed by Tetra Tech Inc.(Gerritsen et. al. 2000) using the DEP’swatershed assessment data. The WVSCIhas proven itself a useful and cost effec-tive tool for assessing the health of WestVirginia’s streams. The impairment cat-egories developed within the WVSCI areimportant tools the Watershed AssessmentSection uses in making management deci-sions and in allocating limited resources tothe streams that need them most.
SAMPLING SUMMARYNamed streams in watershed ..... 522
Named streams visited ................119
Sites visited ................................. 207
Habitat assessment sites ............ 174
Water quality sampling sites ....... 176
Benthic sample sites ................... 173
Comparable benthic sites ........... 167
Random sites .................................63
Reference sites ............................... 6
Photo by Mike Sovic
Photo by Karen Maes
Photo by Ashley Thomas
3
...the Tug Fork WatershedWATER QUALITYSAMPLING
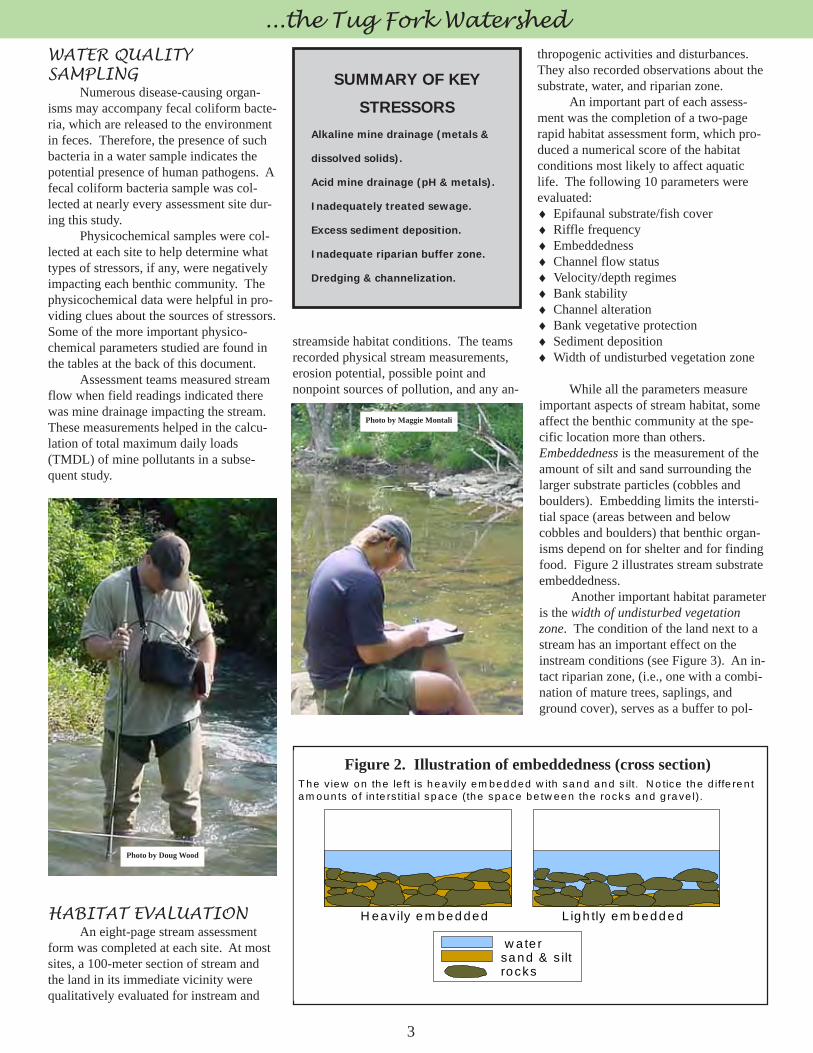
Numerous disease-causing organ-isms may accompany fecal coliform bacte-ria, which are released to the environmentin feces. Therefore, the presence of suchbacteria in a water sample indicates thepotential presence of human pathogens. Afecal coliform bacteria sample was col-lected at nearly every assessment site dur-ing this study.
Physicochemical samples were col-lected at each site to help determine whattypes of stressors, if any, were negativelyimpacting each benthic community. Thephysicochemical data were helpful in pro-viding clues about the sources of stressors.Some of the more important physico-chemical parameters studied are found inthe tables at the back of this document.
Assessment teams measured streamflow when field readings indicated therewas mine drainage impacting the stream.These measurements helped in the calcu-lation of total maximum daily loads(TMDL) of mine pollutants in a subse-quent study.
HABITAT EVALUATIONAn eight-page stream assessment
form was completed at each site. At mostsites, a 100-meter section of stream andthe land in its immediate vicinity werequalitatively evaluated for instream and
streamside habitat conditions. The teamsrecorded physical stream measurements,erosion potential, possible point andnonpoint sources of pollution, and any an-
thropogenic activities and disturbances.They also recorded observations about thesubstrate, water, and riparian zone.
An important part of each assess-ment was the completion of a two-pagerapid habitat assessment form, which pro-duced a numerical score of the habitatconditions most likely to affect aquaticlife. The following 10 parameters wereevaluated:♦ Epifaunal substrate/fish cover♦ Riffle frequency♦ Embeddedness♦ Channel flow status♦ Velocity/depth regimes♦ Bank stability♦ Channel alteration♦ Bank vegetative protection♦ Sediment deposition♦ Width of undisturbed vegetation zone
While all the parameters measureimportant aspects of stream habitat, someaffect the benthic community at the spe-cific location more than others.Embeddedness is the measurement of theamount of silt and sand surrounding thelarger substrate particles (cobbles andboulders). Embedding limits the intersti-tial space (areas between and belowcobbles and boulders) that benthic organ-isms depend on for shelter and for findingfood. Figure 2 illustrates stream substrateembeddedness.
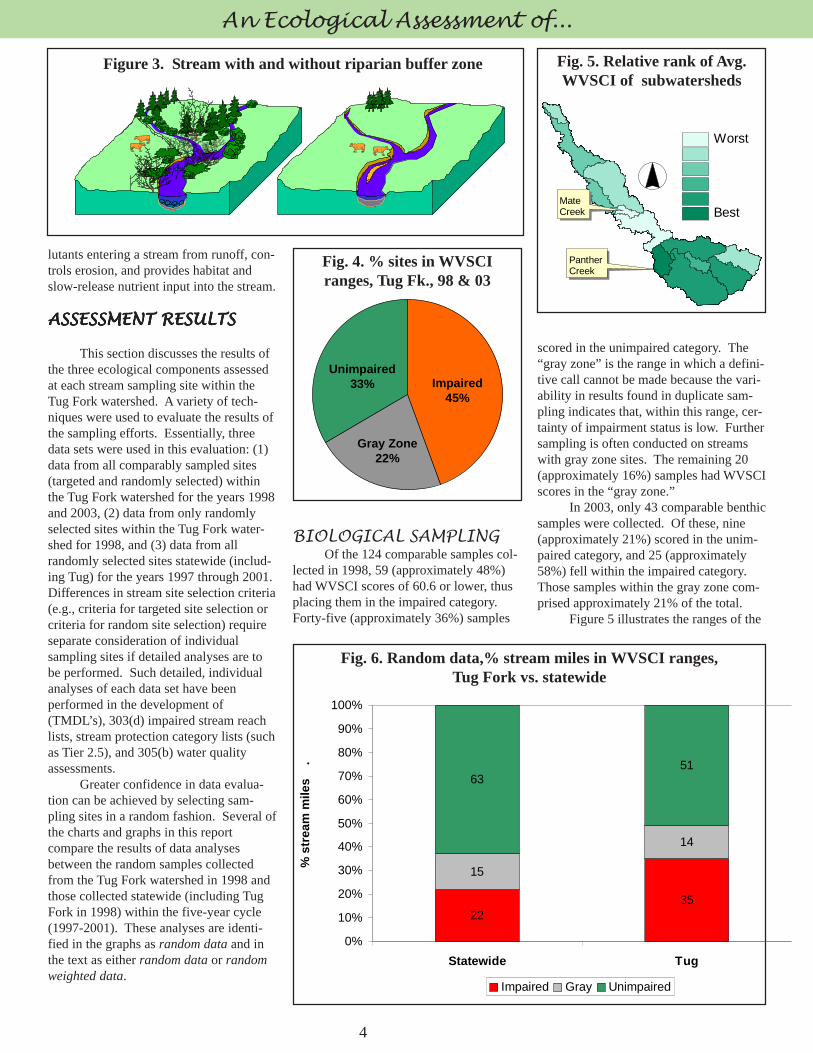
Another important habitat parameteris the width of undisturbed vegetationzone. The condition of the land next to astream has an important effect on theinstream conditions (see Figure 3). An in-tact riparian zone, (i.e., one with a combi-nation of mature trees, saplings, andground cover), serves as a buffer to pol-
SUMMARY OF KEY
STRESSORSAlkaline mine drainage (metals &
dissolved solids).
Acid mine drainage (pH & metals).
Inadequately treated sewage.
Excess sediment deposition.
Inadequate riparian buffer zone.
Dredging & channelization.
T he v iew on the le ft is h eav ily em bedded w ith sa nd an d s ilt. N o tice the d iffe re n ta m oun ts o f in te rs titia l space (the space be tw een the rocks and g ra ve l).
H eav ily e m bed ded L igh tly em b edd ed
w a te rsa nd & s iltrocks
Figure 2. Illustration of embeddedness (cross section)
Photo by Doug Wood
Photo by Maggie Montali
4
An Ecological Assessment of...
lutants entering a stream from runoff, con-trols erosion, and provides habitat andslow-release nutrient input into the stream.
ASSESSMENT RESULTSASSESSMENT RESULTSASSESSMENT RESULTSASSESSMENT RESULTSASSESSMENT RESULTS
This section discusses the results ofthe three ecological components assessedat each stream sampling site within theTug Fork watershed. A variety of tech-niques were used to evaluate the results ofthe sampling efforts. Essentially, threedata sets were used in this evaluation: (1)data from all comparably sampled sites(targeted and randomly selected) withinthe Tug Fork watershed for the years 1998and 2003, (2) data from only randomlyselected sites within the Tug Fork water-shed for 1998, and (3) data from allrandomly selected sites statewide (includ-ing Tug) for the years 1997 through 2001.Differences in stream site selection criteria(e.g., criteria for targeted site selection orcriteria for random site selection) requireseparate consideration of individualsampling sites if detailed analyses are tobe performed. Such detailed, individualanalyses of each data set have beenperformed in the development of(TMDL’s), 303(d) impaired stream reachlists, stream protection category lists (suchas Tier 2.5), and 305(b) water qualityassessments.
Greater confidence in data evalua-tion can be achieved by selecting sam-pling sites in a random fashion. Several ofthe charts and graphs in this reportcompare the results of data analysesbetween the random samples collectedfrom the Tug Fork watershed in 1998 andthose collected statewide (including TugFork in 1998) within the five-year cycle(1997-2001). These analyses are identi-fied in the graphs as random data and inthe text as either random data or randomweighted data.
BIOLOGICAL SAMPLINGOf the 124 comparable samples col-
lected in 1998, 59 (approximately 48%)had WVSCI scores of 60.6 or lower, thusplacing them in the impaired category.Forty-five (approximately 36%) samples
Figure 3. Stream with and without riparian buffer zone
Worst
Best
PantherCreek
MateCreek
Fig. 5. Relative rank of Avg.WVSCI of subwatersheds
Fig. 6. Random data,% stream miles in WVSCI ranges,Tug Fork vs. statewide
2235
15
14
6351
0%
10%
20%
30%
40%
50%
60%
70%
80%
90%
100%
Statewide Tug
% s
trea
m m
iles
.
Impaired Gray Unimpaired
Fig. 4. % sites in WVSCIranges, Tug Fk., 98 & 03
Gray Zone22%
Impaired45%
Unimpaired33%
scored in the unimpaired category. The“gray zone” is the range in which a defini-tive call cannot be made because the vari-ability in results found in duplicate sam-pling indicates that, within this range, cer-tainty of impairment status is low. Furthersampling is often conducted on streamswith gray zone sites. The remaining 20(approximately 16%) samples had WVSCIscores in the “gray zone.”
In 2003, only 43 comparable benthicsamples were collected. Of these, nine(approximately 21%) scored in the unim-paired category, and 25 (approximately58%) fell within the impaired category.Those samples within the gray zone com-prised approximately 21% of the total.
Figure 5 illustrates the ranges of the

5
...the Tug Fork WatershedWVSCI score averages by subwatershedfor the combined 1998 and 2003 data. ThePanther Creek subwatershed had thehighest average score (approximately73.13) and the Mate Creek subwatershedhad the lowest average score (46.08).
Figure 6 contrasts the Tug Forkwatershed’s showing in the WVSCI cat-egories relative to the statewide randomdataset. A greater percentage of streammiles in the Tug Fork watershed were im-paired than statewide.
WATER QUALITYSAMPLING
Water was collected from 129 sitesin 1998 and 41 sites in 2004 to measurefecal coliform bacteria concentrations.Many sites had very high levels, 12 with20,000 or more/100mL. The majority ofsites (nearly 57%) in 1998 had levelsabove 400/100mL, which is a flag valuebased upon the state's water qualitystandard for contact recreation. In orderfor a stream to meet the water qualitystandard, bacteria cannot exceed this levelin more than 10 percent of all samplestaken during a month. In 2003, approxi-mately 48% exceeded this flag value.
The percentage of stream miles thatexceeded this bacteria threshold in the TugFork watershed was greater than that inthe statewide random data set (Fig. 7).Note also the higher percentage in the TugFork watershed over even higher levels ofbacteria concentration (1,000/100mL and2,000/100mL).
Most of the high bacteria levels
were found near residential areas. It issometimes difficult to determine thesources of bacterial contamination.However, the Tug Fork watershed hostedvery little farm livestock (and that mostlyin the northwestern one-fifth of thewatershed) and wildlife populations werenot considered overabundant. Therefore,untreated and inadequately treated sewagewere the most likely primary sources ofhigh bacteria concentrations. Manyassessment forms’ notes support thisreasoning.
In 1998, 56 of the specific conduc-tance readings (approximately 42%) fromall sample sites were greater than 500µmhos/cm, and only 13 (approximately9%) produced values below 100 µmhos/cm. These percentages were approxi-mately 60% and 2%, respectively, in 2003.
In 1998, approximately 9% of thesamples had iron concentrations greaterthan the acute criterion for warmwaterfisheries of 1.5 mg/L, and approximately4% had manganese levels above thehuman health criterion of 1.0 mg/L.However, this criterion is only applicable instream reaches extending five miles abovedrinking water source points. No sampleswere collected for dissolved aluminum in1998, but in 2003, 26 samples (see table 12),including two duplicates, were analyzedfor that constituent. None violated thechronic water quality standard forwarmwater fisheries (not to exceed 750 µg/L). In 2003, only approximately 3% of theiron samples exceeded the water qualitystandard and none violated the humanhealth standard for manganese.
HABITAT EVALUATIONThe average scores for most RBP
habitat parameters were in the good range.One parameter, riffle frequency, was in thevery good range and another, width ofundisturbed vegetation zone was in thefair range. Ten sites had very good totalhabitat scores (160 or greater out of a totalof 200). Twenty-six sites had total habitatscores in the fair range (below 100) and therest (171 sites) had totals in the goodrange. Figure 8 illustrates the percentagesof total habitat scores within the fourranges.
At each site, field crews noted the
presence of activities and disturbancesthat could have been affecting the streams.The type of disturbance observed mostoften was roadways. Other fairly commondisturbances, in descending order, werepower lines, residences, and lawns. Coalmines or preparation plants were locatednear a few sites. Many streams werephysically altered by channelization andby the addition of riprap. None of thesampling sites were adjacent to hayfieldsor pastures.
Many environmentally-aware andcommunity-minded citizens within the wa-tershed have formed civic organizations,watershed associations, and other groupsto help solve environmental problems thatplague the watershed. A notable problemthese groups are currently tacklingthrough stream sweep cleanups, often inconjunction with DEP’s and Division ofNatural Resources’ “litter gitter” enforce-ment efforts, is the illegal dumping of hu-man refuse. The extent of this problem isreflected in the watershed’s aesthetic/trash
Fig. 7. Random data,% stream miles in various FC bacteriacategories, Tug Fork vs. statewide
72.32
27.68
15.56
9.98
51.61
48.39
33.87
30.65
0
10
20
30
40
50
60
70
80
< 400 > 400 > 1000 > 2000Fecal coliform bacteria concentration in colonies/100mL
% s
trea
m m
iles
.
Statewide Tug Fork
Fig. 8. % sites in RBP habitatranges, Tug Fk., 98 & 03
Good81%
Very good11%
Poor0%Fair
8%

6
An Ecological Assessment of...visual rating compared to those in otherwatersheds throughout the state (Fig. 9).In recent years, the actions of thesegroups have shown hopeful outcomes.
It should be noted that the results ofnon-random sampling are biased towardsmore developed areas because of one ofthe sample site selection methods used bythe Watershed Assessment Section. Manystreams were sampled at the road cross-ings nearest to their mouths and upstreamof bridges or culverts. Often, this practiceputs assessment teams in locations with agood deal of human disturbances. This isespecially true in watersheds like TugFork’s where razor-backed ridges andsteep slopes limit residential, industrial,and business developments to the narrowstream valleys.
However, the random weighted datado not have this bias. Figure 10 indicatesthat the Tug Fork watershed fared slightlybetter in the RBP categories than did thestatewide data set. A slightly higherpercentage of Tug Fork stream miles hadtotal RBP habitat scores in the very goodrange and a slightly lower percentage hadscores in the fair range.
The random data set also showsslightly better conditions overall in thecombined habitat parameter category ofembeddedness plus sediment deposition.Figure 11 indicates that the percentage ofTug Fork watershed stream miles in thevery good category was less than that per-centage statewide (approximately 10%less). However, nearly 20% more Tug Forkstream miles than statewide stream milesscored in the good category. In addition,nearly 9% fewer Tug Fork stream milesthan statewide stream miles scored in thefair category.
Figure 12 shows the relationship be-tween the WVSCI scores and the totalscores from the RBP Habitat Assessmentsfor all comparably sampled sites in 1998and 2003. There is only a weak positivecorrelation between the two scores (R =+0.3793341 at the 95% confidence inter-val). In most ecological assessments thisusually indicates that factors (e.g., waterquality or unusual climatological events)other than habitat quality are determiningthe condition of many biological communi-ties within the study area. In the Tug Forkwatershed, water quality is probably thedriving force behind benthic communityconditions at most of the sites sampled.
Fig. 10. Random data,% stream miles in RBP habitat categories,Tug Fork vs. statewide
0.15
12.86
69.11
17.87
0.15
7.79
69.84
22.22
0
10
20
30
40
50
60
70
80
Poor Fair Good Very good
% s
trea
m m
iles
.
Statewide Tug Fork
Fig. 11. Random data,% stream miles in categories ofembeddedness + sediment
1.79
18.27
53.96
25.98
1.59
9.52
73.02
15.87
0
10
20
30
40
50
60
70
80
Poor Fair Good Very Good
% s
trea
m m
iles
.
Statewide Tug Fork
Fig. 9. Random data, % stream miles with poor aesthetic/trashvisual rating for all watersheds statewide
15.9
11.9
9.6 9.38.7
7.5
6.05.1
2.6 2.6 2.51.9
0.0 0.0 0.0 0.0 0.0 0.0 0.0 0.0 0.0 0.0 0.0 0.0 0.00
2
4
6
8
10
12
14
16
18
Tug Fork Coa
l
Mid Ohio
N
Monon
gahe
la
Twelvep
ole
Upr Guy
ando
tte
Lower
New
Lower
Ohio
Lower
Kanaw
ha Elk
N Br Poto
mac
Mid Ohio
S
Upr Ohio
S
Upper
New
Tygart
Vall
ey
Potomac
D D
Little
Kanaw
ha
Greenb
rier
Gauley
S Br Poto
mac
Dunka
rd
Wes
t Fork
Cheat
Cacap
on
Lwr G
uyan
dotte
% s
tream
mile
s

7
...the Tug Fork Watershed
IMPLICATIONSIMPLICATIONSIMPLICATIONSIMPLICATIONSIMPLICATIONSNumerous sites sampled during this
watershed assessment provided evidenceof negative impacts to benthicmacroinvertebrate communities from coalmining activities, both past and ongoing.Even mine drainage recipient sites with pHvalues well within the range required bythe state’s water quality standards pro-duced impaired WVSCI scores.
Similar results were found in threeindependent studies of other watersheds insouthern Appalachian coalfields (Cham-bers and Messinger 2001; Green et. al.2000; and Pond 2004).
A succinct explanation of the basisfor the physicochemical impacts of miningupon streams is found in the Chambersand Messinger report of the KanawhaRiver watershed (borders Tug Forkwatershed on the southeast) study by theU. S. Geological Survey.
The Kentucky Eastern Coal Field(ECF) study reported by Greg Pondrevealed, “Dissolved solids emanatingfrom hollowfills are a primary cause ofbiological impairment because of theirsevere impact to mayflies (a key compo-nent of headwater stream communities)and other sensitive taxa.” (Pond 2004:2).
The study pointed out, “Sulfate andconductivity is probably the most usefulchemical indicator of the condition of astream in mined watersheds in theECF...and its concentration reflects theextent of watershed disturbance.” (Pond2004:6-7).
Similar effects of coal mining wereseen on streams in the Tug Fork watershedduring this study period. Figure 13 showsthat of the 59 comparably sampled sitesthat scored in the unimpaired WVSCIrange and at which specific conductancewas measured, only 10 (approximately17%) had conductivities greater than 500µmhos/cm. Compare this to approxi-mately 56% of impaired and gray zoneWVSCI sites in the same specific conduc-tance range.
Figure 14 shows the averageconductivity of random sites in the TugFork watershed compared to the statewiderandom data. The Tug Fork data indicatethat there were likely higher averages ofcertain dissolved solids, including metalsand sulfate, in the Tug Fork watershedthan in the statewide data set. Indeed, theTug Fork watershed had a higher percent-age of stream miles with sulfate concen-trations indicating mine drainage (> 50mg/l) when compared to the statewide
random weighted data set (Fig. 15).Mountaintop removal, and other,
older forms of mining are the primarycontributors of dissolved solids to streamsthroughout the Tug Fork watershed. Thewatershed has hosted large-scale miningactivities since the beginning of the 20thCentury (see Fig. 16). This has resultednot only in water quality alterations duedirectly to mining waste, but also tochanges due to the presence of miningcommunities. A typical mining town in thewatershed concentrates residences andbusinesses in a narrow river bottom that isfrequently flooded and has little room forexpansion without negative impacts to thenear stream environment. Many of thecommunities have sewers that carry stormrunoff along with household wastes. Thegreat bulk of these combined stormoverflows carry wastes to the lower endsof the towns they serve, where there isinadequate treatment, if any treatment atall, before discharging into a stream.Within the watershed there are 149communities identified by name in GeneralHighway County Maps West Virginiaproduced by the West Virginia Departmentof Transportation. There are only 10publicly owned wastewater treatmentfacilities and one of these is merely a
Fig. 12. Tug Fork 1998 & 2003 data, WVSCI scores vs. RBP habitat scores
20
30
40
50
60
70
80
90
100
50 60 70 80 90 100 110 120 130 140 150 160 170 180 190 200Fair Good Very Good
RBP Scores
WVS
CI
Impa
ired
G
ray
Uni
mpa
ired
.

8
An Ecological Assessment of...
sewage collection system with no treat-ment. Only a fraction of the 149 communi-ties are served by these treatment facilities.Inadequate sewage treatment is believed
to be the primary reason why approxi-mately half of the fecal coliform bacteriasamples collected in both 1998 and 2003exceeded the state water quality standard.
In 1998, the DEP placed 64 streamsfrom the Tug Fork watershed on the 303(d)list of impaired streams because ofviolations of water quality standards forcertain metals. Total maximum daily loadswere developed for these streams in 2002.The TMDL document implicated coalmining as a major source of these viola-tions. The document indicated that mostof the primary point sources of metalsimpairments were mining-related (U.S. EPA2002:1.11). It also explained that aban-doned mine lands represented a significantnonpoint source of water quality impair-ments. Sediment produced from miningand other land-based activities (e.g.,harvested forest, oil and gas operations,and roads) was identified as a potentialsource of high metal contamination (U.S.EPA 2002:3.9, 3.10, & 3.12). Only one non-mining, permitted point source wasconsidered in the wasteload allocationcalculations. All others were not expectedto be significant sources of metals (U.S.EPA 2002:4.8).
Although there were many streamsnegatively impacted by coal mining andother activities within the Tug Forkwatershed during the currently reportedecological assessment, there were alsosome streams with few impacts. Refer-ence streams are considered the leastimpacted by human disturbances. None ofthe sites sampled in 2003 met the criteriaestablished for reference streams, but sixmet those criteria in 1998 (see Fig.17).Four of the six are in the Panther Creeksubwatershed.
The Panther Creek subwatershed,which had the highest average WVSCIscore (Fig. 5) and the lowest averagespecific conductance (Fig. 18), also hadone of the lowest percent land coveragesby mining activities (less than 1%).
Fig. 13. Tug Fork 98 & 03 data, WVSCI vs. specific conductance
20
40
60
80
100
0.00 500.00 1000.00 1500.00
Specific conductance, micromhos/cm .
WVS
CI
Maximum Value Line
Fig. 14. Random data, average conductivity
379
412
360
380
400
420
Statewide Tug Fork
Con
duct
ivity
(uS/
cm)
The aquatic integrity of the Panther Creeksubwatershed is relatively intact.
Photo by Doug Wood
21.98
47.62
0
20
40
60
Statewide Tug Fork
% s
trea
m m
iles
.
Fig. 15. Random data, % stream miles with sulfate>50 mg/L

9
...the Tug Fork Watershed
#S#S
#S
#S
#S
#S
#S#S
#S
#S
#S
#S
#S
#S
#S#S
#S
#S
#S
#S#S
#S
#S
#S
$T
$T$T
$T$T
$T
$T
$T
$T$T$T$T
$T
$T$T
$T
$T
$T $T$T
$T$T$T
$T
$T
$T
$TÊÚ ÊÚ
ÊÚ
ÊÚÊÚÊÚ
Fig. 16. Tug Fork Watershed mining influences
Tugsubshedspoly.shpTug Fork
#S Good WVSCI (>68-78)$T Very good WVSCI (>78)ÊÚ Reference sites
Fig. 17. Tug Fork Watershed sample sites withunimpaired WVSCI scores
Fig. 18. Average conductance in micromhos/cm ofsubwatersheds ranked
r
r
rr
r
r
r
r
rr
r
r
r
r
r
r
r
rr
r
r
r
r
r
rrr r
r
r
r
r
rr
r
r
r
r
r
r
r
r
r
rr
r
r
r
rr
r
rr
rr
r
r
r
rr
r
r
r
r
r
r
r
r r
r
rrr
r
rrr
r
r
r
rr
r
r
rr
r
r
rr
r
r
r
r
r
r
rr rr
r
r
r
rr
rrrrrrrrr
r
r
rrr
r
r
r
rr
r
rr
r
r
r
r
r
rr
r
r
rr
r
r
r
r
r r
r
r
r
r
r
r
r
r
r
r
rrrr
r
r
r
r
r
r
r
rr
r
r
rrr
r
r
r
r
r
rr
r
r
rr
r
r
r
r
r
r
rr
r
r
r
r r
rrrr
rr
r
r
r
rr
r
rrr
r
r
r rr
r r
r
rrrrr
r
r
r
rr
r
rr
r
rr
r
r
r
r
rr
r
r
r
r
rr r r
r
rr
r
r
r
r
rrrr
rr
rrr
r
r
r
r
r
r
r
r
r
r
r
r
r
r
r
r
r
r
r
r
r
r
rr
rr
r
rr
rr
r
r
r
r
r
rr
r
r
r
rr
r
r
r
r
r
rr
r
r
r
r
r
r
r
r
r
r
r
r
r
r
r
r
r
r
r
r
rr
rr
r
r
r
r
rrr
r
rrrr
rr
r rr
r r
r
rrr
r
rrr
rr
rr r
rrr
r
r
rrr
rrr
rrr
r
rr
rr
rrr
rr
r
r
r
r
r
rrr
r
r
rr
r
r
r
r
rr
r
r
r
rrrrr rr
r
r
r
r
r
r
r
r
r
r
r
r
r
rr
r
r
rr
r
r
r
r
r
r
r
r
r
r
r
rr
r
rr
r
rr
rrr
r
r
r
rrrrr
rrr
r
r
r rrr
r
rr
rr
r
rrr
r
rrrrrrr
r rrr
r
rrr
r rr
r
r
r
rr
r
r
rr
r
rrrrr
r
r
rr
rrr
rr
rr
r
rrr
r r
rrr
r r
r
r
r rr
rrr
r
r
r
r
r
rr
r
r
r
rrrrr
r
r
rr
rr
r
r
r
r
r
r rrr
r
r
r
r
r
rrrr
rr rrrr
r
r
r
r
rr
r
rr
r
r
r
r
r
r
rrr
r
r
r
r
r
rrrr
rrrr
r
r
r
rrrrr
rrrr
r
r
$
$
$
$
$
$$$
$
$
$
$ $
$$
$$
$
$
$
Tug Fork watershed boundary
r Recent mine permits $ Mine dams
Abandoned mine strips Augered mines Mining valley fills 303(d) listed streams .
Predicted zone of mtntop mining
0 - 200201 - 500501 - 800
Tug Fork

10
An Ecological Assessment of...
GLOSSARYGLOSSARYGLOSSARYGLOSSARYGLOSSARYDEP - West Virginia Department of
Environmental Protection.EPA - Environmental Protection Agency.EPT - Ephemeroptera, Plecoptera, &
Trichoptera taxonomic orders ofinsects generally considered sensitiveto pollution.
parameter - a factor that restricts what ispossible or what results.
RBP - Rapid Bioassessment Protocol.TMDL - Total Maximum Daily Load.WVSCI - West Virginia Stream Condition
Index.
REFERENCESREFERENCESREFERENCESREFERENCESREFERENCES
Brown, Henry. 1851. The VirginiaHistorical Register, And Literary NoteBook. Vol. IV, Nos. II & III.
Caudill, Harry M. 1962. Night Comes ToThe Cumberlands. Little, Brown andCompany. Boston, Massachusetts andToronto, Canada.
Chambers, Douglas B. and TerenceMessinger. 2001. Benthic InvertebrateCommunities and Their Responses toSelected Environmental Factors in theKanawha River Basin, West Virginia,Virginia, and North Carolina. WaterResources Investigations Report 01-4021. U. S. Department of the InteriorU. S. Geological Survey. Denver,Colorado.
Cunningham, Rodger. 1987. Apples onthe Flood: the Southern MountainExperience. University of TennesseePress, Knoxville, Tennessee.
Dix, Keith. 1988. What’s a Coal Miner toDo?: The Mechanization of CoalMining. University of Pittsburgh Press,Pittsburgh, Pennsylvania.
Gerritsen, Jeroen, June Burton, andMichael T. Barbour. 2000. A streamcondition index for West Virginiawadeable streams. Tetra Tech, Inc.Owings Mills, Maryland.
Green, Jim, Maggie Passmore, and HopeChilders. 2000. A Survey of theCondition of Streams in the PrimaryRegion of Mountaintop Mining/ValleyFill Coal Mining. U.S. EnvironmentalProtection Agency, Region III, AquaticBiology Group. Wheeling, WestVirginia.
Plafkin, J. L., M. T. Barbour, K. D. Porter,S. K. Gross and R. M. Hughes. 1989.Rapid bioassessment protocols for usein streams and rivers: Benthicmacroinvertebrates and fish. UnitedStates Environmental ProtectionAgency. EPA/444/4-89-00.
Pond, Gregory J. 2004. Effects of SurfaceMining and Residential Land Use onHeadwater Stream Biotic Integrity inthe Eastern Kentucky Coalfield Region.Kentucky Department of Environmen-tal Protection, Frankfort, Kentucky.
Shank, Michael. 2004. Development of aMining Fill Inventory from Multi-dateElevation Data. A paper presented atthe 2004 Advanced Integration ofGeospatial Technologies in Mining andReclamation, Dec. 7-9, 2004, Atlanta,Georgia.
Smithson, Janice. 1998. WatershedAssessment Program, StandardOperating Procedures. West VirginiaDivision of Environmental Protection,Office of Water Resources, WatershedAssessment Program.
Williams, John Alexander. 1976. WestVirginia and the Captains of Industry.West Virginia University Library,Morgantown, West Virginia.
DEP. 2003. Watershed AssessmentSection’s 2003 Standard OperatingProcedures. West Virginia Departmentof Environmental Protection, Divisionof Water and Waste Management,Watershed Assessment Section.
U.S. Army Corps of Engineers, U.S.Environmental Protection Agency, U.S.Department of the Interior’s Office ofSurface Mining and Fish & WildlifeService, and the West Virginia Depart-ment of Environmental Protection.2003. Mountaintop Mining/Valley FillDraft Environmental Impact Study.
U.S. EPA (Environmental ProtectionAgency), Region 3. 2002. Metals andpH TMDLs for the Tug Fork RiverWatershed, West Virginia. Philadel-phia, Pennsylvania.
ACKNOWLEDGMENTSACKNOWLEDGMENTSACKNOWLEDGMENTSACKNOWLEDGMENTSACKNOWLEDGMENTSFunding for this watershed assess-
ment was provided by the U.S. Environ-mental Protection Agency and by the WestVirginia Department of EnvironmentalProtection. This report was compiled bystaff of the West Virginia Department ofEnvironmental Protection’s WatershedAssessment Section and was publishedNovember 2006. The primary author isDoug Wood, Environmental ResourceSpecialist. The report can be viewed anddownloaded from the internet atwww.wvdep.org
The DEP is an equal opportunity/affirmative action employer.

11
...the Tug Fork Watershed
Tug Fork Subwatersheds
Tug Fork mainstemSubwatershed borders
Major tributaries
Tug 5Pigeon Creek
Tug 1Dry Fork
Tug 2Tug 4
Mate Creek
Tug 3
Panther Creek
Elkhorn Ck.
Miller Creek
Clear Fork
The following data tablesare organized by the
subwatersheds shown below.
Figure 19.

12
An Ecological Assessment of...
dehsretawbuS1kroFguT.1ELBAT
etaD emaNmaertS edoCNA eliMtnioP ICSVW PBR Hp dnoCpS
)mc/sohmu(etafluS)L/gm(
SST)L/gm(
lAlatoT)L/gm(
eFlatoT)L/gm(
laceF/.loc(
)Lm001
8991/6/7 reviRkroFguT TSBVW 2.401 01.24 611 04.8 426 002 650.0 311.0 0044
8991/71/6 keerCnaidnIelttiL 001-TSBVW 87.94 721 08.7 453 25 50.0< 50.0 07
8991/32/6 hcnarBsworraNkcoR 301-TSBVW 39.64 241 09.7 874 051 741.0 756.0 0031
8991/81/6 hcnarBsirraH 401-TSBVW 44.37 641 00.8 318 003 50.0< 402.0 04
8991/1/7 hcnarBllehctiM 501-TSBVW 33.16 911 06.7 805 081 541.0 903.0 071
8991/71/6 keerCkcildnaS 901-TSBVW 0 32.35 901 02.7 236 052 721.0 652.0 092
8991/1/7 keerCkcildnaS 901-TSBVW 7.1 96.45 921 08.7 718 082 202.0 92.0 061
8991/1/7 kCkcildnaS/kroFthgiR A-901-TSBVW 45.24 211 07.7 993 001 604.0 382.0 092
8991/1/7 keerCkcildnaS/kroFtfeL B-901-TSBVW 57.45 021 05.7 787 043 235.0 753.0 71
8991/71/6 hcnarBnikdA 011-TSBVW 64.75 411 02.7 603 001 50.0< 50.0 72
8991/71/6 hcnarBrehcleB 111-TSBVW 13.16 051 04.7 366 022 50.0< 50.0 4
8991/03/6 hcnarBelohnruT 211-TSBVW 96.66 031 08.7 398 013 721.0 974.0 084
8991/03/6 hcnarBnomraH 311-TSBVW 84.35 321 01.8 048 022 50.0< 452.0 12
8991/03/6 hcnarBnomraH 311-TSBVW 66.14 521 002 50.0< 882.0 12
8991/6/7 kroFguT/kroFhtuoS 511-TSBVW 37.76 221 02.8 825 081 50.0< 241.0 0014
8991/1/7 hcnarBaeT A-511-TSBVW 71.08 321 06.7 001 12 50.0< 2.0 0091
8991/52/6 hcnarBerulCcM B-511-TSBVW 27.88 041 02.7 98 81 15.0 769.0 002
8991/52/6 hcnarBpmuJ D-511-TSBVW 25.77 911 03.7 801 73 951.0 493.0 0021
8991/42/6 keerCecipS E-511-TSBVW 89.97 531 04.7 354 081 50.0< 522.0 71
8991/6/7 hcnarBleruaL F-511-TSBVW 63.18 331 09.7 431 23 116.0 81.1 61
8991/52/6 kroFdaoR G-511-TSBVW 32.47 621 06.7 546 042 456.0 74.1 007
8991/42/6 hcnarBpooL 711-TSBVW 55.85 931 00.8 855 041 3470.0 592.0 4
8991/42/6 hcnarBlliM 811-TSBVW 12.97 651 09.7 005 18 411.0 193.0 04
8991/42/6 hcnarByrD 911-TSBVW 72.29 151 07.6 602 85 381.0 574.0 0031
8991/32/6 keerCelttiL 021-TSBVW 0 13.04 731 02.7 272 53 50.0< 652.0 006
8991/32/6 keerCelttiL 021-TSBVW 2 98.78 541 06.6 241 12 50.0< 761.0 002
8991/32/6 hcnarBevarGnaidnI A-021-TSBVW 72.36 531 01.7 143 35 811.0 935.0 0076
8991/61/6 hcnarBpmacnoehcnuP B-021-TSBVW 01.37 401 02.7 902 73 333.0 184.0 0063
8991/42/6 hcnarBtaeslliM 121-TSBVW 90.98 431 07.6 401 21 50.0< 582.0 0322
3002/41/5 kCkcildnaS/kroFthgiR A-901-TSBVW 3.0 12.25 121 75.7 693 621 6 21.0 32.0 28
3002/41/5 hcnarBleruaL F-511-TSBVW 2.1 42.96 451 44.7 804 841 20.0< 1.0 3
3002/71/9 reviRkroFguT TSBVW 3.221 82.35 141 34.8 117 0021
3002/71/9 reviRkroFguT TSBVW 3.221 82.35 141 34.8 117 0021
3002/61/9 reviRkroFguT TSBVW 9.931 02.76 021 52.8 817 085
3002/61/9 reviRkroFguT TSBVW 8.851 73.34 021 04.8 683 0051
3002/61/9 kroFguT/kroFhtuoS 511-TSBVW 5.0 66.67 451 81.8 156 057
3002/81/9 keerCelttiL 021-TSBVW 0 05.84 611 24.8 323 0022
3002/81/9 keerCelttiL 021-TSBVW 0 13.24 421 24.8 323 0082
3002/81/9 keerCelttiL 021-TSBVW 0 13.24 421 24.8 323 008

13
...the Tug Fork Watershed
dehsretawbuS2kroFguT.2ELBAT
etaD emaNmaertS edoCNA eliMtnioP ICSVW PBR Hp dnoCpS
)mc/sohmu(etafluS)L/gm(
SST)L/gm(
lAlatoT)L/gm(
eFlatoT)L/gm(
laceF/.loc(
)Lm0018991/7/7 keerCesroH 36-TSBVW 2.1 38.77 331 05.8 661 52 50.0< 161.0 0568991/52/6 hcnarBkciL 17-TSBVW 76.03 821 07.7 557 00928991/52/6 hcnarBnomraH 27-TSBVW 14.18 411 04.7 38 0848991/7/7 kroFraelC 67-TSBVW 0 50.67 651 03.7 844 031 171.0 24.0 028991/7/7 kroFraelC 67-TSBVW 0 48.28 171 041 351.0 554.0 918991/8/7 hcnarBmoorybbahS B-87-TSBVW 64.65 911 00.8 372 84 201.0 933.0 00002>8991/9/7 hcnarBpmaCyenoH D-87-TSBVW 03.47 231 06.7 243 001 50.0< 577.0 0038991/9/7 hcnarBeertnooC E-87-TSBVW 04.15 241 04.8 428 021 913.0 538.0 00038991/03/6 hcnarBlaocenotS F-87-TSBVW 07.57 351 02.8 517 032 50.0< 2.0 0848991/1/7 hcnarByawdaB G-87-TSBVW 21.25 511 00.8 824 49 50.0< 486.0 00038991/42/6 hcnarBnosweN H-87-TSBVW 08.32 731 01.8 816 021 50.0< 962.0 00748991/42/6 hcnarBpmacerooM I-87-TSBVW 64.66 241 03.8 607 052 50.0< 561.0 28991/32/6 hcnarByvaD/kroFtfeL A-58-TSBVW 16.36 421 01.8 243 06 961.0 815.0 00002>8991/32/6 hcnarByvaD/kroFtfeL A-58-TSBVW 8.0 45.78 361 09.7 613 25 981.0 386.0 08991/71/6 hcnarBnonnahS 49-TSBVW 15.08 611 04.7 941 14 50.0< 5170.0 0728991/71/6 hcnarBnonnahSreppU 59-TSBVW 65.82 721 07.7 142 05 50.0< 50.0 00838991/71/6 hcnarBpmacnoehcnuP A-89-TSBVW 27.16 131 03.7 701 32 35.0 602.0 0213002/42/9 reviRkroFguT TSBVW 9.17 35.17 641 51.8 646 771 81 25.0 39.0 6113002/71/9 kroFraelC 67-TSBVW 1.0 06.56 741 53.8 234 033002/51/5 hcnarBynneJ 78-TSBVW 9.1 26.19 531 43.6 65 4.11 11 21.0 52.0 002
dehsretawbuS3kroFguT.3ELBAT
etaD emaNmaertS edoCNA eliMtnioP ICSVW PBR Hp dnoCpS
)mc/sohmu(etafluS)L/gm(
SST)L/gm(
lAlatoT)L/gm(
eFlatoT)L/gm(
laceF/.loc(
)Lm0018991/8/7 reviRkroFguT TSBVW 4.74 10.37 361 03.8 506 041 1650.0 412.0 0618991/61/6 keerCruhpluS 14-TSBVW 68.23 721 04.7 523 0818991/61/6 keerCrekcahT 24-TSBVW 97.73 041 05.4 046 072 62.3 50.0 0138991/61/6 hcnarBellivsrossicS A-24-TSBVW 43.75 921 03.7 598 034 429.0 526.0 228991/61/6 hcnarBellivnihcuaM B-24-TSBVW 61.44 931 08.4 356 082 57.1 351.0 58991/61/6 keerCeniveparG 34-TSBVW 34.25 241 03.7 217 013 81.1 792.0 00658991/61/6 kroFkciL A-34-TSBVW 44.74 241 07.3 807 003 23.4 50.0 5<8991/7/7 keerClluB 75-TSBVW 6.0 37.46 701 04.8 362 56 50.0< 251.0 00528991/7/7 keerClluB/kroFtfeL B-75-TSBVW 57.73 311 08.8 092 01<3002/71/9 keerChceeB 64-TSBVW 1.0 13.86 641 81.7 0701 674 5 50.0 41.0 00263002/32/9 keerCneB 25-TSBVW 2.0 27.25 141 72.8 349 433 5 70.0 12.0 811
dehsretawbuS4kroFguT.4ELBAT
etaD emaNmaertS edoCNA eliMtnioP ICSVW PBR Hp dnoCpS
)mc/sohmu(etafluS)L/gm(
SST)L/gm(
lAlatoT)L/gm(
eFlatoT)L/gm(
laceF/.loc(
)Lm0018991/71/6 keerCrelliM 72-TSBVW 5.2 88.76 531 04.7 751 23 838.0 85.1 0818991/71/6 kroFlliM C-72-TSBVW 61.77 061 09.7 132 65 192.0 996.0 998991/32/6 keerColaffuB 13-TSBVW 1 85.26 711 05.7 443 021 4.0 6.0 00498991/51/6 keerColaffuB/kroFhtuoS B-13-TSBVW 59.17 731 05.7 491 0188991/51/6 keerCeertraguS 23-TSBVW 33.95 231 02.7 062 58 792.0 26.1 0948991/71/6 keerCnosmailliW 33-TSBVW 84.34 301 03.7 982 99 6070.0 331.0 000828991/22/6 keerCeromacyS 43-TSBVW 81.76 341 01.8 035 021 50.0< 321.0 0428991/51/6 keerCkciL 53-TSBVW 82.35 651 08.7 874 0758991/22/6 hcnarBnosmailliWkciD 63-TSBVW 71.33 801 05.7 499 044 50.0< 790.0 00858991/1/7 keerCesuorpS 83-TSBVW 69.15 56 01.8 5131 074 24.0 95.0 813002/7/5 keerCkciL 53-TSBVW 2.2 46.46 931 78.7 9301 684 6 71.0 53.0 68
14
An Ecological Assessment of...
dehsretawbuS5kroFguT.5ELBAT
etaD emaNmaertS edoCNA eliMtnioP ICSVW PBR Hp dnoCpS
)mc/sohmu(etafluS)L/gm(
SST)L/gm(
lAlatoT)L/gm(
eFlatoT)L/gm(
laceF/.loc(
)Lm0018991/52/6 hcnarBlliMredwoP 3-TSBVW 61.83 47 01.7 486 11 7850.0 27.1 0088991/03/6 hcnarBretniaP A5.0-01-TSBVW 60.87 611 04.7 86 0078991/7/7 keerClluB 41-TSBVW 35.96 401 08.7 703 00828991/42/6 keerClluB/kroFthgiR B-41-TSBVW 66.27 821 08.7 401 00538991/03/6 keerCrevliS 61-TSBVW 63.95 99 08.7 441 00418991/03/6 keerCeinneJ 71-TSBVW 7.2 08.35 031 06.7 071 61 51.0 6.0 0678991/7/7 keerCenobworraM 91-TSBVW 9.0 08.06 59 09.7 385 051 50.0< 975.0 0848991/6/7 keerCenobworraM 91-TSBVW 8 72.87 501 01.8 385 022 62.0 81.0 0743002/22/9 keerCtsoL 7-TSBVW 7.1 55.15 89 56.6 321 00643002/61/9 keerCeinneJ 71-TSBVW 7.0 49.45 59 24.7 144 5.05 5 70.0 65.1 0733002/71/9 keerCenobworraM 91-TSBVW 1.3 10.44 341 11.8 387 072 3< 20.0 91.0 44
dehsretawbuSkroFraelC.6ELBAT
etaD emaNmaertS edoCNA eliMtnioP ICSVW PBR Hp dnoCpS
)mc/sohmu(etafluS)L/gm(
SST)L/gm(
lAlatoT)L/gm(
eFlatoT)L/gm(
laceF/.loc(
)Lm0018991/1/7 kroFraelC 67-TSBVW 2.01 61.04 821 01.8 693 19 50.0< 432.0 00638991/42/6 kroFraelC 67-TSBVW 6.5 46.36 351 00.8 053 07 50.0< 964.0 0688991/42/6 hcnarBpmacyaD E-67-TSBVW 42.28 351 07.7 381 62 692.0 417.0 54
dehsretawbuSkeerCetaM7ELBAT
etaD emaNmaertS edoCNA eliMtnioP ICSVW PBR Hp dnoCpS
)mc/sohmu(etafluS)L/gm(
SST)L/gm(
lAlatoT)L/gm(
eFlatoT)L/gm(
laceF/.loc(
)Lm0018991/51/6 keerCetaM 04-TSBVW 80.63 121 09.7 245 042 50.0< 41.0 00518991/1/7 hcnarBkrofrehtuR B-04-TSBVW 56.94 711 02.5 097 063 5.1 3.2 5318991/61/6 hcnarBllehctiM C-04-TSBVW 39.23 931 09.7 498 003 403.0 773.0 00418991/51/6 hcnarBnifahC D-04-TSBVW 13.64 711 06.6 467 073 50.0< 951.0 0218991/51/6 kroFpmaCelbuoD H-04-TSBVW 44.56 411 06.7 743 0853002/42/9 keerCetaM 04-TSBVW 5.3 45.95 631 68.7 249 063 3 51.0 2.0 06
dehsretawbuSkeerCrehtnaP.8ELBAT
etaD emaNmaertS edoCNA eliMtnioP ICSVW PBR Hp dnoCpS
)mc/sohmu(etafluS)L/gm(
SST)L/gm(
lAlatoT)L/gm(
eFlatoT)L/gm(
laceF/.loc(
)Lm001
8991/7/7 keerCrehtnaP 06-TSBVW 71.05 431 09.7 022 22 50.0< 961.0 0003
8991/7/7 keerCrehtnaP 06-TSBVW 17.16 041 32 50.0< 741.0 0006
8991/7/7 kroFreirbneerG A-06-TSBVW 2 89.03 421 04.7 772 31 14.2 64.3 000011
8991/71/6 hcnarBbuC D-06-TSBVW 46.88 711 05.7 86 11 231.0 753.0 025
8991/7/7 hcnarBegroeG E-06-TSBVW 28.48 061 05.7 34 6 4590.0 923.0 54
8991/7/7 keerCenarC F-06-TSBVW 66.78 751 03.7 38 41 50.0< 351.0 21
8991/71/6 hcnarBenacirruH G-06-TSBVW 9.0 57.98 871 02.7 64 9 50.0< 511.0 55
8991/8/7 hcnarBkaOetihW 1-I-06-TSBVW 82.19 861 03.7 24 6 255.0 808.0 001
3002/32/9 keerCrehtnaP 06-TSBVW 8.2 94.07 551 88.7 303 042
3002/82/5 kroFhcnualS I-06-TSBVW 3.2 78.16 661 44.7 311 5.11 3 1.0 71.0 2<
keerCrelliM
DETCELLOCEREWSELPMASETARBETREVNIORCAMCIHTNEBON

15
...the Tug Fork Watershed
dehsretawbuSkroFyrD.9ELBAT
etaD emaNmaertS edoCNA eliMtnioP ICSVW PBR Hp dnoCpS
)mc/sohmu(etafluS)L/gm(
SST)L/gm(
lAlatoT)L/gm(
eFlatoT)L/gm(
laceF/.loc(
)Lm001
8991/7/7 kroFyrD 07-TSBVW 3.1 60.66 341 04.8 106 18 50.0< 621.0 051
8991/6/7 kroFyrD 07-TSBVW 4.81 98.55 141 01.8 576 001 50.0< 50.0 074
8991/7/7 kroFyrD 07-TSBVW 4.7 24.56 041 06.8 285 88 50.0< 6790.0 23
8991/2/7 hcnarBeliM C-07-TSBVW 82.08 621 08.7 032 00093
8991/2/7 hcnarBeniveparG F-07-TSBVW 72.35 811 06.7 421 42 50.0< 831.0 0003
8991/2/7 hcnarBnwotraeB I-07-TSBVW 95.07 831 05.7 223 49 317.0 661.0
8991/9/7 keerCwahsdarB M-07-TSBVW 8.1 31.55 221 08.7 561 52 14 46.1 47.1
8991/9/7 hcnarBgohdnuorG 1-M-07-TSBVW 51.23 821 08.7 341 00083
8991/8/7 hcnarBnepfloW 3-M-07-TSBVW 33.06 421 06.7 801 00002>
8991/6/7 keerCetalSelttiL N-07-TSBVW 5.4 78.98 851 03.7 17 9 50.0< 581.0 86
8991/8/7 keerCetalSelttiL N-07-TSBVW 0 76.33 59 08.7 691 44 336 4.51 7.61 00002<
8991/8/7 keerCetalSelttiL N-07-TSBVW 7.2 54.88 931 05.7 731 02 55 93.2 21.3 0063
8991/8/7 hcnarBllewtA O-07-TSBVW 8.96 501 00.8 042 15 961 57.6 60.7 00002>
8991/9/7 keerCyeltraB Q-07-TSBVW 1.66 741 02.8 972 94 05 362.0 53.0 0003
8991/1/7 kroFraelC 2-T-07-TSBVW 8.82 341 01.7 817 0041
8991/6/7 hcnarBgiB 1-U-07-TSBVW 2.68 951 01.7 16 9 50.0< 774.0 72
8991/03/6 kroFbocaJ W-07-TSBVW 8.0 84.86 541 07.7 205 021 50.0< 261.0 061
8991/1/7 kroFbocaJ W-07-TSBVW 8.7 55.85 031 01.8 885 051 50.0< 2290.0 0082
8991/2/7 kroFniatnuoM A-1-W-07-TSBVW 8.0 95.75 931 08.7 862 26 5980.0 823.0 021
8991/1/7 keerCllaV Z-07-TSBVW 0 90.87 731 07.7 531 42 50.0< 721.0 0023
8991/1/7 keerCllaV Z-07-TSBVW 3.2 66.78 751 05.7 93 5 50.0< 622.0 051
3002/31/5 kroFyrD 07-TSBVW 3.91 5.35 641 04.8 507 611 3 60.0 81.0 93
3002/71/9 kroFyrD 07-TSBVW 2.0 94.66 951 43.8 496 7.59 4 80.0 12.0 68
3002/61/9 kroFyrD 07-TSBVW 4.53 76.55 131 37.7 867 6.47 21 790.0 63.0 005
3002/71/9 keerCwahsdarB M-07-TSBVW 1.0 67.66 641 73.8 343 0581
3002/71/9 keerCetalSelttiL N-07-TSBVW 5.1 61.56 221 89.7 872 0521
3002/61/9 keerCraW U-07-TSBVW 1.0 14.47 121 01.8 642 052
3002/61/9 keerCgiB 1-W-07-TSBVW 2.0 29.66 351 96.7 215 741 3 90.0 43.0 811
3002/61/9 keerCgiB 1-W-07-TSBVW 2.0 52.86 441 541 5 790.0 82.0 89
dehsretawbuSkeerCnrohklE.01ELBAT
etaD emaNmaertS edoCNA eliMtnioP ICSVW PBR Hp dnoCpS
)mc/sohmu(etafluS)L/gm(
SST)L/gm(
lAlatoT)L/gm(
eFlatoT)L/gm(
laceF/.loc(
)Lm0018991/22/6 keerCnrohklE 99-TSBVW 4.61 83.95 741 08.7 633 95 50.0< 862.0 0031
8991/22/6 keerCnrohklE/kroFhtroN L-99-TSBVW 0 85.05 831 03.8 844 09 50.0< 772.0 00002>
8991/61/6 keerCnrohklE/kroFhtroN L-99-TSBVW 2.6 74.53 051 06.7 742 53 50.0< 6880.0 0065
8991/22/6 hcnarBdrazzuB 1-L-99-TSBVW 67.36 031 00.8 806 041 50.0< 50.0 0064
3002/61/9 keerCnrohklE 99-TSBVW 5.2 65.55 541 98.7 895 0002
3002/71/9 keerCnrohklE 99-TSBVW 6.61 84.65 851 03.8 994 00011
3002/71/9 hcnarBleruaL E-99-TSBVW 0 51.32 211 37.8 583 3 00021>
3002/51/9 keerCnrohklE/kroFhtroN L-99-TSBVW 3.0 78.15 111 32.8 125 00021>
3002/5/6 hcnarBpaGllimdniW 4-L-99-TSBVW 7.1 39.28 321 86.7 903 7.86 08 56.0 28.0
dehsretawbuSkeerCnoegiP.11ELBAT
etaD emaNmaertS edoCNA eliMtnioP ICSVW PBR Hp dnoCpS
)mc/sohmu(etafluS)L/gm(
SST)L/gm(
lAlatoT)L/gm(
eFlatoT)L/gm(
laceF/.loc(
)Lm0018991/6/7 keerCnoegiP 42-TSBVW 0 51.35 131 01.8 595 041 23.0 26.0 0068991/22/6 keerCnoegiP 42-TSBVW 9 60.25 89 03.8 325 011 50.0< 823.0 00318991/32/6 keerCnoegiP 42-TSBVW 3.92 26.53 021 04.8 439 022 12.1 66.1 00468991/32/6 keerCnoegiP 42-TSBVW 8.13 57.98 911 03.7 651 92 50.0< 2580.0 718991/42/6 kroFecurpS 2-E-42-TSBVW 1.0 47.94 601 01.8 917 002 871.0 975.0 0328991/22/6 kroFsnommiS 8-K-42-TSBVW 56.43 98 09.7 722 04 50.0< 651.0 0088991/61/6 keerCklE N-42-TSBVW 98.84 741 08.7 781 73 121.0 134.0 0648991/61/6 hcnarBenotslliM O-42-TSBVW 72.17 741 01.7 55 31 50.0< 1670.0 00038991/61/6 keerCtsoornoegiP P-42-TSBVW 34.38 741 02.7 75 000228991/61/6 hcnarBgnirpS 7-Q-42-TSBVW 05.06 061 05.7 927 072 911.0 541.0 663002/61/9 keerCnoegiP 42-TSBVW 5.2 89.46 531 13.8 818 822 3< 70.0 42.0 05913002/7/5 keerCnoegiP 42-TSBVW 5.31 9.64 121 52.8 696 171 4 32.0 14.0 05013002/22/9 keerCnoegiP 42-TSBVW 8.61 55.45 241 74.8 479 322 5 2.0 42.0 0323002/61/9 keerCnoegiP 42-TSBVW 8.12 69.55 931 25.8 3721 652 3< 12.0 92.0 673002/61/9 keerCnoegiP 42-TSBVW 8.12 66.85 041 25.8 3721 662 4 691.0 92.0 063002/71/9 keerCnoegiP/kroFleruaL E-42-TSBVW 8.1 92.95 831 02.8 756 452 3< 20.0< 61.0 473002/71/9 kroFecarT K-42-TSBVW 5.0 41.14 111 23.8 4511 714 3< 20.0< 42.0 0913002/71/9 keerCklE N-42-TSBVW 6.0 56.35 931 36.8 777 731 3 20.0< 51.0 00913002/32/9 kroFesuohkcoR Q-42-TSBVW 5.0 39.74 631 88.7 717 042 3< 81.0 30.1 062
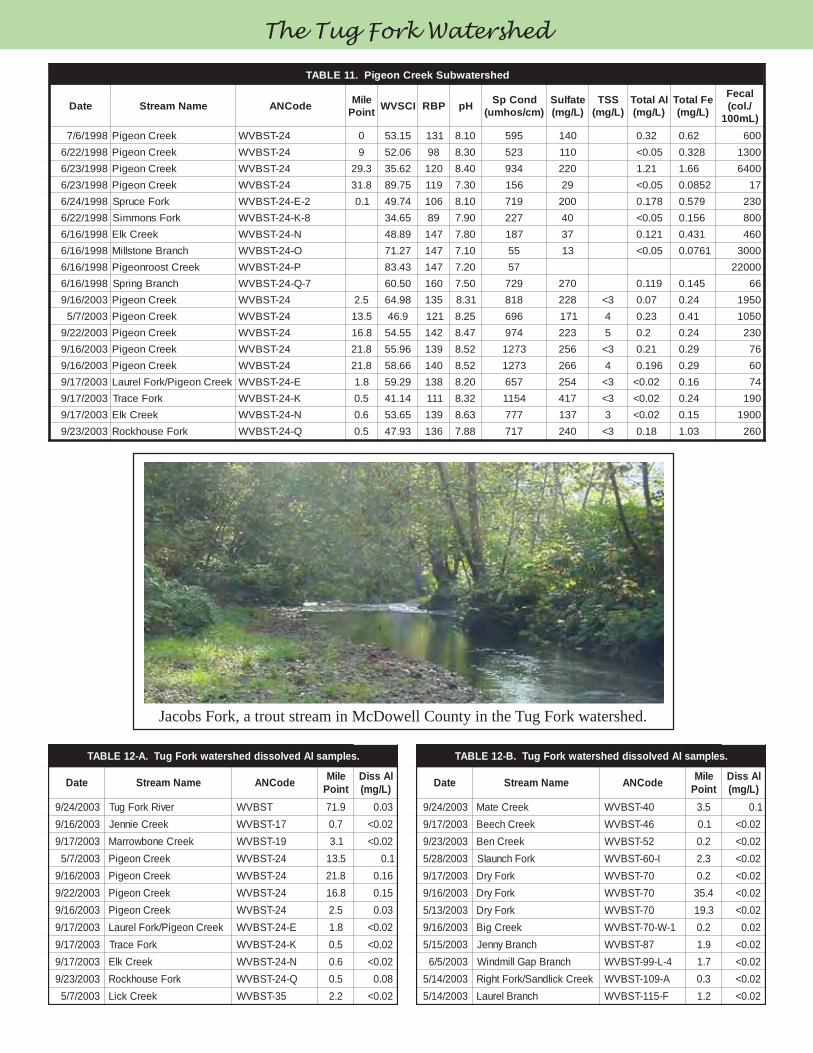
Jacobs Fork, a trout stream in McDowell County in the Tug Fork watershed.
The Tug Fork Watershed
.selpmaslAdevlossiddehsretawkroFguT.A-21ELBAT
etaD emaNmaertS edoCNA eliMtnioP
lAssiD)L/gm(
3002/42/9 reviRkroFguT TSBVW 9.17 30.03002/61/9 keerCeinneJ 71-TSBVW 7.0 20.0<3002/71/9 keerCenobworraM 91-TSBVW 1.3 20.0<3002/7/5 keerCnoegiP 42-TSBVW 5.31 1.03002/61/9 keerCnoegiP 42-TSBVW 8.12 61.03002/22/9 keerCnoegiP 42-TSBVW 8.61 51.03002/61/9 keerCnoegiP 42-TSBVW 5.2 30.03002/71/9 keerCnoegiP/kroFleruaL E-42-TSBVW 8.1 20.0<3002/71/9 kroFecarT K-42-TSBVW 5.0 20.0<3002/71/9 keerCklE N-42-TSBVW 6.0 20.0<3002/32/9 kroFesuohkcoR Q-42-TSBVW 5.0 80.03002/7/5 keerCkciL 53-TSBVW 2.2 20.0<
.selpmaslAdevlossiddehsretawkroFguT.B-21ELBAT
etaD emaNmaertS edoCNA eliMtnioP
lAssiD)L/gm(
3002/42/9 keerCetaM 04-TSBVW 5.3 1.03002/71/9 keerChceeB 64-TSBVW 1.0 20.0<3002/32/9 keerCneB 25-TSBVW 2.0 20.0<3002/82/5 kroFhcnualS I-06-TSBVW 3.2 20.0<3002/71/9 kroFyrD 07-TSBVW 2.0 20.0<3002/61/9 kroFyrD 07-TSBVW 4.53 20.0<3002/31/5 kroFyrD 07-TSBVW 3.91 20.0<3002/61/9 keerCgiB 1-W-07-TSBVW 2.0 20.03002/51/5 hcnarBynneJ 78-TSBVW 9.1 20.0<3002/5/6 hcnarBpaGllimdniW 4-L-99-TSBVW 7.1 20.0<3002/41/5 keerCkcildnaS/kroFthgiR A-901-TSBVW 3.0 20.0<3002/41/5 hcnarBleruaL F-511-TSBVW 2.1 20.0<
Related Documents