ISET Journal of Earthquake Technology, Paper No. 459, Vol. 42, No. 4, December 2005, pp. 111-125 TSUNAMI SOURCES IN THE SUMATRA REGION, INDONESIA AND SIMULATION OF THE 26 DECEMBER 2004 ACEH TSUNAMI Nanang T. Puspito and Indra Gunawan Department of Geophysics and Meteorology Institute of Technology Bandung Jalan Ganeca 10, Bandung 40132, Indonesia ABSTRACT A total of 19 tsunamis generated by earthquakes occurred in the Sumatra region in the period from 1770 to 2005. About 84% of the tsunamigenic earthquakes have magnitude M s > 6.0 and about 86% of them have focal depth less than 100 km. This characteristic is comparable with the characteristics of tsunamigenic earthquakes in the Pacific region. The empirical relationship between tsunami intensity I on Soloview-Imamura scale and the earthquake magnitude M s can be written as I = 0.80M s – 4.18. The tsunamigenic earthquakes in the Sumatra region tend to generate larger tsunami than the ones in the Pacific region where the relationship can be written as I = 1.22M s – 8.89. A numerical tsunami simulation was performed to model the 26 December 2004 Aceh tsunami by utilizing a method developed by the Tohoku University. In general, the calculated tsunami arrival times were comparable with the observed or reported ones, while the calculated tsunami heights were smaller than the observed ones. Judging from the root-mean-square error values at Sibolga and Belawan tide gauge stations it can be noted that the amplitude of the time series of the calculated tsunami heights were quite different compared to the observed ones. However, their coefficient correlation values were relatively high which may indicate that the shape of the two time series of the calculated tsunami heights were comparable with the observed ones. KEYWORDS: Tsunamigenic Earthquake, Tsunami Simulation, Sumatra INTRODUCTION The occurrence of the December 26, 2004 Aceh (northern Sumatra) earthquake (M w = 9.3) that was followed by a catastrophic tsunami in the Indian Ocean has placed the Sumatra region as one of the most tsunami- as well as earthquake-prone regions in Indonesia. According to the historical tsunami records the Sumatra region has been attacked by several large tsunamis caused by both earthquake and volcanic activities. The large tsunamis that attacked the Sumatra region include, among others, the 1797 West Sumatra tsunami, the 1833 Bengkulu tsunami, the 1861 West Sumatra tsunami, the 1883 Krakatau tsunami, and the 2004 Aceh tsunami. The tsunamis have caused the death of thousands of people and losses of billions of Indonesian rupiah. Although the Sumatra region is prone to tsunami disaster and has suffered from several large tsunamis, the nature of tsunami sources in the region is not well studied. For example, the characteristics of tsunamigenic earthquakes that generated tsunamis in the region are not well understood. This is partly because the availability of the historical tsunami data in the region is very limited. Fortunately in the recent years several tsunami catalogues have been developed (e.g., Latief et al., 2000; Gusiakov, 2002; NOAA 1 ). Latief et al. (2000) have developed a tsunami catalog for the Indonesian region, while Gusiakov (2002) has developed the tsunami database for the entire Pacific Ocean region, and NOAA 1 has made a world tsunami database available on their website. This paper attempts to analyze the nature of tsunami sources in the Sumatra region by utilizing the available historical tsunami data. The data was mainly taken from the work of Gusiakov (2002). In order to analyze the characteristics of tsunamigenic earthquakes that generated tsunamis in the region, only the tsunamis caused by earthquakes were considered in the analysis. In addition to the analysis of the characteristics of tsunamigenic earthquakes in the region this paper also attempts to study the 2004 Aceh tsunami. The 2004 Aceh tsunami is very interesting because the 1 Website of National Geophysical Data Center of NOAA, http://www.ngdc.noaa.gov/seg/hazard/tsu.shtml

Welcome message from author
This document is posted to help you gain knowledge. Please leave a comment to let me know what you think about it! Share it to your friends and learn new things together.
Transcript
ISET Journal of Earthquake Technology, Paper No. 459, Vol. 42, No. 4, December 2005, pp. 111-125
TSUNAMI SOURCES IN THE SUMATRA REGION, INDONESIA AND SIMULATION OF THE 26 DECEMBER 2004 ACEH TSUNAMI
Nanang T. Puspito and Indra Gunawan Department of Geophysics and Meteorology
Institute of Technology Bandung Jalan Ganeca 10, Bandung 40132, Indonesia
ABSTRACT
A total of 19 tsunamis generated by earthquakes occurred in the Sumatra region in the period from 1770 to 2005. About 84% of the tsunamigenic earthquakes have magnitude Ms > 6.0 and about 86% of them have focal depth less than 100 km. This characteristic is comparable with the characteristics of tsunamigenic earthquakes in the Pacific region. The empirical relationship between tsunami intensity I on Soloview-Imamura scale and the earthquake magnitude Ms can be written as I = 0.80Ms – 4.18. The tsunamigenic earthquakes in the Sumatra region tend to generate larger tsunami than the ones in the Pacific region where the relationship can be written as I = 1.22Ms – 8.89. A numerical tsunami simulation was performed to model the 26 December 2004 Aceh tsunami by utilizing a method developed by the Tohoku University. In general, the calculated tsunami arrival times were comparable with the observed or reported ones, while the calculated tsunami heights were smaller than the observed ones. Judging from the root-mean-square error values at Sibolga and Belawan tide gauge stations it can be noted that the amplitude of the time series of the calculated tsunami heights were quite different compared to the observed ones. However, their coefficient correlation values were relatively high which may indicate that the shape of the two time series of the calculated tsunami heights were comparable with the observed ones.
KEYWORDS: Tsunamigenic Earthquake, Tsunami Simulation, Sumatra
INTRODUCTION
The occurrence of the December 26, 2004 Aceh (northern Sumatra) earthquake (Mw = 9.3) that was followed by a catastrophic tsunami in the Indian Ocean has placed the Sumatra region as one of the most tsunami- as well as earthquake-prone regions in Indonesia. According to the historical tsunami records the Sumatra region has been attacked by several large tsunamis caused by both earthquake and volcanic activities. The large tsunamis that attacked the Sumatra region include, among others, the 1797 West Sumatra tsunami, the 1833 Bengkulu tsunami, the 1861 West Sumatra tsunami, the 1883 Krakatau tsunami, and the 2004 Aceh tsunami. The tsunamis have caused the death of thousands of people and losses of billions of Indonesian rupiah. Although the Sumatra region is prone to tsunami disaster and has suffered from several large tsunamis, the nature of tsunami sources in the region is not well studied. For example, the characteristics of tsunamigenic earthquakes that generated tsunamis in the region are not well understood. This is partly because the availability of the historical tsunami data in the region is very limited. Fortunately in the recent years several tsunami catalogues have been developed (e.g., Latief et al., 2000; Gusiakov, 2002; NOAA1). Latief et al. (2000) have developed a tsunami catalog for the Indonesian region, while Gusiakov (2002) has developed the tsunami database for the entire Pacific Ocean region, and NOAA1 has made a world tsunami database available on their website. This paper attempts to analyze the nature of tsunami sources in the Sumatra region by utilizing the available historical tsunami data. The data was mainly taken from the work of Gusiakov (2002). In order to analyze the characteristics of tsunamigenic earthquakes that generated tsunamis in the region, only the tsunamis caused by earthquakes were considered in the analysis. In addition to the analysis of the characteristics of tsunamigenic earthquakes in the region this paper also attempts to study the 2004 Aceh tsunami. The 2004 Aceh tsunami is very interesting because the 1 Website of National Geophysical Data Center of NOAA, http://www.ngdc.noaa.gov/seg/hazard/tsu.shtml
112 Tsunami Sources in the Sumatra Region, Indonesia and Simulation of the 26 December 2004 Aceh Tsunami
tsunami was generated by the largest earthquake ever observed in Indonesia. The tsunami heights in some places were extremely high. This tsunami caused death of more than 230,000 people and is considered as the most catastrophic tsunami ever in Indonesia. Several researchers and institutions have modeled the tsunami wave propagation (e.g., NOAA2; Babeyko and Sobolev, 2004; Satake, 2004; Tohoku University3; Yalciner et al., 2004; Lay et al., 2005). They used different earthquake source models to estimate the tsunami heights and its travel times. This paper attempts to model the tsunami wave propagation of the 2004 Aceh tsunami based on earthquake source model proposed by Yagi (2004) by using a numerical tsunami simulation method that was originally developed by Tohoku University (Imamura et al., 1995). The calculated tsunami heights and its travel times will be discussed and compared with the available data recorded at two tide gauge stations in Sumatra.
TECTONICS AND SEISMICITY
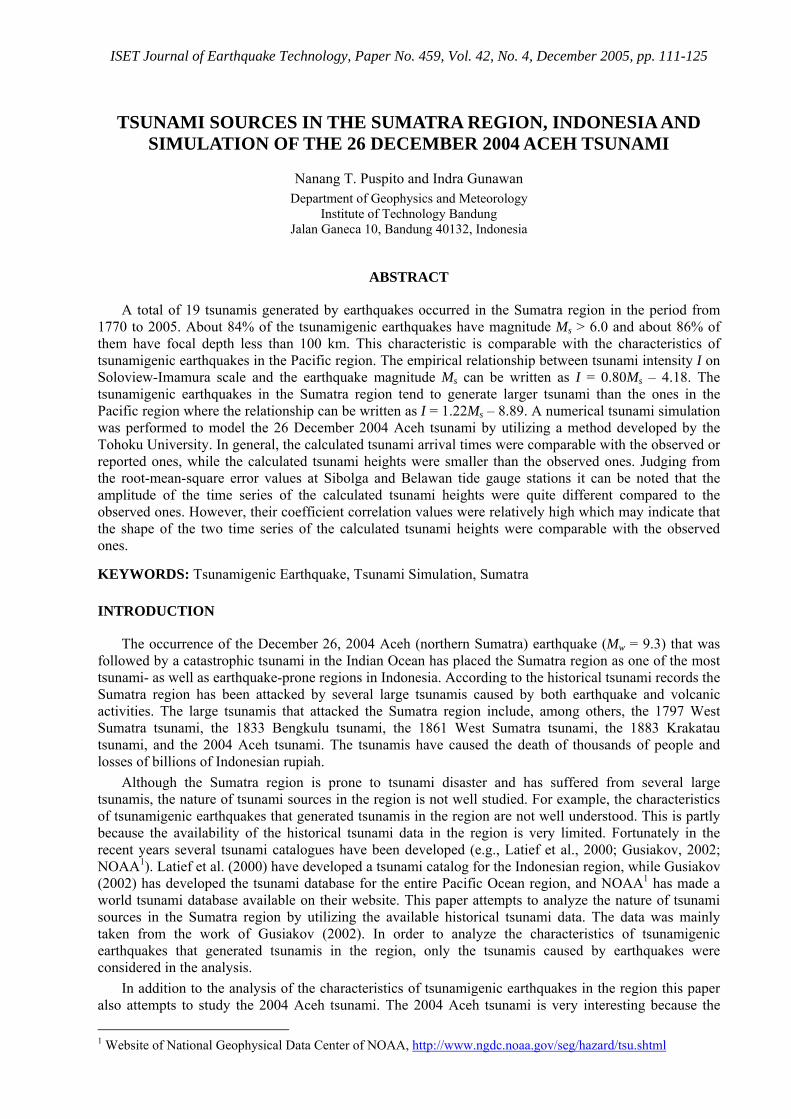
As an introduction to the area in which we are interested, a brief outline of the major tectonic feature of the study region will be described in the following. Figure 1 shows the simplified tectonic map of the Sumatra region. The Sumatra region in the western part of Indonesia is considered as a part of the Sunda arc, which results from the convergence of the Indo-Australian and Eurasian plates. The Sunda arc extends southeastward for about 5,600 km from Andaman Islands through Sumatra, Java and Sumba in the east of Java at longitude of about 120O East. According to Uyeda and Kanamori (1979), the Sunda arc is considered to be an active continental margin or continental arc. Based on seismotectonic data (the depth and dip of slab penetration based on the seismic tomography study and the orientation of P- and T-axis along the slab based on the CMT solutions), the Sumatra region was classified as the Western Sunda arc (Puspito and Shimazaki, 1995).
Eurasian Plate
Fig. 1 The simplified tectonic map of the Sumatra region (arrows indicate the direction of plate
motion relative to Eurasian Plate, while numbers indicate the rate of plate convergence in cm/year)
The plate motion in the region is relatively simple. Relative to the Eurasian plate, the Indo-Australian plate is moving approximately northward. The Indian oceanic plate is being subducted beneath the Eurasian plate along the Sunda arc. The age of subducting oceanic crust increases from Sumatra to Java (Johnson et al., 1976). The rate of plate convergence of about 6.0 cm/yr near northern Sumatra increases
2 Website of Tsunami Research Program of NOAA, http://www.pmel.noaa.gov/tsunami/research.html 3 Website of DCRC Tsunami Engineering of Tohoku University, http://tsunami.civil.tohoku.ac.jp/hokusai2/topics/ 04sumatra/index.html
ISET Journal of Earthquake Technology, December 2005 113
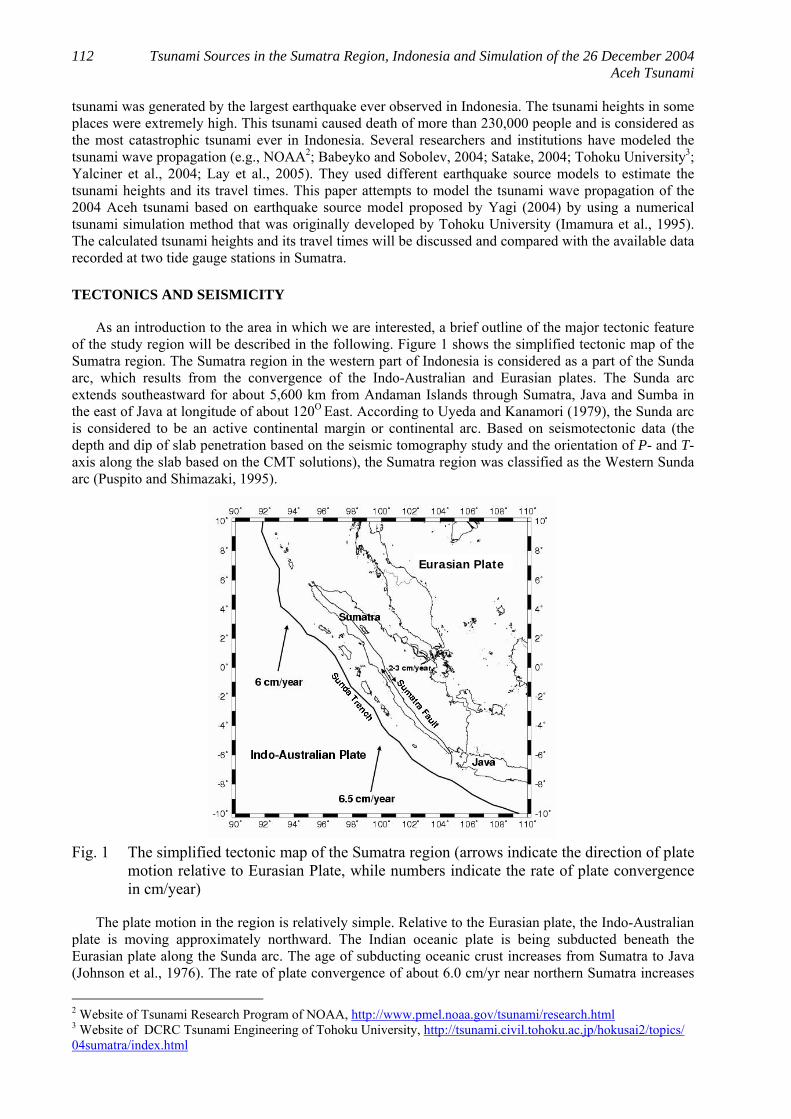
to about 6.5 cm/yr near Java (Minster and Jordan, 1978). The Indian oceanic plate motion is oblique to the structural pattern of Sumatra where motion parallel to the arc is accommodated by dextral strike-slip displacement along the Sumatra fault system. As a product of the plate convergence, the Sumatra region is considered to be one of the most seismically active regions in Indonesia. The characteristics of subduction and seismicity in Sumatra are different from those in Java. There are more frequent and larger earthquakes along Sumatra where younger, more shallowly dipping seafloor enters the trench indicating significant seismic slip rates. On the contrary, along Java less frequent and smaller earthquakes occur where subduction of older seafloor takes place relatively aseismically (Newcomb and McCann, 1987). The maximum depth of earthquakes beneath the Sumatra region is about 250 km, while in the east of Sunda strait, a strait that separates Sumatra and Java, the maximum depth is about 650 km. Figure 2 shows seismicity of the Sumatra region. The activities of the Sunda subduction and the Sumatra fault have produced many large earthquakes (M > 7.0) in the region. The seismic activity on the Sumatra fault is relatively weak compared to the activity on the Sunda subduction zone. There is no great earthquake (M > 8.0) along the Sumatra fault. In contrast, Newcomb and McCann (1987) pointed out that prior to the 2004 Aceh earthquake there were several great earthquakes occurred that were caused by the activity of the Sunda subduction zone. Some of the large earthquakes, inter-plate and intra-plate types, that occurred in the recent years have caused thousands of people to be killed and some billions of Indonesian rupiah losses. Among them are the 1994 Liwa earthquake (Ms = 7.2) that killed about 210 people, and the 1995 Kerinci earthquake (Ms = 7.0) that killed about 80 people. Both earthquakes occurred inland of Sumatra and were caused by the activity of the Sumatra fault. The activity of Sunda subduction zone in the recent years caused the 2000 Bengkulu earthquake (Ms = 7.9; 100 people killed), the December 26, 2004 Aceh earthquake (Mw = 9.3) that was followed by a catastrophic tsunami, and the March 28, 2005 Nias earthquake (Mw = 8.7; 700 people killed). In the historical times the Sunda subduction activity caused several large and great earthquakes including the 1833 Bengkulu earthquake (Mw = 8.7), and the 1861 West Sumatra earthquake (Mw = 8.5) as reported by Newcomb and McCann (1987), and the 1881 Car Nicobar earthquake (Mw = 7.9) that occurred north of Sumatra (Ortiz and Bilham, 2003). Locations of the 1833, 1861, 2004 and 2005 great earthquakes are shown in Figure 2.
Fig. 2 Seismicity of the Sumatra region (the earthquake data were taken from the International
Seismological Center (ISC) for a period from 1973 to 1999 with magnitude M ≥ 5.0; solid circles indicate large earthquakes (M > 7.0) that occurred in the period from 1801 to 2005; numbers and arrows indicate approximate location of the 1833, 1861, 2004 and 2005 great earthquakes)
114 Tsunami Sources in the Sumatra Region, Indonesia and Simulation of the 26 December 2004 Aceh Tsunami
TSUNAMIGENIC EARTHQUAKES
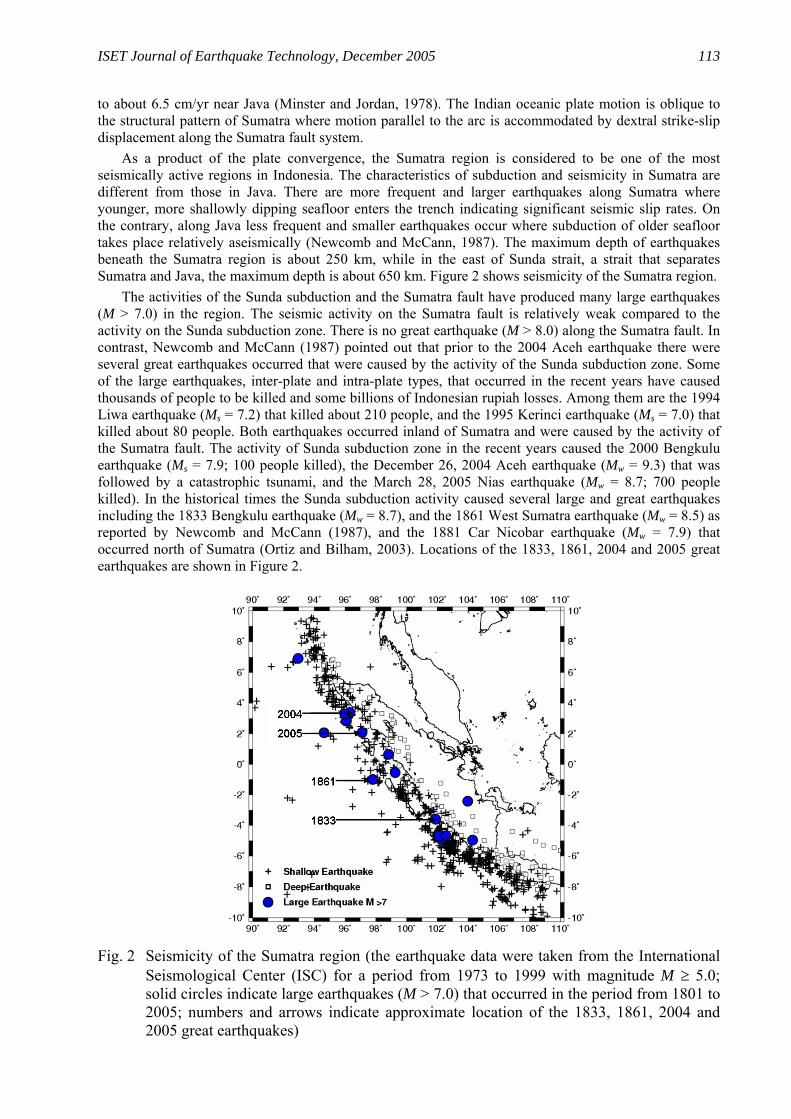
Gusiakov (2002) has developed a tsunami catalog for the entire Pacific region from 47 B.C. to 2000 A.D. The catalog consists of information on, among others, date, location of the source, earthquake magnitude, tsunami magnitude, tsunami intensity (on Soloview-Imamura scale), run-up, the cause of tsunami, reliability, fatalities, and the affected region. The reliabilities were classified into 5 categories, i.e. 4 for definite tsunami, 3 for probable tsunami (probability about 75%), 2 for questionable tsunami (probability 50%), 1 for very doubtful tsunami (probability 25%), and 0 for unknown tsunami. In this paper only tsunami with reliabilities 3 and 4 were selected. Based on those criteria there were 17 tsunamis caused by earthquakes and one tsunami caused by the 1883 Krakatau eruption that occurred in the period from 1770 to 2000. There were two tsunamis that occurred in the region after 2000, i.e. the 2004 Aceh and the 2005 Nias tsunamis. The earthquake parameter data of those tsunamis was taken from NOAA1. The run-up and the estimated tsunami intensity of the 2004 Aceh tsunami were taken from the results of field survey conducted by the Institute of Technology Bandung (ITB, 2005) and the International Tsunami Survey Team (University of Tokyo4). The run-up and the estimated tsunami intensity of the 2005 Nias tsunami were taken from ITB (2005). Based on those data compilation there were 19 tsunamis caused by earthquake and one tsunami caused by the 1883 Krakatau eruption that occurred in the Sumatra region for a period from 1770 to 2005. Figure 3 shows the distribution of the tsunami sources and Table 1 lists the selected 20 tsunamis.
Fig. 3 Tsunami sources in the Sumatra region (the data were mainly taken from the database
developed by Gusiakov (2002) for the period from 1770 to 2000; for the tsunamis that occurred after 2000, the data were taken from ITB (2005), NOAA1 and University of Tokyo4; there were 19 tsunamis caused by earthquakes and one tsunami caused by the 1883 Krakatau eruption)
From the distribution of the tsunami sources as shown in Figure 3, it can be noted that most of the tsunamigenic earthquakes occurred along the fore-arc region. The tsunamigenic earthquakes were caused by the activity of the Sunda subduction zone. The earthquake magnitude, depth, and the empirical relationship between tsunami intensity and earthquake magnitude will be described in the following. Figure 4 shows the histogram of the earthquake magnitude (Ms) distribution, Figure 5 shows the histogram of the earthquake depth distribution, and Figure 6 shows the empirical relationship between 4 Website of University of Tokyo, http://www.eri.u-tokyo.ac.jp/namegaya/sumatra/survey/log/eindex.htm
ISET Journal of Earthquake Technology, December 2005 115
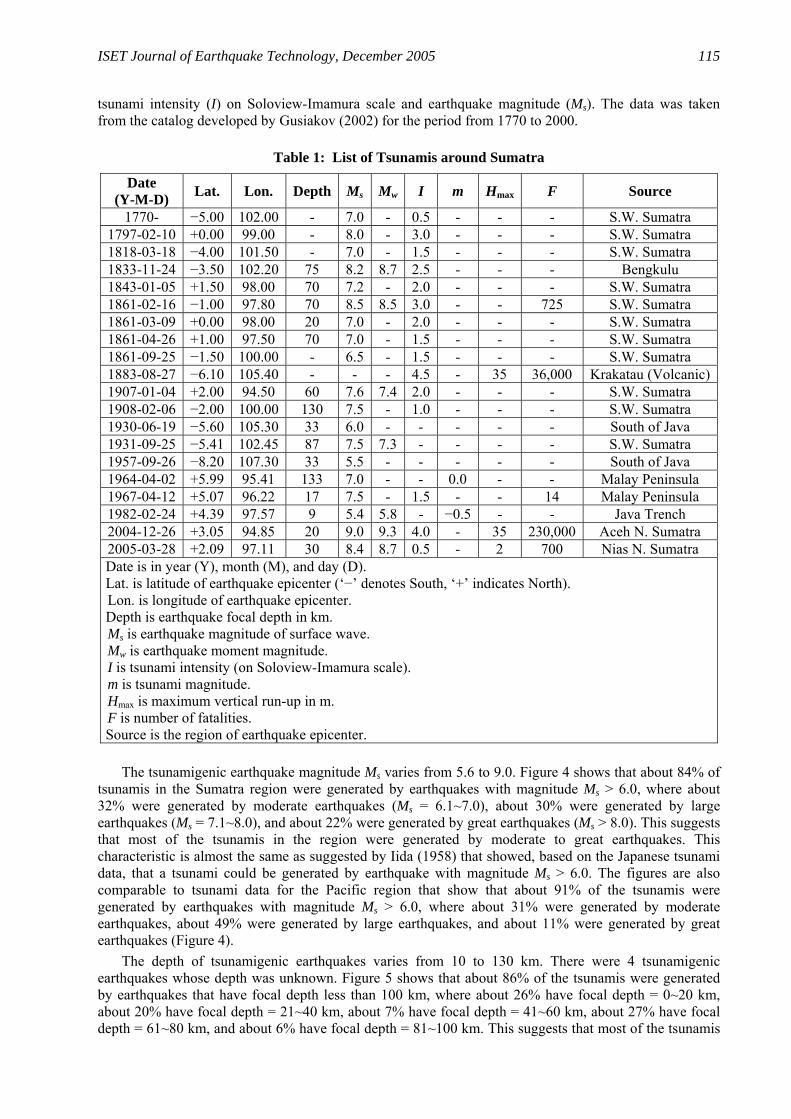
tsunami intensity (I) on Soloview-Imamura scale and earthquake magnitude (Ms). The data was taken from the catalog developed by Gusiakov (2002) for the period from 1770 to 2000.
Table 1: List of Tsunamis around Sumatra
Date (Y-M-D) Lat. Lon. Depth Ms Mw I m Hmax F Source
1770- −5.00 102.00 - 7.0 - 0.5 - - - S.W. Sumatra 1797-02-10 +0.00 99.00 - 8.0 - 3.0 - - - S.W. Sumatra 1818-03-18 −4.00 101.50 - 7.0 - 1.5 - - - S.W. Sumatra 1833-11-24 −3.50 102.20 75 8.2 8.7 2.5 - - - Bengkulu 1843-01-05 +1.50 98.00 70 7.2 - 2.0 - - - S.W. Sumatra 1861-02-16 −1.00 97.80 70 8.5 8.5 3.0 - - 725 S.W. Sumatra 1861-03-09 +0.00 98.00 20 7.0 - 2.0 - - - S.W. Sumatra 1861-04-26 +1.00 97.50 70 7.0 - 1.5 - - - S.W. Sumatra 1861-09-25 −1.50 100.00 - 6.5 - 1.5 - - - S.W. Sumatra 1883-08-27 −6.10 105.40 - - - 4.5 - 35 36,000 Krakatau (Volcanic)1907-01-04 +2.00 94.50 60 7.6 7.4 2.0 - - - S.W. Sumatra 1908-02-06 −2.00 100.00 130 7.5 - 1.0 - - - S.W. Sumatra 1930-06-19 −5.60 105.30 33 6.0 - - - - - South of Java 1931-09-25 −5.41 102.45 87 7.5 7.3 - - - - S.W. Sumatra 1957-09-26 −8.20 107.30 33 5.5 - - - - - South of Java 1964-04-02 +5.99 95.41 133 7.0 - - 0.0 - - Malay Peninsula 1967-04-12 +5.07 96.22 17 7.5 - 1.5 - - 14 Malay Peninsula 1982-02-24 +4.39 97.57 9 5.4 5.8 - −0.5 - - Java Trench 2004-12-26 +3.05 94.85 20 9.0 9.3 4.0 - 35 230,000 Aceh N. Sumatra 2005-03-28 +2.09 97.11 30 8.4 8.7 0.5 - 2 700 Nias N. Sumatra Date is in year (Y), month (M), and day (D). Lat. is latitude of earthquake epicenter (‘−’ denotes South, ‘+’ indicates North). Lon. is longitude of earthquake epicenter. Depth is earthquake focal depth in km. Ms is earthquake magnitude of surface wave. Mw is earthquake moment magnitude. I is tsunami intensity (on Soloview-Imamura scale). m is tsunami magnitude. Hmax is maximum vertical run-up in m. F is number of fatalities. Source is the region of earthquake epicenter.
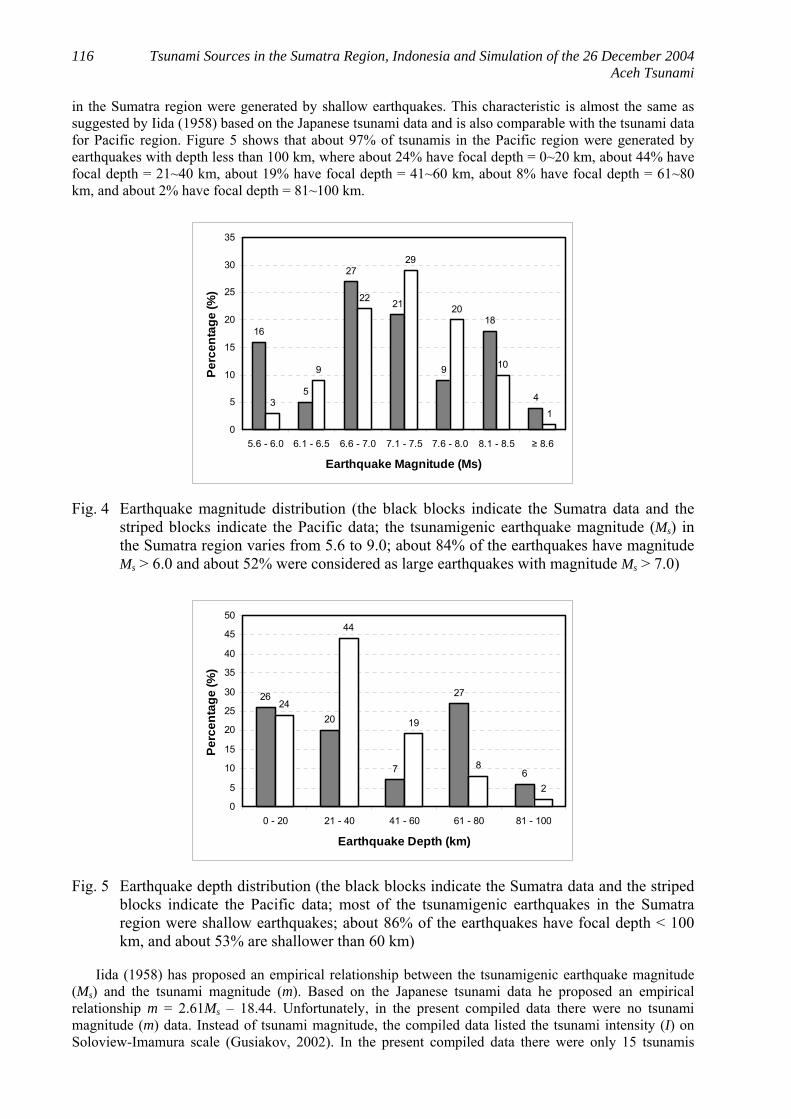
The tsunamigenic earthquake magnitude Ms varies from 5.6 to 9.0. Figure 4 shows that about 84% of tsunamis in the Sumatra region were generated by earthquakes with magnitude Ms > 6.0, where about 32% were generated by moderate earthquakes (Ms = 6.1~7.0), about 30% were generated by large earthquakes (Ms = 7.1~8.0), and about 22% were generated by great earthquakes (Ms > 8.0). This suggests that most of the tsunamis in the region were generated by moderate to great earthquakes. This characteristic is almost the same as suggested by Iida (1958) that showed, based on the Japanese tsunami data, that a tsunami could be generated by earthquake with magnitude Ms > 6.0. The figures are also comparable to tsunami data for the Pacific region that show that about 91% of the tsunamis were generated by earthquakes with magnitude Ms > 6.0, where about 31% were generated by moderate earthquakes, about 49% were generated by large earthquakes, and about 11% were generated by great earthquakes (Figure 4). The depth of tsunamigenic earthquakes varies from 10 to 130 km. There were 4 tsunamigenic earthquakes whose depth was unknown. Figure 5 shows that about 86% of the tsunamis were generated by earthquakes that have focal depth less than 100 km, where about 26% have focal depth = 0~20 km, about 20% have focal depth = 21~40 km, about 7% have focal depth = 41~60 km, about 27% have focal depth = 61~80 km, and about 6% have focal depth = 81~100 km. This suggests that most of the tsunamis
116 Tsunami Sources in the Sumatra Region, Indonesia and Simulation of the 26 December 2004 Aceh Tsunami
in the Sumatra region were generated by shallow earthquakes. This characteristic is almost the same as suggested by Iida (1958) based on the Japanese tsunami data and is also comparable with the tsunami data for Pacific region. Figure 5 shows that about 97% of tsunamis in the Pacific region were generated by earthquakes with depth less than 100 km, where about 24% have focal depth = 0~20 km, about 44% have focal depth = 21~40 km, about 19% have focal depth = 41~60 km, about 8% have focal depth = 61~80 km, and about 2% have focal depth = 81~100 km.
16
5
27
21
9
18
43
9
22
29
20
10
10
5
10
15
20
25
30
35
5.6 - 6.0 6.1 - 6.5 6.6 - 7.0 7.1 - 7.5 7.6 - 8.0 8.1 - 8.5 ≥ 8.6
Earthquake Magnitude (Ms)
Per
cent
age
(%)
Fig. 4 Earthquake magnitude distribution (the black blocks indicate the Sumatra data and the striped blocks indicate the Pacific data; the tsunamigenic earthquake magnitude (Ms) in the Sumatra region varies from 5.6 to 9.0; about 84% of the earthquakes have magnitude Ms > 6.0 and about 52% were considered as large earthquakes with magnitude Ms > 7.0)
26
20
7
27
6
24
44
19
8
2
0
5
10
15
20
25
30
35
40
45
50
0 - 20 21 - 40 41 - 60 61 - 80 81 - 100
Earthquake Depth (km)
Perc
enta
ge (%
)
Fig. 5 Earthquake depth distribution (the black blocks indicate the Sumatra data and the striped blocks indicate the Pacific data; most of the tsunamigenic earthquakes in the Sumatra region were shallow earthquakes; about 86% of the earthquakes have focal depth < 100 km, and about 53% are shallower than 60 km)
Iida (1958) has proposed an empirical relationship between the tsunamigenic earthquake magnitude (Ms) and the tsunami magnitude (m). Based on the Japanese tsunami data he proposed an empirical relationship m = 2.61Ms – 18.44. Unfortunately, in the present compiled data there were no tsunami magnitude (m) data. Instead of tsunami magnitude, the compiled data listed the tsunami intensity (I) on Soloview-Imamura scale (Gusiakov, 2002). In the present compiled data there were only 15 tsunamis
ISET Journal of Earthquake Technology, December 2005 117
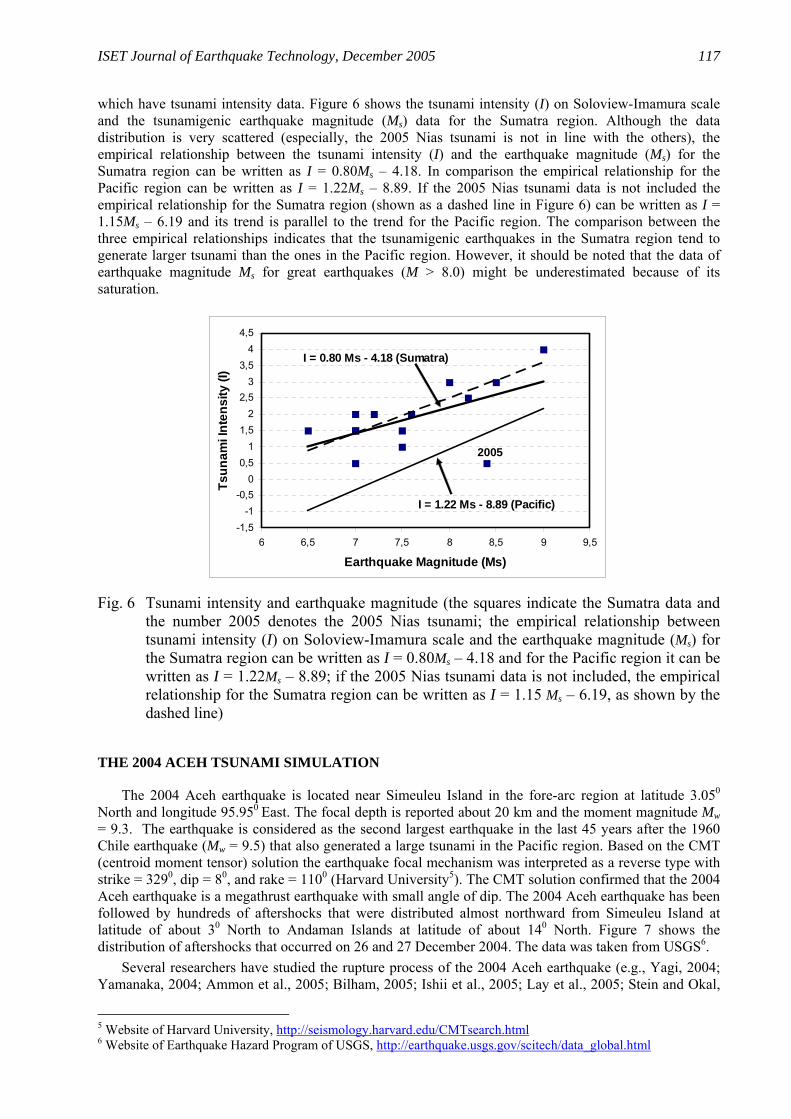
which have tsunami intensity data. Figure 6 shows the tsunami intensity (I) on Soloview-Imamura scale and the tsunamigenic earthquake magnitude (Ms) data for the Sumatra region. Although the data distribution is very scattered (especially, the 2005 Nias tsunami is not in line with the others), the empirical relationship between the tsunami intensity (I) and the earthquake magnitude (Ms) for the Sumatra region can be written as I = 0.80Ms – 4.18. In comparison the empirical relationship for the Pacific region can be written as I = 1.22Ms – 8.89. If the 2005 Nias tsunami data is not included the empirical relationship for the Sumatra region (shown as a dashed line in Figure 6) can be written as I = 1.15Ms – 6.19 and its trend is parallel to the trend for the Pacific region. The comparison between the three empirical relationships indicates that the tsunamigenic earthquakes in the Sumatra region tend to generate larger tsunami than the ones in the Pacific region. However, it should be noted that the data of earthquake magnitude Ms for great earthquakes (M > 8.0) might be underestimated because of its saturation.
I = 1.22 Ms - 8.89 (Pacific)
I = 0.80 Ms - 4.18 (Sumatra)
-1,5-1
-0,50
0,51
1,52
2,53
3,54
4,5
6 6,5 7 7,5 8 8,5 9 9,5
Earthquake Magnitude (Ms)
Tsun
ami I
nten
sity
(I)
2005
Fig. 6 Tsunami intensity and earthquake magnitude (the squares indicate the Sumatra data and the number 2005 denotes the 2005 Nias tsunami; the empirical relationship between tsunami intensity (I) on Soloview-Imamura scale and the earthquake magnitude (Ms) for the Sumatra region can be written as I = 0.80Ms – 4.18 and for the Pacific region it can be written as I = 1.22Ms – 8.89; if the 2005 Nias tsunami data is not included, the empirical relationship for the Sumatra region can be written as I = 1.15 Ms – 6.19, as shown by the dashed line)
THE 2004 ACEH TSUNAMI SIMULATION
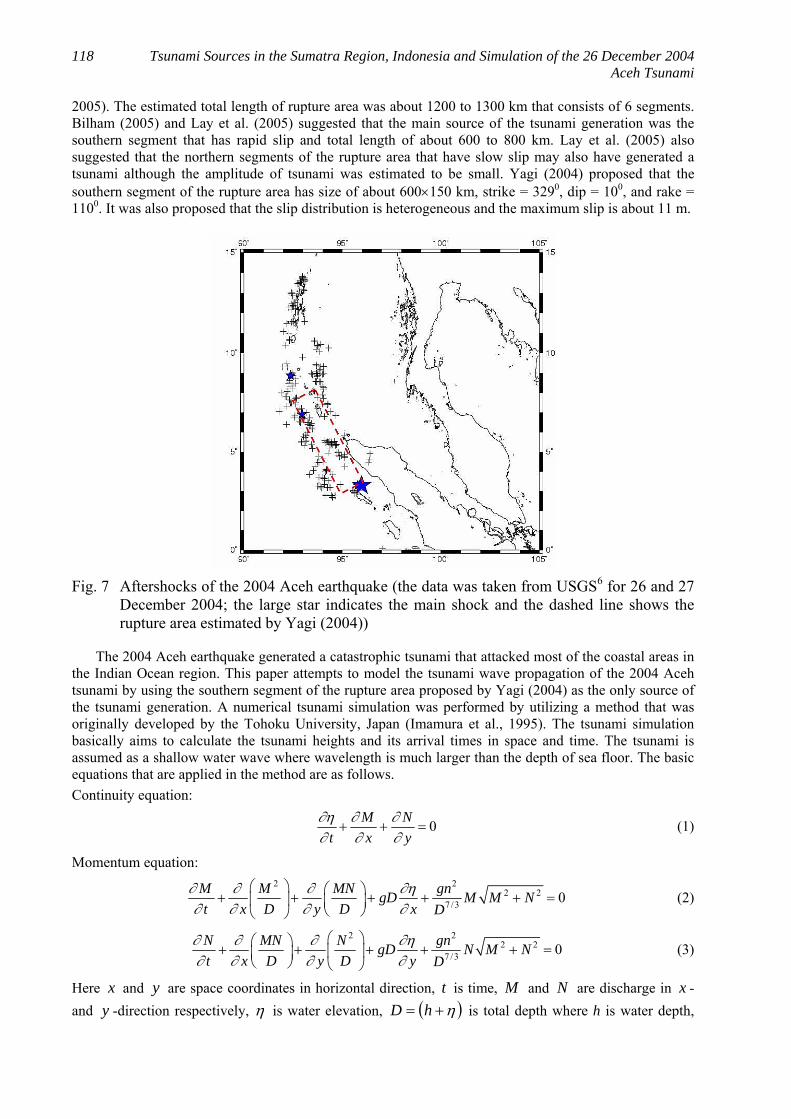
The 2004 Aceh earthquake is located near Simeuleu Island in the fore-arc region at latitude 3.050 North and longitude 95.950 East. The focal depth is reported about 20 km and the moment magnitude Mw = 9.3. The earthquake is considered as the second largest earthquake in the last 45 years after the 1960 Chile earthquake (Mw = 9.5) that also generated a large tsunami in the Pacific region. Based on the CMT (centroid moment tensor) solution the earthquake focal mechanism was interpreted as a reverse type with strike = 3290, dip = 80, and rake = 1100 (Harvard University5). The CMT solution confirmed that the 2004 Aceh earthquake is a megathrust earthquake with small angle of dip. The 2004 Aceh earthquake has been followed by hundreds of aftershocks that were distributed almost northward from Simeuleu Island at latitude of about 30 North to Andaman Islands at latitude of about 140 North. Figure 7 shows the distribution of aftershocks that occurred on 26 and 27 December 2004. The data was taken from USGS6. Several researchers have studied the rupture process of the 2004 Aceh earthquake (e.g., Yagi, 2004; Yamanaka, 2004; Ammon et al., 2005; Bilham, 2005; Ishii et al., 2005; Lay et al., 2005; Stein and Okal,
5 Website of Harvard University, http://seismology.harvard.edu/CMTsearch.html 6 Website of Earthquake Hazard Program of USGS, http://earthquake.usgs.gov/scitech/data_global.html
118 Tsunami Sources in the Sumatra Region, Indonesia and Simulation of the 26 December 2004 Aceh Tsunami
2005). The estimated total length of rupture area was about 1200 to 1300 km that consists of 6 segments. Bilham (2005) and Lay et al. (2005) suggested that the main source of the tsunami generation was the southern segment that has rapid slip and total length of about 600 to 800 km. Lay et al. (2005) also suggested that the northern segments of the rupture area that have slow slip may also have generated a tsunami although the amplitude of tsunami was estimated to be small. Yagi (2004) proposed that the southern segment of the rupture area has size of about 600×150 km, strike = 3290, dip = 100, and rake = 1100. It was also proposed that the slip distribution is heterogeneous and the maximum slip is about 11 m.
Fig. 7 Aftershocks of the 2004 Aceh earthquake (the data was taken from USGS6 for 26 and 27
December 2004; the large star indicates the main shock and the dashed line shows the rupture area estimated by Yagi (2004))
The 2004 Aceh earthquake generated a catastrophic tsunami that attacked most of the coastal areas in the Indian Ocean region. This paper attempts to model the tsunami wave propagation of the 2004 Aceh tsunami by using the southern segment of the rupture area proposed by Yagi (2004) as the only source of the tsunami generation. A numerical tsunami simulation was performed by utilizing a method that was originally developed by the Tohoku University, Japan (Imamura et al., 1995). The tsunami simulation basically aims to calculate the tsunami heights and its arrival times in space and time. The tsunami is assumed as a shallow water wave where wavelength is much larger than the depth of sea floor. The basic equations that are applied in the method are as follows. Continuity equation:
0M Nt x y
∂η ∂ ∂∂ ∂ ∂
+ + = (1)
Momentum equation:
2 2
2 27 /3 0M M MN gngD M M N
t x D y D x D∂ ∂ ∂ ∂η∂ ∂ ∂ ∂
⎛ ⎞ ⎛ ⎞+ + + + + =⎜ ⎟ ⎜ ⎟⎝ ⎠⎝ ⎠
(2)
2 2
2 27 /3 0N MN N gngD N M N
t x D y D y D∂ ∂ ∂ ∂η∂ ∂ ∂ ∂
⎛ ⎞⎛ ⎞+ + + + + =⎜ ⎟⎜ ⎟⎝ ⎠ ⎝ ⎠
(3)
Here x and y are space coordinates in horizontal direction, t is time, M and N are discharge in x -and y -direction respectively, η is water elevation, ( )η+= hD is total depth where h is water depth,
ISET Journal of Earthquake Technology, December 2005 119
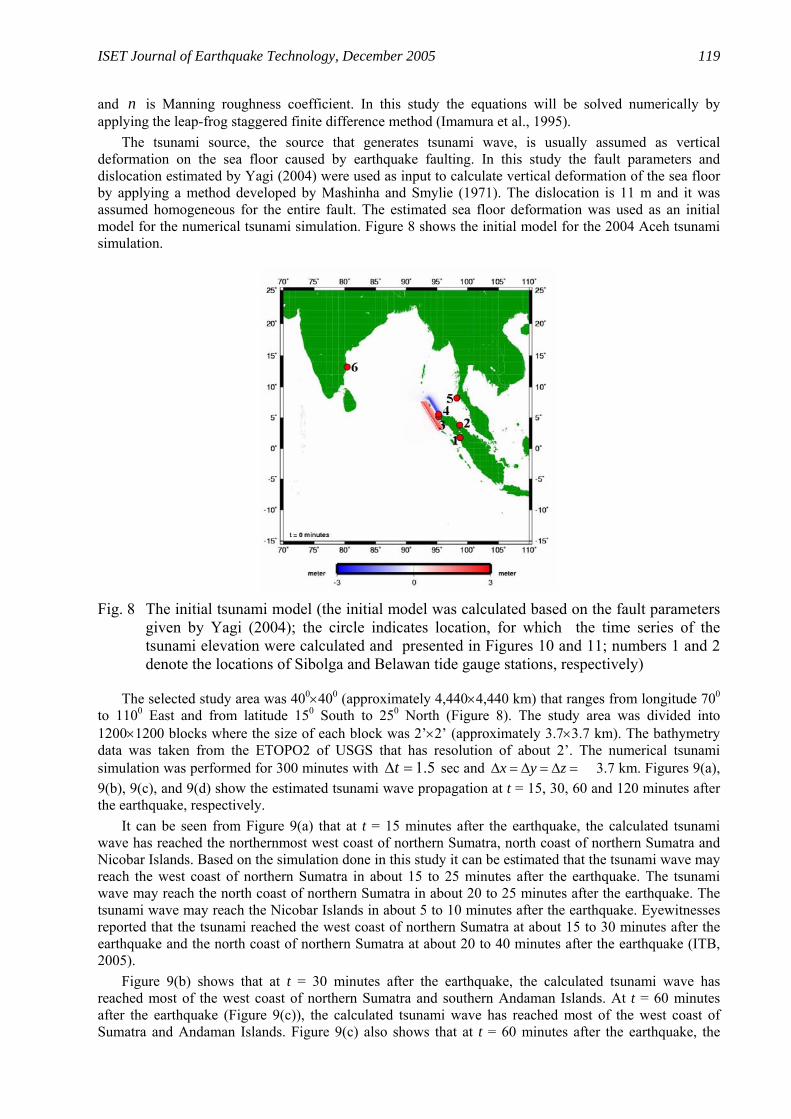
and n is Manning roughness coefficient. In this study the equations will be solved numerically by applying the leap-frog staggered finite difference method (Imamura et al., 1995). The tsunami source, the source that generates tsunami wave, is usually assumed as vertical deformation on the sea floor caused by earthquake faulting. In this study the fault parameters and dislocation estimated by Yagi (2004) were used as input to calculate vertical deformation of the sea floor by applying a method developed by Mashinha and Smylie (1971). The dislocation is 11 m and it was assumed homogeneous for the entire fault. The estimated sea floor deformation was used as an initial model for the numerical tsunami simulation. Figure 8 shows the initial model for the 2004 Aceh tsunami simulation.
Fig. 8 The initial tsunami model (the initial model was calculated based on the fault parameters
given by Yagi (2004); the circle indicates location, for which the time series of the tsunami elevation were calculated and presented in Figures 10 and 11; numbers 1 and 2 denote the locations of Sibolga and Belawan tide gauge stations, respectively)
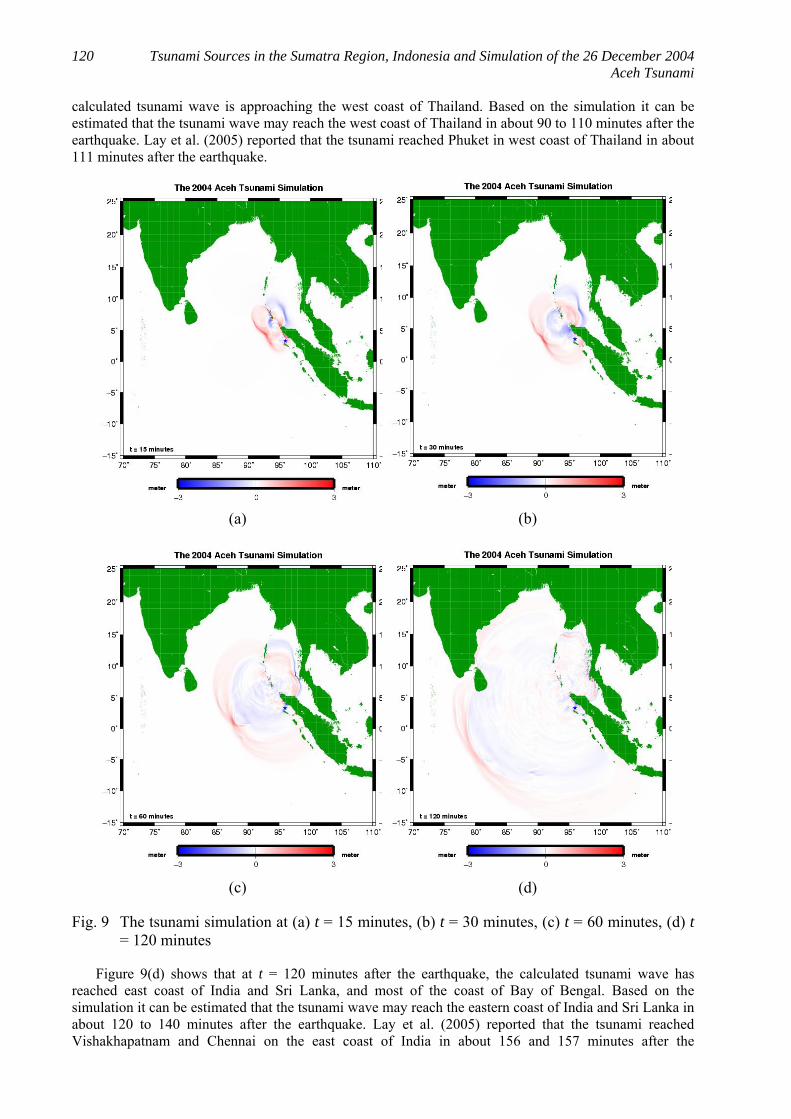
The selected study area was 400×400 (approximately 4,440×4,440 km) that ranges from longitude 700 to 1100 East and from latitude 150 South to 250 North (Figure 8). The study area was divided into 1200×1200 blocks where the size of each block was 2’×2’ (approximately 3.7×3.7 km). The bathymetry data was taken from the ETOPO2 of USGS that has resolution of about 2’. The numerical tsunami simulation was performed for 300 minutes with 5.1=Δt sec and x y zΔ = Δ = Δ = 3.7 km. Figures 9(a), 9(b), 9(c), and 9(d) show the estimated tsunami wave propagation at t = 15, 30, 60 and 120 minutes after the earthquake, respectively. It can be seen from Figure 9(a) that at t = 15 minutes after the earthquake, the calculated tsunami wave has reached the northernmost west coast of northern Sumatra, north coast of northern Sumatra and Nicobar Islands. Based on the simulation done in this study it can be estimated that the tsunami wave may reach the west coast of northern Sumatra in about 15 to 25 minutes after the earthquake. The tsunami wave may reach the north coast of northern Sumatra in about 20 to 25 minutes after the earthquake. The tsunami wave may reach the Nicobar Islands in about 5 to 10 minutes after the earthquake. Eyewitnesses reported that the tsunami reached the west coast of northern Sumatra at about 15 to 30 minutes after the earthquake and the north coast of northern Sumatra at about 20 to 40 minutes after the earthquake (ITB, 2005). Figure 9(b) shows that at t = 30 minutes after the earthquake, the calculated tsunami wave has reached most of the west coast of northern Sumatra and southern Andaman Islands. At t = 60 minutes after the earthquake (Figure 9(c)), the calculated tsunami wave has reached most of the west coast of Sumatra and Andaman Islands. Figure 9(c) also shows that at t = 60 minutes after the earthquake, the
120 Tsunami Sources in the Sumatra Region, Indonesia and Simulation of the 26 December 2004 Aceh Tsunami
calculated tsunami wave is approaching the west coast of Thailand. Based on the simulation it can be estimated that the tsunami wave may reach the west coast of Thailand in about 90 to 110 minutes after the earthquake. Lay et al. (2005) reported that the tsunami reached Phuket in west coast of Thailand in about 111 minutes after the earthquake.
(a)
(b)
(c) (d)
Fig. 9 The tsunami simulation at (a) t = 15 minutes, (b) t = 30 minutes, (c) t = 60 minutes, (d) t = 120 minutes
Figure 9(d) shows that at t = 120 minutes after the earthquake, the calculated tsunami wave has reached east coast of India and Sri Lanka, and most of the coast of Bay of Bengal. Based on the simulation it can be estimated that the tsunami wave may reach the eastern coast of India and Sri Lanka in about 120 to 140 minutes after the earthquake. Lay et al. (2005) reported that the tsunami reached Vishakhapatnam and Chennai on the east coast of India in about 156 and 157 minutes after the
ISET Journal of Earthquake Technology, December 2005 121
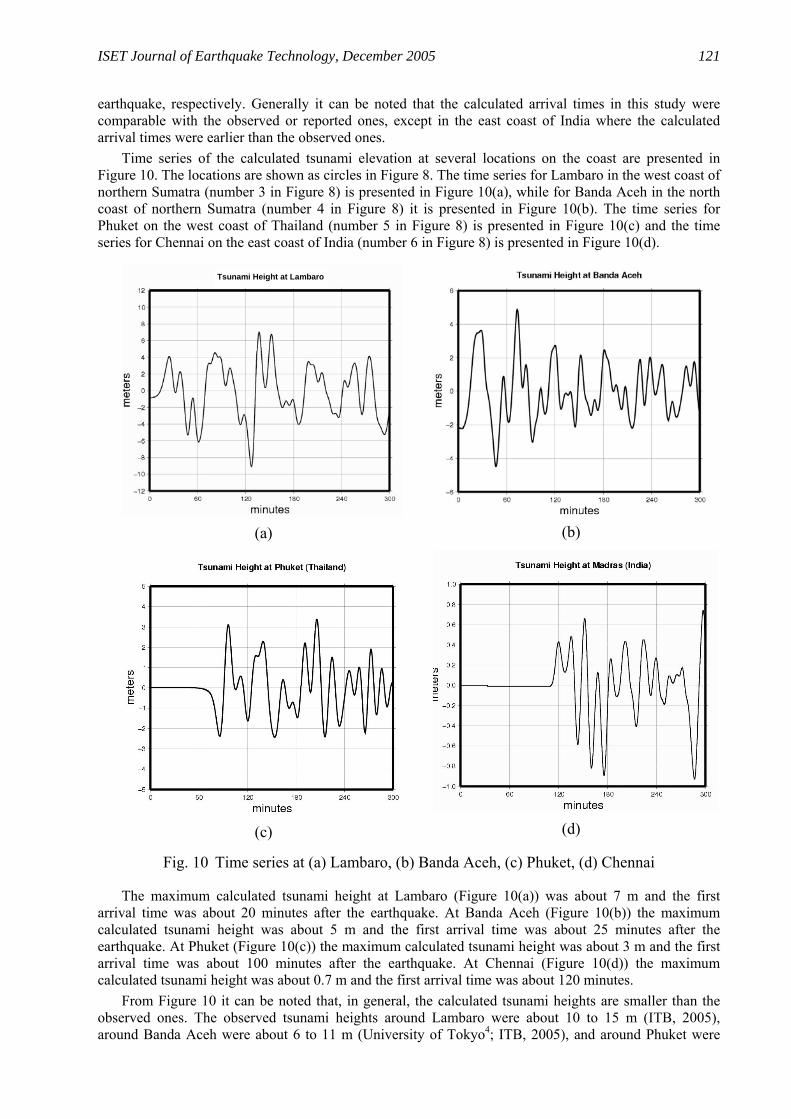
earthquake, respectively. Generally it can be noted that the calculated arrival times in this study were comparable with the observed or reported ones, except in the east coast of India where the calculated arrival times were earlier than the observed ones. Time series of the calculated tsunami elevation at several locations on the coast are presented in Figure 10. The locations are shown as circles in Figure 8. The time series for Lambaro in the west coast of northern Sumatra (number 3 in Figure 8) is presented in Figure 10(a), while for Banda Aceh in the north coast of northern Sumatra (number 4 in Figure 8) it is presented in Figure 10(b). The time series for Phuket on the west coast of Thailand (number 5 in Figure 8) is presented in Figure 10(c) and the time series for Chennai on the east coast of India (number 6 in Figure 8) is presented in Figure 10(d).
Tsunami Height at Lambaro
(a) (b)
(c) (d)
Fig. 10 Time series at (a) Lambaro, (b) Banda Aceh, (c) Phuket, (d) Chennai
The maximum calculated tsunami height at Lambaro (Figure 10(a)) was about 7 m and the first arrival time was about 20 minutes after the earthquake. At Banda Aceh (Figure 10(b)) the maximum calculated tsunami height was about 5 m and the first arrival time was about 25 minutes after the earthquake. At Phuket (Figure 10(c)) the maximum calculated tsunami height was about 3 m and the first arrival time was about 100 minutes after the earthquake. At Chennai (Figure 10(d)) the maximum calculated tsunami height was about 0.7 m and the first arrival time was about 120 minutes. From Figure 10 it can be noted that, in general, the calculated tsunami heights are smaller than the observed ones. The observed tsunami heights around Lambaro were about 10 to 15 m (ITB, 2005), around Banda Aceh were about 6 to 11 m (University of Tokyo4; ITB, 2005), and around Phuket were
122 Tsunami Sources in the Sumatra Region, Indonesia and Simulation of the 26 December 2004 Aceh Tsunami
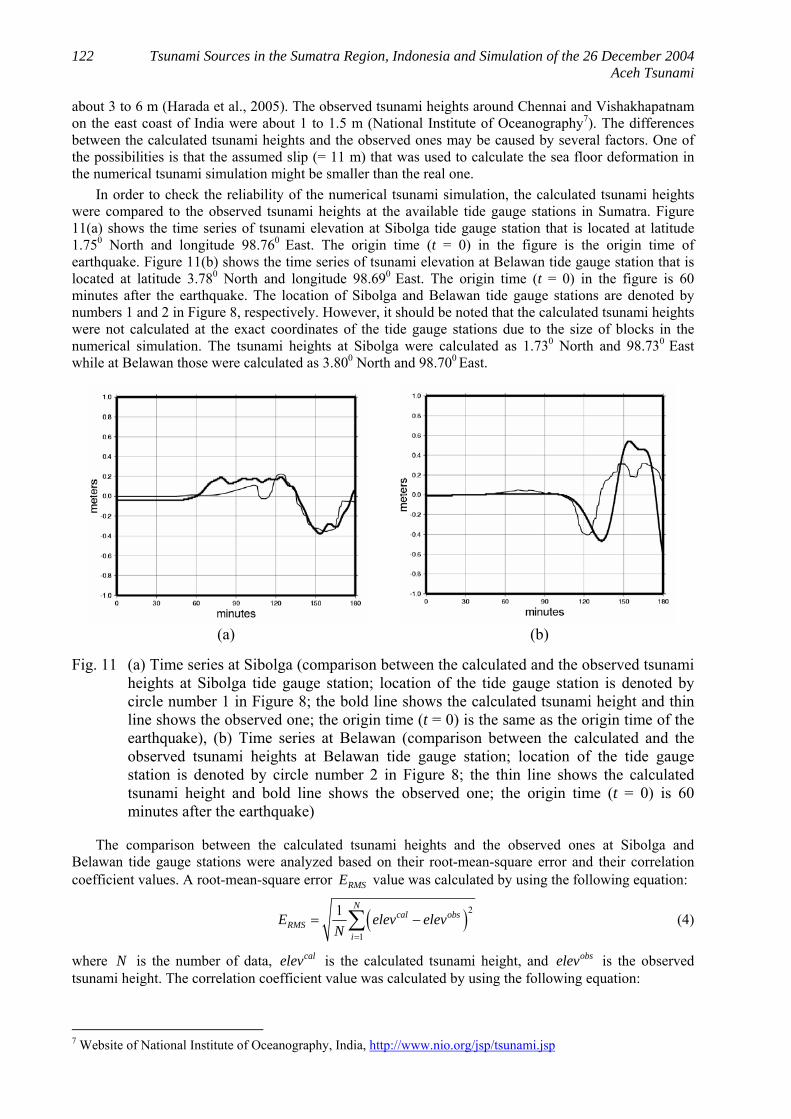
about 3 to 6 m (Harada et al., 2005). The observed tsunami heights around Chennai and Vishakhapatnam on the east coast of India were about 1 to 1.5 m (National Institute of Oceanography7). The differences between the calculated tsunami heights and the observed ones may be caused by several factors. One of the possibilities is that the assumed slip (= 11 m) that was used to calculate the sea floor deformation in the numerical tsunami simulation might be smaller than the real one. In order to check the reliability of the numerical tsunami simulation, the calculated tsunami heights were compared to the observed tsunami heights at the available tide gauge stations in Sumatra. Figure 11(a) shows the time series of tsunami elevation at Sibolga tide gauge station that is located at latitude 1.750 North and longitude 98.760 East. The origin time (t = 0) in the figure is the origin time of earthquake. Figure 11(b) shows the time series of tsunami elevation at Belawan tide gauge station that is located at latitude 3.780 North and longitude 98.690 East. The origin time (t = 0) in the figure is 60 minutes after the earthquake. The location of Sibolga and Belawan tide gauge stations are denoted by numbers 1 and 2 in Figure 8, respectively. However, it should be noted that the calculated tsunami heights were not calculated at the exact coordinates of the tide gauge stations due to the size of blocks in the numerical simulation. The tsunami heights at Sibolga were calculated as 1.730 North and 98.730 East while at Belawan those were calculated as 3.800 North and 98.700 East.
(a) (b)
Fig. 11 (a) Time series at Sibolga (comparison between the calculated and the observed tsunami heights at Sibolga tide gauge station; location of the tide gauge station is denoted by circle number 1 in Figure 8; the bold line shows the calculated tsunami height and thin line shows the observed one; the origin time (t = 0) is the same as the origin time of the earthquake), (b) Time series at Belawan (comparison between the calculated and the observed tsunami heights at Belawan tide gauge station; location of the tide gauge station is denoted by circle number 2 in Figure 8; the thin line shows the calculated tsunami height and bold line shows the observed one; the origin time (t = 0) is 60 minutes after the earthquake)
The comparison between the calculated tsunami heights and the observed ones at Sibolga and Belawan tide gauge stations were analyzed based on their root-mean-square error and their correlation coefficient values. A root-mean-square error RMSE value was calculated by using the following equation:
( )2
1
1 Ncal obs
RMSi
E elev elevN =
= −∑ (4)
where N is the number of data, calelev is the calculated tsunami height, and obselev is the observed tsunami height. The correlation coefficient value was calculated by using the following equation:
7 Website of National Institute of Oceanography, India, http://www.nio.org/jsp/tsunami.jsp
ISET Journal of Earthquake Technology, December 2005 123
∑∑
∑=yyxx
xyr (5)
with
xy∑ = XY X YN
−∑ ∑ ∑ ; xx∑ = ( )22X X
N
−∑ ∑ ; yy∑ = ( )22Y Y
N
−∑ ∑
where r is the correlation coefficient, X is the calculated tsunami height, and Y is the observed tsunami height. The correlation coefficient ranges from –1 to 1, where 1r = indicates perfect positive correlation,
1r = − indicates perfect negative correlation, and 0r = indicates no correlation between the calculated and the observed tsunami heights. The root-mean-square error ( )RMSE values at Sibolga and Belawan tide gauge stations were 0.08 m and 0.18 m, respectively. The RMSE value at Sibolga was about 36% of the observed tsunami height in the first arrival (Figure 11(a)). At Belawan the RMSE value was about 60% of the observed tsunami height in the first arrival (Figure 11(b)). Judging from the RMSE values it can be noted that the amplitudes of the calculated tsunami heights, especially at Belawan, were quite different from the observed ones. However, their correlation coefficient values, especially at Sibolga, were relatively high. The correlation coefficient value at Sibolga was 0.87 and at Belawan it was 0.59. This indicates that the shapes of the time series of the calculated tsunami heights have relatively good correlation and are comparable with the observed ones. The differences between the calculated tsunami heights and the observed ones may be caused by several limitations. The bathymetry data used in the simulation were taken from a global bathymetry data set so that the size of blocks was quite large. In this case the local bathymetry effects might not be resolved in the simulation. Therefore the calculated tsunami heights and the observed ones may not be compatible for comparison in a detailed manner. The simulation was done based on the assumption that the southern segment of the rupture area is the only source of tsunami generation without taking into account the northern segments. However, previous studies (e.g., NOAA2; Babeyko and Sobolev, 2004; Satake, 2004; Tohoku University3; Yalciner et al., 2004; Lay et al., 2005) have suggested that the northern segments of the rupture area that have slow slip might have contributed to the generation of the 2004 Aceh tsunami. Therefore, the tsunami simulation done in this study may not reflect the real size of the source of tsunami generation. The slip distribution in this study was assumed to be homogeneous. However, several studies have suggested that the slip distribution was heterogeneous (e.g., Yagi, 2004; Yamanaka, 2004; Ammon et al., 2005; Bilham, 2005; Ishii et al., 2005; Lay et al., 2005; Stein and Okal, 2005). The limitation in the assumed slip distribution may cause the simulated tsunami heights to be different from the observed ones.
CONCLUSIONS
The conclusions of this paper can be written as follows: 1. The tsunamigenic earthquakes in the Sumatra region are related to the activity of the Sunda
subduction zone. About 84% of them have magnitude Ms > 6.0 and about 86% of them have focal depth less than 100 km. This characteristic is comparable with the characteristic of tsunamigenic earthquakes in the Pacific region.
2. The empirical relationship between tsunami intensity I on Soloview-Imamura scale and earthquake magnitude Ms for the Sumatra region can be written as I = 0.80Ms – 4.18 and for the Pacific region it can be written as I = 1.22Ms – 8.89. This indicates that the tsunamigenic earthquakes in the Sumatra region tend to generate larger tsunamis than the ones in the Pacific region, although it should be noted that the earthquake magnitude Ms for great earthquakes (M > 8.0) might be underestimated because of its saturation.
3. For the Aceh tsunami simulation, in general the calculated tsunami arrival times were comparable with the observed or reported ones, except on the east coast of India where the calculated arrival times were earlier than the observed ones. The calculated tsunami heights were smaller than the
124 Tsunami Sources in the Sumatra Region, Indonesia and Simulation of the 26 December 2004 Aceh Tsunami
observed ones. This indicates that the fault slip value that was used in the simulation might be smaller than the real one.
4. For the Aceh tsunami simulation, the root-mean-square error ( )RMSE values at Sibolga and Belawan tide gauge stations were relatively high. This indicates that the amplitudes of the calculated tsunami heights were quite different from the observed ones. However, their correlation coefficient values were relatively high. This indicates that the shapes of the two calculated time series were comparable with the observed ones.
ACKNOWLEDGEMENTS
The authors thank the three anonymous referees who gave valuable comments on the improvement of this paper and the Editor for his encouragement.
REFERENCES
1. Ammon, C.J., Ji, C., Thio, H.K., Robinson, D., Ni, S., Hjorleifsdottir, V., Kanamori, H., Lay, T., Das, S., Helberger, D., Ichinose, G., Polet, J. and Wald, D. (2005). “Rupture Process of the 2004 Sumatra-Andaman Earthquake”, Science, Vol. 308, pp. 1133-1139.
2. Babeyko, A. and Sobolev, S. (2004). “A Numerical Simulation of the Indian Ocean Tsunami 26 Dec. 2004: Model Description”, http://www.gfz-potsdam.de/news/recent/archive/20041226/ TsunamiModelling/ModelDescription/content-en.html.
3. Bilham, R. (2005). “A Flying Start, Then a Slow Slip”, Science, Vol. 308, pp. 1126-1127. 4. Gusiakov, V.K. (2002). “Historical Tsunami Database for the Pacific, 47 B.C.-2000 A.D.”, Tsunami
Laboratory, ICMMG SD RAS, Novosibirsk, Russia (on CD). 5. Harada, K., Matsutomi, H., Hiraishi, T., Takahashi, T., Matsuyama, M., Nakusakul, S., Supartid, S.,
Kanbua, W., Shiwabowon, C., Phetdee, S., Janchoowong, W., Suttiwanakol, S. and Srivichai, M. (2005). “The December 26, 2004 Sumatra Earthquake Tsunami, Tsunami Field Survey around Phuket, Thailand”, http://www.drs.dpri.kyoto-u.ac.jp/sumatra/thailand/phuket_survey_e.html.
6. Iida, K. (1958). “Magnitude and Energy of Earthquakes Accompanied by Tsunami, and Tsunami Energy”, Journal of Earth Science, Nagoya University, Vol. 6, pp. 101-112.
7. Imamura, F., Gica, E., Takahashi, T. and Shuto, N. (1995). “Numerical Simulation of the 1992 Flores Tsunami: Interpretation of Tsunami Phenomena in Northeastern Flores Island and Damage at Babi Island”, Pure and Applied Geophysics, Vol. 144, No. 3-4, pp. 555-568.
8. Ishii, M., Shearer, P.M., Houston, H. and Vidale, J.E. (2005). “Extent, Duration and Speed of the 2004 Sumatra-Andaman Earthquake Imaged by the Hi-Net Array”, Nature, Vol. 435, pp. 933-936.
9. ITB (2005). “Report of the Field Survey of the 2004 Aceh and the 2005 Nias Earthquakes”, Institute of Technology Bandung, Indonesia (unpublished report in Indonesian language).
10. Johnson, B.D., Powell, C.McA. and Veevers, J.J. (1976). “Spreading History of the Eastern Indian Ocean and Greater India’s Northward Flight from Antarctica and Australia”, Geological Society of America Bulletin, Vol. 87, No. 11, pp. 1560-1566.
11. Latief, H., Puspito, N.T. and Imamura, F. (2000). “Tsunami Catalog and Zones in Indonesia”, Journal of Natural Disaster Science, Vol. 22, No. 1, pp. 25-43.
12. Lay, T., Kanamori, H., Ammon, C.J., Nettles, M., Ward, S.N., Aster, R.C., Beck, S.L., Bilek, S.L., Brudzinski, M.R., Butler, R., DeShon, H.R., Ekstrom, G., Satake, K. and Sipkin, S. (2005). “The Great Sumatra-Andaman Earthquake of 26 December 2004”, Science, Vol. 308, pp. 1127-1133.
13. Mansinha, L. and Symlie, D.E. (1971). “The Displacement Field of Inclined Faults”, Bulletin of the Seismological Society of America, Vol. 61, No. 45, pp. 1433-1440.
14. Minster, J.B. and Jordan, T. (1978). “Present-Day Plate Motions”, Journal of Geophysical Research, Vol. 83, pp. 5331-5354.
15. Newcomb, K.R. and McCann, W.R. (1987). “Seismic History and Seismotectonics of the Sunda Arc”, Journal of Geophysical Research, Vol. 92, pp. 421-439.
ISET Journal of Earthquake Technology, December 2005 125
16. Ortiz, M. and Bilham, R. (2003). “Source Area and Rupture Parameters of the 31 December 1881 Mw = 7.9 Car Nicobar Earthquake Estimated from Tsunamis Recorded in the Bay of Bengal”, Journal of Geophysical Research, Vol. 108, No. B4, pp. ESE 11/1-15.
17. Puspito, N.T. and Shimazaki, K. (1995). “Mantle Structure and Seismotectonics of the Sunda and Banda Arcs”, Tectonophysics, Vol. 251, pp. 215-228.
18. Satake, K. (2004). “2004 Sumatra Earthquake”, http://staff.aist.go.jp/kenji.satake/animation.gif. 19. Stein, S. and Okal, E.A. (2005). “Speed and Size of the Sumatra Earthquake”, Nature, Vol. 434,
pp. 581-582. 20. Uyeda, S. and Kanamori, H. (1979). “Back-Arc Opening and the Mode of Subduction”, Journal of
Geophysical Research, Vol. 84, pp. 1049-1061. 21. Yagi, Y. (2004). “Preliminary Results of Rupture Process for 2004 Off Coast of Northern Sumatra
Giant Earthqauke (Ver. 1)”, http://iisee.kenken.go.jp/staff/yagi/eq/Sumatra2004/Sumatra2004.html. 22. Yalciner, A., Kuran, U. and Taymaz, T. (2004). “North Sumatra Tsunami December 26, 2004”,
http://yalciner.ce.metu.edu.tr/sumatra. 23. Yamanaka, Y. (2004). “04/12/26 Off W. Coast of N. Sumatra”, http://www.eri.u-
tokyo.ac.jp/sanchu/Seismo_Note/2004/EIC161ea.html.
Related Documents