Tropospheric Ozone is a GHG Reference: IPCC (2007)

Welcome message from author
This document is posted to help you gain knowledge. Please leave a comment to let me know what you think about it! Share it to your friends and learn new things together.
Transcript
Tropospheric Ozone is a GHG
Reference: IPCC (2007)
2
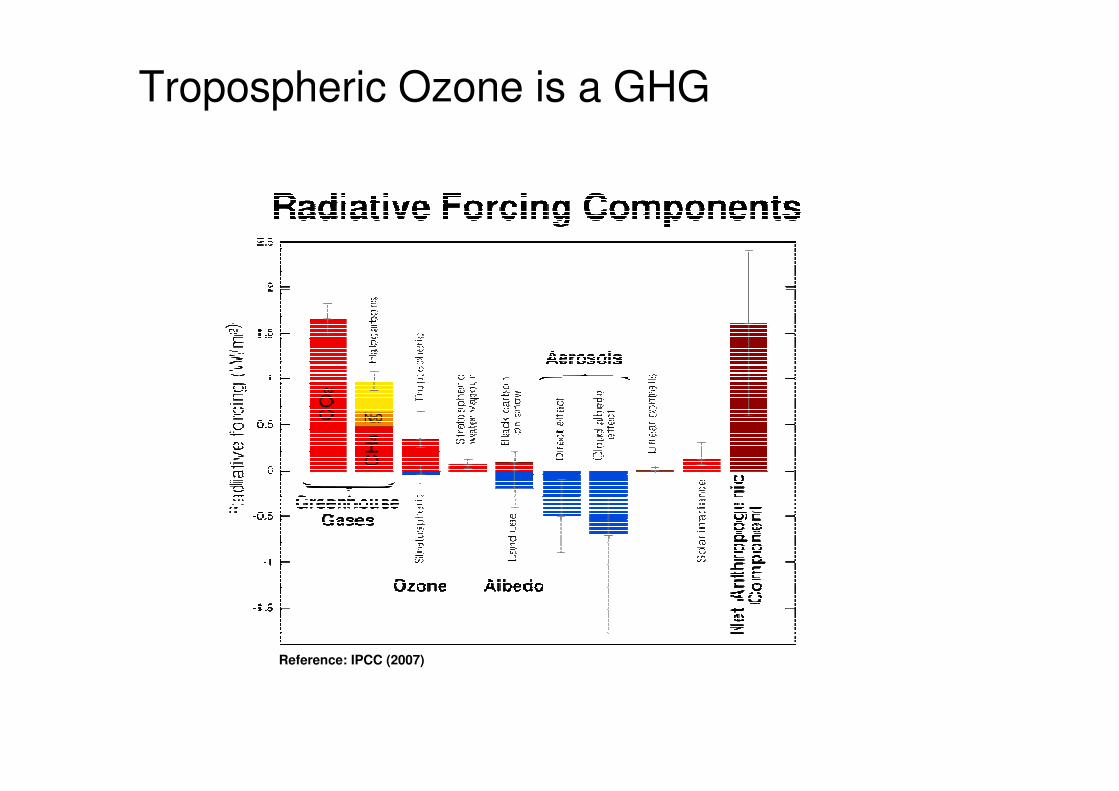
World Calibration Centre WCC-Empa
�Established 1996 for Surface Ozone
� 1997: Carbon Monoxide
� 2000: Methane
� 2007: Collaboration with WCC-N2O
� 2010: Carbon Dioxide

3
Purpose of audits
WCCWorld
CalibrationCentre
CCLStation
Station
Station
Station
• Only one reference in the network
• Traceability chain as short as possible
• Regular audits lead to homogenous data series
RCCRegional
CalibrationCentre Station
Station
WCC-Empa – GAW-CH Conference 2011-01-18

4
CCL WCC Station WCC CCL
TS
Analyzer
PS
LS LS
PS
years years weeks years
LS | WS
Audit scope
Performance Audits and Traceability Chain

WCC-Empa audits at GAW sites - Traceability
SRP#2 at NIST SRP#15+23 at Empa TEI 49C-PS / iPS
Travelling Standards
Stations / RCC

WCC-Empa Audits 1996 – 2010 at GAW stations
Bukit Koto Tabang
South Pole
Barrow
Mauna Loa
Alert
08 Pallas-Sodankylä97,03,07
MinamitorishimaAssekrem03,07
Arembepe01
Ushuaia98,03,08
Izaña96,98,00,04,09
Amsterdam IslandCape Grim02,10
Samoa
Ny Ålesund97,01,05
Lauder / Baring Head
Mace Head96,98,02,05,09
Zugspitze 96,97,01,06,(11)
Mt. Waliguan00,04,09
Neumayer Station
Mt Kenya00,02,05,06,08,10
Polar
Circle
40
0
40
80
40
0
40
80
120160 80 40 0 40 80 120 160
Cape Point97,98,02,06,(11)
Jungfraujoch
99,01,04,07,08,(11)
03
99,06 Ryori 05
Hohenpeissenberg 97,06,(11)
Danum Valley
04
08
08
O3/CO/CH4 O3/CO O3 Not yet audited # Year(s) of audit(s)
Cape Verde (11)
Trinidad Head
10
O3/CO/CH4/CO2
7
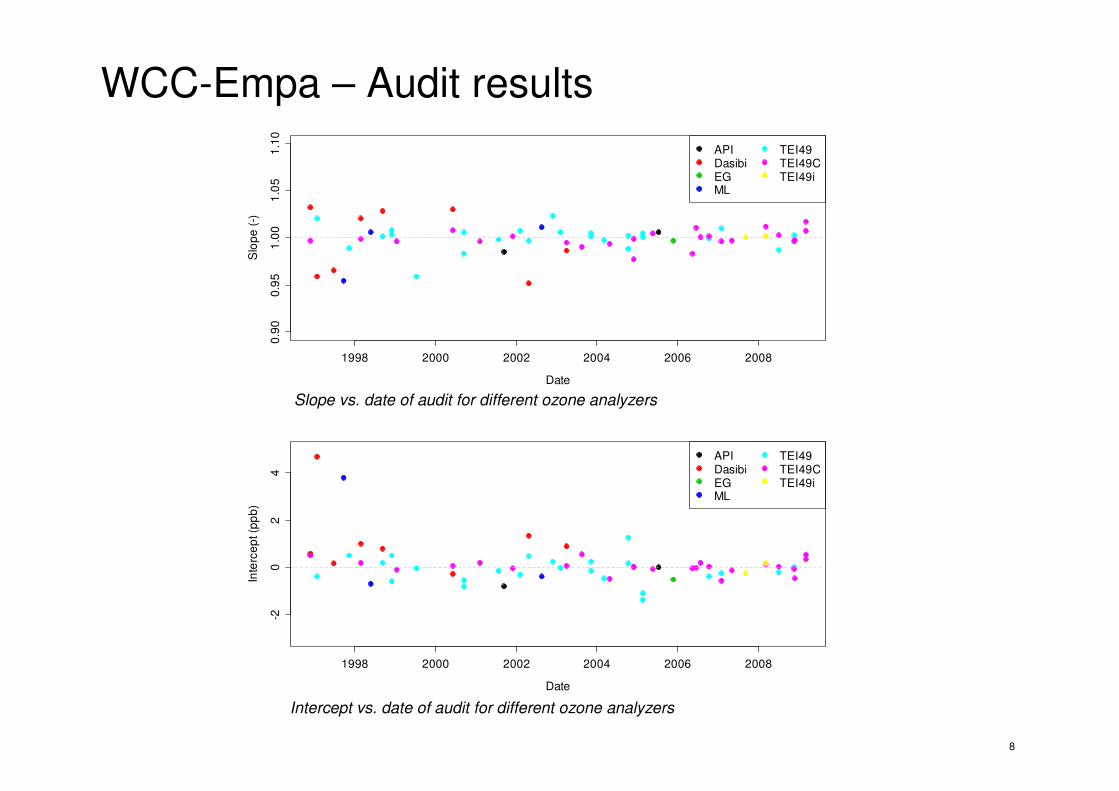
WCC-Empa – Audit results
0.85 0.90 0.95 1.00 1.05 1.10 1.15
-4-2
02
4Slope / (-)
Inte
rce
pt / (n
mo
l·nm
ol−
1)
API
Dasibi
EG
ML
TEI49
TEI49C
TEI49i
Good [Klausen et al. (2003)], Range 0-100 ppb
Sufficient [Klausen et al. (2003)], Range 0-100 ppb
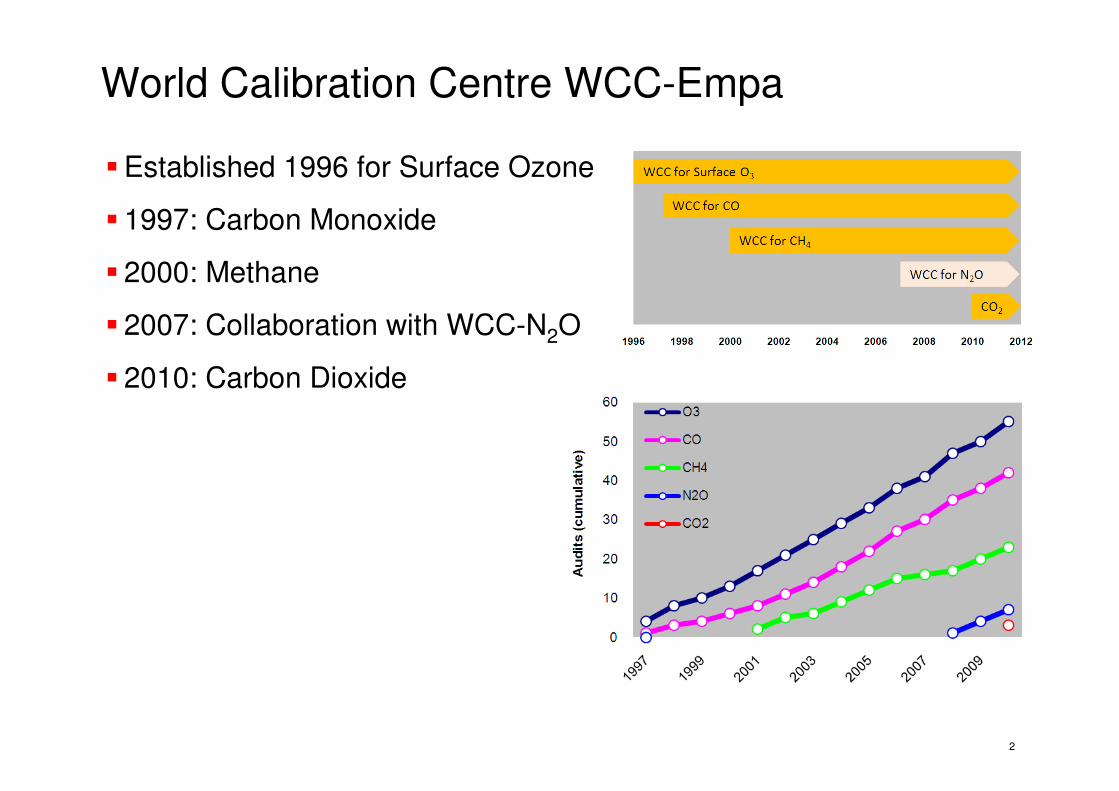
Intercept vs. slope for ozone audits conducted by WCC-Empabetween 1996 and 2008.
0 20 40 60 80
-50
5
SRP (ppb)
[OC
- S
RP
] (p
pb
)
Sufficient
Good
Good
Sufficient
TEI49C-PS #56546-318Unbiased ozone = OC - 0.38 (ppb) / 0.986
Example of an instrument assessment during an audit
DQO [1]: � 20 ppb: Sufficient: 2.1 ppb + 3%
Good: 1.8 ppb + 2%
> 20 ppb: Sufficient: 1.3 ppb + 7%
Good: 1.4 ppb + 4%
[1] Klausen, J., et al. (2003), Uncertainty and bias of surface ozone measurements at selected Global Atmosphere Watch sites, J. Geophys. Res.-Atmos., 108, 4622, doi:4610.1029/2003JD003710.
8
WCC-Empa – Audit results
Date
Slo
pe
(-)
0.9
00
.95
1.0
01
.05
1.1
0
1998 2000 2002 2004 2006 2008
APIDasibiEGML
TEI49TEI49CTEI49i
Date
Inte
rce
pt (p
pb
)
-20
24
1998 2000 2002 2004 2006 2008
APIDasibiEGML
TEI49TEI49CTEI49i
Slope vs. date of audit for different ozone analyzers
Intercept vs. date of audit for different ozone analyzers
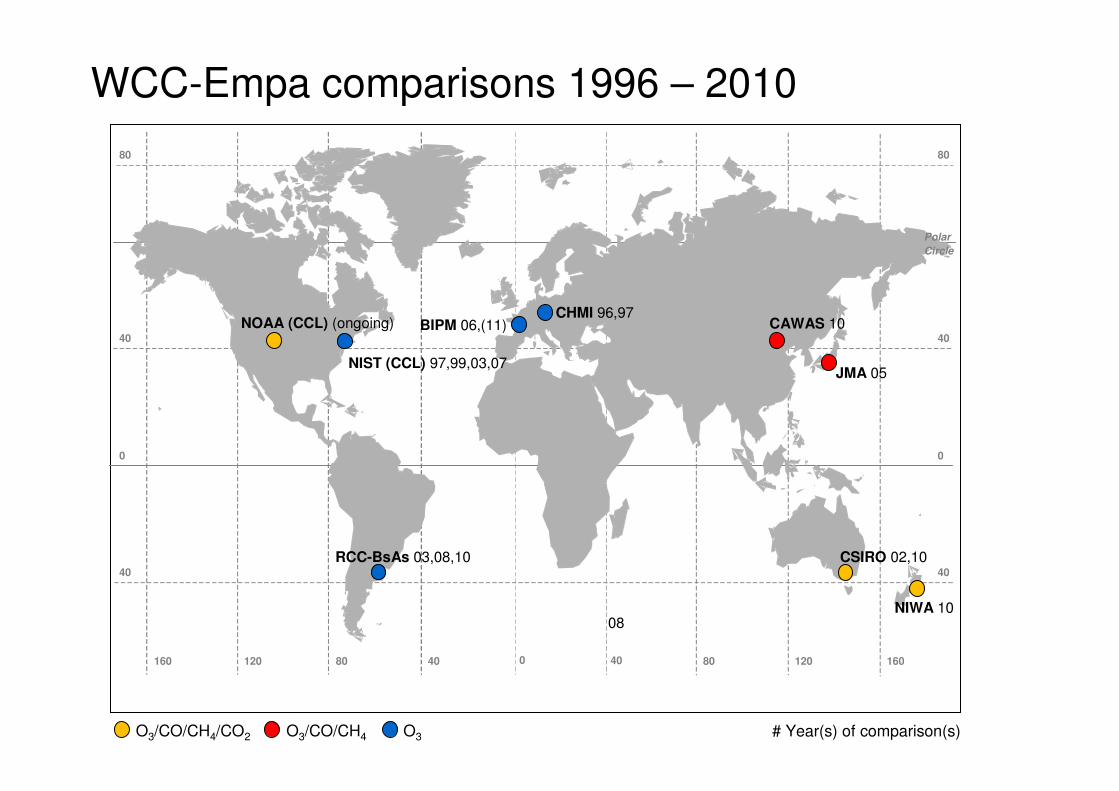
WCC-Empa comparisons 1996 – 2010
Polar
Circle
40
0
40
80
40
0
40
80
120160 80 40 0 40 80 120 160
JMA 05
08
O3/CO/CH4 O3 # Year(s) of comparison(s)O3/CO/CH4/CO2
RCC-BsAs 03,08,10 CSIRO 02,10
NIWA 10
CAWAS 10BIPM 06,(11)
NIST (CCL) 97,99,03,07
NOAA (CCL) (ongoing)CHMI 96,97
10
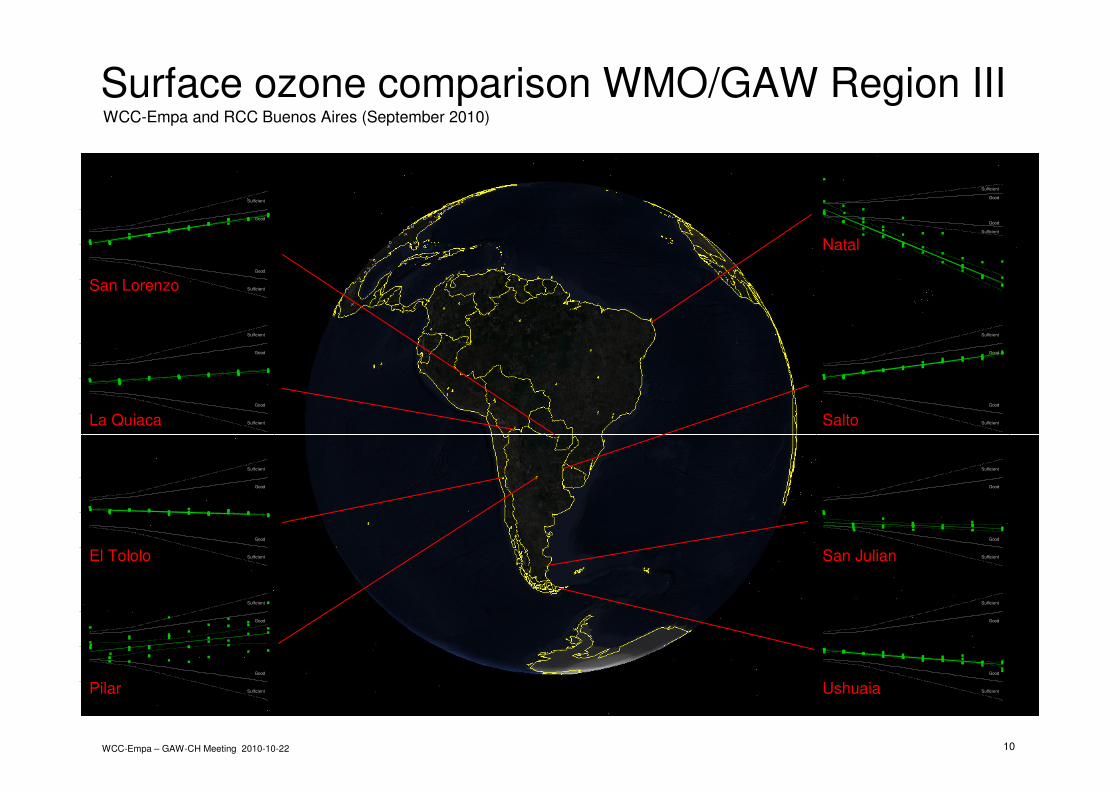
Surface ozone comparison WMO/GAW Region III WCC-Empa and RCC Buenos Aires (September 2010)
WCC-Empa – GAW-CH Meeting 2010-10-22
0 20 40 60 80
<SRP> (ppb)
Sufficient
Good
Good
Sufficient
TEI49 #49978-285(09/22/10 17:52:30)-(09/23/10 08:52:30)
El Tololo
0 20 40 60 80
<SRP> (ppb)
Sufficient
Good
Good
Sufficient
TEI49 #54501-300(09/22/10 17:52:30)-(09/23/10 06:52:30)
San Lorenzo0 20 40 60 80
-20
-15
-10
-50
51
0
<SRP> (ppb)
[OA
- <
SR
P>
] (p
pb
)
Sufficient
Good
Good
Sufficient
TEI49C-PS #62170-334(09/23/10 19:35:30)-(09/24/10 09:32:30)
Natal
0 20 40 60 80
<SRP> (ppb)
Sufficient
Good
Good
Sufficient
TEI49 #54577-300(09/23/10 11:50:30)-(09/23/10 16:50:36)
La Quiaca
Sufficient
Good
Good
Sufficient
TEI49 #49981-285(09/23/10 19:35:30)-(09/24/10 09:32:30)
Pilar
0 20 40 60 80
-50
5
<SRP> (ppb)
[OA
- <
SR
P>
] (p
pb
)
Sufficient
Good
Good
Sufficient
TEI49 #54947-302(09/22/10 17:52:30)-(09/23/10 06:52:30)
Salto
0 20 40 60 80
-50
5
<SRP> (ppb)
[OA
- <
SR
P>
] (p
pb
)
Sufficient
Good
Good
Sufficient
TEI49 #49983-285(09/23/10 11:50:30)-(09/23/10 16:50:36)
-50
5
[OA
- <
SR
P>
] (p
pb
)
Sufficient
Good
Good
Sufficient
TEI49C-PS #56546-318(09/23/10 19:35:30)-(09/24/10 09:32:30)
San Julian
Ushuaia

11
WCC-Empa – SRP stability
0.990 0.995 1.000 1.005 1.010
-1.0
-0.5
0.0
0.5
1.0
SRP23 vs. SRP15
slope
inte
rce
pt
SRP15
SRP15.old.cellsSRP15.old.electronics
Intercept vs. slope for SRP23 vs. SRP15 comparisons from 2001 - 2011
� Largest change after
electronics upgrade
� Change due to cell and
insulation upgrade not
significant
� Reproducibility of SRP23-
SRP15 comparisons
improved after cell and
insulation upgrade

12
WCC-Empa – SRP stability
Intercept and slope for SRP23 vs. SRP15 comparisons from 2001 - 2011
0.9
95
1.0
00
1.0
05
1.0
10
SRP23 vs. SRP15slo
pe
SRP15SRP15.old.cells
SRP15.old.electronics
2002 2004 2006 2008 2010
-0.4
-0.2
0.0
0.2
0.4
date
inte
rce
pt
2002 2004 2006 2008 2010
13
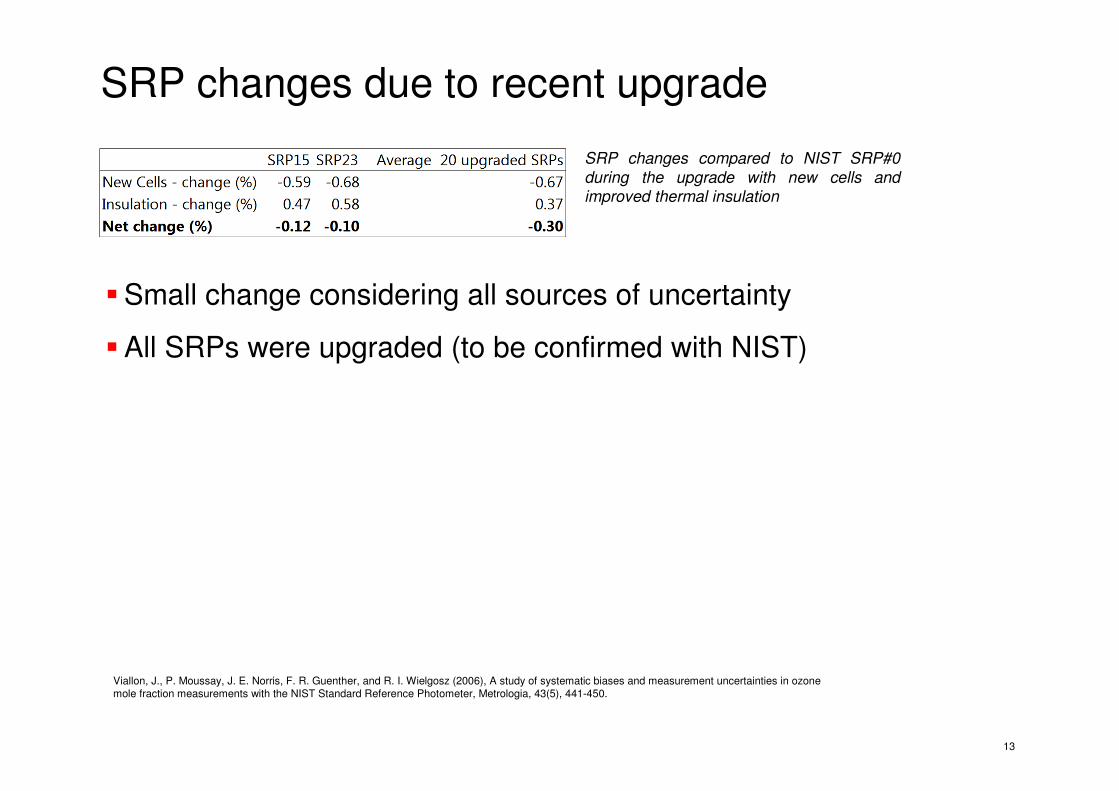
SRP changes due to recent upgrade
�Small change considering all sources of uncertainty
�All SRPs were upgraded (to be confirmed with NIST)
SRP changes compared to NIST SRP#0
during the upgrade with new cells and improved thermal insulation
Viallon, J., P. Moussay, J. E. Norris, F. R. Guenther, and R. I. Wielgosz (2006), A study of systematic biases and measurement uncertainties in ozone mole fraction measurements with the NIST Standard Reference Photometer, Metrologia, 43(5), 441-450.
14
Open issue: Ozone absorption cross section
�Differences between gas phase titration and SRP ozone
measurements (CCQM Report 28)
�Publication of new absorption cross section planned after finalizing
of experiments (Late 2012, by BIPM group)
�Expected change: +1.5%, i.e. all ozone measurements are currently
underestimated by 1.5%.
� as a consequence, impact on time –series already at WDCs
new data submission, implementation of “versions”
Ozone: future activities / issues
� Up date of Report Nr. 97;sub –SAG RG for Surface Ozone:Ian GalbanyChristoph Zellweger, WCC-EmpaEckhard ScheelBIPMNIST?…..
� DQOs; more strict?
� 3rd Dimension
� NRT
� Trend analysis
DQO [1]: � 20 ppb: Sufficient: 2.1 ppb + 3%
Good: 1.8 ppb + 2%
> 20 ppb: Sufficient: 1.3 ppb + 7%
Good: 1.4 ppb + 4%
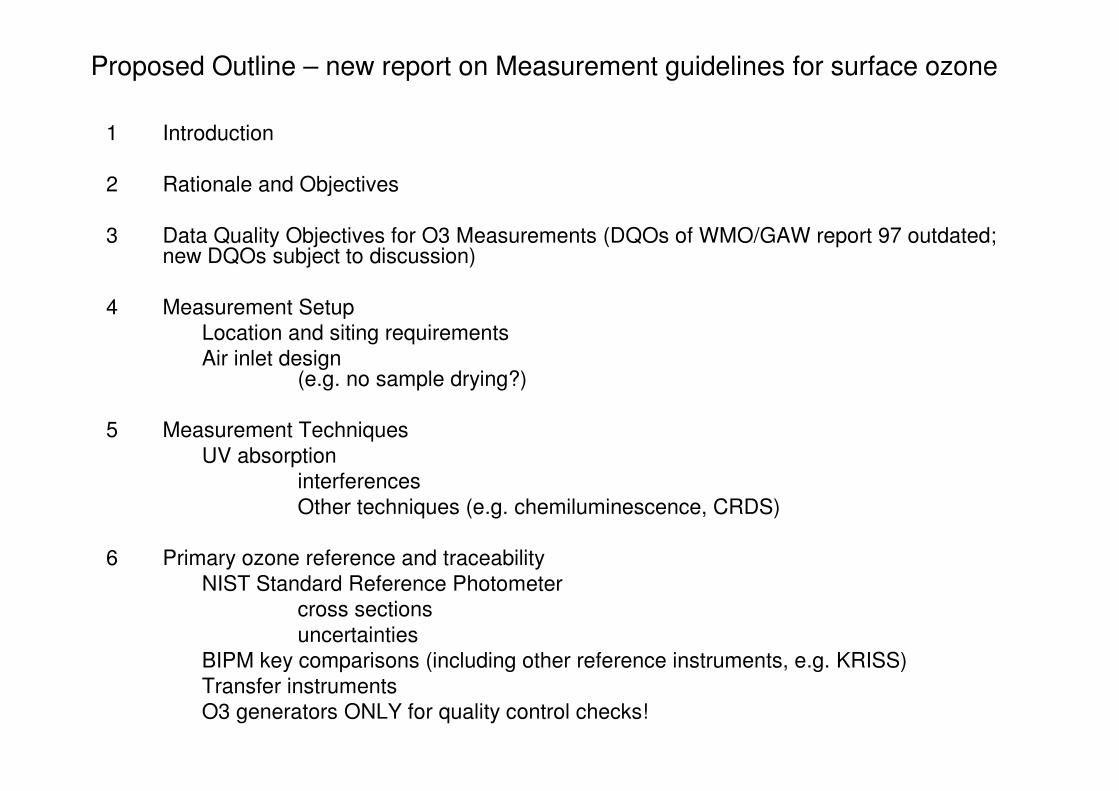
Proposed Outline – new report on Measurement guidelines for surface ozone
1 Introduction
2 Rationale and Objectives
3 Data Quality Objectives for O3 Measurements (DQOs of WMO/GAW report 97 outdated; new DQOs subject to discussion)
4 Measurement Setup
Location and siting requirements
Air inlet design (e.g. no sample drying?)
5 Measurement Techniques
UV absorption
interferences
Other techniques (e.g. chemiluminescence, CRDS)
6 Primary ozone reference and traceability
NIST Standard Reference Photometer
cross sections
uncertainties
BIPM key comparisons (including other reference instruments, e.g. KRISS)
Transfer instruments
O3 generators ONLY for quality control checks!

Proposed Outline – new report on Measurement guidelines for surface ozone
7 Quality Assurance and Quality Control
Calibration
Dry/wet air issues
Regular quality control (zero/span) checks
Other checks (flows, pressure, leak checks)
Inlet losses
Measurement protocol
Audit procedures
Particular issues related to airborne and shipborne observations
Evaluation of overall measurement uncertainty
8 Data Management
Data evaluation
Metadata
Ancillary data
Data archiving
Data submission
Data revision (making link to potential future changes of the O3 cross-section)
9 Integration of surface, airborne and ozonesonde observations
Annex Terms and definitions
Related Documents