Atmos. Meas. Tech., 12, 4113–4129, 2019 https://doi.org/10.5194/amt-12-4113-2019 © Author(s) 2019. This work is distributed under the Creative Commons Attribution 4.0 License. Tropopause altitude determination from temperature profile measurements of reduced vertical resolution Nils König, Peter Braesicke, and Thomas von Clarmann Karlsruhe Institute of Technology, Institute of Meteorology and Climate Research, Karlsruhe, Germany Correspondence: Thomas von Clarmann ([email protected]) Received: 20 December 2018 – Discussion started: 14 January 2019 Revised: 19 June 2019 – Accepted: 26 June 2019 – Published: 29 July 2019 Abstract. Inference of the lapse rate tropopause or the cold point from temperature profiles of finite vertical resolution entails an uncertainty of the tropopause altitude. For tropi- cal radiosonde profiles the tropopause altitude inferred from coarse-grid profiles was found to be lower than that inferred from the original profiles. The mean (median) displacements of the lapse rate tropopause altitude when inferred from a temperature profile of 3 km vertical resolution and a Gaus- sian kernel are -130, -400, -730, and -590 m (-70, -230, -390, and -280 m) for Nairobi, Hilo, Munich, and Greif- swald, respectively. In the case of a Michelson Interferom- eter for Passive Atmospheric Sounding (MIPAS) averaging kernel, the displacement of the lapse rate tropopause alti- tude is -640 m. The mean (median) displacement of the cold point tropopause inferred from a temperature profile of 3 km vertical resolution (Gaussian kernels) was found to be -510, -610, -530, and -390 m (-460, -510, -370, and -280 m) for the stations mentioned above. Unsurprisingly, the tropopause altitude displacement is larger for coarser res- olutions. The effect of the tropopause displacement on the water vapor saturation mixing ratio is roughly proportional to the vertical resolution. In tropical latitudes the resulting er- ror is about 1 to 2 ppmv per vertical resolution in kilometers. The spread of the tropopause displacements within each sam- ple of profiles seems too large as to recommend a correction scheme for tropical temperature profiles, while for midlatitu- dinal temperature profiles of vertical resolutions of 1 to 5 km a lapse rate of -1.3 K km -1 reproduces tropopause altitudes determined from high-resolution temperature profiles with the nominal lapse rate criterion of -2 K km -1 fairly well. 1 Introduction The tropopause constitutes a vertical separation in the at- mosphere that segregates the lower weather active region, viz., the troposphere, from an upper, steadier region, the stratosphere. High-altitude temperature soundings that be- came possible at the end of the 19th century showed an – at that time – unexpected temperature behavior, where tem- peratures would stagnate or even increase with height (see Hoinka, 1997, for a historical overview). Once it was es- tablished that this observation was no measurement error, and that above the troposphere another region of the atmo- sphere exists, namely the stratosphere, an unambiguous def- inition for the height of the boundary, the tropopause, had to be agreed on. The earliest comprehensive definition pro- vided by the British Meteorological Office was based on ei- ther the existence of a temperature inversion or an abrupt transition to a temperature gradient below 2 K km -1 . If the first two criteria were not met, a more general vertical tem- perature gradient criterion was applied: “at the point where the mean fall of temperature for the kilometer next above is 2 K or less provided that it does not exceed 2 K for any sub- sequent kilometer” (Dines, 1919, cited after Hoinka, 1997). A similar definition, focusing solely on the lapse rate of 2 K km -1 was adapted by the World Meteorological Orga- nization (WMO) in later years (World Meteorological Or- ganization, 1957). Since then additional definitions of the tropopause have emerged, focusing on the behavior of dy- namical quantities (e.g., Hoerling et al., 1991) or of trace gas changes (e.g., Pan et al., 2004). However, the most com- monly used method to define the position of the tropopause is still the WMO criterion. In tropical latitudes, another useful reference for distin- guishing the tropopause from the stratosphere is the cold Published by Copernicus Publications on behalf of the European Geosciences Union.

Welcome message from author
This document is posted to help you gain knowledge. Please leave a comment to let me know what you think about it! Share it to your friends and learn new things together.
Transcript
Atmos. Meas. Tech., 12, 4113–4129, 2019https://doi.org/10.5194/amt-12-4113-2019© Author(s) 2019. This work is distributed underthe Creative Commons Attribution 4.0 License.
Tropopause altitude determination from temperature profilemeasurements of reduced vertical resolutionNils König, Peter Braesicke, and Thomas von ClarmannKarlsruhe Institute of Technology, Institute of Meteorology and Climate Research, Karlsruhe, Germany
Correspondence: Thomas von Clarmann ([email protected])
Received: 20 December 2018 – Discussion started: 14 January 2019Revised: 19 June 2019 – Accepted: 26 June 2019 – Published: 29 July 2019
Abstract. Inference of the lapse rate tropopause or the coldpoint from temperature profiles of finite vertical resolutionentails an uncertainty of the tropopause altitude. For tropi-cal radiosonde profiles the tropopause altitude inferred fromcoarse-grid profiles was found to be lower than that inferredfrom the original profiles. The mean (median) displacementsof the lapse rate tropopause altitude when inferred from atemperature profile of 3 km vertical resolution and a Gaus-sian kernel are−130,−400,−730, and−590 m (−70,−230,−390, and −280 m) for Nairobi, Hilo, Munich, and Greif-swald, respectively. In the case of a Michelson Interferom-eter for Passive Atmospheric Sounding (MIPAS) averagingkernel, the displacement of the lapse rate tropopause alti-tude is −640 m. The mean (median) displacement of thecold point tropopause inferred from a temperature profile of3 km vertical resolution (Gaussian kernels) was found to be−510, −610, −530, and −390 m (−460, −510, −370, and−280 m) for the stations mentioned above. Unsurprisingly,the tropopause altitude displacement is larger for coarser res-olutions. The effect of the tropopause displacement on thewater vapor saturation mixing ratio is roughly proportionalto the vertical resolution. In tropical latitudes the resulting er-ror is about 1 to 2 ppmv per vertical resolution in kilometers.The spread of the tropopause displacements within each sam-ple of profiles seems too large as to recommend a correctionscheme for tropical temperature profiles, while for midlatitu-dinal temperature profiles of vertical resolutions of 1 to 5 kma lapse rate of −1.3 K km−1 reproduces tropopause altitudesdetermined from high-resolution temperature profiles withthe nominal lapse rate criterion of −2 K km−1 fairly well.
1 Introduction
The tropopause constitutes a vertical separation in the at-mosphere that segregates the lower weather active region,viz., the troposphere, from an upper, steadier region, thestratosphere. High-altitude temperature soundings that be-came possible at the end of the 19th century showed an –at that time – unexpected temperature behavior, where tem-peratures would stagnate or even increase with height (seeHoinka, 1997, for a historical overview). Once it was es-tablished that this observation was no measurement error,and that above the troposphere another region of the atmo-sphere exists, namely the stratosphere, an unambiguous def-inition for the height of the boundary, the tropopause, hadto be agreed on. The earliest comprehensive definition pro-vided by the British Meteorological Office was based on ei-ther the existence of a temperature inversion or an abrupttransition to a temperature gradient below 2 K km−1. If thefirst two criteria were not met, a more general vertical tem-perature gradient criterion was applied: “at the point wherethe mean fall of temperature for the kilometer next above is2 K or less provided that it does not exceed 2 K for any sub-sequent kilometer” (Dines, 1919, cited after Hoinka, 1997).A similar definition, focusing solely on the lapse rate of2 K km−1 was adapted by the World Meteorological Orga-nization (WMO) in later years (World Meteorological Or-ganization, 1957). Since then additional definitions of thetropopause have emerged, focusing on the behavior of dy-namical quantities (e.g., Hoerling et al., 1991) or of tracegas changes (e.g., Pan et al., 2004). However, the most com-monly used method to define the position of the tropopauseis still the WMO criterion.
In tropical latitudes, another useful reference for distin-guishing the tropopause from the stratosphere is the cold
Published by Copernicus Publications on behalf of the European Geosciences Union.
4114 N. König et al.: Tropopause altitude
point (where the temperature minimum occurs). It relates tothe existence of a temperature inversion in the original def-inition as described above, and the corresponding lapse ratetropopause commonly lies a few hundred meters below thecold point (e.g., Fig. 8 in Kim and Son, 2012).
Aspirational targets exist for knowing the altitude dis-tribution of the thermal tropopause with an uncertainty of100 m globally (see the Observing Systems Capability Anal-ysis and Review Tool at https://www.wmo-sat.info/oscar/variables/view/81, last access: 24 July 2019). However, it isobvious that deriving the altitude of a lapse rate tropopausewill depend to some extent on the resolution of the temper-ature profile that is used to calculate the vertical gradient.The same holds true for the cold point tropopause. Thus,it seems important to understand how the derived altitudeof the tropopause depends on the vertical resolution of thetemperature data. Knowledge of the exact tropopause alti-tude is essential in particular, when distributions of atmo-spheric state variables such as mixing ratios of trace speciesare transformed to a tropopause-related vertical coordinatesystem in order to investigate chemical, transport, and mix-ing processes in the upper troposphere and lowermost strato-sphere (e.g., Tuck et al., 1997; Pan et al., 2004; Birner, 2006;Tilmes et al., 2010; Pan and Munchak, 2011). Tropopause al-titudes inferred from limb measurements have been reportedby Peevey et al. (2012) or Spang et al. (2015).
The goal of this paper is to analyze the possible depen-dence of a derived tropopause altitude on the vertical res-olution of the temperature profile and to evaluate possibili-ties to potentially correct tropopause altitudes inferred fromcoarsely resolved temperature profiles. After presenting theformal concept used for this study (Sect. 2), we first assessthe impact of finite vertical resolution on the determination ofthe tropopause altitude in quantitative terms (Sect. 3). We dothis separately for lapse rate tropopause altitudes (Sect. 3.1)and cold point tropopause altitudes (Sect. 3.2). The impli-cation for the saturation mixing ratio of water vapor is ana-lyzed in Sect. 4. Then we investigate if related altitude errorscan be corrected by a slight modification of the tropopausedefinition, which, when applied to temperature profiles offinite vertical resolution, reproduces the tropopause altitudeaccording to the WMO definition when applied to the origi-nal data (Sect. 5). Finally we discuss the applicability of ourresults to various types of constrained temperature retrievalsfrom satellite data and conclude what the upshot of this studyis from a data user perspective (Sect. 6).
2 The formal concept
The altitude resolution of a vertical profile such as tempera-ture can be characterized by the n×n averaging kernel matrixA (Rodgers, 2000). It consists of the partial derivatives ∂x̃i
∂xj
of the elements x̃i of the degraded profile with respect to thevariation in the element xj of the true profile. Its columns
represent the relative response of a degraded profile x̃ to adelta perturbation of the true profile x. Conversely, the j thcolumn represents the weights with which the elements ofthe true profile contribute to the j th element of the degradedprofile. The averaging kernel of a profile without degradationis the identity matrix I. It goes without saying that effects ona finer scale than that reproducible in the n-dimensional gridremain undetected, unless some prior information on the pro-file shape between the grid points is used, as suggested by, forexample, Reichler et al. (2003). This is to say, the averagingkernel does not characterize the degradation with respect tothe fully resolved true profile but only the degradation withrespect to the profile represented in a vector of n grid points.
Typically, the reduction of altitude resolution is caused byone of the following three mechanisms: (1) the atmosphereis remotely sensed by an instrument of finite vertical resolu-tion. In this case, the atmospheric state is often sampled on agrid finer than that corresponding to the altitude resolution ofthe measurement system; (2) a high-resolution profile is re-sampled on a coarser grid. This resampling goes along witha degradation of the altitude resolution; (3) a filter functionis applied, which reduces the vertical resolution.
2.1 Remotely sensed vertical profiles
Often the degradation, i.e., the loss of vertical resolution, iscaused by the use of a constraint in the retrieval of atmo-spheric state variables from remote measurements y. The es-timated state x̂ depends on the measurement y and the priorinformation xa as
x̂ = xa+(
KTS−1y K+R
)−1KTS−1
y (y−f (xa)) , (1)
where K is the Jacobian matrix ∂yi∂xj
, T indicates a transposedmatrix, Sy is the covariance matrix characterizing measure-ment noise, R is a regularization matrix, and f is the radia-tive transfer function (von Clarmann et al., 2003a). Using aninverse a priori covariance matrix S−1
a as the regularizationmatrix, this formalism renders a maximum a posteriori re-trieval as described by Rodgers (2000). Other widely usedchoices of R are squared lth-order difference matrices (see,e.g., von Clarmann et al., 2003b). The latter are often usedin order to stabilize the profile by smoothing without push-ing the values towards an a priori profile (e.g., Steck and vonClarmann, 2001).
In all cases, the averaging kernel matrix is
Aretrieval =(
KT S−1y K+R
)−1KT S−1
y K, (2)
and with this the state estimate can be separated into twocomponents, which are the contribution of the true atmo-spheric state and the contribution of the prior information
x̂ = Aretrievalxtrue+ (I−Aretrieval)xa+ εx;total, (3)
Atmos. Meas. Tech., 12, 4113–4129, 2019 www.atmos-meas-tech.net/12/4113/2019/
N. König et al.: Tropopause altitude 4115
where, as its index suggests, xtrue represents the true tem-perature profile, and εx;total is the actual realization of theretrieval error.
The altitude resolution of the retrieval can be determinedfrom the averaging kernel matrix. Common conventions areto use either the half widths of its rows or the grid widthsdivided by the diagonal elements. It goes without saying thatthe altitude resolution of a retrieved profile can be altitude-dependent.
2.2 Resampling on a coarser grid
Other causes for degraded profiles are representation on agrid not sufficiently fine to represent all structures or appli-cation of a numerical filter to the original profile. The aver-aging kernel matrix is the adequate tool for dealing with allthese cases.
The effect of a coarse grid is best understood by constru-ing the coarse-grid profile as a result of an interpolation ofthe profile from a finer grid (see Rodgers, 2000, Sect 10.3.1,where a slightly different notation is used). Let x̃ be the pro-file represented on the coarse grid, and x the profile in theoriginal representation where all fine structure is resolved. Inthis case we use an interpolation matrix V and get
x̃ = Vx. (4)
For an interpolation from a fine grid to a coarse grid, V isoften chosen as
V= (WTW)−1WT, (5)
where W is the interpolation from the coarse to the fine grid.A definition of A based on V gives us an asymmetric aver-aging kernel matrix which represents the dependence of theprofile values on the coarse grid on the “true” values on thefine grid.
Acoarse = V (6)
Contrary to the averaging kernel matrix introduced byEq. (2), Acoarse is not square.
To characterize the loss of resolution due to coarse sam-pling the averaging kernel on the fine grid, Ainterpolation isneeded. It is
Ainterpolation =WV. (7)
If the profile on the fine grid is in itself a degraded profile,e.g., because it was generated by a constrained retrieval, weneed a combined averaging kernel matrix:
Acombined =WVAretrieval. (8)
2.3 Application of filter functions
Application of a linear filter corresponds to the convolutionof the original profile with a filter function and is best formu-lated as a matrix product involving a filter matrix T whose
lines correspond to the moving discretized filter functions atits actual position.
x̃ = Tx (9)
In this case the averaging kernel matrix is identical to the Tmatrix.
Afilter = T (10)
3 The dependence of the estimated tropopause altitudeon vertical resolution of the underlying temperatureprofile
To analyze the impact of smoothing effects on the estimatedtropopause altitude we use temperature profiles measuredby radiosondes launched from Nairobi (1.3◦ S, 36.8◦ E),Hilo (19.4◦ N 155.4◦W), Munich (47.8◦ N,10.9◦ E), andGreifswald (54.1◦ N, 13.4◦ E). Data from Nairobi and Hilowere available via the Southern Hemisphere AdditionalOzonesondes (SHADOZ) network (https://tropo.gsfc.nasa.gov/shadoz/, last access: 29 April 2019, Witte et al.,2017; Thompson et al., 2017), while data from Munichand Greifswald were obtained from the German WeatherService (available via ftp://ftp-cdc.dwd.de/, last access:29 April 2019). All radiosonde datasets cover the period2007–2018. All available Nairobi and Hilo radiosonde pro-files within this time period were used. For Munich andGreifswald one profile per week was selected. Details of thesonde profiles used in our study are compiled in Table 1.
One focus of our study lies on tropical temperature pro-files because of the importance of the tropical tropopause inthe climate system. Obviously, the area of the tropics exceedsthat of other latitude bands; the tropical tropopause is the en-try point of air into the stratosphere (Fueglistaler et al., 2009).And finally the tropical tropopause region plays a distinctiverole in the radiative budget of the Earth (Riese et al., 2012).Nairobi was chosen as an example of a continental station,while Hilo (Hawaii) is a maritime station. As a contrast wehave also used the two midlatitudinal stations Munich (closeto the Alps) and Greifswald (close to the Baltic Sea).
Various averaging kernels A are applied to the originalradiosonde profiles x to get degraded temperature profilesx̃. These are used for the determination of the lapse ratetropopause altitude and the results are then compared to thetropopause altitudes determined from the original sonde data.
3.1 The lapse rate tropopause
The lapse rate tropopause is the lower boundary of the low-ermost layer where the temperature gradient is larger (morepositive) than −2 K km−1 provided that the average lapserate between this level and all higher levels within 2 km doesnot exceed 2 K km−1 (World Meteorological Organization,1992). It is often determined from data resampled on a grid
www.atmos-meas-tech.net/12/4113/2019/ Atmos. Meas. Tech., 12, 4113–4129, 2019
4116 N. König et al.: Tropopause altitude
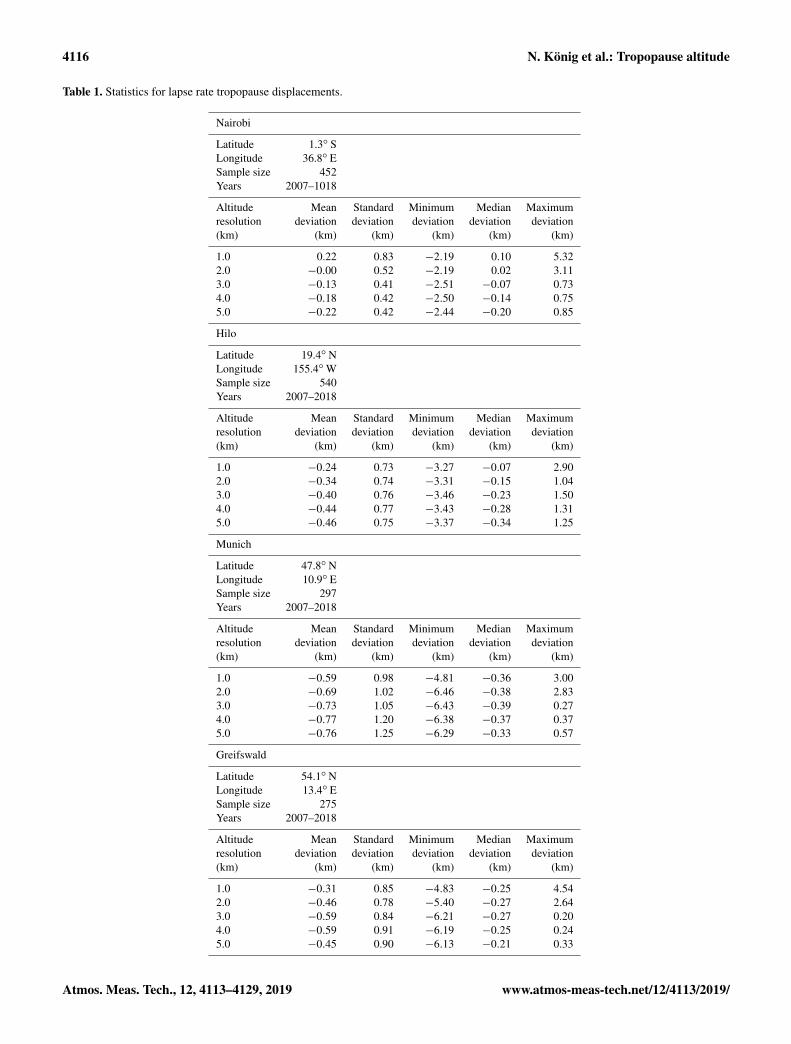
Table 1. Statistics for lapse rate tropopause displacements.
Nairobi
Latitude 1.3◦ SLongitude 36.8◦ ESample size 452Years 2007–1018
Altitude Mean Standard Minimum Median Maximumresolution deviation deviation deviation deviation deviation(km) (km) (km) (km) (km) (km)
1.0 0.22 0.83 −2.19 0.10 5.322.0 −0.00 0.52 −2.19 0.02 3.113.0 −0.13 0.41 −2.51 −0.07 0.734.0 −0.18 0.42 −2.50 −0.14 0.755.0 −0.22 0.42 −2.44 −0.20 0.85
Hilo
Latitude 19.4◦ NLongitude 155.4◦WSample size 540Years 2007–2018
Altitude Mean Standard Minimum Median Maximumresolution deviation deviation deviation deviation deviation(km) (km) (km) (km) (km) (km)
1.0 −0.24 0.73 −3.27 −0.07 2.902.0 −0.34 0.74 −3.31 −0.15 1.043.0 −0.40 0.76 −3.46 −0.23 1.504.0 −0.44 0.77 −3.43 −0.28 1.315.0 −0.46 0.75 −3.37 −0.34 1.25
Munich
Latitude 47.8◦ NLongitude 10.9◦ ESample size 297Years 2007–2018
Altitude Mean Standard Minimum Median Maximumresolution deviation deviation deviation deviation deviation(km) (km) (km) (km) (km) (km)
1.0 −0.59 0.98 −4.81 −0.36 3.002.0 −0.69 1.02 −6.46 −0.38 2.833.0 −0.73 1.05 −6.43 −0.39 0.274.0 −0.77 1.20 −6.38 −0.37 0.375.0 −0.76 1.25 −6.29 −0.33 0.57
Greifswald
Latitude 54.1◦ NLongitude 13.4◦ ESample size 275Years 2007–2018
Altitude Mean Standard Minimum Median Maximumresolution deviation deviation deviation deviation deviation(km) (km) (km) (km) (km) (km)
1.0 −0.31 0.85 −4.83 −0.25 4.542.0 −0.46 0.78 −5.40 −0.27 2.643.0 −0.59 0.84 −6.21 −0.27 0.204.0 −0.59 0.91 −6.19 −0.25 0.245.0 −0.45 0.90 −6.13 −0.21 0.33
Atmos. Meas. Tech., 12, 4113–4129, 2019 www.atmos-meas-tech.net/12/4113/2019/
N. König et al.: Tropopause altitude 4117
corresponding to a wider range of vertical spacings from be-low 1 km (e.g., significant pressure levels) and not alwaysfrom the raw radiosonde data (see, e.g., Reichler et al., 2003,and references therein).
From the radiosonde profiles the lapse rate tropopause al-titudes were determined and served as our benchmark. Onlyin those cases when the lapse rate tropopause determinationfailed, was the cold point tropopause used as a benchmarkinstead. In subsequent steps, the profiles were systematicallydegraded using averaging kernels of different shapes and al-titude resolutions, in order to investigate a possible verticaldisplacement of the apparent tropopause.
3.1.1 Gaussian averaging kernels
To test the dependence of apparent tropopause altitudes onthe vertical resolution of the temperature profile, we useGaussian-shaped averaging kernels to smooth the originalradiosonde profiles. For this purpose we use the radiosondedata on their native grid. The smoothed profiles are sampledon a 1 km altitude grid. Vertical resolutions in terms of fullwidths at half maximum of 1 to 5 km were tested. Since weare not interested in the contribution by any a priori profilebut only in the degradation of the vertical profiles by a de-graded altitude resolution, we use Eq. (9), with the necessarymodification to cope with the irregular input grid.
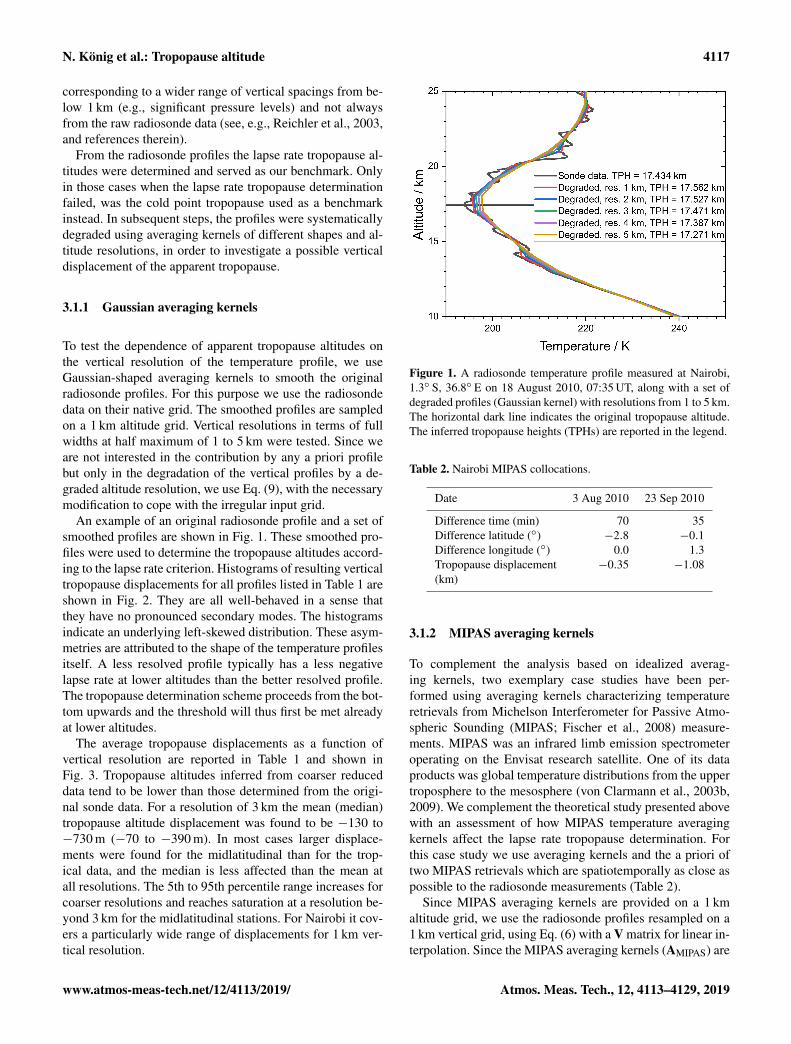
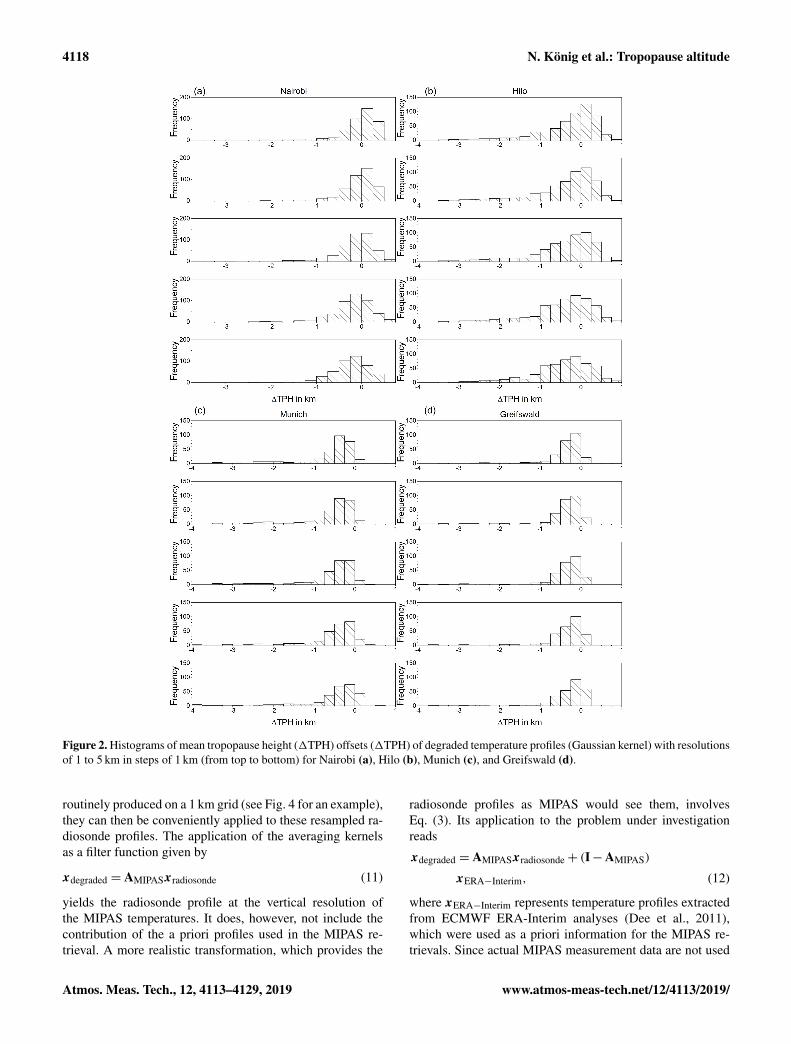
An example of an original radiosonde profile and a set ofsmoothed profiles are shown in Fig. 1. These smoothed pro-files were used to determine the tropopause altitudes accord-ing to the lapse rate criterion. Histograms of resulting verticaltropopause displacements for all profiles listed in Table 1 areshown in Fig. 2. They are all well-behaved in a sense thatthey have no pronounced secondary modes. The histogramsindicate an underlying left-skewed distribution. These asym-metries are attributed to the shape of the temperature profilesitself. A less resolved profile typically has a less negativelapse rate at lower altitudes than the better resolved profile.The tropopause determination scheme proceeds from the bot-tom upwards and the threshold will thus first be met alreadyat lower altitudes.
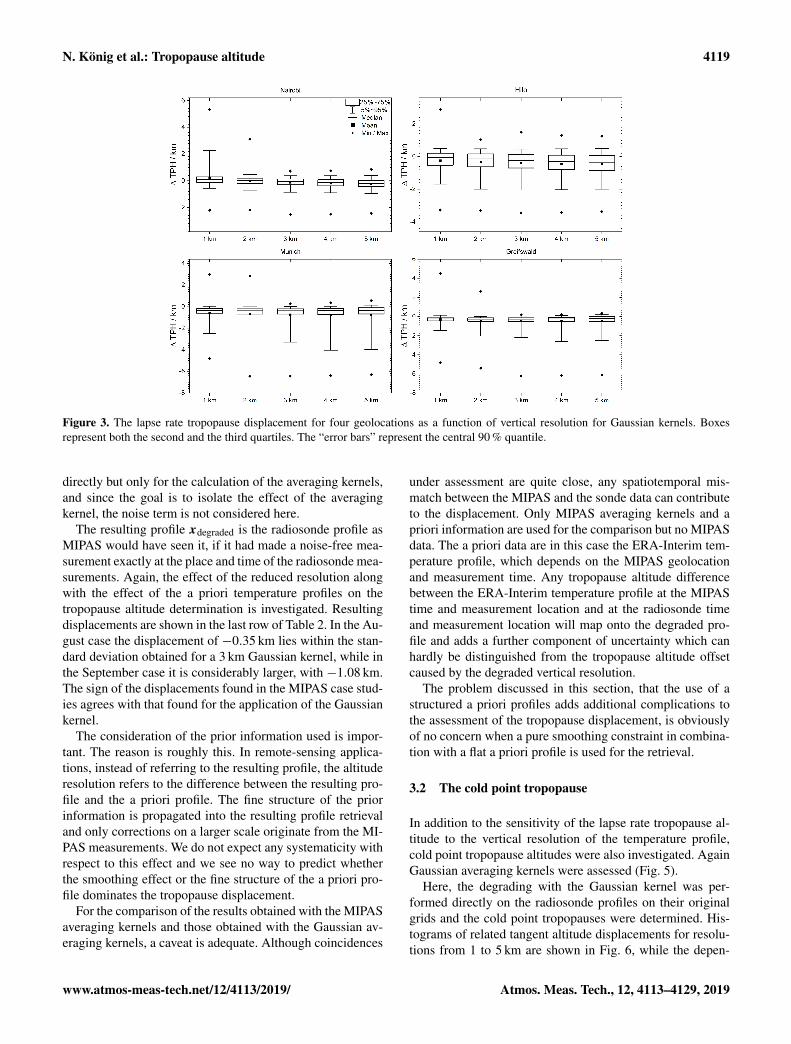
The average tropopause displacements as a function ofvertical resolution are reported in Table 1 and shown inFig. 3. Tropopause altitudes inferred from coarser reduceddata tend to be lower than those determined from the origi-nal sonde data. For a resolution of 3 km the mean (median)tropopause altitude displacement was found to be −130 to−730 m (−70 to −390 m). In most cases larger displace-ments were found for the midlatitudinal than for the trop-ical data, and the median is less affected than the mean atall resolutions. The 5th to 95th percentile range increases forcoarser resolutions and reaches saturation at a resolution be-yond 3 km for the midlatitudinal stations. For Nairobi it cov-ers a particularly wide range of displacements for 1 km ver-tical resolution.
Figure 1. A radiosonde temperature profile measured at Nairobi,1.3◦ S, 36.8◦ E on 18 August 2010, 07:35 UT, along with a set ofdegraded profiles (Gaussian kernel) with resolutions from 1 to 5 km.The horizontal dark line indicates the original tropopause altitude.The inferred tropopause heights (TPHs) are reported in the legend.
Table 2. Nairobi MIPAS collocations.
Date 3 Aug 2010 23 Sep 2010
Difference time (min) 70 35Difference latitude (◦) −2.8 −0.1Difference longitude (◦) 0.0 1.3Tropopause displacement −0.35 −1.08(km)
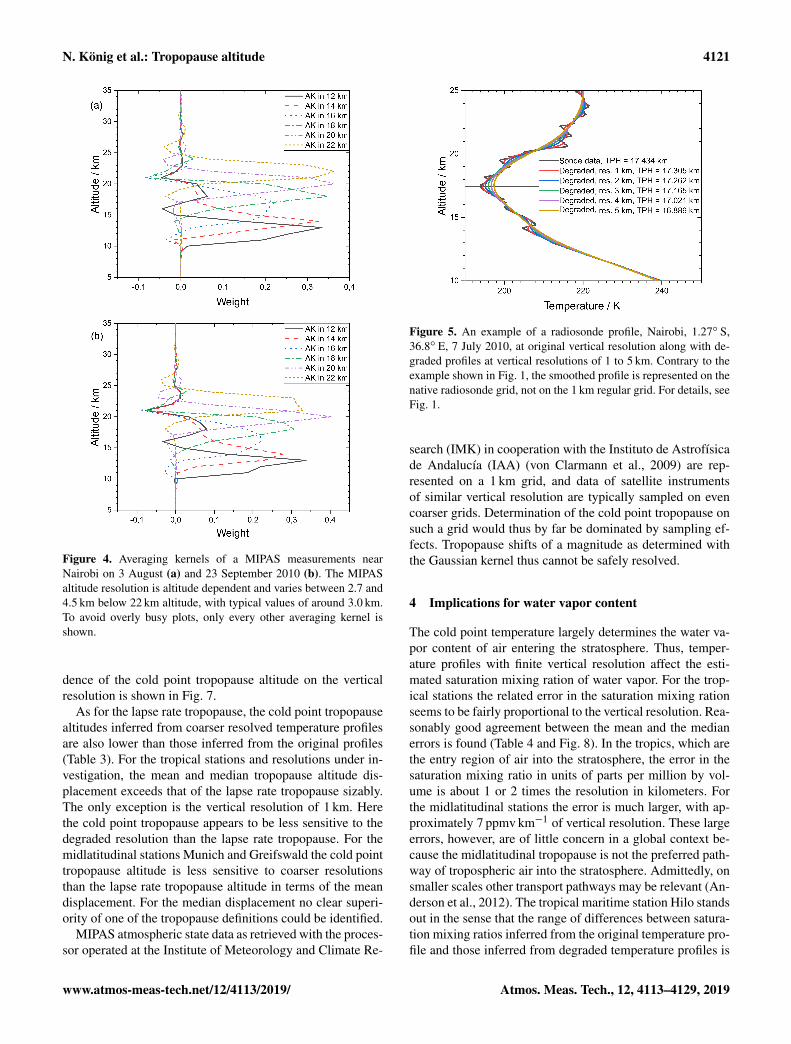
3.1.2 MIPAS averaging kernels
To complement the analysis based on idealized averag-ing kernels, two exemplary case studies have been per-formed using averaging kernels characterizing temperatureretrievals from Michelson Interferometer for Passive Atmo-spheric Sounding (MIPAS; Fischer et al., 2008) measure-ments. MIPAS was an infrared limb emission spectrometeroperating on the Envisat research satellite. One of its dataproducts was global temperature distributions from the uppertroposphere to the mesosphere (von Clarmann et al., 2003b,2009). We complement the theoretical study presented abovewith an assessment of how MIPAS temperature averagingkernels affect the lapse rate tropopause determination. Forthis case study we use averaging kernels and the a priori oftwo MIPAS retrievals which are spatiotemporally as close aspossible to the radiosonde measurements (Table 2).
Since MIPAS averaging kernels are provided on a 1 kmaltitude grid, we use the radiosonde profiles resampled on a1 km vertical grid, using Eq. (6) with a V matrix for linear in-terpolation. Since the MIPAS averaging kernels (AMIPAS) are
www.atmos-meas-tech.net/12/4113/2019/ Atmos. Meas. Tech., 12, 4113–4129, 2019
4118 N. König et al.: Tropopause altitude
Figure 2. Histograms of mean tropopause height (1TPH) offsets (1TPH) of degraded temperature profiles (Gaussian kernel) with resolutionsof 1 to 5 km in steps of 1 km (from top to bottom) for Nairobi (a), Hilo (b), Munich (c), and Greifswald (d).
routinely produced on a 1 km grid (see Fig. 4 for an example),they can then be conveniently applied to these resampled ra-diosonde profiles. The application of the averaging kernelsas a filter function given by
xdegraded = AMIPASxradiosonde (11)
yields the radiosonde profile at the vertical resolution ofthe MIPAS temperatures. It does, however, not include thecontribution of the a priori profiles used in the MIPAS re-trieval. A more realistic transformation, which provides the
radiosonde profiles as MIPAS would see them, involvesEq. (3). Its application to the problem under investigationreads
xdegraded = AMIPASxradiosonde+ (I−AMIPAS)
xERA−Interim, (12)
where xERA−Interim represents temperature profiles extractedfrom ECMWF ERA-Interim analyses (Dee et al., 2011),which were used as a priori information for the MIPAS re-trievals. Since actual MIPAS measurement data are not used
Atmos. Meas. Tech., 12, 4113–4129, 2019 www.atmos-meas-tech.net/12/4113/2019/
N. König et al.: Tropopause altitude 4119
Figure 3. The lapse rate tropopause displacement for four geolocations as a function of vertical resolution for Gaussian kernels. Boxesrepresent both the second and the third quartiles. The “error bars” represent the central 90 % quantile.
directly but only for the calculation of the averaging kernels,and since the goal is to isolate the effect of the averagingkernel, the noise term is not considered here.
The resulting profile xdegraded is the radiosonde profile asMIPAS would have seen it, if it had made a noise-free mea-surement exactly at the place and time of the radiosonde mea-surements. Again, the effect of the reduced resolution alongwith the effect of the a priori temperature profiles on thetropopause altitude determination is investigated. Resultingdisplacements are shown in the last row of Table 2. In the Au-gust case the displacement of −0.35 km lies within the stan-dard deviation obtained for a 3 km Gaussian kernel, while inthe September case it is considerably larger, with −1.08 km.The sign of the displacements found in the MIPAS case stud-ies agrees with that found for the application of the Gaussiankernel.
The consideration of the prior information used is impor-tant. The reason is roughly this. In remote-sensing applica-tions, instead of referring to the resulting profile, the altituderesolution refers to the difference between the resulting pro-file and the a priori profile. The fine structure of the priorinformation is propagated into the resulting profile retrievaland only corrections on a larger scale originate from the MI-PAS measurements. We do not expect any systematicity withrespect to this effect and we see no way to predict whetherthe smoothing effect or the fine structure of the a priori pro-file dominates the tropopause displacement.
For the comparison of the results obtained with the MIPASaveraging kernels and those obtained with the Gaussian av-eraging kernels, a caveat is adequate. Although coincidences
under assessment are quite close, any spatiotemporal mis-match between the MIPAS and the sonde data can contributeto the displacement. Only MIPAS averaging kernels and apriori information are used for the comparison but no MIPASdata. The a priori data are in this case the ERA-Interim tem-perature profile, which depends on the MIPAS geolocationand measurement time. Any tropopause altitude differencebetween the ERA-Interim temperature profile at the MIPAStime and measurement location and at the radiosonde timeand measurement location will map onto the degraded pro-file and adds a further component of uncertainty which canhardly be distinguished from the tropopause altitude offsetcaused by the degraded vertical resolution.
The problem discussed in this section, that the use of astructured a priori profiles adds additional complications tothe assessment of the tropopause displacement, is obviouslyof no concern when a pure smoothing constraint in combina-tion with a flat a priori profile is used for the retrieval.
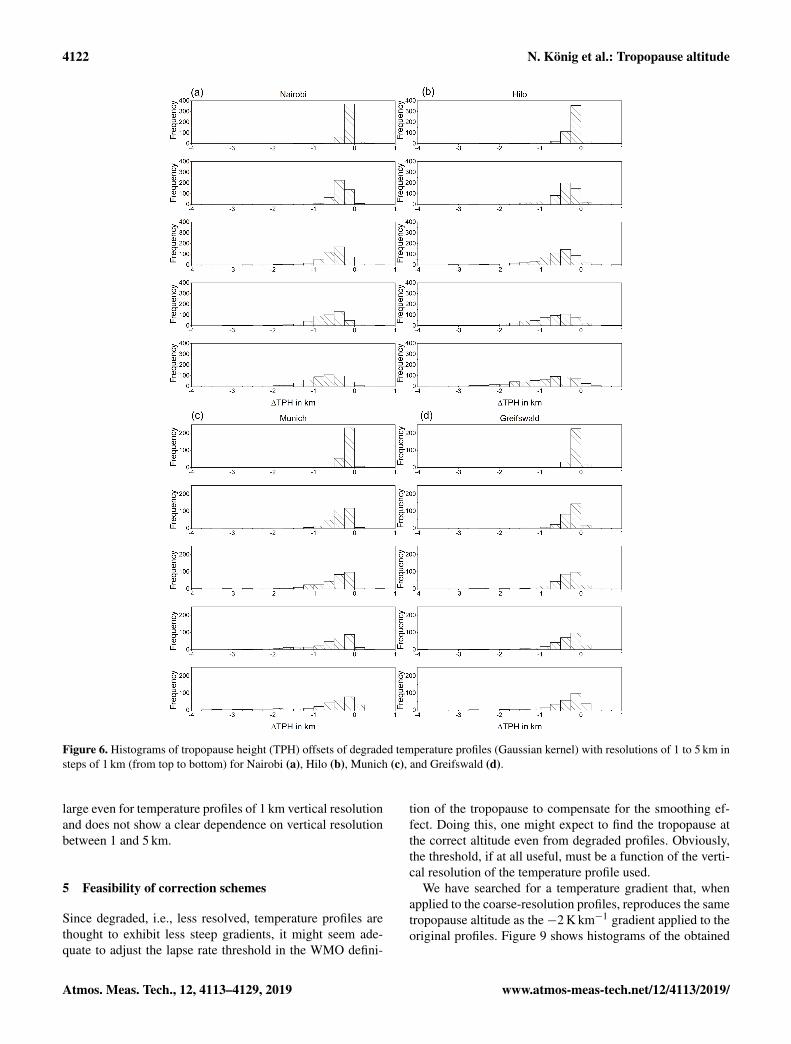
3.2 The cold point tropopause
In addition to the sensitivity of the lapse rate tropopause al-titude to the vertical resolution of the temperature profile,cold point tropopause altitudes were also investigated. AgainGaussian averaging kernels were assessed (Fig. 5).
Here, the degrading with the Gaussian kernel was per-formed directly on the radiosonde profiles on their originalgrids and the cold point tropopauses were determined. His-tograms of related tangent altitude displacements for resolu-tions from 1 to 5 km are shown in Fig. 6, while the depen-
www.atmos-meas-tech.net/12/4113/2019/ Atmos. Meas. Tech., 12, 4113–4129, 2019

4120 N. König et al.: Tropopause altitude
Table 3. Statistics for cold point tropopause displacements
Nairobi
Latitude 1.3◦ SLongitude 36.8◦ ESample size 452Years 2007–2018
Altitude Mean Standard Minimum Median Maximumresolution deviation deviation deviation deviation deviation(km) (km) (km) (km) (km) (km)
1.0 −0.16 0.13 −1.30 −0.15 0.432.0 −0.35 0.22 −1.65 −0.31 0.093.0 −0.51 0.34 −2.68 −0.46 0.594.0 −0.66 0.43 −3.20 −0.60 0.515.0 −0.75 0.47 −3.54 −0.69 0.29
Hilo
Latitude 19.4◦ NLongitude 155.4◦WSample size 540Years 2007–2018
Altitude Mean Standard Minimum Median Maximumresolution deviation deviation deviation deviation deviation(km) (km) (km) (km) (km) (km)
1.0 −0.18 0.31 −2.38 −0.16 2.052.0 −0.42 0.46 −3.16 −0.35 2.193.0 −0.61 0.55 −3.02 −0.51 1.614.0 −0.74 0.71 −4.72 −0.62 4.375.0 −0.87 0.77 −5.03 −0.71 2.47
Munich
Latitude 47.8◦ NLongitude 10.9◦ ESample size 297Years 2007–2018
Altitude Mean Standard Minimum Median Maximumresolution deviation deviation deviation deviation deviation(km) (km) (km) (km) (km) (km)
1.0 −0.15 0.18 −0.86 −0.14 2.242.0 −0.35 0.32 −3.40 −0.30 1.593.0 −0.53 0.56 −5.29 −0.37 0.674.0 −0.64 0.73 −4.80 −0.42 0.385.0 −0.71 0.97 −6.57 −0.39 2.01
Greifswald
Latitude 54.1◦ NLongitude 13.4◦ ESample size 275Years 2007–2018
Altitude Mean Standard Minimum Median Maximumresolution deviation deviation deviation deviation deviation(km) (km) (km) (km) (km) (km)
1.0 −0.14 0.10 −0.63 −0.14 0.102.0 −0.28 0.26 −0.25 −0.23 0.203.0 −0.39 0.47 −4.76 −0.28 0.214.0 −0.45 0.65 −6.95 −0.28 0.225.0 −0.46 0.77 −6.52 −0.25 0.98
Atmos. Meas. Tech., 12, 4113–4129, 2019 www.atmos-meas-tech.net/12/4113/2019/
N. König et al.: Tropopause altitude 4121
Figure 4. Averaging kernels of a MIPAS measurements nearNairobi on 3 August (a) and 23 September 2010 (b). The MIPASaltitude resolution is altitude dependent and varies between 2.7 and4.5 km below 22 km altitude, with typical values of around 3.0 km.To avoid overly busy plots, only every other averaging kernel isshown.
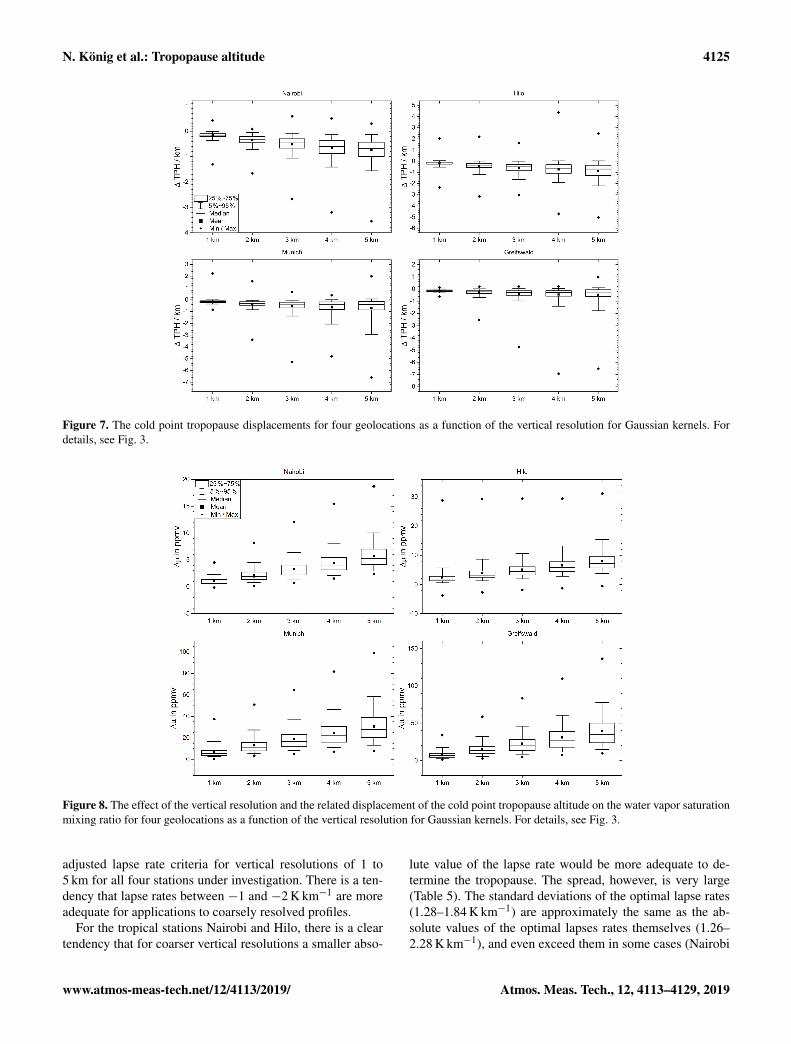
dence of the cold point tropopause altitude on the verticalresolution is shown in Fig. 7.
As for the lapse rate tropopause, the cold point tropopausealtitudes inferred from coarser resolved temperature profilesare also lower than those inferred from the original profiles(Table 3). For the tropical stations and resolutions under in-vestigation, the mean and median tropopause altitude dis-placement exceeds that of the lapse rate tropopause sizably.The only exception is the vertical resolution of 1 km. Herethe cold point tropopause appears to be less sensitive to thedegraded resolution than the lapse rate tropopause. For themidlatitudinal stations Munich and Greifswald the cold pointtropopause altitude is less sensitive to coarser resolutionsthan the lapse rate tropopause altitude in terms of the meandisplacement. For the median displacement no clear superi-ority of one of the tropopause definitions could be identified.
MIPAS atmospheric state data as retrieved with the proces-sor operated at the Institute of Meteorology and Climate Re-
Figure 5. An example of a radiosonde profile, Nairobi, 1.27◦ S,36.8◦ E, 7 July 2010, at original vertical resolution along with de-graded profiles at vertical resolutions of 1 to 5 km. Contrary to theexample shown in Fig. 1, the smoothed profile is represented on thenative radiosonde grid, not on the 1 km regular grid. For details, seeFig. 1.
search (IMK) in cooperation with the Instituto de Astrofísicade Andalucía (IAA) (von Clarmann et al., 2009) are rep-resented on a 1 km grid, and data of satellite instrumentsof similar vertical resolution are typically sampled on evencoarser grids. Determination of the cold point tropopause onsuch a grid would thus by far be dominated by sampling ef-fects. Tropopause shifts of a magnitude as determined withthe Gaussian kernel thus cannot be safely resolved.
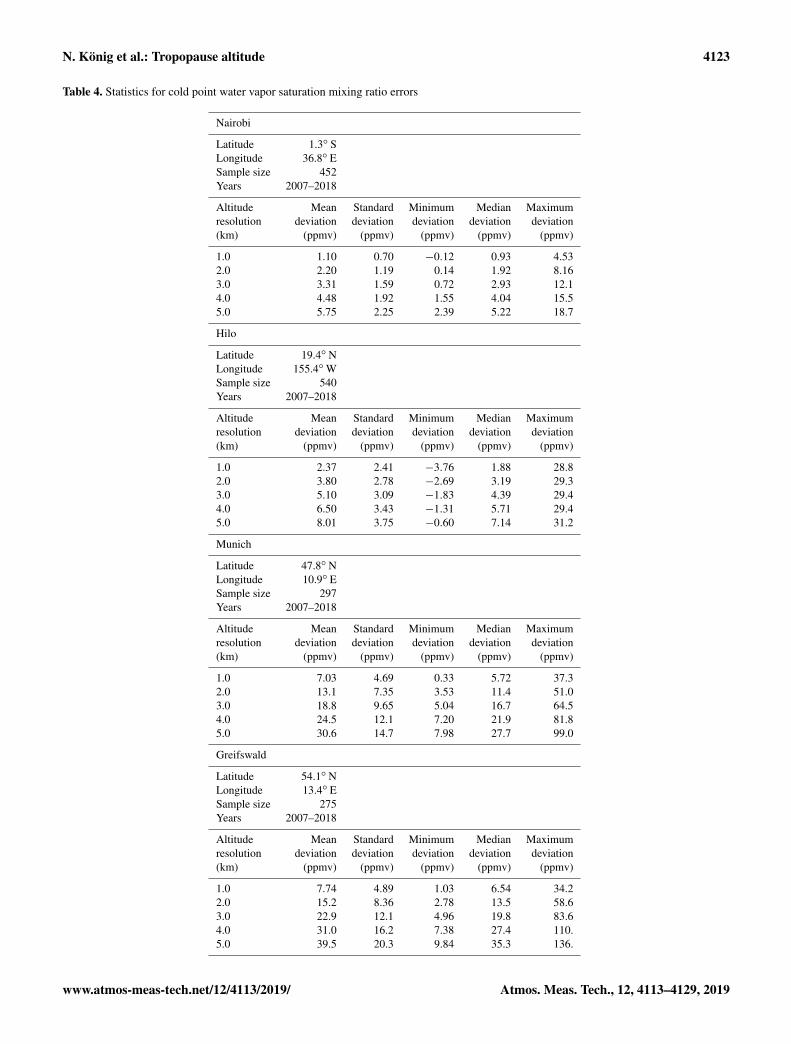
4 Implications for water vapor content
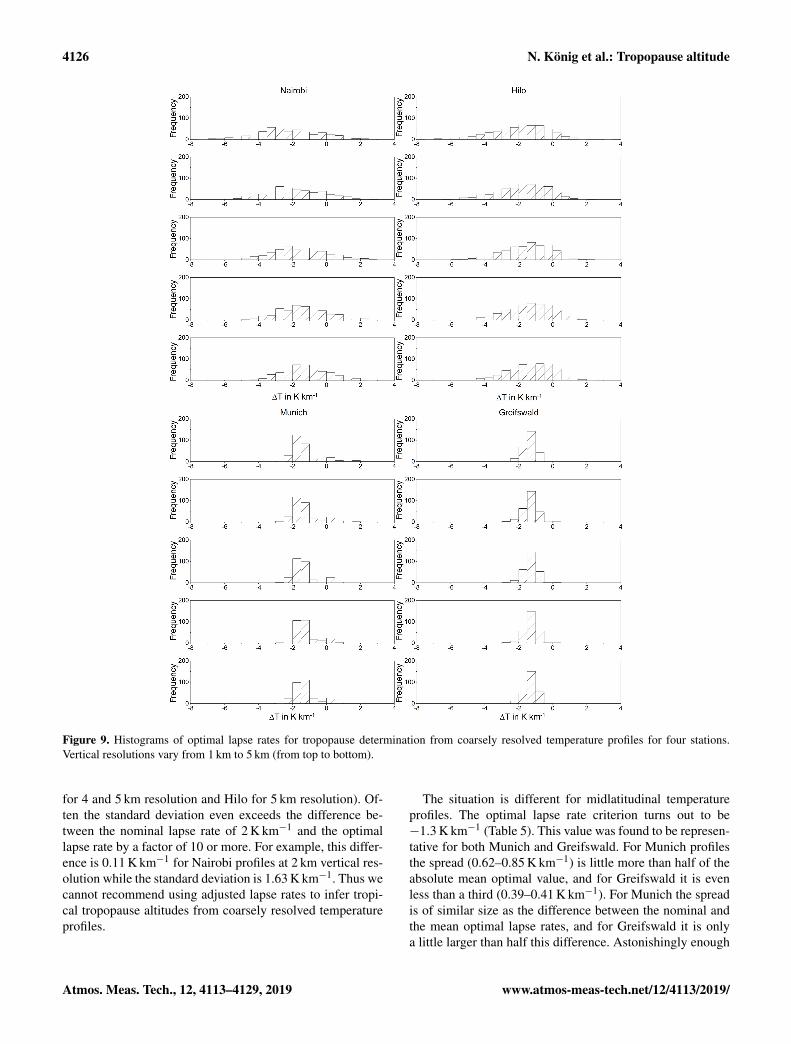
The cold point temperature largely determines the water va-por content of air entering the stratosphere. Thus, temper-ature profiles with finite vertical resolution affect the esti-mated saturation mixing ration of water vapor. For the trop-ical stations the related error in the saturation mixing rationseems to be fairly proportional to the vertical resolution. Rea-sonably good agreement between the mean and the medianerrors is found (Table 4 and Fig. 8). In the tropics, which arethe entry region of air into the stratosphere, the error in thesaturation mixing ratio in units of parts per million by vol-ume is about 1 or 2 times the resolution in kilometers. Forthe midlatitudinal stations the error is much larger, with ap-proximately 7 ppmv km−1 of vertical resolution. These largeerrors, however, are of little concern in a global context be-cause the midlatitudinal tropopause is not the preferred path-way of tropospheric air into the stratosphere. Admittedly, onsmaller scales other transport pathways may be relevant (An-derson et al., 2012). The tropical maritime station Hilo standsout in the sense that the range of differences between satura-tion mixing ratios inferred from the original temperature pro-file and those inferred from degraded temperature profiles is
www.atmos-meas-tech.net/12/4113/2019/ Atmos. Meas. Tech., 12, 4113–4129, 2019
4122 N. König et al.: Tropopause altitude
Figure 6. Histograms of tropopause height (TPH) offsets of degraded temperature profiles (Gaussian kernel) with resolutions of 1 to 5 km insteps of 1 km (from top to bottom) for Nairobi (a), Hilo (b), Munich (c), and Greifswald (d).
large even for temperature profiles of 1 km vertical resolutionand does not show a clear dependence on vertical resolutionbetween 1 and 5 km.
5 Feasibility of correction schemes
Since degraded, i.e., less resolved, temperature profiles arethought to exhibit less steep gradients, it might seem ade-quate to adjust the lapse rate threshold in the WMO defini-
tion of the tropopause to compensate for the smoothing ef-fect. Doing this, one might expect to find the tropopause atthe correct altitude even from degraded profiles. Obviously,the threshold, if at all useful, must be a function of the verti-cal resolution of the temperature profile used.
We have searched for a temperature gradient that, whenapplied to the coarse-resolution profiles, reproduces the sametropopause altitude as the −2 K km−1 gradient applied to theoriginal profiles. Figure 9 shows histograms of the obtained
Atmos. Meas. Tech., 12, 4113–4129, 2019 www.atmos-meas-tech.net/12/4113/2019/
N. König et al.: Tropopause altitude 4123
Table 4. Statistics for cold point water vapor saturation mixing ratio errors
Nairobi
Latitude 1.3◦ SLongitude 36.8◦ ESample size 452Years 2007–2018
Altitude Mean Standard Minimum Median Maximumresolution deviation deviation deviation deviation deviation(km) (ppmv) (ppmv) (ppmv) (ppmv) (ppmv)
1.0 1.10 0.70 −0.12 0.93 4.532.0 2.20 1.19 0.14 1.92 8.163.0 3.31 1.59 0.72 2.93 12.14.0 4.48 1.92 1.55 4.04 15.55.0 5.75 2.25 2.39 5.22 18.7
Hilo
Latitude 19.4◦ NLongitude 155.4◦WSample size 540Years 2007–2018
Altitude Mean Standard Minimum Median Maximumresolution deviation deviation deviation deviation deviation(km) (ppmv) (ppmv) (ppmv) (ppmv) (ppmv)
1.0 2.37 2.41 −3.76 1.88 28.82.0 3.80 2.78 −2.69 3.19 29.33.0 5.10 3.09 −1.83 4.39 29.44.0 6.50 3.43 −1.31 5.71 29.45.0 8.01 3.75 −0.60 7.14 31.2
Munich
Latitude 47.8◦ NLongitude 10.9◦ ESample size 297Years 2007–2018
Altitude Mean Standard Minimum Median Maximumresolution deviation deviation deviation deviation deviation(km) (ppmv) (ppmv) (ppmv) (ppmv) (ppmv)
1.0 7.03 4.69 0.33 5.72 37.32.0 13.1 7.35 3.53 11.4 51.03.0 18.8 9.65 5.04 16.7 64.54.0 24.5 12.1 7.20 21.9 81.85.0 30.6 14.7 7.98 27.7 99.0
Greifswald
Latitude 54.1◦ NLongitude 13.4◦ ESample size 275Years 2007–2018
Altitude Mean Standard Minimum Median Maximumresolution deviation deviation deviation deviation deviation(km) (ppmv) (ppmv) (ppmv) (ppmv) (ppmv)
1.0 7.74 4.89 1.03 6.54 34.22.0 15.2 8.36 2.78 13.5 58.63.0 22.9 12.1 4.96 19.8 83.64.0 31.0 16.2 7.38 27.4 110.5.0 39.5 20.3 9.84 35.3 136.
www.atmos-meas-tech.net/12/4113/2019/ Atmos. Meas. Tech., 12, 4113–4129, 2019
4124 N. König et al.: Tropopause altitude
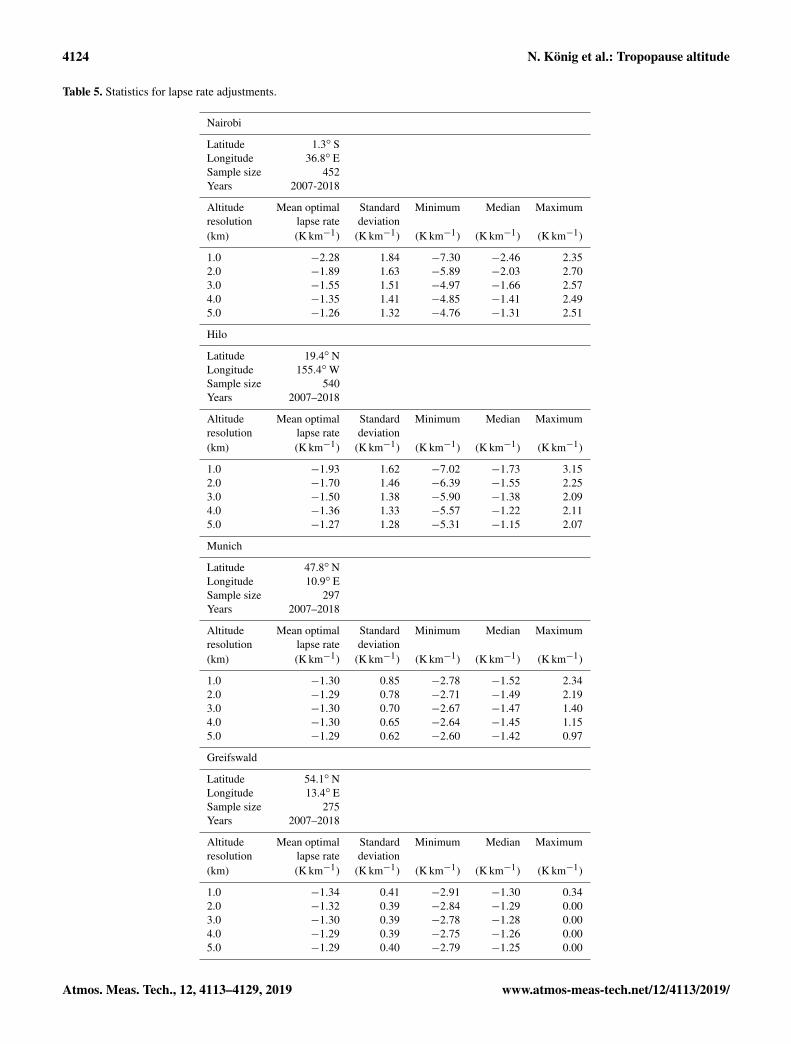
Table 5. Statistics for lapse rate adjustments.
Nairobi
Latitude 1.3◦ SLongitude 36.8◦ ESample size 452Years 2007-2018
Altitude Mean optimal Standard Minimum Median Maximumresolution lapse rate deviation(km) (K km−1) (K km−1) (K km−1) (K km−1) (K km−1)
1.0 −2.28 1.84 −7.30 −2.46 2.352.0 −1.89 1.63 −5.89 −2.03 2.703.0 −1.55 1.51 −4.97 −1.66 2.574.0 −1.35 1.41 −4.85 −1.41 2.495.0 −1.26 1.32 −4.76 −1.31 2.51
Hilo
Latitude 19.4◦ NLongitude 155.4◦WSample size 540Years 2007–2018
Altitude Mean optimal Standard Minimum Median Maximumresolution lapse rate deviation(km) (K km−1) (K km−1) (K km−1) (K km−1) (K km−1)
1.0 −1.93 1.62 −7.02 −1.73 3.152.0 −1.70 1.46 −6.39 −1.55 2.253.0 −1.50 1.38 −5.90 −1.38 2.094.0 −1.36 1.33 −5.57 −1.22 2.115.0 −1.27 1.28 −5.31 −1.15 2.07
Munich
Latitude 47.8◦ NLongitude 10.9◦ ESample size 297Years 2007–2018
Altitude Mean optimal Standard Minimum Median Maximumresolution lapse rate deviation(km) (K km−1) (K km−1) (K km−1) (K km−1) (K km−1)
1.0 −1.30 0.85 −2.78 −1.52 2.342.0 −1.29 0.78 −2.71 −1.49 2.193.0 −1.30 0.70 −2.67 −1.47 1.404.0 −1.30 0.65 −2.64 −1.45 1.155.0 −1.29 0.62 −2.60 −1.42 0.97
Greifswald
Latitude 54.1◦ NLongitude 13.4◦ ESample size 275Years 2007–2018
Altitude Mean optimal Standard Minimum Median Maximumresolution lapse rate deviation(km) (K km−1) (K km−1) (K km−1) (K km−1) (K km−1)
1.0 −1.34 0.41 −2.91 −1.30 0.342.0 −1.32 0.39 −2.84 −1.29 0.003.0 −1.30 0.39 −2.78 −1.28 0.004.0 −1.29 0.39 −2.75 −1.26 0.005.0 −1.29 0.40 −2.79 −1.25 0.00
Atmos. Meas. Tech., 12, 4113–4129, 2019 www.atmos-meas-tech.net/12/4113/2019/
N. König et al.: Tropopause altitude 4125
Figure 7. The cold point tropopause displacements for four geolocations as a function of the vertical resolution for Gaussian kernels. Fordetails, see Fig. 3.
Figure 8. The effect of the vertical resolution and the related displacement of the cold point tropopause altitude on the water vapor saturationmixing ratio for four geolocations as a function of the vertical resolution for Gaussian kernels. For details, see Fig. 3.
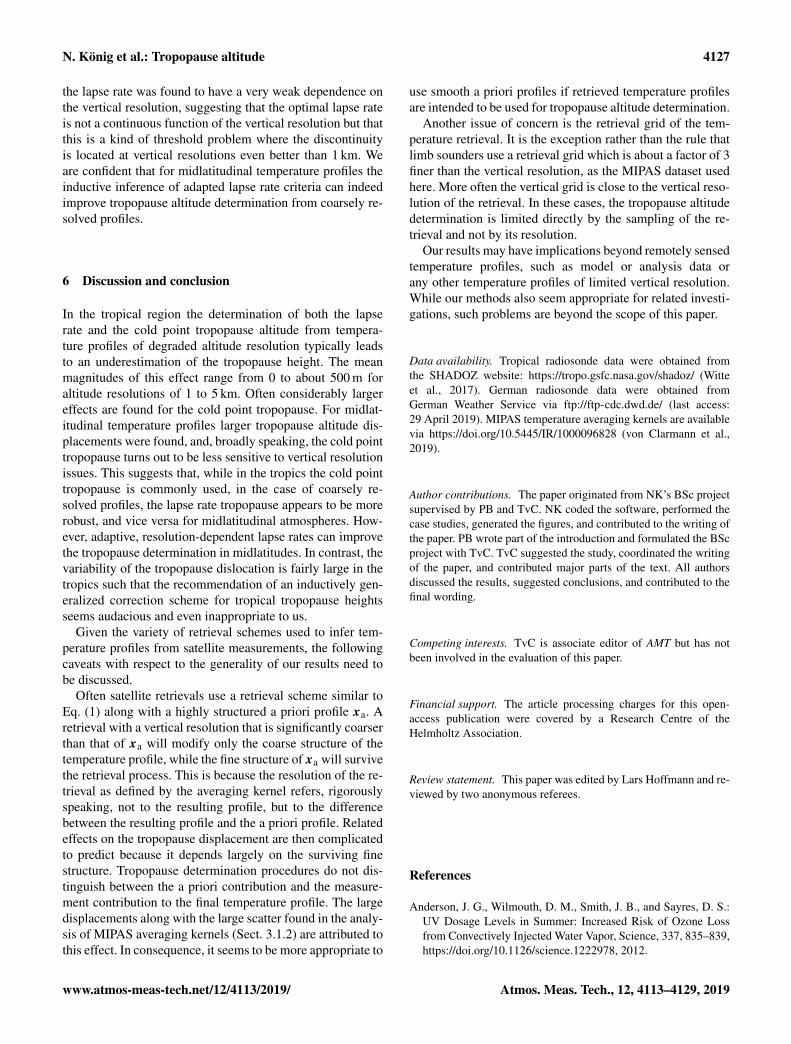
adjusted lapse rate criteria for vertical resolutions of 1 to5 km for all four stations under investigation. There is a ten-dency that lapse rates between −1 and −2 K km−1 are moreadequate for applications to coarsely resolved profiles.
For the tropical stations Nairobi and Hilo, there is a cleartendency that for coarser vertical resolutions a smaller abso-
lute value of the lapse rate would be more adequate to de-termine the tropopause. The spread, however, is very large(Table 5). The standard deviations of the optimal lapse rates(1.28–1.84 K km−1) are approximately the same as the ab-solute values of the optimal lapses rates themselves (1.26–2.28 K km−1), and even exceed them in some cases (Nairobi
www.atmos-meas-tech.net/12/4113/2019/ Atmos. Meas. Tech., 12, 4113–4129, 2019
4126 N. König et al.: Tropopause altitude
Figure 9. Histograms of optimal lapse rates for tropopause determination from coarsely resolved temperature profiles for four stations.Vertical resolutions vary from 1 km to 5 km (from top to bottom).
for 4 and 5 km resolution and Hilo for 5 km resolution). Of-ten the standard deviation even exceeds the difference be-tween the nominal lapse rate of 2 K km−1 and the optimallapse rate by a factor of 10 or more. For example, this differ-ence is 0.11 K km−1 for Nairobi profiles at 2 km vertical res-olution while the standard deviation is 1.63 K km−1. Thus wecannot recommend using adjusted lapse rates to infer tropi-cal tropopause altitudes from coarsely resolved temperatureprofiles.
The situation is different for midlatitudinal temperatureprofiles. The optimal lapse rate criterion turns out to be−1.3 K km−1 (Table 5). This value was found to be represen-tative for both Munich and Greifswald. For Munich profilesthe spread (0.62–0.85 K km−1) is little more than half of theabsolute mean optimal value, and for Greifswald it is evenless than a third (0.39–0.41 K km−1). For Munich the spreadis of similar size as the difference between the nominal andthe mean optimal lapse rates, and for Greifswald it is onlya little larger than half this difference. Astonishingly enough
Atmos. Meas. Tech., 12, 4113–4129, 2019 www.atmos-meas-tech.net/12/4113/2019/
N. König et al.: Tropopause altitude 4127
the lapse rate was found to have a very weak dependence onthe vertical resolution, suggesting that the optimal lapse rateis not a continuous function of the vertical resolution but thatthis is a kind of threshold problem where the discontinuityis located at vertical resolutions even better than 1 km. Weare confident that for midlatitudinal temperature profiles theinductive inference of adapted lapse rate criteria can indeedimprove tropopause altitude determination from coarsely re-solved profiles.
6 Discussion and conclusion
In the tropical region the determination of both the lapserate and the cold point tropopause altitude from tempera-ture profiles of degraded altitude resolution typically leadsto an underestimation of the tropopause height. The meanmagnitudes of this effect range from 0 to about 500 m foraltitude resolutions of 1 to 5 km. Often considerably largereffects are found for the cold point tropopause. For midlat-itudinal temperature profiles larger tropopause altitude dis-placements were found, and, broadly speaking, the cold pointtropopause turns out to be less sensitive to vertical resolutionissues. This suggests that, while in the tropics the cold pointtropopause is commonly used, in the case of coarsely re-solved profiles, the lapse rate tropopause appears to be morerobust, and vice versa for midlatitudinal atmospheres. How-ever, adaptive, resolution-dependent lapse rates can improvethe tropopause determination in midlatitudes. In contrast, thevariability of the tropopause dislocation is fairly large in thetropics such that the recommendation of an inductively gen-eralized correction scheme for tropical tropopause heightsseems audacious and even inappropriate to us.
Given the variety of retrieval schemes used to infer tem-perature profiles from satellite measurements, the followingcaveats with respect to the generality of our results need tobe discussed.
Often satellite retrievals use a retrieval scheme similar toEq. (1) along with a highly structured a priori profile xa. Aretrieval with a vertical resolution that is significantly coarserthan that of xa will modify only the coarse structure of thetemperature profile, while the fine structure of xa will survivethe retrieval process. This is because the resolution of the re-trieval as defined by the averaging kernel refers, rigorouslyspeaking, not to the resulting profile, but to the differencebetween the resulting profile and the a priori profile. Relatedeffects on the tropopause displacement are then complicatedto predict because it depends largely on the surviving finestructure. Tropopause determination procedures do not dis-tinguish between the a priori contribution and the measure-ment contribution to the final temperature profile. The largedisplacements along with the large scatter found in the analy-sis of MIPAS averaging kernels (Sect. 3.1.2) are attributed tothis effect. In consequence, it seems to be more appropriate to
use smooth a priori profiles if retrieved temperature profilesare intended to be used for tropopause altitude determination.
Another issue of concern is the retrieval grid of the tem-perature retrieval. It is the exception rather than the rule thatlimb sounders use a retrieval grid which is about a factor of 3finer than the vertical resolution, as the MIPAS dataset usedhere. More often the vertical grid is close to the vertical reso-lution of the retrieval. In these cases, the tropopause altitudedetermination is limited directly by the sampling of the re-trieval and not by its resolution.
Our results may have implications beyond remotely sensedtemperature profiles, such as model or analysis data orany other temperature profiles of limited vertical resolution.While our methods also seem appropriate for related investi-gations, such problems are beyond the scope of this paper.
Data availability. Tropical radiosonde data were obtained fromthe SHADOZ website: https://tropo.gsfc.nasa.gov/shadoz/ (Witteet al., 2017). German radiosonde data were obtained fromGerman Weather Service via ftp://ftp-cdc.dwd.de/ (last access:29 April 2019). MIPAS temperature averaging kernels are availablevia https://doi.org/10.5445/IR/1000096828 (von Clarmann et al.,2019).
Author contributions. The paper originated from NK’s BSc projectsupervised by PB and TvC. NK coded the software, performed thecase studies, generated the figures, and contributed to the writing ofthe paper. PB wrote part of the introduction and formulated the BScproject with TvC. TvC suggested the study, coordinated the writingof the paper, and contributed major parts of the text. All authorsdiscussed the results, suggested conclusions, and contributed to thefinal wording.
Competing interests. TvC is associate editor of AMT but has notbeen involved in the evaluation of this paper.
Financial support. The article processing charges for this open-access publication were covered by a Research Centre of theHelmholtz Association.
Review statement. This paper was edited by Lars Hoffmann and re-viewed by two anonymous referees.
References
Anderson, J. G., Wilmouth, D. M., Smith, J. B., and Sayres, D. S.:UV Dosage Levels in Summer: Increased Risk of Ozone Lossfrom Convectively Injected Water Vapor, Science, 337, 835–839,https://doi.org/10.1126/science.1222978, 2012.
www.atmos-meas-tech.net/12/4113/2019/ Atmos. Meas. Tech., 12, 4113–4129, 2019
4128 N. König et al.: Tropopause altitude
Birner, T.: Fine-scale structure of the extratropicaltropopause region, J. Geophys. Res., 111, D04104,https://doi.org/10.1029/2005JD006301, 2006.
Dee, D. P., Uppala, S. M., Simmons, A. J., Berrisford, P., Poli,P., Kobayashi, S., Andrae, U., Balmaseda, M. A., Balsamo, G.,Bauer, P., Bechtold, P., Beljaars, A. C. M., van de Berg, L., Bid-lot, J., Bormann, N., Delsol, C., Dragani, R., Fuentes, M., Geer,A. J., Haimberger, L., Healy, S. B., Hersbach, H., Hólm, E. V.,Isaksen, L., Kållberg, P., Köhler, M., Matricardi, M., McNally,A. P., Monge-Sanz, B. M., Morcrette, J.-J., Park, B.-K., Peubey,C., de Rosnay, P., Tavolato, C., Thiépaut, J.-N., and Vitart, F.:The ERA-Interim reanalysis: configuration and performance ofthe data assimilation system, Q. J. Roy. Meteor. Soc., 137, 553–597, https://doi.org/10.1002/qj.828, 2011.
Dines, W. H.: The characteristics of the free atmosphere, in: Geo-physical Memoirs, Meteorological Office, London, 13, 47–76,1919.
Fischer, H., Birk, M., Blom, C., Carli, B., Carlotti, M., von Clar-mann, T., Delbouille, L., Dudhia, A., Ehhalt, D., Endemann, M.,Flaud, J. M., Gessner, R., Kleinert, A., Koopman, R., Langen,J., López-Puertas, M., Mosner, P., Nett, H., Oelhaf, H., Perron,G., Remedios, J., Ridolfi, M., Stiller, G., and Zander, R.: MI-PAS: an instrument for atmospheric and climate research, Atmos.Chem. Phys., 8, 2151–2188, https://doi.org/10.5194/acp-8-2151-2008, 2008.
Fueglistaler, S., Dessler, A. E., Dunkerton, T. J., Folkins, I., Fu, Q.,and Mote, P. W.: Tropical Tropopause Layer, Rev. Geophys., 47,RG1004, https://doi.org/10.1029/2008RG000267, 2009.
Hoerling, M. P., Schaack, T. K., and Lenzen, A. J.: Global objectivetropopause analysis, Mon. Weather Rev., 119, 1816–1831, 1991.
Hoinka, K. P.: The Tropopause: Discovery, Defini-tion and Demarcation, Meteorol. Z., 6, 281–303,https://doi.org/10.1127/metz/6/1997/281, 1997.
Kim, J. and Son, S.-W.: Tropical Cold-Point Tropopause: Climatol-ogy, Seasonal Cycle, and Intraseasonal Variability Derived fromCOSMIC GPS Radio Occultation Measurements, J. Climate, 25,5343–5360, https://doi.org/10.1175/JCLI-D-11-00554.1, 2012.
Pan, L. L. and Munchak, L. A.: Relationship of cloud top to thetropopause and jet structure from CALIPSO data, J. Geophys.Res., 116, D12202, https://doi.org/10.1029/2010JD015462,2011.
Pan, L. L., Randel, W. J., Gary, B. L., Mahoney, M. J., andHintsa, E. J.: Definitions and sharpness of the extratropicaltropopause: A trace gas perspective, J. Geophys. Res., 109,D23103, https://doi.org/10.1029/2004JD004982, 2004.
Peevey, T. R., Gille, J. C., Randall, C. E., and Kunz, A.: In-vestigation of double tropopause spatial and temporal globalvariability utilizing High Resolution Dynamics Limb Soundertemperature observations, J. Geophys. Res., 117, D01105,https://doi.org/10.1029/2011JD016443„ 2012.
Reichler, T., Dameris, M., and Sausen, R.: Determining thetropopause height from gridded data, Geophys. Res. Lett., 30,2042, https://doi.org/10.1029/2003GL018240, 2003.
Riese, M., Ploeger, F., Rap, A., Vogel, B., Konopka, P.,Dameris, M., and Forster, P.: Impact of uncertainties ofatmospheric mixing on simulated UTLS composition andrelated radiative effects, J. Geophys. Res., 117, D16305,https://doi.org/10.1029/2012JD017751, 2012.
Rodgers, C. D.: Inverse Methods for Atmospheric Sounding: The-ory and Practice, vol. 2 of Series on Atmospheric, Oceanic andPlanetary Physics, edited by: Taylor, F. W., World Scientific, Sin-gapore, New Jersey, London, Hong Kong, 2000.
Spang, R., Günther, G., Riese, M., Hoffmann, L., Müller, R., andGriessbach, S.: Satellite observations of cirrus clouds in theNorthern Hemisphere lowermost stratosphere, Atmos. Chem.Phys., 15, 927–950, https://doi.org/10.5194/acp-15-927-2015,2015.
Steck, T. and von Clarmann, T.: Constrained profile retrieval ap-plied to the observation mode of the Michelson Interferometerfor Passive Atmospheric Sounding, Appl. Opt., 40, 3559–3571,2001.
Thompson, A. M., Witte, J. C., Sterling, C., Jordan, A., Johnson,B. J., Oltmans, S. J., Fujiwara, M., Vömel, H., Allaart, M.,Piters, A., Coetzee, G. J. R., Posny, F., Corrales, E., Diaz, J. A.,Félix, C., Komala, N., Lai, N., Nguyen, H. T. A., Maata, M.,Mani, F., Zainal, Z., Ogino, S., Paredes, F., Penha, T. L. B.,da Silva, F. R., Sallons-Mitro, S., Selkirk, H. B., Schmidlin,F. J., Stübi, R., and Thiongo, K.: First reprocessing of South-ern Hemisphere Additional Ozonesondes (SHADOZ) ozone pro-files (1998–2016): 2. Comparisons with satellites and ground-based instruments, J. Geophys. Res.-Atmos., 122, 13000–13025,https://doi.org/10.1002/2017JD027406, 2017.
Tilmes, S., Pan, L. L., Hoor, P., Atlas, E., Avery, M. A., Cam-pos, T., Christensen, L. E., Diskin, G. S., Gao, R.-S., Herman,R. L., Hintsa, E. J., Loewenstein, M., Lopez, J., Paige, M. E.,Pittman, J. V., Podolske, J. R., Proffitt, M. R., Sachse, G. W.,Schiller, C., Schlager, H., Smith, J., Spelten, N., Webster, C.,Weinheimer, A., and Zondlo, M. A.: An aircraft-based uppertroposphere lower stratosphere O3, CO, and H2O climatologyfor the Northern Hemisphere, J. Geophys. Res., 115, D14303,https://doi.org/10.1029/2009JD012731, 2010.
Tuck, A. F., Baumgardner, D., Chan, K. R., Dye, J. E., Elkins, J. W.,Hovde, S. J., Kelly, K. K., Loewenstein, M., Margitan, J. J., May,R. D., Podolske, J. R., Proffitt, M. H., Rosenlof, K. H., Smith,W. L., Webster, C. R., and Wilson, J. C.: The Brewer-DobsonCirculation In the Light of High Altitude In Situ Aircraft Obser-vations, Q. J. Roy. Meteor. Soc., 123, 1–69, 1997.
von Clarmann, T., Ceccherini, S., Doicu, A., Dudhia, A.,Funke, B., Grabowski, U., Hilgers, S., Jay, V., Linden, A.,López-Puertas, M., Martín-Torres, F.-J., Payne, V., Reburn,J., Ridolfi, M., Schreier, F., Schwarz, G., Siddans, R., andSteck, T.: A blind test retrieval experiment for infraredlimb emission spectrometry, J. Geophys. Res., 108, 4746,https://doi.org/10.1029/2003JD003835, 2003a.
von Clarmann, T., Glatthor, N., Grabowski, U., Höpfner, M., Kell-mann, S., Kiefer, M., Linden, A., Mengistu Tsidu, G., Milz,M., Steck, T., Stiller, G. P., Wang, D. Y., Fischer, H., Funke,B., Gil-López, S., and López-Puertas, M.: Retrieval of temper-ature and tangent altitude pointing from limb emission spectrarecorded from space by the Michelson Interferometer for PassiveAtmospheric Sounding (MIPAS), J. Geophys. Res., 108, 4736,https://doi.org/10.1029/2003JD003602, 2003b.
von Clarmann, T., Höpfner, M., Kellmann, S., Linden, A., Chauhan,S., Funke, B., Grabowski, U., Glatthor, N., Kiefer, M., Schiefer-decker, T., Stiller, G. P., and Versick, S.: Retrieval of temperature,H2O, O3, HNO3, CH4, N2O, ClONO2 and ClO from MIPASreduced resolution nominal mode limb emission measurements,
Atmos. Meas. Tech., 12, 4113–4129, 2019 www.atmos-meas-tech.net/12/4113/2019/
N. König et al.: Tropopause altitude 4129
Atmos. Meas. Tech., 2, 159–175, https://doi.org/10.5194/amt-2-159-2009, 2009.
von Clarmann, T., Höpfner, M., Kellmann, S., Linden, A.,Funke, B., Grabowski, U., Glatthor, N., Kiefer, M., andStiller, G. P.: MIPAS temperature averaging kernels,https://doi.org/10.5445/IR/1000096828, 2019.
Witte, J. C., Thompson, A. M., Smit, H. G. J., Fujiwara, M.,Posny, F., Coetzee, G. J. R., Northam, E. T., Johnson, B. J.,Sterling, C. W., Mohamad, M., Ogino, S.-Y., Jordan, A., andda Silva, F. R.: First reprocessing of Southern HemisphereADditional OZonesondes (SHADOZ) profile records (1998–2015): 1. Methodology and evaluation, J. Geophys. Res.-Atmos.,122, 6611–6636, https://doi.org/10.1002/2016JD026403, 2017(data available at: https://tropo.gsfc.nasa.gov/shadoz/, last ac-cess: 29 April 2019).
World Meteorological Organization: Definition of the tropopause,Bulletin of the World Meteorological Organization, 6, 136–137,1957.
World Meteorological Organization: International MeteorologicalVocabulary, Secretariat of the World Meteorological Organiza-tion, Geneve, 2nd edn., 1992.
www.atmos-meas-tech.net/12/4113/2019/ Atmos. Meas. Tech., 12, 4113–4129, 2019
Related Documents