Citation: Odu-Onikosi, A.; Herckes, P.; Fraser, M.; Hopke, P.; Ondov, J.; Solomon, P.A.; Popoola, O.; Hidy, G.M. Tropical Air Chemistry in Lagos, Nigeria. Atmosphere 2022, 13, 1059. https://doi.org/10.3390/ atmos13071059 Academic Editor: James Lee Received: 30 May 2022 Accepted: 30 June 2022 Published: 3 July 2022 Publisher’s Note: MDPI stays neutral with regard to jurisdictional claims in published maps and institutional affil- iations. Copyright: © 2022 by the authors. Licensee MDPI, Basel, Switzerland. This article is an open access article distributed under the terms and conditions of the Creative Commons Attribution (CC BY) license (https:// creativecommons.org/licenses/by/ 4.0/). atmosphere Article Tropical Air Chemistry in Lagos, Nigeria Adebola Odu-Onikosi 1 , Pierre Herckes 2 , Matthew Fraser 3 , Philip Hopke 4 , John Ondov 5 , Paul A. Solomon 6 , Olalekan Popoola 7 and George M. Hidy 8, * 1 EnvironQuest, Lagos 102273, Nigeria; [email protected] 2 School of Molecular Sciences, Arizona State University, Tempe, AZ 85287-1604, USA; [email protected] 3 School of Sustainable Engineering and the Built Environment, Arizona State University, Tempe, AZ 85287-3005, USA; [email protected] 4 Department of Public Health, University of Rochester, Rochester, NY 14642, USA; [email protected] 5 Chemistry Department, University of Maryland, College Park, MD 20742, USA; [email protected] 6 Independent Researcher, Henderson, NV 89052, USA; [email protected] 7 Yusuf Hamied Department of Chemistry, Cambridge University, Cambridge CB2 1EW, UK; [email protected] 8 Envair/Aerochem, Placitas, NM 87043, USA * Correspondence: [email protected]; Tel.: +1-505-771-4082 Abstract: The Nigerian city of Lagos experiences severe air pollution as a result of emissions and subsequent atmospheric photochemistry and aerosol chemistry. A year-long study, between August 2020 and July 2021, included measurements of gas-phase and aerosol processes, with surface meteo- rology at six urban sites. The sites were selected to represent near seacoast conditions, urban sites, and inland locations near agricultural and grassland ecosystems. The observations included continu- ous concentrations for CO, SO 2 , NO x ,O 3 , PM 2.5 , and PM 10 . Samples were collected and analyzed for speciated volatile organic compounds (VOCs) and particulate chemical composition including inorganic and organic chemical species. The average diel variations in concentrations indicated well-known local photochemistry resulting from the presence of combustion sources, including motor vehicles, petroleum production and use, and open burning. The annual diel characteristics were emission-dependent and were modulated by meteorological variability, including the sea breeze and the seasonal changes associated with monsoons and Harmattan winds. Gases and particulate matter varied daily, consistent with the onset of source activities during the day. Fine particles less than 2.5 μm in diameter (PM 2.5 ) included both primary particles from emission sources and secondary particles produced in the atmosphere by photochemical reactions. Importantly, particle sources included a large component of dust and carbonaceous material. For the latter, there was evidence that particle concentrations were dominated by primary sources, with little secondary material formed in the atmosphere. From complementary measurements, there were occasions when regional chemical processes affected the local conditions, including transportation, industry, commercial activity, and open waste burning. Keywords: Lagos; Nigeria; air pollutants; atmospheric chemistry; low-cost sensors 1. Introduction Atmospheric chemistry within the planetary boundary layer in urban environments is a special area of investigation of near-surface tropospheric phenomena. More interest in this subject came about from rising environmental exposure to air pollution following the industrial revolution and the Second World War. Most of the knowledge of urban air chemistry is drawn from studies in the mid-latitude, high-income countries. Comparable research in tropical regions, particularly in sub-Saharan Africa, is limited. An increasing number of atmospheric studies in Nigeria, Africa’s most populous country, have been reported since the early 2000s, for example [1,2]. These have concentrated on regional population centers around the oil-producing Niger River Delta region. The studies have reported ambient data for airborne particles and for commonly monitored gases: carbon Atmosphere 2022, 13, 1059. https://doi.org/10.3390/atmos13071059 https://www.mdpi.com/journal/atmosphere

Welcome message from author
This document is posted to help you gain knowledge. Please leave a comment to let me know what you think about it! Share it to your friends and learn new things together.
Transcript

Citation: Odu-Onikosi, A.; Herckes,
P.; Fraser, M.; Hopke, P.; Ondov, J.;
Solomon, P.A.; Popoola, O.; Hidy,
G.M. Tropical Air Chemistry in
Lagos, Nigeria. Atmosphere 2022, 13,
1059. https://doi.org/10.3390/
atmos13071059
Academic Editor: James Lee
Received: 30 May 2022
Accepted: 30 June 2022
Published: 3 July 2022
Publisher’s Note: MDPI stays neutral
with regard to jurisdictional claims in
published maps and institutional affil-
iations.
Copyright: © 2022 by the authors.
Licensee MDPI, Basel, Switzerland.
This article is an open access article
distributed under the terms and
conditions of the Creative Commons
Attribution (CC BY) license (https://
creativecommons.org/licenses/by/
4.0/).
atmosphere
Article
Tropical Air Chemistry in Lagos, NigeriaAdebola Odu-Onikosi 1, Pierre Herckes 2 , Matthew Fraser 3, Philip Hopke 4 , John Ondov 5, Paul A. Solomon 6,Olalekan Popoola 7 and George M. Hidy 8,*
1 EnvironQuest, Lagos 102273, Nigeria; [email protected] School of Molecular Sciences, Arizona State University, Tempe, AZ 85287-1604, USA; [email protected] School of Sustainable Engineering and the Built Environment, Arizona State University,
Tempe, AZ 85287-3005, USA; [email protected] Department of Public Health, University of Rochester, Rochester, NY 14642, USA; [email protected] Chemistry Department, University of Maryland, College Park, MD 20742, USA; [email protected] Independent Researcher, Henderson, NV 89052, USA; [email protected] Yusuf Hamied Department of Chemistry, Cambridge University, Cambridge CB2 1EW, UK; [email protected] Envair/Aerochem, Placitas, NM 87043, USA* Correspondence: [email protected]; Tel.: +1-505-771-4082
Abstract: The Nigerian city of Lagos experiences severe air pollution as a result of emissions andsubsequent atmospheric photochemistry and aerosol chemistry. A year-long study, between August2020 and July 2021, included measurements of gas-phase and aerosol processes, with surface meteo-rology at six urban sites. The sites were selected to represent near seacoast conditions, urban sites,and inland locations near agricultural and grassland ecosystems. The observations included continu-ous concentrations for CO, SO2, NOx, O3, PM2.5, and PM10. Samples were collected and analyzedfor speciated volatile organic compounds (VOCs) and particulate chemical composition includinginorganic and organic chemical species. The average diel variations in concentrations indicatedwell-known local photochemistry resulting from the presence of combustion sources, including motorvehicles, petroleum production and use, and open burning. The annual diel characteristics wereemission-dependent and were modulated by meteorological variability, including the sea breeze andthe seasonal changes associated with monsoons and Harmattan winds. Gases and particulate mattervaried daily, consistent with the onset of source activities during the day. Fine particles less than2.5 µm in diameter (PM2.5) included both primary particles from emission sources and secondaryparticles produced in the atmosphere by photochemical reactions. Importantly, particle sourcesincluded a large component of dust and carbonaceous material. For the latter, there was evidence thatparticle concentrations were dominated by primary sources, with little secondary material formed inthe atmosphere. From complementary measurements, there were occasions when regional chemicalprocesses affected the local conditions, including transportation, industry, commercial activity, andopen waste burning.
Keywords: Lagos; Nigeria; air pollutants; atmospheric chemistry; low-cost sensors
1. Introduction
Atmospheric chemistry within the planetary boundary layer in urban environmentsis a special area of investigation of near-surface tropospheric phenomena. More interestin this subject came about from rising environmental exposure to air pollution followingthe industrial revolution and the Second World War. Most of the knowledge of urban airchemistry is drawn from studies in the mid-latitude, high-income countries. Comparableresearch in tropical regions, particularly in sub-Saharan Africa, is limited. An increasingnumber of atmospheric studies in Nigeria, Africa’s most populous country, have beenreported since the early 2000s, for example [1,2]. These have concentrated on regionalpopulation centers around the oil-producing Niger River Delta region. The studies havereported ambient data for airborne particles and for commonly monitored gases: carbon
Atmosphere 2022, 13, 1059. https://doi.org/10.3390/atmos13071059 https://www.mdpi.com/journal/atmosphere

Atmosphere 2022, 13, 1059 2 of 26
monoxide (CO), sulfur dioxide (SO2), nitrogen oxides (NOx = NO + NO2), volatile organiccompounds (VOCs), and ozone (O3). One particularly important urban center is Lagos(6.451◦ N; 3.388◦ E), located just north of the equator on the shore of the Gulf of Guineaand west of the Niger River Delta region.
The metropolitan area of Lagos is a fast-growing, high-density “mega-city” with apopulation of more than 20 million, making it the largest city in West Africa. It is mainlya coastal city with some small islands south of a large lagoon. The economy of the cityis diverse and depends in part on its regional financial activities, local industry, andits seaport complex. The metropolitan area has a variety of manufacturing, includingpower generation, an automobile assembly facility, steel and other metal works, petroleumstorage, and fabric production as well as a major agricultural market associated with theseaport. With its current rapid growth, the Lagos area experiences stress on its on-roadtransportation system. Most of the roads throughout the city are highly congested, with aslong as four-hour commutes at times for a journey that typically should last less than anhour [3]. A large fraction of the vehicle fleet is older than 15 years, with poor maintenanceand an uncertain effectiveness of emission controls. The economic growth also has affectedenergy supply; the demand for electricity exceeds the generation capacity, leading to ashortage of electricity. The unreliable electricity supply has resulted in a proliferation ofdiesel electric generators and other fossil-fuel-based units. The variety of transportation,seaport, alternative power generation, and manufacturing pollutant sources along withresidential emissions (cooking) and open waste burning provide important sources drivingatmospheric chemistry in the city and contributing to urban air pollution [3,4].
Lagos is in a tropical forest region just south of an agricultural and Savanah regimeand grasslands merging into the southwestern edge of the Sahel–Sahara Desert regime.Lagos’s climate is dominated by a wet season and a cooler dry season. Its local climate isstrongly dependent on a sea breeze flowing from the south and southwest. As one wouldexpect in the tropics, the temperature is warm year-round, in the 27–30 ◦C range and moist,generally with a daytime relative humidity exceeding 50%. Long-range transport alsocan play a key role in the observed air chemistry, particularly the well-known large-scalenatural “source” phenomenon of blowing dust from the desert across the west coast andacross the Atlantic Ocean to North and South America [5]. Further south, wildfires in thejungles of central Africa have produced smoke plumes that have also been observed acrossthe Atlantic Ocean [6].
This study is intended to complement and extend previous atmospheric compositionmeasurements in southern Nigeria. The project was organized by EnvironQuest withthe World Bank’s support and interest in aiding Nigeria and Lagos officials to develop aplan to manage the severe air pollution in the metropolitan area [3]. The project involvedcomprehensive chemical and meteorological measurements at multiple representativesites in the Lagos metropolitan area from August 2020 to July 2021 [7]. A selection ofobservations of trace gases and fine and coarse particles provides major insights into the airquality of Lagos, which are interpreted in the light of knowledge from mid-latitude studiesand multiscale tropospheric phenomena of interest. The results provide a contemporarybaseline for quantifying changes in Lagos air quality with expected future changes inemissions, meteorology, and urban demography.
2. Methods and Materials
Measurements during this study were conducted at six locations in the Lagos area(Table 1). Included in the table is a brief summary of the site characteristics.

Atmosphere 2022, 13, 1059 3 of 26
Table 1. Monitoring station locations and characteristics.
No. Key: Name and District Latitude Longitude Site Characteristics
1. University of Lagos (UNI), Akoka 6.515500◦ N 3.390450◦ E Urban scale:Business/residential/institutional
2. Nigerian Conservation Foundation(NCF), Lekki 6.432200◦ N 3.535917◦ E Regional scale: low-density
residential; near coast
3. Abesan Estate (ABE), Ipaia 6.609062◦ N 3.267706◦ E Neighborhood scale: High-densityresidential, school environment
4. King Ado School (JAN), Jankara 6.459800◦ N 3.391100◦ ECommercial scale near seaport:High vehicular traffic andhigh-density residential
5. Community Secondary School(IKO), Ikorodu 6.672360◦ N 3.534030◦ E Neighborhood scale: Industrial
low-density residential
6. Lagos State EPA (EPA), Alausa 6.612873◦ N 3.360596◦ E Urban scale: Institutional, businessdistrict with moderate traffic
The location of each measurement site is shown in Figure 1. The orientation of thestations is roughly north–south, with representation at the south and north extremes of theeast–west siting. With a sea breeze, pollution from the Lagos seaport complex south of JANand from sources in the city is transported inland towards IKO, EPA, and ABE.
The Lagos metropolitan area is potentially exposed to regional and larger-scale con-taminants. These include: (a) the Niger River Delta for oil and gas production and refineriesat Port Harcourt 290 km and Warri 170 km to the southeast; (b) the Savanah grasslands tothe north for vegetation debris and wildfires, and (c) the Sahel and Sahara for rising duststorms and O3 transported over West Africa (Figure S1).
Figure 1. Map of Lagos metropolitan area with monitoring station locations (airport shown asreference location). The central body of water is the Lagos lagoon. The entry from the Gulf of Guineais located at the bottom center of the map. The seaport and lagoon entry are bottom center. A map ofthe Niger Delta region with Lagos is included in Figure S1.
Atmosphere 2022, 13, 1059 4 of 26
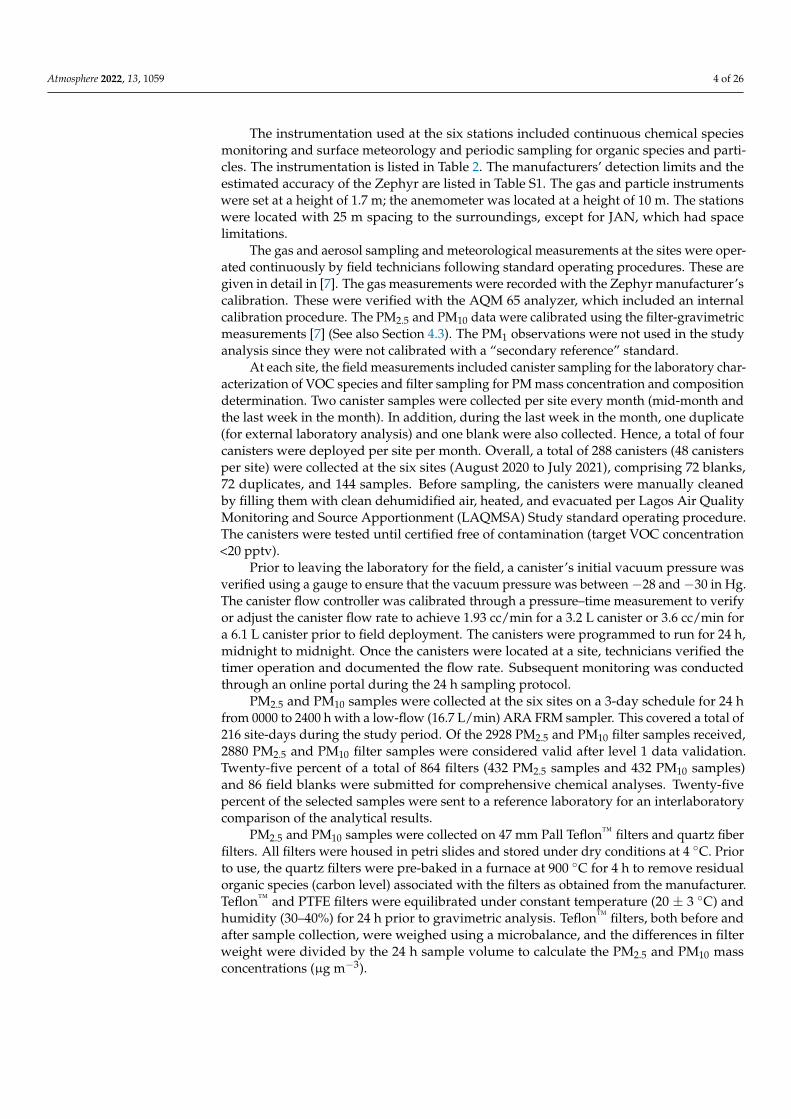
The instrumentation used at the six stations included continuous chemical speciesmonitoring and surface meteorology and periodic sampling for organic species and parti-cles. The instrumentation is listed in Table 2. The manufacturers’ detection limits and theestimated accuracy of the Zephyr are listed in Table S1. The gas and particle instrumentswere set at a height of 1.7 m; the anemometer was located at a height of 10 m. The stationswere located with 25 m spacing to the surroundings, except for JAN, which had spacelimitations.
The gas and aerosol sampling and meteorological measurements at the sites were oper-ated continuously by field technicians following standard operating procedures. These aregiven in detail in [7]. The gas measurements were recorded with the Zephyr manufacturer’scalibration. These were verified with the AQM 65 analyzer, which included an internalcalibration procedure. The PM2.5 and PM10 data were calibrated using the filter-gravimetricmeasurements [7] (See also Section 4.3). The PM1 observations were not used in the studyanalysis since they were not calibrated with a “secondary reference” standard.
At each site, the field measurements included canister sampling for the laboratory char-acterization of VOC species and filter sampling for PM mass concentration and compositiondetermination. Two canister samples were collected per site every month (mid-month andthe last week in the month). In addition, during the last week in the month, one duplicate(for external laboratory analysis) and one blank were also collected. Hence, a total of fourcanisters were deployed per site per month. Overall, a total of 288 canisters (48 canistersper site) were collected at the six sites (August 2020 to July 2021), comprising 72 blanks,72 duplicates, and 144 samples. Before sampling, the canisters were manually cleanedby filling them with clean dehumidified air, heated, and evacuated per Lagos Air QualityMonitoring and Source Apportionment (LAQMSA) Study standard operating procedure.The canisters were tested until certified free of contamination (target VOC concentration<20 pptv).
Prior to leaving the laboratory for the field, a canister’s initial vacuum pressure wasverified using a gauge to ensure that the vacuum pressure was between −28 and −30 in Hg.The canister flow controller was calibrated through a pressure–time measurement to verifyor adjust the canister flow rate to achieve 1.93 cc/min for a 3.2 L canister or 3.6 cc/min fora 6.1 L canister prior to field deployment. The canisters were programmed to run for 24 h,midnight to midnight. Once the canisters were located at a site, technicians verified thetimer operation and documented the flow rate. Subsequent monitoring was conductedthrough an online portal during the 24 h sampling protocol.
PM2.5 and PM10 samples were collected at the six sites on a 3-day schedule for 24 hfrom 0000 to 2400 h with a low-flow (16.7 L/min) ARA FRM sampler. This covered a total of216 site-days during the study period. Of the 2928 PM2.5 and PM10 filter samples received,2880 PM2.5 and PM10 filter samples were considered valid after level 1 data validation.Twenty-five percent of a total of 864 filters (432 PM2.5 samples and 432 PM10 samples)and 86 field blanks were submitted for comprehensive chemical analyses. Twenty-fivepercent of the selected samples were sent to a reference laboratory for an interlaboratorycomparison of the analytical results.
PM2.5 and PM10 samples were collected on 47 mm Pall Teflon™ filters and quartz fiberfilters. All filters were housed in petri slides and stored under dry conditions at 4 ◦C. Priorto use, the quartz filters were pre-baked in a furnace at 900 ◦C for 4 h to remove residualorganic species (carbon level) associated with the filters as obtained from the manufacturer.Teflon™ and PTFE filters were equilibrated under constant temperature (20 ± 3 ◦C) andhumidity (30–40%) for 24 h prior to gravimetric analysis. Teflon™ filters, both before andafter sample collection, were weighed using a microbalance, and the differences in filterweight were divided by the 24 h sample volume to calculate the PM2.5 and PM10 massconcentrations (µg m−3).

Atmosphere 2022, 13, 1059 5 of 26
Table 2. Species measurements showing instrumentation and sampling averaging time.
Measured Parameter Monitoring Instrument Averaging Time
Field Measurement MethodsCO, CO2, NO, NO2, SO2, EarthSense Zephyr [8] (electrochemical
detectors for gases; optical lightscattering for particles; PID for TVOC)
Continuousaveraged 5 min avg.O3
PM2.5, PM10Trace gases and particles (same asZephyr)
Aeroqual AQM65 [9] (electrochemical gasdetectors; PM light scattering) Intermittent/Continuous
for calib. of Zephyr; 5 min avg.PM2.5, PM10 ARA n-FRM Sampler Time-integrated, 24 hVOCs, CH4, N2O, CO2, CFCs, HFCs Entech Silonite Canister Time-integrated, 24 hPrecipitation
Davis Vantage Pro2 Weather StationAs detected
Air Temperature and Rel. Humidity Continuous, averaged 5 minWind Speed and Wind Direction
Laboratory Methods
PM Gravimetry for PM2.5 and PM10 RADWAG Microbalance Post and pre-samplingwith laboratory instruments
Elements RIGAKU X-ray Fluorescence (XRF)Ions Dionex ICS-3000Organic Source Markers Agilent GC-MSEC and OC ANSTO MABI Sunset Analyzer [10]GHGs GC/FID/ECD/MS instruments
The valid data rate exceeded 99%. Eight filter samples (three Teflon™ filters andfive quartz filters) were flagged for meteorological conditions such as a combinationof temperature, wind speed, and wind direction or relative humidity and precipitationanomalously impacting the concentrations of atmospheric pollutants.
Data validation was a critical component of the overall quality control and assuranceprogram evaluating single- and multicomponent data consistency. The validation of thefield and laboratory analysis of the collected data was part of the LAQMSA networkprotocols. The project used a number of standard procedures for maintaining the fieldoperations as well as the analytical laboratory. The quality control and assurance processand results of procedures, field and laboratory audits and intercomparisons are given indetail in [7].
3. Basic Resources for Air Chemistry3.1. Emissions Sources
Emissions of gases and particles for oxidant photochemistry have been reported inpart by Fakinie et al. [11]. Emissions in Lagos derive from a large variety of sources. Manyof these sources are combustion-derived, including electric power generation, groundtransportation, the seaport, open or municipal burning, and residential cooking. Otheremissions include sources such as refining, chemical processing, other manufacturing, andcommercial activity. There are also natural sources of potential concern such as wildfires,street and soil dust, and vegetative emissions. It is unclear from the literature if a completeinventory for Lagos has been assembled. However, there is one example of an annualinventory [11] that covers most combustion sources, except for the in-harbor shipping.This assessment for 2007–2016 includes solid wastes, fuel wood, gasoline and diesel fuel,aviation fuel, and saw dust. The first three are important for Lagos. Their estimates ofannual combustion emissions in kilotons per year (ktpy) are: PM10 188.5; CO 5921; SO2 11.2;NOx 348; and VOCs 4.14. Kerosene use in cooking was identified as a major contributor forNOx, SO2, and CO. These estimates compare with values derived from aircraft samplingof CO (1440 ktpy); NOx (30 ktpy); and VOCs (37 ktpy) with the stated uncertainty of+250 to −60% [11]. Additional emissions data have been reported. The estimates of SO2by Fakinie et al. [11] differ from Olatunji et al. [12]. The difference appears to be a largecontribution of SO2 emissions from kerosene combustion. In any case, the two estimates
Atmosphere 2022, 13, 1059 6 of 26
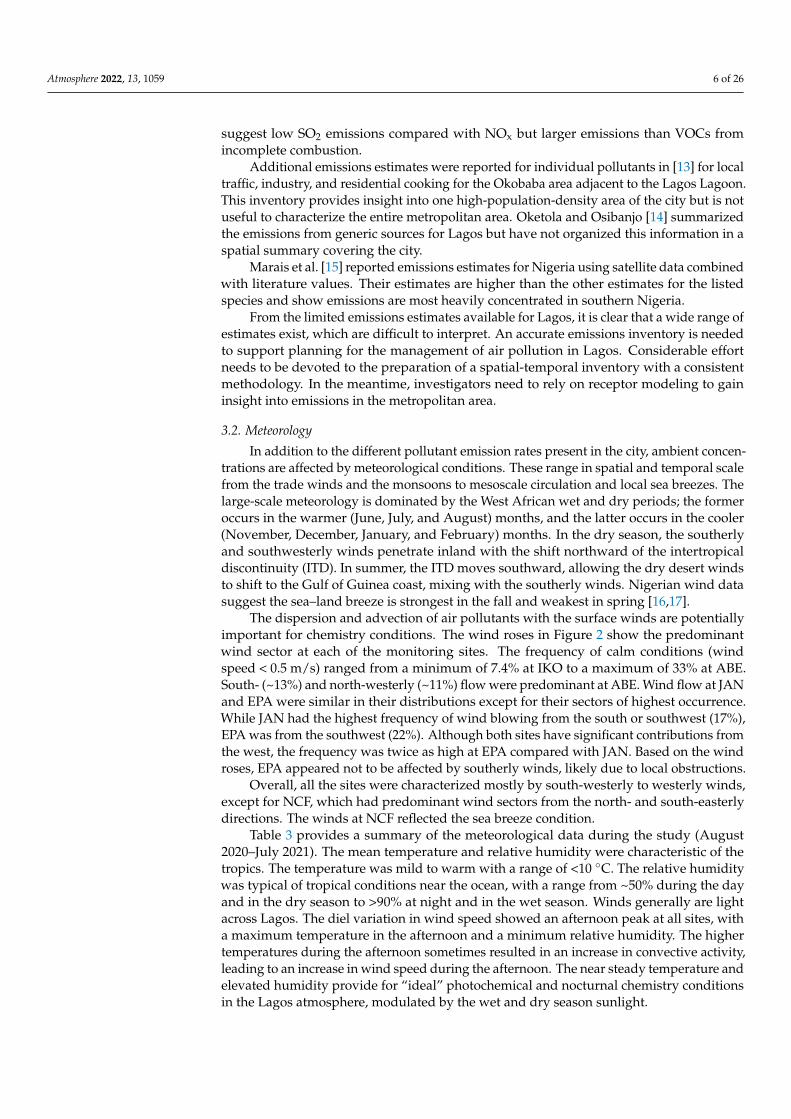
suggest low SO2 emissions compared with NOx but larger emissions than VOCs fromincomplete combustion.
Additional emissions estimates were reported for individual pollutants in [13] for localtraffic, industry, and residential cooking for the Okobaba area adjacent to the Lagos Lagoon.This inventory provides insight into one high-population-density area of the city but is notuseful to characterize the entire metropolitan area. Oketola and Osibanjo [14] summarizedthe emissions from generic sources for Lagos but have not organized this information in aspatial summary covering the city.
Marais et al. [15] reported emissions estimates for Nigeria using satellite data combinedwith literature values. Their estimates are higher than the other estimates for the listedspecies and show emissions are most heavily concentrated in southern Nigeria.
From the limited emissions estimates available for Lagos, it is clear that a wide range ofestimates exist, which are difficult to interpret. An accurate emissions inventory is neededto support planning for the management of air pollution in Lagos. Considerable effortneeds to be devoted to the preparation of a spatial-temporal inventory with a consistentmethodology. In the meantime, investigators need to rely on receptor modeling to gaininsight into emissions in the metropolitan area.
3.2. Meteorology
In addition to the different pollutant emission rates present in the city, ambient concen-trations are affected by meteorological conditions. These range in spatial and temporal scalefrom the trade winds and the monsoons to mesoscale circulation and local sea breezes. Thelarge-scale meteorology is dominated by the West African wet and dry periods; the formeroccurs in the warmer (June, July, and August) months, and the latter occurs in the cooler(November, December, January, and February) months. In the dry season, the southerlyand southwesterly winds penetrate inland with the shift northward of the intertropicaldiscontinuity (ITD). In summer, the ITD moves southward, allowing the dry desert windsto shift to the Gulf of Guinea coast, mixing with the southerly winds. Nigerian wind datasuggest the sea–land breeze is strongest in the fall and weakest in spring [16,17].
The dispersion and advection of air pollutants with the surface winds are potentiallyimportant for chemistry conditions. The wind roses in Figure 2 show the predominantwind sector at each of the monitoring sites. The frequency of calm conditions (windspeed < 0.5 m/s) ranged from a minimum of 7.4% at IKO to a maximum of 33% at ABE.South- (~13%) and north-westerly (~11%) flow were predominant at ABE. Wind flow at JANand EPA were similar in their distributions except for their sectors of highest occurrence.While JAN had the highest frequency of wind blowing from the south or southwest (17%),EPA was from the southwest (22%). Although both sites have significant contributions fromthe west, the frequency was twice as high at EPA compared with JAN. Based on the windroses, EPA appeared not to be affected by southerly winds, likely due to local obstructions.
Overall, all the sites were characterized mostly by south-westerly to westerly winds,except for NCF, which had predominant wind sectors from the north- and south-easterlydirections. The winds at NCF reflected the sea breeze condition.
Table 3 provides a summary of the meteorological data during the study (August2020–July 2021). The mean temperature and relative humidity were characteristic of thetropics. The temperature was mild to warm with a range of <10 ◦C. The relative humiditywas typical of tropical conditions near the ocean, with a range from ~50% during the dayand in the dry season to >90% at night and in the wet season. Winds generally are lightacross Lagos. The diel variation in wind speed showed an afternoon peak at all sites, witha maximum temperature in the afternoon and a minimum relative humidity. The highertemperatures during the afternoon sometimes resulted in an increase in convective activity,leading to an increase in wind speed during the afternoon. The near steady temperature andelevated humidity provide for “ideal” photochemical and nocturnal chemistry conditionsin the Lagos atmosphere, modulated by the wet and dry season sunlight.

Atmosphere 2022, 13, 1059 7 of 26
Across the sites, the observed maximum wind speed decreased in the order among thesites: UNI > NCF > IKO > JAN, and EPA > ABE. The two highest observed wind speeds of4.1 and 3.9 m s−1 were detected at UNI and NCF, respectively, while the mean wind speedobserved at all sites was ≥1 m s−1, except ABE, which was slightly less than the other sites.
The number of sunlight hours per day is a useful measure of the potential for photo-chemical processing. The climatological averages for Lagos [18] were as follows: in the dryseason (November–March), 6.2 h/d, sunlight 55% of the time during daylight; wet season(June–September), 3.8 h/d, sunlight 27% of the time in daylight.
Table 3. Summary of diel changes in local Lagos meteorology.
Location Air Temperature (◦C) Relative Humidity (%) Wind Speed (ms−1)
Range Mean Range Mean Range Mean
ABE 22.9–29.6 26.9 51.0–95.0 87.7 0.0–1.8 0.8IKO 21.9–31.9 26.7 56.0–96.0 87.6 0.3–3.7 1.7JAN 23.4–31.4 27.9 49.0–91.0 83.6 0.1–3.4 1.2EPA 22.8–35.0 27.5 50.0–95.0 84.8 0.0–3.4 1.4NCF 23.4–29.8 27.3 69.0–96.0 88.3 0.1–3.9 1.7UNI 23.1–30.0 27.1 54.0–94.0 86.6 0.1–4.1 1.5
Figure 2. Surface (10 m height) wind roses for the Lagos monitoring sites. Color indicates wind speedrange in m/s).
4. Results and Discussion
The gas and particle measurements in Lagos give a picture of the urban air chemistrycurrently occurring in a tropical mega-city. The continuous and semi-continuous data from

Atmosphere 2022, 13, 1059 8 of 26
this study provide insight into the major chemical reaction pathways associated with airpollution. Described below are the atmospheric characteristics across Lagos.
4.1. Gases4.1.1. Carbon Monoxide
Carbon monoxide originates from incomplete carbon fuel combustion. In the tropo-sphere, it participates in the photochemical oxidant cycle in relatively slow reactions. Incities, the photochemical and associated reactions unrelated to CO are sufficiently rapidthat CO is essentially inert, and ambient concentrations in urban areas depend solely onemissions and meteorology.
The CO measurements at two sites across Lagos, as shown in Figure 3, illustrate theaverage diel, seasonal, and weekday variation, as they represent an “inert” gaseous emis-sion and dispersion from city-wide sources including transportation, electricity generation,the seaport, industry (including sawmills), residential–commercial cooking, sawdust, andopen burning. The diel variation in CO concentrations was similar northward inland withthe southerly sea breeze, with both NCF and EPA (like the other sites) showing morningpeaks (after 0600 h local time) characterizing the onset of daily human activity, includingmorning traffic. At midday, a minimum occurred, with increased atmospheric dispersion,followed by an evening increase to a peak at 2200 h local time, with traffic, followed by adecline in residential activity and an ease of the sea breeze with the onset of a nocturnalinversion. This diel variation is characteristic of virtually all cities studied across the world.
Figure 3. Example of CO variation for near Gulf-of-Guinea site (NCF) and inland site (EPA), includingdiel average in local time (left), monthly average (center), and weekday average (right). Graphs (a)are for NCF and (b) for EPA sites. The vertical bands show variability (pink) ±in values, e.g., 5–95%range. Graphs for the remaining sites are in the Supplementary Materials, Figures S2–S5.
Seasonally, average CO concentrations tended to be steady through the months, withelevated values in in the dry period of winter and lower concentrations during the wetmonths of summer. The weekday average concentrations were variable but tended to showminima on the weekends that were associated with reductions in commercial and industrialactivity and traffic.
The average CO concentrations are typical of contemporary concentrations seen inmid-latitude North America [19]. Earlier studies in Lagos prior to 2016 reported highervalues of CO, e.g., Njoku et al. [20] (21 source-related sites, unspecified time) 11–46 mg m−3;Azeez et al. [1] (3 sites, 3 months) 16.1 mg m−3; and Olajire et al. [21] 19.3 mg m−3 near aroadway for 72 days. More recently, two short-term campaigns reported CO concentrations.The first involved one month of sampling in 2017 and distinguished between residential

Atmosphere 2022, 13, 1059 9 of 26
and transport (roadway) influences. For residential, CO was 3.4 ± 1.6 mg m−3, whiletransport CO was 3.6 ±1.9 mg m−3 [22]. The second study took place over 40 days withsampling at five sites. Their mean CO concentration was reported as 3.1 mg m−3 [23].
4.1.2. Sulfur Dioxide
Sulfur dioxide is reactive in the troposphere. It is oxidized through aqueous phaseprocesses and in the gas phase via the photochemical oxidant cycle to eventually formparticulate sulfate (see also Section 4.2.2). The gas in cities generally comes from the oxida-tion of sulfur from fuel combustion, although it has some natural contributors, includingwetlands or marine S gases such as hydrogen sulfide or dimethyl sulfide. The SO2 measure-ments in Lagos in 2020–2021 were mostly below the instrument detection limit of 8 µg m−3.The Lagos emission estimates for SO2 discussed above indicate that they are far less thanother gases and appear to be associated mostly with the combustion of refined petroleum,including gasoline, diesel, and kerosene.
Some insight into the characteristics of higher SO2 concentrations can be gainedfrom the outlier data in the uppermost 5% range. At the shoreline (NCF), measurementsindicated outliers from 10 to 50 µg/m3, mostly during the day, with one value of 100 µg m−3.Observing SO2 outliers at the shore does not necessarily mean local sources. The highpeak values may reflect SE winds (Figure 2) potentially blowing traces of the gas from asfar away as the petroleum production and refining region in the Niger River Delta. ForJAN, daytime outliers (15–200 µg m−3) exceeded the night values of 10–90 µg m−3. AtUNI, afternoon and evening outliers were the lowest (15–200 µg m−3), while morning andnight outliers were 10–200 µg m−3. EPA showed outlier values from 10 to 200 µg m−3;ABE values ranged from 10 to 200 µg m−3. IKO had the fewest outliers, except in theafternoon, ranging from 10 to 200 µg m−3. The outliers suggest that occasional high SO2concentrations occur at all sites, even at the shoreline. The origins of these outliers areuncertain but could be associated with (a) occasional local use of imported fuel of high Scontent or upsets in local industrial processing, or (b) less likely, from regional transport.
Prior to 2016, SO2 concentrations reported around Lagos included maxima of 260 µg m−3
on the roadside [21] and 1400 µg m−3 [1]. Raheem et al. [2] reported site average SO2 dielconcentrations from five Lagos sites from 2003 to 2006. Their results indicated that in thedry season SO2 concentrations peaked at 38 µg m−3 in the morning at 1015 h and in theafternoon and evening after 1400 h at ~42 µg m−3. In contrast, in the wet season, the SO2morning peak dropped to about half that of the dry period at 16.4 µg m−3 and ~21 µg m−3
for morning and evening, respectively. Obanya et al. [22] reported, in 2017, mean valuesof residential SO2 concentrations of 155 ± 80 µg m−3 and mean vehicle transport corridorSO2 concentrations of 310 ± 235 µg m−3. These concentrations were higher, on average,than those seen in 2020–2021 and are seemingly highly variable. One reason for this couldbe the elimination of “dirty” imported fuels [24] from the market as part of the Nigeriangovernment instituting low S requirements for diesel, marine, and residential fuels. Theincreasing demand for petroleum fuels in Nigeria continues to be a major source of high Sand methanol fuel imports [25], making it a challenge to interpret the ambient SO2 levels.
4.1.3. Nitrogen Oxides
Nitrogen oxides, NOx (NO + NO2), coupled with VOCs, are key reactants for photo-chemical oxidant formation. The sources of NOx are principally from fossil fuel combustionor biomass burning. NOx combustion is dominated by NO with a lesser fraction of NO2 [26].The diel pattern for ambient NOx concentrations shows their reaction sequence (Figure 4).The Lagos sites displayed a characteristic concentration variation that is well-known instudies of NOx-O3 chemistry. The gases peak in the morning and evening in a similar wayto CO, consistent with combustion sources in the city. Upwind, at NCF, the variation in theaverage NO and NO2 showed a peak early in the morning, followed by a second peak inthe evening. At the other sites, the early morning peak of NO concentration was narrower.The NO2 concentrations showed a strong morning peak, paralleling NO, and a secondary

Atmosphere 2022, 13, 1059 10 of 26
peak in the evening. The peak of NO2 concentration paralleling the NO peak is ascribedpartly to the reaction of NO and residual O3 to form NO2. The morning peak concentrationof NO at NCF of 58 µg m−3 was lower than that at EPA at 120 µg m−3. At the other sites,the morning peaks ranged from 80 to 95 µg m−3. The morning peaks for NO2 ranged from~60 µg m−3 at NCF to 80 µg m−3 at EPA. The evening peaks for NO2 concentration rangedfrom less than 50 µg m−3 at NCF to 90 µg m−3 at EPA, near 1600 h. The other sites rangefrom 55 to 95 µg m−3.
Figure 4. Example average concentrations at NCF and EPA for NO and NO2 for the duration ofthe study. Graphs in (a) are NCF and (b) are EPA sites. The remaining site data are located inFigures S2–S5.
The monthly average NO and NO2 concentrations tended to have opposite maximaand minima. NO tended to be highest in the dry period, while NO2 concentrations tend tobe highest in the wet period. The weekday averages both indicated the weekend minimawith reductions in urban activities.
Raheem et al. [2] reported site average morning and evening NOx peaks of 11 µg m−3
and, after a minimum, ~12 µg m−3, respectively. A comparison during the wet sea-son showed a morning peak of 6.5 µg m−3, and the afternoon peak was ~7 µg m−3.Obanya et al. [22] found zero concentrations or “non-detect” of NO2 at both residential andtransport-related sites. These levels were lower than those seen in this study.

Atmosphere 2022, 13, 1059 11 of 26
The ambient concentration ratio of NOx to CO is of interest in relation to the emissionratio. The 2016 average emission ratio for the combustion sources from Fakanie et al. [11]was 0.058, similar to the value of 0.044 of Marais et al. [15]. If we take the morningpeak estimate of NO, representing a minimum reaction of ambient species (NO), theNOx/CO ratios by site were 0.007–0.0144, with a site average of 0.012. This variability inthe “combustion index” can be ascribed to differences in the methods to estimate emissions,combined with a lack of knowledge of the combustion processes forming NOx and CO thatare relevant to Lagos activities.
4.1.4. Volatile Organic Compounds (VOCs)
VOCs represent the second key reactant in the photochemical cycle; they are composedof a wide variety of hydrocarbons and oxygenated organic compounds. The Maraiset al. [15] inventory indicates inordinately high VOC levels compared with other cities.
The ratio of the morning peak VOC to NOx is of a coarse measure of O3 formationsensitivity. The distinction between NOx and VOC sensitivity is sometimes taken as a ratioof 8–10 [27]. The results of a study by Njoku et al. [20] for pre-2016 conditions suggestedVOC sensitivity across the city. If compared with an example of a motor-vehicle-dominatedVOC environment of a subtropical city, Atlanta, GA, USA [28], the ratio is 9–10.
The large number of VOCs present in the urban air has created difficulties for inter-preting simple measures of total VOC concentrations since the 1970s. Most observationalstudies have concentrated on identifying and quantifying the VOC species to seek similari-ties and differences in VOC composition. A sense of the species in VOCs is obtained froma GC-MS analysis of the canister samples. The average speciation from these samples isshown in Figure 5. The mixture was a combination of mostly light (<C6) alkanes, alkenes,and aromatics according to this assay. These have been reported in virtually every sampleof VOCs obtained previously for city air and are associated with petroleum products,including gasoline, kerosene, and diesel fuel [29].
The species distribution by site indicates, with the exception of isoprene, VOC speciesare lowest at NCF near the Gulf. JAN, also near the Gulf, shows low concentrations forall except ethane, ethylene, and acetylene. Further inland, the VOCs accumulate from theemissions of transportation and industrial and residential cooking sources.
An unusually high concentration of dichloromethane was seen at IKO and EPA. Thischlorocarbon is a solvent used in industrial manufacturing and degreasing facilities. Itspresence in high concentrations at these two sites implies local non-transportation sources.
Isoprene is a hydrocarbon predominantly from vegetation emissions. In many loca-tions, it is identified with the ozone formation cycle and with secondary aerosol production.The average isoprene concentrations were low compared with midlatitude values, whichtend to be above 0.10 to 1.0 ppbv (e.g., [28]). The isoprene concentration at IKO appearedto be an exception, with its location closest to the tropical forest boundary to the north. Atthe median levels seen in the Lagos data, this hydrocarbon level suggests a less importantbiogenic contribution to O3 and aerosol formation than in other cities.
A useful relation to identify a motor vehicle source can be examined using a toluene-to-benzene ratio, which is characteristic of gasoline blends. This ratio, from Figure 6, rangedfrom 2.5 to 6.3 in the canister data. This compares with the ratio found in the 1990s to mid-2000s in Atlanta and North Carolina for non-methane organic carbon –NMOC (a part ofVOCs), as in ppbC, ranging from 1.7 to 2.3 [28]. Aircraft observations over Lagos indicateda ratio of approximately 1.5 [15]. The relatively large variation in the toluene–benzene ratiowas identified mainly at ABE and IKO, suggesting multiple sources of aromatic compoundsat these sites.
The toluene/benzene ratio from this study differs from that Olajire and Azeez [29]reported for earlier 2014 sampling along Oba-Akran Road (ratio 0.45–0.75). Drozd et al. [30]measured the ratio of 1.4 in vehicle exhaust in California. The differences can be attributed,in part, to the source of the gasoline blends, which vary somewhat by refinery. Hypotheti-cally, the ratio may be affected by fuel from unofficial artisanal refining in the region. Other

Atmosphere 2022, 13, 1059 12 of 26
examples of characteristic source ratios include the ethane-to-propane ratio. It ranged from0.2 to 0.7 for the Lagos sites vs. 0.15–0.6 in the 1999–2007 Atlanta samples. The predominantalkane concentrations, presence of aromatics, and the consistency of the ethane–propaneratio affirms the importance of petroleum-based emissions to O3 precursors.
Figure 5. Box and whisker mixing ratio plots of canister sample analysis for VOC species between2020 and 2021.
4.1.5. Ozone
Ozone is an important indicator for the oxidation products of the photochemical NOx-VOC reaction sequence. Local production of O3 follows the solar radiation cycle, resultingin a maximum concentration by midday. Solar radiation and ambient temperature near theequator are annually more constant than in the mid-latitudes. Unlike in the mid-latitudes,seasonally averaged O3 concentrations in Lagos follow the dry period cycle. The maximumaverage and extreme concentrations are observed in the dry months, while lower averageconcentrations are seen in the wet months [7]. The potential for increased O3 formationduring the dry season is partly due to the added hours of sunshine compared with the wetseason (for example, see Section 3). It also linked with the abundance of NO2 in the dryseason when clouds and precipitation tend to scavenge and deplete the NO2 concentration.
The average diel concentration profiles for the sites show similar time-dependentcharacteristics (Figures 7 and S2–S5). The examples in Figure 6 indicate the maximumO3 concentrations occur at ~1300 h, with nearly equal values (NCF, 50 µg m−3 and EPA,52 µg m−3). Interestingly, the nocturnal O3 minimum for EPA was <10 µg m−3, whileat NCF it was 27 µg m−3. This variation was present despite the nocturnal NO levelsbeing uniformly ~60 µg m−3. The influence of NO-O3 titration that these results suggest

Atmosphere 2022, 13, 1059 13 of 26
is readily illustrated in Figure S6. The variable residual O3 concentrations at night withNO present also suggest a nocturnal chemistry involving N2O5 and/or NO3. An offshorecomponent seen at NCF may represent a land breeze component. The combination ofthe temporal and spatial characteristics of the average diel NOx, speciated VOC, and O3concentrations exemplifies the locally dominant chemistry within the metropolitan area,with the peaking of O3 near noon, for example. If this were not the case and regionaltransport were frequently involved, the diel elevated O3 would tend to extend well intothe afternoon and possibly into the evening [31].
Figure 6. Annual average diel O3 concentrations for sites NCF (a) and EPA (b). Ozone concentrationsfor the other sites are in Figures S2–S5.
The monthly variation in O3 concentration showed the maximum in the dry seasonand the minimum tendency in the wet season. The weekday variation near the Gulf shoreat NCF was variable, while EPA showed a distinct weekend increase. At both sites, therewas a depletion of NOx on the weekend. The four other sites showed a weekend maximumfor O3 with depleted NOx (Figures 6 and S2–S6).
For comparison, Abulade et al. [23] reported the mean O3 concentrations for their sitesas 32.5 ± 38.7 µg m−3, which was similar to those found in this study. Raheem et al. [2]reported average O3 concentrations for the 2003–2006 period. During the dry period, the six-site average maximum O3 concentration occurred at 12:45 and was 155 µg m−3. In the wetperiod, the average maximum occurred at 1400 h and was 32 µg m−3. A comparison of thewet season maximum with the study averages indicates that the Raheem et al. wet seasonresults were consistent with this study’s overall average. However, their dry season resultwas higher. This difference suggests that the maximum O3 in the dry season concentrationsin earlier years may have been generated by more active NOx-VOC chemistry than in2020–2021.
Theregional character to the O3 concentrations with NOx. CO, formaldehyde, andglyoxal can be assessed from satellite and aircraft flights within 500 km of Lagos [15]. Thisanalysis notes that extremely high VOC levels are inferred. The analysis indicates thatmodeled emissions distributions include a large regional component of elevated reactantconcentrations, and O3 was present in Lagos’s surroundings. The satellite retrievals for O3suggested O3 levels of 118–126 µg m−3 at ~300 m height over the Lagos–Niger River Delta

Atmosphere 2022, 13, 1059 14 of 26
region. This result indicates that with vertical mixing a substantial potential exists for aregional component of urban chemistry in Lagos.
As noted above, the seasonal O3 concentration distributions showed increased O3concentrations with NO2 in the dry months, but significant O3 concentrations were foundin the wet period as well. Both periods have sunny days that would be conducive to O3formation. The dry period experiences increases in large-scale westerly to southwesterlyHarmattan winds from inland (e.g., Figure 2 in Marais et al. [15]). CO and O3 concen-trations have been observed at lower altitudes close to the city, potentially influencinglocal O3 concentrations. An example of vertical profiles in the wet season is found inFigure 7 [32]. With high concentrations of O3 aloft, the potential exists for downwardmixing into the Lagos air, causing extreme cases of O3 exposure in the city. Possible evi-dence for such an occurrence could be inferred from this study in the occasional incidentsof high concentrations of in the range of 100–250 ppb, above the 95% level [7]. Anotherincident was reported from O3 sounding above Cotonou, west of Lagos, in which an O3layer exceeding 295 ppb concentration was observed at just below 2 km of altitude. Thehigh O3 aloft in the first case is attributed to mesoscale air flow from the southeast overwildfires. O3 precursors from the fires are lifted up into the lower troposphere and carriedby a convective baroclinic flow associated with the ITD. The latter case was associated withthe northeasterly flow over fires passing over Lagos on 20 December 2005. Minga et al. [33]used chemical transport modeling to show that the injection aloft of large quantities ofVOCs from a petrochemical plant or refinery accident was required to achieve the highlevel of O3 concentration. Neither the frequency of occurrence of these regional incidentsnor their influence on ground-level O3 has been established yet. However, one case studyin the wet season of 2014 [34] indicated the surface impact of regional wildfire smoke fromconvective mixing is estimated as: 0.15 mg m−3 CO, 10–20 µg m−3 O3, and 5 µg m−3 PM10.
Figure 7. Example of vertical profile for O3 and CO concentrations for 3 July 2003, showing a layerof O3 and CO aloft above 2 km from measurements from an aircraft descending to Lagos airportat approximately 1100 h. Ll and L2 designate layers for the authors’ modeling study. Note that theinstrument for O3 concentration apparently stopped functioning at ~800 m of altitude. Figure fromGlobal Commons, European Geoscience Union [32].

Atmosphere 2022, 13, 1059 15 of 26
4.2. Aerosol Particles in Lagos Air
In addition to gas-phase chemistry, urban air chemistry involves a complex of sus-pended particle (aerosol) chemistry and airborne particle interactions, many of whichremain poorly understood. In this section, we describe the particulate measurementsfrom the Lagos study [6]. The results are interpreted in the light of the city emissions andlinks with air chemistry. The former is discussed in detail with several different receptormodeling calculations [35–38].
Urban aerosols originate from two classes of sources: “primary” from ground-levelactivity from natural debris, such as soil dust and detritus, to anthropogenic sources,including transportation, industry, road dust, and waste burning, and “secondary” fromchemical reactions occurring in the atmosphere involving the oxidation of gases such asSO2, NOx, and VOCs. Most of these reactions are linked with the photochemical oxidantcycle; they include both homogeneous gas to particle formation as well as particle growthby aqueous or heterogeneous reactions [39].
4.2.1. Mass Concentrations
Mass concentrations of particles are essential for tracking conventional air quality.Importantly, for aerosols, they provide a means to test composition measurements ofparticles to achieve a material balance of chemical constituents. The measurement of massconcentration is measured in terms of (fine) particles less than 2.5 µm diameter vs. fineplus coarse particles less than 10 µm in diameter. The data in Figure 8 show an annual andseasonal character of PMx mass concentrations in Lagos.
The annual mean 24 h PM2.5 concentrations ranged from 40 (NCF) to 135 (IKO) µg m−3.The annual 24 h mean PM10 concentrations ranged from to 87 (NCF) to 189 (IKO) µg m−3.The range of PM2.5/PM10 mass ratio was 0.46 (NCF) to 0.8 (IKO). Seasonally, both PMmeasures tended to peak in the dry season, suggesting either a rise in local urban dust or acontribution from regional dust sources associated with the Harmattan winds.
One review of particulate matter in several Nigerian locations between 1985 and2015 [35] indicated, for Lagos, a mean of 56.5 µg m−3 for PM2.5. The mass concentrationsreported by other investigators included those of Owoade et al. [38]. Nine months of 12 hsampling in 2010 at four sites similar to those of the Owoade et al. study yielded meanvalues of PM2.5 mass concentration ranging from 28.0 (residential) to 30.9 µg m−3 (heavytraffic). Their values for PM2.5–10 ranged from 26.1 (marine) to 64.5 µg m−3 (residential).The mean PM2.5/PM10 ratio was determined to be 0.41 ± 0.15. In 2017, Obanya et al. [22]found mean values for PM2.5 of 34.9 ± 12.1 µg m−3 at residential sites and transport-relatedconcentrations of 69.6 ± 335 µg m−3. For PM10, they reported 73.4 ± 27.5 µg m−3 atresidential sites and transport-related values of 144 ± 76.6 µg m−3. These values give massconcentration ratios of 0.467 for residential and 0.495 for transport.
A local influence is observed seasonally at IKO. The PM2.5 concentration at this locationis systematically higher than at other sites year-round, particularly during the dry season.For PM10, the IKO elevated mass concentration was seen in the monthly data, except forthe dry period, December-February. During the dry period, PM10 was much higher at allsites than at other times, even at NCF. The results also showed that the near-shore location(NCF) was low compared with the inland sites, except for the PM10 in the dry season.
4.2.2. Particle Composition
The species compositions for aerosol particles are the principal chemical characteristicsof interest. In the following section, the inorganic and organic speciation from our study isdescribed and interpreted in light of PM2.5 particle sources. Corresponding PM10 data areincluded in the Supplementary Materials.

Atmosphere 2022, 13, 1059 16 of 26
Figure 8. Seasonal variation in particle mass concentration for 24 h samples of fine ≤ 2.5 micrometerdiameter (PM2.5) and fine + coarse particles ≤ 10 micrometer diameter (PM10).
Figure 9 presents the PM2.5 abundance of elements, ions, elemental carbon (EC), andorganic carbon (OC) across the six sites. These species make up the bulk of the compositionof the gravimetric mass of PM2.5 and PM10. A comparison of Figure 9 indicates that Na,Si, SO4
2−, NO3−, NH4
+, OC, and EC were the most abundant quantified species found inPM2.5. These species were also the most abundant in PM10, along with Al (See Figure S8),across the sites. Two major “quasi-natural” particle sources common to many locationsare soil dust and sea salt (near marine areas). The abundances shown in Figure 9 indicatethat there was a surplus of Na, accounting for sea salt; the surplus is probably mainlyassociated with soil dust in the city as sodium aluminum silicates. Relative to other sites,IKO PM2.5 tended to have higher concentrations of all species. This is associated with thepresence of industry and traffic locally. Of the higher atomic weight metals, Fe and Zn tendto dominate, especially in IKO where two steel plants are located (e.g., Figure S7).

Atmosphere 2022, 13, 1059 17 of 26
Figure 9. Average plots of abundance of various PM2.5 species in 24 h filter samples from thisstudy. (Top) Selected primary ionic (ion chromatograph assayed) species and secondary specieswith relatively high concentrations. (Bottom) Abundance of elements found in samples from X-rayfluorescence analysis.
The PM2.5 and PM10 compositions were evaluated relative to the measured gravi-metric mass by converting individual species into materials that estimated their chemicalcomposition in the air. For example, including oxygen with trace elements and oxygen,nitrogen, and other elements with organic carbon. Here, the mass balance was determinedusing a chemical mass balance approach, specifically, the US Interagency Monitoring ofProtected Visual Environments (IMPROVE) model [40]. The percentages of the gravimet-rically measured PM2.5 mass as ammonium nitrate, ammonium sulfate, sea salt (NaCl),trace elements, elemental carbon, and organic material (assumed OM ~1.6 × OC [41]) areincluded. The identified components of PM2.5 for each of the sites are shown in Figure 10.
Figure 10. Pie charts for PM2.5 showing percentage of components by apparent source to total massconcentration from CMB analysis.
An estimated distribution of major sources to PM2.5 is shown in Figure 10 for ourLagos sites. The primary particle attribution indicates that the combination of soil dust

Atmosphere 2022, 13, 1059 18 of 26
and carbonaceous material accounted for the majority of PM2.5 mass, as was the case forPM10. The OC-EC component at the sites was large, representing approximately 30% of thePM2.5. In PM2.5, SO4
2− and NO3− were minor contributors to fine particle mass, unlike
most cities in northern mid-latitude locations.For particles with primary sources, most sites had a large percentage of Si and Al
identified with fine soil dust, likely due to the re-entrainment of dust from Lagos streetsand walkways and the impact of Harmattan dust. For individual sites, ABE was dominatedby fine soil, organic matter, and elemental carbon, which comprised approximately 74% ofthe PM2.5 mass. At IKO, fine soil, trace elements, and organic matter comprised 66% of thePM2.5 mass, while at JAN approximately 72% of PM2.5 was composed of organic material,fine soil, and elemental carbon. Part of OM was identified with the oxidation of VOCs. Alarge fraction of the PM2.5 mass, equal to about 74%, 75%, and 65%, was composed of finesoil, EC, and organic material at EPA, NCF, and UNI, respectively. IKO had a relativelyhigh abundance of trace elements, especially Pb, Zn, Fe, and Cl, which were associatedwith local industry within a few km of the site (see Figure S8). A comparison of the sea saltin NCF (an onshore site) and IKO (an inland site) indicates that sea salt as NaCl at NCFwas nearly half that of IKO.
A study of Leck et al. [42] adds some insight into the background of fine particles usingdata for <PM1 obtained from ship data offshore of the coast of the Gulf of Guinea during thedry period. Data from this 1993 expedition are listed in Table S4. The species listed in thetable indicate that between non-sea salt (nss) SO4
2− (identified with fuel combustion) andmethane sulfonic acid (from oxidation of marine dimethyl sulfide), a significant fractionof the SO4
2− equivalent can be accounted for by marine air. The Leck et al. data alsosuggest from Si and EC concentrations that dust and carbon from inland biomass burningare present in a regional background aerosol. Particulate vanadium in this Gulf regionwas not detected, indicating, by this tracer, that residual oil combustion was regionallyunimportant.
Assuming that the offshore observations of Leck et al. represent marine conditionsover the Gulf of Guinea, we note that, like O3, a regional influence of aerosol dust is present,at least during the Harmattan period [43,44].
Secondary particles are identified with SO42− and NO3
− as NH4+ salts and a part of the
OC. The low average concentrations of SO2 found in Lagos (<20 µg m−3) and the uniformlevels of SO4
2− at ~2 µg m−3 do not support a SO42− spatial gradient that would form
from a local rapid oxidation source for SO42− production. A more likely interpretation for
SO42− is a ubiquitous regional presence ranging up to 5 µg m−3 in addition to 1.7 µg m−3
SO42− in local sources, as suggested by the chemical mass balance [45]. The regional SO4
2−
contribution is stated in reviews of PMx ([35,37]) and multiscale reviews of SO42− in the
mid-latitude conditions [46]. Regional sources are diverse but probably include a rangeof petroleum refining and combustion, agricultural sulfur, and marine or mineral dust.Examples of the marine component offshore are shown in Table S4. A non-sea salt SO4
2−
contribution from the onset of sea breeze could be as high as 0.5 µg m−3. However, ifmethyl sulfonic acid (MSA) in aerosol is oxidized to SO4
2−, its contribution could be ashigh as half of the Lagos PM2.5 concentration.
The NO3− concentrations were similar to SO4
2−. This result is unusual for warmtropical conditions since the equilibrium chemistry for ammonium nitrate formation ispreferential in cold air because of the volatility of the salt. The filter sampling approachof this study suggests that nitrate concentrations are likely to reflect the capture of HNO3vapor on the filter substrate as well as particulate nitrate [47,48] and the loss of NO3
− fromthe Teflon filter by volatility. The latter favors an underestimate of NO3
−-, but it addsuncertainty to the reported value.
The fraction of OC that is secondarily derived from the photochemically relatedoxidation depends on the VOC carbon number. From atmospheric observations and smogchamber experiments, this nominal constraint is ~>C5 [39]. An estimation of the secondarycontribution (SOC) can be made from the OC/EC ratio if this ratio is known for primary

Atmosphere 2022, 13, 1059 19 of 26
sources [49]. The OC/EC fraction in this study averaged 1.9 with a range of 1.6–2.1. Formany cities, the principal primary sources of carbon are fossil or biomass fuel combustion.In the US, for example, up to the early 2000s, the fresh domestic internal combustion anddiesel vehicles had an OC/EC ratio of ~1 [50] (the ratio relevant to vehicle emissions inLagos is unknown). In contrast, biomass combustion is highly variable, depending on thebiomass resource and the burning conditions. The ratio can vary from ~1 to >5, e.g., [51,52].A ratio of <~1.9 could be interpreted as the primary aerosol associated with motor vehicleand biomass burning emissions alone. Based on experience in US cities, an OC/EC ratio of<2 is considered fresh primary carbon, while >2 is identified with “aged” conditions withincreased secondary OC present superimposed on oxidized OC from primary sources [53].
There have been a number of other studies reporting elemental analyses of filtersamples for PM2.5 and PM10 [35,37]. Investigators have applied receptor modeling, eitherchemical mass balance or positive matrix factorization, to these data and have foundessentially the same particle sources. These include soil dust, marine- and traffic-relatedsources, biomass burning, and industrial sectors.
4.2.3. OM Speciation
A GC-MS analysis of the organic components of particulate matter was undertakenusing the quartz fiber filter samples from the study. The average concentration profilesby site for the PM2.5 samples are given in Figure 11. The results for PM2.5 show a majorconcentration grouping of alkanes and relatively high-molecular-weight alkyl-chain com-pounds along with a variety of other species. The PM10 samples showed a similar OCspeciation pattern, as noted in Figure S9. Those classes of compounds are listed below inTable 4 along with the probable source identification for primary particle emissions.
Figure 11. Organic species in PM2.5 quartz fiber filter samples identified in canister samples byGC-MS. Top panel includes hydrocarbon species. Bottom panel includes oxygenates. OM speciationfor PM10 is included in Figure S9.
Some of the carbon species were detected with carbon numbers >20. Biogenic emis-sions tend to produce waxes with more odd-numbered species than even. Figure S10

Atmosphere 2022, 13, 1059 20 of 26
indicates the carbon number associated with the species found in the GC-MS analysis. Theprevalence of odd carbon numbers is apparent, with a much stronger signal in the dryseason than in the wet season. This is interpreted as the importance of biogenic speciesdominance of high-molecular-weight organics in the aerosol. These species could comefrom direct emissions during a warmer portion of the year, or they could be the result ofwildfire emissions in the interior of West Africa during the dry season.
Table 4. Categories of organic species observed by GC-MS analysis in Lagos PM2.5 samples.
Class of Compound No. of Species Range (ng m−3);Site Order Source/Indicator References for
Source Identification
Polycyclic aromatichydrocarbons (PAHs) 10 15 (NCF)-33(IKO) Carbon fuel combustion [54]
n-Alkanes 23 23(NCF)-159 (EPA) Petroleum; vegetation [54–57]Iso/Anteiso-alkanes 10 1.3(NCF)-13(JAN) Waxes; leaves [58]
Hopanes 18 2(NCF)-19(EPA) Petrol prod., lub. oil; motorvehicle exhaust [59,60]
Steranes D13 4(NCF)-28(EPA) Motor vehicle exhaust [59,60]Branched alkanes 2 2–100 Diesel fuel; lub. oil [57,60]
Alkyl cyclohexanes 5 <0.1–20 Diesel fuel; lub. oil [57,60]
Alkenes 2 0.1–2 Squalene a; octadecene b
identified[61]
Monocarboxylic acids 1 (UNI)-(IKO) Nonanoic acid; cooking; fuelcombustion; biogenic [55,62–64]
Alkenoic acids 4 (NCF)-(IKO) Oleic acid; biomass burning [64]Resin acids 4 (NCF)-(IKO) Biomass burning [64]
Dicarboxylic acids 2 (NCF)-(IKO)
Vehicle exhaust, Biomassburning; Meat cooking.
Oxalic acid possible markerfor SOC
[60,64–66]
n-Alkanols 18 (NCF)-(IKO) 1-octa;1-tetra;1-hexa-cosanol;charbroiling [66,67]
Anhydro-sugars 1 6(NCF)-80(IKO) Levoglucosan; biomassburning [68]
Biomarkers 11 Stigmasterol—biomassburning; char-broiling [69,70]
a Biogenic triterpene (C30H50) sterol intermediate from flora and fauna. b Suspected source pyrolysis ofplastic wastes.
Essentially all of the high-molecular-weight classes of OC can be interpreted in termsof primary sources. Nevertheless, there is the potential for SOC formation, not only fromisoprene and substituted aromatic compounds but also from intermediate volatility alkanes(e.g., [71,72]). From the evidence from the OC/EC ratios and the ambiguous speciationfrom the GC-MS analysis, we infer that secondary OC was minimally present in the Lagossamples.
4.3. Uncertainties and Limitations
There are important limitations in field studies that involve representative site selec-tion, instrument or measurement method selection, sampling frequency and duration, andthe quality control or assurance practice. The details addressing these aspects of the studyare included in [7]. In particular, the procedures adopted for documenting the continuousand laboratory measurements were reported in this reference. The results of the study areconstrained by the six urban sites and use of the compact multicomponent Zephyr units.Field comparisons using the Aeroqual AQM 65 instrument as a secondary standard werein used to constrain measurement uncertainties. Recording meteorological observationswas performed with conventional units. The laboratory analyses relied on conventionalsampling using filters and canisters.

Atmosphere 2022, 13, 1059 21 of 26
The uncertainty levels for laboratory-related samples (VOC speciation) and PM chem-istry have been reviewed extensively, for example, in Fehsenfeld et al. [73]. Their re-view also included comments on established uncertainties in meteorological observations.The discussion and precision and accuracy results are summarized in Fehsenfeld et al.Tables 5.2 and 5.3 and are assumed to apply to this study. Their summary indicates thataccuracies range from ±5 to 10%, with a precision of ±10–30%, depending on the specificVOC analyte. Measurements of organic species in aerosols are less well established orperhaps rigorously unknown [73]; uncertainties depend on species and methods used inGC/MS analysis, e.g., [74]. For specific compounds, intercomparison studies have beenattempted [75], and reference material has been proposed [76]. A typical generic value fororganic species is estimated as ±20% accuracy [77]. We note that the organic componentis highly complex, and typically about 25% or less up to 50% of the total in atmosphericaerosols have been identified. Furthermore, additional uncertainties derive from sam-pling and the extraction of samples, including the issue of gas-particle partitioning andatmospheric oxidation. Major recent improvements [78] in instrumentation are facilitatingsubstantial advancements in the identification and quantification of organic species. Oneexample of an approach to the quantitation of multiple condensed and vapor phase speciesderives from studies in Baltimore, Maryland [79].
The gas observations using the inexpensive, multi-species Zephyr and Aeroqual AQM65 (with internal calibration) do not have the credibility that supports the reference instru-ment historically cited, for example, in [74]. The application of these electrochemical-basedinstruments to long-term measurements is limited but illustrates the potential (Table S1)for these units to be used for ambient air measurements [80]. One example of thorough lab-oratory and CO and NO2 detector calibration and performance was reported [81]; anotheris discussed by Mead et al. [82]. Relevant to this study, The USEPA Community Air SensorProject (CAIRSENSE) [83] compared, for an 8-month period, several electrochemical-basedinstruments with each other and federal reference instruments established by independentstudies. The test included an Aeroqual O3 detector. An unpublished Aeroqual AQM65 comparison with an EPA monitor was also reported [84]. Their results indicated reliablequantitative gas measurements over the periods studied. In our Lagos study, the Zephyrgas measurements were collocated with the Aeroqual AQM 65 instrument over six monthsto assess the field-based precision and accuracy estimates and establish a species concentra-tion re-calibration to account for bias and gain. The methods used to follow this procedureare described in the EnvironQuest final report [7].
The Zephyr and Aeroqual instruments are designed for air pollution monitoring ofrelatively high concentrations, especially those near or exceeding health-related thresh-olds [78]. Their use in research studies such as our Lagos study is limited in this respect.In the Lagos study, we were challenged, particularly with the interpretation of data nearor below the detection limits of the Zephyr unit. For the purposes of investigating thecharacter of the diel, weekly, and monthly averages for gas concentrations, we assumedthat the linear relationship with the gas concentration applied below the detection limit.Following the Analytical Methods Committee guidelines [85], we used such low concentra-tion observations to at least semi-quantitatively complete our knowledge of the time seriesaverages and avoid excessive biasing of the summary statistics through left censoring. Wenote that, on average, conditions near or below the instrument detection limits should beconsidered to have unknown accuracy.
The Zephyr and Aeroqual AQM 65 also measure PMx by light scattering or the ARAPM sampler. We did not examine these data for this paper. A PMx comparison withgravimetric results is planned for a separate analysis. Some performance observations wereobtained in the CAIRSENSE study [83].
5. Discussion and Conclusions
The 2020–2021 campaign characterized air-pollution-related chemistry measurementsfor gases and airborne particles at six sites in the Lagos metropolitan area. The observations

Atmosphere 2022, 13, 1059 22 of 26
enhanced the understanding of results from earlier studies by showing the presence ofurban oxidant chemistry consistent with known precursor–ozone product relationships.Paralleling the gas-phase processes was the urban chemistry of aerosols containing bothparticles from local primary sources and secondary particles produced in the atmosphere.
The continuous measurements were obtained with inexpensive compact instrumentsat six geographically distinct surface sites. These were complemented with conventionalfilter and canister sampling for fine and fine plus coarse particle chemistry and VOC species.The sites also included surface meteorological observations.
The interpretation of the measurements for air chemistry was constrained by the avail-able spatially and temporally limited gas and particle emissions data and meteorologicaldata.
Some important conclusions are:
• Unlike in the mid-latitudes, gas and particle chemistry increases with the onset ofthe dry season during the mid-latitude winter months; chemical processes decreaseduring the summer wet months.
• The diel variation in NO and NO2 concentrations are maximal before the middayozone maxima, suggesting a pattern dominated by local processes; a well-knowneffect is seen with ozone increasing on the weekends with decreased NO emissionsfrom reduced human activity, likely reduced traffic.
• VOC precursor species are observed to reflect fossil fuel and biomass componentstypical of large cities with heavy vehicle traffic supplemented with natural emissionsand industrial or domestic sources.
• Fine particles and fine plus coarse particle mass concentrations are seasonally variablewith maxima in the dry season.
• The particle composition contains a variety of urban-related species dominated byelemental and organic carbon with sulfate produced from SO2 oxidation in the air.Particles also contain significant amounts of nitrate, which may be underestimatedfrom the sampling method used.
• The organic carbon fraction can be attributed to primary sources; there was no directevidence of significant amounts of organic carbon produced by the oxidation of VOCs.
• The exploration of the organic species in particles indicates the presence of high-molecular-weight material from anthropogenic sources supplemented by biomasscontributions from open burning and waxy material from vegetation.
• There is indirect evidence of the occasional influence of regional air mass transport ofozone and dust, especially during the Harmattan wind period in the dry season.
Supplementary Materials: The following supporting information can be downloaded at:https://www.mdpi.com/article/10.3390/atmos13071059/s1, Figure S1. Gulf of Guinea-Niger RiverDelta Region. The main oil and gas production region is in and around Port Harcourt; Figure S2.Average variability of gases for Jankara site. Left panel diel variation; center panel monthly variationand right weekday variation; Figure S3. Average variability of gases for Unilag site. Left panel dielvariation; center panel monthly variation and right weekday variation; Figure S4. Average variabilityof gases for Abesan site. Left panel diel variation; center panel monthly variation and right weekdayvariation; Figure S5. Average variability of gases for Ikorodu site. Left panel diel variation; centerpanel monthly variation and right weekday variation; Figure S6. Example of relationship betweenNO/NO2 and 1/3 O3 concentration for Abesan showing local NO-O3 titration effect; Figure S7. Wind-PMx concentration roses (a) and map (b) of Ikorodu area; Figure S8. PM10 chemical compositionfrom filter sampling. Upper panel selected major components of particle samples. Lower panel isan elemental analysis of particles; Figure S9. Distribution of classes of aerosol organic compoundsidentified in PM10 from GC-MS of Lagos filter samples; Figure S10. Distribution of carbon numberof >C20 species in PM2.5 from aerosol samples at Lagos. Table S1. Nigerian government standardsand World Health Organization guidelines for air quality; Table S2. Manufacturer specified detectionlimits and estimated accuracy of the Zephyr and Aeroqual gas measurements; Table S3. Offshoresub-micrometer particle chemistry from ship cruise in 1993 during the dry season. Concentrations inµg m−3 (After data listed in Leck et al. [42]).

Atmosphere 2022, 13, 1059 23 of 26
Author Contributions: A.O.-O., project principal investigator; P.H. (Pierre Herckes) and M.F., ana-lytical chemistry; P.H. (Philip Hopke), data analysis; J.O., meteorological assessment; P.A.S., qualityassurance and coordination; O.P., critical review of operations and analysis; G.M.H., data interpre-tation and manuscript preparation. All authors have read and agreed to the published version ofthe manuscript.
Funding: A.O.-O. works with the project and on World Bank contract management. No other authorshave financial conflicts of interest with the project.
Data Availability Statement: The data and final report [7] are available on request from A.O.-O. atEnvironQuest. The final report will be released to the public shortly by the World Bank.
Acknowledgments: This project was sponsored partly by the World Bank as part of its environmentalassessment activities.
Conflicts of Interest: The authors have no conflict of interest in the project.
References1. Azeez, L.; Oyedeji, A.; Adewuyl, S.; Tijni, K.; Adebisi, S.; Olanaogun, N. Precursors Influencing Tropospheric Ozone Formation
and Apportionment in Three Districts of Ilupeju Industrial Estate. Am. J. Chem. 2016, 6, 65–73.2. Raheem, A.; Adekola, F.; Obioh, L. The Seasonal Variation of the Concentration of Ozone, Sulfur Dioxide, and Nitrogen Oxides in
Two Nigerian Cities. Environ. Model Assess. 2008, 14, 497–509. [CrossRef]3. Kemper, K.; Chaudhui, S. Air Pollution: A Silent Killer; The World Bank: Washington, DC, USA, 2022.4. Tawari, C.; Abowei, J. Air Pollution in the Niger Delta Area of Nigeria. Int. J. Fish. Aquat. Sci. 2012, 1, 94–117.5. Prospero, J. Long term measurements of transport of African mineral dust to the southeastern United States: Implications for
regional air quality. J. Geophys. Res. 1999, 104, 15917–15927. [CrossRef]6. Ansmann, A.; Baars, H.; Tesche, M.; Müller, D.; Althausen, D.; Engelmann, R.; Pauliquevis, T.; Artaxo, P. Dust and smoke
transport from Africa to South America: Lidar profiling over Cape Verde and the Amazon rain forest. Geophys. Res. Lett. 2009, 36,L111802. [CrossRef]
7. EnvironQuest Ltd. Lagos Air Quality and PM Source Apportionment Study. Final 12 Month Summary Report; EnvironQuest: Lagos,Nigeria, 2022.
8. EarthSense. Zephyr Air Quality Sensor (Specifications). 2021. Available online: www.earthsens.cp.uk (accessed on 29 May 2022).9. Aeroqual. AQM 65. Available online: www.aeroqual.com/prioducts/aqm-stations/aqm-65-air-quality-monitoring-station
(accessed on 20 February 2022).10. Sunset Laboratory, Inc. Cutting Edge Carbon Aerosol Particulate Analysis Instrument. Available online: www.sunla.com
(accessed on 20 February 2022).11. Fakinie, B.; Odekanie, E.; Olalekan, A.; Ije, H.; Oke, D.; Sonibare, J. Air pollutant emissions by anthropogenic combustion
processes in Lagos, Nigeria. Cogent Eng. 2020, 7, 1808285. [CrossRef]12. Olatunji, S.; Fakanie, B.; Jimoda, L.; Adeniran, J.; Adesanmi, J. Air Emissions of Sulfur Dioxide from Gasoline and Diesel
Consumption in the Southwestern States of Nigeria. Pet. Sci. Technol. 2015, 33, 678–685. [CrossRef]13. Jimoda, L.; Sonivare, J.; Akeredolu, F.A. Emission Inventory of Anthropogenic Activities at Southeastern Lagos. Ife J. Technol.
2009, 18, 35–541.14. Oketola, A.; Osibanjo, O. Assessment of Industrial Pollution Load in Lagos, Nigeria by Industrial Pollution Projection System (IPPS) versus
Effluent Analysis; Bronicewcz, E., Ed.; Intech Open Book Series; Chap/10. Available online: www.Intechopen.com/books/213(accessed on 10 February 2022).
15. Marais, E.; Jacob, D.; Wecht, K.; Lerot, C.; Zhang, L.; Yu, K.; Kurosu, T.P.; Chance, K.; Sauvage, B. Anthropogenic emissions inNigeria and implications for atmospheric ozone pollution: A view from space. Atmos. Environ. 2014, 99, 22–40. [CrossRef]
16. Amadiou, C.; Omotosho, B.; Coulialy, A.; Ballo, A. Characteristics of land and sea breezes along the Guinea Coast of West Africa.Theor. Appl. Climatol. 2019, 188, 953–971.
17. Gbambie, A.; Steyn, G. Sea breezes at Cotonou and their interaction with the West African Monsoon. Intl. J. Clim. 2012, 33,2889–2899. [CrossRef]
18. Climate Data for Lagos, Nigeria. Available online: www.lagos.climatemps.com/sunlight.php (accessed on 20 February 2022).19. US Environmental Protection Agency. Carbon Monoxide Trends. Available online: www.epa.gov/air-trends/carbon-monoxide-
trends (accessed on 11 February 2022).20. Njoku, K.; Rumide, T.; Akinola, M.; Adesuyi, A.; Jolaoso, A. Ambient Air Quality Monitoring in Metropolitan City of Lagos,
Nigeria. J. Appl. Sci. Environ. Manag. 2016, 20, 178–185. [CrossRef]21. Olajire, A.; Azeez, L.; Oluyemi, E. Exposure to hazardous air pollutants along Oba Akran Road, Lagos-Nigeria. Chemosphere 2011,
84, 1044–1051. [CrossRef]22. Obanya, H.; Ameeze, N.; Otitoloju, A. Air Pollution Monitoring Around Residential and Transportation Sector Locations in
Lagos, Mainland. J. Health Poll. 2018, 8, 9180903. [CrossRef]

Atmosphere 2022, 13, 1059 24 of 26
23. Abulude, F.; Damodharen, U.; Acha, S.; Adamu, A.; Arifalo, K. Preliminary Assessment of Air Pollution Quality Levels of Lagos.Aerosol Sci. Eng. 2021, 5, 275–284. [CrossRef]
24. George, L. Nigeria to Cut Sulfur in Fuels a Year after U.N. Deadline. 2018. Available online: www.reuters.com/article/us-nigeria-idUSKNGP1HQ (accessed on 15 February 2022).
25. Ogundairo, F. Nigeria: Petrol, Diesel Imported from Europe Dirtier Than Fuel from Illegal Refineries—Report. 2020. Availableonline: http://allafrica.com/stories/202007030199.html (accessed on 20 February 2022).
26. Yao, X.; Lau, N.; Chan, C.; Fang, M. The use of tunnel concentration profile data to determine the ratio of NO2/NOx directlyemitted from vehicles. Atmos. Chem. Phys. Discuss. 2005, 5, 12373–12740.
27. Sillman, S.; He, D.; Cardelino, C.; Imhoff, R.E. The use of photochemical indicators to evaluate ozone-NOx-hydrocarbon sensitivity:Case studies from Atlanta, New York, and Los Angeles. J. Air Waste Manag. Assoc. 1997, 47, 1030–1040. [CrossRef]
28. Blanchard, C.; Hidy, G.; Tanenbaum, S.; Rasmussen, R.; Watkins, R.; Edgerton, E. NMOC, ozone, and organic aerosol in thesoutheastern United States 1999–2007: 1. Spatial and temporal variations of NMOC concentrations and composition in Atlanta,Georgia. Atmos. Environ. 2010, 44, 4840–4849. [CrossRef]
29. Olajire, A.; Azeez, L. Source apportionment and ozone formation potential of volatile organic compounds in Lagos, Nigeria.Chem. Ecol. 2014, 30, 156–168. [CrossRef]
30. Drozd, G.T.; Zhao, Y.; Saliba, G.; Frodin, B.; Maddox, C.; Weber, R.J.; Chang, M.-C.O.; Maldonado, H.; Sardar, S.; Robinson, A.L.;et al. Time resolved measurements of speciated tail pipe emissions from motor vehicles: Trends with emission control technology,cold start effects, speciation. Environ. Sci. Technol. 2016, 50, 13592–13599. [CrossRef]
31. Hidy, G.M.; Blanchard, C.L.; Baumann, K.; Edgerton, E.; Tanenbaum, S.; Shaw, S.; Knipping, E.; Tombach, I.; Jansen, J.; Walters, J.Chemical climatology of the southeastern United States, 1999–2013. Atmos. Chem. Phys. 2014, 14, 11823–11914. [CrossRef]
32. Sauvage, B.; Gheusi, F.; Thouret, V.; Cammas, J.-P.; Duron, J.; Escobar, J.; Mari, C.; Mascart, P.; Pont, V. Medium-range mid-tropospheric transport of ozone and precursors over Africa: Two numerical case studies in dry and wet seasons. Atmos. Chem.Phys. 2007, 7, 53757–53770. [CrossRef]
33. Minga, A.; Thouet, V.; Saunola, M.; Dlon, C.; Serca, D.; Mari, C.; Sauvage, B.; Mariscal, A.; Leriche, M.; Cros, B. What causedextreme ozone concentrations over Coutonou in December 2005? Atmos. Chem. Phys. 2010, 10, 895–907. [CrossRef]
34. Menut, L.; Flamant, C.; Turquety, S.; Derioubaix, A.; Chazette, P.; Meynadier, R. Impact of biomass burning on pollutant surfaceconcentrations in mega-cities of the Gulf of Guinea. Atmos. Chem. Phys. 2018, 18, 2687–2707. [CrossRef]
35. Offor, H.; Adie, G.; Ana, G. Review of Particulate Matter and Elemental Composition of Aerosols at Selected Locations in Nigeriafrom 1985–2015. J. Health Pollut. 2016, 6, 1–18. [CrossRef]
36. Ezeh, G.; Obioh, I.; Asubiojo, O. Trace Matals and Source Identification of Air-Borne Particulate Matter Pollution in a NigerianMegacity. J. Environ. Toxicol. 2017, 7, 3. [CrossRef]
37. Taiwo, A.; Arowolo, T.; Abdullah, K.; Taiwo, O. Particulate Matter Pollution in Nigeria. In Proceedings of the 14th Conference onthe Environmental Influence of Atmospheric Science and Technology, Rhodes, Greece, 3–5 September 2015. Available online:https://cest2015.gnest.org/papers/cest2015_poster_paper.pdf (accessed on 25 January 2022).
38. Owoade, O.K.; Fawole, O.G.; Olise, F.S.; Ogundele, L.T.; Olaniyi, H.B.; Almeida, M.S.; Ho, M.D.; Hopke, P.K. Characterizationand source identification of airborne particulate loadings at receptor site-classes of Lagos Mega-City, Nigeria. J. Air Waste Manag.Assoc. 2013, 63, 1026–1035. [CrossRef]
39. Seinfeld, J.H.; Pandis, S.N. Atmospheric Chemistry and Physics: From Air Pollution to Climate Change; John Wiley & Sons: New York,NY, USA, 2006.
40. Interagency Monitoring of Protected Visual Environments (IMPROVE). Available online: http://vista.cira.colostate.edu/Improve/ (accessed on 10 February 2022).
41. Landis, M.; Lewis, C.; Stevens, R.; Keeler, R.; Dvonch, J.; Trembly, R.T. Ft. McHenry tunnel study: Source profiles and mercuryemissions from diesel and gasoline powered vehicles. Atmos. Environ. 2007, 41, 8711–8724. [CrossRef]
42. Leck, C.; Engardt, M.; Heintzenburg, J. A meridional profile of the chemical composition of submicrometre particles over the EastAtlantic Ocean: Regional and hemispheric variabilities. Tellus 2002, 54B, 377–394. [CrossRef]
43. Oluleye, A.; Jimoh, O. Influence of atmospheric circulation patterns on dust transport during the Harmattan Period in WestAfrica. Pollution 2018, 4, 9–27.
44. Chukwuemeka, M.; Adenola, E. Variability of Harmattan Dust Haze Over Northern Nigeria. J. Pollut. 2018, 1, 1000107.45. Oluyemi, E.; Asubojo, O. Ambient Air Particulate Matter in Lagos, Nigeria: A Study Using Receptor Modeling with X-ray
Fluorescent Analysis. Bull. Chem. Soc. Ethiop. 2001, 15, 97–108.46. Hidy, G.M. Worldwide aerosol chemistry: From hemispheric distributions to megacity sources. J. Air Waste Manag. Assoc. 2009,
59, 770–789. [CrossRef]47. Shaw, R., Jr.; Stevens, R.; Bowermaster, J.; Tesch, J.; Tew, E. Measurements of atmospheric nitrate and nitric acid: The Denuder
Difference Experiment. Atmos. Environ. 1982, 16, 845–855. [CrossRef]48. Ashbaugh, L.; Eldred, R. Loss of Particle Nitrate from Teflon Sampling filters. Effects on Measured Gravimetric mass in California
and in the IMPROVE network. J. Air Waste Manag. Assoc. 2002, 54, 93–104. [CrossRef]49. Lim, H.; Turpin, B. Origins of primary and secondary organic aerosol in Atlanta: Results of time-resolved measurements during
the Atlanta supersite experiment. Environ. Sci. Technol. 2002, 36, 4489–4490. [CrossRef]

Atmosphere 2022, 13, 1059 25 of 26
50. Chow, J.C.; Watson, J.G.; Kuhns, H.; Etyemezian, V.; Lowenthal, D.H.; Crow, D.; Kohl, S.D.; Engelbrecht, J.P.; Green, M.C. Sourceprofiles for industrial, mobile, and additional sources in Big Bend Regional Visibility and Observation Study. Chemosphere 2014,554, 185–208.
51. Atiku, F.; Mitchell, E.; Le-Langton, A.; Jones, J.; Williams, A.; Bartle, K. The Impact of Fuel Properties on the Composition of SootProduced by the Combustion of Residential Solid Fuels in a Domestic Stove. Fuel Process. Technol. 2016, 151, 117–125. [CrossRef]
52. Sirignano, C.; Riccio, A.; Chianese, E.; Ni, H.; Zenker, K.; D’Onofrio, A.; Meijer, H.A.J.; Dusek, U. High Contribution of BiomassCombustion to PM2.5 in the City Centre of Naples (Italy). Atmosphere 2019, 10, 451. [CrossRef]
53. Robinson, A.L.; Donahue, N.M.; Shrivastava, M.K.; Weitkamp, E.A.; Sage, A.M.; Grieshop, A.P.; Lane, T.E.; Pierce, J.R.; Pandis,S.N. Rethinking organic aerosols: Semi-volatile emissions and photochemical aging. Science 2007, 315, 1259–1262. [CrossRef]
54. Wang, M.; Huang, R.-J.; Cao, J.; Dai, W.; Zhou, J.; Lin, C.; Ni, H.; Duan, J.; Wang, T.; Chen, Y.; et al. Determination of n-alkanes,polycyclic aromatic hydrocarbons and hopanes in atmospheric aerosol: Evaluation and comparison of thermal desorption GC-MSapproaches. Atmos. Meas. Tech. 2019, 12, 4779–4789. [CrossRef]
55. Brown, S.G.; Herckes, P.; Ashbaugh, L.; Hannigan, M.P.; Kreidenweis, S.M.; Collett, J.L., Jr. Characterization of organic aerosol inBig Bend National Park, Texas. Atmos. Environ. 2002, 36, 5807–5813. [CrossRef]
56. Simoneit, B.R.T. Characterization of organic constituents in aerosols in relation to their origin and transport: A review. Int. J.Environ. Analyt. Chem. 1986, 23, 207–237. [CrossRef]
57. Li, J.; Li, K.; Li, H.; Wang, X.; Wang, W.; Wang, K.; Ge, M. Long-chain alkanes in the atmosphere: A review. J. Environ. Sci. 2022,114, 37–52. [CrossRef]
58. He, D.; Simoneit, B.; Jara, B.; Jaffe, R. Composition and isotopic differences of iso- and anteiso-alkanes in black mangroves(Avicennia germinans) across a salinity gradient in a subtropical estuary. Environ. Chem. 2015, 13, 6230630. [CrossRef]
59. Schauer, J.J.; Kleeman, M.J.; Cass, G.R.; Simoneit, B.R.T. Measurement of emissions from air pollution sources. 5. C1–C32 organiccompounds from gasoline-powered motor vehicles. Environ. Sci. Technol. 2002, 36, 1169–1180. [CrossRef]
60. Schauer, J.J.; Kleeman, M.J.; Cass, G.R.; Simoneit, B.R.T. Measurement of emissions from air pollution sources. 2. C1 through C30organic compounds from medium duty diesel trucks. Environ. Sci. Technol. 1999, 33, 1578–1587. [CrossRef]
61. Popa, O.; Babeano, N.; Popa, I.; Nita, S.; Dinu-Parvu, C. Methods for obtaining and determination of squalene from naturalsources. Biomed. Res. Int. 2015, 2015, 367202. [CrossRef]
62. Budsaereechai, S.; Hunt, A.; Ngernyen, Y. Catalytic pyrolysis of plastic waste for the production of liquid fuels in engines. RSCAdv. 2019, 9, 5844–5857. [CrossRef]
63. Rogge, W.; Hildemann, L.; Mazurek, M.; Cass, G.; Simoneit, B. Sources of fine organic aerosol. 1. Charbroilers and meat cookingoperations. Environ. Sci. Technol. 1991, 25, 1112–1125. [CrossRef]
64. Schauer, J.J.; Kleeman, M.J.; Cass, G.R.; Simoneit, B.R.T. Measurement of emissions from air pollution sources. 3. C1–C29 organiccompounds from fireplace combustion of wood. Environ. Sci. Technol. 2001, 35, 1716–1728. [CrossRef]
65. Kawamura, K.; Bikkina, S. A review of dicarboxylic acids and related compounds in atmospheric aerosols: Molecular distributions,sources and transformation. Atmos. Res. 2016, 170, 140–160. [CrossRef]
66. Wang, Q.; Shao, M.; Zhang, Y.; Wei, Y.; Hu, M.; Guo, S. Source apportionment of fine organic aerosols in Beijing. Atmos. Chem.Phys. 2009, 9, 8573–8585. [CrossRef]
67. Tao, S.; Yin, X.; Jiao, L.; Zhao, S.; Chen, L. Temporal Variability of Source-Specific Solvent-Extractable Organic Compounds inCoastal Aerosols over Xiamen, China. Atmosphere 2017, 8, 33. [CrossRef]
68. Simoneit, B.; Schauer, J.; Nolte, C.; Oros, D.; Elias, V.; Fraser, M.; Rogge, W.; Cass, G. Levoglucosan, a tracer for cellulose inbiomass burning and atmospheric particles. Atmos. Environ. 1999, 33, 173–182. [CrossRef]
69. Kemmo, S.; Ollilainen, V.; Lamopi, A.-M.; Piiromem, V. Determination of sigmasterol and cholesterol using atmospheric pressurechemical ionization liquid chromatography/mass spectroscopy. Food Chem. 2007, 10, 1438–1445. [CrossRef]
70. Lee, A.; Lau, A.; Cheng, J.; Fang, M.; Chan, C. Source identification analysis for the airborne bacteria and fungi using a biomarkerapproach. Atmos. Environ. 2007, 41, 2831–2843. [CrossRef]
71. Lim, Y.; Ziemann, P. Chemistry of Secondary Organic Aerosol Formation from OH Radical-initiated Reactions of Linear, Branched,and Cyclic alkanes in the presence of NO. Aerosol Sci. Technol. 2009, 43, 604–619. [CrossRef]
72. Tkacik, D.; Presto, A.; Donohue, N.; Robinson, A. Secondary organic aerosol formation from intermediate-volatility organiccompounds: Cyclic, linear and branched alkanes. Environ. Sci. Technol. 2012, 46, 8773–8781. [CrossRef]
73. Fehsenfeld, F.; Hastie, D.; Chow, J.; Solomon, P. Particle and Gas Measurements. In Particulate Matter Science for Policy Makers;McMurry, P., Shepherd, M., Vickery, J., Eds.; Cambridge University Press: Cambridge, UK, 2004.
74. Jiminez, O.; Perez-Pastor, R.; Garcia-Alonso, S. Assessment uncertainty associated to the analysis of organic compounds linked toparticulate matter of atmospheric aerosols. Talanta 2010, 80, 1121–1128. [CrossRef]
75. Yttri, K.E.; Schnelle-Kreis, J.; Maenhaut, W.; Abbaszade, G.; Alves, C.; Bjerke, A.; Bonnier, N.; Bossi, R.; Claeys, M.; Dye, C.; et al.An intercomparison study of analytical methods used for quantification of levoglucosan in ambient filter samplers. Atmos. Meas.Tech. 2015, 8, 125–147. [CrossRef]
76. Schantz, M.; Cleveland, D.; Heckert, N.; Kucklick, J.; Leigh, S.; Long, S.; Lynch, J.; Murphy, K.; Olfaz, R.; Pintar, A.; et al.Development of two particulate matte standard reference materials (<4 µm and <10 µm) for the determination of organic andinorganic constituents. Anal. Bioanal. Chem. 2016, 408, 4257–4266. [CrossRef]

Atmosphere 2022, 13, 1059 26 of 26
77. Mancilla, Y.; Medina, G.; Gonzalez, L.; Herckes, P.; Fraser, M.; Mendoza, A. Determination and Similarity Analysis of PM2.5Emission Source Profiles Based on Organic Markers for Monterrey, Mexico. Atmosphere 2021, 12, 554. [CrossRef]
78. Parshintsev, J.; Hyotylainen, T. Methods for characterization of organic compounds in atmospheric aerosol particles. Anal. Bioanal.Chem. 2015, 407, 5877–5897. [CrossRef] [PubMed]
79. Rogge, W.; Ondov, J.; Bernardo-Bricker, A.; Sevimogu, O. Baltimore PM2.5 Supersite: Highly time-resolved organic compounds-sampling duration and phase distribution-implications for health effects studies. Anal. Bioanal. Chem. 2011, 401, 3069–3082.[CrossRef] [PubMed]
80. Cretescu, I.; Lutic, D.; Manea, L. Electrochemical Sensors for Monitoring of Indoor and Outdoor Air Pollution. In ElectrochemicalSensors Technology; Muzibu, R., Asiri, A., Eds.; Intechopin: London, UK, 2017. [CrossRef]
81. Popoola, O. Studies of Urban Air Quality Using Electrochemical Based Sensor Instruments. Ph.D. Dissertation, Queens College,University of Cambridge, Cambridge, UK, 2012.
82. Mead, M.I.; Popoola, O.A.M.; Stewart, G.B.; Landshoff, P.; Calleja, M.; Hayes, M.; Baldovi, J.J.; McLeod, M.W.; Hodgson, T.F.;Dicks, J.; et al. The use of electrochemical sensors for monitoring urban air quality in low-cost, high density networks. Atmos.Environ. 2013, 70, 186–203. [CrossRef]
83. Jiao, W.; Hagler, G.; Williams, R.; Sharpe, R.; Brown, R.; Garver, D.; Judge, R.; Caudill, M.; Rickard, J.; Davis, M.; et al. CommunityAir Sensor Network (CAIRSENSE) project: Evaluation of low-cost sensor performance in a suburban environment in thesoutheastern United States. Atmos. Meas. Tech. 2016, 9, 5281–5292. [CrossRef]
84. Taylor, J.; Henshaw, G.; Aeroqual, Aukland, New Zealand. AQM 65 Colocation Field Study Hartford, CT, USA; UnpublishedReport, 2017.
85. Analytical Methods Committee. What Should Be Done with Results below the Detection Limit? Mentioning the Unmentionable; Tech.Brief No. 5; Royal Society of Chemistry: London, UK, 2001.
Related Documents


![[e-Government Program Action Plan : Lagos, Nigeria]](https://static.cupdf.com/doc/110x72/55840773d8b42af00a8b5143/e-government-program-action-plan-lagos-nigeria.jpg)