Trophic Portfolios in Marine Fisheries:A step towards ecosystem management James N. Sanchirico Fellow Quality of Environment Division Resources for the Future 1616 P Street, NW Washington, D.C. 20036 202–328–5000 [email protected] Martin D. Smith* Assistant Professor of Environmental Economics Nicholas School of the Environment and Earth Sciences Box 90327 Duke University Durham, NC 27708 Telephone: (919) 613-8028 fax: (919) 684-8741 [email protected] *Corresponding Author Selected Paper American Agricultural Economics Association Annual Meeting July 2003, Montreal, Quebec, Canada JEL Codes: Q22 Keywords: ecosystem management, trophic, sustainability Abstract Marine ecologists warn that humans are “fishing down marine food webs.” To explore the economic implications of this phenomenon, this paper applies portfolio theory to aggregate fisheries data. It poses two definitions of a sustainable mean-variance catch frontier. It computes a mean-variance frontier for catch using UNFAO historical fisheries data. Finally, the paper discusses the historical trend in inefficiency. Copyright 2003 by James N. Sanchirico and Martin D. Smith. All rights reserved. Readers may make verbatim copies of this document for non-commercial purposes by any means, provided that this copyright notice appears on all such copies.

Welcome message from author
This document is posted to help you gain knowledge. Please leave a comment to let me know what you think about it! Share it to your friends and learn new things together.
Transcript

Trophic Portfolios in Marine Fisheries:A step towards ecosystem management
James N. Sanchirico Fellow
Quality of Environment Division Resources for the Future
1616 P Street, NW Washington, D.C. 20036
202–328–5000 [email protected]
Martin D. Smith*
Assistant Professor of Environmental Economics Nicholas School of the Environment and Earth Sciences
Box 90327 Duke University
Durham, NC 27708 Telephone: (919) 613-8028
fax: (919) 684-8741 [email protected]
*Corresponding Author
Selected Paper
American Agricultural Economics Association Annual Meeting
July 2003, Montreal, Quebec, Canada
JEL Codes: Q22
Keywords: ecosystem management, trophic, sustainability
Abstract Marine ecologists warn that humans are “fishing down marine food webs.” To explore the economic implications of this phenomenon, this paper applies portfolio theory to aggregate fisheries data. It poses two definitions of a sustainable mean-variance catch frontier. It computes a mean-variance frontier for catch using UNFAO historical fisheries data. Finally, the paper discusses the historical trend in inefficiency.
Copyright 2003 by James N. Sanchirico and Martin D. Smith. All rights reserved. Readers may make verbatim copies of this document for non-commercial purposes by any means, provided that this copyright notice appears on all such copies.

Contents
Introduction............................................................................................................................. 1
A Portfolio Model of Sustainability....................................................................................... 3
Data .......................................................................................................................................... 7
A Preliminary Empirical Exploration of Mean-Variance Portfolios................................. 7
Discussion of Future Work .................................................................................................. 10

Trophic Portfolios in Marine Fisheries: A step towards ecosystem management
James N. Sanchirico and Martin D. Smith
Introduction
The transformation of the marine environment through commercial fishing is one of many examples of human-induced global environmental change. While total production from marine fisheries has steadily increased over the past several decades, the United Nations Food and Agriculture Organization (UNFAO) characterizes 47-50% of marine capture fisheries around the world as “fully exploited,” 15-18% as “overexploited,” and 9-10% as “depleted or recovering from depletion” (UNFAO, 2000). A potential reconciliation of these two trends is that humans are “fishing down marine food webs” (Pauly et al., 1998). That is, average trophic levels for worldwide fish harvest are declining over time as humans sequentially overexploit top predators. Although this phenomenon raises ecological questions on the continued sustainability of ocean ecosystems, the economic implications are unclear. For example, is the current Ricardian pattern of fishing down the food web an efficient use of the marine ecosystem when food production is a stated goal? Are we headed for an ecological and economic crisis by pursuing this pattern of exploitation?
Statistics on overexploitation, studies of global change in the marine environment, and the high levels of uncertainty involved in marine systems have led fishery scientists and mangers to invoke the precautionary principle for management. Some of this literature argues that management should “hedge” against stock collapses, yet the literature on precautionary management of fisheries does not explicitly apply finance theory (e.g. Lauck et al., 1998). Operationally, managers invoking the precautionary principle have traditionally focused on lowering catch totals, closing areas and seasons off to fishing, changing mesh size, and adjusting days-at-sea restrictions. Single species stock assessment models are typically used to set these regulations, but it is the perceived failure of single-species management that has fueled the call for the principle in the first place. This has led many to argue that we need an ecosystem-based
1

Resources for the Future Sanchirico and Smith Nicholas School of the Environment
approach (NRC report), even though it remains unclear how to implement such a system based approach.
We believe modern finance theory presents a structured framework from which managers can begin to understand the trade-offs in managing a portfolio of fish stocks with varying degrees of interdependences. Understanding these interdependences is, of course, critical for implementing an ecosystem-based management system. Unfortunately, we do not have and are a long way from understanding the structural relationships in the marine environment. But, not all hope is lost, because this is similar to finance where the structural interdependences amongst various classes of assets are typically unknown, as prices convey a complex set of contemporaneous and dynamic phenomena. This has not stopped investors, for example, from trying to determine the optimal portfolio; it is just that the work is typically based on reduced form models of these interdependencies via the variance and covariance of portfolio returns. In fisheries, for example, a risk adverse manager can design policies to minimize the variance of returns from the ecosystem (nature's assets) while maintaining a certain mean level of output (catch). In many ways, therefore, portfolio theory provides a means to operationalize and formalize the trade-offs involved in ecosystem-based management without the need for detailed structural models.
The objective of this paper is to evaluate the historical pattern of marine exploitation in the Northwest Atlantic since 1950 using the insights from the capital asset pricing model (CAPM) of modern finance on portfolio analysis. In particular, we treat individual fish stocks as assets and catches as returns on these assets. Changes in catch levels over time reflect both changes in mean returns and variability in returns. The key insight in this approach is that food web interactions induce correlations across different fish stocks and thus influence the sustainable frontier of the harvest portfolio. Using the panel UNFAO data set for the Northwest Atlantic, we compute un-weighted catch means, variances, and covariances in each year by averaging over the historical record of fisheries data. Using this information and numerical optimization techniques, we construct efficient mean-variance frontiers based on two concepts of sustainability: binding and slack sustainability. Binding sustainability is defined on a per stock basis where the traditional single species maximum sustainable yield concept is employed. Slack sustainability, however, is a system measure that is based on the aggregate maximum sustainable yield of a particular region.
With the mean-variance sustainability frontier derived, we can compare the actual patterns of exploitation in the Northwest Atlantic to the efficient sustainability frontiers. This allows us, for example, to measure the inefficiencies of the current distribution of returns
2

Resources for the Future Sanchirico and Smith Nicholas School of the Environment
(catches) across the species relative to the optimal mean-variance allocation. We can also begin to provide answers to important policy questions regarding the distribution of effort across fish stocks. For example, if society wants to reduce the fishing (mean catch) in the Northwest Atlantic by 20%, what are the relative shares across the species that satisfies this reduction at the same time minimizing the variance in the returns? Of course, these are just the types of questions that investors ask regarding asset management, and we believe are the types of questions that need to be addressed to better understand ecosystem-based management.
A contribution of this study is the use of portfolio analysis and the calculation of portfolio risk over time with aggregate fisheries data. A recent study of agricultural cropping patterns shows that the opposite phenomenon of fishing down is underway in agriculture (Blank, 2001). That is, farmers over time have substituted into high mean return high variance crops, essentially getting “squeezed up the farming food chain.” Existing studies that apply portfolio theory to fishing focus on single-species fisheries and assume that assets within the portfolio are uncorrelated (Walters, 1975; Baldursson and Magnusson, 1997) .The most recent study of Baldursson and Magnusson treats age cohorts as separate assets and finds substantial inefficiencies. Our paper is the first to treat individual fisheries as assets in the portfolio and to consider asset return correlations.
The next section develops a portfolio model of sustainability. We propose two different sustainable frontiers, one that is stricter than the other. The following section discusses our preliminary empirical work using fisheries data from the Northwest Atlantic. In the final section, we discuss directions for future work.
A Portfolio Model of Sustainability
There is a long tradition in fisheries management of making a series of marginal management decisions on per stock basis without taking into account the interrelationships in the marine food web. As fisheries ecology has developed more sophisticated models of multiple species and spatial heterogeneity of resources, fisheries management has started to place greater emphasis on the composition of aggregate catch within each region, spatially explicit policy, and ultimately ecosystem-based management. The work of Pauly et al. certainly contributes to this new emphasis. Similarly, the extreme uncertainties involved in marine systems have led fisheries ecologists to call for approaches that explicitly model uncertainty (e.g. Walters, 1986; Hilborn and Mangel, 1997).
3
Resources for the Future Sanchirico and Smith Nicholas School of the Environment
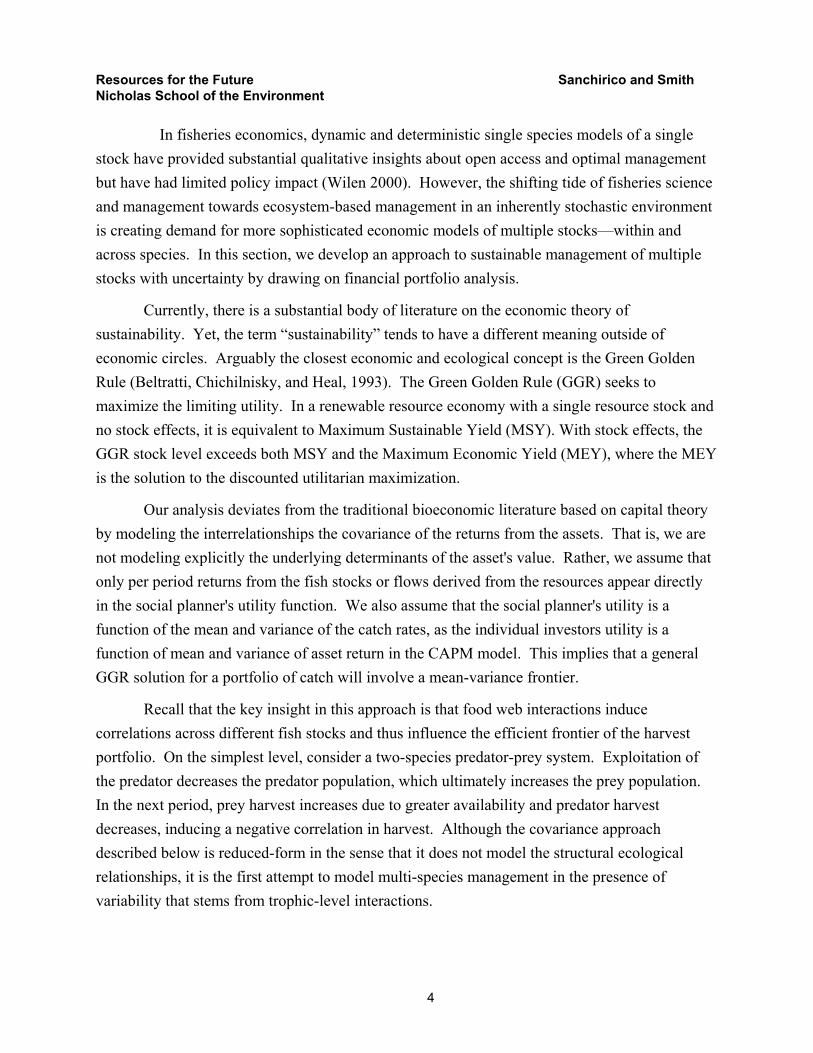
In fisheries economics, dynamic and deterministic single species models of a single stock have provided substantial qualitative insights about open access and optimal management but have had limited policy impact (Wilen 2000). However, the shifting tide of fisheries science and management towards ecosystem-based management in an inherently stochastic environment is creating demand for more sophisticated economic models of multiple stocks—within and across species. In this section, we develop an approach to sustainable management of multiple stocks with uncertainty by drawing on financial portfolio analysis.
Currently, there is a substantial body of literature on the economic theory of sustainability. Yet, the term “sustainability” tends to have a different meaning outside of economic circles. Arguably the closest economic and ecological concept is the Green Golden Rule (Beltratti, Chichilnisky, and Heal, 1993). The Green Golden Rule (GGR) seeks to maximize the limiting utility. In a renewable resource economy with a single resource stock and no stock effects, it is equivalent to Maximum Sustainable Yield (MSY). With stock effects, the GGR stock level exceeds both MSY and the Maximum Economic Yield (MEY), where the MEY is the solution to the discounted utilitarian maximization.
Our analysis deviates from the traditional bioeconomic literature based on capital theory by modeling the interrelationships the covariance of the returns from the assets. That is, we are not modeling explicitly the underlying determinants of the asset's value. Rather, we assume that only per period returns from the fish stocks or flows derived from the resources appear directly in the social planner's utility function. We also assume that the social planner's utility is a function of the mean and variance of the catch rates, as the individual investors utility is a function of mean and variance of asset return in the CAPM model. This implies that a general GGR solution for a portfolio of catch will involve a mean-variance frontier.
Recall that the key insight in this approach is that food web interactions induce correlations across different fish stocks and thus influence the efficient frontier of the harvest portfolio. On the simplest level, consider a two-species predator-prey system. Exploitation of the predator decreases the predator population, which ultimately increases the prey population. In the next period, prey harvest increases due to greater availability and predator harvest decreases, inducing a negative correlation in harvest. Although the covariance approach described below is reduced-form in the sense that it does not model the structural ecological relationships, it is the first attempt to model multi-species management in the presence of variability that stems from trophic-level interactions.
4
Resources for the Future Sanchirico and Smith Nicholas School of the Environment
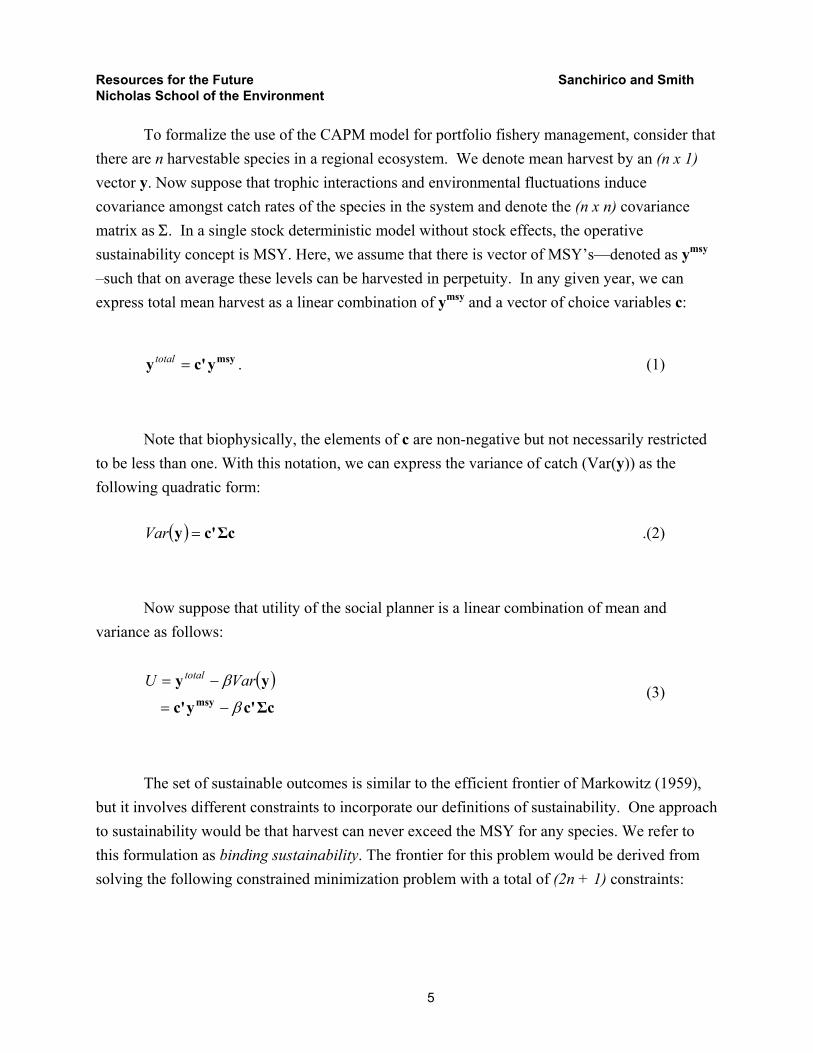
To formalize the use of the CAPM model for portfolio fishery management, consider that there are n harvestable species in a regional ecosystem. We denote mean harvest by an (n x 1) vector y. Now suppose that trophic interactions and environmental fluctuations induce covariance amongst catch rates of the species in the system and denote the (n x n) covariance matrix as Σ. In a single stock deterministic model without stock effects, the operative sustainability concept is MSY. Here, we assume that there is vector of MSY’s—denoted as ymsy –such that on average these levels can be harvested in perpetuity. In any given year, we can express total mean harvest as a linear combination of ymsy and a vector of choice variables c:
msyyc'y =total . (1)
Note that biophysically, the elements of c are non-negative but not necessarily restricted to be less than one. With this notation, we can express the variance of catch (Var(y)) as the following quadratic form:
( ) Σcc'y =Var .(2)
Now suppose that utility of the social planner is a linear combination of mean and variance as follows:
( )Σcc'yc'
yymsy β
β
−=
−= VarU total
(3)
The set of sustainable outcomes is similar to the efficient frontier of Markowitz (1959), but it involves different constraints to incorporate our definitions of sustainability. One approach to sustainability would be that harvest can never exceed the MSY for any species. We refer to this formulation as binding sustainability. The frontier for this problem would be derived from solving the following constrained minimization problem with a total of (2n + 1) constraints:
5
Resources for the Future Sanchirico and Smith Nicholas School of the Environment
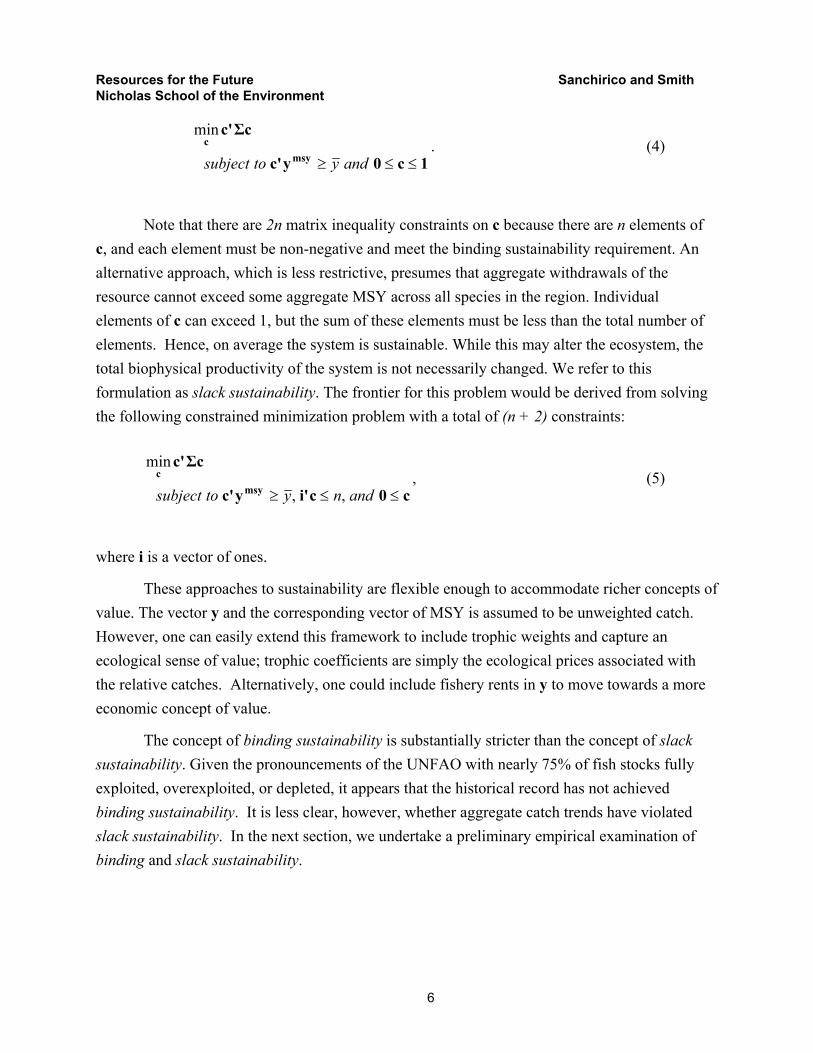
1c0yc'
Σcc'
msyc
≤≤≥ andytosubject
min. (4)
Note that there are 2n matrix inequality constraints on c because there are n elements of c, and each element must be non-negative and meet the binding sustainability requirement. An alternative approach, which is less restrictive, presumes that aggregate withdrawals of the resource cannot exceed some aggregate MSY across all species in the region. Individual elements of c can exceed 1, but the sum of these elements must be less than the total number of elements. Hence, on average the system is sustainable. While this may alter the ecosystem, the total biophysical productivity of the system is not necessarily changed. We refer to this formulation as slack sustainability. The frontier for this problem would be derived from solving the following constrained minimization problem with a total of (n + 2) constraints:
c0ci'yc'
Σcc'
msyc
≤≤≥ andnytosubject ,,
min, (5)
where i is a vector of ones.
These approaches to sustainability are flexible enough to accommodate richer concepts of value. The vector y and the corresponding vector of MSY is assumed to be unweighted catch. However, one can easily extend this framework to include trophic weights and capture an ecological sense of value; trophic coefficients are simply the ecological prices associated with the relative catches. Alternatively, one could include fishery rents in y to move towards a more economic concept of value.
The concept of binding sustainability is substantially stricter than the concept of slack sustainability. Given the pronouncements of the UNFAO with nearly 75% of fish stocks fully exploited, overexploited, or depleted, it appears that the historical record has not achieved binding sustainability. It is less clear, however, whether aggregate catch trends have violated slack sustainability. In the next section, we undertake a preliminary empirical examination of binding and slack sustainability.
6

Resources for the Future Sanchirico and Smith Nicholas School of the Environment
Data
We calculate the mean-variance efficient frontier for the Northwest Atlantic region across ten species categories.1 Using FISHSTAT Plus, we obtained catch data by species from 1950 through 2001. We consider the nine main species listed in Grainger and Garcia (Table 4) and aggregate all other species into a tenth category. The nine individual species include: Atlantic cod, Atlantic herring, Atlantic mackerel, Atlantic redfishes, Greenland halibut, haddock, red hake, saithe, and silver hake.
In Table 1, we present the correlation coefficients on catch rates calculated over the entire period. What is clearly evident is that certain stocks are negatively correlated and others are positively correlated. For example, the returns from Cod have a correlation coefficient of -.6 with Greenland halibut. On the other hand, Red hake has a correlation coefficient of .748 with Silver hake, which is probably not surprising given the similarities in catching technology and habitat preferences.
We also plot the trend in total catch in the region over the period along with the relative shares across the species in Figure 1 and Figure 2. It is clearly evident that catches in this region have fallen since 1974, but there does appear to be a slight upward trend in the most recent years. It is also interesting to see the shift in relative shares of catches across the species in the complex that followed the collapse of the cod fisheries in mid-1990s.
A Preliminary Empirical Exploration of Mean-Variance Portfolios
To derive the sustainability frontiers, we need to make two additional assumptions. First, we assume that the covariance in actual catch over the entire time horizon reflects the true covariance in long-run mean catch. Thus, we compute a single covariance matrix, , from the 52 years of data. Second, we assume that MSY ( ) is 2/3 of the maximum observed catch
over the time horizon.2 Clearly, this is an ad hoc assumption but one that is necessary to get some preliminary results because it allows us to express the choice variables as multipliers of MSY.3
Σmsyy
1 In ongoing work, we are expanding this analysis worldwide and to include a much larger set of species. 2 Our definition of MSY results in lower levels than we would find using current FAO definition, which is the maximum historical catch. Therefore, our frontier and definition for the binding sustainability is slightly more restrictive than otherwise would be the case. We do know, however, that results derived using the FAO definition will reside in between the binding and slack frontiers. 3 This is a simplifying assumption for the time being. Eventually, we plan to use more sophisticated assessments of MSY based on fishery and fishery-independent data.
7

Resources for the Future Sanchirico and Smith Nicholas School of the Environment
To derive the frontiers, we use and to solve the relevant constrained
minimization problems for different values of the minimum aggregate catch. For binding sustainability, we solve a series of problems in (4) by parameterizing
Σ msyy
y . For slack sustainability,
we follow the same procedure but use (5). These procedures provide two sustainability frontiers that we assume are time-invariant.
To compare the frontiers to observed catch, we need to assess mean catch and variance of catch for the observed data. We take actual total catch in each year as an estimate of mean catch )y( . In order to compute estimated variance, we need to know the mulipliers for each year t (and not just actual catch). To find , we back them out using actual catch and . For
example,
cc msyy
msycod
tcodtcod y
catchc
ˆˆ ,
, = . Then we compute variance as follows: ttty 'c)ˆvar( = cΣˆˆ .
Before proceeding, we evaluate the extent to which sustainability constraints have been violated in the existing historical record of exploitation. To do this, we use the calculatedc in each year to check the constraints. Unlike in the Markowitz model, it is possible for observed mean-variance points to lie beyond the frontier. This is due to the fact that the frontiers in our paper are based on constraints that are normative rather than positive in the short run. Though it is physically impossible to violate sustainability constraints in perpetuity—assuming that we have defined them sensibly—it is physically possible to violate them in the short run. When constraints are not violated, falling short of the frontier is a source of inefficiency. When constraints are violated, the normative implication of whether actual fishing activity falls to the left or to the right of the frontier is unclear.
ˆ
Starting with binding sustainability, we need to check a constraint for each species in each year. Based on the way that we computed , it is impossible that binding sustainability could hold in every year. To see this, recall that we defined y as 2/3 of maximum catch for
that species over the sample period. As such, there is at least one year (for each species) in which catch is 50% greater than MSY. However, somewhat to our surprise, 1950 and 1952 are the only years in which binding sustainability holds, i.e. none of the constraints are violated. One interpretation of this result is that at least one key species is always being exploited at a rate beyond its MSY. Yet, it is important to recognize that violations of binding sustainability may be partly an artifact of creating a category for all other species. Defining MSY of all other species as 2/3 of the maximum catch in this category may be overly restrictive in an ecological sense because the composition of that category is changing over time, and there may be sufficient ecological substitution possibilities to allow for greater than 2/3 of the maximum observed catch
msyymsyˆ
8

Resources for the Future Sanchirico and Smith Nicholas School of the Environment
in the long run. If we allow the constraint on ‘all other species’ to be violated, the remaining constraints on hold in 19 years: 1950-53, 1976-78, 1980-84, 1989-91, and 1995-98. That is, with this modification binding sustainability holds in 19 years out of 52.
c
For slack sustainability, there is only a constraint on the sum of . Specifically, we need only check that i in each year, since there are ten species categories. In all years, the constraints for slack sustainability hold for the observed fishing data. That is, slack sustainability is never violated.
c10ˆ' ≤c
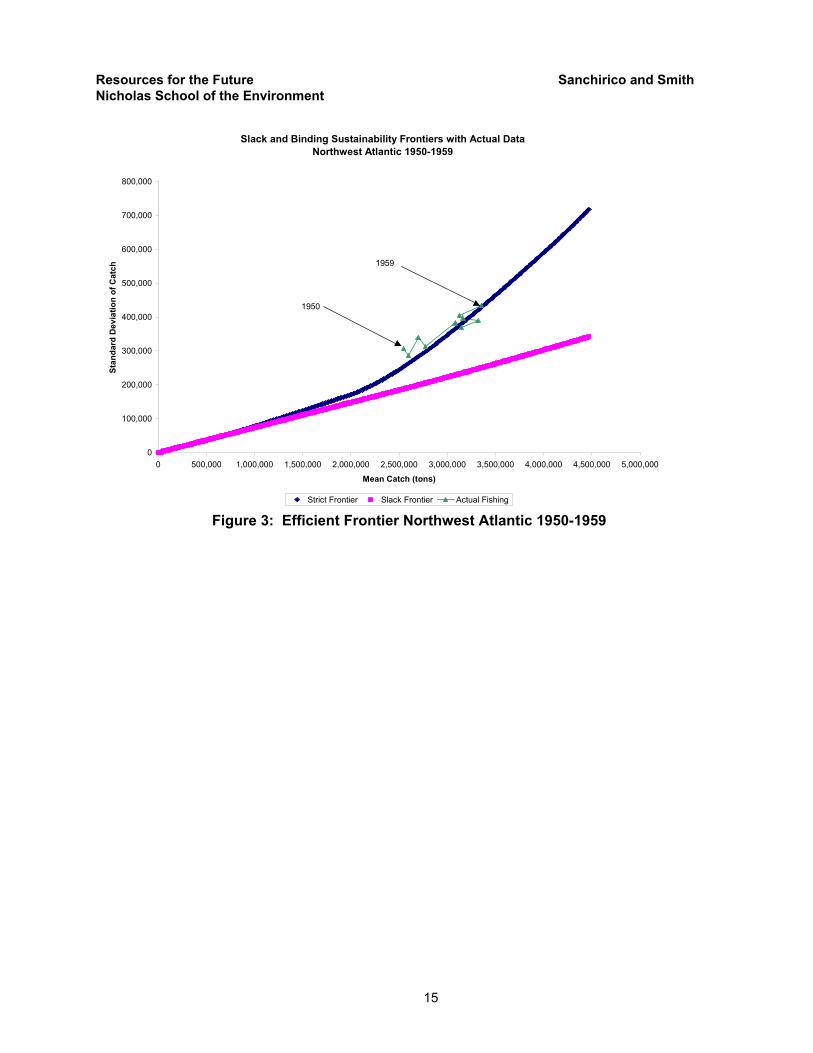
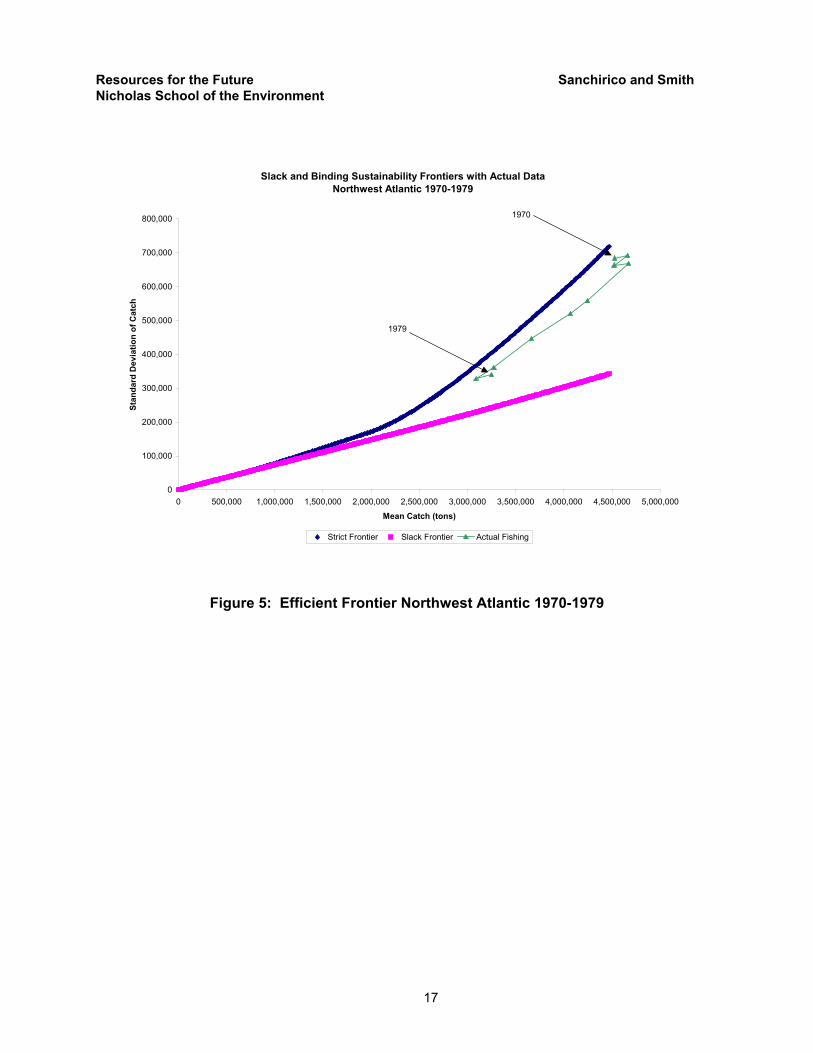
Figures 3-7 depict the two sustainability frontiers with actual catch data from the Northwest Atlantic plotted over different time intervals. In each figure, mean catch is along the x-axis and standard deviation is along the y-axis. Since the frontiers are time-invariant, they appear the same in each picture. The strict frontier corresponds to binding sustainability, while the slack frontier represents slack sustainability. The two frontiers coincide for low values of mean catch. This is due to the fact that minimizing variance subject to low mean catch leads to a diversification strategy across species such that none of the binding sustainability constraints actually bind. For larger mean catch values, the two frontiers diverge because the larger means require that the optimal c’s hit the binding sustainability constraints before the total of the optimal c’s would exceed n.
By comparing Figures 3-7 to each other, some interesting patterns emerge. Although the actual catch data violate the binding sustainability constraints in all but two years, the catch data do hover around this frontier throughout the period. The slack frontier is substantially below the actual data. This raises an interesting question: if the MSY’s are exceeded anyway, is it possible to further increase mean catches or decrease variances? In other words, if society is not going to impose the strict frontier, is it possible biophysically to move closer to the slack frontier?
During the 1970s and 1980s, the actual catch data lie between the two frontiers, which is in contrast to earlier and later periods. From a binding sustainability point of view, this may be troubling. Nevertheless, the question remains whether there are short-run efficiency gains associated with these points.
Another noteworthy pattern is that directional changes in actual catch are infrequent. In the 1950s and 1960s, mean and standard deviation are both steadily increasing, while in the 1970s mean and standard deviation circle back around the frontier and steadily decrease. Only in the 1980s and 1990s do the directional changes become more frequent.
9
Resources for the Future Sanchirico and Smith Nicholas School of the Environment
Discussion of Future Work
One direction for future work is to determine distance from the efficient frontier and whether this inefficiency is increasing or decreasing over time.
An important assumption in our empirical work is that the covariance matrix computed over the entire catch sample is the best estimate for the true covariance matrix that reflects structural bioeconomic relationships. An alternative is to average backwards in a sequential manner such that the estimated covariance in each time period is different. The corresponding sustainability frontiers would thus be time-varying.
So far in this paper, we treat all catch as having the same value. To evaluate the importance of ‘fishing down’, a an important future direction is to weight catch by trophic level. This would allow us to define ecologically efficient frontiers and again assess the current trend in inefficiency by measuring the distance from the frontier and the observed patterns of exploitation. The weighted moments will be determined by trophic coefficients, which are taken from the FISHBASE data set and allow us to investigate whether fishing down the food web actually increases or decreases efficiency.
Finally, we plan to examine the importance of the overall approach by constructing efficient portfolios based on the counterfactual assumption that exploitation levels of different fish stocks are uncorrelated. Although we employ some simplifying assumptions on correlations, this paper provides a foundation for further research on applying portfolio theory to ecosystem-based management on a regional scale and will ultimately lead to a better understanding of how to manage the marine environment in the face of substantial uncertainty.
10
Resources for the Future Sanchirico and Smith Nicholas School of the Environment
References
Baldursson, F.M. and G. Magnusson (1997), “Portfolio Fishing,” Scandinavian Journal of Economics 99(3), 389-403.
Beltratti, Andrea, Graciela Chichilnisky, and Geoffrey M. Heal, “Sustainable growth and the green golden rule,” in I. Goldin and L.A. Winters, eds., Approaches to Sustainable Economic Development, pp. 147-172, Paris: Cambridge University Press for the OECD, 1993.
Blank, S.C. (2001), “Producers Get Sqeezed up the Farming Food Chain: A Theory of Crop Portfolio Composition and Land Use,” Review of Agricultural Economics 23(2), 404-422.
FISHBASE, http://www.fishbase.org/search.html.
FISHSTAT Plus (2003), http://www.fao.org/fi/statist/FISOFT/FISHPLUS.asp.
Grainger, R.J.R and S.M. Garcia (1996), Chronicles of marine fishery landings (1950-1994): Trend analysis and fisheries potential, FAO Fisheries Technical Paper 359, Rome: Food and Agriculture Organization of the United Nations.
Hilborn, Ray and Marc Mangel (1997), The Ecological Detective: Confronting Models with Data, Princeton, NJ: Princeton University Press.
Lauck, T.C., C.W. Clark, M. Mangel, and G.R. Munro (1998), “Implementing the Precautionary Principle in Fisheries Management Through Marine Reserves,” Ecological Applications 8(1), S72-S78.
11

Resources for the Future Sanchirico and Smith Nicholas School of the Environment
Markowitz, Harry (1959), Portfolio Selection, New York: John Wiley and Sons.
Pauly, D., V. Christensen, J. Dalsgaard, R. Froese, and F. Torres, Jr. (1998), “Fishing Down Marine Food Webs,” Science 279, 860-863.
United Nations Food and Agriculture Organization (2000), The State of the World Fisheries and Aquaculture, online at http://www.fao.org/DOCREP/003/X8002E/x8002e00.htm.
Walters, C. (1975), “Optimal Harvest Strategies for Salmon in Relation to Environmental Variability and Uncertain Production Parameters,” Journal of the Fisheries Research Board of Canada 32, 1777-1784.
Walters, Carl (1986) Adaptive Management of Renewable Resources, New York: Macmillan Publishing Company, (reprinted by Fisheries Centre, University of British Columbia, 1997).
Wilen, James E. (2000), “Renewable Resource Economists and Policy: What Differences Have We Made?” Journal of Environmental Economics and Management 39(3), 306-327.
12

Resources for the Future Sanchirico and Smith Nicholas School of the Environment
Tables and Figures
Table 1: Correlation Coefficients of Catch in Northwest Atlantic 1950-2001
Other
Atlantic
cod
Atlantic
herring
Atlantic
mackerel
Atlantic
redfishes
nei
Greenland
halibut Haddock
Red
hake
Saithe
(Pollock) Silver hake
Other 1.000
Atlantic cod -0.597 1.000
Atlantic herring 0.067 0.439 1.000
Atlantic mackerel 0.408 0.093 0.560 1.000
Atlantic redfishes nei -0.251 0.672 0.311 0.412 1.000
Greenland halibut 0.699 -0.603 0.226 0.225 -0.355 1.000
Haddock -0.707 0.701 -0.186 -0.381 0.363 -0.802 1.000
Red hake -0.034 0.488 0.484 0.491 0.461 -0.019 0.237 1.000
Saithe(Pollock) -0.062 0.219 -0.340 -0.096 0.223 -0.292 0.339 -0.150 1.000
Silver hake 0.055 0.491 0.433 0.611 0.556 -0.074 0.152 0.748 0.030 1.000
13

Resources for the Future Sanchirico and Smith Nicholas School of the Environment
0
1000000
2000000
3000000
4000000
5000000
6000000
1950
1952
1954
1956
1958
1960
1962
1964
1966
1968
1970
1972
1974
1976
1978
1980
1982
1984
1986
1988
1990
1992
1994
1996
1998
2000
Cat
ch L
evel
s
Figure 1: Trends in Catch Levels in Northwest Atlantic
0
0.1
0.2
0.3
0.4
0.5
0.6
0.7
0.8
1950
1952
1954
1956
1958
1960
1962
1964
1966
1968
1970
1972
1974
1976
1978
1980
1982
1984
1986
1988
1990
1992
1994
1996
1998
2000
Shar
e of
Tot
al C
atch
Atlantic cod
Atlantic herring
Atlantic mackerel
Atlantic redfishes nei
Greenland halibut
Haddock
Red hake
Saithe(=Pollock)
Silver hake
Total of "Other"
Figure 2: Relative Shares of Total Catch in the Northwest Atlantic from 1950-2001
14
Resources for the Future Sanchirico and Smith Nicholas School of the Environment
Slack and Binding Sustainability Frontiers with Actual DataNorthwest Atlantic 1950-1959
0
100,000
200,000
300,000
400,000
500,000
600,000
700,000
800,000
0 500,000 1,000,000 1,500,000 2,000,000 2,500,000 3,000,000 3,500,000 4,000,000 4,500,000 5,000,000
Mean Catch (tons)
Stan
dard
Dev
iatio
n of
Cat
ch
Strict Frontier Slack Frontier Actual Fishing
1950
1959
Figure 3: Efficient Frontier Northwest Atlantic 1950-1959
15

Resources for the Future Sanchirico and Smith Nicholas School of the Environment
Slack and Binding Sustainability Frontiers with Actual DataNorthwest Atlantic 1960-1969
0
100,000
200,000
300,000
400,000
500,000
600,000
700,000
800,000
900,000
0 500,000 1,000,000 1,500,000 2,000,000 2,500,000 3,000,000 3,500,000 4,000,000 4,500,000 5,000,000
Mean Catch (tons)
Stan
dard
Dev
iatio
n of
Cat
ch
Strict Frontier Slack Frontier Actual Fishing
1969
1960
Figure 4: Efficient Frontier Northwest Atlantic 1960-1969
16
Resources for the Future Sanchirico and Smith Nicholas School of the Environment
Slack and Binding Sustainability Frontiers with Actual DataNorthwest Atlantic 1970-1979
0
100,000
200,000
300,000
400,000
500,000
600,000
700,000
800,000
0 500,000 1,000,000 1,500,000 2,000,000 2,500,000 3,000,000 3,500,000 4,000,000 4,500,000 5,000,000
Mean Catch (tons)
Stan
dard
Dev
iatio
n of
Cat
ch
Strict Frontier Slack Frontier Actual Fishing
1970
1979
Figure 5: Efficient Frontier Northwest Atlantic 1970-1979
17

Resources for the Future Sanchirico and Smith Nicholas School of the Environment
Slack and Binding Sustainability Frontiers with Actual DataNorthwest Atlantic 1980-1989
0
100,000
200,000
300,000
400,000
500,000
600,000
700,000
800,000
0 500,000 1,000,000 1,500,000 2,000,000 2,500,000 3,000,000 3,500,000 4,000,000 4,500,000 5,000,000
Mean Catch (tons)
Stan
dard
Dev
iatio
n of
Cat
ch
Strict Frontier Slack Frontier Actual Fishing
1989
1980
Figure 6: Efficient Frontier Northwest Atlantic 1980-1989
18

Resources for the Future Sanchirico and Smith Nicholas School of the Environment
Slack and Binding Sustainability Frontiers with Actual DataNorthwest Atlantic 1990-2001
0
100,000
200,000
300,000
400,000
500,000
600,000
700,000
800,000
0 500,000 1,000,000 1,500,000 2,000,000 2,500,000 3,000,000 3,500,000 4,000,000 4,500,000 5,000,000
Mean Catch (tons)
Stan
dard
Dev
iatio
n of
Cat
ch
Strict Frontier Slack Frontier Actual Fishing
1990
2001
Figure 7: Efficient Frontier Northwest Atlantic 1990-2001
19
Related Documents