Paper ID #14030 Development of a Laboratory set-up interfacing Programmable Logic Con- troller (PLC), Variable Frequency Drive (VFD) and HVAC Applications Dr. Ahmed Cherif Megri, North Carolina A&T State University Dr. Ahmed Cherif Megri, Associate Professor of Architectural Engineering (AE). He teaches capstone, lighting, electrical, HVAC and energy design courses. He is the ABET Coordinator for the AE Program. His research areas include airflow modeling, zonal modeling, energy modeling, and artificial intelligence modeling using the support vector machine learning approach. Dr. Megri holds a PhD degree from INSA at Lyon (France) in the area of Thermal Engineering and a ”Habilitation” (HDR) degree from Pierre and Marie Curie University - Paris VI, Sorbonne Universities (2011) in the area of Engineering Sciences. Prior to his actual position, he was an Associate Professor at University of Wyoming (UW) and prior to that he was an Assistant Professor and the Director of the AE Program at Illinois Institute of Technology (IIT). He participated significantly to the development of the current architectural engineering undergraduate and master’s programs at IIT. During his stay at IIT, he taught thermal and fluids engineering (thermody- namics, heat transfer, and fluid mechanics), building sciences, physical performance of buildings, building enclosure, as well as design courses, such as HVAC, energy, plumbing, fire protection and lighting. Also, he supervises many courses in the frame of interprofessional projects (IPRO) program. Dr. Megri wrote over 100 journal and conference papers. Overall, Dr. Megri taught more than 30 different courses at University level in the AE area. Areas of Interests: - Zonal modeling approach, - Integration zonal models/building energy simulation models, - Zero Net Energy (ZNE) building, - Airflow in Multizone Buildings & Smoke Control, - Thermal Comfort & Indoor Air Quality, - Predictive modeling and forecasting: Support Vector Machine (SVM) tools, - Energy, HVAC, Plumbing & Fire Protection Systems Design, - Computational Fluid Dynamic (CFD) Application in Building, - BIM & REVIT: application to HVAC and Electrical/Lighting Design systems. c American Society for Engineering Education, 2015 Page 26.520.1

Welcome message from author
This document is posted to help you gain knowledge. Please leave a comment to let me know what you think about it! Share it to your friends and learn new things together.
Transcript

Paper ID #14030
Development of a Laboratory set-up interfacing Programmable Logic Con-troller (PLC), Variable Frequency Drive (VFD) and HVAC Applications
Dr. Ahmed Cherif Megri, North Carolina A&T State University
Dr. Ahmed Cherif Megri, Associate Professor of Architectural Engineering (AE). He teaches capstone,lighting, electrical, HVAC and energy design courses. He is the ABET Coordinator for the AE Program.His research areas include airflow modeling, zonal modeling, energy modeling, and artificial intelligencemodeling using the support vector machine learning approach. Dr. Megri holds a PhD degree from INSAat Lyon (France) in the area of Thermal Engineering and a ”Habilitation” (HDR) degree from Pierre andMarie Curie University - Paris VI, Sorbonne Universities (2011) in the area of Engineering Sciences. Priorto his actual position, he was an Associate Professor at University of Wyoming (UW) and prior to that hewas an Assistant Professor and the Director of the AE Program at Illinois Institute of Technology (IIT).He participated significantly to the development of the current architectural engineering undergraduateand master’s programs at IIT. During his stay at IIT, he taught thermal and fluids engineering (thermody-namics, heat transfer, and fluid mechanics), building sciences, physical performance of buildings, buildingenclosure, as well as design courses, such as HVAC, energy, plumbing, fire protection and lighting. Also,he supervises many courses in the frame of interprofessional projects (IPRO) program. Dr. Megri wroteover 100 journal and conference papers. Overall, Dr. Megri taught more than 30 different courses atUniversity level in the AE area.
Areas of Interests: - Zonal modeling approach, - Integration zonal models/building energy simulationmodels, - Zero Net Energy (ZNE) building, - Airflow in Multizone Buildings & Smoke Control, - ThermalComfort & Indoor Air Quality, - Predictive modeling and forecasting: Support Vector Machine (SVM)tools, - Energy, HVAC, Plumbing & Fire Protection Systems Design, - Computational Fluid Dynamic(CFD) Application in Building, - BIM & REVIT: application to HVAC and Electrical/Lighting Designsystems.
c©American Society for Engineering Education, 2015
Page 26.520.1

ASEE Annual Conference, 2015
Development of a Laboratory set-up interfacing Programmable Logic Controller
(PLC), Variable Frequency Drive (VFD) and HVAC Applications
Ahmed Cherif Megri, PhD, HDR
North Carolina A&T State University
In this day and age, technology is improving the system performance and saving energy. From being
able to use cellular phones as cameras, computers the sizes of notebooks, and vehicles that run on
renewable energy other than fossil fuels. Building automation is delegating the task of controlling the
systems of a building such as lighting, electrical, HVAC, and mechanical systems of a building, to a
computer. While this control is an incredible feat of technology, its primary purpose is to conserve
energy. Two of the most popular pieces of building automation equipment are Programming Logic
Controllers (PLC) and Variable Frequency Drives (VFD).
The Variable Frequency Drives (VFD) is a device used to save energy. Most commonly used in driving
motors of pumps, fans, and HVAC systems of commercial and residential buildings. These devices
function by granting the user control of the output of a motor by regulating the frequency.
Programming Logic Controllers (PLC) are devices that can be used to control the automated processes
in machines.
The purpose of this paper is to demonstrate the design and implementation of an experiment, from
basic components, based on real powered electrical circuits that include a variable Frequency Drive
(VFD) to control the three phase variable speed motor of a fan integrated to a Programming Logic
Controller (PLC). Our objective is to verify several alternatives of this technology to control the
variable-frequency motors on fans to manage the volume of air moved to match the demand of the
system. Thus objectives are:
System integration of different electrical components to make a whole system composed of:
PLC, VFD, three phase motor, motor starters, relays, contactors, transducers, weather station,
and Ethernet communication system.
Experimental investigation of several alternatives (a) the power factors, inductive reactance and
resistance for the fan motor, as a function of the frequency, (b) the electrical power measured
for different value of the frequency,
Development of a better understanding as to how each of the above factors impact the energy
consumption,
Development of appropriate and novel methods to design and to analyze the control of
ventilation system,
Quantitative estimation of the energy saving potential in practical applications
Most importantly, project methodology will be discussed. We discuss the project design program from
students’ point of view, and the experience earned in design, integration, and also in written and oral
communication skills. Methodology used to evaluate the effectiveness of the capstone design program
in term of learning outcomes is also described.
Page 26.520.2
ASEE Annual Conference, 2015
Introduction:
In this day and age, technology is improving the system performance and saving energy. From
being able to use cellular phones as cameras, computers the sizes of notebooks, and vehicles that
run on renewable energy other than fossil fuels. Another popular topic is building automation.
Building automation is delegating the task of controlling the systems of a building such as
lighting, electrical, HVAC, and mechanical systems of a building, to a computer. While this
control is an incredible feat of technology, its primary purpose is to conserve energy. Two of the
most popular pieces of building automation equipment are Programming Logic Controllers
(PLC) and Variable Frequency Drives (VFD).
The Variable Frequency Drives (VFD) is a device used to save energy. Most commonly used in driving
motors of pumps, fans, and HVAC systems of commercial and residential buildings. These devices
function by granting the user control of the output of a motor by regulating the frequency. By reducing
the amperage the motor receives, it reduces energy usage during time of system inactivity. Inversely,
the motor can be turned to maximum during peak usage. In an HVAC system, the physical VFD is
connected to the motor of the fan for its regulation.
The cost and functionality of state-of-the-art PWM variable frequency drives makes them a very
attractive control option for owners and operators of multiples systems to save energy and reduce noise
in non-peak periods. For example, in the case of cooling tower cells, the sophistication of the system
controls, and the cost will dictate the selection of fan controls; however, the most fan-energy efficient
control option is the variable frequency drive.
Type Of Load
Applications
Energy Consideration
Variable Torque Load
- HP varies as the cube of the
speed
- Torque varies as the square
speed
- Centrifugal Fans
- Centrifugal Pumps -
Blowers
- HVAC Systems
Lower speed operation results in
significant energy savings as
power to the motor drops with
the cube of the speed.
Constant Torque Load
- Torque remains the same at
all speeds
- HP varies directly with the
speed.
- Mixers
- Conveyors
- Compressors
- Printing Presses
Lower speed operation saves
energy in direct proportion to the
speed reduction.
Constant Horsepower Load -
Develops the same
horsepower at all speeds.
- Torque varies inversely with
the speed.
- Machine tools -
Lathes
- Milling machines -
Punch presses
No energy savings at reduced
speeds; however, energy savings
can be realized by attaining the
optimized cutting and machining
speeds for the part being produced.
Programming Logic Controllers (PLC) are devices that can be used to control the automated
processes in machines. While the first PLC, the model 084, was invented by Dick Morley in the
1969, the first commercially successful PLC was made in 1973 by Michael Greenberg. PLCs
function with one of the following, but not limited to programming languages, Ladder Logic,
Page 26.520.3

ASEE Annual Conference, 2015
Function Block Logic, and Structured Text (1). These are accessed by either the LED screen or
computer interface. The interface may be an LED display on the front of the device. While this
may seem similar to a VFD, there are several differences. The primary difference is that PLCs
are not limited to just motors. Through a MODBUS cable PLCs can send and receive data from
different machines (2). This difference combined with equipment like occupancy sensors allows
for a higher level of customization of building and machining equipment.
In our case, an axial fan in a warehouse setting, it could be easily fitted with a VFD, PLC, and
MODBUS cable to better and more accurately control the functions of an HVAC system.
To start take a VFD from the VFD-S 230V series, these are noted for the MODBUS compatibility, and
connected it to the fan's motor. The PLC of choice is a model 1790-T16-BV0X, made by Allen
Bradley, for input and output. This allows it to connect to the VFD and to a computer. The MODBUS
cable chosen is the 8777 Multi-Conductor - Shielded Twisted Pair Cable.
With this understanding of both VFDs and PLCs, it can be seen how these two devices have come to
play an important role in the automation of building systems. And with improved controls of build
systems, energy consumption can be more effectively reduced when building are not operating at peak
hours.
In this report, the experimental and simulation works performed will be presented: the installation
construction, and the experimental testing results, as well energy and airflow simulations.
Thus the objectives of this project are:
System interfacing of different electrical components to make a whole system composed of:
PLC, VFD, three phase motor, motor starters, relays, contactors, transducers, weather station,
and Ethernet communication system,
Experimental investigation of several alternatives (a) the power factors, inductive reactance and
resistance for the fan motor, as a function of the frequency, (b) the electrical power measured
for different value of the frequency,
Development of a better understanding as to how each of the above factors impacts the energy
consumption. Quantitative estimation of the energy saving potential in practical applications
Development of appropriate and novel methods to design and to analyze the
control of ventilation system.
Basic Theory
The basic construction of a VFD consists of 4 major components (Metz and Smolik).
- Rectifier: This converts our 3-phase AC voltage electrical supply into a constant DC voltage. For a
600 VAC supply, the DC voltage would approximately be 850 VDC, known as the DC Bus.
- DC Bus: This is an inductive and capacitive circuit to maintain a constant and smooth DC Bus
voltage that tries to resist changes from the main AC supply.
- Inverter: Also known as IGBTs, this section converts the DC Bus voltage by pulsing it by a transistor
network to form a variable voltage and variable frequency supply for a 3-phase electric motor.
Page 26.520.4

ASEE Annual Conference, 2015
- Controller: Controls the pulses and calculates the magnitude of the voltage, current and frequency to
obtain optimum motor performance under all conditions.
The basic equation for a 3 phase electric motor speed (shaft speed V) is: V = (120 * F) / N [RPM],
where N is the number of poles.
F = frequency and # of poles is determined at motor construction ie: 2 poles, 4 poles or 6 poles
machine. If we look at a 2 poles machine and 60 HZ supply, the speed calculates out to 3600 RPM. The
only way to vary the speed is to change the F in the equation. We can accomplish this with a Variable
Frequency Drive (VFD).
System construction:
A primary system has been constructed. This system is composed of an axial fan/motor connected to a
duct/damper, to a variable frequency drive (VFD) and to a Programmable Logic Controller (PLC) with
a view panel and connected to a computer for programming purposes. The design and implementation
of an experiment that include a VFD to control a three phase variable speed motor of a fan integrated to
a PLC has been performed. This system will be used to verify several variants to control the rotational
speed of electric motors of a ventilation system, according to several inputs:
room temperature, CO2 concentration and so on.
A view of the actual system is shown in the figures 1 to 7.
Figure 1a: the VFD-Fan-duct-damper installation at NCAT electrical/lighting lab
Page 26.520.5
ASEE Annual Conference, 2015
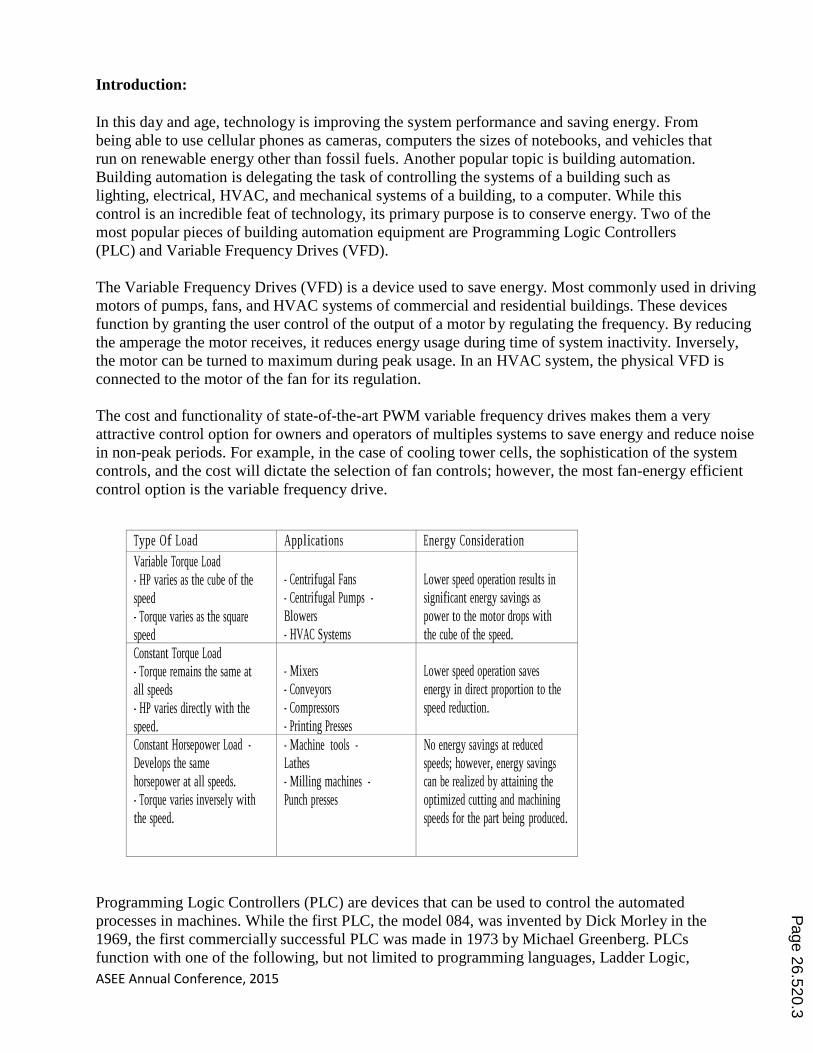
Figure 1b: the VFD-Fan-duct-damper installation at NCAT electrical/lighting lab
Figure 1c: the VFD-Fan-duct-damper installation at NCAT electrical/lighting lab
Page 26.520.6
ASEE Annual Conference, 2015
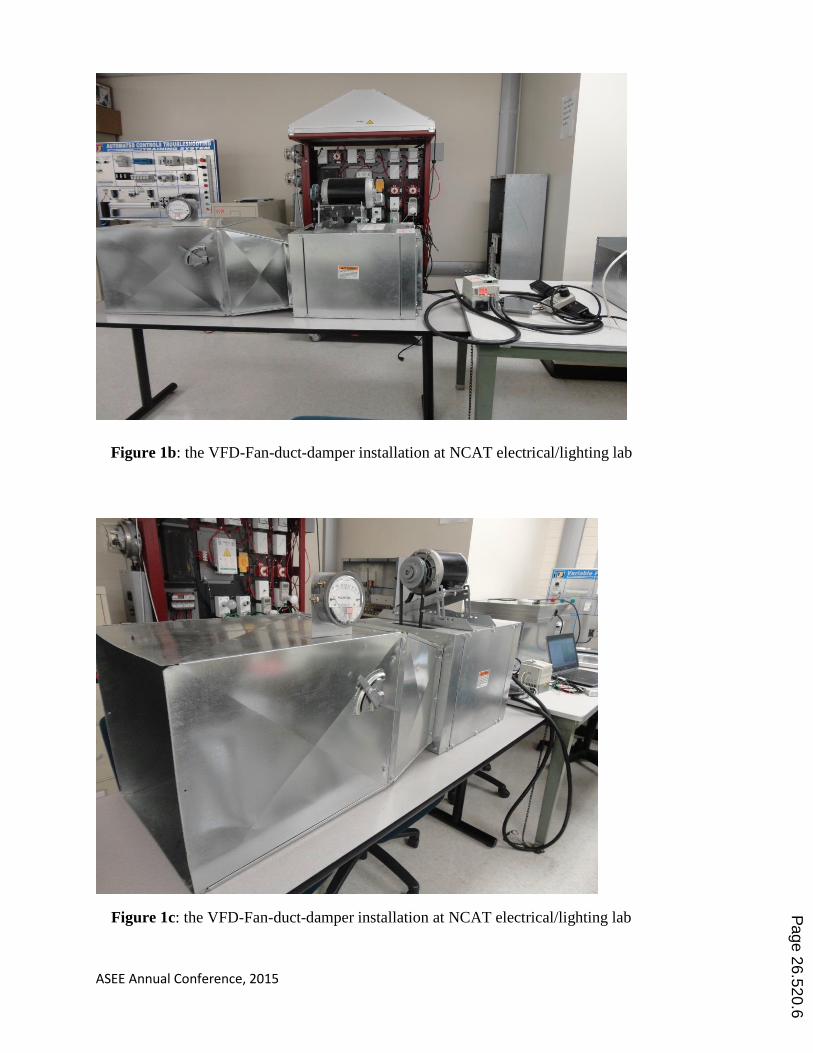
Figure 2: Fan-duct-damper installation at NCAT electrical/lighting lab
Figure3: the PLC-VFD-Fan-duct-damper installation at NCAT electrical/lighting lab
Figure 4: the motor component Figure 5: the VFD component
Page 26.520.7
ASEE Annual Conference, 2015
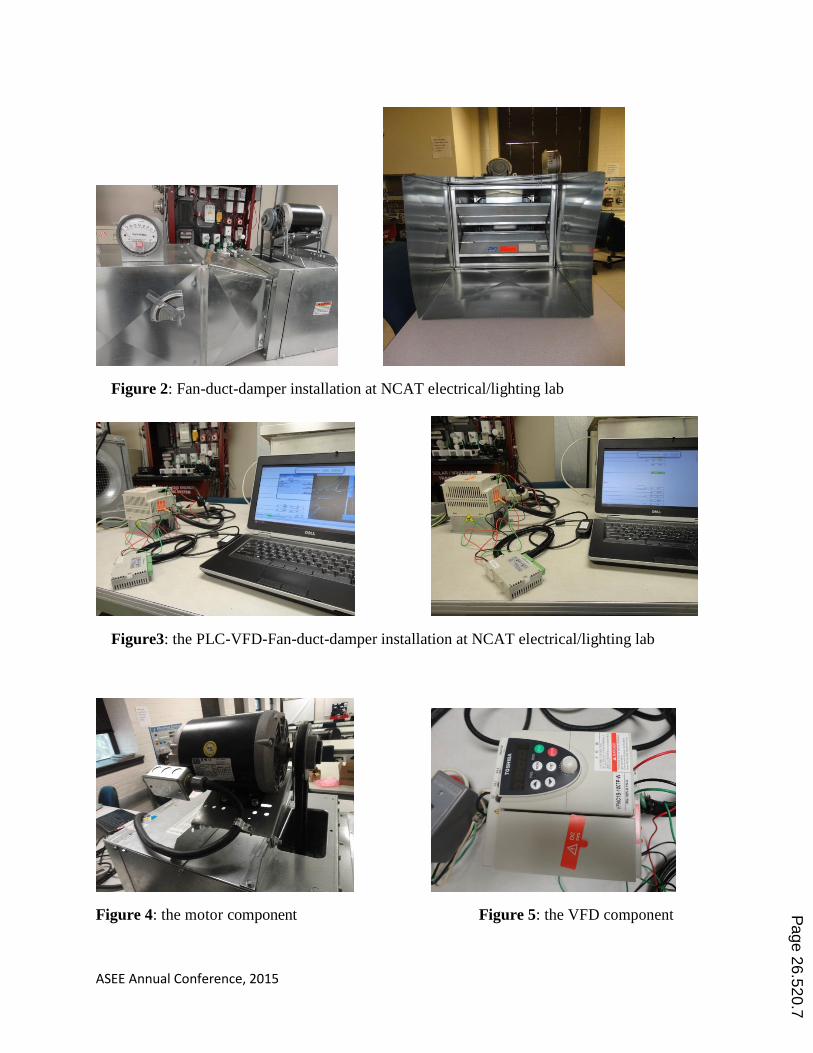
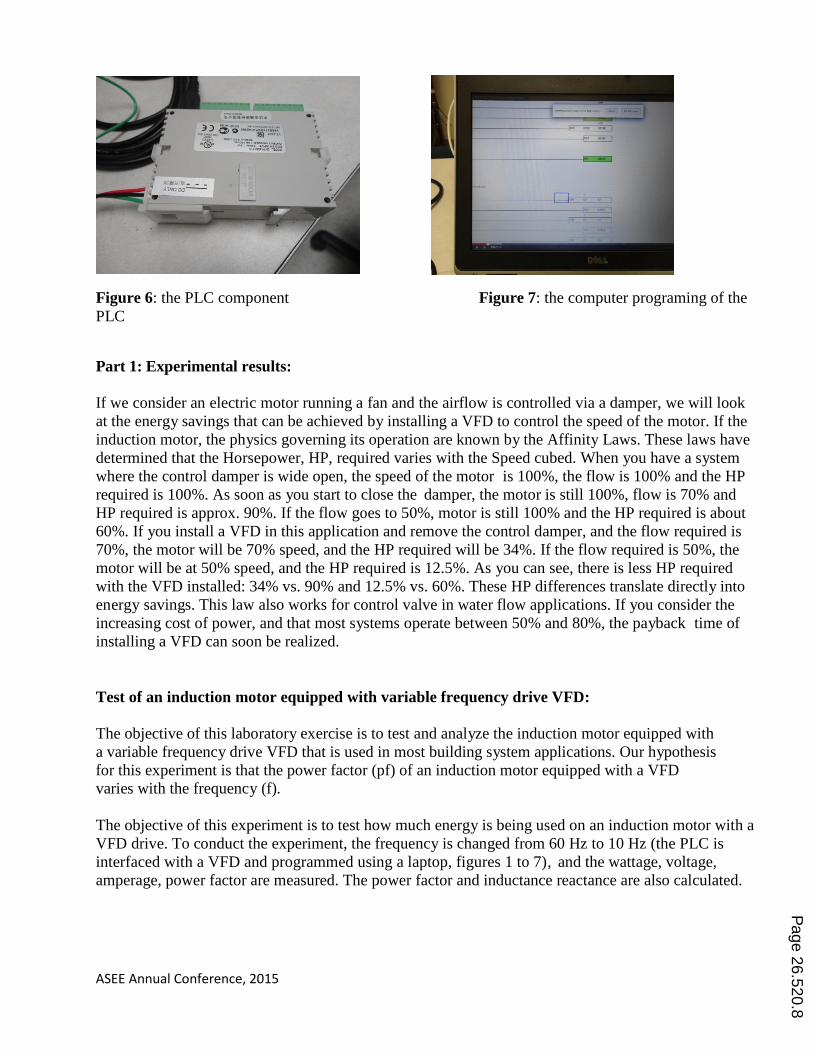
Figure 6: the PLC component Figure 7: the computer programing of the
PLC
Part 1: Experimental results:
If we consider an electric motor running a fan and the airflow is controlled via a damper, we will look
at the energy savings that can be achieved by installing a VFD to control the speed of the motor. If the
induction motor, the physics governing its operation are known by the Affinity Laws. These laws have
determined that the Horsepower, HP, required varies with the Speed cubed. When you have a system
where the control damper is wide open, the speed of the motor is 100%, the flow is 100% and the HP
required is 100%. As soon as you start to close the damper, the motor is still 100%, flow is 70% and
HP required is approx. 90%. If the flow goes to 50%, motor is still 100% and the HP required is about
60%. If you install a VFD in this application and remove the control damper, and the flow required is
70%, the motor will be 70% speed, and the HP required will be 34%. If the flow required is 50%, the
motor will be at 50% speed, and the HP required is 12.5%. As you can see, there is less HP required
with the VFD installed: 34% vs. 90% and 12.5% vs. 60%. These HP differences translate directly into
energy savings. This law also works for control valve in water flow applications. If you consider the
increasing cost of power, and that most systems operate between 50% and 80%, the payback time of
installing a VFD can soon be realized.
Test of an induction motor equipped with variable frequency drive VFD:
The objective of this laboratory exercise is to test and analyze the induction motor equipped with
a variable frequency drive VFD that is used in most building system applications. Our hypothesis
for this experiment is that the power factor (pf) of an induction motor equipped with a VFD
varies with the frequency (f).
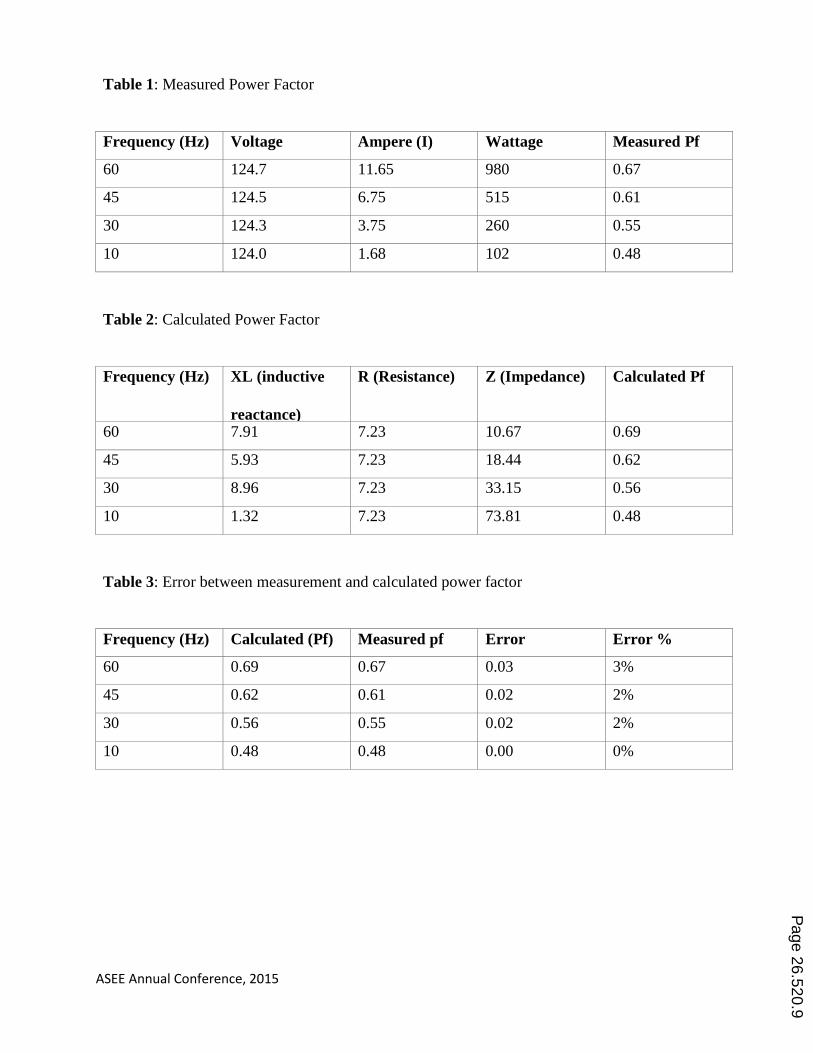
The objective of this experiment is to test how much energy is being used on an induction motor with a
VFD drive. To conduct the experiment, the frequency is changed from 60 Hz to 10 Hz (the PLC is
interfaced with a VFD and programmed using a laptop, figures 1 to 7), and the wattage, voltage,
amperage, power factor are measured. The power factor and inductance reactance are also calculated.
Page 26.520.8
ASEE Annual Conference, 2015
Table 1: Measured Power Factor
Frequency (Hz)
Voltage
Ampere (I)
Wattage
Measured Pf
60
124.7
11.65
980
0.67
45
124.5
6.75
515
0.61
30
124.3
3.75
260
0.55
10
124.0
1.68
102
0.48
Table 2: Calculated Power Factor
Frequency (Hz)
XL (inductive
reactance)
R (Resistance)
Z (Impedance)
Calculated Pf
60
7.91
7.23
10.67
0.69
45
5.93
7.23
18.44
0.62
30
8.96
7.23
33.15
0.56
10
1.32
7.23
73.81
0.48
Table 3: Error between measurement and calculated power factor
Frequency (Hz)
Calculated (Pf)
Measured pf
Error
Error %
60
0.69
0.67
0.03
3%
45
0.62
0.61
0.02
2%
30
0.56
0.55
0.02
2%
10
0.48
0.48
0.00
0%
Page 26.520.9
ASEE Annual Conference, 2015
Wattage vs. frequency 1200
1000
800
600
400 Wattage
200
0
0 10 20 30 40 50 60
Frequency (Hz)
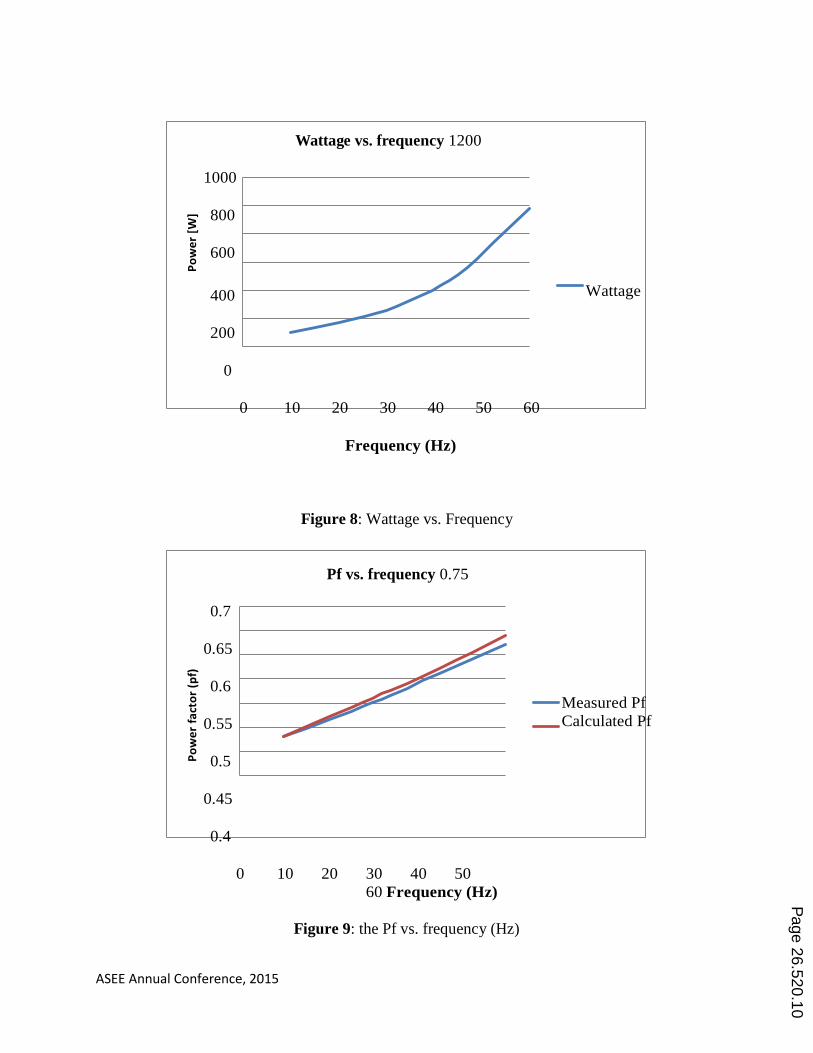
Figure 8: Wattage vs. Frequency
Pf vs. frequency 0.75
0.7
0.65
0.6
0.55
0.5
0.45
0.4
Measured Pf
Calculated Pf
0 10 20 30 40 50
60 Frequency (Hz)
Figure 9: the Pf vs. frequency (Hz)
Po
we
r fa
cto
r (p
f)
Po
we
r [W
]
Page 26.520.10

ASEE Annual Conference, 2015
Reducing the frequency of the motor reduce the wattage (Figure 8). The relation between the power
factor and the frequency is linear (Figure 9).
The power supplied to the motor by a VFD is not smooth. The inverter within the VFD takes the 60 hz
power then chops and re-shapes the AC sine wave. This simulated AC voltage contains spikes and
irregularities that must be absorbed by the motor windings. VFD duty motors are built with heavy-duty
windings and are equipped with extra heat dissipation features to handle the VFD application. In
addition, spike resistant wire is utilized in our VFD duty motor design.
Part 2: Energy Study:
Building Description:
The Fort IRC Building (A research building at North Carolina A&T State University) is considered for
simulation study (Figure 10), to demonstrate the annual energy saving, when all the fans in the building
are interfaced with VFDs, in comparison with the same building when the fans are not connected to
VFDs.
The building characteristics are:
- Building area is 77,776 ft2 (Zone 4A – mixed, humid), 35.3% percent perimeter zone.
- Infiltration: 0.038 CFM/ft2 (ext wall area), Core: 0.001 CFM/ft2 (floor area).
- Number of floors: 4 above grade.
- Minimum Design Flow: 0.50 cfm/ft2
- VAV Minimum Flow: Core (40.0%), Perimeter (30.0%)
- Cooling Equip: Chilled Water Coil
- Heating Equip: Hot Water Coils
- Supply Fans: 3.50 in. WG
- Return Fans: 1.17 in. WG
Thermostat:
Occupied (°F) Unoccupied (°F)
Cooling Set points 76.0 82.0
Heating Set points 70.0 64.0
Design Temperatures and Air Flows:
Indoor (°F) Supply (°F)
Cooling Design Temp 75.0 55.0
Heating Design Temp 72.0 95.0
Page 26.520.11

ASEE Annual Conference, 2015
Figure 10: The Fort IRC Building model used for this study.
Simulation results:
Figure 11: Electrical Consumption, when VFD are used for the fans.
Page 26.520.12

ASEE Annual Conference, 2015
Figure 12: Electrical Consumption, when VFDs are not used for the fans.
Figure 13: Electric Consumption (kWh) comparison
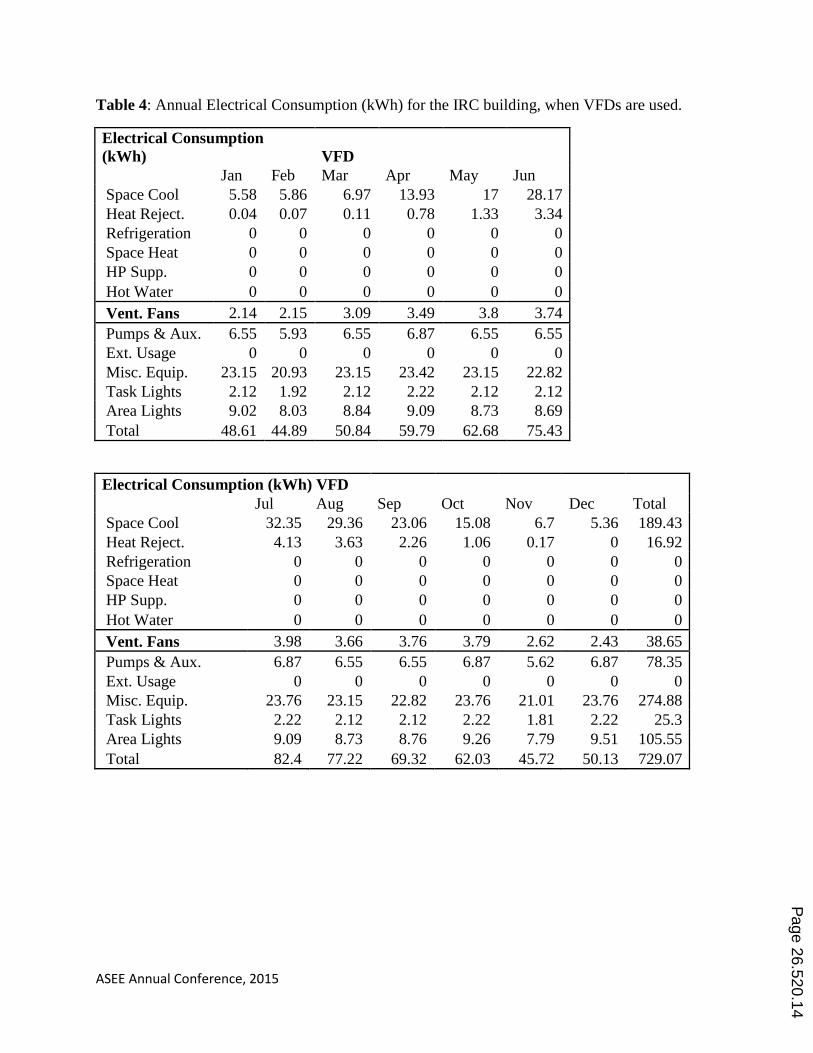
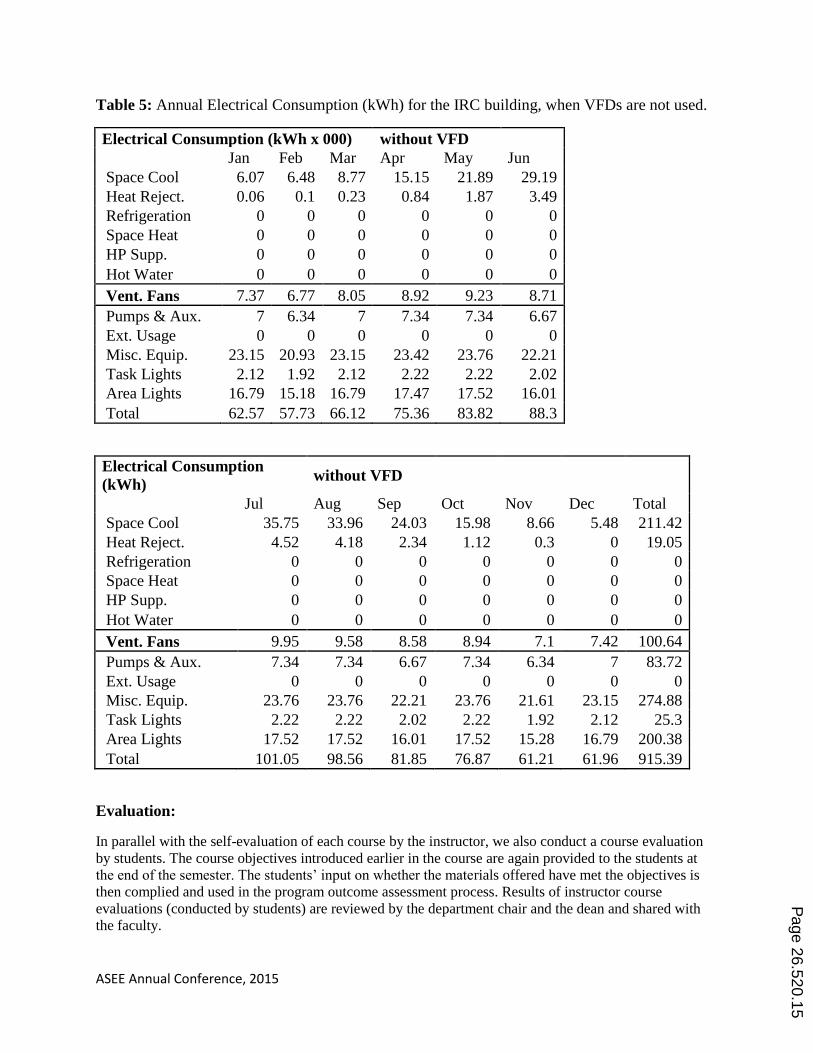
The experimental part shows how the power consumption (wattage), as well as the power
factor when the frequency is reduced. To account how much we save hourly, monthly as
well as annually in term of energy when all HVAC system fans (exhaust fans, supply fans)
of a four story buildings, located at Greensboro, NC. The saving is from 56% to about
70% of the energy consumed by the fans.
0
2
4
6
8
10
12
0 5 10 15
Ele
ctri
c C
on
sum
pti
on
(kW
h)
Months
Energy Saving
Vent. Fans (VFD)
Vent. Fans (Fan curve)
Page 26.520.13
ASEE Annual Conference, 2015
Table 4: Annual Electrical Consumption (kWh) for the IRC building, when VFDs are used.
Electrical Consumption
(kWh) VFD
Jan Feb Mar Apr May Jun
Space Cool 5.58 5.86 6.97 13.93 17 28.17
Heat Reject. 0.04 0.07 0.11 0.78 1.33 3.34
Refrigeration 0 0 0 0 0 0
Space Heat 0 0 0 0 0 0
HP Supp. 0 0 0 0 0 0
Hot Water 0 0 0 0 0 0
Vent. Fans 2.14 2.15 3.09 3.49 3.8 3.74
Pumps & Aux. 6.55 5.93 6.55 6.87 6.55 6.55
Ext. Usage 0 0 0 0 0 0
Misc. Equip. 23.15 20.93 23.15 23.42 23.15 22.82
Task Lights 2.12 1.92 2.12 2.22 2.12 2.12
Area Lights 9.02 8.03 8.84 9.09 8.73 8.69
Total 48.61 44.89 50.84 59.79 62.68 75.43
Electrical Consumption (kWh) VFD
Jul Aug Sep Oct Nov Dec Total
Space Cool 32.35 29.36 23.06 15.08 6.7 5.36 189.43
Heat Reject. 4.13 3.63 2.26 1.06 0.17 0 16.92
Refrigeration 0 0 0 0 0 0 0
Space Heat 0 0 0 0 0 0 0
HP Supp. 0 0 0 0 0 0 0
Hot Water 0 0 0 0 0 0 0
Vent. Fans 3.98 3.66 3.76 3.79 2.62 2.43 38.65
Pumps & Aux. 6.87 6.55 6.55 6.87 5.62 6.87 78.35
Ext. Usage 0 0 0 0 0 0 0
Misc. Equip. 23.76 23.15 22.82 23.76 21.01 23.76 274.88
Task Lights 2.22 2.12 2.12 2.22 1.81 2.22 25.3
Area Lights 9.09 8.73 8.76 9.26 7.79 9.51 105.55
Total 82.4 77.22 69.32 62.03 45.72 50.13 729.07
Page 26.520.14
ASEE Annual Conference, 2015
Table 5: Annual Electrical Consumption (kWh) for the IRC building, when VFDs are not used.
Electrical Consumption (kWh x 000) without VFD
Jan Feb Mar Apr May Jun
Space Cool 6.07 6.48 8.77 15.15 21.89 29.19
Heat Reject. 0.06 0.1 0.23 0.84 1.87 3.49
Refrigeration 0 0 0 0 0 0
Space Heat 0 0 0 0 0 0
HP Supp. 0 0 0 0 0 0
Hot Water 0 0 0 0 0 0
Vent. Fans 7.37 6.77 8.05 8.92 9.23 8.71
Pumps & Aux. 7 6.34 7 7.34 7.34 6.67
Ext. Usage 0 0 0 0 0 0
Misc. Equip. 23.15 20.93 23.15 23.42 23.76 22.21
Task Lights 2.12 1.92 2.12 2.22 2.22 2.02
Area Lights 16.79 15.18 16.79 17.47 17.52 16.01
Total 62.57 57.73 66.12 75.36 83.82 88.3
Electrical Consumption
(kWh) without VFD
Jul Aug Sep Oct Nov Dec Total
Space Cool 35.75 33.96 24.03 15.98 8.66 5.48 211.42
Heat Reject. 4.52 4.18 2.34 1.12 0.3 0 19.05
Refrigeration 0 0 0 0 0 0 0
Space Heat 0 0 0 0 0 0 0
HP Supp. 0 0 0 0 0 0 0
Hot Water 0 0 0 0 0 0 0
Vent. Fans 9.95 9.58 8.58 8.94 7.1 7.42 100.64
Pumps & Aux. 7.34 7.34 6.67 7.34 6.34 7 83.72
Ext. Usage 0 0 0 0 0 0 0
Misc. Equip. 23.76 23.76 22.21 23.76 21.61 23.15 274.88
Task Lights 2.22 2.22 2.02 2.22 1.92 2.12 25.3
Area Lights 17.52 17.52 16.01 17.52 15.28 16.79 200.38
Total 101.05 98.56 81.85 76.87 61.21 61.96 915.39
Evaluation:
In parallel with the self-evaluation of each course by the instructor, we also conduct a course evaluation
by students. The course objectives introduced earlier in the course are again provided to the students at
the end of the semester. The students’ input on whether the materials offered have met the objectives is
then complied and used in the program outcome assessment process. Results of instructor course
evaluations (conducted by students) are reviewed by the department chair and the dean and shared with
the faculty.
Page 26.520.15
ASEE Annual Conference, 2015
Each faculty member also conducts an evaluation of performance of students in his/her courses as part of
the Program Objectives (PO) and outcome assessment process. A summary report on the performance of
students (to meet the program objectives) and compliance with the program outcomes is prepared and
submitted to the department chair for the assessment purposes.
Future plans to evaluate the effectiveness of the capstone in term of learning outcomes: actions that will
be implemented to improve the effectiveness of the curriculum in term of learning outcomes:
We expanded on the instructors’ self-evaluation such that more direct assessment of students’
learning outcomes is obtained. A set of standards for instructor’s self-evaluation will be prepared
by the faculty and the Board of Advisors and will be implemented with the annual assessment
cycle. The main point of these standards is that the evaluation of students’ performance will based
on samples of work in three categories of students: those in the upper 75 percentile, those in the
50 – 75 percentile and those below the 50 percentile populations. Thus the assessment results
compiled are based on course performances and grades, exams, projects, presentations of
students, and writings as required in some courses. Furthermore, each course specifically
addresses the learning outcomes and relation between the course and the program outcomes, the
methods used for the evaluation of students’ performance and the relevance of the course
materials to the program outcomes following the standards adopted for the assessment process.
Students will be provided with the course descriptions including learning objectives and
outcomes. Students also will provide their input on the program outcomes. The results from this
instrument are used along with those from the instructors’ self-assessment of courses as a means
to ensuring compatibility in results obtained.
A more rigorous process in assessing the learning outcomes of this capstone course will be
implemented, which are in parallel with the program outcomes. The following outlines process
will be used for this capstone course assessment.
o Individual instructor evaluation of the degree of learning achievement of individual
students on a capstone team, which includes consideration of the collective achievements
of the team.
o Peer evaluation (optional by instructor).
o Grading of deliverables by the instructors (project plan, mid-term review, final report,
exhibit (and abstract), oral presentation, team minutes, web site if applicable).
o Teamwork survey.
o Self-assessment.
o Senior Design Symposium judging (with evaluation criteria explicitly indexed to the
learning objectives and articulated via rubrics for all measures).
Conclusions:
The study is composed of three parts:
PLC-VFD-Fan-duct-damper installation construction and the experimental study.
Energy simulation study to demonstrate the hourly energy saving
Airflow simulation to demonstrate the weather condition effect on the airflow
supply/exhaust of fans
The variable frequency drive (VFD) has been integrated to the HVAC system represented
by a return/supply duct with a damper and fan connected to a 3-phase motor. The
integration with the Programming logic controller has been performed. A computer is used
for the programming phase and connected to the PLC.
Page 26.520.16

ASEE Annual Conference, 2015
The experimental part shows how the power consumption (wattage), as well as the power
factor when the frequency is reduced. To account how much we save hourly, monthly as
well as annually in term of energy when all HVAC system fans (exhaust fans, supply fans)
of a four story buildings, located at Greensboro, NC. The saving is from 56% to about
70% of the energy consumed by the fans.
Acknowledgement:
This research work is made possible through the help and support from ASHRAE. Thanks to
ASHRAE for supporting this work.
References:
1) <http://www.amci.com/tutorials/tutorials-what-is-programmable-logic-controller.asp>.
2) <http://www.datatrackpi.com/technical-papers/modbus-guide.htm>.
3) Guest Speaker Series “VARIABLE FREQUENCY DRIVE” by Troy Metz and Brian Smolik
Page 26.520.17
Related Documents