University of Calgary PRISM: University of Calgary's Digital Repository Graduate Studies The Vault: Electronic Theses and Dissertations 2013-09-13 Triaxial Compression Strength of Methane Hydrate-Bearing Sediments Jaysinghe, Anuruddhika Jaysinghe, A. (2013). Triaxial Compression Strength of Methane Hydrate-Bearing Sediments (Unpublished doctoral thesis). University of Calgary, Calgary, AB. doi:10.11575/PRISM/28526 http://hdl.handle.net/11023/973 doctoral thesis University of Calgary graduate students retain copyright ownership and moral rights for their thesis. You may use this material in any way that is permitted by the Copyright Act or through licensing that has been assigned to the document. For uses that are not allowable under copyright legislation or licensing, you are required to seek permission. Downloaded from PRISM: https://prism.ucalgary.ca

Welcome message from author
This document is posted to help you gain knowledge. Please leave a comment to let me know what you think about it! Share it to your friends and learn new things together.
Transcript

University of Calgary
PRISM: University of Calgary's Digital Repository
Graduate Studies The Vault: Electronic Theses and Dissertations
2013-09-13
Triaxial Compression Strength of Methane
Hydrate-Bearing Sediments
Jaysinghe, Anuruddhika
Jaysinghe, A. (2013). Triaxial Compression Strength of Methane Hydrate-Bearing Sediments
(Unpublished doctoral thesis). University of Calgary, Calgary, AB. doi:10.11575/PRISM/28526
http://hdl.handle.net/11023/973
doctoral thesis
University of Calgary graduate students retain copyright ownership and moral rights for their
thesis. You may use this material in any way that is permitted by the Copyright Act or through
licensing that has been assigned to the document. For uses that are not allowable under
copyright legislation or licensing, you are required to seek permission.
Downloaded from PRISM: https://prism.ucalgary.ca
UNIVERSITY OF CALGARY
Triaxial Compression Strength of Methane Hydrate-Bearing Sediments
by
Anuruddhika Ganganie Jayasinghe
A THESIS
SUBMITTED TO THE FACULTY OF GRADUATE STUDIES
IN PARTIAL FULFILMENT OF THE REQUIREMENTS FOR THE
DEGREE OF DOCTOR OF PHILOSOPHY
DEPARTMENT OF CIVIL ENGINEERING
CALGARY, ALBERTA
SEPTEMBER, 2013
© Anuruddhika Ganganie Jayasinghe 2013

i
Abstract
Hydrate-bearing sediments are characterized as soils in which the pore space is partially or fully
occupied by ice-like crystalline solid consisting of hydrogen bonded water lattices encapsulating
guest gas molecules, mostly methane in natural environments. These sediments are found along
marine continental margins and in permafrost regions. The main focus of this thesis is to
investigate the behaviour of hydrate-bearing sediments subject to triaxial compression. The work
presented includes (1) an investigation into the formation process dependency of hydrate growth
habit, spatial distribution, and saturation (the key deterministic factors of the physical
behaviour), (2) a novel formation methodology to isolate the effects of formation habit from
those of spatial variation in hydrate distribution, (3) an investigation into the accurate estimation
of hydrate saturation, (4) and a comprehensive series of tests to investigate the initial effective
confining stress and hydrate saturation dependent stress-strain behaviour, strength, and stiffness,
(5) a comparison of present results with previous work published in literature to investigate the
differences in strength/stiffness behaviour between different formation habits. The results of the
study reveal that the stress-strain behaviour is affected by hydrate added cohesion (or
cementation), the failure strength at low saturations is controlled by frictional resistance at
mineral grain contacts, the failure strength at high saturations is determined predominantly by
hydrate-mineral bonding strength or intact hydrate breakage strength while the residual strength
is determined by the hydrate saturation, stiffness is controlled predominantly by formation habit
while hydrate saturation acts as a factor of secondary importance, and the effects of initial
effective confinement on the strength/stiffness behaviour is significant only at low hydrate
ii
saturations. Additionally, an increased dilative tendency, reflected in strongly negative pore
pressure development was observed in the hydrate-bearing specimens under constant mass
shearing. Comparison of our results of the experimental program with theoretical predictions
generates a good match, which indicates that theoretical modeling of the strength gain due to the
presence of gas hydrates is possible. The knowledge generated in this research is essential in
evaluating the potential risks associated with drilling and methane production, reservoir
subsidence, and dissociation induced submarine slope instability.

iii
Acknowledgements
I would like to take this opportunity to thank those who led and accompanied me in this journey
of success.
First and foremost, I would like to express my sincere gratitude to my supervisor, Dr. Jocelyn
Grozic, for her continuous support and guidance without which this work would not have been
possible. Dr. Grozic, being a true mentor, inspired me to explore all arenas of gas hydrates
research. I am privileged to have worked with you. I should also mention the opportunities that
you had provided me with for sharing ideas and research know-how with the other academics
through attending various conferences. I will carry with me the impression you have created in
me as a true teacher and a researcher for the rest of my life.
I would like to thank Dr. Ron Wong and Dr. Richard Wan for the invaluable knowledge and
research expertise they offered through graduate courses and research meetings. Critical
comments made, the insightful questions raised, and the invaluable advice, feedback, and
suggestions provided by the duo helped immensely to shape my research.
I gratefully acknowledge Dr. Matthew Clarke and Dr. Pooladi-Darvish for the advice, and
suggestions received. I should also mention the positive learning experience I enjoyed in
attending Dr. Achari’s graduate courses.
iv
I thank the technical staff of the Department of Civil Engineering for providing me with the
technical support and advice at various stages of the experimental program.
I gratefully acknowledge the financial contributions from Natural Sciences and Engineering
Research Council (NSERC) of Canada, Geological Society of Canada (GSC) - Natural
Resources Canada. I also acknowledge the Department of Civil Engineering, University of
Calgary for the financial assistance I received through teaching assistantships.
I would now like to take this opportunity to thank my colleagues and friends who helped me stay
sane through difficult years. Their support and care helped me overcome setbacks and stay
focused on my studies. I greatly value their friendship and I deeply appreciate their belief in me.
Most importantly, none of this would have been possible without the love, support and patience
of my family. I must express my gratitude to my parents and sister for their silent wish for my
success and the motivation throughout. I thank my husband who stood by me in my joys and
sorrows both. Last but not least I should also mention our son, Charana, who brought smiles and
happiness even at hard times.

v
Dedication
This thesis is dedicated to my parents for their constant love, endless support and
encouragement.
Amma and Appachchi, without you this journey would never have started.

vi
Table of Contents
Abstract ................................................................................................................................ i Acknowledgements ............................................................................................................ iii Dedication ............................................................................................................................v Table of Contents ............................................................................................................... vi
List of Tables .......................................................................................................................x List of Figures ................................................................................................................... xii Nomenclature .....................................................................................................................xv
CHAPTER ONE: INTRODUCTION ..................................................................................1 1.1 Introduction ................................................................................................................1
1.2 Human interest in gas hydrates ..................................................................................2
1.3 Problem statement – The importance and the challenges in assessing geomechanical
properties of hydrate-bearing sediments ..................................................................3
1.4 Research objectives ....................................................................................................4 1.5 Scope of investigation ................................................................................................5 1.6 Organization of the thesis ..........................................................................................5
CHAPTER TWO: METHANE HYDRATES IN POROUS SOIL MEDIA - A REVIEW 9 2.1 Introduction ................................................................................................................9
2.2 Methods of laboratory synthesis of artificial hydrate-bearing sediments ..................9 2.2.1 Dissolved gas method ......................................................................................10 2.2.2 Partial water saturation method .......................................................................11
2.2.3 Ice-seeding method ..........................................................................................12
2.2.4 Hydrate pre-mixing method ............................................................................13 2.3 Natural gas hydrates .................................................................................................13
2.3.1 Hydrate growth morphologies .........................................................................14
2.3.2 Pore scale hydrate growth habits .....................................................................15 2.3.2.1 Pore filling habit ....................................................................................16
2.3.2.2 Load bearing habit .................................................................................16 2.3.2.3 Grain cementing and/or coating habit ....................................................16
2.3.3 Controls on pore scale hydrate growth morphologies and habits ....................17 2.3.4 Classification of natural hydrate accumulations ..............................................19
2.4 Hydrate growth habit dependency of physical properties .......................................20 2.5 Hydrate spatial distribution dependency of physical properties ..............................20 2.6 Hydrate saturation dependency of physical properties ............................................21
2.7 Hydrate formation method dependency of growth habit, spatial distribution, and
hydrate saturation ...................................................................................................22
2.7.1 Growth habit ....................................................................................................22 2.7.2 Spatial distribution ...........................................................................................22 2.7.3 Hydrate saturation ...........................................................................................23

vii
2.8 Formation “Method” versus Formation “Process” ..................................................24
2.8.1 Implications of the primary formation method ...............................................25 2.8.2 Implications of different approaches for forming a partially water saturated
specimens .........................................................................................................27 2.8.3 Effects of freezing and thawing .......................................................................29 2.8.4 Effects of water migration during formation of hydrate .................................31
2.8.5 Effects of formation P/T conditions and subsequent changes to formation P/T
conditions .........................................................................................................32 2.8.6 Effects of post formation water saturation ......................................................33 2.8.7 Intact strength of hydrate .................................................................................34 2.8.8 Hydrate former ................................................................................................36
2.9 Discussion ................................................................................................................37
CHAPTER THREE: LABORATORY SYNTHESIS OF METHANE HYDRATE-BEARING
SEDIMENT ..............................................................................................................46
3.1 Introduction ..............................................................................................................46 3.1.1 A novel procedure for hydrate synthesis – hydrate formation from water rich
gaseous methane ..............................................................................................46
3.1.2 Potential hydrate growth habit .........................................................................49 3.1.3 Implications of hydrate growth habit on the strength and stiffness of the
sediments..........................................................................................................49 3.2 The experimental procedure ....................................................................................49
3.2.1 Materials ..........................................................................................................50
3.2.1.1 Sand .......................................................................................................50
3.2.1.2 Water ......................................................................................................50 3.2.1.3 Hydrate former .......................................................................................50
3.2.2 Methods ...........................................................................................................51
3.2.2.1 Specimen preparation ............................................................................51 3.2.2.2 Hydrate formation ..................................................................................52
3.3 The concept – Hydrate formation from water saturated gaseous methane ..............54 3.4 Estimation of hydrate quantities formed from isobaric cooling of water saturated
vapour ....................................................................................................................58 3.5 Hydrate growth habit and distribution deduced from subsequent strength testing of
hydrate-bearing specimens.....................................................................................59 3.6 Discussion ................................................................................................................60
CHAPTER FOUR: ESTIMATING PORE SPACE HYDRATE SATURATION USING
DISSOCIATION GAS EVOLUTION MEASUREMENTS (DGEM) ....................74 4.1 Introduction ..............................................................................................................74
4.2 Hydrate saturation dependency of physical properties ............................................76 4.2.1 Effective medium models of pore scale hydrate growth habit ........................78
4.3 Techniques for determination of the hydrate saturation ..........................................79
viii
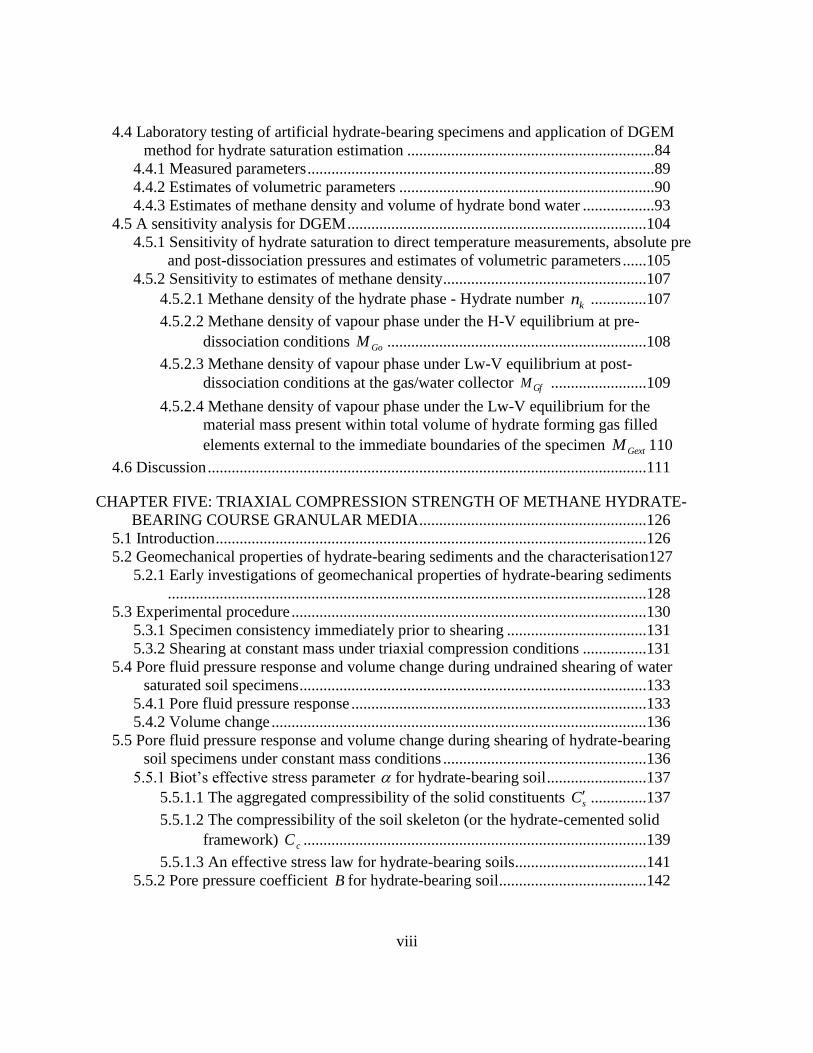
4.4 Laboratory testing of artificial hydrate-bearing specimens and application of DGEM
method for hydrate saturation estimation ..............................................................84 4.4.1 Measured parameters .......................................................................................89 4.4.2 Estimates of volumetric parameters ................................................................90 4.4.3 Estimates of methane density and volume of hydrate bond water ..................93
4.5 A sensitivity analysis for DGEM ...........................................................................104
4.5.1 Sensitivity of hydrate saturation to direct temperature measurements, absolute pre
and post-dissociation pressures and estimates of volumetric parameters ......105 4.5.2 Sensitivity to estimates of methane density ...................................................107
4.5.2.1 Methane density of the hydrate phase - Hydrate number kn ..............107
4.5.2.2 Methane density of vapour phase under the H-V equilibrium at pre-
dissociation conditions GoM .................................................................108
4.5.2.3 Methane density of vapour phase under Lw-V equilibrium at post-
dissociation conditions at the gas/water collector GfM ........................109
4.5.2.4 Methane density of vapour phase under the Lw-V equilibrium for the
material mass present within total volume of hydrate forming gas filled
elements external to the immediate boundaries of the specimen GextM 110
4.6 Discussion ..............................................................................................................111
CHAPTER FIVE: TRIAXIAL COMPRESSION STRENGTH OF METHANE HYDRATE-
BEARING COURSE GRANULAR MEDIA .........................................................126 5.1 Introduction ............................................................................................................126
5.2 Geomechanical properties of hydrate-bearing sediments and the characterisation127
5.2.1 Early investigations of geomechanical properties of hydrate-bearing sediments
........................................................................................................................128 5.3 Experimental procedure .........................................................................................130
5.3.1 Specimen consistency immediately prior to shearing ...................................131 5.3.2 Shearing at constant mass under triaxial compression conditions ................131
5.4 Pore fluid pressure response and volume change during undrained shearing of water
saturated soil specimens .......................................................................................133 5.4.1 Pore fluid pressure response ..........................................................................133 5.4.2 Volume change ..............................................................................................136
5.5 Pore fluid pressure response and volume change during shearing of hydrate-bearing
soil specimens under constant mass conditions ...................................................136
5.5.1 Biot’s effective stress parameter for hydrate-bearing soil .........................137
5.5.1.1 The aggregated compressibility of the solid constituents sC ..............137
5.5.1.2 The compressibility of the soil skeleton (or the hydrate-cemented solid
framework) cC ......................................................................................139
5.5.1.3 An effective stress law for hydrate-bearing soils .................................141 5.5.2 Pore pressure coefficient B for hydrate-bearing soil .....................................142
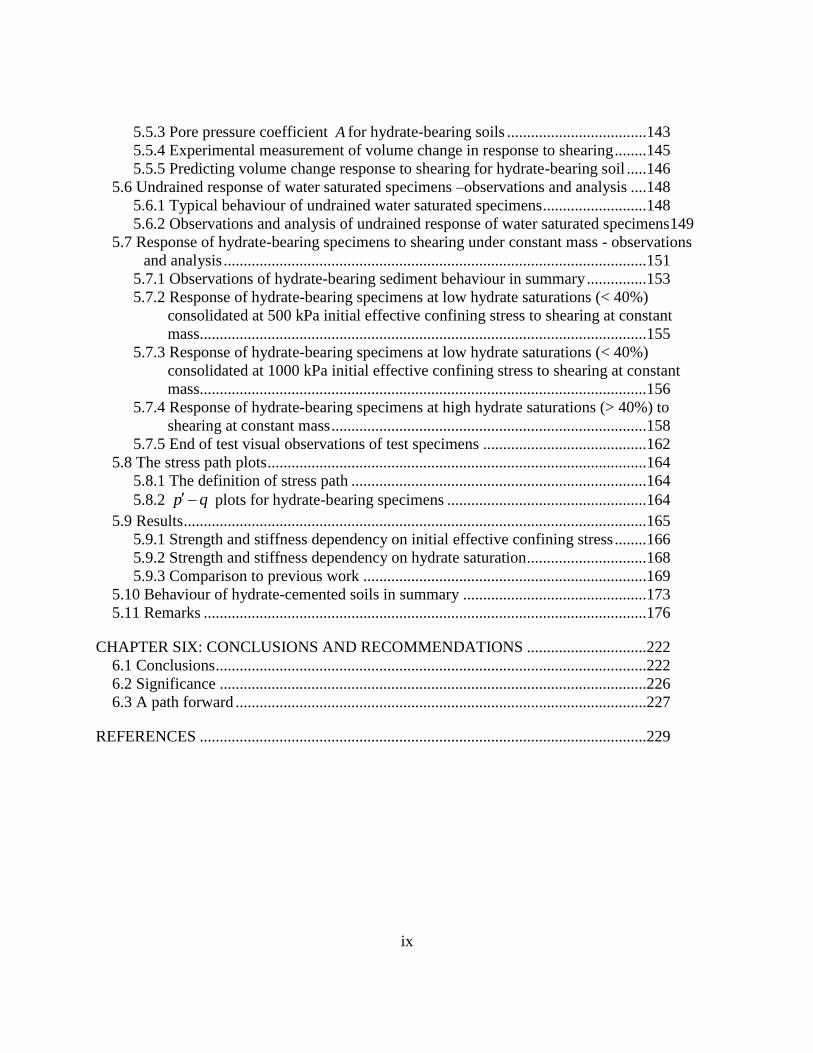
ix
5.5.3 Pore pressure coefficient A for hydrate-bearing soils ...................................143
5.5.4 Experimental measurement of volume change in response to shearing ........145 5.5.5 Predicting volume change response to shearing for hydrate-bearing soil .....146
5.6 Undrained response of water saturated specimens –observations and analysis ....148 5.6.1 Typical behaviour of undrained water saturated specimens ..........................148 5.6.2 Observations and analysis of undrained response of water saturated specimens149
5.7 Response of hydrate-bearing specimens to shearing under constant mass - observations
and analysis ..........................................................................................................151 5.7.1 Observations of hydrate-bearing sediment behaviour in summary ...............153 5.7.2 Response of hydrate-bearing specimens at low hydrate saturations (< 40%)
consolidated at 500 kPa initial effective confining stress to shearing at constant
mass................................................................................................................155
5.7.3 Response of hydrate-bearing specimens at low hydrate saturations (< 40%)
consolidated at 1000 kPa initial effective confining stress to shearing at constant
mass................................................................................................................156 5.7.4 Response of hydrate-bearing specimens at high hydrate saturations (> 40%) to
shearing at constant mass ...............................................................................158
5.7.5 End of test visual observations of test specimens .........................................162 5.8 The stress path plots ...............................................................................................164
5.8.1 The definition of stress path ..........................................................................164
5.8.2 qp plots for hydrate-bearing specimens ..................................................164
5.9 Results ....................................................................................................................165 5.9.1 Strength and stiffness dependency on initial effective confining stress ........166
5.9.2 Strength and stiffness dependency on hydrate saturation ..............................168
5.9.3 Comparison to previous work .......................................................................169
5.10 Behaviour of hydrate-cemented soils in summary ..............................................173 5.11 Remarks ...............................................................................................................176
CHAPTER SIX: CONCLUSIONS AND RECOMMENDATIONS ..............................222 6.1 Conclusions ............................................................................................................222 6.2 Significance ...........................................................................................................226
6.3 A path forward .......................................................................................................227
REFERENCES ................................................................................................................229

x
List of Tables
Table 2.1: Impact of formation process elements on the growth habit and hydrate distribution
during laboratory synthesis of hydrate-bearing soil specimens ............................................ 44
Table 3.1: Possible combination of number of co-existing phases (P) and number of
independent variables (F) for a two component systems in accordance with Gibbs Phase
Rule ....................................................................................................................................... 70
Table 3.2: Experimentally measured values for water content in methane under Lw-V
equilibrium ............................................................................................................................ 70
Table 3.3: Experimentally measured values for water content in methane under H-V
equilibrium ............................................................................................................................ 71
Table 3.4: References for determination of input parameters of the hydrate quantity
estimation .............................................................................................................................. 71
Table 3.5: Estimated hydrate quantity per known volume of water saturated methane under
L-V equilibrium .................................................................................................................... 72
Table 3.6: Laboratory test results for vapour phase hydrate formation with and without initial
water content ......................................................................................................................... 73
Table 4.1: References for experimental determination of hydrate number, kn .......................... 115
Table 4.2: Hydrate saturation estimation with the use of simple and complex primary
estimates at measured P/T conditions ................................................................................. 116
Table 4.3: Resources for determination of hydrate bond water and methane concentration ...... 119
Table 4.4: Sensitivity of hydrate saturation to direct temperature measurements, absolute pre
and post-dissociation system pressures, and estimates of volumetric parameters: ............. 123
Table 4.5: Sensitivity of hydrate saturation to the choice of vapour phase EoS under pre-
dissociation conditions at H-V equilibrium ........................................................................ 124
Table 4.6: Sensitivity of hydrate saturation to the choice of vapour phase EoS under post-
dissociation conditions at Lw-V equilibrium ...................................................................... 124
Table 4.7: Sensitivity of hydrate saturation to the choice of vapour phase EoS at Lw-V
equilibrium for quantity of gas present within such elements external to the immediate
xi
boundaries of the specimen for which the material present within is forced into the
gas/water collector during collection of dissociation products ........................................... 125
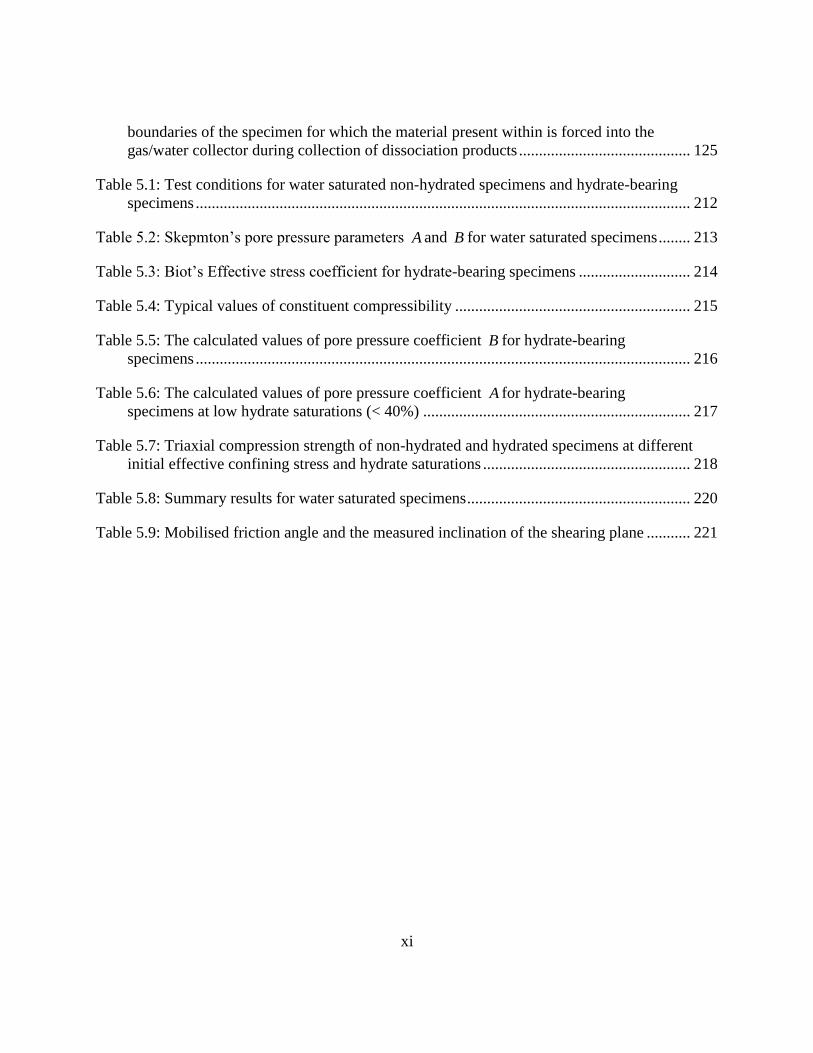
Table 5.1: Test conditions for water saturated non-hydrated specimens and hydrate-bearing
specimens ............................................................................................................................ 212
Table 5.2: Skepmton’s pore pressure parameters A and B for water saturated specimens ........ 213
Table 5.3: Biot’s Effective stress coefficient for hydrate-bearing specimens ............................ 214
Table 5.4: Typical values of constituent compressibility ........................................................... 215
Table 5.5: The calculated values of pore pressure coefficient B for hydrate-bearing
specimens ............................................................................................................................ 216
Table 5.6: The calculated values of pore pressure coefficient A for hydrate-bearing
specimens at low hydrate saturations (< 40%) ................................................................... 217
Table 5.7: Triaxial compression strength of non-hydrated and hydrated specimens at different
initial effective confining stress and hydrate saturations .................................................... 218
Table 5.8: Summary results for water saturated specimens ........................................................ 220
Table 5.9: Mobilised friction angle and the measured inclination of the shearing plane ........... 221

xii
List of Figures
Figure 2.1: Different hydrate growth morphologies found in natural hydrate-bearing
sediments (Hydrate in white) ................................................................................................ 39
Figure 2.2: Pore-scale hydrate growth habits for unconsolidated packing of mineral grains ....... 40
Figure 2.3: Solubility of methane in pure water ........................................................................... 41
Figure 2.4: Classification of hydrate-bearing sediments .............................................................. 42
Figure 2.5: The general association between the four primary methods of hydrate laboratory
synthesis and hydrate growth habits ..................................................................................... 43
Figure 3.1: X-ray MicroCT imagery showing the distribution of different phases within
hydrated sediment ................................................................................................................. 62
Figure 3.2: Growth habit and growth habit transition; (a) initial conversion of capillary held
water into hydrate leading to grain cementing hydrate habit and (b) further hydrate
growth from condensing water leading to grain coating hydrate habit................................. 63
Figure 3.3: Triaxial gas hydrate testing system ............................................................................ 65
Figure 3.4: The PT Diagram for isobaric cooling of water rich gaseous methane (vapour) into
the hydrate stability zone ...................................................................................................... 66
Figure 3.5: Temperature-Composition (T-X) diagram for methane-water binary system at
fixed pressure ........................................................................................................................ 67
Figure 3.6: The reduction in the water content of gaseous methane associated with isobaric
cooling ................................................................................................................................... 68
Figure 3.7: Schematic diagram showing application of mass balance for methane and water
between the two stages; (1) the system consisting of water saturated gaseous methane
(vapour) at Lw-V equilibrium and (2) the system consisting of hydrate and vapour in H-
V equilibrium ........................................................................................................................ 69
Figure 4.1: Hydrate formation in gas-rich environment, subsequent testing, and
measurements to facilitate application of DGEM for hydrate saturation estimation .......... 113
Figure 4.2: System consistency at pre and post-dissociation conditions .................................... 114
Figure 5.1: High pressure and low/high temperature capable triaxial soil testing apparatus ..... 178
xiii
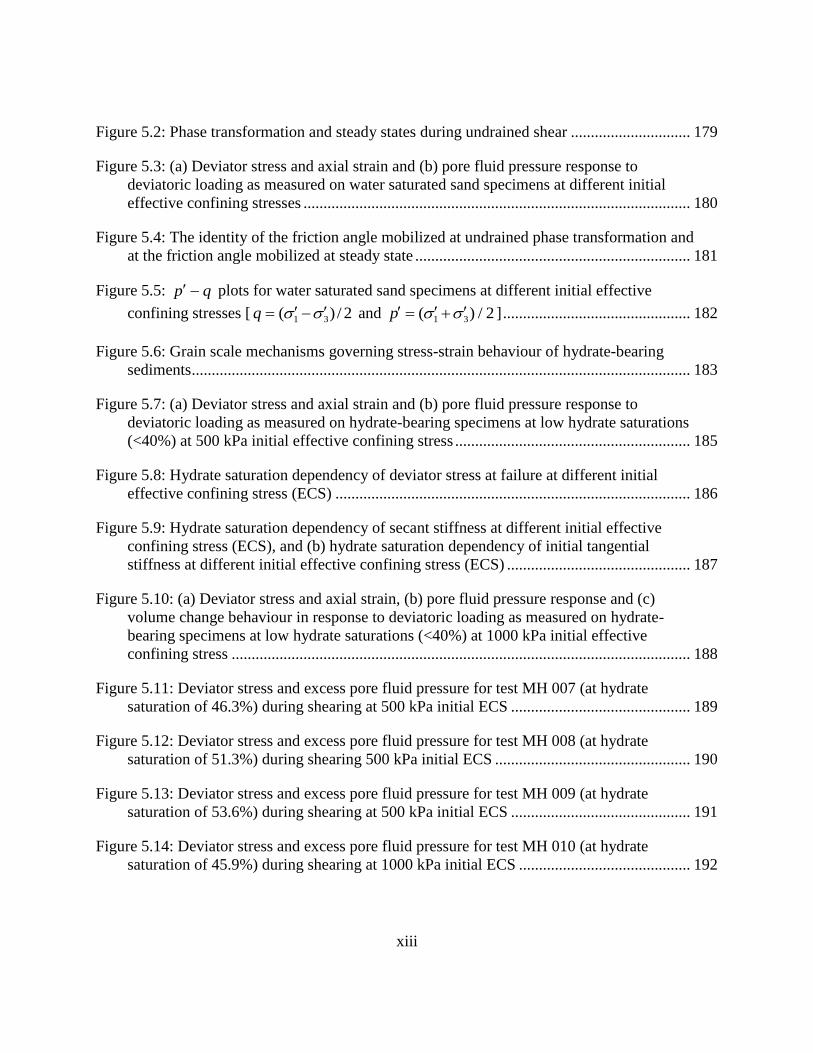
Figure 5.2: Phase transformation and steady states during undrained shear .............................. 179
Figure 5.3: (a) Deviator stress and axial strain and (b) pore fluid pressure response to
deviatoric loading as measured on water saturated sand specimens at different initial
effective confining stresses ................................................................................................. 180
Figure 5.4: The identity of the friction angle mobilized at undrained phase transformation and
at the friction angle mobilized at steady state ..................................................................... 181
Figure 5.5: qp plots for water saturated sand specimens at different initial effective
confining stresses [ 2/)( 31 q and 2/)( 31 p ] ............................................... 182
Figure 5.6: Grain scale mechanisms governing stress-strain behaviour of hydrate-bearing
sediments ............................................................................................................................. 183
Figure 5.7: (a) Deviator stress and axial strain and (b) pore fluid pressure response to
deviatoric loading as measured on hydrate-bearing specimens at low hydrate saturations
(<40%) at 500 kPa initial effective confining stress ........................................................... 185
Figure 5.8: Hydrate saturation dependency of deviator stress at failure at different initial
effective confining stress (ECS) ......................................................................................... 186
Figure 5.9: Hydrate saturation dependency of secant stiffness at different initial effective
confining stress (ECS), and (b) hydrate saturation dependency of initial tangential
stiffness at different initial effective confining stress (ECS) .............................................. 187
Figure 5.10: (a) Deviator stress and axial strain, (b) pore fluid pressure response and (c)
volume change behaviour in response to deviatoric loading as measured on hydrate-
bearing specimens at low hydrate saturations (<40%) at 1000 kPa initial effective
confining stress ................................................................................................................... 188
Figure 5.11: Deviator stress and excess pore fluid pressure for test MH 007 (at hydrate
saturation of 46.3%) during shearing at 500 kPa initial ECS ............................................. 189
Figure 5.12: Deviator stress and excess pore fluid pressure for test MH 008 (at hydrate
saturation of 51.3%) during shearing 500 kPa initial ECS ................................................. 190
Figure 5.13: Deviator stress and excess pore fluid pressure for test MH 009 (at hydrate
saturation of 53.6%) during shearing at 500 kPa initial ECS ............................................. 191
Figure 5.14: Deviator stress and excess pore fluid pressure for test MH 010 (at hydrate
saturation of 45.9%) during shearing at 1000 kPa initial ECS ........................................... 192
xiv
Figure 5.15: Deviator stress and excess pore fluid pressure for test MH 011 (at hydrate
saturation of 56.1%) during shearing at 1000 initial ECS .................................................. 193
Figure 5.16: Deviator stress and excess pore fluid pressure for test MH 012 (at hydrate
saturation of 61.5%) during shearing at 1000 kPa initial ECS ........................................... 194
Figure 5.17: Deviator stress and excess pore fluid pressure for test MH 013 (at hydrate
saturation of 80%) during shearing at 1000 kPa initial ECS .............................................. 195
Figure 5.18: Hydrate saturation dependency of failure stress and residual strength .................. 196
Figure 5.19: Photographs of sheared specimens and deformation band scars left on specimen
membrane ............................................................................................................................ 197
Figure 5.20: The stress path plot and the Mohr-Coulomb failure criterion ................................ 199
Figure 5.21: qp plots for hydrate-bearing specimens ............................................................ 203
Figure 5.22: Comparison of hydrate saturation dependency of failure strength of the present
study for cementing habit of hydrates (solid circles and squares) with that of Yun et al.
[2007] for pore-filling to load bearing habit of hydrates (open circles and squares) .......... 205
Figure 5.23: Comparison of strength-stiffness correlation for the present study for cementing
habit of hydrates (solid circles and squares) with that obtained by Yun et al. [2007] for
pore-filling to load bearing habit of hydrates (open circles and squares) ........................... 206
Figure 5.24: Comparison of shear strength at constant mass obtained in the present study
(solid circles) with the data of Yun et al. [2007] (open circles).......................................... 207
Figure 5.25: The predicted undrained strength by Santamarina and Ruppel [2008] model
versus measured strength of present study (solid circles) and measured undrained
strength of Yun et al. [2007] (open circles) ........................................................................ 208
Figure 5.26: Comparison of measured shear strength of present study (solid circles) with that
predicted by Santamarina and Ruppel [2008] model with a and b parameters obtained
by fitting to data of present study ....................................................................................... 209
Figure 5.27: The predicted strength by Santamarina and Ruppel [2008] model versus the
measured strength of present study (solid circles) .............................................................. 210
Figure 5.28: The predicted strength by Santamarina and Ruppel [2008] model versus the
measured strength of present study (solid circles) .............................................................. 211

xv
Nomenclature
a Lattice parameter
ba, Model coefficients of Santamarina and Ruppel (2008)
oa Lattice parameter at a reference temperature, oT
321 ,, aaa Lattice constants
A, B Skempton`s pore pressure coefficients
cC Compressibility of the soil structure
gC Compressibility of pore gas
HC Compressibility of hydrate
sC Compressibility of the soil mineral
sC Aggregated compressibility of the solid constituents
vC Compressibility of the pore fluid
wC Compressibility of pore water
E Young’s modulus
G Shear modulus
iK Bulk modulus of the thi constituent ( i soil mineral or hydrate)
cK Bulk modulus or the (skeletal stiffness) of the soil framework
sK Aggregated bulk modulus of the solid constituents
xvi
GoM Moles of methane present per unit volume of vapour phase under pre-
dissociation conditions
GfM Moles of methane present per unit volume of vapour phase under post-
dissociation conditions
GextM Moles of methane present per unit volume of vapour phase volume
extV under Lw-V equilibrium
HM Moles of methane present per unit volume in hydrate phase
WoM Moles of methane present per unit volume of aqueous liquid under
pre-dissociation conditions
WfM Moles of methane present per unit volume of aqueous liquid under
post-dissociation conditions
WextM Moles of methane present per unit volume of aqueous phase volume
extV under Lw-V equilibrium
LwMV Molar volume of aqueous liquid
VMV
Molar volume of vapour
n Total number of gas moles present within the volume extV
N Number of distinct solid constituents (= 2 including soil mineral and
hydrate)
extn Porosity of the soil material
xvii
Gfn Total number of gas moles present within the gas/water collector
( )(GWCGfn ) less the total number of gas moles present within the
connection tubing ( extn )
)(GWCGfn Total number of gas moles present within the gas/water collector at
post-dissociation conditions
kn Hydrate number
P Pressure
hq Hydrate strength
q and p Stress path parameters
gS Degree of gas saturation
hS Degree of hydrate saturation
uS Undrained shear strength
wS Degree of water saturation
T Temperature
u Pore pressure
au Pore pressure development during application of all around confining
stress
du The pore pressures development during deviatoric loading stage of the
test

xviii
V Volume
extV Volume of hydrate forming gas filled elements external to the
immediate boundaries of the specimen for which the material mass
within is forced into the gas/water collector during collection of
dissociation products
dV Volume change in the gas phase due to gas dissolution in the aqueous
phase under pre-dissociation conditions
'
dV Volume change in the aqueous phase due to gas dissolution in the
aqueous phase under pre-dissociation conditions
eV Volume of hydrate lattice per mole of water at pre-dissociation
conditions
gV Pore gas volume
GoV Volume of water saturated gaseous methane (vapour) present within
the system under pre-dissociation conditions
GfV Volume of water saturated gaseous methane (vapour) corresponding to
the number of gas moles Gfn under post-dissociation conditions
)(GWCGfV Total volume of gas collected at the gas/water collector under Lw-V
equilibrium at post-dissociation conditions
GHV Volume of gas consumed for hydrate formation

xix
GTotV Total volume of gas available for hydrate formation under pre-
dissociation conditions
HV Volume of hydrates under pre-dissociation conditions
lV Partial molar volume of water in the solution at pre or post-
dissociation conditions
mV Molar volume of methane under given temperature/pressure conditions
MextV Molar volume of methane under Lw-V equilibrium at
pressure/temperature conditions (i.e., pre-dissociation pressure and
room temperature) corresponding to the vapour volume extV
MfV Molar volume of methane under Lw-V equilibrium at post-dissociation
conditions
SV Volume of solid soil (constant under pre and post-dissociation
conditions)
WoV Volume of (gas dissolved) water present within the system under pre-
dissociation conditions
WfV Volume of (gas dissolved) water present within the system under post-
dissociation conditions
WHV Volume of water generated due to hydrate dissociation or consumed in
hydrate formation
WTotV Total volume of water available for hydrate formation under pre-
dissociation conditions
WVV Volume change in the gas phase due to the presence of moisture

xx
'
WVV Volume change in the aqueous phase due to the moisture loss into the
gas phase
VoV Initial volume of voids under pre-dissociation conditions
pv Compression wave velocity
sv Shear wave velocity
4CHx Mole fraction of methane in aqueous liquid
4CHy Mole fraction of methane in vapour phase
Biot`s effective stress coefficient
Inclination of the shearing plane to the direction of minor principal
stress
Poisson’s ratio
Mass density of the soil-hydrate medium
1 Major principal stress
3 Minor principal stress
03 Initial effective confining stress
Friction angle
Effective friction angle
i Volumetric fraction of the thi constituent in the solid phase ( i soil
mineral or hydrate)
1
Chapter One: Introduction
1.1 Introduction
Gas clathrate hydrates (herein called “hydrate” or “hydrates”) are non-stoichiometric compounds
where guest gas molecules are encapsulated within hydrogen bonded lattice cages of water. Two
common molecular structures into which the hydrates of most non-polar and some weakly polar
gases are formed are known as Structure I and Structure II [van der Walls and Platteeuw, 1959],
where, Structure I is the most commonly found in nature [Kvenvolden, 1993]; and methane, a
low carbon number hydrocarbon, is the most commonly found hydrate former in natural systems.
However, many naturally occurring gases such as low-carbon-number hydrocarbons, carbon
dioxide, and hydrogen sulphide have molecular sizes suitable to form hydrates.
Gas hydrates received attention in the 1930s when hydrate formations were discovered to cause
pipeline blockage during transmission of natural gas [Hammerschmidt, 1934]. Natural gas
hydrates were first discovered in the Siberian Messoyakha gas field in 1960s [Makogon, 1981].
In the 1970s they were found to occur in deep water sediments [Claypool & Kaplan, 1974].
Since then, evidence of their existence in deepwater marine sediments and in permafrost regions
have been recorded abundantly where appropriate pressure/temperature (P/T) conditions and
sufficient methane flux exist.

2
1.2 Human interest in gas hydrates
Gas hydrates capture human interest (1) as a potential energy resource, (2) as a submarine geo-
hazard and, (3) as a factor in global climate change [Kvenvolden, 1993]. On one hand, the large
quantities of organic carbon present in the concentrated form of hydrates [Kvenvolden, 1993]
leading to greater energy density of reservoir rock compared to other conventional and
unconventional sources of gas (e.g. coal beds, tight sands, and black shales) [MacDonald, 1990]
explains the popularity of such gas hydrate-bearing sediments as potential sources of energy. On
the other hand, the link to submarine geo-hazards, drilling and methane production related
failures, and climate change issues that are associated with hydrated sediments require
engineering evaluation. The slides and slumps on the continental slope and rise of South West
Africa, slumps on the U. S. Atlantic continental slope, and submarine slides on the Norwegian
continental margin are among much historical evidence that exhibit a possible connection
between hydrate boundaries and geo-hazards [Grozic, 2010]. The possible mechanisms that lead
to the observed behaviour of dramatic loss of strength and stiffness in these sediments are
discussed by Nixon and Grozic [2007] and Sultan et al. [2004]. The role of gas hydrate as an
influential factor controlling climate change is discussed by many including Majorowicz et al.
[2012], Regan et al. [2011], Regan and Moridis [2007], and Ruppel [2011].
3
1.3 Problem statement – The importance and the challenges in assessing geomechanical
properties of hydrate-bearing sediments
Knowledge of the mechanical properties of hydrate-bearing sediments is important in evaluating
the potential risks associated with short and long term sediment behaviour related to drilling and
methane production, reservoir subsidence, and mechanisms that lead to slope instability issues
associated with shallow hydrated sediments. The mechanical properties of these sediments are
determined either by non-destructive field measurements including seismic and electric methods,
direct sampling and subsequent laboratory measurements of natural hydrate-bearing cores, or
laboratory tests on artificially synthesised hydrate-bearing specimens.
A variety of factors including host sediment properties, pore fluid consistency, hydrate
saturation, distribution and growth habit [Spangenberg and Kulenkampff, 2006; Priest et al.,
2005, 2009] affect the seismic and electric properties of these sediments and hence the reliability
of field measurements. Direct sampling is significantly affected by the alterations to in-situ stress
conditions and hydrate dissociation related issues during sampling and core transfer [Waite et al.,
2009; Yun et al., 2006]. As such laboratory synthesis and subsequent testing of hydrate-bearing
sediments is an important method of gaining fundamental knowledge about these complex
materials. However, synthesis of artificial hydrates at the laboratory and the subsequent testing
are very challenging. The greatest difficulty exists with the synthesis to form representative
growth habits of natural systems. It is believed that in many natural environments hydrates form
from dissolved methane in water [buffet and Zatsepina, 2000]; in certain other natural
4
environments hydrates form in the presence of free gas. Replicating the spatial variability of
hydrate distribution is also equally challenging. Waite et al. [2009] presents a vivid illustration of
the special variability in hydrate sediments “from the scale of gas hydrate-bearing reservoirs to
the submicron scale”. Therefore, there exists a need to further our investigation of
geomechanical properties while paying attention to the details of formation process of synthetic
hydrate cores. The results can later be aggregated and adjusted to develop better models of
natural environments.
1.4 Research objectives
This research of geomechanical properties of hydrate-bearing sediments was carried out with the
following objectives:
(a) To introduce a novel formation procedure to artificially synthesise representative hydrate-
bearing sediments at the laboratory.
(b) To investigate the triaxial compressive strength of hydrate-bearing sediments;
specifically to investigate:
a. The hydrate saturation dependency of strength and stiffness
b. The initial effective stress dependency of strength and stiffness
c. Pore-scale hydrate growth habit dependency of strength and stiffness

5
1.5 Scope of investigation
Our attempt to accomplish the above objectives is set within the scope defined by the following
tasks:
(a) Investigating the factors governing the physical properties of natural hydrate-bearing
sediments; specifically the geomechanical properties
(b) Investigating the methods for laboratory synthesis of hydrate-bearing sediments and the
impact on physical properties
(c) Introducing a novel formation method to form methane hydrate in the presence of free
gas within particulate granular soil material
(d) Investigating a method of accurate estimation of hydrate saturation
(e) Testing of hydrate-bearing soil specimens under triaxial compression conditions at
constant strain rate and constant mass
(f) Analysis of test results for general stress-strain behaviour and correlation between
hydrate saturation/initial effective confining stress and strength/stiffness
(g) Comparison of test results with previously published work to identify the pore-scale
growth habit dependency of the strength/stiffness behaviour
1.6 Organization of the thesis
The main aim of this research has been to investigate the strength of hydrate-bearing sediments.
The work carried with this focus is presented within the thesis as explained below.
6
Identifying the impacts of the process of laboratory synthesis of gas hydrate on the physical
properties of hydrate-bearing sediments – Chapter 2
The Chapter identifies that the physical properties of hydrate-bearing sediments are governed by
the growth habit, spatial distribution, and hydrate saturation. It also identifies that the growth
habit, spatial distribution, and hydrate saturation are formation method dependent. Hence it
concludes that the physical properties of hydrate-bearing sediments are governed by the method
of laboratory synthesis of hydrates. Four primary formation methods are brought in to detailed
discussion to identify the variations in the formation procedures for a given primary formation
method adopted at various laboratories. The important impacts of different process elements of
these procedures include the effects of freezing and thawing, water migration during formation,
effects of formation P/T conditions and subsequent changes to the conditions, and effects of post
formation water saturation. The study adds to current knowledge by reviewing in detail the
aforementioned effects for possible impacts on the growth habit and spatial distribution of
hydrates. The Chapter emphasises on the need to direct our attention not only toward the
“method” but also toward the formation “process” and provides insight into planning the
laboratory formation methodology for this research.
Synthesising artificial hydrate-bearing sediments at the laboratory – Chapter 3
The previous discussion on controls of geomechanical properties of hydrate-bearing sediments
indicates the need to isolate these effects in testing for physical properties of these sediments.
This study is focused on hydrate formation in the presence of a free gas phase and attempts to

7
isolate the impact of formation habit on the geomechanical response from the impacts of spatial
variability in distribution. A novel formation procedure which is based on the partial water
saturation method and extended to form hydrates from water saturated methane was introduced.
The methodology is detailed in Chapter 3.
Identifying the need to perform accurate estimations of hydrate saturation – Chapter 4
Many methods of hydrate saturation estimation (including acoustic wave speed measurements,
measurement of electrical properties such as resistivity and dielectric constant) suffer from
dependency of those measured parameters on:
Host sediment characteristics such as porosity, porosity distribution, geological features
such as fractures and fracture orientation, intact properties of the soil grains, and stress
state
Pore space consistency (such as existence of free gas) and pore fluid characteristics (such
as salinity and presence of other solutes)
Hydrate growth habit and distribution
This study explores the applicability of dissociation gas evolution measurements (DGEM) as an
alternative to the aforementioned; the DGEM is attractive for the following reasons; (1) it is
based on fundamental physics and chemistry, (2) the estimation depends only on the bulk
hydrate filled pore volume fraction, and (3) it can be used to calibrate most other aforementioned
methods. The Chapter emphases the need to determine hydrate saturation accurately and links to
8
available resources that are valuable in the accurate determination of the input parameters
required for the DGEM. Additionally, this Chapter explores the sensitivity of hydrate saturation
to the accuracy with which the input parameters are measured or estimated. The work contributes
to the main focus of the research by providing insight as to the degree of care that we need to
exert in relevance to laboratory measurements and by providing guidance as to the choice of
mathematical model in the parameter estimation.
Investigating the triaxial compression strength of hydrate-bearing sediments – Chapter 5
The Chapter 5 serves the main purpose of the thesis. It presents the results of the laboratory
investigation carried out to investigate the behaviour of hydrate-bearing sediments. The Chapter
focuses mainly on the initial effective confining stress, hydrate saturation, and pore scale hydrate
growth habit dependency of strength and stiffness of hydrated sediments.
Conclusions – Chapter 6
The main conclusions derived from the study are presented in Chapter 6. This Chapter also
presents recommendations as to potential future research.

9
Chapter Two: Methane Hydrates in Porous Soil Media - A Review
2.1 Introduction
Presence of hydrate within soil pore space is well known to affect the physical properties of such
sediments and the geomechanical properties are no exclusion. It may well be hypothesised that
these effects are of three folds: (1) effects of hydrate growth habit, (2) effects of spatial
distribution of hydrates, and (3) the effects of the degree of hydrate saturation. At a given degree
of hydrate saturation, the method of hydrate synthesis within host sediment certainly is one of the
major deterministic factors of pore scale hydrate growth habit and distribution. Therefore, it is
one of the most influential factors governing the way in which the sediment responses to various
loading applied on it. As such, this Chapter is organized to identify four different primary
methods of hydrate formation, to identify the growth morphologies and habits encountered in
nature, to discuss the relations between physical properties and growth habit, spatial distribution,
and hydrate saturation, to discuss the relation between formation method and growth habit,
spatial distribution, and hydrate saturation. More importantly, this Chapter reviews in detail the
possible outcomes of important hydrate formation process elements emphasizing on the need to
view hydrate formation as a “process” and not a “method”.
2.2 Methods of laboratory synthesis of artificial hydrate-bearing sediments
There are four commonly used primary methods of laboratory hydrate synthesis:
(1) dissolved gas method;
10
(2) partial water saturation method;
(3) ice-seeding method; and
(4) hydrate pre-mixing method.
However, quite a number of differences are found among the exact formation processes
employed at various laboratories for a given primary formation method. These particulars will
later be discussed in Section 2.9.1. The following details the four primary formation methods.
2.2.1 Dissolved gas method
The dissolved gas method involves circulation of methane dissolved water through a porous
specimen [Ghiassian and Grozic, 2011; Spangenberg et al., 2005, 2008]. Hydrate is expected to
form within porous media as methane dissolved water at high pressure cools into the hydrate
stability zone. Methane depleted water leaving the specimen enters a source chamber within
which high aqueous methane concentration is re-established. The interplay of pressure,
temperature, and dissolved methane concentration as driving forces of hydrate formation is well
described by Zatsepina and Buffett [1997] and Davie et al. [2004]. The rate of hydrate formation
is limited by solubility of methane in water [Ghiassian and Grozic, 2011; Priest et al., 2009;
Spangenberg et al., 2005; Waite et al., 2009; Yun et al., 2005], and whether the flow conditions
are static or dynamic [Tohidi et al., 2001]. Some attempts to promote formation from dissolved
phase are given by Waite et al. [2008a] and Zhong and Rogers [2000]. The dissolved gas method
mostly results in hydrate and gas dissolved water in (H-L) equilibrium at the end of formation
stage as achieving 100% hydrate filled pore-space is unlikely due to decrease in fluid
11
permeability caused by growing hydrate saturation [Spangenberg et al., 2005]. The difficulties
related to formation of methane hydrate from dissolved gas have led researchers to use other
hydrate formers such as carbon dioxide (CO2) and tetrahydrofuran (THF) as proxies for methane.
Formation with CO2 involves a similar procedure to that of formation with methane, and the
details are presented by Buffett and Zatsepina [2000] and Tohidi et al. [2001]. In the case of
THF, known amount of THF and water are pre-mixed to obtain a solution of predetermined
concentration; the porous specimen is saturated with the solution, and then forced in to the
hydrate stability field to allow formation of hydrate [Yun et al., 2007]. The hydrate saturation is
fixed by the concentration of THF-water solution and the desired pore contents can be easily
arrived at. Particularly, the uncertainties related to hydrate saturation estimation can be
eliminated. However, there are concerns related to the use of THF to mimic natural hydrates of
methane. Different forms of “excess water” methods [Eaton et al., 2007, 2009; Madden et al.,
2009; Priest et al., 2009] which appear to be, however, different from what is generally termed
“dissolved gas method” could also be found in literature.
2.2.2 Partial water saturation method
The partial water saturation method involves hydrate growth within gas-rich environment, and
hence hydrate is formed in the presence of free gas. A partially water saturated host specimen is
created and forced into the hydrate stability field. Two different approaches are generally used to
form a partially water saturated specimen; (1) moist tamping of a pre-mixed soil-water mixture
[Ebinuma et al., 2005; Hyodo et al., 2007, 2009, 2011; Priest et al., 2011; Rees et al., 2011;

12
Waite et al., 2008b; Winters et al., 2007; Yoneda et al., 2011] and (2) partially draining of an
initially fully water saturated specimen [Ghiassian and Grozic, 2011; Grozic and Ghiassian,
2010; Masui et al., 2005a, 2005b; Miyasaki et al., 2008, 2010a, 2010b, 2011; Winters et al.,
2004]. Upon complete formation of hydrate, both the methods are expected to produce hydrate
and vapour in (H-V) equilibrium. Although both the approaches may expect to generate hydrate
specimens of similar “consistency”, whether they would produce specimens of similar
“distribution” of pore contents is uncertain. Also, it is appropriate to expect some quantity of un-
reacted water to be present in the pores at the apparent end of formation (indicated by
insignificant gas consumption rates or pressure reduction rates), particularly at higher degree of
initial (pre-formation) water saturations [Kneafsey et al., 2007; Spangenberg et al., 2005; Yun et
al., 2007]. Upon hydrate formation, the test specimens are sometimes brought to H-L equilibrium
by water saturating the specimens [Ebinuma et al., 2005; Hyodo et al., 2007, 2009, 2011; Masui
et al., 2005a, 2005b; Miyasaki et al., 2008, 2010a, 2010b, 2011; Yoneda et al., 2011].
2.2.3 Ice-seeding method
This method involves pre-mixing of ice and cooled sand grains, tamping the mixture into a
mould to construct the testing specimen, and then establishing the P/T conditions suitable for
hydrate formation while ice is forced to melt producing liquid water required in the progression
of the hydrate formation reaction. The details of the methodology are presented by Stern et al.
[1996, 1998]. Masui et al. [2005a, 2005b] and Ebinuma et al. [2005] employ this methodology in
the specimen preparation for geomechanical testing of hydrated sediments. Ice-seeding method
13
results in H-V equilibrium within the soil specimen upon complete conversion of melt water into
hydrate. However, sometimes the test specimens are brought to H-L equilibrium by water
saturating the specimen at the end of formation [Masui et al., 2005a, 2005b].
2.2.4 Hydrate pre-mixing method
Similar to ice-seeding method, hydrate granules are mixed with sand grains and formed into a
test specimen at low temperatures, pressurized, and brought to an elevated temperature while the
P/T conditions are maintained within hydrate stability field. Hyodo et al. [2005] uses hydrate
pre-mixed specimens in testing for geomechanical properties. The hydrate granules are formed
by mixing misted water with pure methane gas under hydrate forming conditions [Hyodo et al.,
2005]. Similar to ice-seeding method, pore space of such hydrate pre-mixed specimens consists
of hydrate and vapour in (H-V) equilibrium.
2.3 Natural gas hydrates
Natural gas hydrates are generally found beneath the permafrost and in deep oceanic sediments.
The upper hydrate boundary is found at typical water depths of 300-800 m conditioned by the
local bottom water temperature in oceanic environments [Koh and Sloan , 2007]. Most hydrate
occurrences are reported in continental shelves and enclosed seas where rapid organic carbon
accumulation takes place, adequate methane flux exists (due to bacterial methanogenesis of
organic carbon), and suitable P/T conditions exist. Natural gas hydrate is usually thought to have

14
formed from gas dissolved aqueous solutions except within such regions where free gas is
present [Buffett and Zatsepina, 2000].
2.3.1 Hydrate growth morphologies
Natural hydrates are found to occur in varying forms (or growth morphologies) within different
types of Earth’s sediments [Boswell and Collett, 2006; Collett, 2002]:
(1) disseminated hydrate growth within the pore space of coarse granular particulate
sediments; and
(2) nodules, laminae, and growth within cracks and fissures particularly associated with fine
grained sediments.
According to the summaries of Waite et al. [2009], Mackenzie Delta and Nankai Trough
sediments contain sand and gravel and are characterized as course grained sediments. Lesser
amounts of disseminated hydrates are also found in fine grained sediments consisting of clay and
silt of Blake Ridge, Gulf of Mexico, Hydrate Ridge, and Offshore India although nodule or
layered hydrate formations within these sediments are the major contributors to the total hydrate
saturation of such sediments [Waite et al., 2009]. The Figure 2.1 illustrates some of these various
growth habits.
15
2.3.2 Pore scale hydrate growth habits
Presently, our understanding of porous media hydrate growth (although not extensive) is limited
to disseminated pore space hydrate growth within sediments of course granular particle
assemblies of varying nature while, other hydrate growth forms such as nodules, laminae, and
growth within cracks and fissures particularly associated with fine grained sediments awaits
proper attention. The disseminated form of growth is generally categorized in to a number of
different pore scale growth habits. A number of studies including but not limited to those carried
out by Kleinberg et al. [2003], Murray et al. [2006], Winters et al. [2004] agree upon model
developed by Helgerud [2001] or similar effective medium models for pore scale hydrate growth
habit. Helgerud [2001] approach is based on four distinct hydrate habit models for explaining
soil hydrate interaction for unconsolidated packing of mineral grains (Figure 2.2). According to
Helgerud [2001] (a) hydrate grows without significant interaction with the frame as a pore filling
substance, (b) hydrate grows in the interior of the pores as a part of the load bearing frame, (c)
hydrate forms preferentially at grain contacts, acting as cement between particles, and (d)
hydrate coats grains more or less uniformly, progressively cementing them as the hydrate volume
increases. The hydrate habits models of Winters et al. [2004] treat the two models of Helgerud
[2001] (c) hydrate formation at grain contacts and (d) hydrate formation coating the grains as one
model of cementation habit. As such it is appropriate to present the pore scale hydrate growth
categorized in to three habits as follows.
16
2.3.2.1 Pore filling habit
The pore filling habit refers to the growth form where hydrate exists within the pore space
without significant interaction with the soil skeleton. Hydrate does not bridge sediment grains
together. Heterogeneous nucleation (i.e., hydrate nucleation occurring on mineral surfaces) or
homogeneous nucleation (i.e., hydrate nucleation occurring spontaneously within fluid phase
away from mineral boundaries as shown in Figure 2.2(a)) may take place conditioned by various
factors [Katsuki et al., 2006, 2007; Ohmura et al., 2004; Spangenberg et al., 2008; Tohidi et al.,
2001; Yun and Santamarina, 2011]. Further details can be fount in Section 2.8.1.
2.3.2.2 Load bearing habit
The load bearing habit refers to the growth form where hydrate acts as a part of the soil skeleton
providing mechanical stability to the structure. The load bearing habit is considered to be as
resulting from continuous growth of pore filling hydrates to reach the mineral boundaries of a
pore (as shown in Figure 2.2(b)). Further growth may even displace the mineral grains in loose
unconsolidated sediments. The load bearing habit may be expected when hydrate saturations
exceed 25-40% [Berge et al., 1999; Yun et al., 2005, 2007]
2.3.2.3 Grain cementing and/or coating habit
This growth form refers to hydrate growth at grain contacts acting as cement between particles
(as shown in Figure 2.2(c)) or hydrate growth coating the sediment grains more or less uniformly

17
progressively cementing the grains as the hydrate volume increases (as shown in Figure 2.2(d)).
This form of hydrate growth generally takes place when free gas is present within the sediments.
2.3.3 Controls on pore scale hydrate growth morphologies and habits
The hydrate growth morphologies and habits found in natural sediments are mainly determined
by (1) permeability and permeability distribution within the sediment which is determined by
pore size and porosity distribution within the sediment [Nimblett and Ruppel, 2003; Waite et al.,
2009], (2) methane solubility which is determined by the temperature, pressure, salinity, and
capillary pressure and pore size [Clennell et al., 1999; Davie et al., 2004; Sun and Duan, 2007;
Zetsepina and Buffett, 1998], and (3) availability of methane flux. Kleinberg et al. [2003] also
suggests variety of other factors including “sediment mineralogy and texture, other solutes such
as biosurfactants, gas composition”, and “annealing effects” as deterministic of hydrate growth
morphology and habit.
Course grained sediments, which are highly permeable compared to fine grained sediments, are
generally associated with disseminated form of hydrate growth in sediment pore space. Within
fine grained sediments, hydrates tend to occur in cracks and fissures where methane flux to
hydrate nucleation sites (either in dissolved form or in free gas form) is less restricted and
capillary inhibition of hydrate formation (detailed below) is less significant. Methane solubility
in water increases with decrease in temperature, however, in the presence of hydrate methane
solubility decreases with decrease in temperature [Davie et al., 2004; Zetsepina and Buffett,

18
1998] (Figure 2.3). In absence of hydrates methane solubility increases with increasing pressure,
however, in the presence of hydrate, solubility decreases slightly with increasing pressure [Davie
et al., 2004; Zetsepina and Buffett, 1998] (Figure 2.3). The aforementioned indicates that greater
the temperature and pressure at the base of the HSZ, the higher the tendency for hydrates to form
from dissolved phase upon pressure temperature decrease within the HSZ while the available
methane flux (which is mostly determined by the geologic setting of the region) compared to the
solubility limit under the prevailing P/T conditions and the rate of methane dissolution
determines if free gas is present within the HSZ. Continuous sedimentation and resulting
warming at the base of HSZ may also cause hydrate dissociation at the base and subsequent
migration of free gas into the HSZ [Rempel and Buffett, 1997]. As would be later discussed in
greater detail, whether or not hydrate is formed in the presence of free gas in tern determines the
formation habit. The presence of salt in pore water results in decreased methane solubility both
in the presence and absence of hydrates; however, the effect is not as significant as that of other
factors. Within fine grained sediments, high capillarity affects growth in two ways: (a) capillarity
increases methane solubility in water [Clarke et al., 1999; Sun and Duan, 2007; Waite et al.,
2009] and (b) capillarity favors hydrate formation in larger pores within the sediment and smaller
pores are invaded later [Kneafsey et al., 2007]. Thus, provides a secondary reason for hydrates to
occupy features of high porosity such as cracks and fissures within fine grained sediments. The
underlying physical laws governing the aforementioned behavior are explained elsewhere
[Clennell et al., 1999; Davie et al., 2004; Waite et al., 2009; Zetsepina and Buffett, 1998].

19
In the context of laboratory synthesis of hydrate-bearing sediment, for given sediment exposed to
particular gas water chemistry, the pore scale hydrate distribution is most preferably governed by
the formation procedure or more specifically, the sequential events during the formation stage.
Apart from formation procedure, the pre-formation water saturation is the most deterministic
factor of hydrate growth habit and the fact is reflected in the experimental results of Howard et
al. [2011] and Minagawa et al. [2009] (Section 4.3).
2.3.4 Classification of natural hydrate accumulations
The natural hydrate accumulations of disseminated hydrate growth morphology (at temperatures
above the freezing point of water and overlain by a cap rock) are further categorized into three
types by Moridis and Collett [2003] (Figure 2.4):
(1) Class I with underlying free gas,
(2) Class II with underlying free water, and
(3) Class III located between impermeable formations.
Class I accumulations consists of hydrate and free gas (Class IG) or hydrate and free water
(Class IW) within the reservoir pore space of the hydrate stability zone (HSZ). These
accumulations are underlain by a region where the sediment pore space is occupied by water and
free gas. Class II and Class III reservoirs are associated with complete pore space hydrate
occupancy within the HSZ.

20
2.4 Hydrate growth habit dependency of physical properties
The growth habits are known to result in “different macro-scale behaviour of seemingly
identical” host “sediments” [Ghiassian and Grozic, 2011] and changes in acoustic and
geomechanical properties are among many such properties that are affected.
The pore filling habit alters the bulk stiffness of the pore fluid of host sediments [Yun et al.,
2005] while, the cementation habit alters both the bulk stiffness of the pore fluid and the skeletal
stiffness [Dvorkin et al., 2000; Yun et al., 2005]. Therefore the acoustic properties of hydrate-
bearing sediments are affected by hydrate growth habit as the wave propagation speeds are
controlled by the sediment’s bulk modulus (which is determined by bulk stiffness of the pore
fluid and the skeletal stiffness [Waite et al., 2009]) and the shear modulus (which is determined
by several factors including the nature of inter-granular contacts and hence by growth habit
[Santamarina et al., 2001]). The differences in sediment strength properties between different
growth habits are highlighted in Winters et al. [2002] and Ghiassian and Grozic [2011] with
observations of stronger and stiffer response for cementing habits compared to that of pore filling
or load bearing habits.
2.5 Hydrate spatial distribution dependency of physical properties
The effects of spatial distribution of hydrate on the geomechanical properties have not been
studied comprehensively. However, the anisotropies caused by variations in hydrate distribution
can very well be anticipated to define the physical properties including the geomechanical

21
properties of these sediments. Studies such as Waite et al. [2008b] indicate the changes in peak
strength caused by the changes in distribution.
2.6 Hydrate saturation dependency of physical properties
Of the three controls, it is the effects of hydrate saturation that has mostly been a research focus.
Many evidence can be found in literature for hydrate saturation dependency of geomechanical
properties (Ebinuma et al., 2005; Hyodo et al., 2007, 2009, 2011; Kuniyuki et al., 2010; Masui et
al., 2005a, 2008a, 2008b; Miyazaki et al., 2008, 2010, 2011; Ghiassian and Grozic, 2011;
Winters et al., 2002, 2007; Yun et al., 2007], acoustic wave speeds [Chand et al., 2006; Howard
et al., 2011; Kleinburg et al., 2003; Priest et al., 2005, 2009; Waite et al., 2008b, 2009; Winters et
al., 2004], electrical properties (such as resistivity and dielectric constant) [Kilner and Grozic,
2006; Spangenberg and Kulenkamff, 2006], and thermal properties (such as thermal
conductivity) [Waite et al., 2002, 2007, 2009]. A detailed explanation of the relationship between
these factors and hydrate saturation is presented in Chapter 4.
The Sections 2.5, 2.6, and 2.7 conclude that the physical properties of hydrate-bearing sediments
are governed by the growth habit, spatial distribution, and hydrate saturation.

22
2.7 Hydrate formation method dependency of growth habit, spatial distribution, and
hydrate saturation
2.7.1 Growth habit
Different methods of hydrate synthesis result in different formation habits [Ebinuma et al., 2005;
Grozic and Ghiassian, 2010; Priest et al., 2009; Spangenberg et al., 2005; Waite et al., 2009;
Winters et al., 2004; Yun et al., 2007; Zhong and Rogers, 2000]. The Figure 2.5 presents the
general association between the four primary methods of hydrate laboratory synthesis (Section
2.2) and hydrate growth habits. As can be seen, the dissolved gas method results in pore filling
growth habit with hydrates nucleating on mineral surfaces [Katsuki et al., 2006, 2007; Ohmura et
al. 2004; Spangenberg et al., 2008; Tohidi et al., 200] and subsequent growth in to the pore space
(Figure 2.5(a)). However, with continuous hydrate growth, load bearing habit can well be
anticipated. The partial water saturation method is associated with grain cementing hydrate habit
with hydrate formation at grain contacts (Figure 2.5(b)). The ice-seeding method either results in
cementing or load bearing habit, while hydrate pre-mixing habit results in load bearing habit
(Figure 2.5(c)) depending upon hydrate saturation and the relative size of the hydrate and
sediment grains.
2.7.2 Spatial distribution
The formation method dependency of hydrate spatial distribution has received attention only
lately. Kneafsey et al. [2010] investigate the possible means of obtaining uniform pore space
distribution of hydrate for variety of formation procedures based on the primary method of
23
partial water saturation, while Minagawa et al. [2009] examines the hydrate spatial distribution
for different formation procedures based on the primary methods of partial water saturation and
ice-seeding. Both studies observe differences in hydrate spatial distribution between different
formation procedures and provide evidence of hydrate formation method dependency of hydrate
spatial distribution. Also, the aforementioned studies reveal the challenges that exist with the
attempts to obtain uniform hydrate distributions at the laboratory which can be used as
representative of a given hydrate habit in the study of physical behaviours associated with the
hydrate habit.
2.7.3 Hydrate saturation
The hydrate saturations obtained in the laboratory is often constrained by the challenges
associated with different formation methods. The dissolved gas method has only shown limited
success due to low solubility of methane in water and hydrate plugging of fluid circulation lines.
Conceptually, it is envisaged that the method can yield up to 60-70% before pore fluid
circulation is severely restricted [Waite et al., 2009]. A highest saturation of 95% after 50 days of
formation had been reported by Spangenberg et al. [2005]. The partial water saturation method
allows hydrate saturations up to about 60%. The full conversion of water into hydrate becomes
challenging as the initial water saturation increases. Thus, higher hydrate saturations obtained
with this method are associated with limited reliability. Ice-seeding and hydrate pre-mixing
methods has been used to generate hydrate saturations up to about 50% [Masui et al., 2005;
Hyodo et al., 2005]. Similar to partial water saturation method the hydrate saturations achievable

24
using ice-seeding method is restricted by the issues related to full conversion of ice or melt water
into hydrate. The hydrate pre-mixing method may conceptually used to achieve 100% hydrate
saturation.
The Sections 2.7.1, 2.7.2, and 2.7.3 allows us to conclude that growth habit, spatial distribution,
and hydrate saturation are formation method dependent. As such, based on our previous
conclusions on growth habit, spatial distribution, and hydrate saturation dependency of physical
properties it can now be deduced that the physical properties of hydrate-bearing sediments are
governed by the method of laboratory synthesis of hydrates. The four primary formation methods
are, in fact, consists of various formation process elements and are employed with significant
differences in procedures at different laboratories. Considering the dependence of physical
properties on the formation method and the differences in formation procedures employed, it is
of immense importance to investigate the implications of different formation process elements in
detail. The Section 2.8 serves this purpose.
2.8 Formation “Method” versus Formation “Process”
When laboratory synthesis of hydrate-bearing sediment is considered, we tend to perceive
hydrate formation in porous media as a result of a mere method of distinctive end product. We
highlight the need to propel our observations towards greater details viewing hydrate formation
as a “process” of which the end product carries the signatures of several process elements.
Evidence can be presented from literature that paying attention to different formation “process

25
elements” is much needed as those different process elements may have significant control over
the hydrate growth habit and the pore space hydrate distribution of the synthesised specimens
thus governing the physical properties. The notion of forming “representative samples” of
natural hydrate-bearing sediments includes two key components; (1) forming a representative
growth habit and (2) forming a representative pore space distribution of hydrate. It can be
noticed that either one of the components often receive attention at a time while the other
remains unnoticed. Kneafsey et al. [2010] and Minagawa et al. [2009] investigate the possible
means of obtaining uniform pore space distribution of hydrate by employing various formation
processes while the general associations between growth habit and primary formation method are
assumed to be applicable. The following sections look into the possible implications of various
process elements over the representative nature of the resulting specimens and thus serve a long
awaited need. Other than the formation process elements (including freezing and thawing, water
migration during hydrate formation, formation P/T conditions and subsequent changes of
conditions on the hydrates of a particular primary formation method), the impact of the factors;
intact strength of hydrate and hydrate former are also discussed.
2.8.1 Implications of the primary formation method
The hydrate growth habit is thought to be predominantly governed by the primary formation
method. According to Waite et al., [2009], and Yun and Santamarina, [2011], when hydrates are
formed from gas dissolved water, heterogeneous nucleation tend to occur on mineral surfaces.
Heterogeneous nucleation is also supported by Katsuki et al. [2006, 2007] and Ohmura et al.

26
[2004], however, different macroscopic hydrate morphologies and different hydrate-sediments
bonding characteristics are reported at different sub-cooling during hydrate formation. In contrast
to above observations, with regard to “excess water” method of hydrate formation, which is a
variation of dissolved gas method, hydrates nucleate in the pore space with no contact with
mineral surfaces [Spangenberg et al., 2008; Tohidi et al., 2001]. In all cases, subsequent hydrate
growth in water-rich environment results in non-cementing hydrate habit [Spangenberg et al.,
2008]; particularly, pore filling habit of hydrate growth at low hydrate saturations and the load
bearing habit at higher saturations are observed [Yun et al., 2007; Priest et al., 2009].
Partial water saturation method, due to pre-formation water accumulation at grain contacts,
however, produces cementation habit of hydrate growth with hydrate formation initiating at grain
contacts [Chuvilin et al., 2003; Ebinuma et al., 2005; Klapproth et al., 2007; Kneafsey et al.,
2005, 2007; Kono and Budhijanto, 2002; Masui et al., 2005a; Priest et al., 2005]. As hydrate
formation proceeds, the growth may result in coating the sediment gains entirely.
According to Waite et al. [2009] it appears that a mixed habit of cementing and load bearing
nature can be expected for specimens created with ice-seeding method. The cementing nature of
the habit is due to preferential melt water accumulation at grain contacts. This form of growth
can particularly be expected at low initial ice to sediment volume fraction. Whether or not the
formation would continue to grow into a load bearing habit is seemingly determined by
combined effect of several factors including the initial (pre-formation) ice to sediment volume
fraction, relative size of mineral and ice grains (which determines if the ice grains filled the

27
sediment pores or acted as a part of the pre-formation sediment frame as a load bearing element),
and the pace at which the melt-water conversion into hydrate takes place relative to the possible
sediment consolidation that may take place as the melting of (load bearing) ice occurs.
The hydrate premixing method essentially results in a load bearing growth habit and the “load
distribution within the sediment depends on the relative size of the hydrate granules and
sediment grains” [Waite et al., 2009].
The above summarises the general associations between the primary formation methods and the
pore scale hydrate growth habits. The exact form of growth habit and hydrate distribution
depends on several other factors which are discussed in the following sections. The knowledge
presented in the following sections may even lead us to question the validity of the
aforementioned associations.
2.8.2 Implications of different approaches for forming a partially water saturated specimens
Mainly two different approaches are employed to form partially water saturated specimen; (1)
moist tamping of a pre-mixed soil-water mixture and (2) partially draining of an initially fully
water saturated specimen.
With the use of moist tamping of pre-mixed soil-water mixture, an approximately uniform initial
water distribution can be expected within the specimen. During the time between specimen

28
preparation and hydrate nucleation some water re-distribution within the specimen can also be
expected for reasons such as gravity effects. According to our observations with 20/30 grading
Ottawa sand, however, at least for low water saturations (up to a water saturations of about 25%)
of compact grain arrangements the gravity effects cause minimal or negligible changes in water
migration over time spans of multiple hours as capillary effects helps holding water at grain
contacts acting against gravity. If the formation procedure consists of freezing and thawing of the
partially saturated specimen, significant degree of water redistribution should be expected.
As opposed to the use of moist sand, partially draining of an initially water saturated specimen
may result in high water saturations predominantly closer to the drainage end of the specimen.
Introducing hydrate forming gas as a bubble form into the specimen with reversed flow direction
may help obtaining a better water distribution. Significant improvements of initial water
distribution can be achieved by subjecting the specimen to a series of sudden pressure pulses
following draining of excess water. Therefore, in either case of (1) use of moist sand, and (2)
partially draining, whether or not a uniform distribution of hydrates would result depends on the
initial water distribution (if not altered by subsequent freezing and thawing) and the very nature
of the hydrate nucleation and growth process. For example, rapid formation with simultaneous
nucleation at multiple sites may result in greater uniformity as opposed to slow formation with
limited number of nucleation sites. Hydrate formation itself can causes non-uniformities within a
specimen [Kneafsey et al., 2010] particularly when the slow formation takes place with water
migration towards a small number of nucleation sites.

29
2.8.3 Effects of freezing and thawing
The effects of freezing and thawing can be discussed in relation to both laboratory synthesised
specimens and natural hydrate-bearing core samples as a factor which affects (1) hydrate
distribution and (2) possible mineral grain re-distribution and preservation of the sediment pore
structure. In the case of laboratory synthesis of hydrate-bearing specimens, the issues of hydrate
distribution appears to be more prominent. In the case of natural core samples the issues of
mineral grain re-distribution and the preservation of the sediment pore structure appear to be
prominent. The following discussion, however, omits the discussion of effects on natural core
samples as the focus of this Chapter is to investigate the process of synthesising artificial
hydrate-bearing specimens at the laboratory. Many laboratories [Hyodo et al., 2007, 2009, 2011;
Masui et al., 2005a; Miyasaki et al., 2008, 2010a, 2010b, 2011] follow hydrate formation
processes consisting of freezing and thawing with respect to initially partially water saturated
specimens. Once the specimens are transferred into strength testing apparatus, such frozen
specimens are then thawed under pressure to reach a temperature outside the hydrate stability
zone [Hyodo et al., 2011] prior to subsequent cooling and formation. In other cases the frozen
specimens are only thawed to facilitate ice melting but temperature is maintained within the
hydrate stability region [Hyodo et al., 2007, 2009; Masui et al., 2005a; Miyasaki et al., 2008,
2010a, 2010b, 2011] facilitating hydrate formation as water-ice melts.
Freezing initiates at surfaces where heat is removed; in the case of cylindrical specimen
subjected to radial heat transfer freezing initiates at the outer radii and then draws water towards
30
the freezing front [Kneafsey et al., 2010, Kneafsey and Nakagawa, 2011]. However, the degree
of water movement is apparently governed by the degree of initial water saturation, the type of
soil, and rate of freezing [Kneafsey et al., 2010]. According to the observations of Kneafsey et al.
[2010] little change in water movement could be expected upon freezing of sand with lower
packing density and high roughness of the grains at low water saturation. Rapid freezing could
also help maintaining uniform ice distribution [Kneafsey et al., 2010]. However, the correlations
do not appear clear and ample room exists for further research.
Irrespective of initial water saturation and the type of soil, thawing seems to be re-establishing
the initial water distribution resulting in fairly uniform water distribution [Kneafsey et al., 2010].
However, whether or not uniformly distributed hydrate formation would result depends on the
subsequent procedures followed in an experiment. From the aforementioned it could be deduced
that controlled slow thawing of a specimen (previously subjected to rapid freezing) under
hydrate forming gas pressure could be used to create more uniform hydrate distribution as
opposed to rapid melting and lagged initiation of hydrate formation as hydrate formation itself
affects water distribution. As the thawing progresses the system temperature may preferably
maintained within the hydrate stability zone.
In addition to water change characteristics, freezing/thawing can also cause mineral grain
redistribution within unconsolidated sediment although the effects can be minimized at higher
confining stresses [Kneafsey et al., 2011]. The mineral grain redistribution is more prominent in
31
fine grained sediments than in course grained sediments and is also freezing rate dependent
[Winters et al., 1999; Winters et al., 2008]. Rapid freezing in liquid Nitrogen does not appear to
disrupt the sediment as severely as slow freezing as extensive grain movement with ice-lens
formation due to “pore water migration towards freezing fronts” associated with slow freezing
[Winters et al., 2008] is avoided.
2.8.4 Effects of water migration during formation of hydrate
The effect of water migration during hydrate formation is discussed below in relevance to
hydrate formed within partially water saturated granular media. Evidence can be cited in
literature for observed water migration towards hydrate nucleation sites creating un-evenness in
water distribution [Guptha et al., 2008; and Kneafsey et al., 2007; and Kneafsey and Nakagawa,
2011]. Capillary pressure changes takes place within porous medium as hydrate formation
narrows the pores [Guptha et al., 2008; Kneafsey et al., 2007, Kneafsey and Nakagawa, 2011]
and water tends to flow into narrower pores and hence, a growing hydrate front drags a region of
high water saturation along [Kneafsey et al., 2007, 2010]. Water migration and hydrate
formation can result even in grain-redistribution particularly in unconsolidated sediments as
explained previously with relevance to freezing and ice-lens formation. If facilitated, rapid
hydrate formation upon establishing hydrate stability conditions with simultaneous nucleation at
multiple sites could be expected to create lesser degree of water migration. Low initial water
saturation could also be expected to promote simultaneous multiple nucleation.
32
2.8.5 Effects of formation P/T conditions and subsequent changes to formation P/T conditions
The effects of formation P/T conditions are barely but addressed in literature with regard to (1)
intact hydrate characteristics of microscopic nature which is later discussed under “intact
strength of hydrate” [Huo et al., 2003; Sloan, 2003], (2) macroscopic morphology of hydrate
crystal growth [Katsuki et al., 2006, 2007; Ohmura et al., 2004], (3) consequent hydrate-
sediment interaction [Katsuki et al., 2006, 2007], and (4) strength properties of granular hydrate
assemblies [Hyodo et al., 2002; Nabeshima et al., 2005; Song et al., 2010]. An unmistakable
dependency of above on formation P/T conditions could be identified.
Macroscopic morphology of hydrate crystal growth is known to be governed by the degree of
sub-cooling which is the difference between the enforced formation temperature and the
equilibrium H-L-V three-phase temperature corresponding to the system pressure [Katsuki et al.,
2006, 2007; Ohmura et al., 2004]. It is interesting to note that those different hydrate
morphologies interact with sediment grains in different ways and hence affect the geomechanical
properties of hydrate-bearing sediment to a varying degree. The type of hydrate morphology
observed at low sub-cooling (faceted crystals) exhibits stronger bonding with the sediment grains
[Katsuki et al., 2006, 2007]. The hydrate morphology observed at high sub-cooling (dendritic
crystals) tends to change to crystals of particulate nature with aging and appears to have no
cementation effect on the sediment grains [Katsuki et al., 2006, 2007].
33
Effects of subsequent changes to formation P/T has been reported external to the crystallographic
scale. Dramatic increase in hydrate formation rate is induced by the “reduction of driving force”
(by means of reducing pressure towards the equilibrium pressure at a given temperature or by
increasing the temperature towards the equilibrium temperature at a given pressure), possibly
due to (1) formation of isolated pockets of water containing dissolved methane and the over-
pressurization as gas pressure declines or temperature increases, consequent breakage of
surrounding hydrate walls of these pockets, and resulting improved communication between
water and gas phases, (2) methane super-saturation of pore water and consequent gas ex-solution
in response to pressure drops [Kneafsey et al., 2007].
2.8.6 Effects of post formation water saturation
Many specimen preparation processes subjected to our review of hydrate synthesis for
geomechanical testing of specimens include post formation water saturation of hydrated
specimens consisting of free gas phase within the pore space at the end of formation phase. Due
to the altered pore contents such a specimen should be expected to exhibit different
geomechanical behaviour with respect to a non-water saturated specimen consisting of hydrate
and vapour. Seismic resonance frequency measurements of Kneafsey et al. [2010] reveals a
reduction of specimen stiffness and therefore, indicates possible de-bonding of hydrate from
mineral surfaces upon post formation water saturation. This important observation suggests a
change in the hydrate habit from grain cementation to pore filling, although little evidence can be
cited in literature to support this observation. Issues such as water saturation induced possible
34
hydrate re-formation or dissolution due to possible methane concentration differences between
flood water and the equilibrium methane concentration at corresponding system temperature and
pressure awaits attention.
2.8.7 Intact strength of hydrate
The effects of intact strength of hydrate are expected to have significant control on the overall
strength of hydrate-bearing sediment particularly at high hydrate saturations exceeding
approximately 80% of pore space saturation as illustrated in Waite et al. [2009]. Triaxial
compression tests of Hyodo et al. [2002], Nabeshima et al. [2005], and Song et al. [2010] on
strength of methane hydrate are seemingly non-representative of particular growth morphologies
formed under the applied formation conditions, but appear to be altered by the respective testing
procedure. Whether or not the P/T conditions are maintained constant between formation and
subsequent testing is not clear. Particularly, some procedures [Nabeshima et al., 2005, Song et
al., 2010] involve compaction of hydrate formed from powdered ice in forming triaxial test
specimens. Therefore, the specimens represent an assembly of hydrate granules of certain growth
morphology with seemingly different crystal-crystal interactions at the inter-granular contacts to
intact bonds between crystals within the undisturbed core of individual granules.
However, the reported strength of these granular hydrate assemblies shows increased strength at
cooler temperatures and higher pressures [Hyodo et al., 2002; Nabeshima et al., 2005; Song et
al., 2010] and interestingly shows a clear correlation with the relative location of test P/T

35
conditions in the P-T space for methane-water system with respect to the three phase hydrate-
aqueous liquid-vapour (H-Lw-V) boundary [Hyodo et al., 2002]. These observations are signs of
microscopic level response of hydrate to different environmental conditions and subsequent
changes in such environmental conditions.
As presented earlier, hydrate crystal morphology at least depends on applied sub-cooling during
hydrate formation [Katsuki et al., 2006, 2007; Ohmura et al., 2004]. Therefore, it is prudent to
assume that strength of hydrate as relevant to its contribution to the strength of hydrated
sediment to be affected by many factors both known and unknown including the intact single
crystal hydrate strength. On one hand, Katsuki et al. [2006] in relevance to their examination of
sub-cooling dependency of morphology assume the mechanical properties of hydrate crystals are
independent of the degree of sub-cooling during formation. On the other hand, Raman
Spectroscopy experiments of Huo et al. [2003] prove non-stoichiometric existence of methane
hydrate unit cell at partial cage occupancy and the cage occupancies are governed by the
pressure, temperature and the overall methane composition of a given system [Sloan, 2003a,
2003b]. In fact, hydrates grown at vapour-liquid interface tends to exhibit greater cage
occupancy than dendritic crystals grown into liquid phase [Huo et al., 2003]. It is therefore, not
inappropriate to question if the intact single crystal strength itself could be considered
independent of formation conditions. As such it is evident that the strength of aggregated hydrate
is governed by complex interplay of variable factors and our present knowledge is apparently
inadequate in predicting its contribution to the overall strength of hydrated sediments.

36
2.8.8 Hydrate former
Carbon dioxide (CO2) and tetrahydrofuran (THF) are often used as proxies for methane with the
intention of avoiding the difficulties associated with methane hydrate formation. According to
the previous discussion, not only the way that hydrate interacts with sediment grains at macro
level but also the properties of intact hydrate at micro level too can be considered as influential
over the overall geomechanical behaviour of hydrate-bearing sediment. Therefore, it is important
that our choices as to the alternative hydrate formers to methane are based on sound scientific
facts. “CO2 hydrate yields the same hydrate structure as the CH4 hydrate” [Buffett and Zatsepina,
2000] and leaves researchers with the ease of working at low pressures still offering greater
solubility in water compared to methane. CO2 is generally considered as a “useful analog to
naturally occurring hydrates” [Buffett and Zatsepina, 2000] and we do not wish to further our
discussion in this regard as geomechanical testing of hydrated specimens reported in literature do
not include hydrates formed from CO2. The differences between THF and CH4 hydrates are
discussed, the issues are raised, and their impacts over the mechanical strength are addressed by
Lee et al. [2007]. Waite et al. [2009] summarises the THF related issues and highlights the
relative advantages of the use of THF as a hydrate former. The argument remains that the overall
hydrate-bearing sediment behaviour is more reflective of the hydrate formation process (i.e., the
primary formation method and the subsequent process elements of macro scale impacts) than it
would be of the micro scale differences of THF and methane hydrates.
37
2.9 Discussion
The results of our above investigation of hydrate formation process are summarized in Table 2.1.
The present success with dissolved gas method remains with the use of proxies for methane such
as tetrahyrofuran (THF). Uncertainties though exist as to whether nucleation takes place on
mineral grains or in pore water with no grain contact. The formation P/T conditions particularly,
the degree of sub-cooling during formation appear to have an impact over the cementing or non-
cementing nature of formation. However, observations of sediment physical properties to date
do not support the cementing habit of hydrates but pore filling and load bearing hydrates.
Hydrate-bearing sediment formed with initially partial water saturated specimens are generally
associated with grain cementation hydrate habit at low saturations and grain coating hydrate
habit at high saturations. However, when the impact of various process elements during
formation are carefully considered, it appears that there exists a possibility of obtaining pore
filling and load bearing hydrate habits which are more representative of natural hydrates.
Evenness of hydrate distribution can be expected in specimens prepared at low initial water
saturations forced to rapid formation with simultaneous nucleation at multiple sites. If freezing
and thawing are involved in the formation process, rapid freezing followed by slow thawing with
temperatures and pressures maintained within hydrate stability zone would results in
preservation of initial water distribution within the specimen. High sub-cooling during formation
and post formation water saturation of the specimen are known to result in hydrate de-bonding
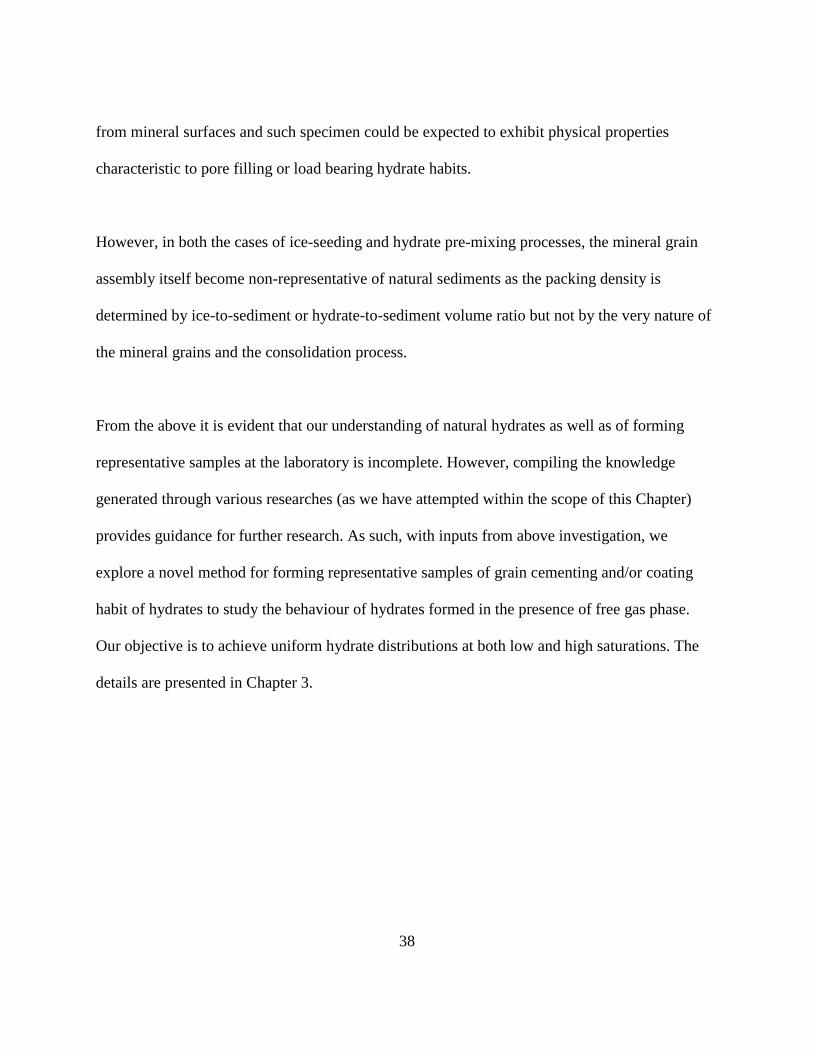
38
from mineral surfaces and such specimen could be expected to exhibit physical properties
characteristic to pore filling or load bearing hydrate habits.
However, in both the cases of ice-seeding and hydrate pre-mixing processes, the mineral grain
assembly itself become non-representative of natural sediments as the packing density is
determined by ice-to-sediment or hydrate-to-sediment volume ratio but not by the very nature of
the mineral grains and the consolidation process.
From the above it is evident that our understanding of natural hydrates as well as of forming
representative samples at the laboratory is incomplete. However, compiling the knowledge
generated through various researches (as we have attempted within the scope of this Chapter)
provides guidance for further research. As such, with inputs from above investigation, we
explore a novel method for forming representative samples of grain cementing and/or coating
habit of hydrates to study the behaviour of hydrates formed in the presence of free gas phase.
Our objective is to achieve uniform hydrate distributions at both low and high saturations. The
details are presented in Chapter 3.

39
(a) (b) (c)
Figure 2.1: Different hydrate growth morphologies found in natural hydrate-bearing
sediments (Hydrate in white)
- (a) Disseminated form of hydrate growth in coarse grained soils from 1998 Mallik 2L-38
hydrate research well, (b) Veined hydrate formation in fine grained sediments from Krishna
Godavari Basin, offshore India, and (c) Sediment coated hydrate chunks in fine grained
sediments of Gulf of Mexico. (Modified from Waite et al. [2009])

40
Figure 2.2: Pore-scale hydrate growth habits for unconsolidated packing of mineral grains
- According to Helgerud [2001], hydrate growth can be categorized into different habits as
follows: (a) hydrate grows without significant interaction with the frame as a pore filling
substance, (b) hydrate grows in the interior of the pores as a part of the load bearing frame, (c)
hydrate forms preferentially at grain contacts, acting as cement between particles, and (d)
hydrate coats grains more or less uniformly, progressively cementing them as the hydrate volume
increases.

41
Figure 2.3: Solubility of methane in pure water
- Methane solubility in water increases with decrease in temperature, however, in the presence of
hydrate methane solubility decreases with decrease in temperature. In the absence of hydrates
methane solubility increases with increasing pressure, however, in the presence of hydrate,
solubility decreases slightly with increasing pressure (Adopted from Davie et al. [2004]).
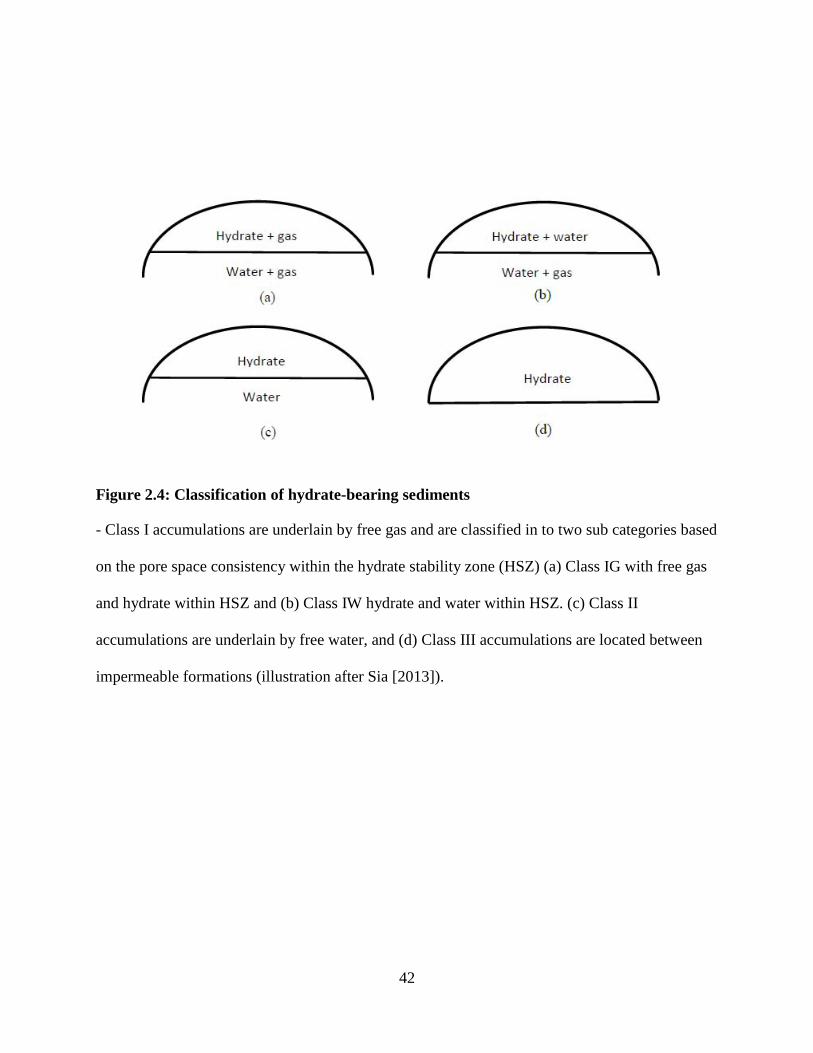
42
Figure 2.4: Classification of hydrate-bearing sediments
- Class I accumulations are underlain by free gas and are classified in to two sub categories based
on the pore space consistency within the hydrate stability zone (HSZ) (a) Class IG with free gas
and hydrate within HSZ and (b) Class IW hydrate and water within HSZ. (c) Class II
accumulations are underlain by free water, and (d) Class III accumulations are located between
impermeable formations (illustration after Sia [2013]).
43
Figure 2.5: The general association between the four primary methods of hydrate
laboratory synthesis and hydrate growth habits
- (a) the dissolved gas method results in pore filling growth habit with hydrates nucleating on
mineral surfaces and subsequent growth in to the pore space, (b) the partial water saturation
method is associated with grain cementing hydrate habit with hydrate formation at grain
contacts, and (c) the ice-seeding method either results in cementing or load bearing habit, while
hydrate pre-mixing habit results in load bearing habit depending upon hydrate saturation and the
relative size of the hydrate and sediment grains (Adopted from Waite et al. [2009])

44
Table 2.1: Impact of formation process elements on the growth habit and hydrate
distribution during laboratory synthesis of hydrate-bearing soil specimens
Formation process elements
Laboratory synthesis of disseminated hydrate in particulate granular media
Primary formation
method
Dissolved gas method – nucleation on mineral surface
and subsequent growth into
pore space OR nucleation in pore water with no grain
contact?
Partial water saturation method – nucleation and
growth at grain contacts
Ice seeding method – melt water is converted
to hydrates
Hydrate premixing
method
General associations between the hydrate
formation methods
and pore space hydrate growth
habits
Pore filling hydrate habit at low
hydrate saturations
Load bearing hydrate habit at high hydrate saturations
Grain cementation hydrate
habit at low hydrate saturations
grain coating habit at high
hydrate saturations
Grain cementation
hydrate habit (at low initial ice to sediment
volume ratio) OR Load
bearing hydrate habit (Whether or not the load
bearing hydrate habit
would exist depends upon several factors as
presented in Section
2.8.1.
Load bearing hydrate habit
Use of moist sand
specimen versus partially draining a
water saturated
specimen to obtain a partially water
saturated specimen
NA
Use of moist sand – fairly
uniform initial distribution of water
Partially draining a
saturated specimen – tendency for uneven initial
distribution of water
NA NA
Freezing –
associated with
water migration and pore water volume
expansion
NA
Mild water migration
observed with: Rapid freezing
Low packing density of
mineral grains High roughness of mineral
grains and
Low initial water saturation
(Caution: Greater tendency
for mineral grain re-distribution exists with
lower packing density)
(The adverse impact is not as severe as in the case of
natural core samples of no
free gas as the pore volume
is much compressible)
NA NA
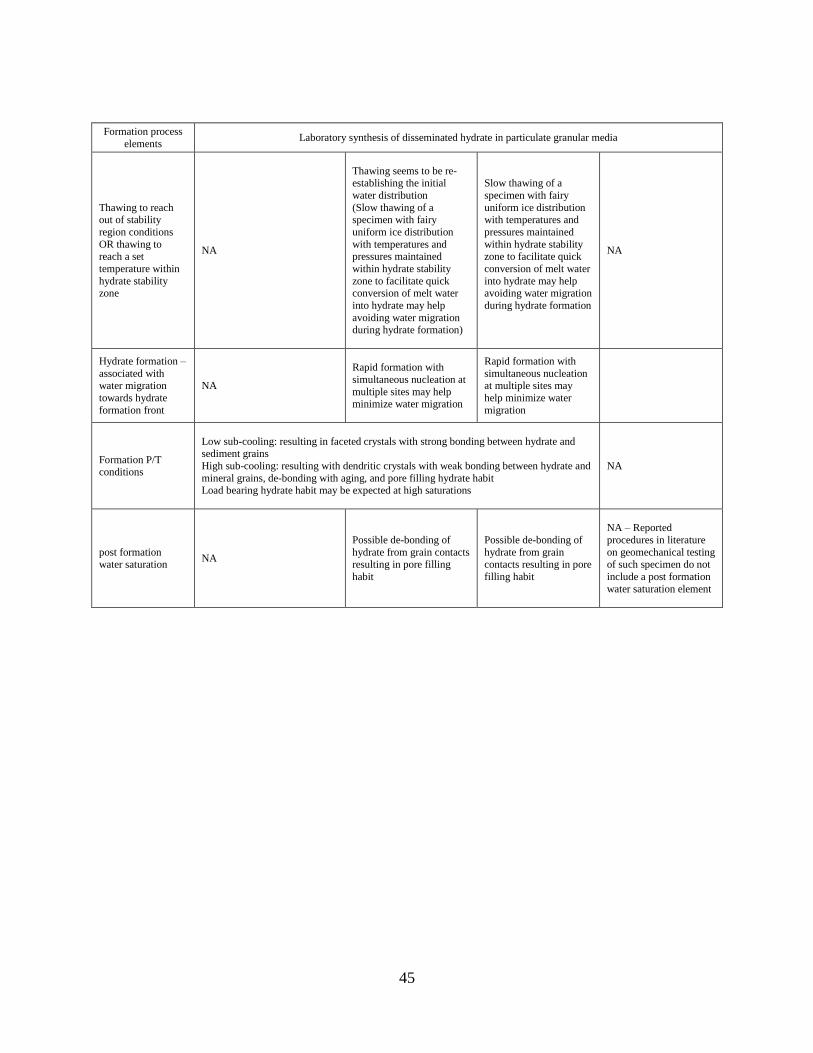
45
Formation process
elements Laboratory synthesis of disseminated hydrate in particulate granular media
Thawing to reach out of stability
region conditions
OR thawing to reach a set
temperature within
hydrate stability zone
NA
Thawing seems to be re-establishing the initial
water distribution
(Slow thawing of a specimen with fairy
uniform ice distribution
with temperatures and pressures maintained
within hydrate stability
zone to facilitate quick conversion of melt water
into hydrate may help
avoiding water migration during hydrate formation)
Slow thawing of a
specimen with fairy
uniform ice distribution with temperatures and
pressures maintained
within hydrate stability zone to facilitate quick
conversion of melt water
into hydrate may help avoiding water migration
during hydrate formation
NA
Hydrate formation –
associated with water migration
towards hydrate
formation front
NA
Rapid formation with
simultaneous nucleation at
multiple sites may help minimize water migration
Rapid formation with
simultaneous nucleation at multiple sites may
help minimize water
migration
Formation P/T conditions
Low sub-cooling: resulting in faceted crystals with strong bonding between hydrate and sediment grains
High sub-cooling: resulting with dendritic crystals with weak bonding between hydrate and
mineral grains, de-bonding with aging, and pore filling hydrate habit Load bearing hydrate habit may be expected at high saturations
NA
post formation water saturation
NA
Possible de-bonding of
hydrate from grain contacts resulting in pore filling
habit
Possible de-bonding of
hydrate from grain contacts resulting in pore
filling habit
NA – Reported
procedures in literature
on geomechanical testing of such specimen do not
include a post formation
water saturation element

46
Chapter Three: Laboratory Synthesis of Methane Hydrate-Bearing Sediment
3.1 Introduction
The details of common methods for laboratory synthesis of methane hydrate-bearing sediments,
namely; (1) dissolved gas method, (2) partial water saturation method (3) ice-seeding method
and (4) hydrate pre-mixing method [Waite et al., 2009] were presented in Chapter 2. Further,
investigation into the hydrate growth habit, spatial distribution, and saturation dependency of
physical properties including geomechanical properties has illustrated that the laboratory
synthesis method of hydrate-bearing sediments plays an influential role in determining the
physical behaviour of such sediments. Existing hydrate formation methodologies are incapable
of producing representative specimens of a given hydrate habit [Kneafsey et al., 2007; Waite et
al., 2008b] as the behaviour is influenced by the specimen non-uniformities resulting from
uneven hydrate distribution [Waite et al., 2008b]. Therefore, one focus of this research has been
to develop a laboratory procedure to obtain a more uniform hydrate distribution, particularly at
higher hydrate saturations, within particulate granular soil media.
3.1.1 A novel procedure for hydrate synthesis – hydrate formation from water rich gaseous
methane
A novel hydrate formation procedure, based on the partially water saturated method, is thus
proposed. The method extends the partial saturation concept to continue hydrate formation in a
second phase where the formation occurs from water saturated gaseous methane (vapour). The
hydrate formation mechanisms in the second (vapour) phase are very similar to hydrate plug
formation, which occurs in natural gas transmission pipelines.
47
Partial water saturation method, due to pre-formation water accumulation at grain contacts,
produces cementation habit of hydrate growth with hydrate formation initiating at grain contacts
[Chuvilin et al., 2003; Ebinuma et al., 2005; Kneafsey et al., 2005, 2007; Priest et al., 2005,
2009; Waite et al., 2008b; Waite et al., 2009]. Uniform hydrate distributions can be achieved
with this methodology at low initial water saturations (or at low hydrate saturations) provided
that pre-formation water menisci are uniformly distributed within the media.
However, at higher hydrate saturations, the specimen non-uniformities, originating mainly from
non uniform distribution of pre-formation water, result in altered physical behaviours as
evidenced by Kneafsey et al. [2010]. When high hydrate saturations are to be achieved, high
initial water saturation is required, which may lead to existence of saturated granular clusters (or
“aggregates of sand grains connected by a patch of pore fluid” [Kneafsey and Nakagawa, 2011])
resulting in occurrences of un-reacted water pockets within the hydrated sediment and not
achieving expected hydrate saturations. The hydrate formation in partially water saturated sand
and measurement of acoustic properties [Kneafsey et al., 2011] at 39% initial degree of water
saturation (which is considered a relatively high water saturation) provides an explanation.
According to Kneafsey et al. [2011], hydrate growth initiates at gas-water interface followed by
“needle like crystal” growth in to the water phase from “diffusion of methane molecules through
the hydrate film and the water”. This growth model is applicable to (a) conversion of capillary
held water at single grain to grain contact (in the case of low initial water saturations) or (b)
conversion of capillary held water at outer surface of a saturated granular cluster. It is reasonable
that at low water saturations, there exists a greater probability of full conversion of capillary held
water at single grain to grain contacts in to hydrate before the thickness of the growing hydrate
48
mass significantly hinders methane diffusion through the hydrate mass. In contrast, at high initial
water saturations there exists a greater probability for unreacted water to be present in the core of
a saturated granular cluster by the time methane diffusion through the growing hydrate film is
apparently blocked. As should be expected, the observations related to tests of Kneafsey et al.
[2011] at 39% water saturation fit with the latter case indicating the possible existence of un-
reacted water pockets within the hydrate mass. The X-ray MicroCT imagery (Figure 3.1) of
laboratory formed hydrate sediments by Jin et al. [2006] also provide visual evidence for
existence of unreacted water. Such irregularities can significantly alter the geomechanical
behaviour of sediment as over-pressurization of trapped water may lead to hydrate fracturing
[Kneafsey et al., 2007] as the soil-hydrate medium deforms due to applied loading particularly
when excess negative bulk pore pressures develop within dense soil medium under undrained
conditions or when bulk pore fluid pressure dissipation takes place under drained conditions.
The developed hydrate formation procedure thus aims at eliminating the difficulties associated
with partial water saturation method and begins by forming a partially water saturated soil
specimen with a known initial water content, kept low enough (15-20% water saturation) to
ensure uniform pre-formation water distribution. Kneafsey et al. [2010] reports on difficulties in
maintaining uniform water distribution arising around water saturations of 35%. At low water
saturations, uniform water distribution can be achieved as capillary effects force water to reside
at grain contacts, thereby negating gravity effects. However, it should be noted that capillary
held water distribution within granular soil media is fundamentally governed by the pore size
(radius) distribution within the media. As such the uniform water distribution within specimens
should be expected for such grain assemblies where reasonably uniform pore size distribution is
49
expected. Hydrate saturations higher than that could be expected by mere conversion of capillary
held free water are obtained by allowing the specimen to enter a secondary formation phase
where accumulated hydrate growth takes place from conversion of vapour phase moisture into
hydrate. The theoretical background is presented in Section 3.3.
3.1.2 Potential hydrate growth habit
Within the specimens prepared with some initial water saturation, hydrate formation will begin at
the gas water interface leading to grain cementing hydrate habit (Figure 3.2(a)). As the growth
proceeds to the secondary phase where formation takes place from water vapour preferably
condensing on the mineral surfaces, the formation can be expected to coat the mineral grains
(Figure 3.2(b)). When the vapour phase is used with initially dry specimens, it is anticipated that
the hydrate will nucleate at the grain surfaces and grow coating the grain surfaces, and eventually
into the pore space.
3.1.3 Implications of hydrate growth habit on the strength and stiffness of the sediments
Grain cementing and grain coating hydrate habits are known to particularly increase the skeletal
stiffness [Fernandez and Santamarina, 2001; Priest et al., 2009; Waite et al., 2009]. Also, host
sediments indicate greater shear strength in the presence of hydrates.
3.2 The experimental procedure
The experimental procedure consists of three important stages, namely; (1) preparation of the
host specimen for hydrate synthesis, (2) hydrate formation, and (3) triaxial compression testing
of the hydrated specimen. The following is focused on the details of stages (1) and (2). The
50
details of stage (3) – the triaxial compression testing procedure are presented in Chapter 5 with
summary information of stages (1) and (2). A detailed diagram of experimental set-up is
presented in Figure 3.3.
3.2.1 Materials
3.2.1.1 Sand
Ottawa sand of uniform grain distribution (20/30, with mean particle size of 0.72 mm and
coefficient of uniformity of 1.2) [Cho et al., 2005] was used for preparation of host specimens
for laboratory synthesis of methane hydrate. The maximum and minimum void ratios of Ottawa
sand are 0.742 and 0.502 respectively [Cho et al., 2005]. According to ASTM C-778-12, Ottawa
sand has a specific gravity of 2.65.
3.2.1.2 Water
De-aired water was used in the testing process for specimen saturation and hydrate formation as
the presence of dissolved gases in water hinders methane dissolution in water and consequently
delays the hydrate nucleation process.
3.2.1.3 Hydrate former
Laboratory grade high purity (99.7%) methane was used as the hydrate former. The presence of
impurities in methane is known to affect the equilibrium P/T conditions of the methane-water
binary system.

51
3.2.2 Methods
3.2.2.1 Specimen preparation
A typical methane hydrate host specimen of cylindrical geometry was prepared by dry pluviation
of sand into a latex membrane fixed to the bottom cap of the triaxial assembly and supported by
a cylindrical split mould. A vacuum applied between the mould and the membrane ensures tight
contact between the membrane and the wall of the cylindrical mould during dry pluviation. The
specimen top cap was then set into place. All test specimens were constructed at an approximate
initial void ratio of 0.57, which corresponds to a relative density of 72%. Initial dimensions of
the test specimens were recorded; typical dimensions were 13.0 cm in height and 6.24 cm in
diameter. A vacuum was applied via the bottom cap of the triaxial assembly to provide suction
sufficient to prevent specimen collapse during removal of the split mould and later application of
initial confining stress. The split mould was then removed, outer triaxial cell assembled, the
triaxial cell filled with water (confining fluid), and an isotropic initial confining stress applied.
The vacuum was released and the specimen was fully water saturated by flow of water through
the specimen under a low head difference; flow occurred upwards, against gravity, to ensure full
saturation.
Following specimen saturation, an initial pore fluid pressure was applied, then confining and
pore fluid pressures were simultaneously increased to reach a pre-determined isotropic effective
consolidation stress (500 kPa or 1000 kPa) and pore fluid pressure of 9000 kPa. The specimen
was then allowed to consolidate under the set effective confining stress until drainage ceased.
The pore fluid volume change measurements allowed calculation of specimen void ratios at the
end of consolidation.
52
After consolidation, the specimen was opened to an interface cell (pressurized to 9000 kPa)
containing water rich gaseous methane and methane was allowed into the specimen while a
known quantity of pore water was drained from the specimen. This procedure produced a
partially water saturated medium of known degree of water saturation. Water saturations
between 15-20% were used to ensure uniform water distribution. To further promote uniform
water distribution, the gas flow direction was reversed and several pressure pluses were applied
at the bottom of the specimen, to promote upwards moisture movement.
3.2.2.2 Hydrate formation
Following preparation of the partially water saturated specimen, the specimen was cooled into
the hydrate stability zone (5o C) initiating hydrate formation, while the pore gas pressure was
maintained constant (at 9000 kPa) by controlling the pressure at the interface cell. Hydrate
formation initiated with conversion of capillary held water at grain contacts into hydrate
(primary formation phase). The interface cell, containing pressurized gas overlying water,
operated as the methane gas source throughout the hydrate formation stage. As such, gaseous
methane, which was fed into the specimen, was rich in water vapour because it was allowed to
reach saturation at the interface cell. The interface cell was at an elevated temperature (room
temperature) relative to the specimen, which was maintained at 5oC. At an elevated temperature
(outside the hydrate stability zone) gaseous methane holds a greater mole fraction of water when
in aqueous liquid-vapour equilibrium than it holds in the presence of hydrate (within the
specimen) at a lower temperature. This reduction in equilibrium water content contained within
the gaseous methane associated with cooling drives the hydrate formation into a secondary phase
where progressive formation occurs from conversion of vaporous water in methane into hydrate.

53
The gas volume consumption recoded at the interface cell provides an approximate estimation of
the hydrate quantities formed. Generally, obtaining higher hydrate saturations required longer
test durations (Table 3.6). Once the target hydrate saturation is achieved, the specimen was left to
equilibrate and the hydrate-vapour (H-V) equilibrium achieved.
At the completion of the formation procedures, the specimen was left to equilibrate and H-V
equilibrium achieved. The details of mechanisms governing the secondary hydrate formation are
discussed in the next section. The data presented in Table 3.6 reveals it was possible to achieve
hydrate saturations of about 55% from an initial water content of 15-20%.
A number of preliminary hydrate formation tests were carried out with zero initial water content
(dry sand). Hydrate formation with zero initial water content resulted in significantly lower
hydrate formation rates. This suggests that hydrate formation from an aqueous form of water is
favoured over hydrate formation from condensing water vapour contained within gaseous
methane. Once in the presence of hydrate formed during the primary formation phase, the
secondary formation reaction appears to continue at a comparatively higher rate. Seemingly,
more and more moisture is drawn towards the already formed hydrate. As hydrate accumulation
continues, the uniformity of hydrate distribution is expected to be maintained as it is fixed by the
initial water distribution and hence by the hydrate distribution of the primary formation phase.
54
3.3 The concept – Hydrate formation from water saturated gaseous methane
The following explains the underlying concept of secondary hydrate formation from water
saturated gaseous methane. Hydrate formation from vapour involves forcing a vapour, which is
initially in thermodynamic equilibrium with aqueous liquid (Lw-V), into hydrate vapour (H-V)
equilibrium. Our method uses isobaric (constant pressure) cooling of vapour in Lw-V
equilibrium to reach H-V equilibrium (Figure 3.4). Note that the numerical representation of
different stages and respective pressure/temperature/composition conditions are thus selected to
maintain consistency between Figures 3.4, 3.5 and 3.6.
The Phase Rule of Gibbs [Gibbs, 1948] provides the basis for understanding the mechanisms
taking place in such a system. It specifies the “degrees of freedom” or the number of independent
variables (F) required in defining the state of a system of known number of component (C) and
number of coexisting phases (P). The phase rule can be stated as: F=C-P+2. The Table 3.1
provides the possible combinations of P and F for a two component system (such as methane-
water system). Once F numbers of variables are fixed for the system, all the other variables are
fixed as well.
The heterogeneous equilibrium of two or more phases of a two component system can be
explained using the Pressure-Temperature-Composition (P-T-X) diagram. The T-X diagram at a
given pressure is particularly useful in understanding phase behaviour (Figure 3.5). The
following summarizes the representation of various combinations of P and F of Table 3.1 for two
or more co-existing phases.
55
(a) P=2, F=2: The state of a system in two phase equilibrium is determined by the spatial
spread of two surfaces in P-T-X space each representing one of the two phases when two
state variables are fixed for the system [Kobayashi and Katz, 1949]. For example, at a
given temperature T, and a pressure P, the phase composition of the existing phases is
fixed by the common intersection of each phase surface with the already fixed constant
P/T planes. In Figure 3.5, at a given temperature T, the composition of the aqueous liquid
and vapour phases in equilibrium are given by vertical projections of point (2) and (1)
respectively, on the composition axis.
(b) P=3, F=1: “Three-phase equilibria are represented by three space curves, each formed by
the intersection of two surfaces. The requirement for the uniformity of pressure and
temperature for an equilibrium system requires that the space curves for all three-phases
must furnish the same projection on the pressure-temperature (P-T) plane” [Kobayashi
and Katz, 1949]. Therefore, a plane consisting three space curves for respective phases in
equilibrium should be associated with single curvature independent of phase composition
in P-T-X space. As such three phase equilibria are represented by lines parallel to X axis
on TX and PX diagrams. For such equilibria only one degree of freedom exists. For
example, for hydrate-aqueous liquid-vapour (H-Lw-V) three phase equilibrium, at a
given pressure there exists unique temperature T (given by the projected intersection of
line (6)-(3)-(4)-(5) onto the T axis in Figure 3.5) and composition X (given by vertical
projections of points (5), (4), and (6) onto the X axis for Lw, H, and V phases
respectively). Therefore, if pressure P is selected as the independent variable, once the
56
pressure is fixed the other two variables temperature (T) and composition (C) are fixed as
well.
(c) P=4, F=0: Four phase equilibrium is represented by quadruple points on the P-T
projection of P-T-X space and are in fact projections of “four unique points in space
falling on a straight line perpendicular to the P-T plane at their respective phase
compositions” [Kobayashi and Katz, 1949]. Each individual point in space is the
intersection of three three-phase space curves. These set of curves “when projected on the
P-T plane appear as four three-phase curves emanating from a four-phase (quadruple
point)” [Kobayashi and Katz, 1949].
The exploration of TX diagrams of Kobayashi and Katz [1949] and the adaptation presented in
Figure 3.5 revels that the hydrate phase coexists with either the aqueous liquid phase or the
vapour phase, depending on the relative abundance of water and gas. Consider isobaric cooling
(which is represented by the dashed vertical line (1)-(7) of Figure 3.5) of a vapour which is in
equilibrium with aqueous liquid at point (1). In the case of our hydrate formation experiments,
the system pressure (within the interface cell and the soil specimen) is predetermined (9000 kPa)
and maintained at a constant value, while the temperature at the interface cell (where vapour at
conditions represented by point (1)) is in equilibrium with room conditions.
The composition of the vapour, which is now governed by the set pressure and temperature
regime, is determined by the vertical projection of point (1) onto the composition axis.
Theoretically, at compositions where the mole fraction of water in vapour is less than the mole

57
fraction corresponding to vertical line (4) – (4’) of stoichiometric hydrate composition
CH4.(5.75)H2O (which is given in terms of a mole fraction of 0.852), the H-V equilibrium can be
reached at by isobaric sub-cooling of the vapour along the line (1)-(3). Careful observation of the
non horizontal boundaries of the Lw-V two-phase region indicates (a) increased dissolved
methane mole fraction in water and (b) decreased mole fraction of water in methane associated
with cooling as moisture removed from vapour condenses to form aqueous liquid. When the
temperature (3) is reached by continuous cooling, hydrate of composition given by (4) forms and
coexists with a water of composition given by (5) and a vapour of composition given by (6). The
system is now at three-phase H-Lw-V equilibrium. Continuous heat removal at constant
temperature results in accumulation of hydrate as more and more vapour is drawn into the soil
medium. Once the supply of water rich methane is stopped, the system settles at the imposed
temperature of (7) by complete conversion of free water into hydrate followed by further cooling
into the H-V two phase region.
The composition of vapour in equilibrium with hydrate is given by the vertical projection onto
the X axis at point (8). The composition of hydrate in equilibrium with vapour is given by the
vertical line (4)-(4’). Originally Kobayashi and Katz [1949] assumed the hydrate phase
composition was fixed with 100% hydrate cage occupancy, however, more recent research [Huo
et al., 2003; Sloan, 2003a and 2003b] provide evidence of the non-stoichiometric nature of
hydrate formation, noting that unoccupied small cages exist within the hydrate structure. The
resulting hydrate number (or the composition) is a function of temperature, pressure, and overall
methane composition [Sloan, 2003b]. The effect of non-stoichiometric hydrate occurrence is
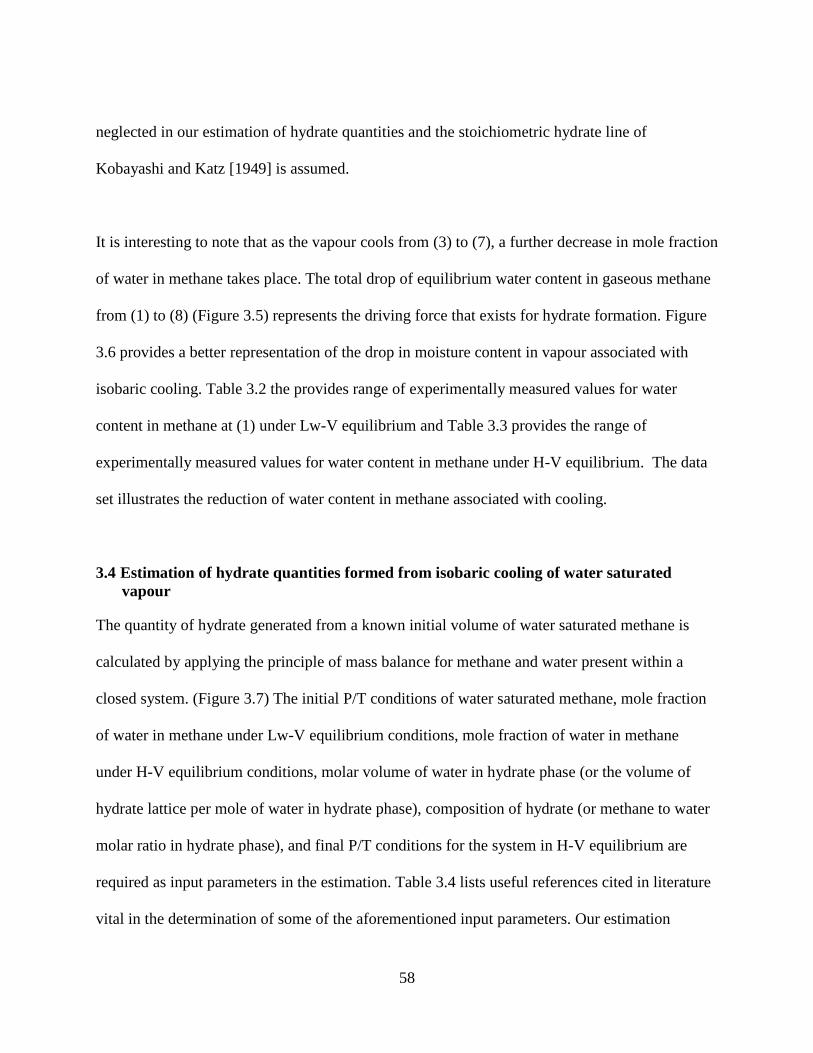
58
neglected in our estimation of hydrate quantities and the stoichiometric hydrate line of
Kobayashi and Katz [1949] is assumed.
It is interesting to note that as the vapour cools from (3) to (7), a further decrease in mole fraction
of water in methane takes place. The total drop of equilibrium water content in gaseous methane
from (1) to (8) (Figure 3.5) represents the driving force that exists for hydrate formation. Figure
3.6 provides a better representation of the drop in moisture content in vapour associated with
isobaric cooling. Table 3.2 the provides range of experimentally measured values for water
content in methane at (1) under Lw-V equilibrium and Table 3.3 provides the range of
experimentally measured values for water content in methane under H-V equilibrium. The data
set illustrates the reduction of water content in methane associated with cooling.
3.4 Estimation of hydrate quantities formed from isobaric cooling of water saturated
vapour
The quantity of hydrate generated from a known initial volume of water saturated methane is
calculated by applying the principle of mass balance for methane and water present within a
closed system. (Figure 3.7) The initial P/T conditions of water saturated methane, mole fraction
of water in methane under Lw-V equilibrium conditions, mole fraction of water in methane
under H-V equilibrium conditions, molar volume of water in hydrate phase (or the volume of
hydrate lattice per mole of water in hydrate phase), composition of hydrate (or methane to water
molar ratio in hydrate phase), and final P/T conditions for the system in H-V equilibrium are
required as input parameters in the estimation. Table 3.4 lists useful references cited in literature
vital in the determination of some of the aforementioned input parameters. Our estimation

59
reveals formation of trivial volume fractions of hydrate upon cooling. The Table 3.5 provides the
estimate of the hydrate quantity generated per known volume of water saturated methane under
Lw-V equilibrium at set P/T conditions. Therefore, it is suggested that continuous feed of water
rich methane into the soil media is critical to the success of the formation process. Interestingly,
our gas consumption measurements provide a hint of continued hydrate growth even under flow
conditions where the flow is allowed to occur through the specimen as a mere consequence of
methane/water concentration differences and/or as a requirement to maintain the system pressure
as methane is consumed in hydrate formation.
3.5 Hydrate growth habit and distribution deduced from subsequent strength testing of
hydrate-bearing specimens
The results of tests (MH A01 – MH 009) where hydrate formation within soil specimens pre-
consolidated at effective confining stress of 500 kPa are presented in Table 6. Subsequent to the
hydrate formation stage, the test specimens MH 001 – MH 009 were subjected to triaxial
compression loading to obtain the strength properties. At the end of the test, hydrate saturation
was calculated using the dissociation gas evolution measurements (DGEM) detailed in Chapter
4. The specimens with zero initial degree of water saturation generated comparatively low
hydrate saturations. However, the presence of some initial water appeared to have facilitated
higher hydrate saturations as can be deduced by comparison of formation duration times and the
obtained hydrate saturations (Table 3.6). The strength results can be used to derive indirect
evidence of the nature of hydrate distribution within the sediment. The clear correlation obtained
between the strength and hydrate saturation at low hydrate saturations (< 40%) is considered as
evidence of uniform hydrate distribution (Figure 5.5 of Chapter 5. However, at higher hydrate

60
saturations (> 40%), the loss of clear correlation between strength and hydrate saturation may be
considered as originating from possible non-uniformities in hydrate distribution. The greater
stiffness obtained for the tested specimens compared to those obtained for non-cementing habit
of hydrate (Yun et al., 2007) suggests possible grain cementation. Based solely on the strength
results, a definitive conclusion as to the growth of vapour phase hydrate formation can not be
reached; however, further research including microscopic imagining could be employed to
understand the pore scale nucleation and growth of hydrate.
3.6 Discussion
As the physical properties of hydrate-bearing sediments are greatly affected by pore space
hydrate distribution, we explore the possibilities of obtaining uniform hydrate distributions
particularly at higher hydrate saturations. The attempt to obtain uniform hydrate distribution
originates by maintaining uniform low initial water distribution within soil pore space and then
extends to hydrate formation from water saturated gaseous methane. In accordance with our
observations of the hydrate formation process we identify two major factors that determine the
degree of success in achieving high hydrate saturations and forming specimens of uniform
hydrate distribution representative of the particular growth habit: (1) initial availability of
minimal uniformly distributed water content, and (2) continuous feed of water rich methane
throughout the formation phase. Our work proves that forming hydrate from water saturated
gaseous methane is possible. As suggested by the strength results, employing the method appears
to have resulted in uniform hydrate distributions up to saturations of 40%. However, at higher
saturations, the strength behaviour suggests possible specimen non-uniformities. Therefore, we

61
emphasise on the need to perform further research to verify the expected growth morphologies
and the uniformity of hydrate distribution.

62
Figure 3.1: X-ray MicroCT imagery showing the distribution of different phases within
hydrated sediment
-Mmineral grains (dark grey), gas (black), water (light grey), and hydrate (white) - (Modified
from Waite et al, [2009] developed after Jin et al.,[ 2006])
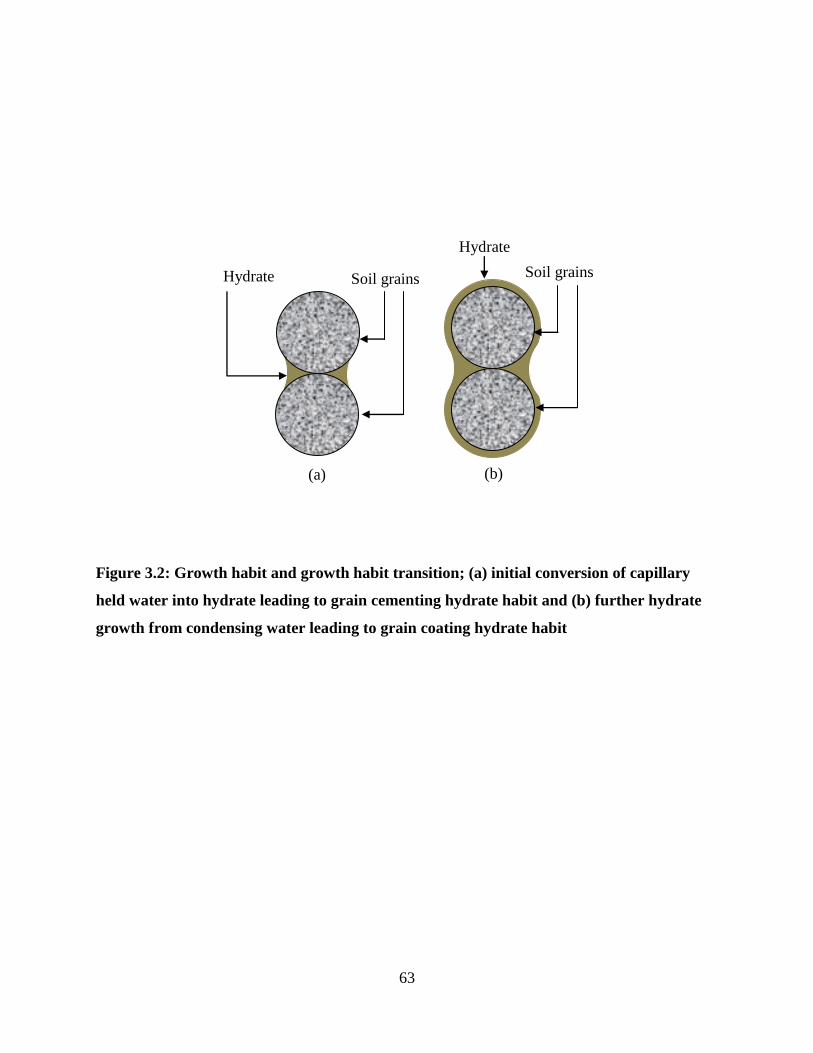
63
Figure 3.2: Growth habit and growth habit transition; (a) initial conversion of capillary
held water into hydrate leading to grain cementing hydrate habit and (b) further hydrate
growth from condensing water leading to grain coating hydrate habit
(a) (b)
Hydrate Soil grains
Hydrate
Soil grains
64
S12 Gas/Water Interface Cell
Gas supply
Temperature Control
System
Digital System
Controller
Axial Actuator
Triaxial Apparatus
Hydraulic
Pump
Pressure
Transducer
Pore fluid
pressure/volume and
confining fluid
pressure/volume
controller
Interface cell
pressure/volume control
65
Index
Pressure Gauge
Pressure Regulator
Three Way Connecter
Stop Valve
Two Way Valve
Temperature Sensor
Fluid Flow
Data Transfer
Control Signals
Personal Computer
Figure 3.3: Triaxial gas hydrate testing system

66
Figure 3.4: The PT Diagram for isobaric cooling of water rich gaseous methane (vapour)
into the hydrate stability zone
Methane hydrate +
Methane rich vapour
(H-V)
Temperature, T
Pressure, P
(3) (7)
Increasing
Increasing Aqueous liquid +
Methane rich
vapour (Lw-V)
Hydrate-Aqueous liquid-
Vapour three phase
equilibrium curve (H-Lw-V)
(1)
Condition at the interface
cell where methane and
water are allowed to reach
Lw-V equilibrium
End of hydrate formation
conditions within the
specimen under H-V
equilibrium
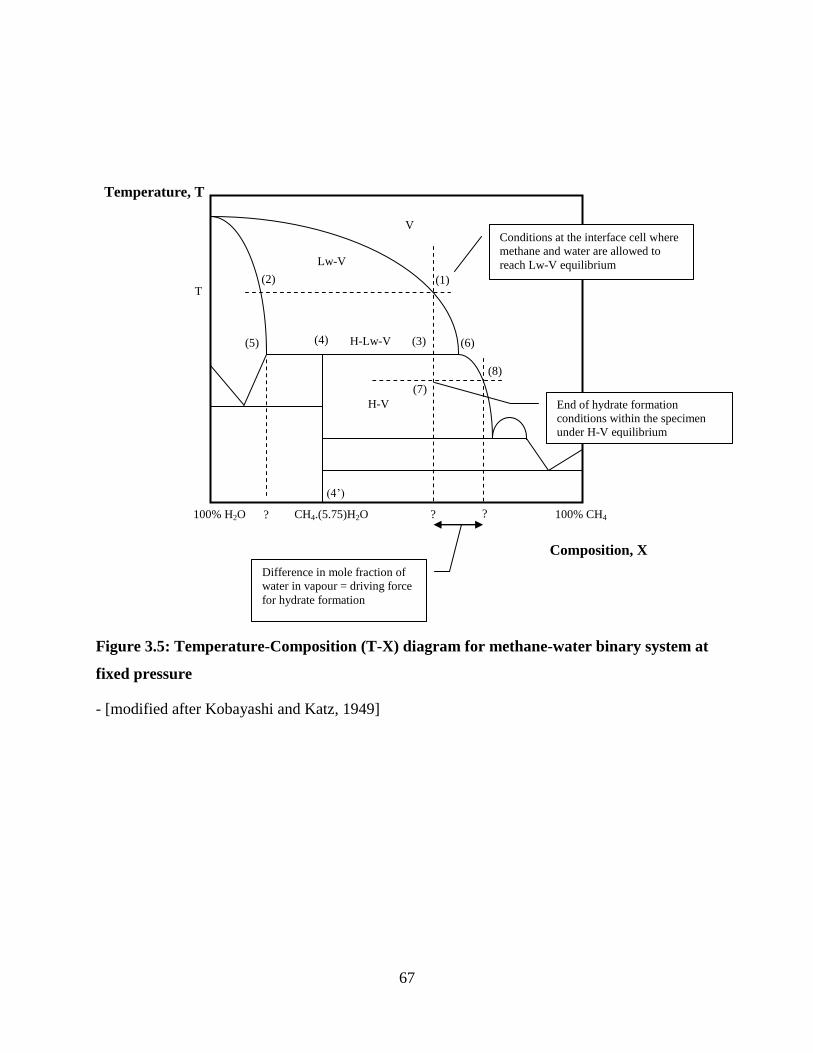
67
Figure 3.5: Temperature-Composition (T-X) diagram for methane-water binary system at
fixed pressure
- [modified after Kobayashi and Katz, 1949]
?
(8)
(4)
T
H-Lw-V
V
Lw-V
H-V
Difference in mole fraction of
water in vapour = driving force
for hydrate formation
Composition, X
? 100% H2O 100% CH4 CH4.(5.75)H2O
Temperature, T
?
(1) (2)
(3) (5) (6)
Figu
re 1:
Tem
perat
ure-
Com
positi
on
(T-
X)
diagr
am
for
meth
ane-
water
binar
y
syste
(7)
Conditions at the interface cell where
methane and water are allowed to
reach Lw-V equilibrium
End of hydrate formation
conditions within the specimen
under H-V equilibrium
(4’)

68
Figure 3.6: The reduction in the water content of gaseous methane associated with isobaric
cooling
- As the cooling takes place, moisture is removed from the vapour in the form of condensation in
order to maintain the equilibrium moisture content in vapour at a given temperature (solid line
(1)-(6)-(8))
(8)
Methane hydrate +
Methane rich vapour
(H-V)
Temperature, T
Mole fraction of water
in vapour, Y
(6)
Increasing
Increasing H2O
mole fraction
Aqueous liquid +
Methane rich
vapour (Lw-V) (1)
Condition at the interface
cell where methane and
water are allowed to reach
Lw-V equilibrium
End of hydrate formation
conditions within the
specimen under H-V
equilibrium
Hydrate-Aqueous liquid-Vapour
three phase equilibrium
(H-Lw-V)
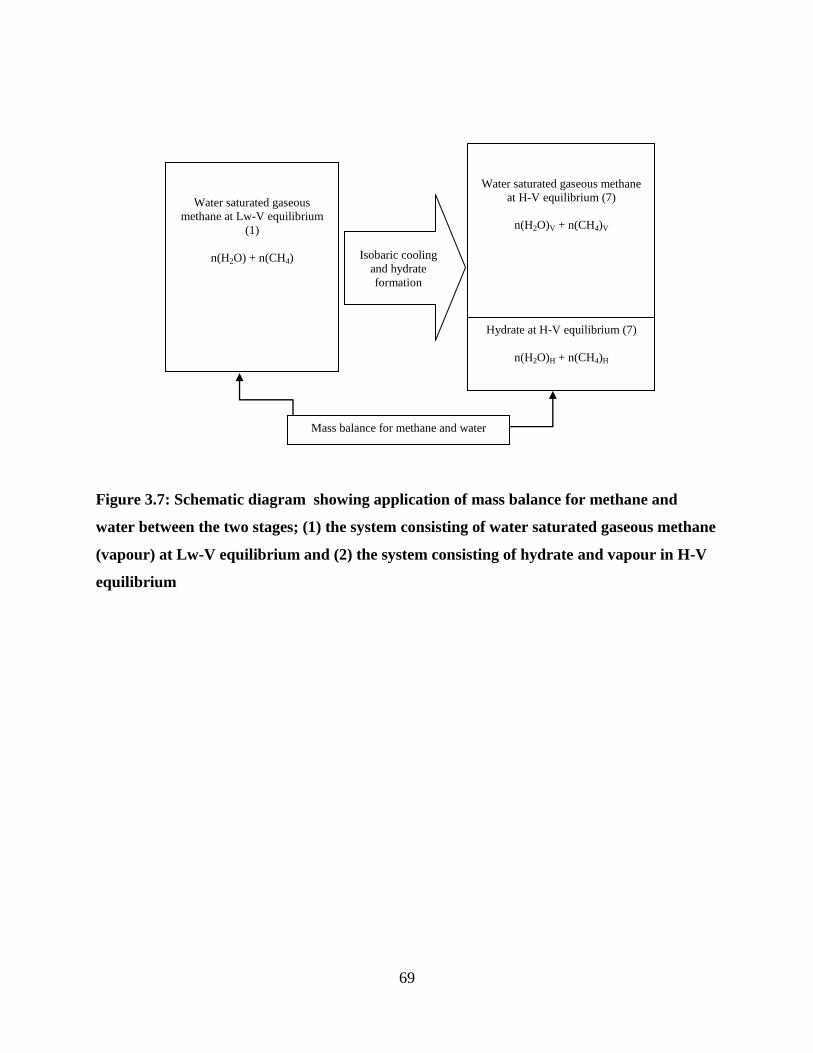
69
Figure 3.7: Schematic diagram showing application of mass balance for methane and
water between the two stages; (1) the system consisting of water saturated gaseous methane
(vapour) at Lw-V equilibrium and (2) the system consisting of hydrate and vapour in H-V
equilibrium
Water saturated gaseous
methane at Lw-V equilibrium
(1)
n(H2O) + n(CH4)
Water saturated gaseous methane
at H-V equilibrium (7)
n(H2O)V + n(CH4)V
Hydrate at H-V equilibrium (7)
n(H2O)H + n(CH4)H
Isobaric cooling
and hydrate
formation
Mass balance for methane and water
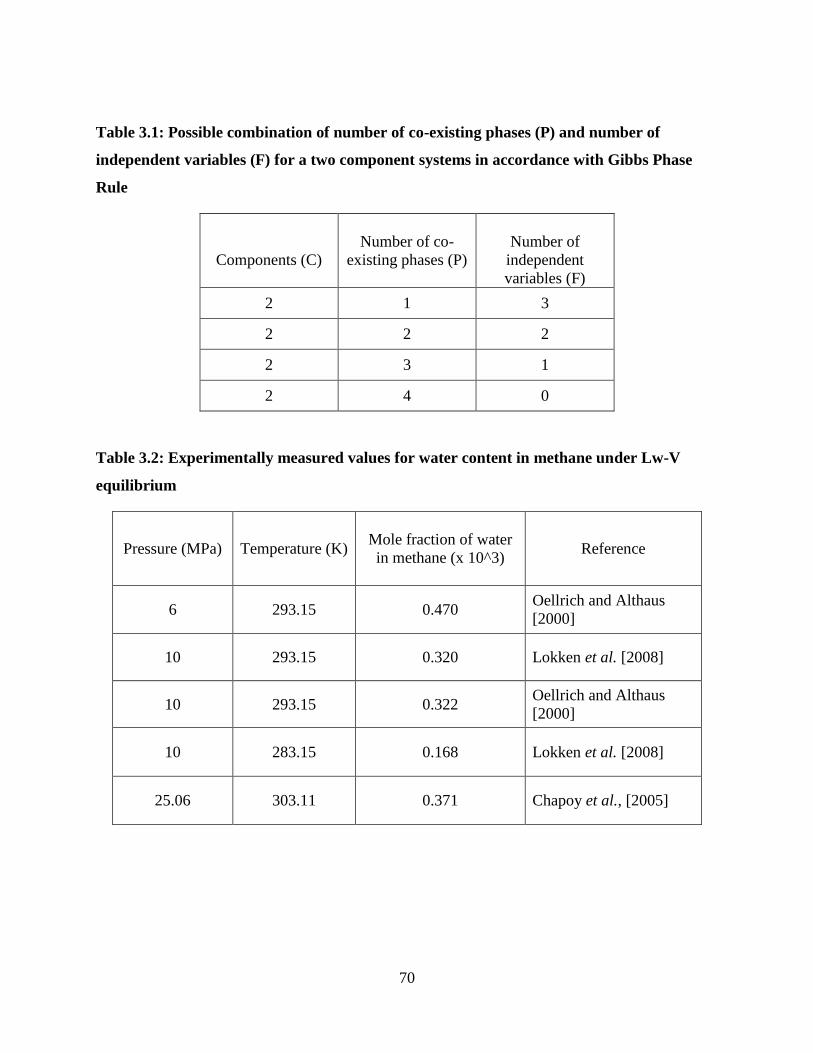
70
Table 3.1: Possible combination of number of co-existing phases (P) and number of
independent variables (F) for a two component systems in accordance with Gibbs Phase
Rule
Components (C)
Number of co-
existing phases (P)
Number of
independent
variables (F)
2 1 3
2 2 2
2 3 1
2 4 0
Table 3.2: Experimentally measured values for water content in methane under Lw-V
equilibrium
Pressure (MPa)
Temperature (K)
Mole fraction of water
in methane (x 10^3)
Reference
6 293.15 0.470 Oellrich and Althaus
[2000]
10 293.15 0.320 Lokken et al. [2008]
10 293.15 0.322 Oellrich and Althaus
[2000]
10 283.15 0.168 Lokken et al. [2008]
25.06 303.11 0.371 Chapoy et al., [2005]
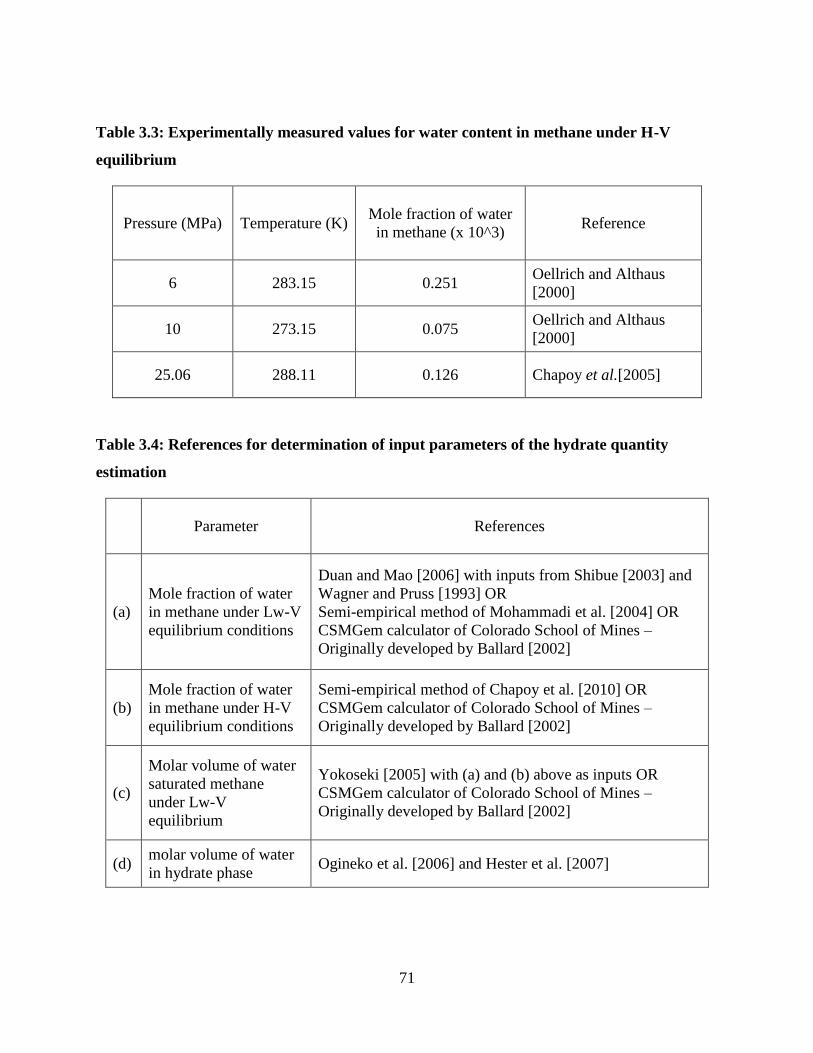
71
Table 3.3: Experimentally measured values for water content in methane under H-V
equilibrium
Pressure (MPa)
Temperature (K)
Mole fraction of water
in methane (x 10^3)
Reference
6 283.15 0.251 Oellrich and Althaus
[2000]
10 273.15 0.075 Oellrich and Althaus
[2000]
25.06 288.11 0.126 Chapoy et al.[2005]
Table 3.4: References for determination of input parameters of the hydrate quantity
estimation
Parameter
References
(a)
Mole fraction of water
in methane under Lw-V
equilibrium conditions
Duan and Mao [2006] with inputs from Shibue [2003] and
Wagner and Pruss [1993] OR
Semi-empirical method of Mohammadi et al. [2004] OR
CSMGem calculator of Colorado School of Mines –
Originally developed by Ballard [2002]
(b)
Mole fraction of water
in methane under H-V
equilibrium conditions
Semi-empirical method of Chapoy et al. [2010] OR
CSMGem calculator of Colorado School of Mines –
Originally developed by Ballard [2002]
(c)
Molar volume of water
saturated methane
under Lw-V
equilibrium
Yokoseki [2005] with (a) and (b) above as inputs OR
CSMGem calculator of Colorado School of Mines –
Originally developed by Ballard [2002]
(d) molar volume of water
in hydrate phase Ogineko et al. [2006] and Hester et al. [2007]

72
Table 3.5: Estimated hydrate quantity per known volume of water saturated methane
under L-V equilibrium
Equilibrium conditions (Lw-V) (H-V)
Temperature (K) 299.15 278.15
Pressure (kPa) 9101.325 9101.325
Volume of hydrate (cc) per 1000 cc of water saturated
methane under L-V equilibrium conditions 0.0375
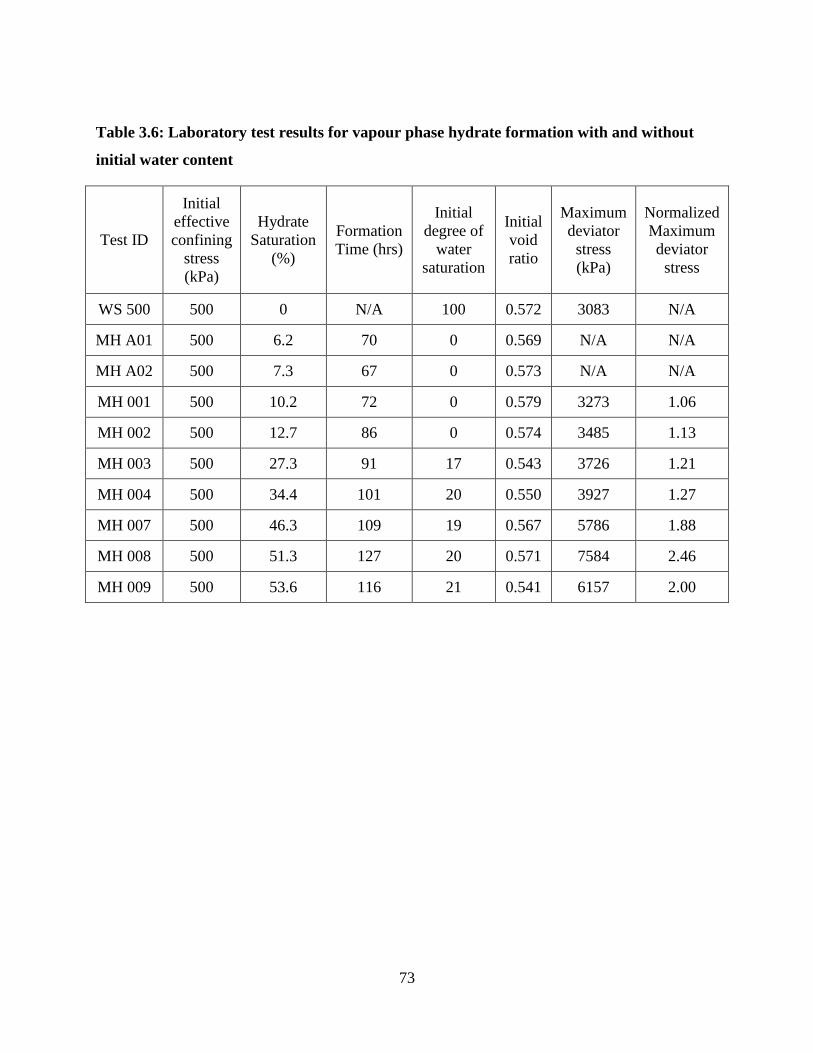
73
Table 3.6: Laboratory test results for vapour phase hydrate formation with and without
initial water content
Test ID
Initial
effective
confining
stress
(kPa)
Hydrate
Saturation
(%)
Formation
Time (hrs)
Initial
degree of
water
saturation
Initial
void
ratio
Maximum
deviator
stress
(kPa)
Normalized
Maximum
deviator
stress
WS 500 500 0 N/A 100 0.572 3083 N/A
MH A01 500 6.2 70 0 0.569 N/A N/A
MH A02 500 7.3 67 0 0.573 N/A N/A
MH 001 500 10.2 72 0 0.579 3273 1.06
MH 002 500 12.7 86 0 0.574 3485 1.13
MH 003 500 27.3 91 17 0.543 3726 1.21
MH 004 500 34.4 101 20 0.550 3927 1.27
MH 007 500 46.3 109 19 0.567 5786 1.88
MH 008 500 51.3 127 20 0.571 7584 2.46
MH 009 500 53.6 116 21 0.541 6157 2.00

74
Chapter Four: Estimating Pore Space Hydrate Saturation Using Dissociation Gas
Evolution Measurements (DGEM) 1
4.1 Introduction
Geomechanical, acoustic, thermal, and flow properties of gas hydrate-bearing soils are greatly
dependent upon the pore space saturation, growth habit, and distribution of hydrates. Therefore,
our attempts to correlate presence of hydrate phase with the physical characteristics of such
sediments are successful to the extent with which we can accurately determine the saturation,
habit, and the distribution of hydrates. Of interest to Chapter 4 is the pore space hydrate
saturation; the pore volume fraction of a given sediment occupied by hydrate and its accurate
quantification. The accuracy of most saturation estimation methods are affected by growth habit
and pore space distribution of hydrate. This chapter presents the details of several methods for
hydrate saturation estimation and highlights the usefulness of the dissociation gas evolution
measurements (DGEM) method as a reference laboratory method for calibrating and overcoming
the challenges associated with other methods. The hydrate saturations values generated by this
method depend only on: (1) choice of fundamental physical and chemical laws to accurately
represent the methane hydrate system and (2) the bulk hydrate filled pore volume fraction. The
calculations associated with the DGEM are based on the concept of mass balance and the volume
compatibility properties between two distinct sets of environmental conditions for a closed
system.
1The full citation of this published chapter is: Jayasinghe, A. G., and Grozic, J. L. H. (2013). Estimating Pore Space
Hydrate Saturation Using Dissociation Gas Evolution Measurements: In Relevance to Laboratory Testing of
Natural or Artificially Synthesised Hydrate-Bearing Soil Specimens, Journal of Geological Research, Vol. 2013,
Article ID 815841, doi:10.1155/2013/815841. The original article is accessible at:
http://www.hindawi.com/journals/jgr/2013/815841/. The article is reproduced under the Creative Commons
Attribution License , © 2013 A. G. Jayasinghe and J. L. H. Grozic.
75
The accuracy of the saturation estimations depends on (1) the precision with which the
laboratory measurements related to temperature, pressure, and volumetric properties of the
system are obtained, and (2) the ability of the physical and chemical laws (models) used in the
determination of various parameters to closely represent the true nature of the system. An
analysis was performed to evaluate the sensitivity of hydrate saturation to various laboratory
measurements associated with the DGEM method, with the intension of understanding the level
of accuracy required in the laboratory measurements. The compilation of the available
mathematical models used in representing system conditions, and thus generating the methane
concentration in different phases, serves as one of the major contributions of the work presented.
The evaluation of the sensitivity of hydrate saturation to those models provides insight into the
appropriateness of various assumptions associated with DGEM.
The chapter is organized to present the aforementioned in detail as follows. The role of hydrate
saturation in determining the host sediment behavior is explained followed by various techniques
for determination of hydrate saturation. The laboratory testing procedure is then summarized in
relation to application of the DGEM method (The complete experimental procedure is presented
in Chapter 2). Measurements of P/T parameters and estimates of volumetric parameters required
in the DGEM method of hydrate saturation calculation are then listed. The presentation then
proceeds to compile resources available in literature facilitating accurate determination of
methane density required in the determination of input parameters to the DGEM method. The
analysis performed to evaluate the sensitivity of hydrate saturation to various laboratory
measurements associated with the method and to the assumptions of equilibrium states of the
system precedes the concluding discussion.
76
4.2 Hydrate saturation dependency of physical properties
The presence (or more specifically the saturation) of hydrate within the pore space is known to
alter the physical properties of host sediment by a great extent. The control of geomechanical
(meaning; strength, deformation, and flow) properties of host sediments by hydrates has been a
global research focus over the recent past and certainly is gaining more and more interest. The
following presents a few experimental investigations of pore space hydrate to illustrate the
important effects of hydrate saturation on the physical properties. Understanding of the effects
of hydrate saturation highlights the importance of its accurate quantification.
When geomechanical properties of hydrate-bearing sediment are concerned, Ebinuma et al.
[2005], Hyodo et al. [2007, 2009, 2011], Kuniyuki et al. [2010], Masui et al. [2005a, 2008a,
2008b] and Miyazaki et al. [2008, 2010, 2011] display hydrate saturation dependency of stress-
strain behavior including strength properties such as maximum deviator stress (or peak strength),
Young’s modulus at 50% of the stress at failure, cohesion, and dilation angle in drained triaxial
compression tests. Ghiassian and Grozic [2011] and Winters et al. [2002, 2007] illustrate the
hydrate saturation dependency of stress-strain behavior and the excess pore pressure
development compared to hydrate free soil under undrained triaxial compression conditions. Yun
et al. [2007] illustrates the hydrate saturation dependency of stiffness and strength for
Tetrahydrofuran (THF) hydrate under undrained conditions. Strain rate dependency of stress
(under uniaxial compression) and creep behavior of hydrate-bearing sediments are investigated
by Parameswaran et al. [1989] for frozen specimens of THF hydrate. Cameron and Handa [1990]
further the study of Parameswaran et al. [1989] by including the temperature effects on the short
and long term strength and deformation behavior. The exact effect of hydrate saturation on the

77
strength and deformation behavior is detailed by Waite et al. [2009]. The current communication
does not wish to duplicate Waite et al. [2009] discussion, but wish to highlight the impact of
hydrate saturation on the soil properties to shed light on the importance of its accurate
estimation.
Not only strength and deformation properties but also the flow properties of host sediments are
altered by the presence of hydrate. According to Kneafsey et al. [2011], Minagawa et al. [2009],
and Waite et al. [2009] permeability of hydrated sediments is altered by both the degree of
hydrate saturation and the pore scale hydrate distribution. Kumar et al. [2010], and Liang et al.
[2011], and Ordonez et al. [2009] are also among the researchers who relate hydrate saturation to
host sediment flow properties.
In fact, most physical properties of hydrate sediments, not just geomechanical properties, are
affected by the degree of hydrate saturation. These properties include acoustic wave speeds
[Chand et al., 2006; Howard et al., 2011; Kleinburg et al., 2003; Priest et al., 2005, 2009; Waite
et al., 2008b, 2009; Winters et al., 2004], electrical properties (such as resistivity and dielectric
constant) [Kilner and Grozic, 2006; Spangenberg and Kulenkamff, 2006], and thermal properties
(such as thermal conductivity) [Waite et al., 2002, 2007, 2009]. Hydrate saturation dependency
of some of these properties have lead us to the development of several field and laboratory
hydrate detection and quantification techniques. The effectiveness of these techniques greatly
depends on pore scale hydrate growth habit and effective medium models of such growth habit
used in the interpretation of field or laboratory measurements. Those techniques based on
acoustic and electrical properties and other methods of hydrate saturation estimation will later be

78
discussed in Section 4.3 for effectiveness in comparison to the DGEM method, which is the
central of focus for this chapter.
4.2.1 Effective medium models of pore scale hydrate growth habit
As previously described in Chapter 2, a number of different effective medium models for pore
scale hydrate growth habits in unconsolidated packing of mineral grains are agreed upon. The
Helgerud [2001] classification includes (a) hydrate formation without significant interaction with
the frame as a pore filling substance, (b) hydrate formation in the interior of the pores as a part of
the load bearing frame, (c) hydrate formation occurring preferentially at grain contacts, acting as
cement between particles, and (d) hydrate coating grains more or less uniformly, progressively
cementing them as the hydrate volume increases. The hydrate habit models of Winters et al.
[2004] treat the hydrate formation at grain contacts or coating the grains within single
cementation model.
The choice of effective medium models of hydrate growth habit in the quantification of hydrate
saturation is an important decision with regard to certain hydrate saturation quantification
methods. Hydrate saturations predicted by both Helgerud [2001] and Winters et al. [2004] are
characteristic of speculated hydrate habit model. More recently, Chand et al. [2006] developed a
procedure to allow a portion of hydrate saturation to be present as load-bearing cement while the
remaining is treated as pore filling inclusions. The predicted hydrate saturations of this approach
depend upon the accuracy with which the fraction of cementing hydrate is determined.

79
4.3 Techniques for determination of the hydrate saturation
The use of acoustic wave speed characteristics, electrical properties including resistivity and
dielectric constant, chloride anomalies and associated pore fluid conductivity, imaging methods,
pre-formation pore water saturation with the mere assumption of full conversion of water into
hydrate, and dissociation gas evolution measurements (DGEM) are among the techniques for
quantification of hydrate saturation. However, none of these techniques are without limitations, it
is only that some are relatively more effective than the others.
The studies of Priest et al. [2005] and Waite et al. [2008b] and are among the ample evidence
found in literature for hydrate saturation dependency of acoustic wave speeds. The acoustic
properties, therefore, are used both in the field and laboratory estimation of pore scale hydrate
saturation. However, acoustic properties of hydrate-affected sediments are, in fact, largely
affected by the pore scale growth habit of hydrate [Howard et al., 2011; Kleinberg et al., 2003;
Priest et al., 2009; Waite et al., 2009] as the shear stiffness of the medium is affected by the
hydrate growth habit to a varying degree [Waite et al., 2009]. Winters et al. [2004] and Chand et
al. [2006] use these phenomena in further analysis of determining growth habit based hydrate
saturation (forward model) or hydrate saturation based growth habit (inverse model). Winters et
al. [2004] uses P wave measurements to investigate the hydrate growth habit of natural and
laboratory synthesized hydrate-bearing specimen at varying hydrate saturations estimated with
the use of collection and measurement of dissociation products. The results reflects upon the
growth habit dependency of P wave measurements and the need for accurate independent
estimate of hydrate saturation in correlating the acoustic wave speeds with hydrate growth habit.
On the contrary, Chand et al. [2006] develops an effective medium inversion algorithm for
80
quantification of hydrate saturation which uses both P and S wave measurements. The degree of
grain cementation (which is most certainly governed by many controlling factors including the
pre-formation water saturation as discussed previously) is an input parameter to the algorithm.
Neither studies provide evidence for capability of acoustic wave speed measurements as a stand-
alone technology for hydrate saturation estimation; rather, it requires supporting technology to
assess grain scale characteristics. Kleinberg et al. [2003] also agrees that “acoustic properties of
hydrate-affected sediments are very sensitive to the growth habit of hydrate”. Howard et al.
[2011] also provide evidence for not only hydrate saturation but growth habit dependency of
acoustic wave speeds. According to Howard et al. [2011] the pre-formation water saturation
determines the growth habit and the low initial water saturations result in acoustic wave
velocities attributable to grain coating hydrate habit while, the high initial water saturations
generate velocities attributable to hydrates acting as a part of the frame in a load-bearing model.
Priest and Best [2005] highlight the need for validating current seismic models against
experimental data obtained from laboratory synthesized hydrate-bearing sediment as the early
attempts on such validations fail due to several reasons including the incapability of performing
proper hydrate saturation quantifications. However, the limitations are not completely derived
from growth habit related uncertainties. In fact, for an identified growth form the effective use of
acoustics in the hydrate saturation estimation relies on our understanding of the correlation
between various sediment properties and stress state with wave speeds (i.e., compression wave
velocity pv and shear wave velocity sv ). “For naturally occurring hydrate-bearing sediments,
where the hydrate formation is similar to the excess water method, the sp vv / ratio will be
dependent on porosity, confining pressure and hydrate saturation and therefore quantification of

81
hydrate pore saturation from either sv , pv , or sp vv / ratio would be difficult without a detailed
knowledge of sediment properties and stress state” [Priest et al., 2009].
Electrical properties can also be correlated to hydrate saturation and are therefore, used in field
and laboratory investigations. The study of Spangenberg and Kulenkampff [2006]
experimentally investigates methane hydrate saturation dependency of electrical properties of a
glass bead sediment and comments on the difficulties associated with the applicability of the
laboratory results in the field hydrate saturation predictions as the accuracy of such predictions
depend on a combination of several factors including the cementing or non-cementing grain
scale habit of hydrate, grain size distribution, and grain shape distribution. Therefore, it is
“advisable to use hydrate content estimations from electrical field measurements with caution as
long as the used interpretation methods are not calibrated in the laboratory and verified for their
applicability in a natural hydrate-bearing system” (Spangenberg and Kulenkampff, 2006).
Further discussion on the limitations of the methods based on electrical resistivity is provided in
Waite et al. [2009].
Kilner and Grozic [2006] employ the theory of dielectrics using the time domain reflectometry
(TDR) technique and generate a clear correlation between dielectric constant and pore space
hydrate saturation. They identify the need to isolate “the effects of individual variables such as:
temperature, pressure, salinity, pH, soil type (sands versus clays), grain size, density (porosity
and permeability), etc.” in generalizing such correlation for dielectrics and hydrate saturation. No
evidence can be found in literature for the use of TDR in field measurements; however, field
82
application of the method is possible provided that the effect of aforementioned variables on the
hydrate saturation measurement is known.
Chloride anomalies seem to generate accurate predictions of hydrate saturation for saline systems
when employed in the laboratory under controlled conditions. The inapplicability of this method
for systems without access to pore water during formation and for systems with zero salinity
remains the disadvantage. Spangenberg et al. [2005] estimates the hydrate saturation with the use
of fluid resistivity measurements (or inferred fluid conductivity) combined with fluid
conductivity-salt concentration relations to estimate water conversion into hydrate during
formation. Other input parameters include hydrate cage occupancy, hydrate density, and
specimen pore volume. X-ray diffraction analysis of a portion of the specimen provides an
independent estimate of hydrate saturation which is in good agreement with the former estimate.
Modern imaging technology such as x-ray computed tomography (CT) appears to be promising
either as stand-alone technology for hydrate saturation estimation at the laboratory or as
supporting technology to validate other methods such as those that specifically depend on the
pore scale characteristics. Seol et al. [2011] uses x-ray computed tomography observations of
hydrated specimens to estimate hydrate saturation and other properties but, with several
assumptions. The assumptions are made in relation to hydrate cage occupancy, density of
hydrate and gas phases, the host soil skeleton and the degree of relative movement between the
particles of the matrix in addition to the assumptions correlating X-ray attenuation and material
mass. Density Magnetic Resonance (DMR) measurements are another approach to imaging
hydrated sediments. Murray et al. [2006] use DMR measurements for hydrate saturation

83
estimation in marine sediments and state that accurate estimations are generated conditioned by
the use of modern wireline tools of certain specifications to acquire magnetic resonance data.
The DGEM method of hydrate saturation calculation is based on the principle of mass balance
and the concept of volume compatibility between two distinct states of a closed system. The
method is applicable in the laboratory for determination of hydrate saturation of natural or
artificial hydrate-bearing specimens. The method involves obtaining pressure, volume, and
temperature (PVT) data for a hydrate-bearing soil specimen within hydrate stability zone, then
forcing the specimen to reach elevated temperatures and/or low pressures outsize hydrate
stability zone resulting in hydrate dissociation, and then repeating PVT measurements allowing
determination of phase composition of the system. The accuracy of the predictions relies on the
precision with which the PVT data are obtained and the phase composition of system is
determined under given state variables.
Despite the modern day technology the use of “a variety of independent estimates of hydrate
concentrations, such as resistivity logs, chloride anomalies, and gas evolution measurements
(during hydrate dissociation)” combined “with acoustic data” results in “contradictory
conclusions regarding the interaction between hydrate and the sediment” [Priest et al., 2005] and
is an indication of poorly undertaken hydrate saturation estimates. The discrepancies between
hydrate saturations estimated using various techniques are seemingly explained by the
uncertainties in the estimated porosities and inaccurate parameter estimates used in
corresponding analyses for at least electrical resistivity and P and S wave velocities [Lee and
Collett, 2009]. Most methods for hydrate saturation estimation are affected by:

84
(1) host sediment characteristics such as porosity, porosity distribution, geological features
such as fractures and fracture orientation, intact properties of the soil grains, and stress
state;
(2) pore space consistency (such as existence of free gas) and pore fluid characteristics (such
as salinity and presence of other solutes); and
(3) hydrate growth habit and distribution.
The correlation between the aforementioned and the measured parameter(s) in the hydrate
saturation estimation is not clear to the scientific community to the date and/or the determination
of the correlation requires employment of secondary measurements/supporting technology.
The challenges may be overcome by employing DGEM in the laboratory as a method of
generating reference hydrate saturations in the process of validating saturations generated by
other methods it is associated with the following advantages:
(1) DGEM is based on fundamental physics and chemistry; and
(2) the estimation depends only on the bulk hydrate filled pore volume fraction.
4.4 Laboratory testing of artificial hydrate-bearing specimens and application of DGEM
method for hydrate saturation estimation
The following explains the summery experimental procedure employed at the Geotechnical Gas
Hydrate Research Laboratory (GGHRL) at the University of Calgary for synthesis of hydrate-
bearing soil specimens and the application of DGEM method for hydrate saturation estimation.
85
The procedure is also illustrated in Figure 4.1 for hydrate formation in gas rich environment. The
complete experimental procedure is presented in Chapter 3.
Step (1)
For laboratory synthesis of artificial methane hydrate-bearing specimens this stage involves
preparation of a soil specimen within which hydrates are to be artificially synthesized, assembly
of the soil specimen within the testing apparatus, application of P/T conditions under which the
hydrates are to be synthesized, and consolidation of the soil specimen.
During this stage measurements are performed to obtain initial specimen dimensions (height and
diameter). For the case of laboratory synthesized hydrate specimens, the mass of dry soil
occupying the specimen is also obtained. These measurements facilitate the estimation of the
volume of void space, VoV of the specimen. Any volume change of the specimen during
consolidation is recorded and VoV is corrected accordingly.
Step (2)
For laboratory synthesis of artificial methane hydrate-bearing specimens the second step
involves hydrate formation within the soil specimen. Formation in water rich environment
generally involves continuous feed of methane dissolved water into the specimen. Formation in
gas-rich environment generally involves continuous feed of methane-the hydrate former into the
partially water saturated specimen. It should be noted that there are other methods of hydrate
synthesis at the laboratory which are associated with slightly different procedures. However, the
86
completion of hydrate formation, if attempted in a water rich environment, will result in two
distinct phases; hydrate and gas dissolved water (equation (4.1)). As opposed to aforementioned,
hydrate formation, if attempted in a gas rich environment, upon completion will result in two
distinct phases; hydrate and vapour (equation (4.2)). In either case, incomplete formation will
result in all three phases; hydrate, gas dissolved water, and vapour (equation (4.3), Figure 4.2) to
be present in the system while the system is assumed to be at a given temperature and pressure
within the hydrate stability zone where the actual temperature at a minute locality within the
hydrate forming media can be approximated to the enforced temperature without significant loss
of accuracy. The P/T conditions of the system at the end of hydrate formation stage are herein
after referred to as pre-dissociation temperature and pre-dissociation pressure. The equation
(4.1) assumes that the soil specimen is at hydrate-aqueous liquid (H-Lw) two phase equilibrium
while the equation (4.2) assumes that the soil specimen is at hydrate-vapour (H-V) two phase
equilibrium. The measured values of pre-dissociation temperature and pressure are used to
determine the methane concentration of different phases (i.e., HM , WoM , and GoM ) as detailed in
Section 4.4.3. The series of tests for which the results are presented in this thesis involved
hydrate formation in gas-rich environment arriving at H-V two phase equilibrium under the pre-
dissociation conditions.
Step (3)
During this stage the hydrated soil specimen was subjected to triaxial compression test at
constant mass. Other destructive tests and/or non-destructive tests (e.g., acoustic, thermal, or
flow property measurements, computer tomography or electron scanning to generate hydrate

87
distribution profiles) may also be performed. During such a testing procedure the soil specimen
may or may not be allowed to undergo deformation and/or volume change.
Step (4)
At the end of testing mentioned in Step (3), hydrates are allowed to dissociate, and the
dissociation products are collected at a separate gas/water collector cell. The dissociation may
have been induced either by increasing the system temperature or by depressurization or by a
combination of both. Dissociation of hydrates will result in two distinct phases to be present
within the system; gas dissolved water, and vapour (Figure 4.2). Complete collection of any gas
trapped within the host sediment at the gas/water collector is ensured by flooding the soils
specimen with water. The system including the host soil specimen, gas/water collector, and the
connection tubing in-between are all then allowed to reach aqueous liquid-hydrate (Lw-H) two
phase equilibrium under P/T conditions outside hydrate stability zone. These P/T conditions of
the system are referred to as post-dissociation conditions hereinafter and are usually represented
by the ambient room temperature and moderate to low pressures. The measured values of post-
dissociation temperature and pressure are used to determine the methane concentration of
different phases (i.e., WfM and GfM ) as detailed in Section 4.4.3. Other laboratory
measurements associated with this stage are used to determine the volumetric parameters
including )(GWCGfV , extV , WTotV , and )(GWCGiV and the details are presented in Section 4.4.2.
The principle of mass balance when applied between the pre and post-dissociation conditions of
the system appear in following forms for (1) complete formation in water rich environment, (2)

88
complete formation in gas rich environment, and (3) incomplete formation in either water or gas
rich environments.
GfGfWfWfWoWoHH VMVMVMVM (4.1)
GfGfWfWfGoGoHH VMVMVMVM (4.2)
GfGfWfWfGoGoWoWoHH VMVMVMVMVM (4.3)
The mass balance equations, when coupled with volume compatibility equations derived from
the Figure 4.1 results in the following relationships for the hydrate saturation respectively.
WoH
WfWfWoVoGfGfH
MM
MVMVMVV
(4.4)
GoH
WfWfGoVoGfGf
HMM
MVMVMVV
(4.5)
)()(
)(
GoWoe
lGoH
GoWoWTotWfWfGoVoGfGf
H
MMV
VMM
MMVMVMVMVV
(4.6)
The following sub-sections discuss measurements and estimates that are required to be
performed in the hydrate saturation estimation in order to obtain the volume and concentration
(or density) components that appear in equations (4.4)-(4.6). It should be noted that methane-
water binary system has been considered hereinafter for the presentation of DGEM for hydrate
saturation estimation. The intension is to provide the reader with an understanding of the system
at pre and post-dissociation conditions, and with a guide to sources of information available in

89
literature allowing proper calculations of the properties of each phase of the system. The
challenges associated with each measurement or parameter estimation are also discussed.
4.4.1 Measured parameters
The measured parameters include the direct measurements of P/T state variables for system at
pre and post dissociation conditions and are used in conjunction with estimates of methane
density in the hydrate saturation calculation. These parameters include the following:
(1) Pre-dissociation temperature
(2) Pre-dissociation pressure (gauge)
(3) Post-dissociation temperature: if the system is allowed to reach thermodynamic
equilibrium with the room conditions the post-dissociation temperature is the same as
ambient room temperature. However, ensuring the system reaches thermodynamic
equilibrium with the environment or within the two-phase aqueous liquid-vapour (Lw-V)
system itself is a matter of extreme practical difficulty. This issue is later discussed in
more detail with relevance to estimation of total aqueous phase volume of the system WfV
at post dissociation conditions.
(4) Post-dissociation pressure (gauge)
(5) Ambient room temperature
(6) Ambient pressure: The ambient pressure is used coupled with gauge pressure
measurements in arriving at system state variables under pre and post dissociation
conditions and can be obtained using an absolute pressure transducer. Alternatively, local
weather reports may be used to obtain this parameter. Ambient pressure is mentioned as

90
one of the top two contributors to error in hydrate saturation calculation by Lee and
Collett [2009] with respect to their gas evolution measurements of pressure cores.
4.4.2 Estimates of volumetric parameters
The volumetric parameters are derived from multiple laboratory measurements performed during
a typical test and are used as inputs with equations (4.4), (4.5), and (4.6) in the hydrate saturation
estimation. These parameters include the following:
(1) Volume of voids VoV within the hydrated host sediment under pre-dissociation conditions
immediately prior to testing such as those mentioned in Step (3) of Section 4.4: This is
usually estimated with specimen dimensions (height and diameter), grain density of soil,
and mass of dry soil occupying the specimen. The VoV for a laboratory synthesized
hydrate specimen is corrected for any specimen volume changes occurring due to
consolidation etc. between the time of measurement of specimen dimensions and
reaching the pre-test conditions within the hydrate stability zone.
(2) Total gas phase volume )(GWCGfV of the system at completion of the collection of
gas/water products from hydrate dissociation: This is usually estimated with height and
diameter of a gas column of a gas/water collection assembly.
(3) Total volume of hydrate forming gas filled elements external to the immediate boundaries
of the specimen extV for which the material mass present within is forced into the
91
gas/water collector during collection of dissociation products: The method of estimating
such volume component needs to be given proper attention during planning of
experimental procedure. For the tests carried out at the GGHRL at University of Calgary
the gas volume associated with material external to the specimen boundaries arise only
from the quantity of gas present within the specimen end caps and connection tubing
between the specimen top cap and the gas/water collector. This quantity is carefully
determined from mass of water occupying the corresponding volume at full water
saturation, density of water, ambient temperature, and pressure.
(4) Total aqueous phase volume WfV of the system under post-dissociation conditions (which
includes the soil specimen, gas/water collector, and the connection tubing in between) at
completion of collection of gas/water products from hydrate dissociation: Theoretically,
WfV is the initial volume of water present within the system corrected for P/T differences
between the initial and post-dissociation conditions plus the total inflow minus the total
outflow. The above quantity is given by the net summation of the following components:
(1) the volume of water available at pre-dissociation conditions immediately prior to
testing corrected for P/T differences between the pre and post-dissociation conditions (2)
volume of water generated from hydrate dissociation calculated at post-dissociation P/T
conditions (3) volume inflow in to the specimen (if any) during the collection of
dissociation products at the gas/water collector (4) volume of water initially present
within connection tubing (if any) between the specimen and the gas/water collector
corrected for P/T differences between initial and post-dissociation conditions (5) volume

92
of water initially present within the gas/water collector corrected for P/T differences
between initial and post-dissociation conditions (6) volume of water displaced from
gas/water collector (if any) during collection of dissociation products. The component (6)
is valid only in the case of a water displacement column type collector with the
assumption that displaced water would not carry away significant quantity of hydrate
forming gas (methane) in dissolved form. The fact that methane dissolves in water at very
slow rates at neat ambient conditions especially when no significant agitation of the
aqueous liquid body is present may even lead to difficulties in justifying the efforts
needed to estimate WfV under practical circumstances. Further, such a system cannot be
expected to reach thermodynamic Lw-V equilibrium within a reasonable time span for
any efforts of quantification to be justifiable. Therefore, WfV may be abandoned from the
hydrate saturation calculation.
(5) Initial volume of water WTotV available for hydrate formation: This quantity is
ideologically estimated at pre-dissociation or hydrate forming P/T conditions before
substantial or preferably any mixing of water and hydrate forming gas takes place. For
laboratory synthesized hydrate this quantity can be estimated from initial soil moisture
content or from water saturated specimen pore volume minus displaced pore water
volume associated with gas introduction (corrected for P/T differences between initial
and pre-dissociation conditions). Estimation of this quantity is needed only when the
complete formation of hydrate cannot be guaranteed under pre-dissociation conditions
immediately prior to testing. Determining this quantity for natural hydrate-bearing

93
specimens of core samples could be extremely challenging, instead, it would be more
practical to determine the specimen consistency at pre-dissociation conditions
immediately prior to testing. Lee and Collett [2009] address the issues with determining
the specimen consistency. Seemingly, Lee and Collett [2009] assume that the specimen
pore space is completely occupied by hydrate and free water neglecting the possible
presence of free gas within the specimen.
(6) Initial gas phase volume )(GWCGiV at the gas/water collector: Absence or presence of such
volume component depends on the design of the gas/water collector: (1) if the gas/water
collector is designed in the form of a water displacement column with no initial air/gas
within, no such volume component exists; (2) if the gas/water collector is designed in the
form of a pressure vessel with no flow out during collection of dissociation products, an
initial gas volume of )(GWCGiV may present within the collector. In the latter case the initial
gas volume component may be determined with the use of height and diameter of the gas
column. The hydrate saturation calculation presented herein considers no existence of
initial gas volume within the collector.
4.4.3 Estimates of methane density and volume of hydrate bond water
Estimates of methane density and volume of hydrate bond water are required as inputs with the
use of equations (4.4), (4.5), or (4.6) in the hydrate saturation estimation. The following outlines
the methods for estimating five different methane density values at various P/T conditions in and
out the hydrate stability zone of methane-water binary system. Various thermodynamic and
empirical models are assumed for the methane-water binary system in the estimation of these

94
parameters. In addition to the density parameters, the molar volumes of water in the aqueous
liquid ( lV ) and hydrate ( eV ) phases are estimated. The range of applicability and limitations of
the models used in the calculation process are presented in Table 4.3. The recommended options
for methane density calculations are provided. The choices made as to the use of these different
models in the estimation of hydrate saturation for the tests conducted at GGHRL of University of
Calgary and presented in this thesis are also denoted.
(1) The molar volume of water lV is determined either at post-dissociation T and P or at pre-
dissociation T and P with the use of water density obtained from Lide [2007] and molar mass of
water. This quantity is used in the hydrate saturation calculation to estimate the volume of water
generated as a dissociation product or consumed during hydrate formation WHV which is
estimated with the following relationship.
e
HlWH
V
VVV (4.7)
If the volume of hydrate bond water WHV is used in the hydrate saturation calculation with
relevance to the system consistency at post-dissociation conditions, the post-dissociation T and P
are applicable to lV . Otherwise, pre-dissociation T and P should be used.
(2) Molar volume of water in the hydrate lattice eV
The molar volume of water in the hydrate phase is used as a secondary input in the estimation of
methane density in the hydrate phase. The volume of hydrate lattice per mole of water at pre-
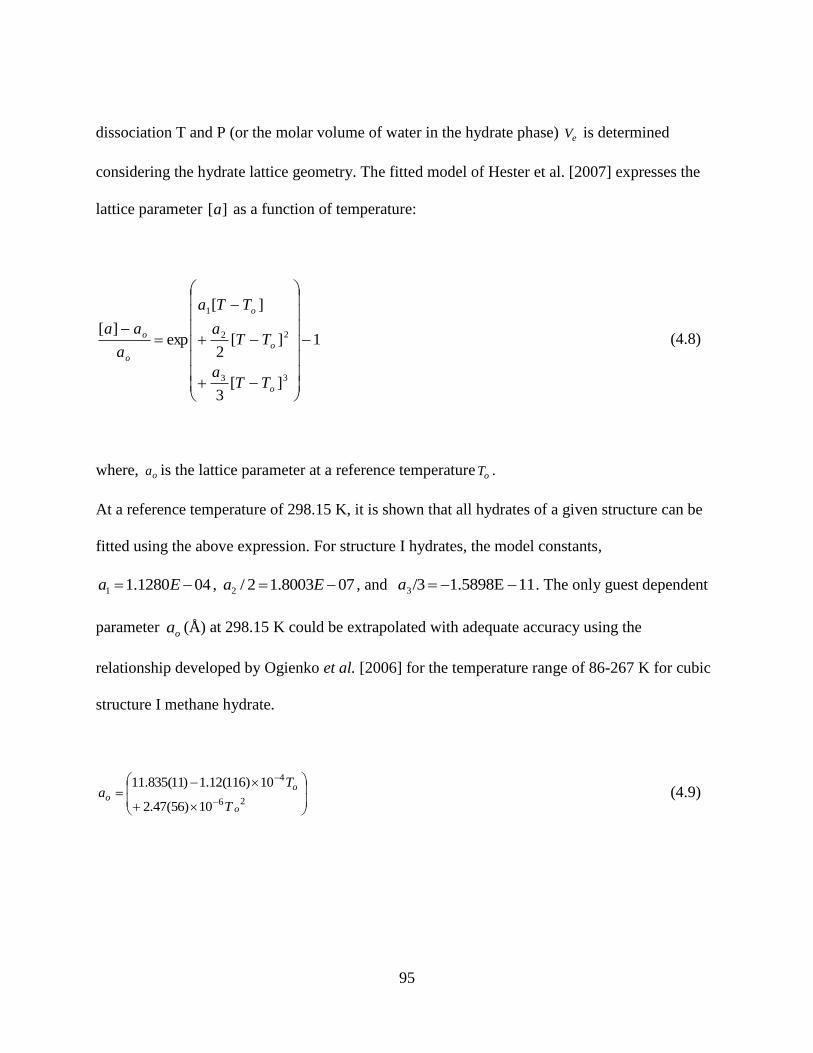
95
dissociation T and P (or the molar volume of water in the hydrate phase) eV is determined
considering the hydrate lattice geometry. The fitted model of Hester et al. [2007] expresses the
lattice parameter ][a as a function of temperature:
1
][3
][2
][
exp][
33
22
1
o
o
o
o
o
TTa
TTa
TTa
a
aa (4.8)
where, oa is the lattice parameter at a reference temperature oT .
At a reference temperature of 298.15 K, it is shown that all hydrates of a given structure can be
fitted using the above expression. For structure I hydrates, the model constants,
041280.11 Ea , 078003.12/2 Ea , and 111.5898E/33 a . The only guest dependent
parameter oa (Å) at 298.15 K could be extrapolated with adequate accuracy using the
relationship developed by Ogienko et al. [2006] for the temperature range of 86-267 K for cubic
structure I methane hydrate.
26
4
10)56(47.2
10)116(12.1)11(835.11
o
oo
T
Ta (4.9)
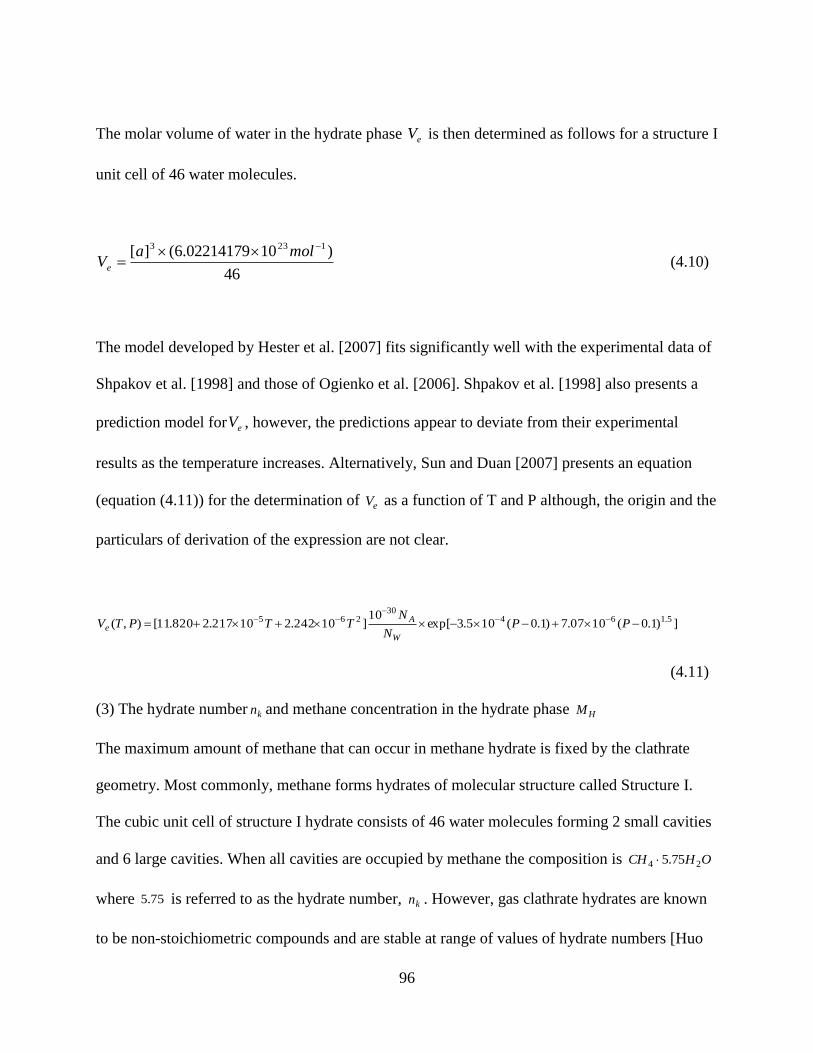
96
The molar volume of water in the hydrate phase eV is then determined as follows for a structure I
unit cell of 46 water molecules.
46
)1002214179.6(][ 1233
molaVe (4.10)
The model developed by Hester et al. [2007] fits significantly well with the experimental data of
Shpakov et al. [1998] and those of Ogienko et al. [2006]. Shpakov et al. [1998] also presents a
prediction model for eV , however, the predictions appear to deviate from their experimental
results as the temperature increases. Alternatively, Sun and Duan [2007] presents an equation
(equation (4.11)) for the determination of eV as a function of T and P although, the origin and the
particulars of derivation of the expression are not clear.
])1.0(1007.7)1.0(105.3exp[10
]10242.210217.2820.11[),( 5.16430
265
PPN
NTTPTV
W
Ae
(4.11)
(3) The hydrate number kn and methane concentration in the hydrate phase HM
The maximum amount of methane that can occur in methane hydrate is fixed by the clathrate
geometry. Most commonly, methane forms hydrates of molecular structure called Structure I.
The cubic unit cell of structure I hydrate consists of 46 water molecules forming 2 small cavities
and 6 large cavities. When all cavities are occupied by methane the composition is OHCH 24 75.5
where 75.5 is referred to as the hydrate number, kn . However, gas clathrate hydrates are known
to be non-stoichiometric compounds and are stable at range of values of hydrate numbers [Huo
97
et al., 2003]. In fact different cage occupancies are obtained at different formation temperatures
and pressures [Jager, 2001; Sloan, 1998; Sum et al., [1997]; Sun and Duan, 2007] and at
different overall methane compositions [Huo et al., 2003; Sloan, 2003a]. According to the
predictions of Sun and Duan [2007], “the occupancy fraction of methane both in small cage and
large cage increases with increasing temperature and pressure” at H-Lw equilibrium. Table 4.1
summarises hydrate numbers generated by a number of independent experimental studies by
Galloway et al. [1970], Handa [1986], Handa and Stupin [1992], Sum et al. [1997], Uchida et al.
[1999], Seo et al., [2002], and Circone et al. [2005]. Fair amount of variability can be identified
as associated with the experimentally derived values of kn and correlating hydrate number with
formation conditions does not appear to be possible with the limited experimental data.
Alternatively, the model of Sun and Duan [2007] allows computing the hydrate cage occupancy
at given P/T conditions over the H-Lw region. The CSMGem calculator of Colorado School of
Mines [originally developed by Ballard, 2002] also proves to be a useful tool in generating small
and large cage occupancies under H-V, hydrate-aqueous liquid-vapour (H-Lw-V), and H-Lw
equilibrium conditions for a given system at known P/T allowing subsequent calculation of kn .
However, commenting on the relative accuracy of the predictions of Sun and Duan [2007] and
CSMGem are beyond the scope of this research. The hydrate number kn is used in the hydrate
saturation calculation to determine the Methane concentration in the hydrate phase under pre-
dissociation conditions.
The moles of methane in the hydrate phase under pre-dissociation conditions are determined
using the following relationship with the approximated or estimated kn as an input variable.

98
ek
HVn
M11
(4.12)
(4) Vapour phase methane concentration under H-V equilibrium GoM
Determination of vapour phase methane concentration within the H-V region of OHCH 24
system requires computation of vapour phase composition (i.e., mole fraction of methane) and
the molar volume of the vapour at a given P/T condition. The equilibrium vapour phase
composition can be derived from the moisture content measurements in methane in the presence
of hydrate performed by Chapoy et al. [2005, 2010], Folas et al. [2007], Lokken et al. [2008],
Kosyakov et al. [1979], Oellrich and Althause [2000], Youssef et al. [2009], Aoyagi et al.
[1980], Aoyagi et al. [1979], and Sloan et al. [1976], Song et al. [2004], and Zhang et al. [2011].
The moisture content data range over P/T regions of 240-280 K and 3.4-10.4 MPa. Moisture
content data is usually presented in literature in terms of ppm (parts per million or more
specifically the number of moles of methane present per million moles of the methane-water
mixture) [Chapoy et al., 2010; Youssef et al., 2009] or in terms of lbm/MMCF (pound mass per
million cubic feet) at a reference pressure and a temperature (which are usually 14.7 psia and
60oF). Using the above in the calculation of methane concentration per unit volume of vapour
phase requires the use of an appropriate Equation of State (EoS) capable of generating the molar
volume of vapour phase at the corresponding pre-dissociation T/P conditions at which the test is
conducted and at the reference T/P conditions (60oF and 14.7 psia). Many of the equations of
state for methane-water system are applicable over the Lw-V region but not in the presence of
hydrate. Duan et al. [1992a] provides a hint of the difficulties associated with accommodating
the complex volumetric and phase behaviour in the presence of hydrates in to the formulation of

99
an EoS. Therefore, the methane concentration in vapour phase needs to be calculated by
approximating an existing pure component EoS. As such we recommend the use of the pure
component EoS for methane developed by Duan et al. [1992b] in the determination of GoM .
Alternatively, the CSMGem calculator can also be used to determine GoM . The vapour phase
methane concentration is thus calculated by approximating )@()(24
VHOHCHVMV with pure
component (methane) molar volume under hydrate forming conditions (equation 4.13).
)@ ()(24
4
VHOHCHV
CH
GoMV
yM
(4.13)
(5) Aqueous phase methane concentration under H-Lw equilibrium WoM
Methane solubility in water in equilibrium with its hydrate has been researched by many [Davie
et al., 2004; Hashemi et al., 2006; Lu et al., 2008; Servio and Englezos, 2002; Sun and Duan,
2007; Zatsepina and Buffett, 1997]. In the absence of hydrate methane solubility increases with
decreasing temperature and increasing pressure, however, in the presence of hydrate the
solubility decreases with decreasing temperature and increasing pressure [Lu et al., 2008; Servio
and Englezos, 2002; Zatsepina and Buffett, 1997]. The peak in the hydrate solubility corresponds
to the three phase H-Lw-V equilibrium temperature at a given pressure [Zatsepina and Buffett,
1997]. The pressure dependency of the solubility profile could be considered insignificant in the
presence of hydrates [Davie et al., 2004]. However, according to Lu et al. [2008] the pressure
effect on solubility in the presence of hydrate is small at low temperatures than at high
temperatures, also, the relative change in solubility over the same magnitude of pressure change
increases with pressure. The model developed by Zatsepina and Buffette [1997] investigates the

100
effects of temperature, pressure, and salinity on methane solubility. However, “the model of
Zatsepina and Buffette [1997, 1998] underestimated 4CH solubility in water and underestimated
the salting-out effect of electrolyte on 4CH solubility both at vapour-aqueous liquid (V-Lw)
equilibrium and at H-Lw equilibrium” [Sun and Duan, 2007]. Davie et al. [2004] fits theoretical
calculations of Zatsepina and Buffette [1997] with a simple equation. Hashemi et al. [2006]
presents an improved model to predict solubilities in pure water at H-Lw and H-Lw-V
equilibrium. The results closely match the experimentally derived values of Servio and Englezos
[2002]. The effects of capillarity and salinity are also taken into account in the predictions of the
model Sun and Duan [2007]. The model requires temperature, pressure, salinity, and pore radios
as the inputs. It is noteworthy that the pore radius effects are negligible for coarse grained
sediments and the aforementioned fact is visible in the model predictions for radii greater than
300 nm. The model results over the H-Lw region and along the H-Lw-V boundary have been
verified against experimental data of Servio and Englezos [2002], Kim et al. [2003], and Seo et
al. [2002] for solubility in pure water. Lu et al. [2008] using Raman spectroscopy measures
methane concentrations in pure water in equilibrium with structure I hydrate. A relationship for
mole fraction 4CHx of methane in water is derived as a function of temperature (T in K) and
pressure ( P in MPa).
TP
PxCH
/)0158.80.4886(
023267.00464.11exp
4 (4.14)
The predictions obtained using equation (4.14) is in good agreement with the measured values
given by Servio and Englezos [2002] and values predicted by Sun and Duan [2007].
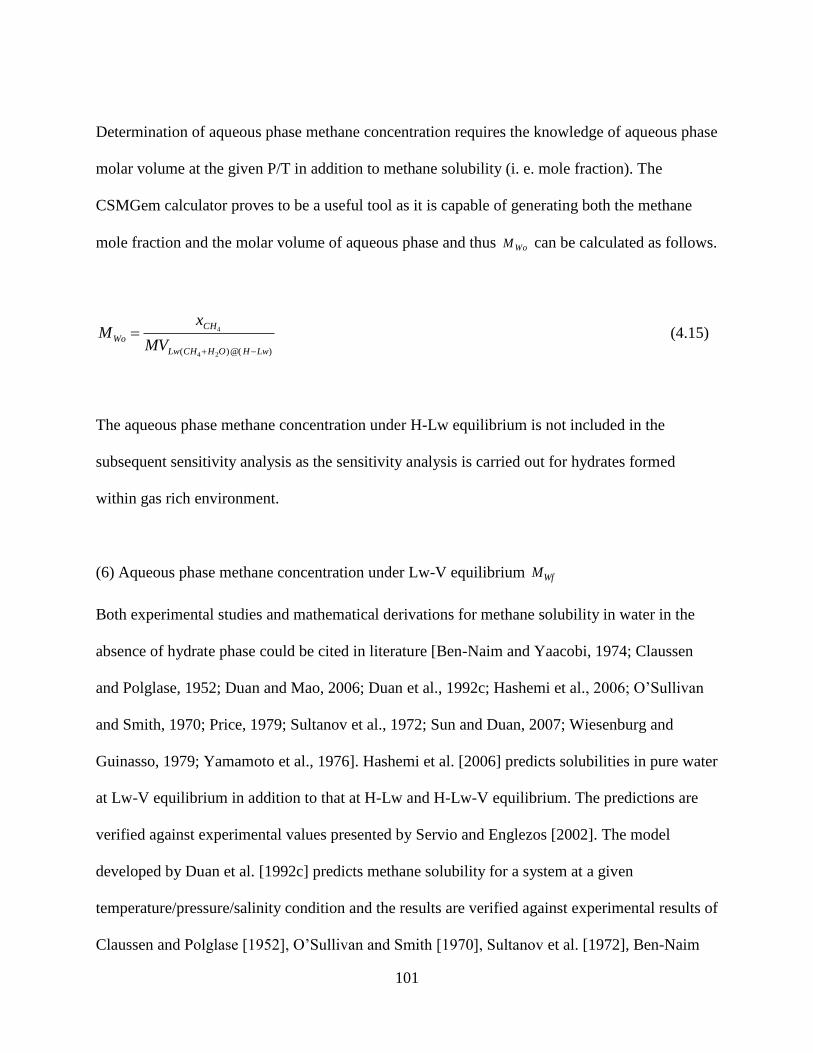
101
Determination of aqueous phase methane concentration requires the knowledge of aqueous phase
molar volume at the given P/T in addition to methane solubility (i. e. mole fraction). The
CSMGem calculator proves to be a useful tool as it is capable of generating both the methane
mole fraction and the molar volume of aqueous phase and thus WoM can be calculated as follows.
)@()( 24
4
LwHOHCHLw
CH
WoMV
xM
(4.15)
The aqueous phase methane concentration under H-Lw equilibrium is not included in the
subsequent sensitivity analysis as the sensitivity analysis is carried out for hydrates formed
within gas rich environment.
(6) Aqueous phase methane concentration under Lw-V equilibrium WfM
Both experimental studies and mathematical derivations for methane solubility in water in the
absence of hydrate phase could be cited in literature [Ben-Naim and Yaacobi, 1974; Claussen
and Polglase, 1952; Duan and Mao, 2006; Duan et al., 1992c; Hashemi et al., 2006; O’Sullivan
and Smith, 1970; Price, 1979; Sultanov et al., 1972; Sun and Duan, 2007; Wiesenburg and
Guinasso, 1979; Yamamoto et al., 1976]. Hashemi et al. [2006] predicts solubilities in pure water
at Lw-V equilibrium in addition to that at H-Lw and H-Lw-V equilibrium. The predictions are
verified against experimental values presented by Servio and Englezos [2002]. The model
developed by Duan et al. [1992c] predicts methane solubility for a system at a given
temperature/pressure/salinity condition and the results are verified against experimental results of
Claussen and Polglase [1952], O’Sullivan and Smith [1970], Sultanov et al. [1972], Ben-Naim
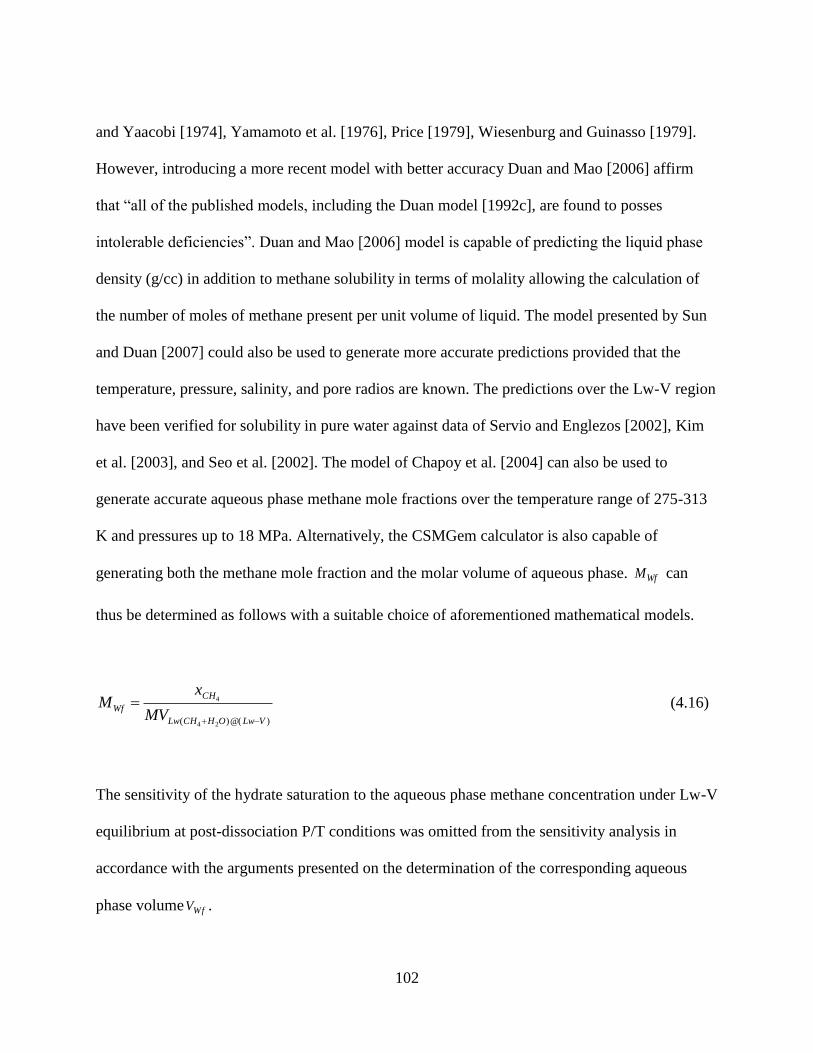
102
and Yaacobi [1974], Yamamoto et al. [1976], Price [1979], Wiesenburg and Guinasso [1979].
However, introducing a more recent model with better accuracy Duan and Mao [2006] affirm
that “all of the published models, including the Duan model [1992c], are found to posses
intolerable deficiencies”. Duan and Mao [2006] model is capable of predicting the liquid phase
density (g/cc) in addition to methane solubility in terms of molality allowing the calculation of
the number of moles of methane present per unit volume of liquid. The model presented by Sun
and Duan [2007] could also be used to generate more accurate predictions provided that the
temperature, pressure, salinity, and pore radios are known. The predictions over the Lw-V region
have been verified for solubility in pure water against data of Servio and Englezos [2002], Kim
et al. [2003], and Seo et al. [2002]. The model of Chapoy et al. [2004] can also be used to
generate accurate aqueous phase methane mole fractions over the temperature range of 275-313
K and pressures up to 18 MPa. Alternatively, the CSMGem calculator is also capable of
generating both the methane mole fraction and the molar volume of aqueous phase. WfM can
thus be determined as follows with a suitable choice of aforementioned mathematical models.
)@()( 24
4
VLwOHCHLw
CH
WfMV
xM
(4.16)
The sensitivity of the hydrate saturation to the aqueous phase methane concentration under Lw-V
equilibrium at post-dissociation P/T conditions was omitted from the sensitivity analysis in
accordance with the arguments presented on the determination of the corresponding aqueous
phase volume WfV .
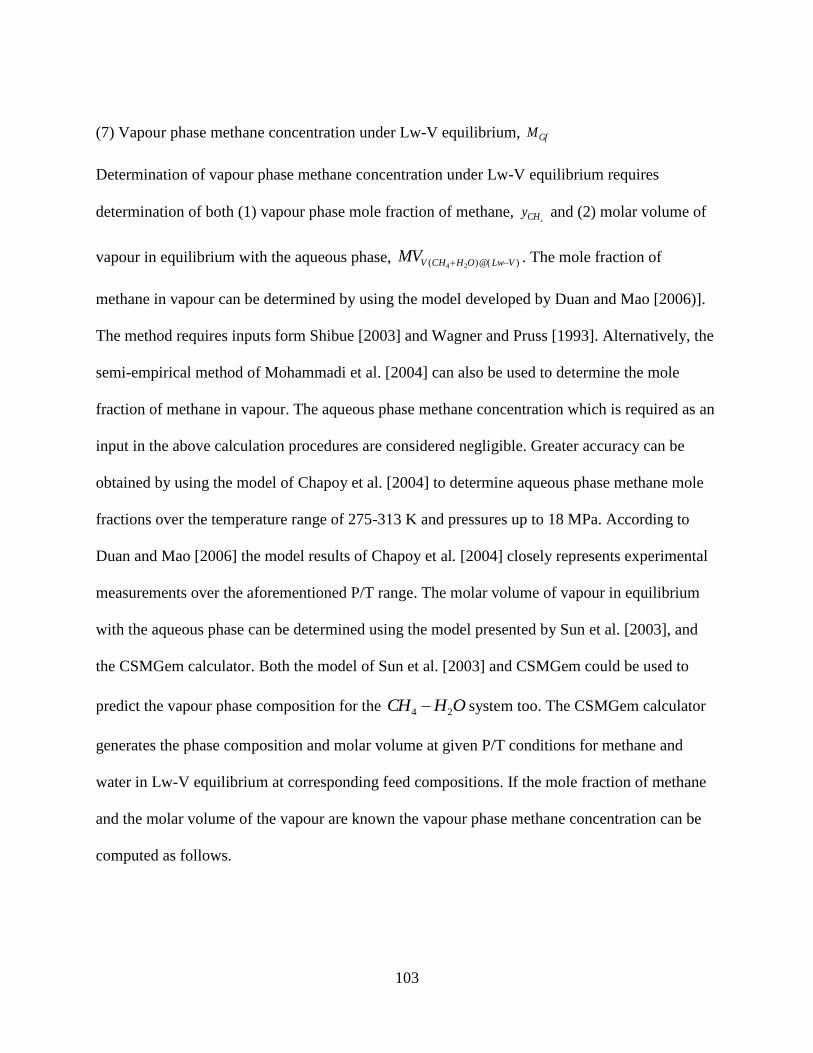
103
(7) Vapour phase methane concentration under Lw-V equilibrium, GfM
Determination of vapour phase methane concentration under Lw-V equilibrium requires
determination of both (1) vapour phase mole fraction of methane, 4
CHy and (2) molar volume of
vapour in equilibrium with the aqueous phase, )@()( 24 VLwOHCHVMV . The mole fraction of
methane in vapour can be determined by using the model developed by Duan and Mao [2006)].
The method requires inputs form Shibue [2003] and Wagner and Pruss [1993]. Alternatively, the
semi-empirical method of Mohammadi et al. [2004] can also be used to determine the mole
fraction of methane in vapour. The aqueous phase methane concentration which is required as an
input in the above calculation procedures are considered negligible. Greater accuracy can be
obtained by using the model of Chapoy et al. [2004] to determine aqueous phase methane mole
fractions over the temperature range of 275-313 K and pressures up to 18 MPa. According to
Duan and Mao [2006] the model results of Chapoy et al. [2004] closely represents experimental
measurements over the aforementioned P/T range. The molar volume of vapour in equilibrium
with the aqueous phase can be determined using the model presented by Sun et al. [2003], and
the CSMGem calculator. Both the model of Sun et al. [2003] and CSMGem could be used to
predict the vapour phase composition for the OHCH 24 system too. The CSMGem calculator
generates the phase composition and molar volume at given P/T conditions for methane and
water in Lw-V equilibrium at corresponding feed compositions. If the mole fraction of methane
and the molar volume of the vapour are known the vapour phase methane concentration can be
computed as follows.
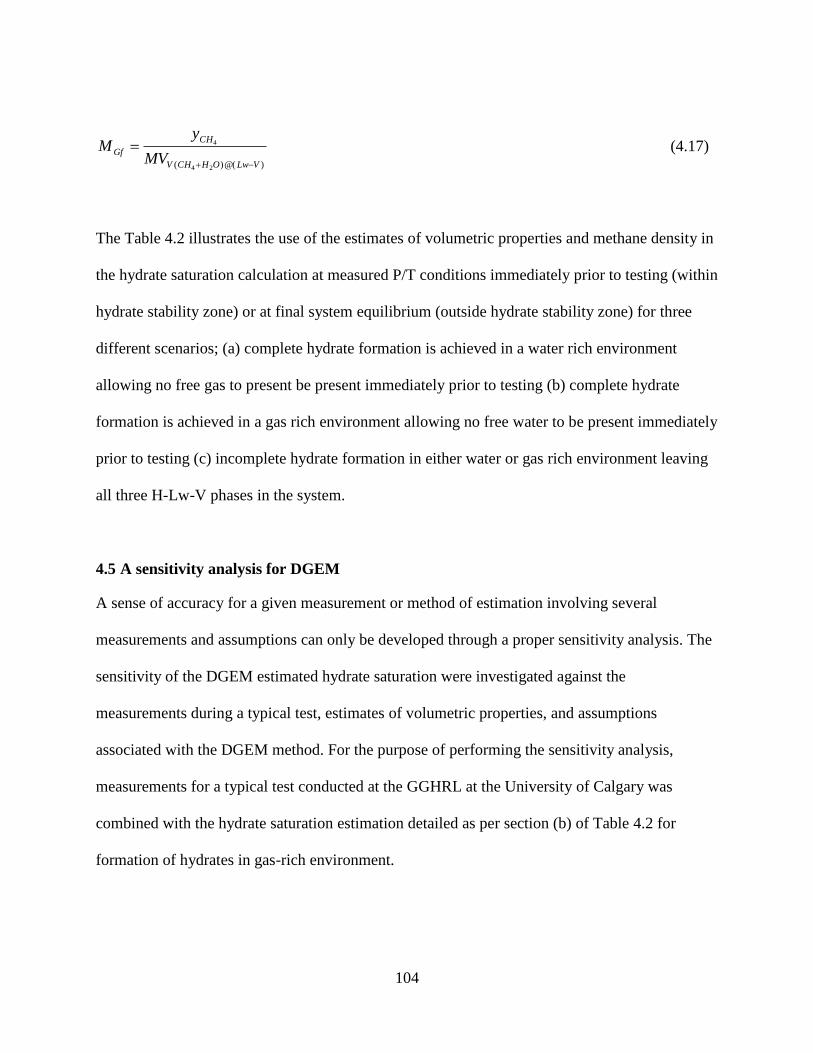
104
)@()( 24
4
VLwOHCHV
CH
GfMV
yM
(4.17)
The Table 4.2 illustrates the use of the estimates of volumetric properties and methane density in
the hydrate saturation calculation at measured P/T conditions immediately prior to testing (within
hydrate stability zone) or at final system equilibrium (outside hydrate stability zone) for three
different scenarios; (a) complete hydrate formation is achieved in a water rich environment
allowing no free gas to present be present immediately prior to testing (b) complete hydrate
formation is achieved in a gas rich environment allowing no free water to be present immediately
prior to testing (c) incomplete hydrate formation in either water or gas rich environment leaving
all three H-Lw-V phases in the system.
4.5 A sensitivity analysis for DGEM
A sense of accuracy for a given measurement or method of estimation involving several
measurements and assumptions can only be developed through a proper sensitivity analysis. The
sensitivity of the DGEM estimated hydrate saturation were investigated against the
measurements during a typical test, estimates of volumetric properties, and assumptions
associated with the DGEM method. For the purpose of performing the sensitivity analysis,
measurements for a typical test conducted at the GGHRL at the University of Calgary was
combined with the hydrate saturation estimation detailed as per section (b) of Table 4.2 for
formation of hydrates in gas-rich environment.

105
4.5.1 Sensitivity of hydrate saturation to direct temperature measurements, absolute pre and
post-dissociation pressures and estimates of volumetric parameters
The Table 4.4 illustrates the sensitivity of the hydrate saturation to number of test parameters. It
should be noted that most of the test parameters are “secondary” as they are derived from
multiple “primary” laboratory measurements. Preferably, the sensitivity of hydrate saturation is
evaluated against the secondary parameters but not against the primary measured parameters.
The objective is to allow the use of more than one method in deriving the secondary parameters
at the laboratory. As such the sensitivities presented herein would be more meaningful and useful
to the reader.
The sensitivities presented in Table 4.4 are based on functional tables developed by calculating
the hydrate saturation at different values of a test parameter within the mentioned range of
validity. The functional tables were converted into graphical form and empirical equations were
developed by fitting linear trend-lines. Therefore, it should be noted that although we have
retained nine-digit accuracy for the sensitivity derived from the constants of an empirical
equation, the equation itself is by no means this accurate. The accuracy of the sensitivity
calculation is therefore, limited by the uncertainty in the estimation of hydrate saturation which
is attributed to the uncertainties of various mathematical models used and the assumptions made
during the process of estimation. However, this does not underestimate the usefulness of
sensitivity values presented in Table 4.4 (given a calculation procedure) as it is very important in
any experiment to know the “uncertainty” or the “estimated amount by which the observed or
calculated value of a quantity may differ from the true value” [Zebrowski, 1979] due to errors in
measurement. Errors in measurement could either be systematic (occurring due to errors in
106
calibration or inappropriate use of a measuring instrument) or random (occurring due to
uncontrolled variables such as minor fluctuations in environmental conditions or due to specimen
variations).
Provided that appropriate measuring instruments under existing environmental conditions are
used during the test, the total uncertainty in the measurement (test parameter) can be calculated
considering the “accuracy” and the “precision” of the instruments. The ‘accuracy” of an
instrument is related to the instrument calibration and the physical standards against which the
instrument is calibrated and is defined as “a certification of how closely” an instrument “be
expected to agree with its calibration standard” [Zebrowski, 1979]. “The precision of an
instrument is the index of its discriminating ability. It is usually stated as the instrument’s
smallest scale division” [Zebrowski, 1979]. It should also be noted that certain test parameters
depend on more than one measured quantity (e.g. Initial volume of soil voids). In such situations,
the error analysis should consist of error propagation calculations as well. Once the total
uncertainty of the measurement is calculated, the sensitivity values presented can be used to
calculate the corresponding uncertainly that should be expected in the estimated hydrate
saturation. The performed sensitivity analysis provided valuable input in to re-evaluating the
accuracy of the experimental measurement at the GGHRL of University of Calgary. With the
renewed accuracy of our measurements, our hydrate saturation estimates carry only about ± 2%
error.
107
4.5.2 Sensitivity to estimates of methane density
Based on our previous presentation of available resources for methane density estimations, the
following models were chosen to generate methane density estimates for hydrates formed in gas-
rich environment: EoS of Duan et al. [1992b], CSMGem Calculator of Colorado School of
Mines, Duan and Mao [2006] model, and the Ideal Gas Law. The Ideal Gas Law is used here
only as a method associated with minimal computational effort. The hydrate saturations obtained
with the use of Ideal Gas Law can then be compared with those obtained by employing the other
models to generate a feel for the value of extra effort associated with those other models.
4.5.2.1 Methane density of the hydrate phase - Hydrate number kn
The sensitivity of the hydrate saturation to the hydrate number was investigated by computing
the hydrate saturation for a typical test over a range of hydrate numbers from 5.75 to 6.00 at
formation conditions given by a temperature of 278.15 K and pressure of 9101.325 kPa. The
resulting functional table was then used to develop an empirical correlation by fitting a linear
trend-line. A sensitivity of 0.01234504 change in hydrate saturation per percentage change in
hydrate number was derived. The range of hydrate numbers over which the sensitivity was
evaluated extend beyond the range of experimentally determined hydrate numbers at the stated
P/T conditions. However, with very little amount of experimental data and our modest
understanding of the factors governing the hydrate cage occupancy uncertainties still exist as to
the adequacy of the range of hydrate numbers selected for the analysis. However, compared to
the sensitivities of hydrate saturation to other parameters subjected to investigation, the derived
sensitivity to hydrate number appears less significant.

108
4.5.2.2 Methane density of vapour phase under the H-V equilibrium at pre-dissociation
conditions GoM
The application of DGEM in hydrate saturation estimation for hydrates formed in gas-rich
environment assumes H-V equilibrium under pre-dissociation conditions. The hydrate saturation
at the above assumption of two-phase H-V equilibrium conditions was evaluated by determining
hydrate saturation with the use of CSMGem calculator, the EoS developed by Duan et al.
[1992b], and the Ideal Gas Law. The use of Duan model and Ideal Gas Law neglects the
presence of moisture in vapour. Apparently, CSMGem calculator too seems to be neglecting the
presence of moisture and hence the vapour is approximated to a single component pure CH4
system. If CSMGem is assumed to accommodate the presence of moisture in gas phase, the mere
comparison of the hydrate saturation values obtained by CSMGem and Duan et al. [1992b] may
suggest that the sensitivity to the assumption of moisture free gas phase appears to have little
effect over the hydrate saturation. However, the difference between the CSMGem and Duan et
al. [1992b] based predictions cannot be completely attributed to the consideration of presence or
absence of moisture in the gas phase, as there could be other differences between the two
calculation procedures contributing to the difference in predicted saturations. As such the
available resources do not allow us to investigate the effects of possible existence of non-
equilibrium conditions within the system or the treatment of water-hydrocarbon interaction. The
hydrate saturations obtained are presented in Table 4.5. The calculations were performed at pre-
dissociation temperature of 278.15 K and pressure of 9101.325 kPa. It is also interesting to note
that the results generated with the use of Ideal Gas Law deviate greatly from the rest and
highlights the usefulness of other methods at high pressures and low temperatures as the real
gases stray from ideal conditions.
109
4.5.2.3 Methane density of vapour phase under Lw-V equilibrium at post-dissociation conditions
at the gas/water collector GfM
The application of DGEM assumes Lw-V two phase equilibrium under the post-dissociation
conditions. As such we investigate the sensitivity of the hydrate saturation against the
assumption of moisture free gas phase in equilibrium with aqueous liquid. If the vapour phase
water content in methane is neglected assuming gaseous phase of pure CH4 within the gas/water
collector the molar volume of methane under the post-dissociation conditions can be calculated
using the Ideal Gas Law or the EoS of Duan et al. [1992b]. The approaches such as the model
developed by Duan and Mao [2006] and CSMGem accommodates the effect due to the presence
of moisture in the vapour phase. The CSMGem calculator is calibrated for water-hydrocarbon
systems by regressing water-hydrocarbon interaction parameters available in GPA
Thermodynamic Database [1996]. The hydrate saturations obtained with the use of
aforementioned at post-dissociation temperature of 296.15 K and pressure of 445.325 kPa are
presented in Table 4.6. The results show a moderate sensitivity to the treatment of water-
hydrocarbon interaction in the gaseous phase. At the test P/T conditions there exists a difference
of only 1.62 in percentage hydrate saturation between the two Duan models. Interestingly, the
hydrate saturation generated by the Ideal Gas Law appears to be in good agreement with those
other methods. Therefore, it is suggested that under conditions of high temperature and low
pressure a model such as Ideal Gas Law which is associated with the least computation effort can
be employed in the saturation calculation without significant accuracy.

110
4.5.2.4 Methane density of vapour phase under the Lw-V equilibrium for the material mass
present within total volume of hydrate forming gas filled elements external to the
immediate boundaries of the specimen GextM
When hydrate dissociation products are collected and post-dissociation gas P/T/V measurements
are performed at separate gas/water collector external to the hydrated specimen, a quantity of gas
external to the specimen and present within such elements as connection tubing between the
specimen and the collector may enter into the collector resulting in an overestimation of the
moles of methane generated from hydrate dissociation. Therefore this quantity of gas should be
estimated and detached from the hydrate saturation calculation. Under the prevailing conditions
at GGHRL of University of Calgary, such connection tubing consists of vapour saturated
gaseous methane at formation pressure and room temperature. A similar procedure to previously
mentioned (for vapour phase methane density under Lw-V equilibrium at the gas/water collector)
was followed to check the sensitivity to the assumption of Lw-V two phase equilibrium in the
determination of the quantity of gas within respective external volume under corresponding P/T
conditions. The results are shown in Table 4.7 for a typical test at a (room) temperature of 299.15
K and a pressure of 9101.325 kPa. Similar to the previous case of estimating GfM , the fact that
whether or not the gaseous phase is saturated with water does not appear to have no significant
impact over the estimated hydrate saturation. However, as opposed to the hydrate saturations
obtained for vapour phase under post-dissociation conditions at the gas/water collector, the use
of Ideal Gas Law results in significant overestimation of hydrate saturation. This is due to the
fact that real gases deviate from ideal conditions at high pressures. The results indicate the
necessity for approximating the actual test conditions with appropriate models of adequate
accuracy.

111
4.6 Discussion
The use of DGEM method for estimation of hydrate saturation proves to be a useful
methodology as the estimated quantities are independent of intact sediment characteristics, pore
space consistency, hydrate growth habit, and hydrate distribution. The calculation is based on the
principle of mass balance for methane and volume compatibility of the phases present within the
system. However, the task is not less challenging as the accuracy of the estimation greatly
depends on (1) the degree of care we exert in performing numerous measurements in the
laboratory, (2) selection of measuring devices and apparatus to generate adequate level of
accuracy, and (3) how well the hydrated soil system is modelled with physical and chemical
equilibrium conditions that are assumed. Therefore, we perform a sensitivity analysis
highlighting the need for minimizing measurement errors, and evaluating the consequences of
assumed equilibrium conditions not being representative of the true nature of the system. The
key findings of the sensitivity analysis on various laboratory measurements can be summarized
as follows:
P/T measurements of the system components contained within the laboratory are critical,
particularly when large quantities of methane are present at low density (specifically at
high temperatures and low pressures).
Volume measurements in the system components are critical when the methane density is
at its greatest (high pressure and low temperature).
Laboratory experiments should therefore pay attention to the aforementioned in the selection of
measuring devices and apparatus in order maintain appropriate levels of accuracy in testing.
112
Under the assumed equilibrium pre and post dissociation conditions, estimation of methane
density in hydrate, aqueous liquid, and vapour phases require the use of various theoretical
models. As such we focus on developing a resource information base for hydrate saturation
estimates illustrating the current state of knowledge in related hydrate sciences. In this effort we
have attempted suggesting the use of those models that are validated against experimental data in
many situations as possible. The key findings of the sensitivity analysis for hydrates formed in
gas-rich environment at the assumed equilibrium conditions of the system under which methane
density of different phases are estimated suggests that neglecting the water content in vapour
phase, as done with the use of single component models, does not appear to result in significant
change in the estimated hydrate saturations. It, therefore, appears that the consequences of
assumed equilibrium conditions not being representative of the true nature of the system to have
no significant impact on the estimated hydrate saturations. As a result, the DGEM method for
hydrate saturation estimation yields results representative of true hydrate saturation present
within a given sediment, provided that adequate care is exerted at the laboratory to minimize
measurement errors. Additionally, the analysis presented in Section 4.5.2 extends to investigate
when and where it is appropriate to use models such as Ideal Gas Law (which are associated with
minimal computational effort) and caution the use of ideal approximation of moist gaseous
methane when conditions stray from ideal conditions.
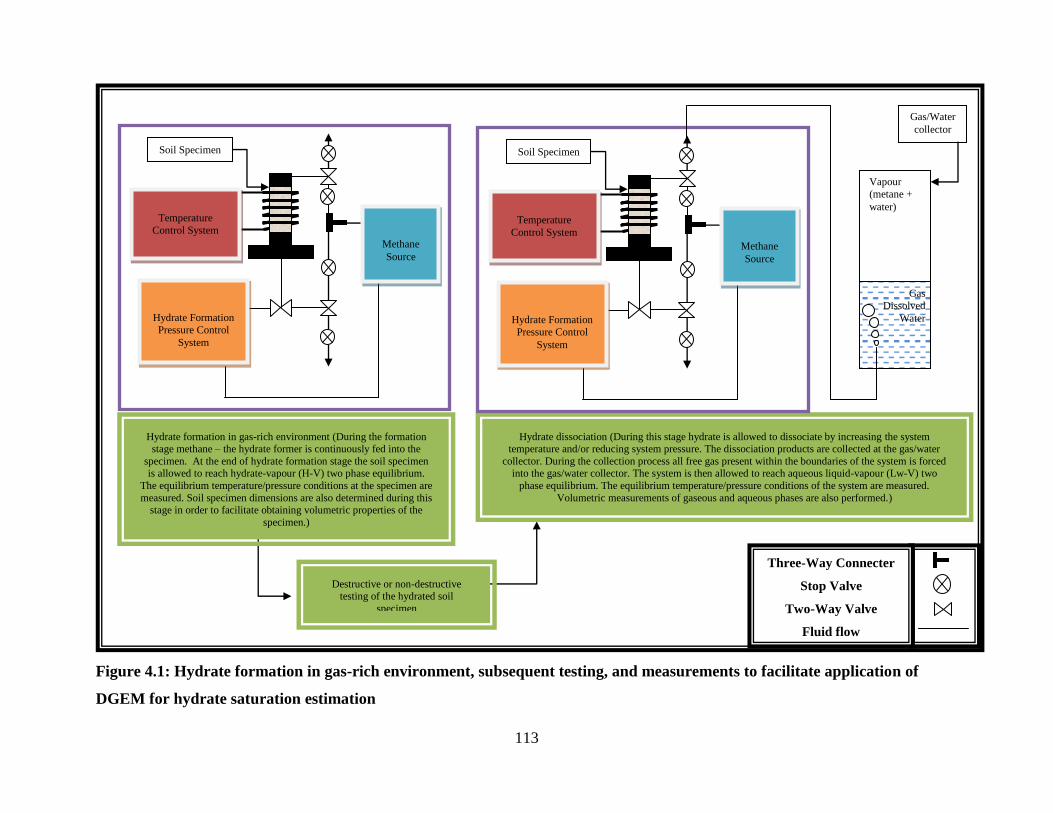
113
Figure 4.1: Hydrate formation in gas-rich environment, subsequent testing, and measurements to facilitate application of
DGEM for hydrate saturation estimation
Temperature
Control System
Methane
Source
Hydrate Formation
Pressure Control
System
Soil Specimen
Destructive or non-destructive testing of the hydrated soil
specimen
Hydrate formation in gas-rich environment (During the formation
stage methane – the hydrate former is continuously fed into the
specimen. At the end of hydrate formation stage the soil specimen is allowed to reach hydrate-vapour (H-V) two phase equilibrium.
The equilibrium temperature/pressure conditions at the specimen are
measured. Soil specimen dimensions are also determined during this stage in order to facilitate obtaining volumetric properties of the
specimen.)
Hydrate dissociation (During this stage hydrate is allowed to dissociate by increasing the system
temperature and/or reducing system pressure. The dissociation products are collected at the gas/water
collector. During the collection process all free gas present within the boundaries of the system is forced into the gas/water collector. The system is then allowed to reach aqueous liquid-vapour (Lw-V) two
phase equilibrium. The equilibrium temperature/pressure conditions of the system are measured.
Volumetric measurements of gaseous and aqueous phases are also performed.)
Temperature
Control System
Methane
Source
Hydrate Formation
Pressure Control
System
Soil Specimen
Vapour
(metane +
water)
Gas
Dissolved
Water
Gas/Water
collector
Three-Way Connecter
Stop Valve
Two-Way Valve
Fluid flow
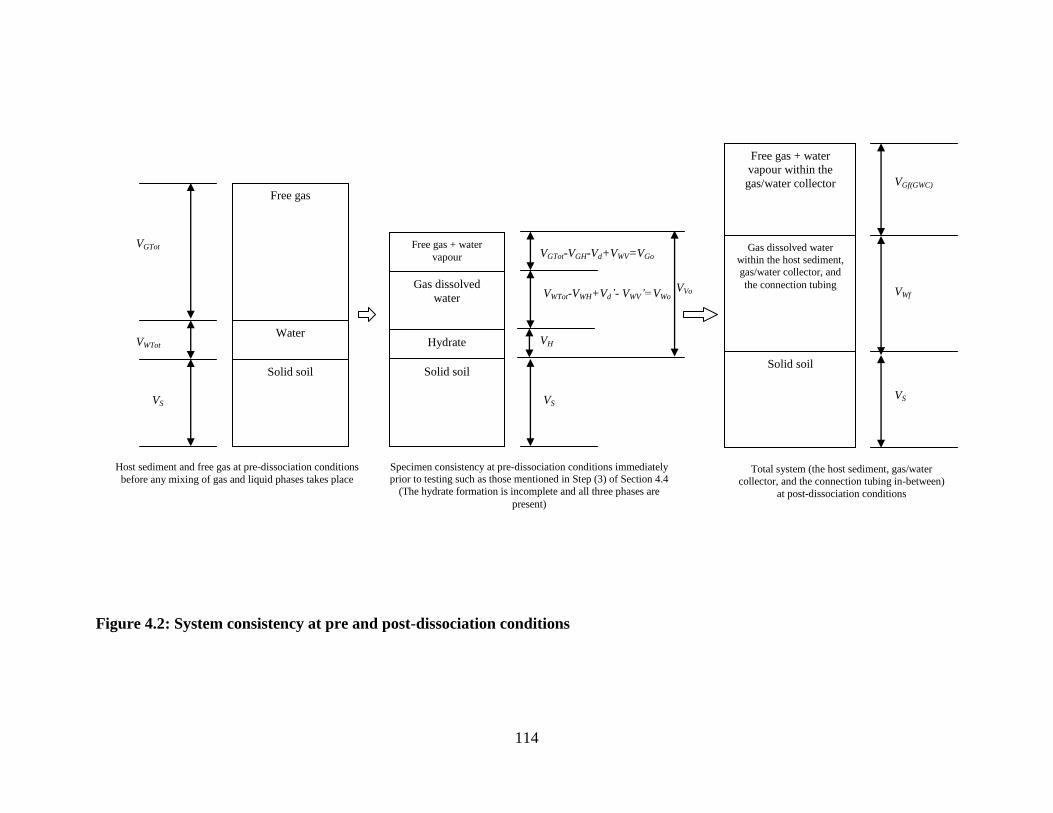
114
Figure 4.2: System consistency at pre and post-dissociation conditions
Host sediment and free gas at pre-dissociation conditions
before any mixing of gas and liquid phases takes place
Solid soil
Water
Free gas
VGTot
VWTot
VS
Specimen consistency at pre-dissociation conditions immediately prior to testing such as those mentioned in Step (3) of Section 4.4
(The hydrate formation is incomplete and all three phases are
present)
Solid soil
Free gas + water
vapour
Gas dissolved
water
Hydrate
VGTot-VGH-Vd+VWV=VGo
VWTot-VWH+Vd’- VWV’=VWo
VS
VH
VVo
Total system (the host sediment, gas/water
collector, and the connection tubing in-between)
at post-dissociation conditions
Solid soil
Free gas + water
vapour within the
gas/water collector
Gas dissolved water
within the host sediment,
gas/water collector, and
the connection tubing
VGf(GWC)
VWf
VS
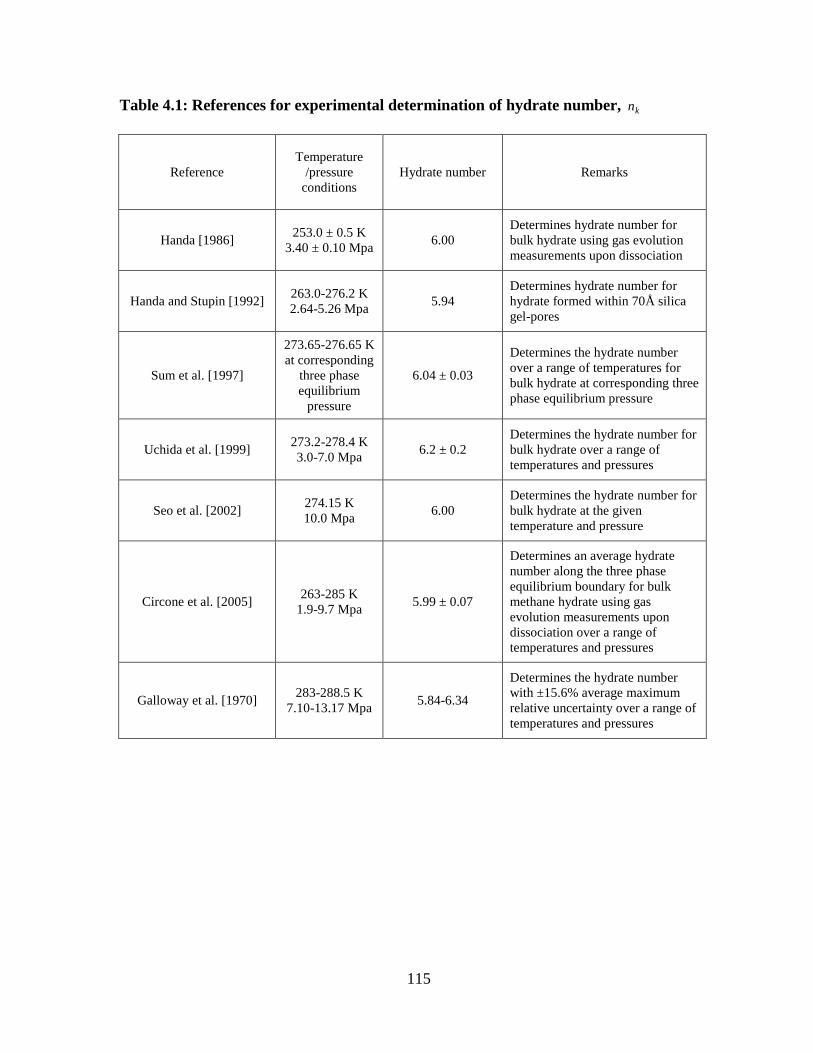
115
Table 4.1: References for experimental determination of hydrate number, kn
Reference
Temperature
/pressure
conditions
Hydrate number Remarks
Handa [1986] 253.0 ± 0.5 K
3.40 ± 0.10 Mpa 6.00
Determines hydrate number for
bulk hydrate using gas evolution
measurements upon dissociation
Handa and Stupin [1992] 263.0-276.2 K
2.64-5.26 Mpa 5.94
Determines hydrate number for
hydrate formed within 70Å silica
gel-pores
Sum et al. [1997]
273.65-276.65 K
at corresponding
three phase
equilibrium
pressure
6.04 ± 0.03
Determines the hydrate number
over a range of temperatures for
bulk hydrate at corresponding three
phase equilibrium pressure
Uchida et al. [1999] 273.2-278.4 K
3.0-7.0 Mpa 6.2 ± 0.2
Determines the hydrate number for
bulk hydrate over a range of
temperatures and pressures
Seo et al. [2002] 274.15 K
10.0 Mpa 6.00
Determines the hydrate number for
bulk hydrate at the given
temperature and pressure
Circone et al. [2005] 263-285 K
1.9-9.7 Mpa 5.99 ± 0.07
Determines an average hydrate
number along the three phase
equilibrium boundary for bulk
methane hydrate using gas
evolution measurements upon
dissociation over a range of
temperatures and pressures
Galloway et al. [1970] 283-288.5 K
7.10-13.17 Mpa 5.84-6.34
Determines the hydrate number
with ±15.6% average maximum
relative uncertainty over a range of
temperatures and pressures
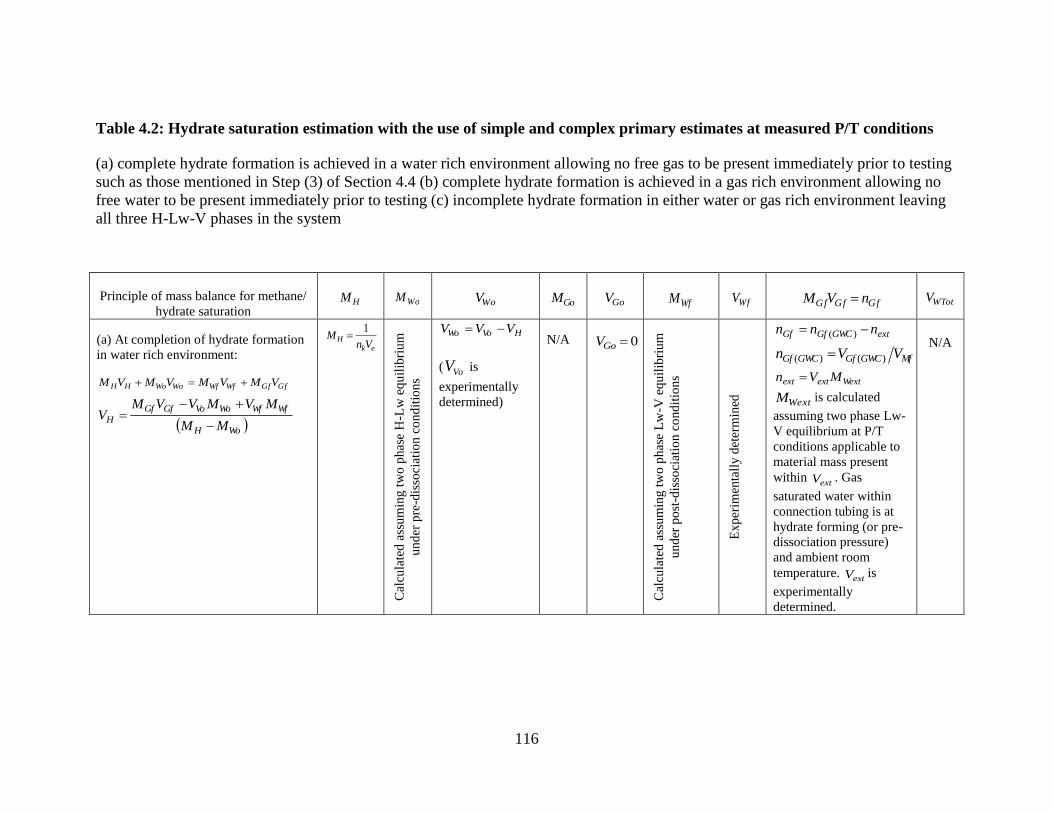
116
Table 4.2: Hydrate saturation estimation with the use of simple and complex primary estimates at measured P/T conditions
(a) complete hydrate formation is achieved in a water rich environment allowing no free gas to be present immediately prior to testing
such as those mentioned in Step (3) of Section 4.4 (b) complete hydrate formation is achieved in a gas rich environment allowing no
free water to be present immediately prior to testing (c) incomplete hydrate formation in either water or gas rich environment leaving
all three H-Lw-V phases in the system
Principle of mass balance for methane/
hydrate saturation
HM
WoM
WoV
GoM
GoV
WfM
WfV
GfGfGf nVM
WTotV
(a) At completion of hydrate formation
in water rich environment:
GfGfWfWfWoWoHH VMVMVMVM
WoH
WfWfWoVoGfGf
HMM
MVMVVMV
ekH
VnM
1
Cal
cula
ted
ass
um
ing
tw
o p
has
e H
-Lw
eq
uil
ibri
um
un
der
pre
-dis
soci
atio
n c
on
dit
ion
s
HVoWo VVV
( VoV is
experimentally
determined)
N/A
0GoV
Cal
cula
ted
ass
um
ing
tw
o p
has
e L
w-V
eq
uil
ibri
um
un
der
po
st-d
isso
ciat
ion
co
nd
itio
ns
Ex
per
imen
tall
y d
eter
min
ed
extGWCGfGf nnn )(
MfGWCGfGWCGf VVn )()(
Wextextext MVn
WextM is calculated
assuming two phase Lw-
V equilibrium at P/T
conditions applicable to
material mass present
within extV . Gas
saturated water within
connection tubing is at
hydrate forming (or pre-
dissociation pressure)
and ambient room
temperature. extV is
experimentally
determined.
N/A

117
Principle of mass balance for methane/
hydrate saturation
HM
WoM
WoV
GoM
GoV
WfM
WfV
GfGfGf nVM
WTotV
(b) At completion of hydrate formation
in gas rich environment:
GfGfWfWfGoGoHH VMVMVMVM
GoH
WfWfGoVoGfGf
HMM
MVMVVMV
ekH
VnM
1
N/A
0WoV
Cal
cula
ted
ass
um
ing
tw
o p
has
e H
-V e
qu
ilib
riu
m u
nd
er p
re-
dis
soci
atio
n c
on
dit
ion
s
HVo
Go
VV
V
( VoV is
experi-
mental-
ly
determ-
ined )
Cal
cula
ted
ass
um
ing
tw
o p
hase
Lw
-V e
qu
ilib
riu
m u
nd
er p
ost
-
dis
soci
atio
n c
on
dit
ion
s
Ex
per
imen
tall
y d
eter
min
ed
extGWCGfGf nnn )(
MfGWCGfGWCGf VVn )()(
GfMf MV 1
Mext
extext
V
Vn
GextMext MV 1
GextM is calculated
assuming two phase Lw-
V equilibrium at P/T
conditions applicable to
material mass present
within extV . Vapour
within extV is at hydrate
forming (or pre-
dissociation pressure)
and ambient room
temperature. extV is
experimentally
determined.
N/A
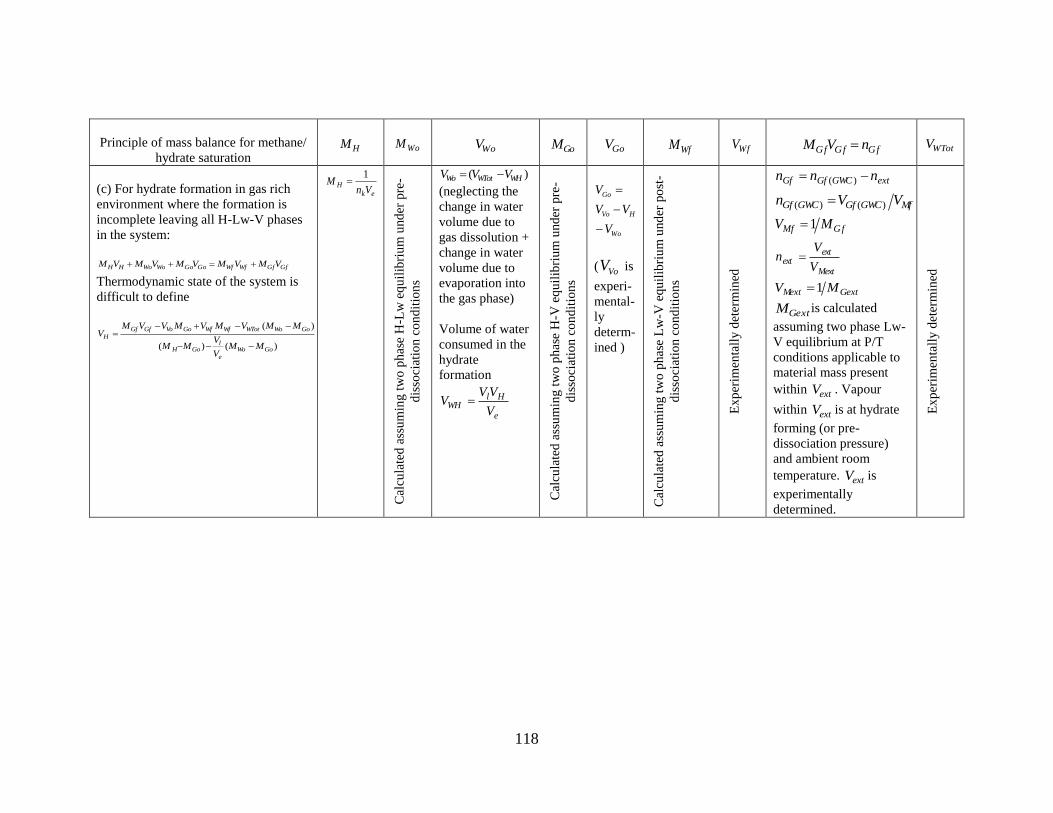
118
Principle of mass balance for methane/
hydrate saturation
HM
WoM
WoV
GoM
GoV
WfM
WfV
GfGfGf nVM
WTotV
(c) For hydrate formation in gas rich
environment where the formation is
incomplete leaving all H-Lw-V phases
in the system:
GfGfWfWfGoGoWoWoHH VMVMVMVMVM
Thermodynamic state of the system is
difficult to define
)()(
)(
GoWo
e
lGoH
GoWoWTotWfWfGoVoGfGf
H
MMV
VMM
MMVMVMVVMV
ekH
VnM
1
Cal
cula
ted
ass
um
ing
tw
o p
has
e H
-Lw
eq
uil
ibri
um
und
er p
re-
dis
soci
atio
n c
on
dit
ion
s
)( WHWTotWo VVV
(neglecting the
change in water
volume due to
gas dissolution +
change in water
volume due to
evaporation into
the gas phase)
Volume of water
consumed in the
hydrate
formation
e
HlWH
V
VVV
Cal
cula
ted
ass
um
ing
tw
o p
has
e H
-V e
qu
ilib
riu
m u
nd
er p
re-
dis
soci
atio
n c
on
dit
ion
s
Wo
HVo
Go
V
VV
V
( VoV is
experi-
mental-
ly
determ-
ined )
Cal
cula
ted
ass
um
ing
tw
o p
has
e L
w-V
eq
uil
ibri
um
und
er p
ost
-
dis
soci
atio
n c
on
dit
ion
s
Ex
per
imen
tall
y d
eter
min
ed
extGWCGfGf nnn )(
MfGWCGfGWCGf VVn )()(
GfMf MV 1
Mext
extext
V
Vn
GextMext MV 1
GextM is calculated
assuming two phase Lw-
V equilibrium at P/T
conditions applicable to
material mass present
within extV . Vapour
within extV is at hydrate
forming (or pre-
dissociation pressure)
and ambient room
temperature. extV is
experimentally
determined.
Ex
per
imen
tall
y d
eter
min
ed

119
Table 4.3: Resources for determination of hydrate bond water and methane concentration
The volume of hydrate bond water WHV
(1) Molar volume of water in aqueous liquid lV
Lide [2007] – Density of water at a given temperature (pressure effect on water density is
neglected) – Recommended and used in this study
(2) Molar volume of water in the hydrate phase eV
(a) Hester et al. [2007] – Recommended and used in this study – (Theoretical) – Lattice
parameter a at a given temperature (pressure effect on hydrate density neglected) –
fits with experimental data of Shpakov et al. [1998] and Ogienko et al. [2006] with
an average difference of 0.004 Å which is falling within the measurement error of
experimental data
Ogienko et al. [2006] – (Experimental/Theoretical) lattice parameter at a reference
temperature, oa (pressure effect on hydrate density neglected) – T range = 86-267 K
(b) Shpakov et al. [1998] – (Experimental/Theoretical) lattice parameter a at a given
temperature by fitting to experimental data (pressure effect on hydrate density
neglected) – T range = 80-210 K – Predictions deviate from experimental data with
increasing temperature
(c) Sun and Duan [2007] – (Theoretical) eV at a given temperature and a pressure
The hydrate number kn for estimation of methane concentration in the hydrate phase HM
(a) Regression of experimental data – not recommended as limited amount of
experimental data is available
(b) CSMGem [Ballard, 2002] – Recommended and used in this study – (Theoretical) –
Verified against experimental data available at Gas Processors Association (1996),
Thermodynamic Database Version 2.0 – Predictions of kn at
temperature/pressure/composition conditions over (H-V), (H-Lw-V), and (H-Lw)
phase regions
(c) Sun and Duan [2007] – (Theoretical) – Predictions of kn at P/T conditions over (H-
Lw) two phase region
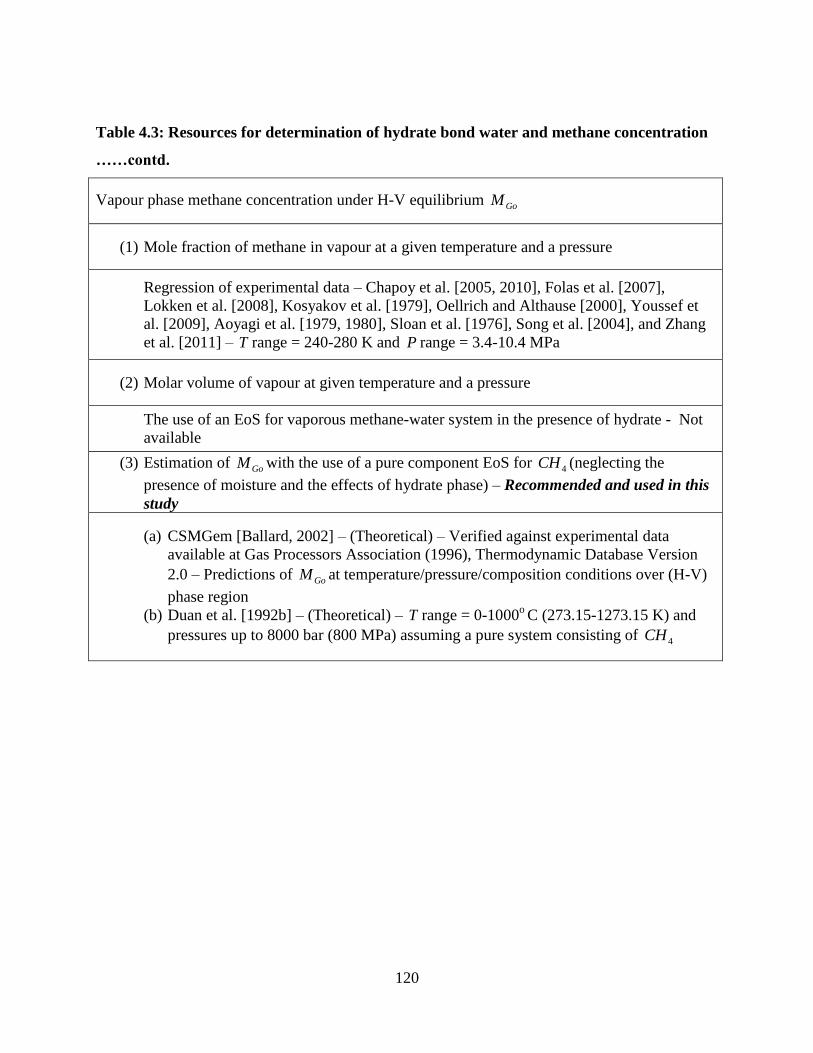
120
Table 4.3: Resources for determination of hydrate bond water and methane concentration
……contd.
Vapour phase methane concentration under H-V equilibrium GoM
(1) Mole fraction of methane in vapour at a given temperature and a pressure
Regression of experimental data – Chapoy et al. [2005, 2010], Folas et al. [2007],
Lokken et al. [2008], Kosyakov et al. [1979], Oellrich and Althause [2000], Youssef et
al. [2009], Aoyagi et al. [1979, 1980], Sloan et al. [1976], Song et al. [2004], and Zhang
et al. [2011] – T range = 240-280 K and P range = 3.4-10.4 MPa
(2) Molar volume of vapour at given temperature and a pressure
The use of an EoS for vaporous methane-water system in the presence of hydrate - Not
available
(3) Estimation of GoM with the use of a pure component EoS for 4CH (neglecting the
presence of moisture and the effects of hydrate phase) – Recommended and used in this
study
(a) CSMGem [Ballard, 2002] – (Theoretical) – Verified against experimental data
available at Gas Processors Association (1996), Thermodynamic Database Version
2.0 – Predictions of GoM at temperature/pressure/composition conditions over (H-V)
phase region
(b) Duan et al. [1992b] – (Theoretical) – T range = 0-1000o C (273.15-1273.15 K) and
pressures up to 8000 bar (800 MPa) assuming a pure system consisting of 4CH

121
Table 4.3: Resources for determination of hydrate bond water and methane concentration
……contd.
Aqueous phase methane concentration under Lw-V equilibrium WfM
(a) Chapoy et al. [2004] – Recommended – (Experimental/Theoritical) – T range = 257-
313 K and pressures up to 18 MPa – Predictions of the thermodynamic model
verified against experimental data
(b) CSMGem [Ballard, 2002] – Recommended – (Theoretical) – Verified against
experimental data available at Gas Processors Association (1996), Thermodynamic
Database Version 2.0
(c) Duan et al. [1992c] – Not recommended over the T range of 273-283 K according to
Duan and Mao [2006] – (Theoretical)
(d) Duan and Mao [2006] – Recommended and used in this study – (Theoretical) –
Predictions verified against experimental data, T range = 273-523 K and pressures up
to 2000 bar (200 MPa) – Obtains experimental accuracy – Salinity effects over
methane solubility taken into consideration
(e) Hashemi et al. [ 2006] – (Theoretical) – Verified against experimental data of Servio
and Englezos [2002] over the P/T ranges of 278.7-284.4 K and 35-65 bar (3.5-6.5
MPa)
(f) Sun and Duan [2007] – (Theoretical) – Verified against experimental data – Salinity
and capillary effect over methane solubility taken in to consideration

122
Table 4.3: Resources for determination of hydrate bond water and methane concentration
……contd.
Vapour phase methane concentration under Lw-V equilibrium GfM
(1) Mole fraction of methane in vapour at a given temperature and a pressure
(a) CSMGem [Ballard, 2002] – Recommended and used in this study – (Theoretical) –
Verified against experimental data available at Gas Processors Association (1996),
Thermodynamic Database Version 2.0
(b) Duan and Mao [2006] with inputs from Shibue et al. [2003] and Wagner and Pruss
[1993] – Recommended and used in this study – T range = 273-523 K and pressures
up to 2000 bar (200 MPa), predictions verified against experimental data of Olds et
al. [1942], Sultanov et al. [2005], Mohammadi et al. [2004], Rigby and Prausnits
[1968] for both non saline and saline systems
(c) Mohammadi et al. [2004] with dissolved mole fraction of methane in aqueous phase
calculated using Chapoy et al. [2004] – (Experimental/Theoretical) – Verified against
experimental data over the temperature range of 273.15-377.59 K and pressures up to
1000 bar (100 MPa)
(d) Sun et l. [2003] – (Theoretical) – Accurate predictions in the T range of 273-383 K
and pressures up to 1000 bar (100 MPa)
(2) Molar volume of vapour at given temperature and a pressure
(a) CSMGem [Ballard, 2002] – Recommended and used in this study – (Theoretical)–
Verified against experimental data available at Gas Processors Association (1996),
Thermodynamic Database Version 2.0
(b) Duan and Mao [2006] – Recommended and used in this stud y – (Theoretical) –
T range = 273-523 K and pressures up to 2000 bar (200 MPa)
(c) Sun et l. [2003] ] – (Theoretical) – Accurate predictions in the T range of 273-383 K
and pressures up to 1000 bar (100 MPa)
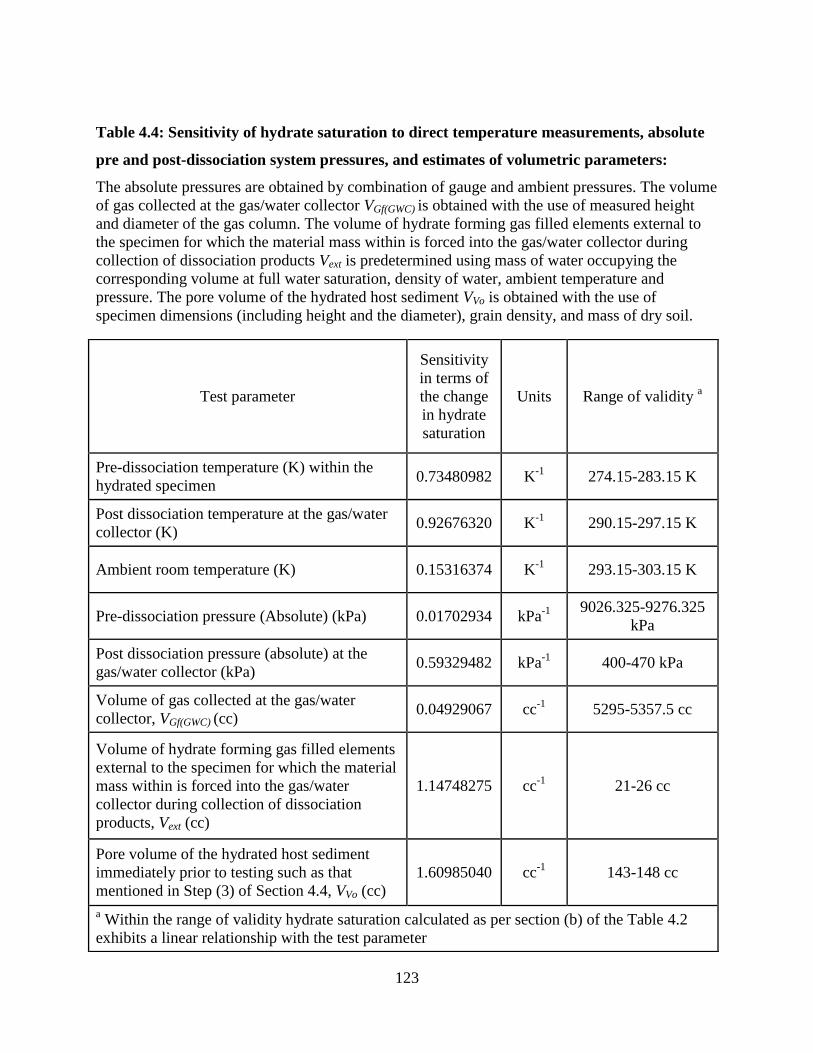
123
Table 4.4: Sensitivity of hydrate saturation to direct temperature measurements, absolute
pre and post-dissociation system pressures, and estimates of volumetric parameters:
The absolute pressures are obtained by combination of gauge and ambient pressures. The volume
of gas collected at the gas/water collector VGf(GWC) is obtained with the use of measured height
and diameter of the gas column. The volume of hydrate forming gas filled elements external to
the specimen for which the material mass within is forced into the gas/water collector during
collection of dissociation products Vext is predetermined using mass of water occupying the
corresponding volume at full water saturation, density of water, ambient temperature and
pressure. The pore volume of the hydrated host sediment VVo is obtained with the use of
specimen dimensions (including height and the diameter), grain density, and mass of dry soil.
Test parameter
Sensitivity
in terms of
the change
in hydrate
saturation
Units Range of validity a
Pre-dissociation temperature (K) within the
hydrated specimen 0.73480982 K
-1 274.15-283.15 K
Post dissociation temperature at the gas/water
collector (K) 0.92676320 K
-1 290.15-297.15 K
Ambient room temperature (K) 0.15316374 K-1
293.15-303.15 K
Pre-dissociation pressure (Absolute) (kPa) 0.01702934 kPa-1
9026.325-9276.325
kPa
Post dissociation pressure (absolute) at the
gas/water collector (kPa) 0.59329482 kPa
-1 400-470 kPa
Volume of gas collected at the gas/water
collector, VGf(GWC) (cc) 0.04929067 cc
-1 5295-5357.5 cc
Volume of hydrate forming gas filled elements
external to the specimen for which the material
mass within is forced into the gas/water
collector during collection of dissociation
products, Vext (cc)
1.14748275 cc-1
21-26 cc
Pore volume of the hydrated host sediment
immediately prior to testing such as that
mentioned in Step (3) of Section 4.4, VVo (cc)
1.60985040 cc-1
143-148 cc
a Within the range of validity hydrate saturation calculated as per section (b) of the Table 4.2
exhibits a linear relationship with the test parameter

124
Table 4.5: Sensitivity of hydrate saturation to the choice of vapour phase EoS under pre-
dissociation conditions at H-V equilibrium
Description Molar volume of methane
(cc/mol)
Hydrate saturation
(%)
CSMGem 210.13 47.7
EoS of Duan et al. [1992b] 206.8594 46.2
Ideal Gas Law 254.1026 60.2
Table 4.6: Sensitivity of hydrate saturation to the choice of vapour phase EoS under post-
dissociation conditions at Lw-V equilibrium
Description Molar volume of methane
(cc/mol)
Hydrate saturation
(%)
Vapour saturated gas phase
using Duan and Mao [2006] 5520.98 44.6
EoS of Duan et al. [1992b] 5486.85 46.2
CSMGem 5523.34 44.4
Ideal Gas Law 5529.29 44.2

125
Table 4.7: Sensitivity of hydrate saturation to the choice of vapour phase EoS at Lw-V
equilibrium for quantity of gas present within such elements external to the immediate
boundaries of the specimen for which the material present within is forced into the
gas/water collector during collection of dissociation products
Description Molar volume of methane
(cc/mol)
Hydrate saturation
(%)
Vapour saturated gas phase
using Duan and Mao [2006] 236.03 46.2
EoS of Duan et al., [1992b] 235.69 46.2
CSMGem 239.33 46.6
Ideal Gas Law 273.29 49.9
126
Chapter Five: Triaxial compression strength of methane hydrate-bearing course granular
media
5.1 Introduction
Of interest to this chapter is the behavior of hydrate-cemented course granular sand under triaxial
compression conditions. An experimental program was carried out with the use of laboratory
reconstituted specimens of 20/30 grading Ottawa sand at an initial void ratio of 0.57
corresponding to a relative density of 72%. One of the objectives of the investigation was to
study the hydrate saturation dependency of strength (defined by the maximum deviator stress)
and stiffness (i.e., initial tangential stiffness defined by the Young’s modulus and secant stiffness
defined by the secant modulus or the Young’s modulus at 50% stress at failure). A set of triaxial
tests under constant mass conditions were carried out (at various hydrate saturations ranging
from 0 to 80%) after consolidation at an effective confining stress of 500 kPa or 1000 kPa. This
allowed investigating the initial effective confining stress dependency of strength and stiffness of
hydrate-bearing soils – which was the second objective of the experimental program. At the time
of triaxial compression, a typical hydrated specimen consisted of hydrate and vapour (i.e. water
saturated gaseous methane) in its pore space. No free water was expected to be present within the
specimens during this stage of the test given the particular hydrate formation method presented
in Chapter 3 was followed. The comparison of the present results with those published in
literature then led to differentiation of behaviour between sediments consisting of cementing
habit of hydrate (as in the case of present research) and sediments consisting of pore filling/load
bearing habit of hydrate (as published in literature). The comparison met the requirements of the
127
third objective of the work – investigating the growth habit dependency of strength and stiffness
of hydrate-bearing sediments.
The Chapter is organised to present geomechanical properties of hydrae-bearing sediments and
their characterization, a literature review of experimental investigations on geomechanical
properties of hydrate-bearing sediments, the present experimental procedure in summery, a
comprehensive analyses of observations, followed by the results including the initial effective
confining stress/hydrate saturation/hydrate habit dependency of strength/stiffness. Based on the
results, the possible grain-scale mechanisms taking place under triaxial compression of hydrate-
cemented soils and the differences in the mechanisms that should be expected for non-cementing
hydrate habits are postulated and discussed.
5.2 Geomechanical properties of hydrate-bearing sediments and the characterisation
Geomechanical properties of hydrate-bearing sediments are greatly altered by the presence of
hydrates. However, the exact nature of hydrate influence on sediment properties is not fully
understood. The geomechanical properties play a major role in determining the short and long
term sediment behaviour related to drilling and methane production, reservoir subsidence, and in
understanding mechanisms that lead to slope instability issues associated with shallow hydrated
sediments. Sediment strength and deformation characteristics under application of loading are
critical inputs for analysis of potential failure around wells [Rustqvist and Moridis, 2007]. The
slides and slumps on the continental slope and rise of South West Africa, slumps on the U. S.
Atlantic continental slope, and submarine slides on the Norwegian continental margin are among
many historical evidence that exhibit a possible connection between hydrate boundaries and geo-

128
hazards [Grozic, 2010]. The possible mechanisms that lead to slope instability in these sediments
include those that are associated with adverse changes in pressure or temperature coursing partial
dissociation of hydrate such as lowering of sea level, increase in ocean temperature, and erosion
or local slumping [Grozic, 2010; McIver, 1982; Nixon and Grozic, 2007; Sultan et al., 2004].
Characterization of the mechanical properties of hydrate-bearing sediments are based on non-
destructive field measurements including seismic and electric methods, direct sampling and
subsequent laboratory measurements of natural hydrate-bearing cores, or laboratory tests on
artificially synthesised hydrate-bearing specimens. The field measurement of seismic and electric
properties are affected by a complex interplay of host sediment properties, pore fluid
consistency, hydrate saturation, distribution and growth habit [Priest et al., 2005, 2009;
Spangenberg and Kulenkampff, 2006]. Direct sampling is significantly affected by alterations to
in-situ stress conditions and hydrate dissociation related issues during sampling and core transfer
[Waite et al., 2009; Yun et al., 2006]. As such laboratory synthesis and subsequent testing of
hydrate-bearing sediments is an important method of gaining fundamental knowledge about
these complex materials provided that host sediment properties, intact hydrate properties,
quantity and the spatial variation of hydrate present within sediment pore space, and the nature of
hydrate and sediment grain interaction are known.
5.2.1 Early investigations of geomechanical properties of hydrate-bearing sediments
The majority of our knowledge of the geomechanical properties of hydrate-bearing sediments is
fairly recent. Sego and Wittebolle [1984] tested the mechanical behaviour of Freon 12 hydrate-
bearing specimens in a modified triaxial cell and demonstrated a remarkable increase in strength
and stiffness in the presence of hydrate.
129
Drained conditions: Following the aforementioned early investigations, Ebinuma et al. [2005],
Hyodo et al. [2007, 2009, 2011], Kuniyuki et al. [2010], Masui et al. [2005, 2008a, 2008b] and
Miyazaki et al. [2008, 2010, 2011] investigated hydrate saturation dependency of stress-strain
behavior including strength properties such as peak strength, Young’s modulus at 50% of the
stress at failure, cohesion, and dilation angle under drained triaxial compression conditions for
methane hydrate-bearing sediments. The aforementioned forms a reasonably comprehensive set
of tests on drained strength contributing to understanding of methane production and reservoir
subsidence related issues of hydrated sediments. The tests were performed on soil specimens
consisting artificially synthesized hydrates from ice-seeding or hydrate pre-mixing methods. The
details of different methods of laboratory hydrate synthesis and their implications on the physical
properties are presented in Chapter 2.
Undrained or constant mass conditions: The understanding of the strength of hydrate-bearing
sediments under undrained conditions (where pore pressure dissipation of incompressible pore
fluid is completely obstructed) and under constant mass conditions (where drainage of pore fluid
including gas and water is completely obstructed but partial pore fluid pressure dissipation due to
compressibility of the free gas occupying the pore space is allowed) are particularly important in
relevance to loading of subsurface strata due to offshore constructions and slope instability
issues. The undrained strength of methane hydrate-bearing sediments was first investigated by
Winters et al. [2002, 2007a] with focus on acoustic, shear strength, permeability, and electrical
resistance properties prior to and after hydrate formation. The study used soil specimens
containing natural hydrates and soil specimens containing artificial hydrates formed in the
laboratory using the partial water saturation method. Their work showed that physical properties
130
greatly depend on the amount of hydrate present in sediment, its distribution within the pore
space, and the concentration at specific locations. The strength of hydrate-bearing specimens was
found to be much higher than that of specimens containing no hydrates [Winters et al., 2002]; the
presence of solid hydrate in pore voids caused dilation with an increase in strength and negative
pore pressure development during undrained shear. The strength (of hydrated sediments formed
by employing partial water saturation method) was further investigated by Ghiassian and Grozic
[2011], who illustrated the hydrate saturation dependency of stress-strain behavior and the excess
pore pressure development under undrained conditions. Yun et al. [2007] also investigated the
hydrate saturation dependency of stiffness and strength for Tetrahydrofuran (THF) hydrate-
bearing specimens under constant mass conditions. However, complete understanding of the
behavior of hydrated sediments during shear deformation under conditions of hindered drainage
has not yet been achieved, further research effort is required.
5.3 Experimental procedure
The experimental procedure consists of several steps:
(1) preparation of hydrate host sediment by dry pluviation of sand;
(2) water saturation of the sand specimen;
(3) ramping up of pore and confining fluid pressures;
(4) consolidation;
(5) partial pore fluid replacement by gaseous methane;
(6) hydrate formation;
(7) shearing under triaxial compression; and
(8) hydrate dissociation and collection of dissociation products.

131
The detailed procedures for Steps (1) through (6) are presented in Chapter 3. The Step (8) is
detailed in Chapter 4 in relevance to dissociation gas evolution measurements method for
hydrate saturation estimation. Therefore, the following is focused on detailing the Step (7) –
shearing under triaxial compression with summary information of the other steps.
20/30 grading Ottawa sand was used to prepare all test specimens of dimensions 13.0 cm in
height and 6.24 cm in diameter at 0.57 initial void ratio, which corresponds to a relative density
of 72%. The sand specimens were completely water saturated and allowed to consolidate under
an effective confining stress of either 500 kPa or 1000 kPa and at a pore water pressure of 9000
kPa. Upon consolidation gaseous methane was introduced into the specimens replacing a pre-
determined volume of pore water. Hydrates were then allowed to form at a temperature of 5oC
and a gas pressure of 9000 kPa. Upon completion of hydrate formation process, the specimens
were subjected to shearing under triaxial compression. The test conditions are given in Table 5.1.
5.3.1 Specimen consistency immediately prior to shearing
Immediately prior to shearing, a typical hydrated soil specimen consisted of hydrate and vapour
(i.e. water saturated gaseous methane) in its pore space.
5.3.2 Shearing at constant mass under triaxial compression conditions
The standard consolidated undrained (CU) test serves as a baseline method for the triaxial
compression testing carried out within the scope of this research. The first stage of the test
involves application of all-round stress with drainage permitted, ensuring the sample is fully
consolidated under the applied all-around stress. This stage refers to the Step (4) of the
132
experimental procedure followed. The second stage of the CU test involves shearing the
specimen by application of deviator stress with no drainage allowed (i.e., under undrained
conditions). This stage refers to the Step (7) of the experimental procedure followed. In the case
of the hydrate-bearing specimens subjected to testing, fully undrained conditions did not exist as
the specimen pore space consisted of considerable amount of free gas, and hence partial pore gas
pressure dissipation was expected due to compressibility of free gas. However, the pore space
constituents were not allowed to change during shearing and therefore, the tests may be
described as performed under constant mass conditions.
Deviator stress was applied at a constant strain rate of 1%/min. The confining fluid pressure was
maintained constant throughout the shearing stage and the confining fluid volume displacement
was recorded facilitating the calculation of specimen volume change during the shearing stage.
The axial load, axial deformation, and the pore fluid (gas) pressure response were also recorded.
The Figure 5.1 presents a schematic diagram of the triaxial apparatus.
Upon completion of shearing, temperature was increased to induce hydrate dissociation and all
dissociation products (gas/water) were collected at a separate gas/water collector. The pressure,
temperature, and volume measurements of the dissociation products were then used to calculate
the hydrate saturations of the respective specimens. The methodology for determination of
hydrate saturation is detailed in Chapter 4. At the end of gas/water collection process, test
specimen was isolated from the gas/water collector and an instant vacuum was applied at the
bottom of the specimen to preserve the features of the failed specimen during subsequent release
of confining pressure, draining of confining fluid, and disassembly of the triaxial cell. Visual
133
observations were then carried out to identify the features such as shear bands. Shear bands were
observed particularly at higher hydrate saturations.
The test specimens for water saturated reference tests were performed following standard
procedure of the CU test. The specimens were prepared by employing the same procedure listed
above for hydrate-bearing specimens except the partial pore fluid replacement by methane
introduction (Step 5), and hydrate formation (Step 6) were omitted. The shearing was performed
under undrained conditions subsequent to consolidation of test specimens at either one of the
initial effective confining stresses; 250 kPa, 500 kPa, and 1000 kPa.
The consolidated undrained/constant mass triaxial compression tests carried out on water
saturated and hydrate-bearing soil specimens are listed with the respective conditions under
which the tests are carried out in Table 5.1.
5.4 Pore fluid pressure response and volume change during undrained shearing of water
saturated soil specimens
5.4.1 Pore fluid pressure response
The change in pore pressure ( u ) caused by the respective changes in the major and minor
principal stresses 1 and 3 are given by the following equation developed by Skempton
[1954].
)]([ 313 ABu (5.1)
134
where da uuu (5.2)
au is the pore pressure development during application of all around confining stress and is
expressed as:
3 Bua (5.3)
du is the pore pressures development during deviatoric loading stage of the test and is
expressed as:
)( 31 BAud (5.4)
In the case of consolidated undrained triaxial test, the shearing stage or the deviator stress
application stage involves shearing of a soil specimen under constant confinement, and hence the
excess pore water pressure development during shearing can be expressed using the equation 5.4
with substitution of constant 3 applicable for the test.
The parameters A and B are known as the Skempton’s pore pressure coefficients and the
B parameter is expressed as follows:
c
v
C
nCB
1
1 (5.5)
135
or
c
v
C
nCB
1 (5.6)
and,
Biot’s effective stress coefficient; c
s
C
C1
sC compressibility of the soil mineral
n porosity of the soil material,
vC compressibility of the pore fluid (water in the case of saturated soil), and
cC compressibility of the soil structure
The B parameter is expressed as presented by equation (5.5) with the assumption of Terzaghi’s
simple effective stress law: u . The B parameter is expressed as presented by
equation (5.6) with the assumption of Biot’s expression for effective stress: u .
The coefficient B greatly depends on the relative compressibility of pore space, soil structure, and
the mineral grains [Bishop and Henkel, 1962]. For water saturated soil, where the relative
compressibility of pore space to soil structure is considered insignificant, the ratio
cv CC / approaches zero. Also, as the relative compressibility of the mineral grains to that of soil
structure may well be considered as negligible, the ratio cs CC / approaches zero. As such the
value of Biot’s effective stress coefficient tends towards unity (1) and so does the
coefficient B . The measured values of the B for the water saturated test specimens WS 250, WS
500, and WS 1000 are given in Table 5.2.

136
The coefficient 3
1A for elastic materials. However, soil material can hardly be described as
elastic. In the case of soil, the coefficient A is reflective of stress-strain behaviour of the soil
structure. A is positive for initially loose packing of particulate material, which are expected to
undergo compression upon deviatoric loading. A is negative for dense dilative material. The
value of Aat a given point on the stress-strain curve also depends on the proportion of failure
stress applied [Bishop and Henkel, 1956; Skempton, 1954]. Therefore, it appears no unique
value of A exists for a given soil material. With relevance to the present study, the Aparameter
for water saturated test specimens was determined experimentally at 5% strain with the use of
measured pore pressure response. The values obtained are presented indicating the dilative
background volumetric behaviour of dense sand (Table 5.2).
5.4.2 Volume change
Theoretically, when incompressible mineral grains and pore water is assumed, water saturated
specimens do not undergo volume change during application of deviatoric stress under undrained
conditions. However, in reality, minute quantity of volume change should be expected, the
accurate measurement of which is generally hindered since the relative magnitude of volume
change compared to the measurement error associated with measuring devices and mechanisms
is not significant.
5.5 Pore fluid pressure response and volume change during shearing of hydrate-bearing
soil specimens under constant mass conditions
As previously mentioned, the hydrate-bearing soil specimens subjected to testing consisted of
hydrate and water saturated gaseous methane in the pore space. Presence of no free water in the
137
pore space should be expected when the specific experimental procedure adopted is considered.
Hence, pore fluid pressure response during shear is referred to pore gas pressure response. Due
to compressibility of the pore space consequential of the presence of free gas, the change in pore
fluid pressure originating in response to shearing should be expected to undergo partial
dissipation. Thus, it is also expected that the hydrate-bearing specimens undergo volume change
in response to shearing.
The analysis of pore fluid pressure response of hydrate-bearing specimens requires appropriate
modifications to Biot’s and Skempton’s B parameters. The theoretical predictions of the
volume change can then be made for hydrate-bearing soils considering volume compatibility of
the constituents (i.e., soil, hydrate, and free gas) within a hydrated soil specimen.
5.5.1 Biot’s effective stress parameter for hydrate-bearing soil
As previously mentioned the Biot’s effective stress coefficient for hydrate-free sediment is
given as c
s
C
C1 , where sC is the compressibility of the soil mineral and cC is the
compressibility of the soil structure (or the skeleton). In the case of hydrate-cemented soils,
appropriate modifications to sC and cC should be considered in the theoretical determination of
Biot’s coefficient.
5.5.1.1 The aggregated compressibility of the solid constituents sC
The compressibility of the soil mineral sC , should preferably be substituted with the aggregated
compressibility of all solid constituents sC (i.e., mineral grains and solid ice like hydrate). In

138
hydrate-cemented soil systems, soil grains and hydrate behave as an aggregated crystal. In this
case, the compressibility of the crystalline aggregate is not accurately represented by the simple
volumetric average of compressibility of the two phases: soil and hydrate. The equation 5.7
expresses the aggregate compressibility according to Hill's [1952] theoretical study on the elastic
behaviour of a crystalline aggregate. Priest et al. [2005] estimates compressional and shear wave
velocities ( pv and sv ) with the use of Hill’s [1952] expression for aggregated compressibility of
hydrate-cemented soil over a range of hydrate saturations. The estimated values of velocity are
found to be comparable with independent measurements of pv and sv performed over the range of
hydrate saturations. This observation proves the applicability of equation 5.7 for hydrate-
cemented soils. The aggregated bulk modulus of the solid constituents sK (which is the inverse
of the aggregated compressibility of the solid constituents sC ) is thus calculated with the use of
Hill’s averaging method as follows facilitating the determination of the compressibility of the
solid phase with the effects of hydrate taken into account.
N
i
N
i i
iii
s
s KK
CK
1
1
12
11 (5.7)
where,
N = number of distinct solid constituents (= 2 including soil mineral and hydrate)
i = the volumetric fraction of the thi constituent in the solid phase and
iK = the bulk modulus of the thi constituent
139
5.5.1.2 The compressibility of the soil skeleton (or the hydrate-cemented solid framework) cC
The compressibility of the soil skeleton is given by the inverse of bulk modulus or the (skeletal
stiffness) of the soil framework cK . The skeletal stiffness cK is generally expressed as follows.
)21(3
1
E
CK
c
c (5.8)
where,
E = Young’s modulus and
= Poisson’s ratio
In hydrate research, the skeletal stiffness cK if often considered to be better represented by
GC
Kc
c)21(3
)1(21
(5.9)
with independent measurements/estimations of shear modulus G .
Santamarina et al. [2010] and Waite el al. [2009] brings into greater attention the fact that G is
dependent upon the sediment’s fabric properties, and the nature of inter-granular contacts.
Particularly, in the presence of hydrate, G becomes significantly dependent on the degree of
hydrate saturation and the pore scale hydrate habit. In the case of sediments where the hydrate
formation cements the sediment grains at the grain contacts, as in the case of specimens

140
subjected to testing under present research, hydrate formation becomes the primary control of
G and therefore of the skeletal stiffness [Dvorkin et al, 2000]. As such the ability to accurately
determine G is immensely important in determining the compressibility of the solid (soil-
hydrate) framework of hydrate-cemented soils. Often, the use of acoustic wave speed
measurements is suggested. The shear modulus G is related to shear wave velocity sv as follows
[Priest et al., 2005; Santamarina et al., 2010].
Gvs (5.10)
where,
= mass density of the soil-hydrate medium
However, it should be noted that according to Lambe and Whitman [1979], the shear modulus
G obtained for small strain conditions as aforementioned provides only an upper bound to the
value of G applicable to large strain conditions.
Nevertheless, the measurement of acoustic properties of hydrate-bearing soils, remains beyond
the scope of the present research. Therefore the compressibility of the solid framework, cC was
determined using the equation 5.8.
The Poisons ratio can be evaluated from the measured axial and lateral strains during deviator
stress application stage of the triaxial compression test. Since, lateral strain measurements were

141
not performed as a part of laboratory testing of the present research, an approximated value of
2.0 was used in the aforementioned calculation of Biot’s coefficient. This assumption is
based on the observation of Lambe and Whitman [1979] that the Poisson’s ratio varies with
strain and typically has values of about 0.1 to 0.2 during early stages of loading of sand
associated with elastic deformation.
The Biot’s coefficient for the test specimens was therefore, determined with (1) the aggregated
compressibility of the solid constituents sC determined from equation (5.7) and (2) the
compressibility of the solid framework cC determined using the equation (5.8) with the use of
experimentally obtained E and the approximated value of (=0.2). The calculated values of
Biot’s coefficient are presented in the Table 5.3. The typical values of constituent
compressibility used with equation 5.7 are presented in Table 5.4(a) and (b).
5.5.1.3 An effective stress law for hydrate-bearing soils
The calculated values of Biot’s coefficient for hydrate-bearing soils range between 0.947 and
0.996. Therefore, the effective stress coefficient for hydrate-bearing soils can well be
approximated to unity (1). As a result, the Terzaghi’s simple effective stress law is applicable for
tested hydrate-bearing soils.
gu (5.11)
142
where,
= effective stress
= total stress and
gu = the pore gas pressure
5.5.2 Pore pressure coefficient B for hydrate-bearing soil
The pore pressure coefficient B can be determined with the use of Biot’s effective stress
coefficient as determined in the previous section and the compressibility of the solid
framework cC determined using the equation (5.8) upon appropriate modifications to
compressibility of the pore fluid vC to represent hydrate-bearing soil. The hydrate-bearing soil
specimens subjected to testing in the present study consisted of solid hydrate and free gaseous
methane in the pore space. As mentioned in relation to determination of the Biot’s coefficient,
the hydrate is considered as a solid constituent. Therefore, the pore space compressibility is
determined solely by pore gas compressibility gC and is expressed as follows.
ggv SCC (5.13)
where;
P
V
VC
g
g
g
1 at constant temperature T ; denotes change in gas volume gV or pressure P
and gS degree of gas saturation
143
The gas compressibility value used in the calculations is given in Table 5.4(c).
The definition of porosity n of the hydrate-bearing soil material in relevance to determination of
B should also be modified accordingly to include free gaseous methane as the only pore space
constituent and is expressed as follows.
gHs
g
VVV
Vn
(5.13)
The calculated values of coefficient B are presented in the Table 5.5. It can be seen that the
values of B obtained for hydrate-bearing soils are significantly low and are governed by the high
compressibility of the pore space occupied by gaseous methane.
5.5.3 Pore pressure coefficient A for hydrate-bearing soils
The Skempton’s pore pressure coefficient A for the tested specimens can be calculated using the
pore fluid pressure measurements performed during deviatoric loading. For specimens at low
hydrate saturations (< 40%), the coefficient was calculated at 2-5% strain in order to capture the
pore pressure development behaviour prior to reaching at maximum deviator stress. The values
are presented in Table 5.6.
As will be discussed later in Section 5.7.4, the maximum deviator stress and the pre-peak stress-
strain behaviour obtained for specimens with high hydrate saturations (> 40%) do not reflect the
properties of the soil medium under the applied loading and boundary conditions, but are
considerably affected by hydrate strength. The properties of the soil medium, specifically,
144
negative pore pressure development indicating dilative background volumetric tendency are
apparent only in the post-peak region at these hydrate saturations. Also, the corresponding
deviator stress response in the post-peak region, is not representative of the pore pressure
response and its resultants (i.e. development of negative pore pressure, increase of effective
stress, and increase of frictional resistance to shearing) as further hydrate breakage/de-bonding
related loss of cohesion is greater than any increase in frictional resistance. The resultant is a net
decrease in deviator stress. Therefore, the calculation of A parameter either as applicable to pre-
peak region or as applicable to post-peak region for the specimens consisting of high hydrate
saturations is apparently not meaningful.
In overall, the discussion of pore fluid pressure response of hydrate-bearing soils provided in
Sections 5.5.1, 5.5.2, and 5.5.3 can be summarized as follows. In general, for a material whose
background volumetric tendency is dilative, a deviator stress increment under undrained/constant
mass conditions causes a negative pore pressure change and hence the net pore pressure reduces
upon further deviator stress increase. However, in the presence of free gas when the medium is
associated with a low B value as in the case of our hydrate-bearing specimens, the Skempton’s
equation (Equation 5.4) for pore pressure generation suggests development of smaller negative
pore pressure change upon application of deviator stress increment, relative to the case of a
specimen consisting of no free gas. Volume expansion should then be expected as the medium
does not generate an increment of effective stress adequate to prevent volume expansion during
deviatoric loading. Hindered negative pore pressure development and associated hindered
development of effective stress may eventually lead to strain softening of deviator stress as less
and less resistance to shearing is developed as the shearing continues.

145
Some evidence can be found in gas hydrate literature: according to Winters et al. [2007] the
presence of free gas within the pore space during constant mass shear is reported to greatly
reduce the tendency for negative pore pressure development of hydrate-bearing sediments
resulting in decreased shear strength development; Yun et al.[2007] also suggests possibility of
specimen volume expansion due to inadequate pore space water saturation as associated with
observed larger lateral strains in triaxial compression of their hydrated soil specimens at constant
mass.
5.5.4 Experimental measurement of volume change in response to shearing
The total specimen volume change during the shearing stage of the consolidated undrained
triaxial test can be measured by means of tracking the volume displacement of the confining
fluid (water). Specifically, the calculation can be performed taking into consideration (1) the
fluid volume received by the cell pressure intensifier in the event of specimen volume expansion
or (2) the fluid volume pushed out from the cell pressure intensifier into the confining cell
surrounding the soil specimen in the event of specimen volume reduction. A correction should be
made to the calculated volume change for volume of fluid displaced into the cell pressure
intensifier due to intrusion of the axial loading ram into the triaxial confining cell during
application of deviator stress. However, in relevance to testing of hydrate-bearing specimens, the
accurate measurement of volume change is hindered due to existence of many obstacles
including temperature variations/gradients within the confining fluid volume tracking system,
possible gas migration through membranes surrounding the soil specimen, and creep in the
triaxial confinement cell etc. Therefore, the volume change measurements performed during the
present research was considered as of low reliability and was exempted from the subsequent
146
analysis of the test results. The following methods are recommended for volume change
measurements to address the aforementioned challenges with respect to hydrate-bearing soils.
(a) Direct measurement of strain using axial and lateral strain gauges – Despite the difficulty
in fixing suitable deformation indicators due to low strength of soil specimens [Bishop
and Henkel, 1962], the use of axial strain gauges and multiple lateral measurement
gauges to capture non uniform strains resulting from end resistance can be employed to
obtain a specimen volume change measure independent of uncertainties related to that
obtained by tracking the confining fluid displacement.
(b) Use of digital imaging techniques – Imaging technology such as those suggested by
Macari et al. [1997] presents a way of eliminating limitations such as those related to
measuring radial strains with strain gauges placed at discrete points (commonly at the
middle, at a third, and at two thirds along the height of the specimen) and later use of
averaging methods to correlate the deformation measured at discrete points to that of total
specimen. The method of Macari et al. [1997] involved video recording of a soil
specimen throughout a triaxial test using two cameras placed to capture perpendicular
view of specimen, selection of discrete individual images for further analysis, and
computer aided volume estimation. Application of proper correction for magnification
due to presence of confining fluid in the line of vision between the specimen and the
video camera was also considered.
5.5.5 Predicting volume change response to shearing for hydrate-bearing soil
The specimen volume change during shearing can be calculated considering the volume
compatibility for a hydrated soil specimen. The following inputs are required for the calculation:
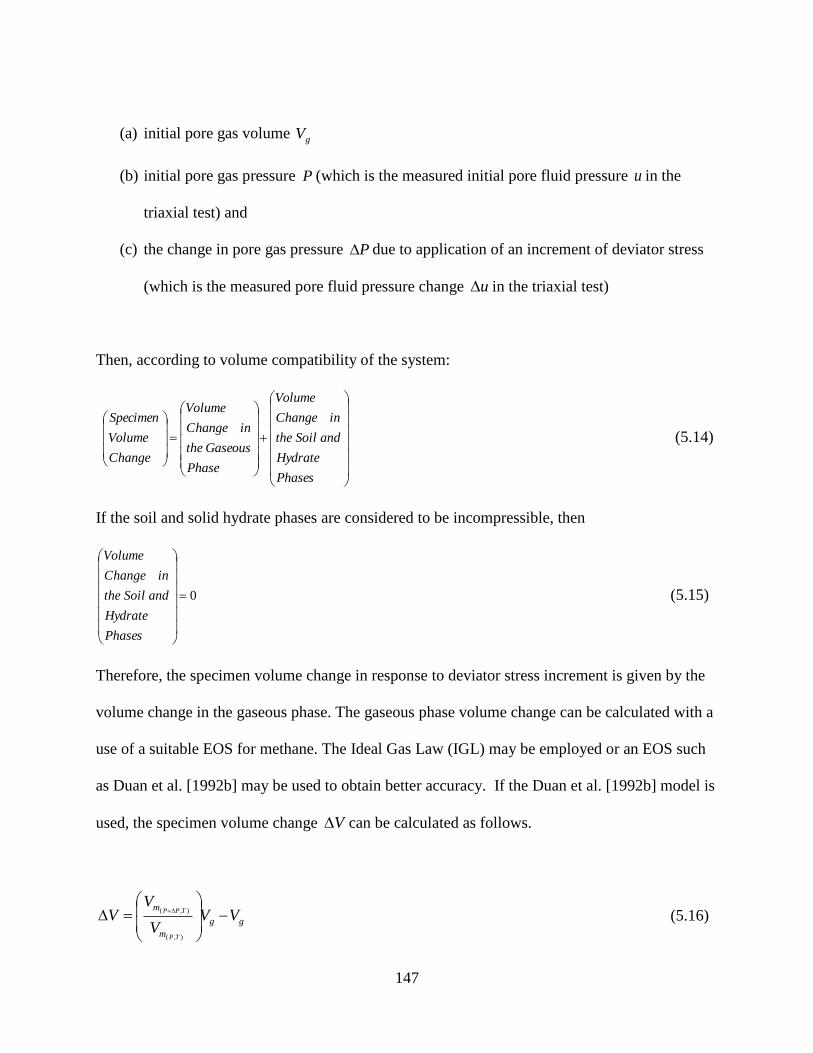
147
(a) initial pore gas volume gV
(b) initial pore gas pressure P (which is the measured initial pore fluid pressure u in the
triaxial test) and
(c) the change in pore gas pressure P due to application of an increment of deviator stress
(which is the measured pore fluid pressure change u in the triaxial test)
Then, according to volume compatibility of the system:
Phases
Hydrate
andSoilthe
inChange
Volume
Phase
Gaseousthe
inChange
Volume
Change
Volume
Specimen
(5.14)
If the soil and solid hydrate phases are considered to be incompressible, then
0
Phases
Hydrate
andSoilthe
inChange
Volume
(5.15)
Therefore, the specimen volume change in response to deviator stress increment is given by the
volume change in the gaseous phase. The gaseous phase volume change can be calculated with a
use of a suitable EOS for methane. The Ideal Gas Law (IGL) may be employed or an EOS such
as Duan et al. [1992b] may be used to obtain better accuracy. If the Duan et al. [1992b] model is
used, the specimen volume change V can be calculated as follows.
gg
m
mVV
V
VV
TP
TPP
),(
),(
(5.16)

148
where,
),( TPmV = molar volume of methane at initial pore gas pressure P and temperature T (obtained
from Duan et al. [1992b] EOS)
),( TPPmV
= molar volume of methane at pore gas pressure PP and temperature T (obtained
from Duan et al. [1992b] EOS)
5.6 Undrained response of water saturated specimens –observations and analysis
5.6.1 Typical behaviour of undrained water saturated specimens
The typical undrained behaviour of dense saturated sand under triaxial compression is
characterised by the following features:
(a) strain hardening of deviator stress in response to shear;
(b) initial effective confining stress dependency of deviator stress at failure – greater the
initial effective confining stress, the and higher the deviator stress at failure; and
(c) initial effective confining stress dependency of excess pore pressure development –
greater the initial effective confining stress, the higher the initial positive pore pressure
response (contractive volumetric tendency), and the smaller the later negative pore
pressure response (dilative volumetric tendency).
Undrained shearing of saturated sand ultimately results in arriving at a steady state characterised
by deformation at constant stresses, volume, and velocity [Poulos, 1981; Castro et al., 1982].
Dense (dilative) materials initially develop positive excess pore pressure (indicative of
contraction tendency); then reach at a point of maximum pore pressure (point of phase

149
transformation); and undergo reduction of pore pressure afterwards (indicative of dilative
tendency) as the steady state is reached at large strains [Negussey et al., 1987]. This behaviour is
illustrated in Figure 5.2. The point of phase transformation can also be characterised as the point
at which the stress path turns its direction in qp space.
5.6.2 Observations and analysis of undrained response of water saturated specimens
The features of the observed behaviour of the specimens tested are presented in Table 5.7.
The undrained triaxial compression behaviour of water saturated sand specimens subjected to
testing are representative of a dense packing of particulate granular material (Figure 5.3). The
deviator stress response to constant rate strain (1%/min) illustrates stain-hardening behaviour. At
all three effective confining stresses (250 kPa, 500 kPa, and 1000 kPa) phase transformation
occurs very early during loading (at axial strains < 1%). Upon phase transformation, the shear
resistance continues to increase as the development of negative pore pressures lead to increased
effective stress. Failure occurs at strains between 10-13% in all cases. The tests yield a mobilised
friction angle of 31.51o at the maximum deviator stress (Figure 5.3). At higher initial effective
confining stresses, the specimens develop greater secant (50E ) and initial tangential stiffness
(Table 5.7).
The pore fluid pressure response is representative of dense material of which the background
volumetric tendency is dilative. Close observation of the pore pressure development allows
identification of potential signs of dissolved gas exsolution from pore water such as the drop in
the rate of negative pore pressure development (Figure 5.3) initiating between 5-7% axial strains.
The crossing of excess pore pressure curves may have resulted from the differences in the degree
150
of gas exsolution between the specimens, and the resulting differences in the negative pore
pressure development. The tests were conducted at initial back pressures of 1050 kPa, 1050 kPa,
and 1070 kPa at respective effective confining stresses of 250 kPa, 500 kPa, and 1000 kPa.
Apparently, the imposed initial back pressure was insufficient to prevent dissolved gas
exsolution at all negative pore pressures that developed for the test specimens at the respective
density and initial confining stress. Therefore, the negative pore pressure response at larger
strains was omitted from further analysis.
Consequently, it is difficult to determine if the observed mild softening of deviator stress at
larger strains (Figure 5.3) occurring associated with the reduced rate of negative pore pressure
development is indicative of the material reaching at a steady state or is resulting from a mere
counter-effect of reduced negative pore pressure development. When free gas is present within
the pore space (due to gas exsolution), resulting in B values between zero (0) and unity (1), the
Skempton’s equation suggests development of smaller negative pore pressure change relative to
the case of fully saturated soils upon application of deviator stress increment. Hindered negative
pore pressure development and associated hindered development of effective stress can
eventually lead to strain softening of deviator stress as less and less resistance to shearing is
developed as the shearing continues. Therefore, there exists little confidence with regard to using
the end of test state of the tests to derive the steady state friction angle which is considered a
material parameter constant for a given sand [Negussey et al., 1987]. However, it is shown
experimentally (Figure 5.4) that the friction angle mobilized at undrained phase transformation
and the friction angle mobilized at steady state are identical [Negussey et al., 1987]. Therefore, a
steady state friction (or friction at phase transformation) represented by an angle of 24.21o was
151
obtained for the sand using the measurements at phase transformation (Figure 5.5). The findings
of the analysis of the behaviour of the water saturated specimens are summarised in Table 5.8.
To eliminate dissolved gas exsolution in the case of undrained tests on dense material, where
negative pore pressure development is expected, the initial pore water pressure and the confining
pressure under which shearing initiates should be obtained by incrementing the back pressure
and confining pressure adequately beyond the pressures at which back pressure saturation is
carried out upon completion of a successful B-Test. During the increment of back pressure and
confining pressure, the effective confinement may be kept constant; further consolidation of the
specimen may be carried out at the final pressures if the effective confinement is allowed to
change during pressure increment. It is also recommended to flush carbon dioxide gas through
the specimen before flushing de-aired water during specimen saturation stage in order to obtain
better pore saturation.
5.7 Response of hydrate-bearing specimens to shearing under constant mass -
observations and analysis
The observations made on the stress-strain behaviour of the hydrate-bearing specimens tested are
presented under three headings; (1) response of hydrate-bearing specimens at low hydrate
saturations (< 40%) consolidated at 500 kPa initial effective confining stress, (2) response of
hydrate-bearing specimens at low hydrate saturations (< 40%) consolidated at 1000 kPa initial
effective confining stress, and (3) response of hydrate-bearing specimens at high hydrate
saturations (> 40%). The 40% limit of hydrate saturation for distinguishing the behaviour is
selected upon careful evaluation of overall observations. Particularly, strength (the maximum

152
deviator stress) dependency on hydrate saturation starts showing lack of correlation and scatter
around hydrate saturation of 40%. The features of the observed behaviour of the specimens
tested are presented in Table 5.7.
At set values of host specimen void ratio of dense packing, initial effective confining stress, and
pore fluid pressure (i.e., gas pressure in the case of present study), the strength-deformation
behaviour of hydrate-bearing cemented specimen under constant mass conditions is
differentiated from the behaviour of the water saturated non-hydrated host specimen under
undrained conditions mainly by three factors: (1) compressibility of the pores space relative to
that of water saturated non-hydrated specimen, (2) cementation of soil grains due to the presence
of hydrate at mineral grain contacts, and (3) densification of the soil material due to hydrate pore
space occupancy.
The effects of relative pore space compressibility were discussed previously (Section 5.5.2) and
can be summarized as (a) the presence of free gas within pore space of hydrate-bearing soil
resulting in a low value for Skempton’s pore pressure coefficient B , (b) development of smaller
negative pore pressure change and hence hindered effective stress development compared to
water saturated non-hydrated specimen upon application of deviator stress increment, (c) volume
expansion of the hydrate-bearing specimen as the medium does not generate an increment of
effective stress adequate to prevent volume expansion during deviatoric loading, and (d)
hindered development of effective stress leading to strain softening of deviator stress at larger
strains as less and less resistance to shearing is developed as shearing continues.
153
The effects of grain cementation due to presence of hydrate are particularly visible in the form of
greater stiffness and tendency for aggregate scale dilation [Waite et al., 2009 after Yun et al.,
2007]. Under constant mass conditions, tendency for aggregate scale dilation results in greater
tendency for development of negative pore pressure – an opposite effect to which is resulting due
to pore space compressibility.
The effects of densification due to pore space presence of hydrate should be expected to be
visible in the form of greater strength compared to a water saturated non-hydrated specimen, and
increased dilative volumetric tendency [Waite et al., 2009 after Yun et al., 2007] resulting in
greater negative pore pressure development upon application of deviator stress increment under
constant mass conditions – an opposite effect to which is resulting due to pore space
compressibility.
The grain scale model for shear strength of hydrate-bearing sediments presented in Waite et al
[2009] modified after Yun et al. [2007] (Figure 5.6) presents the aforementioned graphically.
Experimental evidence for aforementioned can also be found in Winters et al. [2002, 2007] and
Ghiassian and Grozic [2011].
5.7.1 Observations of hydrate-bearing sediment behaviour in summary
The initial effective confining stress/hydrate saturation dependency of strength/stiffness observed
in the stress-strain response of the hydrate-bearing specimens tested under triaxial compression
are characterized by the following features.

154
(a) The specimens at hydrate saturation < 40% exhibit:
strain hardening response to shear (with mild softening at larger strains);
smaller initial positive pore pressure response (contractive volumetric tendency)
compared to water saturated non-hydrated specimens, and tendency for positive
pore pressure development decreasing with increasing hydrate saturation;
smaller or similar rate of later negative pore pressure development compared to
water saturated non-hydrated specimens (dilative volumetric tendency) , and
tendency for negative pore pressure development increasing with hydrate
saturation;
increased strength (maximum deviator stress) at higher initial effective confining
stress;
greater initial tangential stiffness at greater initial effective confining stress, lack
of correlation between secant stiffness and initial effective confining stress; and
increased strength and stiffness with increasing hydrate saturation.
(b) The specimens at hydrate saturations > 40% exhibit:
brittle behaviour in stress-strain response;
significantly higher peak stress and initial tangential stiffness and secant stiffness
relative to the tests performed at low saturations; and
lack of clear correlation of peak stress and stiffness with initial effective confining
stress and hydrate saturation.
The following sections discuss the behaviour listed above in detail.
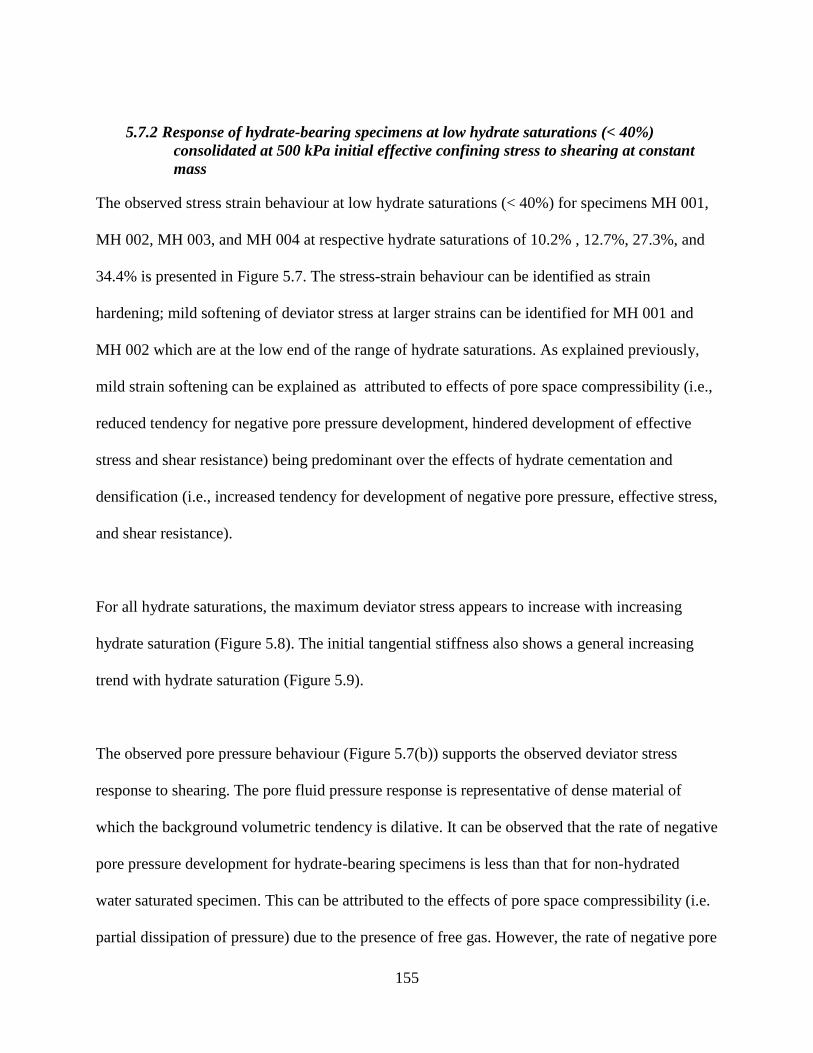
155
5.7.2 Response of hydrate-bearing specimens at low hydrate saturations (< 40%)
consolidated at 500 kPa initial effective confining stress to shearing at constant
mass
The observed stress strain behaviour at low hydrate saturations (< 40%) for specimens MH 001,
MH 002, MH 003, and MH 004 at respective hydrate saturations of 10.2% , 12.7%, 27.3%, and
34.4% is presented in Figure 5.7. The stress-strain behaviour can be identified as strain
hardening; mild softening of deviator stress at larger strains can be identified for MH 001 and
MH 002 which are at the low end of the range of hydrate saturations. As explained previously,
mild strain softening can be explained as attributed to effects of pore space compressibility (i.e.,
reduced tendency for negative pore pressure development, hindered development of effective
stress and shear resistance) being predominant over the effects of hydrate cementation and
densification (i.e., increased tendency for development of negative pore pressure, effective stress,
and shear resistance).
For all hydrate saturations, the maximum deviator stress appears to increase with increasing
hydrate saturation (Figure 5.8). The initial tangential stiffness also shows a general increasing
trend with hydrate saturation (Figure 5.9).
The observed pore pressure behaviour (Figure 5.7(b)) supports the observed deviator stress
response to shearing. The pore fluid pressure response is representative of dense material of
which the background volumetric tendency is dilative. It can be observed that the rate of negative
pore pressure development for hydrate-bearing specimens is less than that for non-hydrated
water saturated specimen. This can be attributed to the effects of pore space compressibility (i.e.
partial dissipation of pressure) due to the presence of free gas. However, the rate of negative pore

156
pressure development has generally increased with increasing hydrate saturation (except in the
case of MH 004).This is explained by the increasing degree of difficulty against volumetric
deformation caused by hydrate densification taking place with increasing hydrate saturation
becoming more predominant (resulting in a material of greater dilative volumetric tendency)
over the pore space compressibility effects. The test MH 004 later develops a higher rate of
negative pore pressure development representative of its higher hydrate saturation compared to
the other tests. The initial behaviour of the test may have originated from a specimen specific
irregularity.
In all cases, the hydrate-bearing specimens show insignificant positive pore pressure response
compared to the water saturated non-hydrated specimens at the beginning of the deviatoric
loading stage (corresponding to the contractive volumetric tendency), indicating that hydrate has
stiffened the soil skeleton.
5.7.3 Response of hydrate-bearing specimens at low hydrate saturations (< 40%)
consolidated at 1000 kPa initial effective confining stress to shearing at constant
mass
The observed stress strain behaviour at low hydrate saturations (< 40%) and 1000 kPa initial
effective confining stress for specimens MH 005, and MH 006 at respective hydrate saturations
of 22.6% and 38.8% are presented in Figure 5.10. It should be noted that the actual pore pressure
response of test MH 006 is unknown due to connectivity issues originating from hydrate
plugging of connection tubing between specimen pore space and the pressure measuring device
(the pore gas pressure during the shearing stage of the test was measured with a transducer
157
connected and placed closely to the top cap of the triaxial specimen). Behaviour similar to that of
specimens consolidated at 500 kPa initial effective confining stress is observed with (a) strain
hardening with mild softening at larger strains resulting from damping of negative pore pressure
due to pore space compressibility, (b) lower tendency for initial positive pore pressure
development representative of hydrate stiffened soil skeleton of low contractive volumetric
tendency, and (d) later pore fluid pressure response representative of dilative volumetric
tendency (Figure 5.10). The maximum deviator stresses occur at strains between 9-11%. The
hydrate saturation dependency of the deviator stress at failure (Figure 5.8) and stiffness (Figure
5.9) are observed, indicating higher strength and stiffness at higher hydrate saturations. The
initial rate of later negative pore pressure development of MH 005 is apparently equal to that of
the water saturated non-hydrated soil specimen which is an indication of hydrate cementation
and densification effects being predominant over the pore space compressibility effects at the
particular hydrate saturation.
Comparison of maximum deviator stress and stiffness of these tests with the respective
parameters obtained for those consolidated at 500 kPa initial effective confining stress indicates
the initial effective confining stress dependency of strength (Figure 5.8) and stiffness (Figure
5.9). Greater strength (maximum deviator stress at failure) and initial tangential stiffness is
obtained at higher initial effective confining stress.

158
5.7.4 Response of hydrate-bearing specimens at high hydrate saturations (> 40%) to
shearing at constant mass
The maximum deviator stress and stiffness of specimens containing hydrate saturations > 40%
are in general significantly higher than that of specimens with low saturations. The characteristic
feature of stress-strain behaviour at these saturations is the brittle behaviour shown by most of
the specimens (MH 008, MH 009, MH 010, MH 011, MH 012, and MH 013) with strain
softening of deviator stress occurring subsequent to arriving at a peak stress (Figure 5.12, Figure
5.13, Figure 5.14, Figure 5.15, Figure 5.16, and Figure 5.17). Over the range of hydrate
saturation > 40%, moderate to high negative pore pressures are developed during shearing
compared to the previous cases; generally, larger negative pore pressures are developed at higher
hydrate saturations as should be expected due to hydrate cementation and densification. The
maximum rate of negative pore pressure response is generally reached after the peak in deviator
stress.
Neither the maximum deviator stress nor the stiffness show a clear correlation with hydrate
saturation or the initial effective confining stress (Figures 5.8 and 5.9). It is, however, interesting
to note that the residual/ultimate strength of tested specimens (Figure 5.18) generally falls within
a strength band of positive gradient showing a general increase in residual/ultimate strength with
hydrate saturation. It can be hypothesised that the lack of correlation of peak strength with
hydrate saturation is originating from factors such as non-uniformities in spatial distribution of
hydrate, and whether the failure takes place following hydrate breakage or hydrate-mineral de-
bonding (which is determined by the relative magnitude of intact strength of hydrate and hydrate
–mineral bonding strength). Both intact hydrate strength and hydrate-mineral bonding strength
159
are complex functions of many variables including the properties of the mineral substrate,
hydrate former, P/T conditions at which hydrate formation is carried out, and hydrate habit etc.
[Hyodo et al., 2002; and Jung and Santamarina 2011]. Therefore, the strength behaviour
becomes difficult to predict with the knowledge of hydrate saturation alone.
Irrespective of lack of correlation seen, the observed behaviour (i.e., brittle failure followed by
reaching at a residual strength which is generally increasing with hydrate saturation) can be
explained as related to peak strength being determined by intact hydrate strength and/or hydrate-
mineral bonding strength at these hydrate saturations [Yun et al, 2007]. As can be seen in the
case of many specimens, the peak strength is generally reached after initial positive pore pressure
development (indicative of contract volumetric tendency) and some negative pore pressure
development (indicative of dilative volumetric tendency) eventually causing hydrate breakage or
de-bonding. Hydrate breakage or de-bonding (at peak) results in sudden loss of cohesion which
is visible in the form of an abrupt drop in strength. Hydrate de-bonding at the hydrate-grain
interface (interface shearing) should be expected to result in greater dilative volumetric tendency
than in the case of hydrate breakage (or hydrate shearing). A graphical presentation of the
aforementioned can be found in Figure 5.6 after Waite et al. [2009]. Most of our tests for which
the pore gas pressure measurement is available (MH 009, MH 010, MH 011 and MH 013) show
a further increase in the rate of negative pore pressure development corresponding to greater
dilative volumetric tendency at the respective strains in the post-peak region. The rate of
negative pore pressure development reaches a peak at 2%, 2.6%, 1.4%, and 4.7% strain for the
aforementioned specimens respectively. Therefore, it is possible to expect hydrate-mineral de-
bonding to take place rather than hydrate breakage under the corresponding test P/T conditions

160
and surface properties of Ottawa sand used for testing. However, verification of the
aforementioned awaits technology development such as integration of grain scale visual imaging
techniques into triaxial testing.
The increased tendency for negative pore pressure development observed in the post-peak region
may also be viewed as an attempt to overcome naturally present grain interlocking and hydrate
added resistance to deformation. The strength of soil material is a combination of cohesive
resistance and effective stress dependent frictional resistance. The aforementioned tendency for
negative pore pressure development (in the post-peak region) resulting in greater effective stress,
however, is aligned with reduction of strength as previously mentioned. The observation can be
explained as increased frictional resistance due to increased effective stress being not adequate to
overcome loss of cohesive strength resulting from hydrate de-bonding. However, as clearly
visible in the case of specimen MH 013 (Figure 5.17), continuous development of frictional
strength later overcomes the loss of cohesive strength resulting in overall strength regain.
Further as our specimens are consisting of free gas in the pore space, development of negative
pore pressure adequate to prevent volume change is hindered. Therefore the specimens overcome
resistance to deformation leading to failure, reaching at residual strengths and development of
shear planes.
Shearing could be expected to generate heat due to frictional resistance causing localized
dissociation of hydrates at the respective sliding planes. However, the measured global P/T
conditions associated with the series of hydrate-bearing tests indicated that the specimens
161
remained within the hydrate stability zone for methane-water system throughout application of
deviatoric loading. Whether the amount of frictional heat generated under the respective P/T
conditions and deformation rates is adequate to initiate hydrate dissociation would be an
interesting subject for future research and integration of new technologies such as thermal
imaging to obtain visual evidence of such behaviour is recommended. Although little evidence is
found in literature on frictional melting of hydrates, such evidence is available on frictional
melting of water ice-which is considered a close analogy for hydrates. It is shown that the
quantity of frictional heat and resultant melting is deformation rate and temperature dependent
[Bowden and Tabor, 1950; Evans et al., 1976; Marmo et al., 2005]. Upon generation of such
frictional heating, continuous hydrate dissociation is not expected as hydrate dissociation is an
endothermic process which results in temperature reduction in the locality leading to self-
preservation of hydrate. Localized hydrate dissociation may initially produce a lubricating effect
at the shearing surface. Also, it may partially reduce the greater dilative volumetric tendency
existing in the presence of hydrate and could be considered as a secondary reason for reduced
later tendency for negative pore pressure development. The ultimate/residual strength is
apparently representative of the hydrate saturation (Figure 5.18). The residual strength generally
increases with hydrate saturation.
Detection of frictional heat generation as mentioned above originates with the early observations
of Bowden and Tabor [1959] which demonstrated that small sparkling points of light occurred at
the interface between glass or quartz surfaces sliding relative to each other in the dark. This is
recognized as due to friction between grains generating heat [Loung, 1986] and the technique,
infrared thermography, a non-destructive method of observing the energy dissipation ability of

162
granular material is used successfully to detect heat generated by friction between grains of
sheared sand [Luong,1896; Luong, 2007]. The method has been used most successfully at stress
states beyond the characteristic state for drained shearing under application of cyclic or vibratory
loading. In the case of triaxial compression test, the characteristic state refers to the stress state at
which the transformation in deformation mechanism from compression to dilation takes place for
a granular assembly of grains which is also characterised by zero rate of change in volumetric
strain under drained conditions. “Within the subcharacteristic domain below the characteristic
threshold” (characteristic state), “the intergranular contacts remain stable” and continuous
loading causes small slip and greater “entanglement” and “tightening of constituent grains”
resulting in relatively small quantity of heat generation [Luong, 2007]. However, beyond the
characteristic state, the “intergranular contacts become unstable, leading to significant sliding
caused by interlocking breakdown” and significantly large quantities of frictional heat is
dissipated [Luong, 2007]. The application of the method under monotonic loading and constant
mass conditions as relevant to the present research is not documented; however, it would be
interesting to investigate the possible use of this technology as relevant to testing of present
study since it would provide visual evidence of hydrate dissociation due to frictional heat
suggested above.
5.7.5 End of test visual observations of test specimens
Visual observations of the specimens were performed at the end of each test to identify modes of
failure. These observations provided evidence of shear banding for the tests MH 008, MH 009,
MH 010, MH 012, and MH 013. The photographs of the sheared specimens or deformation band
scars left on the membranes are presented in Figure 5.19. A vacuum was applied at the bottom of

163
the specimens in order to preserve the features of the deformed specimen, immediately prior to
releasing the confining pressure at the end of respective tests. The photographs were taken once
the confining cell was removed. Shear banding provides evidence of volume change during
constant mass shearing of the test specimens. Slight increase in strength observed towards the
end of certain tests (as in the case of MH 009) may be attributed to failure mode resulting in
restricted movement of failed soil wedge (Figure 5.19 (b)).
The measured inclination of the shearing plane ( ) to the direction of minor principal stress
varied approximately from 54o to 65
o. With the assumption of the classical Mohr-Coulomb
solution for the orientation of the failure plane, the mobilised friction angle ( ) for the respective
specimens can be calculated using the relation 2/45 o . The obtained values of mobilised
friction angle that vary between 18 and 40 are presented in Table 5.9. However, it should be
noted that only limited information of the specimen deformation mechanism can be obtained
from end of test visual observations. Use of technology such as Computer Tomographic (CT)
scanning when performed at multiple stages during loading allows obtaining greater details of
initiation and development of strain localisation [Alshibli et al., 2006; and Kneafsey el al., 2010].
Use of scanning electron microscopy (SEM) can further deepen the investigation allowing
identification of grain scale features within and in the vicinity of deformation zones [Sulem and
Outfroukh, 2006]. However, integration of these technologies (particularly SEM) with hydrate-
bearing soil testing systems awaits further technological advancement mainly due to
requirements of maintaining P/T conditions suitable for ensuring hydrate stability.

164
5.8 The stress path plots
5.8.1 The definition of stress path
“A stress path is a locus of points of maximum shear stress experienced by an element in going
from one state of stress to another” [Lambe, 1967]. When the effective stress path is considered,
the maximum shear stress q is given by 2/)( 31 q at the stress state 2/)( 31 p . An
illustration is provided in Figure 5.20 with an explanation of the integration of the Mohr-
Coulomb failure criterion in the qp space. The presentation of our test data in the qp space
further highlights the differences in stress-strain behaviour between water saturated sand
specimens and hydrate-bearing specimens. It also provides direction for future research to further
our understanding of hydrate-bearing soils.
5.8.2 qp plots for hydrate-bearing specimens
The qp plots where 2/)( 31 q and 2/)( 31 p , for all test specimens are
provided in Figure 5.21 categorised using the initial effective confining stress and hydrate
saturation. The specimens with relatively higher hydrate saturation generally marks higher shear
strength at failure (denoted by solid green circles of Figure 5.21(a)). The hydrate saturation
appears to increase the density of the granular packing resulting in higher strength.
The dashed blue line represents the steady state obtained using the conditions at phase
transformation for the water saturated reference tests performed at the corresponding initial
effective confining stress. The dashed red line represents the Mohr-Coulomb failure criterion for
the non-cohesive water saturated sand specimens. The gradient of the line relates to the

165
mobilised friction angle as given by sintan . Integration of Mohr-Coulomb failure
criterion suggests that the points of maximum shear stress at failure (corresponding to maximum
deviator stress) obtained for a given soil at different initial effective confining stress (ECS) lie on
a straight line on the qp plot (denoted by dashed green line in Figure 5.21 (a)). When zero
cohesion is assumed for sand, the maximum shear stress at failure is given by ff pq sin . It
appears that our hydrate-bearing tests generally do not plot on this line of zero cohesion.
Therefore, if the friction angle is assumed to be unaffected by the presence of hydrate, it can be
concluded that hydrate adds cohesion to the granular material. This can only be verified by
performing triaxial compression tests at given host sediment void ratio and constant hydrate
saturation at varying initial effective confining stress to determine if the mobilised friction angle
at the respective hydrate saturation has changed from that of non-hydrated specimen. The
magnitude of hydrate added cohesion can be determined as given by the intercept of the plot
(= cosc ). Repeating the aforementioned set of experiments at various hydrate saturations
would also allow the determination of the correlation between hydrate saturation and the
mobilised friction angle. According to Soga et al. [2006] and Waite et al. [2009], the friction
angle is independent of hydrate saturation resulting in the increased strength reported in the
presence of hydrate being completely attributed to hydrate added cohesion. The experimental
verification of the aforementioned is suggested for future research.
5.9 Results
The following section summarises the findings of this research as to the initial effective
confining stress/hydrate saturation dependency of strength/stiffness. Also, it presents a
166
comparison of the present wok to the findings of Yun et al. [2007] and Santamarina and Ruppel
[2008].
5.9.1 Strength and stiffness dependency on initial effective confining stress
(a) Strength versus initial effective confining stress
The observations reveal a positive relationship between strength and effective confining
stress at low hydrate saturations (< 40%). Greater strength is obtained at greater initial
effective confinement.
The observations reveal no clear correlation between strength and effective confining
stress at high hydrate saturations (> 40%).
The strength of hydrate-bearing sediment at low hydrate saturations is hypothesised to be
predominantly determined by a combination of (a) frictional resistance between mineral
grains and (b) hydrate-added cohesion (due to cementation) and/ or frictional resistance
(due to densification of the soil material). The frictional resistance determined by the
mineral contact stress is related to the effective confinement. Thus the hypothesised
strength behaviour justifies the observed correlation between strength and initial effective
confining stress.
However, at high hydrate saturations, it is hypothesised that strength is predominantly
determined by the intact hydrate strength and/or hydrate-mineral bonding strength, the
degree to which the strength is influenced by the effective confinement depends upon the
degree to which the intact hydrate strength and/or hydrate-mineral bonding strength is
affected by the effective confinement. Such evidence of intact hydrate strength and/or
hydrate-mineral bonding strength dependency on effective confinement is hardly
167
addressed in existing literature. However, the intact hydrate strength is known to be
governed by the formation pore fluid pressure [Hyodo et al., 2002] which is a constant
(9000 kPa) for the entire set of specimens subjected to testing under this research.
Therefore, there exists only little possibility that the hydrate strength is determined by the
initial effective confinement; hence the above hypothesis of strength behaviour at high
hydrate saturations justifies the lack of correlation between strength and effective
confinement.
(b) Stiffness versus initial effective confining stress
The observations reveal greater initial tangential stiffness at confining stress at low
hydrate saturations (< 40%). However, no clear correlation between secant stiffness and
effective confining stress is observed both at low (< 40%) and high hydrate saturations (>
40%).
The stiffness of hydrate-bearing particulate soil material can be considered as determined
by the packing density of the host sediment, grain interlocking between the mineral
particles, and hydrate cementation. Of above factors, the packing density is influenced by
the effective confinement; thus stiffness may expect to be influenced by effective
confinement. However, at the initial void ratio of 0.57 (corresponding to a relative
density of 72%) it appears that the differences in stiffness between the specimens tested
at 500 kPa and 1000 kPa initial effective confinement are only visible at low hydrate
saturations where the hydrate cementation effects on stiffness are not so predominant.

168
5.9.2 Strength and stiffness dependency on hydrate saturation
(a) Strength versus hydrate saturation
The observations reveal a positive relationship between strength and hydrate saturation at
low hydrate saturations (< 40%). Greater strength is obtained at greater hydrate
saturations.
The observations reveal no clear correlation between strength and hydrate saturation at
high hydrate saturations (> 40%). However, significantly higher strengths than that
obtained at low saturations are reported.
At low saturations, increase in the degree of hydrate saturation results in greater
volumetric tendency for dilation (due to hydrate added resistance to deformation resulting
from densification and cementation). A dilative sediment undergoing shearing under
constant mass conditions develop negative pore fluid pressures. Consequently, the
effective confinement on the sediment increases and thus is the strength.
At high hydrate saturations (> 40%) peak strength is governed by intact hydrate strength
and/or hydrate-mineral bonding strength and therefore shows a poor correlation between
strength and hydrate saturation. However, the residual/ultimate strength shows a positive
correlation with hydrate saturation; the underlying mechanisms are revisited under
Section 5.10.
(b) Stiffness versus hydrate saturation
The observations reveal a positive relationship between stiffness and hydrate saturation at
low hydrate saturations (< 40%). Greater stiffness is obtained at greater hydrate
saturations. This could be attributed to increased cementing effect with increasing hydrate

169
saturation. The initial tangential stiffness is better correlated with hydrate saturation than
secant stiffness.
The observations reveal no clear correlation between stiffness and hydrate saturation at
high hydrate saturations (> 40%). However, significantly higher stiffness than that
obtained at low saturations is reported. The factors such as special variability in hydrate
distribution may have resulted in a poor correlation between stiffness and hydrate
saturation.
In overall, the strength/stiffness behaviour is consistent with the speculations made in Chapter 3
of the grain cementing/coating growth habit of hydrate relevant to the hydrate formation method
followed in the preparation of the test specimens. The grain scale mechanisms underlying the
behaviour are revisited in Section 5.7.
5.9.3 Comparison to previous work
The Figure 5.22 explores the strength-hydrate saturation correlation for hydrate-bearing sand
specimens, including the data of present study and those of Yun et al. [2007]. Both the data sets
exhibit similar non-linear trend of increasing strength with increasing hydrate saturation. It
should be noted that the results of Yun et al. [2007] are obtained for THF hydrates with pore
water saturation, where pore filling to load bearing habits of hydrate can be expected. The
hydrate formation method employed in the present study results in grain cementing habit of
hydrate formation. Further information of these different hydrate habits were presented in
Chapter 2. The strength results of the present work generally plot above those of Yun et al.
[2007]. The differences in strength between the two studies may be originating from differences
170
in host sediment properties and differences in hydrate habit. Comparison of the non-hydrated
specimen strengths of the two studies reveals a possible influence of host sediment differences.
A comparison of stiffness-strength correlation (Figure 5.23) reveals greater differences between
the two formation habits. The cementing habit (this study) generates greater stiffness,
particularly at higher hydrate saturations.
From Figures 5.22 and 5.23, there is an indication that stiffness of hydrate-bearing sediments is
greatly influenced by the hydrate habit (or in other words, the degree of inter-particle bonding
due to hydrate cementation); while, the strength of hydrate-bearing sediments does not show a
significant difference between the two formation habits.
The comparison of our results to previous work is further extended to compare our results with
those predicted by the Santamarina and Ruppel [2008] model with the intention of generating
further understanding of the underlying mechanisms of strength/stiffness behaviour.
Santamarina and Ruppel [2008] developed an expression for undrained shear strength of hydrate-
bearing sediments based on their observation of experimental data generated by Yun et al. [2007]
for sand specimens consisting THF hydrate and water in the pore space. Their observations can
be listed as follows: (a) at low hydrate saturations the strength is determined by effective stress
controlled particle frictional resistance, (b) the contribution of intact hydrate strength and/or
hydrate-mineral bonding strength increases non-linearly with increasing hydrate saturation, and
(c) the effects of pore space presence of hydrate are more pronounced at lower host sediment
171
porosities. The model captures these observations and is given by equation 5.17. The model
parameters a and b were obtained by fitting the model results to experimental data of Yun et al.
[2007].
2
3 )(
n
SbqaS h
hou (5.17)
uS is the undrained shear strength (MPa); o)( 3 is the initial effective confining stress (MPa);
hq is the hydrate strength (= 8 MPa, after Durham et al., 2005); hS is the hydrate saturation (0 <
hS < 1); n is the porosity of the medium; a is a model coefficient which captures friction and
pore pressure generation in sediments; and “b is a model coefficient which captures the
hydrate’s ability to contribute to sediment strength and thus “reflect the formation method/habit
of hydrate in a given soil” [Santamarina and Ruppel, 2008].
Comparison of our results to those predicted by the above expression with the fitted model
coefficients a= 1.55 and b = 0.14 (derived for F110 Ottawa Sand) are shown in Figure 5.24. The
predicted versus measured strength of present study and Yun et al. [2007] is given in Figure
5.25. It should be noted that the values of aand b of Santamarina and Ruppel [2008] model are
obtained by fitting the model to experimental data of Yun et al. [2007] for THF hydrates of pore
filling to load bearing hydrate habits. In general, for most of our test specimens, the measured
strength appears to be greater than the predicted strength. The difference could be attributed to
one or many of the following factors: (1) the general error associated with the model predictions

172
(note that the data of Yun et al. [2007] also exhibits similar scatter about the trend of model
predicted strength), (2) mismatch of the fitted values of the model coefficients with the host
sediment properties and hydrate-cemented nature of sand subjected to testing in the present
study, and (3) mismatch of model assumptions with the properties of hydrate-cemented sands of
the present study originating from differences between the nature of the hydrate-sediment
interaction (or the hydrate growth habit) of the two studies. In the following discussion we
explore the contribution of the aforementioned factors (2) and (3) to the differences between the
predicted and the observed strength.
Multiple linear regression analysis was employed to calibrate the Santamarina and Ruppel [2008]
model to best fit our data set with the intension of eliminating undesirable influence of
mismatching model coefficients in the interpretation of the observations. As a result an a= 2.30
and b = 0.12 was obtained. The Figure 5.26 and Figure 5.27 illustrate the better fit obtained with
the use of calibrated model.
Santamarina and Ruppel [2008] model the contribution of hydrate to strength of aggregated
material as equal to
2
n
Sbq h
h , and expect the parameter b to be reflective of the formation
method/habit of hydrate. Careful observation of the equation suggests that for a given sediment
of known porosity n , the contribution of hydrate to strength is a function of the degree of
hydrate saturation hS and the hydrate strength hq . The hydrate strength obtained after Durham
et al. [2005] represent the hydrate breakage strength in shear. As such it appears that the

173
expression represents pore filling or load bearing habits of hydrate where the grain cementing
nature of hydrate (or hydrate-mineral bonding effect) is insignificant. As observed in Figure 5.26
and Figure 5.27 the data fit of the present study with the Santamarina and Ruppel [2008] model
suggests that the influence of potential hydrate-grain cementation on the strength is not
significant up to 50% hydrate saturation. However, at higher hydrate saturations our results
deviate from behaviour of sediments with pore filling to load bearing hydrate habit, and the
model is incapable of capturing the behaviour at these hydrate saturations.
Interestingly, if the model calibration is performed at each different initial effective confining
stress (500 kPa and 1000 kPa) to generate 2 sets of values for a and b ( a= 3.10 and b = 0.08 at
500 kPa effective confinement and a= 2.45 and b = 0.05 1000 kPa effective confinement), a
noticeable improvement in the predicted strength can be obtained (Figure 5.28). Therefore it
appears that differentiating between the initial effective confinement in the calibration of the
model constants help isolating the hydrate saturation effects on the model predicted strength.
5.10 Behaviour of hydrate-cemented soils in summary
The following concludes the presentation of the finding of this research in summary with grain-
scale mechanisms underlying the observed strength/stiffness behaviour of hydrate-cemented
sediments under constant mass shearing. The understanding of the mechanisms taking place at
particle level is then used to predict the variations of strength/stiffness behaviour that should be
expected with non-cementing hydrate growth habits. In overall the above comparison of our
results with Yun et al. [2007] and Santamarina and Ruppel [2008] suggest that the differences in
strength behaviour between pore filling/load bearing and cementing hydrate habits are more
174
prominent at high hydrate saturations. According to analysis of our experimental results, at high
hydrate-saturations the strength is governed by intact hydrate strength and/or hydrate-mineral
bonding strength.
(a) Grain-scale mechanisms at low hydrate saturations (< 40%) can be summarised as
follows:
Particles develop frictional resistance in response to shearing
Deformation and particle re-arrangement is restricted due to cohesion induced by hydrate
cementation at grain contacts and accumulation on grain surfaces. Thus, stiffer response
and greater volumetric tendency for dilation compared to non-hydrated sediments should
be expected.
Increased volumetric tendency for dilation results in greater tendency for negative pore
pressure generation under constant mass shearing and therefore, increased strength
compared to non cementing sediments should be expected.
(b) Grain-scale mechanisms at high hydrate saturations (> 40%) can be summarised as
follows:
The development of frictional resistance upon application of loading is hindered within
the hydrate stiffened aggregated body of particulate soil material. Particularly the initial
contractive volumetric tendency is low.
Further development of resistance to applied loading develops with appearance of
dilative volumetric tendency. In the case of constant mass shearing with pore space
consisting of free gas, volumetric change is allowed. However deformation is restricted
175
within the hydrate stiffened body. Resistance to applied loading is borne by the hydrate
mass, which later fails upon reaching at intact hydrate strength and/or hydrate- mineral
bonding strength. According to our observations, hydrate failure marks a peak in the
stress-strain curve.
Hydrate failure results in sudden loss of cohesion. The failure strength is thus governed
by the intact hydrate strength and/or hydrate-mineral bonding strength. Generally, greater
stiffness than that at low saturation should be expected.
Upon hydrate breakage or de-bonding, dilative volumetric tendency further increases as
mineral grain interlocking and hydrate-induced resistance to deformation is attempted to
overcome. This is visible in the form of increasing rate of negative pore pressure
development in the post-peak region.
As in the case of our test specimens where the pore space is compressible, volumetric
deformation takes place by overcoming the resistance to deformation with dissipation of
negative pore pressure. Localised zones of deformation may appear and the material
reaches residual/ultimate strength which is predominantly governed by the hydrate
saturation.
In the case of non-cementing hydrate growth habits the following variations of the
strength/stiffness behaviour should be expected under constant mass shearing.
In the case of non-cementing hydrates, the effect of hydrate pore space presence can be
identified as densification of the soil structure. Therefore, the soil behaves as a material
of greater density than that given by the void ratio of the soil mineral grain packing.
176
At low saturations where the hydrate added cohesion is low for cementing hydrates, no
significant difference in strength should be expected between cementing and non-
cementing growth habits. In other words the strength is determined by hydrate saturation
but not by the growth habit.
Less stiff response should be expected with non-cementing hydrates as hydrate
cementation added resistance to deformation is non-existent.
At high hydrate saturations the strength is determined by intact hydrate strength (but not
by hydrate-mineral bonding strength). Also, dependant upon the hydrate formation
methodology, un-reacted water may present surrounding the grains and within hydrate
masses. Such features can also affect the strength of uncemented sediments as over
pressurization of trapped water can promote hydrate breakage as negative global pore
fluid pressures develop in response to shearing under constant mass.
At very high hydrate saturations where the particulate body tend to behave as an
aggregated body, the stiffness of non-cementing hydrate-bearing sediment may expect to
be as comparable to that of cementing hydrates.
5.11 Remarks
The following few remarks upon review of experimental program presented in this thesis are
presented with the intention of providing guidance for future research. First, we identify the need
to develop experimental methods to properly isolate the hydrate effects on soil behaviour under
undrained triaxial conditions from drained effects due to pore space presence of free gas and
resulting pressure dissipation. Achieving complete water saturation of hydrate-cemented
specimens will require overcoming challenges present due to:
177
low permeability of hydrate-cemented media
possibilities of hydrate de-bonding from grain surfaces or grain contacts and being
carried away as particulate matter from the specimen affecting hydrate saturation
hydrate dissolution or reformation depending upon the dissolved methane concentration
in percolating water and P/T conditions.
Secondly, further triaxial compression testing may be performed for a given soil material to
study the comparative behaviour between the cases of undrained with no pore space presence of
free gas, constant mass with pore space presence of free gas, and drained. Thirdly, we identify
the need to integrate thermal/visual imaging techniques to further facilitate grain scale studies.

178
Figure 5.1: High pressure and low/high temperature capable triaxial soil testing apparatus
-The axial load, axial deformation, confining fluid pressure/volume and pore gas pressure are
measured during a typical triaxial test at constant mass for hydrate-bearing soil consisting of
hydrate and free gas within its pore space. The system temperature is maintained constant within
the hydrate stability zone during the test.
Load Cell
Pressure-
volume
controller
Axial load and displacement
control/measurement
Temperature
measurement
thermocouples
Axial loading
piston
Pore and confining fluid
volume/pressure
control/measurement
Pore fluid
Confining fluid
Soil specimen
Circulation of hot/cold liquid for
temperature control of the system To the methane gas
circulation system for
hydrate formation
To the methane gas
circulation system for
hydrate formation
Temperature control
pump
Pore gas pressure
measurement
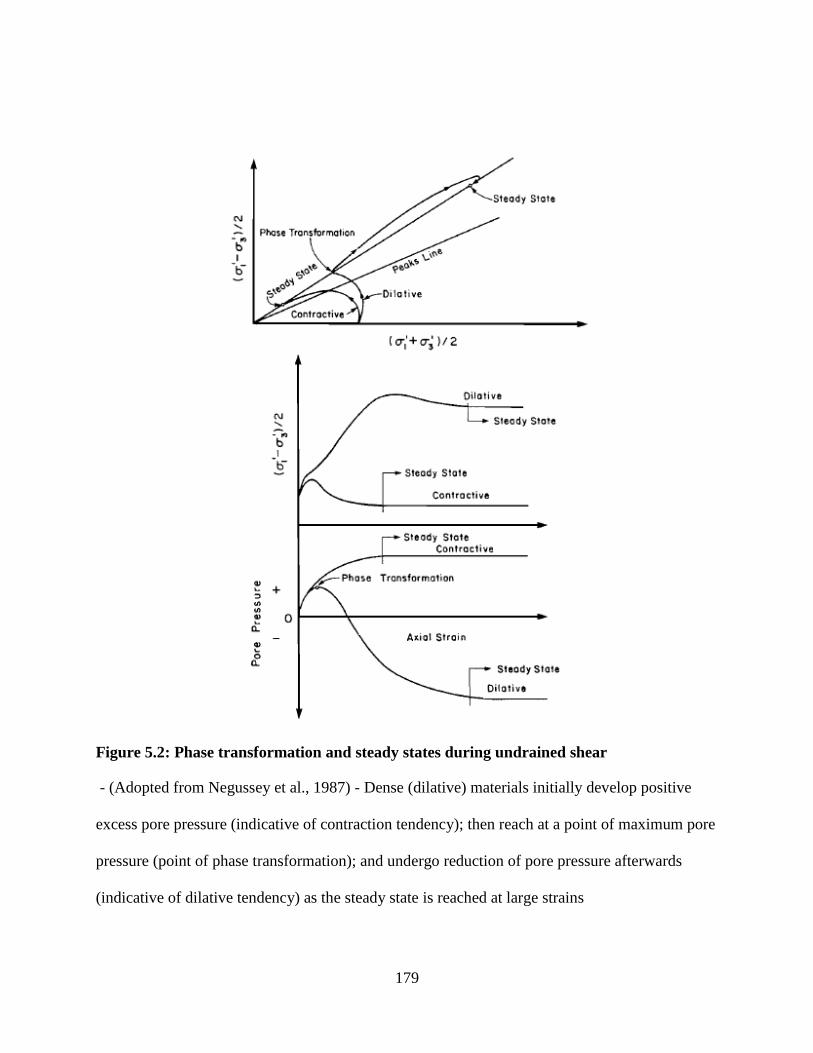
179
Figure 5.2: Phase transformation and steady states during undrained shear
- (Adopted from Negussey et al., 1987) - Dense (dilative) materials initially develop positive
excess pore pressure (indicative of contraction tendency); then reach at a point of maximum pore
pressure (point of phase transformation); and undergo reduction of pore pressure afterwards
(indicative of dilative tendency) as the steady state is reached at large strains
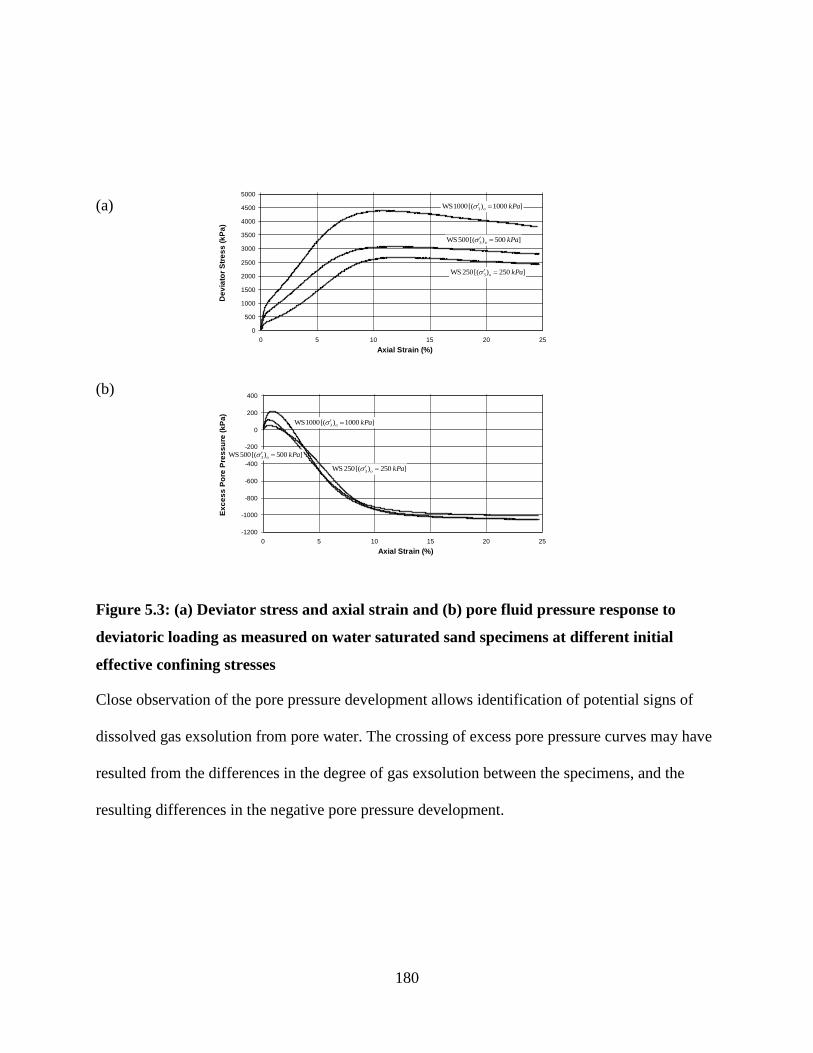
180
-1200
-1000
-800
-600
-400
-200
0
200
400
0 5 10 15 20 25
Axial Strain (%)
Ex
ce
ss
Po
re P
res
su
re (
kP
a)
]500)([ 500 WS 3 kPao
]1000)([ 1000 WS 3 kPao
]250)([ 250 WS 3 kPao
0
500
1000
1500
2000
2500
3000
3500
4000
4500
5000
0 5 10 15 20 25
Axial Strain (%)
De
via
tor
Str
es
s (
kP
a)
]500)([ 500 WS 3 kPao
]1000)([ 1000 WS 3 kPao
]250)([ 250 WS 3 kPao
(a)
(b)
Figure 5.3: (a) Deviator stress and axial strain and (b) pore fluid pressure response to
deviatoric loading as measured on water saturated sand specimens at different initial
effective confining stresses
Close observation of the pore pressure development allows identification of potential signs of
dissolved gas exsolution from pore water. The crossing of excess pore pressure curves may have
resulted from the differences in the degree of gas exsolution between the specimens, and the
resulting differences in the negative pore pressure development.

181
Figure 5.4: The identity of the friction angle mobilized at undrained phase transformation
and at the friction angle mobilized at steady state
- (Adopted from Negussey et al., 1987 based on the experimental results obtained for dilative
Brenda Mine tailings)
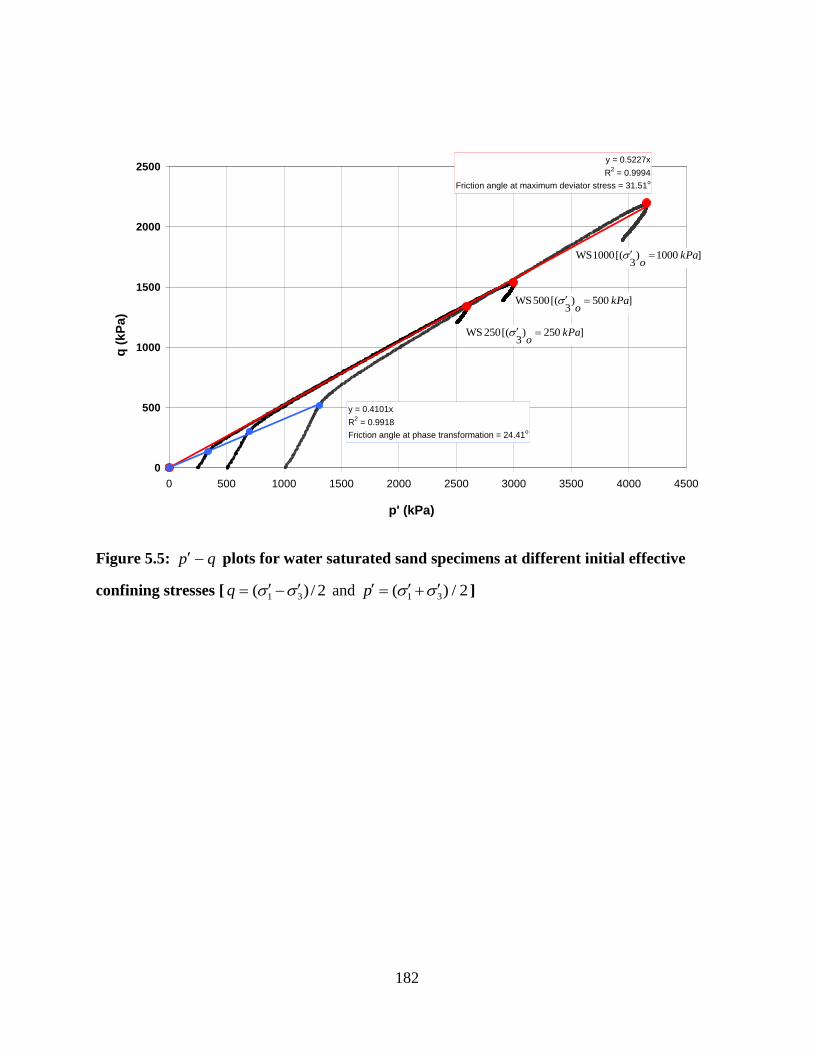
182
y = 0.5227x
R2 = 0.9994
Friction angle at maximum deviator stress = 31.51o
y = 0.4101x
R2 = 0.9918
Friction angle at phase transformation = 24.41o
0
500
1000
1500
2000
2500
0 500 1000 1500 2000 2500 3000 3500 4000 4500
p' (kPa)
q (
kP
a)
]250)3
([ 250 WS kPao
]500)3
([ 500 WS kPao
]1000)3
([ 1000 WS kPao
Figure 5.5: qp plots for water saturated sand specimens at different initial effective
confining stresses [ 2/)( 31 q and 2/)( 31 p ]

183
Figure 5.6: Grain scale mechanisms governing stress-strain behaviour of hydrate-bearing
sediments
- (Adopted from Waite et al. [2009] developed based on experimental results obtained for THF
hydrate-bearing sand specimens byYun et al. [2007]) - The sediment grains are indicated as
white circles, hydrate as black, and water as blue. At low hydrate saturations (0 to 40%), the
model suggests that the shear strength is mainly determined by the frictional resistance between
the soil grains. Stiffness is expected to increase with hydrate saturation. At moderate hydrate
saturations (40 to 80%), it is suggested that a stiffer response should be expected with increased
dilation taking place at aggregate scale, and hydrate cementation induced cohesion exceeds the
frictional resistance between soil grains. At very high hydrate saturations (> 80%), it is suggested
that soil behaves more like a continuum the shear strength, stiffness, and the overall stress-strain
behaviour of which is determined by intact hydrate strength and/or hydrate-mineral bonding
strength. According to Hyodo et al. [2002] and Jung and Santamarina [2011], both intact hydrate
strength and hydrate-mineral bonding strength are complex functions of many variables

184
including the properties of the mineral substrate, hydrate former, P/T conditions at which hydrate
formation is carried out, and hydrate habit etc. Therefore, the behaviour becomes difficult to
predict.

185
(a)
(b)
-1600
-1400
-1200
-1000
-800
-600
-400
-200
0
200
0 5 10 15 20 25
Axial Strain (%)
Excess P
ore
Pre
ssu
re (
kP
a)
500 WS
001 MH
002 MH
003 MH
004 MH
Figure 5.7: (a) Deviator stress and axial strain and (b) pore fluid pressure response to
deviatoric loading as measured on hydrate-bearing specimens at low hydrate saturations
(<40%) at 500 kPa initial effective confining stress
The lower tendency for initial positive pore pressure generation appears to increase with
increasing hydrate saturation. Also the rate of negative pressure development has generally
increased with increasing hydrate saturation as should be expected with increasing tendency for
background volumetric deformation that exists with hydrate densification of the soil medium.
0
500
1000
1500
2000
2500
3000
3500
4000
4500
0 5 10 15 20 25
Axial Strain (%)
Devia
tor
Str
ess (
kP
a)
500 WS
001 MH002 MH
003 MH
004 MH

186
(1000,38.8)
(1000,22.6)
(1000,0.0)
(500,34.4)
(500,27.3)
(500,12.7)
(500,10.2)(500,0.0)
(1000,61.5)
(500,53.6)
(500,46.3)
(1000,56.1)
(500,51.3)(1000,45.9)
(1000,80.0)
0
2000
4000
6000
8000
10000
12000
0.0 10.0 20.0 30.0 40.0 50.0 60.0 70.0 80.0 90.0
Hydrate Saturation, Sh (%)
Devia
tor
Str
ess a
t F
ail
ure
(kP
a)
Failure stress at 1000 kPa initial effective confining stress
Failure stress at 500 kPa initial effective confining stress
Failure stres-(Sh>40%)
Figure 5.8: Hydrate saturation dependency of deviator stress at failure at different initial
effective confining stress (ECS)
- The solid line joining the solid squares illustrates the trend at 500 kPa initial ECS for hydrate
saturations < 40%. The solid line joining the solid circles illustrates the trend at 1000 kPa initial
ECS. At higher hydrate saturations, the plot of data points (solid diamonds) illustrates the loss of
clear correlation of deviator stress at failure with initial ECS and hydrate saturation. The data
points are labelled with initial ECS in kPa and hydrate saturation appearing within parenthesis ( )
respectively. Refer to Figure 5.18 for the variation of residual/ultimate strength at high hydrate
saturations (> 40%) with initial ECS.

187
(a)
(500,34.4)
(500,27.3)
(500,12.7)
(500,10.2)
(500,0.0)
(1000,38.8)(1000,22.6)
(1000,0.0)
(500,53.6)
(500,51.3)
(500,46.3)
(1000,80.0)(1000,61.5)
(1000,56.1)
(1000,45.9)
0
200
400
600
800
1000
1200
0.0 10.0 20.0 30.0 40.0 50.0 60.0 70.0 80.0 90.0
Hydrate Saturation (Sh) (%)
Se
ca
nt
Sti
ffn
es
s (
MP
a)
Secant Stiffness-(Sh<40%)-500 kPa
Secant stiffness-(Sh<40%)-1000 kPa
Secant stiffness-(Sh>40%)-500 kPa
Secant stiffness-(Sh>40%)-1000 kPa
(b)
(500,53.6)
(500,51.3)
(500,46.3)(500,34.4)(500,27.3)
(500,12.7)(500,0)
(500,10.2)
(1000,80.0)
(1000,56.1)
(1000,45.9)
(1000,61.5)
(1000,38.8)(1000,22.6)
(1000,0)
0
500
1000
1500
2000
2500
3000
0.00 10.00 20.00 30.00 40.00 50.00 60.00 70.00 80.00 90.00
Hydrate saturation (Sh) (%)
Init
ial
Tan
ge
nti
al
Sti
ffn
es
s (
MP
a)
Initial tangential stiffness - 500 kPa initial effective confining stress
Initial tangential stiffness - 1000 kPa initial effective confining stress
Figure 5.9: Hydrate saturation dependency of secant stiffness at different initial effective
confining stress (ECS), and (b) hydrate saturation dependency of initial tangential stiffness
at different initial effective confining stress (ECS)
- The higher the hydrate saturation, the greater the stiffness. Apparently, stiffness only slightly
affected by the initial ECS. The data points are labelled with initial ECS in kPa and hydrate
saturation appearing within parenthesis ( ) respectively.
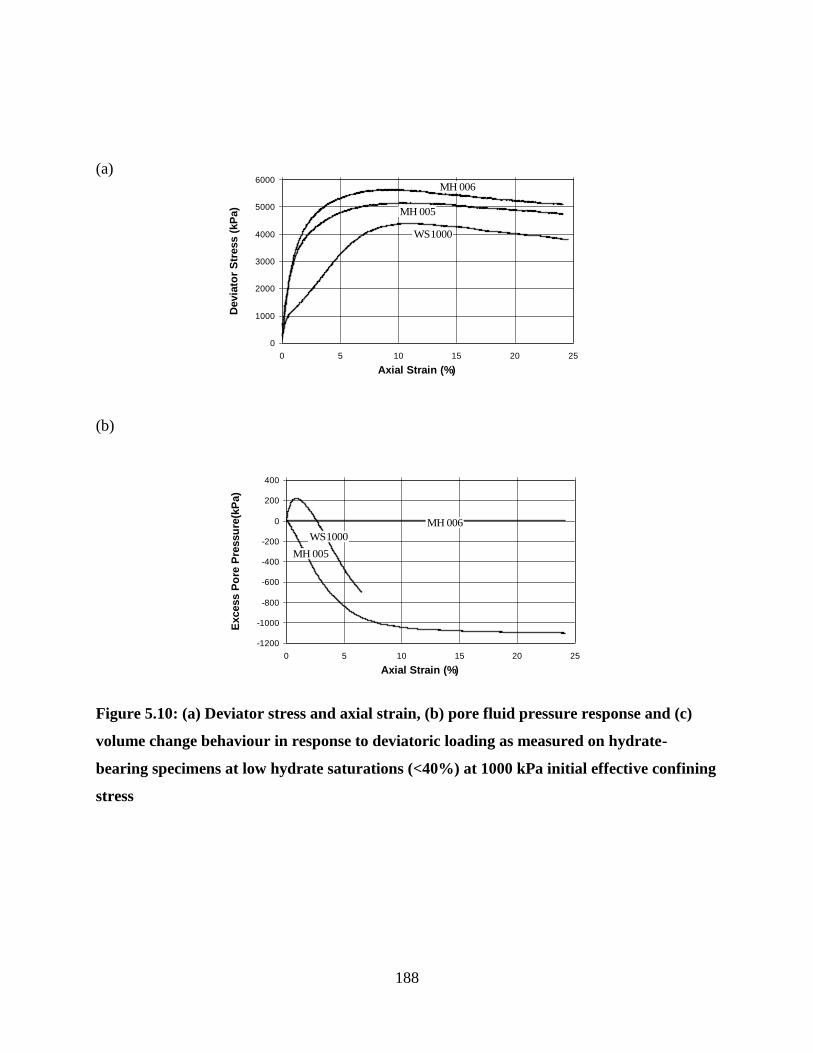
188
(a)
(b)
-1200
-1000
-800
-600
-400
-200
0
200
400
0 5 10 15 20 25
Axial Strain (%)
Excess P
ore
Pre
ssu
re(k
Pa)
005 MH
006 MH
1000 WS
Figure 5.10: (a) Deviator stress and axial strain, (b) pore fluid pressure response and (c)
volume change behaviour in response to deviatoric loading as measured on hydrate-
bearing specimens at low hydrate saturations (<40%) at 1000 kPa initial effective confining
stress
0
1000
2000
3000
4000
5000
6000
0 5 10 15 20 25
Axial Strain (%)
Devia
tor
Str
ess (
kP
a) 005 MH
006 MH
1000 WS
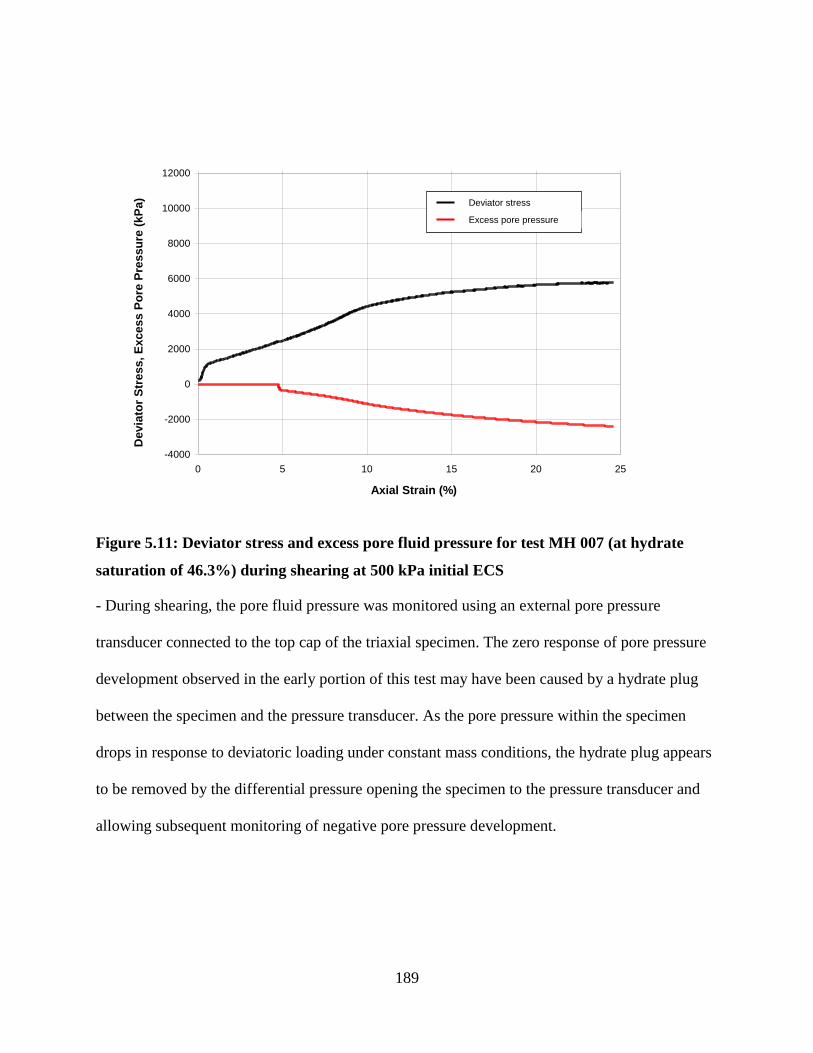
189
-4000
-2000
0
2000
4000
6000
8000
10000
12000
0 5 10 15 20 25
Axial Strain (%)
Devia
tor
Str
ess,
Excess P
ore
Pre
ssu
re (
kP
a) Deviator stress
Excess pore pressure
Figure 5.11: Deviator stress and excess pore fluid pressure for test MH 007 (at hydrate
saturation of 46.3%) during shearing at 500 kPa initial ECS
- During shearing, the pore fluid pressure was monitored using an external pore pressure
transducer connected to the top cap of the triaxial specimen. The zero response of pore pressure
development observed in the early portion of this test may have been caused by a hydrate plug
between the specimen and the pressure transducer. As the pore pressure within the specimen
drops in response to deviatoric loading under constant mass conditions, the hydrate plug appears
to be removed by the differential pressure opening the specimen to the pressure transducer and
allowing subsequent monitoring of negative pore pressure development.
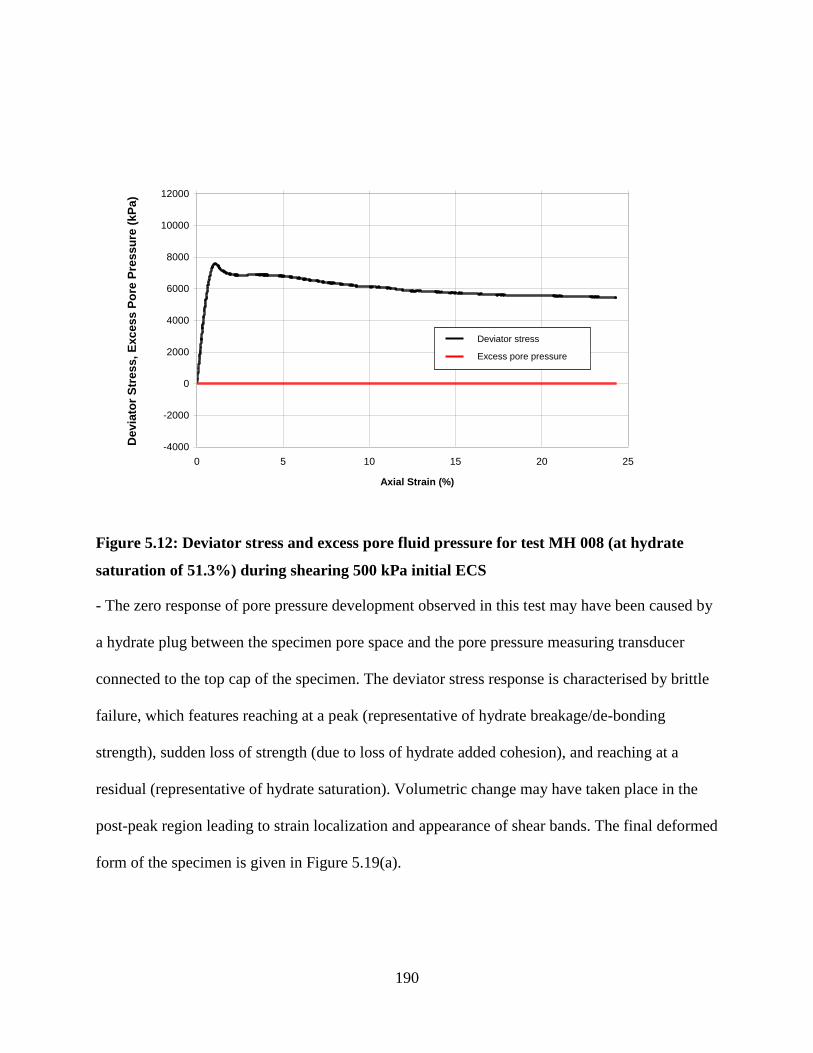
190
-4000
-2000
0
2000
4000
6000
8000
10000
12000
0 5 10 15 20 25
Axial Strain (%)
Devia
tor
Str
ess,
Excess P
ore
Pre
ssu
re (
kP
a)
Deviator stress
Excess pore pressure
Figure 5.12: Deviator stress and excess pore fluid pressure for test MH 008 (at hydrate
saturation of 51.3%) during shearing 500 kPa initial ECS
- The zero response of pore pressure development observed in this test may have been caused by
a hydrate plug between the specimen pore space and the pore pressure measuring transducer
connected to the top cap of the specimen. The deviator stress response is characterised by brittle
failure, which features reaching at a peak (representative of hydrate breakage/de-bonding
strength), sudden loss of strength (due to loss of hydrate added cohesion), and reaching at a
residual (representative of hydrate saturation). Volumetric change may have taken place in the
post-peak region leading to strain localization and appearance of shear bands. The final deformed
form of the specimen is given in Figure 5.19(a).
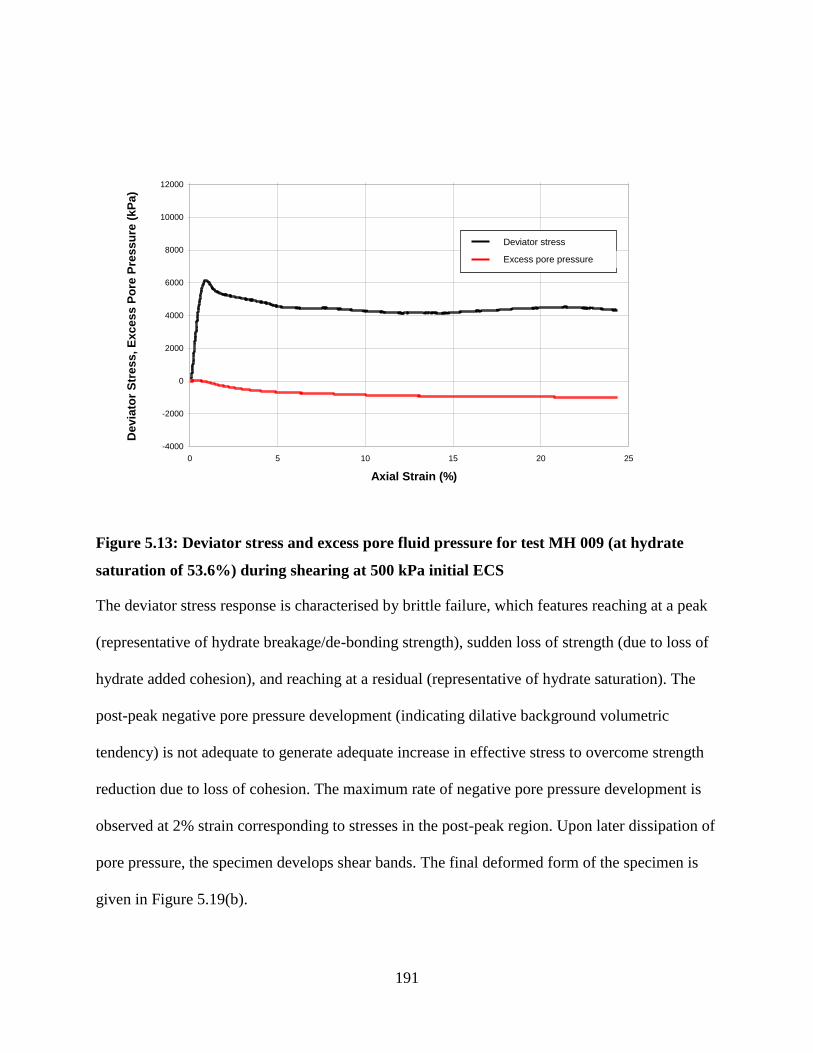
191
-4000
-2000
0
2000
4000
6000
8000
10000
12000
0 5 10 15 20 25
Axial Strain (%)
Devia
tor
Str
ess,
Excess P
ore
Pre
ssu
re (
kP
a)
Deviator stress
Excess pore pressure
Figure 5.13: Deviator stress and excess pore fluid pressure for test MH 009 (at hydrate
saturation of 53.6%) during shearing at 500 kPa initial ECS
The deviator stress response is characterised by brittle failure, which features reaching at a peak
(representative of hydrate breakage/de-bonding strength), sudden loss of strength (due to loss of
hydrate added cohesion), and reaching at a residual (representative of hydrate saturation). The
post-peak negative pore pressure development (indicating dilative background volumetric
tendency) is not adequate to generate adequate increase in effective stress to overcome strength
reduction due to loss of cohesion. The maximum rate of negative pore pressure development is
observed at 2% strain corresponding to stresses in the post-peak region. Upon later dissipation of
pore pressure, the specimen develops shear bands. The final deformed form of the specimen is
given in Figure 5.19(b).

192
-4000
-2000
0
2000
4000
6000
8000
10000
12000
0 5 10 15 20 25
Axial Strain (%)
Devia
tor
Str
ess,
Excess P
ore
Pre
ssu
re (
kP
a)
Deviator stress
Excess pore pressure
Figure 5.14: Deviator stress and excess pore fluid pressure for test MH 010 (at hydrate
saturation of 45.9%) during shearing at 1000 kPa initial ECS
The deviator stress response is characterised by brittle failure, which features reaching at a peak
(representative of hydrate breakage/de-bonding strength), sudden loss of strength (due to loss of
hydrate added cohesion), and reaching at a residual (representative of hydrate saturation). The
post-peak negative pore pressure development (indicating dilative background volumetric
tendency) is not adequate to generate adequate increase in effective stress to overcome strength
reduction due to loss of cohesion. The maximum rate of negative pore pressure development is
observed at 2.6% strain corresponding to stresses in the post-peak region. Upon later dissipation
of pore pressure, the specimen develops shear bands. The final deformed form of the specimen is
given in Figure 5.19(c).
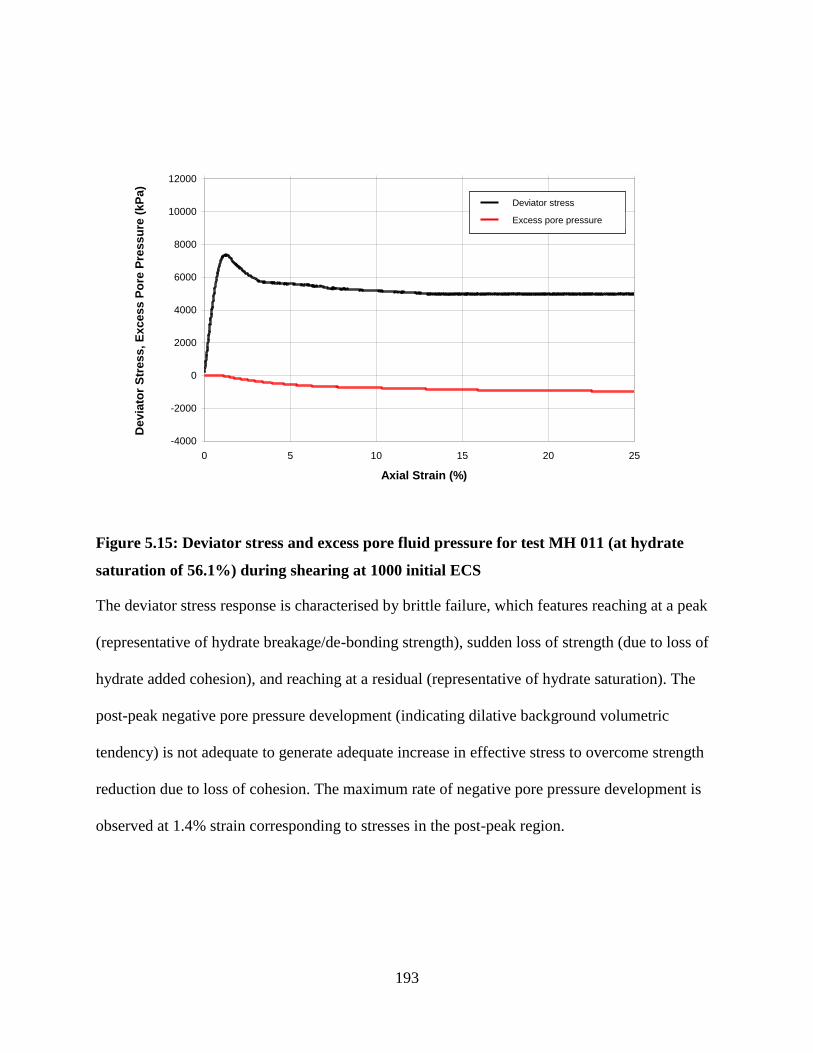
193
-4000
-2000
0
2000
4000
6000
8000
10000
12000
0 5 10 15 20 25
Axial Strain (%)
Devia
tor
Str
ess,
Exc
es
s P
ore
Pre
ssu
re (
kP
a)
Deviator stress
Excess pore pressure
Figure 5.15: Deviator stress and excess pore fluid pressure for test MH 011 (at hydrate
saturation of 56.1%) during shearing at 1000 initial ECS
The deviator stress response is characterised by brittle failure, which features reaching at a peak
(representative of hydrate breakage/de-bonding strength), sudden loss of strength (due to loss of
hydrate added cohesion), and reaching at a residual (representative of hydrate saturation). The
post-peak negative pore pressure development (indicating dilative background volumetric
tendency) is not adequate to generate adequate increase in effective stress to overcome strength
reduction due to loss of cohesion. The maximum rate of negative pore pressure development is
observed at 1.4% strain corresponding to stresses in the post-peak region.
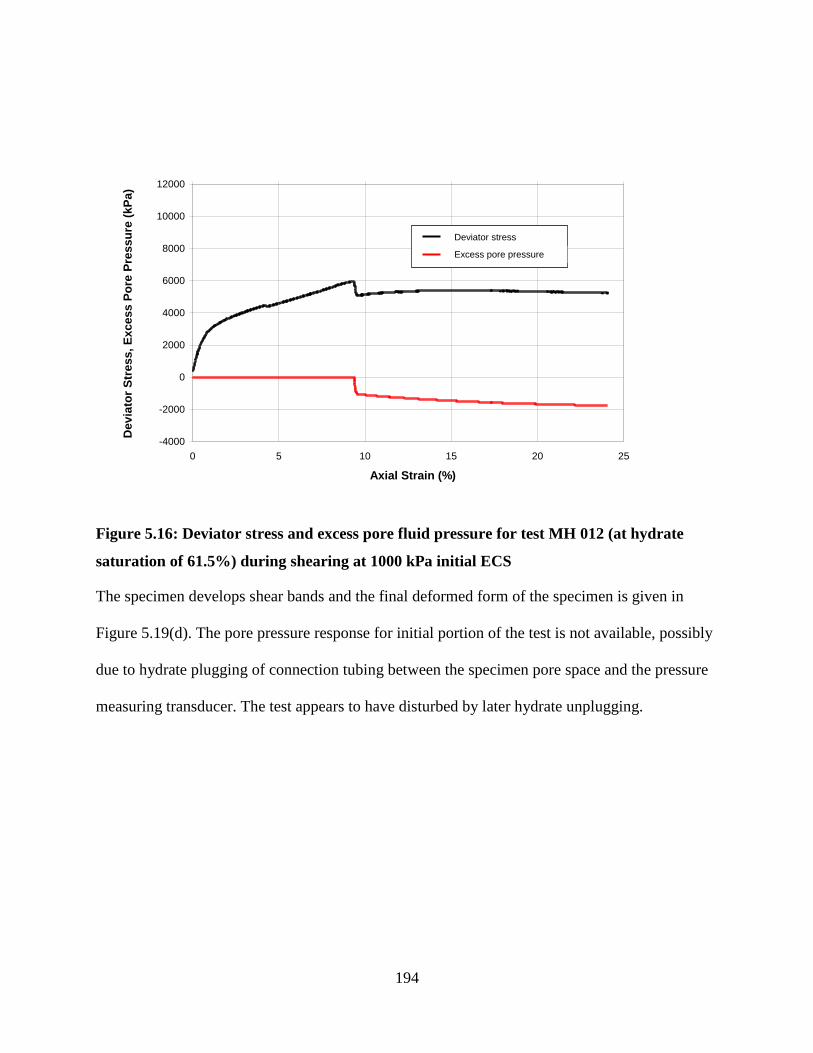
194
-4000
-2000
0
2000
4000
6000
8000
10000
12000
0 5 10 15 20 25
Axial Strain (%)
Devia
tor
Str
ess,
Excess P
ore
Pre
ssu
re (
kP
a)
Deviator stress
Excess pore pressure
Figure 5.16: Deviator stress and excess pore fluid pressure for test MH 012 (at hydrate
saturation of 61.5%) during shearing at 1000 kPa initial ECS
The specimen develops shear bands and the final deformed form of the specimen is given in
Figure 5.19(d). The pore pressure response for initial portion of the test is not available, possibly
due to hydrate plugging of connection tubing between the specimen pore space and the pressure
measuring transducer. The test appears to have disturbed by later hydrate unplugging.

195
-4000
-2000
0
2000
4000
6000
8000
10000
12000
0 5 10 15 20 25
Axial Strain (%)
Devia
tor
Str
ess,
Excess P
ore
Pre
ssu
re (
kP
a)
Deviator stress
Excess pore pressure
Figure
5.17: Deviator stress and excess pore fluid pressure for test MH 013 (at hydrate saturation
of 80%) during shearing at 1000 kPa initial ECS
The deviator stress response is characterised by brittle failure, which features reaching at a peak
(representative of hydrate breakage/de-bonding strength), sudden loss of strength (due to loss of
hydrate added cohesion), and reaching at a residual (representative of hydrate saturation). A
significant amount of post-peak frictional strength regain is observed with the development of
negative pore pressure. Upon later pore pressure dissipation the specimen develops shear bands
and Figure 5.1(e) shows the band scars left on the specimen membrane. The maximum rate of
negative pore pressure development is observed at 4.7% strain corresponding to stresses in the
post-peak region.
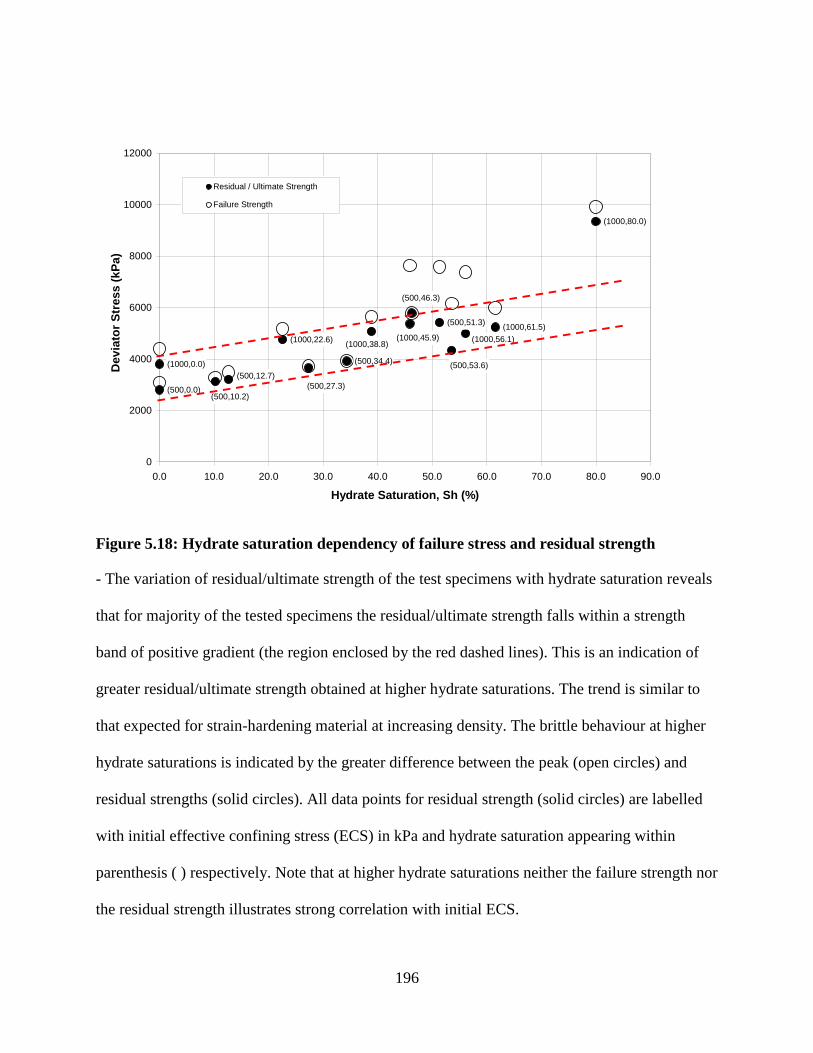
196
(1000,80.0)
(1000,61.5)
(1000,56.1)
(500,53.6)
(500,51.3)
(1000,45.9)
(500,46.3)
(1000,38.8)(1000,22.6)
(500,34.4)
(500,27.3)
(500,10.2)
(500,12.7)
(500,0.0)
(1000,0.0)
0
2000
4000
6000
8000
10000
12000
0.0 10.0 20.0 30.0 40.0 50.0 60.0 70.0 80.0 90.0
Hydrate Saturation, Sh (%)
Devia
tor
Str
ess (
kP
a)
Residual / Ultimate Strength
Failure Strength
Figure 5.18: Hydrate saturation dependency of failure stress and residual strength
- The variation of residual/ultimate strength of the test specimens with hydrate saturation reveals
that for majority of the tested specimens the residual/ultimate strength falls within a strength
band of positive gradient (the region enclosed by the red dashed lines). This is an indication of
greater residual/ultimate strength obtained at higher hydrate saturations. The trend is similar to
that expected for strain-hardening material at increasing density. The brittle behaviour at higher
hydrate saturations is indicated by the greater difference between the peak (open circles) and
residual strengths (solid circles). All data points for residual strength (solid circles) are labelled
with initial effective confining stress (ECS) in kPa and hydrate saturation appearing within
parenthesis ( ) respectively. Note that at higher hydrate saturations neither the failure strength nor
the residual strength illustrates strong correlation with initial ECS.

197
Figure 5.19: Photographs of sheared specimens and deformation band scars left on
specimen membrane
(b) MH 009 (c) MH 010
(d) MH 012
(a) MH 008
(e) MH 013
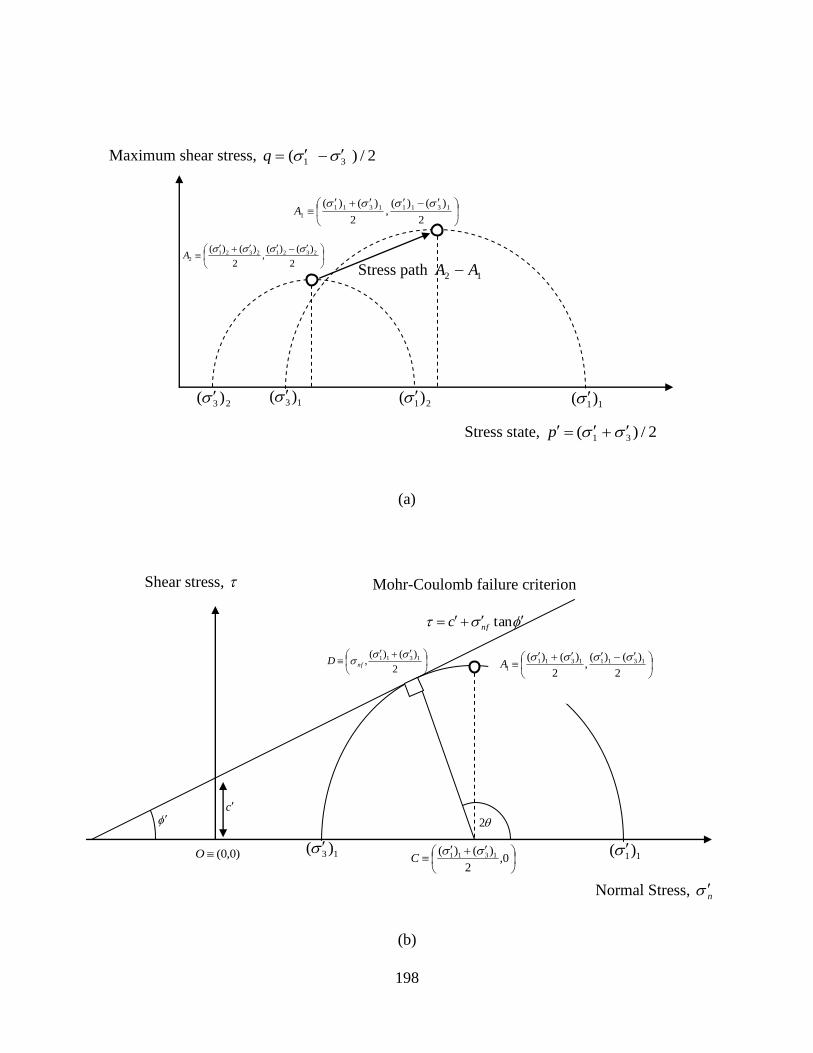
198
(a)
(b)
Maximum shear stress, 2/)( 31 q
Stress state, 2/)( 31 p
2
)()(,
2
)()( 232123212
A
Stress path 12 AA
2
)()(,
2
)()( 13111311
1
A
21)( 11)( 23 )( 13 )(
Shear stress,
Normal Stress, n
Mohr-Coulomb failure criterion
tannfc
2
)()(,
2
)()( 131113111
A
0,
2
)()( 1311 C
11)( 13 )(
2
)()(, 1311
nfD
)0,0(O
c
2

199
(c)
Figure 5.20: The stress path plot and the Mohr-Coulomb failure criterion
(a) The stress path 12 AA , (b) The Mohr’s Circle and the Mohr-Coulomb failure criterion – The
coordinates of a point on the perimeter (e.g. D ) gives the normal shear stress and the mobilised
shear stress on a plane of inclination to the direction of minor principal stress. The point
D represents the shear and the normal stresses on the failure plane corresponding to the
maximum shear stress given by 2/])()[( 1311 fq or maximum deviator stress)/2 (in the case
of triaxial testing) and the stress state 2/])()[( 1311 fp . The maximum shear stress
mobilises on a plane of inclination o45 to the minor principal stress and is represented by point
1A . The geometry of the plot suggests cossin cOCCD . The equation can also be
written as cossin cpq ff . (c) The plot of maximum shear stress at failure obtained for
different stress states (for different tests) on the pq plane. Integration of the Mohr-Coulomb
failure criterion suggests that the gradient of the plot is given by sintan and the intercept
of the plot is given by cosc .
Stress state, p
Maximum shear stress, q
22 , ff qpA
)0,0(O
'cosc
11 , ff qpA

200
0
500
1000
1500
2000
2500
0 500 1000 1500 2000 2500 3000 3500 4000 4500
p' (kPa)
q (
kP
a)
500 WS
001 MH
002 MH
003 MH 004 MH
(a) qp plots for hydrate-bearing specimens at low hydrate saturations (<40%) at 500 kPa
initial effective confining stress [ 2/)( 31 q and 2/)( 31 p ]
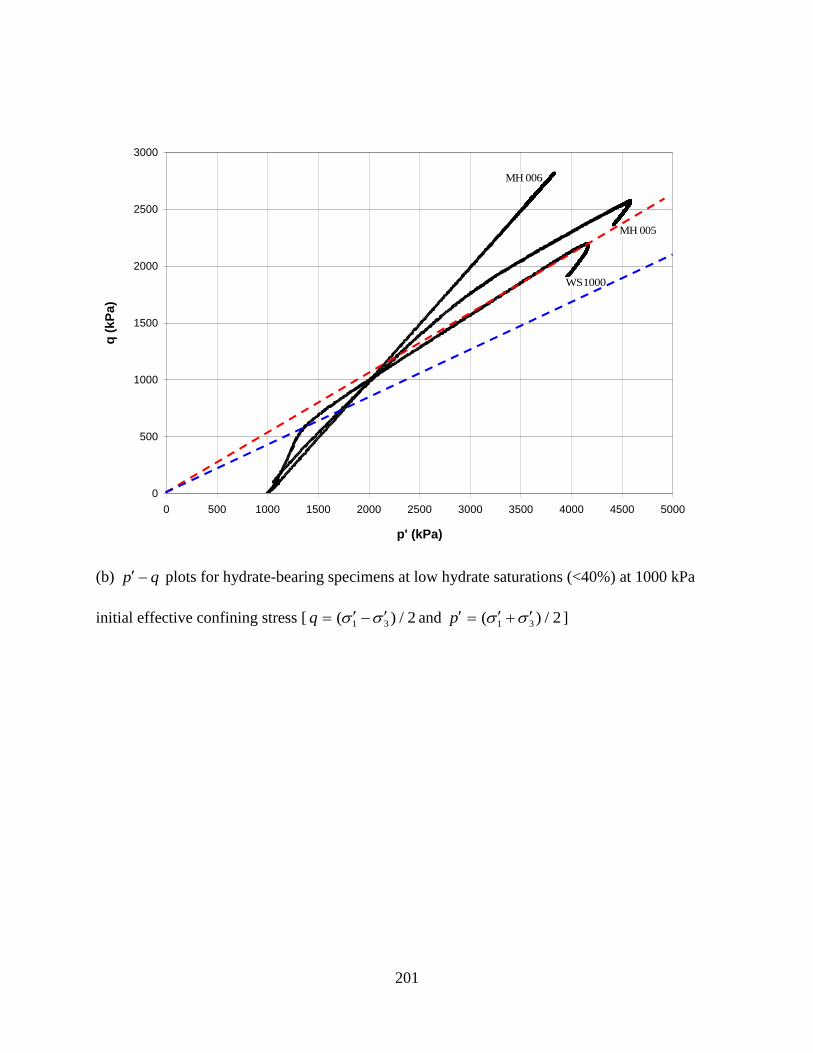
201
0
500
1000
1500
2000
2500
3000
0 500 1000 1500 2000 2500 3000 3500 4000 4500 5000
p' (kPa)
q (
kP
a)
005 MH
006 MH
1000 WS
(b) qp plots for hydrate-bearing specimens at low hydrate saturations (<40%) at 1000 kPa
initial effective confining stress [ 2/)( 31 q and 2/)( 31 p ]
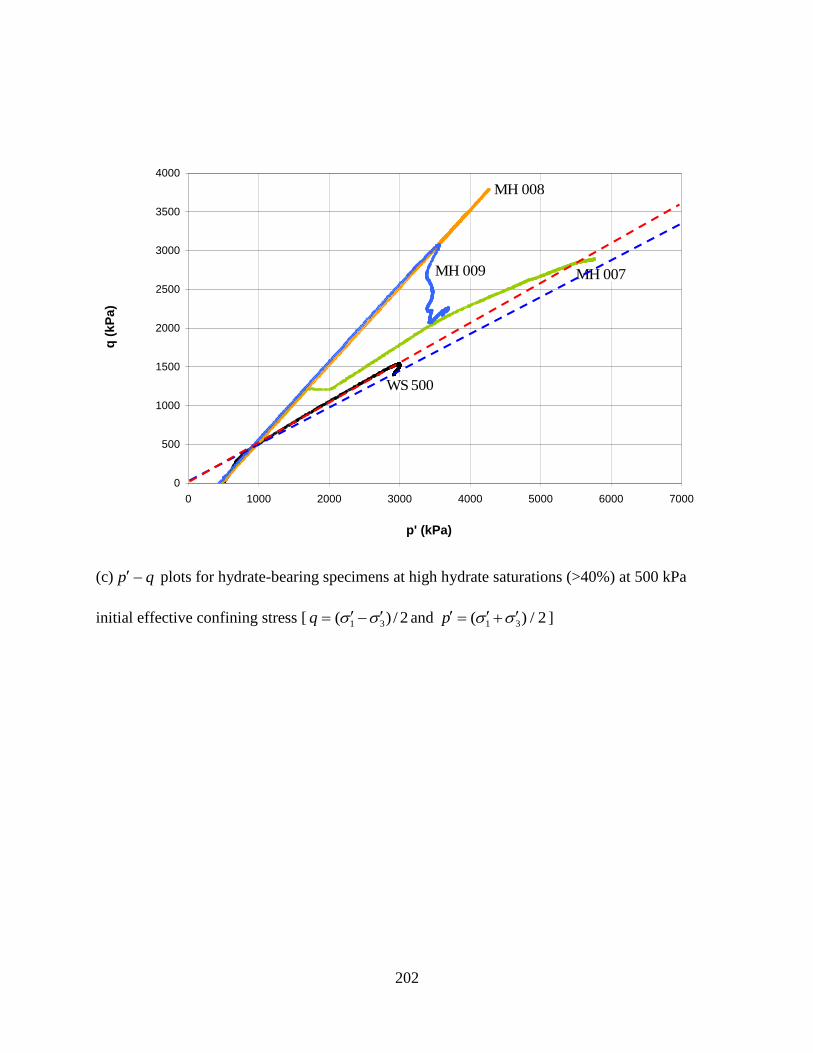
202
0
500
1000
1500
2000
2500
3000
3500
4000
0 1000 2000 3000 4000 5000 6000 7000
p' (kPa)
q (
kP
a)
500 WS
007 MH
008 MH
009 MH
(c) qp plots for hydrate-bearing specimens at high hydrate saturations (>40%) at 500 kPa
initial effective confining stress [ 2/)( 31 q and 2/)( 31 p ]

203
0
1000
2000
3000
4000
5000
6000
0 1000 2000 3000 4000 5000 6000 7000 8000 9000
p' (kPa)
q (
kP
a)
1000 WS
010 MH
011 MH
012 MH
013 MH
(d) qp plots for hydrate-bearing specimens at high hydrate saturations (>40%) at 1000 kPa
initial effective confining stress [ 2/)( 31 q and 2/)( 31 p ]
Figure 5.21: qp plots for hydrate-bearing specimens
The dashed blue line represents the steady state obtained using the conditions at phase
transformation for the water saturated reference tests performed at the corresponding initial
effective confining stress. The dashed red line represents the Mohr-Coulomb failure criterion for
the non-cohesive water saturated sand specimens. The gradient of the line relates to the
mobilised friction angle as given by sintan . The failure shear strength of each hydrated
specimen is denoted by a solid green circle in (a).
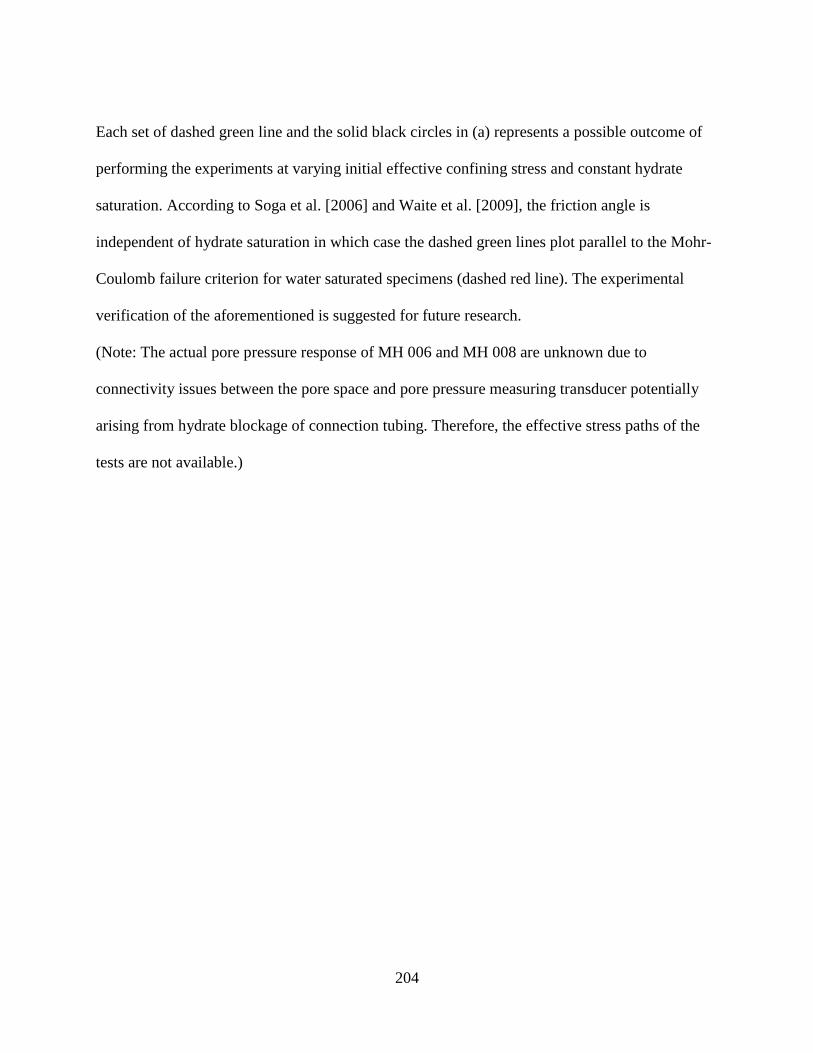
204
Each set of dashed green line and the solid black circles in (a) represents a possible outcome of
performing the experiments at varying initial effective confining stress and constant hydrate
saturation. According to Soga et al. [2006] and Waite et al. [2009], the friction angle is
independent of hydrate saturation in which case the dashed green lines plot parallel to the Mohr-
Coulomb failure criterion for water saturated specimens (dashed red line). The experimental
verification of the aforementioned is suggested for future research.
(Note: The actual pore pressure response of MH 006 and MH 008 are unknown due to
connectivity issues between the pore space and pore pressure measuring transducer potentially
arising from hydrate blockage of connection tubing. Therefore, the effective stress paths of the
tests are not available.)
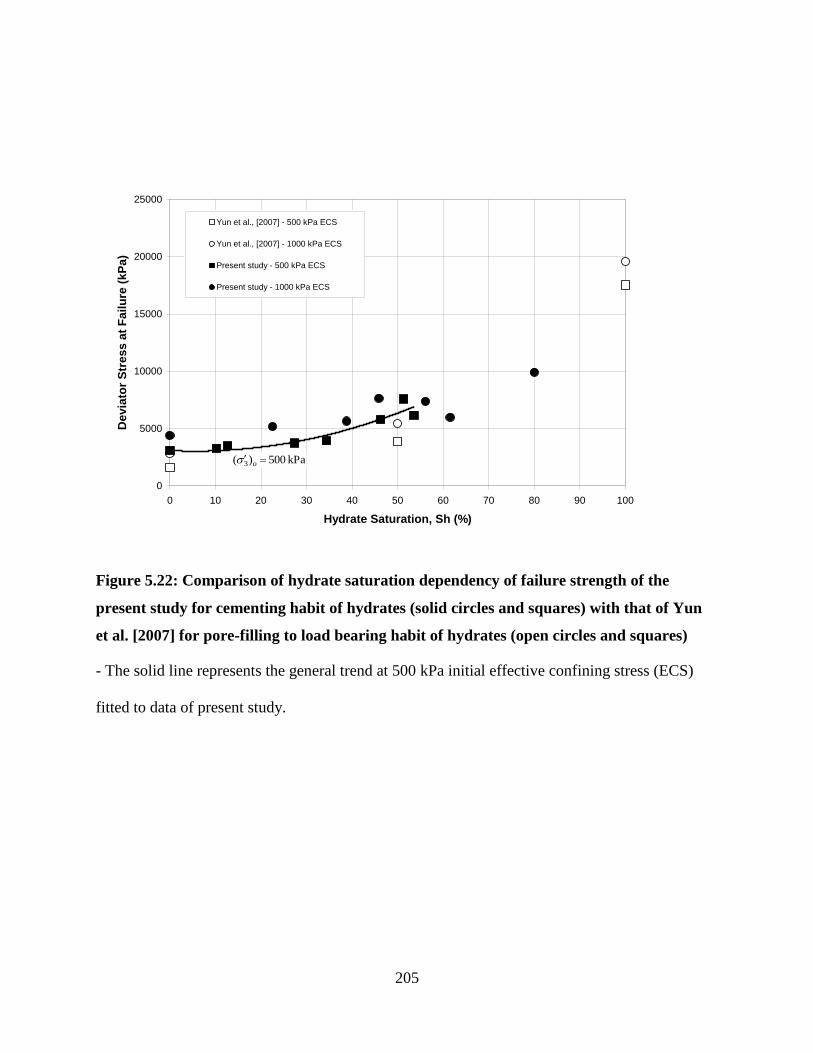
205
0
5000
10000
15000
20000
25000
0 10 20 30 40 50 60 70 80 90 100
Hydrate Saturation, Sh (%)
Devia
tor
Str
ess a
t F
ail
ure
(kP
a)
Yun et al., [2007] - 500 kPa ECS
Yun et al., [2007] - 1000 kPa ECS
Present study - 500 kPa ECS
Present study - 1000 kPa ECS
kPa 500)( 3 o
Figure 5.22: Comparison of hydrate saturation dependency of failure strength of the
present study for cementing habit of hydrates (solid circles and squares) with that of Yun
et al. [2007] for pore-filling to load bearing habit of hydrates (open circles and squares)
- The solid line represents the general trend at 500 kPa initial effective confining stress (ECS)
fitted to data of present study.

206
0
200
400
600
800
1000
1200
1400
1600
0 2 4 6 8 10 12 14 16 18 20
Deviator Stress at Failure (MPa)
Secan
t S
tiff
ness (
MP
a)
Yun et al. [2007] - 500 kPa ECS
Yun et al. [2007] - 1000 kPa ECS
Present study - 500 kPa ECS
Present study - 1000 kPa ECS
Stiffness-Strength Correlation for pore filling to load bearinghydrates - Santamarina and Ruppel [2008]
Figure 5.23: Comparison of strength-stiffness correlation for the present study for
cementing habit of hydrates (solid circles and squares) with that obtained by Yun et al.
[2007] for pore-filling to load bearing habit of hydrates (open circles and squares)
- The solid line represents the strength-stiffness correlation of Santamarina and Ruppel [2008]
developed by fitting to the data of Yun et al. [2007].
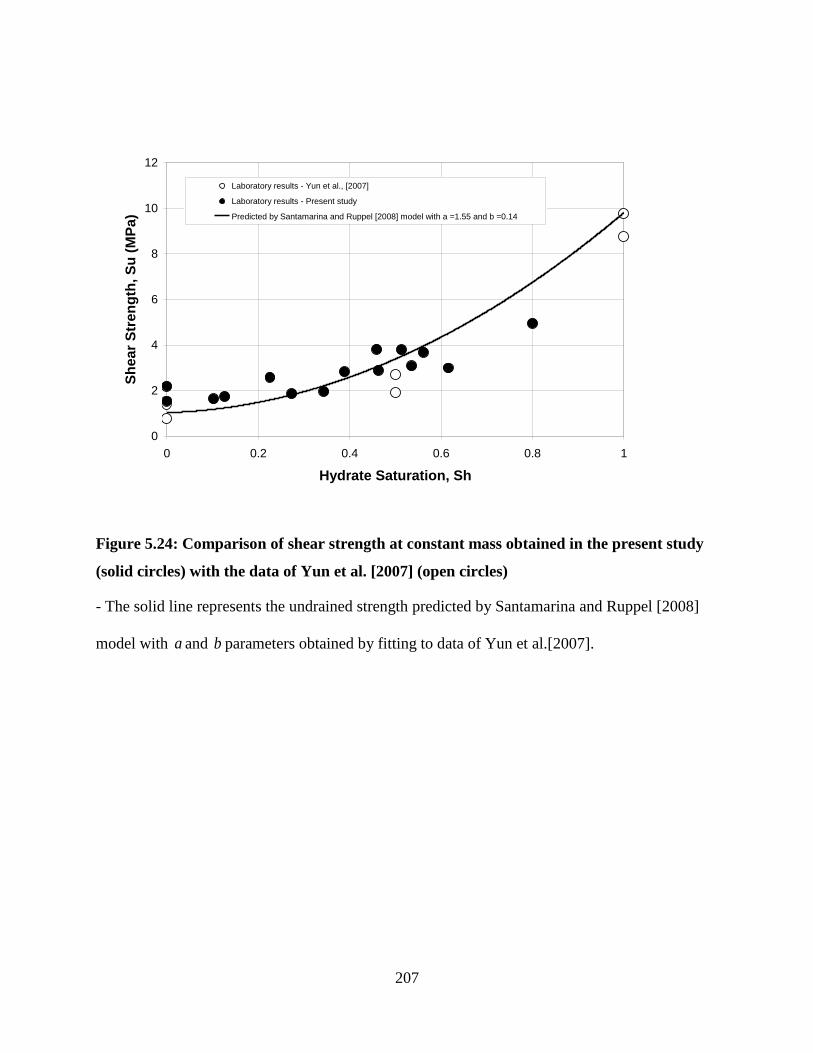
207
0
2
4
6
8
10
12
0 0.2 0.4 0.6 0.8 1
Hydrate Saturation, Sh
Sh
ea
r S
tre
ng
th,
Su
(M
Pa
)
Laboratory results - Yun et al., [2007]
Laboratory results - Present study
Predicted by Santamarina and Ruppel [2008] model with a =1.55 and b =0.14
Figure 5.24: Comparison of shear strength at constant mass obtained in the present study
(solid circles) with the data of Yun et al. [2007] (open circles)
- The solid line represents the undrained strength predicted by Santamarina and Ruppel [2008]
model with a and b parameters obtained by fitting to data of Yun et al.[2007].
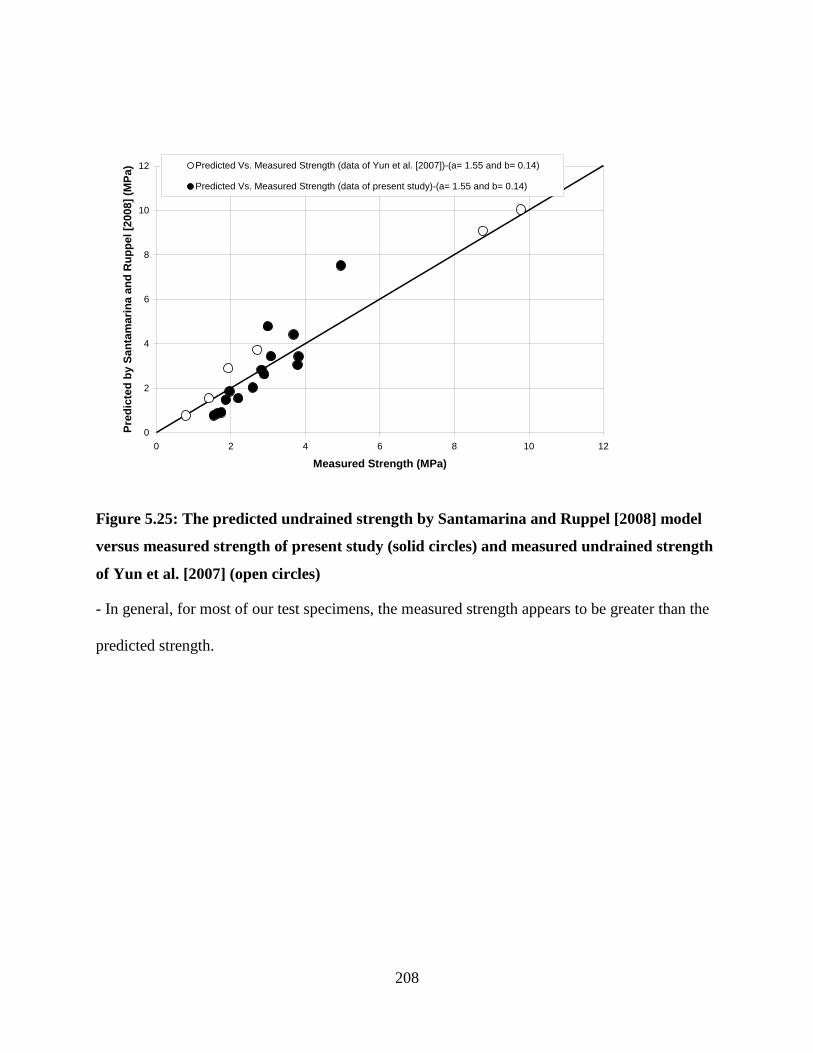
208
0
2
4
6
8
10
12
0 2 4 6 8 10 12
Measured Strength (MPa)
Pre
dic
ted
by S
an
tam
ari
na a
nd
Ru
pp
el
[2008]
(MP
a) Predicted Vs. Measured Strength (data of Yun et al. [2007])-(a= 1.55 and b= 0.14)
Predicted Vs. Measured Strength (data of present study)-(a= 1.55 and b= 0.14)
Figure 5.25: The predicted undrained strength by Santamarina and Ruppel [2008] model
versus measured strength of present study (solid circles) and measured undrained strength
of Yun et al. [2007] (open circles)
- In general, for most of our test specimens, the measured strength appears to be greater than the
predicted strength.
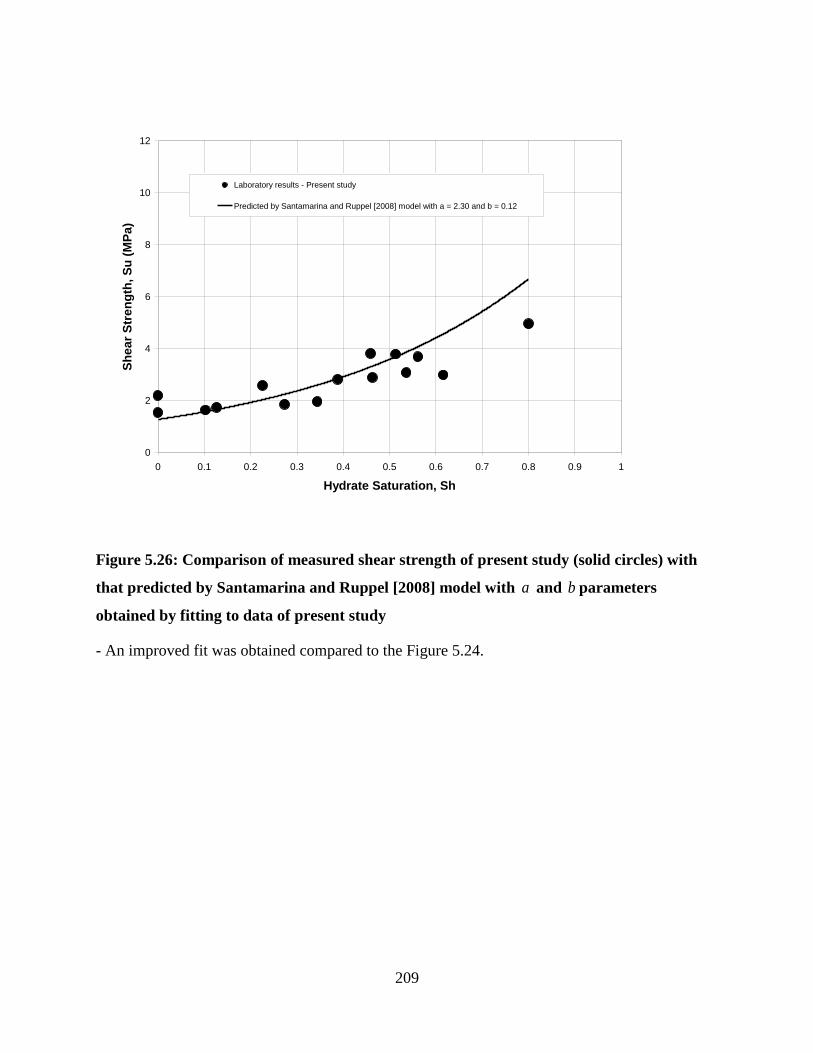
209
0
2
4
6
8
10
12
0 0.1 0.2 0.3 0.4 0.5 0.6 0.7 0.8 0.9 1
Hydrate Saturation, Sh
Sh
ea
r S
tre
ng
th,
Su
(M
Pa
)
Laboratory results - Present study
Predicted by Santamarina and Ruppel [2008] model with a = 2.30 and b = 0.12
Figure 5.26: Comparison of measured shear strength of present study (solid circles) with
that predicted by Santamarina and Ruppel [2008] model with a and b parameters
obtained by fitting to data of present study
- An improved fit was obtained compared to the Figure 5.24.
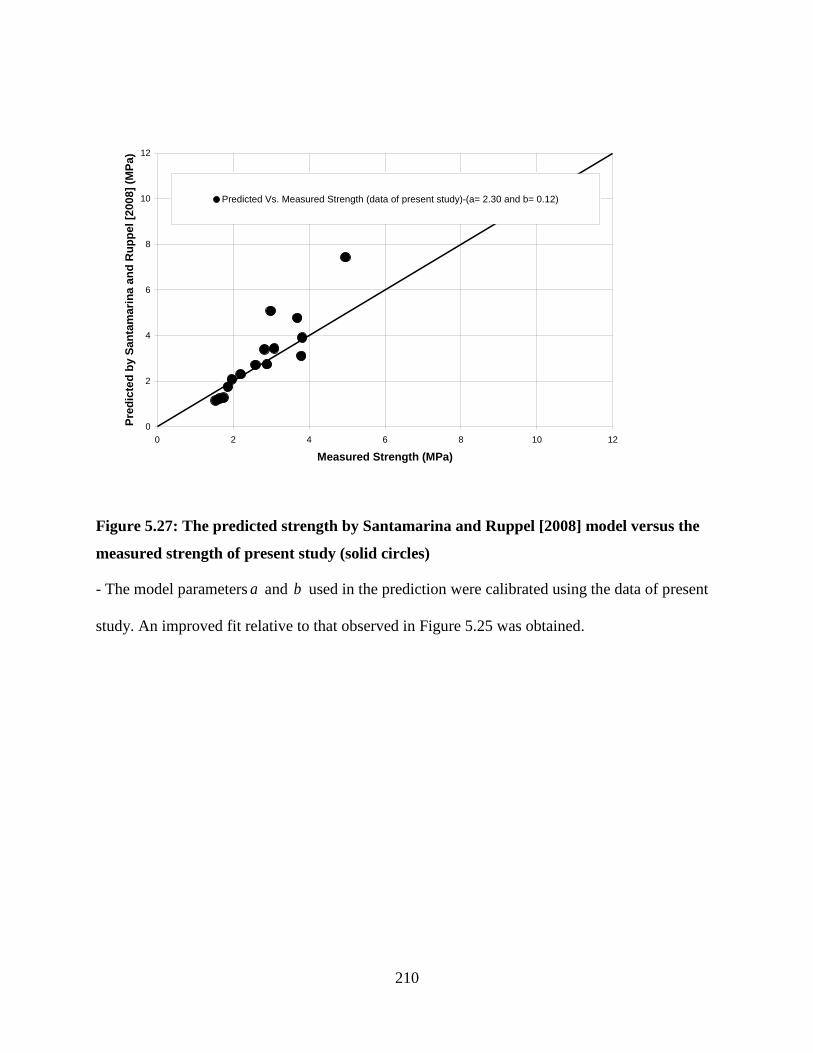
210
0
2
4
6
8
10
12
0 2 4 6 8 10 12
Measured Strength (MPa)
Pre
dic
ted
by S
an
tam
ari
na a
nd
Ru
pp
el
[2008]
(MP
a)
Predicted Vs. Measured Strength (data of present study)-(a= 2.30 and b= 0.12)
Figure 5.27: The predicted strength by Santamarina and Ruppel [2008] model versus the
measured strength of present study (solid circles)
- The model parameters a and b used in the prediction were calibrated using the data of present
study. An improved fit relative to that observed in Figure 5.25 was obtained.
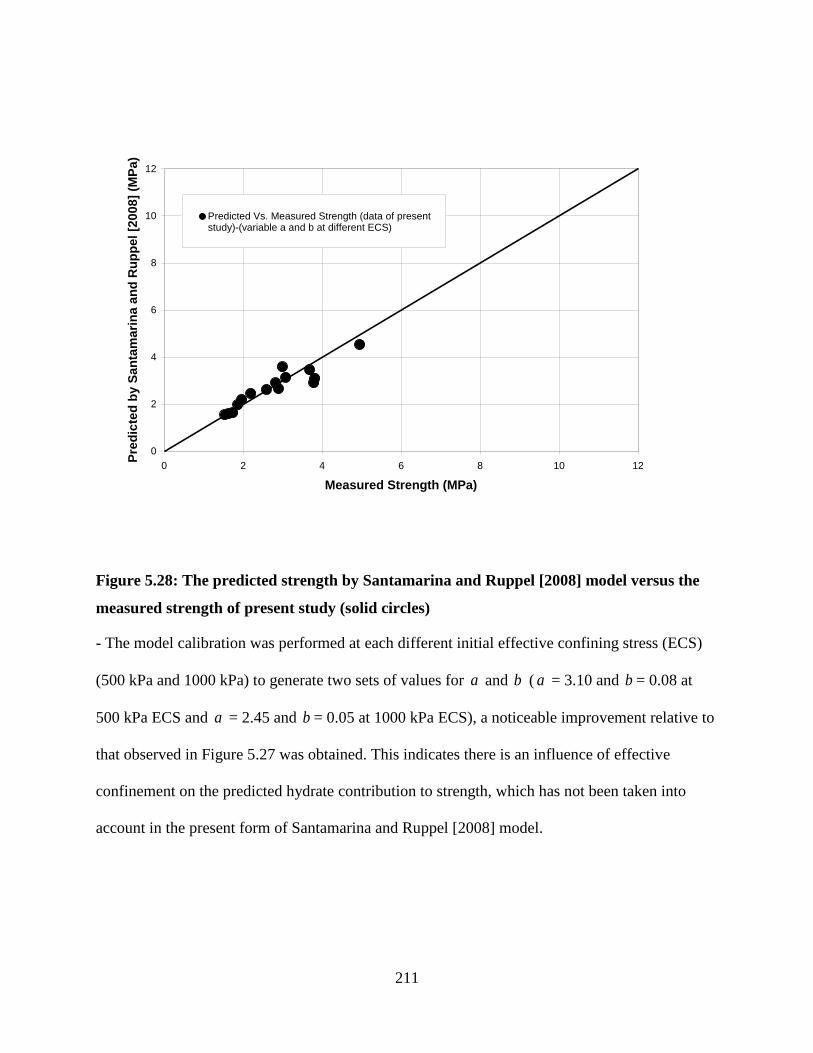
211
0
2
4
6
8
10
12
0 2 4 6 8 10 12
Measured Strength (MPa)
Pre
dic
ted
by
Sa
nta
ma
rin
a a
nd
Ru
pp
el
[20
08
] (M
Pa
)
Predicted Vs. Measured Strength (data of presentstudy)-(variable a and b at different ECS)
Figure 5.28: The predicted strength by Santamarina and Ruppel [2008] model versus the
measured strength of present study (solid circles)
- The model calibration was performed at each different initial effective confining stress (ECS)
(500 kPa and 1000 kPa) to generate two sets of values for a and b ( a = 3.10 and b = 0.08 at
500 kPa ECS and a = 2.45 and b = 0.05 at 1000 kPa ECS), a noticeable improvement relative to
that observed in Figure 5.27 was obtained. This indicates there is an influence of effective
confinement on the predicted hydrate contribution to strength, which has not been taken into
account in the present form of Santamarina and Ruppel [2008] model.
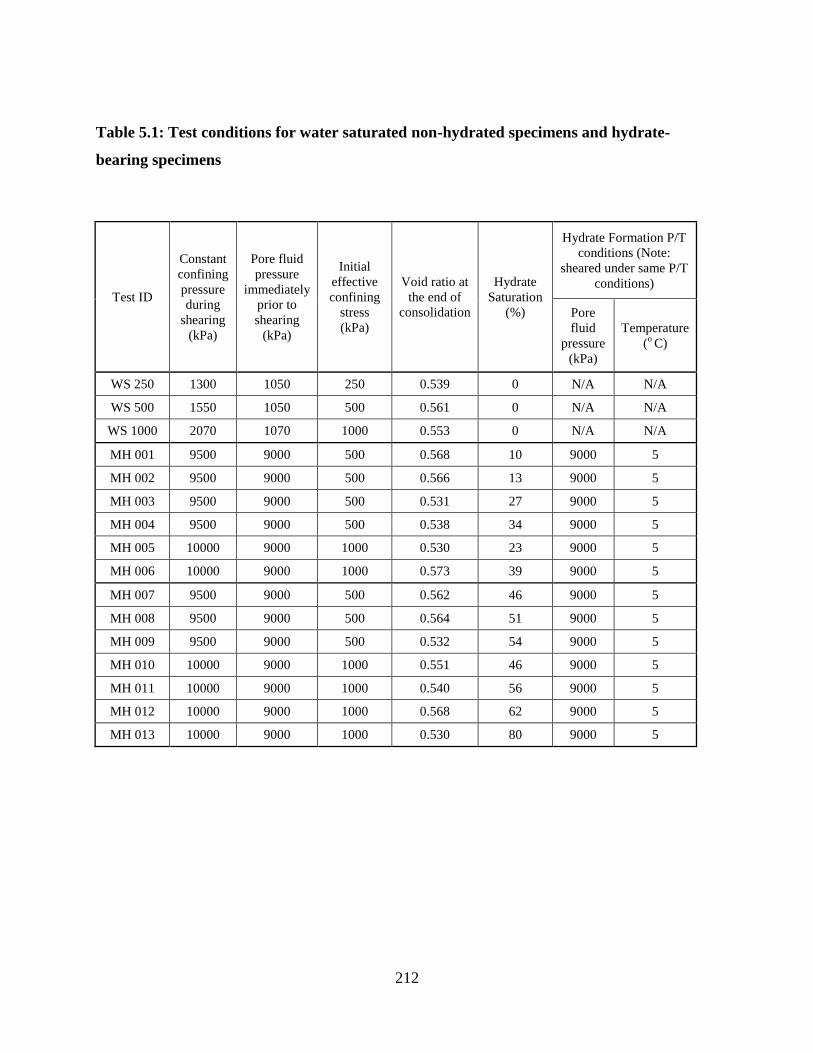
212
Table 5.1: Test conditions for water saturated non-hydrated specimens and hydrate-
bearing specimens
Test ID
Constant
confining
pressure
during
shearing
(kPa)
Pore fluid
pressure
immediately
prior to
shearing
(kPa)
Initial
effective
confining
stress
(kPa)
Void ratio at
the end of
consolidation
Hydrate
Saturation
(%)
Hydrate Formation P/T
conditions (Note:
sheared under same P/T
conditions)
Pore
fluid
pressure
(kPa)
Temperature
(o C)
WS 250 1300 1050 250 0.539 0 N/A N/A
WS 500 1550 1050 500 0.561 0 N/A N/A
WS 1000 2070 1070 1000 0.553 0 N/A N/A
MH 001 9500 9000 500 0.568 10 9000 5
MH 002 9500 9000 500 0.566 13 9000 5
MH 003 9500 9000 500 0.531 27 9000 5
MH 004 9500 9000 500 0.538 34 9000 5
MH 005 10000 9000 1000 0.530 23 9000 5
MH 006 10000 9000 1000 0.573 39 9000 5
MH 007 9500 9000 500 0.562 46 9000 5
MH 008 9500 9000 500 0.564 51 9000 5
MH 009 9500 9000 500 0.532 54 9000 5
MH 010 10000 9000 1000 0.551 46 9000 5
MH 011 10000 9000 1000 0.540 56 9000 5
MH 012 10000 9000 1000 0.568 62 9000 5
MH 013 10000 9000 1000 0.530 80 9000 5
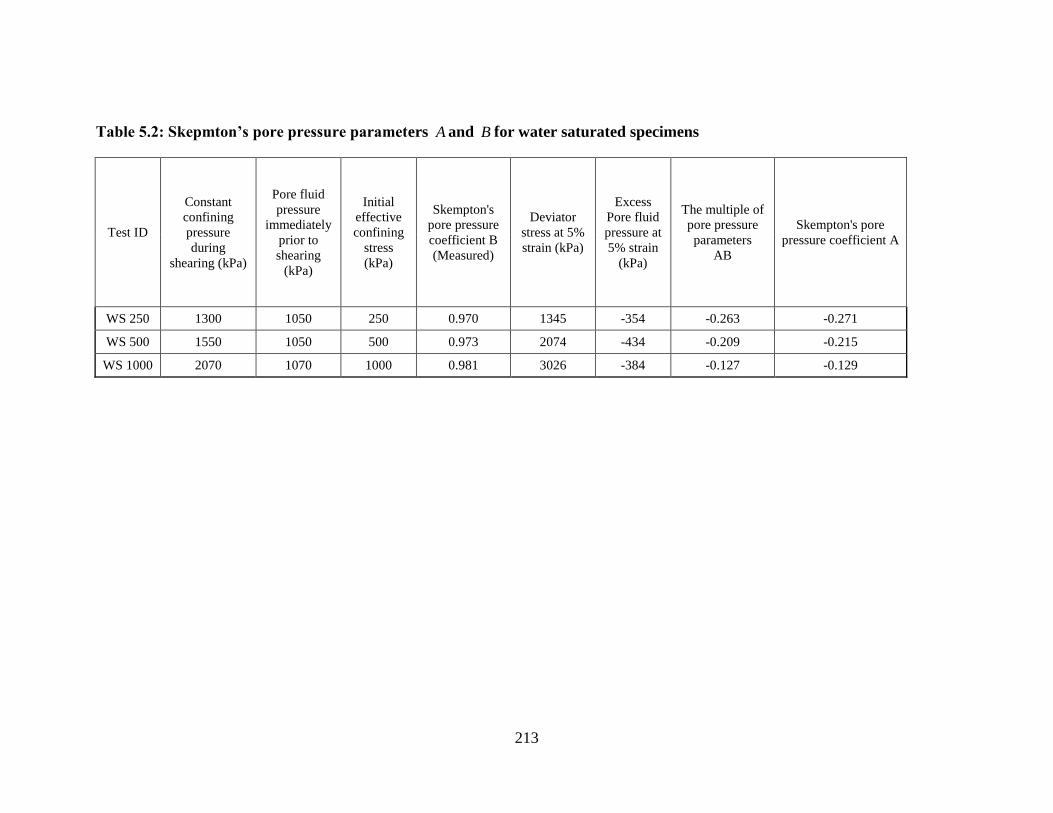
213
Table 5.2: Skepmton’s pore pressure parameters A and B for water saturated specimens
Test ID
Constant
confining
pressure
during
shearing (kPa)
Pore fluid
pressure
immediately
prior to
shearing
(kPa)
Initial
effective
confining
stress
(kPa)
Skempton's
pore pressure
coefficient B
(Measured)
Deviator
stress at 5%
strain (kPa)
Excess
Pore fluid
pressure at
5% strain
(kPa)
The multiple of
pore pressure
parameters
AB
Skempton's pore
pressure coefficient A
WS 250 1300 1050 250 0.970 1345 -354 -0.263 -0.271
WS 500 1550 1050 500 0.973 2074 -434 -0.209 -0.215
WS 1000 2070 1070 1000 0.981 3026 -384 -0.127 -0.129

214
Table 5.3: Biot’s Effective stress coefficient for hydrate-bearing specimens
Test ID
Hydrate
Saturation
(%)
Initial
effective
confining
stress
(kPa)
Aggregated
compressibility
of the solid
constituents
(soil and hydrate)
(Mpa-1
) C's
Compressibility of
hydrate-cemented soil
skeleton
(Mpa-1
) Cc
Biot's effective stress
coefficient
= (1-C's/Cc)
MH 001 10.21
500
2.81E-05 4.00E-03 0.993
MH 002 12.67 2.86E-05 6.79E-03 0.996
MH 003 27.34 3.10E-05 5.61E-03 0.994
MH 004 34.36 3.23E-05 5.00E-03 0.994
MH 007 46.27 3.47E-05 4.68E-03 0.993
MH 008 51.32 3.57E-05 1.25E-03 0.971
MH 009 53.56 3.55E-05 1.88E-03 0.981
MH 005 22.56
1000
3.01E-05 3.75E-03 0.992
MH 006 38.84 3.35E-05 3.45E-03 0.990
MH 010 45.91 3.45E-05 1.88E-03 0.982
MH 011 56.12 3.61E-05 1.69E-03 0.979
MH 012 61.54 3.76E-05 3.12E-03 0.988
MH 013 80.00 4.00E-05 7.50E-04 0.947

215
Table 5.4: Typical values of constituent compressibility
Specimen constituents
Compressibility of
the specimen
constituents (Mpa-1
)
References
(a) Soil mineral grains
2.78E-05 Stroll and Kan [1981], Hovem and Ingram [1979]; Stern et
al. [1985], Turgut and Yamamoto [1990]
2.50E-05 Ogushwitz et al. [1985]
2.63E-05 Richardson et al. [2002] - Used in the calculations
2.13E-05 Richardson et al. [2002]
2.73E-05 Waite et al. [2000] - As reported in Priest et al. [2005]
(b) Solid methane hydrate 1.30E-04 Waite et al. [2000] - As reported in Priest et al. [2005] -
Used in the calculations
(c) Gaseous methane 1.31E-01
At the relative pressure of 9000 kPa and temperature 5o C
calculated with the use of Duan et al. [1992b] - Used in the
calculations

216
Table 5.5: The calculated values of pore pressure coefficient B for hydrate-bearing specimens
Test ID
Hydrate
Saturation
(%)
Initial
effective
confining
stress
(kPa)
Aggregated
compressibility
of the solid
constituents
(soil and
hydrate)
(Mpa-1
) C's
Compressibility
of hydrate-
cemented soil
skeleton
(Mpa-1
) Cc
Pore space
compressibility
Cv (= Gas
compressibility)
(Mpa-1
)
Biot's effective
stress coefficient
= (1-C's/Cc)
Skempton's Pore
Pressure
coefficient B
MH 001 10.21
500
2.81E-05 4.00E-03 1.306E-01 0.993 0.086
MH 002 12.67 2.86E-05 6.79E-03 1.306E-01 0.996 0.142
MH 003 27.34 3.10E-05 5.61E-03 1.306E-01 0.994 0.146
MH 004 34.36 3.23E-05 5.00E-03 1.306E-01 0.994 0.143
MH 007 46.27 3.47E-05 4.68E-03 1.306E-01 0.993 0.156
MH 008 51.32 3.57E-05 1.25E-03 1.306E-01 0.971 0.052
MH 009 53.56 3.55E-05 1.88E-03 1.306E-01 0.981 0.082
MH 005 22.56
1000
3.01E-05 3.75E-03 1.306E-01 0.992 0.097
MH 006 38.84 3.35E-05 3.45E-03 1.306E-01 0.990 0.106
MH 010 45.91 3.45E-05 1.88E-03 1.306E-01 0.982 0.070
MH 011 56.12 3.61E-05 1.69E-03 1.306E-01 0.979 0.078
MH 012 61.54 3.76E-05 3.12E-03 1.306E-01 0.988 0.147
MH 013 80.00 4.00E-05 7.50E-04 1.306E-01 0.947 0.077
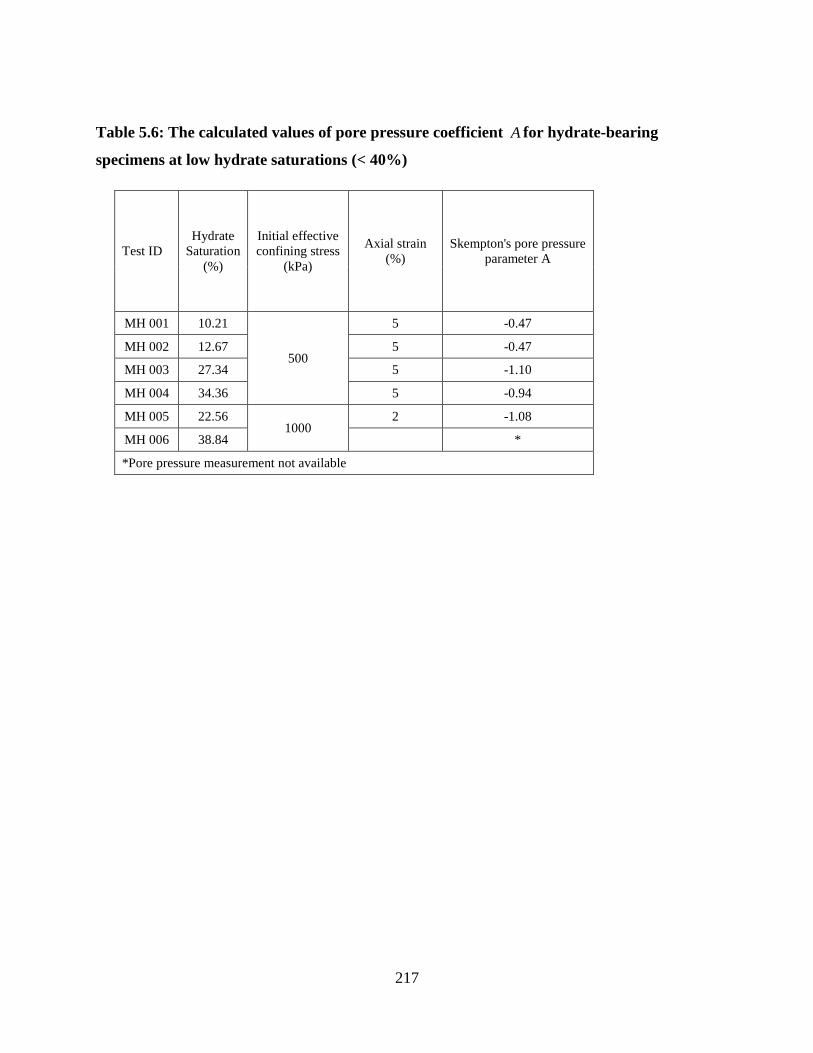
217
Table 5.6: The calculated values of pore pressure coefficient A for hydrate-bearing
specimens at low hydrate saturations (< 40%)
Test ID
Hydrate
Saturation
(%)
Initial effective
confining stress
(kPa)
Axial strain
(%)
Skempton's pore pressure
parameter A
MH 001 10.21
500
5 -0.47
MH 002 12.67 5 -0.47
MH 003 27.34 5 -1.10
MH 004 34.36 5 -0.94
MH 005 22.56 1000
2 -1.08
MH 006 38.84 *
*Pore pressure measurement not available

218
Table 5.7: Triaxial compression strength of non-hydrated and hydrated specimens at different initial effective confining stress
and hydrate saturations
Test ID
Initial
effective
confining
stress
(kPa)
Hydrate
Saturation
(%)
Formation P/T
conditions (Note:
sheared under same P/T
conditions)
Pore fluid
pressure
immediately
prior to
shearing
(kPa)
Constant
confining
pressure
during
shearing
(kPa)
Pore space
consistency
during
shearing
(Gas: G,
Water: W,
Hydrate:
H)
Initial void
ratio
Void ratio at
the end of
consolidation Pore
fluid
pressure
(kPa)
Temperature
(o C)
WS 250 250 0 1050 5 1050 1300 W 0.548 0.539
WS 500 500 0 1050 5 1050 1550 W 0.572 0.561
WS 1000 1000 0 1070 5 1070 2070 W 0.560 0.553
MH 001 500 10.2 9000 5 9000 9500 GH 0.579 0.568
MH 002 500 12.7 9000 5 9000 9500 GH 0.574 0.566
MH 003 500 27.3 9000 5 9000 9500 GH 0.543 0.531
MH 004 500 34.4 9000 5 9000 9500 GH 0.550 0.538
MH 005 1000 22.6 9000 5 9000 10000 GH 0.546 0.530
MH 006 1000 38.8 9000 5 9000 10000 GH 0.589 0.573
MH 007 500 46.3 9000 5 9000 9500 GH 0.567 0.562
MH 008 500 51.3 9000 5 9000 9500 GH 0.571 0.564
MH 009 500 53.6 9000 5 9000 9500 GH 0.541 0.532
MH 010 1000 45.9 9000 5 9000 10000 GH 0.565 0.551
MH 011 1000 56.1 9000 5 9000 10000 GH 0.551 0.540
MH 012 1000 61.5 9000 5 9000 10000 GH 0.577 0.568
MH 013 1000 80.0 9000 5 9000 10000 GH 0.545 0.530

219
Table 5.7: Triaxial compression strength of non-hydrated and hydrated specimens at different initial effective confining stress
and hydrate saturations-results….contd.
Test ID
Hydrate
Saturation
(%)
Maximum
deviator
stress
(kPa)
Secant
Stiffness,
E50 (MPa)
Initial
tangential
stiffness
(Mpa)
Residual /
Ultimate
deviator
stress (kPa)
Maximum
negative excess
pore pressure
developed in
response to
shearing (kPa)
WS 250 0 2682 28 122 2417 -1025
WS 500 0 3083 48 233 2798 -1014
WS 1000 0 4397 73 360 3799 -1052
MH 001 10.2 3273 167 450 3123 -638
MH 002 12.7 3485 223 265 3211 -666
MH 003 27.3 3726 82 321 3653 -1276
MH 004 34.4 3927 35 360 3915 -1398
MH 005 22.6 5177 331 480 4752 -1052
MH 006 38.8 5643 326 521 5075 -14
MH 007 46.3 5786 46 385 5784 -2371
MH 008 51.3 7584 1063 1439 5419 20
MH 009 53.6 6157 858 960 4334 -947
MH 010 45.9 7636 789 960 5363 -1020
MH 011 56.1 7373 920 1067 4992 -1018
MH 012 61.5 5982 289 577 5237 -1774
MH 013 80.0 9910 291 2400 9348 -2086
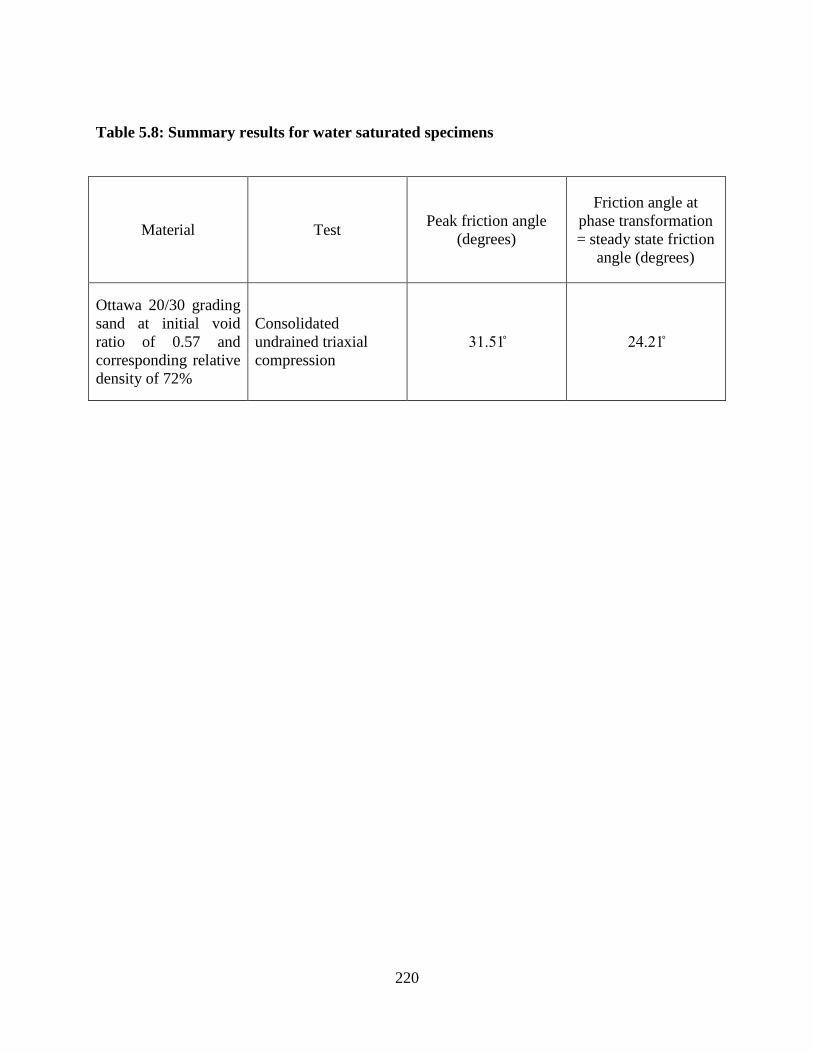
220
Table 5.8: Summary results for water saturated specimens
Material Test Peak friction angle
(degrees)
Friction angle at
phase transformation
= steady state friction
angle (degrees)
Ottawa 20/30 grading
sand at initial void
ratio of 0.57 and
corresponding relative
density of 72%
Consolidated
undrained triaxial
compression
31.51 24.21

221
Table 5.9: Mobilised friction angle and the measured inclination of the shearing plane
Test ID
Hydrate
Saturation
(%)
Initial
effective
confining
stress
(kPa)
Measured
inclination of the
shearing plane to
the direction of
minor principal
stress ( )
Mobilised friction
angle assuming
Mohr-Coulomb
solution ( )
MH 008 22.56 500
54 18.00
MH 009 38.84 60 30.00
MH 010 45.91
1000
60 30.00
MH 012 61.54 65 40.00
MH 013 80.00 60 30.00
222
Chapter Six: Conclusions and Recommendations
6.1 Conclusions
This thesis is focused on introducing a novel formation procedure to artificially synthesise
representative hydrate-bearing sediments in the laboratory and investigating the behaviour of
hydrate-bearing sediments under triaxial compression conditions. Additionally, attention had
been paid to accurately estimating the hydrate saturations. The findings have led to several
conclusions, which are presented below in relevance to the main findings of the Chapters 2, 3, 4,
and 5.
Methane Hydrates in Porous Soil Media-A Review - Chapter 2
Natural hydrate-bearing cores are greatly disturbed by the sample handling and specimen
preparation process. Particularly, freezing causes the greatest damage to the soil skeleton
and the pore structure while, depressurization and subsequent re-pressurization alters
hydrate distribution. Therefore, the use of laboratory synthesised hydrate-bearing
specimens is necessary in the study of hydrate-bearing sediments. More importantly, the
ability to form specimens representative of the hydrate habit which is of interest to the
study is of immense importance in our attempt to better understand the physical
properties of these sediments.
Artificial hydrate-bearing sediments formed with the use of initially partial water
saturated specimens are believed to be of grain cementing habit. Review of water
migration characteristics during formation suggests that evenness of hydrate distribution
may be obtained at low initial water saturations followed by rapid formation with
223
simultaneous nucleation at multiple sites. Post formation water saturation of these
sediments may lead to hydrate de-bonding from grain contacts resulting in pore filling to
load bearing hydrate habits. The review of hydrate formation process presented in
Chapter 2 provided insight into planning the laboratory formation procedure of the
present study.
Laboratory Synthesis of Methane Hydrate-Bearing Sediment – A novel method for laboratory
synthesis of methane hydrate-bearing sediment from water saturated gaseous methane -
Chapter 3
Hydrate formation from water saturated gaseous methane within initially partial water
saturated sand specimens apparently results in grain cementing and/or coating hydrate
habit.
Two major factors were identified as determining the degree of success as to achieving
high hydrate saturations and forming specimens of uniform hydrate distribution
representative of grain cementing and/or coating growth habit: (1) initial availability of
minimal uniformly distributed water content, and (2) continuous feed of water rich
methane throughout the formation phase.
The formation procedure employed in the present study proves the possibility of
obtaining higher hydrate saturations compared to those obtained from other existing
procedures. As evident from the results uniform spatial distribution of hydrates was
obtained only at low hydrate saturations. Further research at grain scale may be employed
to confirm the deduced growth habit and the uniformity of hydrate distribution.
224
Estimating Pore Space Hydrate Saturation Using Dissociation Gas Evolution Measurements
(DGEM) - Chapter 4
The investigation of the sensitivity of hydrate saturation to various measurements performed in
the laboratory revealed:
P/T measurements of the system components at the laboratory are critical, particularly
when large quantities of methane are present at low density (specifically at high
temperatures and low pressures).
Volume measurements in the system components are critical when the methane density is
at its greatest (high pressure and low temperature).
The key findings of the sensitivity analysis on the use of different mathematical models to
generate methane densities representative of the true nature of the methane-water system
revealed:
Alternatives to ideal approximation such as Duan et al. [1992b] and CSMGem calculator
of Ballard [2002] should be used when conditions stray from ideal conditions. Therefore,
the Ideal Gas Law should be employed with caution.
Neglecting the water content in vapour phase, as done with the use of single component
models for methane such as Duan et al., [1992b], does not appear to have significant
impact on the estimated hydrate saturation.

225
Triaxial Compression Strength of Methane Hydrate-Bearing Coarse Granular Media -
Chapter 5
The series of laboratory tests on the triaxial compression behaviour of artificially synthesised
methane hydrate-bearing sand to investigate the initial confining stress and hydrate saturation
dependency of strength and stiffness led to the following conclusions:
At low hydrate saturations (<40%), the strength of hydrate-bearing sediments is affected
by initial effective confinement and hydrate saturation; greater strength is obtained at
greater initial effective confinement and higher hydrate saturations.
At low hydrate saturations (<40%), the stiffness of hydrate-bearing sediments is affected
by initial effective confinement and hydrate saturation; greater stiffness is obtained at
greater initial effective confinement and higher hydrate saturations.
The stress-strain behaviour at high hydrate saturations (> 40%), exhibits brittleness and
seemingly represents an altered strain hardening behaviour.
At high hydrate saturations (> 40%), hydrate-bearing sediments develop greater strength,
however, it is difficult to deduce a clear correlation between strength, initial effective
confinement, and saturation.
Also, at high hydrate saturations (> 40%), hydrate-bearing sediments develop greater
stiffness, however, it is difficult to deduce a clear correlation between stiffness and
saturation.
The stiffness of hydrate-bearing sediments at high hydrate saturations does not appear to
be significantly affected by initial effective confinement.

226
The in depth investigation of grain scale mechanisms of shearing and comparison of our
results to those obtained for non-cementing hydrates revealed:
At low saturations the strength is mainly governed by frictional resistance to shearing.
However, evidence of hydrate induced cohesion is also available.
At high saturations the peak strength is governed by the intact hydrate strength and/or
hydrate-mineral bonding strength.
At high saturations the residual strength is predominantly governed by the hydrate
saturation.
Stiffness is greatly determined by the hydrate habit; cementing and/or grain coating habit
showing greater stiffness at low saturations. At high saturations stiffness of non-
cementing hydrates may expect to be as comparable to that of cementing hydrates only if
the saturation is as high as such that the particulate body tend to behave as an aggregated
body.
6.2 Significance
This research marks the single most comprehensive laboratory investigation of triaxial
compression strength of methane hydrate-bearing sediments at constant mass undertaken to date.
The work presented in this thesis has made a significant contribution to the advancement of
hydrate knowledge in the form of the very findings that it presents and also in the form of
directions it provides for future research. Specifically, the knowledge of soil behaviour at
constant mass is important in evaluating the potential risks associated with short and long term
sediment behaviour related to drilling and methane production, reservoir subsidence, and
mechanisms that lead to slope instability issues associated with shallow hydrated sediments. The
227
experimental investigation observes the shear failure of these sediments under loading conditions
with restricted pore pressure dissipation. Further, as can be deduced from the observations of
pore pressure development, it also suggests of another kind of failure; failure due
depressurisation (or negative excess pore pressure development) which brings a portion of the
sediment outside the hydrate stability boundary thus inducing dissociation.
6.3 A path forward
The work presented in this thesis has taken our understanding of the behaviour of hydrate-
bearing sediments a step forward. However, understanding the mechanics of these sediments still
require significant study. As such, continuous deployment of research effort is needed on both
experimental and numerical aspects for the development of hydrate sciences. The following
areas of potential future development are identified based on the experience gained throughout
the years working towards the presentation of this work:
1. Experimental methods
a. Improvements in experimental methods to isolate the nature of hydrate habit,
including overcoming limitations such as possible pore space compressibility
b. Incorporation of advanced technology (such as microscopic imaging) with
conventional methods of geomechanical testing to better understand the particle level
mechanisms
2. Further experimental investigation such as:
a. Triaxial compression testing to verify the hypothesised behaviours.

228
b. Isotropic loading and unloading tests to better understand the pore pressure
development, potential induced hydrate dissociation, and after-effects on pore
pressure development and volume change behaviour.
3. Further experimental investigations on micro and macro scale hydrate growth
habits/morphologies achieved with different specimen preparation techniques, and
comparison to formation of natural hydrates
4. Further experimental investigations on the hydrate-mineral bonding strength and
compressive/tensile strength of intact hydrate
5. Investigations on the effects of host sediment properties, formation P/T conditions, and
subsequent changes to the P/T conditions in relevance to all aforementioned experimental
investigations
6. Further improvements to numerical correlation of geomechanical properties and the pore
space presence of hydrate
a. By inclusion of mathematical expression of hydrate-sediment interaction (or the
formation habit effects)
b. By inclusion of potential deterministic factors of intact hydrate compressive/tensile
strength (such as confining pressure and temperature)
229
References
Andersen, G. R., C. W. Swan, C. C. Ladd, and J. T. Germaine (1995), Small-strain behavior of
frozen sand in triaxial compression, Can. Geotech. J., 32, 428–451.
Alshibli, K. A., Batiste, S. N., & Sture, S. (2003). Strain localization in sand: plane strain versus
triaxial compression. Journal of Geotechnical and Geoenvironmental Engineering, 129(6),
483-494.
Aoyagi, .K, K. Y. Song, E. D. Sloan, P. B. Dharmawardhana, and K. Riki (1979), Improved
measurements and correlation of the water content of methane gas in equilibrium with
hydrate, paper presented at the 1979 Annual Convention, Gas Processors Association, 25-
28.
Aoyagi, K, K. Y. Song, R. Kobayashi, E. D. Sloan, and P. B. Dharmawardhana (1980), The
water content and correlation of the water content of methane in equilibrium with hydrates,
Report no. 45, Gas Processors Association, Tulsa, OK.
ASTM Standard C-778-12, Standard Specification for Standard Sand, American Society for
Testing and Materials (ASTM), West Conshohocken, PA.
Ballard, A. L. (2002), A non-ideal hydrate solid solution model for a multi-phase equilibria
program, PhD Thesis, Chemical and Petroleum-Refining Engineering, Colorado School of
Mines, Colorado, USA.
Ben-Naim, A., and M. Yaacobi (1974), Effects of solutes on the strength of hydrophobic
interaction and its temperature dependence, Journal of Physical Chemistry, 78, 170-175.
230
Berge, L. I., K. A. Jacobsen, and A. Solstad (1999), Measured acoustic wave velocities of R11
(CCl3F) hydrate samples with and without sand as a function of hydrate concentration,
Journal of Geophysical Research, 104, 15, 415-424, doi: 10.1029/1999JB900098.
Bishop, A. W., & Henkel, D. J. (1962). The measurement of soil properties in the triaxial test,
2nd Edition, Edward Arnold (Publishers) Ltd., London, United Kingdom.
Boswell, R., and T. Collett (2006), The gas hydrates resource pyramid, Fire in the Ice: Methane
Hydrate Newsletter, fall, pp. 5–7, Office of Fossil Energy, Natl. Energy Technol. Lab.,
U.S. Dep. of Energy, Washington, D. C.
Bowden, F. P. and Tabor, D. (1959). Friction and Lubrification, Dunod, Paris.
Buffett, B., and O. Zatsepina (2000), Formation of gas hydrate from dissolved gas in natural
porous media, Marine Geology., 164, 69–77, doi:10.1016/S0025-3227(99)00127-9.
Cameron, I., Y. P. Handa, and T. H. W. Baker (1990), Compressive strength and creep behaviour
of hydrate-consolidated sand, Canadian Geotechnical Journal, 27, 255-258.
Castro, G., Poulos, S. J., France, J. W., and Enos, J. L. (1982). Liquefaction induced by cyclic
loading. Report submitted to National Science Foundation, Washington, DC.
Chand, S., T. A. Minshull, J. A. Priest, A. I. Best, C. R. I. Clayton, and W. F. Waite (2006), An
effective medium inversion algorithm for gas hydrate quantification and its application to
laboratory and borehole measurements of gas hydrate-bearing sediments, Geophysical
Journal International, 166, 543-552.
Chapoy, A., C. Coquelet, and D. Richon (2005), Corrigendum to “Revised solubility data and
modeling of water in the gas phase of the methane/water binary system at temperatures
231
from 283.08 to 318.12 K and pressures up to 34.5 MPa” [Fluid Phase Equilibria 214
(2003) 101-117], Fluid Phase Equilib., 230, 210-214.
Chapoy, A., H. Haghighi, R. Burgass, and B. Tohidi (2010), Gas hydrates in low water content
gases: Experimental measurements and modelling using the CPA equation of state, Fluid
Phase Equilib., 292, 9-14.
Chapoy, A., A. H. Mohammadi, D. Richon, and B. Tohidi (2004), Gas solubility measurement
and modeling for methane-water and methane-ethane-n-butane-water systems at low
temperature conditions, Fluid Phase Equilib., 220, 113-121.
Cho, G., J. Dodds, and J. Santamarina (2005). Particle shape effects on packing density, stiffness
and strength: Natural and crushed sands. Internal report- Georgia Institute of Technology.
Cho, G., J. Dodds, and J. C. Santamarina (2006). Particle shape effects on packing density,
stiffness, and strength: natural and crushed sands. Journal of Geotechnical and
Geoenvironmental Engineering, 132, 5, 591-602.
Chuvilin, E. M., T. Ebinuma, Y. Kamata, T. Uchida, S. Takeya, J. Nagao, and H. Narita (2003),
Effects of temperature cycling on the phase transition of water in gas-saturated sediments,
Can. J. Phys., 81, 343–350, doi:10.1139/p03-028.
Circone, S., S. H. Kirby, and L. A. Stern (2005), Direct measurement of methane hydrate
composition along the hydrate equilibrium boundary, Journal of Physical Chemistry B,
109, 9468-75.
Clarke, M. A., M. Pooladi-Darvish, and P. R. Bishnoi (1999), A Method to Predict Equilibrium
Conditions of Gas Hydrate Formation in Porous Media, Ind. Eng. Chem. Res., 38, 2485-
2490.
232
Claussen, W. F., and M. F. Polglase (1952), Solubilities and structures in aqueous aliphatic
hydrocarbon solutions, Journal of the American Chemical Society, 74, 4817-4819.
Claypool, G. W., and I. R. Kaplan (1974), Natural Gases in Marine Sediments, pp. 99-139,
Plenum, New York, USA:
Clennell, M. B., M. Hovland, J. S. Booth, P. Henry, and W. J. Winters (1999), Formation of
natural gas hydrates in marine sediments: 1. Conceptual model of gas hydrate growth
conditioned by host sediment properties, J. Geophys. Res., 104, 22, 985-23, 003,
doi:10.1029/1999JB900175.
Collett, T. S. (2002), Energy resource potential of natural gas hydrates, AAPG Bull., 86, 1971–
1992.
Davie, M. K., O.Y. Zatsepina, and B. A. Buffett (2004), Methane solubility in marine hydrate
environments, Marine Geology, 203, 177-184.
Duan, Z., and S. Mao (2006), A thermodynamic model for calculating methane solubility,
density and gas phase composition of methane-bearing aqueous fluids from 273 to 523 K
and from 1 to 2000 bar, Geochimica et Cosmochimica Acta, 70, 3369-3386.
Duan, Z., N. Moller, and J. H. Weare (1992a), An equation of state for the CH4-CO2-H2O
system: II. Mixtures from 50 to 1000 oC and 0 to 1000 bar, Geochimica et Cosmochimica
Acta 56, 2619-2631.
Duan, Z., N. Moller, J. Greenberg, and J. H. Weare (1992b), An equation of state for the CH4-
CO2-H2O system: I. Pure systems from 0 to 1000oC and 0 to 8000 bar, Geochimica et
Cosmochimica Acta, 56, 2605-2617.
233
Duan, Z., N. Moller, J. Greenberg, and J. H. Weare (1992c), The prediction of methane solubility
in natural waters to high ionic strength from 0 to 250oC and from 0 to 1600 bar,
Geochimica et Cosmochimica Acta, 56, 1451-1460.
Durham, W. B., L. A. Stern, S. H. Kirby, and S. Circone (2005), Rheological comparisons and
structural imaging of sI and sII end-member gas hydrates and hydrate/sediment aggregates,
paper presented at Fifth International Conference on Gas Hydrates, pp. 607– 614, Tapir
Acad, Trondheim, Norway.
Dvorkin, J., M. B. Helgerud, W. F. Waite, S. H. Kirby, and A. Nur (2000), Introduction to
physical properties and elasticity models, in Natural Gas Hydrate: In Oceanic and
Permafrost Environments, edited by M. D. Max, pp. 245–260, Kluwer Acad., Dordrecht,
Netherlands.
Eaton, M., D. Mahajan, and R. Flood (2007), A novel high-pressure apparatus to study hydrate-
sediment interactions, Journal of Petroleum Science and Engineering, 56, 101-107.
Eaton, M. W., K. W. Jones, and D. Mahajan (2009), Mimicking natural systems: methane
hydrate formation – decomposition in depleted sediments, The Geological Society,
London, Special Publications, 319, 121-130.
Ebinuma, T., Y. Kamata, H. Minagawa, R. Ohmura, J. Nagao, and H. Narita (2005), Mechanical
properties of sandy sediment containing methane hydrate, paper presented at Fifth
International Conference on Gas Hydrates, Tapir Acad., Trondheim, Norway, 958–961.
Fernandez, A. L., and J. C. Santamarina (2001), Effect of cementation on the small-strain
parameters of sands, Can. Geotech. J., 38, 191–199, doi:10.1139/cgj-38-1-191.
234
Folas, G. K., E. W. Froyna, J. Lovland, G. M. Kontogeorgis, and E. Solbraa (2007), Data and
Prediction of water content of high pressure nitrogen, methane, and natural gas, Fluid
Phase Equilib., 252, 162-174.
Galloway, T. J., W. Ruska, P. S. Chappelear, and R. Kobayashi (1970), Experimental
Measurement of hydrate numbers for methane and ethane and comparison with theoretical
values, Ind. Eng. Chem. Fundam., 9(2), 237-243.
Gas Processors Association (1996), Thermodynamic Database Version 2.0, Oklahoma
State University, OK, USA.
Ghiassian, H., and J. L. H. Grozic (2011), Undrained Triaxial Testing Of Methane Hydrate
Bearing Soil Specimens, paper presented at 7th
International Conference on Gas Hydrates,
Edinburgh, Scotland, United Kingdom.
Gibbs, J. W. (1948), The collected works of J. Willard Gibbs, Thermodynamics, (1(1), Yale U.
Press, New Haven, CN.
Grozic, J. L. H. (2010). Interplay between gas hydrates and submarine slope failure. Advances in
Natural and Technological Hazards Research, Special Issue Submarine Mass Movements
and Their Consequences, Vol. 28, pp 11-30.
Grozic, J. L. H., and H. Ghiassian (2010). Undrained shear strength of methane hydrate-bearing
sand: Preliminary laboratory results, Proceedings 6th Canadian Permafrost Conference and
63rd Canadian Geotechnical Conference, Calgary.
Gupta, A., J. Lachance, E. D. Sloan, and C. A. Koh (2008), Measurements of methane hydrate
heat of dissociation using high pressure differential scanning calorimetry, Chem. Eng. Sci.,
63,5848–5853, doi:10.1016/j.ces.2008.09.002.

235
Hammerschmidt, E.G. (1934), Formation of gas hydrates in natural gas transmission lines,
Industrial and Engineering Chemistry, 8, 851-855.
Handa, Y. P. (1986), Compositions, enthalpies of dissociation, and heat capacities in the range
85 to 270 K for clathrate hydrates of methane, ethane, and propane, and enthalpy of
dissociation of isobutene hydrate, as determined by a heat-flow calorimeter, J. Chem.
Thermodynamics, 18, 915-921.
Handa, Y. P., and D. Stupin (1992), Thermodynamic properties and Dissociation Characteristics
of Methane and Propane Hydrates in 70-Å-Radius silica gel pores, J. Phys. Chem., 96,
8599-8603.
Hashemi ,S., A. Macchi, S. Bergeron, and P. Servio (2006), Prediction of methane and carbon
dioxide solubility in water in the presence of hydrate, Fluid Phase Equilibria, 246, 131-136.
Helgerud, M. B. (2001), Wave speeds in gas hydrate and sediments containing gas hydrate: A
laboratory and modeling study, Ph.D. thesis, Stanford University, California, USA.
Hester, K. C., Z. Huo, A. L. Ballard, C. A. Koh, K. T. Miller, and E. D. Sloan (2007), Thermal
expansivity of sI and sII clathrate hydrates, Journal of Physical Chemistry B, 111, 8830-
8835.
Hill, R., (1952). The elastic behaviour of crystalline aggregate. Proc. Phys. Soc. London, Sect. A,
65, 349-354.
Howard, J. J., K. C. Hester, J. C. Stevens, and M. B. Rydzy (2011), Ultrasonic velocity
measurements during experimental CH4 hydrate formation and CO2 exchange, paper
presented at 7th
International Conference on Gas Hydrates, Edinburgh, Scotland, United
Kingdom.

236
Huo, Z., K. Hester, E. D. Sloan Jr., and K. T. Miller (2003), Methane hydrate nonstoichiometry
and phase diagram, AICHE J., 49, 1300-1306.
Hvorslev, M. J. (1969), Physical properties of remoulded cohesive soils, Vicksburg: U.S. Army
Engineer Waterways Experiment Station, Translation 69-5.
Hyodo, M., A. F. L. Hyde, Y. Nakata, N. Yoshimoto, M. Fukunaga, K. Kubo, Y. Nanjo, T.
Matsuo, and K. Nakamura (2002), Triaxial Compressive Strength of Methane Hydrate,
Paper presented at the 12th
International Offshore and Polar Engineering Conference,
Kitakyushu, Japan.
Hyodo, M., Y. Nakata, N. Yoshimoto, and T. Ebinuma (2005), Basic research on the mechanical
behavior of methane hydrate sediments mixture, Soils Found., 45, 75–85.
Hyodo, M., Y. Narita, N. Yoshimoto, and R. Orense (2007), Shear behaviour of methane
hydrate-bearing sand, paper presented at Sixteenth International Offshore and Polar
Engineering Conference, Lisbon, Portugal.
Hyodo, M., Y. Nakata, N. Yoshimoto, R. Orense, and J. Yoneda (2009), Bonding strength by
methane hydrate formed among sand particle. Powders and Grains, paper presented at 6th
International Conference on Micromechanics of Granular Media, 79-82.
Hyodo, M., J. Yoneda, Y. Nakata, and N. Yoshimoto (2011), Strength and dissociation property
of methane hydrate bearing sand, paper presented at 7th
International Conference on Gas
Hydrates, Edinburgh, Scotland, United Kingdom.
Jager, M. D. (2001), High pressure studies of hydrate phase inhibition using Raman
spectroscopy, Ph.D. thesis, Colorado School of Mines, Colorado, USA.

237
Jardine, R. J., A. Gens, D. W. Hight, and M .R. Coop (2004), Developments in understanding
soil behaviour, The Skempton Conference: Proceedings of a Three Day Conference on
Advances in Geotechnical Engineering, Organised by the Institution of Civil Engineers and
Held at the Royal Geographical Society, London, UK.
Jayasinghe, A. G., and Grozic, J. L. H. (2013). Estimating Pore Space Hydrate Saturation Using
Dissociation Gas Evolution Measurements: In Relevance to Laboratory Testing of Natural
or Artificially Synthesised Hydrate-Bearing Soil Specimens, Journal of Geological
Research, Vol. 2013, Article ID 815841, doi:10.1155/2013/815841.
Jayasinghe, A and J. L. H. Grozic (2008), Modelling Dissociation Behaviour of Methane
Hydrate in porous soil media, paper presented at Sixth International Conference on Gas
Hydrates, Chevron, Vancouver, BC, Canada.
Jin, S., J. Nagao, S. Takeya, Y. Jin, J. Hayashi, Y. Kamata, T. Ebinuma, and H. Narita (2006),
Structural investigation of methane hydrate sediments by microfocus X-ray computed
tomography technique under high-pressure conditions, Jpn. J. Appl. Phys., 45, L714- L716,
doi:10.1143/JJAP.45.L714.
Jung, J. W., and J. C. Santamarina (2011), Hydrate adhesive and tensile strengths, Geochem.
Geophys. Geosyst., 12, Q08003, doi:10.1029/2010GC003495.
Katsuki, D., R. Ohmura, T. Ebinuma, and H. Narita (2007), Methane hydrate crystal growth in a
porous medium filled with methane-saturated liquid water, Philosophical Magazine, 87,
1057-1069.
Katsuki, D., R. Ohmura, T. Ebinuma, and H. Narita (2006), Formation, growth and ageing of
clathrate hydrate crystals in a porous medium, Philosophical Magazine, 86, 1753-1761.

238
Kilner, J. R., and J. L. H. Grozic (2006), Determination of synthetic hydrate content in sand
specimens using dielectrics, Canadian Geotechnical Journal, 43(6), 551-562.
Kim, Y. S., S. K. Ryu, S. O. Yang, and C. S. Lee (2003). Liquid water–hydrate equilibrium
measurements and unified predictions of hydrate-containing phase equilibria for methane,
ethane, propane, and their mixtures. Industrial & Engineering Chemistry Research, 42,
2409–2414.
Klapproth, A., K. S. Techmer, S. A. Klapp, M. M. Murshed, and W. F. Kuhs (2007),
Microstructure of gas hydrates in porous media, in Physics and Chemistry of Ice:
Proceedings of the 11th International Conference on the Physics and Chemistry of Ice,
edited by W. F. Kuhs, pp. 321–328, R. Soc. of Chem., London.
Kleinberg, R. L., C. Flaum, D. D. Griffin, P. G. Brewer, G. E. Malby, and E. T. Peltzer, J. P.
Yesinowski (2003), Deep Sea NMR: Methane hydrate growth habit in porous media and
its relationship to hydraulic permeability, deposit accumulation, and submarine slope
stability. Journal of Geophysical Research, 108(B10), 2508, doi: 10.1029/2003JB002389.
Kleinberg, R., and D. Griffin (2005), NMR measurements of permafrost: Unfrozen water assay,
pore-scale distribution of ice, and hydraulic permeability of sediments, Cold Reg. Science
Technol., 42, 63 – 77.
Kneafsey, T. J., Y. Seol, A. Gupta, and L. Tomutsa L (2011), Permeability of laboratory-formed
methane-hydrate-bearing sand: Measurements and observations using X-Ray computed
tomography, SPE Journal, March 2011, 78-94.
Kneafsey, T. J., L. Tomutsa, L. Moridis, Y. Seol, B. Freifeld, C. E. Taylor, and A. Gupta (2005),
Methane hydrate formation and dissociation in a partially saturated sand—Measurements
and observations, in Fifth International Conference on Gas Hydrates, pp. 213–220, Tapir
Acad., Trondheim, Norway.
239
Kneafsey, T. J., L. Tomutsa, G. J. Moridis, Y. Seol, B. M. Freifeld, C. E. Taylor, and A. Gupta
(2007), Methane hydrate formation and dissociation in a partially saturated core-scale sand
sample, Journal of Petroleum Science and Engineering, 56, 108-126.
Kneafsey, T, J., Rees, E. V. L., Nakagawa, S., and Kwon, T. H. (2010), Examination of Hydrate
Formation Methods: Trying to Create Representative Samples,
http://www.netl.doe.gov/technologies/oil-gas/publications/ Hydrates/2010Reports/ESD05-
048_HydrateFormationMethods.pdf
Kneafsey T. J. And S. Nakagawa (2011), Repeated Methane hydrate Formation and Dissociation
in a Partially Water Saturated Sand: Impact on Hydrate Heterogeneity and Sonic-
Frequency Seismic Properties., Paper Presented at 7th International Conference on Gas
Hydrates (ICGH 2011), Edinburgh, Scotland, United Kingdom.
Kobayashi, R., and D. Katz (1949), Methane hydrate at high pressure, Petroleum Transactions-
AIME, 66-70.
Koh, C. A. and Sloan, E. D. (2007), Natural gas hydrates: Recent advances and challenges in
energy and environmental applications. AIChE J., 53: 1636–1643. doi: 10.1002/aic.11219
Kono, H. O., and B. Budhijanto (2002), Modeling of gas hydrate formation processes by
controlling the interfacial boundary surfaces, paper presented at the 4th International
Conference on Gas Hydrates, Jpn. Natl. Oil Corp., Yokohama, Japan, 19–23 May.
Kosyakov, N. E., B. I. Ivchenko, and P. P. Krishtopa (1979), Solubility of moisture in
compressed argon, methane, and helium at low temperatures, Zhurnal Prikladnoi Khimi,
52(4), 922-923.
Kumar, A., B. Maini, P. R. Bishnoi, M. Clarke, O. Zatsepina, and S. Srinivas (2010),
Experimental determination of permeability in the presence of hydrates and its effect on
240
the dissociation characteristics of gas hydrates in porous media, Journal of Petroleum
Science and Engineering, 70, 114-122.
Kuniyuki, M., M. Akira, A. Kazuo, S. Yasuhide, Y. Tsutomu, and O. Seisuke (2010). Strain-rate
dependence of triaxial compressive strength of artificial methane-hydrate-bearing
sediment, International Journal of Offshore and Polar Engineers, 20 (4), 256-264.
Kvenvolden, K. A. (1993), Gas Hydrates - Geological Perspective and Global Change, Reviews
of Geophysics, 31, 173-187.
Kwon, T. H., G. C. Cho, and J. C. Santamarina (2008), Gas hydrate dissociation in sediments:
Pressure-temperature evolution, Geochem. Geophys. Geosyst., 9, Q03019,
doi:10.1029/2007GC001920.
Lambe, T. W. (1967). Stress path method. ASCE Journal of the Soil Mechanics and Foundations
Division, November, 309-331.
Lambe, W. T., and Whitman, R. V. (1979). Soil Mechanics. John Wiley & Sons.
Lee, J. Y, Yun, T. S., Santamarina, J. C., Ruppel, C. (2007).Observations related to
tetrahydrofuran and methane hydrates for laboratory studies of hydrate-bearing sediments.
Geochem. Geophys. Geosyst., 8(10).
Lee, M. W., and T. S. Collett (2009), Gas hydrate saturations estimated from fractured reservoir
at Site NGHP-01-10, Krishna-Godavari Basin, India, Journal of Geophysical Research,
114: B07102, doi: 10.1029/2008JB006237.
Liang, H., Y. Song, Y. Chen, and Y. Liu (2011), The measurement of permeability of porous
media with methane hydrate, Petroleum Science and Technology, 29, 79-87.
241
Lide, D. R. (2007), CRC Handbook of Chemistry and Physics 88 ed., CRC Press Inc., Boca
Raton, Florida.
Lokken, T. V., A. Bersas, K. O. Christensen, C. F. Nygaard, and E. Solbraa (2008), Water
content of high pressure natural gas: Data, prediction and experience from field, paper
presented at International Gas Union Research Conference, Paris, France.
Luong, M. P. (2007). Introducing infrared thermography in soil dynamics, Infrared Physics &
Technology,49, 306-311.
Luong, M. P. (1986). Characteristic threshold and infrared vibrothermography of sand. ASTM
geotechnical testing journal, 9(2), 80-86.
Lu, W., I. M. Chou, and R. C. Burruss (2008), Determination of methane concentrations in water
in equilibrium with sI methane hydrate in the absence of a vapor phase by in situ Raman
spectroscopy. Geochimica et Cosmochimica Acta, 72, 412-422.
Macari, E. J., Parken, J. K., & Costes, N. C. (1997). Measurement of volume changes in triaxial
tests using digital imaging techniques. ASTM geotechnical testing journal, 20(1), 103-109.
MacDonald, G. T. (1990), Role of methane clathrate in past and future climates, Climate
Change, 16, 247-281.
Madden, E. M., S. Ulrich, P. Szymcek, S. McCallum and T. Phelps (2009), Experiment
formation of massive hydrate deposits from accumulation of CH4 gas bubbles within
synthetic and natural sediments, Marine and Petroleum Geology, 26, 369-378.
Majorowicz, J., and J. Safanda, K. Osadetz (2012), Inferred gas hydrate and permafrost stability
history models linked to climate change in the Beaufort-Mackenzie Basin, Arctic Canada,
Climate of the Past, 8 (2), 667-682.
242
Makogon, I.F. (1981), Hydrates of natural gas, PennWell Books, Tulsa, Okla.
Masui, A., H. Haneda, Y. Ogata, and K. Aoki (2005a), The effect of saturation degree of
methane hydrate on the shear strength of synthetic methane hydrate sediments, the paper
presented at Fifth International Conference on Gas Hydrates, Tapir Acad., Trondheim,
Norway, 657–663.
Masui, A., H. Haneda, Y. Ogata, and K. Aoki (2005b), Effects of Methane Hydrate Formation on
Shear Strength of Synthetic Methane Hydrate Sediments, Paper presented at the 5th
International Offshore and Polar Engineering Conference, Seoul, Korea.
Masui, A., K. Miyazaki, H. Haneda, Y. Ogata, and K. Aoki (2008a), Mechanical properties of
natural gas hydrate bearing sediments retrieved from eastern Nankai trough, paper
presented at OTC 19277, OTC 2008, Houston, Texas, USA.
Masui, A., K. Miyazaki, H. Haneda, Y. Ogata, and K. Aoki (2008b), Mechanical characteristics
of natural and artificial gas hydrate bearing sediments, paper presented at Sixth
International Conference on Gas Hydrates, Chevron, Vancouver, BC, Canada.
Minagawa, H., R. Ohmura, Y. Kamata, J. Nagao, T. Ebinuma, H. Narita, and Y. Masuda (2009),
Water permeability of porous media containing methane hydrate as controlled by the
methane-hydrate growth process, in Natural gas hydrates—Energy resource potential and
associated geologic hazards, edited by T. Collett, A. Johnson, C. Knapp, and R. Boswell,
pp 734-739, AAPG Memoir 89, Tulsa, O. K.
Miyazaki, K., A. Masui, H. Haneda, Y. Ogata, K. Aoki and T. Yamaguchi (2008), Variable-
Compliance-Type Constitutive Model For Methane Hydrate Bearing Sediment, paper
presented at 6th
International Conference on Gas Hydrates, Vancouver, British Columbia,
Canada.
243
Miyazaki, K., A. Masui, Y. Sakamoto, and N. Tenma (2010a), Effect of confining pressure on
triaxial compressive properties of artificial methane hydrate bearing sediments, Offshore
Technology Conference, Houston, Texas, USA.
Miyazaki, K., A. Masui, K. Aoki, Y. Sakamoto, T. Yamaguchi, and S. Okubo (2010b), Strain-
Rate Dependence of Triaxial Compressive Strength of Artificial Methane-Hydrate-Bearing
Sediment, International Journal of Offshore and Polar Engineering, 20 (4), 256-264.
Miyazaki, K., A. Masui, Y. Sakamoto, K. Aoki, N. Tenma, and T. Yamaguchi (2011), Triaxial
compressive properties of artificial methane‐hydrate‐bearing sediment, Journal of
Geophysical Research,116, B06102, doi:10.1029/2010JB008049.
Mohammadi, A. H., A. Chapoy, B. Tohidi, and D. Richon (2004), A semi empirical approach for
estimating the water content of natural gases, Ind. Eng. Chem. Res.,43, 7137-7147.
Moridis, G. J., and T. S. Collett (2003), Strategies for Gas Production from Hydrate
Accumulations under various Geologic Conditions, Report LBNL-52568, Lawrance
Berkeley National Laboratory, Berkeley, CA.
Murray D. R., R. L. Kleinberg, B. K. Sinha, M. Fukuhara, O. Osawa, T. Endo, and T. Namikawa
(2006), Saturation, acoustic properties, growth habit, and state of stress of a gas hydrate
reservoir from well logs. Petrophysics, 47(2), 129-137.
Nabeshima, Y., Y. Takai, and T. Komai (2005), Compressive strength and density of methane
hydrate, 6th 2005 International Society of Offshore and Polar Engineers, Ocean Mining
Symposium, ISOPE OMS-2005, 197-200, Changsha, China.
Negussey, D., Wijewickreme, W. K. D., and Vaid, Y. P. (1987). Constant volume friction angle
of granular materials. Canadian Geotechnical Journal, 25(1), 50-55.
244
Nimblett, J., and C. Ruppel (2003), Permeability evolution during the formation of gas hydrates
in marine sediments, J. Geophys. Res., 108(B9), 2420, doi:10.1029/2001JB001650.
Nishio, S., E. Ogisako, and A. Denda (2011), Geotechnical properties of seabed ground in East
Nankai Trough, paper presented at the 7th
International Conference on Gas Hydrates,
Edinburgh, Scotland, United Kingdom.
Nixon, M. F., and J. L. H. Grozic (2007), Submarine slope failure due to gas hydrate
dissociation: A preliminary quantification, Can. Geotech. J., 44, 314–325,
doi:10.1139/T06-121.
Oellrich, L. R., and K. Althaus (2000), GERG-Water Correlation (GERG Technical Monograph
TM14) Relationship between water content and water due point keeping in consideration
the gas composition in the field of natural gas, Fortschritt-Berichte VDI, Reihe 3-Nr. 679.
Ogienko, A. G., A. V. Kurnosov, A. Y. Manakov, E. G. Larionov, A.I. Ancharov, M. A.
Sheromov, and A. N. Nesterov (2006), Gas hydrates of argon and methane synthesized at
high pressures: composition, thermal expansion, and self-preservation, Journal of Physical
Chemistry B, 110, 2840-2846.
Ohmura, R., W. Shimada, T. Uchida, Y. H. Mori, S. Takeya, J. Nagao, H. Minagawa, T.
Ebinuma, and H. Narita (2004), Clathrate hydrate crystal growth in liquid water saturated
with a hydrate-forming substance: variations in crystal morphology, Philosophical
Magazine, 84 (1), 1-16.
Olds, R. H., Sage, B. H., Lacey, W. H., (1942), Phase equilibria in hydrocarbon systems:
composition of the dew-point gas of the methane–water system., Ind. Eng. Chem. Res., 34,
(10), 1223–1227.
245
Ordonez, C., J. L. H. Grozic, and J. Chen (2009), Hydraulic conductivity of Ottawa sand
specimens containing R-11 gas hydrates, paper presented at 62nd
Canadian Geotechnical
Conference, Halifax, NS, Canada.
O’Sullivan, T. D., and N. O. Smith (1970), The solubility and partial molar volume of nitrogen
and methane in water and in aqueous sodium chloride from 50 to 125oC and 100 to 600
atm, Journal of Physical Chemistry, 74, 1460-1466.
Parameswaran, V. R., M. Paradis, and Y. P. Handa (1989), Strength of frozen sand containing
tetrahydrofuran hydrate, Canadian Geotechnical Journal, 26, 479-483.
Price, L. C. (1979), Aqueous solubility of methane at elevated pressures and temperatures,
AAPG bulletin, 632, 1527-1533.
Priest, J. A., A. Best, and C. R. Clayton (2005), A laboratory investigation into the seismic
velocities of methane gas hydrate- bearing sand, J. Geophys. Res., 110 (13), B04102,
doi:10.1029/2004JB003259.
Priest, J. A., E. V. L. Rees, and C. R. I. Clayton (2009), Influence of gas hydrate morphology on
the seismic velocities of sands, J. Geophys. Res., 114, B11205,
doi:10.1029/2009JB006284.
Priest, J., A. Sutaniya and C. Clayton (2011), Impact of hydrate formation and dissociation on
the stiffness of a sand, paper presented at the 7th
International Conference on Gas Hydrates
(ICGH 2011), Edinburgh, Scotland, United Kingdom.
Poulos, S. J. (1981). The steady state of deformation. ASCE Journal of Geotechnical Engineering
Division, 107(GT5), 553-562.

246
Reagan, M. T., and G. J. Moridis (2007), Oceanic gas hydrate instability and dissociation under
climate change scenarios, LBNL-62999, Geophys. Res. Lett., 34, L22709, doi:
10.1029/2007GL031671.
Reagan, M. T., G. J. Moridis, S. M. Elliott, and M. Maltrud (2011), Simulation of arctic gas
hydrate dissociation in response to climate change: Basin-scale assessment, in Arctic
Technology Conference 2011, Society of Petroleum Engineers, 1038-1051.
Rempel, A.W., and B. A. Buffett (1997), Formation and accumulation of gas hydrate in porous
media, Journal of Geophysical Research, 102, B5, 10151-10164.
Rees, E. V. L., T. J. Kneafsey, and S. Nakagawa (2011), Geomechanical Properties of synthetic
hydrate bearing sediments, Paper presented at the 7th
International Conference on Gas
Hydrates (ICGH 2011), Edinburgh, Scotland, United Kingdom.
Rigby, M., Prausnitz, J. M., (1968), Solubility of water in compressed nitrogen, argon and
methane, J. Phys. Chem., 72 (1), 330–334.
Ruppel, C. (2011), Methane hydrates and contemporary climate change, Nat. Educ. Knowl.,
2(12), 12.
Santamarina, J. C., K. A. Klein, and M. A. Fam (2001), Soils and Waves: Particulate Materials
Behavior, Characterization and Process Monitoring, 488 pp., John Wiley, New York.
Santamarina, J. C., and C. Ruppel (2008), The impact of hydrate saturation on the mechanical,
electrical, and thermal properties of hydrate-bearing sand, silts, and clay, paper 5817
presented at the 6th International Conference on Gas Hydrates, Chevron, Vancouver, B. C.,
Canada.

247
Sego, D. C. and R. J. Wittebolle (1984), Engineering behaviour of a sand containing gas
hydrates, Proceedings of. Cold Regions-Engineering Speciality Conference, 589-601,
Montreal, Canada.
Seo, Y., H. Lee, and B. Ryu (2002), Hydration number and two-phase equilibria of CH4 hydrate
in the deep ocean sediments, Geophysical Research Letters, 29(8), No. 1244.
Seol, Y., E. Myshakin, and T. Kneafsey (2011), Quantitative applications of X-Ray CT
observations for core-scale hydrate studies, Paper presented at 7th
International Conference
on Gas Hydrates, Edinburgh, Scotland.
Servio, P., and P. Englezos (2002), Measurement of dissolved methane in water in equilibrium
with its hydrate, Journal of Chemical & Engineering Data, 47, 87-90.
Shpakov, V. P., J. S. Tse, C. A. Tulk, B. Kvamme, and R. Belosludov (1998), Elastic moduli
calculation and instability in structure I methane clathrate hydrate, Chemical Physics
Letters, 282, 107-114.
Shibue, Y. (2003), Vapor pressures of aqueous NaCl and CaCl2 solutions at elevated
temperatures, Fluid Phase Equilib., 213, 39-51.
Sia, C. W. (2013), Experiment investigation of gas hydrate formation habit in porous media
using permeability and thermal conductivity measurements, Ph. D. Thesis, Department of
Chemical and Petroleum Engineering, University of Calgary, Calgary, Alberta.
Skempton, A. W. (1954), The pore-pressure coefficients A and B, Geotechnique, 4, 143-147.
Sloan, E. D. (1998), Clathrate Hydrates of Natural Gas, 2nd edition, Marcel Dekker, New York,
USA.
248
Sloan, E. D., F. M. Khoury, and R. Kobayashi (1976), Water content of methane gas in
equilibrium with hydrates, Industrial & Engineering Chemistry Fundamentals,15(4), 318-
323.
Sloan, E. D. (2003), Clathrate hydrate measurements: microscopic, mesoscopic, and
macroscopic, J. Chem. Thermodynamics 35, 41-53.
Sloan, E. D. (2003), Fundamental principles and applications of natural gas hydrates, Nature,
426(20), 353-359.
Soga, K., Lee, S. L., Ng, M. Y. A., and Klar, A. (2006). Characterisation and engineering
properties of methane hydrate soils. Proceedings of the 2nd International Workshop on
Characterisation and Engineering Properties of Natural Soils,4, 2591-2642.
Song, K. Y., M. Yarrison, and W. Chapman (2004), Experimental low temperature water content
in gaseous methane, liquid ethane, and liquid propane in equilibrium with hydrate at
cryogenic conditions, Fluid Phase Equilib., 224, 271-277.
Song, Y., F. Yu, Y. Li, W. Liu and J. Zhao (2010), Mechanical property of artificial methane
hydrate under triaxial compression, Journal of Natural Gas Chemistry, 19, 246-250.
Spangenberg, E., and J. Kulenkampff (2006), Influence of methane hydrate content on electrical
sediment properties, Journal of Geophysical Research, 33, L24315, doi:
10.1029/2006GL028188.
Spangenberg, E., B. Beeskow-Strauch, M. Luzi, R. Naumann, and J. M. Schicks (2008), The
process of hydrate formation in clastic sediments and its impact on their physical
properties, Proceedings of the 6th
international conference on Gas Hydrates, Vancouver,
BC, Canada.

249
Spangenberg, E., J. Kulenkampff, R. Naumann, and J. Erzinger (2005), Pore space hydrate
formation in a glass bead sample from methane dissolved in water, Geophys. Res. Lett.,
32, L24301, doi:10.1029/2005GL024107.
Stern, L. A., S. H. Kirby, and W. B. Durham (1996), Peculiarities of methane clathrate hydrate
formation and solid-state deformation, including possible superheating of water ice,
Science, 273, 1843–1848, doi:10.1126/science.273.5283.1843.
Stern, L. A., S. H. Kirby, and W. B. Durham (1998), Polycrystalline methane hydrate: Synthesis
from superheated ice, and low-temperature mechanical properties, Energy Fuels, 12, 201–
211, doi:10.1021/ef970167m.
Sulem, J. and Outfroukh, H. (2006). Shear banding in drained and undrained triaxial tests on a
saturated sandstone: Porosity and permeability evolution, International Journal of Rock
Mechanics and Mining Sciences, 43, 292-310.
Sultan, N., P. Cochonat, J. P. Foucher, and J. Mienert (2004), Effect of Gas Hydrate Melting on
Seafloor Slope Instability, International Journal of Marine Geology, 213, 379-401.
Sultan, N. (2007), Comment on ‘‘Excess pore pressure resulting from methane hydrate
dissociation in marine sediments: A theoretical approach’’ by Wenyue Xu and Leonid N.
Germanovich, J. Geophys. Res., 112, B02103, doi:10.1029/2006JB004527.
Sultanov, R. C., V. E. Skripka, and A. Y. Namiot (1972), Solubility of methane in water at high
temperatures and pressures (in Russian), Gazova Promyshlennost, 17, 6-7.
Sum, A. K., R. C. Burruss, and E. D. Sloan (1997), Measurement of clathrate hydrates via
Raman spectroscopy, Journal of Physical Chemistry B, 101, 7271-7377.

250
Sun, R., and Z. Duan (2007), An accurate model to predict the thermodynamic stability of
methane hydrate and methane solubility in marine environments. Chemical Geology, 244,
248-262.
Sun, R., Z. Huang, and Z. Duan (2003), A new equation of state and Fortran 77 program to
calculate vapor-liquid equilibria of CH4-H2O system at low temperatures, Computers and
Geosciences, 1291-1299.
Ting, J. M., R. T. Martin, and C. C. Ladd (1983), Mechanisms of strength for frozen sand, J.
Geotech. Eng., 109(10), 1286–1302.
Tohidi, B., R. Anderson, M. B. Clennell, R. W. Burgass, and A. B. Biderkab (2001), Visual
observation of gas-hydrate formation and dissociation in synthetic porous media by means
of glass micromodels, Geology, 29 (9), 867-870.
Uchida, T., T. Hirano, T. Ebinuma, H. Narita, K. Gohara, S. Mae, and R. Matsumoto (1999),
Raman spectroscopic determination of hydration number of methane hydrates, AIChE
J.,45(12), 2641-2645.
Van der Waals, J.H., J.C. Platteeuw (1959) Validity of the Clapeyron’s Equation for phase
equilibria involving clathrates. Nature, 183-462.
Wagner, W., and A. Pruss (1993), International equations for the saturation properties of
ordinary water substance. Revised according to the international temperature scale of 1990.
addendum to J. Phys. Chem. Ref. Data 16, 893 (1987), J. Phys. Chem. Ref. Data, 22,783-
787.
Waite, W. F., B. J. de Martin, S. H. Kirby, J. Pinkston, and C. D. Ruppel (2002), Thermal
conductivity measurements in porous mixtures of methane hydrate and quartz sand,
Geophys. Res. Lett., 29(24), 2229, doi:10.1029/2002GL015988.
251
Waite, W. F., L. A. Stern, S. H. Kirby, W. J. Winters, and D. H. Mason (2007), Simultaneous
determination of thermal conductivity, thermal diffusivity and specific heat in sI methane
hydrate, Geophys. J. Int., 169, 767–774, doi:10.1111/j.1365-246X.
Waite, W. F., J. C. Santamarina, D. D. Cortes, B. Dugan, D. N. Espinoza, J. Germaine, J. Jang, J.
W. Jung, T. J. Kneafsey, H. Shin, K. Soga, W. J. Winters, and T. S. Yun (2009), Physical
properties of hydrate-bearing sediments, Rev. Geophys., 47, RG4003,
doi:10.1029/2008RG000279.
Waite, W. F., T. J. Kneafsey, W. J. Winters, and D. H. Mason (2008a), Physical property
changes in hydrate-bearing sediment due to depressurization and subsequent
repressurization, Journal of Geophysical Research, 113, B07102,
doi:10.1029/2007JB005351.
Waite, W. F., J. P. Osegovic, W. J. Winters, M. D. Max, and D. H. Mason (2008b), Seeding
hydrate formation in water-saturated sand with dissolved-phase methane obtained from
hydrate dissolution: a progress report, paper presented at the 6th
International conference
on Gas Hydrates (ICGH 2008), Vancouver, BC, Canada.
Wiesenburg, D. A. and N. L. Guinasso (1979), Equilibrium solubilities of methane, carbon
monoxide and hydrogen in water and seawater, Journal of Chemical & Engineering Data,
24, 356-360.
Winters, W. J., I. A. Pecher, J. S. Booth, D. H. Mason, M. K. Relle, and W. P. Dillon (1999),
Properties of samples containing natural gas hydrate from the JAPEX/JNOC/GSC Mallik
2L-38 gas hydrate research well, determined using Gas Hydrate And Sediment Test
Laboratory Instrument (GHASTLI), in Geological Survey of Canada, Bulletin 544, edited
by S. R. Dallimore et al., pp. 241-250, Canadian Government Publication Centre, Ottawa.
252
Winters, W. J., W. F. Waite, D. H. Mason, W. P. Dillon, and I. A. Pecher (2002), Sediment
properties associated with gas hydrate formation. Proceedings of the Fourth International
Conference on Gas Hydrates, pp. 722-727, Yakohama.
Winters, W. J., I. A. Pecher, W. F. Waite, and D. H. Mason (2004), Physical properties and rock
physics models of sediment containing natural and laboratory-formed methane gas hydrate,
American Mineralogist, Volume 89, 1221–1227.
Winters, W. J., .W. F. Waite, D. H. Mason, L. Y. Gilbert, and I. A. Pecher (2007), Methane gas
hydrate effect on sediment acoustic and strength properties, Journal of Petroleum Science
and Engineering, 56, 127–135.
Winters, W. J., W. F. Waite, D. H. Mason, and P. Kumar (2008), Physical properties of
repressurized samples recovered during the 2006 national gas hydrate program expedition
offshore India, paper 5531 presented at the 6th International Conference on Gas Hydrates,
Chevron, Vancouver, B. C., Canada.
Yamamoto, S., J. B. Alcauskas, and T. E. Crozier (1976), Solubility of methane in distilled water
and seawater, Journal of Chemical & Engineering Data, 21, 78-80.
Yokoseki, A. (2005), Methane gas hydrate viewed through unified solid-liquid-vapor equation of
state, International Journal of Thermophysics, 26(3), doi:10.1007/s10765-005-5575-5.
Yoneda, J., M. Hyodo, Y. Nakata, N. Yoshimoto, Y. Imamura and N. Tenma (2011), Localized
deformation of Methane Hydrate-bearing sand by Plane Strain Shear Tests, paper
presented at 7th
International Conference on Gas Hydrates, Edinburgh, Scotland, United
Kingdom.
Youssef, Z., A. Barreau, P. Mougin, J. Jose, and I. Mokbel (2009), Measurements of hydrate
dissociation temperature of methane, ethane, and CO2 in the absence of any aqueous phase
253
and prediction with the cubic plus association equation of state, Industrial and Engineering
Chemistry Research, 48, 4045-4050.
Yun, T. S., F. M. Francisca, J. C. Santamarina, and C. Ruppel (2005), Compressional and shear
wave velocities in uncemented sediment containing gas hydrate, Geophys. Res. Lett., 32,
L10609, doi:10.1029/2005GL022607.
Yun, T. S, G. A. Narsilio, J. C. Santamarina, and C. Ruppel (2006), Instrumented pressure
testing chamber for characterizing sediment cores recovered at in situ hydrostatic pressure,
Marine Geology, 229, 285-293.
Yun, T. S., J. C. Santamarina, and C. Ruppel (2007), Mechanical properties of sand, silt, and
clay containing tetrahydrofuran hydrate, Journal of Geophysical Research, vol. 112,
B04106, doi:10.1029/2006JB004484.
Yun T. S., and J. C. Santamarina (2011), Hydrate growth in granular materials: implications to
the hydrate bearing sediments, Geoscience Journal, 15(3), 265-273, doi: 10.1007/s12303-
011-0025-9.
Zatsepina, O. Y, and B. A. Buffett (1997), Phase equilibrium of gas hydrate: implications for the
formation of hydrate in the deep sea floor, Geophysical Research Letters, 24(13), 1567-
1570.
Zatsepina, O. Y., and B. A. Buffett (1998), Thermodynamic conditions for the stability of gas
hydrate in the seafloor, Journal of Geophysical Research-B: Solid Earth, 103, 24127-39.
Zebrowski, E (1979), Fundamentals of Physical Measurement, Rohnbach P, editor. Wadsworth
Publishing Company, Inc., Belmont, CA, USA.

254
Zhang, L., R. Burgass, A. Chapoy, and B. Tohidi (2011), Measurement and modeling of water
content in low temperature hydrate-methane and hydrate-natural gas systems, J. Chem.
Eng. Data, 56, 2932-2935.
Zhong, Y., and R. E. Rogers (2000), Surfactant effects on gas hydrate formation, Chem. Eng.
Sci., 55, 4175 – 4187, doi:10.1016/S0009-2509(00)00072-5.
Related Documents


![Methane Hydrate in Confined Spaces ‐ An …...methane hydrate may be twice that of all other fuels combined.[6] Indeed, the future exploitation of methane hydrate from marine turned](https://static.cupdf.com/doc/110x72/5fbd4d959cef473df80642b6/methane-hydrate-in-confined-spaces-a-an-methane-hydrate-may-be-twice-that.jpg)