U.S. Department of Justice Federal Bureau of Investigation Washington, D. C February 20s3 5-000 I 28, 2007 Norman Gahn Calumet County District Attorney,s Office 206 Court Street. Chilton, WI 53014 RE: State of Wisconsin v. Steven Averv Dear Mr. Gahn: I am wrJ-ting in response to a letter f rom rlerome F. Buting dated February 25, 2007, reguesting discovery in the above-captioned matter. Eacrh request relating to the analysis performed by the FBf Laboratory is addressed individually bel-ow. 1. "The protocol issu.e date is February 1_5, 2007..., Enclosed is a copy of the relevant analysis protocols utilized by the FBI Laboratory in this case. 2. "Any data on tests the FBI has done or cuIled... ', There were no tests performed by the FBI that determined the amounts of EDTA found in ordinary household or automotive objects. 3. "Any and all lab sheets, work sheets, bench sheets. .,, Enclosed is a copy of al-I of the fite material generated by the FBI Laboratory relat,ing to the analysis performed in this case. This material incl-udes bench notes, computer printouts, chain of custody documents, and all other specific information regarding the case. A CD Rom is also included with this materiaL containing raw data files. These fires cannot be accessed unless the proprietary software which is available from Thermo Finnigan, is installed on your computer. {^r 4'l l- (i ) "*,a3{60TL

Welcome message from author
This document is posted to help you gain knowledge. Please leave a comment to let me know what you think about it! Share it to your friends and learn new things together.
Transcript
U.S. Department of Justice
Federal Bureau of Investigation
Washington, D. C
February
20s3 5-000 I
28, 2007
Norman GahnCalumet County District Attorney,s Office206 Court Street.Chilton, WI 53014
RE: State of Wisconsin v. Steven Averv
Dear Mr. Gahn:
I am wrJ-ting in response to a letter f rom rlerome F.Buting dated February 25, 2007, reguesting discovery in theabove-captioned matter. Eacrh request relating to the analysisperformed by the FBf Laboratory is addressed individually bel-ow.
1. "The protocol issu.e date is February 1_5, 2007...,
Enclosed is a copy of the relevant analysisprotocols utilized by the FBI Laboratory in this case.
2. "Any data on tests the FBI has done or cuIled... ',
There were no tests performed by the FBI thatdetermined the amounts of EDTA found in ordinaryhousehold or automotive objects.
3. "Any and all lab sheets, work sheets, bench sheets. .,,Enclosed is a copy of al-I of the fite material
generated by the FBI Laboratory relat,ing to theanalysis performed in this case. This materialincl-udes bench notes, computer printouts, chain ofcustody documents, and all other specific informationregarding the case. A CD Rom is also included withthis materiaL containing raw data files. These firescannot be accessed unless the proprietary softwarewhich is available from Thermo Finnigan, is installedon your computer.
{^r 4'l l-(i )
"*,a3{60TL

4.
5.
5.
.,
8.
"l\ny and all valiclation studies the FBI has done. .,,
Enclosed is a copy of the validation studies.
"Any and alL "limltation of detection" studies. . .,,
Information regarding studies referred to in theprotocol in this case is found in the material providedfor response 4.
"Any and aL1 "selectivity" st,udies referred to in...,,Information regarding studies referred t.o in t.he
prot.ocol in this case is found in the material providedfor response 4.
"Any and all "matrix effects" studies referred to...,,Information r:egarding studies referred to in the
protocol in this case is found in the material providedfor response 4.
"Citations to any and all "literatrlre" referred to. ."
Information r:egarding literature referred to inthe protocol j-n ttris case is found in the materialprovided for response 4.
"A list of any ancl all cases where Marc LeBeau. ."
Inasmuch as this request if not for documentationrelating to the pz:esent case or for documentationregarding underlyj"ng scientific data, it is beyond thescope of discovery.
"A complete curriculum vitae for any individual. . "
The analysis in this case was performed by UnitChief Marc A. LeBe:au. Chemist .fason Brewer was theTechnician. Examiner Madeline Montgomery was theTechnical Reviewer and Examiner Eileen Waninger was theAdministrative Rev'iewer in this case. A copy of theircurriculum vitae i.s enclosed.
"A1l data reflecti,ng the rate of degradation or..."fnasmuch as t.his reguest is not for documentation
relating to the present case, it is beyond the scope ofdj-scovery. This information can be researched by anydefense expert and is in the public domain.
t_0 .
1L.
2
€^t, +4 b
ro)
L4
1,2.
13.
15.
15.
L7.
18.
"Any complaints or negative performance evaluations. . .,,
Pursuant to IIBI Policy, a review of t,he Examiner,sfile for complainl-s or negative performance evaluationsmay be requested in writing by the prosecutor to t.heappropriate Chief Division Counsel, who will coordinatea search with appropri-aLe legal personnel atHeadquarLers. Laboratory personnel may not have accessto certain personnel files containing such information.
"Any and all insicle or outside prof iciency tests. . .',A copy of Lhe completed proficiency test summaries
for Unif Chief Marc A. LeBeau, Examiners EileenWaninger and Madeline Montgomery and Chemist ,JasonBrewer is enclosed.
"Laboratory chain of custody records, including a1I..."A11 informatlon, regarding chain of custody of
evidence for this case will be found in the case notesprovided for response 3.
"Copies of traceability documentation for sEandards. . . "
A11 informatjlon regarding traceability for thiscase will be founcl in the case notes provided forresponse 3.
"Instrument run 1og with identification of aII. . . "
A11 informati-on, regarding instrument run logs forthis case will be found in the case notes provided forresponse 3.
"Records of instrr.rment maintenance status and..."
Enclosed is er copy of the maintenance records oft,he j-nstruments used in the analysis of this case, fort.he time period surrounding the examination in thisarz c!a
"An error or contamination 1og covering any and a1l..."There were no instances of contamination in this
case. Had any instances occurred, the documentation,including actions taken, would be included in thematerial provided in response to request. 3. Anyrequest for documentat.j-on regarding error or
fa ++t'( 3)
contamination that occurred in other cases is bevondthe scope of the discovery.
1-9 . "Raw data f or the complete measurement sequence. . . ,,
A11 information regarding the raw data for thiscase, is found on the CD provided in response torequest, 3.
r hope this materi.al will assist vou in this effort.
,Joseph DiZinno, D.D.SAssistant DirectorLaboratorv Division
by
lfi /l'f t tL. ./ I/rr/ Robert TramSection ChiefScient.if ic Analysis Section
Enclosures
{'< ,/'/ a'
(r)

ozf za fozTbp
50-rh D:doF *flBrt anl NyN - f Tfr lp{ftm-oTfrLos(ro qL F?.pfnnt- flzq'V)\l-/l
L_M{nb {D _@C A€tl<6p {btA_ 6 BLI-T- StuPL€NoN-€tA "Tt-{H€y cMbFry ,
t t4"tx c4{D_/ lo fLepo- sl,v
(, o- ,rlrlqt /u.) nr) oa/
{D "L / sq, r/ Crz-Y q, 3 s- u? n/.t',
(tou - Frt+ DLe-*-zs,v .nob) .
rr; .;; 55-,1ref. f uAct-p r^J L,t'Be c cp,/
qL__ _9"-_(f* Dlz-tu_-r.+ Gy) t!( tuhCttL.L€_
-J.oo --
ct't\ ou1 ?\WCFb. -.*towff *-;n, I1::q{t t-qpyr_! _:=
a.
4VttE-t\

C :U(calibur\...\Stability\StabilityoS 0?,28107 05:51:47
NL:0r.l= 272.9273-5 F: - cESI SRM [email protected],272.50-273.501 MSSTAEILITYOS
.
ffilz. 248.+217 .5 Ft - cESI SRM ms2291.20@15,00 [246.50-247.50,272.50.273.501 MSSTABILITYOS
BTANK (neg blood, Dl H2O ext.)150
m/2.325.5-326.5 F: - cESI SRM [email protected] I299.50.300.50,325.50326.501 MSSTABILITYOS.
o
itc2
o
Time (mh)

C :\Xcalibur\...\Stability\Stability09 5p
1oGr
tu".]I*-l
*-l8G__l,a-.']
1l"-l3 60-.1
ol
rlT-246.5-241,5 F: - cESISRM [email protected] I246.50-".47.50.272.50-?73.501 MSSTAEILlrYog
NL: 2.46E3rYF 325.$326-5 F: - cESI SRM [email protected] t299.50-300.50.325.50-326.501 MSSTAAILITYO9.
\0)
a
(0I

otI.u
od
NL:0tnlz=272.1273,5 F:. cESI SRM [email protected] MSSTABILITYIO
C:D(calibur\...\Stability\Stabilityl 0 <up 02128tO7 06:13:31 BIANK (neg blood, Dl HZO ext.)
rrlz= 299.$300.5 F: - cESI SRM ms2
3iisgJ333(sz5.so.32o.soi usSTABILITYIO-
E
*to.a
ot
)L-K
Tim(min)
,zr)
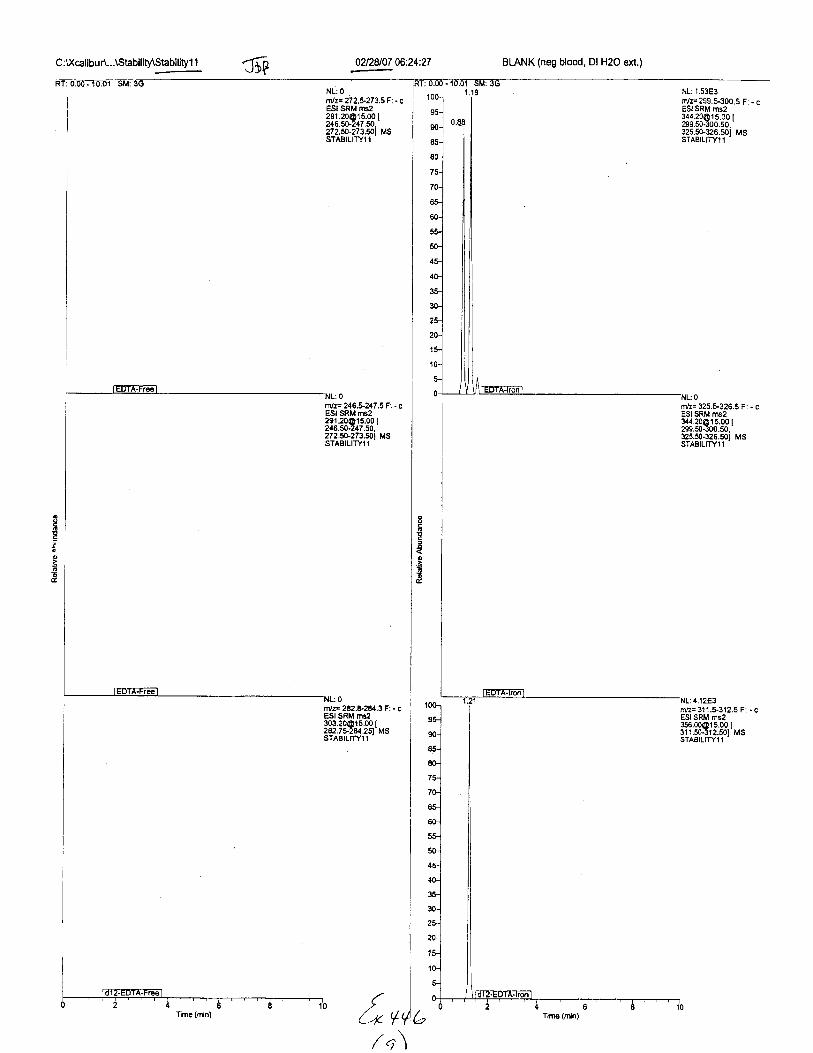
C :U(calibu A...\Stability\Stabilityl 1 <<;Jlf 02128107 06:24:27 BLANK (neg blood, Dl H2O ext.)
NL: 0nlz= 272.1273.5 F: - cESI SRM [email protected] I246.50-247.*,272.5C273.501 MSSTABILTryI I
)LrV
r/z= 325.S326.5 Fi. cESISRM [email protected] MSSTABILTTYI 1
oIEio
6
NL: O
nlz-282.&284.3Ft- cESI SRM [email protected]$2134.251 MSSTABILNYIl.
Timc (min)
/q\
C:U(calibuA...\Stability\Stabilityl 2
1001
s5-.1
.o-]
"]80-j
zs-]
?o-l
uu-l
8 60-.1Fr
try'F 325.5-326.5 F: - cESI SRM [email protected] [299.50-300.50.325.50.326.501 MSSTAEILITYl2
.
\o't
mn= 282-8-2u.3 F: - cESI SRM [email protected]{1.r.251 MSsTAA[ttYt2
,{ vr( i",)
E
o
s
NL: 0mlz= 272.5-213.6 Fi - cESI SRM [email protected]&247.50,272.50.273.501 MSsTA8tLtryl3
NL: 0r]/z= 24A.5-247.sFi. cESI SRM ms2291.20€115.0O I246.50,247.50,272.50-273.501 MSSTABILIryl3
C :\)(calibuA...\Stability\Stabilityl 3 02128107 06:46r08 BLANK (neg blood, Dl H2O ext.)
NL:3.80E3m/z= 299.$300.5 F: . cESI SRM rE2344.20@15,00 I299.5G300.50.325,50-326.501 MSSTABtltryl3-
'llma (mln) ,4q Tlne (min)
(,,\
C :U(calibur\...\Stability\Stabil ity 1 4 0212U07 06:57:01
NL:0ntz=272t.U?73.5F',. cESI SRMms229r.20@ rs.0o I246.50-247.50.272.sG273.501 MSSTABILITY,I4.
rnlz=282.9.2U.3F:- cESI Sru ms2303r0@'15.00 [282.7U28l ',t MSSTAB|L|Y14'
t{ qk/, t\
BLANK (neg blood, Dl H2O ext.).-f-i ^JryNL:0nt.|:= 299.5-300.5 F: . cESI SRM [email protected] I299.50-300.50.325.50326.sO1 MSSTABILITY1,I
-
rVF 325.5326.5 F: - cESI SRM [email protected] I29S.5G300.50,325.5S326.501 MSSIABILTTY,I4-
isoe
lo
eE
nm (nin) Tirne (rnh)

C:D(calibur\...\Stability\St bilityl 5
-
0?i28107 07:07:51
NL:1.06E,1ntlz.216-5247.5F: - cESI SRM ms22s1.20O1s.00 I246.n-247.fi-272.5S,273.501 MSsTABtLtrYlS'
rlz= 282.9-284.3F: - cESI SRM ms2303.20Ots.@ [282.7$2r(.251 MSSTABILITYl5
-
Card C extract (EDTA +)
100-l
e5J
so"]
NL:4,61E4Nz=272.*273-5 F: - cESI SR[,] ms229r [email protected] {246.50-247.s0,272.50-273.501 MSSTAEILITYIs-
P
mfu:325.5-326.5 F: - cESI SRM [email protected] [299.50.300.50.325.50.326.50t MSsTAErUTYls
-
Tme (min)

aE
io.:
C:Xcalibur\...\Stability\Stabilityl 6 159 0?/28107 07:18:40 BLANK (neg blood, Dl H2O exl)
NL:0n!z'272.5-273.5F: - cESI sRM [email protected] [246,5e247.50,272.5G?73.501 MSSTABILITYI6.
rn/z= 245.$247.5 F: - cESISRM [email protected] [24650-?47.50,272.50-273.501 MSSTABIL|TYI6
m/z= 299.$300.5 F: - cESI SRM [email protected] l299.5&300.50.'325.50.326.50t MsSTAEILITY16'
Tim (min) Tim (mln)
C :U(calibur\...\Stability\Stabilityl 7 02128107 07:29:35
nlz- 246.5.247.5 F: - cESISRM [email protected] I216.5G217.fi.272.50-273.fit USSTABILITY,IT.
BLANK (neg blood, Dl H2O ext.)sP
IFe
o66G
{r +a<-,/ t<\
NL: otnlz= 272.5-273.5 Fi . cESI SRM [email protected] (216.fi-217.fi,272.50-273.sot MSsTABtLtrYlT'
Tinr (min) Tirr (min)
C:U(calibur\...\Slability\Stabiligl 8 fDP 0228107 07:40:31 Card D extract (EDTA +1
NL:1.14E5tnJl.272.9273.5 F:- cESI SRM [email protected],272.5G273.s01 MSSTABIL TY18
t"oqo,/rr'.\
lsr
"]"l
,*l,5-j
s0J
,l801
?5-]
ro-l
55J
fl 60-]r -.1
rn/z: 325.$326.5 F: - cESI SRM ms23{[email protected] I299.50.300.50.32s.5&326.s0i MssTABtLtrytS'
r/2. 311.9,3'12.5 F: . cESI SRM [email protected] I311.5&312.501 MSSTABILITYIt
-
\oI
rnlz= 282.8.2U.3F:. cESI SRM ms2303.20@ rs.00 t282.7$2114.25t MSSTA8ILITY18.
Tim€ (n{n) Tlme (min)

C :XcalibuA...\Stabil ity\Slability 1 I frp 0212W07 07151:26 BIANK (neg blood, Dl H2O ext.)
NL: O
ntlz= 272.1213.5 Fi - cESI SRM [email protected] I246.50-247.50,272.50-273.s01 MSSTABILITY,I9
r|/!= 24i.$247.5 F: - cESI SRM ms229r.20O15.@ [246.50-247.50.272.50-273.501 MSSTA8|LITYl9
NL: O
tr/F 299.5.300.5 F: - cESI SRM [email protected] t299.50.300.50.'325.5e326.501 MSSTABILITYl9
nrie (rtn)
t..r 4VQ,,Z)
Tire (rin)
C :U(calibuA...\Stabil ity\Stability20 02128107 08:02:20
t
a
!
NL:0tr!z.272.5-273.5Fi - cESI SRU [email protected] I246.50-it47.50,272.s0.273.501 MSSTAEILITY2O
4vdrJTlnr (rin)
BLANK (neg blood, Dl H2O ext.)
rvz= 325-$.326.5 F: - cESI SRM [email protected] {299.5&300.50,325.50.326,s01 MSSTABILTTY2O.
o
EIfo
EE
Tinc (rdn)

C :U(calibur\...\Stability\Sla bility2 1 {vg
t*rrtl,0_I
gs-.1
I*-l
"-l'l65-1
3 60-.1
!
3.96E3nlF24$.$247.5F'.-cESISRM [email protected].*247_fi.272.5G273.50t MSSTABILITY2l
.
t_
\0'
'r00-l
ss-l
,o-l
,u-]
*-l,-|70-1
^- |oo-l
60'l
uul
501
*.1ol"l::l
nlF 28;,1.9.2U3F|- cESI SRM [email protected] I282.7$234.251 MSSTABILI|Y2I '

nx
E
o.3
E
C :U(calibur\...\Stability\Stability22<- 02f28rc7 08:24:05
NL:0tlz-272.5.273.5F:. c€SISRM ro229'[email protected] I245.5G247.50,272.50-273.s01 MSSTABITITP2
BLANK (neg blood, Dl H2O ext.)
rvz. 299.5.300.5 F: - cESISRM [email protected] MsSTABtLrry22'
trVz= 325.S326.5 F: - cESI SRM ms2344.20(D15.0O I299.50.300.50,325.5G326.501 MSSTABILITY22
.
o
a
Io64
li, ++o/,.r.\
nn€ (rin) lim€ (min)

C:\j(calibur\...\Stability\Stabllity23
-
TbP 0?i2407 08:34:58 BIANK (neg blood, Dl H2O ext)
Nti 0nlF272,*273.5 F:. cESI SRM ms2291.2001s.00 [246.5G247.50,272.5G273.50t MSSTABILITY23.
nlz- 246.5.247 .5 F: - cESI SRM [email protected]{7.50.272.5e273.501 MSSTABtLnY23'
36
zo
o6
oIv
aogo
.l(.r 4tu
NLOnvz= [email protected] F: - cESI SRM [email protected] t299.50.300.50.-325.50.326.5O1 MSsTAEUryA'
Tlm (nin) Iim (rin)
C :l(calibur\...\Stability\Stab ilihr24 02f28107 08:45:49 Card F extract (EDTA +)
0'1 00-
80-
70-
55-
45-
40-
$lE 282.*2g.3Ft . cESI SRM mE23O320O15.@ I282.7$284.25t MSSTABI!ITY24'
[* v,/a,/-,r-i\
\.)t

C:l(calibur1...\Stability\Stabilitv25 Tvg 02128107 Q8:56:43 BLANK (neg blood, Dl H2O ext.)
NL:0tnlz= 272.$273.5Fi - cESI SRM [email protected] I246.50'247.50.272.5G273,50t MSSTABILIT\2s.
n/z:325.$326.5 F: . cESI SRM ms23,t4,[email protected] [299.50.300.50.325.50.326.501 MSSTABILITY2S.
oIE
o.:Eo
Ttr. (rin)
C:XcalibuA...\Stabillty\Stability26 5-Df D2l2U07 09:07:38
NL: 0rNL= 272.5-273.5 F: - .ESI SRM [email protected] [245.50-2,t7.50.272.50-273.501 MSSTABILI-IY26
BI-ANK (neg blood, Dl H2O ext.)
r00l
*]*l*-lrul
'1*1ro'l
Tim (min)
rYz.3l't.$312.5 F: - cESISRM rc2356.00O15.00 [311.5e312.501 MSSTABILITY26
8r44,/ t+-\
Ikn€ (6in)

C:U(calibuA,..\Stability\Stability2T 02f28107 09:18:28
NL: 7.78E,1rnlz=272.5.273,5F: - cesl SRM ms22s1.20or 5.0o (
2,r6.5S247.50,272.50-?73.501 MSSTABILIW2T
NL: 6.33€3rr/F 246.5-247.5 F: . cESISRM ru229r.20O1s.m I246.55247.50.272.5G273.501 MSSTASILITY2T-
NL:1.55EFnlz.2V..8-N.3F: - cESI SR { ms230320@ r5.00 [282.7$284.25t MSSTABILITY2T.
Card G extract (EDTA +)5bg
t*-lru"]
s0'1
rnr:= 325.5-326.5 F: - cESI SRM msz34,120@15.@ I299.5G300.s0.325.5G326.501 MSSTAEILITY2T
.
Tlmr (rnh)

C :U(calibuA...\Stability\Stability2S -1h? 02128107 09,29:23
NL: 0tnlz=27?:..5.2f 3.5F: - cESI SRM rts229120O15.00 [246.5G217.50.272.50-273.501 MSsTAEtLnaa2S'
4,5283ttlz.248.*247.5 Fi - cESI SRil [email protected] [246.50-2,t7.50.2r2.so-2r3.soi MsSTA8[lIY2E
Tm (nin)
'lY;K
BI-ANK (neg blood, Dl H2O ext.)
rn/2" 299.5.300.5 F: - cESI SRM rrE234420015.00I299.50-300.s0.325.5o326.50i MsSTABILITY2E-
tdz.325.5.326.5 F: - cESI SRM [email protected] l299.50-300.50,325.s0-326.501 MSSTABILTN/28
Tlme (rnln)

C :U(calibur\...\Sta bility\S tability29 02/28107 09:40:17 BLANK (neg blood, Dl H2O ext.)
NL:2,90E3rnrz= 299.5.300.5 F: . cESISRM [email protected],325.50.326.s01 MsSTABILITY2g'
@IdPtto
Eo
ftlz'2A2.6-284.3F:. cESISRM rc23O3.20(!1 s.00 I262.7'|A1.A1 MSSTABILITV29.
(1
.tL +q
'*'re51
so'l
Tinr (rin) Ti.ra (min)
,/^ -\

C :U(cali bur\...\Stability\Stability30 A2128107 09:51:06
rnlz. 246.1247 ,5 Ft - cESI SRM [email protected] [216-5n.217 -5o.272.50.23.501 MSSTABILTTrcO
Card H exbact (EDTA +)Tuf
\oI
nvz:325.5-326.5 F: . cESI SRM [email protected] [299.50.300.50,325.5S326.501 MSSTABILIry3o
f,r/u = 311.$312.5 F: . cESISRM [email protected] I311.5G312.501 MSSTABILITY3O'
,C, +q l,
'*l-l*l*luo1
'-lzo-l
,a-l
*l
,/ rA

C :Xcalibur\...\Stability\Stability3 1 A2128107 10:01:55
NL: 0nlp 272.U273.5 F: - cESI SRM [email protected] [246.50-247.s0.272.50-273.501 MSSTABILITY3I
.
BLANK{neg blood, Dl H2O ext.)J-D$
ftVz= 2,16.5-247.5 F: - cESI SRM ms2291.20@1s.@ [246.5o.247.50-272.5e273.s01 MSSTABILITY3l
pE
=
oo6
R
o
!
-EeE
r/z= 31 1 .9312.5 F: - cESI SRM [email protected] [311,5S3'12.501 MSSTABILITY3l
t) q+lTinr (dn) nnrc (tiln)
/ ^n,\

C:U(calibuA...\Stability\Stabilitv32'- Tb{ 0?i28,C/ 10:12:51 BLANK (neg blood, Dl H2O ext.)
NL: 0fii1F272.5-273.5 F. - cESI SRM [email protected] [246.50.247.50.272.50.273.501 MSSTABILIIY32
dtlzE 216.5247.5 F: . cESI SRM trt32291.20@r5.@ I246.50-247.50,272.5G273.501 MSSTABILI']Y32
2.138Ailz= 282.U28/..3F:. cESI SRM ns23O3.20O15.@ [282.75.2t14.25t MSSTABILTTY32
.
R
t
eo
Iot
40
Tim (;'in)
C:Xcalibu 4...\Stability\Stability33 0428107 10:23:40
tr'lz=272-5-273.5 F: - cESI SRM ms2
;:::,39;iS,{272.50-273.501 MSSTAEILITY33
tlF 282.&2U.3 Fi - cESI SRM [email protected] [282.7$21425t MSSTASILNY$.
{'o +al
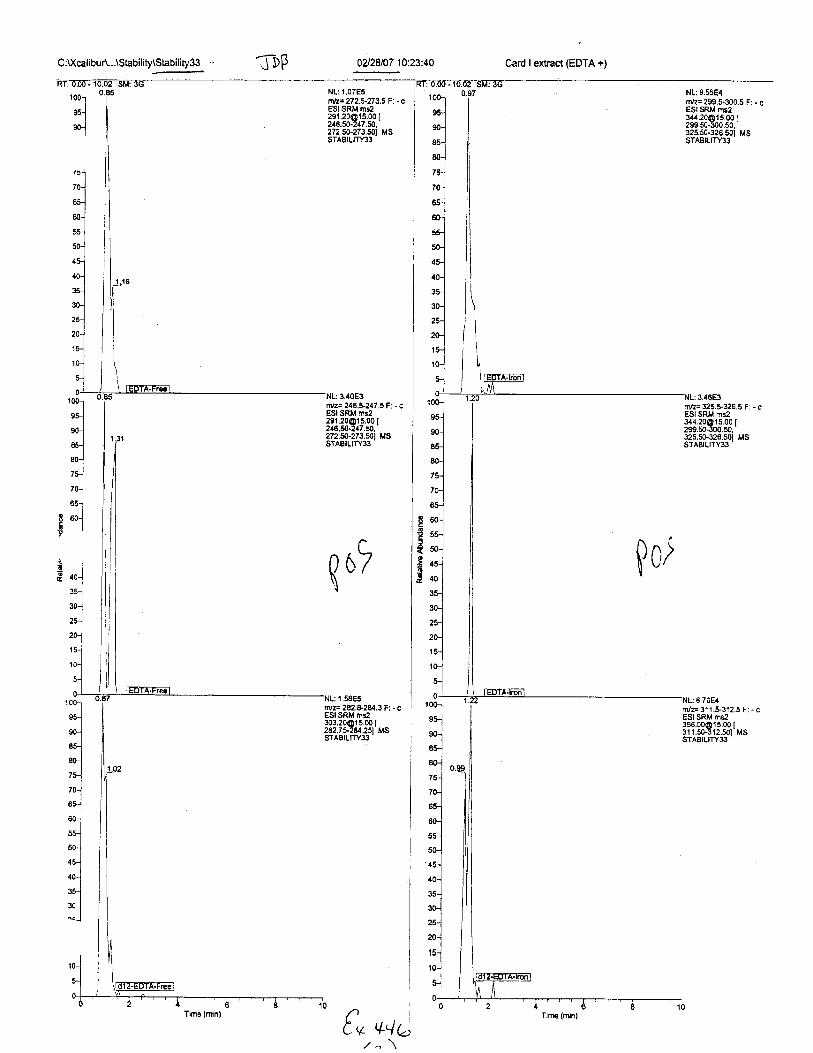
Card I extract (EDTn +;-J uP
NL: 9,55E4nvz= 299.5.300.5 F: - cESI SRM ms2344.20O15.001299.50.300.50.325.50.326.501 MSSTABILITYS.
rTri:= 325.5-326.5 F: - cESI SRM [email protected] |299.50-300.50.32s.so-326.50i MssTABtLtTY33'
,*l'lro-]
rul,o-l
'lro-l
65-J
I eo-.]
$l
Tim€ (min)

C :Xca libuA...\Stability\Stability34 -l oF 02128/07 10:34:32 BLANK (neg blood, Dl H2O ext.)
NL:2.4OE3tr/z= 299.$,300.5 F: . cESI SRM [email protected] |299.5G.300.50.'325.5G.325.50t MSSTAEILITYs4'
o9o
o
Eo
n/2- 246.$247.5 F: ; cESI SRM ms2291,20O1s.@ [246.fi-217.fi.272.50-273.501 MSsTA8rLfry34'
{lo,aap
€iao,lEo
ll' O
TirB (n{n)
10(
g
s[
8(
7l
6{
45
40
1(
Thn. (min)

C:u(catibuA,,.\Stability\Sjqj!!ty35 aiF 0?i28107 10:45:25 BTANK (neg blood, Dl HzO ext.)
nlz=272.5-273.5 Fi. cESI SRM ms2291.20Or5.001246.50-247.50.272.5S273.501 MSSTABILIry35.
r!z=216.5-247.sFi- cESI SRM [email protected] [216.*247.fi.272.sS273.501 MSSTABILITrcS'
rfilz= 292.t12E4.3 F: - cESI SRM [email protected]&..7r2U.25t MSSTABILIT}'35
-
Tim lmin)
lxt: u.utj . 19.u2 5M: 3(iNL:1.94E3 |
od
eo
-!
nm(nrin)
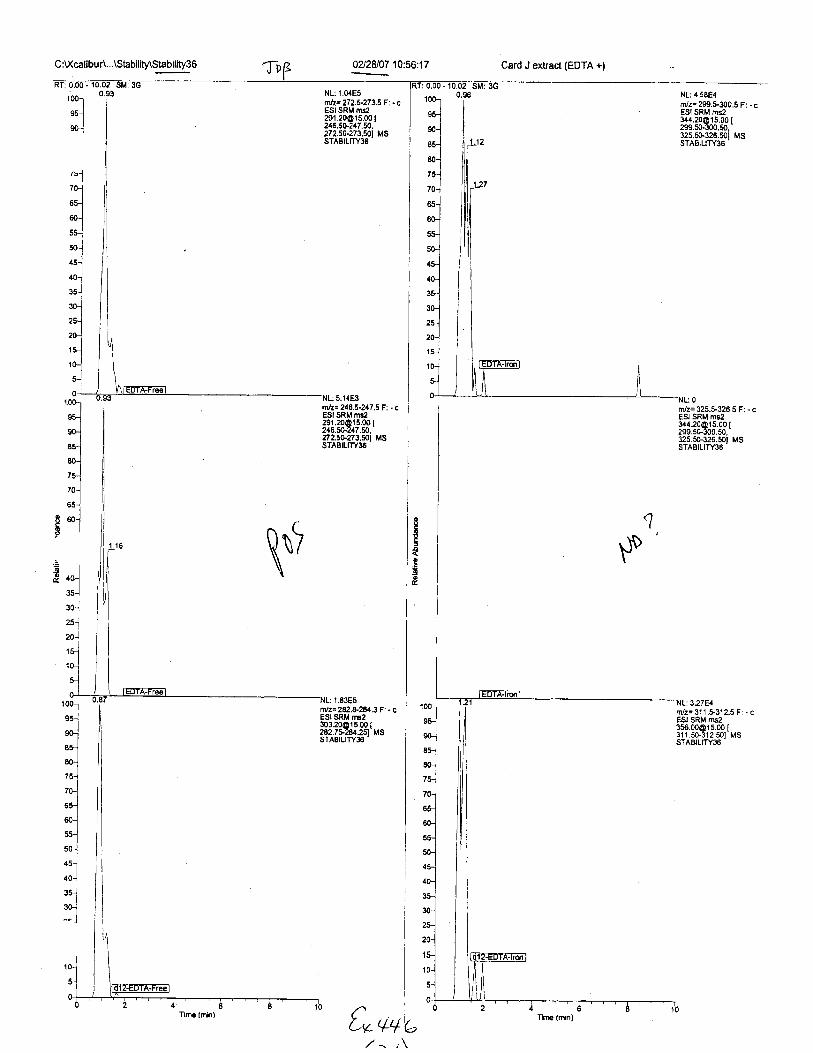
C :U(calibur\...\Stability\Stability36 0212407 10:56:17 Card J extract (EDTA +;
'*-.l95-.1
-lnlz- 272.$27!.5 F: - cESI SRM ms2291.20Or5.00 [246.50-247.50.272-50.273.501 MSSTABILI1Y36.
rvz= 325.5.326.5 F: - cESI SRM [email protected] MSSTABILITY36.
P
10o-l
,5.1
*1ru']
80-..1
'u-]'o']uu-l
*.1
fimG (rim)I
t:*++tu Tln€ (nin)
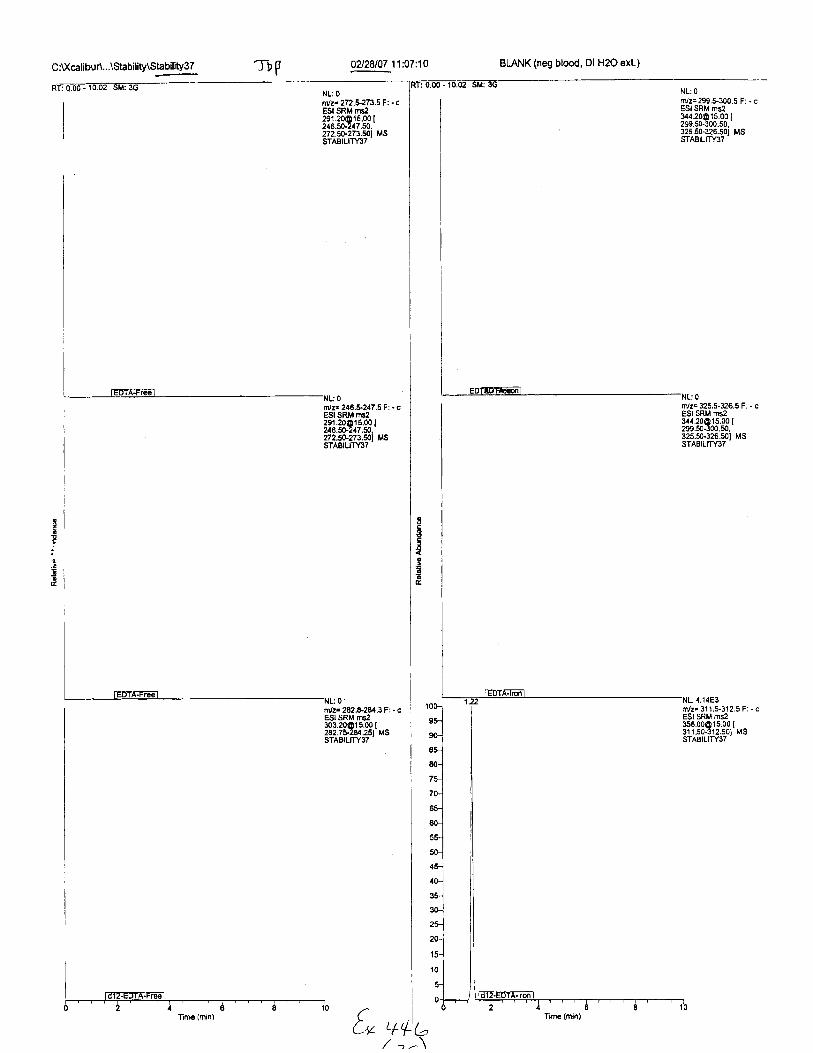
C :[(calibuA...\Stability\Slability3T A2l2U07 11:07:10 BIANK (neg blood, Dl H2O exl.)
NL:0trlz- 272.$273.5 F: - cESI SRM [email protected] MSSTAAILITY3T
flVz=299.$300.5 F: - cESI SRM [email protected],325.50-326.501 MSsTABtLnr3T
-
Tm(min)
n/z' 31 1.5-312.5 F: - cESI SRt4 ms23s5.00o1s.00 [311.50-312.501 MSSTAEILITY3T
a(-y ++('
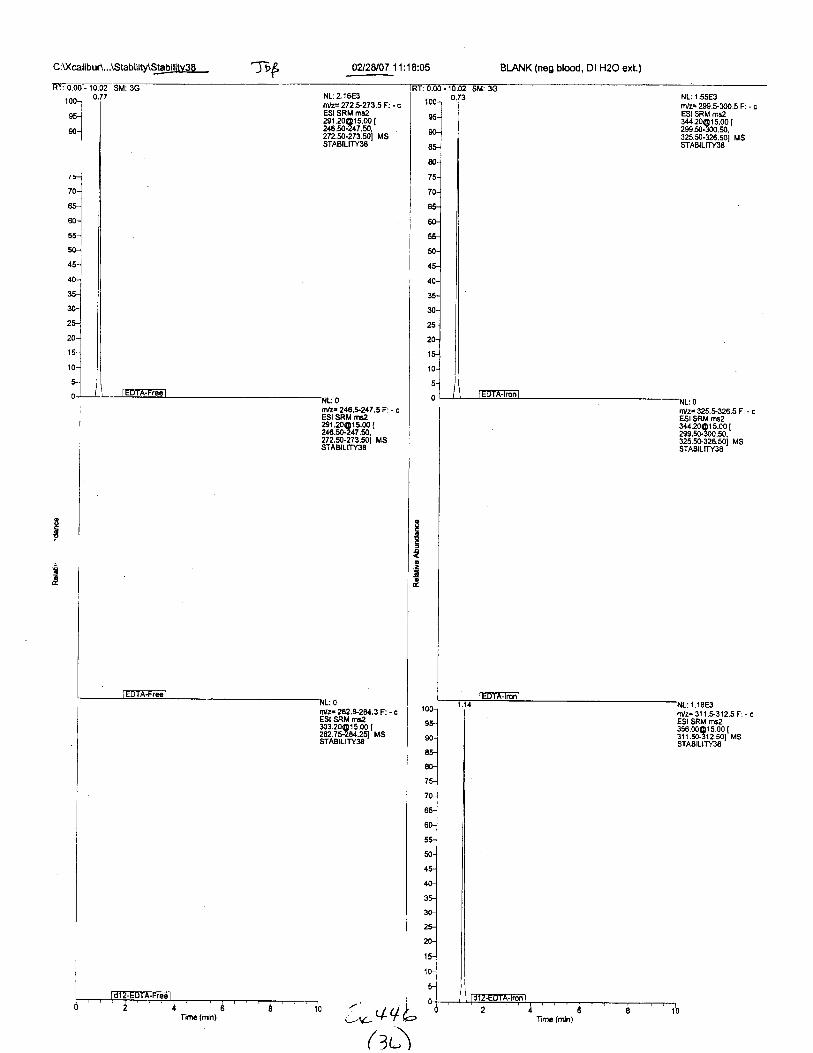
C:U(calibur\...\Stabilih^Stabilitv3E -jlF 0?/2U07 11:18:05
t*rrule0-l
NL: 2.16E3rtlz?272.12?3.5F: -cESI SRM ms2291.20@15,00 [246.50-247.50.2t2.50.273.501 MSSTAB|UW3S'
Ilr. (min) J.'.oa'lltu)
BI-ANK (neg blood, Dl H2O ext.)
NL:1.55E3r/z= 299.$300.5 F: - cESI SRM [email protected] [email protected] MSsTAEtLrTWs'
REg!t€.l.EoE
Tim (ndn)
C :U(calibur\...\Stability\Stability39 100 ppm EDTA
,*-lru-l
s0l
tolru-l
,o-j
85-]
ro-]
rrlro-]
*'l*-l
nrulmin)
rv.= 325.5-326.5 F: - cESI SRM ms234,[email protected]&300.50.325.s0.326.s0t MSSTABILITY3g.
I'lz-2a2.8.2U,3Ft. cESI SFIM tr8230320@1!;.001282.7$28.1.2q MSSTABILITY39
f:,K{r
0?/2U07 1 1:39:48
NL; 0nlzr 2f2.s273.5 F; - cESI SRM ms229120O15.001248.*21f .9,272.5G273,501 MSSTABILITY4O
BLANK (neS blood, Dl H2O ext.)
Tlm(mir)
C :l(calibuA...\Stab ility\Stability4 1 TbF 0228[07.11:50:40 BLANK (neg blood, Dl H2O ext,)
RI:0.00-10.02 SM:3GNL: O
o?
io
io
tilz=272.*273.5Fi - cESISRM [email protected] [24650.247.50,272.50273.501 MSSTABILITY4I
tr'lz=246.6247.5F: - cESI SRM rns229r 20O'r 5.00 I246.50247.50.272.50273.501 MSSTABILITY4l
rr'z= 2a2.&-2E/.3 F: - cESI SRM rns230320@t s.00 [282.75-2eQ51 MSsTABtLrn'41
{*
lr<r: u.oo - ru.uz sM: rG
NLOrn/z= 299.t300.5 F: . cESI SRM rsz
l#:"38J3.S,t325.50-326.50t MSSTABTLITY4'I
-
:2.06E3nvz:325.$326.5 F: - cESI SRM ms2
li3:338J333t32s.5G326.501 MSSTABILITY4T
L4 to

,- C :U(calituril..\EDTA\Brewer\O22807U2801 0A28107 03:31:28 EDTA neg blood/H2O extract To{
ds
:r2
6
NL: O
nlF n2,*7135Fi- cESI SRM nE2291.20@,|5.00 [246.9.241.fi.272.50.273.501 MS22001
R
i!c{3.t.9
E
NL:2.55E3rn/z:290.$300.5 F: - cESI SRM [email protected] MS22fJJ1
nft= 311.$312.5 F: -
ESISRM G2356.00O1s.00 [3r 1.5G312.sO1 MS22Eo1
nJZ.216.*217,5Fi - cESISRM ffi229r20Ct15.0O I246.5G247.50.272.5O-Zr3.5Ol MS2?@1
Ifm ln{n) Tlm(rnn)
Cr +q

rofnl*-1
*-l
C :l(caliDuA...\EDTA\BreweA022807tE,2B02
8oo
tuu
0A28107 03:42i41'--ir D
100 ppm EDTA J'f
nJz= 24Ei.5.217.sFi - cESI SRM ms2291,[email protected] [246.5(F217,50.272.5G273.so1 MS22802
NL: 1.56E4m/r:299.$300.5 F: . cESI SRM [email protected] I299.50.300.50.325.50-326.sot MS22802
m/:= 325.5-326.5 F: - cESI SRM [email protected] [299.50-300.50,325.50-326.501 MS22802
m/2.311.$312.5Fi-cESI SRM [email protected] I311,5O.312.501 MS22eo2
R
6E
eo..:o
Tim(mh)
Sample Name:
Comment:
Seq u e n ce---E DTA-sta bi I ity-n eg ion . sld [O pen]
BI-ANK (neg blood, Dl l't9o ef.)n
Study:
Client
Laboratory:
Company:
Phone:
C : Xcal i bu Amethod s\EDTA_Neg_
Sample Name:
Comment Study:
Client:
Laboratory:
Company:
Phone:
Sample Type File Name Sample lD Path Inst Method
Unknown STABILITYO2 02 C :\Xcalibu tlData\E DTA\Brewer\Stability u:\ GilrDunmemoos\Eu I A_Neg_swaDs
Proc Method CalFile Position njVol Level Sample Wt Sample Vol ISTD Amt
1 5.0 0.000 0.000 1.000
ozl..xl'tSF
Seq uence--E DTA-sta b i I ity-neg i on. s I d [Open]
Sample Name:
Comment
card extract
Study:
Client
Laboratory:
Company:
Phone:
Sarnple Type ile Name Sample lD Path lnst Method
Unknown STABILIryO3 01 :\Xcalibu nData\EDTA\Brewenstablllty C: U(calibur\methods\EDTA-Neg-Swabs
Proc Method CalFile Position lnjVol Level Sample Wt Sample Vol ISTD Amt
2 5.0 0.000 0.000 1.000
Sample N (neg blood, Dl H2O ext,
Comment: Study:
Client
Laboratory:
Company:
Phone:
Sample Type File Name Sample lD Path lnst Method
Unkno,vn STABILITYM 01 C:Xcalibu AData\EDTA\BreweAStability C :Xcali bu r\methods\E DTA_Neg_Swabs
Proc Method CalFile Position lnjVol Level Sample Wt Sample Vol ISTD Amt
1 5.0 0.000 0.000 1.000
otlt-rl"t@
Sample Name:
Comment:
(neg blood, Dl H2O ext.
Study:
Client
Laboratory:
Company:
Phone:
Proc Memoo CalFile Position njVol Level Sample Wt Sample Vol ISTD Amt
1 5.0 t.000 0.000 1.000
ffifrffiisffittrffiat€t*fttffifftffffitffittffiffiatlffilillta*tttttt#ittltt*tffifftttill*iit*txlfft'ttttft
Sample Name:I
comrnent studY:
Client:
Laboratory:
Company:
Phone:
Seq u en ce-- E DTA-sta bi I ity-ne g ion. sl d [O pen ]
f; {r/ e,( q+\
page 3 /
lDil Factor I
n006---l
rttatt*tt**frtt**tt**hitttttittt*iaftittit*t*t**Ht#fr tat*frit*tF6l*ttrt*HttttftffaitlttattHat*ttttffti*trattrtifffft*ta*tt
otftl"t'ft?
Sample Type File Name Sample lD Path lnst Method
Unknown STABILIWOs 01 C fXca[i ou rtOata\EDTA\Brewer\Stability C :Xcali bu r\m ethods\EDTA-Neg-Swa bs
Sample Type File Name Sample lD Path lnst Method
Unknown STABILITYO6 01 C :\)(calibu r\Data\E DTA\Brewer\Stabili$ :v(calibur\metnocls\ts IJ I A_Neg_swaDs

Seq uence---E DTA_sta bi I ity_neg i o n. s ld [O pen]
Sample t,tame:tl
Study:
Client:
l-aboratory:
Company:
Phone:
Sample Type File Name Sample lD Path Inst Method
Unknown STABILIryOT 01 g: u(caltbunDaE\ts D I A\Hre\r/er\Stabrlrty u:xcallbunmemods\tsD I A_Neg-liwabs
Proc Method CalFile Position InjVol Level Sample Wt SampleVol ISTD Amt
5.0 0.000 0.000 1.000
Sample Name:
Comment: Study:
tllient:
l-aboratory:
Oompany:
Phone:
sample lype File Name Sample lD Path lnst Method
Unknown STABILITYOS 01 C:XcaliburlData\EDTA\BreweAStability : \Xcalib u r\m ethods\EDTA_N eg_Swabs
Proc Method CalFile Position lnjVol Level Samole Wt Sample Vol STD Amt
5,0 3.000 0.000 1.000
[* +na( +s1
page4'
ovl*1"1{!P

Sample Name:
Comment:
Seq u e n ce---E DTA_sta bi I itlneg i on . sld [O pen ]
Study:
Client:
Laboratory:
Company:
Phone:
+)
Sample Type File Name Sample lD Path lnst Method
Unknown STABILIWOg 01 C :\)(calibuAData\EDTA\BreweAStabili$ C :U(cal i bu r\m ethods\E DTA-Neg_Swabs
Proc Metnod CalFile Position njVol Level Sample Wt Sample Vol ISTD Amt
4 5.0 0.000 0.000 1.000
Sample Name:
Comment: Study:
Client:
Laboratory:
Company:
Phone:
,neg
Sample Type File Name Sample lD Path lnst Method
Unknown STAEILITYlO 01 c: \xcali bu RDaIa\EDTA\B rewer\Stability C :\Xcalabu r\methods\E DTA_N eg_Swabs
fr r'(L,( qL,\
page 5
ouluel"l.S.roF

Seq u e n ce--E DTA_sta b i I ity_n eg ion . s I d [O pe n ]
Sample Name:
Comment:
ext.
Study:
Client:
Laboratory:
Company:
Phone:
Sample Type File Name Sample lD Path lnst Method
Unknown STAEILITY1l 01 :U(cal i bu AData\EDTA\Brewer\Stab ility C:XcdibuAmethods\EDTA_Neg-Swabs
Proc Method Cal File Position InjVol Level Sample Wt Sample Vol ISTD Amt
5,0 0.000 0.000 1.000
Sample Name: lIJComment Study:
Client:
Laboratory:
Company:
Phone:
Sample Type File Name Sample lD Path lnst Method
Unknown STABILITY12 01 u:\ cattDunuata\Eu I A\tsrewen$EDilrty C:\Xcalibur\methods\EDTA_Neg_Swabs
ttaaittttt*ff tttittttit*t*
fl,t+a(v t)
page 6 '
or- f urJ"'l'{nP

Sample Name:
Comment:
Seq uen ce---E DTA-sta bi I ity-neg i on . sld [O pe n]
BI-ANK (neg blood, Dl H2O eX.
Study:
Client:
Laboratory:
Company:
Phone:
Proc Method CalFile Position InjVol Level Sample Wt Sample vol ISTD Amt
1 5.0 0.000 0.000 1.000
Sample 11366'
Study:
Client:
Laboratory:
Company:
Phone:
Sample Type File Name Sample lD Path lnst Memod
Unknown STAEILITYl4 01 C :Xcalibu r\Data\EDTA\BreweAStabili$ :Xcalibu Amethods\E DTA_N e g_Swabs
Proc Method CalFile Position Injvol Level Sample Wt Sample Vol ISTD Amt
1 5.0 0.000 0.000 1.000
5. qu"( as)
pageT'
orlrsl-t'gP

S eq u ence--- E DTA-stab i I ity-neg i o n. sld [O pen]
Sample Name:
Comment StudY:
Client:
Laboratory:
Company;
Phone:
Sample Type File Name Sample lD Path Inst Method
Unknown STABILITY1S 01 C:U(cali bu r\Data\EDTA\8 rewe r\Stabi lity :Xcalibur\methods\E DTA_Neg_Swa bs
Proc Method CalFile Position InjVol Level Sample Wt Sample Vol ISTD Amt
o 5.0 0.000 0.000 1.000
Sample Name:
Comment:
(neg ext.
Study:
Client:
Laboratory:
Company:
Phone:
Sample Type File Name SamDle lD Path lnst Method
Unknown STABILITYl6 01 c: u(caltDu r\Data\Eu I A\tsrewensEDrlrty :\Xcalibur\methods\EDTA_Neg-Swabs
Proc Method CalFile Position InjVol Level Sample Wt Sample Vol ISTD Amt
1 5.U 0.000 0.000 1.000
orl*1.1,s,P[*'/'/-,
( +q\page 8/
Seq u e n ce-- E DTA-sta b i I ity-neg io n. s I d [O pen]
Sample Name:
Comment:
neg blood, Dl H2O ext.)
Study:
Client:
Laboratory:
Company:
Phone:
trffiffiffiffiffif,*tftl*'t*llffftltf.ttttffi**tttlllttttttt.ttffltffitftsfrttlllltaftt*tt.tta
Sample Name: Card D extract (EDTA +
Comment: Study:
Client:
Laboratory:
Company:
Phone:
Sample Type File Name Sample lD Path lnst Method
Unknown STABILITYlT 01 C:\)(calibuAData\EDTA\BreweAStabil ity : Xcalibur\methods\EDTA-N eg-Swabs
Proc Method CalFile Position InjVol Level Sample Wt Sample Vol ISTD AMt
1 5.0 0.000 0.000 1.000
o.lrrl't'av?5z,tu+
/5o)page 9'

S eq u ence--- E DTA-sta bi I ity-n eg i o n. sld [O pe n ]
Sample Name:
Comment:
(neg blood, Dl H2O ext.)
Study:
Client:
Laboratory:
Company:
Phone:
Itiff rtrttff tffi ffi F.tttff tlttl*llt#tltttrtff ttft$tff lllff lfr tltAttltff I
Sample Name:
Comment:
(neg blood, Dl H2O ext.)
Study:
Client:
Laboratory:
Company:
Phone:
Sample Type Fild Name Sample lD Inst Methotl
Unknown STABILITY19 01 C:Xcali bur\Datra\EDTA\Brewer\Stability :Xcdibu Amehods\E DTA-N eg-Swabs
Proc Method CalFile Position lnjVol Level Sample Wt Samole Vol ISTD Amt
1 5.0 0.000 0.000 1.000
foquo( s,)
page'10
ovlt'||t"1'$'P
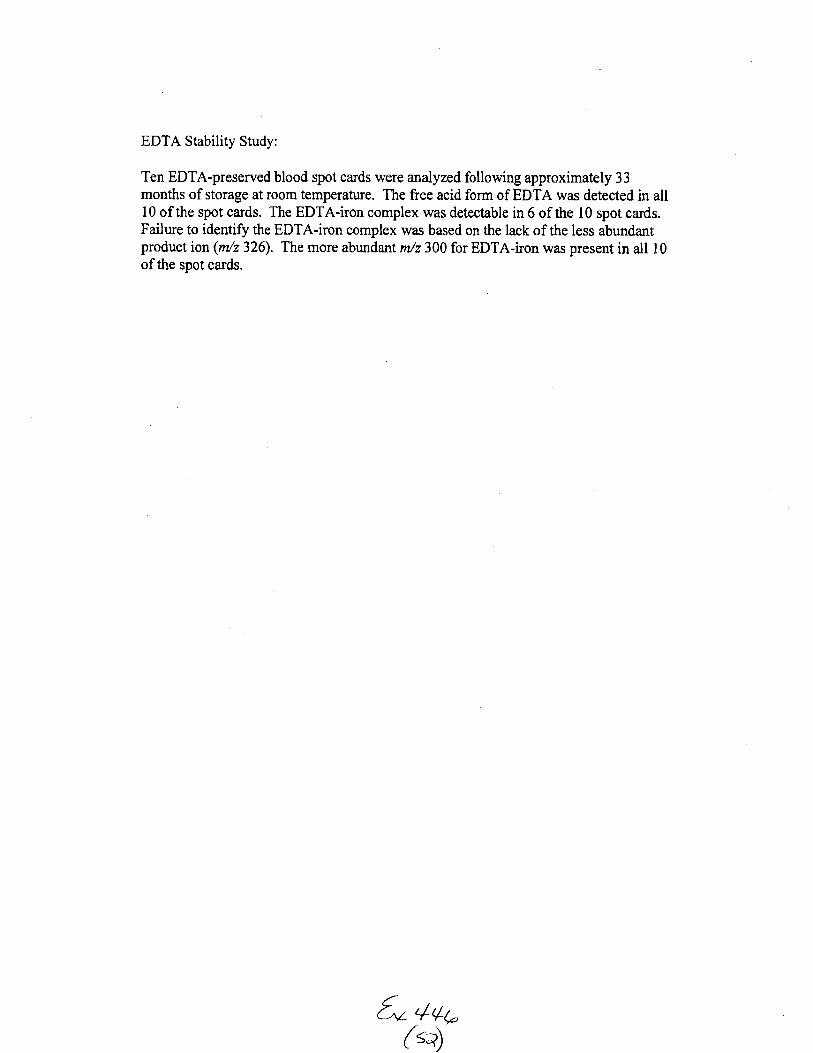
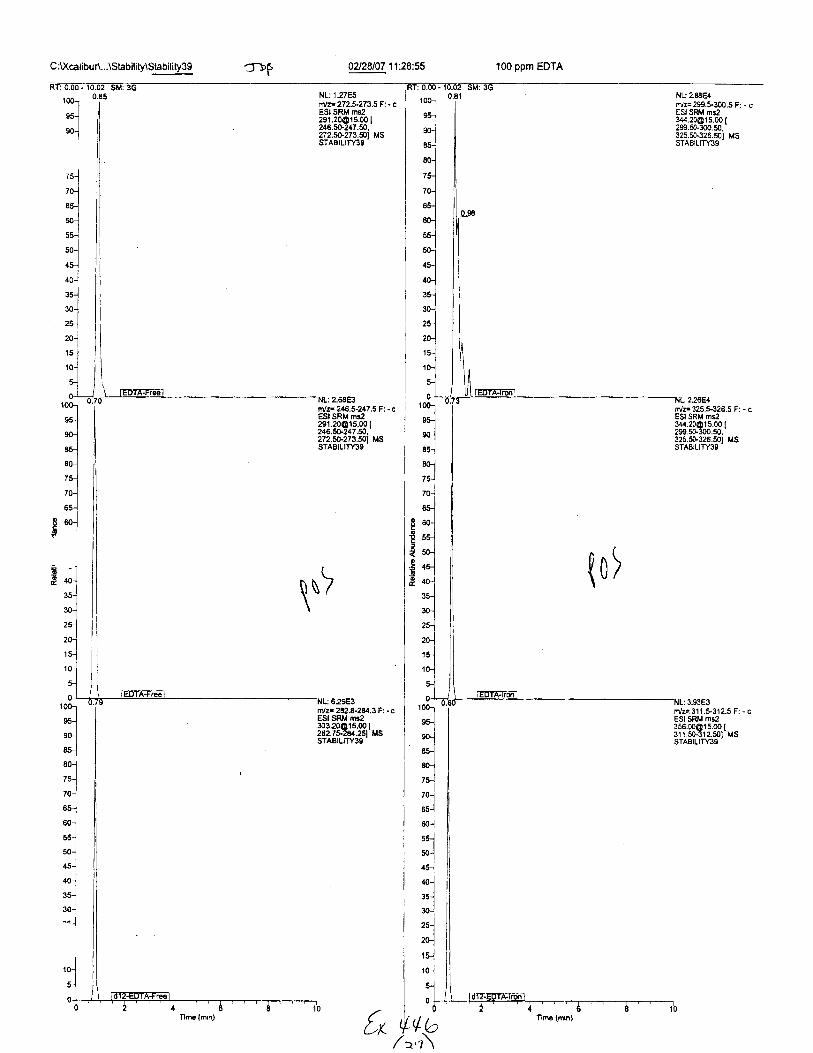
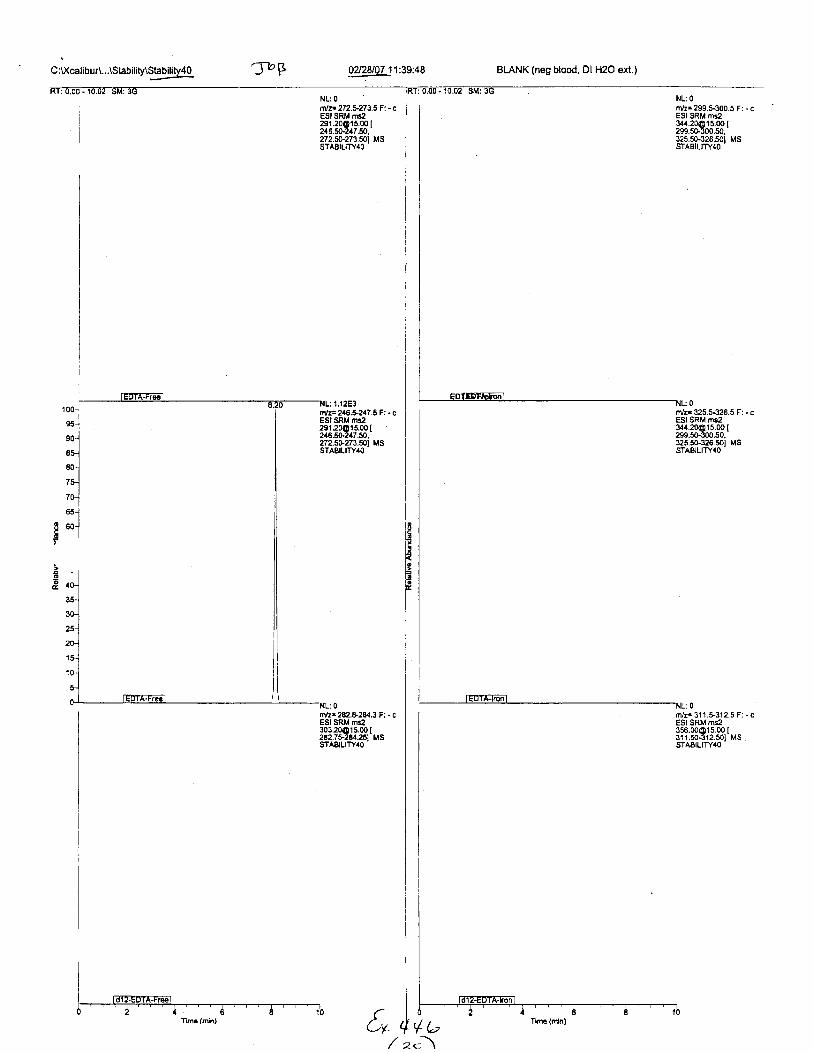
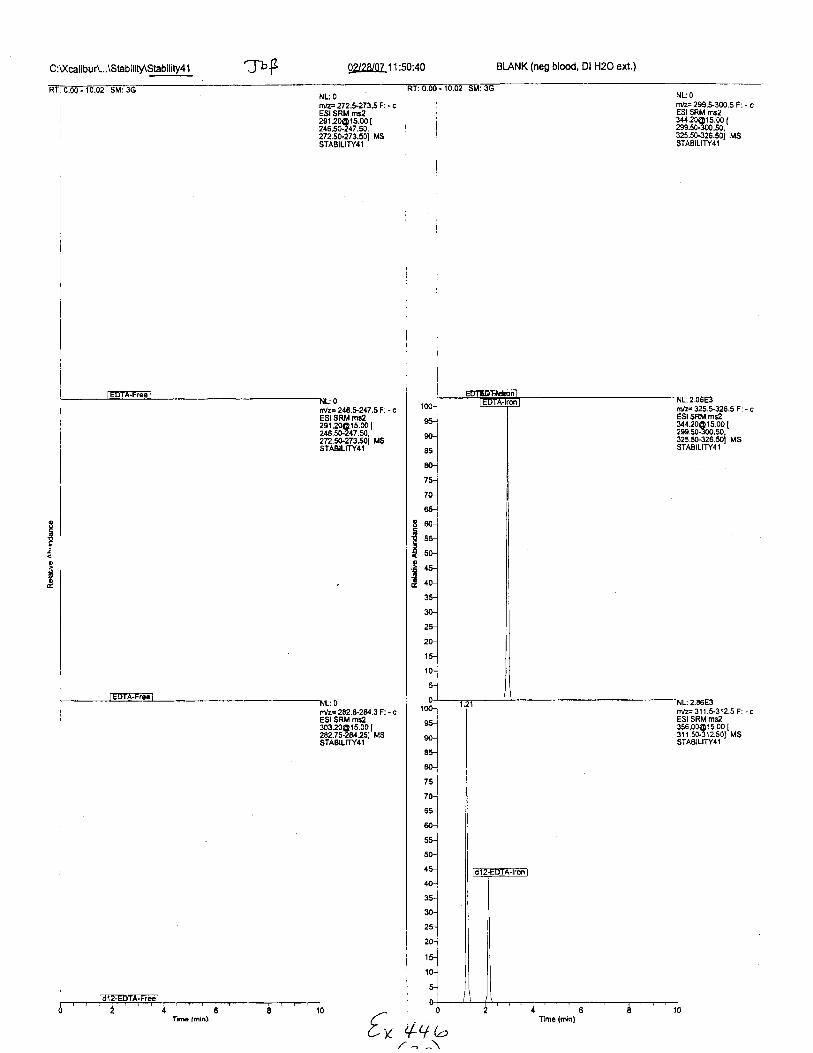
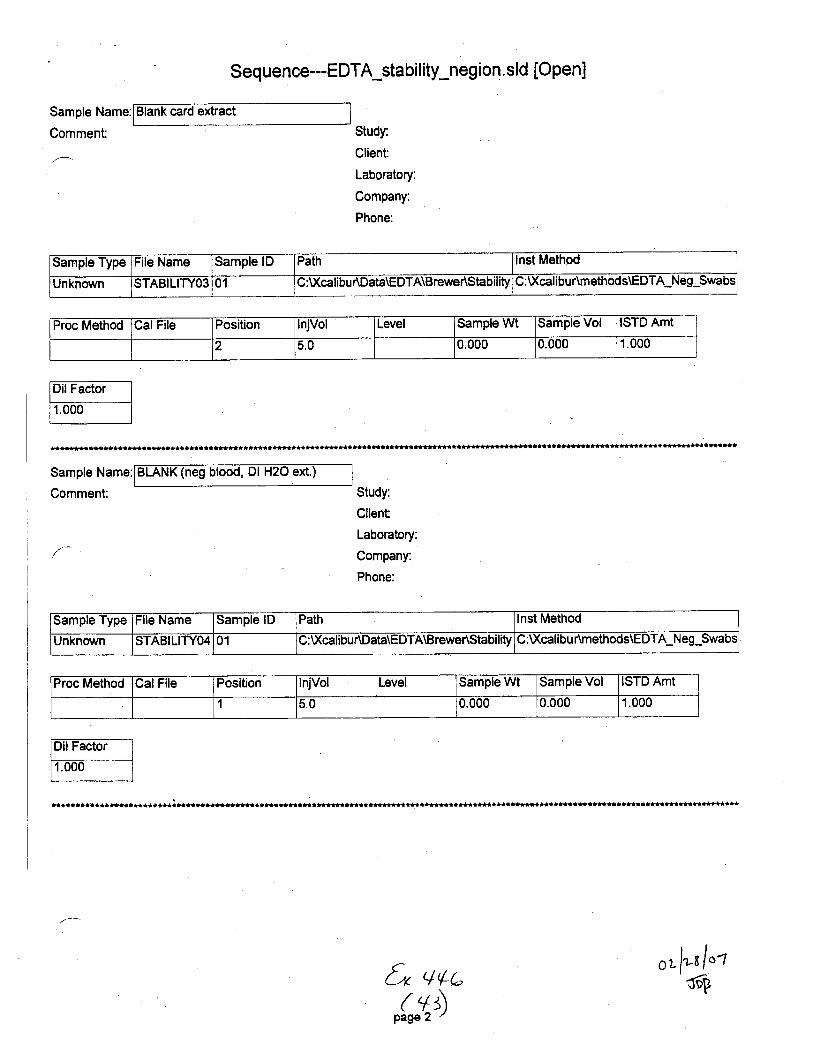
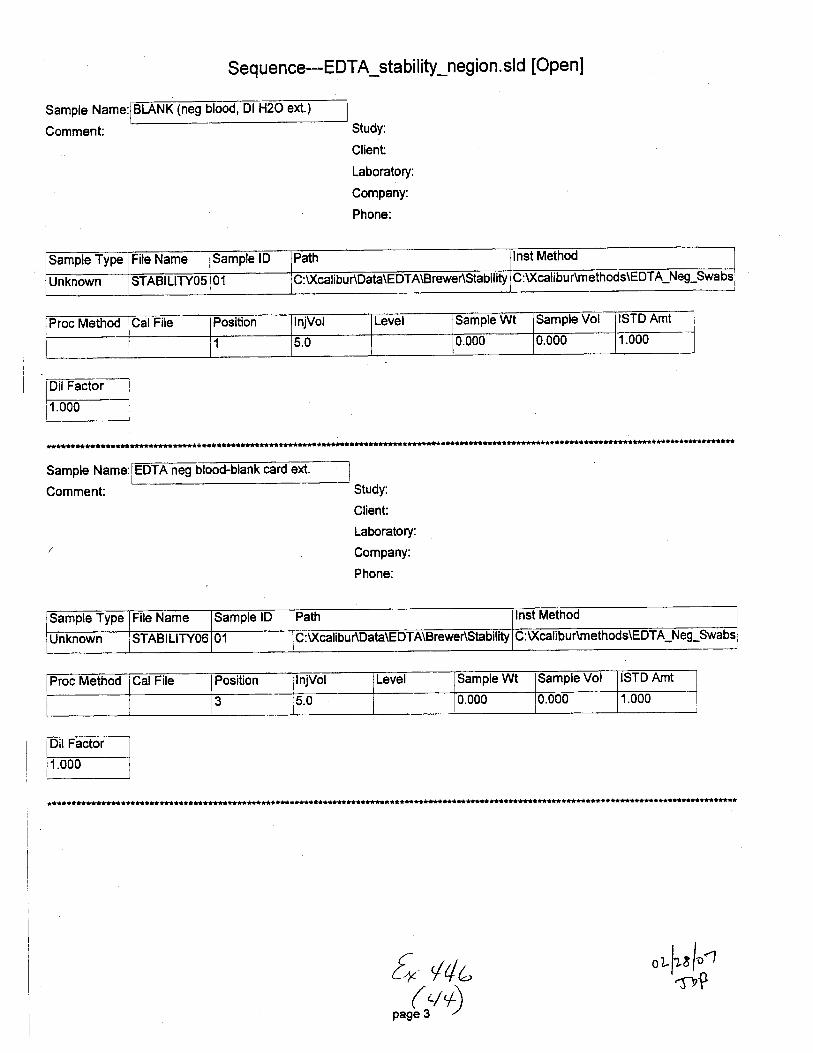
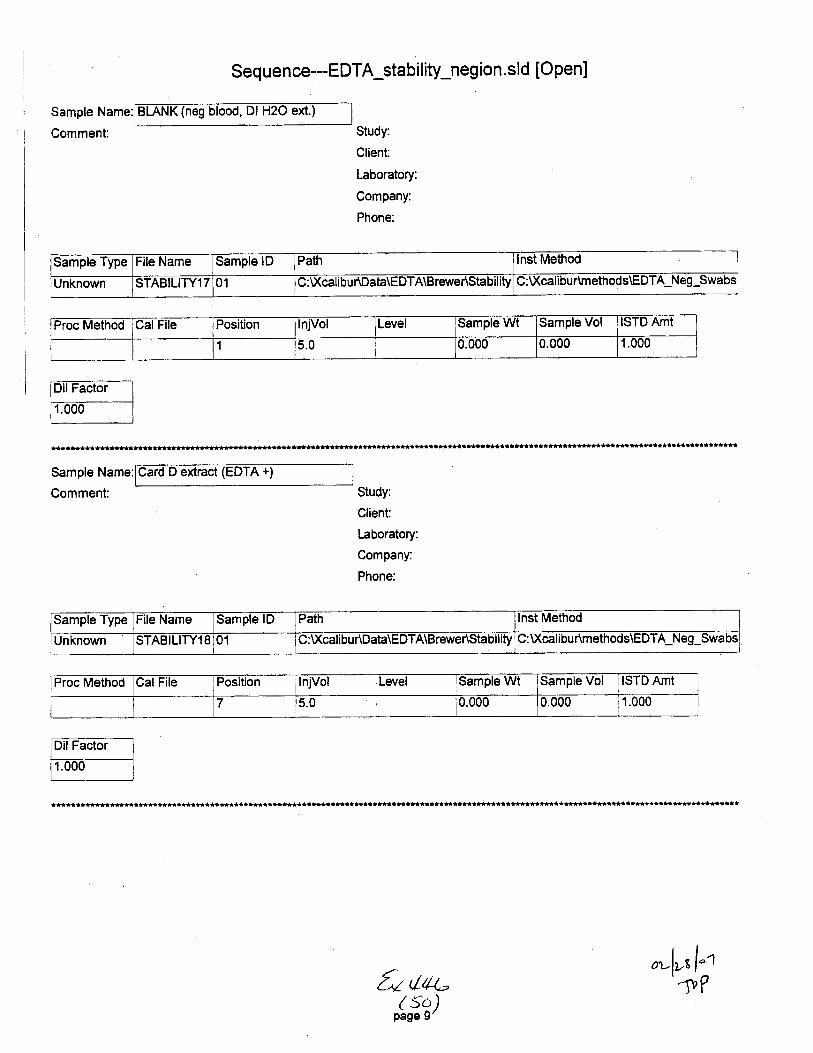
EDTA Stability Study:
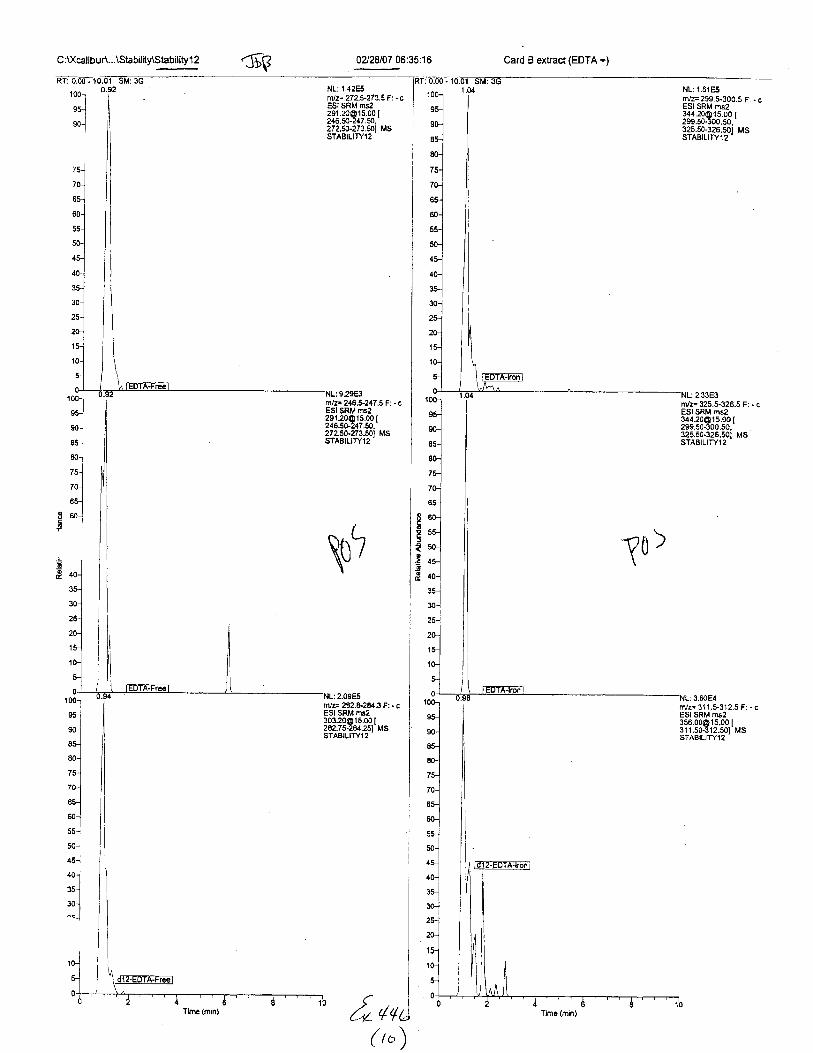
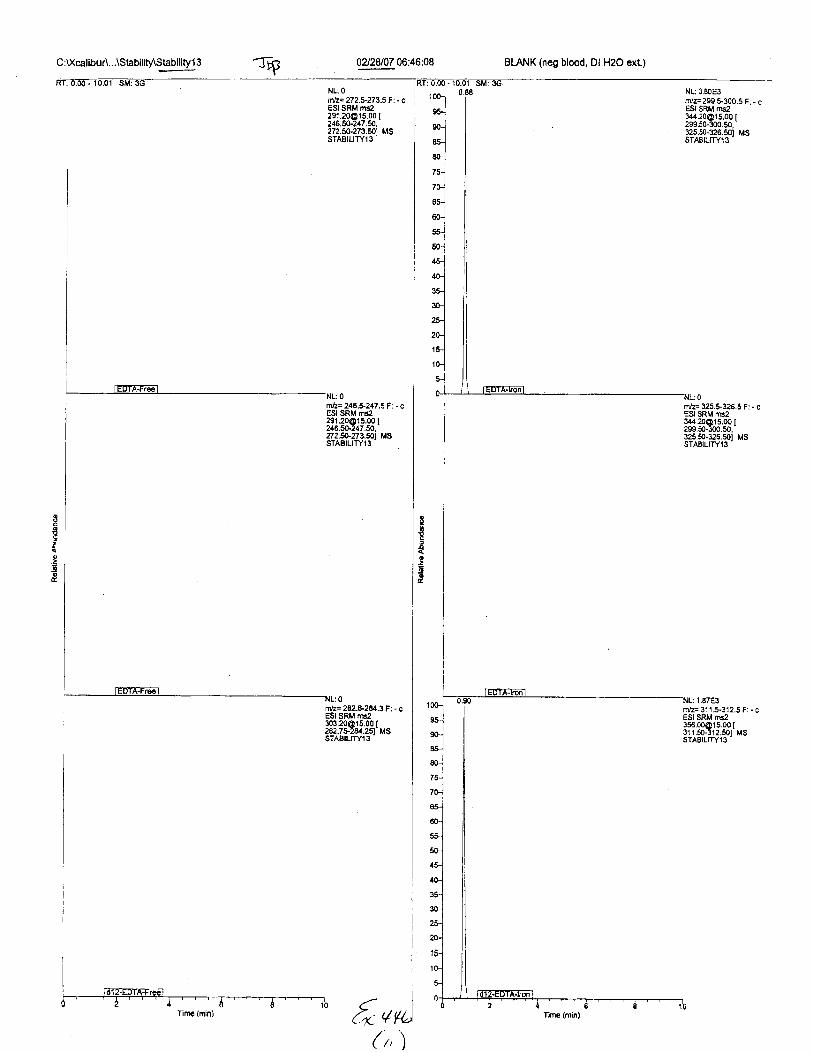
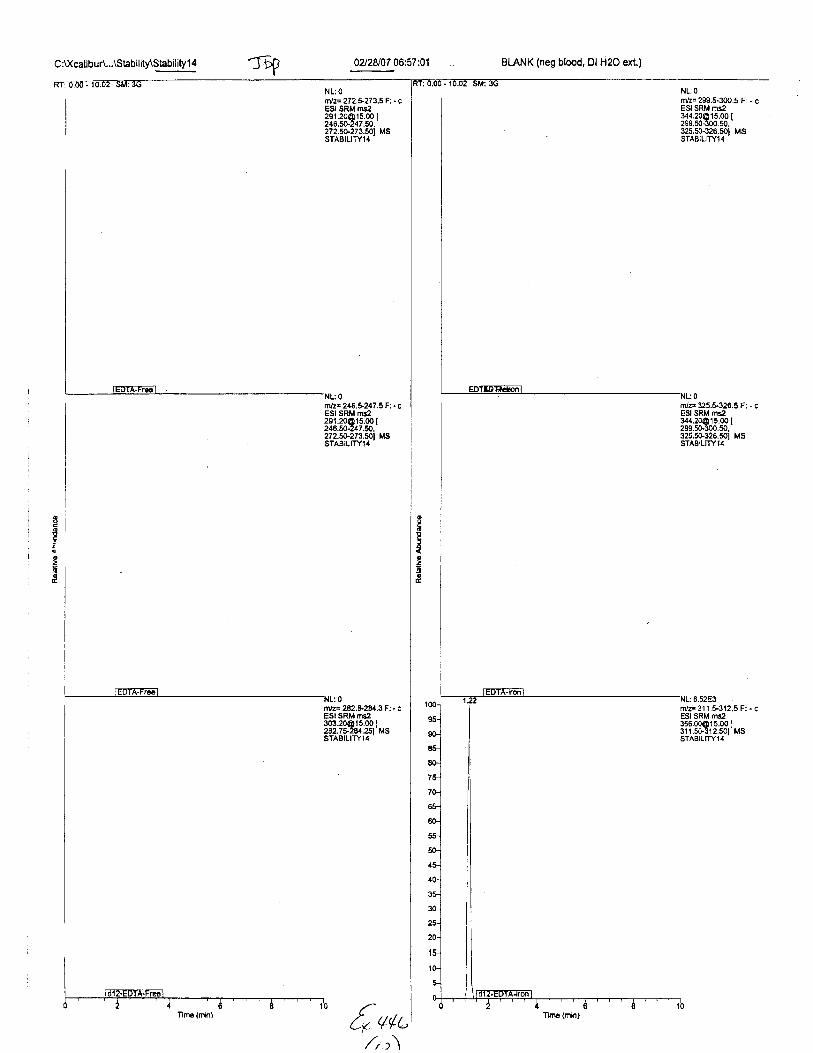
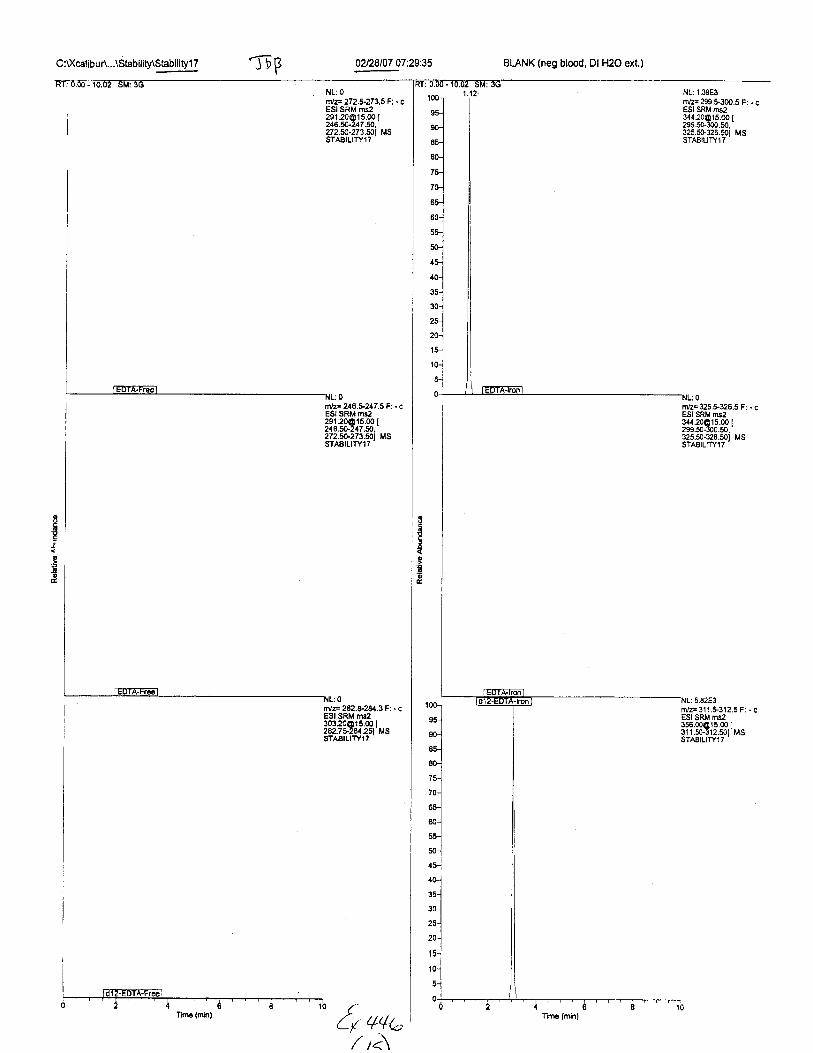
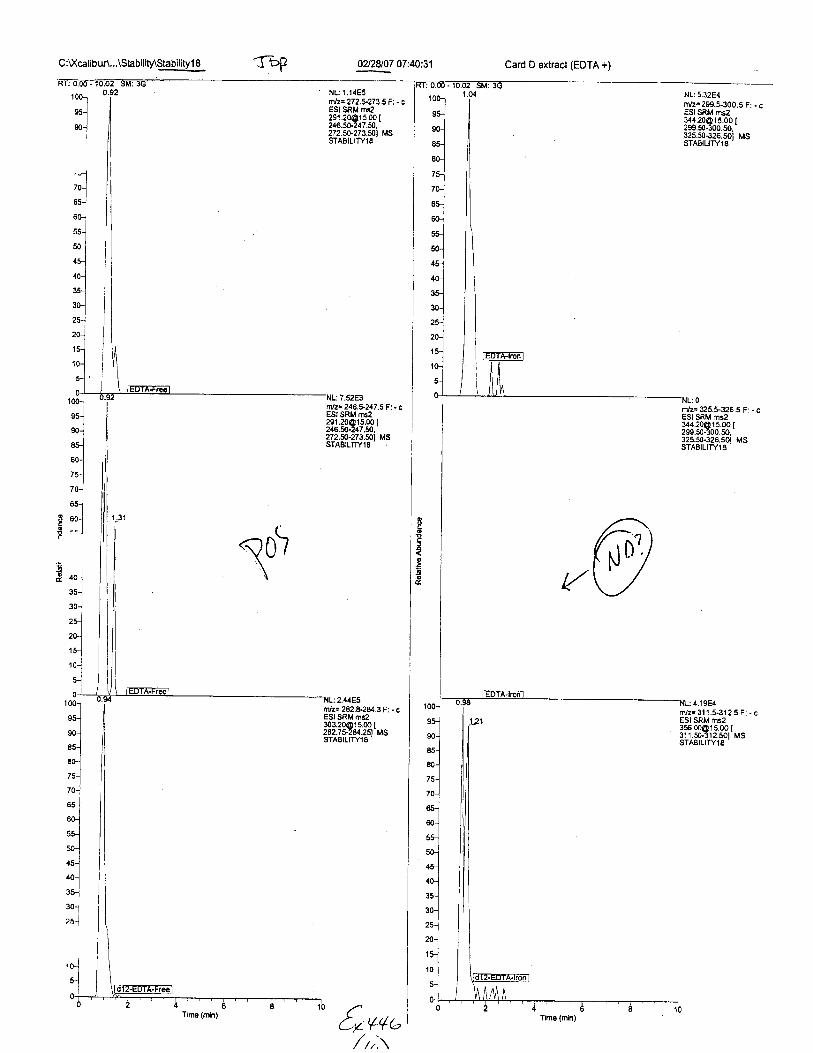
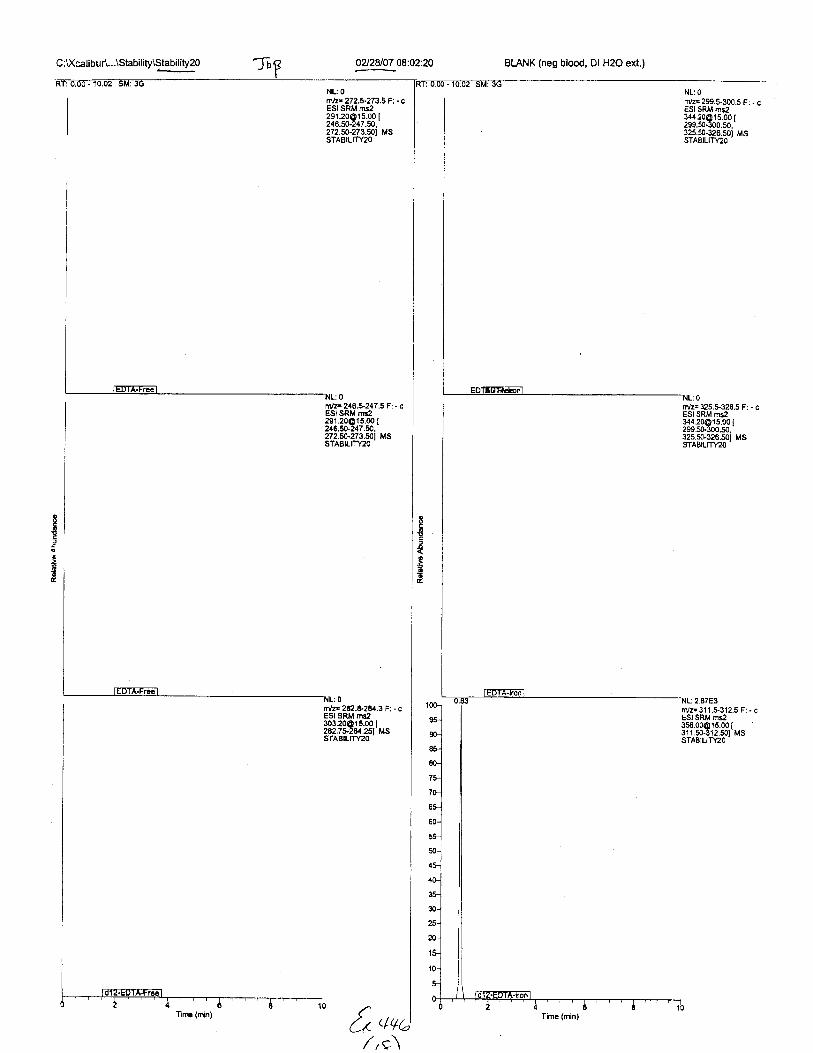
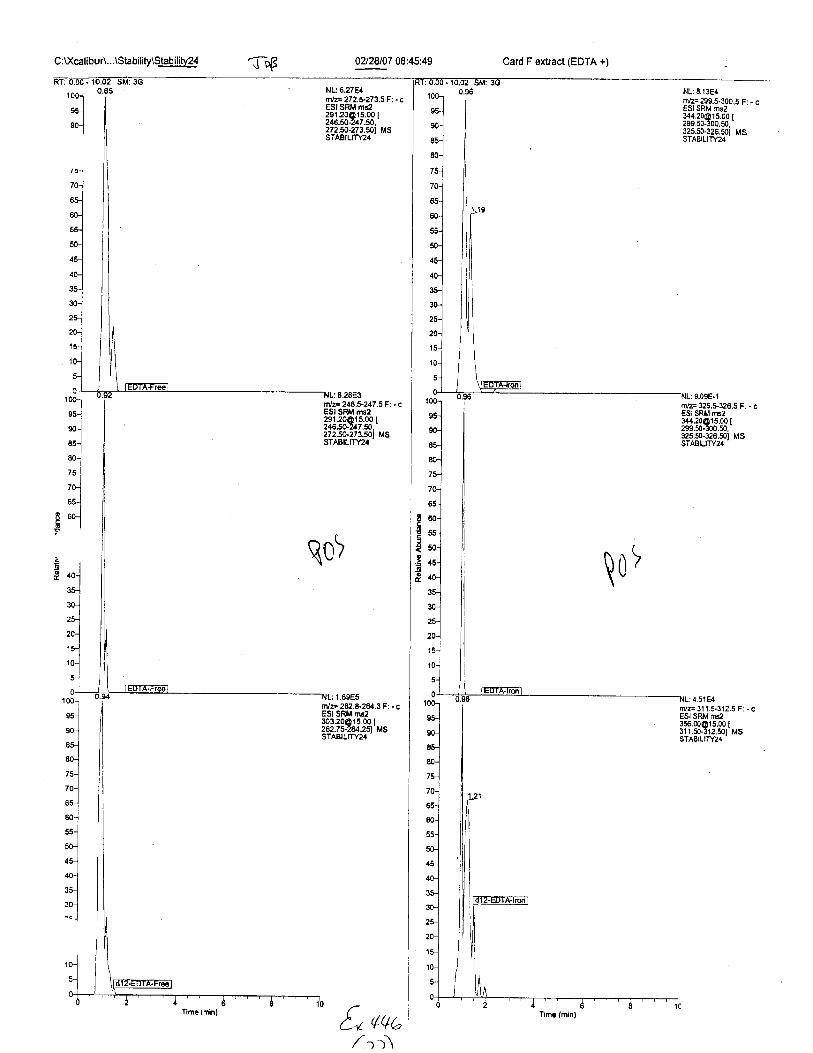
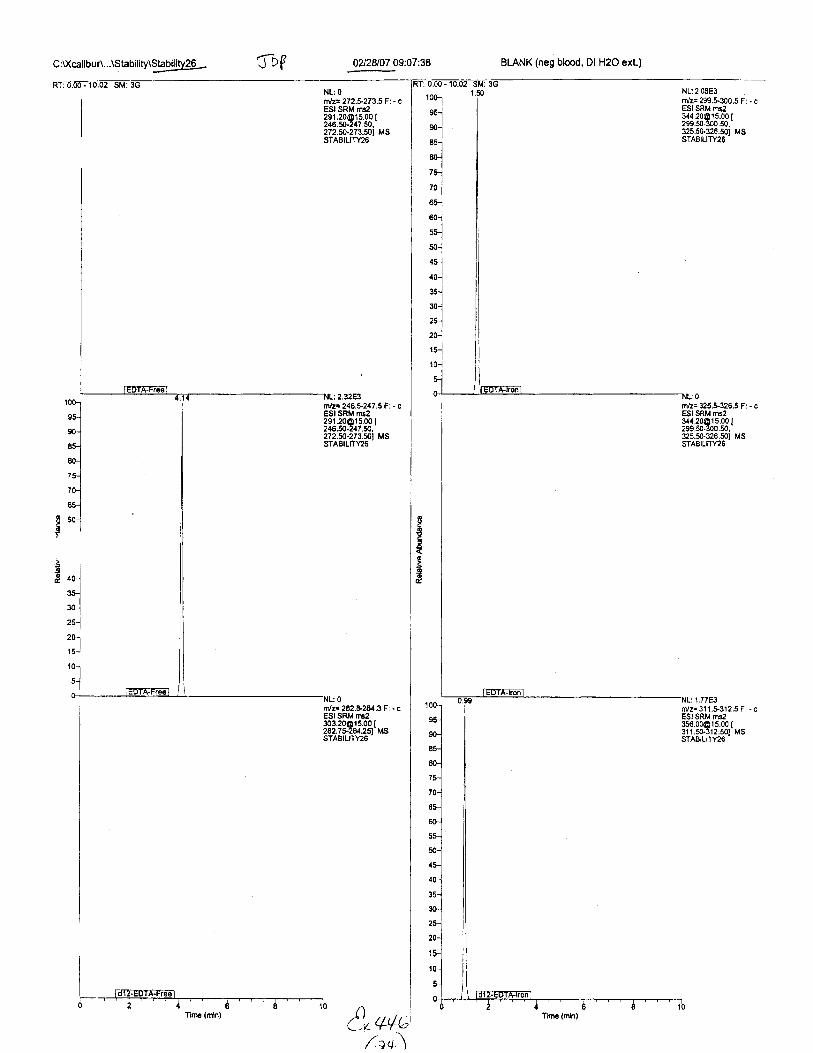
Ten EDTA-preserved blood spot cards were analyzed following approximately 33months of storage at room temperature. The free acid form of EDTA was detected in alll0 of the spot cards. The EDTA-iron complex was detectable in 6 of the l0 spot cards.Failure to identify the EDTA-iron complex was based on the lack of the less abundantproduct ion (m/z 326). The more abundant m/z 300 for EDTA-iron was present in all l0ofthe spot cards.
5o +v6G4

CASE FILE
t, q+b(')

7;l-M*a'ct.t6)
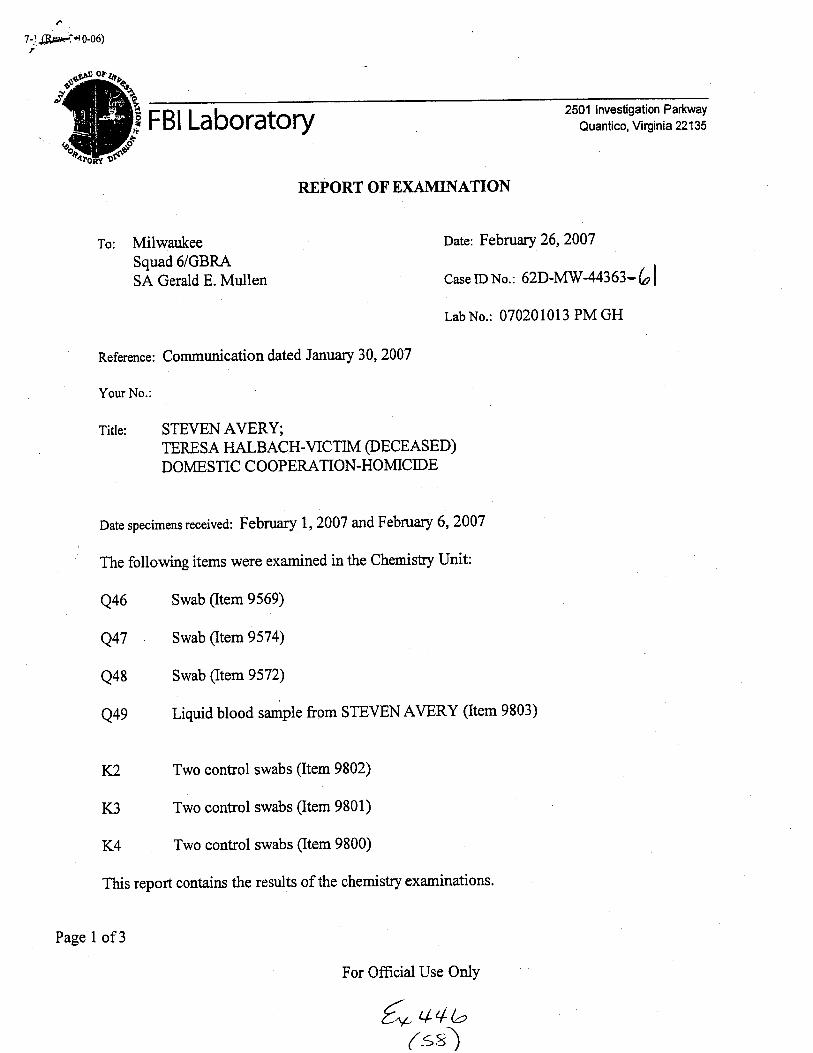
ffiffi'@ 2501 Investigation Parkway
Quantico, Virginia 221 35
REPORT OF EXAMINATION
To: Milwaukee Date: Febru ary 26,2007Squad 6/GBRASA Gerald E. Mullen Case IDNo.: 62D-MW-443$*bl
Lab No.: 070201013 PM GH
Reference : Communication dated January 3 0, 2007
Your No.:
Title: STEVEN AVERY;TERESA HALBACH-VICTIM (DECEASED)DOMESTIC COOPERATION-HOMICIDE
Date specimens received: February 1,2007 arrd February 6,2007
The following items were examined in the Chemistry Unit:
Q46 Swab (Item 9569)
Q47 Swab (Item 9574)
Q48 Swab (ltem9572)
Q49 Liquid blood sample from STIIVEN AVERY (Item 9803)
K2 Two control swabs (Item 9802)
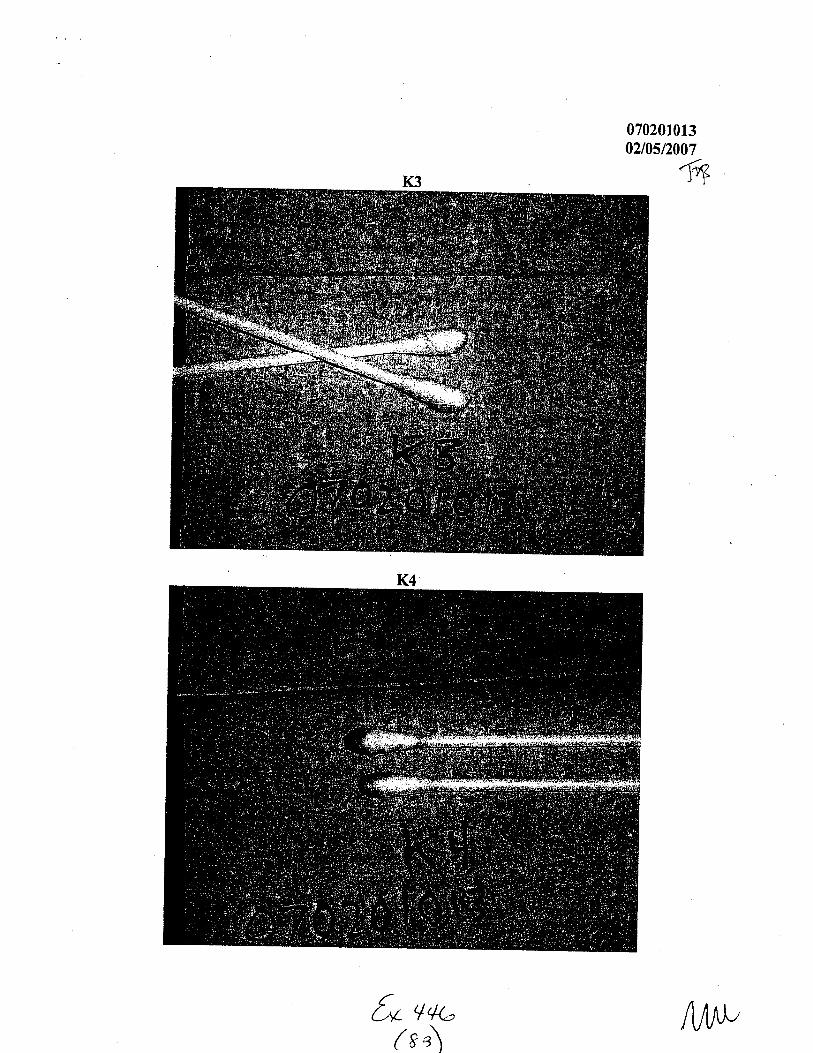
K3 Two control swabs (Item 9801)
K4 Two control swabs (Item 9800)
This report contains the results of the chernistry examinations.
Page 1 of3
For Official Use Onlv
14t6( s+\
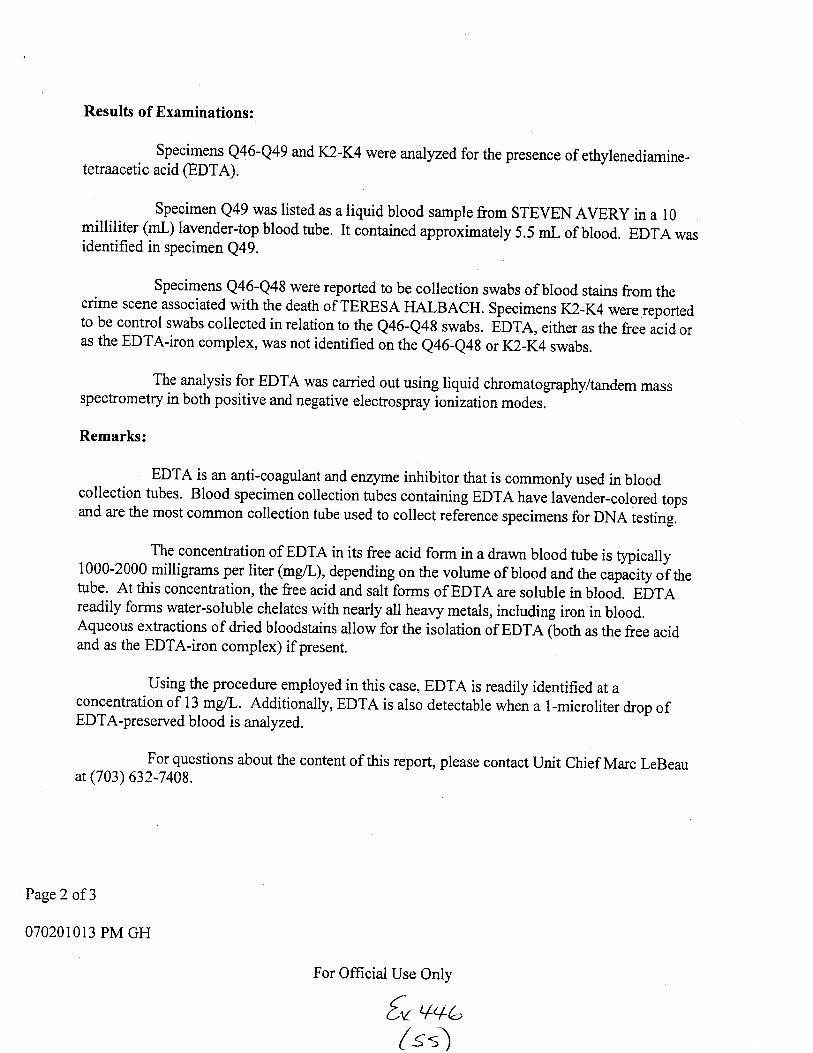
Results of Examinations:
Specimens Q46-Q49 and K2-K4 were analyzed for the presence of ethylenediamine-tetraacetic acid @DTA).
Specimen Q49 was listed as a liquid blood sample from STEVEN AVERy in a l0milliliter (mL) lavender-top blood tube. It contained approximately 5.5 mL of blood. EDTA wasidentified in specimen Q49.
Specimens Q46-Q48 were reported to be collection swabs of blood stains from thecrime scene associated with the death of TERESA HALBACH. Specimens K2-K4 were reportedto be control swabs collected in relation to the Q46-Q48 swabs. BO1R, either as the free acid oras the EDTA-iron complex, was not identified on the e46-e4g or K2-K4 swabs.
The analysis for EDTA was carried out using liquid cluomatography/tandem massspectrometry in both positive and negative electrospray ionization modes.
Remarks:
EDTA is an anti-coagulant and en4rme inhibitor that is commonly used in bloodcollection tubes. Blood specimen collectiorr tubes containing EDTA have lavender-colored topsand are the most common collection tube used to collect reference specimens for DNA testing.
The concentration of EDTA in its free acid form in a drawn blood tube is typically1000-2000 milligrams per liter (mg/L), depending on the volume of blood and the.up*ity oith.tube. At this concentration, the free acid and salt forms of EDTA are soluble in blood. EDTAreadily forms water-soluble chelates with nearly all heavy metals, including iron in blood.Aqueous extractions of dried bloodstains allLow for the isolation of EDTA (both as the free acidand as the EDTA-iron complex) if present.
Using the procedure employed irr this case, EDTA is readily identified at aconcenfration of 13 mglL. Additionally, ELITA is also detectable when a 1-microliter drop ofEDTA-preserved blood is analyzed
For questions about the content of this report, please contact Unit Chief Marc LeBeauat (703) 632-7408.
Page2 of3
07020t013 PM GH
For Official Use Onlv
€o ++e,
1st)

For questions about the status of remaining forensic examinations, if applicable,please contact Request coordinator Michael vanArsd-ale at (703) 632-gg09.
The submitted evidence was returned under separate cover of communication.
Marc A. LeBeau, PhDChemistry Unit(703) 632-7408
Technically reviewed and any identifications and associations confirmed bv:
This report contains the opinions/interpretations of the examiner(s) who issued the report.
Page 3 of3
070201013 PM GH
For Official Use Onlv
&.++,-/5r\
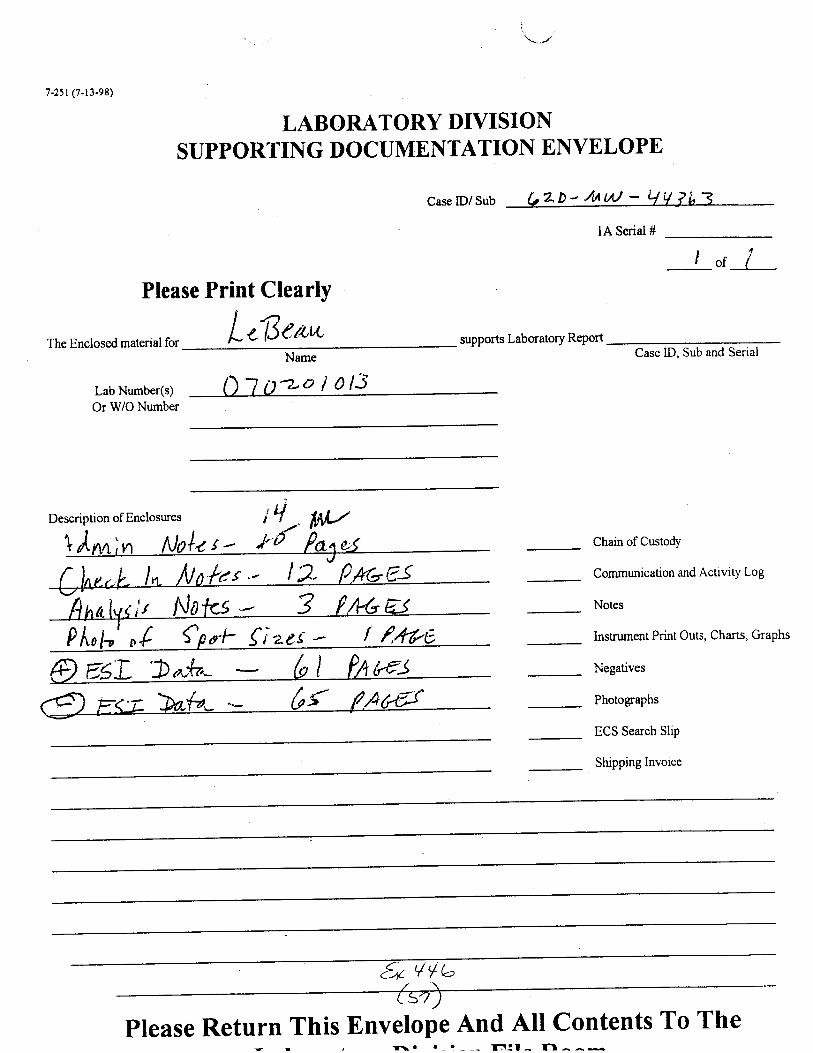
7-251 (7-13-e8)
The Enclosed material for
LABORATORY DIVISIONSUPPORTING DOCUMENTATION ENVELOPE
Case ID/ Sub LzD-,/uW - qV ?1,3
IA Serial #
Please Print Clearly
LtT3e*n supports LaboratorY RePort
Ilor
Name
LabNumber(s) 11 O-z'o | 013Or WO Number
Case ID, Sub and Serial
Chain of Custody
Communication and ActivitY Log
Notes
Instrument Prrnt Outs, Charts, Graphs
Negatives
Photographs
ECS Search Slip
Shipping Invoice
DescriptionofEnclosures itl -
\ )'rv'n Nole g - J'.f Jv<
7s .- l2 Pr+r-gS
P hsh' ,{ {po't- {izes ' I /''f"EF ssL b,J,^- * b I Pn r,rs
please Return This Ilnvelope And All contents To The
a
7-.lJBEr'io 0-06)
r^rl ni.-^u---.-,Y,-Lg.
Hrui FBI Laboratory
MilwaukeeSquad 6/GBRASA Gerald E. Mullen
Reference:
Your No.:
Title:
K2
K3
K4
This report contains the results of the chemistry examinations.
Page 1 of3
2501 Investigation Parkway
Quantico, Virginia 221 35
REPORT OF EXAMINATION
Date: February 26,2007
Case ID No.: 62D-MW'443$-(ol
Lab No.: 070201013 PM GH
STEVEN AVERY;TERESA HALBACH-VICTM (DECEASED)
DOMESTIC COOPERATION -HOMICIDE
Date specimens received: February 1,2007 and February 6,2007
The following items were examined in the Chemistry Unit:
Q46 Swab (Item 9569)
Q47 Swab (Item 9574)
Q48 Swab (Item 9572)
Q49 Liquid blood sample from STEVEN AVERY (Item 9803)
Communication dated January 30, 2007
Two control swabs (Item 9802)
Two control swabs Qtem 9801)
Two control swabs (Item 9800)
For Offrcial Use Only
6o ++t( ss)

Results of Examinations:
specimens Q46-Q49 and K2-K4 were analyzed for the presence of ethylenediamine-tetraacetic acid @DTA).
specimen Q49 was listed as a liquid blood sample from sTEVEN AvERy in a 10milliliter (mL) lavender-top blood tube. It contained uppro*i*utely 5.5 mL of blood. EDTA wasidentified in specimen e49.
Specimens Q46-Q4s were reported to be collection swabs of blood stains from thecrime scene associated with the death of TERESA IIALBACH. Specimen, rz-r+ were reportedto be control swabs collected in relation tg s. Q46-Q4g .wabs. EDTA, either as the free acid oras the EDTA-iron cornplex, was not identified * trr. q+o_e4g or K2-K4 swabs.
The analysis for EDTA was.carri.ed out using liquid chromatography/tandem massspectromety in both positive and negative elechosprayfonization modes.
Remarks:
EDTA is an,anti-coagulant and enzyme inhibitor that is commonly used in bloodcollection tubes' Blood specimen collection tubes containing EDTA have lavender-colored topsand are the most common collection tube used to collect refeience specimens for DNA testing.
The concentration of EDTA in its free acid fonn in a drawn blood tube is typically1000-2000 milligrams per liter (mg/L), depending on the uolu*, of blood and the capacity of thetube' At this concentation, the free acid and saliforms of EDTA are soluble in blood. EDTAreadily forms water-soluble chelates with nearly alldt;etals, including iron in blood.Aqueous extactions of dried bloodstains allowfor the isolation of EDTA (both as the free acidand as the EDTA-iron complex) ifpresent.
Using the procedurl.e.mnlg-red in this case, EDTA is readily identified at aconcenbation of 13 mglL. Additionally, EDTA is also detectable when a l-microliter drop ofEDTA-preserved blood is analyzed. 4 r-'uvr'
For questions about the content of this report, please contact unit chief Marc LeBeauat (703) 632-7408.
Page 2 of 3
070201013 PM GH
For Official Use Only
f, ++t"( s'i)

/
For questions about the status of remaining forensic examinations, if applicable,please contact Request coordinator Michael vanarsiare -i''
rloz>632-gg09.
The submitted evidence was returned under separate cover of communication.
Marc A. LeBeau, phDChemisty Unit(703) 632-7408
Technically reviewed and any identifications and associations confirmed by:
Date:
This report contains the opinions/interpretations of the examiner(s) who issued the report.Page 3 of3
070201013 PM GH
For Official Use Onlv
fn vqb(cr,\

7-25{ (7-13-98)
The Enclosed material for
LABORATORY DIVISIONSUPPORTING DOCUMENTATION ENVELOPE
Case ID/ Sub (,zD-/uW-aV?A3lA Serial #
orlPlease Print Clearly
Lr&et'u supports Laboratory RePort
Description of Enclosures
\ )rnqin'de .- l7
't Na
P l,,ul.' o{ {po'l- 9i zccl
. tli7_. frhl/
d!- k0 Panu
Case ID, Sub and Serial
Chain of Custody
Communication and ActivitY Log
Notes
Instrument Print Outs, Charts, Graphs
Negatives
Photographs
ECS Search Slip
Shipping Invoice
Name
LabNumber(s) 01 tSt'o I 0 13Or WO Number
F ssL b,d"- - 6l Pnrcs
Please Return This Envelope And All Contents To The

(Rcv. 0l-3 l'2003)
FEDERAL BUREAU oF tI{rtEsTlGATlOIU
Fron: MilwaukeeSquad 6/GBRA r ,^^^\Coatact,:SAGeraldE'MuIlen,(920)432-3868
APProved B-yr Greco RaYmond A
Drafted By: Mullen Gerald E:d1g 070201013
Cage ID #: 62D-MW-44363 (Pending)-5b
Tit,Ie: STEVEN AVERY iTERESA I{ALBACH-VICTIM (DECEASED)
DOMESTIC COOPERATION-HOMI CIDE
Slraopeie:Summaryo{captioned'matterwithrequestforaPProPriate examination'
PackageCoPy:Beingforwardedunderseparatecoveraretrhefollowing iEemst To 3e Srlr.#q#
1) one box conta'ining vial human blood'- it,'1'c^rDt? -
fut,,':J'oFg- tro(oziulto
2) envelopes containing swabs from crime scene
DetaiLs: Teresa Halbach was reported missing by family members
"" ii7o3 /2oot. sn. was rasr seln on 10/3r/2005 on the propertyof steven Avery "n" "t""
a salvagg yard with his family' Halbach
wa' Eaking pirotogiipit" of a vehiEle that was for sale as she
worked for the Auto'Trader: magazine' Numerous search warrantswere executed on the Averlr property and. significant evidence was
,""o.r"r"d implic"iing Steireir Alrery_1n the murder of TeresaHalbach. The Cal;;;i --*tty Sfreriff , 'Jerry Pagel' has requested
the assistance of the FBI fbr laboratory examinations.
Precedeace: DEAD]TINE B I 09 / 2007
To s Laborat,ory
DaEe: orl3 o/2007
Attn: Scientific Analysis SectionChemistry UnitMark Lebeau
stevenAverlgwasreleasedfromprisonin2003afterbeing exonerated for I rape conviction by DNA evidence' A vialof Avery,s Uf ooe, which wls drawn and, ueld to exonerate him inthe rape conviction, was maintained at the Manitowoc County Clerkof Courts Office. Avery's defense has aLleged the-investigatorsfrom the Manitowoc county sheriff's Department used this vial of
blood to plant evidence lrc the crime scene implicating Avery inmurder of teresa Halbach. This vial of blood contains EDTA'
RE;rURI.{ E\TIDENCP
ro lGirv nu Ys;-DIvIsloNa-,/ q4b
/t.'>\ "l4tltu/
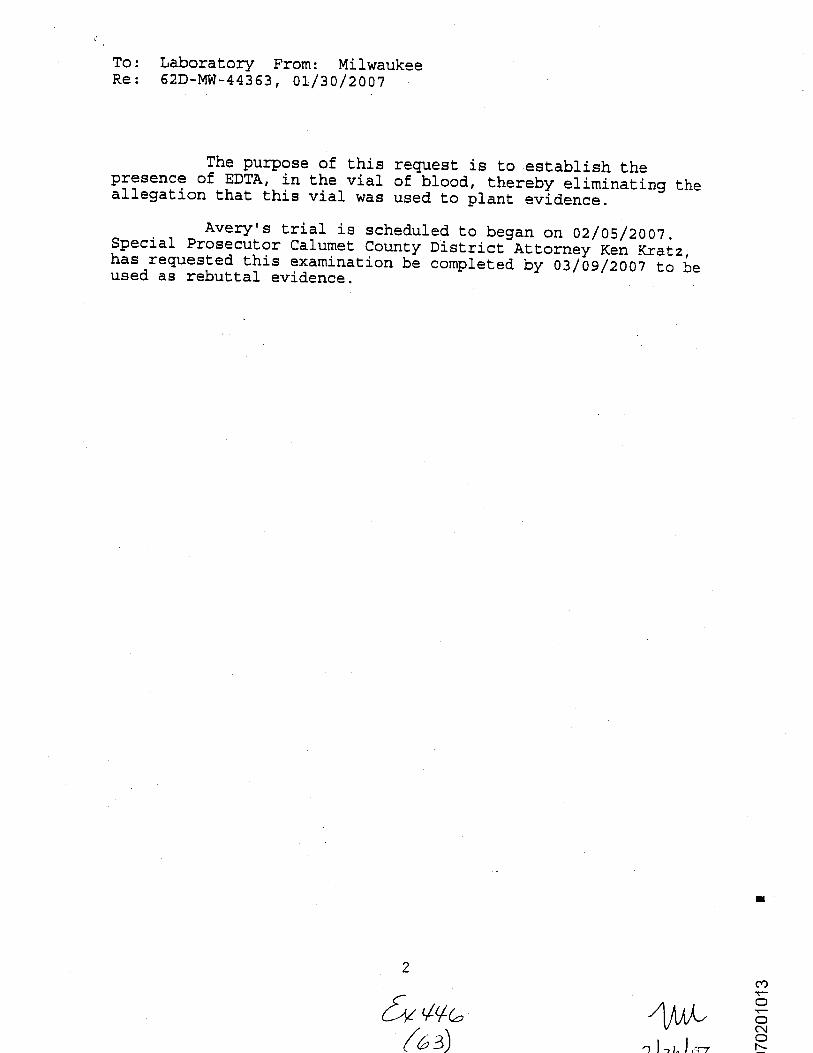
To: Laboratory From: MilwaukeeRe: 62D-MW-44363 , 0L/30/ZOOI
The purpose of this reguest is to estabrish thepresence of EDTA, in the vial of -blood, thereby eliminating theallegation that this vial was used. t,o plant evidence.
Averyrs trial is scheduled !o began on o2/os/zool.special Prosecut,or calumet county District Attorney'Ken Kratz,has -requested rhis examinaEion bi complered by oilbg/io07 ro beused ag rebuttal evidence.
2
C-^/ (Vr-fuz)
4/,w"l-,"1'=
cf)
-c)NOf.-
To:Re:
I-,,aboratory From: Milwaukee62D-MW-44363, Ot/30/2007
LEAD (g) I
Set Lead, 1: (Action)
I,ABORATORY
AT OUANTICO, VA
Chemstry Unit conduct appropriate examination of vialof blood to determine the presence of EDTA. Conduct relevantcomparisons to swabs from crime scene. Conduct degradationanaiydis of blood. Tt is requested t,his examination be-ompieted by 03/Og/2007. The point, of contact from the WisconsinOepirt,ment ;f .Tustice is Assistant Attorney General Norm Gahn at(920) 418-4087.
ti
RETURN] EVIDENCETO MIL\TAUIiLE DiVISIO}tr
fy 44r-
I
(Y)
Oc)NONO
( r+)/VJ/1.,. Ln
7-243 (Rev.3-3r-04) FBI Laboratory
Chain-of-Custody Los G@'FYd'.- :, ..'e/ (-.-r'-,f
I Laboratory No.: O7O2O1Or a 'ffin* Case II) No.: G z\ - 1tr 14 - 11StoS
Tracking No(e).: 7 11O Ll b7 9 '/1/1 |
Opened for Retrieval of Communication ny: I//
Date: 2/ / /07
-
tr Shipping Container Damage
ECC Comments:
Container(s) Received Via Date Contributor
I ?nVfecl Ex -b- /-n-drtb,,.D tf ifoz FBf 7,t ilua"-Lcc
/r&
Container(s) Delivered Date Remarla
/44 \,*^tolJyzn-C, Into ECU Storage tln l, lt.,-t/ t t rtt I/#,^\ d(efrtgeretor trSefe tr Shell
I brrFrom ECU Storage
I} /ilJ1il,,.^f)zftfoz Qrtc - Qqt,
/$EZ-ruErl/]/' eL"-
Q4G-a4t,N EZ-'$F/{
EU/- Sfuqe1,f,,
**4*<-I Fk\
ItemsReceived: a40.. aqt,,r"rn? , e+11 A>t\q
Grtb-yur
,4,r€ fr .tlsp1(/
EC{-i srorage
4r/"tFn1QLth- 6Ng
tu aa' Usg
/r'L 'r'ltkyr gz- @22ss7
-,4 cu
.?r b
u ,k,fu,Ut,> n// -
r 44b/r-s]t
tLlChein+f{ustody Pagc of

(quLaboratorv Number:
070201013 I
tui\ A, {Chain-of-Custodv Paoi t/ of '

@cv.3-31-04) FBI Laboratory
Chain-of-Custody Log
-aboratory No.: O?O&OIO lg Case ID No.: l9 t"8- fnUJ -4 4AUs
TrackingNo(s).: Tlqo 4rc73,:ii1q I
Opened for Retrieval of Communication Uy Or*, A l L0l2&Z
tr Shipping Container Damage
Container(s) Received Via Date Contributor
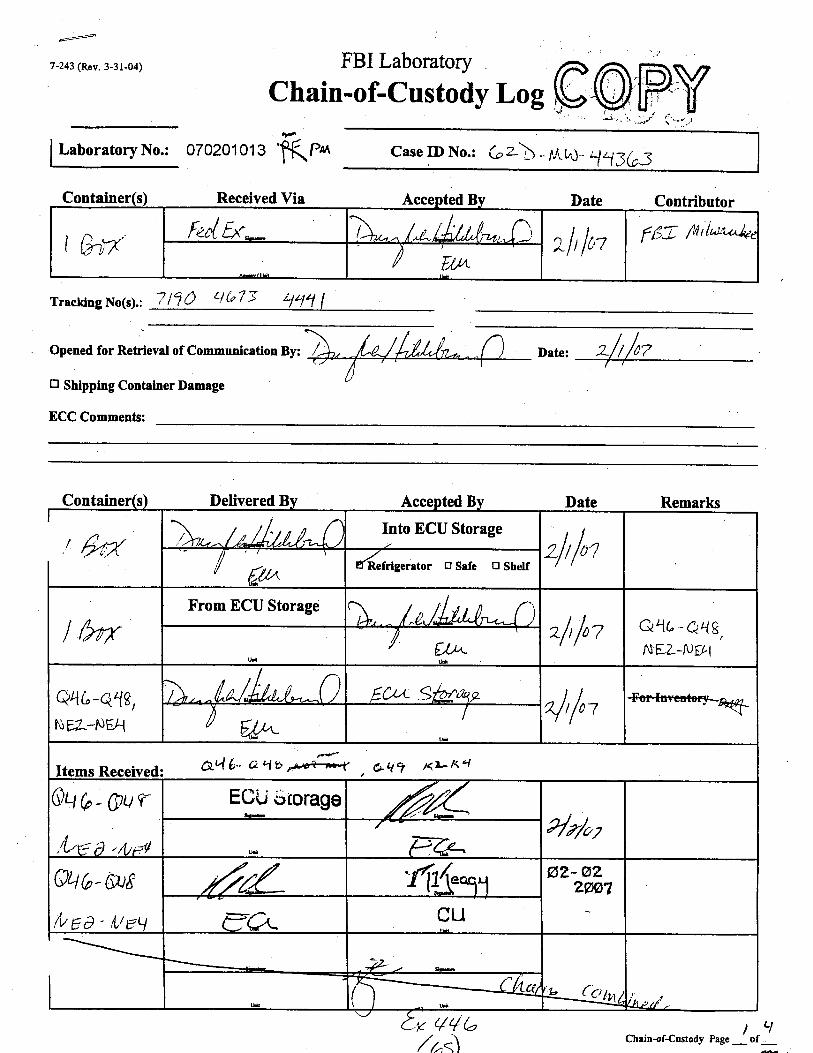
t Bu,vfutex -/(rnufur{L,r 4ol^-, fil iluJ0ruko& . ul
faLrc,u_
ECC Comments:
s) Delivered B Date Remarks
I bati *lomiad,,tML)' Into ECU Storage zl rll?&z
-) E&r w{efrirentor BSafe oshelf
I uryFrom ECU Storage r1lffi 2.1I4o 0{qJ
["u,11'l )
d"{q[,J^r*ffi-* 4'^
TI,U "*Hxftw PL,/*lot For Inventory
'f''{W,t/)/l
Items Received:
a19,fj.U ,Hlr,,nn (h&ffi:"R- *l+/or
a ',\WQNIa49. ff|,,,,ffi*a, 4#ryt a2-@7
2A@7\uMl CU
QLl6-@1 1t
K) -lry
^DE-{*;.,li ,///€> tl,r/,,
un 2 -tv€Ll
c\-'yt.J'b ILt- Ltt
\c*C t/r Ct+t,
[, quL'Chain-of{ustody YageS 61
1 c-t\

COPYDelivered B
q,Lt(-@VqJ
K)-KLt
\
-i-frefta $slte t;t
&q6-drlEt- t1{
F-a,,n €CLt
"Returne d viaI bol
& 4q6Laboratorv Number: csa a'7 is t a i 3 (as) t^ \t
Chain-of-Custody Page _ of '
7-243a (Rev. 3-3 I -04)
FBI Laboratory
Chain-of-Custody Log
uao'atorvNo.: fr7o2@1a73 caserDNo.: 6zD- Mw- ug6ltr, Request Coordinato/s Logd Innaunit Logtr Other
Unit Name:
Unit Name:
Unit Name:
cu
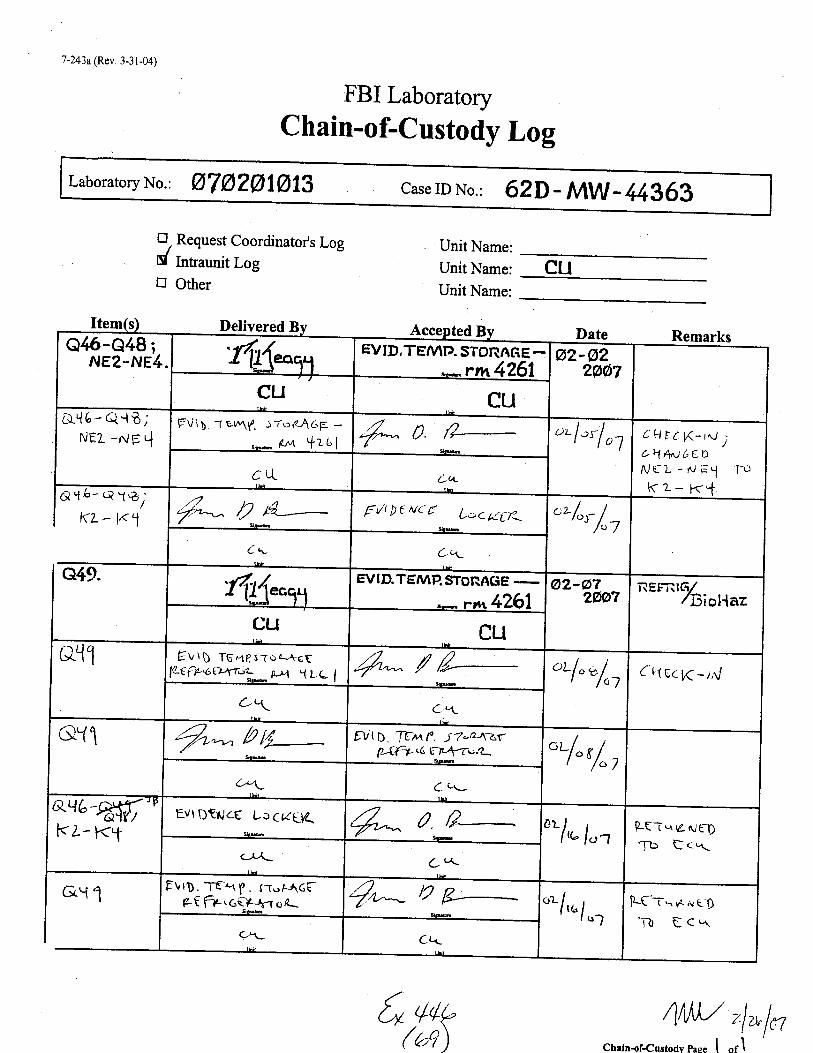
Delivered B fpd Date Remarksa46-a48;NEz.NE4.
'4$^vt EVID.TEMT'. STORAGE-*Fn{ 4261
s2-@229A7
cu cuo.Lt6- a.{8;
rueZ -,.i e .{FVty rew1f. JToK-\6p -
oo* @ tfz6l4 /4 ./)
-/r-- U. t-t
url,rf o.J cHtc,lK-t,e
)LNAil 6€DAIEL-NE.1 T!6z- K'f
C\L Ltt-
trz - K.l /"""^ O3- Ft/tDeM(E Latc/gf_ "r/,rf tL .r- c\
(Jrfly. ftK.y EV!D.TEMp.SToRAGE _e- F/rr 4261
@2-@72b@7
nEFRTG//Diol{az
cu cue11 FVtg 1U^.tsToq+(E
la_€FPtt"et-ryi?_*p-^4 "{ r.L I4^^ / E--- "rl" */", CttscK-r,r/
C\ C/+
GY1 4/"",.,b1+ tVtD. 'fA^f. J7-a<z{PIf--f-((' 6v\<tl1
sir- "t/. e/" tC,\ C t\-
&\L'ffi'vrz- KT
Evr Dtalce La c(tyL ,fr,, 0 a- 6'1,,.lut LC-r.^eNE-DTb E c'r*
(-,L/- cq_
e\1 FVttr. 1c-^1F . {-T-AGE-P[ fici6,qP*41o2
,/l,.,."- 12 F - */,"- /"?
IL(--C.^*re1Ttr trc"rc'\- c{
4/1il/ ,f"fnChein-of-Custoav poe. I or I

7-245 (Rcv. 6-l 9-00)
FBI LaboratoryActivity and Communication Log
Laboratory No.: 0nOA,Ol O t e, Case ID No.:
Activity/Communication and OutcomeDate
L/J/-qBy: CO.(.
D-Mw -*Vib.
pzl--, t*__By: .'*
_Uq l"-_By: ,-
llJz t_27By: rV+ .
LJ]LJ N-By:lvttu
L6il19lAe^!d b. fh {/x'LBy:-
By:
(z\ 4lWrl ,nln[^r'/+A

Violation{s):rstic Police Cooperation
Violation date:Violation Location:
Victim:HALBACH, TERESA
Cross Reference:
Remarks:
Lab No: 070201013 PM GH
City: Milwaukee, WisconsinAgency: FBI
Form: Electronic Communication, 01/30/2007CaselD: 62D-MW44363 Seriat:Latent Number:Contributor No: 62D-MW-44363
Subiect:AVERY, STEVEN
30
ECC Delivered to Unit:
Previous Submission(s)
o6t2270L2 PM PvMilwaukee, WisconsinFtsIElectlonic CoE'!. : t2/19 /2006Qs:15-tl5 Ks : NE IteE!:
^-r 11{005 PM PV NNlraukee, Wisconsin
-4ectronic Coua. : Ll/ 01 / 2006Qs:13-1tl
06u08009 PM PvMilwaukee, WisconsinEBIElectronic Co&a.. : tl/02/2006Qs:11-12
060118254 QcMilwaukee, Wisconsin
Electronic Conln. : Ol/ 04/2006 ELna]-:04/ LL/2OO6Qs:3-10 NE Jtahe:l
051123009 PM MRl'lilwaukee, WisconainEBTElectlonic Co@,. : tl/L6/2005Qs:1-2
el Method and No: Federal Express .7190 4673 4441xes - l Date Received: 0210112007 -More
Received in ECC: 0?0il20070210712007 12:03:28 PM . mvanarsdale fo 4+,
( tr)/vw'
?-lzbln

ECU- I (Rev.7f27D005)
Evidence Control UnitEvidence Check-In Notes
Laboratory Number: 070201013 PM Case ID: 62D-MW_44363
Received via FedEx one sealed box, tracking number 7lg0 4673 444l,containing:one sealed box containing:six sealed paper bags:
bag labeled "9569" contained:one sealed envelope containing:
Q46 Swab (Item 9569)bag labeled " 957 4' contained:one sealed envelope containing:
Q47 Swab (ltem 9574)bag labeled "9572" contained:
one sealed envelope containing:
Q48 Swab (ltem9572)bag labeled "9801" contained:one unsealed envelope containing: *envelope sealed in ECU*one unsealed box containing: *box sealed in ECU*NE2 Two control swabs (ltem 9801)bag labeled "9802" contained:one unsealed envelope containing: *envelope sealed in ECU*one unsealed box containing: +box seak:d in ECU*NE3 Two control swabs (Item 9802)bag labeled "9800" contained:one unsealed envelope containing: *envelope sealed in ECU*one unsealed box containing: *box sealed in ECU*NE4 Two control swabs (Item 9800)
+q-bZ-r)
a /vw-l- ,1^u
ECU - I (Rev.7/27D005)
Evidence Control UnitEvidence Check-ln Notes
Laboratory Number: 070201013 PM Case ID: 62D-MW-44363
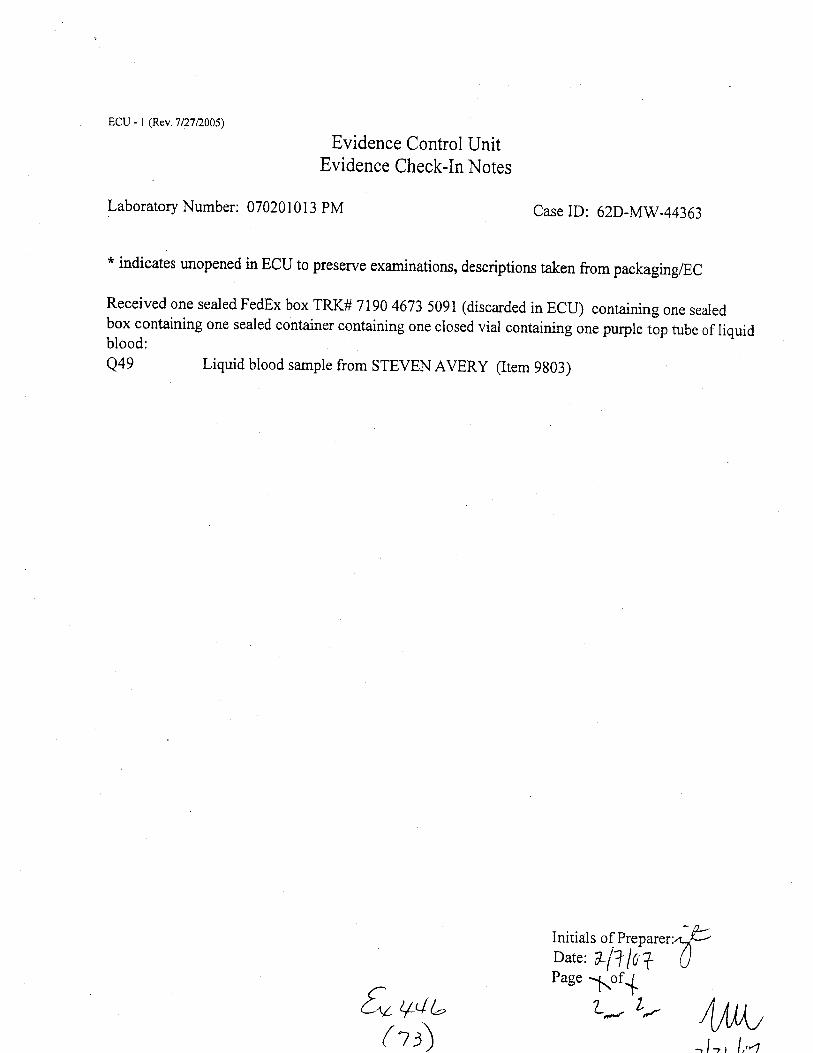
* indicates unopened in ECU to preserve examinations, descriptions taken from packaginglEC
Received one sealed FedEx box TRK# 7190 4673 5091 (discarded in ECU) containing one sealedbox containing one sealed container containing one closed vial containing one purple top tube of liquidblood:
Q49 Liquid blood sample from STEVEN AVERY (Item 9g03)
Initials of Preparer,&Date: 717 l0+ uPaee 1of-p
fu+ut-(tt)
L.- Ln4fi,\,-l . , [,'rl

7-2 (Rev. 7-10-06)
Federal Bureau of InvestigationLaboratory Division
LABORATORY WORK SHEET
To: Milwaukee Date: February 1,2007Squad 6/GBRASA Gerald E. Mullen case rD No.: 62D-Mw-44363
LabNo.: 070201013 PM
Reference: Communication dated January 30, 2007
YourNo.:
ritle: STEVEN AVERY;TERESA HALBACH-VICTIM PECEASED)DOMESTIC COOPERATION.HOMICIDE
Date specimens received: February t,2007
Specimens:
Q46 Swab (Item 9569)
Q47 Swab (Item 9574)
Q48 Swab Stem9572)
K: -NEZ-'[' Two control swabs (Item 98,01)
.<'n
K2_ $83-'l' Two control swabs (Item 9802)
Kq NB+IF Two control swabs (Item 9800)
[v ++t-Page I ofl (tA/ltwt) "t,ls'7

fiwl_, I ^-
II
,l-lI
I'*t..1c)
I
I
\l{.1(l\l
I
I
-u
=,
g<C)-'inC)U
" lnF lrf": =v'r 3#r-'] - n!UU
E<o-> f-]ou
' lh.E E5
= E:
trtrtr
OJ
3<>tlc)!
" lhtr:.:g:v! Hsg)aL
ll l-J u
{J
H<>tlc)u
nFa::v! s:|'l]/)IJ.
lJ ll Ll
E<>lc)s
'| >\ -o!i'iq
=x,€ 6Y'r E:Q u) tJ-
nnt-..1
c.;r
3<> r-lc)u
"lhF:X-:g =
v
;H#AatL
trntr
)F\\s.\
s:lt
l\I
ag
-5.-+ts-
J\
'.f,, ,\{!,rt
!'\,\';11.
q
2
r)
qq-Q'
7s)
0)
()
U)q)
c)
r!1
I
I
I
I
I
I
I
I
I
I
I
I
I
I
I
I
I
I
,ltl{l
)lrtlil\\lI
I
I
I
i-:
-=
Er)
I
I
I
I
I
I
I
I
I
I
t.ll.\
I'\t I
f.^ I\l.\I-,1
-lJI.Jl\l:lil\.lrl
I
I
'ri
2
TO
tl\trl,I\.1J
.F
lvvi
v5
I
\9t.J
a
oq)
cn
0)
lltllltltlllttllllllltal.t\l .Olil <l:l (l'JI *fI
rll slr"'.ll'l I
l..liiE*gE.;2Ehrix\JY!Zut!e;a
>.-!-'bt
--LC):.!-rGlC€-i-f '=-l --
all .!l-}{I'\
F.l
-t
Tsie

i'
Chemistry UnitEvidence Check-In Sheet
Check-In Date:CHEaIsT:' BKEATCA
case ID *: (Ll - nil ,- ll16 s E:raminer: Le B.+q
Mode .Reccived: '/E USPS tr FedEx d DelivcredBY:
E CT)
Tracking #:
Evidence InitiallY Recsived In:
d Boxes (# I ) tr PaPer Bags (# )
tr Plastic Bags (# ) tr EnveloPes (# )
tr Cans (# )
E Othen
Condition of Extemal Container(s):,
o1 Fropu Seal(s)/Labet(s) tr Othen (Corrmeoa Below)
GENERAL DESCRIPTION OF' EVtr)ENCE AIT{D COIT{TAINER,S:
ONF Bot sf+ t-e> ntf V6Uuo, t r+f e wr' tnt rrrnt-|, f+r$Rt^(6D t'oloZotoll
rlur - /)ua ^:r 1 - ni l- 4 il
tllN jiDE r c .)^JF t2nv strAt.€h-' ni I Vt*o"t TApf WI tutrtAtJ m4AKED
C-Ot --,r,7 Ou!- f?r4. nJiL- iuA* ' e'ltH nnn '' '"A"n *'/ n"o "'"''n
-rt ^r ,,1 .. - . - a-,* -n.it o tir . ..-n.^,, aat ()AAtv6{ " CAl .4'r-lET
Cb'+N(y Si1{At{f't D€t"fuTue^IT" Ey'lb€alc( LhAFt r''/ 4eotront; €4cH
oLo/o.1 ?,"
Cc-Olt1-7ff; DtlaF: ar, tfRoA. s747€ teWtE L-\g uAll,t so,n/, LocA-r,on : DASn.(zaA<r:, nl.E4r4 , l6'vtn-^)
Sw t'(ct-l Ftct€K: BftLIvJtalIt
sTA / ^i
NgtDE B46+l tt A E Auca tu,
r r --7- ot " uABGLtfD
- ,r" {v\frotsor./ U^,g* W\ if - Zc{c?, + A B, pS -crsl - q Sf '
{Z€b eVtpeNc€'T-4p{ wf t,vtft,4cs u / :L€ 4u- T-|yi "w / t*t t T( 4L-f
W*, O-Tozato t.3 Initials:
Oan: oz/et_12:o7_ Pase
6ratorf
4AM,/
to ouu(rd

GEMRAL DESCRIPTION OF EVIDENCE AND CONTAINERS (continued):
IAJ t,Dg Tne EnjVEuc' ji is CI N F CoTTonl tt/+B w / 4
DttL< Erow*154 sT,hty'.
846#L Is At-so u4xKED "otl,1 " ,t u4rzeueD."u7nter<* O(-tt1,of -otf'7 - 1ff , 04-TEt of lLf 106, Evttl€,\tc{ 746 # 2s74 fecstv€b Fpu,t -
5T41tr (&(AE LAB A4n"Ott,-^l l,,r(,+Tt-,'/ : ^l
?TAL ? FooA ENTtLhNctr he €4f\l( piSJ tt pE I c,fFtcG-i4-: 13ALDw,^J I B l9 , bEf(p\f-r.:,-t / lUfrA^r\-r,.c^J : sv4-l?
I
aF sTfti*-"lrlJrDl 84642 ts 4 sunW U*+.l'ttLt + ExtVgcope se4LeA w/
AED EVtDEuce -Cftp€ wl tNrcr*cs, lh trlt<eD " 07a L o t.^,l , ey- il-J-of ,
bt -orr1- )rf ,"
^3-oL, fftr/-G," 1,q6eu€b " t4frvttoN A4of - ZYLz # a tz
. tNttD( 7]1€' 6i/\EiLoPC , is orvE corTo*t rw+B il,' A
, D\R.K BE-w,yttH s'Ttt'!.
* BAG + 7 tt r+cso tta+'Rx€D i'Q{fr' tNl, tnAeL€b " / sol 67L 4- 0e -tt g* ,
0f- 6tf"l-qrft nqle:- ,4l7€ CaW€ LhB /-thaita^/. LoCA-'f tor\/: 6,LK, c^ CAfF oN n4a^/T F+ttEN6€<S'Eff, OFfic€E: B4t-DtltJ (rBlr, , T\Es(At pa,-N f Nfr)t-aa-7.,^J : f4B a{ JT,ftrv. "
f/ry/o(.4 -?-o(." tft6€LW AMtdoN LAE:. Aof -L,(L1 + 4,c. d_r-ott7-Ar- "7))'
t^/t lD€ 'ru€ 6'a/r/52-,ag It aN sw4'X Lr A s,q 4LL
VI c l-l-f p *c,.tNt 5 t1 ffrlt,V.
846 +q i s rtLJo tutt<KFD t'NF L h*lt L\A€L{D'' rr- (,'ri-qrf p4T€:tl
ol l? llcT EVtnentce f46 # a?ol , &€cetueV #cN'. U^N i vccxt,=al: ueTaLAEAA DooK ,!,4g4 y'#sseiv6€l& sr Dql, oFfi.c€(2-: H4,^,r',4r^i J lt\-c, Dtrctry-r..>..i /
lrvnfF.^{ tk(zrtl : Z'r^tfA.i'- J'.^/48 . t'
, l4JtD€ BA-6,+Ll IS A /4A7\/t(t-4 Frt/t/t€Lc>ftr t?+LgD v rz€D
LVIr)€Nc€ -fW€ wl l"/tTt+LJ MA.,4K€p " OTDLO/ o/? N{ 2- ot-DiJ-7-7tt
Initials: JFS
Pase L ot f[ilr,YW I-ab {f a7 [tLo lo13
note' o4!tl ]-!

GENERAL DESCRIPTION OF EVIDENCE AND COMAIMR,S (continued):
/1-E,'1 +ts?ts\, X CcN-rn-oLJ*,AG,2+ c-'Fswtq{ gy.. la2ylldtnt{ tt,Z6,lllAf6-: bt{?tlo?, Tt,,-tE: O7t? q^.r, Lac\-t.-^t: 3y l+..Beu -*)
A€TAI- PIECLs . *'
tdjiDg 'lWc €N/{toe€ ls A **V1tT€ Bcr tEVIDEN.F 'T14t/E w,t l,Vt7t4t-5, utl4€D " O-zoz olotZ, ,Vct, r'ntTaol
ltotlltlo7, T:t< * ?&o1.,"lNtlDe rlKr'Twts coT7,n/ tw4ts, oru€c:€tLt.
s'"ryJ *pff4zs rD tt4vc + sAAL A-*tr. oF Dtarltrq-^t4o€t.*-r, TH{ o'TH6tL rr^tcJ6 4f/(4tu cceft*,l.
t'ttA +f t, ftttt414 TD 846 ,*Ll wl fhV FoLcc,t^tt4G 5;Xcgpart41!,l)1t v
5illTc?l 04jH Bo+L\,,'\
i,VrtDq Bpr6 +f iJ * nhN:LLA E:,JyELopf sEAt-so wl CE
* Evl I)€N(E qW€ wl t^tt-(t/+Ls - tT tt A4-4K€b StAtLhatljo .n-t( tNVtrL,r(€-
lN l?+6 '+1 d I Tl4{ faLL,),,,^J6 {KcEyT,',!t, L' NETt t-rc^t + 28o27
. fr,^,\F: O?3& qH, LcC..Ar-r,.,^l: Ry l(A/rTro^/ rryrfcq f4rFBq4,af\. "
lnJ sipf 'T({ F /vELare: tt A tuH(7{ 6o. ({4Lw v"/_ rz€-p
EVtr)€'rrtt{ Thr€ w r/ ln,tTtrhr, fuA$(D t'67oLo
t o ?, * z r. c'.*zz.c,
lN { | DE' p'yZ€ .Ttuo coa-/,orr/ srvhAS
046 tC ts stu,ta{ '7o Bq,s: 44 &4r M,l -ThvForto*,d6 rcspz,.*ttvtrzvsv "n/E q ) I rLeb t'nvtteuc{ l46 # rrloat Lecetvcx f{z-na, BLa.K cD c+sEI ^/4,4.^.r, ^.lFv'/
't I aPi:l r'
, lqt srD€ 846 *6 lS A uhrt t.LA trNve,r€- c€-4LFa .,' Zfo Evttterycf
WV wl t^ltltryLJ. lT tt tnrtr!-K€b sl tt4t(-4LL" 'fb -mf qJvFtt>f€r lN B+6-r # f 8."
4f wl 'lh( frLtotwt^ii' €xceyTtcnts t'ue l, iT€u # qQcto 'ntutE: O,fyo e'\s esN k7-r-n4. "
1Nt/D{ TH{ €Nv€Lol€ tJ n ,"nt
1#\'"ntw
0"tr -ferft€D t^/
ln4flKf , ' aT[rrla
rab*
Date:
AJotot ol3 Initiais: fl/jzlaff*"7 page 7 of
GENERAL DESCRIPTION OF EVIDENCE AND CONTAINERS (continued):
lNStll€ KtL€ 'Wa c-ftunt s-Ats r,,t 6'rt,+ltttl ST+,,vs.
Initials: X6$Lab* aloLul cttz
1:ry (w rug" ? ot
Chemistry UnitEvidence Check-In Sheet
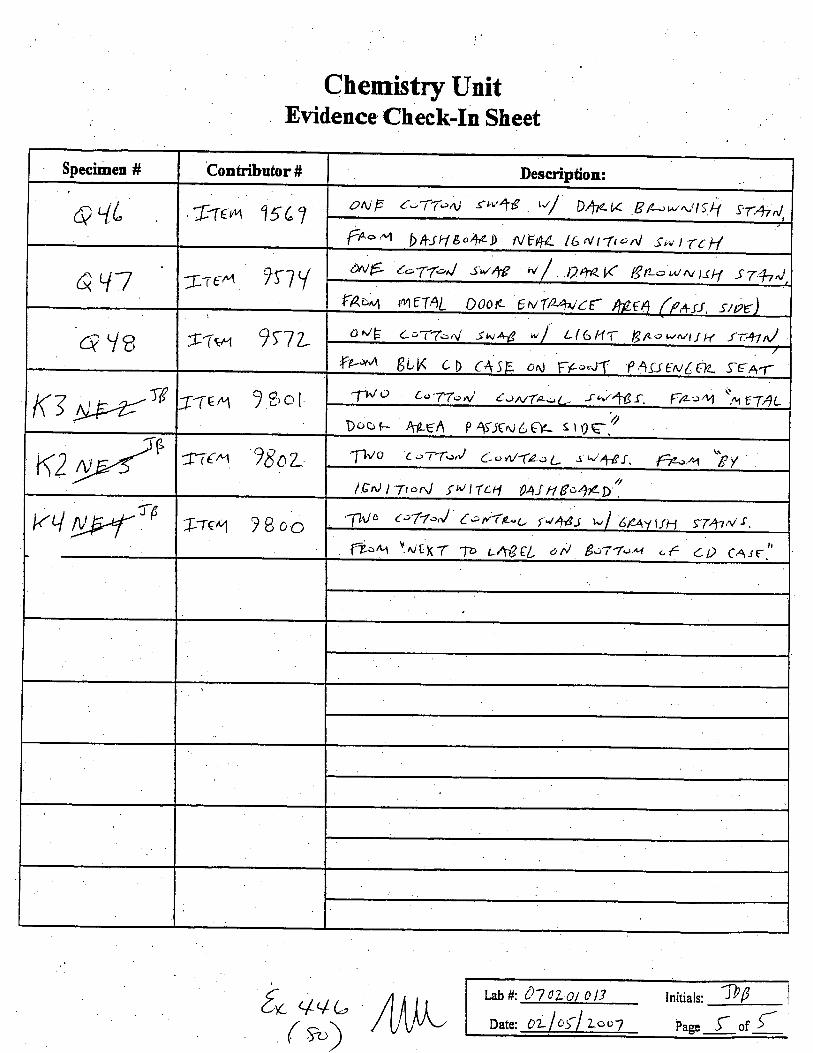
Specimen # Conhibutor # Description:
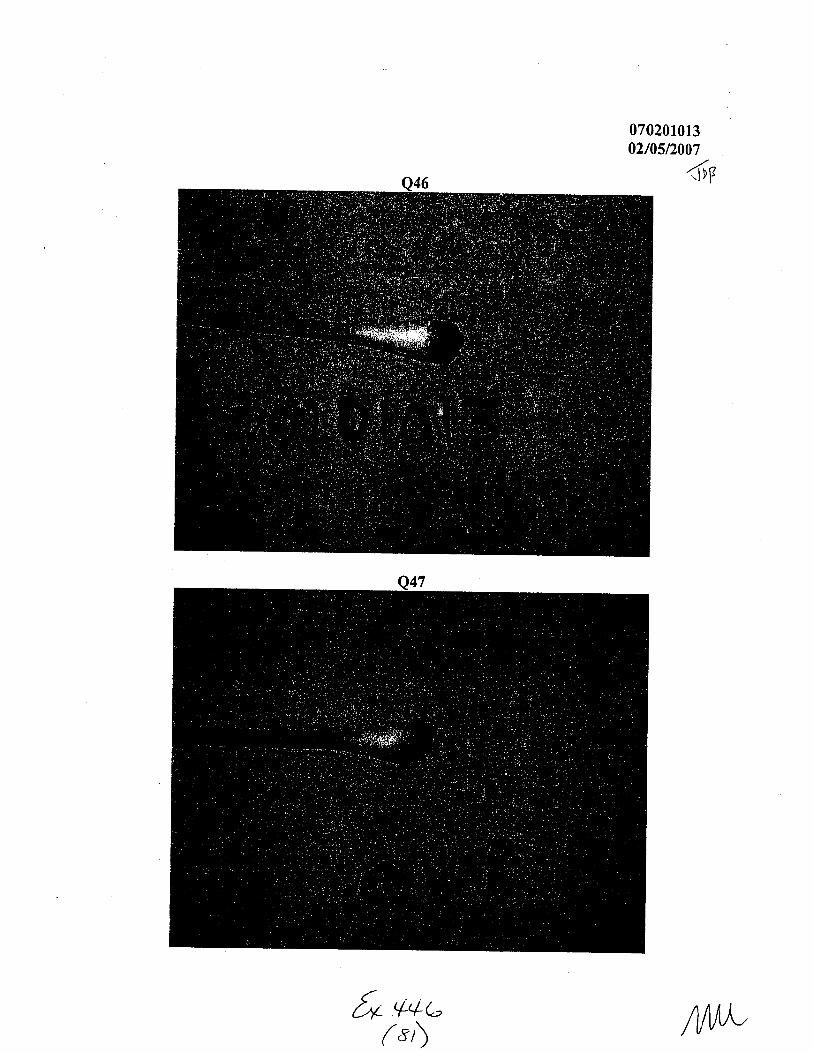
a'{L f,'(tu 15 e 1ztUF t;-1fc>4 {lv48 ,',/ Dtr.t< pp-utNtS\ S.T.+^l
ft-ry1 bfrJ4ea1,zD NEtL l6Nt-fronl Siu tTt:i/
aql Tre,q 7n I t>vE t-'Tf-J s;4g ,{ DroraK Brr--wrv trH srh^iFAI>', ttu1€TAL Doo* evT/2/4^/c{ nprn (/+ot, giy)
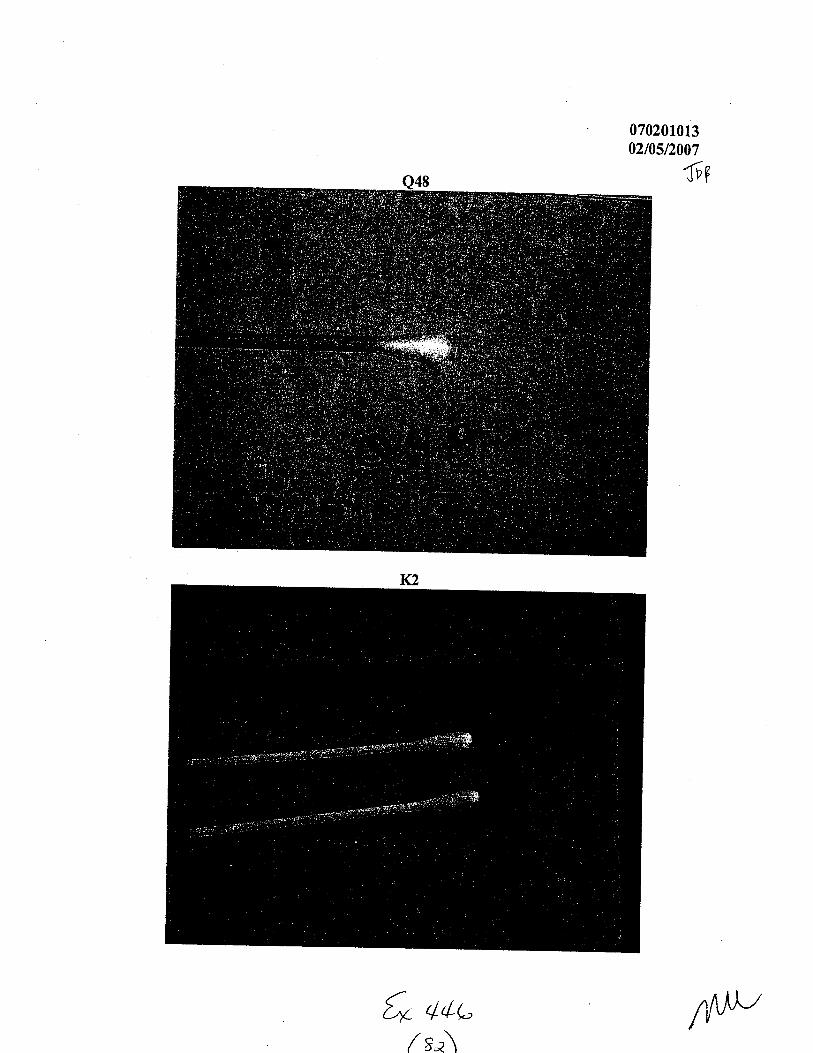
du8 . A-q^T1t/-1 7> lL ailE cr(Zonl si-+B */ L((>HT S,&.cwutfH tr.+l,J---:--trkqA BLK cD c4sE oN F*.*tl f 4sJ€ud€tu s€*r
K7fn)6 I'(84 ? eo1 'TN o L.>'77on/ t ouTt-U -r qt4t3 f . fa-"rt '', ,TAL
Doc' F- 4464 p l-:E,ri6er- st()q.'/
K2gE/e fr€ry ?|oL "f1lo (.:'-1foal Co n/-(La L s d,l4 t. ftr.L1 "E //9^t t -ttc.nj tN tTLtl g414 go47ego.
K4 ryEryTA I-rE4 78oo,1'hJc c,7-/-J t:rvap-u rt44s -l dfatvH ST+tns
I?u IrueXZ p c6€fl aN gor-t.t*t .€ aD C,nrFtl
t" 44u(*)
Initials: 1bf
Page f or {t** 07 oLot o llDate: 0L loil Loc
07020101302/0st2007
4vr
,fo ++,-( u,\
07020101302t05t2007
fir
{* 44t-/ sa\
t" q4G
Is')
Chemistry UnitEvidence Check-In $heet
Check-ln Dats: OLlo0 lToo-J Case ID #:6LD- pf vd -Llrl3L7 E:raminer L,g [?v^cfte"(rrr: 9&v w cu
Mode.Receive& )/E USPS tr FedEx u/ Delivued By
EC+Tracking #:
Evidmce Iaitialty Received In:
e/noxes (# | ) tr Paper Bags (# )
E Plastic Bags (# ) tr EnveloPes (# )
tr Cans (#
tr Othec
Condition of External' Container(s):
{*optr Seal(s)llabel(s) tr Othen (Co,r,"',eot Below)
GENERAL DESCRIPTION OF' E\TIDENCE A}ID CONTAE{ERS:
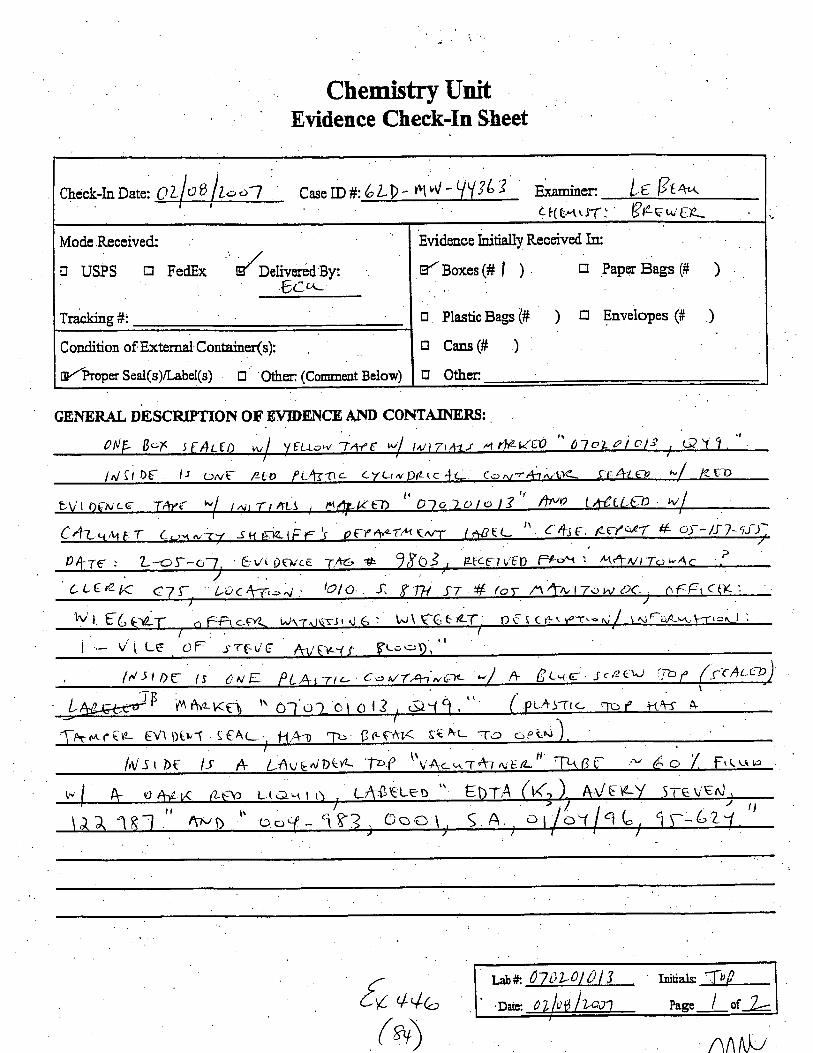
\NF B-l< sf At-Et. v,rl y€u;,,,t 74rt wl l,',t-rnt' arl{lCg '' 0^ozaiolg , t2\ 1 "
l^l ll D€ . lJ CtNt Peo f L,+gntc- <YLtND(\< +L- (o^,741 ^,'t.r'-..
(FA7 €Y t",/ " €D
c*LaMFT ("n*z; snrr'-rz'tFe" oFrftA't*t l*Be+ '' c4s'g".et''oe7 # q^-lf-';iT
P+T€ : L-of -o-7. ' Evt DwcE 7,ft6 + q(YO3 7, EtL€tv'lrn fre \ Lr+^/tT<'wAc , '.7,
t /\n*r-(/* rra nrrr.r* '
Wl. 5(r€rAI , a Ffrc-e,A wrrnrsstlr,l 6 : f-\ €6t4I, ,nf s crr rar'-,.'1 r'taoA^'vt-r'.'T I :
I - Vtt-e oF j?[-U6
, lrlJtD€ (s 0N E PL4\7tc- covTA-'*tx- -,' ,+ Ecr'u- -trn€w) 7bf /|(ALQ.)
LME*+P prftyevcer, r'OJo?-o1613,.91Q,' (Pu. s-rr<- ror iter A
,\ $ r (r- EV1 l)[]1 s €Ae eF*K g€Ac 1a; cJp(N
/,Vsr DF /-r A LAvEruDtr< T>f (tv'Ac"^r+t,veratr Tr<BF * /^ o F*t.qr,
LTtSELED " E
{o, u+outx 0l ouol 0 l 3 raitiats: il,/'DaH Page / of
AA/il-7(ro)

Specimen # Contributor # Description:
&Y1 a''\ 1&..tgL(.?<rg $ti:-s r.$^^furfiA"* r'-icvE^J q,1$(/
(u4vsvDeA -rop -r..ge . '.ED.T+ K" " )
Chemistry UnitEvidence Check-In Sheet
f. q4G
(qInitials: fr fs
ilzbh, oloLato12
Date: oL lo.( lL- . Pus" L or L

07020r01302/08/2007
-^5P
ov 4+(-,/\t-\\( Yr\ Atri'v
07020r01302t08/2007
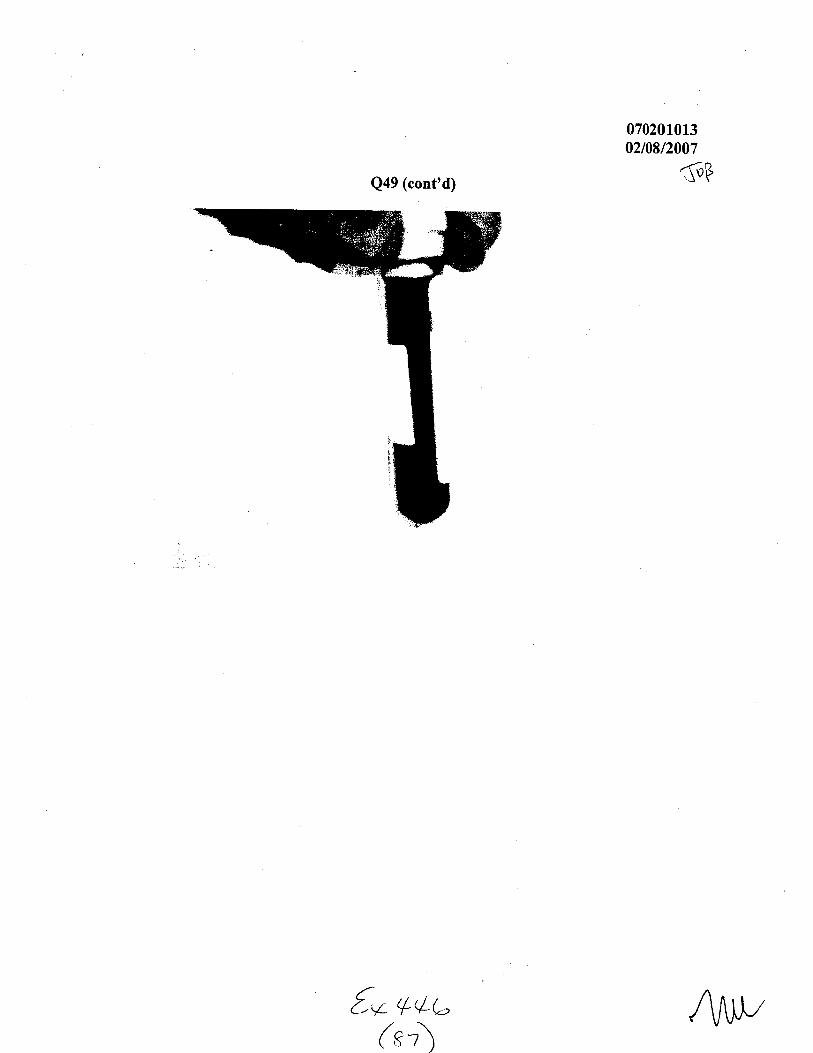
('PQ49 (cont'd)
,{o #Lu(*')

01 0LotolSPC L oF 3 oz-ltt lz-"'7
-rrF /W
VtS,-)AL.
- A{f" oN€. (.,;"(7.,"J 'rt48t ltrt-tt+Lu/
cqT. H41 4 phzl EA-,a*r5tf -/-€Df 1,tvI /r,.fSr'wT. (nc47t-r\/- D.+S'r-/B,;+*o //€,1-A i4n t7,-^),
q!7 - ote ct1'7.->nl ,*)Bt Prtr-Tr*c-t-'1 c"(7. ll+s ft p4'B-K pA-w-1s14-E€D
t-f41 n Pf*rS€w-7. (r"r+T'-^./ - boa4 €rv-t*1,'4^'<E 4"L€4, P4tr. t'or),
d 7 g - ortt € co'Ta,'rtJ s'"'ft-{3, P*etr 4-L.t7 c,<7. v' €e7 ru-* L.L /1r.84 h iJl+^l rFF-'dHtr( f yr.u-,zrtt-l Dllc.,t-.>R-,tl.Ttort/. (c'c.y'fr=/y'-.t.^r)
K L - -f Wa c>Jfonl g 1,il6s7 f tr-t<*cem TD(€THqL, t'Lt64T Dt J c*c --?:fttrrvl.
(c..t<ffir-rJ - D4-s,< Bc4.ay l6rttTtu,J gvt(ct4 ,NeA*).KS - '1rvo coJ-larJ r'r4-81 / P4<x4cgu TDc'€'Tt(€Y-. (c.ie r(7 DrJc-" Lc,a-trcr.r.
(C.cr+-t,-r\/- Do.r'- 4;=.e4, F4st srcrF).z K rt - Iw o c=*(/oil s,'' tBS, Bt-qcrc rs 4 S-(+1'.Jl f &trse nT c-'N e .4-c t/.
(".,4-r, ur/ - C 5 c 4 sr) . f +-ct<Mtb -rb6. <^rrt € R.
Q t/1- L|vEwD€w Top ',,'+.r-rhlw{y | € D-(A (K)" BLaab 'f24 8€ , '- 7a-Lc''/.
t"r,-t-. '-f7"9{ (N+1- t'77 €Ja1,-<FT€-D T.r $r /o oL, fu""pVo u,,Va { € St ruft-teD -ID B { 'f. f A- L .
S 4 tulP t-t,,i 6_
A 1 L - cq-i 'lz- cF -Tl'r€ l(fri r{P 4*eA ,l a cG,+r./ i crrJ*.al 4-* I fc {cq--D
Dtz-EC-(L/ (^r7o A L,+Bgcgp a€N1Prfi-14g' FfL?gA D\r,tctr (gj!A"'D cAl/sD
QI1 - cct-T 'lZ dF 'f:r.€ 5a41*{b A,{tA ,"1 ,us't'V -lc(s s;?,t 1-'' b (c$c{D
bt pl L'T L7 / xr'(o A 1,'tr3€ L E-D 'f
D fuD (tf f {P '
? d"l8- C"tI 'L c>€ THt T(!CctL.P-{o rtA(A -l cce,{-rrJ s'ctJr--2-t A-tvD
f utccv Drr-f c7L7 ri"Ta h cAi3gu6D Cf D 't* D (*f f{-D,
K L' t.L(T ,lu o€ J- oF Tp(6 s"it(S rt,'D /l4ct-p DrArcTc/(x'-(o ft L.,tG [. L(-D c Fb "\N D c \t' Pfl) ,
- l<3 Cq-r 'lL o€ A- <::€- -Ti1g s*t'ts 4r'rD fL\ctp Dt,aCc'rtY
rx'(c A r-Nr?q u€D C€D A,"l C.Np f fD .
K 1-'- (a11 'lt o( L c:€ 'T?it- (*4flJ A^rD PL4cEt, ptrtfcTtT
w-(o ft L"\Grt€b (,CD Pr") C\/pfD t; V* b

0'7c,zo / o l3PG L o€3 atfrcf.-o7
-rv{z /W
sAl\PLrrV6 (r.*z'l)'' N-EQ+-T|(tr cc:rv-rRoL r ,,L o€ lvotr'-{brn pzrr6)Lv€.D lJLoob (fruc,u* -fiuAL, zf"ln) w4s (/l,ezrgn dN'To A ccEn-,t/ daTaot/ r-jt ND slra rrctro.
T4{ st"48 lvfu fUcro //\t A trtBete:v CFD Mb Cffrfl,lot,'t,'tlErc't"l-ra'tt' A f ^L ct€ EDTA pKts€o^/cD Qcactl (14ur*D€.-r1 7ap,,rtAL.,>ltl"l) t"'fts ftrFtrEtz a,t,1o A CL€n^t Cu.zurrt (w4t 6^/D $7a hprev.Tlrc sr/ffi u4: rL,,l<w /,,v A L.hteu{> afp ft*o cffr,fl.
- fost-ktt{ ce*7ecL B* { qL c,€ orr ecoca tv$s pt/€TTtb tNT,t 4Ct gN cc T,onl r r,,4g No rTt rz 0rzr eg , ,T4 t{ s vfl3 v 4-s r L1-e w i,v, 4L4teew cfrs 4to cn-frw.
e {faT stZE Lcb 4 I "L a€ qffLL<N 5c4ss s'Ltt)€ N0 hrz. Drtt€v.tr|-Ta€v w I Dt Hto fup uru-tt hiv+{9 vft1 tjl rt D lz-l6b .Tn E-r,t f Ltz-ca
Be"ag r/4-t rlrts77€-D aNTo A
A C te 4; Cir-qo ^J ,uM u4Ssv'/t8 Tl<r (oY? flLauo Th{t+/ 4 cjA€Leu (fu tuD
LN rEtt .
Sr''1 Jlz€ t-"'D B- ftthv€ (t-,:cs72qp{ Rra ' soo A' uvh L{t"ckrepLsril(, L t^t- aF Ayj (c.ac:g.
Bt4*t< - //L€p4*€-b orlt,t-f z-ut (mg)- g60 raL a€ Da Hzo hz^.p
2o qL o€ r/oN'€vlrr Pp-vseTLvao BL.o12 (yrru,u.uf rMLt z/tloluEt4-€ Tvor- Tb tZo n Lfit(L€, ,70t (4rt*Dz :iyrett ({}rt-ft2,€qcw a)-\t'o p,fvr ft,L ta ^trnj , Tkg Fr crafis. \-/tJ Tl.A^,$€cKpqa TD A v )Au\* V c,<r.rrtg Eg.
EKTA4cTT:,rrl
LOA utL o€ {00 ypn. ) tt-trv-C\ (nfl ( a tz ED-A - t4,cr i!,/rs1,g tsa ro rEth'gor-\<or-tE\, Lc.-T f-r1Lr/ TerytD ctf alf,l- Jrrrz) w4, 4-pp{D -ra
€4c1'1 svryR lt** c\-('r(N6 t^,HtL€ t^t r-(s pcs1,{(Ttv,€ cFD, (r*te-)tl - ts--r.--7r4rL-'ur) (4 t4.: tu.)T ftpt>Cv'lr lft,a
I
.-rL\ €q [.C / F t ,_ f.-tr. rnl
'F.,1-*,* ' ) .
itf,tty* fX{r'4c-r,,v! {-re- Y\-^,"1, tACr{ (.1-o w4l ,t\-TirFqrurr (l-r*1*6Acil RL1A{TE
"At'1}|Osr?rr-gr-n 1, A LA0rL\jl) lvi-jlrr,-,rr\-)i v\A,L
{'s 4u,t-(e1)
\r LrOL r-f"'/+r U

AJ c2e I c: ['7
oF 3Pb '3-rDF
*FlL11t{<er !/6lt-lt F-trt-t:' Arv&ey-?el) tN foitzrv'g loNlLyr,.:at qcDC ctN rlie'U, e-l ( w*ettt LLlr Lc Lar(t-€b *l 4 (ruNtL.+^t q4( t rA. ). Tht
rv:lnaD ('frr4-lor-f*oLs.^e1t',') h.^D sE(r,tisuci ('rrsLcto/-i- Pc;s.rt4')
ttEe€ f r't^ttvb.*TA€ fttt64rCs (sfuue VTALJ) t,fL( n'(XT A^+tZZ€D t4/ Nt(,l1te,s (:,,v114-7.-o,l
/'roDf <rr,J 'L.crtt-7 .' -rt1r , t.,n,.!, (' e oz+ _ N"J- s.o Ls. rnh') l +.^iD
5taqedcg ('rror'to/3-- n"J, ,1/ ') r,vtr]a6 fF*ttr€T,I
5/ +'lb('?")
o, l!6 lz---1

0211512007
Blood spot sizes (l uL, 5 uL, 10 uL)
OJoloto\sTpP
{v ++t-('it)
\t',/
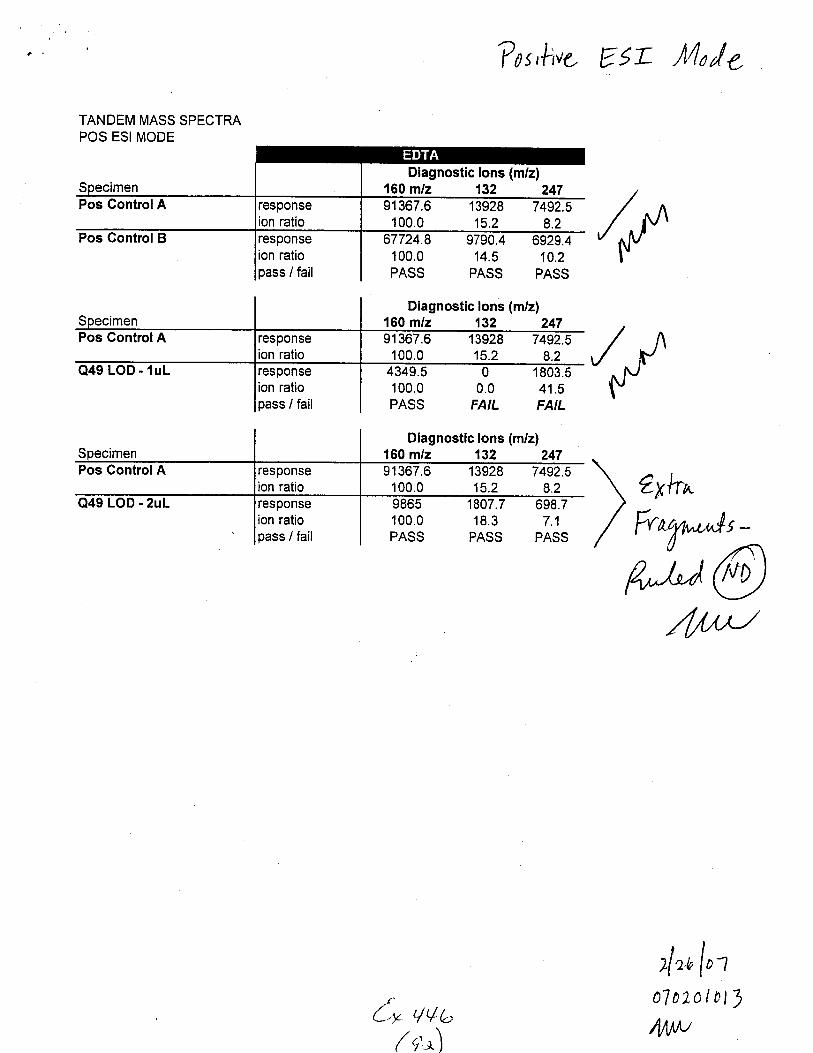
?;t,hre ESr ,M/o/e
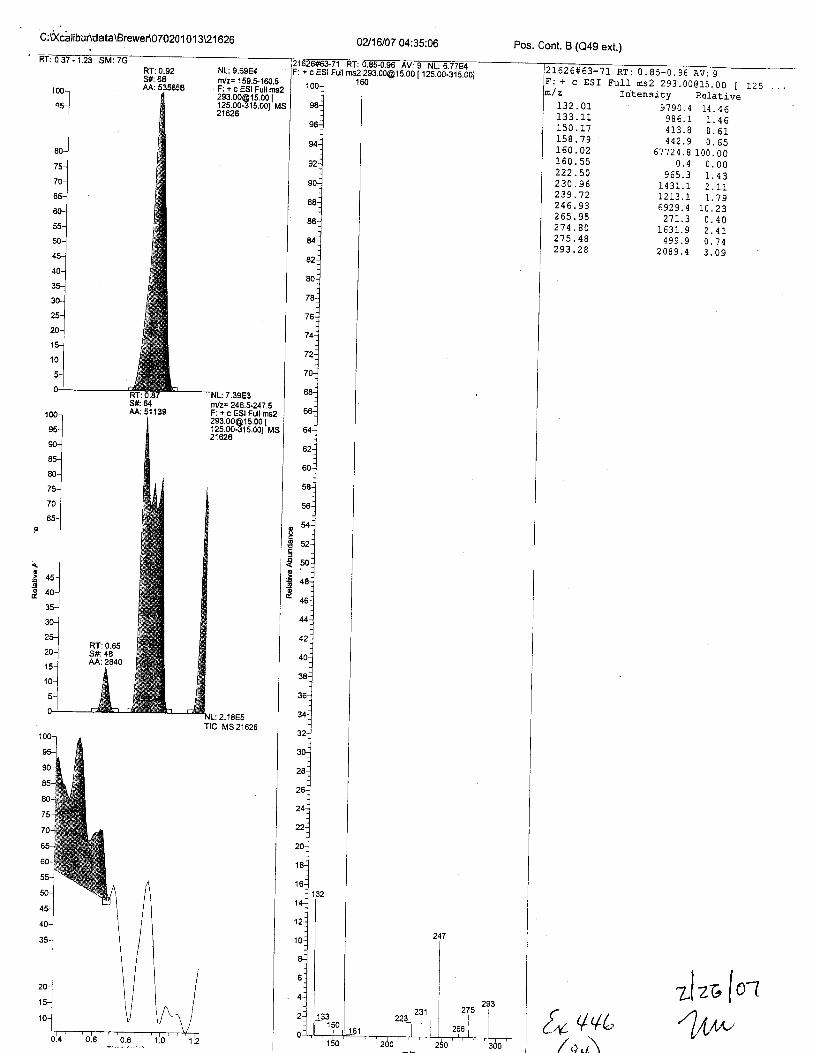
TANDEM MASS SPECTRAPOS ESI MODE
Pos GontrolB
Pos GontrolA
Q49 LOD - lul
Pos GontrolA
Q49 LOD - 2uL
responseion ratiopass / fail
responseion ratiopass / fail
responseion ratiopass / fail
100.0PASS
Diagnostic lons (m/z)160 m/z 132 24791367.6 13928 7492.5100.0 15.2 8.2
67724.8 9790.4 6929.4100.0 14.5 10.2PASS PASS PASS
Diagnostic lons (m/z)160 m/z 132 24791367.6 13928 7492.5100.0 15.2 8.24349.5 0 1803.5100.0 0.0 41.5PASS FAIL FAIL
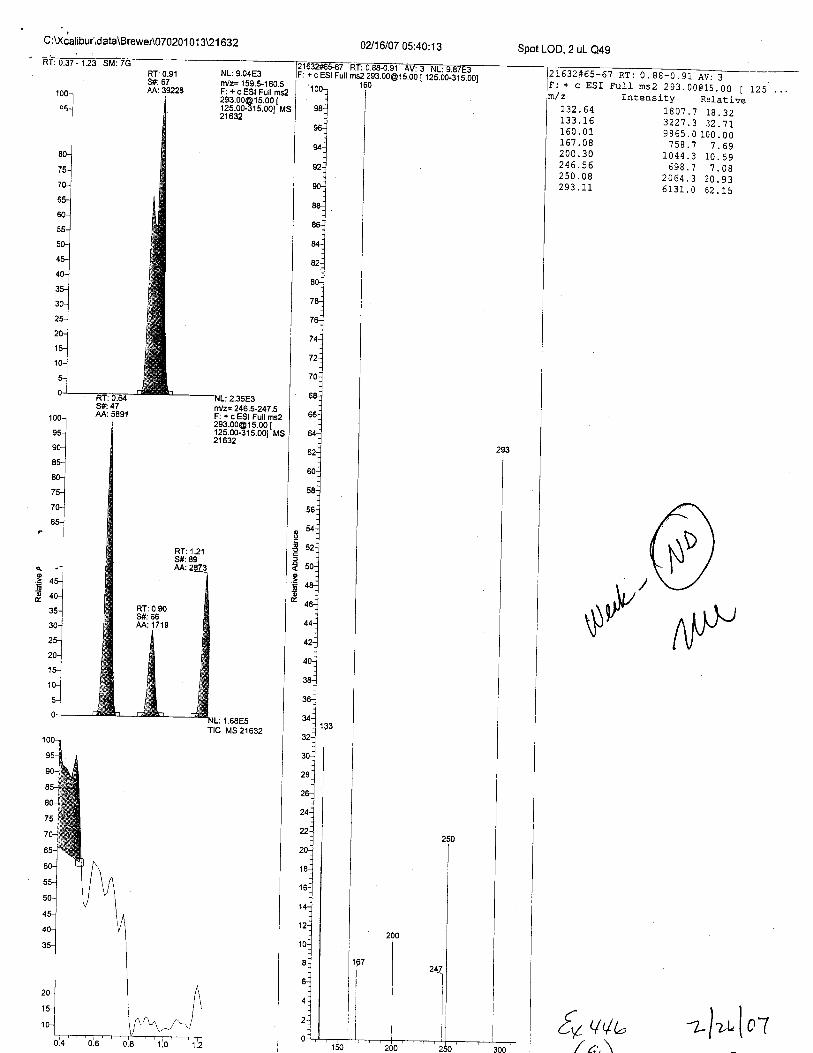
Diagnostic lons (m/z)150 m/z 132 24791367.6 13928 7492.5100.0 15.2 8.2
1807.7 698.718.3 7.1
PASS PASS
/,f
/-lt.J'
2yha
ey lqb1q^\
fta4ar"rnls -
ur@
zlrt,lot07b7atol3
lW

C:\Xcalibuirdata\Brewer\070201 013\21 623
RT:0.89S#:66M:837425
SilA 70AA:77063
NL:1.25E5fit/z= 159.S160.5F: + c ESI Full [email protected] Ms21623
10(
9{
9(
T5
70
ffilz= 246.5-247 .5F: + c ESI Full [email protected] I125.00-315.001 MSzlozJ
@oo
o
=ao
: 2.08E5Tlc Ms21623
+ c ESI Full ms2 [email protected] I
02116107 M:Q2:32 Pos. Cont. A (MAL EDTA ext.)
21623#60-70 Rr: 0.81-0.95 Av: 11F: + c ESI FuLI ros2 293.00015.00 f 1r<
r32 .07122 ntI ?? qa
f J6.9b160.04160.80
t7 4 .64
zzz.6z247 .L4249.00293.24
Intensity Relative280.5 0.31
I3928.0 15.24
549.3 0.71244.9 0.21
91367.5 100. 000.1 0.00
253.4 0.28955.5 1.05'709.4 0.?8r92.3 0 .27
7 492.5 I .20985.0 1. 08
3323. ? 3. 54
{,v +Vt/ at\
"t,lzt,lo:- a'-
0l ozol o l3
C:U(catibur\'data\Brewer\07020 1 O1 3U1 626
100-t
"u_1
RT:0.92S#:68AA:535858
NL: 9.69E4n/z= '1 59.5-1 60.5F: + c ESI Full [email protected] t1 25.00-31 5.00t'MSztoz6
S#:64AA:51139
RT: 0.65S#:4EAA:,28/'O
NL:2.18E5Tlc Ms 21626
OZ16107 04:35:06
+ c ESt Fuil ms2 [email protected] I 1
Pos. Cont. B (Q49 ext.)
21625#63-7I RT: 0. B5-0.9G Av:9F: + c ESJ Full rns2 [email protected] I r25 . ..
12' n 1
l qa "oL60 .02
?)7 Cn
230.95)'1A a)246.93z03.y5214 .80275.48)oa )e
Intensity Relative' 9790.4 14.46
986.1 1.46413.8 0.61442.9 0. 65
57724.8 I00 . oo0.4 0.00
965.3 1.431a?1 1 1 11
1213.l. 1. ?96929.4 la.2327!.3 0.40
1631.9 2.4L499.9 0. ?{
2089.4 3.09
zl'o[ot[* ++u
/o)

C:t(calibur\data\Brewer\070201 O1 3\2 1 629
RT:0.89S#:65AA: 19603
NL:4.34E3trYz= 159.5-,160.5F:+c551PrU."t
?!3:3381333r"'21629
. I tlE2S#: &lM:2958'10(
9:
9C
80
75
70
c
o
o
NL:2.10E5Trc Ms 21629
0?/16107 05:07:38 Spot LOD, 1uL e49
.ii-sii,rrmsi'ziiioit6rf ,ioirii;ioo'jislSq1Oo_ 160
2152e#54_6s @P:. + 6 951 Fult rns2 [email protected] t t2Sn/z Intensity Relative
159.95 4349. q r no ^^?19'?s i;,ii:; ';;:;;
293.33 3758.0 85.40
& qq-Lz't<\
lltlvu [01
o
6
+cESl
C:Xcalibur\data\BreweA070201 01 3U 1 632
RT:0.9'lS#:67AA: 39228
02116107 05:40:13
ms2 [email protected] 1 tZS.oo-Sts.oO1
Spot LOD,2 uL Q49
L632#65-6't Rr: 0. 88-0.91 tt-F: + c ESI FulI ns2 293.00G15.00 Im/ z Intensity Relative
L25 . ..NL:9.04E3n/z= 159.5-160.5F: + c ESI Fult ms2
?!3:33.9133&r"'21632
L32 .64
160.01fo/.uu200.30z90.Jb250.08?q? 11
1807.7 18.323227 .3 32.119865.0 100.00758.7 1.69
1044.3 10. 59598.? 7.08
2064.3 20.935131.0 52. 15
S#:47AA:5E91
1 00-l
ru-J
ro-]
ru]
'ltuJ
'l65-l-l @
6
o.=
,ArrQ?
$\lfl /\t\P,
NL:1.68E5Ttc Ms 21632
€s vub -ulr,"lol/ ,:,\
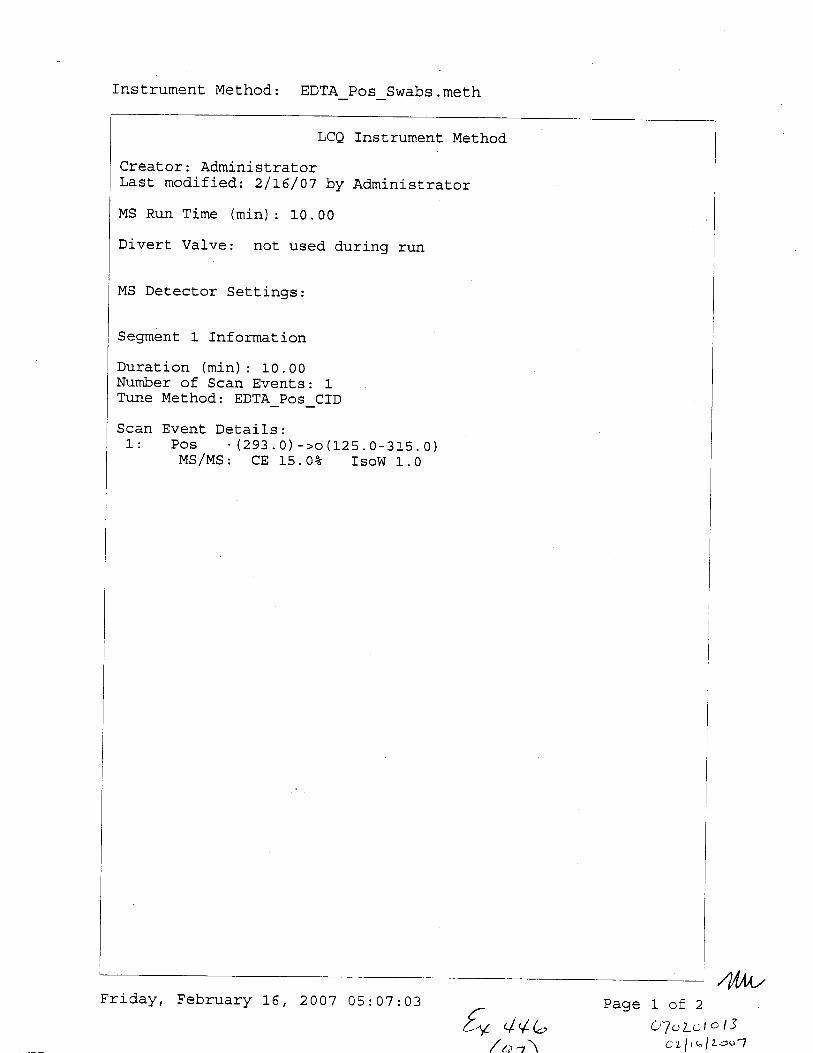
Instrument Method: EDTA pos Swabs.meth
LCQ Instrument Method
Creator: AdministratorLast. modifiedt 2/!6/07 by Administrator
MS Run Time (min) : 10. 00
Divert, Valve: Dot used durinq run
MS Detector Settinqs:
Segment l- fnformation
Duration (min) : 10. O0Number of Scan Events: l_
Tune Method: EDTA_Pos_CfD
Scan Event Details:1: Pos - (293.0)->o(L2!;.0-315.0)
MS/MS: CE 15. O? ttsow 1.0
t, 44bz; z\
Page L of 2
QlaYcr a | 3Or/rc lLco'J
Friday, February 16, 2OO7 05:07203
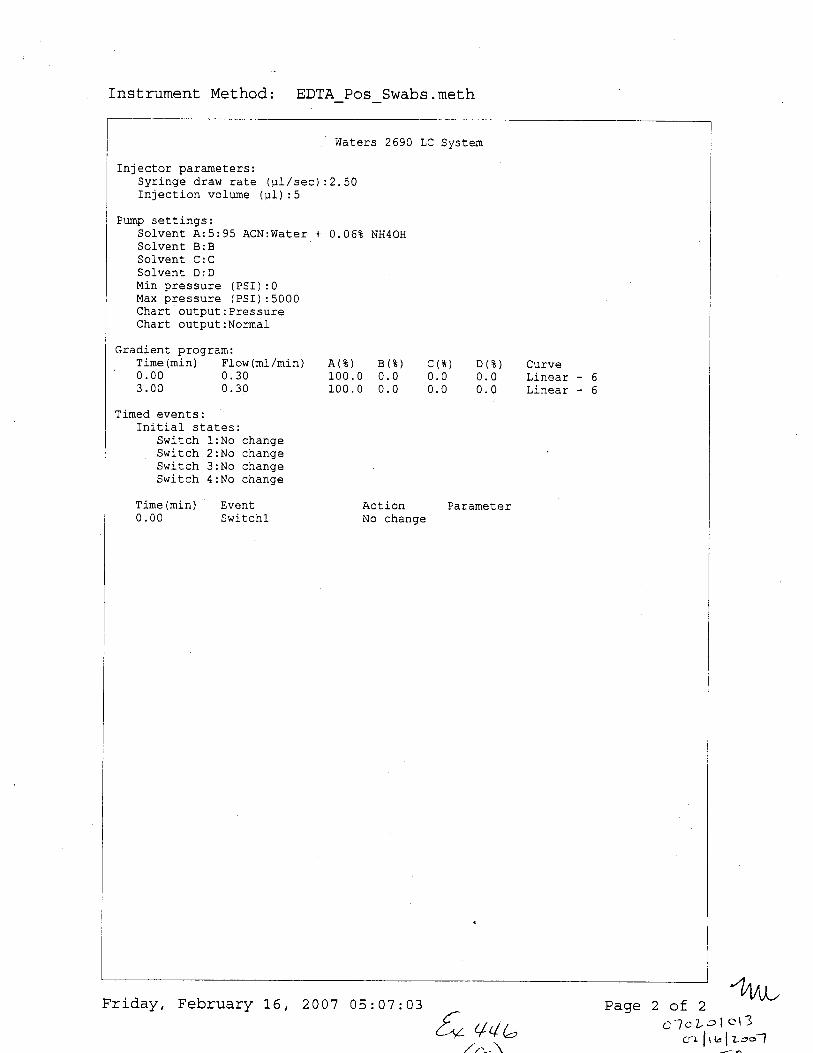
Inst.rument, Method: EDTA Pos Swabs . meth
Waters 2690 LC Svstem
Injector parameters:Syringe draw rate (pI/sec):2.50Injection vol-ume (p1) :5
Pump settings:Solvent A:5:95 ACN:Water + 0.06t NH4OHSolvent B:BSolvent C:CSolvent D: DMin pressure (PSI):0Max pressure (PSI) :5000frha rl- nrr{- nrl{- . Dr*-. - -essureCha rf nrrf nrrf . Nnry1g]
Gradient program:Time(min) Flow(m]/min) A(E) B(t) C(S) D(t) Curve0.00 0.30 100.0 0.0 0.0 0.0 Llnear - G
3 .00 0. 30 100. 0 0. 0 0.0 0. 0 Li_near - G
Timed events:Initial states:
Switch L:No change. Switch 2:No change '
Switch 3:No changeSwitch 4:No chanqe
firne (min) Event Action Parameter0.00 Switchl No chanqe
Friday, February 15, 2007 C)5 : 07 ; 03 /^
'-v q'/ b
,/; \
Page 2 of 2
c'1aL,r I cl3crrfrr"ltc-'1

Sample Name:
C.,mment:
(neg Dl H2O ext.)
Seq uenc e---07 0201 0 1 3_Pos. sld [Open]
Study:
Client:
Laboratory:
Company:
Phone:
Sample Type File Name Sample lD Path Inst MethodUnknown 21601 C : Xcali bur\Data\B rewer\07 0201 0 1 3 U:\ calrbur\methods\EDTA Pos Swabs
Proc Method Cal File Position InjVol Level Sample Wt lSample Vol ISTD Amt
1 5.0 0.000 0.000 0.000
Sample Name:
Comment:
Neg. Control(-EDTA blood swab ext.)
Study:
Client:
Laboratory:
Company:
Phone:
Sample Type File Name Sample lD Path Inst MethodunKnown 21602 02 C: U(calibu r\Data\Brewer\07 020 1 01 3 C:Xcalibur\methods\EDTA pos-Swabs
Proc Cal File Position InjVol Level Sample Wt Sample Vol ISTD Amt2 5.0 0.000 0.000 0.000
f* v+,-/cq\
/1/wo7ola I o l3
czf rr lz-o1-l-tP
page 1

Sample Name:
C^-rment:
Sequenc e---070201 01 3_Pos. sld [Open]
BLANK (neg blood, Dl H2O ext.)
Study:
Client:
Laboratory:
Company:
Phone:
Sample Type File Name Sample lD Path Inst MethodUnknown 21603 01 C:Xcal ibu r\Data\Brewer\07 020 1 0 1 3 C:Xcalibur\methods\EDTA pos Swabs
Proc Method CalFile Position njVol Level Sample Wt Sample Vol ISTD Amt1 5.0 0.000 0.000 0.000
t***t************************************t
Sample Name:_r-lComment Study:
Client:
Laboratory:
Company:
Phone:
Sample Type File Name Sample lD Path lnst MethodUNKNOWN 21604 01 C:U(calibur\Data\BreweA07020 1 0 t3 C:Xcalibur\methods\EDTA pos SteG
Proc Method CalFile Position InjVol Level Sample Wt Sample Vol STD AmtI 5.0 0.000 0.u00 0.000
t********************** **t*******t***t******************************+i******a*****
t" q(u( r"")
oaoe2
a1c'tat ol3orf rt,f Lool
-ir$
Seq uenc e--07 020 1 0 1 3-Pos. sld [Open]
Sample Name:
C^rment:
extract
Study:
Client:
Laboratory:
Company:
Phone:
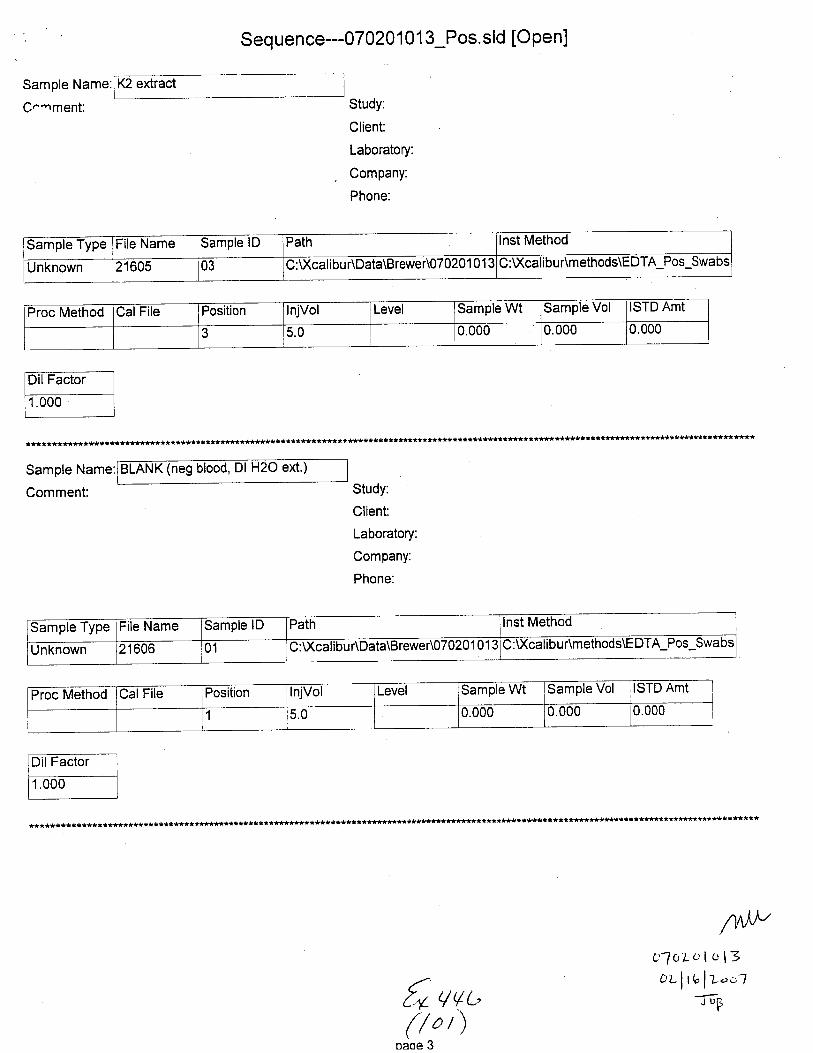
Sample Type File Name Samole lD Path lnst Method
Unknown 21605 03 C:\)(calibur\Data\Brewer\070201 0 1 3 C:Xcalibur\methods\EDTA Pos-Swabs
Proc Method iCal File Position InjVol Level Sample Wt Sample Vol ISTD Amt
3 5.0 0.000 0.000 0.000
Sample Name:IBLANK (neg blood, Dl H2O ext.)
Comment:
****************t***************t***t***i*********t*****
Study:
Client:
l-aboratory:
r0ompany:
Phone:
AA/.,p/"c1o'Lc'lol3o.tlrUltu,'1
JDRr{+ qvL,(/or)
oaoe 3
Sample Type ile Name Samole lD Path lnst Method
Unknown 21606 01 C tXcatiOu rtData\Brewer\07020 1 0 1 3 C:U(cal i bu r\methods\E DTA-Pos-Swabs
Proc Method Cal File Position InjVol Level Sample Wt Sample Vol ISTD Amt
1 5.0 0.000 0.000 ]o.ooo

Sequence--07 0201 0 1 3_Pos. sld [Open]
Sample Name:
C^"nment:
(neg blood, Dl H2O ext.)
t***t****s*tt********t*i**i***********************tft
Study:
Client:
Laboratory:
Company:
Phone:
Study:
Client:
Laboratory:
llompany:
Phone:
Sample Name:
Comment:
extract
Sample Type File Name Sample lD Path lnst Method
Unknown 21607 01 C :\XcalibuAData\B rewer\07 0201 0 1 3 C:U(calibur\methods\EDTA Pos Swabs
Proc Method CalFile Position InjVol Level Sample Wt Sample Vol ISTD Amt
1 5.0 0.000 0.000 0.000
Sample Type File Name Sample lD Path lnst Method
unKnown 21 608 04 C: \Xcal ibu i\Data\Brewer\07 0201 0 1 3 C:Xcalibur\methods\EDTA Pos Swabs
Proc Method lCalFile lPositionInjVol Level Sample Wt Sample Vol ISTD Amt
145.0 0.000 0.000 0.000
t*****************************************f****************************t*i*******t************************************t
fu q(b(t,r)
nanc 4
01o'La 1 o l3ozlrt,iu.,,7
Tttl
Sample Name:
C - -ment:
Sequence---07 020 1 0 1 3_Pos.sld [Open]
BLANK (neg blood, Dl H2O ext.)
Study:
Client:
Laboratory:
Company:
Phone:
Study:
Client:
Laboratory:
Company:
Phone:
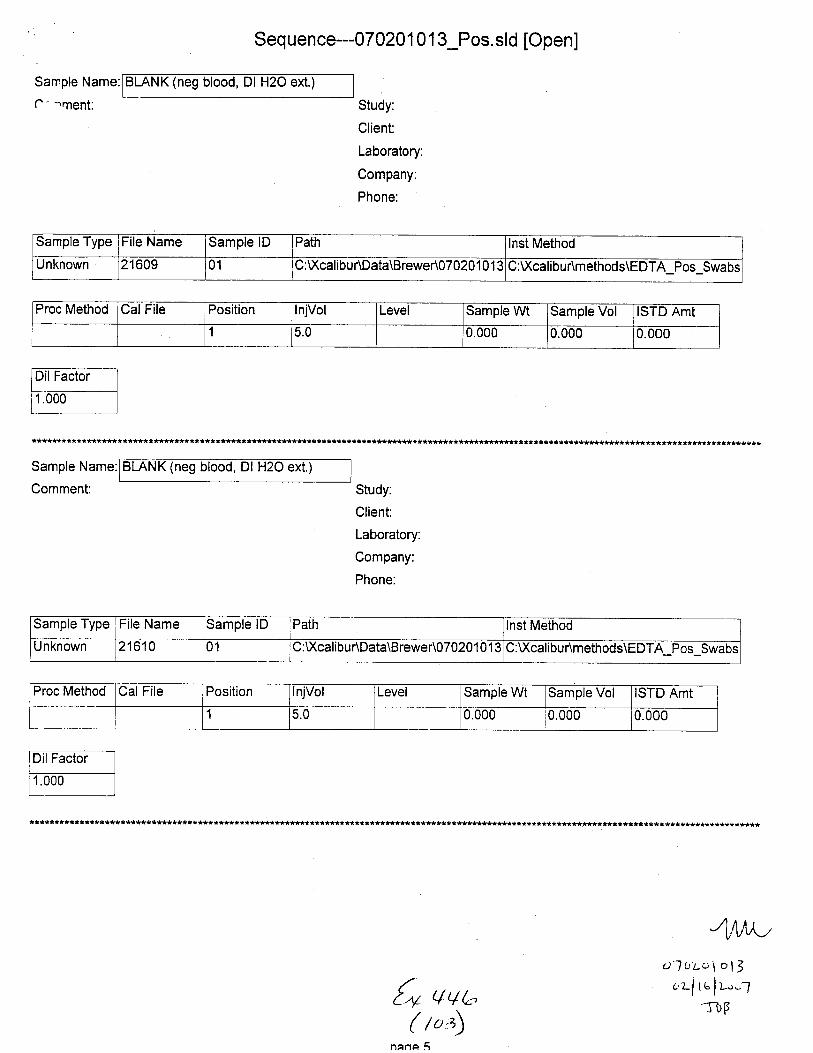
Sample Type File Name Sample lD Path Inst Method
Unknown 21609 01 :XcalibuAData\Brewer\07020 1 0 1 3 C:U(calibur\methods\EDTA Pos Swabs
Proc Method Cal File Position InjVol Level Sample Wt Sample Vol ISTD Amt
1 5.0 U.OOU 0.000 0.000
Sample Name:
Comment:
neg blood, Dl H2O ext.)
Sample Type File Name Sample lD Path nst Method
Unknown 21610 01 C : \Xca I ibu AData\Brewer\07 0201 0 1 3 C:U(calibur\methods\EDTA Pos Swabs
Proc Method Cal File Posrtron InjVol Level Sample Wt Sample Vol ISTD Amt
1 5.0 0.000 0.000 0.000
*****tt********************t***t
{* qt/L,,( t ol;
nane 5
ol a'Lo\ o13
c'lf tt l)-"--7-rbF

Sample Name:
C- -ment:
Sequence---07 020 1 01 3_Pos.sld [Open]
K3 extract
Study:
Client:
Laboratory:
Company:
Phone:
Sample Type File Name Sample lD Path lnst Method
Unknown 21611 05 C:Xcalibu r\Data\Brewer\070201 0 1 3 G:\XcaltDur\memo0s\tsu I A Pos Swabs
Proc Method CalFile Position InjVol Level Sample Wt Sample Vol ISTD Amt
5 5.0 0,000 U.UUU U.UUU
**tt*********t*************
Sample Name: BLANK (neg blood, Dl H2O ext.
Comment: Study:
Client:
Laboratory:
Company:
Phone:
Sample Type File Name Samole lD Path lnst Method
Unknown 21612 UI C:U(calibu r\Data\BreweA070201 0 1 3 C:Xcalibur\methods\EDTA Pos Swabs
Proc Method Cal File Position InjVol Level Sample Wt Sample Vol ISTD Amt
1 5.0 0.000 0.000 0.000
**i**********************
4/1/t'/olo2-olol3
c,'r- [ tt, I L.t c,lI_oF
5r,V4r-( r"v)
nenc A

Sample Name:
(^ .ment:
Sequenc e---07 0201 01 3_Pos.sld [Open]
BLANK (neg blood, Dl H2O ext.)
Study:
Client:
Laboratory:
Company:
Phone:
Sample Type File Name Sample lD Path Inst Method
Unknown 21613 01 C :XcalibuAData\Brewer\O70201 0 1 3 C:XcalibuAmethods\EDTA Pos Swabs
Proc Method CalFile Position InjVol Level Sample Wt Sample Vol ISTD Amt
1 5.0 0.000 0.000 0.000
*i******************t********************************t**ist**************t*t*t*t***ti**1************#**f,**t****t**
Sample Name:
Comment:
Q47 extract
Study:
Client:
Laboratory:
Company:
Phone:
21614 C : Xcal i bu AData\B rewer\O7 0201 0 1
Proc Method Cal File Position lnjVol Level Sample Wt Sample Vol
o 5.0 0.000 0.000 0.000
*********************
{* vvt( rcs)
clola't t'r13
a'>ltt-lro"J.r1rP

Seq uen c e---07 0201 0 1 3_Pos. sld [Open]
Sample Name:
C- -ment:
(neg blood, Dl H2O ext.)
Study:
Client:
Laboratory:
Company:
Phone:
Sample Type File Name Samole lD Path lnst Method
Unknown 21615 01 C:Xcalibur\Data\Brewer\070201 0 1 3 C:U(callbur\methods\EDTA Pos Swabs
Proc Method CalFile Position InjVol Level sample wt Sample Vol ISTD Amt
1 5.0 0.000 0.000 0.000
Sample Name:
Comment Study:
Client:
Laboratory:
Company:
Phone:
Sample Type File Name Sample lD Path lnst Method
Unknown 21616 01 C : \Xcalibu r\Data\B rewer\07 0201 0 1 3 C:U(calibur\methods\EDTA Pos Swabs
Proc Method tCal FileI
Position njVol Level Sample Wt rSample Vol IST
1 5.0 0.000 0.000 0.000
t*********t****************************************************t***********l***********************l
fx a4r-lrou\
naoe I /
O-7c>Lt t cl3olf ru lz'"1
Tbp
Sample Name:
/^- -'rment:
Seq uenc e---07 0201 0 1 3_Pos. sld [O pen]
K4 extract
Study:
Client:
Laboratory:
Company:
Phone:
Sample Type File Name Sample lD Path Inst Method
Unknown 21617 07 C:U(cal ibur\Data\Brewer\07020 1 0 1 3 C:U(calibuAmethods\EDTA Pos Sw,bs
Proc Method Cal File Position lnjVol Level Samole Wt Sample Vol ISTD Amt7 5.0 0.000 rJ.000 0.000
*t*******i*****************r******
Sample Name: (neg blood, Dl H2O ext.
Comment: Study:
,Client:
Laboratory:
Company:
Phone:
Sample Type File Name Sample lD Path Inst Method
Unknown 21618 01 C :\Xca libu r\Data\Brewer\07 0201 0 1 3 C:U(calibur\methods\EDTA Pos Swabs
Proc Method Cal File Position lnjVol Level Sample Wt Sample Vol iISTD Amt
1 5.0 0.000 0.00u 0.000
*****************************
5, qvL.
"!::')
0lcLolol3oLl lt I z-"c 1
wF

Sample Name:
C^-ment:
Sequenc e---07 020 1 0 1 3_Pos. sld [Open]
BLANK (neg blood, Dl H2O ext.)
Study:
Client:
Laboratory:
Company:
Phone:
Sample Type File Name Sample lD Path lnst Method
Unknown 21619 01 C:U(calibur\Data\Brewer\070201 0 1 3 C:U(calibur\methods\EDTA Pos Swabs
Proc Method Cal File Position InjVol Level Sample Wt Sample Vol ISTD Amt
1 5.0 0.000 0.000 0.000
Sample Name:
Comment:
extract
Study:
Client:
Laboratory:
Company:
Phone:
sample lype File Name Sample lD Path Inst Method
Unknown 21620 08 C:U(calibur\Data\Brewer\07020 1 0 1 3 C:Xcalibur\methods\EDTA Pos Swabs
Proc Method Cal File Position InjVol Level lSample Wt Sample Vol STD Amt
I 5.0 0.000 0.000 10.000
******************t**************t
/o q+GoJoLo\ o\3
6Ll \b I t-,'1-TI'F
( t,s1nana 1O

Sample Name:
C^-rnent:
Sequenc e---07 020 1 0 1 3_Pos. sld [Open]
BLANK (neg blood, Dl H2O ext.
Study:
Client:
Laboratory:
Company:
Phone:
Sample Type File Name Samole lD Path Inst Method
Unknown 21621 01 C:\)(calibur\Data\Brewer\070201 0 1 3 C:D(calibuAmethods\EDTA Pos Swabs
Proc Method CalFile Position InjVol Level Sample Wt Sample Vol ISTD Amt
1 5.0 U.UUU 0.000 U.UUU
*************
Sample Name:
Comment:
BLANK (neg blood, Dl H2O ext.)
Study:
Client:
Laboratory:
Company:
Phone:
Sample Type File Name Sample lD Path lnst Method
unKnown 21622 01 C:\)(calibur\Data\Brewer\07020 1 0't 3 C:XcalibuAmethods\EDTA Pos Swabs
Proc Metnod Cal File Position InjVol evel lSample WtI
Samole Vol Amt
1 5.0 U.UUU 0.000 0.000
f************
/* ,/'/ ('(t"o)
oaoe 1 1
ol0Lol O l3oLlit l2oc-i
T0fl
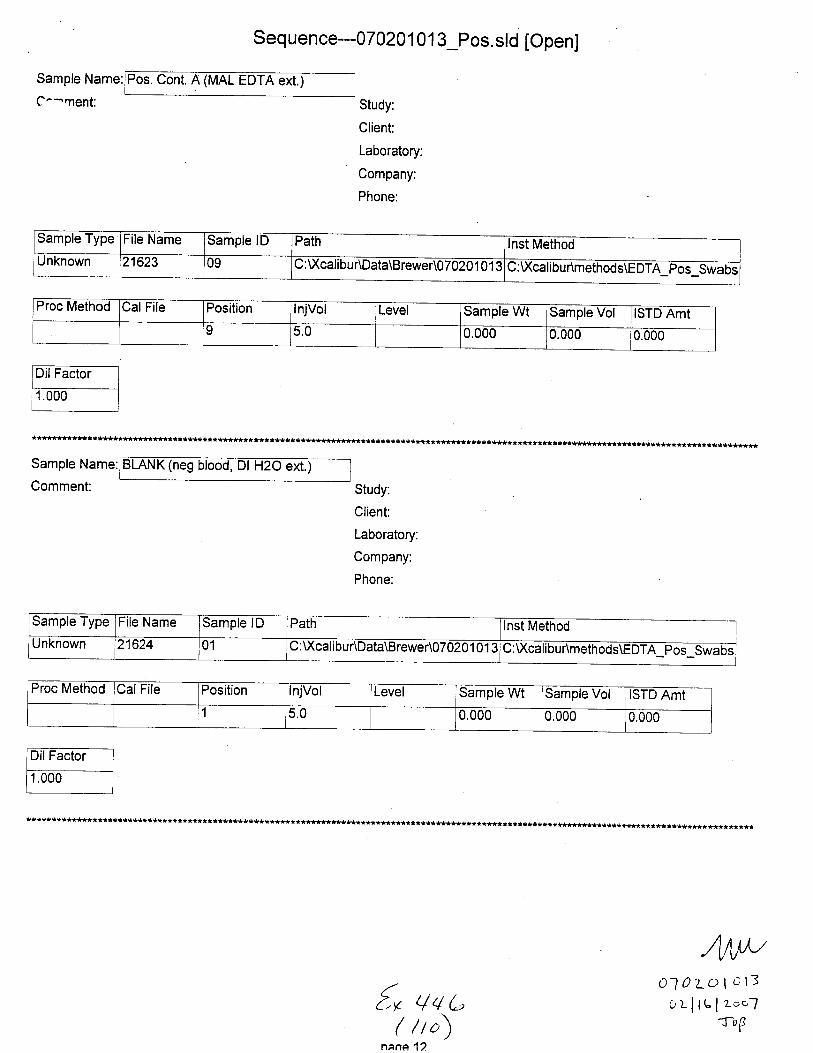
Sequenc e--070201 01 3_Pos. sld [OpenJ
Sample Name:I
O^-rnent: Study:
Client:
Laboratory:
Company:
Phone:
******t*********i*t*****t*****************************t*****t*****************
Sample Name:
Comment:
BLANK (neg blood, Dl H2O ext.)
Study:
Client:
Laboratory:
Company:
Phone:
******************
F*********t*******************ft ************************************
{* L/4 6( tro)
naoe 12
o-l 0LOl0l3ui-ltClzooT
i-uP
Sample Type File Name Sample lD Path lnst MethodUnknown 21623 09 : \Xcallbur\Data\Brewer\07020 1 0 1 l : U(ca libur\methods\E DTA_poLSwaG
Proc Method Cal File Position InjVol Level Sample Wt Sample Vol ISTD Amtv 5.0 0.000 0.000 0.000
ype File Name Sample lD Path Inst Method
Unknown 21624 01 C: \Xcalibur\Data\Brewer\O7 0201 01 3 C : U(cal i bur\meth ods\E DTA_pos_Swa bs
Proc Method Cal File Position InjVol Level Sample Wt Sample Vol ISTD Amti1 5.0 0.000 0.000 0.000
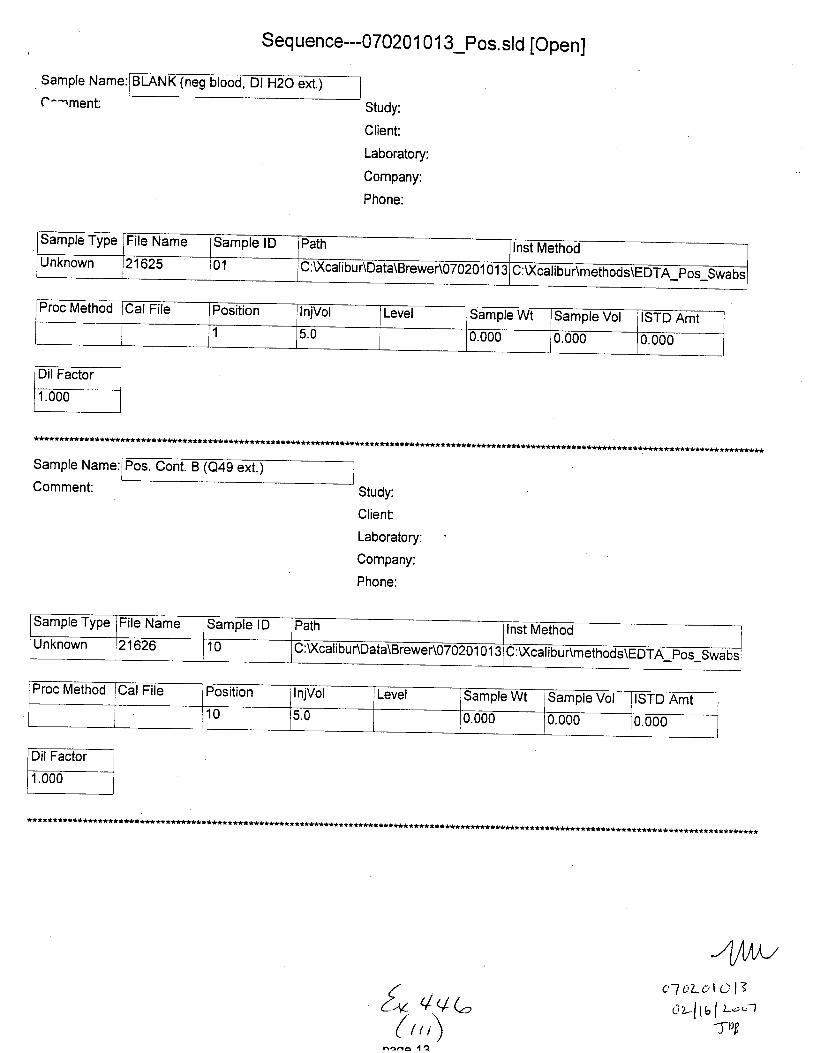
Sequence--07020 1 0 1 3_pos.sld [Open]
Sample tlame: ]C^*rment Study:
Client:
Laboratory:
Company:
Phone:
**************************l**t********************************f******ft*i*******************t*************t*****************************i*******
Sample Name:
Comment:
Cont. B (Q49 ext.)
Study:
Client:
Laboratory:
Company:
Phone:
***tt********i************t**********i*********************************************
Sample Type File Name Darnpte tu lHam Inst MethodUnknown 21625 01 :Xcalibur\Data\Brewer\0i0201 0 1 l \ACat tDu r\method s\EDTA_Pos_swa bs
Sample Type File Name Samole lD Path lnstUnknown 21626 10 C:DGalibur\Data\Brewe^0
Method Cal File Position InjVol Levet ]Sampte Wt lsampteTol Amt10 5.0 u.000 0.000 0.000
f* 44a(r"\
nana 4 2
ol oLcl a l70Lll6l t-oa1
-r1rg

Sample Name:
C^rment:
Sequence---07 020 1 0 1 3_Pos. sld [Open]
(neg blood, Dl H2O ext.)
Study:
Client:
Laboratory:
Company:
Phone:
Sample Type File Name Sample lD Path Inst Method
Unknown 21627 01 u: \xcattbur\Data\Brewen070201 0 1 : C : Xca I i bu r\m ethod s\EDTA_Pos_ Swabs
Proc Method Cal Fite Position lnjVol Level Sample Wt Sample Vol ISTD Amt
1 5.0 0.000 0.000 0.000
**************************s*****t*
Sample Name:
Comment:
BLANK (neg blood, Dl H2O ext.)
Study:
Client:
l-aboratory:
Company:
Phone:
************t******************
Sample Type File Name Sample lD Path Inst Method
Unknown 21628 01 C :\Xcal ibu r\Data\Brewer\07 020 1 0 1 3 U:V\calrDur\methods\EDTA Pos Swabs
Proc Method Cal File Position InjVol Level Sample Wt Samole Vol ISTD Amt
i1 5.0 0.000 0.000 0.000
{* ,L{a(r t ,a)
oaoe 14
ol o Zo\0lloLllvl i,oc)
aoP

Sample Name:
C^'nment:
Sequenc e---07 020 1 0 1 3_pos.std [Open]
{u avu,( tra)
oaoe 15
LOD, 1uL
Study:
Client:
Laboratory:
Company:
Phone:
*************l*t*********t****t*******************************************t*tt**tf***********t********************t***********r****************
Sample Narne:
Comment:
(neg blood, Dl H2O ext.)
Study:
Client:
Laboratory:
Company:
Phone:
*************************'*************************************************************************t********************
o1s7.o I c 1jc:>ltulz,"
7
IV,F
Sample Type File Name Sample lD Path Inst MethodUnknown 21629 11 C:Xcalibur\Data\Brewer\07020 1 0 1 3 u : v(cattb u r\methods\EDTA_pos_Swa bs
Proc Method CalFile iPositio- InjVol Level Sample Wt Sample Vol ISTD Amt1 b.0 u.0u0 0.000 0.000
Sample Type File Name Samole lD Path nst MethodUnknown 21 630 01 C:\)(calibuirData\Brewer\070201 01 l C:\)(calibur\methodstEDTA pos Swabs
Proc Method CalFile Position njVol Level Sample Wt ]Sampte Vol ISTD Amt
i50 0.000 0.000 0.
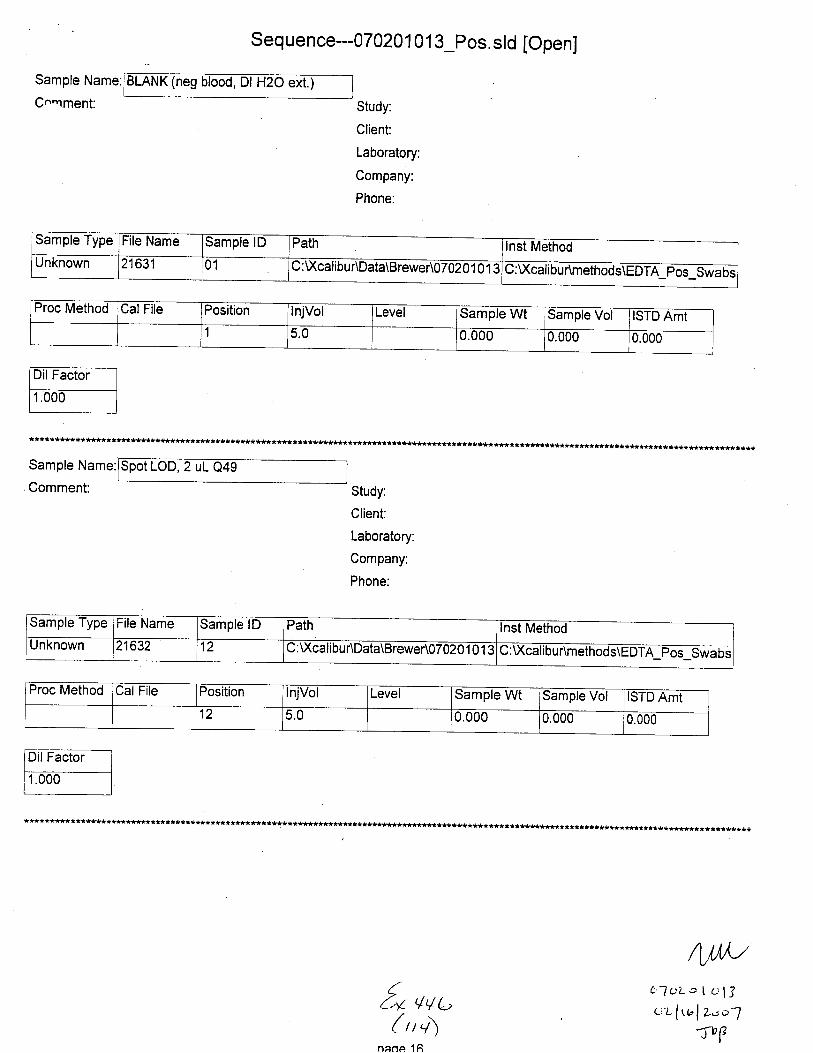
Sample t{ame:l'lu^Tment: Study:
Client:
Laboratory:
Company:
Phone:
Sample Name:
Comment:
Spot LOD,
Study:
Client:
Laboratory:
Company:
Phone:
Seq uenc e---07 0201 0 1 3_pos. std [OpenJ
{* uu,(r,v\
naoe 16
***************t************************************t**t**t**t********ti*******************
r**************t***************************************
/l,/r,U61aL.. I allcz{rr"f Laol
avP
Sample Type Frle Name Sample lD Path Inst MethodUnknown 21631 01 C:U(calibuAData\BreweJ\o2020 1 O 1 l :U(calibu r\methods\EDTA_poi Swabs
Proc Method CalFile Position InjVol Level Sample Wt lSampte VolI
ISTD Amt1 5.0 0.000 0.000 0.000
Proc Method Cal File Position InjVol Level Sample Wt Sample Vol ISTD Amt12 5.0 0.000 0.000 0.000
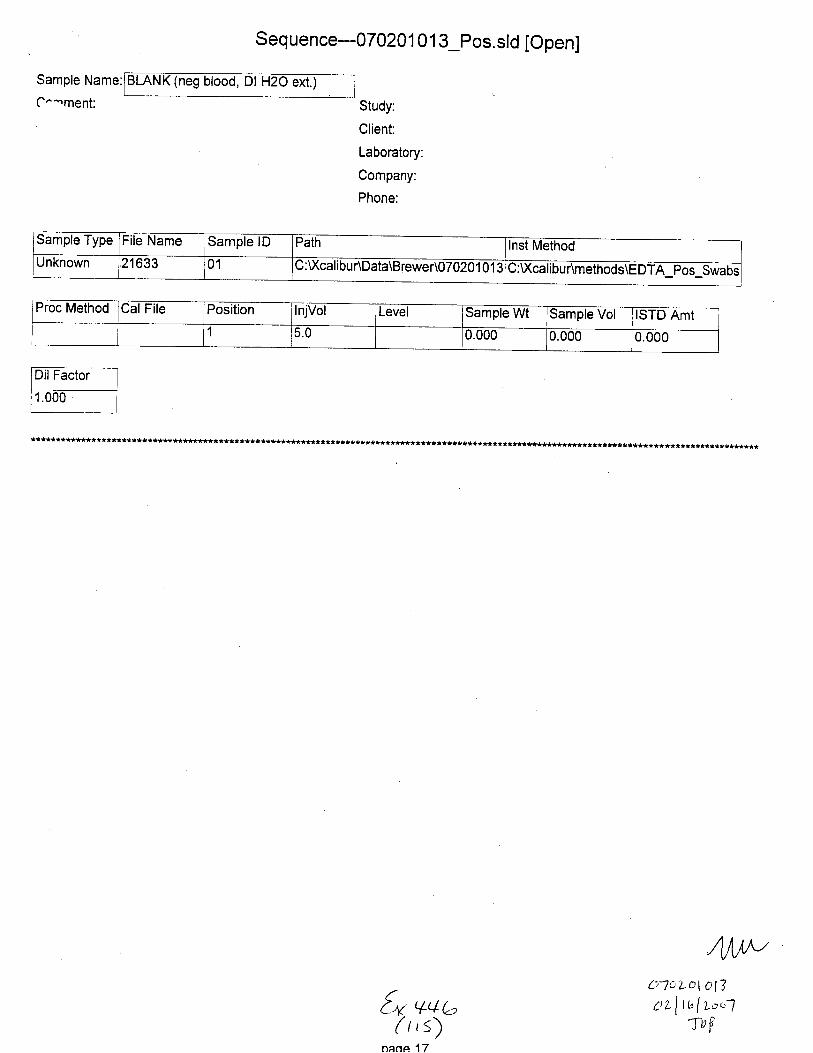
Sample Name:
C^-ment:
BLANK (neg I H2O ext.)
Sequence---070201 01 3_Pos.sld [Open]
Study:
Client:
Laboratory:
Company:
Phone:
Sample Type File Name lSamole lDI
Path Inst MethodUnknown 21633 01 :Xcal i bu r\Data\Brewer\07020 1 0 1 :l G:u(calibur\methods\EDTA pos Swabs
Proc Method CalFile Position InjVol Level Sample Wt Sample Vol ISTD Amt1 5.0 0.000 0.000 0.000
*****t*****t****t***************i********t*
f'u +rle'(its)
oaoe 17
oloLol o13
ctzlrt lLo"-lavF
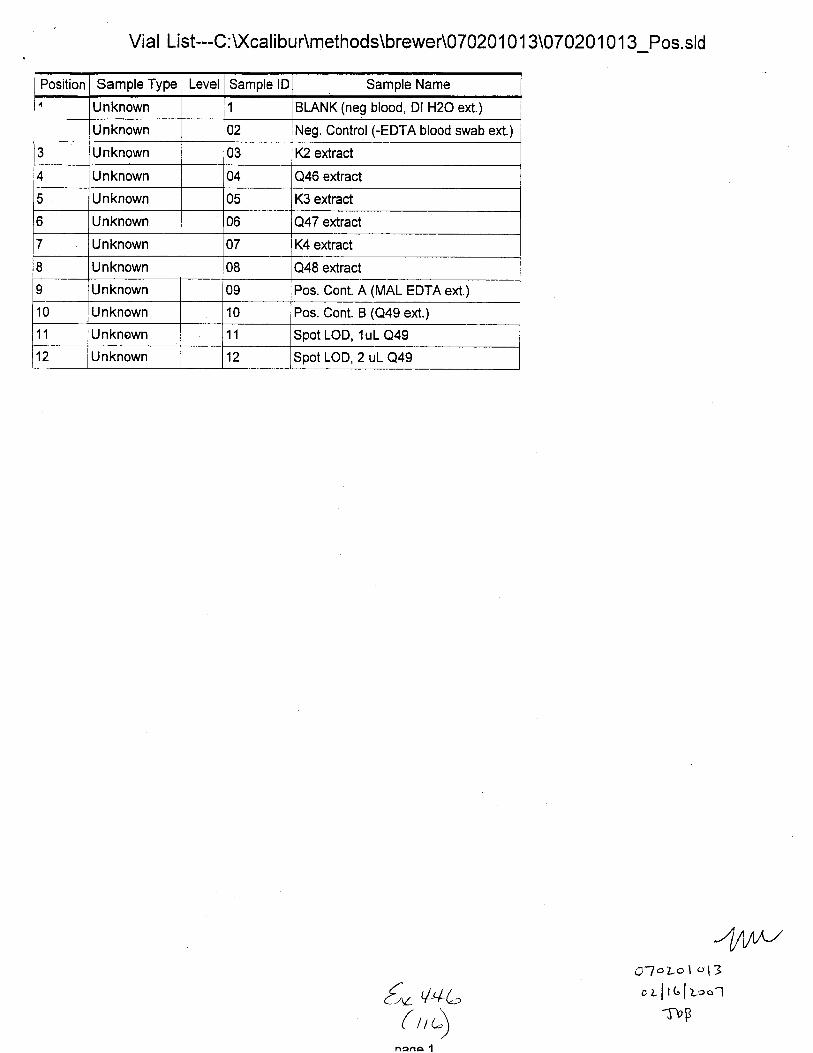
Vial List---C. Xca li bu r\methods\brewer\07020 1 0 1 3\070 20 1 0 1 3 Pos. sld
Position Sample Type Level Sample lD Sample Name
3
Unknown 1 BLANK (neg blood, Dl H2O ext.)
Unknown 02 Neg. Control (-EDTA blood swab ext.)
Unknown 03 K2 extract
4 Unknown 04 Q46 extract
c Unknown 05 K3 extract
o Unknown 06 Q47 extract
7 Unknown 07 K4 extract
I Unknown 08 Q48 extract
I Unknown 09 Pos. Cont. A (MAL EDTA ext.)
10 Unknown 10 Pos. Cont. B (Qa9 ext.)
11 Unknown 11 Spot LOD, 1uL Q49
12 Unknown 12 Spot LOD, 2 uL Q49
{o ++l-(r,)
nana 1
QloLol al3
" tlrc I loo.tT\tP
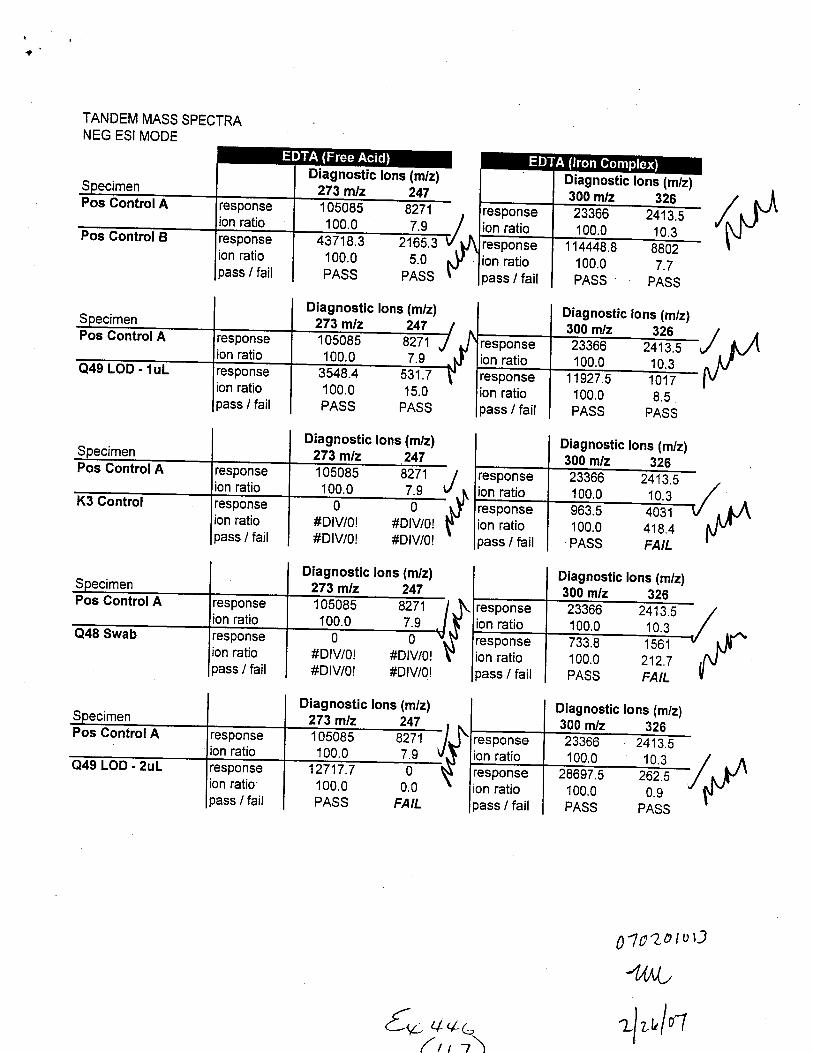
a
TANDEM MASS SPECTRANEG ESI MODE
Pos ControlA
Q49 LOD - 1uL
Diagnostic lons (m/z)273 mlz 247
100.03548.4100.0PASS
Diagnostic lons (m/z)273 mlz 247
Diagnostic lons (nVz)300 m/z 326
Diagnostic lons (m/z)300 m/z 326
2413.510.3
responseion ratiopass / fail
(,y531.715.0
PASS
responseion ratiopass / fail
responseion ratiopass / fail
responseion ratiopass / fail
01020 t o t)
4/W
zlrt,ln
S
Pos Control
Diagnostic lons (m/z)273 mlz Z4t105085 W1100.0 7.9
43718.3 -1653100.0 5.0PASS PASS
23366 2413.5100.0 10.3
114448.8 8802100.0 7.7PASS PASS
Diagnostic lons (m/z)
105085 8271100.0 7.9
Diagnostic lons (m/z)
963.5 4031100.0 418.4PASS FAIL
Diagnostic lons (m/z)273 mlz 247
Diagnostic lons (m/z)300 m/z 32623366 241t5100.0 10.3733.8 1561100.0 212.7PASS FAIL
105085 8271100.0 7 .9
12717.7 0
Diagnostic lons (m/z)
366 2413.5
1q0.0 10.3
,4+c,/r,t\
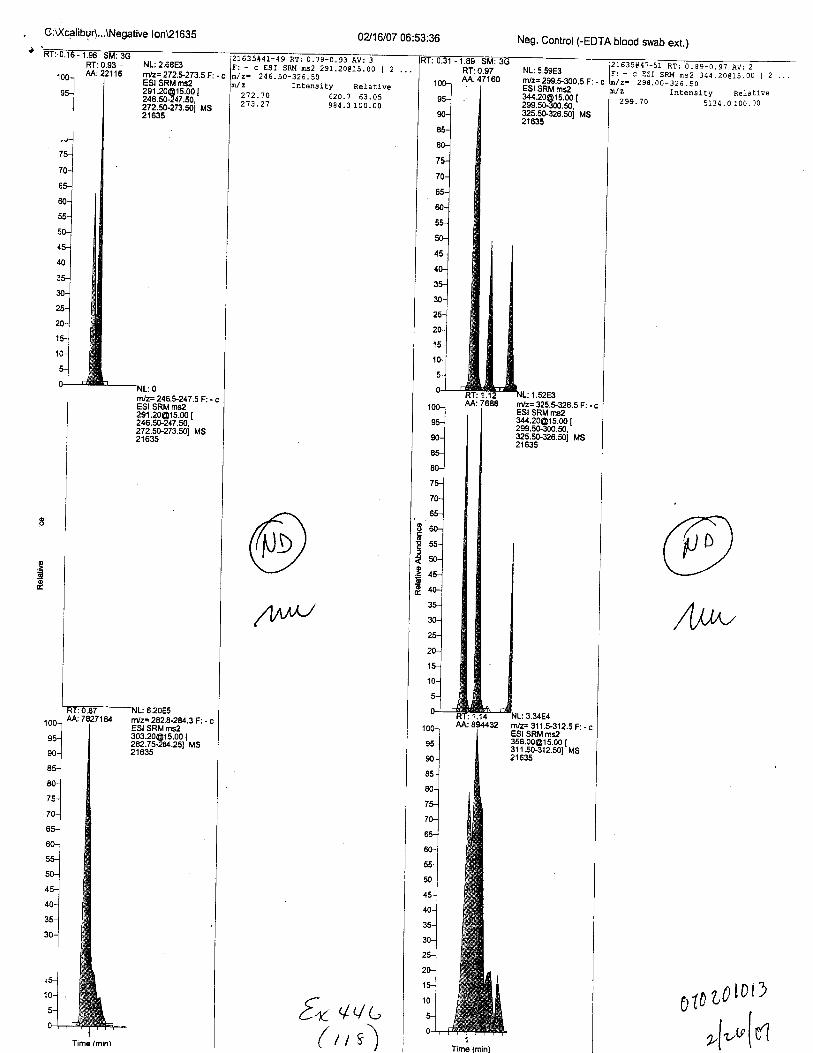
, C:rXcalibur\...\Negativelon\21635
NL: 6.2085
41-49 RT: 0.78-0.93 AV: 3- c ESI SRU ns2 291.20e15.00 I 2z" 246.50-325.50z Intensity Relacrve
Neg. Control GEDTA blood swab ext.)
2153sil4?-sr nr;l.lllilg-r ev; zFr - c Esl SRM ns2 344.20G15.00 I 2z- 298.00-326.50
z Intensity Relaltve299.70
ofi ?'oIo ,t)
'[-'lvt
02116107 06:53:36
RT:0.93 -M:22116 RT:0.97
AA:47160100.1
*J 272.'t0213.21 98{.3 100.00
-z?s.,// \/ l,tn I( Mv /\-/
/(w
oo
Df
€o
oo
@W
€n q"'N u( rtt)
illlz= 282.8-2U.3 F: - cESI SRM [email protected] |282.7*2U.251 MS2't635
Time tminlTime (min)
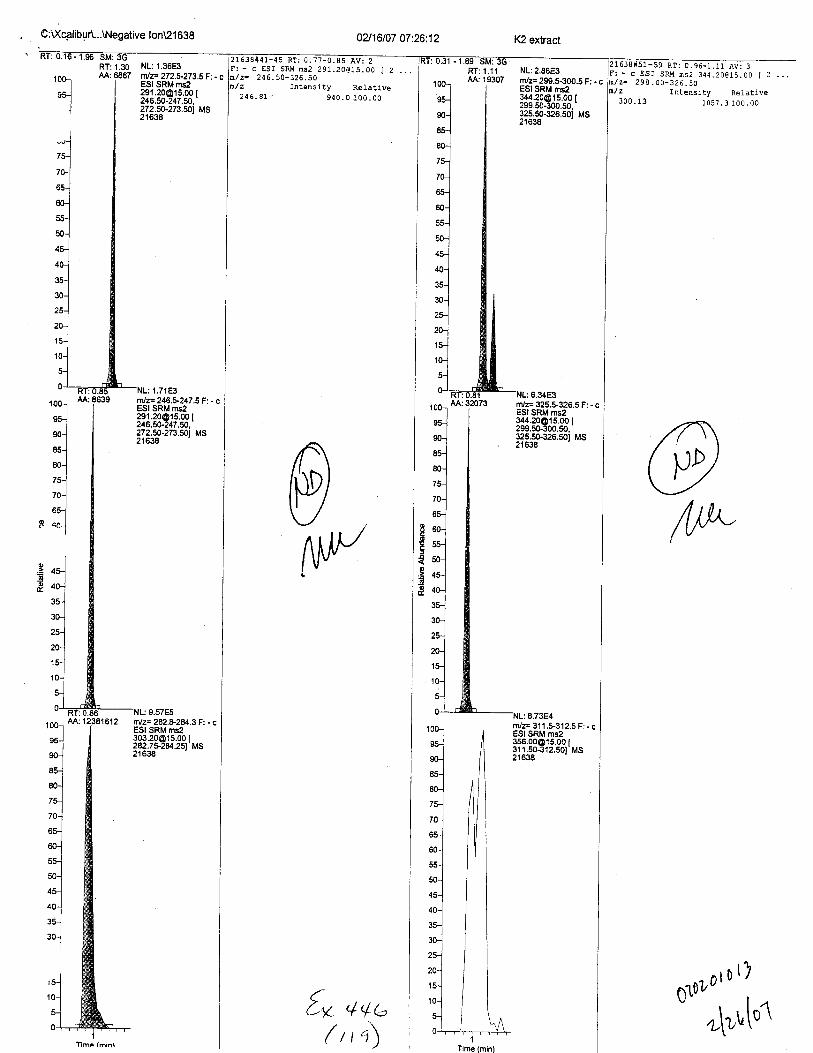
02116107 07:26:12 K2 extractC:Xcalibur\...\Negative lon\21 638
z- 298.00-326-50z Intensity Relative300.13 105?.3 LO0.0O
@w
z Intensity Relative246.8L 9{0. o 100. oo
@I\t/'
RT:1.30 NL:1.36E3M: 6867 Nz= 272.1273.5 F: - cI ESI SRMms2
3il:339if 331272.50-273.501 MS
tdz= 246.*217 .5 F: - cESI SRM [email protected] [246.50-217.fi.272.50-273.501 MS21638
':l
I6
€oio
10(
4
I'
7C
55
50
45
40
u'a,lnto ,t:4b(,r')
nvz= 311.$312.5 F: - cESI SRM [email protected] I311.5C.312.501 MS21 638
Tlme (mrn)

C:U(cqllbuA...\Negative lon\2 1 641 02/16107 07:58:57 Q46 extract
aT. n raM:28309 RT: 1.35
AA:18923- c ESI sR!.{ ns2 344.20c15.00 [ 2z- 298.00-326.S0z Inteosity Relative299.'t9 2907. 0 1OO. 00
rot
'lNL: 5.61 E3nlz= 272.5-273.5 F: - cESI SRM [email protected] [246.50-247.fi,272.sG273.501 MS21il1
1 00-1
^-lJ--l--lolEo-l
I7U'-l70i'^-l"l60-l
JTI
501
4s-lI
oo-l
--l^^l*-j
@
^J\v
@ttllL
d1llil o \?
lWr\*\fl
r/z= 31 1.5-312.5 F: - cESI SRM [email protected] I311.5G312.501 MS21il1
f* r,q"/ t ><t\ Time (min)
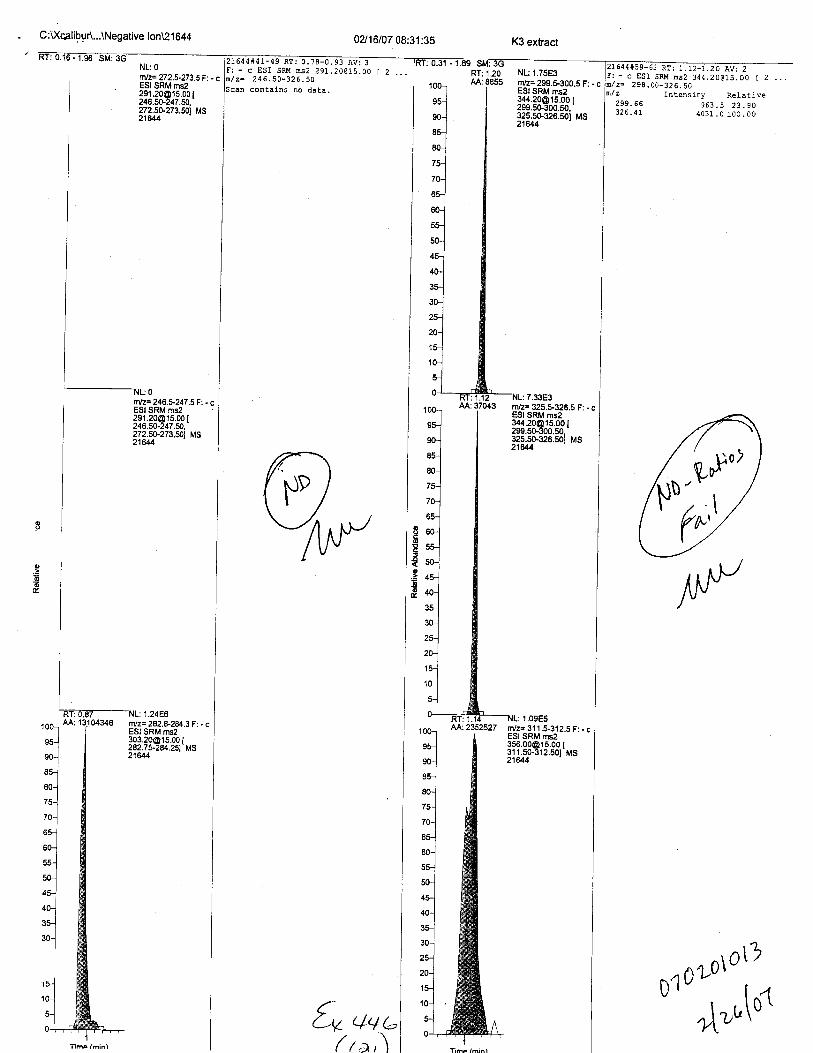
C:\XcalibuA...\Negative lon\21 644 02116107 08:31:35
(Jq u
NL:0r]iz= 272.5-273.5F: - cESI SRM [email protected] [246.fi-247.fi,272.50-273.501 MS21644
NL:0
1644#4I-49 RT: 0.78-0.93 AV: 3- c ESI SRM ns2 291.20015.00 Iz- 246.50-326.50
contains no data.
rnlz=246.5-247.5F: - cESI SRM [email protected] [246.*-247.s.272.5O-273.50j MS
oIE
{o
-Eo
RT;0.87AA: 13:104346
NL: 1.24E6nh= 242.8-2U.3 F: . cESI SRM [email protected] MS
(ra,\
RT: 1.20AA: 6655
K3 extract
NL: 1.75H!mfz= 299.$300.5 F:. cESI SRM ms2
13333_9J333.r32s.5G320.501 MS
216441f59-63 RT; 1.12-r.20 ev: 2| - c ESI SRM ns2 344.20015.00 t 2z- 298.00-326.50
Intensj.ty Relative963.5 23.90
4031.0 100.00325.41
4ru\fl

C:D(calibuA...\Negative lon\21 647 02116107 09:04:15 Q47 extraci
NL:0
'n'lz= 272.5-273.5 F: - cESI SRM [email protected] [246.50-247.50,272.50-273.50t MS216/'7
;M:RT:AA:
RT:1.19AA:4347
1,81z= 246.50-326.50conlarns no data.
z" 298.00-326.50contains no data.
nlz= 2465-247.5 F: - cESI SRM [email protected]?.fi-273.501 MS
nlz= 282.8-2A43 F: - cESI SRM [email protected] I242.75-2U.25l MS21e47
rn/z= 325.t326.5 F: - cI ESt SRM ms2I [email protected] 299.5G300.5o,I g2s.s0-326.501 MS
I 21u7
I
I
I
I
"lol6lxltlot<lol6t@i-l
I
I
I
I
I
I
NL:2.10E5, nn_ rfz= 31 1 .$,312.5 F: - c'-- I I EStSRMms2,5.1 | iff:B&gllgr".'oJ Il 21u'|
8q llsolll'u'l I I'ol ll'l /l'ol /lssJ iluo.liloul l\oo'l I \
'u'l I \
'o'l I \27 1\2o-l | \lsll
\'ll\'-1/ l.ol-+-1->-+
Time (min)
6t,u,/ t:>5\
"ili:
,ool9H
on-l--lqr--l*l'l,\_-l*l*-]*l*lorloo-l
*l^^lar-l
Time (min)
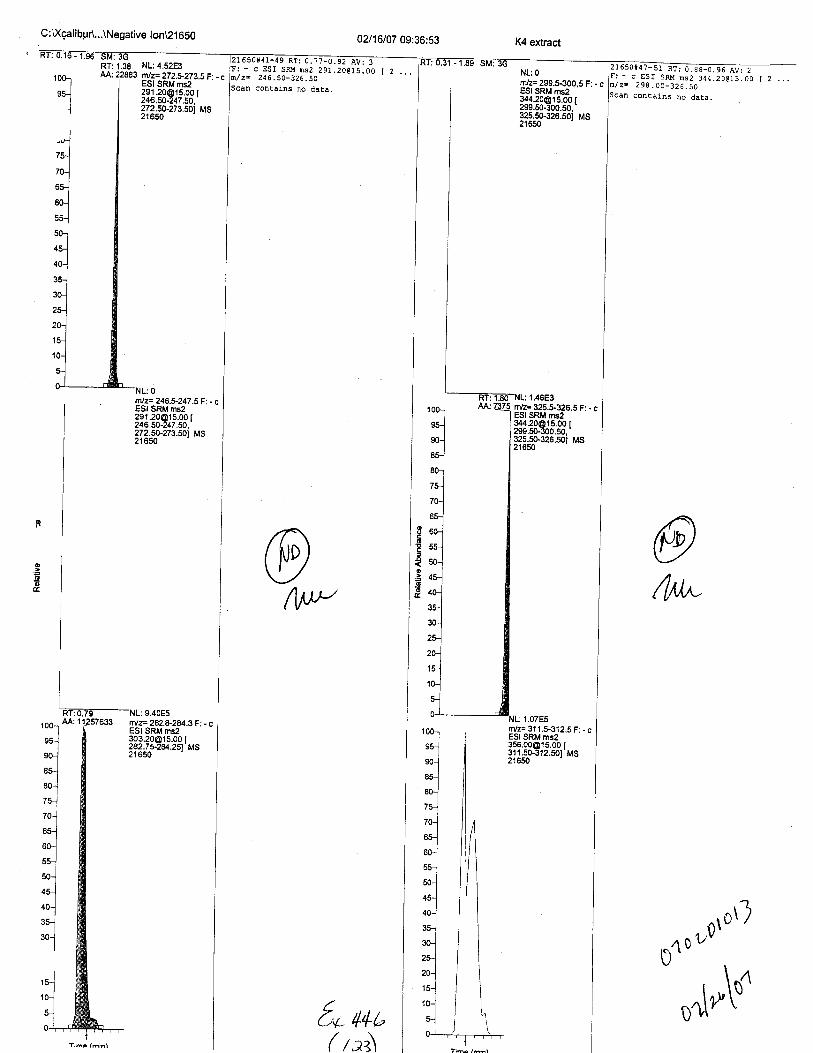
C:l(galibpr\...\Negative lon\2.1 650 0?/16107 09:36:53 K4 extracl
RT: 1.3A NL:4.52E3M: 22883 n,tz= ZTZ.+213.5 F: - c
NLOrn/z= 299.$300,5 F: . cESI SRM ms2
333:',39Jfi93t325,5S.326.501 MS
Scan contains no data,
@lw
ESI SRM ms2
3il:3391i33t272.50-273.501 Ms216sO
':i
@l,w
@o
o
o
r.4 o r,,0\o\J
0dilst* 44b
rnlz= 246,5-247.5 F: - cESI SRM [email protected] t246.50-247.50.272.so-223.50i Ms21 650
rnlz= 325.5.326.5 F: . cESI SRM ms23/[email protected] t299.50-300.50_ -
325.50-326.s01 MS21650
rvz= 311.$312.5 F: - cESI SRM [email protected] t31r5G312.501 Ms
( ral)

C:U(calibur\...\Negative lon\21 653 02116107 10:09:33 Q48 extract
NL:2.67E3rw2= 299.5-300.5 F: - cESI SRM ms2
t#3381333'325,50-326.50i MS
NL:0||r'z- 272.6273.5F. - cESI SRM ms2291 [email protected] I246.50-247.50,272.50-273.50t MS21653
1-49 RT: 0.7?-0.92 AV: 3c ESI SRM ns2 291.20€15.00246.50-326.50conlains oo data.
RT;1.04AA: 23310
2I 653i|43-ss nr, o. er-il?-iE-a-F: - c ESI SRM ms2 344,20015.00 { 2B,/z- 298 .00-326. 5O
z Intensity Relative300.25 133.8 47,01
1561.0 100.00
@,N
o
.go
NL: 8.53E5mJz= 282.8-2&.3 F: - cESI SRM [email protected] I292.75-2U.25t MS21653
ood
€o
=o
^,afl:)oo"^,'lo'r'
Cu-nt( r"t+\
NL: O
nJz= 246.5-247.5 F: - cESI SRM [email protected] I246.50-247.50,272.sG273.s01 MS21 653
":44J,
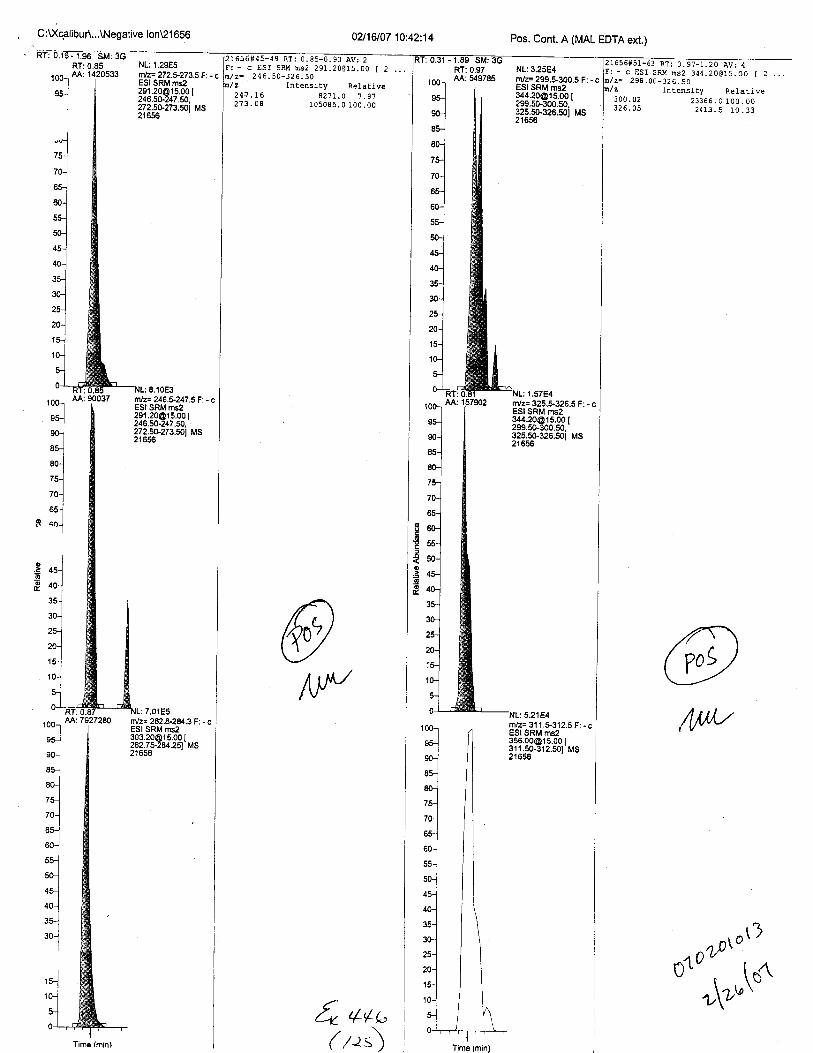
C:\XqglibuA...\Negative lon\21 656 02J16107 10:,42:14 Pos. Cont. A (MAL EDTA ext.)
2l656tt4s-49 RT: 0-85-0. 93 Av: 2
z= 246.50-326.50: - c ESI sRM ns2 291.20915.00 t 2 ... NL: 3.25E4
m/z= 299.5-300.5 F: - cESI SRM [email protected] [299.50-300.50.325.50-326.501 MS21 656
r/z= 31 1.$312.5 F: - cESI SRM [email protected] t31'1.50-312.501 MS21656
1656ia51-63 RT:0.9?-1.20 A1 4: - c ESI SR!.i ns2 344.20.a15-OO t 2z= 298.00-326.50z Intensity Relative
23366.0 100.00ZCTJ.5 IU. JJ
RT:0.97AA:549785Intensity Relative
821t.0 1.81r05085.0 100 ,00
300.02
AA: 90037
e
o!ctod6c.
@Ay
Nz= 282.8-28/.3 F: - cESI SRM [email protected] I282.7+2U.251 MS
/t/W
f" +*a(,''ts)
fflz= 246.1247.5 F: - cESI SRM ms2291 [email protected] [246.50-247.50,272.50-273.501 MS21656
'l-ime (minlTime (min)
'.,ill

C:U(qalihuA...\Negative lon\21 659 Pos. Cont. B (Q49 ext.)
NL:2.28E5m,2= 299.S300.5 F: . cESI SRM [email protected] [299.50-300.50,
-
325.50-326.501 MS21659
NL:6.35E4rnlz= 31 1.t312.5 F: - c
l-1RT:0.97AA:2619370
- c ESI SRU nsz 344.20c15.00 I 2 ...z- 298.00-326.50z Intensity Rel.ative299.91 114448.9 1 00. o0326.04 8802.0 1.69
@/w
100-.1
'-l
",18q.o']
zN
'o']65j@ ^^l,. -|
l45-1
40l?6J*lro-]
24,-lril'-l'l
o.26@E
roo-, M'
nr-l
*-lru-]
801
tA
^.]ul*-l*-]*-1orloo-l
rrl
'"]
ESI SRM [email protected] [246.50-24?.50.272.5G273.501 MS21659
1 nlz=282.8-2U.3F:-cESI SRM [email protected] [282.75-2U.251 MS21659
@/1N^
ESI SRM [email protected] I311.50-312.50] MS21659
Q+u,( ,'at'\ f ime (min)
,.';,-i;

662f43-53 RTr O.g1-1.19 AV:6- c ESI SRU ns2 [email protected] I 2
298.00-325.50
02116107 11:47:36 Spot LOD, 1uL Q49C:U(qalibur\...\Negative lon\21 662
nlz=272.5273.5F: - cESI SRM [email protected]
ms2r5.00 [
246.50-247.50,272.50-273.501 . MSa tooz
'NL:5.10E5
dz= 242.8-28,4.3F: - cESI SRM [email protected] I282.75.2U.25t MS21662
RT:0.85AA: 11851E1001
*l
@(tw0
/\1,,"
0.,';:L.f* ++a( r^z\
RT:0.88AA:363506
filz= 246.1247 .5 F: - cESI SRM [email protected] [246.50-247.fi.272.50-273.501 MS21662
oo
o
o45
40

0?/17107 12:20:10 Spot LOD, 2 uL Q49
7.04E4
. C:u(calibud...\Negativelon\21665
- C-ESI SRM ns2 344.20015.00 [ 2z- 298.00-326.50z Intensity Relative3:: !9 286e?.s 100.00r.o.z6 262.5 0.91
0.88746703
' ,.(RT:AA:
04AI^"
rnlz= 282.4-2U.3 F: - cESI SRM ms2
i3l7t9Jfi3t".
^ nrOl)
0'10',Jrr\*6: aa( ,,s)
m/a= 299.$300.5 F: - cESI SRM ms2
133:338J333t325.sG326.501 MS21665
nlz= 246.1247 .5 F: - cESI SRM [email protected] I246.fi-247.50.272.50-273.501 MS21655
I 00-l
*t*-1Ail*iro-1
7l,"1*t60-l
-- |
::l'ul45-1
rc-lI'-t
^^ i
'u-l
r/z= 31 1.5-312.5 F: - cESI SRM [email protected] I3t'1 .50-312.501-MS21665
@4M
@oF
€oio
$,

C:'"'icalibur\data\Brewer\070201 01 3\2'l 601Tfog
02116107 12:03:08
NL: 1.36E3rvz= 159.$'160.5F: + c ESI Full [email protected] [ '12s.00-315.001 MS2160'l
10€
95
90
80
70
I 0o6uoo
-go
66J--61 NL: 2.83E59.04 TtC MS 21601
3044.'15
2403.28
3544.U
cua 6zt6.93 510 E.Ss
tnlT- 246.5-247.5F: + c ESI Full [email protected] [125.00-315.001 MS21601
BLANK (neg blood, Dl H2O ext.)
+ c ESI Full ms2 [email protected] [ 125.00-315.001
nxnrnrT 50005 cF 381
oll;l,a3'M{\',
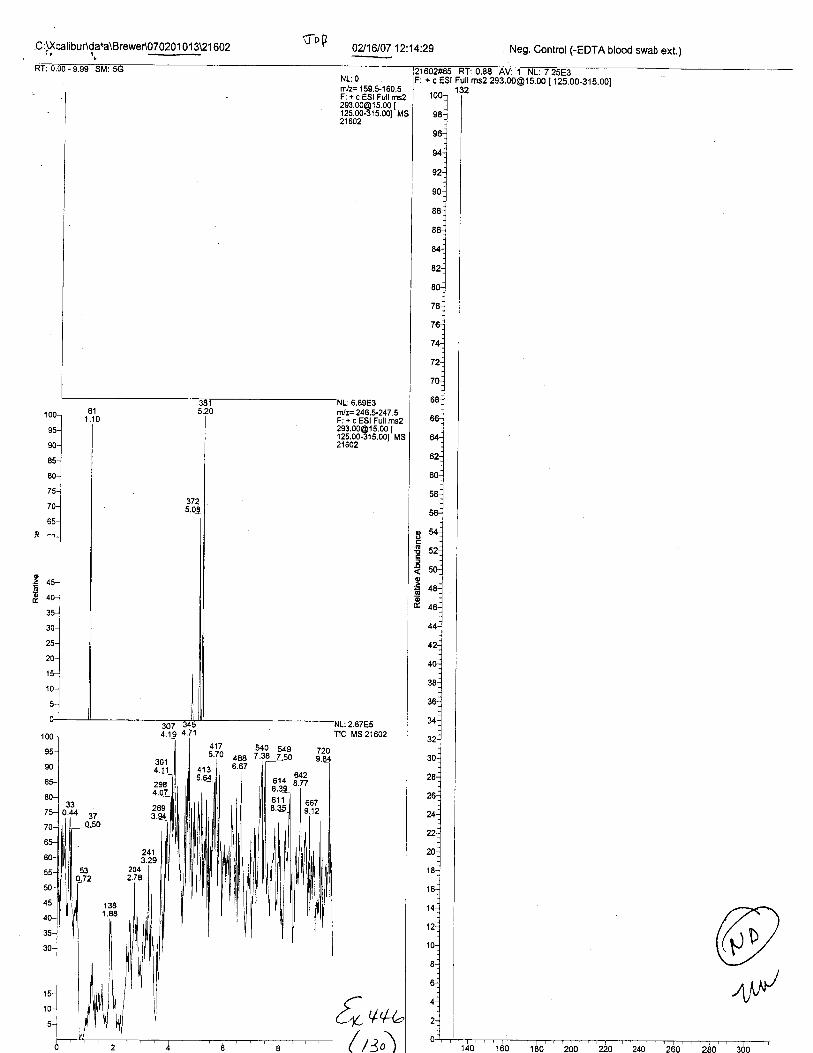
C:)XcalibuAdata\Brewer\O7020 1 0 1 3\21 602r, t.
cDP ozrcrc7 i2:14.29
NL:0mrz= 159.5-160.5F: + c ESI Full [email protected] [125.00-315.001 MS21eo2
. a nqEr
100-l
*lnol
65t
.o-]I
,o-lI
ru-i
,q ^n-l
m/z= 246.5.247.5F: + c ESI Full [email protected] [125.00-315.001 MS21602
6u('il)
Neg. Control (-EDTA blood swab ext.)
160?#65 RT:o.EE AV: 1 NL: 7.25E3: + c ESI Full ms2 [email protected] [125.00-315.00]
@41,/
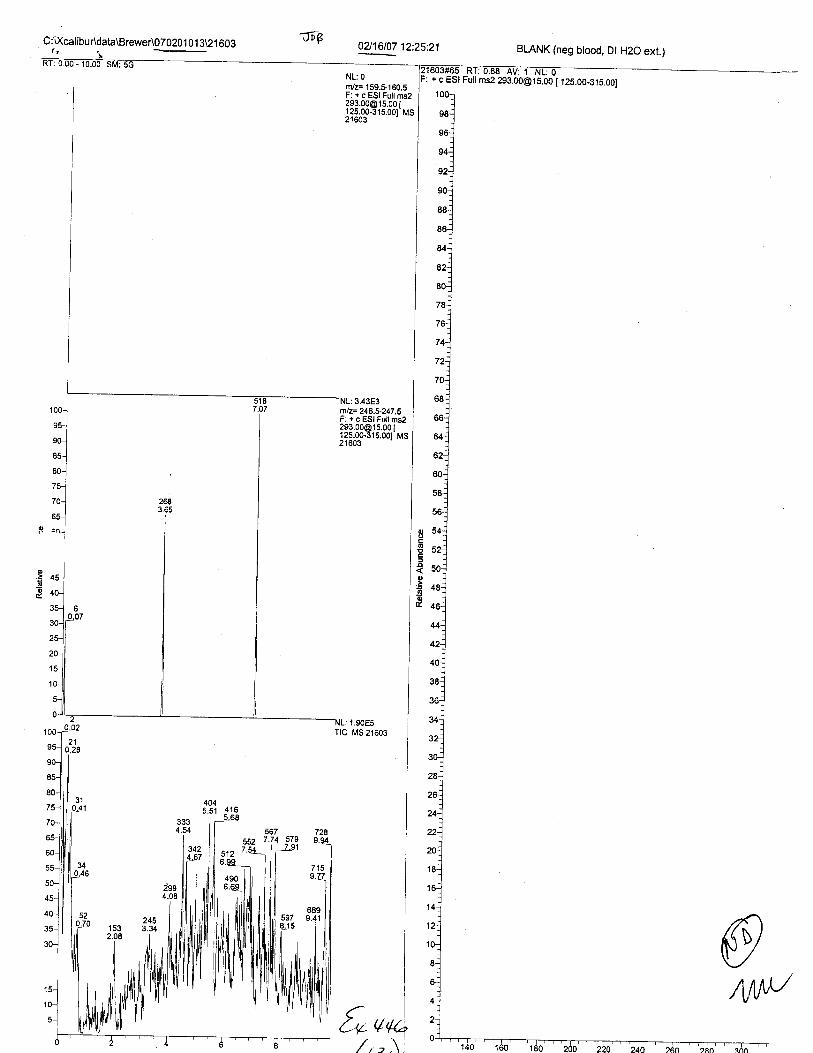
C:VcalibuAdata\Brewer\O70201 O 1 3U1 603-rg
-
0?/16107 12:25:21
NL: O
nvz= 159.$150.5F: + c ESI Futl [email protected] 25.oo-5i s.ool' Ms21603
rnlz= 246.$247.5F: +cESl [email protected] Ms2l 603
3.43E3
.t onEE
Ttc {\rs 21603
oo
0
Eo
t"qK
BLANK (neg btood, Dt H2O ext.)
JUJrcO A I : U.OO AV: 'I NL: O+ c ESt Fuil ms2 [email protected] [ 125.00-315.001
@M

C:Xcalibur\data\Brewer\07020 1 Ol 3U 1 604f\
-lo6'0A16107 12:36:16
:1.1gEsTIC i/ls21604
oooE
o.:oo
ti+
rnlz= 246.5-247 .5F: + c ESI Full ms2
?33339f333rr^
/ta)
BLANK (neg blood, Dt H2O ext.)
: + c ESI Full ms2 [email protected] [ 125.00-3iS.0OI
@/1/y
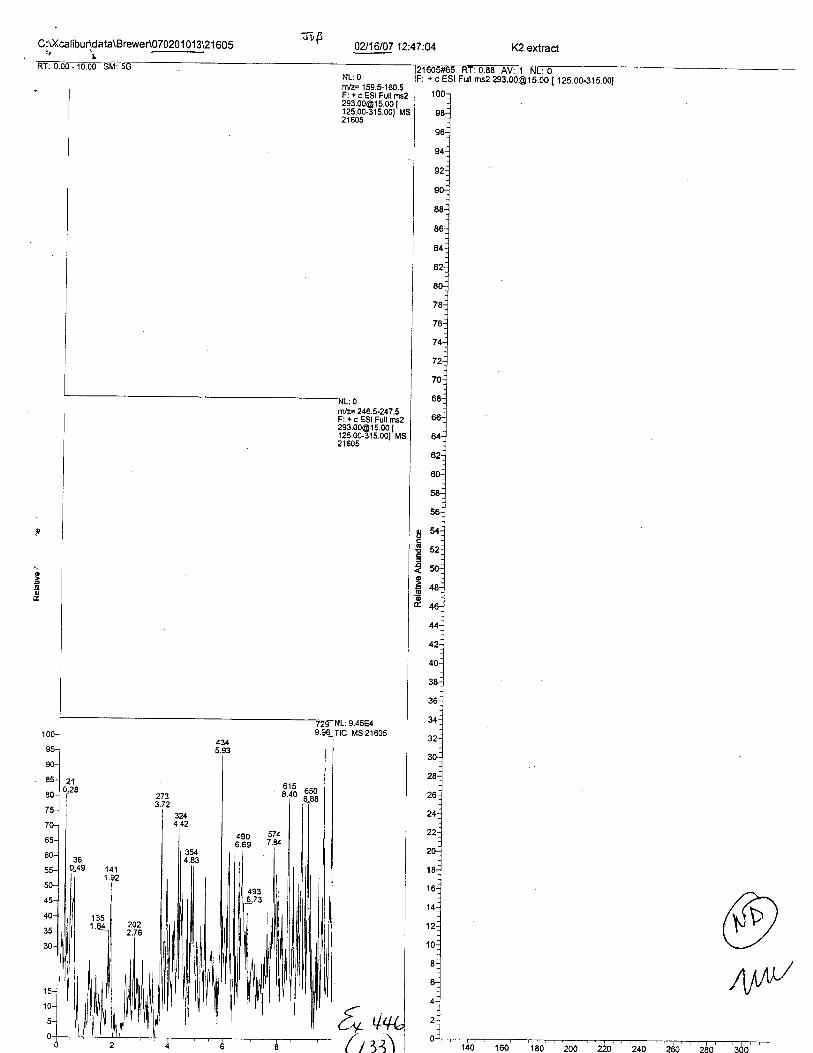
C$(calibur\data\Brewer\07020 1 01 3U l 605\-
7.U
NL:0m/z= 159.5-160.5F: + c ESt Full [email protected] |125.00-315.00t MS21605
ntlz= 246.5-247.5F: +,: ESI Full [email protected] [125.00-315.00t Ms21605
JDP' 02116107 12:47:04
NL: 9.45E4Ttc Ms 21605
oo
E
o.z-g!o
5* 4+,(rv\
K2 extract
+ c ESI Full ms2 [email protected] [ 125.00-315.001
@Aw
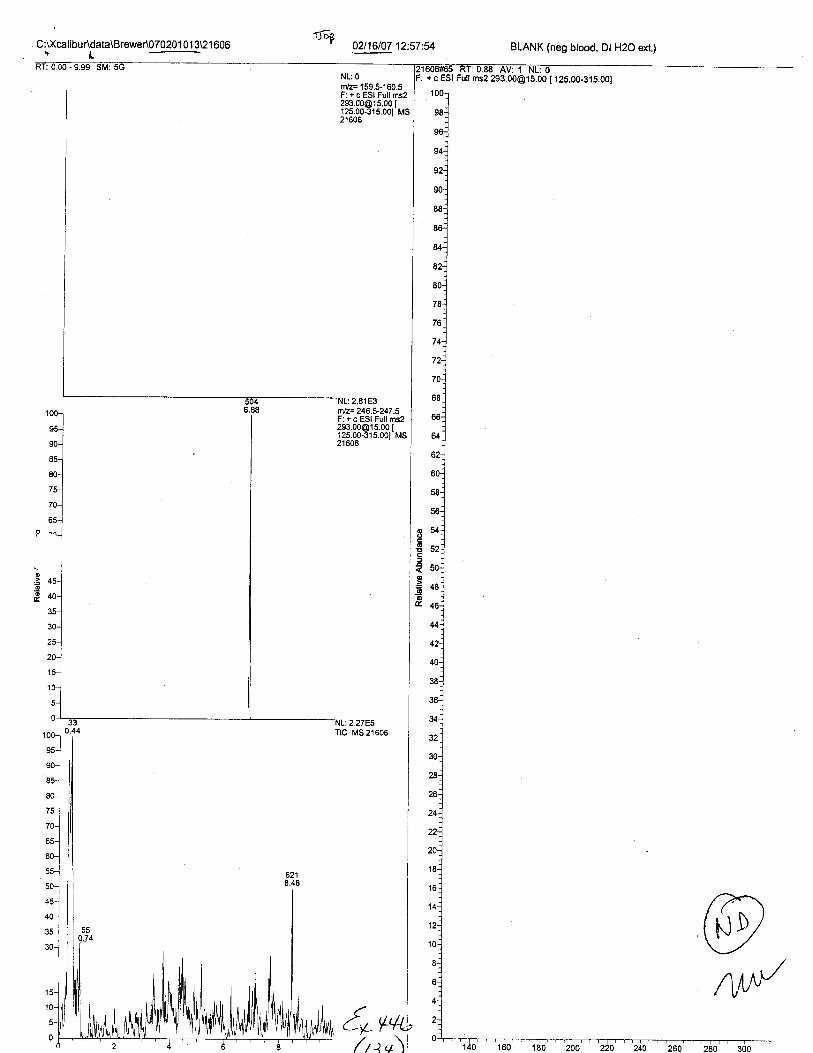
C:\Xcalibur\data\Brewer\070201 01 3121 606rl -|vg' 0U16107 12:57:54
: 2.81E3
100-l
ru-.1
ro-l
*lro-l
to-]I--l
I ^^-.1
ftlz= 246.5-247 .5F: + c ESI Full [email protected] I125.00-315.001 MS21606
m/z= 159.5-'160.5F: + c ESt Full [email protected] [125.00-315.001 MS21606
BLANK (neg blood, Dl H2O ext.)
+ c ESI Full ms2 [email protected] [ 123.00-315.001
@A/^/

C',Wcaliburtgata\Brewer\070201 01 3U1 607 J DI'02116107 01:08:5'l
NL:0rn/z= 159.5-160.5F: + c ESI Full [email protected] Ms2',t607
m/z= 246.1247.5F:+cESl Fullms2293 [email protected] [125 00-315.001 MS21607
BLANK (neg blood, Dl H2O ext.)
: + c ESI Full ms2 [email protected] [ 125.00-315.00]
@^N
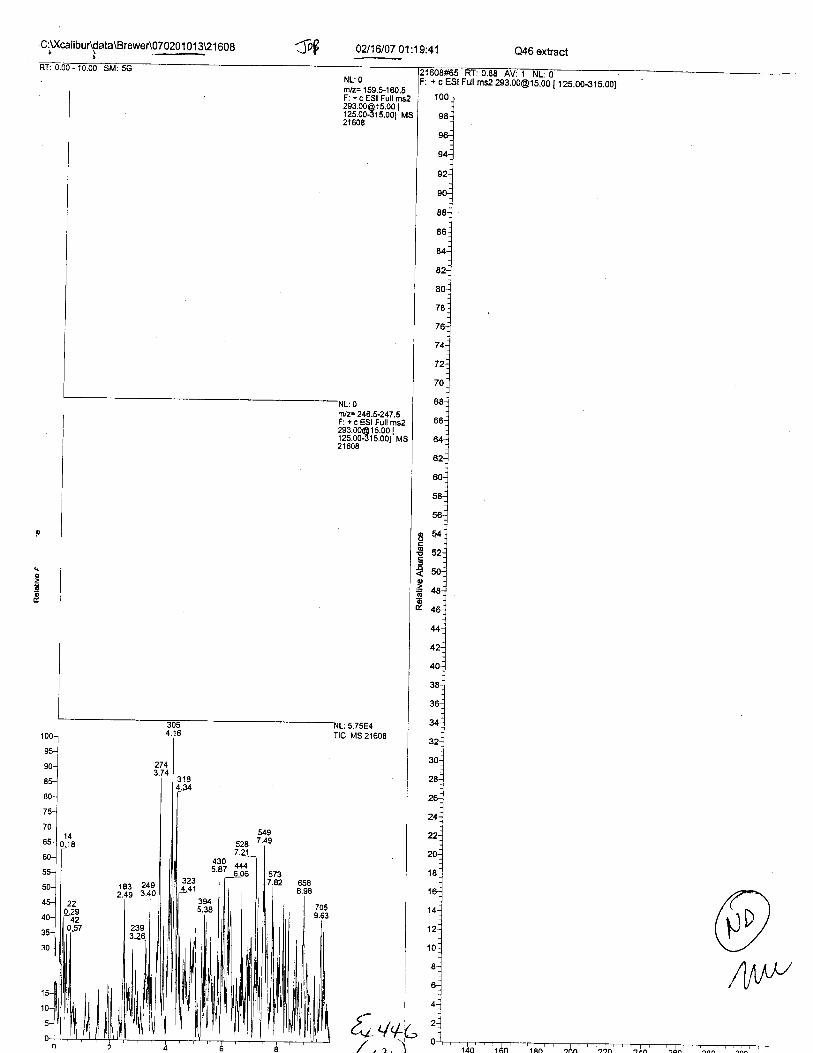
C:Uftalibur\datia\Brewer\070201 0 l 3U1 60g'l
NL:0rvz= 159.5-160.5F: + c ESI Full [email protected] I12s.00-51s.oot'Ms21608
2493.40
239
,L++
+ c ESI Full ms2 [email protected] [ 125.00-315.001
@/vw

C:\XcalibuAdata\BreweA070201 01 3\21 609
nlz= 1 59.5-'160.5F: + c ESI Futl [email protected] t125.00-31 5.001'MS21 609
'NL: 0.r z=246.1247.sF: + c 951 PrU r.,[email protected] t1 25.00-31 5.00t-Ms21509
,{r v
BLANK (neg blood, Dl H2O ext.)
;;Esr i;il 'U 2r!.bb61';:ddr 125.00-315.001
@4/

BLANK (neg blood, Dl H2O ext.)
+ c ESI Full ms2 [email protected] [1z5.oo-315.00]
fre\oyAl,/
l{y t1,

-C:U(calibur\data\Brewer\07020'l 01 3\21 6.1 .l t op o2t16to7 o1:52:18
NL;0nvz= 159.5-160.5F: + c 551 Pu1, tr,[email protected] [125.00-315.001 MS21611
100-l
ru-]
e0-j
e*].o-l
^-lto-]
uuJ
P ^n-j
ti+
5086.94497433
5.U
5.12
J I rruJ ^ t. u.oo Av: I NL: u
+ c ESI Full ms2 [email protected] [ i2S.O0-315.001
@Al,/

C:U(calibur\datia\Brewer\070201 0 1 3\2 1 6 1 2"--_ ffip oa$rc7 o2:03:10 BLANK (neg blood, Dl H2O ext.)
Full ms2 293.00@1S 00 [ 125.00-315.00]
10(
oa
8C
/a
70
6o
a
ooo
@A/N
NL:3.196E5Trc Ms21612
4255.8't
^^^lJOO I
t-uV
o

C:,\XcalibuAdata\BreweA07020't 013U1 6l 3
N!: onVz= 159.5-160.5F: i c ESI Full [email protected] I125.00-315.00t MS21615
1 00-l
*-]*.1uu-l
801
zs']
toJ
5s-l
I
i. -"-Jol3 4s-lol.9 40-.1-^,1
I
ro-]
ru-j
,olru-l
ro-]
-l
mlz= 246.1247.5F: + c ESI Full ms22e3 [email protected] I12500-315.001 Ms
702
BLANK (neg blood, Dl H2O ext.)
: + c ESI Full ms2 [email protected] 1 ,|ZS.OO-atS.OOJ
@
^W
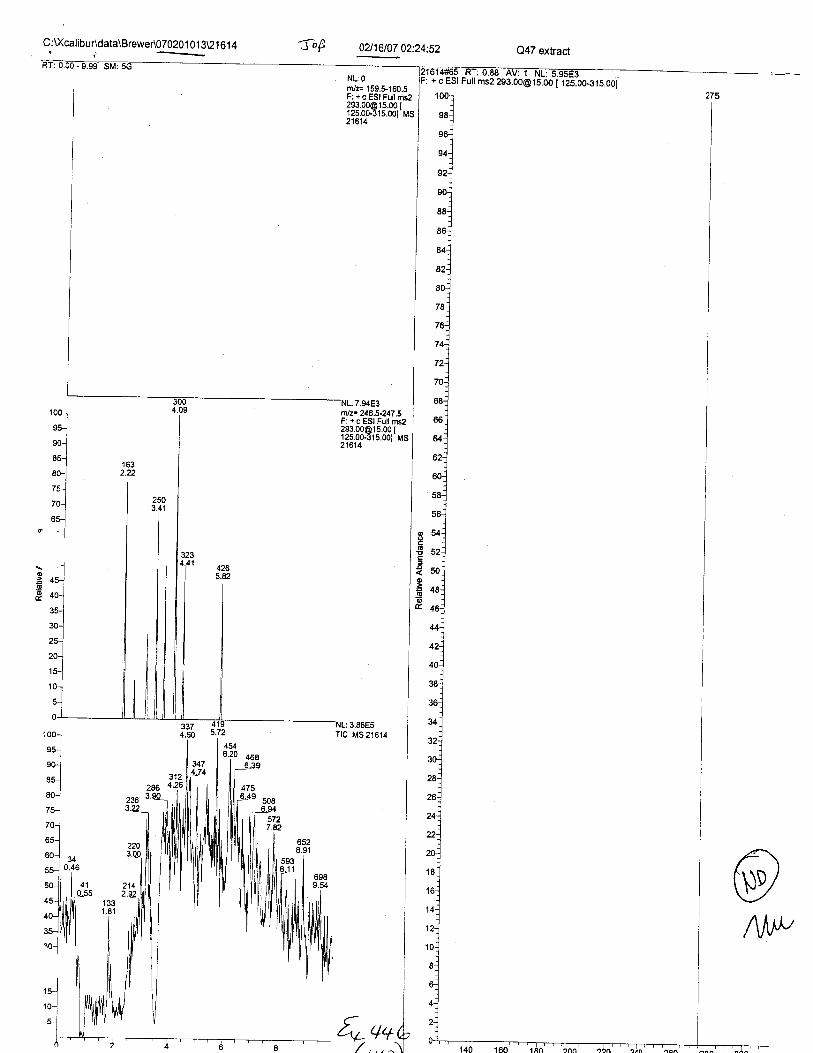
og
C:U(calibur\data\Brewer\070201 O1 3U 1 61 4'i
drp 02116107 02:24:52
7.94E3
NL:0rn/z= 159.$160.5F: + c ESI Fult ms2,o? nn6la
^n r
12s.00-315.001 Ms21614
100
90
85
80
75
70
65.
rnlz= 246.5-247.5F: + c ESI Full ms2
ir,ifl3.sl833,r^
oooE
o€6
NL: 3,86E5Ttc t,ts 21614
Q47 extract
+ c Est Futi mii 2s's.bb@idno"i 1z5.oo-31s.001
@I\IIP
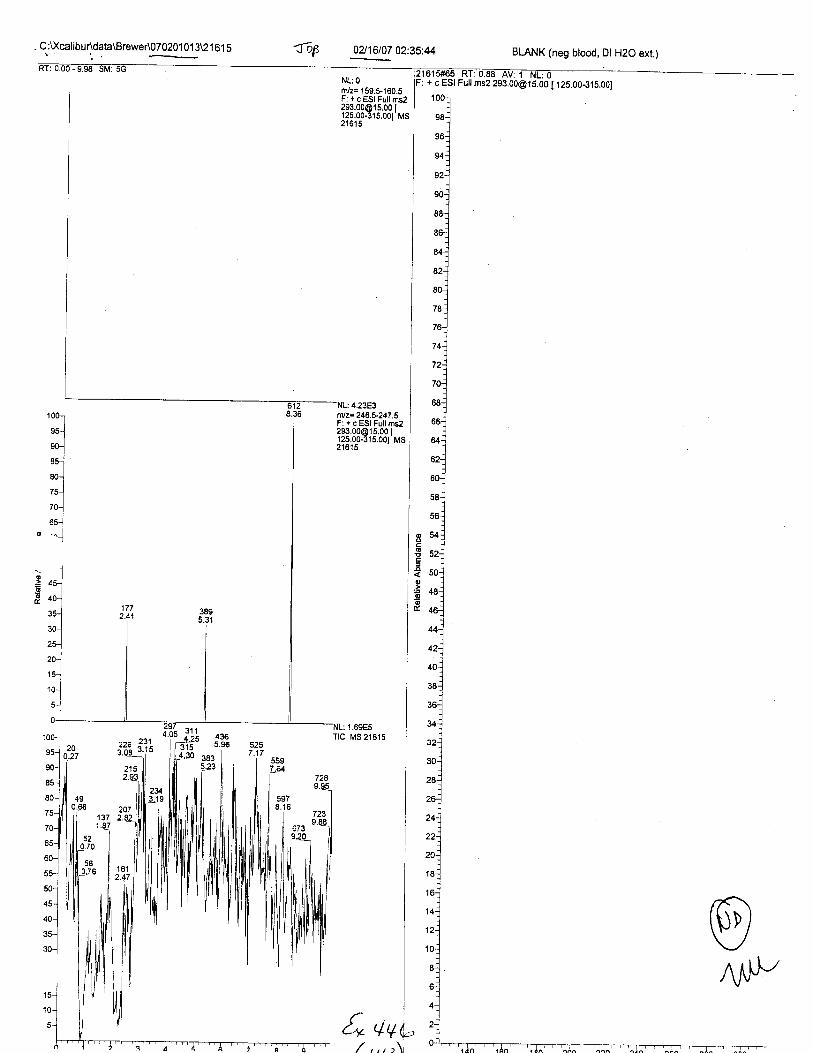
- C :U(calibur\data\BreweA070201 0 1 3U 1 61 5t \., + 02116107 02:35:44 BLANK (neg blood, Dl H2O ext.)
NL:0rn/z= 159.$160.5F: + c ESI Full ms2,ol nn^a E nn I12s_00-315.001 MS216'15
oAlp
li,t,t
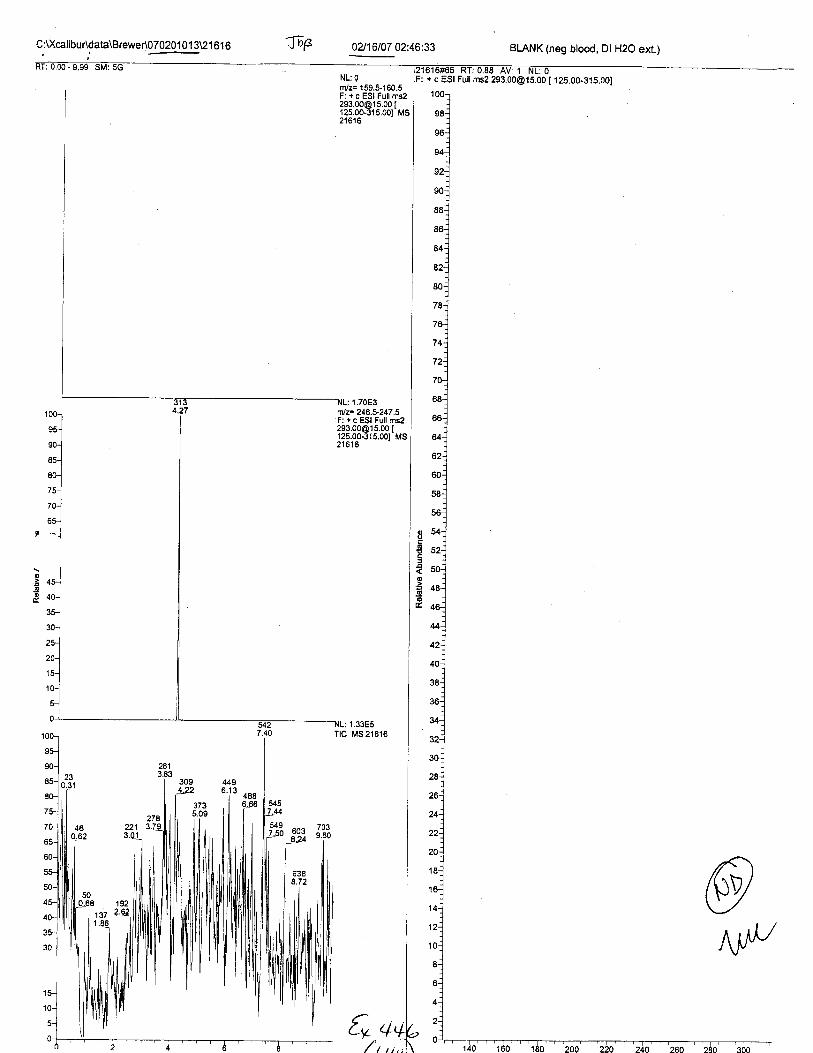
C:lKcalibuAdata\Brewer\070201 0 1 3U 1 61 6 frF 0?/16107 02:46:33
NL: 0nvz= 159.5-160.5F: + c ESI Full [email protected] [125.00.315.001 MS21616
tnlr-246.U247.5F: + c ESI Full [email protected] [12s.00-315.001 Ms216'16
1.70E3
o,:.g!o
ooo
o
.go
1.33E5Tlc lls 2'1616
ti+
BLANK (neg blood, Dl H2O ext.)
+ c ESI Full ms2 [email protected] [ 125.00-315.001
t00
@N,lv
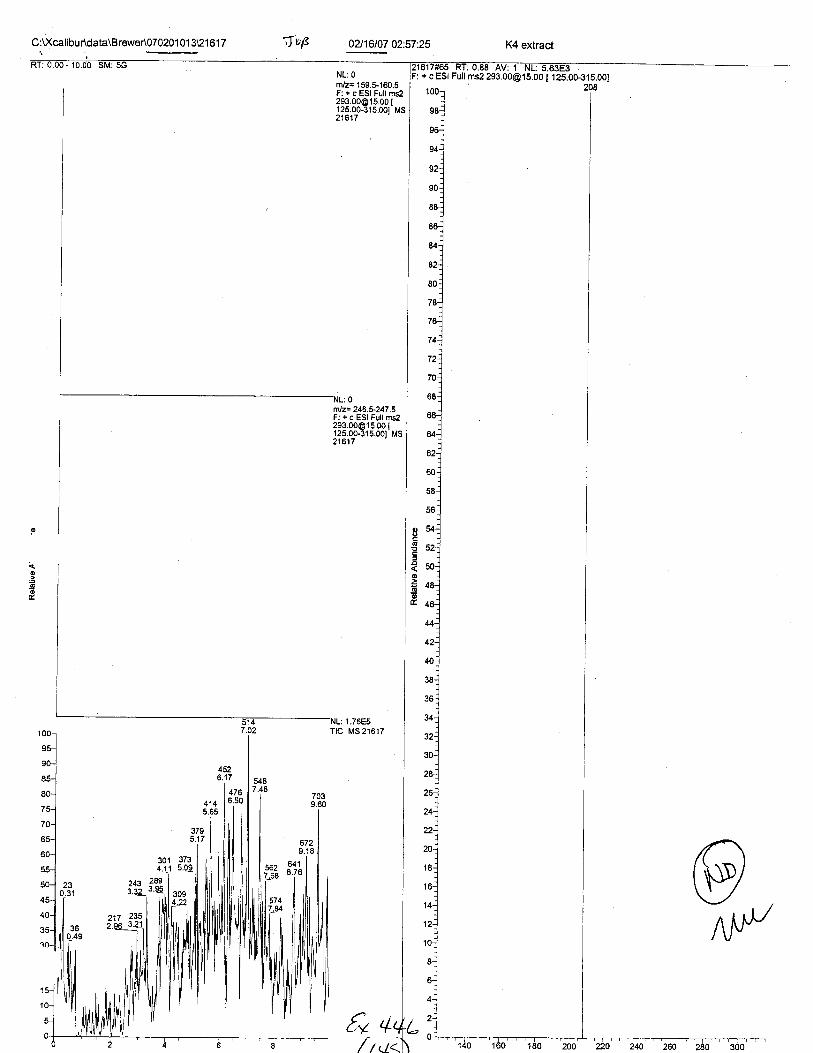
C:\)(calibur\data\Brewer\07020 1 0'l 3\21 61 7 02116107 02:57:25
NL:0r/z- 159.5.160.5F: + c ESI Full [email protected] ['125.00-315.001 Ms21617
fiilz= 246.5-247.5F: + c Egl Pu11 t.,[email protected] {125.00-3'15.001 MS2'1617
1.76E5MS 21617
ooo
aoo.:oo
tit +/r rt
K4 extract
01 /fft5 r{t: 0.66 AV: I NL: 5.63E3+ c ESI Full ms2 293.00@ t5.00 [ 125.00-315.00]
@Aj,P'

BLANK (neg blood, Dl H2O ext.)
i c ESI Full ms2 [email protected] [ i25.o0-3i5.ool
C:Vcalibur\data\Brewer\07020101 3\21618 :floyg 02t16t07 03:08:17
rn/z= 'l59.$.160.5F: +cESl [email protected] [125.00.315.001 MS21618
1001
ru-l
ro-1
ro-]I
ru-l
70-J
^.-l--lI "n_l

C.:\Xcalibur\data\Brewer\070201 01 3U 1 6 1 9 fttF o2t16tot o3:1e:12 BLANK (neg blood, Dt H2O ext.)
NL:0nvz= 159.5.160.5F: + c ESI Full ms2,ol nn6r a nn r
125.00-315.001 MS2't619
10(
oa
80
70
rrlJz=246.5-247.5F: + c ESI Futl ms2
?:33393#rr^
A AOEt
: {./ /ECTtc Ms 21619
oo€E
foo
-=6dtr
tr'/
i ; ; l-sl ini '-ii zg'g.bbtb iiio' r I 2s.00-3 I 5.00I
@AtN
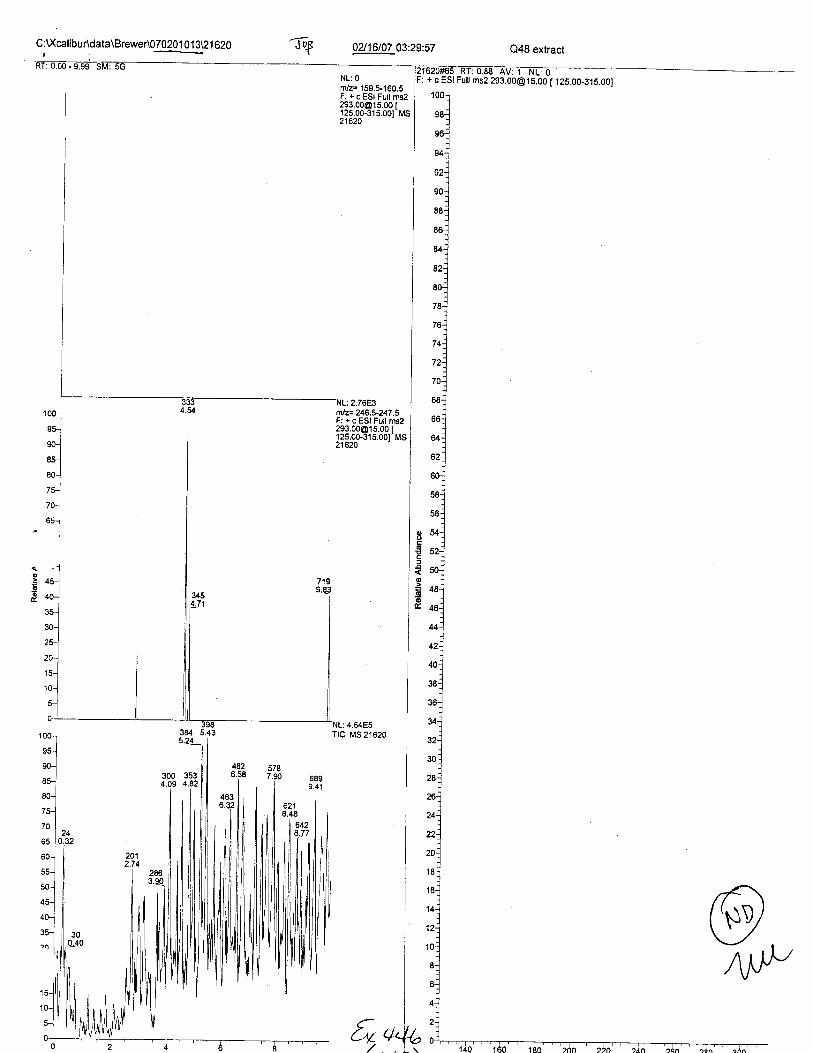
+ c ESI Full ms2 [email protected] [ 125.00-315.001
@,/\Ilv
C:\Xcalibur\data\Brewer\070201 0 1 3\21 620tL
fi4 oz16to7 o3.29:s7
NL:0nvz='159.$'160.5F: + c ESI Full [email protected] [125.00-315.001 MS21620
laa7.90
o
;

E
C:U(calibur\data\BreweA070201 0 1 3\21 621_ T-ry 02116107 03:40:49 BLANK (neg blood, Dl H2O ext.)
NL;0rvz= 159.5.160.5F: + c ESI Full msa
!i!1{38r33&',.
: /./cEJ1001
nlrol
"-lro']
tulto-l
6sir -^-l
rnlz= 246.9247 .5F: + c ESI Full [email protected] [125.00-315.001 MS21621
oo6
o.:-s!o
flc Ms21621
fl,^ 3ll
%,{+ v
+ c ESI Full ms2 [email protected] [ 125.00-315.001
/t , /tt
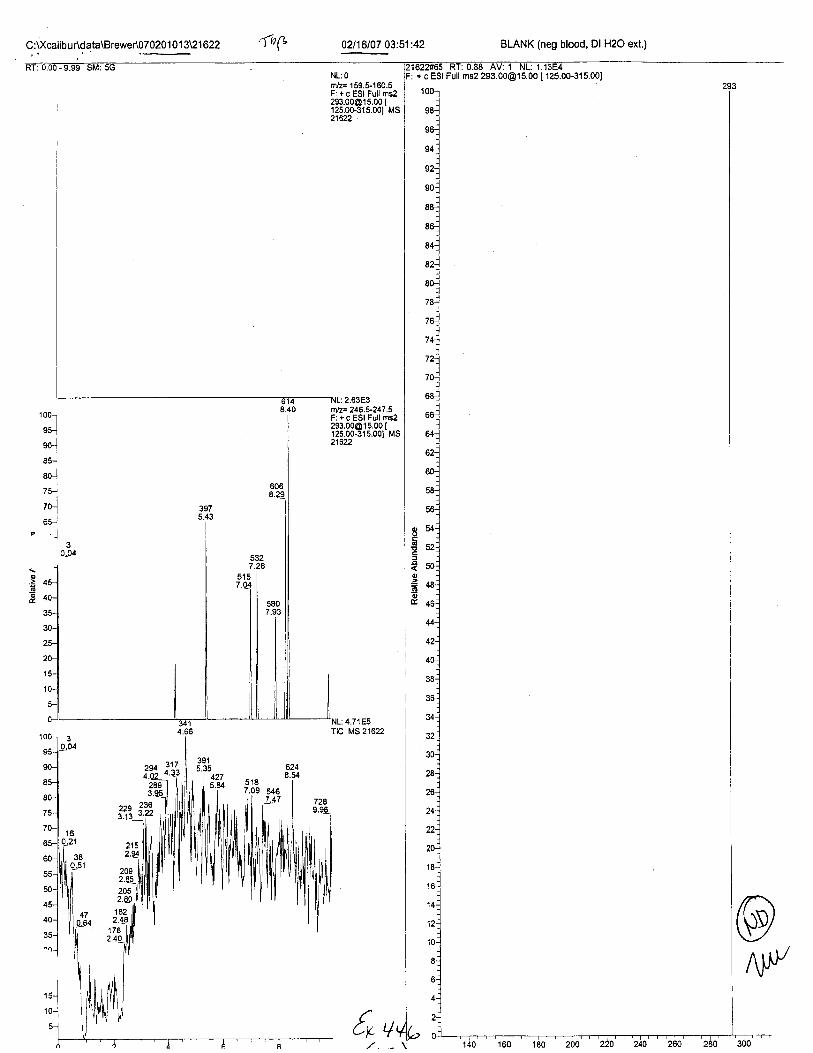
C:D(calibur\data\BreweA070201 0 1 3U1 622 {n(t 02116107 03:51 :42 BLANK (neg blood, Dl H2O ext.)
NL:0m/z= 159.$160.5F: + c P51 Pr11 [email protected] [125.00-315.001 MS21622
Z.OJEJ8.40 mh=246.5-247.5
F: + c ESI Full [email protected] [125.00.3'15.001 Ms21622
NL: 4.i'1E5rc Ms21622
oo
o'aoo
3915.35
| 427I 5.84 5'18
7.09 546
209z.w20s
5JZ7.28
3.?2
lttzzfttt t{t: u.66 Av: 1 NL: 1.13E4: + c ESI Full ms2 [email protected] [ 125.00-315.001
54
38
36
34
@rus

C:U(calibuAdata\Brewer\07020 1 01 3\21 623
4.42
02116107 04:02:32
NL:1.33E5n/z= 159.5-160.5F: + c ESI Full [email protected] [125.00-315.001 MS21623
oo6
o
oE
Ttc Ms 21623
419 4755.72 6.49
Lg-
Pos. Cont. A (MAL EDTA ext.)
+ c ESI Full ms2 [email protected] [ 125.00-315.001
?oJ.hoL,M
\,$v

Q:U(calibuddata\Brewer\070201 01 3U1 624 d"$ 0U16107 04:13:22
NL:0nvz= 159.$160.5F: + c ESI Full [email protected] [12s.00-315.001 MS21624
'NL: 6.06E3nlz= 246.5-247 .5
100-l
^-l"l6J*tqEl*t80J
I71)
.^l^_lol
l
6218 le ees
F: + c ESI Full [email protected] [125.00-315.001 Ms21624
NL:4.63E5Ttc Ms21624
I.z.go
5.El407 l4s.56 lJ4.0€
,/l c -i
BLANK (neg blood, Dl H2O ext.)
324#65 Rr: O.E6 AV: 1 NL:0+ c ESI Full ms2 [email protected] [125.00-315.001
@/W
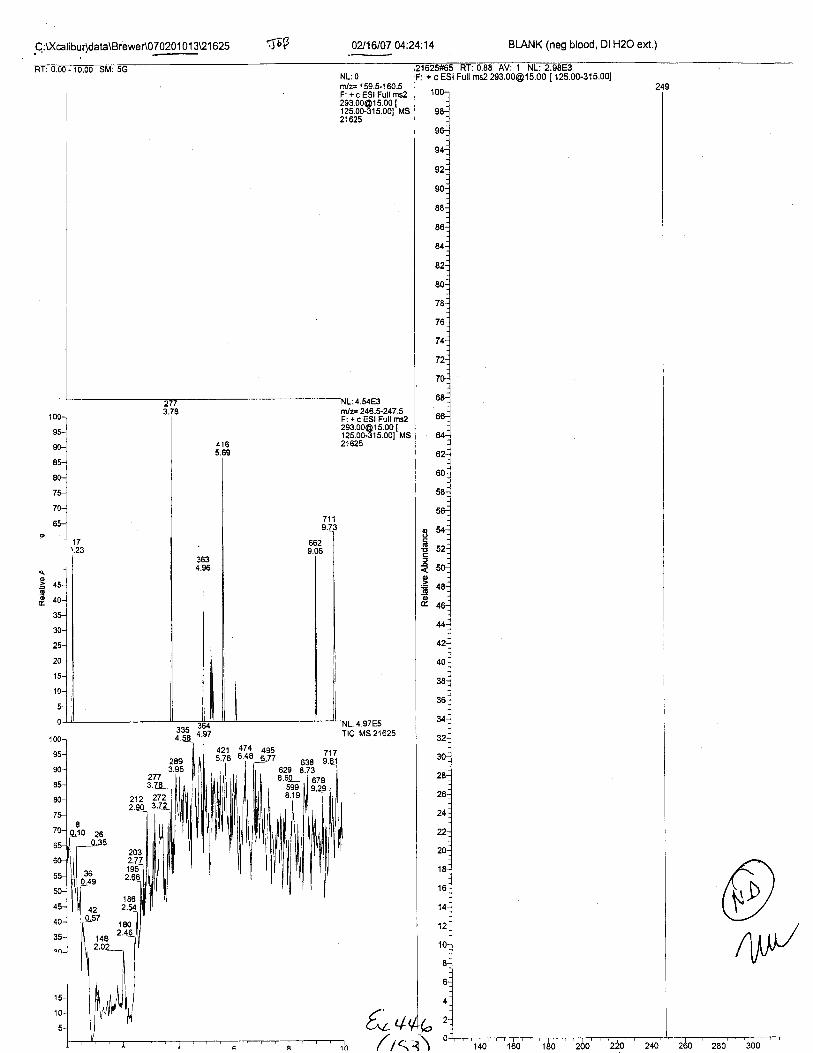
C:Xcalibur\data\Brewer\07020 1 01 3U1 625 0?/16107 04,'24:14
rn/z= 159.5-160.5F: + c ESI Full [email protected] I125.00-315.001 MS21625
tlz= 246.5-247.5F: + c ESI Full [email protected] [125.00-3'15.001 Ms21625
4.54E3
4.97E5Ttc MS 2'1625
oo
oo
o-
4.1
2893.95
ssg | | 9.298.19 ll I
4/ t<,
BLANK (neg blood, Dl H2O ext.)
1625#€5 RT:0.E6 AV: 1 NL: 2.9EE3: + c ESI Full ms2 [email protected] [ 125.00-315.00]
@}IM

Pos. Cont. B (Q49 ext.)
+ c ESI Full ms2 [email protected] [ 125.00-315.001160
@M
teV 0U16107 04:35:06
1 00-l
*trol*l"-l75-l
-^l
^:--l
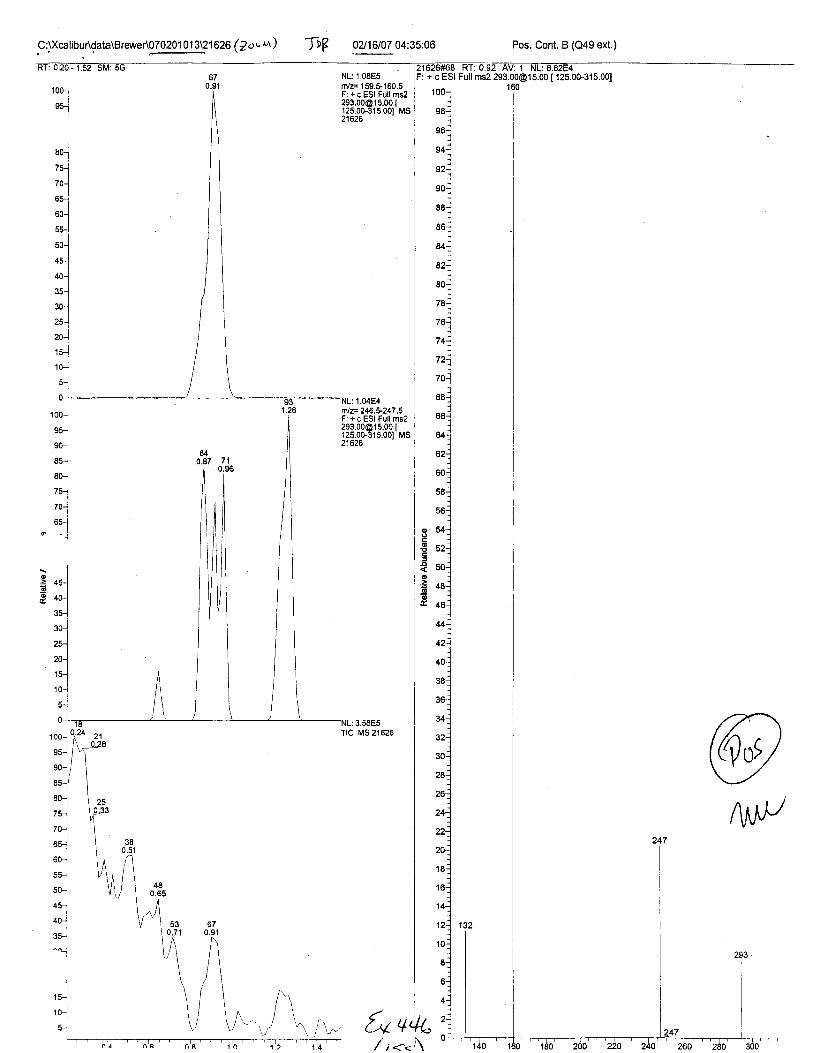
C:XcalibuAdata\Brewer\070201 01 3\2 1626 () o " u) TbF oa't6n7 o4:35:06
NL:1.08E5rdz= 159.$160.5F: + c ESI Full [email protected] [125.00-315.001 MS21626
fflz=246.5-247.5F: + c ESI Full [email protected] [125.00.315.001 MSztozo
{"+/;<
Pos. Cont. B (Q49 ext.)
1
+ c ESI Full ms2 [email protected] [125.00-315.001
@A^jl'J

BLANK (neg blood, Dl H2O ext.)
+ c ESI Full msz 293.00@ 1 5.00 [ 125.00-31 5.00]
@ffN
-ID$ 0A16107 04:45:57
n/z= 159.$160.5F: + c ESI Full [email protected] [12s.00-315.001 Ms21621
NL:1.23E4rnlz= 246.5-247.5F: + c ESI Full [email protected] ['125.00-315.001 MS21627
1001
s5-.1
on-l*l"-l
"n-l;L'-l7o-l
I
--to --l
o
o
€!
o6E
o.Jz6468.84
I
624 |
8.54 I
azJ7.24
4.66E5Ttc Ms 21627
zsz i6^3^ a'Ps
Co+
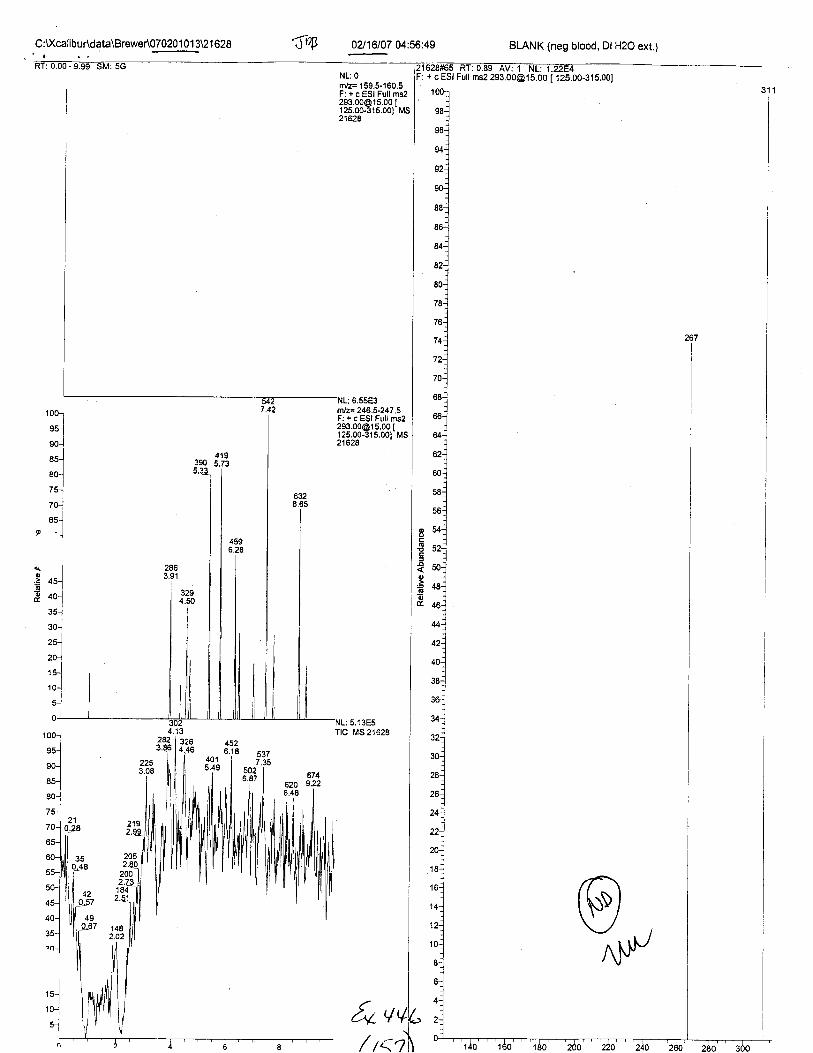
C:Xcalibur\data\Brewer\O7020 1 01 3U 1 628 ',w 02116107 04:56:49
NL:0r/z= 159.5-160.5F: + c ESI Full [email protected] I125.00-315.00] MS2162A
ooG
o.:6o
@
Tlc Ms 21628
,{* q/ i1'7
BLANK (neg blood, Dl H2O ext.)
+ c ESI Full ms2 [email protected] [ 125.00-315.00]
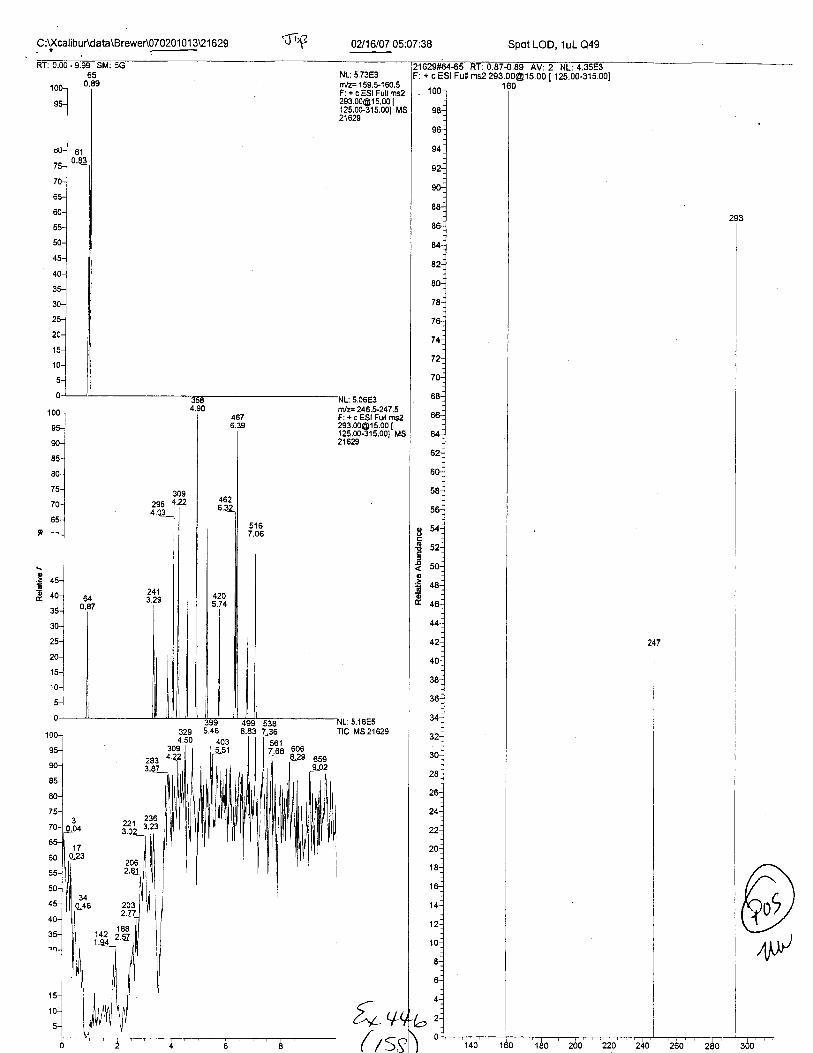
C:U(calibur\data\Brewer\070201 01 3U 1 629
309
4.03 |
zJo
taq
OA16107 05:07:38
NL: 5.73E3r/z= 159.t160.5F: + c ESI Full [email protected] Ms21629
rlz=246.1247.5F: + c ESI Full [email protected] [125.00-315.00] MS21629
1 001
ss-J
ro-l
ru-l
:tr
"-]zo-l
651
P -".1
o
-Eo
ooop
o,:6E
AA?NL: 5.1 6E5Ttc t\,ts 216295.46
i ros4.503091 | 7.68
^o99
2.1
Spot LOD, 1uL Q49
+ c ESI Full ms2 [email protected] [ 125.00-315.001
@Atrr
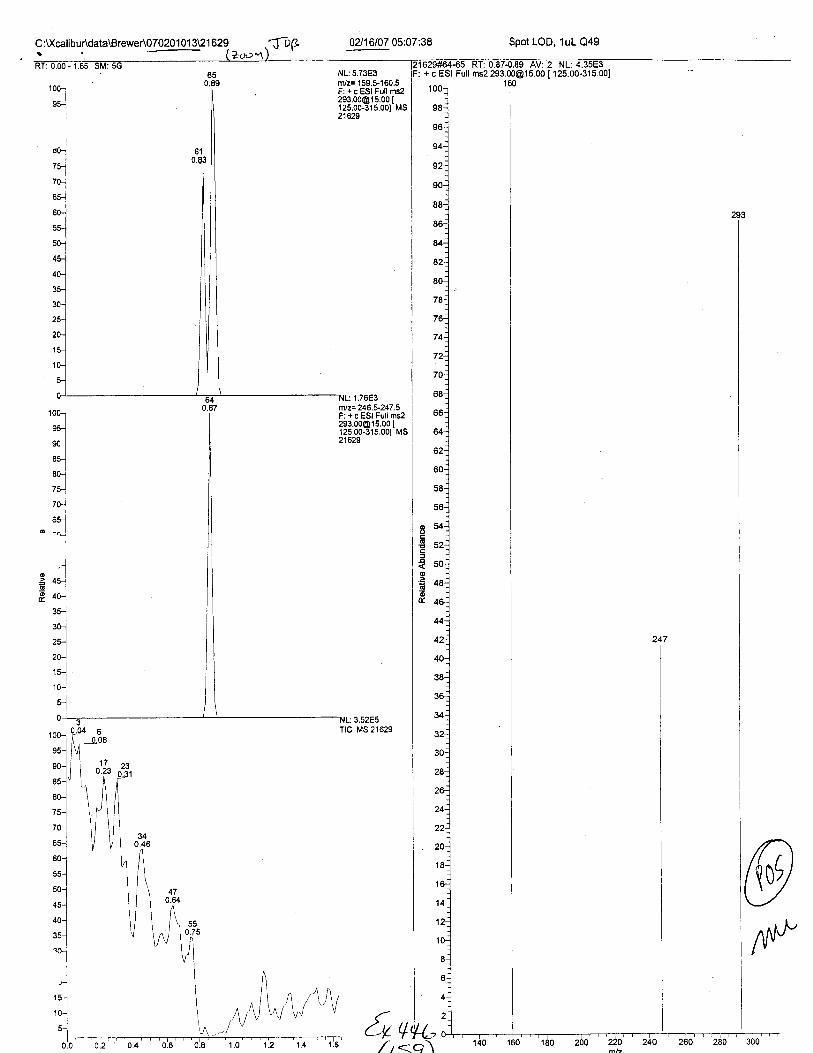
C :U(calibur\data\BreweA07020 1 01 3\21 629I
Spot LOD, 1uL Q49
1629F64-O5 t{t: 0.6/{t.69 AV: Z NL: 4.35EJ: + c ESI Full ms2 [email protected] [ 125.00-315.00]
::r
4*luo-]
'-tro-1
65-l
-"1I,..]
0.64
A/'r
@N
{+q
0.75
,rril'\/4/t <,
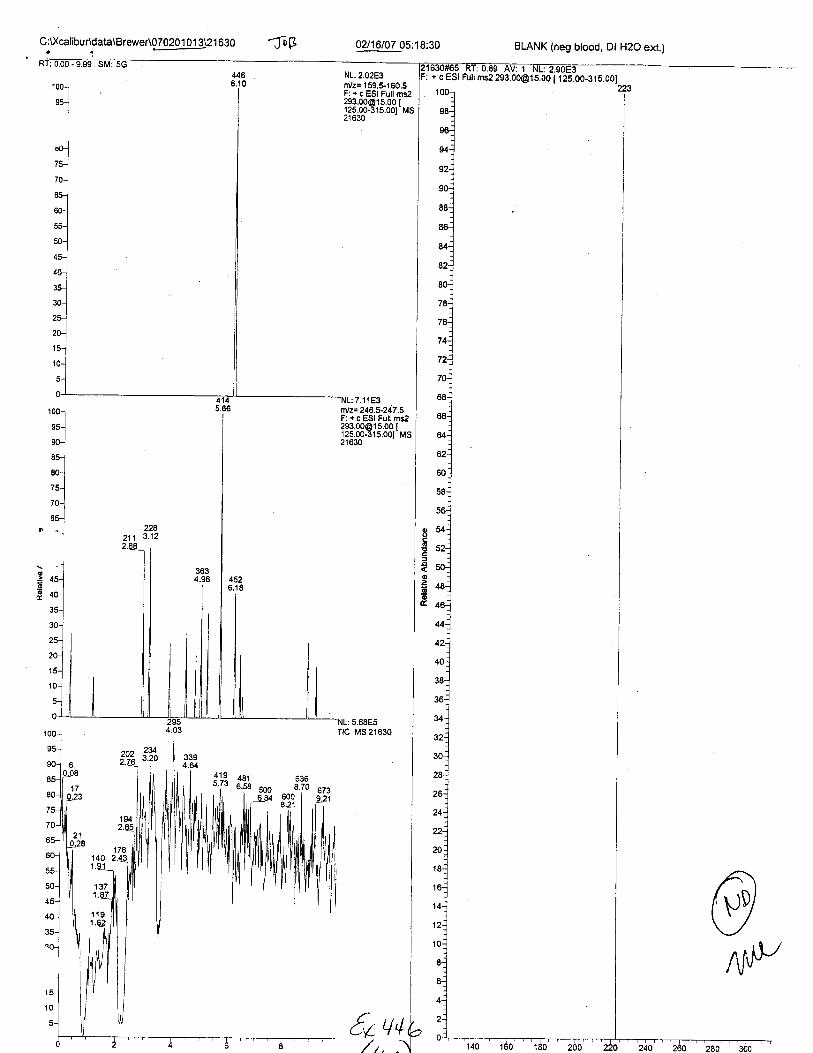
C:\jt(calibur\data\Brewer\070201 01 3U 1 630a . e
-Jnp 02/16/07 05:'18:30
NL:2.02E3rvz= 159.$160.5F: + c ESI Full ms2z5J.W@ tC.UU I125.00-a15.OOl'MS21630
100-
*-]
10c
9€
85
EC
r!70
ooo
a0o
.Eotr
228211 3.12
o5.Eo
: 7.1 1E3n122246.1247.5F: + c ESI Full ms2293 [email protected] [12500-315.001 MS2't630
BLANK (neg blood, Dl H2O ext.)
+ c ESI Fuil ms2 [email protected] [ 125.00-315.00]
@Af\N',
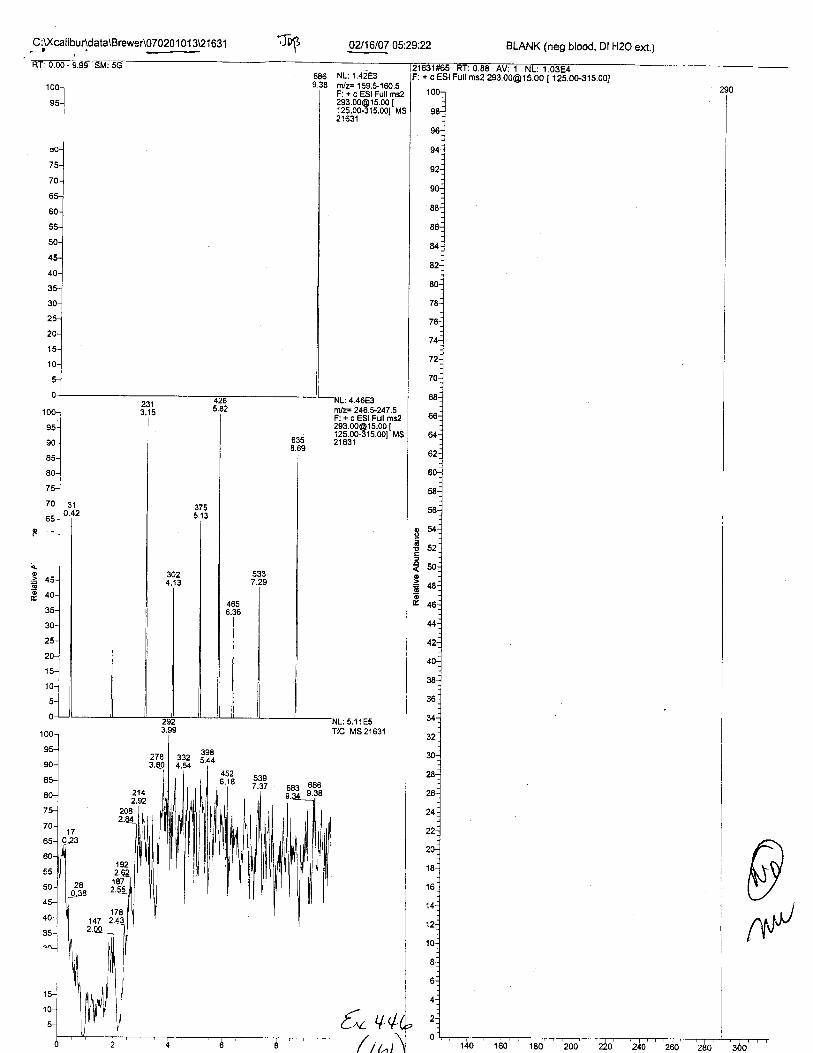
C :U(calibur\data\Brewer\070201 01 3Ul 6314..
1 00f^-l"-l
:Ivp 0A16107 05:29:22
NL: 1.42E3nvz= 159.5-160.5F: + c ESI Full [email protected] I125.00-315.001 MS21631
{u tt|/ t,-t
BLANK (neg blood, Dl H2O ext.)
031t65 RT:0.88 AV: 1 NL: 1.0384+ c ESI Full ms2 [email protected] [ 125.00-315.00]
@r1|\/

C:Xcalibur\data\BreweA070201 01 3U1 632I =---
'05o<J*t67
0.91
,ra 356i.;; 4.s6
f,DF 0U16107 05:40:13
NL: 1.27E4rn/z:159.$160.5F: + c ESI Full [email protected] [125.00-315.001 MSztoJz
1001
'-loJ*l*-]ro-l
tr-]to-l
*i'-l
1orloo-1
^-l,"-.1
ro-l
'1,o-.1
tq!'-l1 0-1
-l
mlz=246.U247.5F: + c ESI Full [email protected] MSz toJz
:4,25E3
: c.u/ E5Ttc Ms21632
{" v.lu/,, -F
461 876618 zY.'eE 561
JOZ
Spot LOD, 2 uL Q49
Z IOJMO X I ; U.YU AV: 1 NL: g.Z/E3F: + c ESI Full ms2 [email protected] [ 125.00-31S.00]

. C:U(calibur\data\Brewer\070201 01 3\2t 632 (2.:v^a ) ar\ 0416107 05:40:13
: 2.30E5Trc Ms 21632
b
oo
f
o6o
fn
NL:127E4nvz= 159.$160.5F: + c ESI Full [email protected] [125.00-315.00t MS21632
NL: 3.51 E3.r,lz=246.5-247,5F: + c ESI Full [email protected] [125.00-315.001 MS2'1632
Spot LOD,2 uL Q49
r oozrco n t ; u.vu Av: t NL: 9.2/Eo: + c ESI Full ms2 [email protected] [ 125.00-315.00]

BLANK (neg blood, Dl H2O ext.)
+ c ESI Full ms2 [email protected] [ 125.00-31S.OO]
@AI\}.v
C:\,Xcalibur\data\Brewer\O7020 1 01 3\21 633 l-s oF 02116107 05:5't:09
m/z= 159.!160.5F: + c ESt Fult [email protected] Ms21633
1001
ro.l
,A ot.L*ll|l^.ll^ll,ll
o *ll
279 3443.81 4.70
2U
a
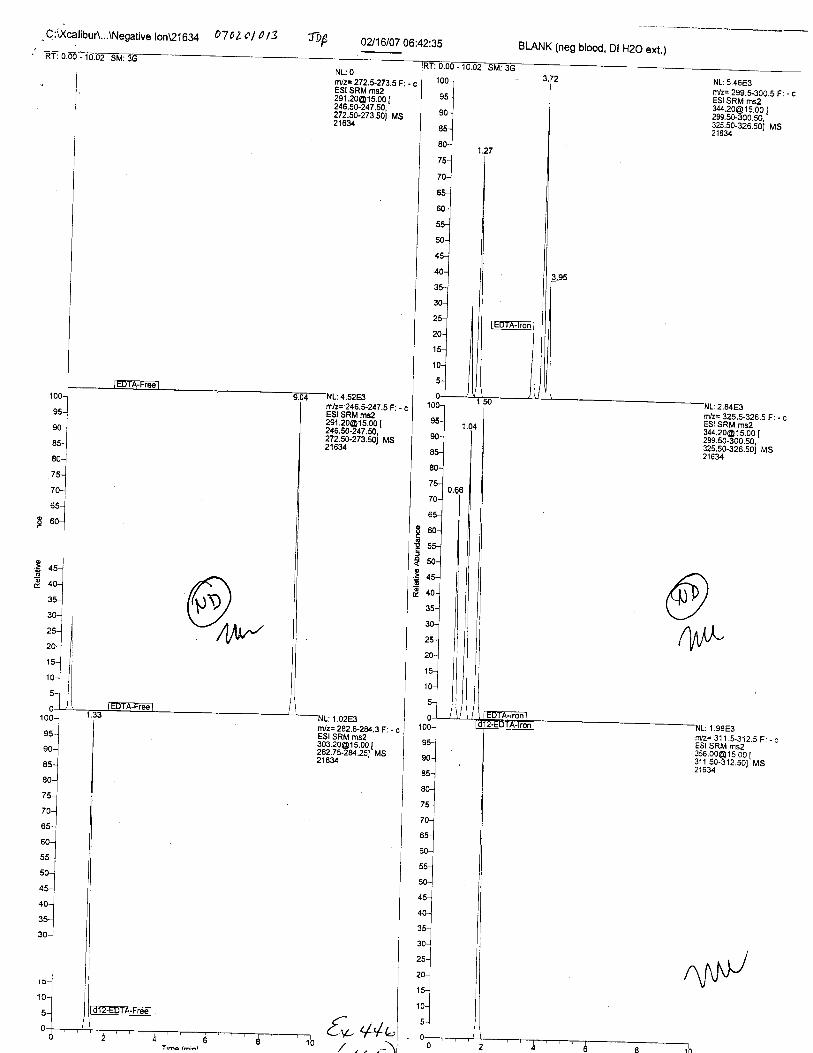
C:'XcalibuA...\Negative lon\21634 A70Zol 0 t3 j-oF02116107 06:42:35 BLANK (neg btood, Dt H2O ext.)
NL:0nlz= 272.5-273.5 F: - cESI SRM [email protected] t246.50-247.50.'272.50-273.soi Ms2163/
NL:4.52E3trlz= 246.$247.5 F: - cESI SRM [email protected].'272.so-273.s0i Ms2163/
m/?= 325.5-326.5 F: - cESI SRM ms2
133339J,133r325.50-326.s01 MS
8oE
"Eo
@n^iL
r/z= 31 1.5-3i2.5 F: - cESI SRM [email protected] I31 1,50.312.501'Ms2163/.
nlz= 282.t1-284.3 F: - cESI SRM ms2
lSiiS.gJfj$r",
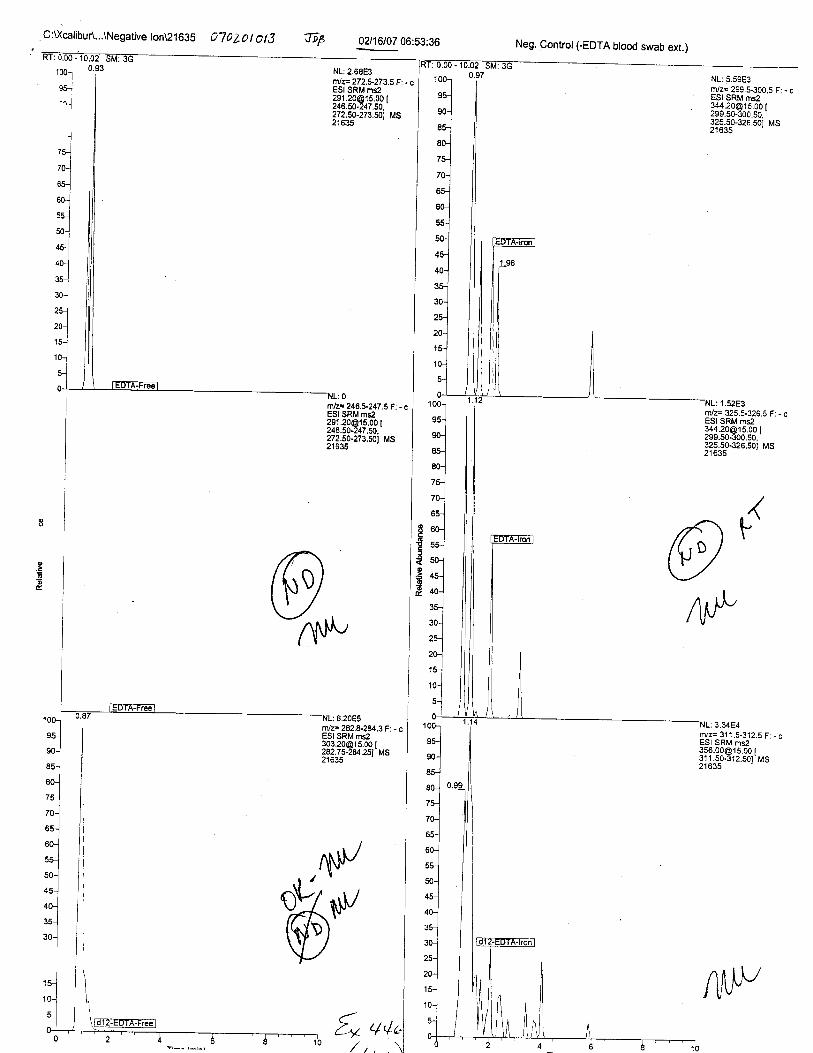
C:\Xcalibu^...\Negative lon!21635 070/.O I Ols 02116107 06:53:36 Neg. Controt (-EDTA blood swab ext.)
100rI*l
-"1--
NL:2.68E3nlz=272.5-273.5 F:. cESI SRM ms229'[email protected] [246.50-247.50.272.50-273.50i MS21 635
rn/z= 299.5-300.5 F: - cESI SRM [email protected] I299.50-300.50.-325.50-326.501 MS21635
@/\,P
o
@
o
AtIt/
ffi,v
/Tr'z= 246.1247.5 F: - cESI SRM [email protected] t246.50-247.50,272.50-273.s01 Ms21 635
ntz= 282.8-28/..3 F: - cESI SRM [email protected] I282.75-2U.251 MS2'1635
100-l
*l*.185-J
'o-ltu-l
1lor-l
uo-J
*luo-]
ou-l
oo-]
ru-]
rol
ntuv
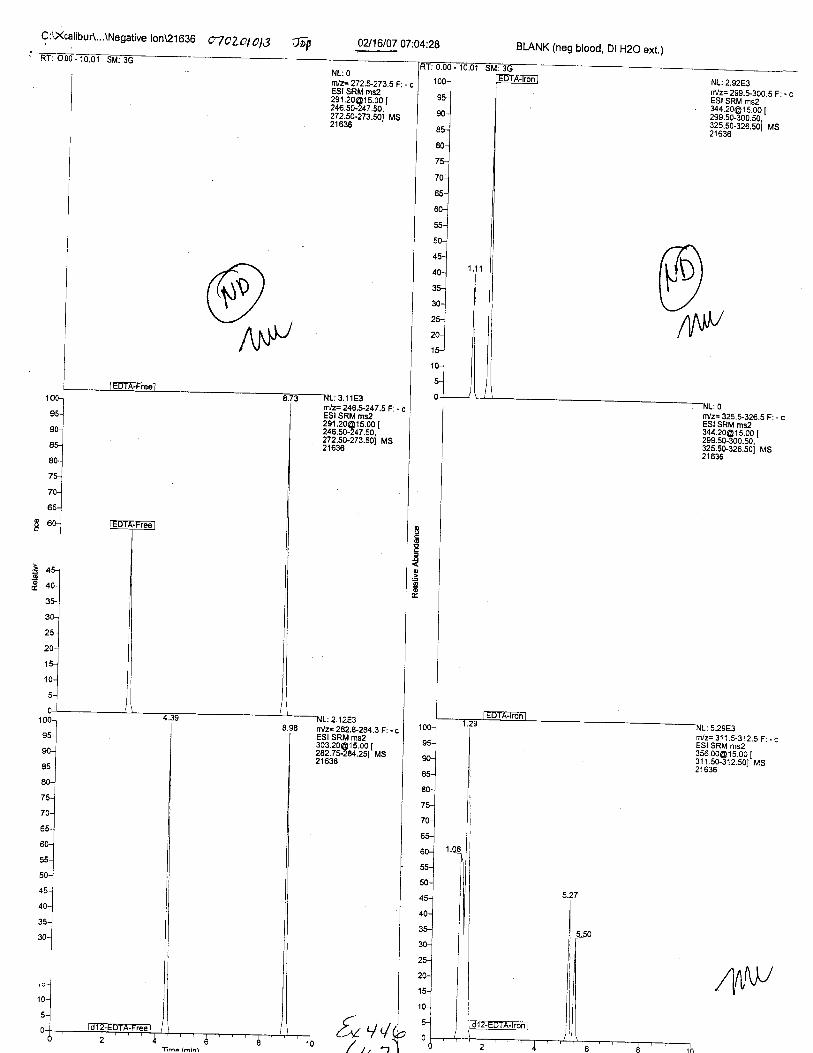
C:D(calibur\...\Negative lon\2 1 636 e7ozotol3 Jop 0?J16107 07:04:28
f.vqa/'t, z
BLANK (neg blood, Dt H2O ext.)
%
rvz:299.$300.5 F: - cESI SRM [email protected] t299.50-300.50.'325.50-326.50i MSz toJo
tol
'lno-J
ru-l
80'j
zs-]
zo]^-lol
s oo-]clo
€@
@
nlz=246.5-247.5 F: - cESI SRM ms2
lil:33.91f 33t272.s0-273.501 MS21636
rn/z= 282.8-2U.3 F: - cESI SRM nrsz
l3l?&gJfi3'r",21636
rvz= 325.5-326.5 F: - cESI SRM msz
3d3339J333r325.50-326.501 MS
ANW
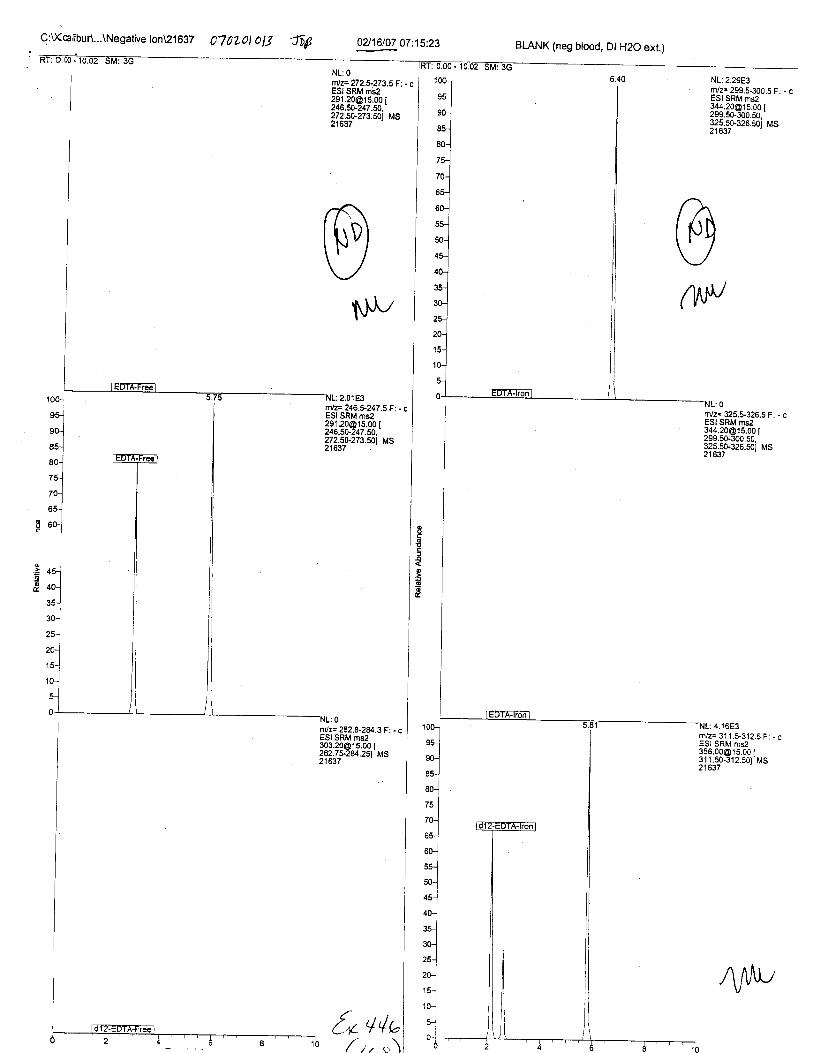
C:Xcalibur\...\Negativelont21637 077LOlO13 J'lp 0?/16107 07:15:23
NL:0flilz= 272.5-273.5 F: . cESI SRM [email protected] l246.50-247.50,272.s0-273.501 MS21637
BLANK (neg btood, Dt H2O ext.)
1001
sslro-l
ru'l
ro-l
"-l,o1
*-1
I 60-l
fitlz= 282.8-284.3F: - cESI SRM [email protected] I282.7s-2U.251 MSltoJt
8d
o
-qo
, oo-]
*ls0-1
es-]
Eo-]
ruJ
70J
.s-]
.o-]-- |*l*-l4s-..1
."]^-l"'-l3q,u)
I
20i,
''-]ro-]
F
NL:4.16E3rn/z= 31 1.$,312.5 F: - cESI SRM [email protected] I31 1 .50.312.50t' MS
frt 4,/r./,, u\
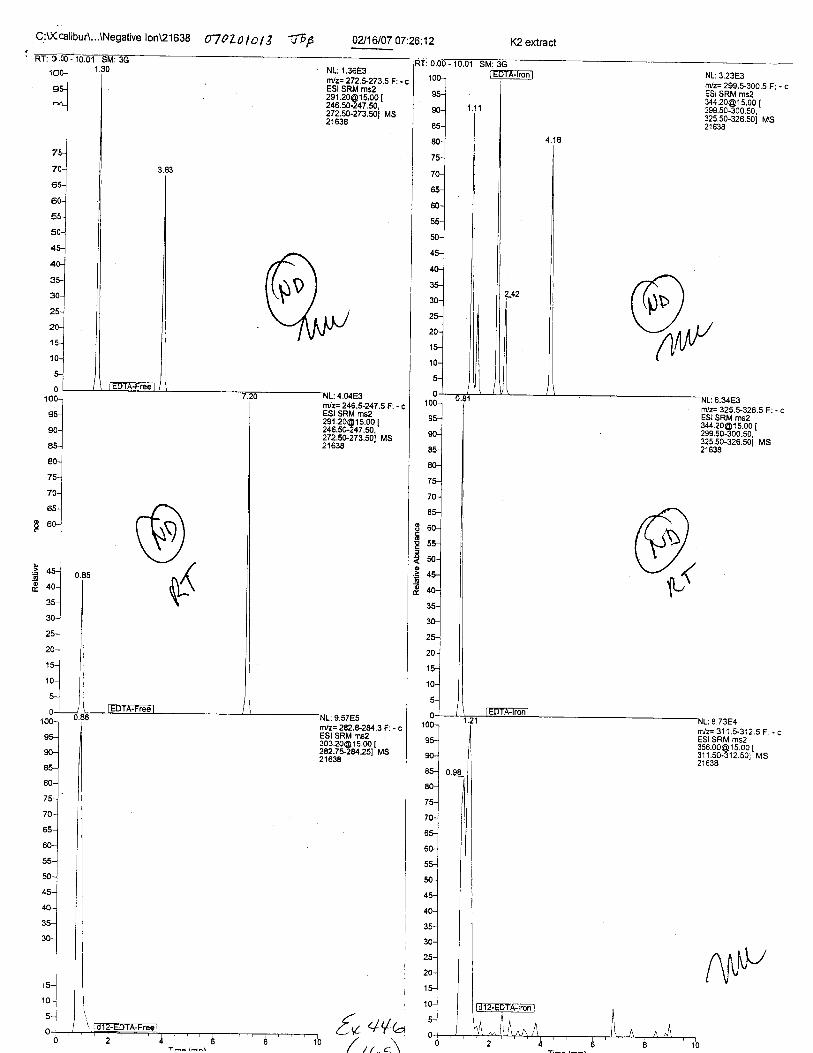
C:D(calibur\...\Negative lon!21638 A7 OLl I o I A -tD p 0?16107 07:26:12
,o5e$l
NL: 1.36E3rnlz= 272.5-273.5 F: . cESI SRM ms2291.20@15,00 [246.50-247.50,272.s0-273.501 MS21638
4.04E3ftlz= 246,5-247 .5 F: - cESI SRM [email protected] [246.50-247.50,272.50-273.s01 MS2'1638
fflz= 282.&2U.3 F: - cESI SRM [email protected] [282.7r2U.251 MS21638
nvz= 325.5-326.5 F: - cESI SRM [email protected] [299.50-300.50.325.50-326.501 MS21638
q1001
nl*-l
:fi:1,"-l
'luo-]
--l-^l--lou-j
40-J
^-l*l30-l
I
8.73E4m/z= 31 1.5-312.5 F: - cESI SRM msz3s6.00@ 1 5.00 [311.50-312.501 MS21638
{ur 4(

Q:U<calibur\...\Negative lon\21639 01A7Ol 0l 3 JTP 02116107 07:37:08 BLANK (neg blood, Dl H2O ext.)
NL:0rnlz= 272.5-273.5F: . cESI SRM msZ291.20@'t5.00 |246.50.247.50.272.50.273.501 MS21639
r lz=246.5-247.5F:-cESI SRM [email protected],272.50-273.501 MS21639
m/z= 325.5-326.5 F: - cESI SRM [email protected] I299.50-300.50,325.50-326.501 MS21639
m/z= 311.5.312.5 F: . cESI SRM [email protected] [311.50-312.501 MS21 639
@4,ur'
8c
o
.Eo@
Aw
rr'z= 282.9-2U.3 F: - cESI SRM [email protected] I282.75-284.251 MS21639
1 001
--l*-l--t*l80-l__l, "-l
ro-j
rul*-l*i*lou-]
,o-l
*l.v-1
I
1.'i[+q
./'l1
4[v
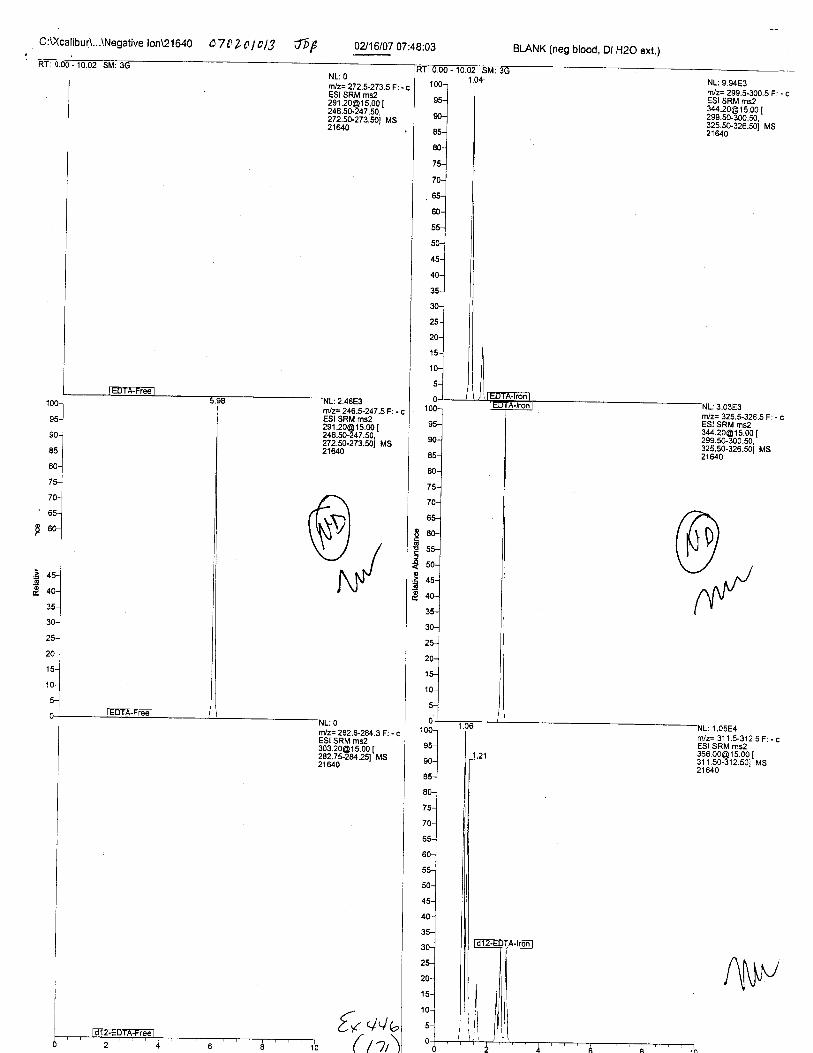
C:\XcalibuA...\Negativeton\21640 C70Z0l0lJ 16p 0?J16t07 07:48:03 BLANK (neg blood, Dt H2O ext.)
@n0t"
6
@
.p
NL:0tr]/z=272.5-273.5 F: - cESI SRM [email protected],272.50-273.501 MS21640
NL:9.94E3n/z= 299.5-300.5 F: - cESI SRM ms2
133339J333r32150326.501 MS
m/z= 325.5-326.5 F:. cESI SRM [email protected] I299.50-300.50,325.50-326.501 MS216/0
1.05E4NL:0nlz= 282.8-284.3 F:ESI SRM ms2 nVz= 31 1.t312.5 F: - c
ESI SRM [email protected] MS21 640
[email protected] [2?21s-2u.2sl Ms
{* aatt /lr
At\lv

NL:5.66E3nvz= 299.$300.5 F: - cESI SRM [email protected] I299.50-300.50.'325.50-326.501 MS21641
rr'z= 246.5-247 .5 F: - cESI SRM ms2291 [email protected] I246.50-247.50,272.50-273.501 MS216/.1
C:tXcalibur\...\Negative ton\21641 0l0LOl p 13 a6p 02116107 07:58:57
NL: 5.61 E3rlp 272.5-273.5 Ft - cESI SRM [email protected] [246.50.247.50,272.50-273.501 MS21€/1
| 001
95-..1
"l
NL:2.19E3n/z= 325.5-326.5 FESI SRM [email protected] [299.50-300.50,325s0-326.501 MS
^KlL'r '.\,('r.iD
t ti I L /, ttl uv@
nru^1
NL: 8.52E:5fiilz=2828-2U.3F'. - cESI SRM [email protected] I282.75-2U.251 MS21€/1
100-.]
ru-l
'o-l*-lultu-1
70-..1
",]n ^o-l
*"1I
:l*lrnl--l'-l,o-.1
ru-l
,o-]
5!
o11 001
*lSJ
^-lo"-l
*-l
::l,"1^-l"'l60J-- |*l*l45-1
oo-l
as-..1
r-lI
A\1^',

C:\Xcatibur\...\Negativeton\21642 OlLLOl0lJ Jnl 0?/16107 08:09:50
trvz= 325.5-326.5 F: - cESI SRM [email protected].'325.50-326.501 MS21d42
BLANK (neg blood, Dl H2O ext.)
@,/r{
oo6
€@
.go0
nv
rnlz= 272.5-273.5F: . cESI SRM [email protected] [246.50-247.50.2z2.so-273.50i Ms216p2
5,r (4,
1 00-
'JI,olru-l
80-l
t*lI
to-l
-l8 eo-l
m/z= 246.5-247.5F:. - cESI SRM [email protected] I246.50-247.fi.272.s0-223.50i Ms21642
rnlz= 282.5284.3 F: . cESI SRM [email protected] [282i5-2U.251 MS
0J1001
95i
*_l*-lso-l
ruJ
70!,
^-loc-
.o-]I
s5-J
so-l
ou-l
oo-l
ru-1
"-l
/'rA z\

C:u(caliburl...\Negarive lon\21643 0T0Zo/ot3 lTp 02116107 08:20:45
m/z= 299.5.300.5 F: - cESI SRM [email protected]
I299.50-300.50.'325.s0.s26.50i MS216/3
rtlz= 246.5-247.5 F: - cESI SRM [email protected] [246.fi-247.50,272.50-273.501 MS21643
@r$/
s.89E3nlz=282.8-2U.3'F:, - cESI SRM [email protected] [282.7*2U.251 MS21€/.3
BLANK (neg blood, Dt H2O ext.)
m/z= 325.5-326.5 F: - cESI SRM [email protected] [299.50-300.50.325.50-326.501 MS21€/3
@^N

C:lXcalibur\...\Negativeton\21644 0ZoZolo/3 JDB 0?/16107 08:31:35
Nz= 272.5-273.5F: - cESI SRM ms2
ill:339ii33,t272.50-273.501 Ms
rrvz= 246.$247.5 F: - cESI SRM [email protected] I246.50-247.50.-zzz.so-zz:.soi tr,ts2'tu4
K3 extract
rvz= 299.5-300.5 F: - cESI SRM ms2
133:33€J333t325-s0-326 501 MS
%1.24E6
*{}
od
o
@o %
1.09E5rdz= 282.t]-284.3 F: - c
:3!?39;figr".
,Y4
rvz= 311.5-312.5 F: - cESI SRM [email protected] I311.50.312.501 Ms
/'t'?.
J\I},

C:U(calibuA...\Negative ton\21645 01 0L0 i O 13 Tnp 0U16107 08:42:24 BLANK (neg blood, Dt H2O ext.)
NL:0mtz= 272.5-273.5 Fi - cESI SRM [email protected] I246.5G247.50.'272.50.273.501 MS216/5
rn/z= 299.$300.5 F: - cESI SRM ms2
!i3:338J'133t
!ffi-ezo.sot us
@nN
oo
E
o
oo
@AI.J
5y:4a
trlz= 246.*247.SF:. cESI SRM ms229',[email protected] MS2't 645
, tot2m/z= 325.5326.5 F: - cESI SRM [email protected] t299.50-300.50.-325.50-326.501 Ms216/.5
m/Sz= 282.&284.3 F: - c
;if,3.gJ."'3lr^
nVz= 311.$312.5 F: - cESI SRM [email protected] I311.50-312.501'MS21645

C:Uftalibur\...\Negative lon\21646 070LO t Ol3 frg 02116107 08:53:19 BLANK (neg blood, Dt H2O ext.)
100-lI
J3l
."1-
NL: 4.51 E3NF272.5-273.5Ft - cESI SRM [email protected] [246.50-247.50.272.50-273.501 MS216/,6
NL:6.52E3rn/z= 299.5-300.5 F: - cESI SRM msz344.20@1s,00 I299.50-300.50.'32s.ss326.50i Ms216/6
: 4.2'1E3mlz= 246.5-247 ,5 F: - cESI SRM [email protected] [246.50-247.50,272.50-273.501 MS2't646
NL: 9.77E:3
mlz= 282.8-28/..3Fi - cESI SRM [email protected] [282.75-2U.251 MS21€,!6
4*b
nvz= 3'l1.5-312.5 F: . cESI SRM [email protected] I311.s0-312.501 MS21646
@Alt'"
oIo
{oFgo0
r*/
10(
65
75
7A
65
OU
55
4n
45
40
30
z,t ^I\J'p
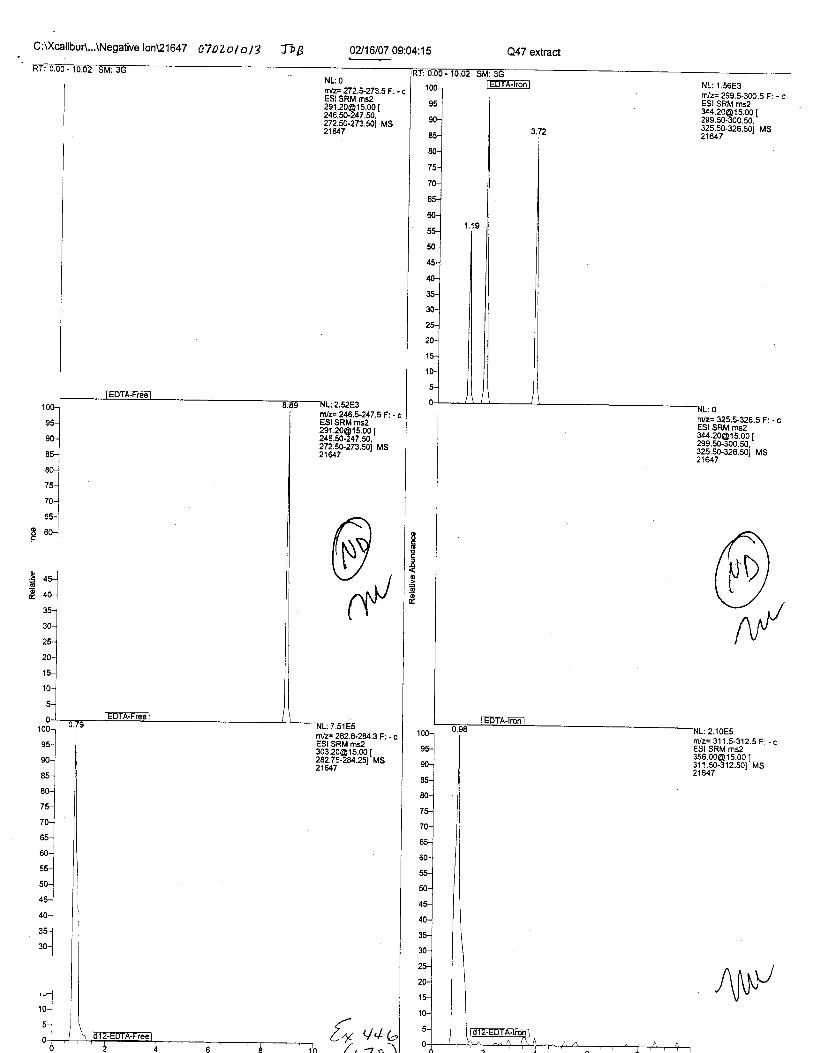
02J16107 09:04:15 Q47 extractC:\Xcafibtlr\...\Negative lon\2,|647 Al|Lot ol3 ftA
rvz= 299.5.300.5 F: - cESI SRM [email protected] I299.50-300.50,'325.5G326.501 MS21647
rniz= 325.t326.5 F: . cESI SRM [email protected] [299.50-300.50,325.50-326.50t MS21647
@tv
@flv
NL: O
f,tlF 272.+273.5F: - cESI SRM [email protected] MS21€/7
m'lz= 246.5-247 .5 F: - cESI SRM [email protected],272.50-273.501 MS21647
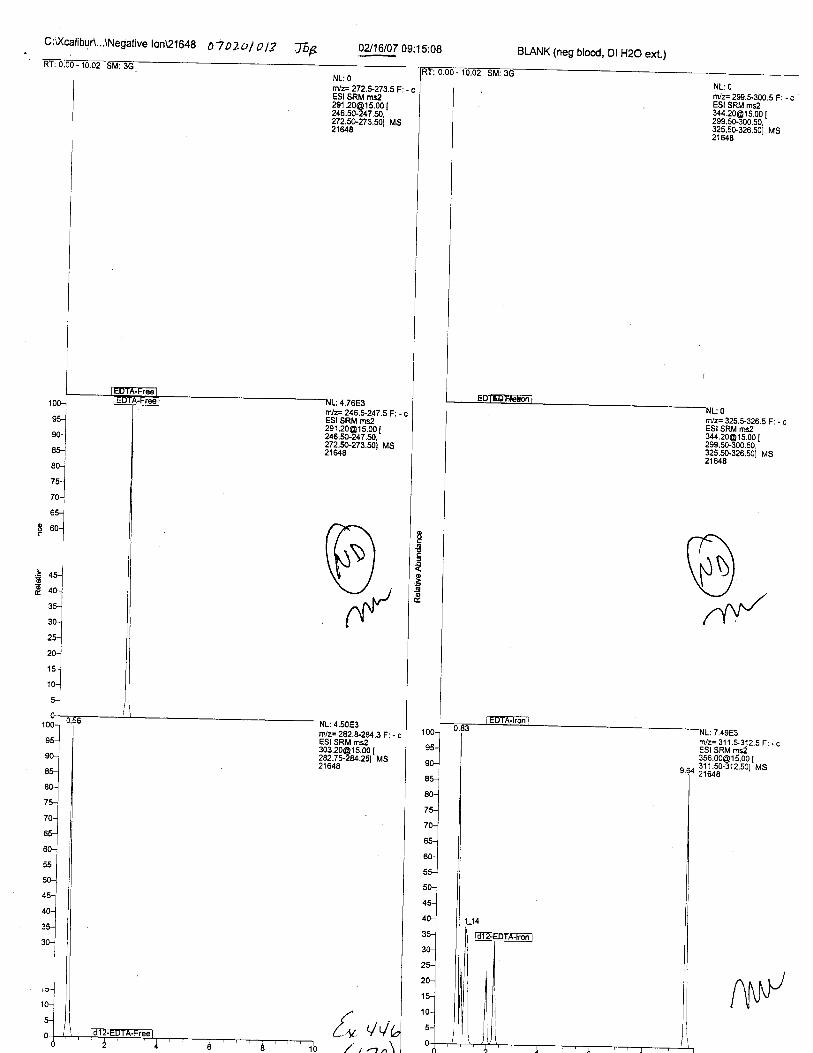
C;iXcalibuA...\Negative lon\21648 0702o/ Ot? ftp 02J16107 09:15:08 BLANK (neg btood, Dt H2O ext.)
1001
nu-J
*-l
'lro-l
75-l
?o-l
6s-l
8 oo-l'l
NL:0rj/z=272.5-273.5F: - cESI SRM ms2291 [email protected] r246.s0-247.50.'272.50-273.s0t Ms216/.A
mE= 246.5-247.5 F.. - cESI SRM [email protected] t246.so-247.s0.'272.50-273.501 MS216/.8
n,lz= 282.9-2U.3 Fi - cESI SRM [email protected] I282.7U2U.251 MS
[" q'/
NL:0rilz= 299.1300.5 F: - cESI SRM [email protected] MS21&t8
rvz= 325.5-326.5 F: . cESI SRM [email protected] r299.50.300.s0.'325.s0-326.501 MS21il8
wo
o
@
oo@
nN'
: 7.49E3rvz= 31 1.S312.5 F: . cESI SRM [email protected] Ms
/,nn\
f'ftl,/
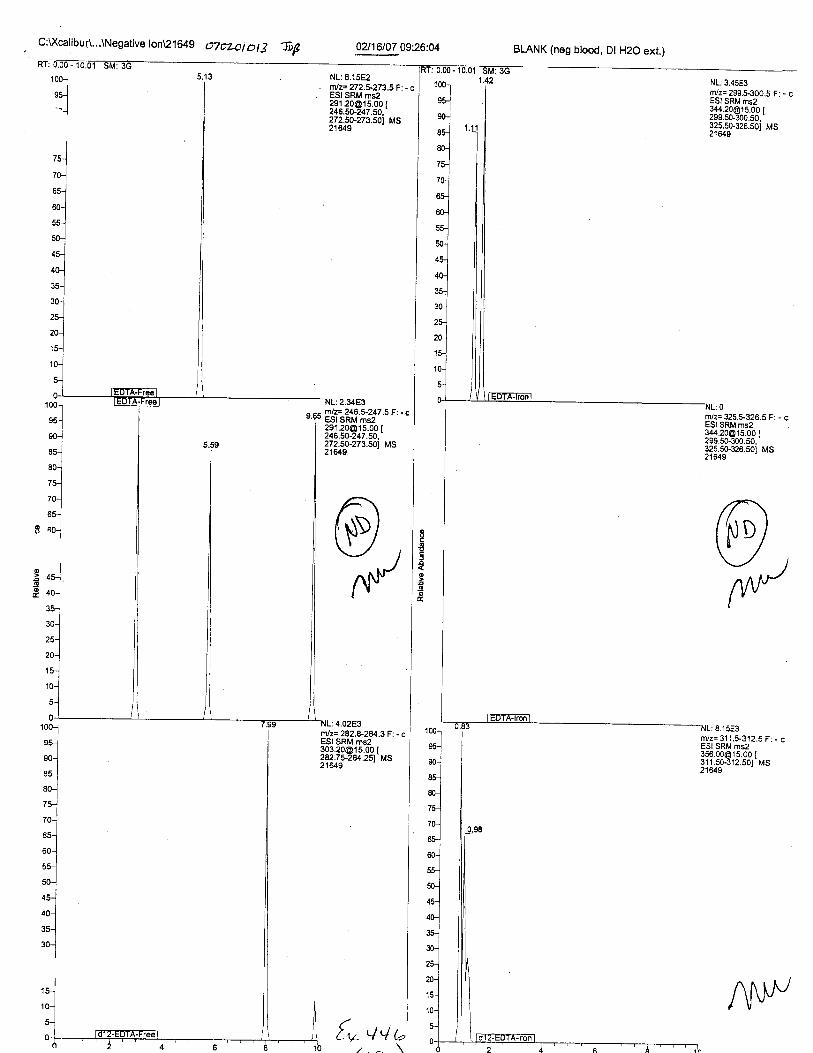
BLANK (neg blood, Dt H2O ext.)C:U(calibur\...\Negative lonl21649 CI7oLol OIZ 6g 0A16l07 09:26:04
NL:8.15E2rrllz= 272.5-273.5 F: . cESI SRM [email protected] [246.50-247.50.272.50-273.501 MS21€.4.9
2.3183
'iil
t.F Psiit*1f;L:'jt s t''"
| [email protected] [email protected] [246.50-247.50,27250-273.s01 MS
1001
,5-l
e0-J
*-l80-..1
t;
^]6qI *-]
@Not
ao
.Eo
@nr/
rol"-lo^J--l^-l""1ro-1
trJ
1t::ro"l*lqnJ*loul
ool
*lro-1
illz=282.8-284.3F: - cESI SRM ms2303.20@ | s.00 I282.75-284.251 MS2'tu9
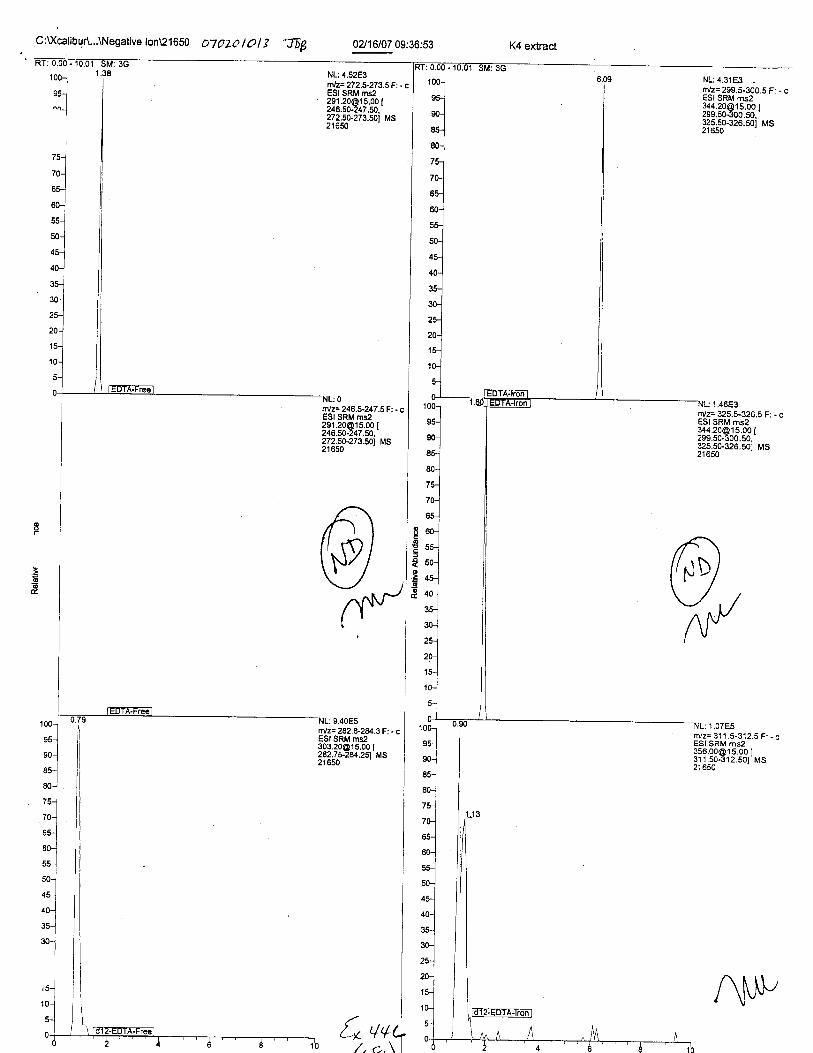
C:\j(calibur\...\Negative ton\21650 o70Zc-> /0 | j -I6p 02/16/07 09:36:53 K4 extract
NL:4.52E3.tl/z=272.5-273.5 Fi - cESI SRM [email protected] [246.50-247.&,272.50-273.501 MS21650
NL: 4,31E3 .-rvz= 299.5-300.5 F: - cESI SRM [email protected] l299.50-300.50.-325.50-326.501 MS21550
tr/z= 325.5-326.5 F: - cESI SRM [email protected] [299.s0-300.50.325.50-326.501 MS21650
1 00-1
o^J*l^n-l
%o
o
€o
6o-
,{\vnf*
o!ol-l
: 1.07E5100-l
*t6!*l*lro-l
tulrol*l60i-- |
".-l5Ui
OJI
oo-]
*l'o-]
rniz= 311.5-312.5 F: - cESI SRM [email protected] [311.50-312.501 MS21 650
L,,t
rl]/z=246.5-247.5F: - cESI SRM [email protected] [246.50-247.50.272.50-273.501 MS2't 650
4+,qO,\1
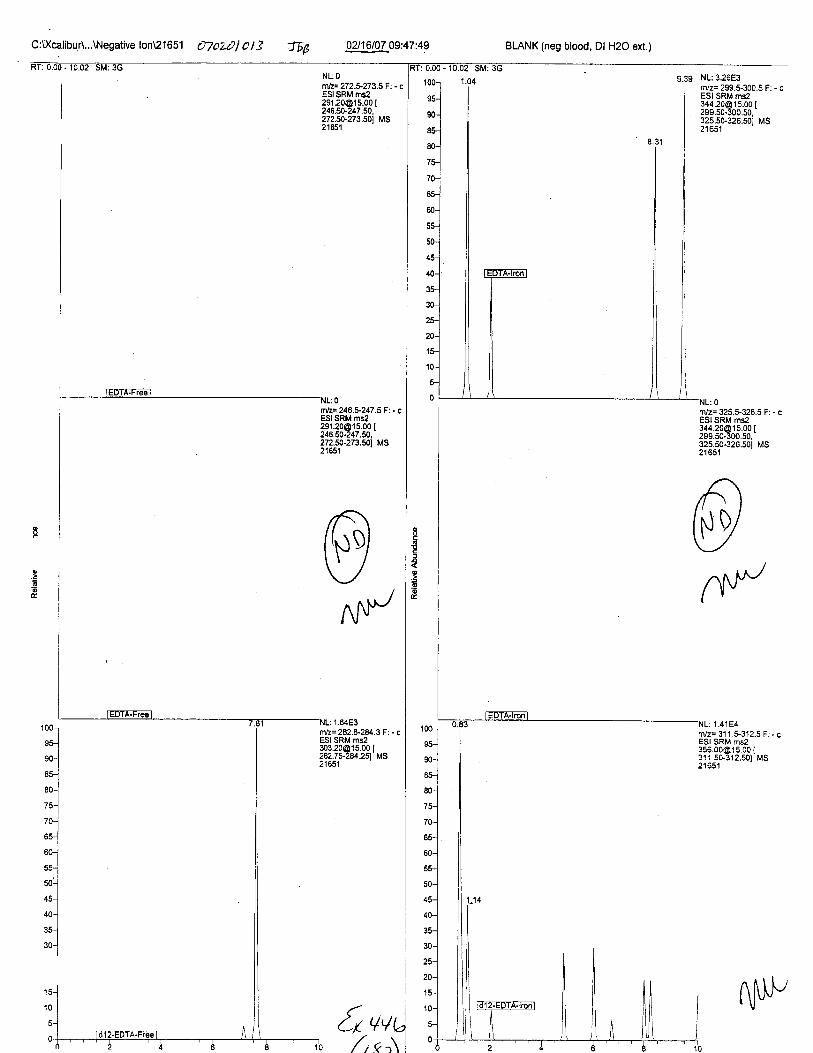
C:U(calibuA...\Negative lon\21651 O7oZ4l C | 3 TTB BLANK (neg blood, Dl H2O ext.)
@nM'
G
c
oo@
0^^/
0?i16107 09:47:49
NL:0rnlz= 272.5-273.5 F: - cESI SRM [email protected] [246.50-217.W,272.s0-273.501 MS2't65'l
9.39 NL:3.26E3ftVz= 299.5.300.5 F: - cESI SRM [email protected] [299.50-300.50,325.50-326.sot MS21 651
m/z= 325.5-326.5 F: - cESI SRM [email protected] [299.50-300.50,325.50-326.501 MS21 651
trVz= 31 1 .$312.5 F: - cESI SRM [email protected] [311.s0-312.501 MS21651
qqq.(r\ I
1,t
m'lr-246.*247.5 Ft - cESI SRM [email protected] [246.50-247.50,272.50-273.501 MS21651
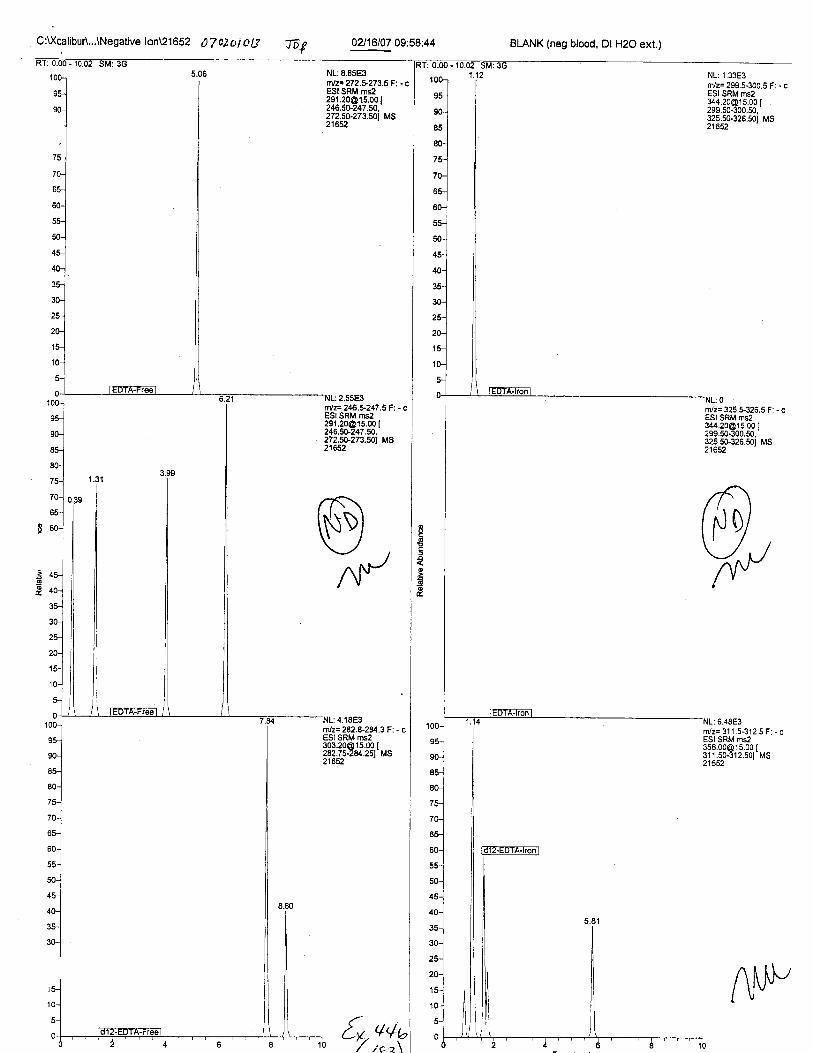
C:\jXcalibuA...\Negative lon91 6 52 0 7 aZ a t o 13 frg 0?J16107 09:58:44 BLANK (neg blood, Dl H2O ext.)
NL:8.85E3rnlz=272.5-273.5F: -cESI SRM [email protected] [246.50.247.50.272.50-273.501 MS21652
nr/z= 299.5-300.5 F: - cESI SRM [email protected],325.50-326.501 MS21652
r/z= 325.5-326.5 F: - cESI SRM [email protected] [299.50-300.50,325.50-326.50t MS2't652
nvz= 311.S312.5 F: - cESI SRM [email protected] I311.50-312.501 MS21652
:2.55E:lttlz= 246.U247 .5 F: - c
@.oo
!
o
6@
0^r
ESI SRM [email protected] [246.fi-247.50,272.50-273.501 MS21652

C:U(calibur\...\Negative lon\21653 OToLo lo tJ TOp 02116107 10:09:33 Q48 extract
NL:0nnF 272.+273.5 F: - cESI SRM [email protected] [246.50-247.50,272.50-273.s01 MS21653
rnlz= 246.5-247 .5 F: - cESI SRM [email protected] [246.50-247.50,272.s0-273.501 MS21653
NL:2.67E3rvz= 299.5-300.5 F: - cESI sRM ms234420@'15.00 [299.50-300.50,325.50-326.501 MS21653
NL: '1.29E5
rVz=311.$312.5 F: - c
-'
o
ao
go
s0rg
ESI SRM [email protected] {311.50-312.501 MS,IAEt
m/z= 325.$326.5 F: - cESI SRM [email protected] [299.50-300.50,325.s0-326.s01 Ms2'1653
qqbcrA

C:XcalibuA...\Negative lon\21654 OTOZOI O tg w 02116107 10:20'.25
NL:0tr,lz= 272.5-273,5 Fi - cESI SRM [email protected] [246.50-247.50.272.50-273.s0t MS21654
mlz= 246.5-247.5 Fi - cESI SRM [email protected] [246.50-247.50.272.50-273.50i MS21654
rnlz= ?42.9-28/..3 F: - cESI SRM [email protected] I282.75-284.25t MS2'1654
BLANK (neg blood, Dl H2O ext.)
NL: 7.30E3nvz= 299.5-300.5 F: - cESI SRM [email protected] [299.50-300.50,325.50-326.501 MS21654
NL:3.87E3m/2= 325.5m/2= 325.5-326.5 F: - cESI SRM ms2
%oo6E
aogo@
Al.}"
[email protected] I299.s0-5oo.so.'32s.s0-326.s01 Ms
A. rt{,.]Z', r.q\ ]
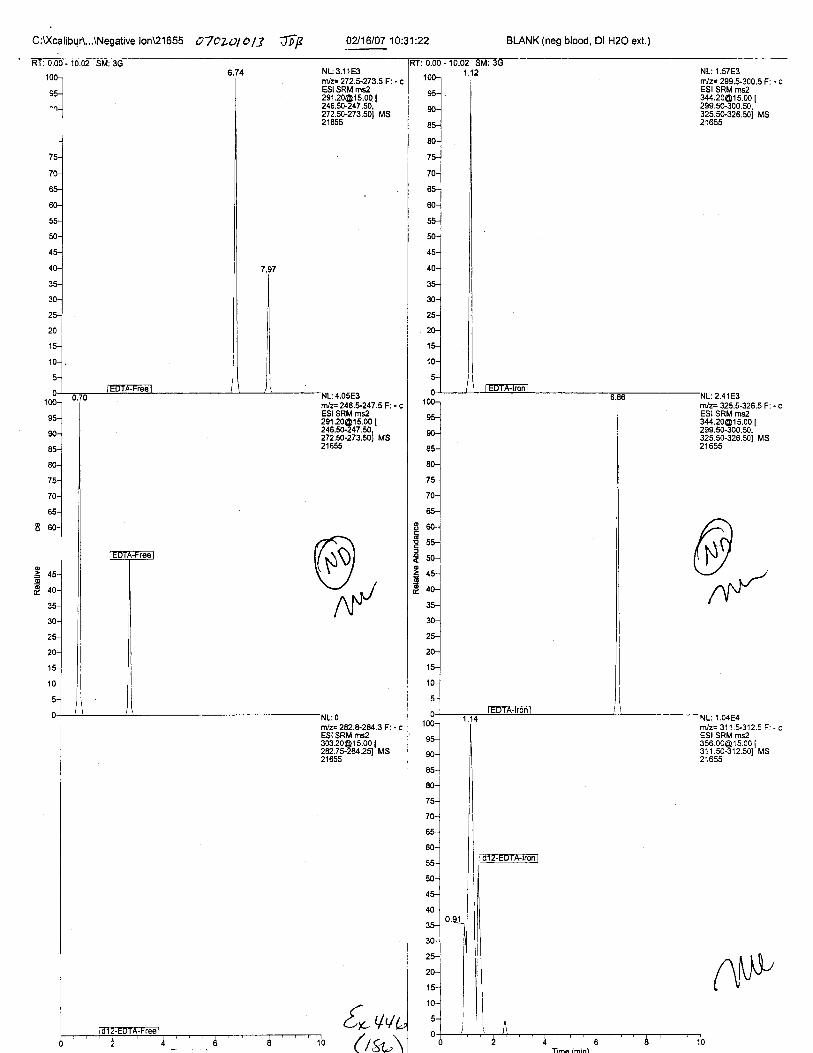
C:U(calibur\...\Negative lon\21655 OToLOl A B {f p 021'16107 10:31:22 BLANK (neg blood, Dl H2O ext.)
1 00-
"J*l'1J
NL:3.11E3.r'lz= 272.5-273.5 F. - cESI SRM [email protected] [246.50-247.50.272.50-273.501 MS21655
: 4.05E3ftilz= 246.+247 .5 F: - cESI SRM [email protected] [246.50-247.50,272.50-273.501 MS21655
.r.lz=282.8-2E/.3F'. - cESI SRM [email protected] [242.75-2U.251 MS21655
ll*,/v
NL: 1.57E3r/z: 299.5-300.5 F: . cESI SRM [email protected] [299.50-300.50.325.50-326.50t MS21655
n/z= 325.5-326.5 F: - cESI SRM [email protected] I299.s0-300.50.325.50-326.501 MS21655
2.41e3
|.04E4
%E
@
-ao@Ay
r/z= 311.S312.5 F: - cESI SRM [email protected] [311.50-312.s01 MS21655
(l,gr"\ I
Al\l'I,

C:XcalibuA...\Negative lon\21656 oaoLolol 3 JDp 0?/16107 10:42:14
@AM/
100-l
"-lq8s-..1
*.1I'l
ro-l
*l8.1
iool t it"'lI'tl
NL:1.29E5nlz-272.1273s F: - cESI SRM [email protected] [246.50-247.50,272.5S273.501 MS21656
8.1 0E3n{z= 246.5-247.5 F: - cESI SRM [email protected] [246.50-247.50,272.50-273.501 MS21 656
7.0185tuz= 282.8-2U.3 F: - cESI SRM [email protected] [282.7U2U.251 MS21 656
Ic
eo
@
o
€ol*130-J
l
2s1I
,lr qq5--lo ( t,gz
Pos. Cont. A (MAL EDTA ext.)
@N
NL: 3.25E4r/z= 299.5.300.5 F: - cESI SRM [email protected] [299.50-300.50.325.s0-326.501 MS2't655
rvz= 325.5-326.5 F: - cESI SRM [email protected] [299.50-300.50,325.50-326.501 MS21656
5.21E4r/z= 311.4312.5 F:. cESI SRM [email protected] I311.5e312.501 MS21656

C:U(calibuA...\Negative lon\21657 OTaLolOlS JD6 0?/16107 10:53:13
NL:4.56E3NF272.5-273.5F: - cESI SRM [email protected] [246.50-247.50,272.50-273.501 MS21657
:2.15E3Irl/F246.+247.5F:-cESI SRM ms22e1 [email protected] [246.50-247.50.272.50-273.501 MS21657
.n/z= 282.8-2U.3 Fi - cESI SRM [email protected] [242.75-2U.25t MS2'1657
BLANK (neg blood, Dl H2O ext.)
1 00-l
rul^n_.{
NL:1.18E3rn/z:299.5.300.5 F: - cESI SRM [email protected] [4W.CU-JUU.JU,325.50-326.50t MS21857
r/F 325.t326.5 F: - cESI SRM [email protected] [299.5G.300.50.325.5G326.501 MS2'1657
@Alv
@
Eo!c
o
.go&
Time (min)
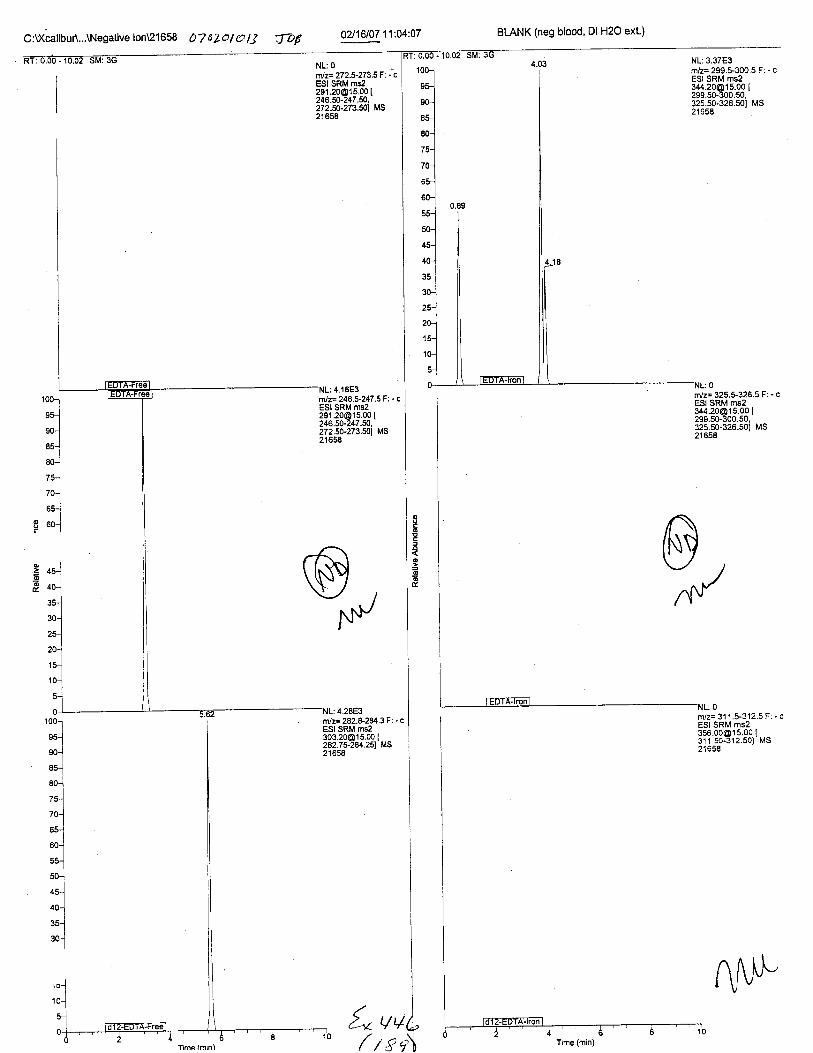
C:XcalibuA...\Negative lon\21658 07 aZol e B T-OF 021'16107 11:04:07
NL:0ilz= 272.5-273.5 F: . cESI SRM [email protected] [246.fi-247.fi,272.50-273.501 MS21 658
filz= 282..*2U.3F: - cESI SRM [email protected] [282.7r2U.251 MS21656
,{* qr/
BLANK (neg blood, Dl H2O ext.)
1001
oR-J--lIru-l
80-1
?5-l
to-l
ru-1
g eo_i
NL:0m/z= 325.5-326.5 F: - cESI SRM [email protected] [299.50-300.50,325.50-326.501 MS21658
@I't'v
%
1001
*lnol^-l'-l80-l_-l, t-ltol*l""-l*l50-l
4s-]I
oo-]
*lro-l
Time (min)(rEq
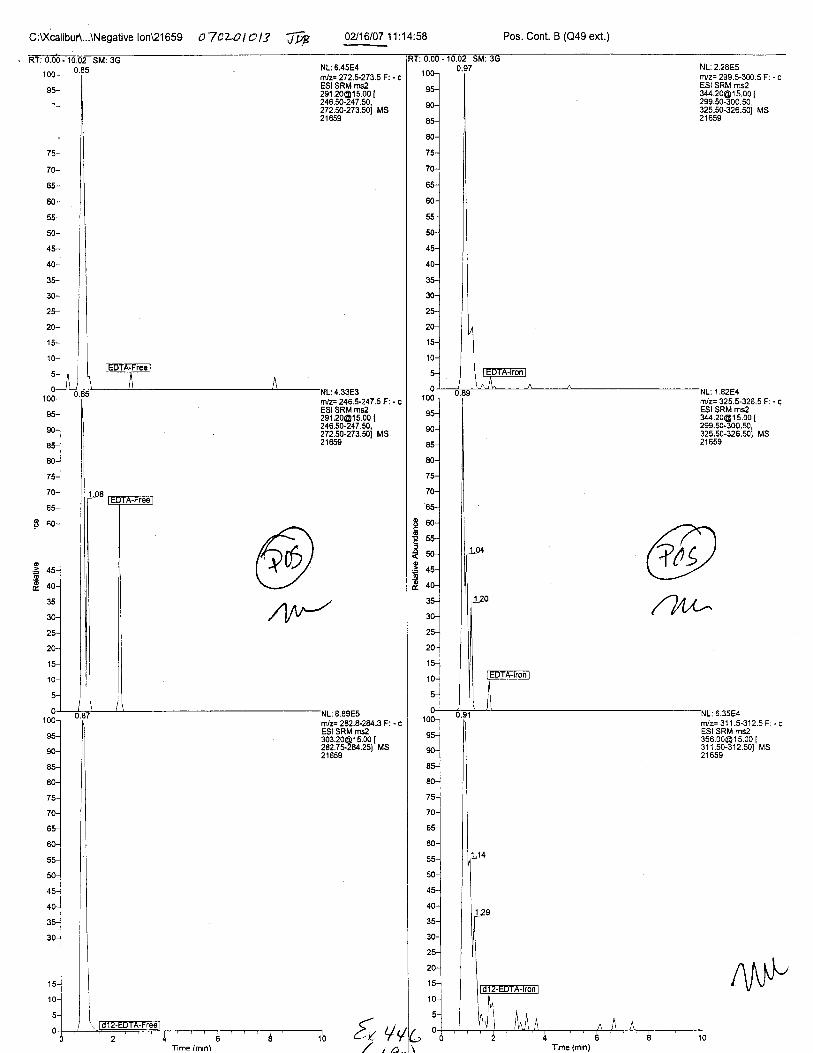
C:XcalibuA...\Negativelon\21659 OTCLAI Cl3 ff7 02116107 11:14:58
NL: 6.45E4rrlz=272.i273.5F: - cESI SRM [email protected] [246.50-247.50,272.50-273.501 MS21659
lool t itru'l I.t I
4.33E3n!z- 246.5-247 .5 F: - cESI SRM [email protected] [246.50-247.50,272.50-273.501 MS21 659
oo6
.Eo
10(
Y'
9(
8!
7(
5l
4(
5(
: 8.89E5fi'lz= 2A2.a-28/..1F: - cESI SRM [email protected] [282.7U2U.251 MS2t659
't0
0
Time lminl
Pos. Cont. B (Q49 ext.)
NL: 2.28E5nvz= 299.5-300.5 F: - cESI SRM ms23,[email protected] [299.50-300.50,325.50-326.501 MS21659
NL: 1.82E4r/z= 325.+326.5 F: - qESI SRM [email protected] [299.50-300.50,325.50-326.501 MS21659
@a-14,u
NL:6.35E4r/z=311.5-312.5F:.cESI SRM ms2356.00@15,00 [311,50-312.501 MS21659
'l'ime (min)
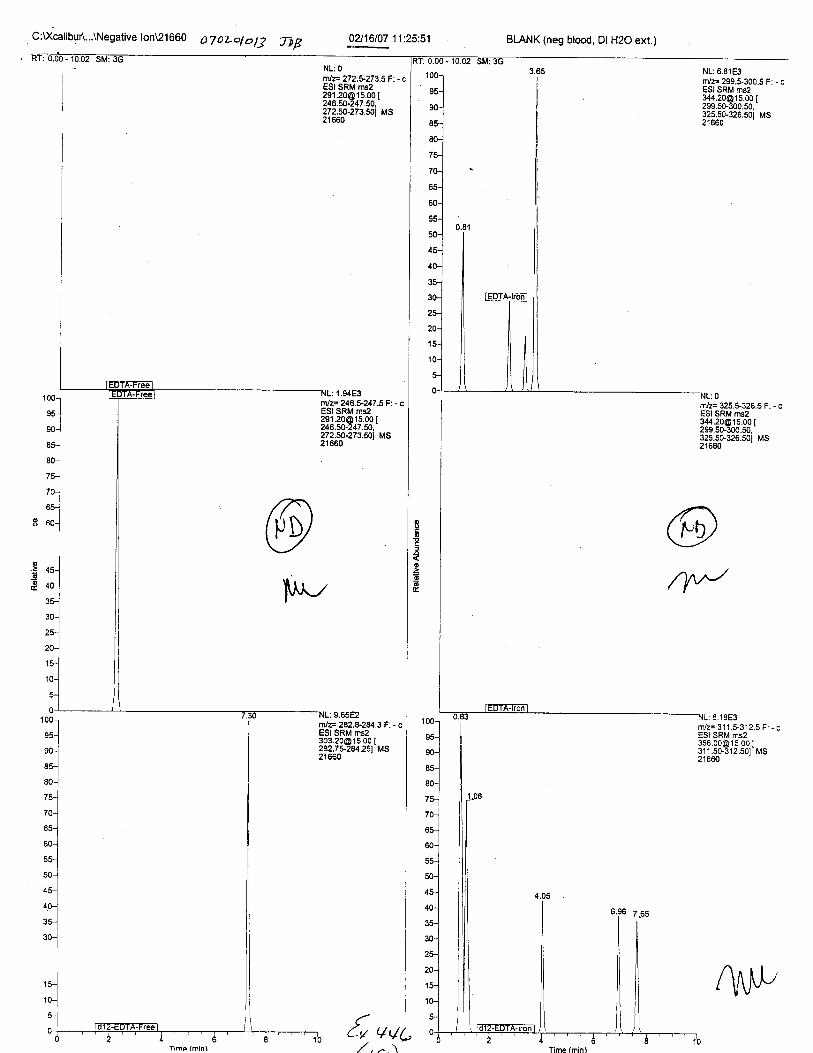
C:U<'caliUurt...tNegative lon\21660 OToLololS TrB 02116107 11.'25:5'l
NL: O
tt{z= 272.5-273.5 F: - cESI SRM [email protected] [246.fi-247.50.272.s0-273.501 MS21660
BLANK (neg blood, Dl H2O ext.)
,oo-l
ru-1
*-lru-l
80-l
'lto-l
*-lI 60_l
NL: 6.81 E3rvz= 2995300.5 F: - cESI SRM [email protected] I299.50-300.50.325.50-326.50t MSz toou
6.1 8E3
m/z= 325.5-326.5 F: . cESI SRM [email protected],325.50-326.501 MS21660
@N
oo
€o
66
@}\^\/
v.ocEz10(
9:
8(
7(
filz=282.*2U.3F.-cESI SRM [email protected] I282.7*2U.251 MS
c{u qv
r/z= 311 .5-3'12.5 F: - cESI SRM [email protected] I311 .50-3'12.501 MS21550
4Ar\l,,
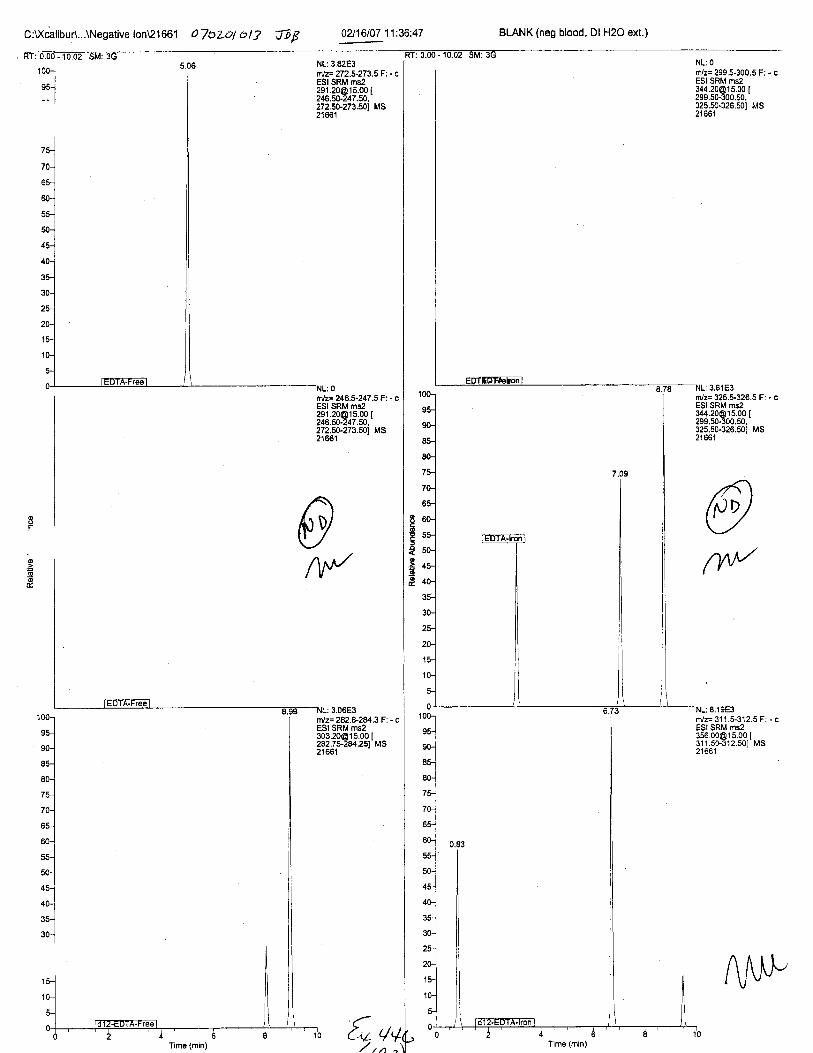
C:XcalibuA...\Negative lon\21661 OToLol ol? JjE 0?/16107 11:36:47
NL:3.82E3rilz=272.5-273.5F: -cESI SRM ms2291.20@'t 5.00 [246.fi-247.50,272.50-273.501 MS2'1661
rtlz=246.5-247.5 F: - cESI SRM [email protected] [246.50-247.fi,272.50-273.501 MS21661
ntlz=282.d-284.3 F: - cESI SRM [email protected] I282.75-284251 MS21 661
li, q
@Atl
I
o
.goE
Time (min)
BLANK (neg blood, Dl H2O ext.)
NL:0nvz= 299.5-300.5 F: - cESI SRM [email protected] [299.50-300.50.325.50-326.501 MS21661
3.61E3t/z= 325.&326.5 F: - cESI SRM [email protected] [299.50-300.50,325.s0.326.501 MS21661
. e totr?n/z= 31'1.5-312.5 F: . cESI SRM [email protected] [3't1.50-312.501 MS21661
Time (min)
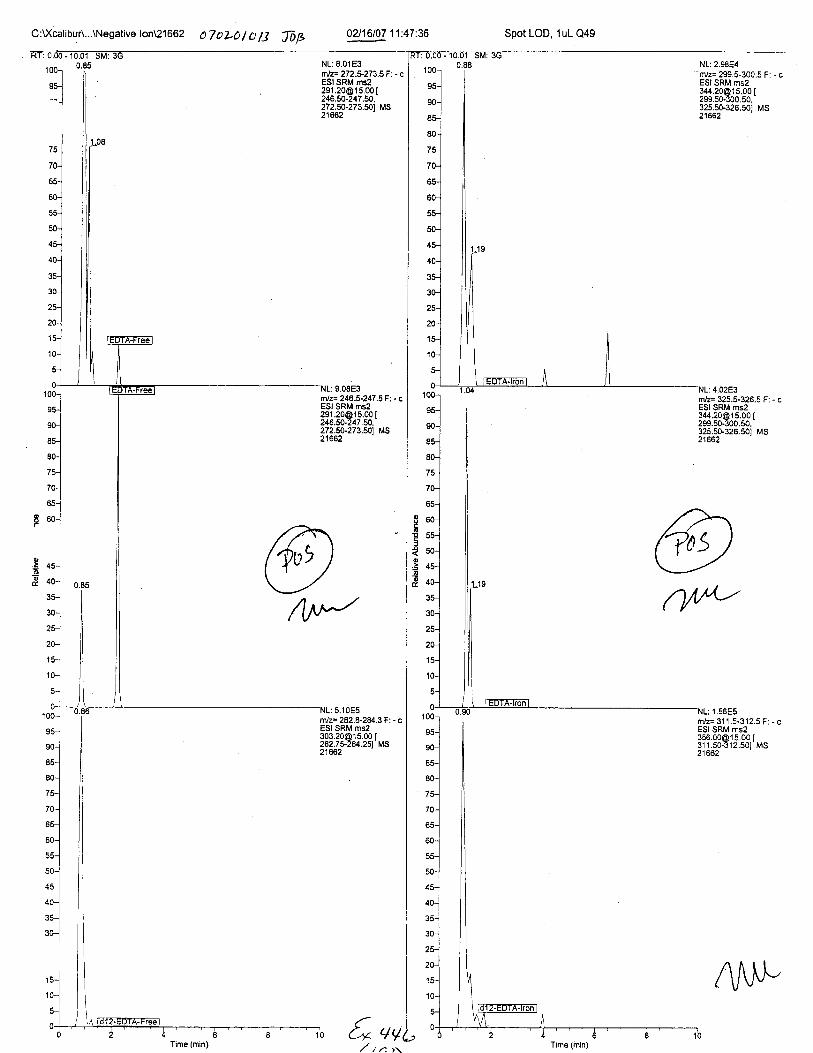
C:XcalibuA...\Negative lon\21662 OToLO/ A B TDtE 02116107 1 1:47:36
1.01
u-63 NL:8.01E3rrlz= 272.+273.5F: - cESI SRM [email protected] [246.50-247.50,272.s0-273.501 MS21662
nlz= 246.5-247.5 F: - cESI SRM [email protected],272.50-273.501 MSzt00z
1001
ru-l
rol--l
--l*lru-l
to-]
tt-]I 60-l-l
@to
5
o
!o
5.1 0E5filz= 282.8-2U.3F: - cESI SRM [email protected] I282.75-2w.2sl MSz tooz
c{* aV,/ rn t:.Time (min)
Spot LOD, 1uL Q49
NL: 2.98E4-m/z= 299.5-300.5 F: - cESI SRM [email protected] [299.50-300.50.325.50-326.s01 MS2'1662
rn/z= 325.5-326.5 F: - cESI SRM [email protected] [299.50-300.50,325.50-326.501 MSztooz
4.02E3
1.56E5rfl/z= 31 1.5-312.5 F: - cESI SRM [email protected] [311.50-312.501 MS
Time (min)

C:U(calibuA...\Negative lon\21663 07o 20lo tZ TOg BLANK (neg blood, Dl H2O ext.)
@Moc
to
o
@qv
0?/16107 11:58:29
NL: 0
nlz= 272.5-273.5 F: - cESI SRM [email protected] [246.fi-247.50,272.50-273.501 MS21663
NL:5.02E3r/z= 299.5-300.5 F: - cESI SRM [email protected] [zw,cu-Juu.il,325.50-326.501 MS21663
rrvz= 325.5326.5 F: - cESI SRM [email protected] [299.5G300.50.325.s0-326.501 MS21663
n/z= 31 1 .$.312.5 F: . cESI SRM [email protected] [311.s0-312.s01 MS21 663
trlz=246.5-247 ,5 F: - cESI SRM [email protected] [246.fi-247.50,272.50-273.s01 MS21 663
10(
ta
7C
oa
OL
55
c!
45
40
J!
30
:9.09E-l
Time (min) Time (min)
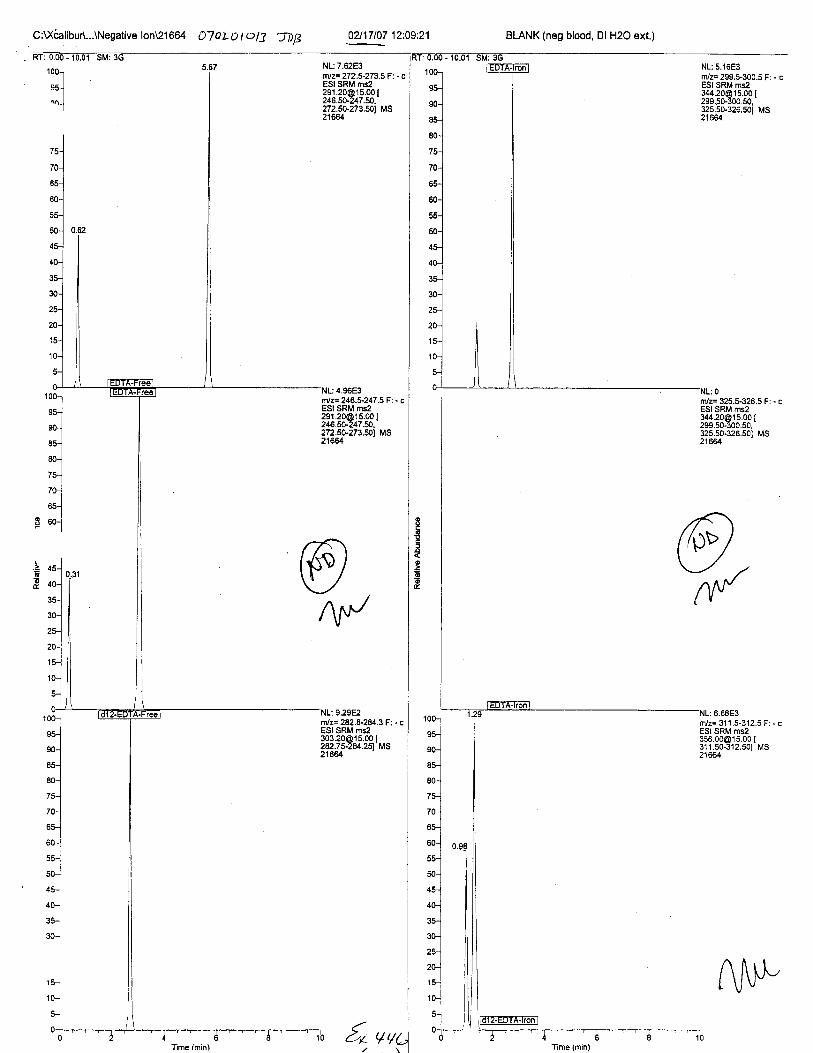
BLANK (neg blood, Dl H2O ext.)C:Wcalibur\...\Negative lon\21664 OToLtJ I olj jDB 0A17107 12:09:21
nlz=282,8-2U.3F:- cESI SRM ms2303.20@ rs.00 [282.75-284.251 MS2166/.
iio vv
1001
*-1
*-lru-l
ro-l
ru-]
70-..1
"]I 60-l
@Nil
1001
oaJ
;;lI*-]
uo-l
--lro-J
'1ro-]
*luo-l
ou-]
oo-]
*t'o-]
NL:7.62E3rnlz=272.5-273.5 F: - cESI SRM [email protected] [246.50-247.50.272.50-273.501 MS216&1
r,lr-248-*247.5 Fi - cESI SRM [email protected] [246.50-247.50.272.50-273.501 MS2't664

C:U(calibuA...\Negative lon\21665 O TOLo I a lj -TDB
41
10
5
0
0?/17107 12:20:10
).01U.UJ NL:1.96E4
fflz= 272 .5-273 .5 F : - cESI SRM [email protected] [246.50-247.50,272.5G273.s01 MS21665
ttlz=246.5-247.5 Fi - cESI SRM [email protected] [246.50-247.50,272.50-273.501 MS21665
ffi.lz=282&2U.3 F: - cESI SRM ms2303,20@ r5,00 [282.7s-2U.251 MS21 665
1 00-i
--l"n-l
,::
;.1--lru-]
:f, "--l
ro1
ss-j
I 60--l oP
E
;
Time (min)
Spot LOD,2 uL Q49
NL: 6.38E4ffVz= 299.5-300.5 F: - cESI SRM msz344,[email protected] I299.50-300.50,325.50-326.501 MS21 665
6.1 8E3m/2= 325.$326.5 F: - cESI SRM [email protected] [299.50-300.50,325.50-326.501 MS21665
7.c/'E4rnlz= 311.t312.5 F: - cESI SRM [email protected] I31'1.50-3'12.501 MS21665
6,,P
Time (min)

C:D(cafiburl...\Negative lonl21666 OToLolotS J^op 0?J17107 12:31:06 BLANK (neg blood, Dl H2O ext.)
J./O NL:4.74E3.n'lz=272,+273.5F: . cESI SRM [email protected] [246.fi-247.50,272.50-273.501 MS21666
n!z=246.1247.5F:- cESI SRM [email protected] [246.50-247.50,272.50-273.501 MS21666
ftlz=282.8-2$3F: - cESI SRM [email protected] [282.7$284.251 MS21666
NL:8.98E3rn/z= 299.$300.5 F: - cESI SRM [email protected] {299.50.300.50.s25.50-326.501 MS21666
m/z= 325.5-326.5 F; - cESI SRM [email protected] [299.50-300.50,325.5G.326.501 MSztooo
rvz= 31 1.5-312.5 F: - cESI SRM [email protected] I311.50-312.s01 MS2'1666
, t*l9$"]
'.lI
@ftJ
oP
E
to
66@
^P
Time (min) Time (min)

fnstrument Method: EDTA_Neg_Swabs. meth
LCe fnstrument Method
Creator: AdministratorLasr modified: z/t6/07 by AdministratorMS Run Time (min) : 10.00
Divert Valve: Dot used during run
MS Detector Settinss:
Segrment 1 fnformation
Duration (min) : 10.00Number of Scan Events: 4Tune Method:
Scan Event De
EDTA_NEG
tails:(291, .2 ) - >oS (246 . s-247 . s
CE L5 . 0? IsoW i_. 0
(303 . 2) ->os (282. B-294.3)CE 15.0? fsoW l_.0
G+e .2) ->oS (299 .5-300. 5CE l-5. 0t f soW 1. 0
(3s5.0) ->oS (srr. s-312. s)CE 15. 0t IsoW l-. 0
l_
2
4
NegMS/MS
NegMS/Ms
NegMS/MS
NegMS/MS
272.s-273 .5)
32s.s-326.s)
Friday, February 15, 2OO7 05i :0 7 z j,4
{a 4+t-Page 1 of 2
CloLc:t e 17
oz lr,o I z.o-?/ tqc\
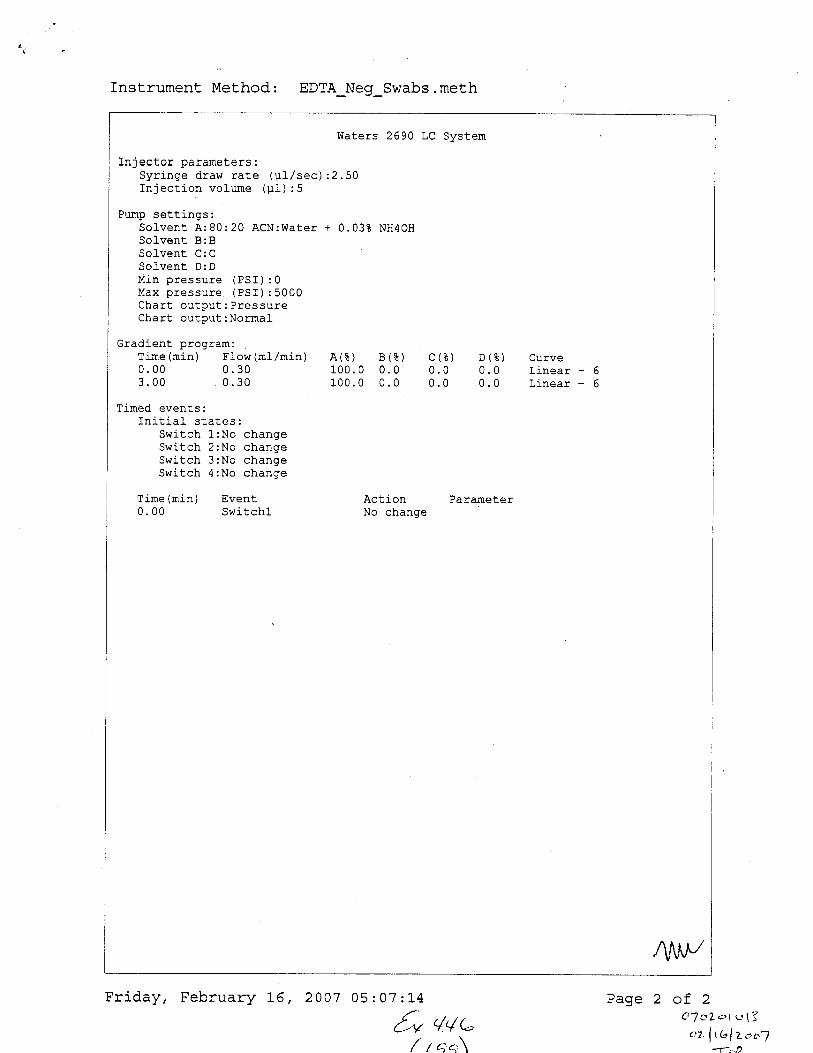
Instrument Method: EDTA_Neg_Swabs . meth
Thiaafnr narematare.
Syringe draw rate (pI/sec)Tn'i onn i nn rrn l rrma / rr 'l \ ' E\ F_ / ' v
Drrmn cal- f i nae .
Solvent A:80: 20 ACN:WaterSolvent B:BQn l rrant t"'1'
Solvent D:DMin nroccrrra /PqT\ . n
\!v+, . v
Mav nroccrrra /PqT \ . qnnn\!vf /.vvvv
l'hart nrrfnrrf . DroqqrrraCh: r1- nrrf nrri . Nn11116f
f]r:di ont hrnftitm r
Time (nin) Flow (mI,/min)0. 003. 00
0.300.30
Timed events:Initial states:
Switch L:No changeSwitch 2:No changeSwitch 3:No changeSwitch 4:No change
T ime (mi n ) Event0. 00 Switchl
Waters 2690 LC System
+ 0.038 NH40H
A(r) B(r) c(E) D(*)100. 0 0. 0 0.0 0. 0100.0 0.0 0.0 0.0
Action ParameterNo change
CurveLinearLi-near
-5-6
2007 05:07:I4
5u q'/uf r ar1\
Page 2 of 2(r'/ oL<>l c-.\3
ozfrrofLaa--/D
Friday, February 16,

:
Sample Name:
Conment:
Sequenc e---07 020 1 0 1 3-Neg.sld [Open]
(neg blood, Dl H2O exl
Study:
Client:
Laboratory:
Company:
Phone:
Sample Type File Name Sample lD Path
Unknown 21634 C:U(cal ibu r\Data\B rewer\07020 1 0 1 3\N eg ative lon
lnst Method Proc Method CalFile Position InjVol Level Sample Wt
C :Xcal i bu r\methods\E DTA-Neg-Swabs 1I 5.0 1.000
Sample Vol ISTD AMt Dil Factor
0.u00 0.000 1.000
Sample Name:
Comment:
Control (-EDTA blood swab ext.)
Study:
Client:
Laboratory:
Company:
Phone:
Sample Type File Name Samole lD Path
Unknown 21635 02 C :U(calibur\Data\B rewer\07020 1 0 1 3\Negative I or
lnst Method Proc Method CalFile Position InjVol Level Sample Wt
:Xcalibur\methods\EDTA z 5.0 0.000
Samole Vol ISTD AMt Dil Factor
0.000 0.000 1.000
fr aqcb"q
page 1
Dl oL o\ ol3a tl I ulto"1
ToP

Sarnple Name:
Cornment:
Sequence---07 0201 0 1 3_Neg. sld [Open]
BLANK (neg blood, Dl H2O ext.)
Study:
Client:
Laboratory:
Company:
Phone:
Sample Type File Name Sample lD Path
Unknown 21636 01 C:\)(calibuAData\BreweA070201 0 1 3\Negative lon
Inst Method Proc Method Cal File Position InjVol Level Sample Wt
C:Xcalibur\methods\EDTA Neo Swabs 1 5.0 0.000
Sample Vol ISTD Amt Dil Factor
0.000 0.000 1.000
i**************t****t****************l*****t**+**t*********************************t********i*********
Sample Name:
Comment:
(neg blood, Dl H2O ext.)
Study:
Client:
Laboratory:
Company:
Phone:
mple Type File Name Sample lD Path
Unknown 21637 01 C:Xcalibur\Data\BreweA07020 1 0 1 3\Negative lon
Inst Method Proc Method Cal File Position InjVol Level Sample wtC : Xcal i bu r\methods\EDTA_N eg_Swabs 1 5.0 0.000
Sample Vol ISTD Amt DilFactor
0.000 0.000 1.000
****ii*********************************************
/tu 4qc,(;. i\
page2
ALrt''Q'la?-o lc13ezfralt""l
-i-r.,p

Sample Name:
Comment:
Sequence---07 0201 0 1 3_Neg.sld [Open]
eltract
Study:
Client:
Laboratory:
Company:
Phone:
Sample Type File Name Sample lD Path
Unknown 21638 03 :U(ca|i bu AData\Brewer\O7020 1 0 1 3\Negative I on
Inst Method Proc Method CalFile Position InjVol Level lSample WtC:\Xcalibur\methods\EDTA Neo Swabs 3 5.0 0.000
Sample Vol ISTD Amt DilFactor
0.000 U.UOO 1.000
Sample Name:
Comment:
(neg blood, Dl H2O ext.)
Study:
Client:
Laboratory:
Company:
Phone:
Sample Type File Name Sample lD Patn
Unknown 21639 01 C :\Xca I i bur\Data\Brewer\07 020 1 013\Negative lor
Inst Method Proc Method Cal File Position InjVol ilevel SamFte WtC:Xcalibur\methods\EDTA Neq Swabs 1 5.0 I 10.000
Sample Vol ISTD Amt Dil Factor
0.000 0.000 1.000
E q,/orr" )
c,Tolotol3or.l ru I u.:.1
_J_pp
paqe 3
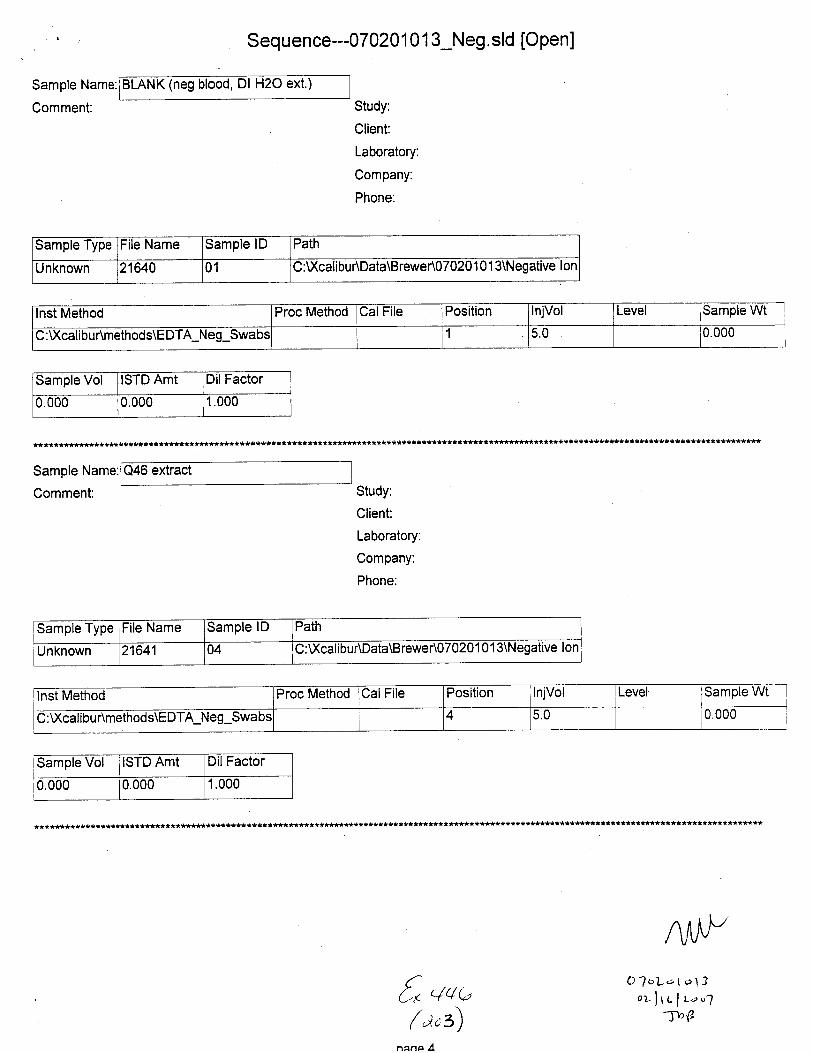
Sample Name:
Comment: Study:
Client:
Sequence---07020 1 0 1 3_Neg. sld [Open]
BLANK (neg blood, Dl H2O ext.)
Laboratory:
Company:
Phone:
Sample Type File Name Samole lD Path
Unknown 21640 01 C :U(calibuAData\Brewer\07020 1 0 1 3\N egative lon
lnst Method Proc Method CalFile Position InjVol Level Samole Wt
C :Xcalibur\methods\E DTA-Neg-Swabs 1 5.0 0.000
Sample Vol ISTD Amt DilFactor
0.000 0.000 1.000
*********************i*tt***********t****i***********
Sample Name:
Comment:
Q46 extract
Study:
Client:
Laboratory:
Company:
Phone:
Sample Type File Name Sample lD Path
Unknown 21641 04 C: U(cali buAData\B rewer\07020 1 0 1 3\Negative I or
lnst Method Proc Method CalFile Position InjVol Level lSample
C : U(cal ibu r\methods\EDTA-Neg-Swabs 4 5.0 0.000
Sample Vol ISTD Amt DilFactor
0.000 0.000 1.000
t************i**********************tt
fr qu,( aoz)
nan.a A
O-lol.a\ o\3or-frc lt-oo'l
Ttf
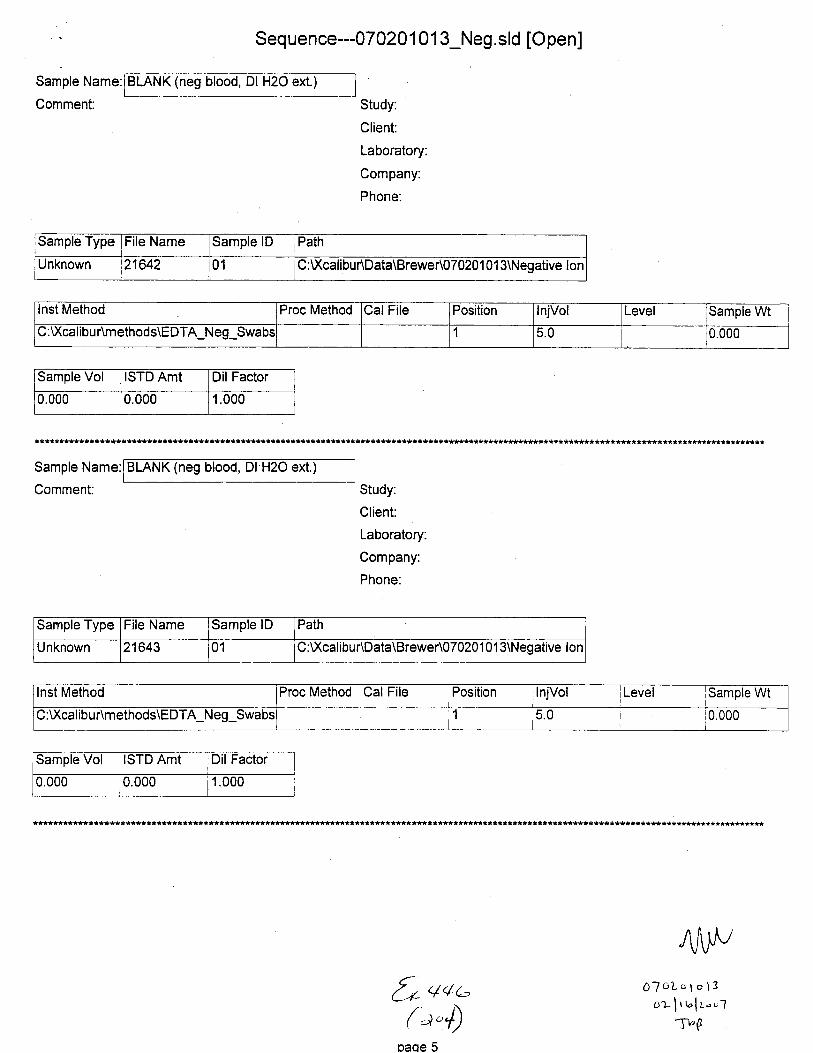
Sample Name:
Comment:
Seq uenc e---07 020 1 0 1 3_Neg. sld [Open]
(neg blood, ext.)
Study:
Client:
Laboratory:
Company:
Phone:
Sample Type File Name Sample lD Path
unKnown 21642 01 C :U(calibuAData\Brewer\O7020 1 0 1 3\Negative I or.
Inst Method Proc Method Cal File Position InjVol Level Samole Wt
C:Xcalibur\methods\EDTA Neo Swabs 5.0 0.000
Sample Vol ISTD Amt Dil Factor
u.000 0.000 1.000
Sample Name:
Comment:
BLANK (neg blood, Dl H2O ext.)
Study:
Client:
Laboratory:
Company:
Phone:
Sample Type File Name Sample lD Path
Unknown 21643 01 :Xcalibur\Data\Brewer\07020 1 0 1 3\Negative lon
lnst Method Proc Method Cal File Position InjVol Level Sample Wt
C :Xcal ib u r\methods\EDTA_N eg_Swabs 1 5.0 r0.000
Sample Vol ISTD Amt Dil Factor
0.000 0.000 1.000
{* ++c,(a"4)
oaqe 5
01 oLolr:13or-lrr"lr-"'1
-fl,p
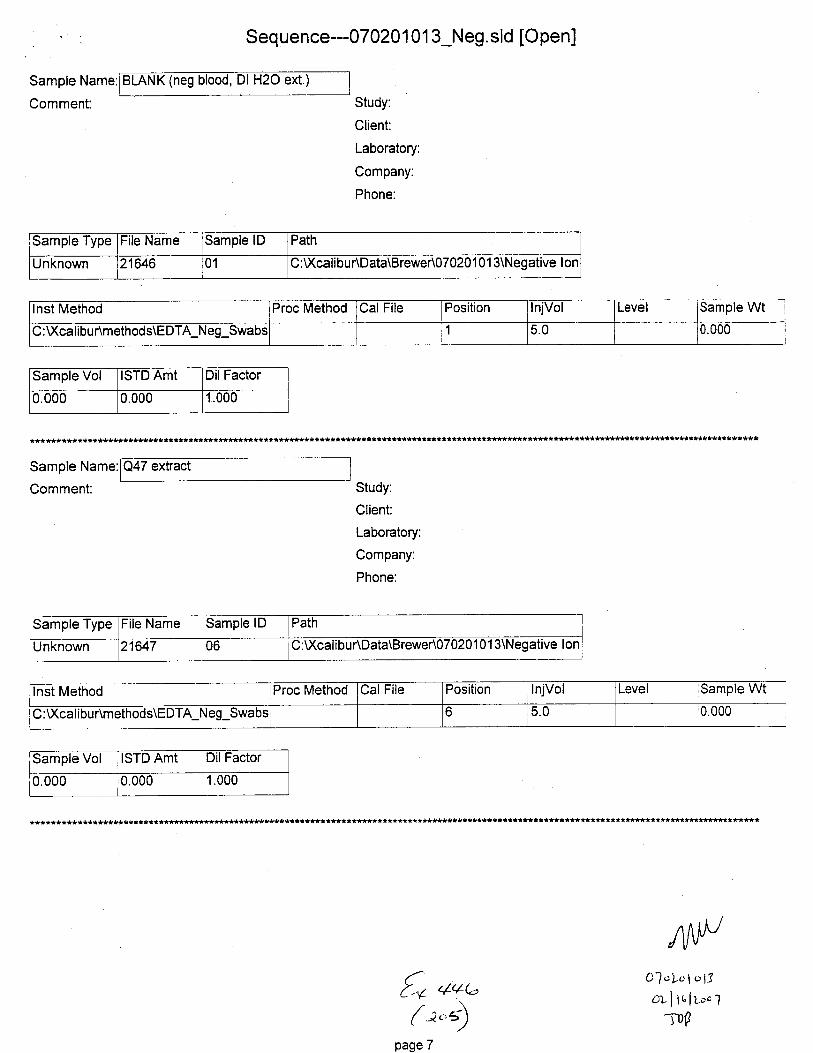
Sample Name:
Comment:
Sequenc e---07 0201 01 3_Neg.sld [Open]
BLANK (neg blood, Dl H2O ext.)
Study:
Client:
Laboratory:
Company:
Phone:
m File Name Sample lD Path
Unknown 121646I
01 G :Xcalibu r\Data\Brewer\07 0201 013\Negative I on
lnst Method Proc Method Cal File Position InjVol Level Sample Wt
C : U(ca I ibu r\method s\EDTA_N eg_Swabs 5.0 0.000
Sample Vol STD Amt DilFactor
0.000 0.000 1.000
************t****l
Sample Name:
Comment:
Q47 extract
Study:
Client:
Laboratory:
Company:
Phone:
Sample Type File Name Sample lD Path
Unknown 21647 06 C :\Xcali bu r\Data\Brewer\07 0201 01 3\Negative I on
lnst Method Proc Method Cal File Position InjVol Level lSamole Wt
C : U(ca I ibu r\methods\E DTA-N eg-Swabs 6 5.0 r0,000
Sample Vol ISTD Amt DilFactor
0.000 0.000 1.000
************* t***t*************************
n ,/!G( tr,t)
page 7
Cl o'yo\ olJ
or I ic f r-o. '7
TDP
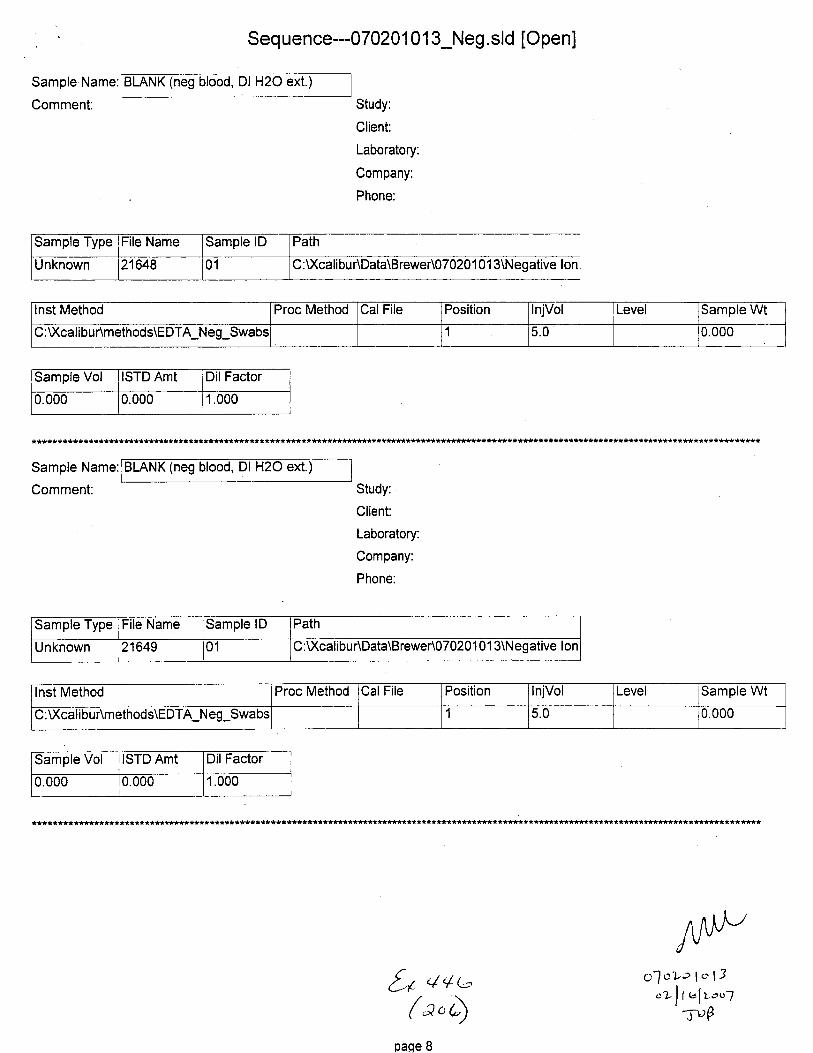
Sample Name:
Comment:
Sequence---070201 0 1 3_Neg.sld [Open]
BLANK (neg blood, Dl H2O ext.)
Study:
Client:
Laboratory:
Company:
Phone:
Sample Type File Name Sample lD Path
Unknown 21648 01 C:U(calibuAData\Brewer\07020 1 0 1 3\Neqative lon
lnst Method Proc Method Cal File Position InjVol Level Sampre wtC :Xcali bu r\method s\EDTA_Neg_Swabs 1 5.0 0.000
Sample Vol ISTD Amt DilFactor
0.000 0.000 1.000
t*t******************s**********tt**tr********s*r***********************
Sample Name:
Comment:
(neg blood, ext.
Study:
Client:
Laboratory:
Company:
Phone:
Sample Type File Name Sample lD Path
Unknown 21649 01 C :\Xcalibu r\Data\Brewer\07 0201 01 3\Neg ative I on
Inst Method Proc Method Cal File Position InjVol Level Sample Wt
C : Xcali bur\method s\EDTA_N eg-Swabs I b.L)10.000
Sample Vol ISTD Amt Dil Factor
0.000 0.000 1.000
f, '-/4 G(t"4page I
o-lot-a 1o 1 3
"v!t elvolTvp

Sequence--07020 1 0 1 3_Neg.sld [Open]
Sample Name:
Comment:
K4 extract
Study:
Client:
Laboratory:
Company:
Phone:
Sample Type Frle Name Sample lD Path
Unknown 21650 07 C :U(calibu AData\Brewer\07020 1 0 1 3\Neoative lo n
lnst Method Proc Method CalFile Position lnjVol Level Samole Wt
C:U(calibur\methods\EDTA Neo Swabs 7 5.0 0.000
Sample Vol ISTD Amt Dil Factor
0.000 0.000 1.000
Sample Name:l BLANK (neg DI
Comment:
ext.)
Study:
Client:
Laboratory:
Company:
Phone:
Sample Type File Name Sample lD Path
Unknown 21651 01 C :Xcal ibur\Data\Brewer\07 0201 0 1 3\Neoative I on
lnst Method Proc Method CalFile Position lnjVol Level lSample
Wt
C:U(calibur\methods\EDTA Neo Swabs 1 5.0 0.000
Vol ISTD Amt Dil Factor
0.000 0.000 1.000
{n'/+(-(^" r)
oaoe 9
a1cl/ol o l?crlrcfi-.'1
-5bp

Sample Name:
Comment:
Sequence---07020 1 0 1 3_Neg.sld [Open]
(neg blood, Dl H2O ext.)
Study:
Client:
Laboratory:
Company:
Phone:
Sample Type File Name Sample lD Path
Unknown 21652 01 C:XcalibuAData\Brewer\070201 0 1 3\Negative lon
lnst Method Proc Method Cal File Position lnjVol Level Sample Wt
C :U(cal i bu r\methods\EDTA_N eg_Swabs 1 5.0 0.000
Sample Vol ISTD Amt Dil Factor
0.000 0.000 1.000
l********t*****************t*****t*****tt*f*********************i***************************************t*t****r**ti***
Sample Name:
Comment:
Q48 extract
Study:
Client:
Laboratory:
Company:
Phone:
Sample Type File Name Sample lD Path
Unknown 21653 08 C:Xcalibur\Data\Brewer\070201 0 1 3\Negative lon
lnst Method Proc Method Cal File Position lnjVol Level lSamole Wt
C :XcalibuAmethods\EDTA_Neg_Swabs 8 5.010.000
Samole Vol ISTD Amt DilFactor
0.000 0.000 1.000
{ q(L,(t.D
oaqe 10
0"1 eLol alT
oultd f r'.'"1
1vP
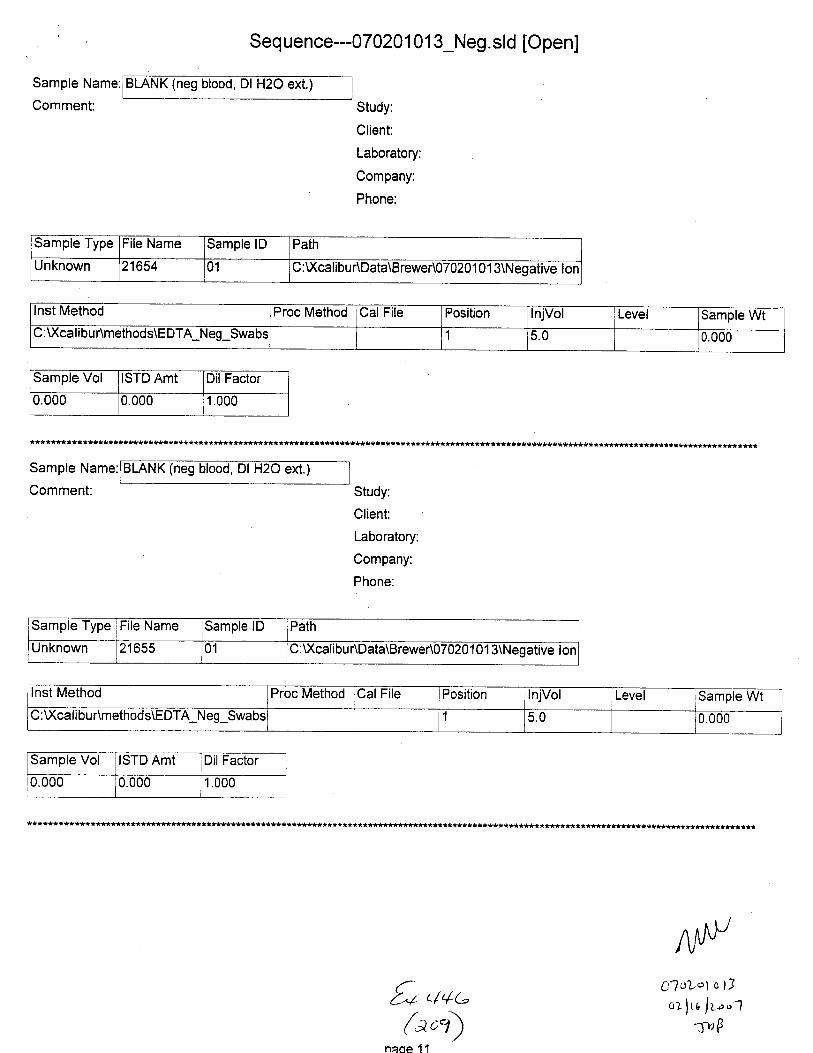
Sample Name:
Comment:
Seq uenc e---07 020 1 0 1 3_Neg. sld [Open]
(neg ext.)
Study:
Client:
Laboratory:
Company:
Phone:
Sample Type File Name Sample lD Path
Unknown 21654 01 C:XcalibuAData\Brewer\070201 01 3\Negative ton
lnst Method Proc Method Cal File Fosition InjVol Level Sample WtC: U(cal ibur\methods\E DTA_Neg_Swabs 5.0 0.000
Sample Vol ISTD Amt Dil Factor
0.000 0.000 1.000
Sample Name: K (neg blood, Dl H2O ext.)
Comment: Study:
Client:
Laboratory:
Company:
Phone:
mple Type File Name Sample lD Path
Unknown 21655 01 C : U(cali bu r\Data\Brewer\07 0201 01 3\Neg ative I or
Sample Vol ISTD Amt Dil Factor
U.UUO 0.000 1.000
{, q+.(ao'j)
naoe 1 1
cloLot o t3
czlt' lto"1-pP

Sample Name:
Comment:
Sequence---07 0201 0 1 3_Neg. sld [Open]
Pos. ext.
Study:
Client:
Laboratory:
Company:
Phone:
Sample Type File Name Sample lD Path
Unknown 21656 09 C :U(calibuAData\Brewer\07 0201 013\Negative lon
Inst Method Proc Method CalFile Position InjVol Level Sample WtC : Xcalibu r\methods\EDTA-Neg_Swabs 9 b.0 U.OUO
Sample Vol STD Amt Dil Factor
0.000 0.000 1.000
Sample Name
Comment:
BLANK (neg blood, ext.)
Study:
Client:
Laboratory:
Company:
Phone:
Sample Type File Name Sample lD Path
Unknown 21657 01 C:U(calibur\Data\Brewer\070201 0 1 3\Neqative lon
Inst Method Proc Method CalFile Position InjVol Sample WtC:Xcalibur\methods\EDTA Neo Swabs I 5.U t0.000
Sample Vol ISTD Amt Dil Factor
0.000 0.000 1.000
******l*******************ff*************************#******t*************************
{o uo,(;t)
oaoe 12
AloLcl al?olltclr".1
5up

Sequenc e--07 0201 0 1 3_Neg. std [Open]
Sample Name: (neg blood, Dl H2O ext.)Comment: Study:
Client
Laboratory:
Company:
Phone:
Sample Vol ISTD Amt DilFactor0.000 0.000 1.000
Sample Name:
Comment:
****t*****tt*******trt******t*******************
Pos. Cont. B (Q49 ext.
Study:
Client:
Laboratory:
Company:
Phone:
Sample Type File Name Sample lD Path
Unknown 21659 10 ;:xcattbur\Data\Brewer\O70201 0 1 3\NEetivelon
Inst Method Proc Method Cal File Position InjVol Level Samtte Wt: U(cal i bu r\method s\E DTA_Neg_Swa6! 10 5.0 U.
Sample Vol ISTD Amt Dil Factor
0.000 0.000 1.000
*******************************************************t******
{n(
4(AJt t;13
o-?oLol r"" l3
aLlrclb-1.TVF

Sample Name:
Comrnent:
Sequence---07 0201 0 1 3_Neg. sld [Open]
BLANK (neg blood, Dl H2O ext.
Study:
Client:
Laboratory:
Company:
Phone:
Sample Type File Name Sample lD Path
Unknown 21660 01 C :Xcali bur\Data\Brewer\07020 1 0 1 3\Negative I on
Inst Method Proc Method Cal File Position InjVol Level Sample WtC:\Xcalibur\methods\EDTA Neo Swabs 1 5.0 U.OUO
Sample Vol ISTD Amt DilFactor
0.000 0.000 1.000
Sample Name:
Comment:
BLANK (neg elit.
Study:
Client:
Laboratory:
Company:
Phone:
sampre rype Frle Name Sample lD Path
Unknown 21661 01 C:U(cali bu r\Data\BreweA07020 1 0 1 3\N eg ative I on
lnst Method Proc Method CalFile Position InjVol Level lSamole Wt
C:Xcalibur\methods\EDTA Neq Swabs 1 5.0 0.000
Sample Vol ISTD Amt lDil Factor
0.000 0.000 1.000
{* ou,1;'a)
oaoe 14
^ A,\,V, V'
0?o1-o\rc't3oLlttluo.'7
'lvp
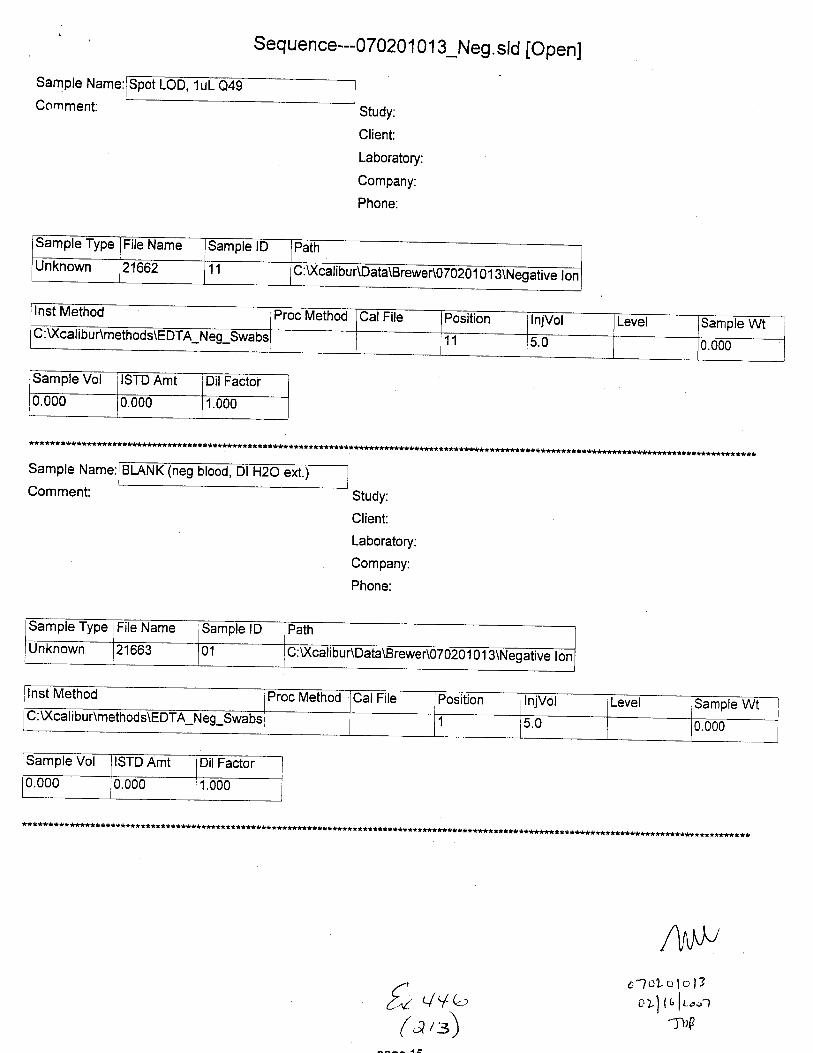
Sequenc e--07 020 1 O 1 3_Neg. std [Open]
Study:
Client:
Laboratory:
Company:
Phone:
Sample Vol ISTD Amt DilFactor
0.000 0.000 1.000
t*t*************************t*f***************************t***t********t*****************************#*****************************r******
Sample Name: neg blood, Dl H2O ext.)
Comment: Study:
Client:
Laboratory:
Company:
Phone:
Sample Type File Name Sample lD Path
Unknown 21663 101
C : Xca I i b u r\Data\B rewer\@
Sample Vol ISTD Amt DilFactor
0.000 0.000 1.000
***************i*************t**********i***********************t**************t**********i***********************************f***************
f, 4va'(a,z)
6loL ti lo l3a:-J (c lr-,.r
-Ttti'

Seq uenc e---07 020 1 O 1 3_Neg. std [Open]
Sample Name: K (neg blood, Dl H2O extJComment: Study:
Client:
Laboratory:
Company:
Phone:
sample vol ISTD Amt DilFactor0.000 u.u00 1.000
**************************************t*****i**t**************i***t*******************t**t********r*****************************************
Sample Name:
Comment:
Spot LOD, 2 uL
Study:
Client:
Laboratory:
Company:
Phone:
Sample Type File Name Sample lD Path
Unknown 21665 12 rv : \AcatrDu r\uaE\tsrewer\O/020 1 0 1 3\Negative I on
Level lSample Wt
Sample ISTD Amt Dil Factor
0.000 U.UOO l.UUO
*****************************************+***********************
a4 VV L,." .\
( r_'+ )nana'14
61aLol o l3alflofr--o?
Tlr0
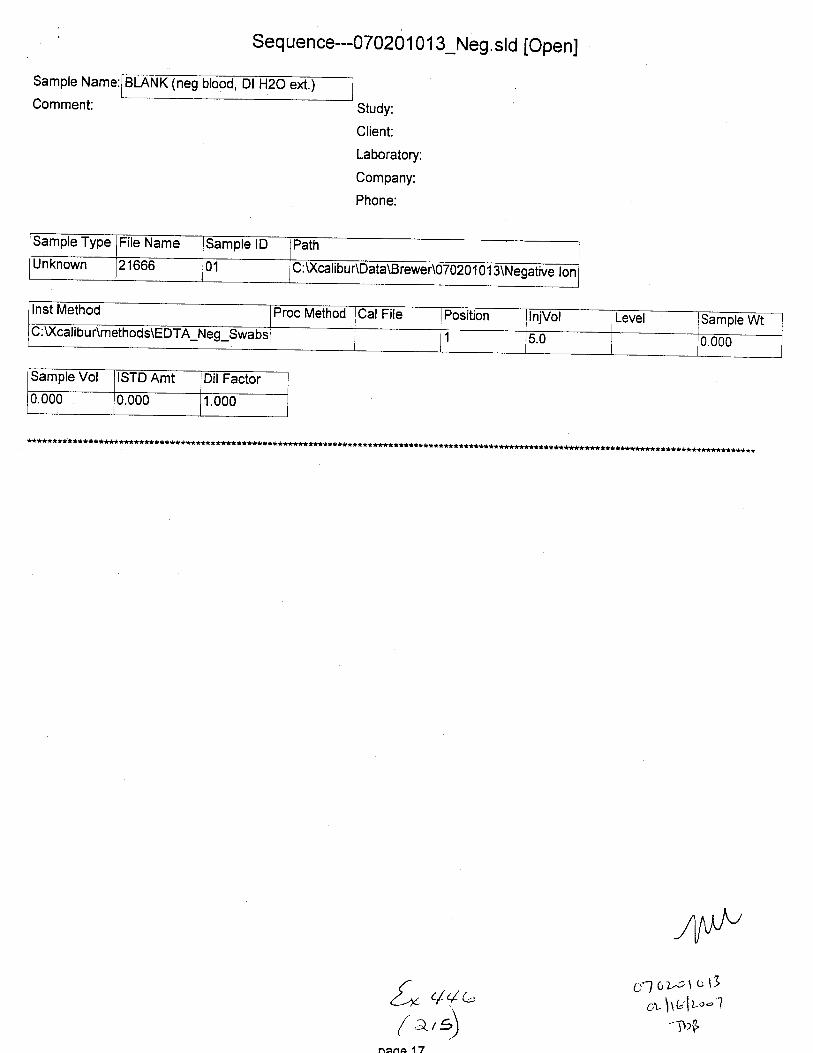
Seq uenc e--070201 01 3_Neg. std [Open]
Sample Name:1- | - -"-'' I
uomment: Study:
Client:
Laboratory:
Company:
Phone:
Sample Type File Name Sample lD Path
Unknown 21666 31 C:U(calibuAData\Brewer\0702O1 0 1 3v\legm lon
Inst Method Proc Method lCal Fite Position InjVol Level Sample WtL; : \Xcal ibu r\methods\E DTA_Neg_Swabs 1 5.0 u.000
Samole Vol ISTD Amt Dil Factor
0.000 0.000 1.000
*****************i*****t**********t****************************************************t**********t************************r****************t
g'J tt>ct tt 19
crr- \tLlr-"-'7-Tt9
t(a
nana 17
44 c-
,)
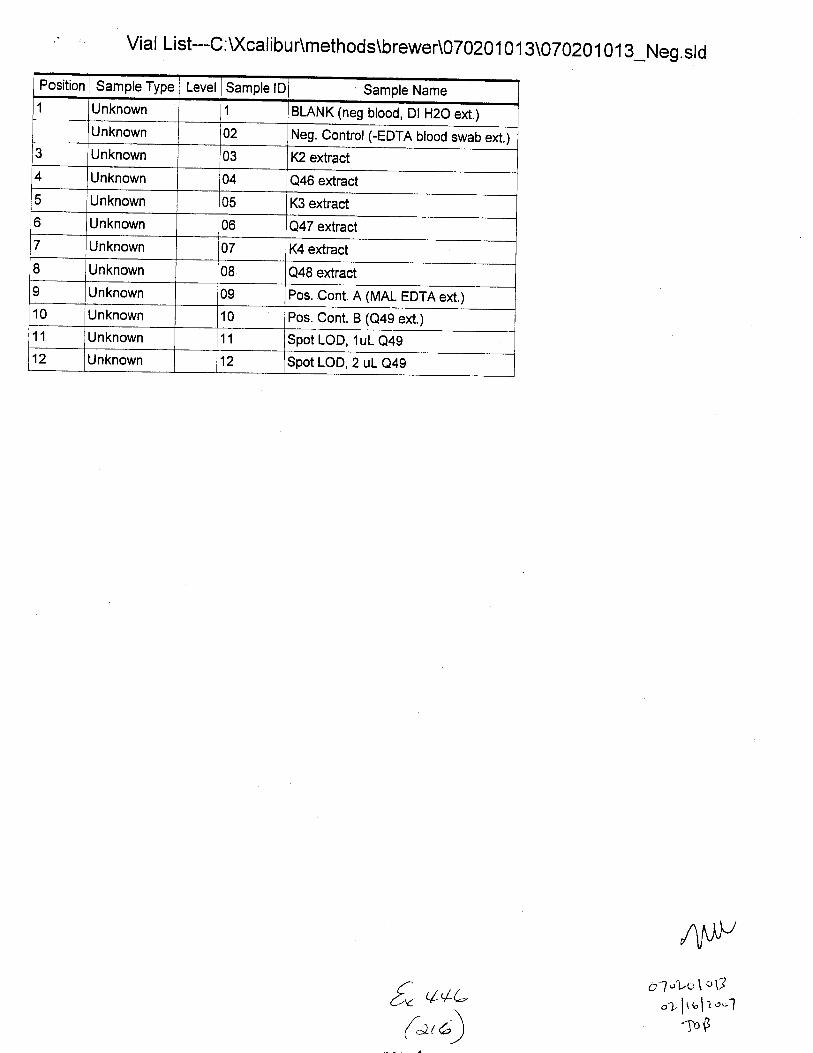
' Vial List--C:Xcalibur\methods\brewer\070201013\070201013_Neg.std
Position Sample Type Level Sample lD Sample Name1
3
Unknown 1 BLANK (neg blood, Dt H2O ext.)Unknown 02 Neg. Control (-EDTA blood swab ext.)Unknown 03 t(2 extract
4 Unknown 04 Q46 extract
c Unknown 05 K3 extract
o Unknown 06 Q47 extract
7 Unknown 07 K4 extract
8 Unknown 08 Q48 extract
9 Unknown 09 Pos. Cont. A (MAL EDTA ext.)10 Unknown 10 Pos. Cont. B (Q49 ext.)11 Unknown 11 SpotLOD, luLQ4g12 Unknown 12 Spot LOD, 2 uL Q49
a;'l "L'o\':\7"Z f
tr"lz,,*J.TDS
z* 44C/-\
/ ,-tr 4" )'_/

SOPs
5, q'l'-'(t,r)

-4r
F
FBI LaboratoryChemisry Unit
Toxicolory SubunitTox 4 I 3-0.doc
Issue Date: 0Zll5/07Revision: 0Page I of9
Analysis of EDTA in Dried Bloodstains
1 Introduction
The collection of blood at crime scenes and for legal proceedings is a common practice that maybe used to inculpate or exculpate individuals susp;ct;d of being involved in the-crime.occasionally, there are allegations that blood evidence collecteO f.or crime scenes was ,,planted',.This issue may be resolved by the determination of exogenous components in the bloodstains (e.g.preservatives) that should not be present in authentic crime scene evidence.
Ethylenediaminetetraacetic acid (EDTA) is an anti-coagulant and enzyme inhibitor that iscommonly used in blood specimen collection tubes. Blood specimen collection tubes containingEDTA have lavender-colored tops and are the most common collection tube used to collectreference specimens for DNA testing. Therefore, most allegations of blood evidence ,,planting,,focus on EDTA-preserved blood samples.
EDTA-preserved blood tubes use either the disodium, dipotassium, or tripotassium salt forms ofEDTA. The concentration of EDTA in its free acid form in a drawn blood tube is fypically1000-2000 mg[-, depending on the volume of blood and the capaciry of the tube. At thisconcentration, the free acid and salt forms of EDTA are soluble in the blood. EDTA readily formswater-soluble chelates with nearly all heavy metals, so aqueous extractions of dried blooditainsshould isolate EDTA.
2 Scope
This procedure allows for the screening and confirmation of EDTA in suspected blood stains.
3 Principle
This method takes advantage of the water solubilify of EDTA and EDTA-complexes. A driedbloodstain is first extracted with deionized water and then subjected to ultrafiltiation. Followingultrafiltration, the filtrate is analyzed by liquid chromatography/mass spectrometry/massspectrometry (LCA4SA4S) in both the positive and negative electrospray ionization (ESI) modes.
4 Specimens
This procedure can be used for assaying bloodstains from a cotton swab or other cotton-basedmatrices.
This is an uncontrolled copy of a controlled document.
n qlb/:,<\

b.
d.
e.
f.
FBI LaboratoryChemistry Unit
foxicology Subunit
,,,,.;lJ,oji;lro,;;
ff;J;'r,3
5 E q uipmen t/lVlaterials/Reagents
Guidance for the preparation of reagents may be found inthe preparation of chemical Reagentsstandard operating procedure flox iO:).
a' Liquid chromatograph/mass spectrometer equipped with a Hamilton pRp-l polymericcolumn (2.I mm x 150 mm x 5pm) or equivalint
Laboratory scissors
Millipore Amicon ultra-4 10,000 Molecular weight cutoff centrifugal Filter Device
Wheaton (or similar) pipette - 200 pL
Centrifuge
EDTA-preserved whole blood
EDTA-free whole blood
Deionized water
Acetonitrile (HPLC grade)
Ammonium Hydroxide (HPLC grade)
Deionized water (9s%) / Acetonitrire (s%) / Ammonium Hydroxid e (0.06%)_ MobilePhase for Positive Electrospray Ionization
Acetonirrile (80%) / Deionized water (20%) / Ammonium Hydroxid e (0.03%)_ MobirePhase for Negative Electrospray Ionization
Common laboratory supplies such as glassware, pasteur pipettes, etc.
6 Standards and Controls
EDTA LCA4S/MS(ESI) performance Mix_ 100 pglml-:Accurately weigh r2.7 mgof the disodium saltofE-DTA (reagent grade, Ardrich) anddilute with deionized water to a final volume of 100 rnr. btoie at room temperature in aclear glass container. Stable for at least 6 months.
This is an uncontrolled copy of a controlled document.
{u uut/\(,) /,;\

b.
FBI LabontoryChemisrry Unit
Toxicology SubunitTox 413-0.doc
Issue Date:.02l15/07
page 3 of 9
dr2-EDTA Working Internal Standard Solution _ 500 pglml:Accurately weigh 5 mg of the free acid of drz-EDTA i.;d";;grade, cambridge IsotopeLaboratories) and dilute with deionized water to a finar vJlu*Jor l0 mL. store frozen ina brown glass container. Stable for at least 6 months.
Negative Bloodstain Control:Add 50 pL of EDTA-free whore brood to a cotton-tip appricator. Dry for at least 30minutes at room temperature before use. Store at room temperature in a glass test tube orpaper envelope. Stable for at least 2 yeus.
Positive Bloodstain Control :
Add 50 pL of EDTA-preserved whole blood to a cotton-tip applicator. Dry for at least 30minutes at room temperature before use. Store at room t..p.iutur. in a glass test tube orpaper envelope. Stable for at least 2 years.
d.
7 Calibration
This procedure has not been validated for quantitative analysis.
8 Sampling
Not applicable.
9 Procedure
a.
b.
carefully cut the tip from a cotton swab (negative control, positive control, or questionedswab) using clean laboratory scissors.
Place the cotton swab tip into a separately labeled molecular weight cutoff filter device.
Add 200 pL of the drz-EDTAWorking Internal standard Solution directly to each cottonswab tip in the molecular weight cutoff filter device. Allow to sit at room temperature for45 minutes.
centrifuge the molecular weight cutoff firter device for l0 minutes atz500RpM.
copy of a controlled document.
fu uu,/at,r1
d.
This is an uncontrolled

:i:*tHr"#'*''r'i:%:li:::
Issue Date: 02/15/07
ff;:l?3e' Transfer the filtrate to an autosampler vial and inject 5 pL into the LClIr4S/lr4S system thatis in negative ion mode and monitor for both the free acid of EDTA and the EDTA-iron
complex.r SuTll:l that screen positive are confirm.o Ly in;..tion of 5 pL of the filtrateinto the LClIr'IS/l\4S system in the positive ion mode, in wtrich the free acid of EDTA canDe conllrTned.
l0 Instrumental Conditions
10.1 Liquid Chromatograph parameters
10.1.1 Positive Electrospray Ionization Mode
Mobile Phase Composition: Deionized Water (95%) / Acetonitrile (5%) / Ammonium Hydroxide(0.46%)
Column Parameters: Hamilton PRP-I (2.I mm x 150 mm x 5pm) at ambient temperature
Isocratic Flow Rate: 0.3 ml/minute
10.1.2 Negative Electrospray lonization Mode
Mobile Phase composition: Acetonitrile (80%) / Deionized water (20%) / Ammonium Hydroxide(0.03%)
Column Parameters: Hamilton PRP-l (2.1 mm x 150 mm x 5pm) at ambient temperature
Isocratic Flow Rate: 0.3 mllminute
10.2 Mass Spectrometer Parameters
10,2.1 Positive Electrospray Ionization Mode
Spray Voltage: 4.5 kV
Capillary Temperatur e: 230" C
Capillary Voltage: +30V
Collision Induced Dissociation: 100%
' See note on carryover in the Limitations section of this procedure (Section l4).
This is an uncontroiled copy of a controiled document.
L-\a Y'r \r,\/;al\
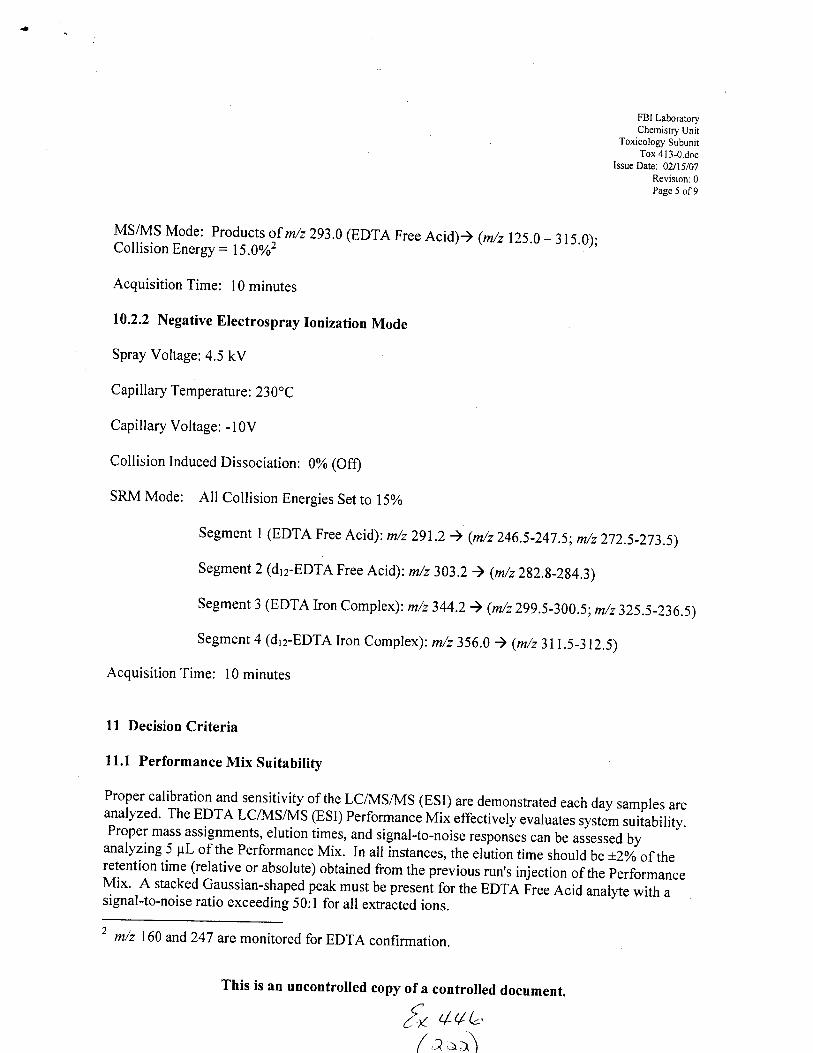
FBI LaboratoryChemistry Unit
Toxicology SubunitTox 413-0.doc
Issue Date: 02/15107
Revision: 0Page 5 of9
MSA4' Mode: orog:*::f m/z 293.0(EDTA Free Acid)) (m/z 125.0- 3 ls.0);Collision Energy = 15.0%62
Acquisition Time: l0 minutes
10.2.2 Negative Electrospray Ionization Mode
Spray Voltage: 4.5 kV
Capillary Temperatur e: 230" C
Capillary Voltage: -10V
Collision Induced Dissociation: 0% (Offl
SRM Mode: All Collision Energies Set to l5%
Segment I (EDTA Free Acid): m/z 291.2 ) (m/z 246.5-247.5; m/z 272.5-273.5)
Segment 2 (dr2-EDTA Free Acid): m/z 303.2 ) (m/zzg2,g-2s4.3)
Segment 3 (EDTA Iron Complex): m/z 344.2 ) (m/2299.5-300.5;m/z 325.5-236.5)
Segment 4 (d'2-EDTA Iron complex): m/z 356.0 ) (m/z3lr.5-312.5)
Acquisition Time: 10 minutes
11 Decision Criteria
11.1 Performance Mix Suitability
Proper calibration and sensitivity of the LCII\4S/MS (ESI) are demonstrated each day samples areanalyzed. The EDTA LCll\4SA4S (ESI) Performance Mix effectively evaluates rvrr* suitability.Proper mass assignments' elution times, and signal-to-noise responses can be assessed byanalyzing 5 pL of the Performance Mix. In all instances, the elution time should be +zyoof theretention time (relative or absolute) obtained from the previous run's injection of the performanceMix' A stacked Gaussian-shaped peak must be pr.r.ni for the EDTA Free Acid anallte with asignal-to-noise ratio exceeding 50:l for all extracted ions.
' m/z 160 and247 are monitored for EDTA confirmation.
This is an uncontrolled copy of a controlled document./'> '/ t/ /('{ Ll-v Q"/\/ ,?:r. )
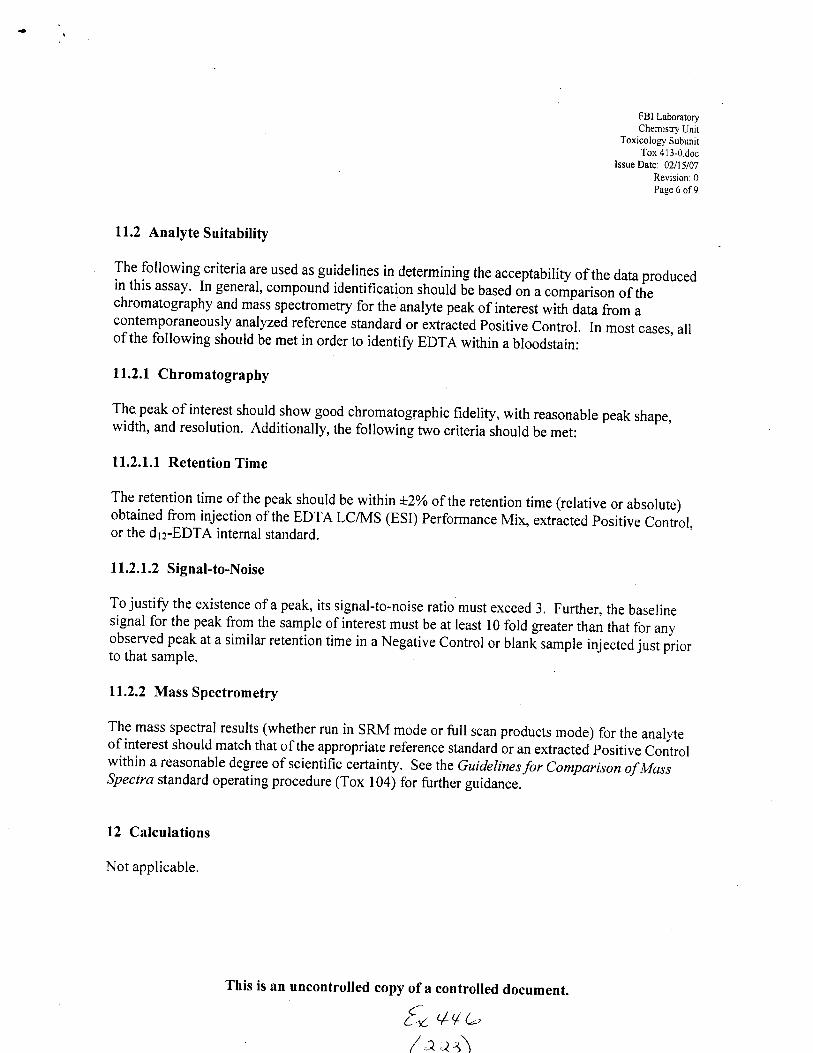
FBI LaboratoryChemistry Unit
t*''r"i:%::l:::
Issue Darc: 02/lS/07Revision:0Page 6 of9
11.2 Analyte Suitabitify
The following criteria are used as guideline_s in determining the acceptabilify of the data producedin this assay. In general, compound identification should 6e based on a comparison of thechromatography and mass spectrometry for the analyte peak of interest with data from acontemporaneously analyzed reference standard or extracted Positive Control. In most cases, allof the following should be met in order to identi8, EDTA within a bloodstain:
ll.2.l Chromatography
The peak of interest should show good chromatographic fidelity, with reasonable peak shape,width, and resolution. Additionally, the following two criteria should be met:
ll,2.l,l Retention Time
The retention time of the peak should be within +ZYo of the retention time (relative or absolute)obtained from injection of the EDTA LCA4S (ESI) Performance Mix, extracted positive control,or the drz-EDTA internal standard.
11.2.1.2 Signal-to-Noise
To justify the existence of a peak, its signal-to-noise ratio must exceed 3. Further, the baselinesignal for the peak from the sample of interest must be at least l0 fold greater than that for anyobserved peak at a similar retention time in a Negative Control or blanf sample injected just priorto that sample.
11.2.2 Mass Spectrometry
The mass spectral results (whether run in SRM mode or full scan products mode) for the analyteof interest should match that ofthe appropriate reference standard or an extracted positive Controlwithin a reasonable degree of scientific certainty. See the Guidelines for Comparison of Massspectra standard operating procedure (Tox 104) for further guidance.
l2 Calculations
Not applicable.
This is an uncontrolled copy of a controlled document.
f- +v t-,
/,e ,r a\
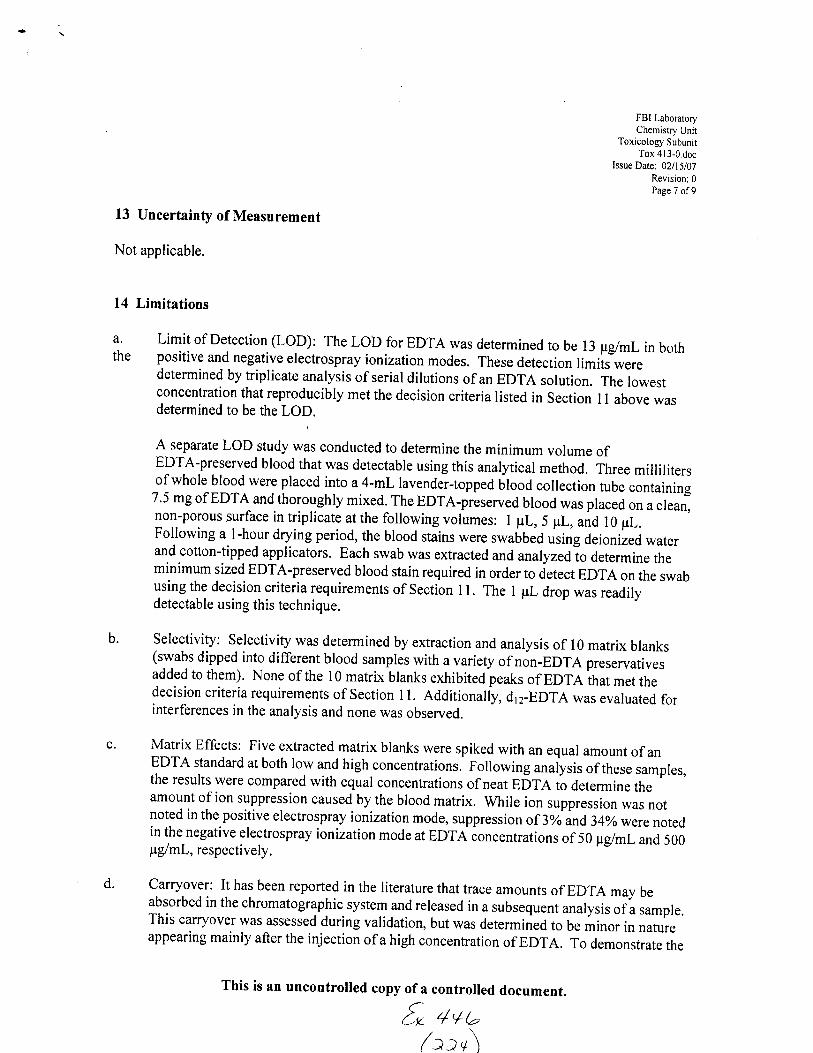
FBI LaboratoryChemistry Unit
Toxicology SubunitTox 413-0.doc
Issue Date: 02/15/07Revision: 0Page 7 of9
13 Uncertainty of Measurement
Not applicable.
l4 Limitations
a' Limit of Detection (LoD): The LoD for EDTA was determined to be 13 pglml in boththe positive and negative electrospray ionization modes. These detection limits weredetermined by triplicate analysis of serial dilutions of an EDTA solution. The lowestconcentration that reproducibly met the decision criteria listed in Section l l above wasdetermined to be the LOD.
b.
A separate LoD study was conducted to determine the minimum volume ofEDTA-preserved blood that was detectable using this analytical method. Three millilitersof whole blood were placed into a 4-mL lavendei-topped blood collection tube containing7'5 mg of EDTA and thoroughly mixed. The EDTA-prbserved blood was placed on a clean,non-porous surface in triplicate at the following volumes: I pL, 5 pL, and l0 pL.Following a I -hour drying period, the blood stains were swabbed using deion lzed waterand cotton-tipped applicators. Each swab was extracted and analyzedio determine theminimum sized EDTA-preserved blood stain required in order to detect EDTA on the swabusing the decision criteria requirements of Section I l. The I pL drop was readilydetectable using this technique.
Selectivity: Selectivity was determined by extraction and analysis of l0 matrix blanks(swabs dipped into different blood samples with a variety of non-EDTA preservativesadded to them). None of the l0 matrix blanks exhibited peaks of EDTA ihat met thedecision criteria requirements of Section I l. Additionally, d12-EDTA was evaluated forinterferences in the analysis and none was observed.
Matrix Effects: Five extracted matrix blanks were spiked with an equal amount of anEDTA standard at both low and high concentrations. Following analysis of these samples,the results were compared with equal concentrations of neat pOfe to determine theamount of ion suppression caused by the blood matrix. While ion suppression was notnoted in the positive electrospray ionization mode, suppression of 3% ind34olo were notedin the negative electrospray ionization mode at EDTA ioncentrations of 50 pglmLand 500p,g/mL, respectively.
Carryover: It has been reported in the literature that trace amounts of EDTA may beabsorbed in the chromatographic system and released in a subsequent analysis of a sample.This carryover was assessed during validation, but was determined to be minor in nafureappearing mainly after the injection of a high concentration of EDTA. To demonstrate the
This is an uncontrolled copy of a controlled document.(-'Cr ///(-
z\())'/\
d.

:?::lffi!"#'*'?i:%::fi:x
Issue Date: 02/lS/0i
il:lT,3lack of carryover within an analytical run, a minimum of two matrix-matched negativesamples (i.e. whole blood extracts) must be analyzed between case samples.
15 Safety
Take standard precautions for the handling of chemicals and biological materials. Refer to the FBILaboratory Safety Manual for guidance.
16 References
Miller, M.L., Mccord, 8.R., Martz, R., and Budowle, B. "The Analysis of EDTA in DriedBloodstains by Electrospray LC-MS-MS and Ion Chromatography", Journal of AnalyticalToxicologt, Vol. 2 l, 1997, 521 -528.
Sheppard, R.L. and Henion, J. "Determining EDTA in Blood", Analytical Chemistry,Vol. 69,1997,477A-480A.
Preparation of Chemical Reagents (Tox 103); FBI Laboratory Chemistry Unit - ToxicologySubunit SOP Manual.
Guidelinesfor Comparison of Mass Spectra (Tox 104); FBI Laboratory Chemistry Unit -Toxicology Subunit SOP Manual.
FBI Laboratory Chemistry Unit - Instrument Operation and Support Subunit SOp Manual.
FBI Laboratory Safety Manual.
This is an uncontrolled copy of a controlled document.
| ,/t/ /
a-1/ V V tz"z^-.--\( 4 4> )

FBI LaboratoryChemistry Unir
Toxicology SubunitTox 4 I l-0.doc
Issue Datc: 02115107
Revision: 0Page 9 ol'9
Rev, # Issue Date
0
Approval
Chemistry Unit Chief:
OA Approval
Quality Manager:
Issuance
Tox Subunit Manager:
02/15t07 New document.
O{/a^-Fg-Marc A. LeBeau
n/r.lnoate:4lSllOOT
This is an uncontrolled copy of a controlled document./'tr 446
,Z --- -\/ ..x,i (. I
Madeline A. Montgomery

FBI Laboratory
rnsrmment opera,'"" u ffiffH#lillnst 202-0.doc
'** o"?.lu,li"'Jo8
Page I ofS
Performance Monitoring protocol (eA/eC)for the Finnigan LCe LCIMS (ESI)
I Scope
This document addresses the performance monitoring (QA/QC) of the Finnigan LCe LCA{Ssystem consisting of a Finnigan LCQ MS and a waters LC. it ls an analytical instrument used toanalyze a wide variety of evidence and must be maintained in such u *uy as to verify itsreproducibility from analysis to analysis and its reliability in court.
2 Principle
The LCQ system is comprised of a Waters Liquid Chromatograph (LC) and a Finnigan ion trapLCQ Mass Spectrometer (MS). The instrument is configurei with an ApI source th-at is capableof both electrospray (ESI) and atmospheric pressure chemical (APCD ionization. Theinstrument is primarily used in ESI mode. However, this protocol can also be used for ApCIprovided the method of ionization is clearly labeled in the resulting data and documentation.Definitions and guidelines for following this protocol are outlined in the ,,General InsrrumentMaintenance Policy."
E q u i p m en t/UIateria ls/Rea gen ts
Instrumentation - Finnigan LCQ MS, API Source, Waters Alliance 2690/2695 LC,and Data System with XCalibur software (or equivalent)
API Gas - Nitrogen, 9999% (high purity or equivalent)
Ion Trap Gas - Helium,99.99%o (high purity or equivalent,l
Methanol, HPLC grade
Deionized Watero 18 MO Milli-e or equivalent
Acetonitrile, HpLC grade
Acetic Acid, reagent grade
This is an uncontrolled copy of a controlled document.
a.
b.
d.
e.
g
{x 44 t-
l"D

h.
t.
j.
k.
t.
FBI Laboratory
rnsrrument opera,,.. * s:|;TigoYil:Inst 202-0.d0c
Issue Date:06/21106
page 2 of 8
Ultramark 1621 (Finnigan or equivalent)
Caffeine (Sigma or equivalent)
MRFA (L-methionyl-arginyl-phenylalanyl-alanine acetate) (Finnigan or equivalent)
Ammonium Hydroxide (l.lH4OH), reagent grade
Codeine (Sigma or equivalent)
Brucine (Sigma or equivalent)
Reserpine (Sigma or equivalent)
Volumetric glassware
Infusion syringe - l0 to 500 pL LC syringe (Hamilton or equivalent)
4 Standards and Controls
4.1 Testmix
The Testmix is used to assess daily operating performance, mass assignment, and continuedintegrity of the system. To prepare, weigh 5.0 mg caffeine, 1.0 mg cod.in", 1.0 mg brucine, and1.0 mg reserpine into a 100-mL volumetric flask. Bring to the mark with methanol and mix well.Store the solution in the refrigerator. It has a shelf-lifJof three years. This preparation may be
appropriately scaled up.
4.2 Calibration Solution
The calibration solution is used for coarse tuning and calibrating the mass spectrometer over theentire mass range. This procedure only needs to be performed when the instiument has beenmoved, down for a long period of time, undergone i major repair, or wananted based on systemperformance.
The calibration solution is a solution of caffeine, MRFA, and ultramark l62l inacetonitrile:methanol:water containing l% acetic acid. To prepare this solution, follow theprocedure in the LCQ'Getting Started'manual. Store the solution in the refrigerator. It has ashelf-life of three years. This preparation may be appropriately scaled up.
This is an uncontrolled copy of a controlled document.
n.
h|'.
{" q'/ u(rr)

FBI LaboratoryChemisfy Unit
lnstrument Operation & Support SubunitInst 202-0.doc
Issue Dale: 06/21/06Revision: 0
Page 3 of8
5 Calibration
The calibration procedure should be performed as needed, when the instrument has been moved,down for a long period of time, undergone a major repair, or warranted based on systemperforrnance.
a. Load a 250 1tL syringe with the calibration solution.
b. Using capillary tubing, connect the infusion syringe to the ESI probe assembly, andplace in the syringe pump.
c. Set the syringe pump to the correct syringe fype and set the pump rate tolQpllminute.
d. Load the tune file "ESI_TL|NE" (or equivalent).
e. Check that instrument is in POSITIVE ION mode and collecting CENTROID data.
f. Set the detector using the parameters listed in the 'Instrumental Conditions'section ofthis protocol.
g. Turn on the syringe pump and verif, that the solution is flowing out the ESI needle.
h. Engage the ESI probe and turn on the MS.
i. In Tune Plus, open the Calibrate dialog box, choose the'Automatic'tab and check theindividual tests or'Select All' and then 'Start.'
j. When the calibration is complete, it will display whether or not the calibration wassuccessful.
o Ifthe procedure fails, repeat the calibration.r When the procedure passes, print the report and evaluate the calibration
solution spectrum using the'Decision Criteria' section of this protocol. If theresults are acceptable, print the spectrum of the calibration solution.
k. If all requirements are within specification, prepare the documentation as outlined inthe "General Instrument Maintenance Policy." If any requirements fail, the IOSS
This is an uncontrolled copy of a controlled document.
a^L 44 G\
/aa'i \'./
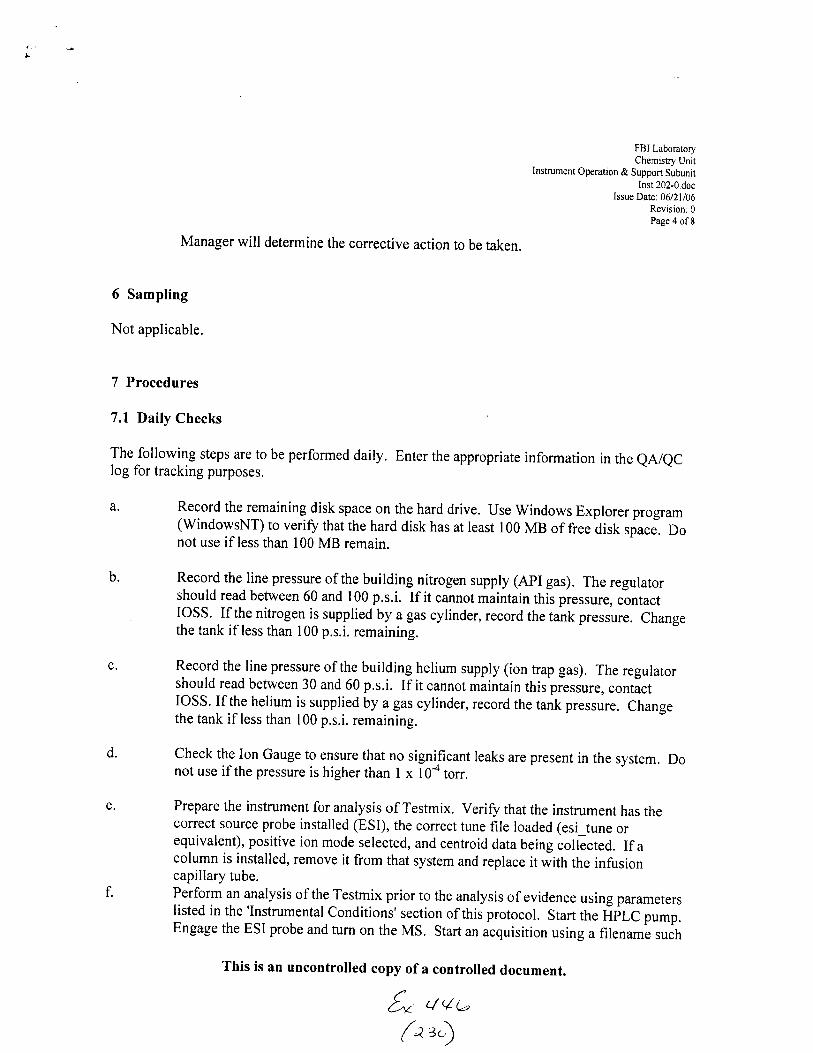
a.
b.
FBI Laboratory
rnstrument operat,." . fliTJHoYlilInst 202-0.doc
Issue Date: 06/2l/06
ff;:1?3Manager will determine the corrective action to be taken.
6 Sampling
Not applicable.
7 Procedures
7.1 Daily Checks
The following steps are to be performed daily. Enter the appropriate information in the eA/eClog for tracking purposes.
Record the remaining disk space on the hard drive. Use Windows Explorer program(WindowsNT) to verifu that the hard disk has at least 100 MB of free disk space-. Donot use if less than 100 MB remain.
Record the line pressure of the building nitrogen supply (ApI gas). The regulatorshould read between 60 and 100 p.s.i. If it cannot maintain thii pressure, contactIOSS. If the nitrogen is supplied by a gas cylinder, record the tank pressure. Changethe tank if less than 100 p.s.i. remaining.
Record the line pressure of the building helium suppry (ion trap gas). The regulatorshould read between 30 and 60 p.s.i. If it cannot maintain this pressure, conracrIoss. If the helium is supplied by a gas cylinder, record the tank pressure. changethe tank if less than 100 p.s.i. remaining.
Check the Ion Gauge to ensure that no significant leaks are present in the system. Donot use if the pressure is higher than I x l0-a torr.
Prepare the instrument for analysis of Testmix. Verifu that the instrument has thecorrect source probe installed (ESI), the correct tune file loaded (esi_tune orequivalent), positive ion mode selected, and centroid data being collected. If acolumn is installed, remove it from that system and replace it wittr the infusioncapillary tube.Perform an analysis of the Testmix prior to the analysis of evidence using parameterslisted in the 'Instrumental Conditions' section of this protocol. Start the ftplC pump.Engage the ESI probe and turn on the MS. Start an acquisition using a filenam! such
This is an uncontrolled copy of a controlled document.
t" 4qa{a zr)
d.
e.

FBI Laboratory
rnstrument operat'.,' u rililiH#lilInst 202-0.doc
Issue Date: 06/2l/06
lilii[!as'testmix'(or equivalent). Make three 5 pL injections of the Testmix solutionapproximately l0 seconds apart by using the manual loop injector, and then stop thedata collection. Evaluate the results using the 'Decision Criteria' section of thisprotocol. If the results are acceptabte, print the TIC and spectra for all components inthe Testmix.
g' If all requirements are within specification, prepare the documentation as outlined inthe "General Instrument Maintenance Policy." If any requirements fail, contactIOSS.
7.2 As Needed Checks
b.
Re-cut or replace the sample capillary as needed.
Clean or replace the heated capillary as needed.
8 Instrumental Conditions
Refer to the "General Instrument Maintenance Policy" for procedures on minor deviations.
8.1 Testmix
Liquid ChromatographMobile Phase:Flow Rate:
Column:Inj Volume:Number of Inj:
Mass SpectrometerIonization:Tune File:Scan Mode:Scan Range:
95:5 methanol:water + 0.03% ammonium hydroxide0.2 mllminNone5pL
aJ
ESIesi_tuneFull Scan100-650 m/z
This is an uncontrolled copy of a controlled document.
{a uVt( a st-)

+I
FBI LaboraroryChemistry Unit
Instrument Operation & Support SubunitInst 202-0.doc
Issue Date: 06/21/06Revision: 0page 6 of g
8.2 Calibration
Mass SDectrometerIonization:Tune File:Scan Mode:Scan Range:
9 Decision Criteria
9.1 Testmix
ESIesi_tuneFull Scan100-2000 m/z
Verifu the results of the Testmix. The following ions should be observed in the three Testmixinjections:
o Caffeine 195 m/zo Codeine 300 mlzr Brucine 395 mlz. Reserpine 609 mlz
9.2 Calibration
Verify the results of the calibration. The calibration will indicate if the procedure wassuccessful. The individual ions for the calibration solution are:
r Caffeineo MRFAr Ultramark
195 mlz524 mlz1022 mlzll22 m/z1222 mlz1322 mlz1422 m/z1522 mlz1622 mlz1722 m/z1822 mlz1922 mlz
greater than 5Yo
greater than 50%greater than 5Yo
greater than 20o/o
greater than 50Yogreater than 50Yogreater than 80%o
greater than 50%o
greater than 50Togreater than 20%o
greater than 10%o
present
copy of a controlled document.
n (vu,(a s"t)
This is an uncontrolled
.a\I
FBI Laboratory
rnsrrument op€rat'," * f liTJHrYlilInst 202-0.doc
Issue Date: 06/21106
ff;:'il,310 Calculations
Not applicable.
ll Uncertainty of Measurement
Not applicable.
12 Limitations
Only properly trained personnel shall perform duties involved in the operation, maintenance, ortroubleshooting of this instrument.
13 Safefy
Take standard precautions for the handling of all chemicals, reagents, and standards. Refer tothe FBI Laboratory Saf"ty Manual for the proper handling and disposal of all chemicals.Personal protective equipment should be used when handling any chemical and when performingany type of analysis. Many instrument components are held at temperatures of 250oC andhigher. Precautions should be taken to prevent the contact of skin with heated surfaces andareas.
14 References
Manufacturer's Instrument Manuals for the specific models and accessories used.
"General Instrument Maintenance Policy" (Inst 001) Instrument Operation and Support SubunitSOP Manual.
"Liquid Chromatograph General Maintenance Protocol" (Inst 003) Instrument Operation andSupport Subunit SOP Manual.
"Mass Spectrometer General Maintenance Protocol" (Inst 004) Instrument Operation andSupport Subunit SOP Manual.
FBI Laboratory Safety ManuaL
This is an uncontrolled copy of a controlled document.
5"(a
4qa*)

I{u-r'. # lssuc f]ntc liistnn'
I'lJI Litlt,.rntt:ntllr{lrrrtn. L trt
ltlrtrrln\-rt ( ip,:ratl,.rr: & iupprri _,iuhunrt
Inrr lU1.{r rl,;rhrur i.l;rtc 0rr,: | iln
l{cfrjilrn lll',rr,c K nt i\
il li(i,'llltlii \,{rr dncumcnt rvhiqh l:tflau$s trriginal fitlsd '.pLrrlirrntilns(:lr'truritoring Pror(,col ruAiQCl lor rhr iiinnignn t"ce LC/irJs(ESI)."
..tnnrur:ul
illrcmistry l-init Chief:
O,,\ 'lnnrovrtl
Qualitl'Nlar:as,rr:
lssu*ncc
IOSS f,{enarrcr:
-r4, J , ,''tilr.,. \3 'Ot, rWU- t ..r'-./"L-r--' Dl.r.tc:
l\lrrt ""\" L-sBt:ilu
l)ate:.lrtlirr' I
This is an uncontrolled copy of a controlled document.
I*tiborp$e-ir
{) qv L'
(tt)
Rutilr"i Bl Snscv
FBI LabontoryChemistry Unit
Toxicolory SubunitTox l034.doc
Issue Date: 10/27/2006Revision: 2
Page I of 15
Preparation of Chemical Reagents
I Scope
This procedure provides instructions for the preparation and storage of all reagents used in thevarious standard operating procedures of the Chemistry Unit's Toxicology Su-bunit. Thisdocument does not provide information for materials used directly as obiained from themanufacturer. Neither does it provide instructions for the preparation of calibrators, controls, oranalytical standards. Prepared reagents are listed, in alphabetical order, in section 6, ,,procedure,,and materials needed for preparation of these reagents are listed in section 2,o,Equipment/Materials/Reagents." Refer to the Chemistry (Jnit Procedure for Verification of'Re'agents, Kits,Solvents and Standards (CUQA 9) for guidance in labeling and testing the reliabilirylf reagents.
2 Equipment/lVlaterials/Reagents
a. Electronic balance
b. pH paper in various ranges
Ultrasonicator
vacuum filtration apparatus (l liter size) with 0.5 pm prFE filter membranes
Miscellaneous routine laboratory glassware and supplies
Acetic acid, glacial(17 M) (ACS grade)
Acetonitrile (HPLC grade)
Ammonium acetate (reagent grade)
Ammonium hydroxide, concentrated (15 M) (ACS grade)
Calcium chloride (reagent grade)
Chloramine T (reagent grade)
Chloroform (GC2 grade and HpLC grade)
o-Cresol (reagent grade)
c.
d.
o
h.
J.
k.
l.
This is an uncontrolled copy of a controlled document.
{-u v+t-/a ss\
m,
FBI LaboBtory
,"*:li"H'g#li:Tox I 03-2.doc
rssueDate: l:i1lf::t
Page2ofl5
n. Cupric sulfate pentahydrate (reagent grade, CuSOa.5H2O)
o. Curcumin (reagent grade)
p. Diethyl ether (high purity grade)
q. Dimethylsulfoxide (ACS grade)
r. Diphenylamine (reagent grade)
s. Ethyl acetate (HPLC grade)
t. Ethyl alcohol (200 proof and pharmaceutical grade)
u. Ferric chloride hexahydrate (reagent grade, FeCls.6HzO)
v. Ferric nitrate nonahydrate (reagent grade, Fe(NO3)3,9H2O)
w. Gold(III) chloride hydrochloride trihydrate (reagent grade, HAucl+.3Hzo)
x. Heptafluorobufyric acid (aka HFBA) (reagent grade)
y. Hexamethonium hydroxide solution, 0.1 M (obtained from Fluka Chemical Company)
z. Hexane (UV grade)
aa. Hydrochloric acid, concentrated (12 M) (ACS grade)
bb. Indigo Carmine (reagent grade)
cc. Iodine (reagent grade)
dd. Isopropanol (2-propanol) (HPLC grade)
ee. Magnesium nitrate (high purity grade I)
ff. Mercuric chloride (reagent grade, HgCl2)
eg. Methanol (GC2 grade and HPLC grade)
hh. Methylene Chloride (dichloromethane) (HPLC grade)
ii. Nitric acid, concentrated (16 M) (ACS grade and optima grade)
This is an uncontrolled copy of a controlled document.) t/t)t(-s- YY 2,
./r-ri\

:?:tlHr"#'*'1.1:?r::,::::
Issue Date: 1012712006
Revision: 2
Page 3 of 15
jj. Palladium matrix modifier solution (0.1% obtained from High-Purity Standards,Inc.)
kk. PIC reagent (methanesulfonic acid) (reagent grade)
ll' PICB-8 reagent (octanesulfonic acid) (low UV grade obtained from Waters Corp.)
mm. Potassium cyanide (reagent grade)
nn, Potassium ferricyanide (reagent grade)
oo. Potassium hydroxide (reagent grade)
pp. Potassium iodide (reagent grade)
qq. Potassium phosphate, monobasic (ACS grade, KH2pOa)
rr. Pyromellitic acid (reagent grade)
ss. Saponin (reagent grade)
tt. Silver nitrate (reagent grade)
uu. Sodium acetate trihydrate (reagent grade)
vv. Sodium bicarbonate (reagent grade)
ww. Sodium borate (sodium tetraborate decahydrate) (ACS grade, NazB+oz.l0H2o)
xx. Sodium chloride (reagent grade)
W. Sodium dithionite (reagent grade)
zz. Sodium hydroxide (ACS grade)
aaa. Sodium phosphate, dibasic heptahydrate(ACS grade, Na2HpO4.7H2O)
bbb. Sodium phosphate, monobasic monohydrate (ACS grade, NaHzpO+.HzO)
ccc. Sulfuric acid, concentrated (18 M) (ACS grade)
ddd. Tetramethylammonium hydroxide (ACS grade)
This is an uncontrolled copy of a controlled document.(/ ((-
/' ,l z,t\

fff.
FBI LaboratoryChemistry Unit
Toxicology SubunitTox 103-2.doc
Issue Date: 10127 12006
Revision: 2
Page4ofl5
Toluene (HPLC grade)
Triethanolamine (reagent grade)
ggg. Trifluoroacetic acid (98+% purity)
hhh. Water, Deionized (18+MO grade)
3 Standards and Controls
Not applicable.
4 Calibration
Not applicable.
5 Sampling
Not applicable.
6 Procedure
Unless specifically noted otherwise, all reagents can be prepared in larger or smaller total volumes,as needed, by appropriate scaling of component volumes and masses. Listed grades or qualities ofchemicals are the minimum acceptable levels. Unless specifically noted otherwise, a higherquality of the same chemical may be substituted.
a. 50 mM Acetic Acid:To a 100-mL graduated cylinder, add 80 mL deionized water and 0.25 mL glacial aceticacid. Mix well and bring to 85 mL with deionized water. Store in glass at roomtemperature. Stable 3 months.
b. 0.1 M Acetic Acid:To a 100-mL graduated cylinder, add 80 mL deionized water and 0.5 mL glacial acetic acid.Mix well and bring to 85 mL with deionized water. Store in glass at room temperature.Stable 3 months.
This is an uncontrolled copy of a controlled document.
€. qVL1a ss)
d.
ob.
h.
FBI LaboratoryChemistry Unit
Toxicology SubunitTox I 03-2.doc
lssue Date: 10/27/2006Revision: 2
Page5ofl5
Dilute (- 1.5 M) Acetic Acid:Mix 2 mL glacial acetic acid with 20 mL deionized water and shake to combine. Store inglass at room temperature. Stable 3 months.
I : I Acetonitrile:Water:Combine 100-mL HPLC grade acetonitrile with 100 mL deionized water and mix well.Store in glass at room temperature. Stable 6 months.
0.1 M Ammonium Acetate:Add 3.85 g ammonium acetate to a 500-mL volumetric flask containing 300 mL deionizedwater. Mix well to dissolve, and bring to volume with deionized water. Store inrefrigerated in glass. Stable 2 months.
0.24 M Ammonium Hydroxide:Add 1.6 mL concentrated ammonium hydroxide to 50 mL deionized water in a 100-mLgraduated cylinder. Fill to the 100-mL mark with deionized water and mix well. Store inglass at room temperature. Stable I month.
2 M Ammonium Hydroxide:Add l0 mL concentrated ammonium hydroxide to 50 mL deionized water in a 100-mLgraduated cylinder. Fillto the 75-mL mark with deionized water and mix well. Store inglass at room temperafure. Stable I month.
5% (wlv) Calcium Chloride Solution:Dissolve I g calcium chloride in 20 mL deionized water. Store in glass at roomtemperature. Stable I year.
CE (Capillary Electrophoresis) Run Buffer - Anions:To a 1000-mL volumetric flask, add 500 mL deionized water, 612 mgpyromellitic acid,280 mg sodium hydroxide, 238 mg triethanolamine, and 7.5 mL 0.1M hexamethoniumhydroxide solution. Mix wellto dissolve, and bring to volume with deionized water. Storerefrigerated in plastic. Stable I week.
05% (wlv) Chloramine T:To a 100-mL volumetric flask, add 80 mL deionized water and 0.5 g chloramine T. Mixwell to dissolve and bring to volume with deionized water. Store refrigerated in glass.Stable 6 months.
4: I Chloroform:Methanol:Combine 40 mL GC2 grade chloroform with l0 mL GC2 methanol. Mix well. Store inbrown glass at room temperature. Stable I month.
k.
This is an uncontrolled copy of a controlled document.
Zr '14 L,'\{s t+\

m.
n.
p.
q.
FBI LaboratoryChemistry Unit
Toxicology SubunitTox 103-2.doc
Issue Date: 10127/2006
Revision: 2
Page 6 of l5
l% (by volume) o-Cresol:Place I mL o-cresol in a 100-mL volumetric flask and fill to the mark with deionized water.Mix well and allow to stand for at least 24 hours before use. Store refrigerated in brownglass. Stable 6 months.
5% (w:v) Cupric Sulfate Solution:Dissolve 1.56 g cupric sulfate pentahydrate in 20 mL deionized water. Store in slass atroom temperature. Stable I year.
Curcumin Solution (saturated in ethanol):Add curcumin to l0 mL 200 proof ethanol in a test tube with mixing until no more willdissolve. Centrifuge at low speed for 5 min and transfer the supernatant. Store in glass atroom temperature. Stable 1 year.
Cyanmethemoglobin Reagent (Drabkin's Solution):To a 1000-mL volumetric flask containing 500 mL deionized water, add 200 mg potassiumfenicyanide, 50 mg potassium cyanide, and I g sodium bicarbonate. Mix well to dissolveand bring to volume with deionized water. Store refrigerated in brown glass. Stable 4months.
Diphenylamine Reagent (05% w:v in sulfuric acid):Dissolve 0.5 g diphenylamine in 100 mL concentrated sulfuric acid. Store in glass with aPTFE-lined cap at room temperature. Stable I year.
80% (by volume) Ethanol:Measure 80 mL pharmaceutical grade ethanol into a 100-mL volumetric flask. Bring tovolume with deionized water and mix well, Store in glass at room temperature. Stable for6 months.
l:l Ether:Toluene:Combine 50 mL HPLC grade toluene with 50 mL diethyl ether. Mix well. Store in slassat room temperature. Stable I month.
5% (wlv) Ferric Chloride Solution:Dissolve 1.67 g fenic chloride hexahydrate in 20 mL deionized water. Store in slass atroom temperature. Stable I year.
05% (w/v) Gold Chloride Solution:Dissolve 130 mg gold(IID chloride hydrochloride trihydrate in 20 mL deionized water.Store in brown glass at room temperature. Stable I year.
This is an uncontrolled copy of a controlled document.
a^t 4( b/ j,/c,\

:?:*1'f,11'#
'*111?,::*::Issue Date: l0n7/2006
Revision: 2
PageTofl5
u. 0.1% (w/v) Heptafluoroburyric Acid:Add 0.5 g HFBA to 400 mL deionized water in a 500-mL volumetric flask and mix well.Bring to volume with deionized water. Store in glass at room temperature. Stable 3months.
w.
X,
v.
aa.
bb.
2mM Hydrochloric Acid:In a 100-mL volumetric flask, combine g0 mL deionized water with l6hydrochloric acid and mix well. Bring to volume with deionized water.room temperature. Stable 6 months.
pl concentratedStore in glass at
0.1 M Hydrochloric Acid:To a 100-mL graduated cylinder, add 80 mL deionized water and 0.8 mL concentratedhydrochloric acid. Bring to 96 mL with deionized water and mix well. Store in slass atroom temperature. stable 6 months.
0.96 M Hydrochloric Acid:To a 100-mL volumetric flask, add 80 mL deionized water. Add S mL concentratedhydrochloric acid and mix well. Bring to volume with deionizedwater. Store in glass atroom temperature. Stable 6 months.
I M Hydrochloric Acid:To a 100-mL graduated cylinder, add 80 mL deionized water. Add 8 mL concentratedhydrochloric acid and mix well. Bring to 96 mL with deionized water. Store in glass atroom temperature. Stable 6 months.
6 M Hydrochloric Acid (- 50% v:v):To a 25-mL graduated cylinder containing l0 mL deionized water, add l2 mLconcentrated hydrochloric acid and mix well. Bring to 24 mLwith deionized water. Storein glass at room temperature. Stable 6 months.
0.01% (w/v) Indigo Carmine Reagent:Dissolve l0 mg indigo carmine in 100 mL deionized water. Store in glass at roomtemperature. Stable I year.
Iodine Test Solution:Dissolve 0.4 g iodine and 0.6 g potassium iodide in 20 mL deionized water. Store in qlassat room temperature. Stable 6 months.
LC (Liquid chromatography) Mobile phase - Alkaline#l / cocaine (95:5:0.03methanol :water:ammonia) :
Combine 950 mL HPLC grade methanol and 50 mL deionized water. Mix well andvacuum filter through a 0.5 pm PTFE membrane. Add 0.3 mL concentrated ammonium
This is an unco.ntrolled copy of a controlled document.
a-,/ UYG/:>+t\
dd.
. FBI LaboratoryChemistry Unit
Toxicology SubunitTox I 03-2.doc
Issue Date: 10/27/2006Revision. 2
page 8 of 15
hydroxide and mix gently. Veriff pH>8. Store in glass at room temperature. Stable Imonth.
LC Mobile Phase - Alkaline#2 (5:95:0.03 methanol:water:ammonia):Combine 25 mL HPLC grade methanoland 475 mL deionized water. Mix well andvacuum filter through a 0.5 pm PTFE membrane. Add 0.15 mL concentrated ammoniumhydroxide and mix gently. Verif, pH>8. Store in glass at room temperature. Stable Imonth.
LC Mobile Phase - Benzodiazepines (60 :40 :0.03 methanol:water:ammonia):Combine 300 mL HPLC grade methanol and 200 mL deionized water. Mix well andvacuum filter through a 0.5 pm PTFE membrane. Add 0.15 mL concentrated ammoniumhydroxide and mix gently. Verifu pH>8. Store in glass at room temperature. Stable Imonth.
LC Mobile Phase - Rodenticide #l (0.1% acetic acid in water):Vacuum filter 500 mL deionized water through a 0.5 pm PTFE membrane. Add 0.5 mLACS grade glacial acetic acid. Store in glass at room temperature. Stable I month.
LC Mobile Phase - Rodenticide #2 (0.1% acetic acid in methanol):Vacuum filter 500 mL Optima grade methanol. Add 0.5 mL ACS grade glacial acetic acid.Vacuum filter through a 0.5 pm PTFE membrane. Store in glass at room temperature.Stable I month.
LC Mobile Phase - Mivacurium #l (acetonitrile):Measure out 1000 mL HPLC grade acetonitrile and vacuum filter through a 0.5 pm pTFEmembrane. Store in glass at room temperature. Stable 2 months.
LC Mobile Phase - Mivacurium#Z (5 mM octanesulfonic acid):Quantitatively transfer the contents of one vial of PICB-8 reagent into a 1000-mLvolumetric flask and bring to the mark with deionized water. Vacuum filter through a 0.5pm PTFE membrane. Store in glass at room temperature. stable I month.
LC Mobile Phase - Mivacurium MSMS (40 : 60 :0.0 I 5 acetonitrile:water:methanesulfonicacid):Combine 200 mL HPLC grade acetonitrile, 300 mL deionized water, and 75 pl pIC reagent.vacuum filter through a 0.5 pm PTFE membrane, and verifu 2<pH<3.5. Store at roomtemperature in brown glass. Stable I month.
LC Mobile Phase - Succinylmonocholine #l (92:8:0.1 water:methanol:pIC reagent):Combine 460 mL deionized water, 40 mL HPLC methanol, and 0.5 mL pIC ..["ni. tuti*well and vacuum filter through a 0.5 pm PTFE membrane. Store ar room remperature inbrown glass. Stable for I month.
This is an uncontrolled copy of a controlled document.
Zr 4t/u/a v;\
ff.
goEE'
hh.
ll.
jj.
kk.
oo.
pp.
qq.
FBI Laboratory
t"-':j,'"H'H#lllTox 103-2.doc
Issue Date: 10/27/2006Revision: 2
Page9ofl5
ll. LC Mobile Phase- Succinylmonocholine #z(80:15:4.75:0.25 0.1% HFBA:g.1 Mammonium acetate:acetonihile: isopropanol) r
Combine 400 mL 0.1% heptafluorobutyric acid,75 mL 0.1 M ammonium acetate,23.75mL HPLC grade acetonitrile, and 1.25 mL HPLC grade isopropanol. Mix well andvacuum filter through a 0.5 pm PTFE membrane. Store in glass at room temperature.Stable I month.
mm. l:l Methanol:Dilule Hydrochloric Acid:Combine 2 mL GC'grade methanol with 2 mL I M hydrochloric acid, and mix well. Storein glass at room temperature. To be prepared fresh.
nn. 95:5 Methanol:Water:Combine 95 mL HPLC grade methanol with 5 mL deionized water and mix well. Store inglass at room temperature. Stable 6 months.
l:l Methanol:Water:Combine 50 mL HPLC methanolwith 50 mL deionized water and mix well. Store in elassat room temperature. Stable 6 months.
Nitric Acid, Dilute (33%by volume):Mix 5 mL concentrated nitric acid with 10 mL deionized water and shake to combine.Store in glass at room temperature. Stable I year.
0.2% (by volume) Nitric Acid:To a 1000-mL Nalgene volumetric flask containing 600 mL deionized water, add 2 mLOptima grade concentrated nitric acid. Bring to volume with deionized water and mix well.Store in plastic at room temperature. Stable I year.
Op iates Extraction Solvent (90 : I 0 chloroform : isopropanol) :
Combine 50 mL HPLC grade isopropanol and 450 mL HPLC grade chloroform and mixwell. Store at room temperature in brown glass. Stable I month.
Palladium / Magnesium Nitrate Matrix Modifier for AAS (Atomic AbsorptionSpectroscopy):To a 100-mL Nalgene volumetric flask containing 50 mL deionized water, add l5 mgmagnesium nitrate and25 mL palladium matrix modifier solution. Bring to volume withdeionized water and mix well. Store at room temperature in Nalgene container. Stable 5years.
This is an uncontrolled copy of a controlled document.
Z^z 4+t,/ .c ua\
FBI LabomtoryChemistry Unir
Toxicology SubunitTox I 03-2.doc
Issue Date: ljVD006Revision: 2
Page l0 of I 5
tt. I 1.8 M Potassium Hydroxide:To a 100-mLNalgene volumetric flask add 66 g potassium hydroxide and 50 mL deionizedwater. Mix well to dissolve and bring to volume with deionized water. Store at roomtemperature in Nalgene container. Stable I year.
uu. 5% (wlv) Potassium Phosphate Buffer (pH 4.5):To a 100-mL volumetric flask, add 80 mL deionized water. Add 5 g monobasic potassiumphosphate and mix wellto dissolve. Bring to volume with deionized water, and veri$r4.0<pH<5.0. Store refrigerated in glass. Stable I month.
vv. l0% (w/v) Silver Nitrate Solution:Dissolve 2 g silver nitrate in 20 mL deionized water. Store at room temperature in anopaque container. Stable I year.
ww. 0.1 M Sodium Acetate Buffer (pH 7):
To a 250-mL volumetric flask, add 3.4 g sodium acetate trihydrate and 200 mL deionizedwater. Mix well and adjust to 6.5<pH<7.5 by slow addition of I N hydrochloric acid.Bring to volume with deionized water. Store refrigerated in glass. Stable 2 months.
xx. Sodium Acetate Buffer with 5% Methanol:Add 5 mL HPLC grade methanolto a 100-mL volumetric flask and bring to volume with0.1 M sodium acetate buffer (pH 7). Store refrigerated in glass. Stable 2 months.
yy. 1.1 M Sodium Acetate Buffer (pH 5.5):To a 100-mL volumetric flask, add 14.95 g sodium acetate trihydrate, 60 mL deionizedwater, and2.2 mL glacial acetic acid. Mix wellto dissolve, and bring to volume withdeionized water. Verif 5<pH<6. Store refrigerated in glass. Stable 2 months.
zz. 0.1 M Sodium Borate Buffer (pH 9):To a 100-mL volumetric flask add 3.8 g sodium borate and bring to volume with deionizedwater. Sonicate for l5 minutes to assist dissolution, and verifu 8.5<pH<9.5. Storerefrigerated in glass. Stable 3 months.
aaa. Saturated Sodium Chloride Solution (- 35%wlv):To a 500-mL volumetric flask, add 450 mL deionized water and 175 g sodium chloride.Gently heat with continuous stining for at least one hour. Remove the stirbar, fill tovolume with deionized water, and mix by inversion. A small amount of undissolved solidshould remain in the bottom of the flask. Store in glass at room temperature. Stable forone year.
This is an uncontrolled copy of a controlled document.
5" uvL,/J,t,*\
:i::t'ffi#'*1*?,*o:::
Issue Date: 10/27/2006Revision: 2
Page ll of15
bbb. 0.287 M Sodium Dithionite Reducing Agent:To a 50-mL volumetric flask, add 40 mL deionized water and 236 gsodium dithionite.Mix well to dissolve and bring to volume with deionizedwater. Store in glass at roomtemperature. Stable I month.
ccc. 0.1 M Sodium Hydroxide:To a 100-mL Nalgene volumetric flask, add 60 mL water and 0.4 g sodium hydroxide. Mixwell to dissolve and bring to volume with deionized water. Store in Nalgene containers atroom temperature. Stable 1 year.
ddd. 5 M (20% w/v) Sodium Hydroxide:To a 100-mL Nalgenb volumetric flask, add 60 mL water and 20 g sodium hydroxide. Mixwell to dissolve and bring to volume with deionized water. Store in Nalgene containers atroom temperature. Stable I year.
eee. 0.1 M Sodium Phosphate Bufler (pH 6.0):To a 500-mL volumetric flask, add 400 mL deionized water, 6.1 g sodium phosphatemonobasic monohydrate, and 1.6 g sodium phosphate dibasic heptahydrate. tvti* well todissolve. Verifr 5.8<pH<6.1, adjusting pH by addition of 0.1 M dibasic sodium phosphate(increases pH) or 0.1 M monobasic sodium phosphate (decreases pH) as necessary. Bringto volume with deionized water. Store refrigerated in glass. Stable I month.
fff. 0.1 M Sodium Phosphate, Dibasic:To a 100-mL volumetric flask, add 2.7 g sodium phosphate dibasic heptahydrate and 80mL deionized water. Mix wellto dissolve and bring to volume with deionized water.Store refrigerated in glass. Stable I month.
goo 0.1 M Sodium Phosphate, Monobasic:To a 100-mL volumetric flask, add 1.4 g sodium phosphate monobasic monohydrate and80 mL deionized water. Mix well to dissolve and bring to volume with deionized warer.Store refrigerated in glass. Stable I month.
SPE (Solid Phase Extraction) Alkaline / Cocaine Elution Solvent (78:20:2 methylenechloride : isopropanol : ammonia) :
Combine 20 mL HPLC grade isopropanolwith 2 mL concentrated ammonium hydroxideand mix well. Add 78 mL HPLC grade methylene chloride and mix well. Store in slass atroom temperature. To be prepared fresh.
SPE Benzodiazepines Elution Solvent (49:l ethyl acetate:ammonia):Combine 49 mL ethylacetate with I mL concentrated ammonium hydroxide and mix well.Store in glass at room temperature. To be prepared fresh.
This is an uncontrolled copy of a controlled document.
{4 '1'4r*,/\/ ) it<\
hhh.
lll.
i?::t'ffl,'#Toxicology Subunit
trrr.o.J:lJr?;ff;Revision: 2
Page l2ofl5
jjj. SPE Benzodiazepines Wash Solvent (20% acetonitrile in 0.1 M phosphate buffer):Combine 80 mL 0.1 M phosphate buffer (pH 6) with 20 mL HPLC grade acetonitrile andmix well. Store in glass at room temperature. Stable I month.
kkk. SPE THC Elution Solvent aka Rodenticide Wash Solvent (95:5 hexane:ethyl acetate):Combine 95 mL hexane with 5 mL ethyl acetate and mix well. Store in glass at roomtemperature. Stable 3 months.
ll l. sPE THC-cooH Elution Solvent aka Rodenticide Elution Solvent (75.25:l hexane:ethylacetate:acetic acid):Combine 75 mL hexane with 25 mL ethylStore in glass at room temperature. Stable
mmm.5NSulfuricAcid:To a 100-mL graduated cylinder containing 70 mL deionized water, slowly add 12.5 mLconcentrated sulfuric acid. Mix well and bring to 90 mL with deionized water. Store inglass at room temperature. Stable I year.
nnn. 5% (by volume) Sulfuric Acid:To a 100-mL volumetric flask containing 80 mL deionized water, slowly add 5 mLconcentrated sulfuric acid. Mix well and bring to volume with deionized water. Store inglass at room temperature. Stable I year.
ooo. I M Sulfuric Acid with I .5% (wlv) Saponin:Add 80 mL deionized water and 1.35 g saponin to a 100-mL graduated cylinder and mixwell to dissolve. Slowly add 5 mL concentrated sulfuric acid. Bring to the 90-mL markwith deionized water and mix well. Store in glass at room temperature. Stable I year.
ppp. THC-COOH Extraction Solvent (7:l hexane:ethyl acetate):Combine 70 mL hexane with 10 mL ethyl acetate and mix well. Store in glass at roomtemperature. Stable 3 months.
qqq. TMAH Reagent:Dissolve 0.25 gtetramethylammoniumhydroxide in I mL deionized water. Add 20 mLdimethylsulfoxide and mix well. Store refrigerated in brown glass. Stable I year.
rrr. 0.04% (by volume) Trifluoroacetic Acid (TFA):To a 100-mL volumetric flask, add 90 mL deionized water and 40 pltrifluoroacetic acid,Mix well and bring to volume with deionized water. Store in glass at room temperature.Stable 3 months.
This is an uncontrolled copy o)t contrTlled document.
J'u V 4L,/ 3,tr-\
acetate and I mL glacial acetic acid. Mix well.I month.
FBI LaboratoryChemrstry Unit
Toxicology SubunitTox I 03-2.doc
Issue Date: 1012712006
Revision: 2Page l3 of l5
sss. Trinder'sReagent:Add 400 mg mercuric chloride, 400 mg fenic nitrate nonahydrate , and 0.1 mLconcentrated hydrochloric acid to 5 mL deionized water in a 10-mL volumetric flask. Mixwell to dissolve and bring to volume with deionized water. Store refrigerated in glass.Stable 6 months.
7 Instrumental Conditions
Not applicable.
8 Decision Criteria
Not applicable.
9 Calculations
Not applicable.
10 Uncertainty of Measurement
Not applicable.
11 Limitations
Not applicable.
12 Safety
Follow standard precautions for the handling of chemicals and biological materials. Refer to theFBI Laboratory Safety Manual for guidance.
This is an uncontrolled copy of a controlled document.
t-u q.+L,,\/.'rqt\

ii:*lff;"f,t*''r*?r::l"o::
Issue Dare: 10/2712006
Revision: 2
Page l4 of I 5
13 References
Shugar, G. J.; Ballinger, J.T. Chemical Technicians' Ready Reference Handbook, 3'd Ed;McGraw-Hill: New York. NY. 1990.
FBI Laboratory Safety Manuol,
Toxicologt Subunit SOP Manual.
Chemistry Unit Procedurefor Verification of Reagents, Kits, Solvents and Standards (CUQA 9);FBI Laboratory Chemistry Unit Quality Assurance Manual.
This is an uncontrolled copy of a controlled document.
i-v 44 G/,1 v r\
FBI LaboraroryChcrnistry Unit
'I'oxicology Subunit
l'ox l0!2,docIssue Daie; l0lZ712006
Rcvision: 2pagc lSofl5
Rev. # Issue Date History%
0 l/30/06 New document.
L 6121106 Added new reagent (saturated sodium chroride), and removedseveral (insulin ELISA reagents).
tat27/a6 Added new reagents (mobile phases for rodenticides).
Apnroval ; A//l V nChemistry Unit Chief: ' I/UUW fu#-(*- Date:
Marc A. LeBeau
OA Apnroval
Qualiry Manager:
Issuance
Tox Subunit Manager:
This is an uncontrolled copy of a controlled document.
& u4a./\I )v9 \
. t' ,
fv\Ai'WH,4.lV.n
FBI LabontoryChemistry Unit
Toxicology SubunitTox I 04-0.doc
Issue Date: 06121/06
Revision: 0Page I of 15
Guidelines for Comparison of Mass Spectra
I Introduction
Many of the analytical procedures used in the Toxicology Subunit rely on mass spectrometry tohelp establish identification of individual chemical entitils within a sample. In oider to ensureconsistency and reproducibility in compound identification, it is desirabie to have guidelines forthe comparison of known and unknown mass spectra.
2 Scope
This document provides guidelines to help determine what constitutes a match between knownand unknown mass spectra. Various critical characteristics of a mass spectrum are defined, andprocedures for using these characteristics to evaluate matching between spectra are laid out. Notethat this document provides guidelines for the matching of miss spectra, and does not directlyaddress compound identification. A good quality masJspectral match will normally be onlytneelement in establishing the identity of an unknown substance. These protocols are intended forapplication to full scan, tandem, and selected ion monitoring (SIM) mass spectra acquired inelectron impact (EI), chemical (CI), electrospray (ESI), and atmospheric piessure chemicalionization (APCI) modes. other mass spectral techniques are beyond the scope of this document.
3 Principle
The spectrum of a given unknown of interest is compared to the known spectrum of a targetanalyte. The unknown spectrum should contain all the significant ions present in the knownspectrum, and should not contain any unexplained significant ions not seen in the known spectrum.The relative intensities (hereafter referred to as "ion ratios") of several selected characteristic ions
should match in both spectra, to within defined tolerances. These guidelines draw heavily ontechnical document 2003IDCR from the World Anti-Doping Agency, the 2003 recommendationsof the American Society for Mass Spectrometry's Measur.r.nts and Standards Committee, andthe2002 National Committee for Clinical Laboratory Standards Approved Guideline for GC/Tr4S(gas chromatography/mass spectrometry) Confirmation of Drugs.
4 Specimens
Not applicable.
5 Equipment/Materials/Reagents
This is an uncontrolled copy of a controlled document.
{u +v t-
/::;,,\
FBI LaboratoryChemistry Unit
Toxicology SubunitTox 104-0.doc
lssue Date: 06/21106Revision: 0
Page2ofl5
Not applicable.
6 Standards and Controls
Not applicable.
7 Calibration
The calibration of all mass spectrometers should be verified regularly per the appropriateinstrument protocols inthe Instrument Operations and Support Subunit SOP Manual.
8 Sampling
Not applicable.
9 Procedure
Provided below are procedures for defining and determining critical characteristics of a mass
spectrum to be used in establishing whether or not two spectra match. An abbreviated list of the
key points is provided in Appendix L
9.1 Averaging and Background Subtraction of Mass Spectra
In many real-world samples, it may be necessary to correct mass spectra of interest for the
presence of ions resulting from sample background, instrument background, or partially coelutingsample components. The necessary background-subtracted spectrum will usually be generated byaveraging not more than five spectra across the peak of interest and then subtracting the average
of a number of background spectra equalto not more than twice the number of sample spectra. Thebackground spectra may come before and/or after the sample spectra, and should all be selected
from outside the region integrated for determination of ion ratios. This background-subhacted
spectrum will be used to establish the list of significant ions and the base peak for that spectrum.
9.2 Determination of "Significant lons" in a Mass Spectrum
Any ion signal greater than l5% of the most intense ion signal in a background-subtracted mass
spectrum will normally be considered a signiJicant ion. An ion that would otherwise be
considered significant may be excluded if it can be demonstrated that the ion arises from, or issignificantly disturbed by, an uncorrectable chemical interference. Such interferences will
This is an uncontrolled copy of a controlled document.
{_" ++c,/ ,. \
( )'t' )

:i::t'f,?#,'*'?i:?r?:l:::
Issue Date: 06121106
,H:':i,!
normally be demonstrated by showing that a reconstructed ion trace for the ion in question is not
coincident with the traces for other ions associated with the component of interest.
9.3 Determination of "Diagnostic Ions" in a Mass Spectrum
Diagnostic ions are those ions in a mass spectrum that are characteristic of the chemicalcompound under investigation. Determination of diagnostic ions depends upon knowledge of the
chemical structure of a component under investigation, and may therefore only be determined
from mass spectra of known standards. The definition of what makes any given ion
"characteristic" of a particular chemical structure is somewhat nebulous, and there does not appear
to be any universally accepted standard in the field. This means that good and consistent judgment
by the examiner is essential. There are, however, recommendations as to what renders some ions
nonspecific and not diagnostic, and an examiner should abide by these practices when eliminatingions from consideration as diagnostic.
Adduct ions will normally be excluded, except that one pseudomolecular adduct ion may be
considered diagnostic. Isotopomers will be excluded unless they are characteristic of a specific
chemical composition. Normally this will be limited to chlorine and bromine isotopomers, but
other possibilities may arise. Ions resulting purely from a derivatizing or complexing reagent willnormally be excluded from the list of diagnostic ions. For example,themlz 73 ion of atrimethylsilyl derivative may not be chosen as a diagnostic ion. Normally the (pseudo)molecular
ion for a compound will be considered diagnostic, unless the intensity for that ion is less than 5%o
of the intensity for the base peak in the background-subtracted spectrum of the component in
question.
9.4 Determination of the "Base Peak" in a Mass Spectrum
The base peak for the mass spectrum of a known standard is the most intense signal for a
diagnostic ion in the background-subtracted spectrum. For the purpose of determining relative ion
intensities the base peak in an unknown mass spectrum will be taken as the base peak of the
standard spectrum to which it is being compared, even if a different diagnostic ion shows higher
intensity in that spectrum.
In instances where it can be demonstrated that the nominal base peak signal is significantlydisturbed by an uncorrectable chemical interference, the second most intense diagnostic ionpresent in the spectrum may be used as the base peak. Such interference will normally be
demonstrated by showing that a reconstructed ion trace for the ion in question is not coincident
with the traces for other ions associated with the component of interest.
9.5 Method for Calculating Ion Ratios
Ion ratios will normally be determined by integrating reconstructed ion traces for each diagnosticion present in a given component. All integrations of reconstructed ion traces from a given
This is an uncontrolled copy of a controlled document.
Ev(r
qqGSr)

:i:*lffi'f,'*'Ti:?,i]fl::
lssue Date: 06121106
Revision: 0
Page 4 of l5
component should have comparable stop and start points. Ion ratios are then calculated bydividing the area for each ion trace by the area for the trace ofthe base peak ion, and expressing theresult as a percentage. In instances where the reconstructed ion traces produce non-integratabledata, it is acceptable to substitute ion abundances from the background subtracted spectrum of thecompound of interest for the integrated areas from reconstructed ion traces. This will normallyhappen in situations where multiple sorts of mass spectral data are simultaneously acquired in a
single analytical run, resulting in discontinuous data streams for the various individual massspectral experiments.
l0 Instrument Conditions
Not applicable.
1l Decision Criteria
Provided below are guidelines for establishing a match between a known mass spectrum and thatof an unknown spectrum. Note that some analytical standard operating procedures (SOP's)include detailed criteria for the evaluation of mass spectra of individual target analyes. Suchspecific instructions will supercede the guidelines provided below.
In almost all cases, unknown spectra should be matched against known spectra obtained fromcontemporaneously analyzed reference material. Exceptions are discussed in section 12.5 of these
guidelines. When assessing spectra for a targeted analyte from multiple unknown samples in a
single analytical run, it is acceptable to compare each unknown spectrum to the known spectrumresulting from a different contemporaneously analyzed reference sample. The mass spectra ofmany chemical entities are known to vary with analyte load. It is acceptable to dilute and
reanalyze a sample containing a high level of a suspected target compound in order to be able tomore appropriately match its spectrum to a lower concentration standard, control, or calibrator.
11.1 For Full Scan Mass Spectra
In order to establish a match between known and unknown mass spectra in the full scan mode, bothof the followine criteria should be met:
Every significant ion present in the known spectrum should be present in the unknownspectrum, and vice-versa.
All relative intensities for diagnostic ions in the unknown spectrum should match thoseobserved in the known spectrum within the tolerances shown in Table I or Table 2. Ifthese limits would produce an acceptable lower bound of less than lo/o for a given ion ratio,
This is an uncontrolled copy of a controlled document,
Z'w qq U/\1O,s3)
b.

FBI LaboratoryChemistry Unit
Toxicology SubunitTox 104-0.doc
Issue Date: 06121106
Revision: 0
Page 5 of 15
the lower limit will be set at 106. Ion ratios for specific diagnostic ions may be excludedfrom consideration if they meet any of the following criteria:
l. The ion ratio for that ion in the known spectrum is less than 5o/o (less than l\Yo forCI, ESI, or APCI spectra).The signal-to-noise ratio of the reconstructed ion trace for that ion in the unknownspectrum is less than 3.
It can be shown that the signal for that ion in either the known or the unknownspectrum is significantly disturbed by an uncorrectable chemical interference.Such interference will normally be demonstrated by showing that a reconstructedion trace for the ion in question is not coincident with the traces for other ions
associated with the component of interest.
If there are more than four diagnostic ions in the known spectrum, then the examiner need onlyevaluate the ratios for four diagnostic ions (three ratios) in order to establish a scientifically validmatch between the spectra. For compounds with a molecular weight less than 80 AMU, only three
diagnostic ions (2 ratios) need be evaluated to establish a scientifically valid match. The selected
ions will normally include the base peak and the (pseudo)molecular ion, unless those ions meet
one ofthe three exclusion criteria given above. If fewer than three diagnostic ions are available forevaluation, the specha may still be matched, but the examiner should be aware that the information
content derived from such a match is limited, and should be regarded with caution. Examiners
should also take care to ensure that the chosen scan range provides adequate "buffer space" around
the diagnostic and significant ions of the substance in question.
Matchi for CI. ESI. and APCI M
11.2 For SIM Mass Spectra
Selected ion monitoring experiments can allow for the detection of very low levels of analyte in
complex sample matrices, at the cost of reducing the information content of that experiment.Examiners should take great care in selecting monitored ions for a SIM experiment. Ions for aSIM experiment must be based upon a known full scan spectrum of the species of interest collected
This is an uncontrolled copy of a controlled document.
2.
J.
Tol
5, v4b1s "l\
Table l: Ion Ratio Matching 'l'olerances tor El Mass
If the ion ratio in the knownspectrum is:
>5IYo >25o and <50% <2504
Then the ion ratio in the unknownsDectrum should be within:
l0% absolute 20%o relative 5% absolute
able 7: lon Ratto ln erances a ASS
If the ion ratio in the knownsnectrum is:
>60Vo >40Yo and <60%o <40%
Then the ion ratio in the unknownsnectrum should be within:
l5% absolute 25Vo rclative 10% absolute
:i::t'ffi"f,'*'Tii?Jll:::
Issue Date: 06/21106
Revision: 0
Page6ofl5
on the instrument to be used for the SIM experiment. Four diagnostic ions will normally beselected (three ions for compounds with a molecular weight less than 80 AMU; see 12.4 foranother exception), and, if possible, all should be significant as well as diagnostic. The base peakwill normally be one of the chosen ions, and the (pseudo)molecular ion should be included if it hasa relative intensity greater than 5o/o in the known full scan spectrum. In order to establish a matchbetween a known SIM spectrum and an unknown SIM spectrum, all resulting ion ratios shouldmeet the tolerances specified in Table I or Table 2, as appropriate.
11.3 For Tandem Mass Spectrometry (MS/LS)
Tandem mass spectrometry can lend a great deal of additional specificity to mass spectralexperiments by greatly increasing the confidence that the ions in a given spectrum are allassociated with a single substance. Due to the nature of most collision-induced dissociationprocesses, however, ion ratios in tandem mass spectra tend to be much less stable, and much moredependent on analyte load, than is true for classic electron impact mass spectra,
Tandem mass spectra tend to be much "cleaner" than full scan mass spectra, with fewer extraneousions. Therefore, the limit for determination of significant ions in a tandem mass spectrum islowered to l}Yo (from l5%) of the most intense observed ion in the background subtractedspectrum. The high probability of ion association in tandem mass spectrometry means that nearlyall ions of reasonable intensity observed in an MS/lvIS experiment should be considered diagnostic,with the exception of ions resulting purely from the loss of an adduct.
Due to vagaries of the physical processes involved in the precursor ion isolation and fragmentationevents in an ion trap mass spectrometer, tandem mass spectra acquired on such an instrument willoccasionally show an "ion-splitting" artifact for a precursor ion returned in a product ion massspectrum. This is evidenced by the presence of trvo ions, separated by a fraction of an AMU, at thenominal mass of the precursor ion in the product ion spectrum. In instances where thisphenomenon is observed, the response for the affected ion should be taken as the total of theresponse for both components of the "split" ion signal.
11.3.1 Product Ion Experiments
When conducting product ion experiments, the selection of a precursor ion is critical to obtaininguseful and reliable information. In most cases, the (pseudo)molecular ion of the species underconsideration should be selected, if available. It is also acceptable to use a diagnostic isotopomerof the (pseudo)molecular ion, if one is available. If the (pseudo)molecular ion is not available, oris not suitable for some reason, then the selected precursor ion should be both significant anddiagnostic in the full scan mass spectrum of the substance under consideration. With product ionspectra, it is also important to ensure that the observed fragment spectrum is, in fact, emergingfrom the selected precursor ion. For this reason, one of the fwo following criteria should normallybe met for a product ion spectrum:
This is an uncontrolled copy of a controlled document.
a.'/ qlL,/\
/ -l\5 \

[i::lff;'#,Toxicology Subunit
r,,".;nl3#'r3;
'};;;':i'!
a. The precursor ion should be observed in the product ion spectrum with an ion ratio of at
least 5%.
b. If full scan mass spectral data are collected concunently with the product ion spectra, the
full scan spectrum of the component of interest should show no ions within 1.5 AMU of the
precursor ion with greater than three times the intensity of the precursor ion.
In order to establish a match between a known product ion spectrum and the product ion spectrum
of an unknown, both of the following criteria should be met:
a. Every significant ion present in the known spectrum should be present in the unknown
spectrum, and vice-versa.
b. All relative intensities for diagnostic ions in the unknown spectrum should match those
observed in the known spectrum to within the tolerances shown in Table 3. If these limits
would produce an acceptable lower bound of less than loh for a given ion ratio, the lower
Iimit will be set at0.5o/o. Ion ratios for specific diagnostic ions may be excluded from
consideration if they meet any of the following criteria:
1. The ion ratio for that ion in the known spectrum is less than 5%a.
2. The signal-to-noise ratio of the reconstructed ion trace for that ion in the unknown
spectrum is less than 3.
3. It can be shown that the signal for that ion in either the known or the unknown
spectrum is significantly disturbed by an uncorrectable chemical interference.
Such interference will normally be demonstrated by showing that a reconstructed
ion trace for the ion in question is not coincident with the traces for other ions
associated with the component of interest.
If there are more than three diagnostic ions in the known spectrum, then the examiner need only
evaluate the ratios for three diagnostic ions (two ratios) in order to establish a scientifically valid
match between the spectra. The selected three ions should include the base peak and the precursor
ion (if present), unless those ions meet one of the three exclusion criteria given above. If only a
singie diagnostic ion is observed in the product ion spectrum, spectra may still be matched, but the
.*u*in.r thould be aware that the information content derived from such a match is limited, and
should be regarded with caution.
ol for MS/lvlS Prod Ion S
This is an uncontrolled copy of a controlled document.
E" t/4 r-/as,t,
Table 3: Ion Ratio Matchtng lolerances lor MS/M5 Hrooucl
If the ion ratio in the known spectrum is: >400 s40%
Then the ion ratio in the unknown spectrum should be within: 25o/o relative l0% absolute

FBI LabordtoryChemistry Unit
Toxicology SubunitTox 104-0.doc
Issue Date: 06121106
Revisron: 0
Page 8 of 15
LL.3.2 Precursor Ion and Neutral Loss Experiments
The practical information content for precursor ion and neutral loss MS/lvIS experiments isgenerally low, but circumstances may stillarise in which one of these techniques can provide
critical additional information about a given substance. For precursor ion experiments, a match
between a known and an unknown spectrum may be established if all significant ions present in
the known spectrum are present in the unknown spectrum, and vice-versa. For neutral loss
experiments, a match between a known and an unknown spectrum may be established if all
significant transition pairs present in the known spectrum are present in the unknown spectrum
and vice-versa.
11.3.3 Selected Reaction Monitoring (SRM) Experiments
SRM analysis shares many features, advantages, and limitations with SIM analysis, but benefits
from the added specificify afforded by tandem mass spectrometry. Three diagnostic ion
transitions should be chosen for an SRM experiment. Generally, all three transitions should share
a common precursor ion, although it is appropriate to use multiple precursor ions if all are part ofa diagnostic isotope cluster in the full scan spectrum of the substance in question. It is desirable
that the chosen precursor ion be the (pseudo)molecular ion of the substance in question. If this is
not possible, or not practical, then the chosen precursor ion should be both significant and
diagnostic in the full scan spectrum of the substance in question. In order to establish a match
between a known SRM spectrum and an unknown SRM spectrum, both resulting ion ratios should
meet the tolerances specified in Table 3'
11.3.4 Higher Order (MS") Tandem Mass Spectrometry
Tandem mass spectra of order higher than2 are beyond the scope of this document. There is little
to no discussion of this subject in the various published technical guidelines, and the technique is
rarely practiced in forensic and regulatory settings. When used, higher order tandem mass spectra
will be addressed on a case-by-case basis, usually as a part of method validation. Examiners
should consider using the criteria for product ion MS/MS in section 12.3.1 as a starting point forsuch evaluation.
11.4 Exact (Precise) Mass Measurement Techniques
Exact mass measurement can provide a significant additional level of information content in a
mass spectrum, giving an examiner more confidence in any conclusions based upon that spectrum.
The use of exact mass measurement techniques does not, however, allow an examiner to disregard
other aspects of the mass spectrum under consideration. As such, mass spectra obtained using
exact mass techniques should still meet all of the matching criteria for the appropriate mass
spectral techniques given above, but different standards may be used in selecting diagnostic ions,
and more confidence can be placed in matches based upon a limited set of diagnostic ions.
This is an uncontrolled co_py of a controlled document.
to 4Vb-\(f';'7)
!i::lffi:"#'*'i":?o;loo::'j
Issue Date: 06121/06
Revision: 0
Page9ofl5
Ions in an unknown spectrum willbe considered to be an exact mass match to those in a knownspectrum if the measured masses agree to within 0.005 AMU. For a SIM experiment, only threeions, instead of four, need be monitored, and show appropriate ion ratio agreement, if all three ionsmeet this exact mass match criterion. When determining diagnostic ions, any isotopomer of a(pseudo)molecular ion may be considered diagnostic if it meets this exact mass match criterion.One additional adduct ion, beyond the pseudomolecular ion, may also be considered diagnostic ifit meets this exact mass match criterion.
11.5 Matching to Library Spectra
While mass spectral libraries (either commercial compendia or collections generated in-house)can be invaluable tools in helping to direct examinations and suggest possible targets for furtherinvestigation, an examiner should remain aware of the limitations of these libraries, Mostcommercial libraries do not clearly indicate the instrumentation the spectra were acquired on, orat what level of sample loading. In-house library data may have been acquired on the sameinstrumentation used to obtain a given unknown spectrum, but it is very difficult to ensure thatlong-term drift in instrument performance has not compromised the reproducibility of thoselibrary spectra.
Despite these limitations, there may arise rare instances in which it is necessary to compare anunknown spectrum to a library entry, for example if a standard of the substance in question cannotbe readily obtained, or for purposes of screening to direct further investigation. In cases wheresuch matching is attempted, all criteria for the appropriate type of mass spectrometry, given above,should still be observed, with one significant change. In these instances, ion abundances for thedetermination of ion ratios will be measured as the intensity of the ion in the spectrum, rather thanas the integrated area of a reconstructed ion trace. For the unknown spectrum, all criteriaregarding averaging and background subtraction from section 10.1 should still be observed.
12 Calculations
IR* : (A*/A6)xl 00%, where:
IR* = the ion ratio for ion xA* : the integrated area of the reconstructed ion trace for ion x4,6: the integrated area of the reconstructed ion tpace for the base peak ion(lon abundances from background subtracted mass spectra may be substituted for integrated areasunder certain circumstances detailed in section 9.5.)
13 Uncertainty of Measurement
Not applicable.
This is an uncontrolled copy of a controlled document.
t* 4'J L,
/rss)

FBI LaboratoryChemistry Unit
Toxicology SubunitTox I 04-0.doc
Issue Date: 06/21106
Revision: 0Page l0ofl5
14 Limitations
This procedure, while extensive, is not intended to be exhaustive, and situations will arise in whichtheir blind application could lead to inappropriate conclusions. No set of rules can ever replace thegood judgment of a trained and experienced examiner. The mere fact that an unknown massspectrum matches wellto the spectrum of a known standard will rarely, by itself, be sufficientgrounds to claim the presence of that compound in the questioned sample. All of the analyticaldata for the samples in question should be considered when drawing such final conclusions.Similarly, the fact that an unknown mass spectrum fails to match that of a known standardgenerally will not, by itself, constitute grounds for concluding that the compound is not present inthe questioned specimen.
This protocol does not excuse an examiner from exercising care in the acquisition of mass spectraldata. It should be remembered that poor practices in the acquisition of mass spectra willyield datathat is useless at best, and misleading at worst. Samples that show evidence of severechromatographic overload should generally be diluted and reinjected in order to obtain reliablemass spectra. Instrument calibration is also critical for obtaining useful mass spectral data, and itis incumbent upon any examiner to run appropriate test samples to demonstrate proper instrumentfunction.
15 Safety
Not applicable.
16 References
Betham, R.,; Boison, J.; et al J. Am. Soc. Mass Spectrom.2003,14,528-541.
deZeeuw, R. A. I Forensic Sci. 2005, 50,745-747.
Mclafferty, F. W.; Stauffer,10. t229-1240.
Soc. Mass Spectrom. 1999,
A. Forensic Sci. Int. 2004. 145.85-96.
deZeeuw, R. A. -r. Chrom. B 2004,811, 3-12.
Technical Document TD2003IDCR, 2004; World Anti-Doping Agency, Montreal, Canada.
Bowers, L. D.; Armbruster, D.A.; et aINCCLS DocumentC43-A,2002:The NationalCommittee
This is an uncontrolled copy of a controlled document.
Ev ?ub(at'\

FBI LaboratoryChemistry Unit
Toxicology SubunitTox I 04-0.doc
lssue Date: 06/21/06Revision: 0
Page ll of15
for Clinical Laboratory Standards, Wayne, PA.
Instrument Operations and Support Subunit SOP Manual,
This is an uncontrolled copy of a controlled document.
fi uvu(s"")

liBl l.aboratorrChemistry Lrrrit
Toxicology Suhunir'l ox I0'1-0.doc
lssuc Dlrtc: 06,/l l/06l{cvisionr 0
I,nge 12 ol' l5
Rer.. # Issue l)ate History
0621n6 Original Issue
ADnrovrrl
crrenristry Llnit chier: 4//O*q{}-.*--Marc r\. LeBeau
OA Approval
Quality ivlanager:
Issuance
Tox Subunit !{ar:ager :
This is an uncontrolled copy of a controlled document.
Ct qq L/^ \('rbt )
o^,", // $ ho{
l)ate: 0,/luf o '*Wd-t/.,/,-.-{ A /t trttIr4adeline A.
:?::1H1'#
'*'Ti:?o::oo:::Issue Date: 06121106
Revision: 0
Page l3 ofl5
Appendix l: Mass Spectra Key Points
l. AveraginglBackground Subtraction of Mass Spectra: (* = subtracted spectrum)a. <6 scans averaged for sample (N)b. <2N+l scans for backgroundc. background outside area integrated for ion ratios
2. Significant Ions: Ion signal > l5o (10% for MSA4S) of most intense ion signal (*)
3. Diagnostic Ions (determine from mass spectra of known standard):a. Characteristic of chemical compounds chemical structureb. Diagnostic criteria (not well defined):
(Pseudo)molecular ion is diagnostic if intensity > 5% base peak (*)c. Non-diagnostic ions (generally exclude):
Adduct ions except pseudomolecular ionIsotopomers except chlorine and bromine isotopomersIons 2nory to a derivatizing reagent (e.g. m/z 73 TMS deriv)
4. Base Peak (determined from mass spectra of known standard):a. Most intense signal for diagnostic ion (*)b. Base peak standard is base peak unknown (Exception: can use second most intense
diagnostic ion if base peak has an uncorrectable chemical interference)
5. Method for calculating relative ion intensities:a. Determine ion abundances = integrate RIC's / EIC's for each diagnostic ionb. Integration - comparable stop & start pointsc. Ion ratios (expressed as o/o) = each ion trace area/base peak ion aread. Spectral peak height may be substituted for integrated area if the RIC data in
non-integrable.
6. Decision Criteria: Unknown spectra matched against known spectra.
6.1 Full Scan Mass Spectraa. Every significant ion in known spectra present in unknown and vice-versab. Relative ion intensities (EI)
Known Ion ratio > 50yo - unknown l0% absoluteKnown Ion ratio 25-50% - unknown 20%orelativeKnown Ion ratio <25yo - unknown 5% absolute
c. Relative ion intensities (CI, ESI, APCI)Known Ion ratio > 600A - unknown 15% absoluteKnown Ion ratio 40-60% - unknown 25YorelativeKnown Ion ratio < 40Vo - unknown 10% absolute
This is an uncontrolled copy of a controlled document.
5" q+bl r'e)
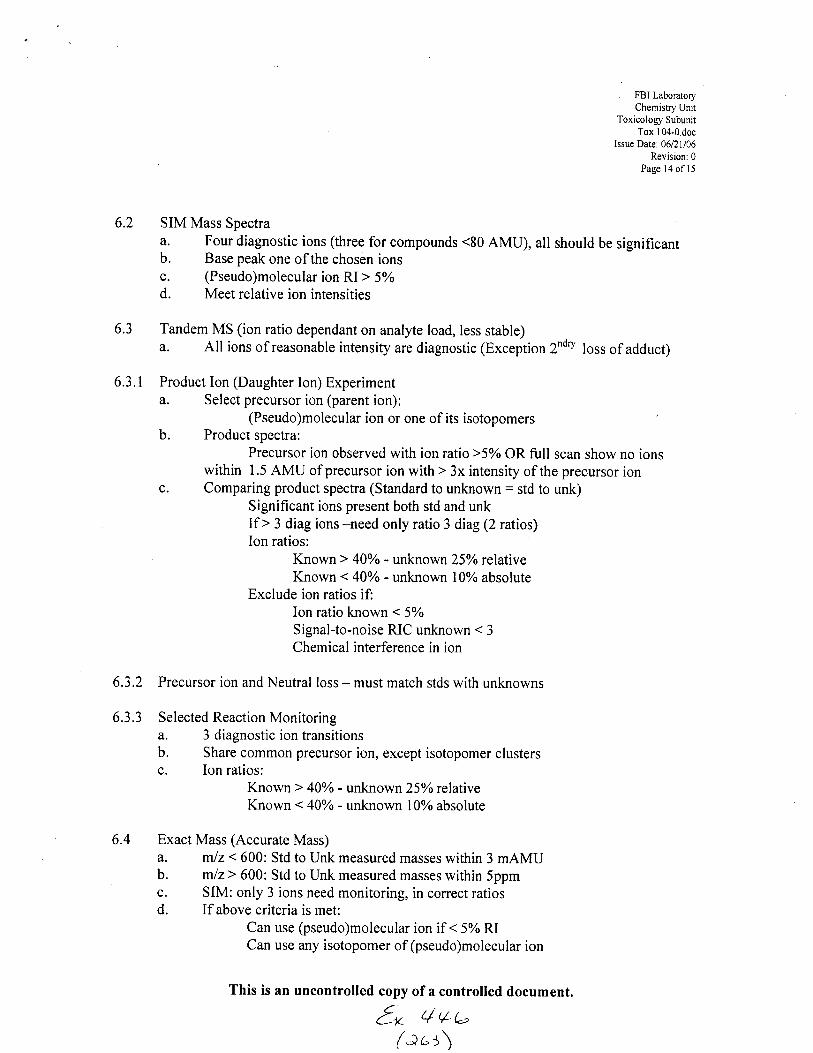
ii:*t'tr;"#'*'Ti:?oi:oo:::
Issue Date: 06121106
Revision: 0
Page 14 of I 5
6.2 SIM Mass Spectraa. Four diagnostic ions (three for compounds <80 AMU), all should be significantb. Base peak one ofthe chosen ionsc. (Pseudo)molecular ion RI > 5%d. Meet relative ion intensities
6.3 Tandem MS (ion ratio dependant on analyte load, less stable)a. All ions of reasonable intensity are diagnostic (Exception 2ndv loss of adduct)
6.3.I Product Ion (Daughter Ion) Experimenta. Select precursor ion (parent ion):
(Pseudo)molecular ion or one of its isotopomersb. Product spectra:
Precursor ion observed with ion ratio >5% OR full scan show no ionswithin 1.5 AMU of precursor ion with > 3x intensity of the precursor ion
c. Comparing product spectra (Standard to unknown = std to unk)Significant ions present both std and unkIf > 3 diag ions -need only ratio 3 diag (2 ratios)Ion ratios:
Known > 40yo - unknown 25%o relativeKnown < 40Yo - unknown l0% absolute
Exclude ion ratios if:Ion ratio known < 5olo
Signal-to-noise RIC unknown < 3Chemical interference in ion
6.3.2 Precursor ion and Neutral loss - must match stds with unknowns
6.3.3 Selected Reaction Monitoringa. 3 diagnostic ion transitionsb. Share common precursor ion, except isotopomer clustersc. Ion ratios:
Known > 40yo - unknown 25%orelativeKnown < 40o - unknown l0% absolute
6.4 Exact Mass (Accurate Mass)a. rn/z < 600: Std to Unk measured masses within 3 mAMUb. m/z> 600: Std to Unk measured masses within 5ppmc. SIM: only 3 ions need monitoring, in correct ratiosd. If above criteria is met:
Can use (pseudo)molecular ion if < 5% zuCan use any isotopomer of (pseudo)molecular ion
This is an uncontrolled copy of a controlled document.
f* qvL,(-r,;\
' FBI Laboratory
'",.'!i,"?)'flJlilTox 104-0.docIssue Date: 06/21106
'#l!'lii3can use up to one additional adduct ion, beyond pseudomorecular ion
Appendix 2: Glossary of Terms
Adduct Ion - Any ion to which another chemical entity has been attached by a means other thancovalent bonding.
Base Peak - The most intense or abundant diagnostic ion in the mass spectrum of a substance.
Diagnostic Ion - Any ion observed in the mass spectrum of a substance that is characteristic of thechemical structure of that substance.
Ion Ratio - The relative abundance or intensity of t'wo ion signals in a mass spectrum.
Isotopomers - Two or more chemical species that differ only in isotopic composition. Forexample, CH3OH and CD3OH are two isotopomers of methanol.
Molecular Ion - A charged intact molecular species, with charge acquired solely through the gainor loss of electrons. Normally denoted as M* or M- for singly charged species.
Precursor Ion - In tandem mass spectrometry, the ion selected for fragmentation. Often refenedto as a "parent ion",
Product Ion - In tandem mass spectrometry, an ion resulting from the fragmentation of another ion.Often refened to as a "daughter ion".
Pseudomolecular Ion - A charged molecule in which charge has been acquired through adductionof an ion or through loss of a moiety able to dissociate in solution. Examples include (M+H)*,(M-H)-, (M+Na)*, and (M+NHa)+.
Reconstructed Ion Trace - A display of the abundance or intensity of a single ion signal as afunction of time during an analysis. Often also called an "extracted ion chromatogram" (EIC) or"reconstructed ion chromatogram" (RIC).
Significant Ion - Any ion in the mass spectrum of a substance present above a specified intensityor abundance.
This is an uncontrolled copy of a controlled document.
8y qqL,(; '+\

VALIDATION
iio +4+.
Gr)

Chemistry UnitMethod Validation Review Form
This method has been appropriately validated for its intended use (as specified above). The method is considered fit for theabove use.
Unit Chief Approval:
ProcedureName: Arur,ysrs o7 EwA nt Dprrn Fuoogrr^,n,
tr Measurement of PhysicaUChemical Property
p/ nstablishment of Presence/Absence of Specific Analyte(s)/Class(es)
tr Quantitation of Specified Analyte(s)
g/ Selectivtty: Analysis of at least l0 sources ofblankmatrix + 2 zero samples (blank matrix spiked withinternal standard). Analysis of samples spiked withother compounds expected to be in real samples.
n Calibration Model Qinearity)..Analysis of at least5 non-zero calibrators at a minimum of 5 replicatesper level,
n Bias, Repeatability, and Intermediate Precision:QC samples at low and high conc in calibrationrange. Analysis ofduplicates ofeach conc in at least5 runs,
Limit of Detectioz; See Procedure for details.
tr lpwer Limit of Quantitation: See Procedure fordetails.
g/ UooX t6rcts.'For LC-MS(-MS) procedures only.Analysis of5 neat standards and 5 blank extracts
zltLldt,zlBloz
Additional Comments:
fi vuuftoa)
ltDate: 7/l'' / 07
-

METHOD
{^r V4Lr(^rr)

Instrument Method: EDTA pos Swabs.meth
LCQ fnstrument Method
Creator: AdminislratorLast modified: 2/12/OZ by AdministratorMS Run Time (min) : L0.00
Divert Valve: not used during run
MS Detector Settinqs:
Segment l_ fnformation
Duration (min) : l_0. 00Number of Scan Events: l_
Tune Method: EDTA_pos_CID
Scan Event Details:1: Pos . (293.0)->o(fZS.O-3j_5.0)
MS/MS: CE 15. 0? IsoW l_.0
Monday, February 12, 2OO7 12:55:05 page 1 of 2
{-v q4 c./;"s)

Injector parameters:Syringe draw rate (pl/sec)Injection volume (UI) :5
Pump settings:.Solvent A:5:95 ACN:Water +Solvent B:BSolwent C:CSol-vent D: D
Min pressure (pSI):0Max pressure (PSf) :5000Chart output: PressureChart output:Normal
Gradient program:Time (min) Flow (nl/min)
Waters 2690 LC Systern
:2.50
0.06t NH40H
0. 003. 00
0.300.30
A(*) B(t) c(t) D(t) Curve100.0 0.0 0.0 0.0 Linear1,00.0 0.0 0.0 0.0 Li_near
-6-6
Timed events:Initial states:
Switch L:No changeSwitch 2:No changeSwitch 3:No changeSwj-tch 4:No change
Time(min) EvenE0. 00 Switchl
Action ParameterNo change
InsLrument Method: EDTA pos Swabs.meth
Monday, February 12, 2007 12:55:05 page 2 of 2
Z'v VVc'/ at ri\
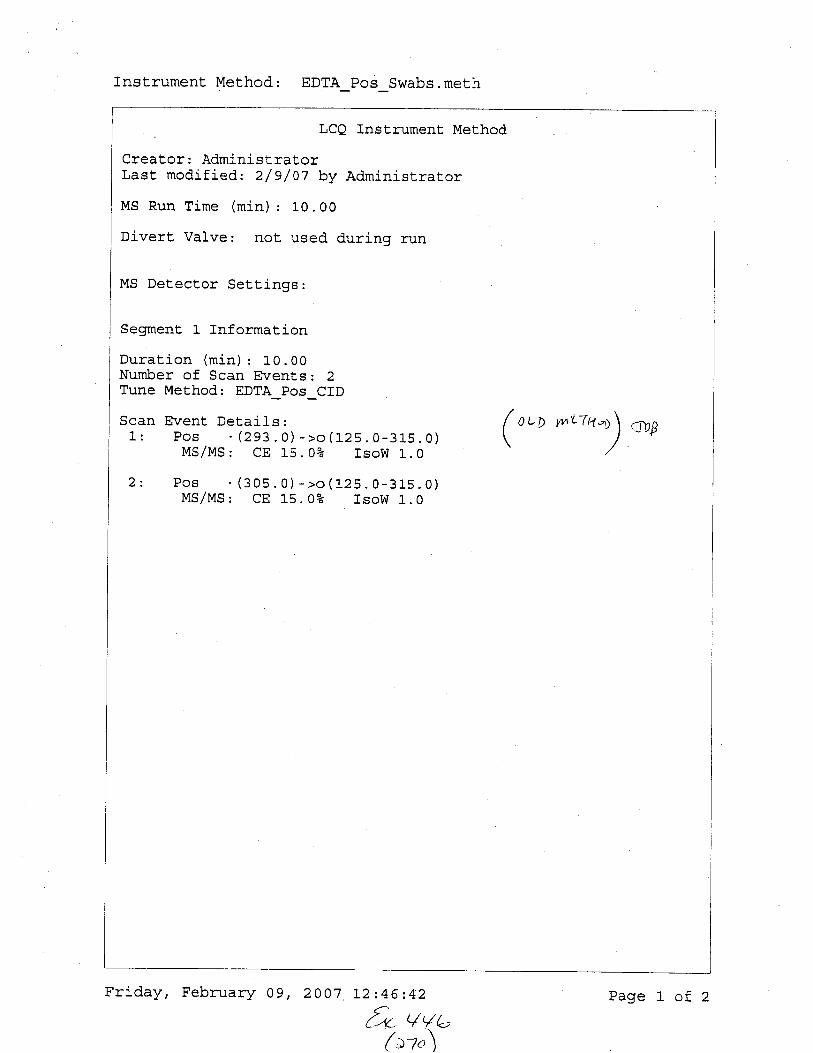
fnstrument Method: EDTA Pos Swabs.meth
LCQ Instrument Met.hod
Creator : AdministratorLast modified 2/9/ 07 by Administrator
MS Run Time (min) : 10.00
Divert Valve: not used during run
MS Detector Settinqs:
Segment 1 Information
Duration (min): 10.00Number of Scan Events: 2Tune Method: EDTA_Pos_CID
Scan Event Details:l-: Pos - (293.0)->o(tZS.0-315.0)
MS/MS : CE 1-5. 0? IsoW 1.0
2: Pos . (305.0)->o(tZS.0-31_5.0)MS/MS : CE l-5. 0e IsoW 1. 0
(0", v,trn.,>) Ap
L2246242
f-<. q(u( ato\
Friday, February 09, 20A7 Page I of 2

InsLrument Met.hod: EDTA_Pos_Swabs . meth
Waters 2690 LC System
Injector parameters:Syringe draw rate (pl,/sec) :2.50Tnicnf inn rrnl"-o /"I\,q"vrsne (pL) :5
Pump settings:Solvent A: 5: 95 ACN: l,f ater + 0 . 06* NH4OHSolvent B: B
. S6l \t6hf a. n
Solvent D: DMin pressure (pSI):0Max pressure (pSI) :5000Ch: ri ^rrf nrlf . D-_. - -essureChart output:Normal
Gradient program:Time(min) Flow(mI,/min) A(t) B(E) C(t) D(E) Curve0.00 0.30 100.0 0.0 0. 0 O . 0 Linear _ 63. 00 0 . 30 100.0 0. 0 0. 0 O. O Linear _ 6
Timed events:Tn i f i a l qt- ri6a.
Switch L:No changeSwitch 2:No changeSwitch 3:No changeSwitch 4:No change
Tj.me (min) Event Act j.on parameter0. 00 Switchl No change
Friday, February 09, 2OO7 12:46:42
&qq6( st,\
Page 2 of 2
METITOD
4 ,/qb1; r-t)

Instrument Method: EDTA Neq Swabs.meth
LCQ Instrument Method
Creator : AdministratorLast modified: 2/9/07 by AdministratorMS Run Time (min) : 10.00
Divert Valve: not used during run
MS Detector Sett.inqs:
Segrnent I Information
Duration (min) : l-0.00Number of Scan Events: 4Tune Method: EDTA_NEG
Scan Event Details:l: Neg - (291.2)->oS (246.5-247.5 272.5-273.5)
MS/MS: CE 15.0? Isow 1.0
2: Neg . (303.2)->oS(292.8-284.3)MS/MS : CE l-5. O? IsoW 1. 0
3: Neg . (344.2)->oS (299.5-300.5 325.5-326.5)MS/MS: CE 15.0? rsow 1.0
4: Neg - (356.0)->oS(31j-.5-312.5)MS/MS: CE 15. O? IsoW L. 0
2007 12:47:03
f-x (qa(at z\
Friday, February 09, Dana 1 n€ argYU + v! a

Instrument Method: EDTA Necr Swabs.meth
Waters 2690 LC System
lnjector parameters:Syringe draw rate (F1lsec):2.50fnjection vol-ume (p1) :5
Prrmn c6f l- i nfic .
Solvent A:80:20 ACN:Water + 0.03t NH4OHSoLvent B:BSolvent C:CSolvent D:DMin oressrrrc lPSf):0Max pressure (PSI) :5000Chart output: PressureChart output:Normal
Gradient program:Time(min) Flow(ml,/min) A(t) B(t) C(E) D(t) Curve0.00 0.30 100.0 0.0 0.0 0.0 Linear - 63.00 0.30 l-00.0 0.0 0.0 0.0 Linear - 6
Timed events:Tni ii r1 ei-rl-oc.
Switch L:No changeSwltch 2:No changeSwitch 3:No changeSwitch 4:No chanoe
Time (min) Event Action Pararneter0.00 SwitchL No chanqe
Friday, February 09, 2007 1-2247 203 page 2 of 2
a4 lqb/t> u\

SELECTIVITY
fu 44b(^r t)

tSample Name:
C- nent:
Seq uence---select_pos. sld [O pen]
A, Case 1, Grey
Study:
Client:
Laboratory:
Company:
Phone:
Sample Type Ftle Name Sample lD Path
Unknown SELOl 1 C:\)(calibuAData\EDTA\BreweASEL Positive
Inst Method Proc Method CalFile Position InjVol Level Sample WtC:Xcalibur\methods\EDTA Pos Swabs 1 5.0 0.000
Sample Vol ISTD Amt DilFactor
0.000 0.000 1.000
*****************************i*****i**t********+********************************i*******t*t***tt**i***********t*********
Sample Name: Swab.A, Case 2, Red
Comment: Study:
Client:
Laboratory:
Company:
Phone:
Sample Type File Name Sample lD Path
Unknown SELO2 02 C:Xcalibur\Data\EDTA\BreweASEL Positive
Inst Method Proc Method Cal File Position InjVol Level lSample Wt
C:Xcalibur\methods\EDTA Pos Swabs 2 5.0 0.000
Vol ISTD Amt Dil Factor
0.000 0.000 t.00u
/* q+b1; t,')page 1
6uzf t lot

Sample Name:
C' -nent:
Seq uence--select_pos. sld [Open]
Swab B, Case 2, Grey
Study:
Client:
Laboratory:
Company:
Phone:
Sample Type File Name Sample lD Path
Unknown SELO3 03 C:U(calibur\DataEOtffi
Sample Vol ISTD Amt DilFactor
0.000 0.000 1.000
*t**t**t**********ii*t***********t**t*****************************t*****ti****i***tr****t*******th*r
Sample Name:
Comment:
Swab C, Case 3-1, Grey
Study:
Client:
Laboratory:
Company:
Phone:
iample Type File Name Sample lD Path
Unknown lSEL04 04 C:Xcalibur\Data\EDTA\Brewer\SEt positive
Sample Vol ISTD Amt DilFactor
0.000 0.000 1.000
*******************t*************i**************tt*t*******t******t***********t****************t******************ffi***********************
{" q4e,( nt)
6vzf rl.t

p
Sample Name:
/--lment:
Sequence--select_pos. sld [Open]
Swab C, Case 3-2,
Study:
Client:
Laboratory:
Companyi
Phone:
Sample Type File Name Sample lD PathUnknown SELOs 05 u : \Acail0u nData\E DTA\B reweAS EL_positive
Sample Vol ISTD Amt DilFactor0.000 0.000 1.000
******t*t***i*ti**********i*****t*********t**********************t******************************************H****************r********ttt*t***
Sample Name:
Comment:
Swab
' Study:
Client:
Laboratory:
Company:
Phone:
Sample Vol ISTD Amt DilFactor0.000 0.000 1.000
***t**t*i***t*t*t********i**********************+*****************a*************************i*******t*************************************t***
4(a
ffizlnl'trylu
)s)
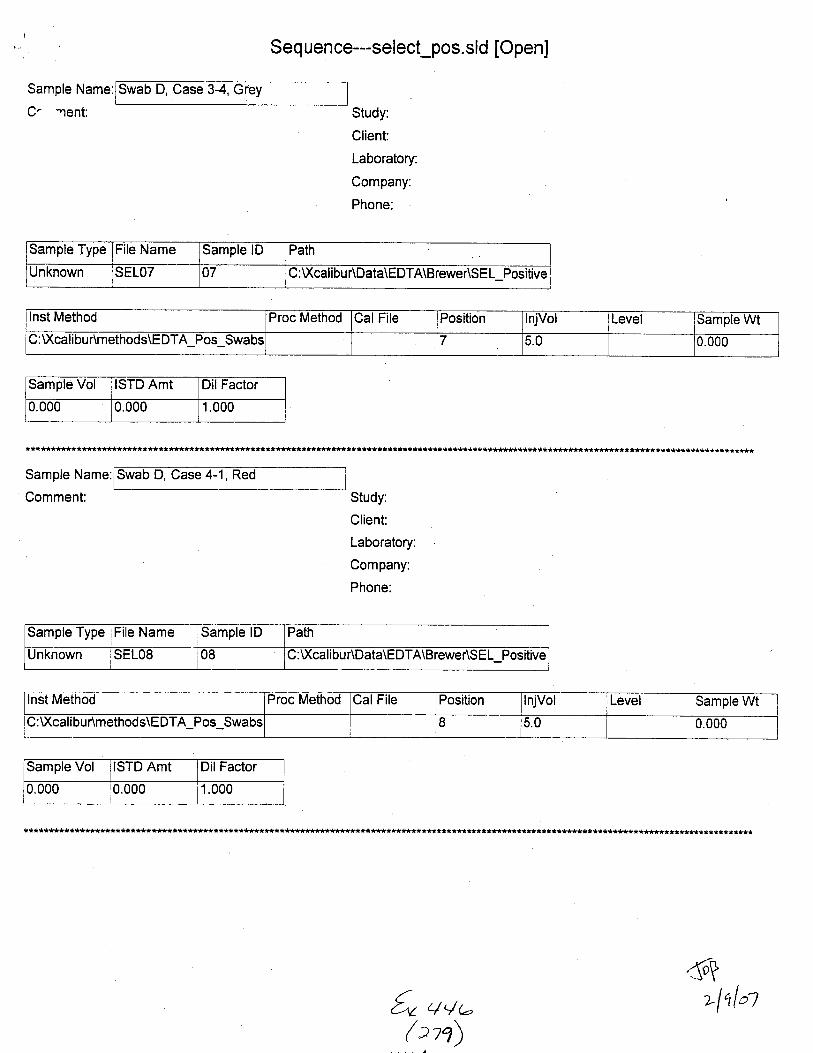
Sample Name:
C' rent:
Seq uence---select_pos. sld [Open]
b D, Case 3*4,
Study:
Client:
Laboratory:
Company:
Phone:
Sample Type File Name Sample lD
Unknown SELOT 07 C:XcalibuAData\EDTA\BreweASEL Positive
Inst Method Proc Method Cal File Position InjVol Level Sample WtC:XcalibuAmethods\EDTA Pos Swabs 7 5.0 0.000
Sample Vol ISTD Amt DilFactor
0.000 0.0rJ0 1.000
Sample Name:iSwab D, Case 4-1, Red
Comment: Study:
Client:
Laboratory:
Company:
Phone:
Sample Type File Name Sample lD Path
unKnown SELOS 08 C:U(calibur\Data\EDTA\Brewer\SEL Positive
Inst Method Proc Method Cal File Position InjVol Level Sample Wt
u:v(calrbur\metnods\tu lA Pos swabs I 5.0 0.000
Sample Vol ISTD Amt Dil Factor
0.000 0.000 1.000
6r{o qq, >lnln(an)

Sample Name:
C- rent:
Seq uence---select_pos. sld [Open]
, Case 5, Red
Study:
Client:
Laboratory:
Company:
Phone:
Sample Type File Name Sample lD Path
Unknown SELOg 09 C:\XcalibuAData\EDTA\BreweASEL Postlive
Inst Method Proc Method CalFile Position InjVol Level Sample WtC:\Xcalibur\methods\EDTA Pos Swabs I 5.0 0.000
Sample Vol ISTD Amt DilFactor
0.000 0.000 1.000
Sample Name:
Comment:
ellow
*t***********t**i**tt**********t**********************s******s***i********rl***********
Study:
Client:
Laboratory:
Company:
Phone:
Sample Type File Name Sample lD Path
Unknown SELlO 10 C:Xcalibur\Data\EDTA\Brewer\SEL Positive
Inst Method Proc Method Cal File Position lnjVol Level Sample Wtu:u(cattbunmethods\EDTA Pos swabs 10 5.0 0.000
Sample Vol ISTD Amt DilFactor
0.000 0.000 1.000
{v a4 r- Ll,fu( axc)
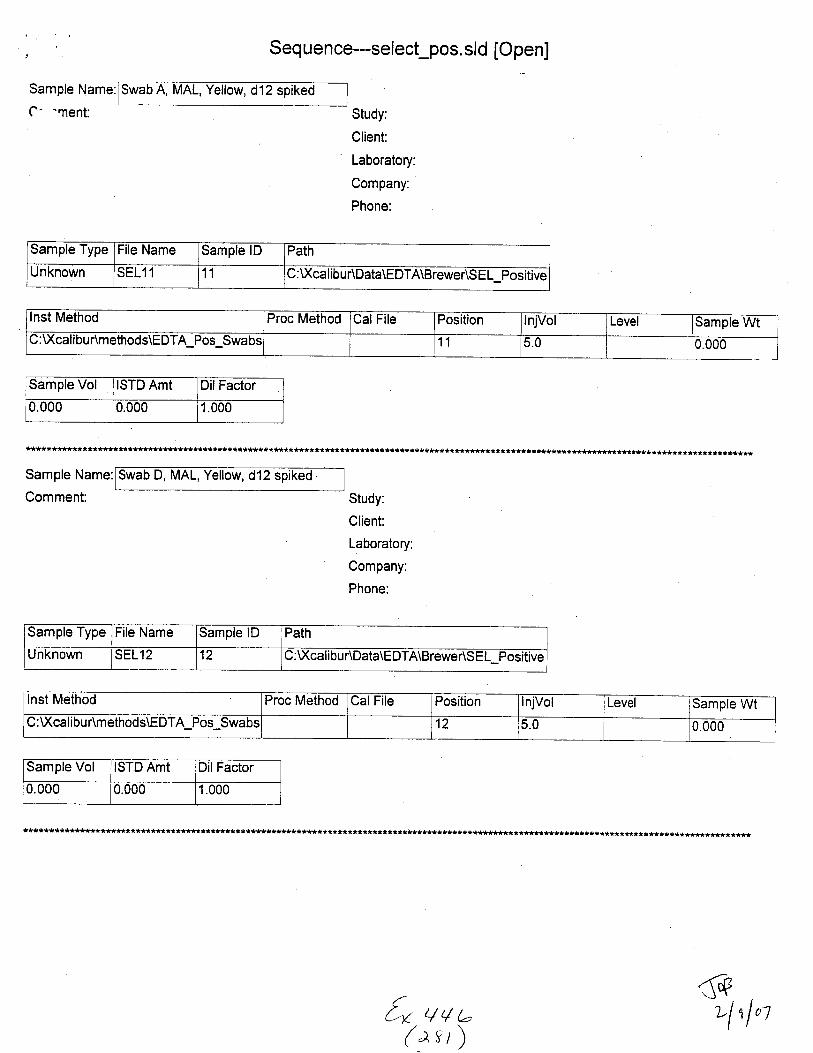
Seq uence--select_pos. sld [Open]
Sample Name:
C- 'nent:Swab A, MAL, Yellow, d
Study:
Client:
Laboratory:
Company:
Phone:
Sample Type File Name Sample lD Path
Unknown SELl 1 11 C:U(calibur\Data\EDTA\Brewer\SEL Positive
Inst Method Proc Method Cal File Position lnjVol Level Sample WtC:Xcalibur\methods\EDTA Pos Swabs 11 5.0 0.000
Sample Vol ISTD Amt DilFactor
U.UOO 0.000 1.000
Sample Name:
Comrnent:
*tl**********************t******t****t*********t**i**************************t**t********t***************
Swab D, MAL, Yellow, d12
Study:
Client:
Laboratory:
Company:
Phone:
Sample Type File Name Sample lD ath
Unknown SEL12 12 C:Xcalibur\Data\EDTA\Brewer\S EL Positive
lnst Method Proc Method CalFile Position njVol Level Sample WtC:Xcalibur\methods\EDTA Pos Swabs 12 5.0 0.000
Sample Vol ISTD Amt DilFactor
0.000 0.000 1.000
t. qq u(1u,1
{eul tl't
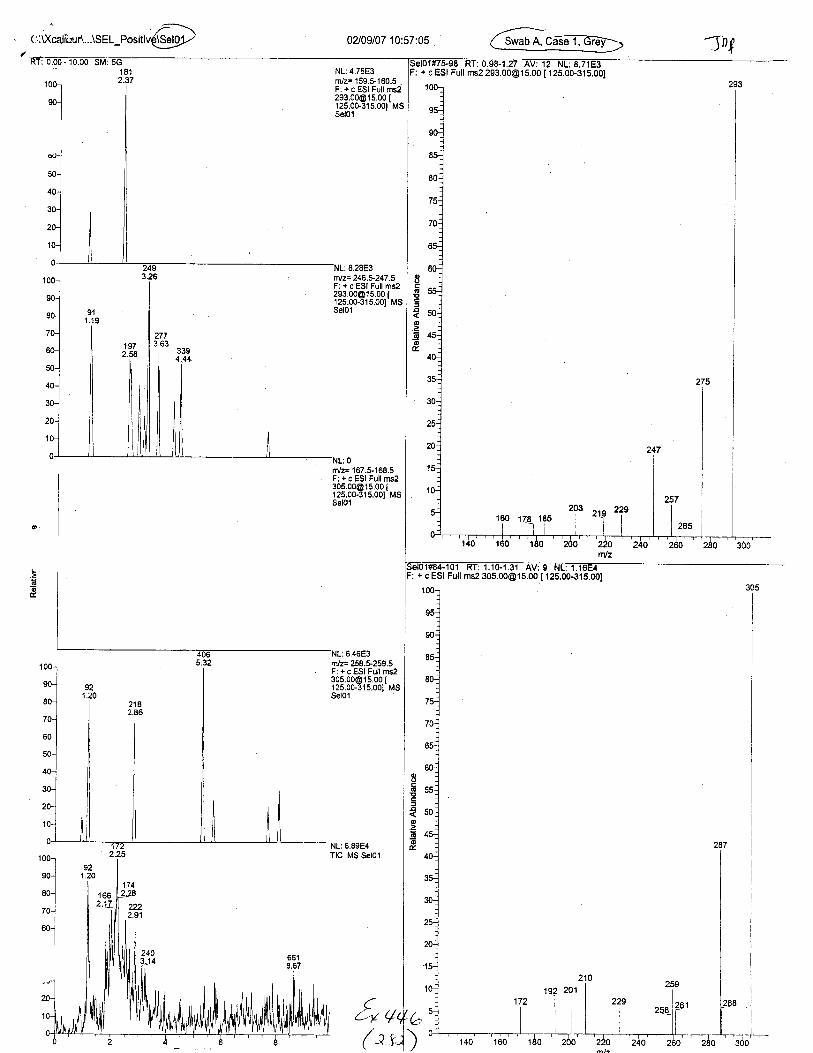
.,, i*,a,ru, 0...r. e l-eo, itiu(Gi]\ 02109107 10:57:05 1 SwabA, Cdsdl.ErEV--.r- ____1 /
1812.57
1 00-l
go-.1
I
NL:4.76E3rn/z='159.S160.5 .
F: + c ESI Full [email protected] [125.00.315.00t MSSet0l
Selul*/5-96 RI: 0.96-1.27 AV: 12 NL:8.71E3F: + c ESI Full ms2 [email protected] [ 125.00-315.00]
erurF64-1ul Kt:1.',Iu-1.3'l AV:9 NL: 1.16E4: + c ESI Full ms2 [email protected] [125.00-315.001
ntlz= 246.5-247.5F: + c ESI Full [email protected] [125.00-315.001 MSSelOl
m/z= 167.t168.5F: + c ESI Full [email protected] [12s.00.315.001 MsSelo1
8.28E3
6.46E3rn/z= 258.$259.5F: a c ESI Full [email protected] [125.00-31s.001 MsSel0'l
NL:6.89E4TIC MS Sel01
o
6E
o
Go
ooco
o
-s!od
L,t 4(a

NL:4.76E3m/z= 159.5-160.5F: + c ESI Full [email protected] [125.00-315.001 MSSel01
mlz= 246.5-247.5F:+ c ESlFull [email protected] [12100-315.001 MS
miz= 167.5-168.5F: + c ESI Full [email protected] [125.00-315.001 MSSel01
mlz= 258.5-259.5F:+ c ESI Full [email protected] [125.00-315.001 MSSel01
TIC MS Sel01
f.'L+u
2773.63197
2.58
q.,
.zoEx.
Tima /minl (av t\
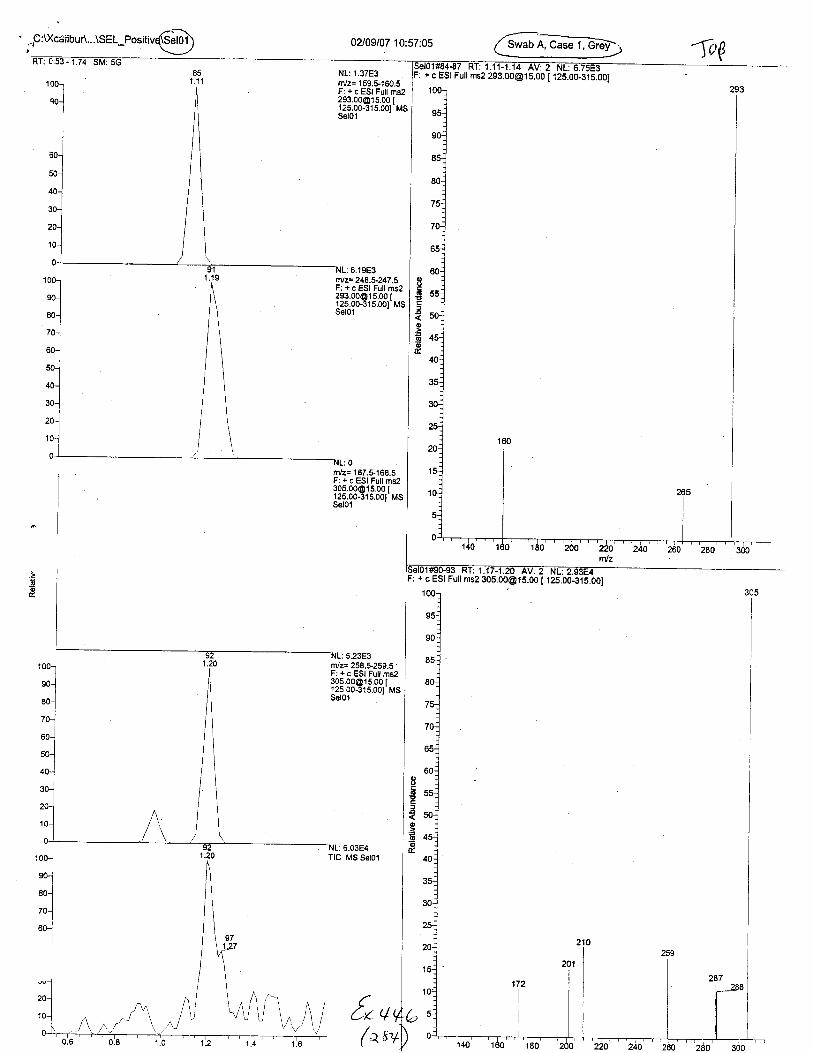
0?/09107 10:57:05 atr(el01#E4-87 RT: 1.11-1.14 AV: 2 NL: 6.7SE3-: + c ESI Full ms2 [email protected] [ 125.00-315.00]NL:1.37E3
m/z= 159.$160.5F: + c E5; 5u1 .",[email protected] I125.00-315.001 MSSel01
o
GE
o
o
@0
: + c ESI Full msz [email protected]
oo6u
o=.go6.03E4
rnlz= 167.5.168.5F: + c ESI Full [email protected] [125.00-3'15.001 MSSel01
NL: 2.93E4125.00-31s.001
TIC MS Sel01
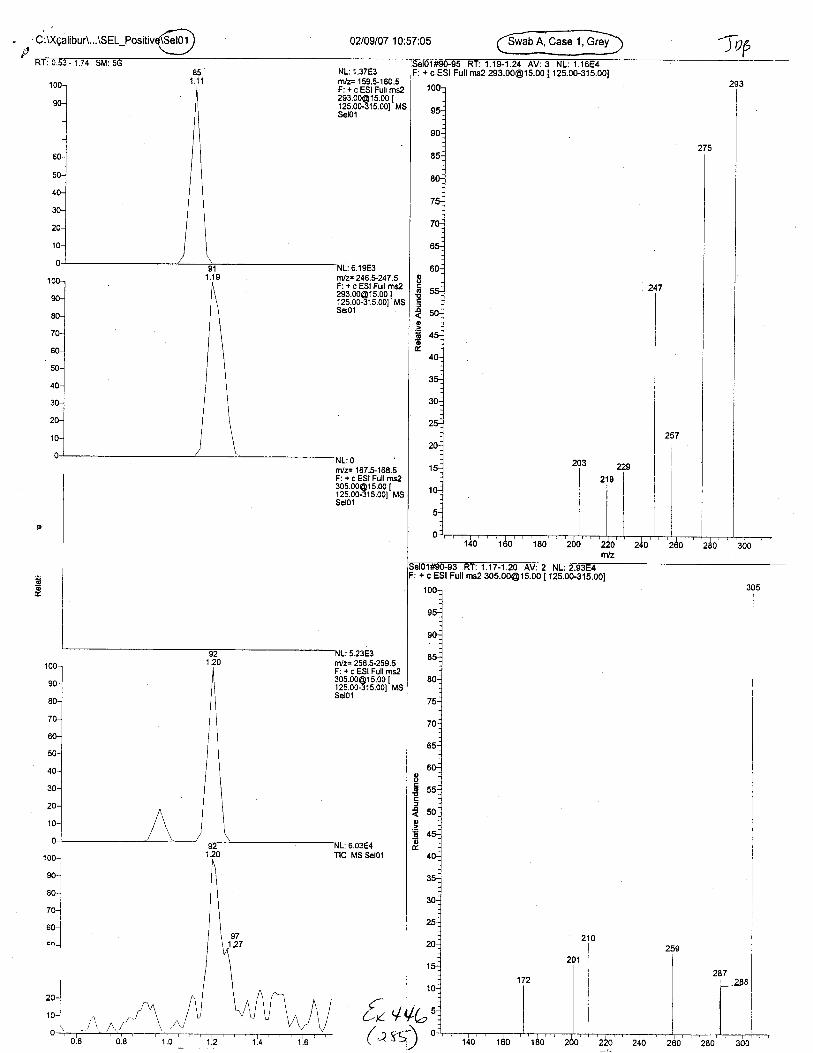
C :U(qalibur\...\Sel-PositivEffi)n_ \-1 0U09107 10:57:05 A, Case 1, Grey aapNL: 1.37E3rniz= 159.S160.5F: + c ESI Full [email protected] I125.00-315.001 MSSelol
Sel01#90-95 RT: 1.19-1.24 AV:3 NL: 1.16E4F: + c ESI Full ms2 [email protected] [ 125.00-315.001
+ c ESt Fult ms2 [email protected] 12s.00-315.001
.ll'lz= 246.5-247 ,5F: + c ESI Full [email protected] [125.00.315.001 MS
6.1 9E3
:9.ZJEJ
oo6!a!o
oo
oo6E
0
6o
rn/z= 258.5-259.5F: + c ESI Full [email protected] Ir25.00-315.001 MsSelo1
NL:6.03E4TIC MS Selol
6,t
n/z:167.5-16E.5F: + c ESI Full [email protected] ['125.00-3't5.001 MsSel0'l
(as

02109107 11:08:17 Swab A, Case 2, Red
rlz= 246.5-247.5F: + c E51 Pu11 *,[email protected] [12100-315.00] MS
NL:7.66E3rn/z= 258.5-259.5F: + c ESI Full [email protected] [125O0-315.001 Ms
oooE
o
6o
o
6
o.=
"g!o
tb
)
1+ c ESI Full ms2 [email protected] [ 12S.OO-glS.OO]
NL:6.62E4TIC MS Sel02ro0l
,o-]
*.1
ro-l
uo-l
170z.1J
6,/
NL:0rvz= I 59.5.1 60.5F:+q551 [email protected] [125.00-315.00r MSSelo2
: + c ESt Fuil ms2 [email protected] [ 125.00-315.001
2'?6 nz
1841
200
158
r.-/5

. C:Vcalibur\...rSel-eositiv@lD 02109107 1 1 :19:06 -l0E
NL:0rvz= 159.5.160.5F: +c95; 6u1,r.,[email protected] [125.00-315.001 MSSel03
rnlz= 246.5-247 .5F:+cESl [email protected] MSSel03
trVz= 157.5.168.5F: + c ESI Full [email protected] [12100-315.001 Ms
ooG
-o':.s!o
r/z= 258.$259.5F: + c ESI Full ms2
?33.339i;trt*
2.51E3
: 2.99E4TIC MS Sel03
{.v
o
oE
o.=66
Swab B, Case 2, Grey
tuJrcz-tu Kt: u.6z{r.9u AV: 4 NL: 0+ c ESI Full msz 293.00@'t5.00 [ 125.00-315.001
uJ#62-6C Kt: l.Uir-].10 AV: 2 NL: 2.ggE3+ c ESI Full ms2 [email protected] [ 12S.OO-315.00]
LqJ
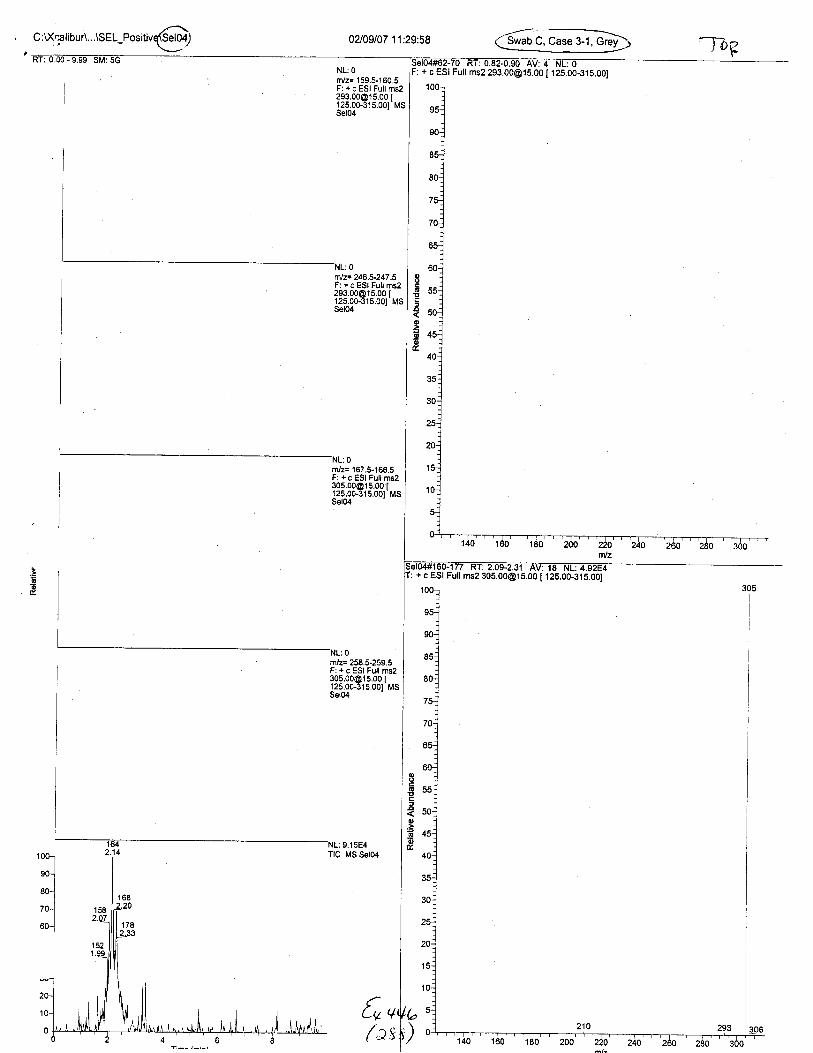
C :U(na I ibu r\...\SEL-Positiv(@ 0U09107 11:29:58
NL:0rn/z='159.5.160.5F: + c ESI Full ms2
i!"3#.9t33&r*
tnlz= 246.5-247 .5F: + c ESI Full [email protected] I125.00-315.001 Ms
r/z='167.5.168.5F: + c ESI Full [email protected] [
33r5d!0-31s.001 Ms
ooou!oo
.s!o
r/z= 25E.5-259.5F: + c ESI Full [email protected] [125.00-3't5.00t MsSetM
{nu(as
oooE4o,z
E
_--'( Swab C, Case 3-1, Grey)--__-_____-_-j-
tu4*ttz-tu Rt:0.62.0.90 AV:4 NL:0+ c ESI Fuil ms2 [email protected] [ 125.00-315.001
I+ c ESI Full ms2 15.00 [125.0G315.00]
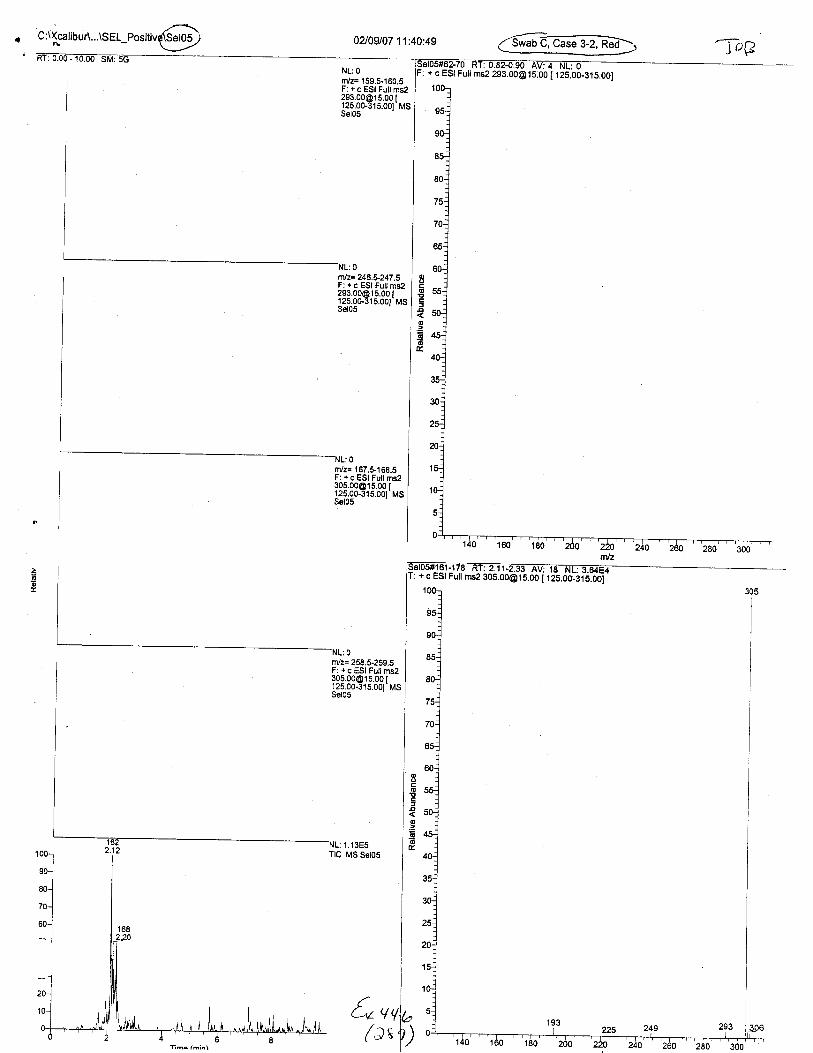
0?J09rc7 11:40:49
NL:O lF; + crU X I: U.62.{J.9U AV: 4 NL: OFull ms2 [email protected] [ 125.00-31S.00]
rvz= 159.5-'160.5F: + c ESI Full ms2
ffi81319'ir"'
nr/z= 167.$'168.5F: + s E51 Prt r.,
i:fig3eJifir".
;;dii;ljri'!2-ift :d;6"is.,jt'r12s.00-3is.oot
mts= 258.$259.5F: + c ESI Full [email protected] [12100.315.001 MS
z--T':^)uv
oooo
o.=oo
1.1 3E5MS Sel05
o
o
o66
&,(at

C:\Xcalibur\...\SEL PositivI 0?J09107 11:51:40 ----<--)
)t)NL: O
m/z= 159.5-160.5F: + c ESI Full [email protected] t12s.00-315.001 MsSel06
o
EoJ
o6o
rn/z= 167.5,'168.5F: + c ESI Fult [email protected] t.
32",5d30-3 t s. ool' r,ls
efub*rur-r/6 Rr: 2.11-2.31 AV: 16 NLi 6ZSE: + c ESI Full ms2 [email protected] 1 rzS.oo:eiS.oOl
m/z= 256.$259.5F: + s E51 Prt rs2
U3;l3e;3f3rr^
NL: 1.37E5TIC MS Sel06
ooo
oo
6
'u xt; u.bz{J.gu Av:4 NL:0Full ms2 [email protected] [ i25.00-31S.00]
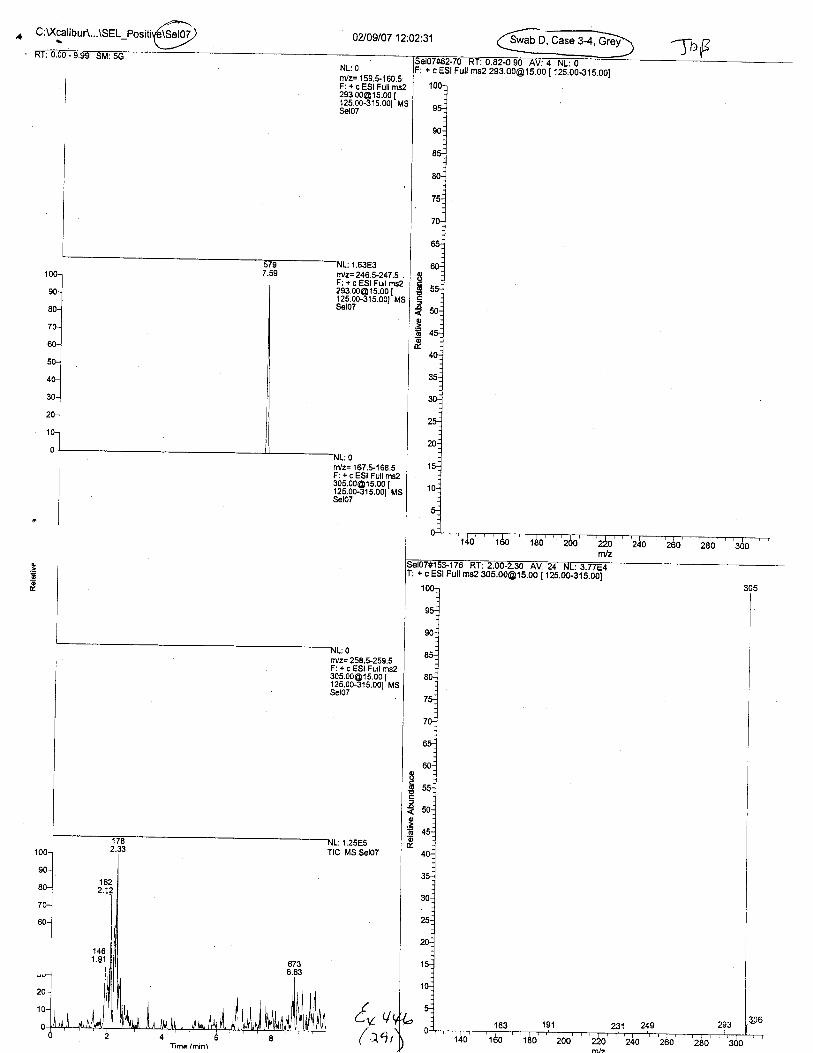
. C:U(calibur\...\SEL 0U09lO7 12:02:31 Swab D, Case 3-4,
T: + c ESI Full ms2 [email protected] t 125.06iJ
-YrFNL:0rn/z= 159.5-160.5F: + c ESI Full [email protected] [12s.00-315.001 MsSel07
IG
4
o
l9o
'NL: 1.25E5TIC MS Sel07
o
ou
o
.s!o
fo'/
utnz-tv r t; u.6z-u,9u AV: 4 NL: 0+ c ESt Fuil ms2 [email protected] [ 125.00-315.00I
fil/z= 167.t168.5F: + c ESI Full ms2305,[email protected] [12530-315.001 Ms
rn/z= 258.S259.5F: + c ESI Full ms2
?3*339t33&r",
( aq,
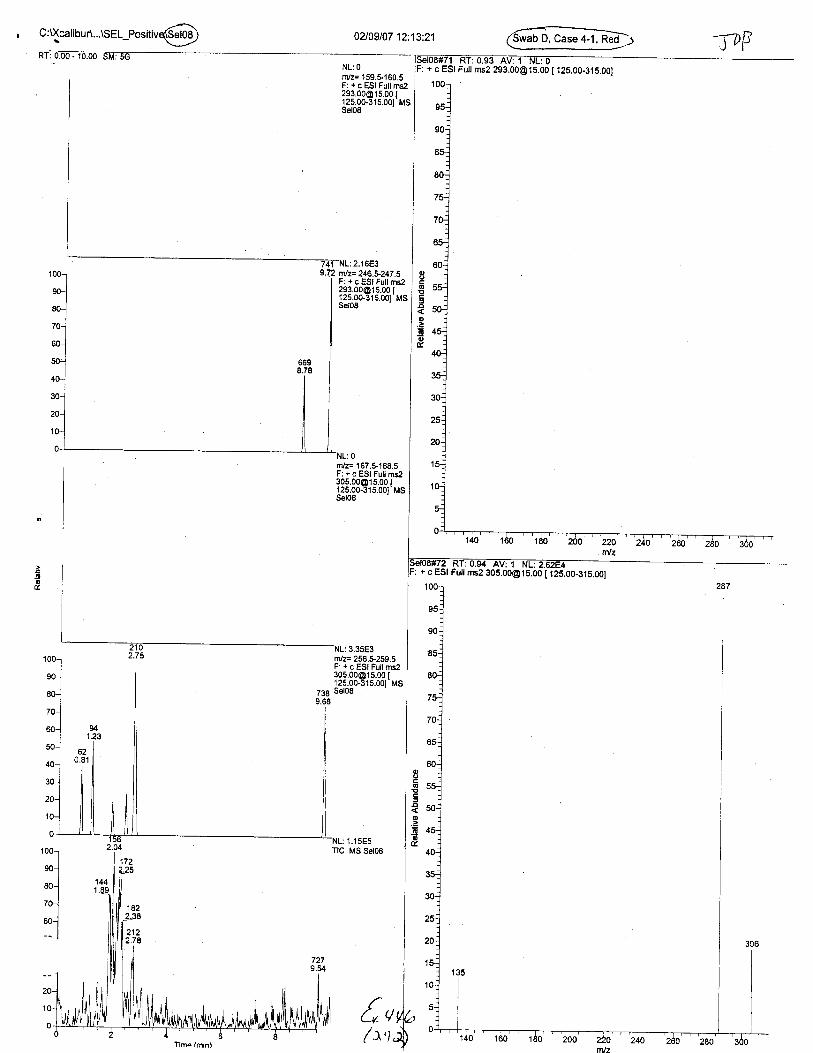
, C:U(calibun...\SEL positive{ffi;)t- OZ09l07 12:.13:2'l an
NL: 0n/z= 159.$160.5F: + c ESI Full [email protected] [125.00-3't5.001 MSSel08
+ c ESI Full ms2 [email protected] [ 125.00-315.00]
c)ooE
o.a.go
ruz= 167.$168.5F: + c ESI Full [email protected] [12100-315.001 Ms
m/z= 258.$259.5F: + c ESI Full [email protected] ['125.00-315.001 MS
736 Sel089.68
NL:'1,15E5TIC MS Sel06
ooo
o.:so
r c ESI Full ms2 [email protected] [ 125.00-3tS.O0l
6,
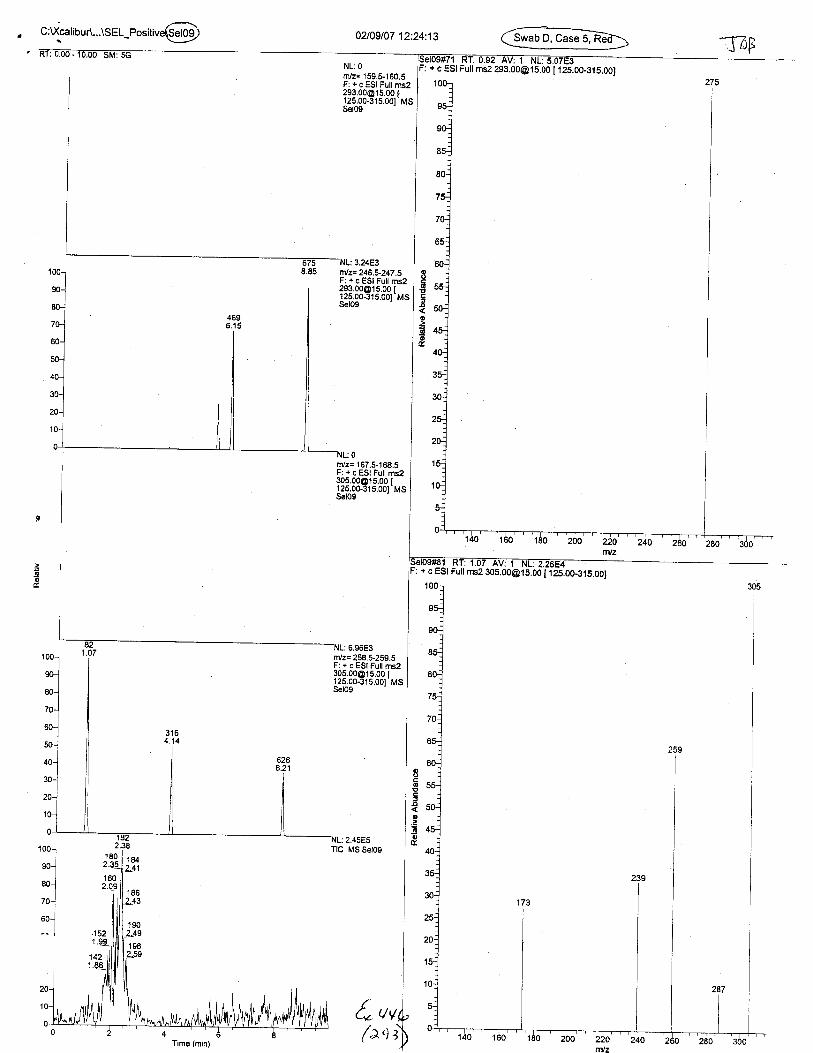
NL:0rn/z= 159.5-160.5F: + c ESI Full ms2.Yr.uu(4 to.uu t125.00-315.001 MSSel09
8.85 n:/z= 246.5-247 .sI F: + c ESI Full ms2
[email protected] |125.00-31 5.001'Ms
ntz= 25E.5-259.5F: + c ESI Futt [email protected] t12100-315.001 Ms
+ c ESt Fuil ms2 [email protected] [125.00-315.001
Full ms2 [email protected] [ 125.00-31S.00]
TIC MS Sel09

02t09t07 12..35..M Swab A, MAL. Yellow
trVz= 159.$160.5F: + c 551 Pr;; t",[email protected] I125.00-315.001 MS
: E. l4E3fil/z= 246.5-247.5F: + c ESI Full ms2
?i3:33913331t*
0o6E
o.:6o
1001
'o-]
'o-l. ,n_j
100-l
go-l
*-l,^l'"tuo-]
t" qq
+ c ESI Fuil msz [email protected] [ 125.00-315.001
9.97E2nvz= 'l 67.5-1 68.5F: + c ESI Full ms2
j!fli&ets,lerr*
m82 [email protected] [ 125.00-315.001
1 9a rso
168
182
't8/.
144
1
( aq+
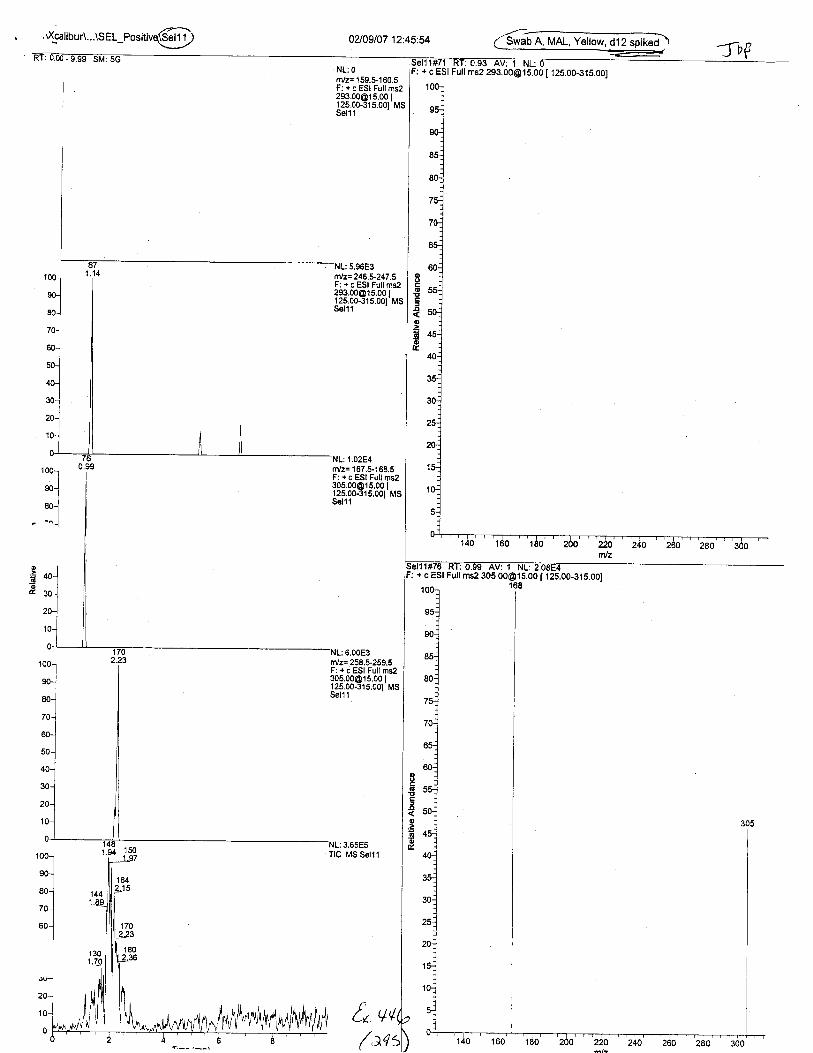
rXcalibuA...\SEL-eo.itiu@ 0?/09107 12:45:5,4
{bFnvz= 159.$160.5F: + c ESI Full [email protected] [125.00-315.001 MS
rtlz=246.5,247.5F: + c ESI Full [email protected] [125.00-315.001 MSSalt'l
. a ddtrt
IoE
oooEu
MS SelllNL:Ilc
rn/z= 258.$259.5F: + c ESI Full [email protected] [125.00.315.001 MSSel1l
fr'l(
I6u€o
66
Swab A, MAL, Yeltow, OiZ spifea-\
: + c ESI Fuil ms2 [email protected] [ 125.00-315.00]
[ 125.00-315.001
i.94 150
(v
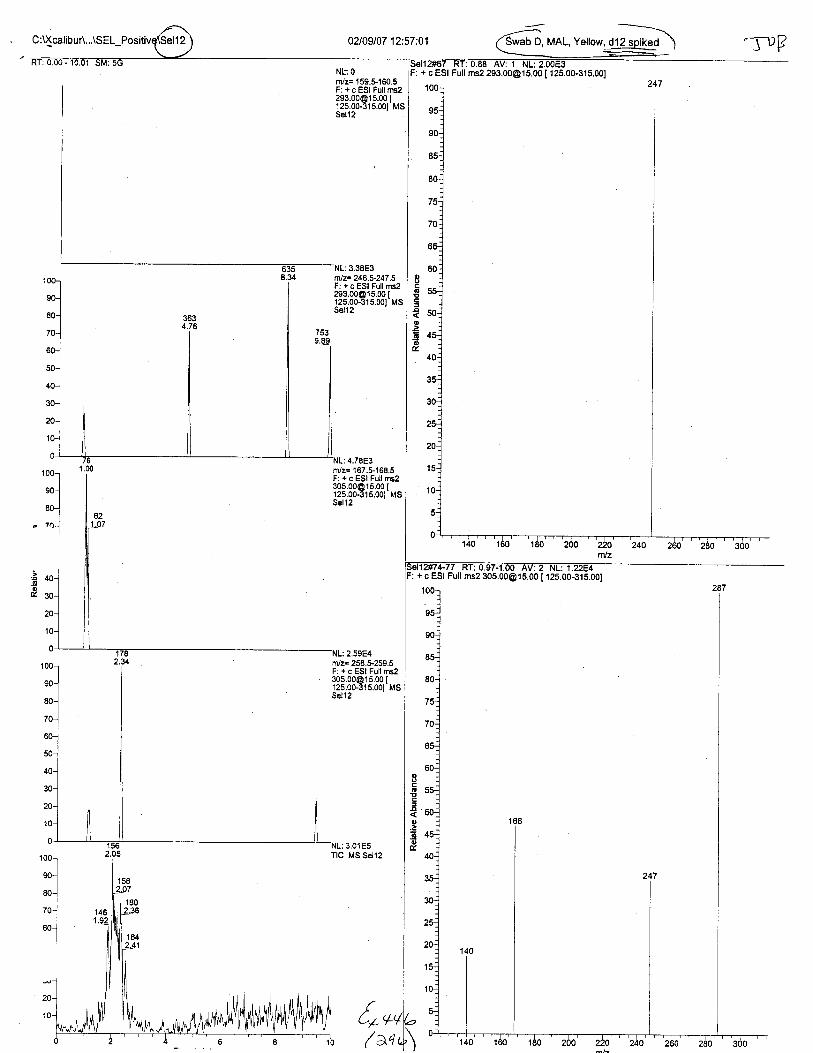
02109107 12:57:01 "TI'FNL:0rn/z= 159.$160.5F: + c ESI Full [email protected] ['125.00-315.00t MSSel12
+ c ESI Full ms2 [email protected] [ 1
et14t4-tI Kr: U.97-l.OO AV: 2 NL: 1.22E4: + c ESt Full ms2 [email protected] [125.00€15.00]
'Itlz= 246.5-247.5F: + c ESI Full [email protected] [125.00-315.001 MSSel12
!)
6
f!
ooo
o
oEoo.z6o3.0'1E5
MS Sel12100-]
;l--lza)-luo-]
dz= 258.$259.5F:+cESl [email protected] [125.00-315.001 MSSel l2
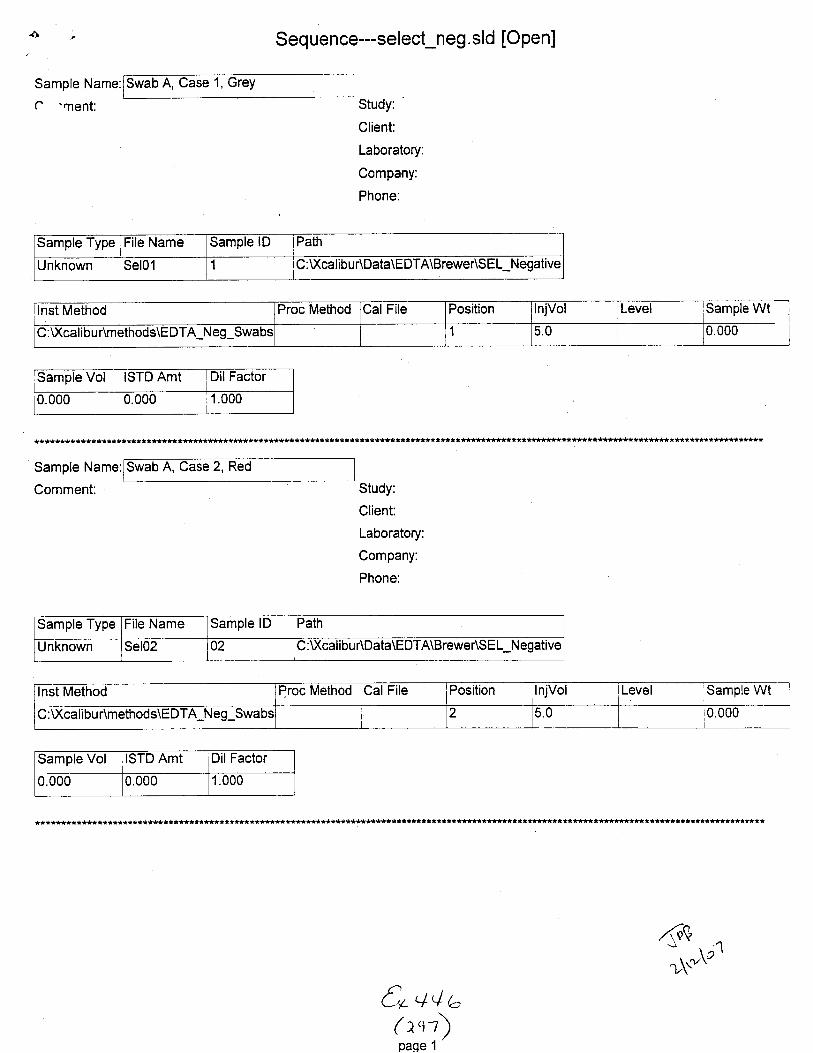
Seq uence--select-neg. sld [Open]
Sample Name:
c '"nent:
Swab A, Case 1,
Study:
Client:
Laboratory:
Company:
Phone:
Sample Type File Name Sample lD Path
Unknown Sel01 1 C :Xcalibur\Data\EDTA\Brewer\S E L_Negative
lnst Method Proc Method Cal File Position InjVol Level Sample Wt
C:U(ca I i bu r\methods\EDTA-Neg-Swabs 1 5.0 0.000
Sample Vol STD Amt DilFactor
0.000 0.000 1.000
Sample Name:
Comment:
, Case 2, Red
Study:
Glient:
Laboratory:
Company:
Phone:
Sample Type File Name Samole lD Path
Unknown Sel02 02 C : Xcal i bu AData\EDTA\Brewer\S E L_Negative
lnst Method Proc Method Cal File Position InjVol ,Level Sample Wt
C : U(ca li bu r\method s\EDTA_Neg_Swabs 2 5.0 0.000
Sample Vol ISTD Amt Dil Factor
0.000 0.000 1.000
*****tt***********t***********************#**********t***r**********
,49;r*u'
C"+4a( att)paqe 1

Sample Name:
C rent:
Seq uence---select_neg. sld [O pen]
Swab B, Gase 2,
Study:
Glient:
Laboratory:
Company:
Phone:
Sample Type File Name Sample lD Path
Unknown Sel03 03 C:Xcal ibu r\Data\E DTA\BreweASEL_N egative
lnst Method Proc Method Cal File Position lnjVol Level Samole Wt
C : Xcalib u Amethods\EDTA_Neg-Swabs 3 5.0 0.000
Sample Vol ISTD Amt Dil Factor
0.000 0.000 1.000
Sample ttame:
Comment Study:
Client:
Laboratory:
Company:
Phone:
Type File Name Sample lD Path
Unknown Sel04 04 C :U(calibu r\Data\EDTA\Brewer\S E L_N egative
nst Method Proc Method CalFile Position InjVol Level rSample Wt
C :U(ca li bu r\methods\EDTA-N eg-Swabs 4 5.0 0.000
Sample Vol ISTD AMt Dil Factor
0.000 0.000 1.000
4rtt*t"€, ++,-lrq s)

Sample Name:
r .ment: Study:
Client:
Laboratory:
Company
Phone:
Seq uence--select_neg. sld [Open]
Sample Type File Name Sample lD Path
Unknown Sel05 05 C:Xcalibur\Data\EDTA\Brewer\SEL Neqative
Inst Method Proc Method Cal File Position InjVol Level Samole WtG:Xcalibur\methods\EDTA Neo Swabs 5 5.0 0.000
Sample Vol ISTD Amt Dil Factor
0.000 U.OUO 1.000
Sample Name:
Comment:
Swab C,
Study:
Client:
Laboratory:
Company:
Phone:
Sample Type File Name Sample lD Path
unKnown Sel06 06 C :Xcal ibu AData\EDTA\BreweAS EL_Negative
Inst Method Proc Method Cal File Position InjVol Level ]Sample WtA_Neg_ 6 5.0 0.000
Sample Vol ISTD Amt Dil Factor
0.000 0.000 1.000
+t
44uaq ri\
oJf'

Sample Name:,Swab D, Case 3-4, GreY
Sequence--select-neg. sld [Open]
Study:
Client:
Laboratory:
Company:
Phone:
(' rent:
Sample Type File Name Sample lD Path
Unknown Sel07 07 C :Xcal ibu r\Data\E DTA\Brewer\SE L-Negativg
lnst Method Proc Method CalFile Position lnjVol Level Samole Wt
C : U(cal ibu r\meth ods\E DTA-Neg-Swabs 7 5.0 0.000
Sample Vol ISTD Amt Dil Factor
0.000 0.000 1.000
Sample Name:
Comrnent:
Swab D, Case 4-1,
Study:
Client:
Laboratory:
Company:
Phone:
Sample Type File Name lSample lD Path
Unknown Sel08 08 C :\)(cal ibu r\Data\EDTA\B rewer\SEL-Negative
lnst Method Proc Method CalFile Position InjVol Level Sample Wt
C :U(ca li bu r\method s\EDTA-Neg-Swabs I 5.0 0.000
Sample Vol ISTD Amt Dil Factor
0.000 0.000 1.000
ty- 4ab/s"9
r\'('u4 M

,-|'
Sample Name:
r nent:
Seq uence--select-neg. sld [Open]
D, Case 5,
Study:
Client:
Laboratory:
Company:
Phone:
Sample Type File Name Sample lD Path
Unknown Sel09 09 C :Xcalibun\Data\EDTA\Brewer\SEL-Negative
lnst Method Proc Method CalFile Position InjVol Level Sample Wt
C :U(cal i bur\methods\EDTA_Neg_Swabs I 5.0 0.000
Sample Vol ISTD Amt DilFactor
0.000 0.000 1.000
Sample Name:lSwab A, MAL, Yellow
Comment: Study:
Client:
Laboratory:
Gompany:
Phone:
Sample Type File Name Sample lD Path
Unknown Sel10 10 C : U(calibu r\Data\E DTA\Brewer\S E L-N eg ative
lnst Method Proc Method Cal File Position InjVol Level Sample Wt
C :U(cal i bu r\methods\EDTA-Neg-Swabs 10 b.0
Sample Vol ISTD AMt DilFactor
0.000 0.000 1.000
L,{ L{+(-/^ \( Joi)
*Jt*,"
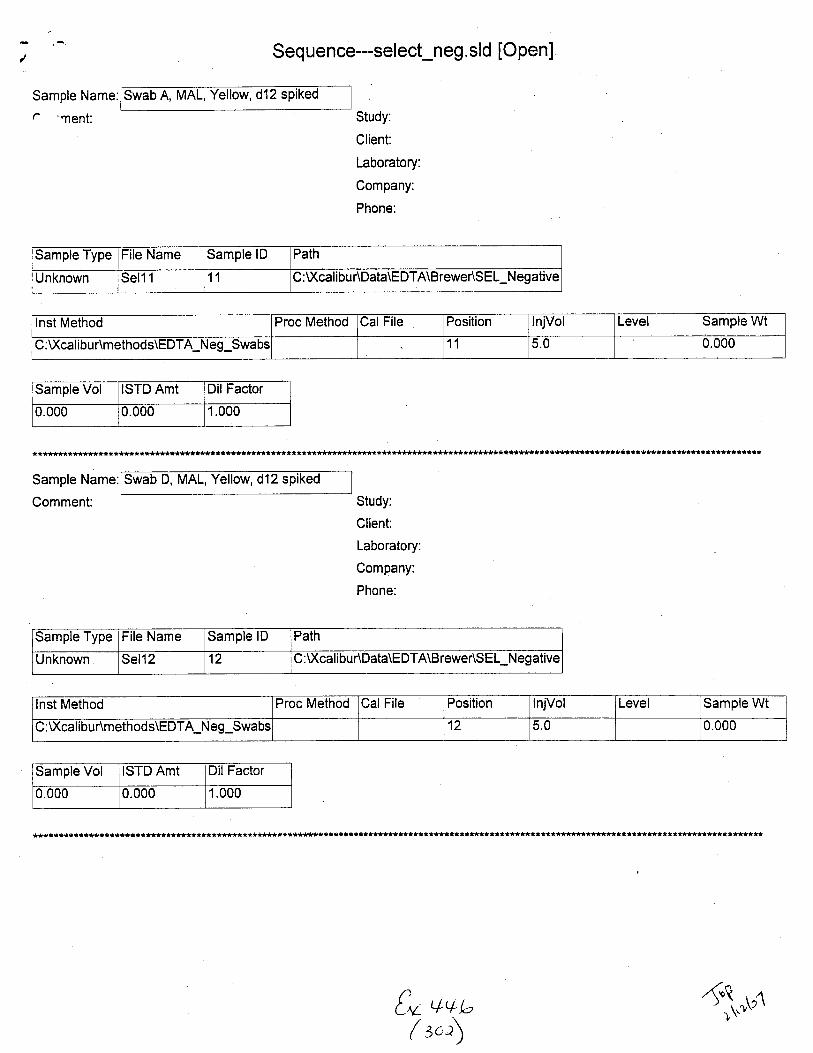
Seq uence--select_neg. sld [Open]
Sample Name:
t' 'ment:
A, MAL, Yellow, d12
Study:
Client:
Laboratory:
Cornpany:
Phone:
sample lype File Name Sample lD Path
Unknown Sel11 11 C :U(cal ibur\Data\EDTA\BreweAS E L_Negative
Inst Method Proc Method Cal File Position lnjVol Level Sample Wt
C :Xcal ibu r\methods\EDTA_N eg_Swabs 11 5.0 0.000
Sample Vol ISTD Amt Dil Factor
U.UUU 0.000 1.000
Sample Name:
Comment:
, MAL, Yellow, d12 spiked
Study:
Client:
Laboratory:
Company:
Phone:
Sample Type File Name Sample lD Path
Unknown Sel12 12 C :V(calibur\Data\E DTA\B reweAS EL_Negative
lnst Method Proc Method Cal File Position InjVol Level Sample Wt
C : U(cal ibu r\meth od s\EDTA_N eg_Swabs 12 5.0 r0.000I
Samole Vol ISTD Amt Dil Factor
O.UUU 0.000 1.000
to +*a( sa),

1001
;ilssl80-l
"-]ro-l
.u-l 1
8 60-.'l
ualzlvl 1uiz1:J4
m'lz= 246.5-247 .5 F: - cESI SRM [email protected] [246.50-247.50,272.50-273.s01 MSSel01
Time (mn)
nJz= 282.V2U.3F: - cESI SRM [email protected] [282.7U2U.251 MSSel01
tp aU( sat
NL:2.96E4rnlz=272.5-273.5 F: - cESI SRM [email protected] I?46.50-247.50,272.50-273.501 MSSel0l
DWaO A, \JaSC |, lJrt,y J'rNL: 1.08E4rniz= 299.5-300.5 F: - cESI SRM [email protected] I299.50-300.50.325.50-326.50t MSSel01
ESI SRM [email protected] [299.50.300.50.325s0-326.501 MS
ESI SRM [email protected] [31r5G312.501 MS
Time (min)

02112107 10:32:28
3.91 E4nlz=246.*247.5F.-cESI SRM [email protected] [246.50-247.50.272.s&273.501 MSSel02
1.29E3filz= 282.8-2U.3F:. - cESI SRM ms2303,[email protected] I282.7t284.2s1 MSSel02
[, v+
Time (min)(t,o)
Swab A, Case 2, Red
nr/z= 299.S300.5 F: - cESI SRM [email protected] I,oo qn_1nn 6n32s.50.326.501 MSSel02
nvz= 325.S326.5 F: - cESI SRM [email protected] I299.50-300.50,325.50-326.501 MSSel02
m/z= 31'1.5-312.5 F:- cESI SRM [email protected] [311.50.312.501 MSSel02
Time (mrn)

, C:U(calibuA...\SEL-Neeafiv@!],/ 02112J07 1O:43:17
NL:1.92E4ilz=272.5-273.5F: - cESI SRM [email protected],50-273.501 MSSel03
Ir'lz=246.5-247.5Fi - cESI SRM ms2291 [email protected] [246.9-247.fi.272.50-273.501 MSSel03
nlz=282.8-28/..3F:. - cESI SRM ms2303:[email protected] [282.7$.284.2s1 MS
1 00-l
^^l"r-l
I
oc6
o
.E
10(
9:
8:
80
7t
70
4
55
40
30
Time (min)
Swab B, Case 2, Grey JAP
Tlme (min)

C : u{ca I i bu 4...\S e L-N e gaIv(\Se to1) 021207 10:54:09 Swab C, Case 3-1, Grey ,Jr/13
NL: 1.21 E4trl/z= 299.5-300.5 F: - cESI SRM [email protected] I299.50-300.50,325.50-326.501 MSSel04
NL: 7.73E3r/z= 31 1.5-312.5 F: - cESI SRM [email protected] [311.50-312.501 MSSel04
NL: 1.34E4ttlz= 272.5-273.5 F: - cESI SRM [email protected] [246.50-247.50,272.5&273.501 MSSel04
rn/z= 325.$326.5 F: - cESI SRM [email protected] [299.50-300.50,325.50-326.501 MSSel04
o
d
o
o
tr- u,l ilx
NL: 3.74E3mlz=282.8-2U.3 Fi - cESI SRM [email protected] [282.7s.2U.251 MSSel04
Time (min) Time (min)&4

C:XcalibuA...\SEL_Negativ{9eP 0212107 't 1:04:58 Swab C, Case 3-2, Red J I'P
10(
9l
9(
AI
8(
7l
7(
8etSs.
NL: 1.09E4ftUz= 272.$273.5 F: - cESI SRM [email protected] [246.50-247.50,272.50-273.501 MSSel05
tt!z= 246.5-247 .5 F: - cESI SRM [email protected] [246.50-247.50,272.50-273.501 MSSelos
.r/z= 282.8-28/'.3 F: - cESI SRM [email protected] [282.75-284.251 MS
NL: 5.04E3m/z= 299.$300,5 F: - cESI SRM msZ3,[email protected] I299.50-300.50,325.50-326.501 MSSel05
r/z:325.5-326.5 F: - cESI SRM ms23,[email protected] [299.50-300.50,325.50-326.501 MSSel05
r/z= 31 1.5-312.5 F: - cESI SRM ms2356,[email protected] [311.50-312.501 MSDEIUJ
E6
€o
6
10c
Yi
8t
Af
7,
7C
CL
45
40
30
f" qs
Time (min) Time (min)
( s'"t)

C :Xca I ib q 4...\S e l-ru"S"tiu{@ 02/12/0711:15:48
NL;4.26E4nlz= 272.5-273.5 F: - cESI SRM [email protected] [246.50-247.50,272.50-273.501 MSSel06
1.88E4rnlz= 246.t247.5 F: - cESI SRM ms2291 [email protected] [246.fi-247.50.2725o-273.50i Ms
nlz= 282.8-28/.3 Fi - cESI SRM [email protected] [282.75-2A4.251 MSSel06
I
o
.Eo
100
93
90
80
70
65
60
55
45
40
t<
30
Time (min)
Swab C, Case 3-3, Grey :TOP
NL:1.20E4m/z= 299.5-300.5 F: - cESI SRM [email protected] I299.50.300.50,325.50.326.501 MSSel06
z,otE5rtz= 325.5-326.5 F: - cESI SRM [email protected] [[email protected],32s.50-326.501 MS
Time (min)

, C:Xcalibur\...tSEt-t tegativdsepZ) 02112107 11:26:37
NL:4.74E3$lz=272.$273.5Fi - cESI SRM [email protected] [246.50-247.il,272.s0-273.501 MsSel07
1.96E4nn-246.*247.5Fi -cESI SRM ms229120@1s,00 I246.fi-247.50.272.s0-273.50i MSSel07
'r'lz=282.8-2U.3F: - cESI SRM [email protected] [282.75-284.251 MSS€107
[y +,/a( tor)
Swab D, Case 34, Grey 10r
1 00-t
aq!*1*t
-. 1'-l70-J
L
oci
*.]sq
NL:7.88E3m/z= 299.5-300.5 F: - cESI SRM [email protected],325.50-326.501 MSSelo7
i2.23EgtrVz= 325.5-326.5 F: - cESI SRM [email protected] [299.50-300.50,32s.50-326.501 MsSel07
b.ZYEJntlz= 311.5-312.5 F: - cESI SRM [email protected] I31 1 .50-312.501 MSSel07
oc6
€o
Tlme (min) Time (min)

NL: '1.48E4
mlz= 272.5-?73.5 F: - cESI SRM [email protected] [246.50.247.50.272.50-273.501 MSSel08
C:D(calibuA...\SEL_NeOativQp)
100
90
02i1U07 11:37''28 Swab D, Case 4-1, Red -rbpNL: 1.85E4rn/z= 299.5-300.5 F: - cESI SRM [email protected] [299.50-300.50,325.50-326.501 MSSel08
1.O7E4rolru-l
ro-i,lE0-l
75-]I
::.1"lI 60-]ol
nlF 246.*247.5 Fi - cESI SRM [email protected] [246.50-247.50,272.50-273.s01 MSSel08
nlz=282.E-2U.3 F: - cESI SRM [email protected] [282.75-284251 MSSel08
m/z= 325.$326.5 F: - cESI SRM [email protected] [299.50-300.50,325.50-326.501 MSSelOS
NL:7.79E3rn/z= 311.F.312.5 F: - cESI SRM [email protected] [311.50-312.501 MSSelOS
o
3eo
'nme (min) 'nme (min)

, C:U(balibuA.,.rSel-rueOativ@
lool oft
'lls'l I
02112107 1 1 :48:16 Swab D, Case 5, Red wp
mlz= 272.1273.5 F: - cESI SRM [email protected] [246.50-247.50,272.50-273.s01 MSSel09
ff{z= 246.5-247 .5 F: - cESI SRM [email protected] [246.fi-247.50.272.s0-273.501 MSSel09
rtlz= 282.8-2U.3 F'. - cESI SRM [email protected] MSSel09
[* uu,( s")
o
dE
5e@IoE
rn/z= 325.5-326.5 F: - cESI SRM [email protected] I299.50-300.50,325.50-326.501 MSSel09
ESI SRM [email protected] [311.50-312.501 MSSel09
Time (min) Time (min)
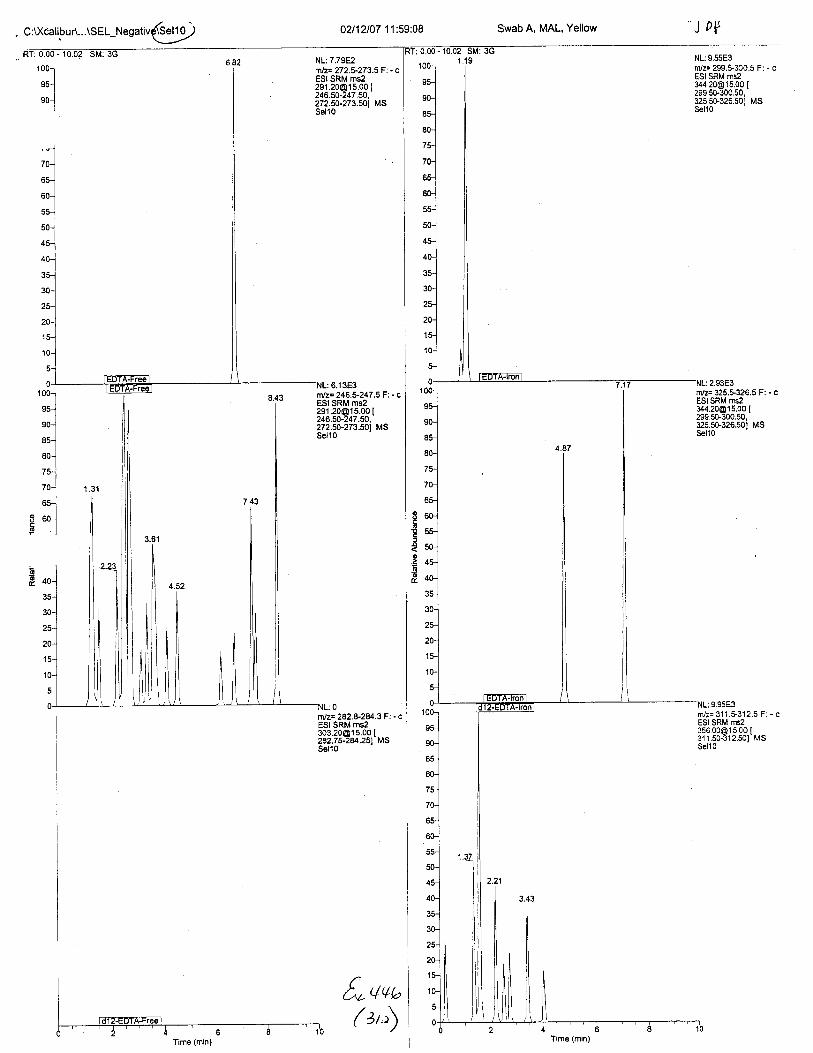
, C:U(calibuA...\SEL-NeSativgi 02112107 11:59:08 Swab A. MAL, Yellow -J Dtt'
1 00tI*l
oni*l
att
1001
;;,u-l
I
ro-.1
tul
'o-l
s .o-]ol
A lAEA
rlz= 246.5-247 .5 F'. - cESI SRM [email protected] [246.50-247.fi,272.50-273.s01 MSSel l0
qvb
Time (min)
(2,)
NL: 9.55E3rn/z:299.$300.5 F: - cESI SRM [email protected] [299,50-300.50,325.50-326.501 MSSel10
z.vlEJrl/z= 325.$326.5 F: - cESI SRM [email protected] [299.50-300.50,325.50-326.501 MSSel10
Time (min)

C :lXcalibu A...\S EL-NeOati{}p
7
NL: 7.28E3nrlz=272.*273.5F: - cESI SRM [email protected] [246.50-247.50,272.50-273.501 MSSell'l
nlz=246.U24?.5F: - cESI SRM ms2291 [email protected] [246.fi-247.fi,272.50-273.s01 MSSelll
0?112107 12:10:01
:1.'llE6ntlz=282.6-28/..3F:- cESI SRM [email protected] [282.7r2U.251 MSSell'l
Swab A, MAL, Yellow, d12 spiked -JbP
1001
--l,"1qnJ--l
NL:2.06E3dz= 299.5-300.5 F: - cESI SRM [email protected] I299.50-300.50,325.50-326.501 MSSell 1
rnlz= 325.5-326.5 F: - cESI SRM [email protected] I299.50-300.50,325.50-326.501 MSSell l
:3.74E4
o
o
oo
miz= 3'l 1 .5-312.5 F: - cESI SRM [email protected] I311.50-312.5O1 MSSel11
80
70
{n,tq{"
Time (min)
(t,tTime (min)

C lXcalibur\...\SEL-NeSativeEP 0211A07 12'.20:51 Swab D, MAL, Yellow, 01z sptKeo Jv7
NL:3.25E3nr/z= 299.$300.5 F: - cESI SRM [email protected] [299.50-300.50,325.50-326.501 MSSel12
3.78E3r/z= 325.$326.5 F: - cESI SRM [email protected].
ms2r5.00 I
299.50-300.50,325.50-326.s01 MsSell 2
1.03E4r/z= 31 1.$312.5 F: - cESI SRM [email protected] [311.50-312.501 MSSel12
rool
nl*l
NL: 5.96E3r:.lz=272.5-273.5 F: - cESI SRM [email protected] (
246.50-247.fi,272.sG273.s01 MSSel12
NLi 8.03E3trtlz= 246.*247.5F: - c1001
*-lo.-l*l80-l
'u-lrol*l
8 60-lg -. I
ESI SRM [email protected] [246.fi-247.&,272.s0-273.501 MSSelt2
mlF 282.8-2u.3F'. - cESI sRM [email protected] [282.7$284251 MSSell2
@
F
€o
.Eo
Time (min)
L.O.D.
{* qlb(:is)

Sample Name:
C nent:
Sequence---LoD_neg. sld [Open]
100 ppm EDTA
Study:
Client:
Laboratory:
Company:
Phone:
Sample Type File Name Sample lD Path Inst Method
Unknown LODOl C:XcalibuAData\EDTA\Brewer\LOD NeoatMe g: V\calibur\methods\EDTA Nec
Proc Method CalFile Position lnjVol ,evel Sample Wt Sample Vol ISTD Amt
1 5.0 u.000 0.000 0.000
Sample Name:
Comment:
100 ppm EDTA
r*****************
*********t**************t*************************************
Study:
Client:
Laboratory:
Company:
Phone:
fl+uu( stu)nano 1
ft>[r'\o1
Proc Method Cal File Position!
InjVol Level Sample Wt Sample Vol ISTD Amt
1 5.0 0.000 0.000 0.000

Sequence---LOD_neg.sld [Open]
Sample Name:
C nent:
100 ppm EDTA
Study:
Client:
Laboratory:
Company:
Phone:
Sample Type File Name Sample lD Path Inst MethodUnknown LODO3 01 : U(calibu r\Data\EDTA\BreweALO D_Negative G:U(calibuAmethods\EDTA Nei
Proc Method CalFile Position njVol Level Sample Wt Sample Vol ISTD Amt5.0 0.000 0.000 0.000
*******i*+*t*********t**t************tt**r********
Sample Name:
Comment:
ppm EDTA
Study:
Client:
Laboratory:
Company:
Phone:
Sample Type l-rle Name Sample lD Path lnst Method
Unknown LOD04 02 C :U(calibu r\Data\EDTA\Brewer\tO[Negative C : Xca I ibu r\m etn oO s\EDTA_N e g
Proc Method Cal File Position InjVol Level Sample Wt Sample Vol ISTD Amt2 5.0 0.000 0.0u0 0.000
l********************************************i**********
5u a'/ bG,r)
-yit-vlvlo1
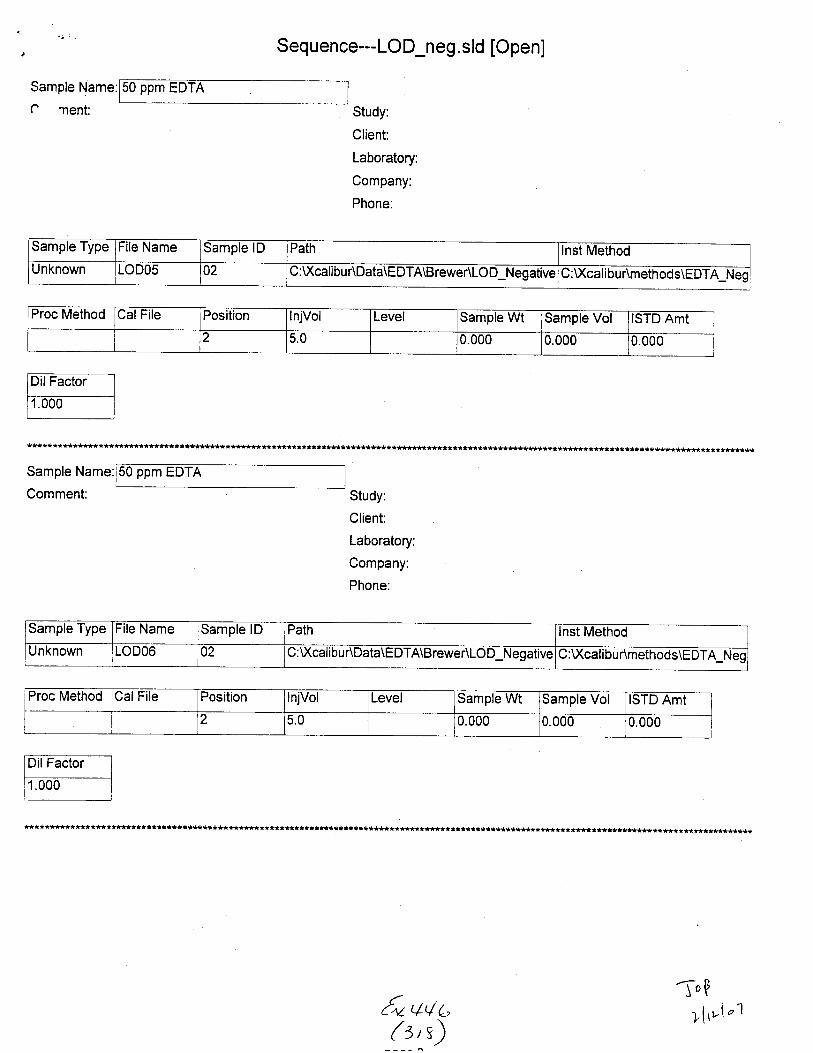
Sample Name:
c nent:
Sequence---LoD_neg. sld [Open]
50 ppm EDTA
Study:
Client:
Laboratory:
Company:
Phone:
Sample Type File Name Sample lD Path Inst Method
Unknown LODO5 02 C: U(calibu r\Data\EDTA\Brewer\LOD_Negative G: V(cal i bu r\method s\EDTA_Neg
Proc Method CalFile Position lnjVol Level Sample Wt Sample Vol ISTD Amt2 5.0 0.000 0.000 0.000
Sample Name:
Comment:
ppm EDTA
Study:
Client:
Laboratory:
Company:
Phone:
Sample Type ile Name Sample lD Path Inst Method
Unknown LODO6 02 C : Xcali bu r\Data\E DTA\Brewer\LO D_Negative C:Xcalibur\methods\EDTA Nec
Proc Method CalFile Position lnjVol Level Sample Wt Sample Vol ISTD Amt2 5.0 u.uuO 0.000
**#*****************t*******************t************t********t
5, 4,/ e3,s)
-OI0Y
"tlpl"1

"t. " ''
Sample Name:
c rent:
Sequence---LOD_neg. sld [Open]
25 ppm EDTA
Study:
Client:
Laboratory:
Company:
Phone:
f******i*******t*****i*************t********s******tr*t***************r*****************
Sample Type File Name Sample lD Path Inst Method
Unknown LODOT 03 C : U(calibur\Data\EDTA\Brewer\LO D_N egative :v\caltbur\rnethods\EDTA Nec
Proc Method Cal File Position lnjVol Level Sample Wt Sample Vol ISTD Amt
3 5.0 u.000 0.000 0.000
Sample Name:
Study:
Client:
Laboratory:
Company:
Phone:
uample lype File Name Sample lD Path Inst Method
Unknown LoD08 ]03 C : U(cali bu r\Data\EDTA\BreweALO D_N egative C:Xcalibur\methods\EDTA Neo
Proc Method Cal File Position lnjVol Level Sample Wt Sample Vol ISTD Amt
3 5.U 0.000 rJ.u00 0.
- qq/o
(:^'^,\
7rVvl,'lc1
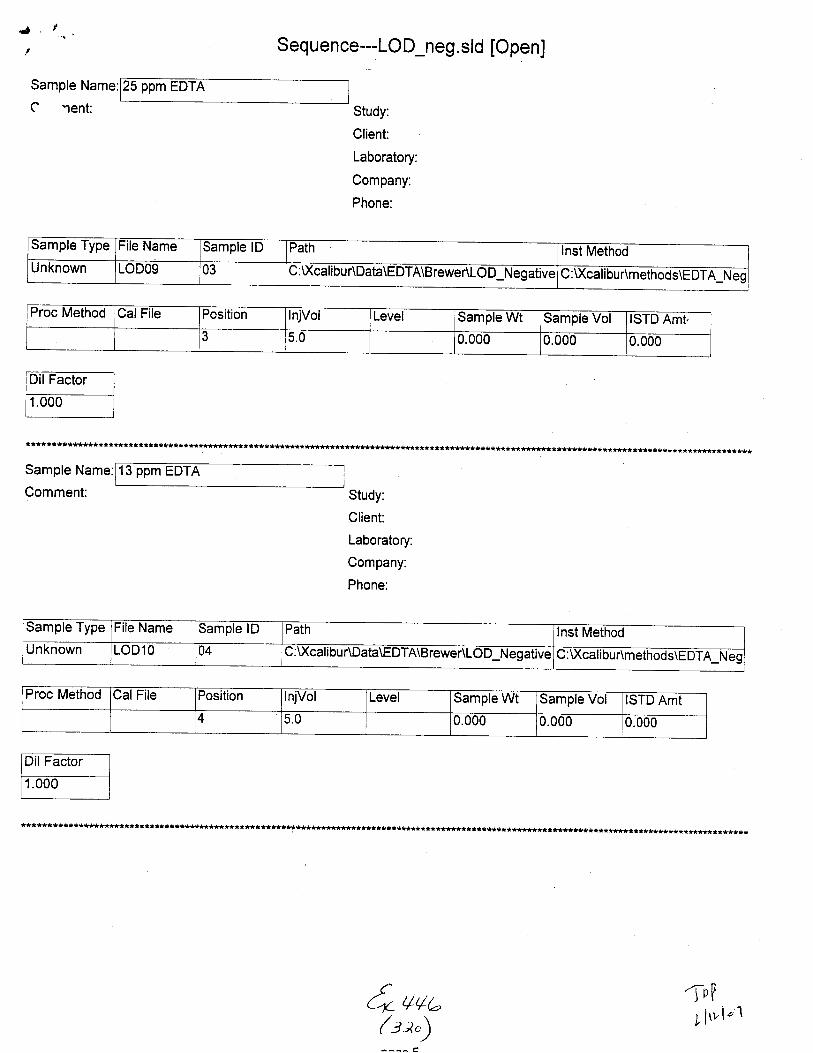
J '",'
Sample Name:
e rent:
Seq uence---LO D_neg. sld [Open]
25 ppm EDTA
Study:
Client:
Laboratory:
Company:
Phone:
Sample Name:
Comment:
ppm EDTA
Study:
Client:
Laboratory:
Company:
Phone:
****************t************r**s**************************s*****t****t*****
Sample Type File Name Sample lD Path Inst MethodUnknown LODOg 03 C :Xcalibu AData\EDTA\B reweALOD_t',I eg ative C:U(calibuAmethods\E DTA Nec
Proc Method CalFile Position InjVol Level Sample Wt Sample Vol ISTD Amt.3 5.0 0.000 0.000 0.000
******t*********
Sample Type ile Name Sample lD Path Inst MethodUnknown LOD1O 04 C:U(calibu r\Data\E DTA\B reweAIOD_N egEtive U:\Xcatrbur\methods\EDTA Nec
Proc Method CalFile Position InjVol Level Sample Wt Sample Vol ISTD AmtAA 0.000 0.000 0.000
Quuuba)
ApU
Ylvl"1

-,
Sample Name:
C rent:
Sequence--LOD_neg. sld [Open]
13 ppm EDTA
Study:
Client:
Laboratory:
Company:
Phone:
********t*********************t**t**********t******s***t****************t********************t****iis***********t**********ffi********
Sample Name:
Comment:
13 ppm
Study:
Client:
Laboratory:
Company:
Phone:
Sample Type File Name Sample lD Path lnst Method
Unknown LOD11 04 C :U(calibuAData\EDTA\Brewer\LO D_Negative C:\)(calibur\methods\EDTA Neo
Proc Method CalFile Position njVol Level lSample WtI
Sample Vol ISTD Amt
4 5.0 0.000 0.000 0.000
Sample Type File Name Samole lD Path lnst Method
Unknown LOD12 04 C :U(calibu AData\EDTA\BreweALO D-Negative C:U(calibur\methods\EDTA N
Proc Method CalFile Position lnjVol evel Sample Wt Samole Vol ISTD Amt
4 5.0 0.000 0.000 0.000
****t***********
{o q,/,-( zt,\
zfoJDY
)lru'\21

6 ppm EDTA
Seq uence---LOD_neg. sld [Open]
Study:
Client:
Laboratory:
Company:
Phone:
********t*tf ******************************t********i*****f *r
Study:
Client
Laboratory:
Company:
Phone:
Sample Name:
r lent:
Sample Name:
Comment:
ppm EDTA
Sample Type File Name Sample lD Path lnst MethodUnknown LOD13 05 \/\Ldiluut \ua[a \tru I A\E'rewer\Luu_Nggatlv€ :v(calibur\methods\EDTA Nec
Proc Method Cal File Position lnjVol Level Sample Wt Sample Vol ISTD Amt5 5.0 0.000 0.000 0.000
Sample Type File Name Sample lD Path Inst MethodUnknown LOD14 05 u : \xcatrbu r\Data\EDTA\B reweALOD_Negative C:Xcalibur\methods\EDTA I'teo
Proc Method CalFile Position InjVol Level lSample WtI
Sample Vol ISTD Amtc 5.0 0.000 0.000 0.000
.***************l***************tt********s**i
6. uoo(sta)
Tr?-t'ltvlal

q .'",.,
Sample Name:
n Ytent:
Sequence---LOD_neg. sld [Open]
ppm EDTA
Study:
Client:
Laboratory:
Company:
Phone:
Sample Type File Name Sample lD Path Inst MethodUnknown LOD15 05 :U(calibuAData\E DTA\B rewer\LO D-Negative u:v(calibur\rnethods\EDTA Nec
Proc Method Cal File Position lnjVol Level Sample Wt Sample Vol ISTD Amt5 5.0 0.000 0.000 0.000
Q vva( t:z)
anT'Vl'v\o1

C :\)(calibur\...\LOD-NeOativ@$ 0U1?i07 12:41:10 100 ppm EDTA J"?
n/z= 272.5-273.5 F: - cESI SRM [email protected] [246.50-247.50,272.50-273.501 MSLod01
fitlz= 246.+247.5 Fi - cESI SRM [email protected] [246.50.247.50,272.5O.273.s01 MSLodol
NL: 1.94E4BVz= 299.5-300.5 F: - cESI SRM [email protected] [299.50-300.50,325.50-326.501 MSLodo1
o
o
o
o
NL:0tf'lz=282.8-2U.3Fi -cESI SRM [email protected] [2A2.75-2U.251 MSLod0'l
fl/z= 325.5-326.5 F: - cESI SRM [email protected] [299.50-300.50,325.50-326.501 MSLod0l
fime (min)
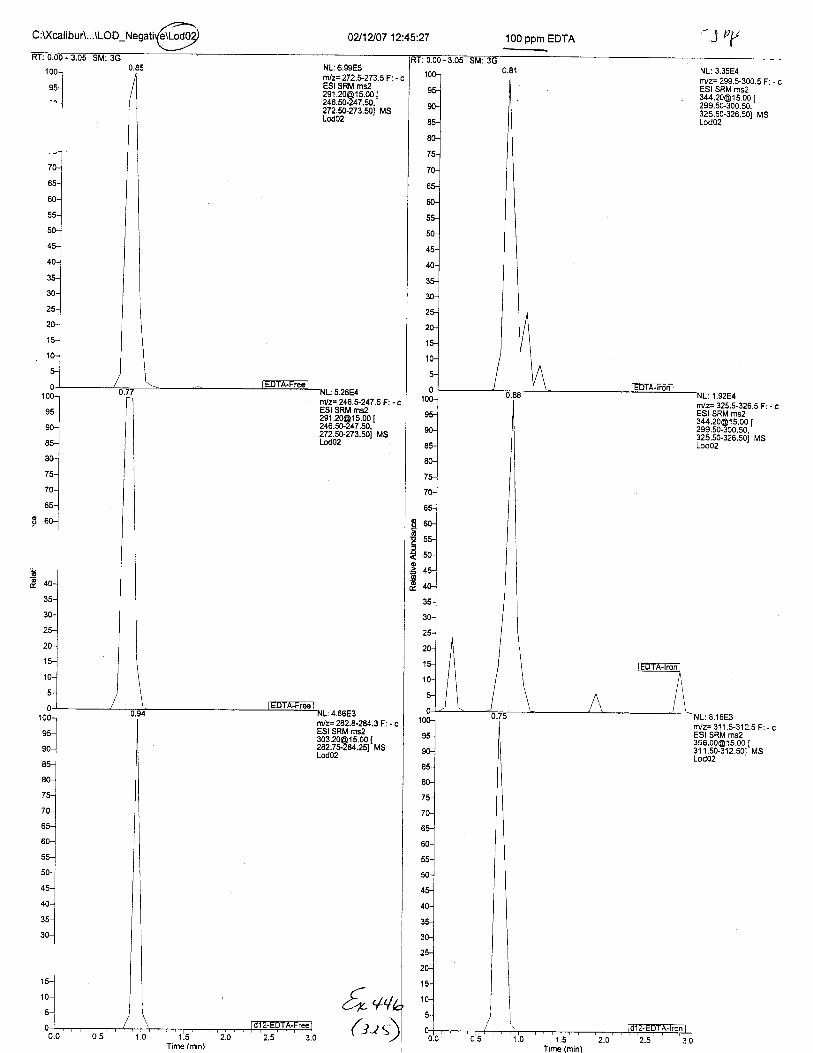
02l1aa7 12'.45'.27
ftill=272.1273.5F: - cESI SRM [email protected]
ms2r5.00 I
246.56247.fi,272.5e273.s01 MS
100 ppm EDTA'\eu
I
rn/z= 325.5-326.5 F: - cESI SRM [email protected] [299.50.300.50,325.50-326.501 MSLod02
:5.26E4nlz= 246.5-247.5F: - cESI SRM [email protected] I246.50-247.50,272.s0.273.501 MSLod02
o
ooo
NL:4.66E3nlz=282.8-2U.3 F: - cESI SRM [email protected] [email protected] [282J2$284.251 MS
6u,/,
: E.16E3nlz= 311 .5-312.5 F: - cESI SRM [email protected] I31 1.50.312.501 MSLod02
Time (min)
(t-ts

NL:6.6585mlz= 272.5-273.5F: - cESI SRM [email protected] I246.50-247.50,272.50-273.501 MSLod03
0211207 12:49:20 100 ppm EDTA T,F
n/z= 299.5-300.5 F: - cESI SRM [email protected] [299.5G300.50.325.50-326.50} MSLod03
t*r--l
*-l*.]*-l7sJ
?o-l
"1,8 60l
NL:4.28E4rnlz= 246.5-247 .5 F: - cESI SRM [email protected] [246.50-247.50,272.s0-273.501 MSLod03
nlz=282.8-2U,3F:. cESI SRM [email protected] [282J3$284.251 MS
6rw
1001
^-l--lso-]
als0-l
"lro-1,l60-l
--l*.]50-J
ou-]I
oo-l
*-l
(a sc.

C:Xcalibur\...\LOD_Negati 02h207 12:53:15 50 ppm EDTA 'TPP
10(
8(
7l
7(
ba
Qar
NL:4.19E4ntlz=272.*273.5 F: - cESI SRM [email protected] [246.50-247.50,272.50-273.s01 MSLodOl
ESI SRM [email protected] [246.fi-247.50,272.s0-273.501 MSLod04
mlz=282.8-2U.3F: - cESI SRM [email protected] [282.75-2u.251 MSLod04
NL:2.32E4rnlz= 299.5-300.5 F: . cESI SRM [email protected],qo qo-?no qn
325.50-326.501 MSLod04
:3.31E3r/z= 325.$326.5 F: - cESI SRM [email protected] I299.50-300.50.325.50-326.501 MSLodOl
3,41E3r/z= 311.$312.5 F: - cESI SRM [email protected] [311.50-312.s0j MSLod04
I6
e@
-c
1.5Time (min)
E,v
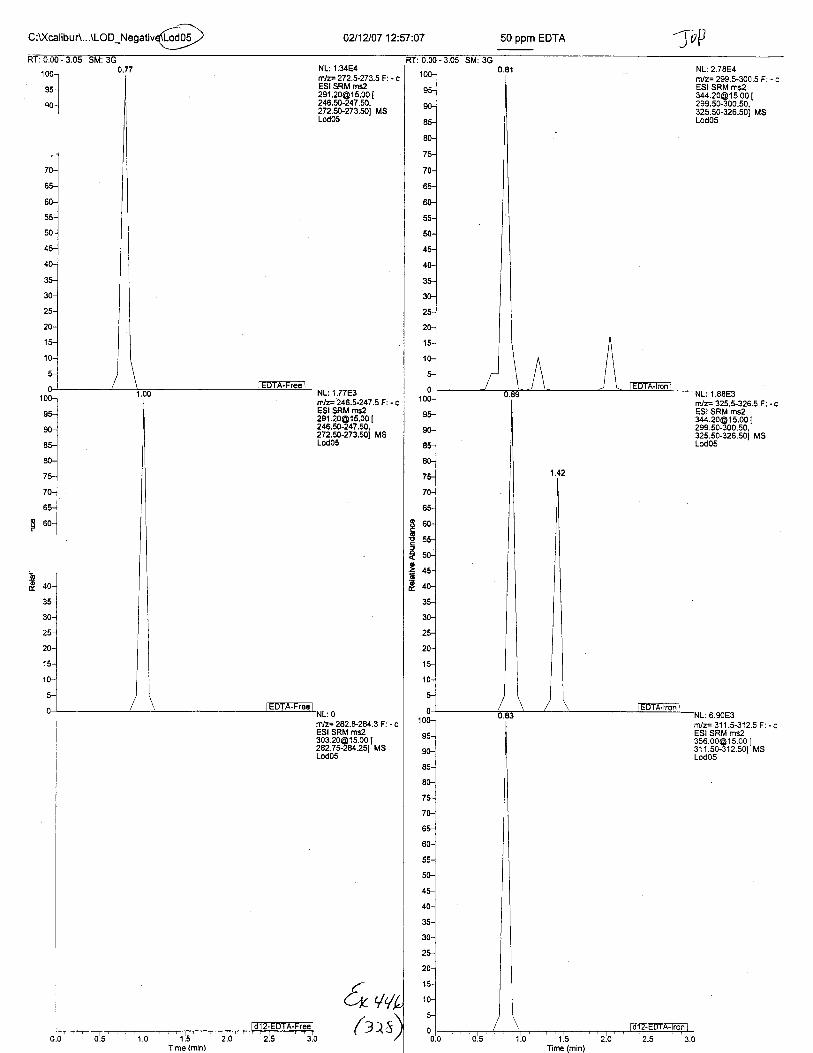
C:l(calibur\...\LOD_Negativ
0.77
02fi407 12:57:07
NL:'1.77E3
'r'lz= 246.5-247 .5 F: - c
NL:1.34E4mlz=272.5-273.5 Fi - cESI SRM [email protected] [246.&-247.50,272.50-273.501 MSLod05
ESI SRM [email protected] [246.50-247.50,272.5C273.sO1 MSLod05
NL:0rnlz:- 282.V2U.3 F: - cESI SRM [email protected] [282.75-2u.251 MSLod05
IF
)€o
@oE
Time (min)
& vq,
50 ppm EDTA joP
r/z= 325.5-326.5 F: . cESI SRM [email protected] {299.50-300.50,325.50-326.501 MSLodO5
NL: 6.90E3rn/z=311.5-312.5 F:.cESI SRM [email protected] [311.50-312.501 MSLod05
Time (min)
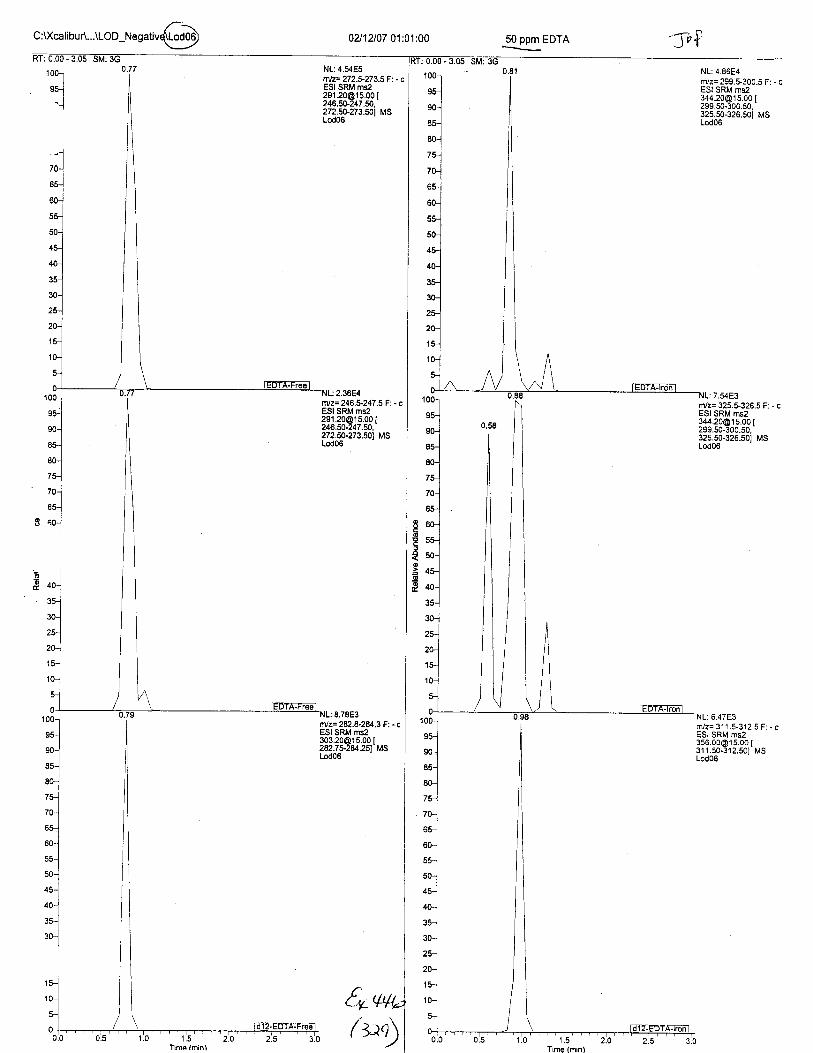
C :U(ca libuA...\LOO-Nesativ6';b 0?J12107 01 :01:00
NL:4.54E5rtlz= 272.5-273.5 F: - cESI SRM [email protected],272.50-273.s01 MSLod06
ftlz=246.5-247.5 F: - cESI SRM msz29120@15,00 [246.50-247.fi.272.50.273.501 MSLod06
€-
50 ppm EDTA ')pt'
1 o0l
--l
^.1
7.54E3
o
o
€o
.Eo
nr/z= 325.$326.5 F: - cESI SRM [email protected] [299.50-300.50.325.50-326.501 MSLod06
r/z= 311.5-312.5 F: - cESI SRM [email protected] [311.s0-312.501 MSLod06
10(
8:
EO
7C
6C
55
40
30
1.5nme (min)Time tminl
bD

C :U(calib ur\...\LO O-f.f "Orr'@ 0211A07 01:04:53 25 ppm EDTA
100-t
oJ*l-J
ESI SRM [email protected] [246.50-247.50,272.50-273.501 MS
NL:123E4
']/z= 246.5-247 .5 F: - c
ESI SRM [email protected] [248.50-247.50,272.50-273.501 MSLod07
NL: 1.63E4miz= 299.5.300.5 F: . cESI SRM [email protected],325.50-326.501 MSLod07
r/z= 325.5-326.5 F: - cESI SRM [email protected],325.50-326.50t MSLod07
NL:1.79E3nlz= 282.8-2U.3 F: - cESI SRM [email protected] I282.7$284.251 MSLod07
rvz= 311.5-312.5 F: . cESI SRM [email protected] MS
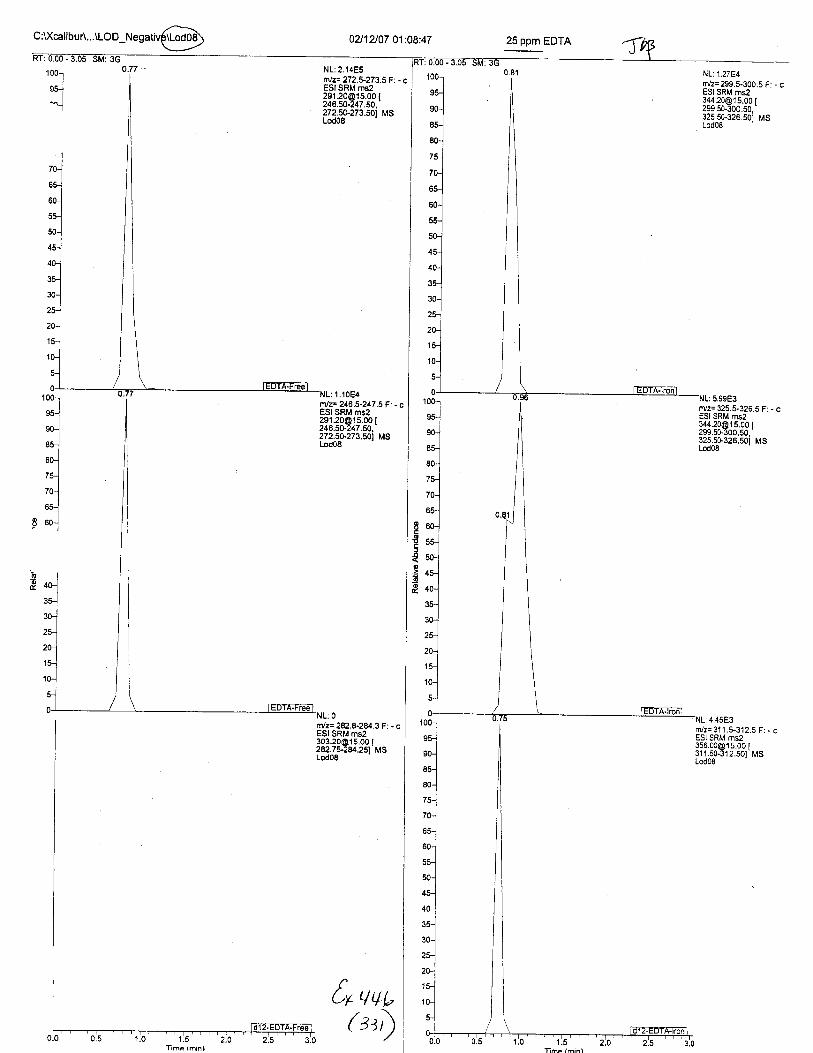
02J12107 01:08:47
NL:1.10E4r 1z.246,5-247.5F:-cESI SRM msz29'[email protected]@15.00 [246.50-247.50,272.s0-273.501 MS
25 ppm EDTA
NL:1.27E4nvz= 299.5-300.5 F: - cESI SRM [email protected] I299.50-300.50.325.50-326.50t MSLod08
1001
".]s5-l
8JI?l
?0-l
ari8 60--l
ffVz= 325.5-326.5 F: - cESI SRM [email protected] t299.50-300.50,-325.50-326.501 MSLod08
f,y 4+bGt)

0211A07 01:12:45 25 ppm EDTA
NL:2.44E4m/z= 299.5-300.5 F: - cESI SRM [email protected] [299.50-300.50.325.50-326.s0t MsLod09
NL:2.03E5nlz--272,5-273.5F: - cESI SRM ms2291,[email protected] [246.50-247.50.272.50-273.501 MSLod09
t00
90
AE.
E0.
65.
60.
55-
5U-
45-
40-
3$
30-
Io
e
!o
rn/z= 325.5-326.5 F: - cESI SRM [email protected] [299.50-300.50,325.50-326.501 MSLod09
4.73E3
[+ a(( tta

C :U(ca libur\...\LOD-NeSati{11E 0U12107 01:16:37 13 ppm EDTA atF0.77 NLi 4.42E4
'll/z= 272.5-273.5 F: - cESI SRM [email protected] I246.50-247.50,272.50-273.501 MSLod10
r'lz=246.+247.5F:. cESI SRM [email protected] [246.50-247.50,272.50-273.501 MSLod10
NL: 0tnlz=282.8-2g.3 F: - cESI SRM [email protected] [282.752U.251 MSLod10
ood
:o
=
8.91E2m/z= 3'11.$312.5 F: . cESI SRM [email protected] [311.50-312.501 MS
f+ q((zst)
NL:2.'13E4m/z= 299.5-300.5 FESI SRM [email protected] I299.50-300.50,'325.50-326.50t MSLod'10

02112107 01:20:32
NL:6,86E4rniz=272.5-273.5 Fi - cESI SRM ms2291 [email protected] [246.50-247.50.272.50-273.s01 MS
:9.E7E3f,]lz=246.5-247.5 F: - cESI SRM [email protected] [246.50-247.50,272.50-273.s01 MSLodl I
.tlz=282.8-2U.3 F'. - cESI SRM [email protected] [282.75-28/.251 MSLodt'l
od
o
@o
tr qq
( ts+
13 ppm EDTA Jtg
fEDTfjronl
1.00E4m/z= 325.5-326.5 F: . cESI SRM [email protected] [299.50.300.50.325.50-326.501 MSLodll
r r1trarvz= 3 l 1.5-31 2.5 F: - cESI SRM msz3s6,[email protected] I3'11.50-3'12.501 MSLodl 1
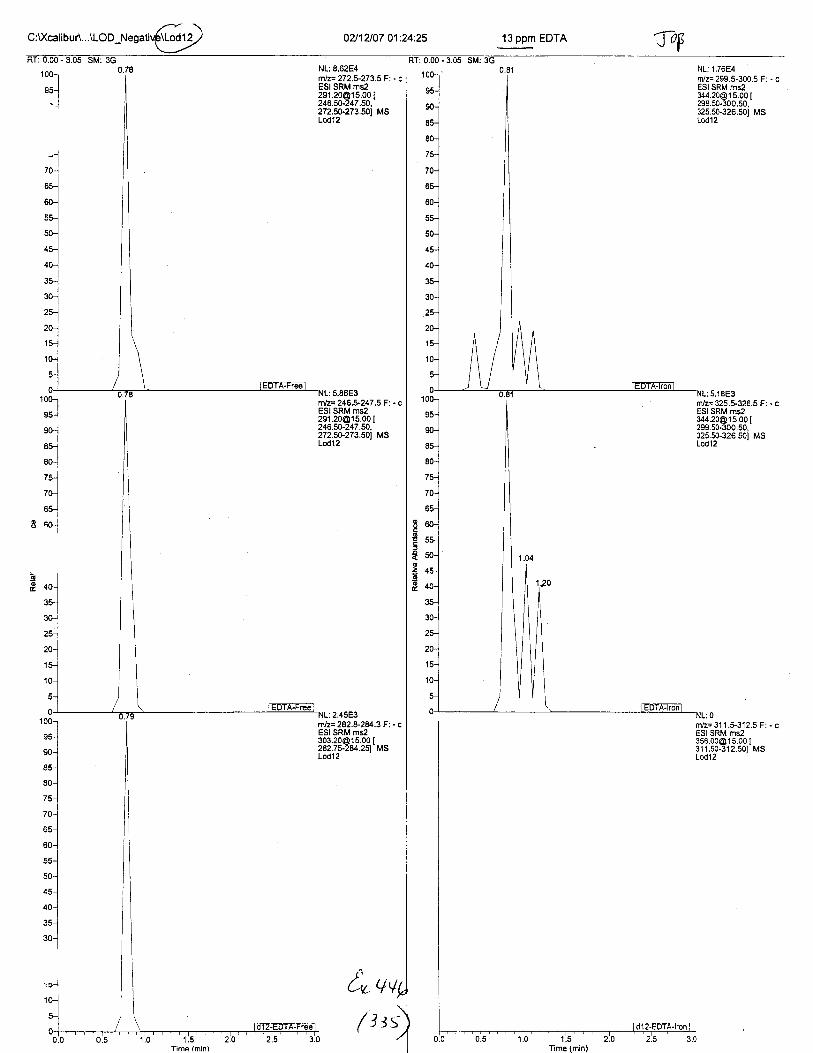
0?i1?i07 01:24:25 13 ppm EDTA
NL:8.62E4nlz=272.5-273.5 F: - cESI SRM [email protected] [246.50-247.50,272.50.273.501 MSLod12
NL:2.45E3rfllz=282.*2U.3 Fi - cESI SRM [email protected] [282Js-2U.251 MS
qv
8f,
o
.go
NL: 1,76E4nr/z= 299.5-300.5 F: . cESI SRM [email protected] [299.50.300.50,325.50-326.501 MSLodl2
r/z= 325.S326.5 F: - cESI SRM [email protected] [299.50-300.50,325.50-326.501 MSLod12
r/z= 31 1.''312.5 F: - cESI SRM [email protected] [311.50-312.501 MSLod'12
Cv
1.5Time (min)
1.5 2.0Time (min)
:5.86E3rnlz=246.*247.5 F: - cESI SRM [email protected] [246.50-247.9,272.s0-273.501 MSLod12
( 3ss

02112107 01:28:18 6 ppm EDTA
r/z= 299.5-300.5 F: - cESI SRM ms2ms2
r5.00 [[email protected] [299.50-300.50,325.50-326.501 MSLod13
nvz= 325.5-326.5 F: - cESI SRM [email protected] I299.50-500.50,'325.50-326.50t MSLodl 3
m/z= 31 1.5-312.5 F: . cESI SRM [email protected] [311.50-312.50) MSLodl 3
1 00-l
^-l'ls0J
^-l
;;l?5-]
I
to-1
uuJ
q
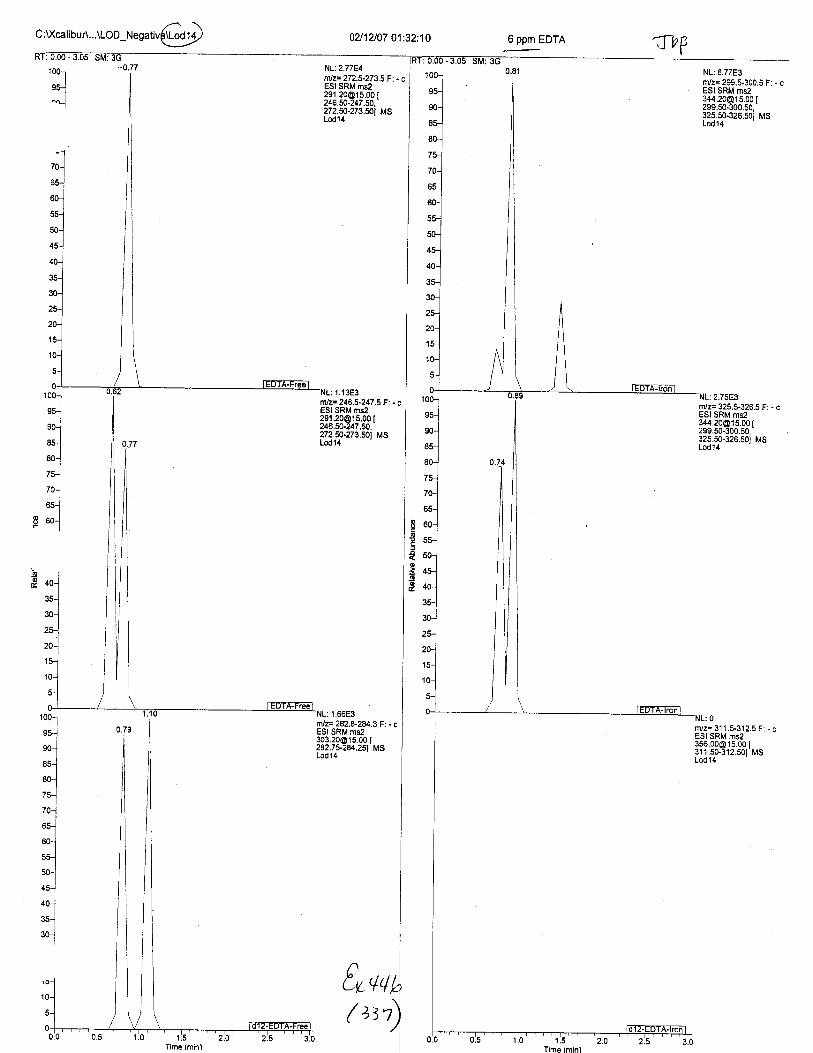
0?/1?./07 01:32:10 6 ppm EDTA
NL:2.77E4nlz=272.$273.5 F: - cESI SRM [email protected] I246.50-247.50,272.50-273.50t MSLod'14
m/z= 299.5-300.5 F: - cESI SRM [email protected] [299.50-300.50,325.50-326.501 MSLodl4
1001
"-ls0-1
n<--l*lro-l
75-..1
7o-.1I*l
I 60-]-l
mlz= 246.*247.5 F: - cESI SRM [email protected] [246.50.247.50.272.50-273.50t MSLod 14
NL:2.75E3r/z= 325.S.326.5 F: - cESI SRM [email protected] [299.50-300.50,325.50-326.s01 MSLod14
1.66E3(r|F282.8-2U.3F: - cESI SRM [email protected] [282-752U.251 MSLod14
tr.+,1,( )s't
l'lme (min)
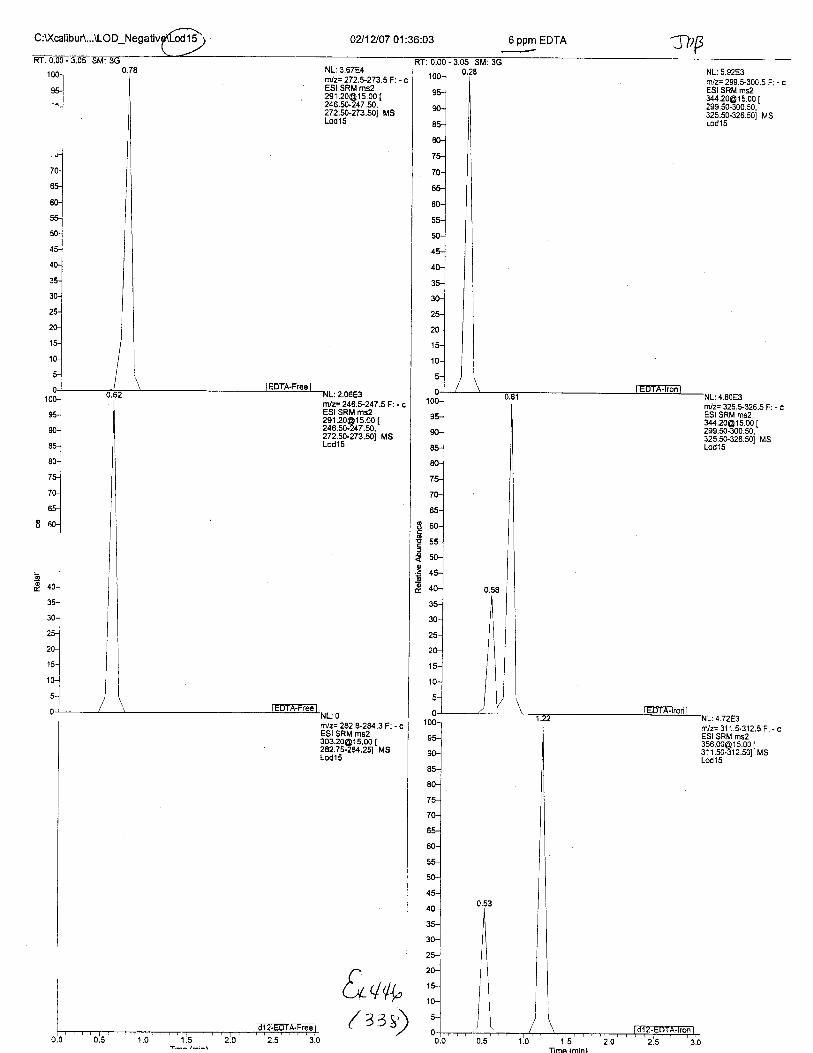
C:U(calibur\...\LOD 0211207 01:36:03
,::::l
NL: 3.67E4nlz=272.5-273.5Fl- cESI SRM [email protected] [246.50.247.50,272.5&.273.501 MSLod15
&-,/w
o
6
€o
( 338
6 ppm EDTA JhPNL:5.92E3rvz= 299.5-300.5 F: - cESI SRM [email protected] [299.50.300.50.325.s0-U6.501 MsLodl 5
: 4.80E3rvz= 325.S326.5 F: . cESI SRM [email protected] MSLodl5
NL:4.72E3trVz= 31 1.t312.5 F: - cESI SRM [email protected] [311.50-312.501 MSLod15
0.53
A
/\
tl

Seq uence--LOD2_neg. sld [Open]
Sample Name:
C--nent:3 ppm EDTA
Study:
Client:
Laboratory:
Company:
Phone:
Sample Type File Name Sample lD Path Inst Method
Unknown LOD16 05 C:Xcalibur\Data\EDTA\Brewer\LOD Neoative G:Xcalibur\methods\EDTA Nec
Proc Method CalFile Position InjVol Level Sample Wt Sample Vol ISTD Amt
o b.u 0.000 0.000 0.000
Sample Name:
Comment:
ppm
Study:
Client:
Laboratory:
Company:
Phone:
tH*****s******t*it**********************t*****************i*********************************t***ff**********
€r q(u( 3)q)page 1
7*Vp\r,\'1
Proc Method CalFile Position InjVol Level Sample Wt Sample Vol ISTD Amt
o 5.0 0.000 0.000 u.00u
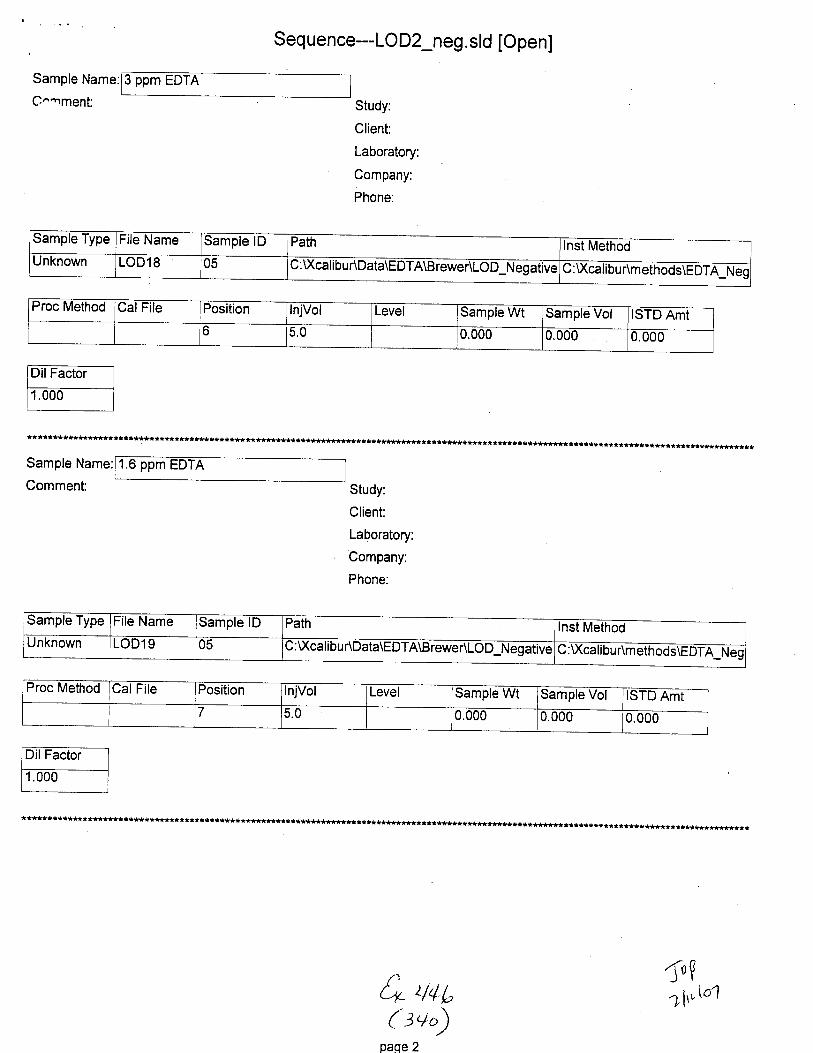
Sequence--LOD2_neg. sld [Open]
Sample Name:
C^nment:
3 ppm EDTA
Study:
Client:
Laboratory:
Company:
Phone:
***********t**************t***********************************************i*t*+*********i*****t**************t******************************r**
Sample Name: .6 ppm EDTA
Comment: Study:
Client:
Laboratory:
Company:
Phone:
{n rl,lu( l+r)
page 2
5rl1Pto1
Proc Method GalFile Position InjVol Level Sample Wt Sample Vol ISTD Amto 5.0 0.000 u.000 0.000
Sample Type File Name Sample lD Path Inst MethodUnknown LOD19 05 :\Xcall bur\Data\E DTA\Brewer\LO D_Negative :\Xcallbur\methods\EDTA Nec
Proc Method Cal File Position InjVol Level Sample Wt Sample Vol IISTD Amr7 5.0 0.000 0.000 0.000
-

Sequence--LOD2_neg. sld [Open]
Sample Name:
C'-"nent:1.6 ppm EDTA
Study:
Client:
Laboratory:
Company:
Phone:
Sample Type File Name Sample lD Path Method
Unknown LOD2O 05 :Xcalibu AData\EDTA\B reweALO D_Negative C:U(calibuAmethods\EDTA Neo
Proc Method Cal File Position lnjVol Level Sample Wt Sample Vol ISTD Amt.,t b.0 rJ.{J00 0.000 0.000
*******************s***i*******************i*************t*****************
Sample Name:
Comment:
1.6 ppm EDTA
Study:
Client:
Laboratory:
Company:
Phone:
Sample Type File Name Sample lD Path lnst Method
Unknown LoD21 105
C :\)(cali bu r\Data\EDTA\Brewer\LO D_N eg ative C:Xcalibur\methods\EDTA Neq
Proc Method CalFile Position InjVol Level Sample Wt Sample Vol ISTD Amt
7 5.0 0.000 0.000 U.UUU
arV'Lltv\'ta
ht- VVb,/- \()ar\nana ? '/
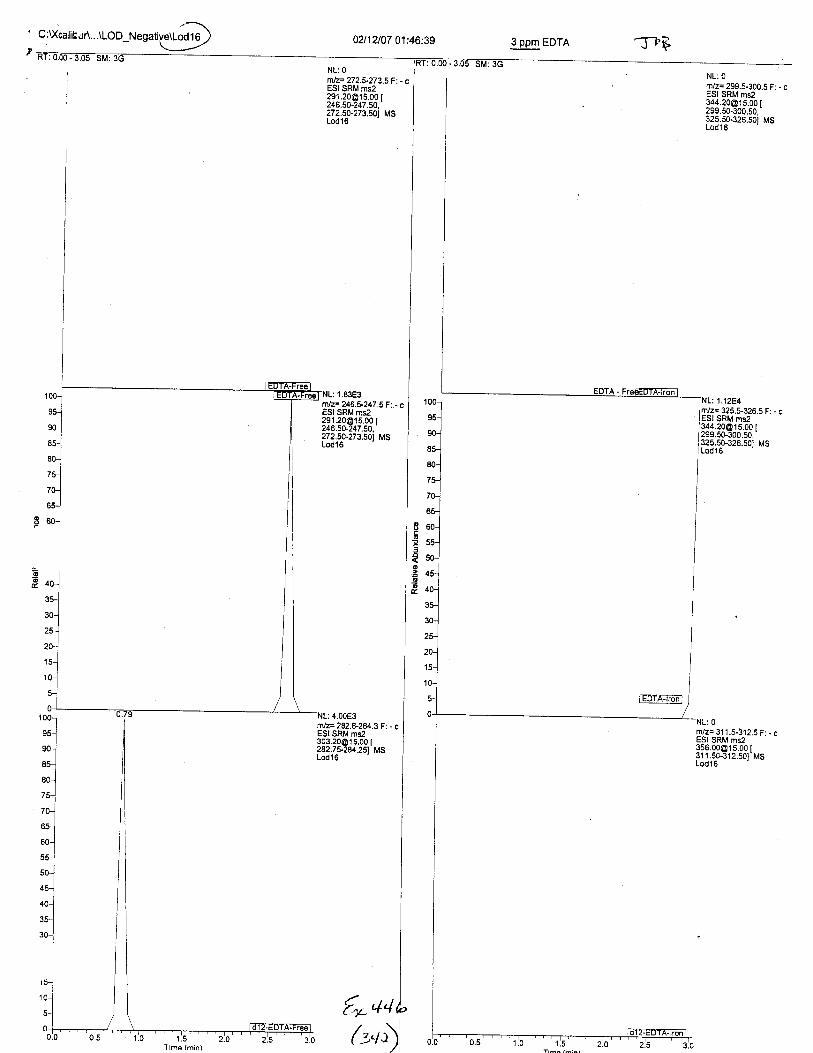
02112107 01;46:39
1001
ru-l
*.1
851
*.]?l7q.*l
I 60-l
r]/z=272.1273.5Fi - cESI SRM ms2291 [email protected] [246.50-247.50,272.s0r73.501 Ms
{*a4
NL:0fil/z= 299.5-300.5 F: - cESI SRM [email protected] I299.50.300.50,-32s.50-326.501 MSLod16
325.5-326.5 F: - cESI SRM [email protected] r299.50-5oo.so.'325.s0-326.501 MS
NL: 1.83E3
'n/z= 246.1247 .5 F: - cESI SRM [email protected],272.50273.501 MS
filz= 282.8-2U.3F.. - cESI SRM [email protected] I282.75-2U.251 MSLod'16
r00l
ru-J
*-l8q8o-l
tr-l
'o-l6l60-]
-- |
"rlroloul
oo'1
,.]
G4j
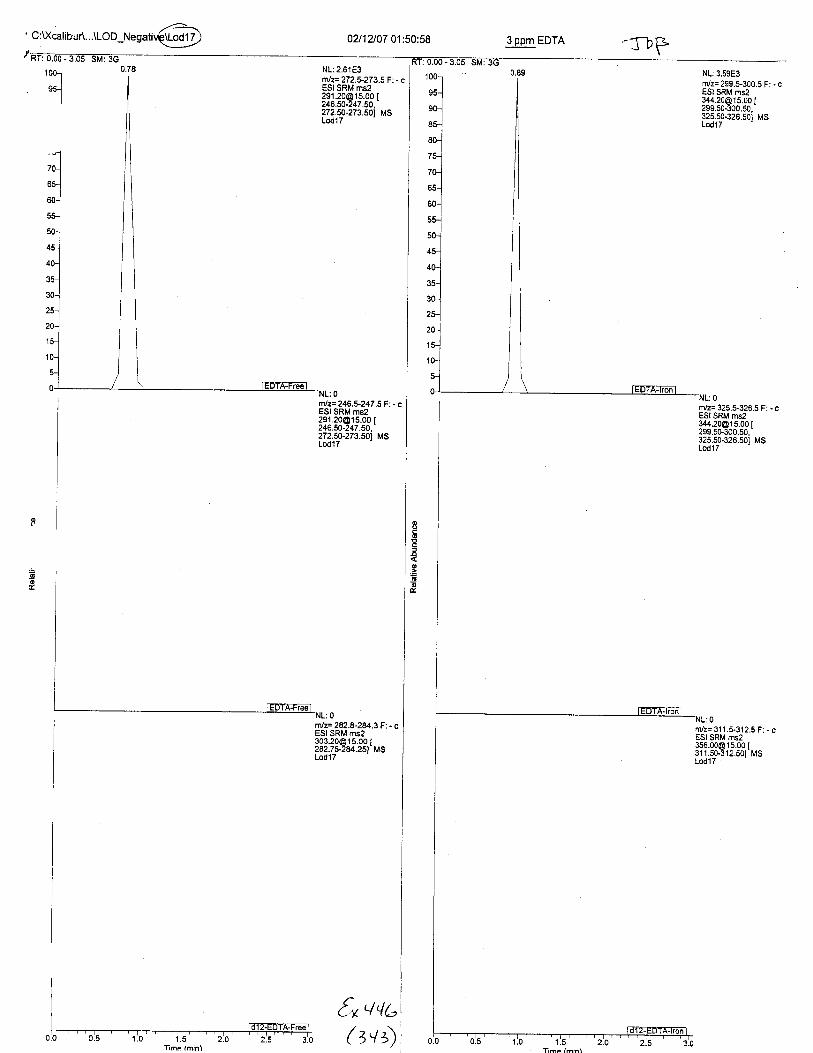
' C:U(calibuA...\LOD 02l1VO7 01:50:58 3 ppm EDTA
NL:3.59E3nvz= 299.5-300.5 F: - cESI SRM [email protected] MSLod17
nlz= 246.$247 .5 F: - cESI SRM [email protected] [246.50-247.50.272.50-273.501 MSLodl 7
o
o
-g
€o'/'lU
t7]lz= 282.8-2U.3 F: - cESI SRM [email protected] [282.7$284.251 MSLodlT
( t+)
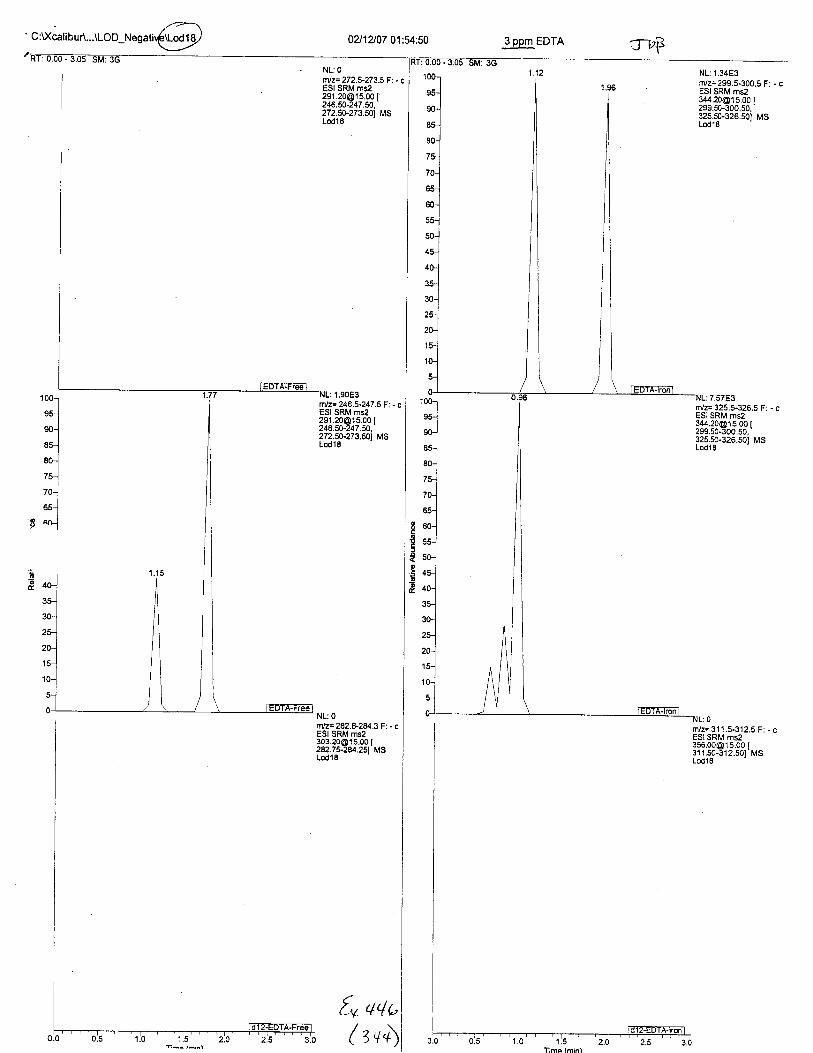
C:XcalibuA...\LOD 0?J12107 01:54:50
NL: O
nlz= 272.5-273.5 F: . cESI SRM [email protected] [246.50-247.50.272.50-273.501 MSLod18
1.90E3r!z= 246.5-247.5 F: - cESI SRM [email protected] [246.&-247.50,272.50-273.501 MSLod'l I
3 ppm EDTA
o
oo
tn'/4b( z+'\
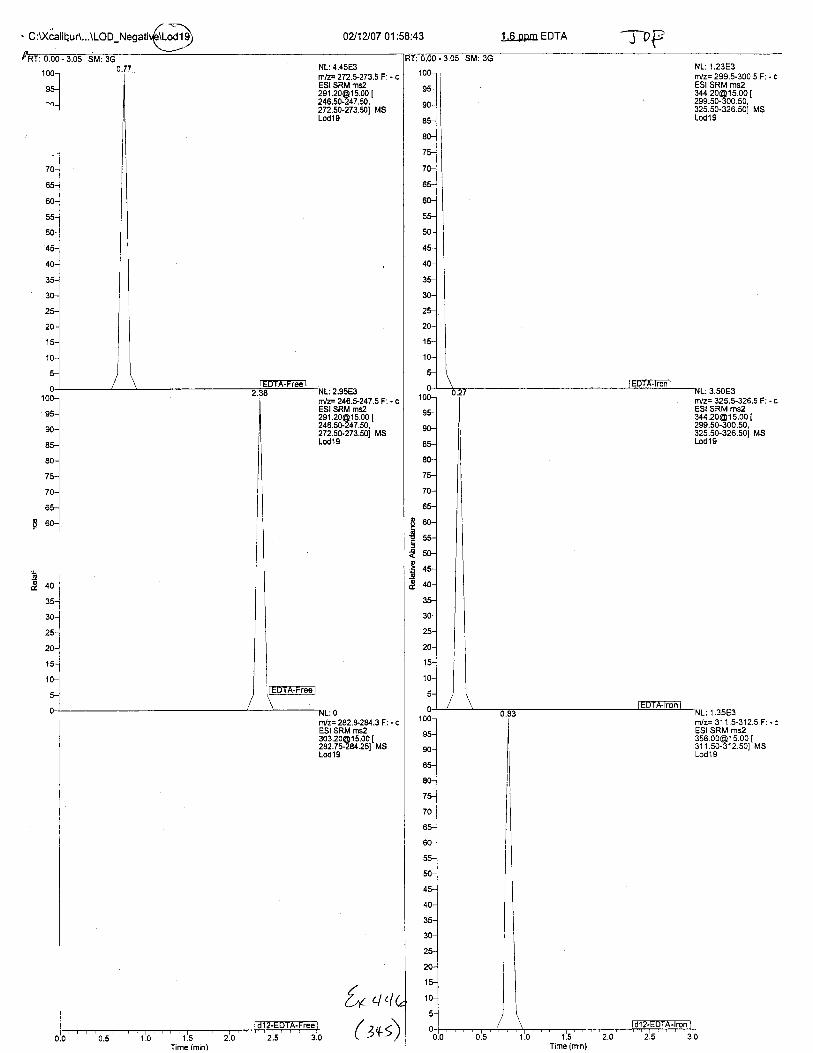
0A12107 01:58:43 1.F ppm EDTA
NL: 1.23E3m/z= 299.5-300.5 Fi - cESI SRM ms2344,[email protected],325.50-326.501 MSLodl 9
nlz= 246.*247 .5 Ft - cESI SRM [email protected] I246.5G247.50,272.50.273.s01 MSlod19
NL: O
n{z=282.V284.37: - cESI SRM [email protected] [282.7$.284251 MSLod'19
o
E
3.50E3
: 1 .35E3r/z= 31 1.5-312.5 F: - cESI SRM [email protected] [311.50-312.50j MSLod'19
, -dl,+DTFfi?A0.0 0.s 1.0 1:5 2.0 2.5 3.0
Lr q"(
rn/z= 325.5-326.5 F: - cESI SRM [email protected] [299.50-300.50,325.50-326.501 MSLod19
Time (mrn)Time (min)
( *s)
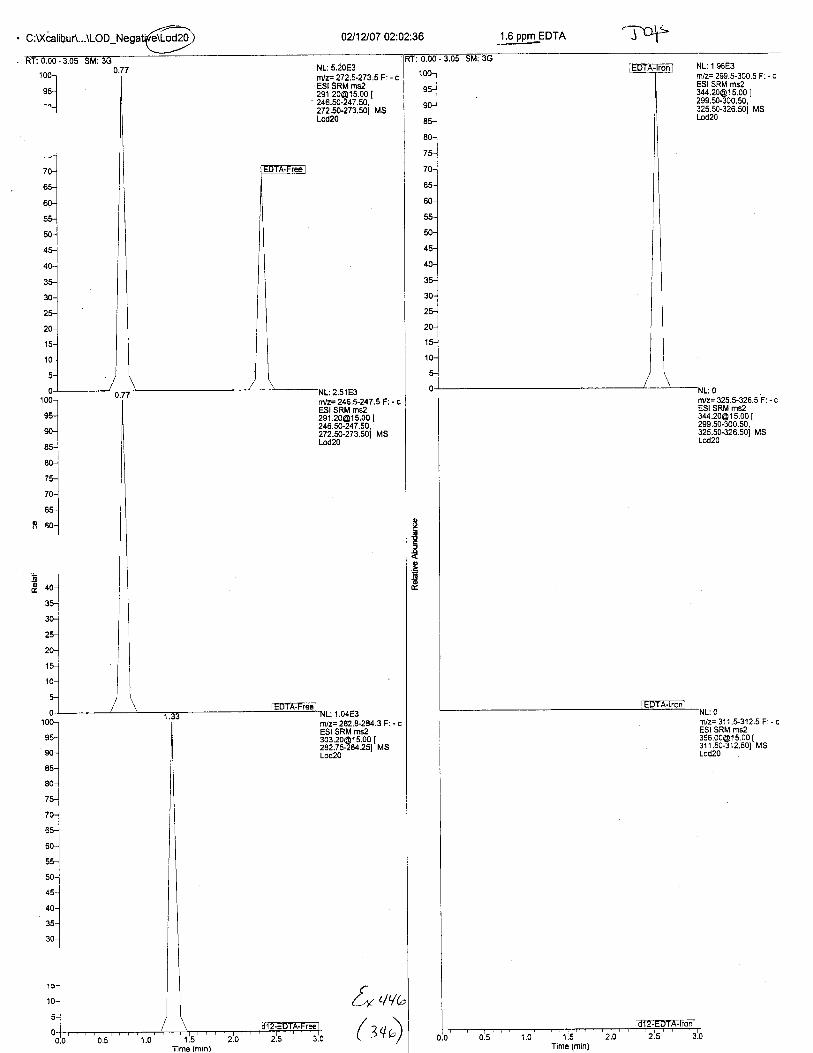
C:U(calibur\...\LOD_ 02112107 02:02:36
NL: 5.20E3.r/z= 272,5-273.5 F: - c
'ESl SRM [email protected] [' 246.50-247.50,272.50-273.501 MSLod20
.r.lz=2465-247.5 Fi - cESI SRM [email protected] [246.50-247.50.272.50-273.501 MSLod20
nlz= 282.8-2a43 F'. - cESI SRM [email protected] I282.75-284251 MSLod20
1.6 ppm EDTA-l-oF
100-l
-"1-
NL: 1.98E3nriz= 299.5-300.5 F: - cESI SRM [email protected] I299.5C300.50,325.s0-326.501 MSLod20
m/z= 325.+326.5 F: - cESI SRM [email protected] {299.50-300.50,325.50-326.501 MSLod20
R
du
eo
-s!@
fn qva
( z+)Tlme (min) Trme (min)

RT:03d- 3o-5
100-l
ss-]I
'n-l
100-
v5-
90-
85-
80-
75-
60-
5J-
s-45-
40-
35-
30-
' C :Xca I ibu r\...tt-O O-N.g"tir6f;2l
0.77
0A1UO7 02:06:29 1.6 ppm EDTA 'f rpP
NL: 2.81 E3rtlz= 272.5-273.5 F: - cESI SRM [email protected] [246.50-247.50,272.50-273.501 MSLod21
nJz= ?46.5-247.5 F: - EESI SRM ms2291 [email protected] [246.50-247.50,272.50-273.501 MSLod2l
fi1lz=282.8-2U3 F: - cESI SRM [email protected] [282.75-2U.251 M8Lod2l
@
6
o
o
rn/z= 299.$300.5 F: - cESI SRM [email protected] I299.50-300.50,325.50-326.501 MSLod21
rvz= 325.5-326.5 F: - cESI SRM [email protected] [299.50-300.50,325.50.326.501 MSLod21
rrz: 31 1 .5-3'12.5 F: - cESI SRM [email protected] [311,5S312.501 MS
{* aqG

{Sequence--LOD_pos. sld [Open]
Sample Name:
C- rent:
100 ppm
Study:
Client:
Laboratory:
Company:
Phone:
Sample Name:
Comment:
100 ppm EDTA
Study:
Client:
Laboratory:
Company:
Phone:
t**********i*************t*******i****************tf****t***t********t*t*****t*#**************tl
{rc (,t c'( vt)
oaqe 1
Sample Type File Name Samole lD Path lnst Method
Unknown LODOl 1 C :Xcalibur\Data\EDTA\Brewer\LOD Positive :Xcalibur\methods\EDTA Pos
Proc Method CalFile Position nJvol Level Samole Wt Sample Vol ISTD Amt
1 5.0 0.000 0.000 0.000
Sample Type ile Name Sample lD Path lnst Method
Unknown LODO2 01 C:U(calibur\Data\EDTA\Brewer\LOD Positive C:U(calibur\methods\EDTA Pos
Proc Method Cal File Position InjVol Level Sample Wt Sample Vol ISTD Amt
1 5.0 0.000 0.000 0.000
ft'>lr-1"'1

Sample Name:
C- '.nent:
Seq uence---LoD_pos. sld [OpenJ
100 ppm EDT
Study:
Client:
Laboratory:
Company:
Phone:
Sample Type File Name Samole lD Path Inst MethodUnknown LODO3 01 C:Xcalibur\Data\EDTffi C:Xcalibur\methods\EDTA pos
Proc Method CalFile Position InjVol Level Sample Wt Sample Vol ISTD Amt1 5.0 0.000 0.000 0.000
Sample Name:
Comment:
ppm ED
******ti*****************i********t******t***t*********************
****t*******************************t*************r******
Study:
Client:
Laboratory:
Company:
Phone:
{r avu(t+';
naoe 2
:Tstlvi."t
Proc Method CalFile Position InjVol Level Sample Wt Sample Vol Amt2 5.0 0.000 0.000 0.000

Sample Name: rl(- nent Study:
Client:
Laboratory:
Company:
Phone:
***t*t***********************************************i*t************************t***********************t**************************t******l**t*
Sample Name:
Comment:
ppm EDT
Study:
Client:
Laboratory:
Company:
Phone:
**8**t******************t***************************************************************#***********i*********i*******t**r*************i***
Seq uence---LO D_pos. sld [Open]
[y +qb( zs')
JOF
Llttlc 7
C:Xcalibur\metnoOs\eDTR
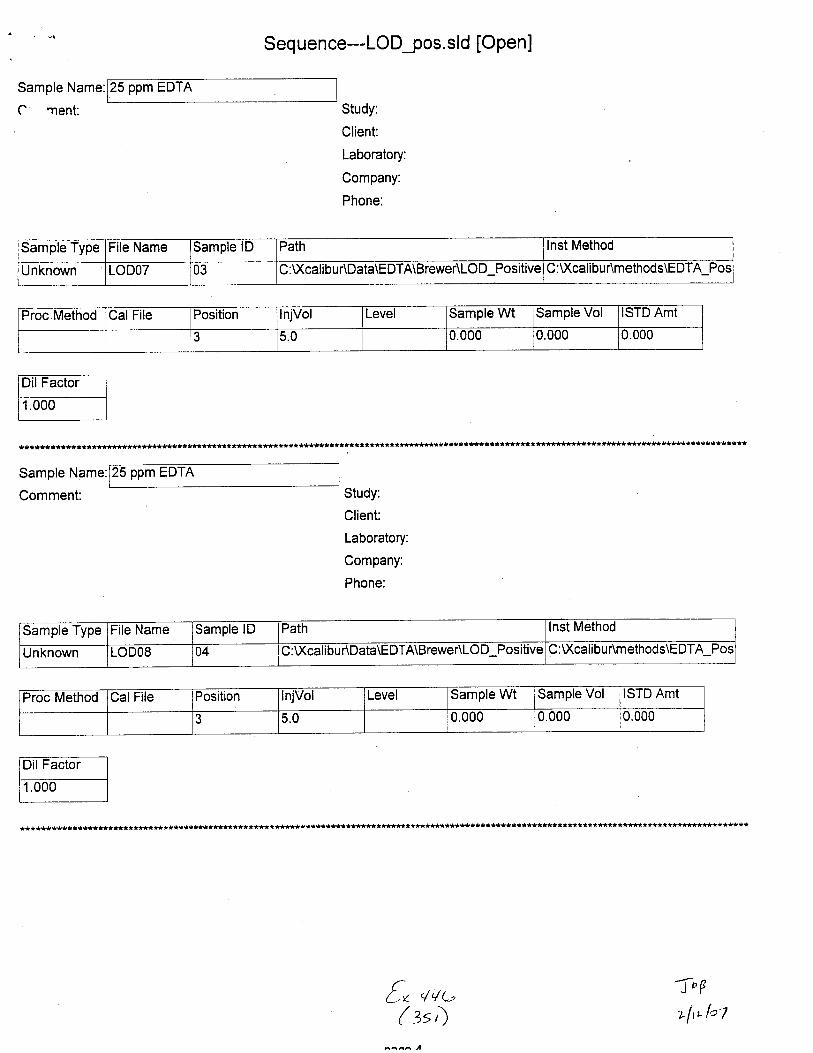
Sample Name:
C nent:
Sequence---LOD_pos. sld [Open]
25 ppm EDTA
Study:
Client:
Laboratory:
Company:
Phone:
Sample Type File Name Sample lD Path lnst Method
Unknown LODOT 03 C:Xcalibur\Data\EDTA\Brewer\LOD Positive C:U(calibur\methods\EDTA Pos
Proc Method Cal File Position lnjVol Level Sample Wt Sample Vol ISTD Amt
3 5.0 0.000 0.000 0.000
*******tl*************ii*******ff **f *********tr*******t
Sample Name:
Comment:
25 ppm
Study:
Client:
Laboratory:
Company:
Phone:
Sample Type File Name Sample lD Path lnst Method
Unknown LODOS )4 C:Xcalibur\Data\EDTA\Brewer\LOD Positive C:Xcalibur\methods\EDTA Pos
Proc Method Cal File lPositionI
InjVol Level Sample Wt Sample Vol ISTD Amt
3 5.0 0.000 0.000 0.000
t***t**t*********************l******
fr qqc'
^^l^t^'n
ArF'ultl"'7
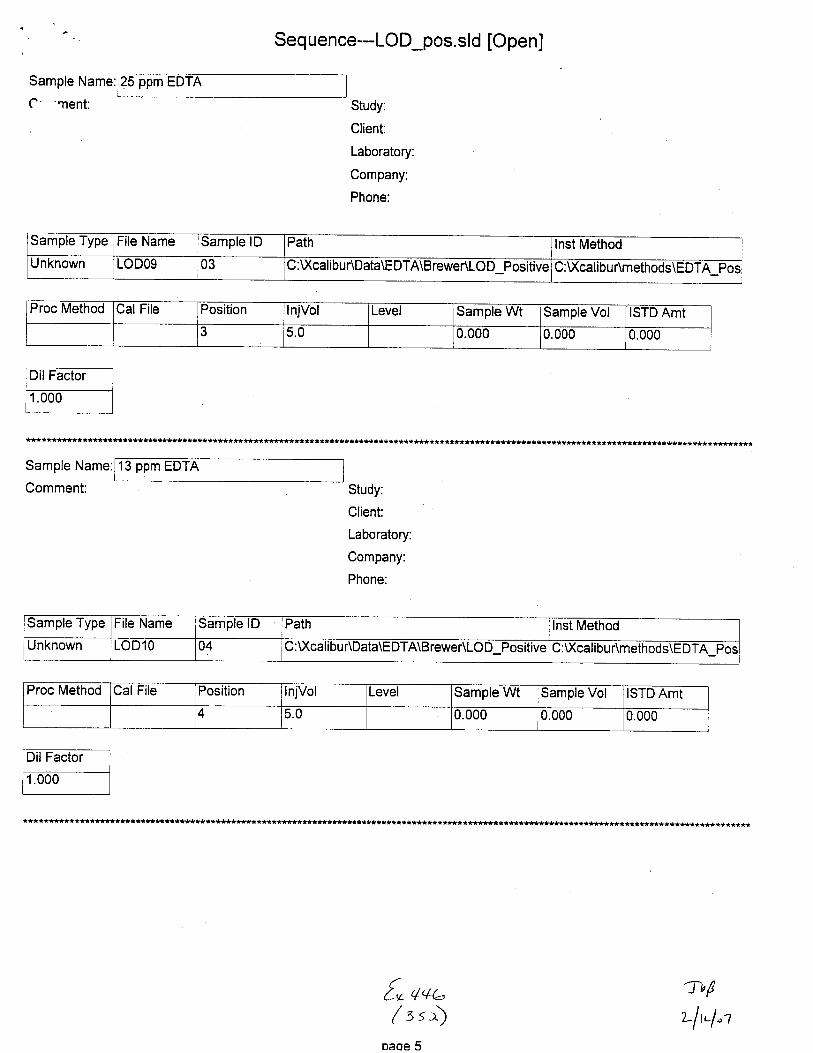
Sample Name:
C- 'nent:
Seq uence--LOD_pos. sld [Open]
25 ppm EDTA
Study:
Client:
Laboratory:
Company:
Phone:
Sample Type File Name Sample lD Path Inst Method
Unknown LODOg 03 C:Xcalibur\Data\EDTA\Brewer\LOD Positive C:U(calibur\methods\EDTA Pos
Proc Method Cal File Position InjVol Level Sample Wt Sample Vol ISTD Amt3 5.0 0.000 0.000 0,000
Sample Name:
Comment:
13 ppm EDTA
Study:
Client:
Laboratory:
Company:
Phone:
Sample Type File Name Sample lD Path Inst Method
Unknown oD10 04 C:Xcalibu r\Data\EDTA\Brewer\LOD Positive C:U(calibur\methods\EDTA Pos
Proc Method Cal File Position InjVol Level Sample Wt Sample Vol ISTD Amt
4 5.0 0.000 0.000 0.000
*************t
fo'/u,(st^)
oaoe 5
Jb!uf vf "t

Sample Name:
C- '.nent:
Sequence--LOD_pos. sld [Open]
13 ppm
Study:
Client:
Laboratory:
Company:
Phone:
Sample Type File Name Sample lD Path lnst Method
Unknown LOD11 04 C:Xcalibur\Data\EDTA\Brewer\LOD Positive C:Xcalibur\methods\EDTA Pos
Proc Method CalFile Position InjVol Level Sample Wt Samole Vol ISTD Amt
4 5.0 0.000 0.000 0.000
**t*****t*******************i**************t***********t**t*******
Sample Name:
Comment:
13 ppm E
Study:
Client:
Laboratory:
Company:
Phone:
Sample Type File Name Sample lD Path lnst Method
Unknown LOD12 04 C:XcalibuAData\EDTA\Brewer\LOD Positive C:Xcalibur\methods\EDTA Pos
Proc Method Cal File iPosition InjVol Level Sample Wt Sample Vol ISTD Amt
4 5.0 0.000 0.000 0.000
**********t*t********************************i***********
tn u+o( zs)
nana A
JrfLlvl"1
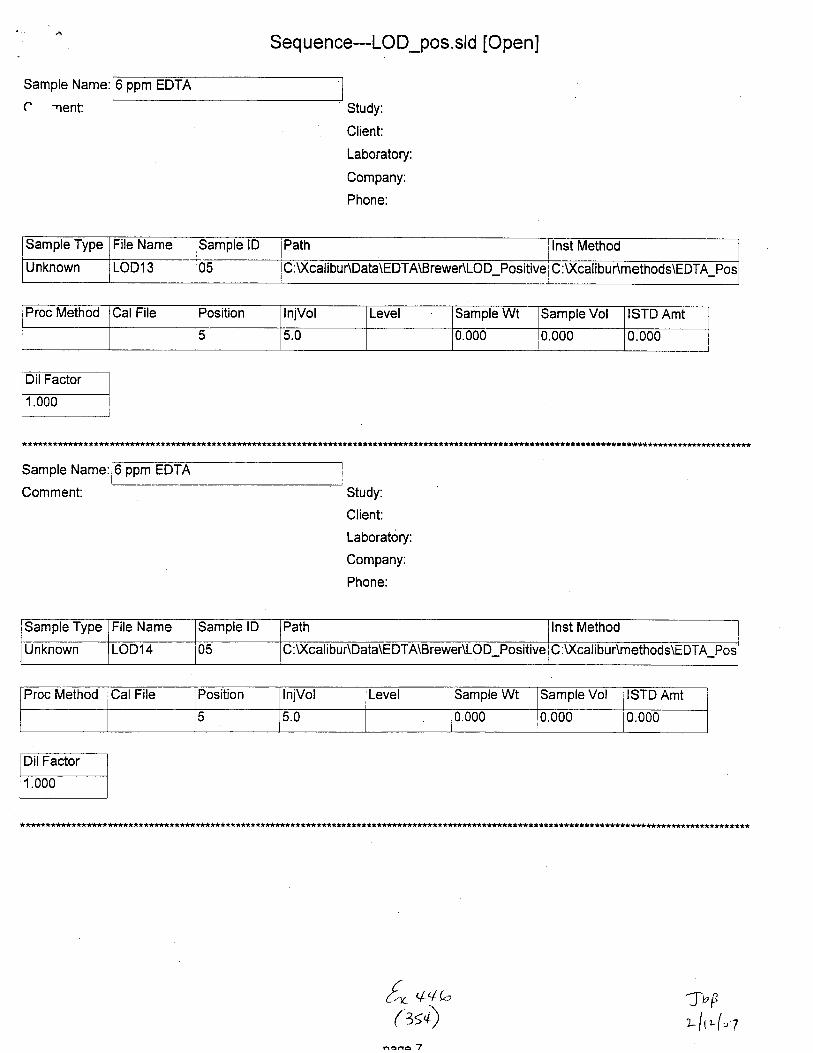
Sample Name:
C rent:
Sequence---LOD_pos. sld [Open]
6 ppm EDTA
Study:
Client:
Laboratory:
Company:
Phone:
Sample Type File Name Sample lD Path Inst Method
Unknown LOD13 05 :U(calibuAData\EDTA\BreweALOD Positive C :U(calibur\methods\EDTA Pos
Proc Method Cal File Position InjVol Level Sample Wt Sample Vol ISTD Amt
5 5.0 0.000 0.000 0.000
***t*****************
Sample Name:
Comment:
6 ppm EDTA
Study:
Client:
Laboratory:
Company:
Phone:
Sample Type File Name Sample lD Path Inst Method
Unknown LOD14 05 C:\)(calibur\Data\EDTA\BreweALOD Positive C :U(calibur\methods\EDTA Pos
Proc Method Cal File Position InjVol Level Sample Wt Samole Vol ISTD Amt
5 5.0 0.000 0.000 0.000
***********************************t*t******l*******************t**************************
{'* ou o( zs+)
aaaa'7
-,nJ DI'II'L ItLl2 7
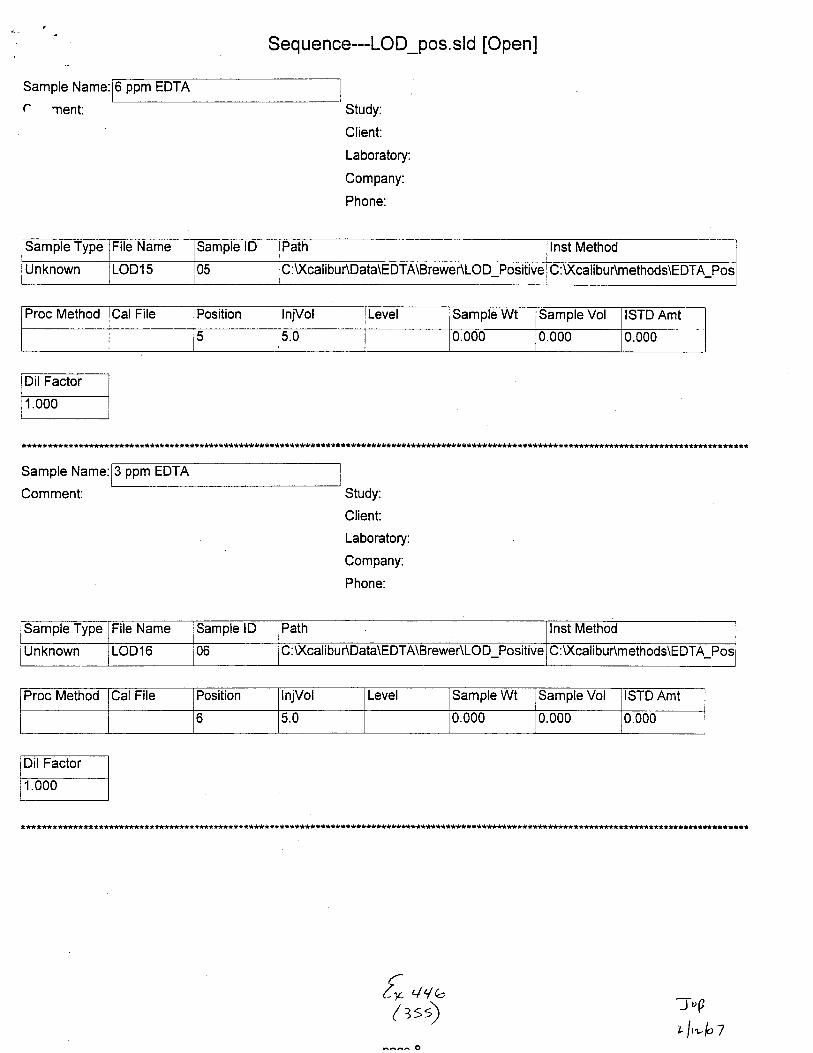
Sample Name:
c nent:
Sequence---LoD_pos. sld [Open]
6 ppm EDTA
Study:
Client:
Laboratory:
Company:
Phone:
Sample Type File Name Sample lD Path Inst Method
Unknown LOD15 05 C:U(calibuAData\EDTA\BreweALOD Positive C:U(calibuAmethods\EDTA Pos
Proc Method Cal File Position InjVol Level Sample Wt Sample Vol ISTD Amt
5 5.0 0.000 0.000 0.000
Sample Name:
Comment:
3 ppm EDTA
Study:
Client:
Laboratory:
Company:
Phone:
Sample Type File Name Sample lD Path Inst Method
Unknown LOD16 UO u : \xcal tbu r\uata\tsLJ I A\H rewer\Lu u Postttve C:U(calibur\methods\EDTA Pos
Proc Method Cal File Position njVol Level Sample Wt Sample Vol ISTD Amt
5.0 0.000 0.000 0.000
fr. uuo( zs) JbF
t lwbt

Sample Name:
C -nent:
Sequence--LOD_pos. sld [Open]
ppm EDTA
Study:
Client:
Laboratory:
Company:
Phone:
Study:
Client:
Laboratory:
Company:
Phone:
Sample Type File Name Sample lD Path Inst Method
Unknown LOD17 06 C:U(calibur\Data\EDTA\Brewer\LOD Positive C:U(calibur\methods\EDTA Pos
Proc Method Cal File Position InjVol Level Sample Wt Sample Vol ISTD Amt
c 5.0 0.000 0.000 0.000
*****************t*****s*tr*t*********i******************tt**t**t*i********t**********s*******t***r*******ti*********t***********r***********
Sample Name:
Comment:
3 ppm EDTA
sampre rype File Narne Sample lD Path lnst Method
Unknown LOD18 06 C:Xcalibur\Data\EDTA\Brewer\LOD Positive C:Xcalibur\methods\EDTA Pos
Proc Method Cal File Position InjVol Level Sample Wt Samole Vol ISTD Amt
5.0 0.uuu 0.000 0.000
f'r aqb( es)
nana O
'Jrf
rlvl"t
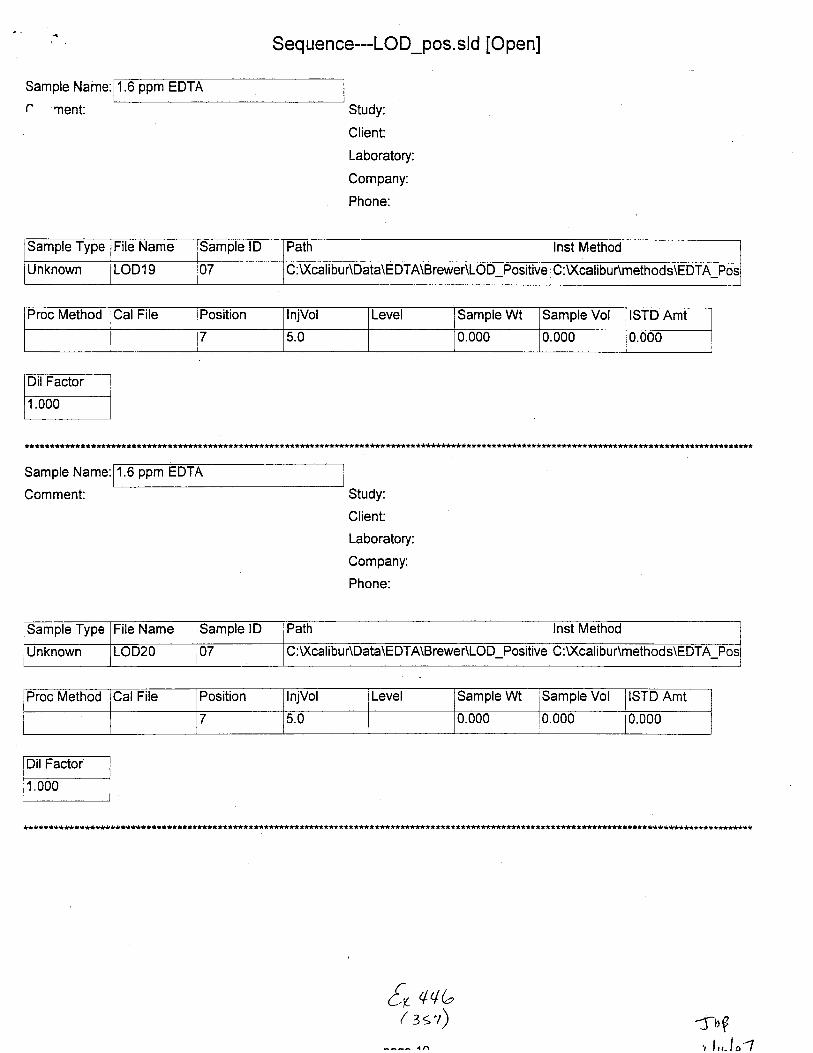
Sample Na
(- nent:
Sequence---LOD_pos. sld [Open]
1.6 ppm EDTA
Study:
Client:
Laboratory:
Company:
Phone:
Study:
Client:
Laboratory:
Company:
Phone:
Sample Type File Name Sample lD Path Inst Method
Unknown LOD19 07 C:UKcalibur\Data\EDTA\BreweALOD Positive C:U(calibur\methods\EDTA Pos
Proc Method CalFile Position InjVol Level Sample Wt Sample Vol ISTD Amt
7 5.0 0.000 0.000 0.000
Sample Name:
Comment:
1.6 ppm
Sample Type File Name Sample lD Path Inst Method
Unknown LOD2O 07 C:U(calibur\Data\EDTA\Brewer\LOD Positive C:\)(calibur\methods\EDTA Pos
Proc Method Cal File Position njVol Level Sample Wt Sample Vol ISTD Amt
7 5.0 0.000 0.000 10.000
fr'/'/('( zst) {bF
,lrr-lo1

Sample Name:
C -rent:
Sequence---LOD_pos.sld [Open]
.6 ppm EDTA
Study:
Client:
Laboratory:
Company:
Phone:
{r 4ab( zst)
Sample Type File Name lSample lDI
Path lnst Method
Unknown LOD21 07 C:U(calibur\Data\EDTA\BreweALOD Positive C:Xcalibur\methods\EDTA Pos
Proc Method Cal File Position InjVol Level Sample Wt Sample Vol ISTD Amt
7 5.0 0.000 0.000 0.000
tr,11'l ' 1
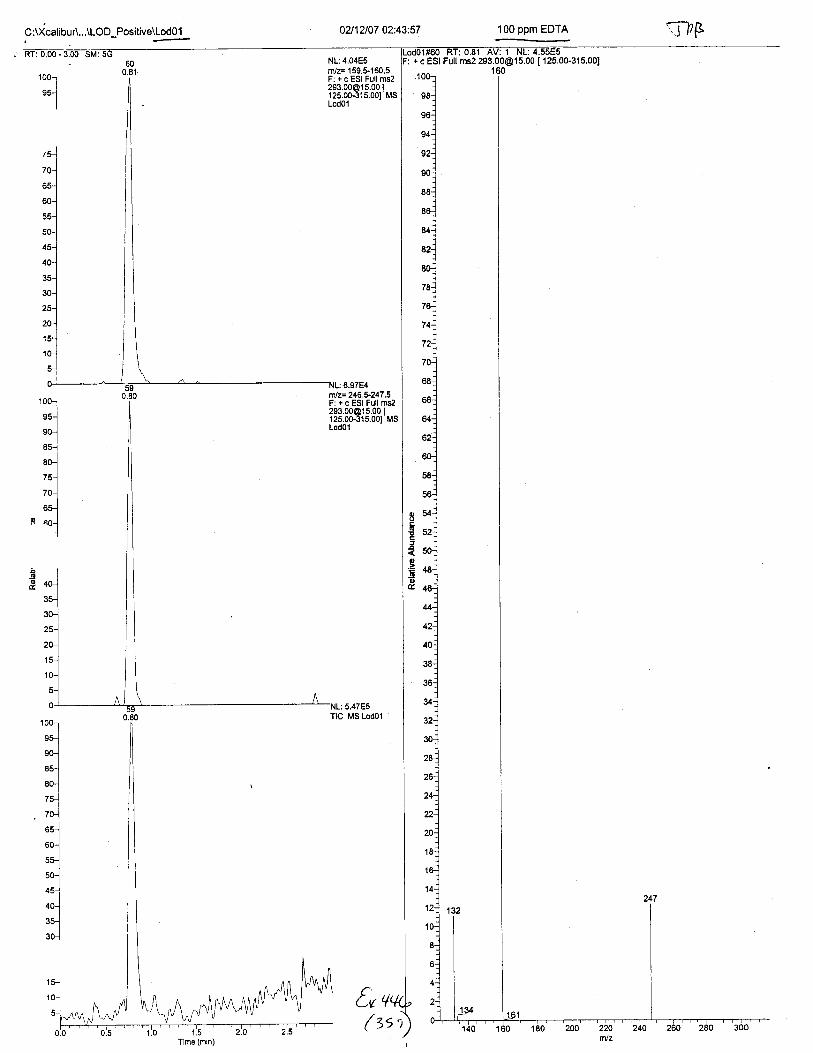
C:\)(calibuA...\LOD_Positive\Lod01.
-
02112107 02:43:57
1001
'-t
NL:4.04E5rVz= 159.5-160.5F: + c ESI Full [email protected] MSLod01
F: + c ESI Full [email protected] [r25.00-315.001 MsLod0l
1001
vvl
ro-]I*l
nnl*l75-..1
I
701
^-lIfl ao-.1
I
: 5.47E5TIC MS Lod01
(-{( ts'i
100 ppm EDTA
-
t-ltF101#60 RT: O.81 AV: 1 NL:4.55E5+ c ESI Full ms2 [email protected] [ 125.00-315.00]
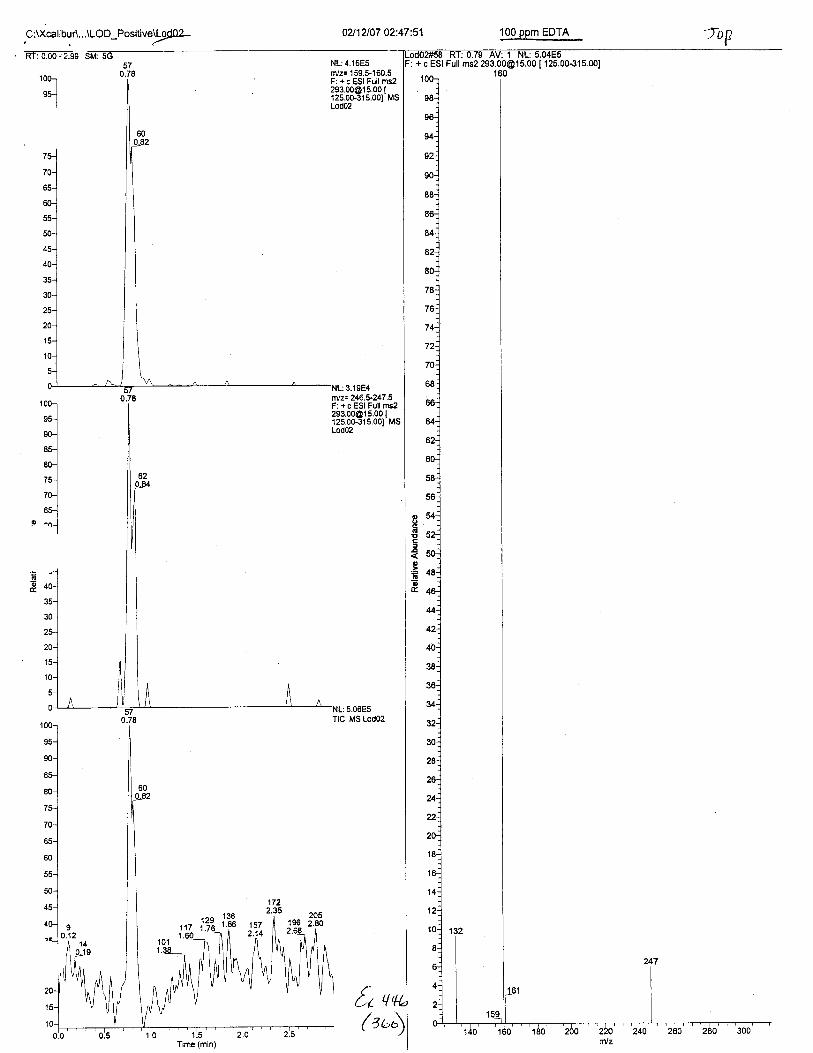
C :U(calibur\...\LOD_Positiveld02- 02112/07 02:47:51
rol*I
NL:4.16E5nYz= 159.5.160.5F: + c ESI Full [email protected] MSLod02
NL:5.06E5TIC MS Lod02
IG2.6€
Time (min)
2052.80
t" 'l( eL,i
100 ppm EDTA
+ c ESI Full ms2 293.00@'15.00 [125.00-315.00]
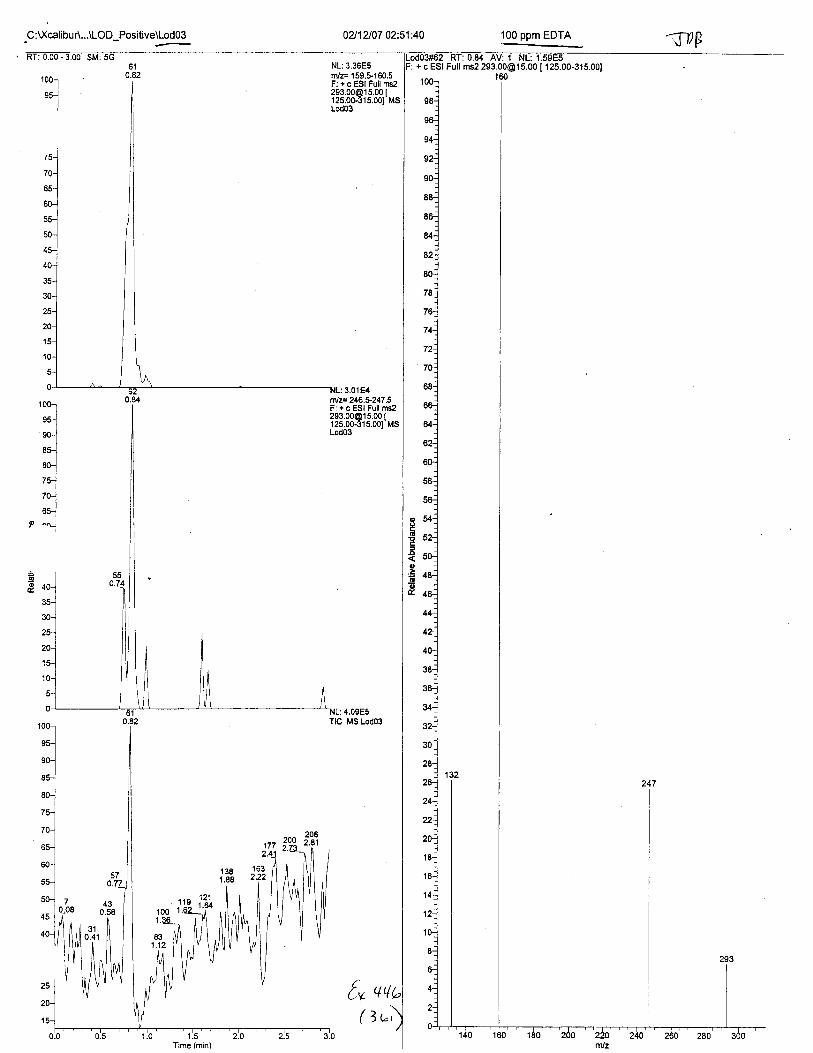
1001
ru-l
*-lAE.]*t'l'l'l6l
o ^^l,1
,ol
'u-]
'o-]*-l
'l7ff..]uu-]
60-l
*.]5o-l z
I 0.0845_1 t
4/1il'lll
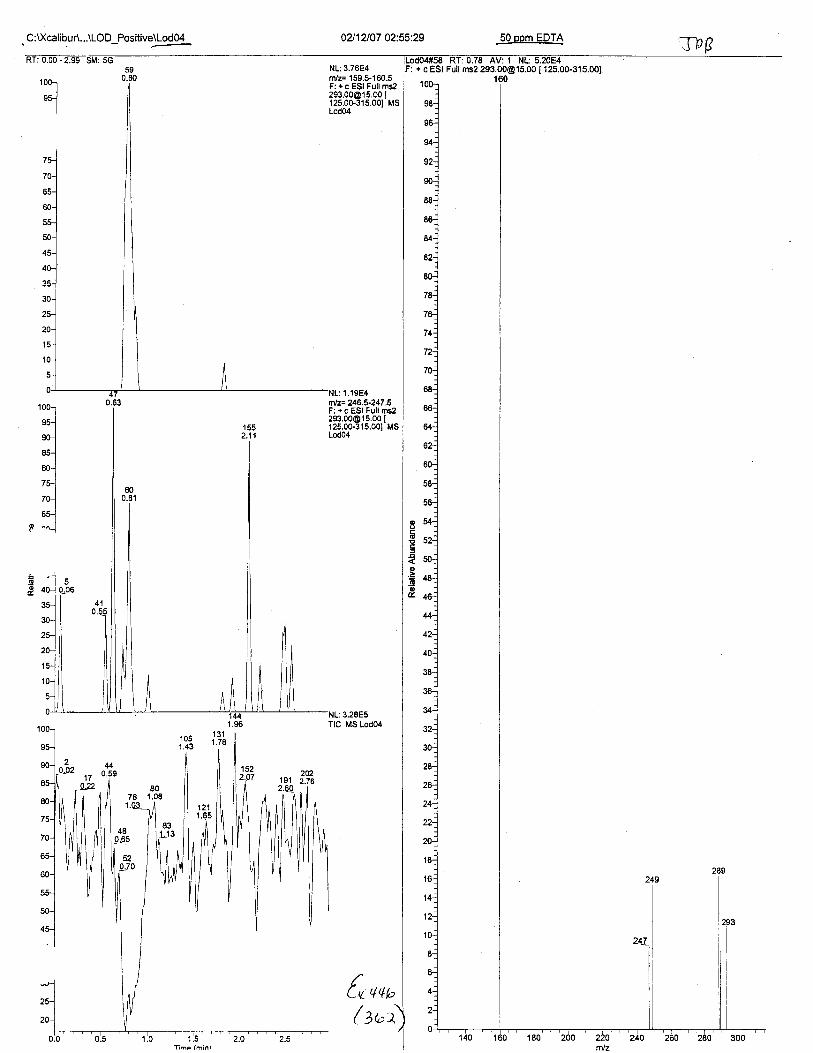
C:\)(calibuA...\LOD_Positive\Lod04
8076 1.06
02l1AO7 02:55:29
NL:3.76E4rniz= 159.$160.5F: + c ESI Full [email protected] [125.0G315.001 MSLod04
: l.zEEiTIC MS Lod04
oo6
oo=do
(o uu,( zuz
50 oom EDTA
tu4*i6 Kt: u./6 Av:1 NL: b.ZUE4+ c ESI Full ms2 [email protected] [125.00-315.00]
l
I
I
I

C:U(calibuA...\LOD_Positive\Lod05 02112107 02:59:15
NL:8.6'1E4rn/z= 159.$160.5F: + c ESI Full [email protected] I12s.00.315.001 MsLod05
65-
N-
45-
40-
zb
20-
't5-
10-
trtlz- 246.5-247 .5F: + c ESI Full [email protected] I't25.00-3'15.001 MSLMUS
t,a
: 1.00E4
(tat
+ c ESI Full msz [email protected] [ 125.00-315.00]

C :U(calibuA...\LOD_Positive\Lod06 0211i/07 03:03:06
1OGr
^-l'lNL:5.82E4rn/z= 159.5-160.5F: + c ESI Full [email protected] [125.00-3'15.001 MsLod06
,ol
*-lru-]ao!*ttr-l
1lo"-'l,'1
F: + c ESI Full [email protected] [125.00-315.001 MSLod06
1.42E4
NL:2.40E5TIC MS Lod06
o
oofE
o
oox,
{oqu(
50 ppm EDTAa---
1 NL:+ c ESI Fullhs2 [email protected] [125.00-315.001
160

RT: 0.00
1 00-l
*l
C :\)(calibu r\...\LOD_Positive\LodO7-
43 0.71
0.85
02112107 03:06:59
9.40E3nlz= 246.U247.5F: + c ESI Full [email protected] [125.00-315.001 MSLodo7
NL: 1.99E5TIC MS Lod07
ta0.33
1.5Time {min)
25 ppm EDTA ,
: + c ESI Full ms2 [email protected] [ 125.00-315.001
oo6!
o.zoo

C :U(calibuA...\LOD_Positive\Lod09, 0212/07 03:14:36
'ol*lNL: 1,69E4rn/z= 159.$160.5F: i c ESI Full [email protected] [12s.0G315.001 MSLod09
4.42E3
1001
ru-]
*-l,u-]FAJ*l75-i
to-]
^J--tP 'nl
tr'lz= 246.5-247 .5F: + c ESI Full [email protected] [12s.00-315.001 Ms
oo6
4o6E
-NL:2.18E5j.!2, rrc us r-oaos
fo,l,l o
luvRiz Kt: u.64 Av: I NL: 2.ZtE4+ c ESI Full ms2 [email protected] [ 125.00-315.00]

2.01E3
1001
,5-l
*-18s-l
'o-ltu-l
7o--l
.'- ]
rnlz= 246.*247 .5F: i c ESI Full [email protected] [125.00-3't5.001 MSLod08
to q+
(r"l
+ c ESI Full ms2 [email protected] [ 125.00-315.00]

C:\)(calibuA...\LOD_Positive\Lod 1 0
5 qatra
,:l"l*J*lrnJ--lzs--l
I
toJ
*lI
rilz= 246.*247 .5F: i c ESI Full [email protected]'15.001 MsLodl 0
{,^t +'l t"(tus)
od10*r61 RT: 0.83 AV: 1 NL: 3.45E4: + c ESI Full ms2 [email protected] [ 125.00-315.00]
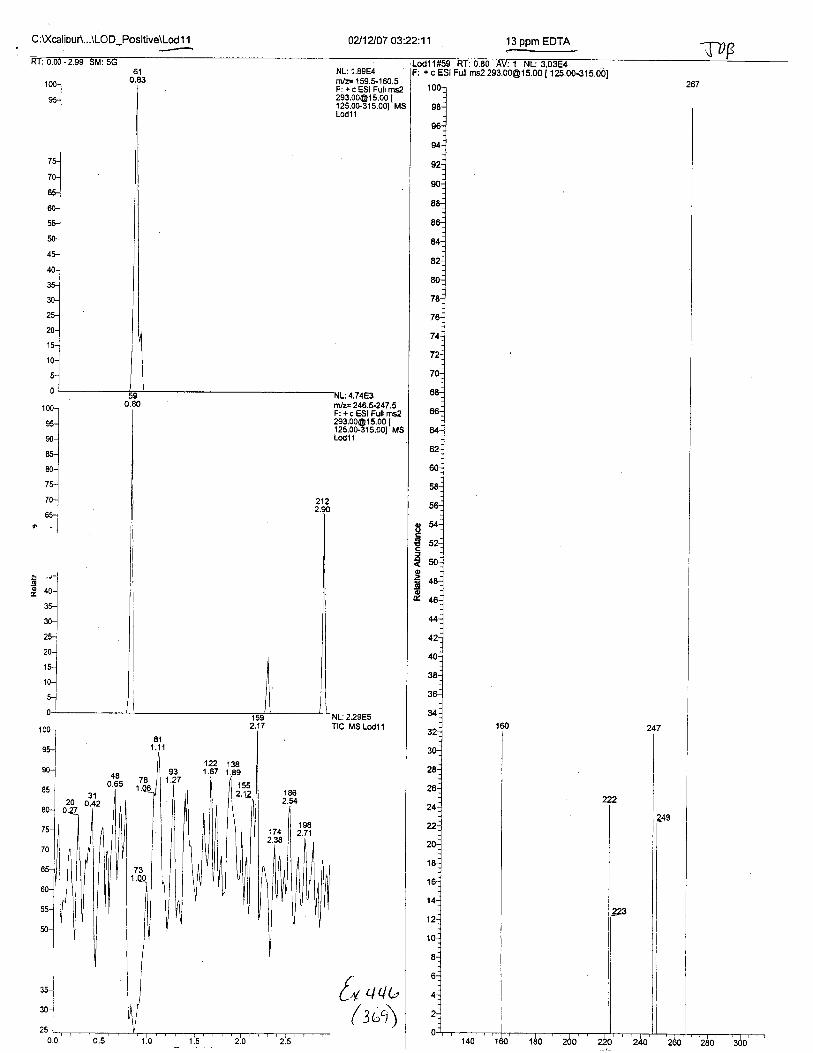
C :l(calibur\...\LOD_Positive\Lod 1 1 0A1ZO7 03:22:11
t*-]*l*.1*.180-l
7s-l
,0-l
" ':-]
NL: 1.89E4m/F 159.$160.5F: + c ESI Full [email protected] [125.00.315.001 MSLodl 1
NF246.5-247.5F: + c 551 Pr1 t"[email protected] [125.0C315.001 MSLodi 1
[+ aau( 2,,,q\
: + c ESI Fult ms2 [email protected] [ 125.00-315.00J
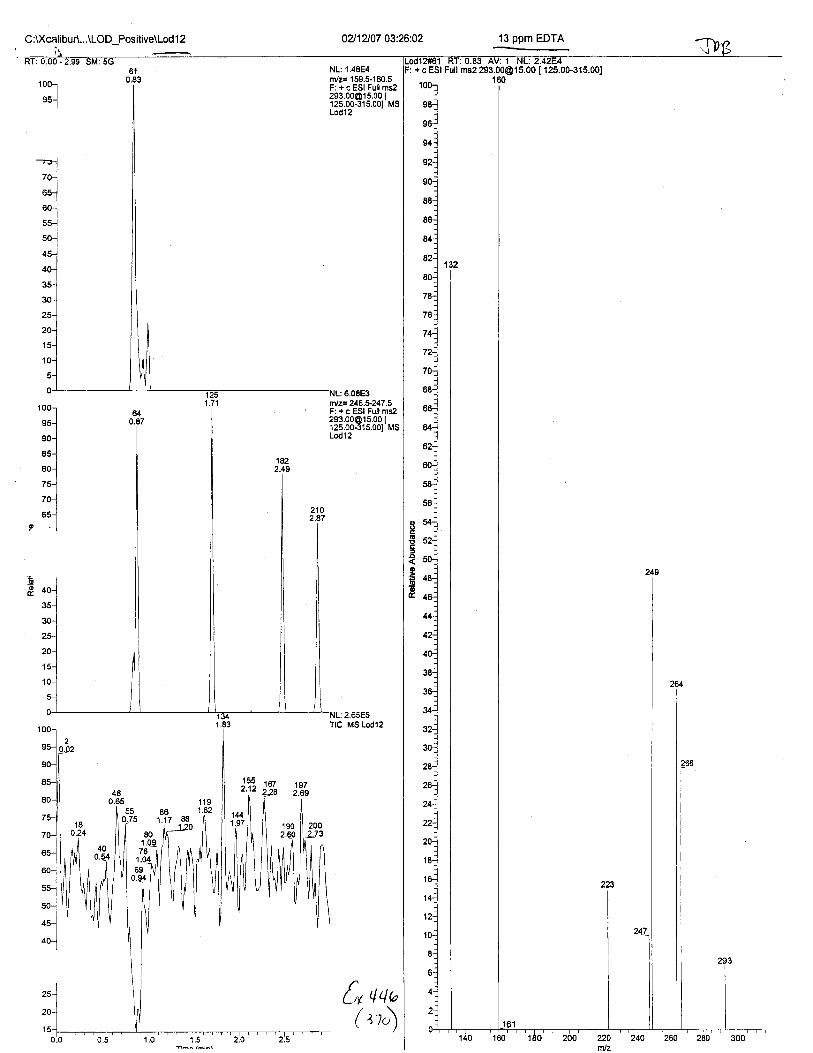
C:\)(calibuA...\LOD Positive\Lod12 0?/12107 03:26:02
1 00-lI
s5-1
""-lAqJ--tnnJ*lru-l
70-JI
ai-J--lP -l
nlz= 246.$247.5F: + c ESI Full [email protected] I125.00-315.00t MSLod12
f,r 4,tb
ar i4
: z.ocE3TIC MS Lodl2
13 ppm EDTA
-
0d1?#61 Rl:0.E3 AV:1 NL:2.42E4: + c ESI Full ms2 [email protected] [ 125.00-315.001
Eo
o66tr
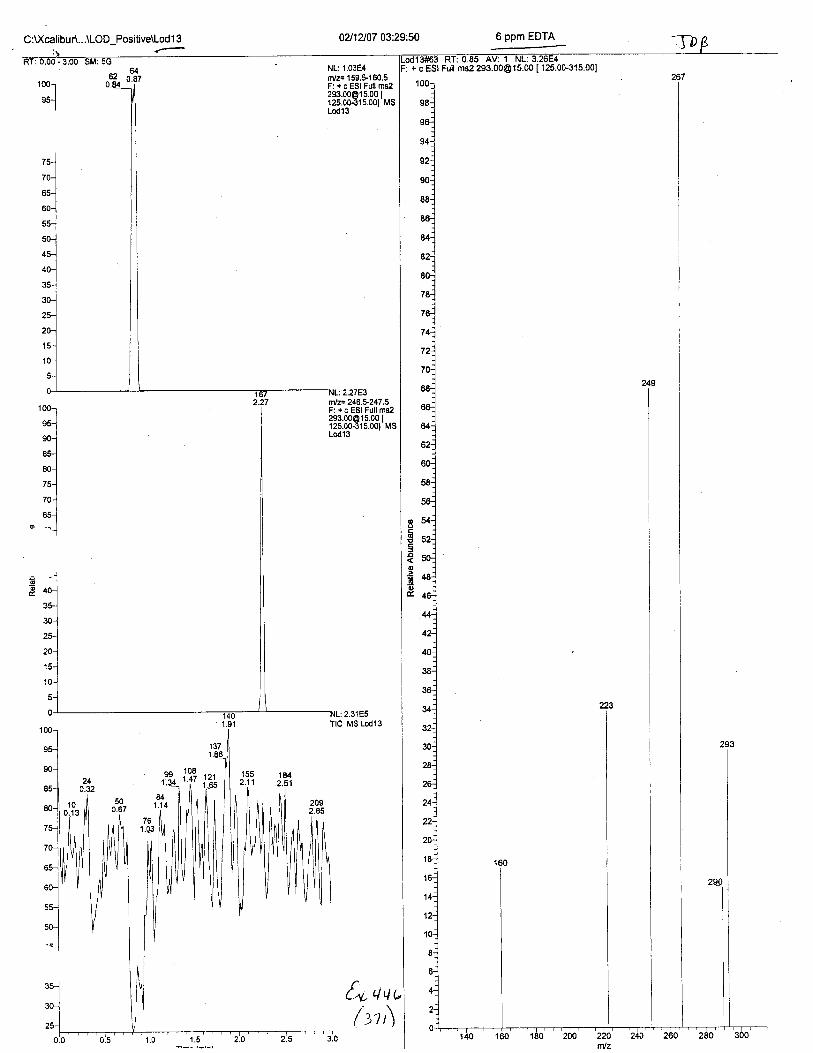
C:XcalibuA...\LOD Positive\Lod 1 3
64or. 0.87
02112107 03:29:50
NL:1.03E4n/z= 159.$160.5F: + c ESI Full [email protected] l125.00-315.001 MsLod13
227E3n|F246.1247.5F: + c E6l Full [email protected] |125.00.315.001 MSLod13
NL:2.31E5TIC MS Lod13
€t.3
6 ppm EDTA
l'13#63 t{l: u.65 AV: I NL: J.zbE4+ c ESI Full ms2 [email protected] [125.00-315.001

C :U(calibur\...\LOD_Positive\Lod 1 4 02112107 03:33:39
NL; 1.29E4n/z= 159.F160.5F: + c ESI Full [email protected] MSLod14
1001
;*.]*-l
'lto'1
--lo -. 1-t
rnlz= 246.5-247.5F: + c ESI Full [email protected] MSLod14
:2.46E5TIC MS Lod 14
tn,tu,( tt,t
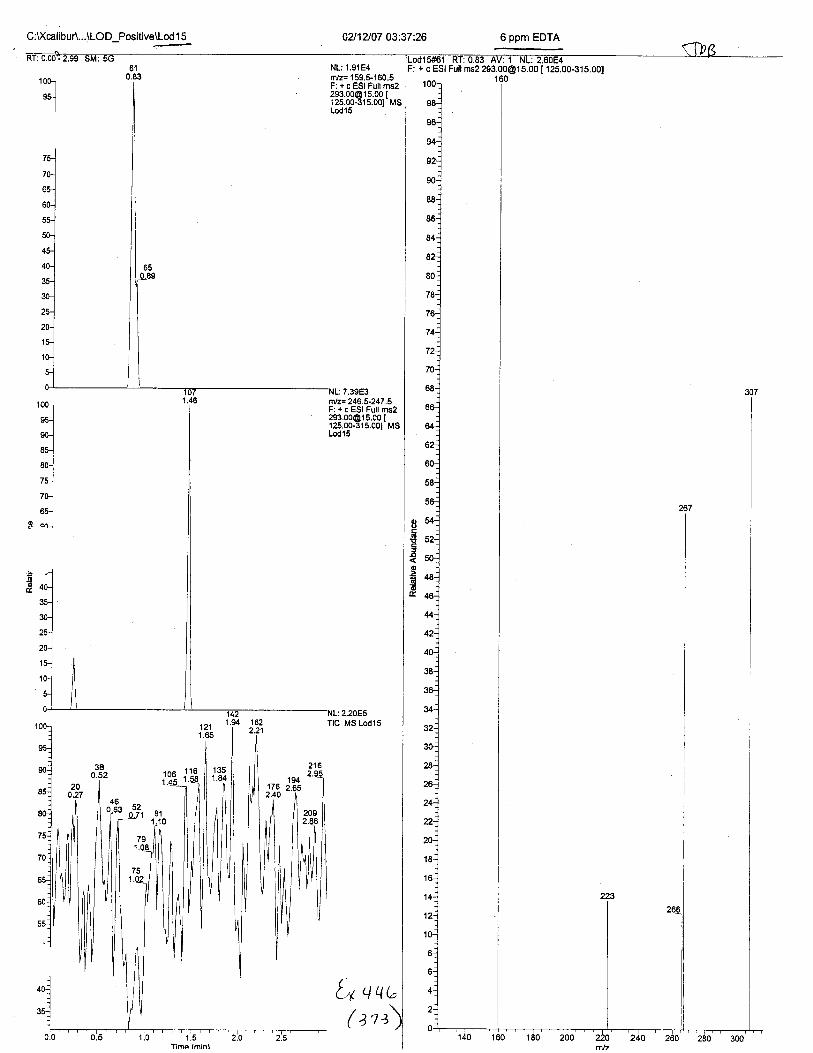
0?/1U07 03:37:26
NL:'1.91E4rvz= 15S.5-160.5F: + c ESI Full [email protected] [125.00-315.001 MSLod15
ty aau
':l"l*l*lrol
'l7H
"-l. ^^lc -t
( ztz
+ c ESI Full ms2 [email protected] [ 125.00-315.001
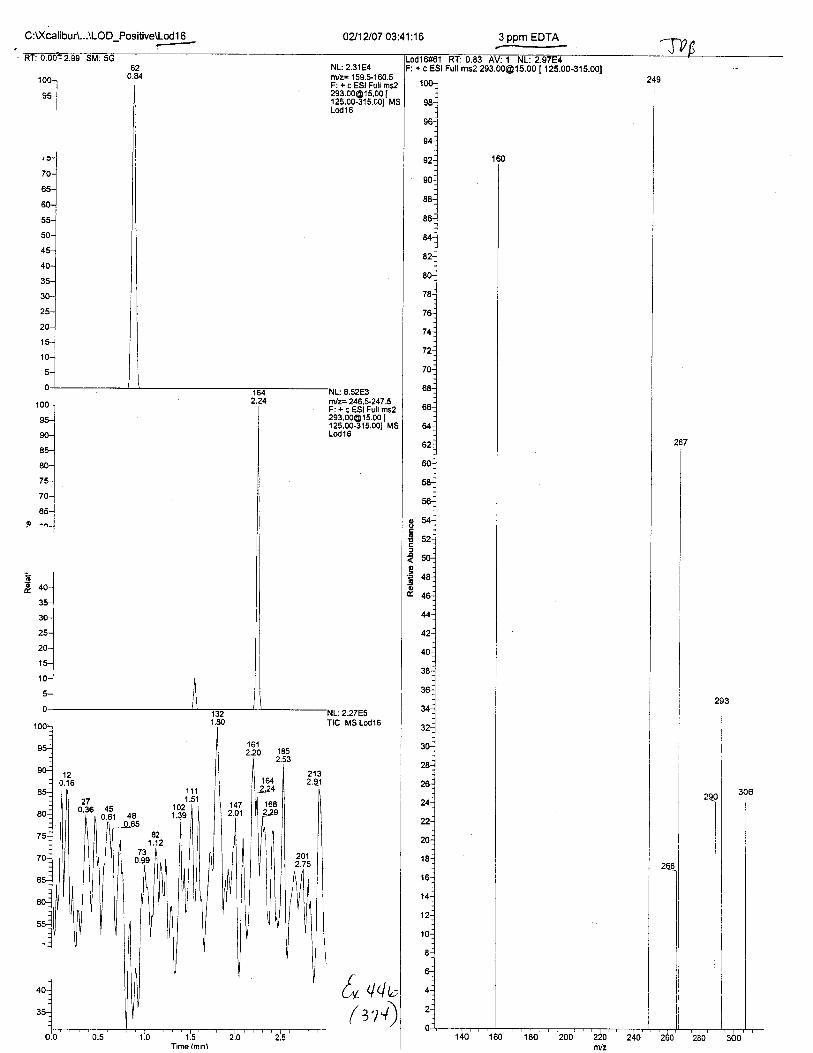
C:U(calibur\...\LOD_Positive\Lod 1 6
100-rI
--l
0?J12107 03:41:16
NL: 2.31 E4nvz= 'l 59.5-1 60.5F: + c ESI Fult [email protected] [125.00-315.001 MSLodl 6
fttlz= 246,5-247.5F: + c ESI Full [email protected] [125.00-315.001 MSLod16
ooo
f
o
.co
2.27E5TIC MS Lodl6
t* qqo
( n+)
3 ppm EDTA
-
Full ms2 [email protected] [ 125.00-315.00]

C:U(calibuA...\LOD Positive\Lod 1 7 02112/07 03:45:05
2.78 rnlz= 246.5-247.5I F: + c ESI Full ms2
[email protected] [125.00-315.001 MS
oo6€foo6EE,
2.01E5TIC MS Lod17
fr qo
1662.26
( tts
3 ppm EDTA
--+ c ESt Fuil ms2 [email protected] [ 125.00-315.00]
263
I
I
I

C :U(calibuA...\LOD_Positive\Lod 1 8 041U07 03:48:52
':iNL:7.78E3rnlz= 159.5-'160.5F: + c ESI Full [email protected] [125.00-315.001 MSLodlS
: l.l3E31001
rulel*l*-lru-l
to-]
6l" -n-l
ft/z=246.5-247.5F: r c ESI Full [email protected] [125.00-315.001 MSLodl I
'NL:229E5
TIC MS Lod18
ooE!aooo6E.
{r,1,1( z'tu
3 ppm EDTA
+ c ESI Full ms2 [email protected] [125.00-315.001

MATRIX
fo vqu( ztt)
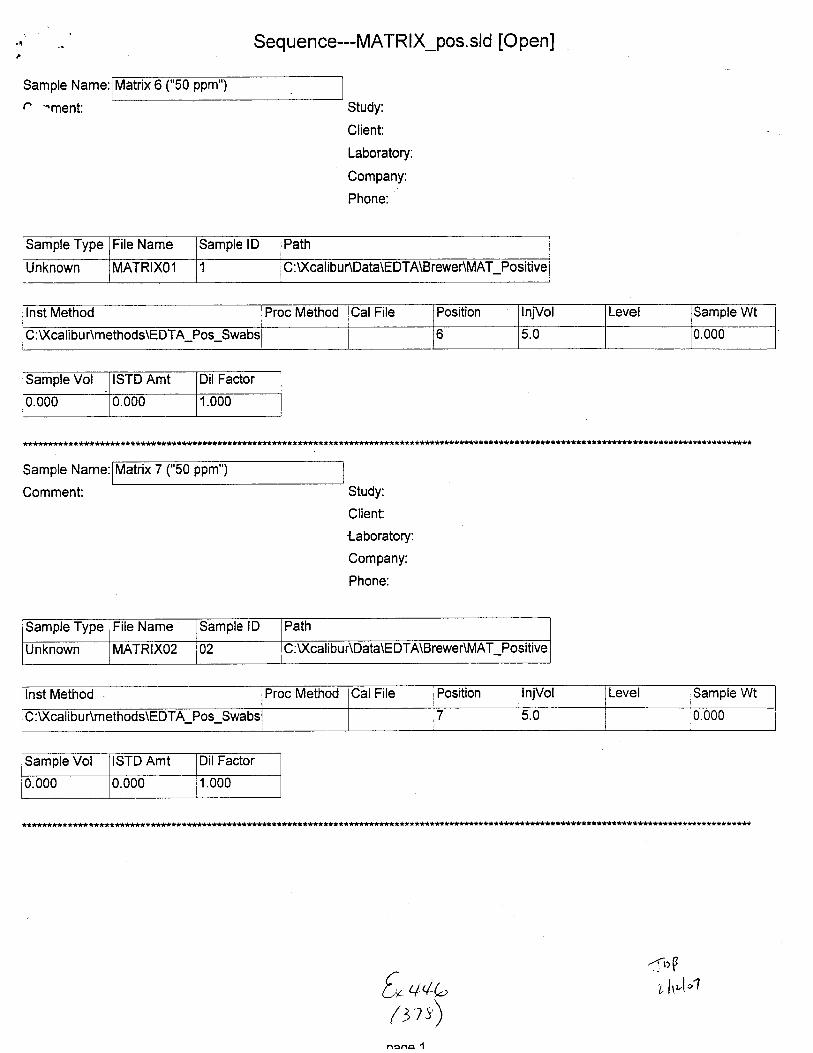
.0
Sample Name:
n -ment:
Seq uence---MATRIX_pos. sld [O pen]
("50 ppm")
Study:
Client:
Laboratory:
Company:
Phone:
Sample Type File Name Samole lD Path
Unknown MATRIXOl I C :\Xcalibu r\Data\E DTA\BreweAMAT Positive
lnst Method Proc Method CalFile Position lnjVol Level Samole Wt
C:Xcalibur\methods\EDTA Pos Swabs 6 5.0 0.000
Sample Vol ISTD Amt Dil Factor
0.000 0.000 1.000
Sample Name:
Comment:
atrix
Study:
Client:
'l-aboratory:
Company:
Phone:
Sample Type File Name Samole lD Path
Unknown MATRIXOz 02 C:Xcalibur\Data\EDTA\Brewer\MAT Positive
lnst Method Proc Method CalFile Position InjVol Level lSample Wt
C:Xcalibur\methods\EDTA Pos Swabs 7 5.0 0.000
Sample Vol ISTD Amt Dil Factor
0.000 0.000 1.000
************i
f,* uo,;I rts)
nana 'l
-..,tr(.Llpl.1

Sample Name:
C--rment:
Sequence---MATRIX_pos. sld [Open]
Matrix 8 ("50 ppm")
Study:
Client:
Laboratory:
Company:
Phone:
Sample Type File Name Sample lD Path
Unknown MATRIXO3 03 :XcalibuAData\EDTA\Brewer\MAT Positive
Inst Method Proc Method CalFile Position InjVol Level Sample Wt
C:U(calibur\methods\EDTA Pos Swabs 8 5.U 0.000
Sample Vol STD Amt Dil Factor
0.000 0.000 1.000
*ff****t*****
Sample Name:
Comment:
9 ("50 ppm
Study:
Client:
Laboratory:
Company:
Phone:
sample lype File Name Sample lD Path
Unknown MATRIXO4 04 C:U(calibur\Data\EDTA\Brewer\MAT Positive
lnst Method Proc Method CalFile Position InjVol Level lSample Wt
C:XcalibuAmethods\EDTA Pos I 5.0 0.000
Samole Vol ISTD Amt Dil Factor
0.000 0.000 1.000
*****************************t***********************t*************t***********************t*********t**************************************
/'L4(
+tlb)'11\
{q0r lrr \:1
nana )

Sample Name:
f---rment:
Seq uence---MATRIX_pos, sld [Open]
Makix 10 ("50 ppm")
Study:
Client:
Laboratory:
Company:
Phone:
Sample Type File Name Sample lD Path
Unknown MATRIXOS 05 C:U(calibuAData\EDTA\Brewer\MAT Positive
Inst Method Proc Method CalFile Position njVol Level Sample WtC:Xcalibur\methods\EDTA Pos Swabs 10 5.0 0.000
Sample Vol ISTD Amt Dil Factor
0.000 0.000 1.000
Sample Name:
Comment:
50 ppm EDTA
Study:
Client:
Laboratory:
Company:
Phone:
Sample Type File Name Sample lD Path
Unknown MATRIXO6 06 C:U(calibuAData\EDTA\Brewer\MAT Positive
Inst Method iProc Method
Sample Vol ISTD Amt Dil Factor
0.000 0.000 1.000
f* *of-( zs)
nana ?
{rPr- lrr-\o1

Sequence--MATRIX_pos. sld [Open]
Sample Name:
C^"rment:
ppm
Study:
Client:
Laboratory:
Company:
Phone:
Sample Type File Name Sample lD Path
Unknown MATRIXOT 06 C:XcalibuAData\EDTA\Brewer\MAT Positive
lnst Method Proc Method Cal File Position lnjVol Level Sample Wt
C:Xcalibur\methods\EDTA Pos Swabs 12 5.0 0.000
Sample Vol ISTD Amt Dil Factor
0.000 0.000 1.000
****t**t*****t**********+*l*s*t***tt*********************t**
Sample Name:
Comment:
50 ppm EDTA
Study:
Client .
Laboratory:
Company:
Phone:
Sample Type File Name Sample lD Path
Unknown MATRIXOS UO C:U(calibur\Data\EDTA\BreweAMAT Positive
lnst Method Proc Method CalFile Position InjVol Level Sample Wt
C:U(calibur\methods\EDTA Pos Swabs 12 5.0 0.000
Sample Vol ISTD Amt DilFactor
0.000 0.000 1.000
****t***t********s******t**********************************t***********
tu +Vt"( +s)
oaoe 4
4"0Lf t- i"e

Sequence---MATRIX_pos. sld [Open]
Sample Name:
/^-rment Study:
Client:
Laboratory:
Company:
Phone:
Sample Type File Name Sample lD Path
Unknown MATRIXOg 06 C :U(cal ibu r\Data\EDTA\Brewer\MAT Positive
lnst Method Proc Method CalFile Position lnjVol Level Sample Wt
C:Xcalibur\methods\EDTA Pos Swabs 12 c.tJ 0.000
Sample Vol ISTD Amt DilFactor
0.000 0.000 1.000
Sample Name:
Gomment:
50 ppm EDTA
Study:
Client:
Laboratory:
Company:
Phone:
Sample Type File Name Sample lD Path
unKnown MATRIXlO 12 ;:u(calrDur\Data\tsu I A\Hrewer\MA I Posttve
lnst Method Proc Method CalFile Position InjVol Level Sample Wt
C:U(calibur\methods\EDTA Pos Swabs 12 5.0 0.000
Sample Vol ISTD Amt Dil Factor
0.000 0.000 1.000
*f ***********t*******
{+ a+ulrse)
naoe 5
T'rP1lt'\'r

Sample Name:
' .ment:
Seq uence---MATR lX_pos. sld [Open]
Matrix 3 ("500 ppm")
Study:
Client:
Laboratory:
Company:
Phone:
Sample Type File Name Sample lD Path
Unknown MATRIX13 03 C :U(calibu r\Data\EDTA\Brewer\MAT Positive
Inst Method Proc Method Cal File Position njVol Level Sample Wt
C:U(calibur\methods\EDTA Pos Swabs 3 5.0 U.UUO
Sample Vol ISTD Amt Dil Factor
0.000 0.000 I.UUU
Study:
Client:
Laboratory:
Company:
Phone:
Sample Type File Name Sample lD Path
Unknown MATRIXl4 o4 C:XcalibuAData\EDTA\Brewer\MAT Positive
Inst Method Proc Method CalFile Position lnjVol Level Samole Wt
:Xcalibur\methods\EDTA Pos Swabs 4 5.0 0.000
Sample Vol ISTD Amt Dil Factor
0.000 0.000 1.000
€* qqo(38,
aaaa 7
4ott\r'lJ
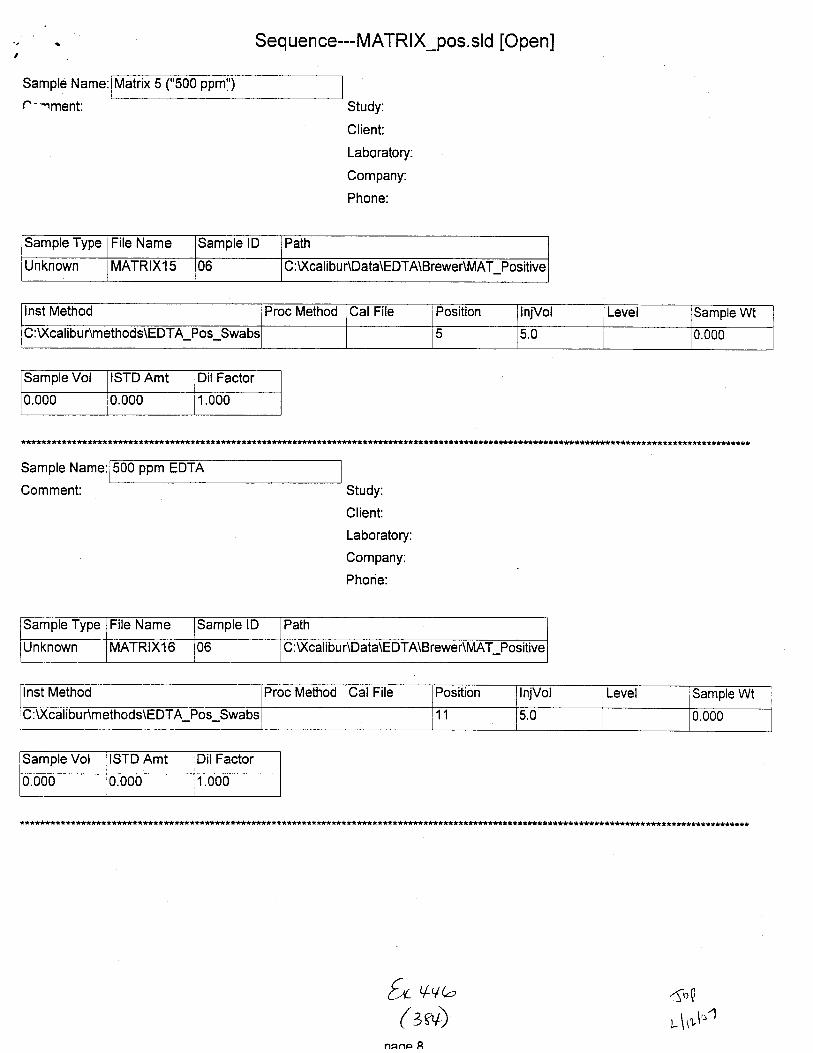
Sample Name:
c- rment:
Seq uen ce---MATR|X_pos. sld [Open]
Matrix 5 ("500 ppm:')
Study:
Client:
Laboratory:
Company:
Phone:
Sample Type File Name Sample lD Path
Unknown MATRIXlS 06 C:Xcalibur\Data\EDTA\Brewer\MAT Positive
lnst Method Proc Method Cal File Position InjVol Level Samole Wt
C:Xcalibur\methods\EDTA Pos Swabs 5 5.0 0.000
Sample Vol ISTD Amt DilFactor
0.000 0.000 1.000
f ********************t*
Sample Name:
Comment:
ppm EDTA
Study:
Client:
Laboratory:
Company:
Phone:
Sample Type File Name Sample lD Path
Unknown MATRIXl6 06 C:XcalibuAData\EDTA\BreweAMAT Positive
lnst Method Proc Method Cal File Position InjVol Level iSamole WtI
u:\xcaltbunmetnods\EDIA Pos swabs 11 5.0 0.000
Sample Vol ISTD Amt Dil Factor
0.000 0.000 1.000
V+to( g?D
5"0
r- \rr'to'1n:nc A

Sample Name:
c-rment:
Sequence---MATRIX_pos. sld [Open]
500 ppm
Study:
Client:
Laboratory:
Company:
Phone:
Sample Type File Name Sample lD Path
Unknown MATRIXlT 06 C:U(calibur\Data\EDTA\Brewer\MAT Positive
Inst Method Proc Method CalFile Position InjVol Level Sample Wt
C:Xcalibur\methods\EDTA Pos Swabs 11 5.0 0.000
Sample Vol STD Amt Dil Factor
0.000 0.000 1.000
*******i*********
Sample Name:
Comment:
500 ppm
Study:
Client:
Laboratory:
Company:
Phone:
Sample Type File Name Samole lD Path
Unknown MATRIXlS Ub C:U(calibur\Data\EDTA\BreweAMAT Positive
lnst Method Proc Method Cal File Position lnjVol Level Samole WtI
C:U(calibur\methods\EDTA Pos Swabs 11 5.0 0.000
Sample Vol ISTD Amt Dil Factor
0.000 0.000 1.000
tr +w-( tss)
naoe 9
1n0 | ,4-t ^\.lt.l \\ b\r\
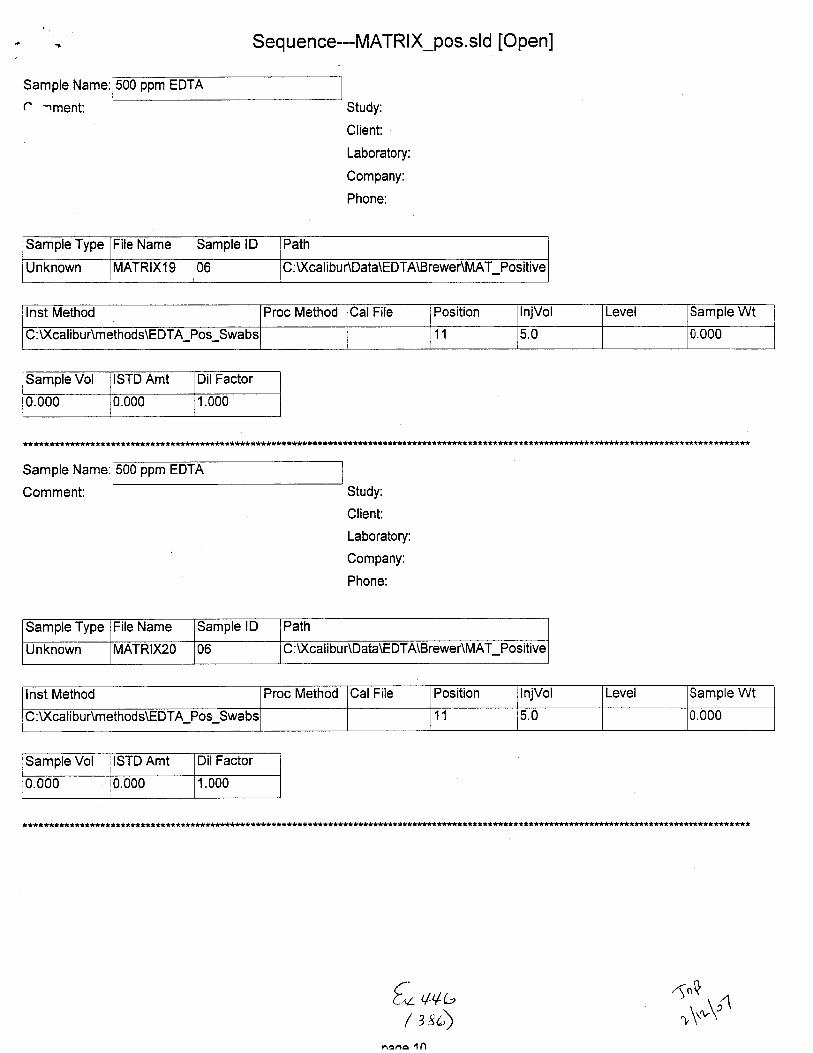
:"Sample Name:
c'rment:
Seq uence---MATR lX_pos. sld [Open]
ppm EDTA
Study:
Client:
Laboratory:
Company:
Phone:
Sample Type File Name Sample lD Path
Unknown MATRIXl9 06 C:U(calibur\Data\EDTA\BreweAMAT Positive
Inst Method Proc Method CalFile Position lnjVol Level Sample Wt
C:Xcalibur\methods\EDTA Pos Swabs 11 5.0 U.UUU
Samole Vol ISTD Amt DilFactor
0.0u0 U.OOU r.000
Sample Name:
Comment:
500 ppm EDTA
Study:
Client:
Laboratory:
Company:
Phone:
Sample Type File Name Sample lD Path
Unknown MATRIX2O 06 C:U(calibur\Data\EDTA\Brewer\MAT Positive
lnst Method Proc Method CalFile Position InjVol Level Sample Wt
C:Xcalibur\methods\EDTA Pos Swabs 44 5.0 0.000
Sample Vol ISTD Amt DilFactor
0.000 0.000 1.000
{* v+uI 3 8/">
nana'lO
')ii"r^

Sequence--MATRIX_pos. sld [Open]"-Sample Name:
f- -ment:
Matrix 1
Study:
Client:
Laboratory:
Company:
Phone:
Sample Type File Name Samole lD Path
Unknown MATRIXll 01 C : U(cali bu AData\EDTA\BreweAMAT-Positive
lnst Methocl Proc Method Cal File Position lnjVol Level Sample Wt
C:\Xcalibur\methods\EDTA Pos Swabs 1 5.0 0.000
Sample Vol ISTD Amt Dil Factor
0.000 0.000 1.000
Sample Name:
Comment:
Matrix 2
Study:
Client:
Laboratory:
Company:
Phone:
Sample Type File Name Sample lD Path
Unknown MATRIXl2 02 C :U(calibur\Data\EDTA\BreweAMAT Positive
lnst Method Proc Method CalFile Position InjVol Level jSample Wt
C:Xcalibur\methods\EDTA Pos Swabs 2 5.0 0.000
Sample Vol ISTD Amt DilFactor
0.000 0.000 1.000
6('tq,-,\(zstl{o&
r-l'u \r

C :U(calibu A...\MAT-Positive\Matrix0 1
-.--RT:S#:
0.95704848899
100rI
'-1
t-4 t
( tsx
Matrix 6 ("50 ppm")
i c ESI Full ms2 [email protected] [ 125.00-315.001
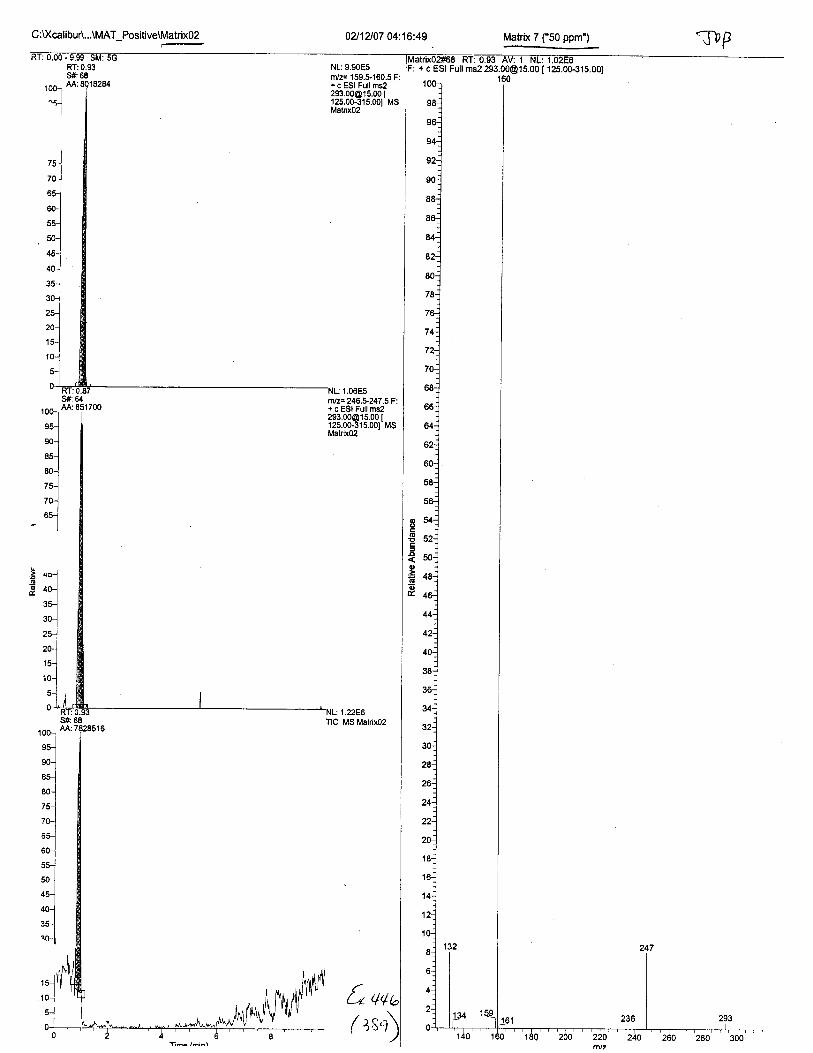
C :D(ca libur\...\MAT_Positive\Matrix02 02112107 04:16:49
nqa688018284
RT:S#:M:
NL:9.90E5rdz= 159.5-160.5 F:+ c ESI Full [email protected]'t5.001 MSMatnxo2
rnlz= 246.5'247 .5 Fi+ c ESI [email protected] MSMatrix02
&,/
s* 64AA: 85'1700
86E
o
o66E
( 1E,-t
Matsix 7 ("50 ppm")
-
[rx02#ri6 RI:0.93 AV: 1 NL: 1.02E0+ c ESI Full ms2 [email protected] [ 125.00-315.001

C :\)(calibur\...\MAT_Positive\Matrix03 OU1Z07 04:27:39
0.90oo
RT:s#:
NL:5.72E5rn/z= 159.5-160.5 F:+ c ESI [email protected] I125.00-315.001 MSMatrix03
1001
"5-1
5.83E4ntlz= 246.1247.5 F:+ c ESI Full [email protected] [125.00-315.001 MSMatrixo3
{r",/+,'1;'r")
Matrix 8 ('50 ppm')
tafixuitttro Kt: u.gu AV: I NL: 6.61E5: + c ESI Full msz [email protected] [ 125.00-315.00]

C:U&alibur\...\MAT Positive\Matrix04 0211?/07 04:38:28
: 5.49E4
nmoo
RT:S#:AA:
1 001
"..1
S#:69AA:,267123
KI:O.ZYS#:460M:15177
rrlz=246.5247.5F:+ c ESI Full [email protected] [125.0G.315.001 MSMatrixo4
'NL: 5.07E5TIC MS Matdxo4
t*-r*l90-.1
o"-l*lMJ*l. c-1
I
70--{
^J--lfl
fo +'/,,(tr\
NL:4.02E5nVz= 159.$'160.5 F:+ c ESI Full [email protected] [125.00-315.001 MSMatrixo4
Matrix 9 f50 ppm')
+ c ESI Full ms2 [email protected] [ 125.00-315.001

C:U(calibuA...\MAT Positive\Matrix05 02112107 04:49:22
. Y.YY iRT: 0.87S#:64
NL: '1.27E6
rVz= 159.$160.5 F:+ c ESI Full [email protected] [125.00-315.001 MSMetrixos
nlz:- 246.$247 .5 Fi+ c ESI Full [email protected] [125.00-315.00t Msiilatrixo5
'*tou-i
oo6
t
o-=dE
1.62E6TIC MS Matrixos
f* rt,t
1iq.r)
Matrix 10 ("50 ppm")
trix05#69 RT:0.94 AV:1 NL:1.14E6+ c ESI Full ms2 [email protected] [ 125.00-315.00]
.Tb P
2m
18
16
14

C :U(calibuA...\MAT-Positive\Matrix06 0211A07 05:00:13
RT:S*:AA:
NL:1.00E5n/z= 159.5-160.5 F:+ c ESI Full [email protected] [125.00-31s.001 MSMalrix06
100-l
"u_l
S#;59A*.52207
10(
9I
u:
8(
71
7(
os
ooG6
S#:403M:4747RT: 2.1 1
S#:155AA:3592
NL:3.25E5TIC MS Matdx06
6" ++
NL:1.16E4nlz= 246.t247.5 F:+ c ESI Full [email protected] [125.00-315.001 MSMatrix06
( tqt
50 ppm EDTA T}E
+ c ESI Full ms2 [email protected] [ 125.00-315.00]

C :U(calibu 4...\MAT_Positive\Matrix07 0412107 05:11:03 50 ppm EDTA TTB
RT:0.86S#:63AA:5F0515
NL: 1.06E5n/z= 159.S160.5 F:+ c ESI Full [email protected] [125.00-315.001 MSMatrix0T
NL:2.63E5TIG MS MatrixoT
S#:61AA:37298
{o t+ro
RT: 1.42tnozoat Eo
(ztl
{,oG
Joodo
+ c ESI Full ms2 [email protected]
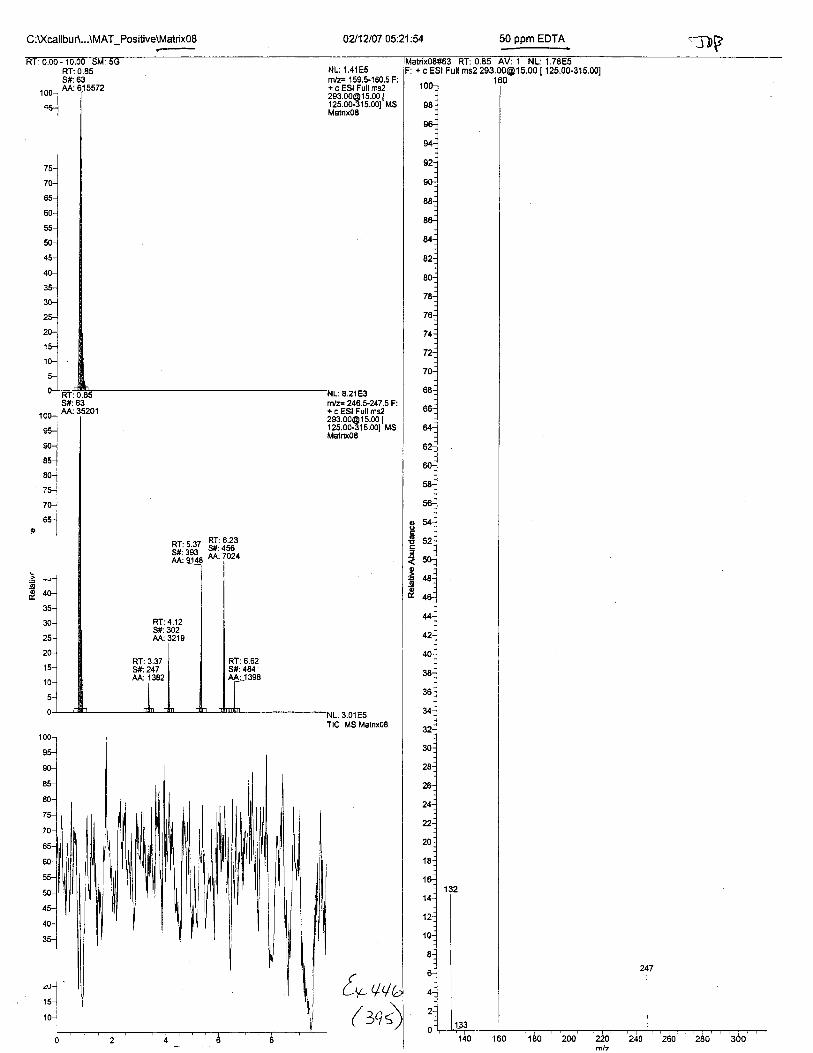
C :Xcalibu 4...\MAT_Positive\Matrix08
S#:63M:3520'l
RT:5.37S#: 393AA:914
RT: 3.37#:247M:1382
OA12l07 05:21:54
0.8563615572
- tu,RT:s#:AA:
NL:1.41E5rn/z= 159.5-160.5 F:+ c ESI Full ms2293.00@'15.00 |12s.00.315.001 MSMatrix06
RT: 6.23S#:456M:7024
rnlz.-- 246.*247 .5 F:+ c ESI Full [email protected] [125.00-31s.001 MSMatrix0E
: E21E3
:3.01E5TIC MS Matrixoo
fv- qq
oo6gf4
o
6o
RT:4.12s* 302M:3219
Kt:o.ozS#:484
1398
f /-al <
50 ppm EDTA
[rix08#63 RT:0.E5 AV: 1 NL: 1.78E5+ cESl Full ms2 [email protected] [ 125.00-315.001
'f)P

C :U(calib ur\...\MAT_Positive\Matrix09
RT:0.83S#:61M: 945379
0211?/07 05:32:46
NL: 2.08E5n/z= 159.S160.5 F:+ c ESI [email protected] [125.00-31s.001 MsMatrixog
TIC MS Matrixog
ooG
o
-gox.
f x+4br3r 6)
10(
8C
T'
7A
oc@
4.61
11
50 ppm EDTA
il[uvrcz 6t; u.o+ Av: I NL: z./cEc+ c ESI Full ms2 [email protected] [ 125.00-315.00]

C:U(calibuA...\MAT_Positive\Matrixl 0 0?/12107 05:43:37
0.64oz707733
RT:stAA:
NL:1.54E5rnlz= 159.$160.5 F:+ c ESI Full [email protected] [12s.00-315.00t MsMatrixl0
[-'r +a u( zl)
1 00-l
'a
50 ppm EDTA
rtnxl0#64 RT: o.EZ AV: 1 NL: 6.69E4+ c ESI Full ms2 [email protected] [ 125.00-315.00]
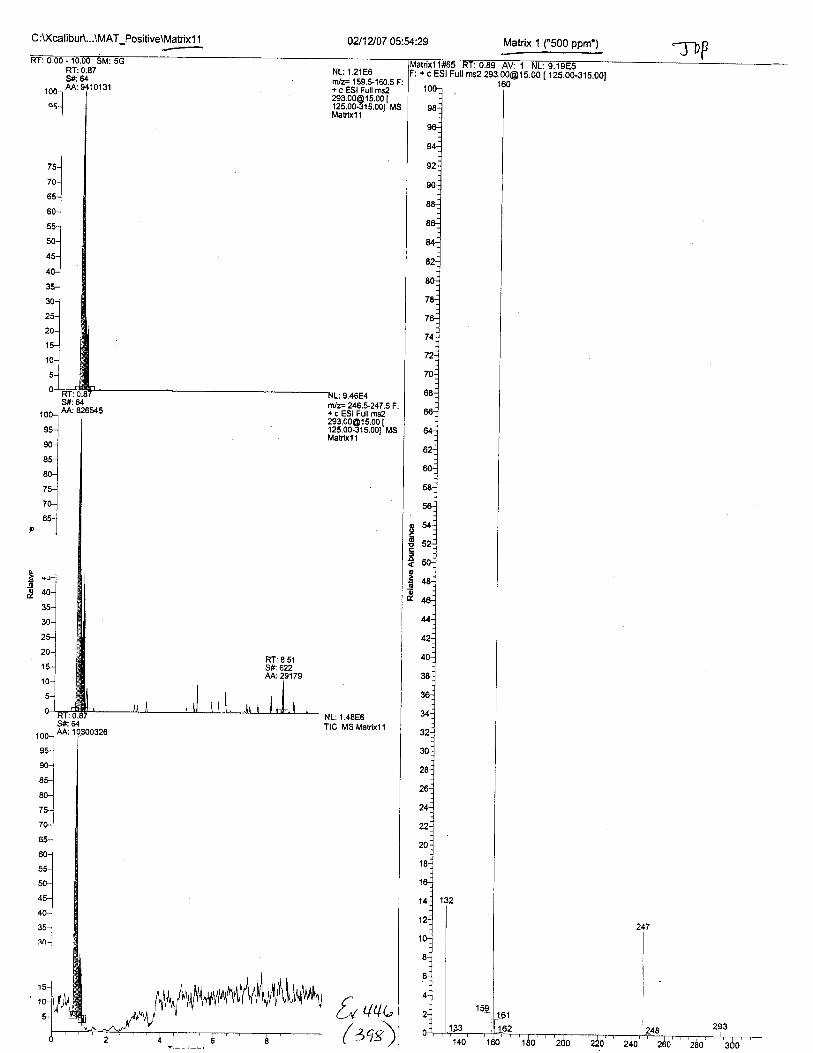
C :Xcalibur\...\MAT_Positive\Matrixl 1
RT:0.87S#:64
0412107 05:54:29
1oo] AA:
"r_J
S#:64AA:826545
ftlz= 246.5-247 .5 F:+ c ESI Full [email protected] [125.00-315.001 MSMatrixl l
NL:1.48E0TIC MS Matrixll
& uqu( zqt)
1001
orl--l*-l'-{ro-l
Irrlr0-1
.s-]el oo
G
Jo
o
oE
RT: 8.51S#:622AA:29179
NL:1.21E0n/z= 1 59.5-160.5 F:+ c ESI Full [email protected] [125.00-315.001 MSMatrixl l
100-
95-
90-
85-
80-
tv
olou-
55-
50-
45-
40-
3F
Matrix 1 ('500 ppm')
: + c ESI Full ms2 [email protected] [ 125.00-31S.00]
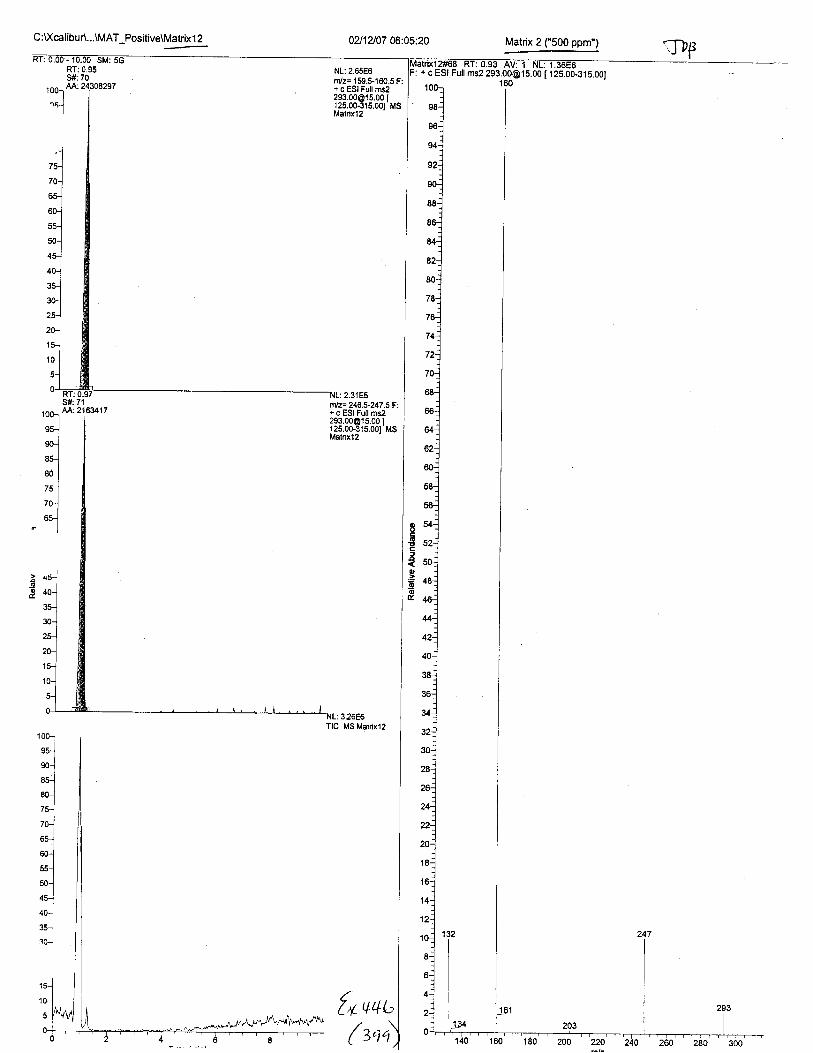
C:U(calibur\...\MAT_Positive\Matrix 1 2 02fi2107 06:05:20 Matrix 2 ('500 ppm')
no570
RT:s#:AA:1001
"[email protected] I125.00-315.001 MSMetrixl2
t+ v+t"(tqo
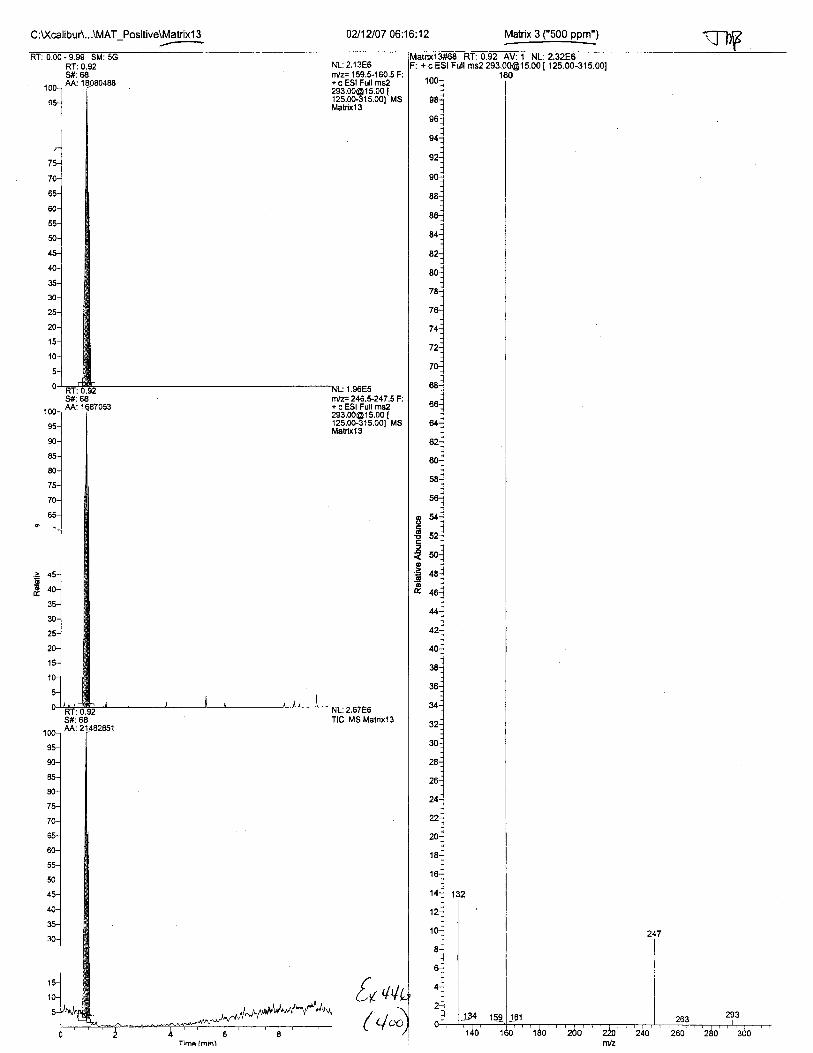
C :U(calibu 4...\MAT_Positive\Matrix'l 3 0412107 06:16:12
RT:S#:M:
0.92
1001
nr-l
n/z= 1 59.5-1 60.5 F:+ c ESI Full [email protected] [125.00-315.001 MSMatrix'13
nJz:246.$247.5F+ c ESI Full [email protected] [125.00-315.001 MSMatdxl3
1 ool AA:
nu-]
"-l8As0-l
7s-1
to-]
" r:-l
-l
oo6E
oo66
TIC MS Matrixl3
ft 4((4*
Matrix 3 ("500 ppm")
+ c ESI Full ms2 [email protected] [ 125.00-315.001
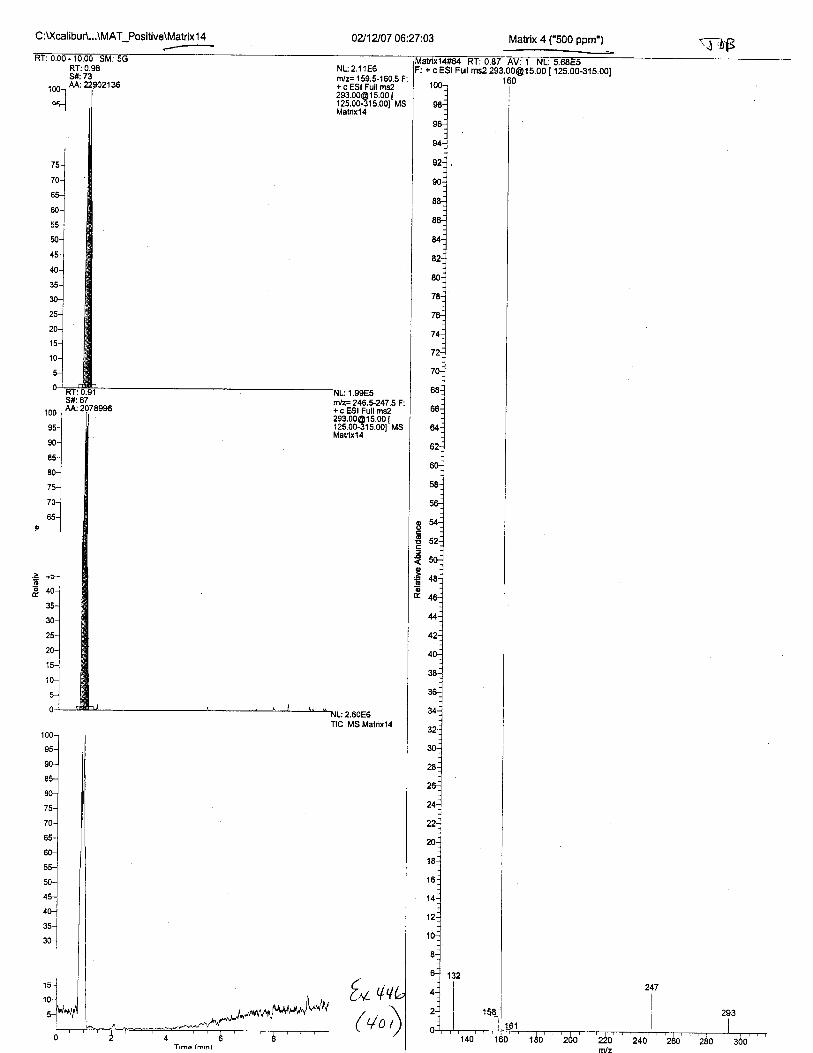
C :VcalibuA...\MAT_Positive\Matrix 1 4 0?J12107 06:27:03
:2.60E6TIC MS Matrixl4
0.9873
RT:S#:AA:
Matrix 4 ("500 ppm')
F: + c ESI Full ms2 [email protected] [ 125.00-3i5.00]
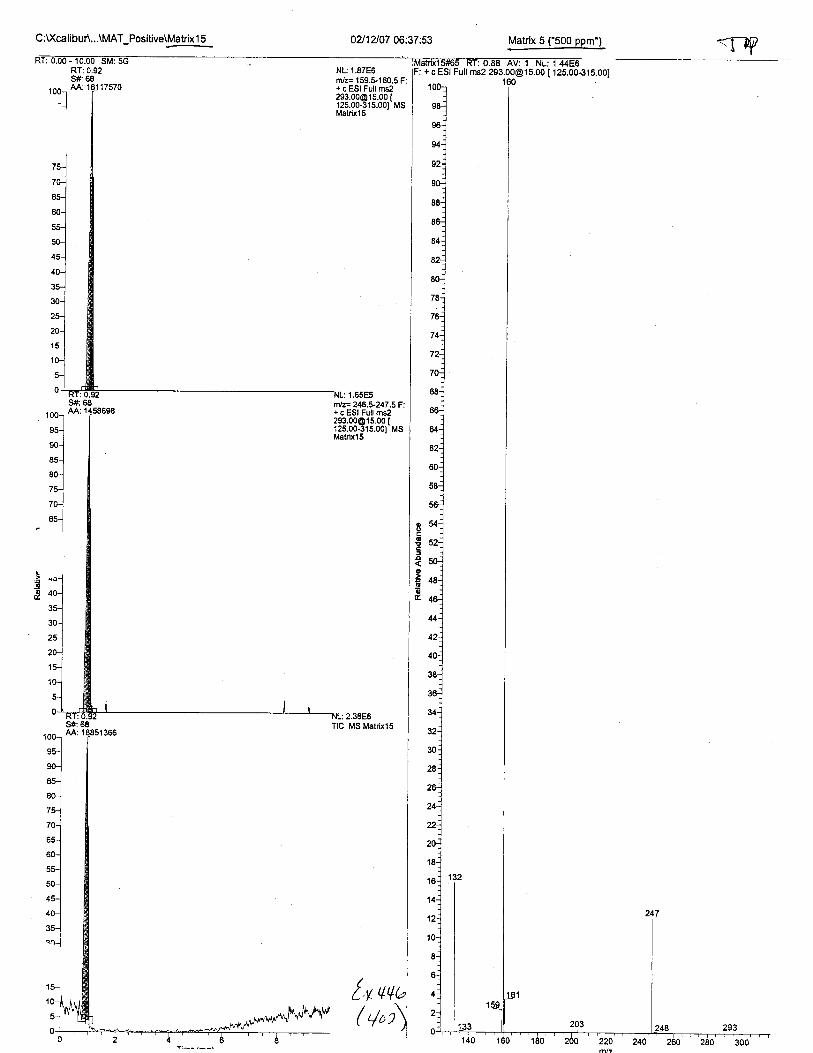
C :D(ca libur\...\MAT_Positive\Matrix 1 5
161 1
RT:stA
I--.1
02112107 06:37:53
NL: 1.87E0rn/z= 159.&160.5 F:+ c ESI Full [email protected] [125.00-315.001 MSMatrixl5
fflz= 246.*247.5 F:+ c ESI Full [email protected] [125.00-315.001 MSMaHx15
oo6!!o
o":oE
:2-38E6TIC MS Matrixls
t,r,t(4ot
Matrix 5 ("500 ppm')
I c ESI Full ms2 [email protected] [ 125.00-315.001
<rry
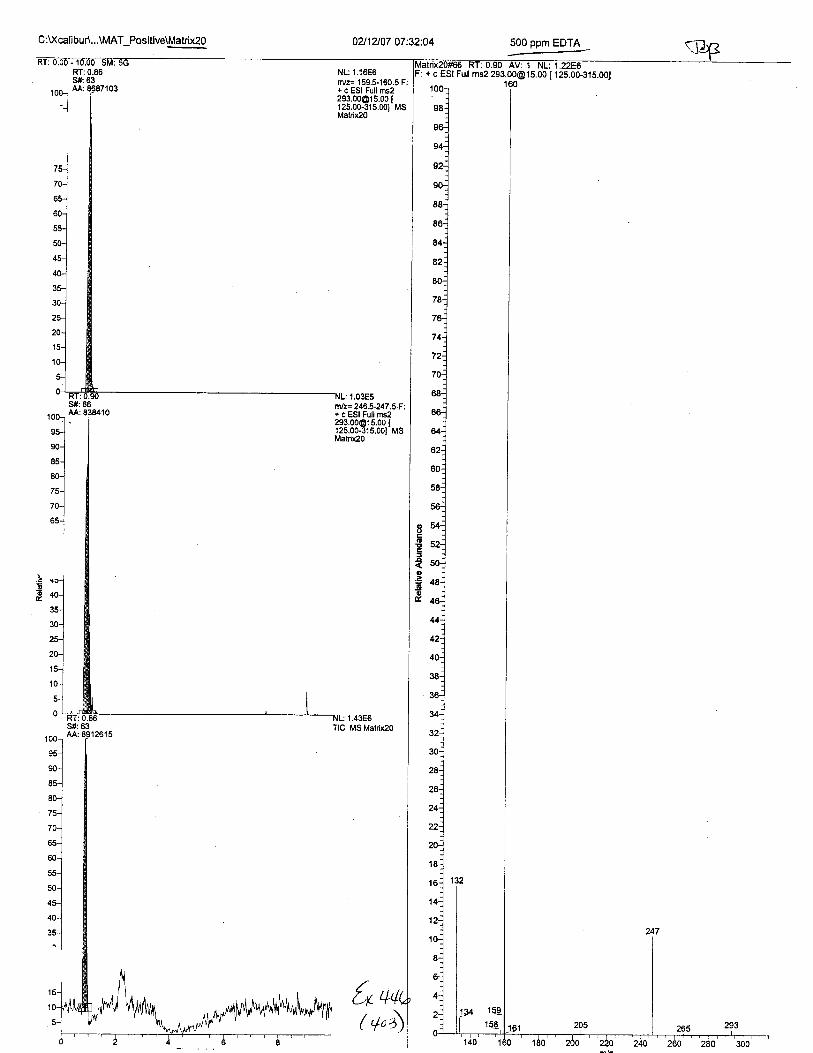
C :U(cali bu r\...\MAT_Positivewatrix20 0U12107 07:32:04
0.8663
RT:s#:AA:
NL:1.16E6r/z= 159.s'160.5 F:+ c ESI Full [email protected] [125.00-315.001 MSMatdx2O
d(-{
S#:65AA: E38410.t100r
^-l*l90-l
I
ru-l
roltu-l
'l'u-]
oE:Do
o{,
'|.03E5
n{z= 246.5-247 .5 F:+ c ESI Full [email protected] [125.00-315.001 MSMatrix20
(,/',
500 ppm EDTA
1
F: + c ESI Full ms2 [email protected] [ 125.00-315.00]
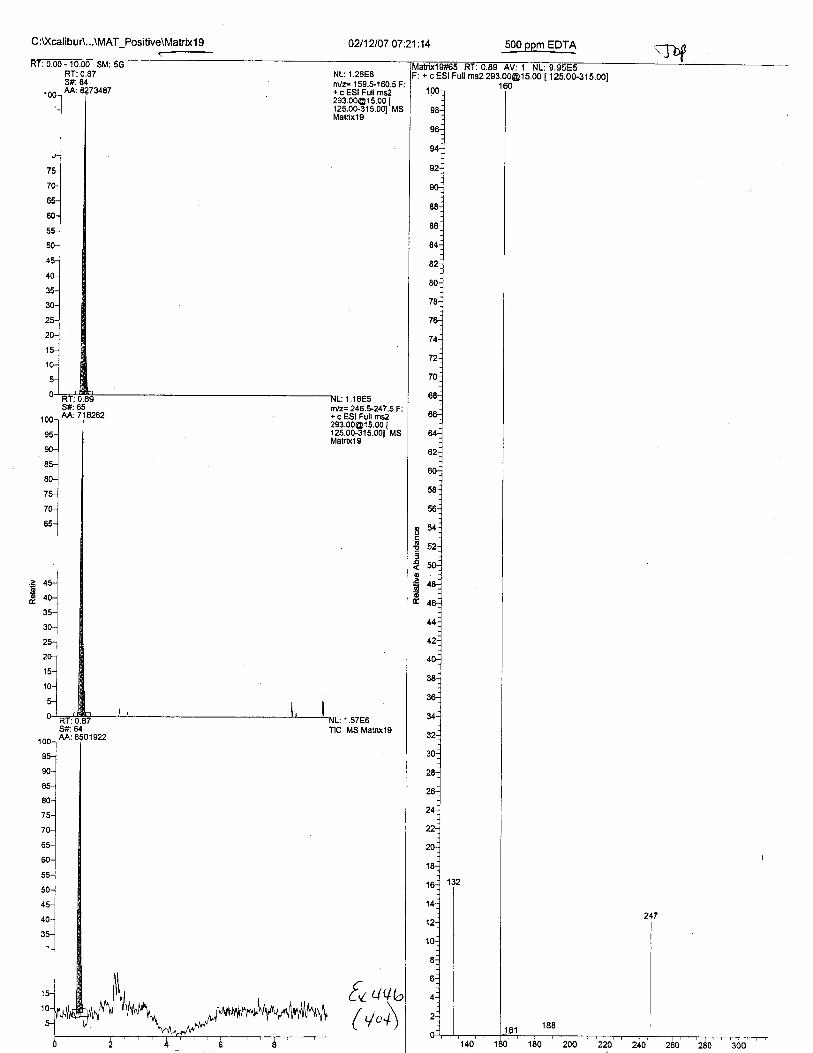
C:U(calibuA...\MAT_Positive\Matrixl 9
-
0?/12t07 07'.21;14 500 ppm EDTA Tbf0.8764
KI:S#:AA:
NL:1.26E6m/= 159.5-160.5 F:+ c ESI Full [email protected] [125.00-31s.001 MsMatrixl9
$lr- 246.5-247.5 F:+ c ESI Full [email protected] I12s.00-315.001 MSMatrixl9
1001
-..1
S#:65M:71A262t*-]
'ls0-l
'l80-]
tul70-..1
*-lI
. <AEA
648501922
S#:AA:
TIC MS Matixlg
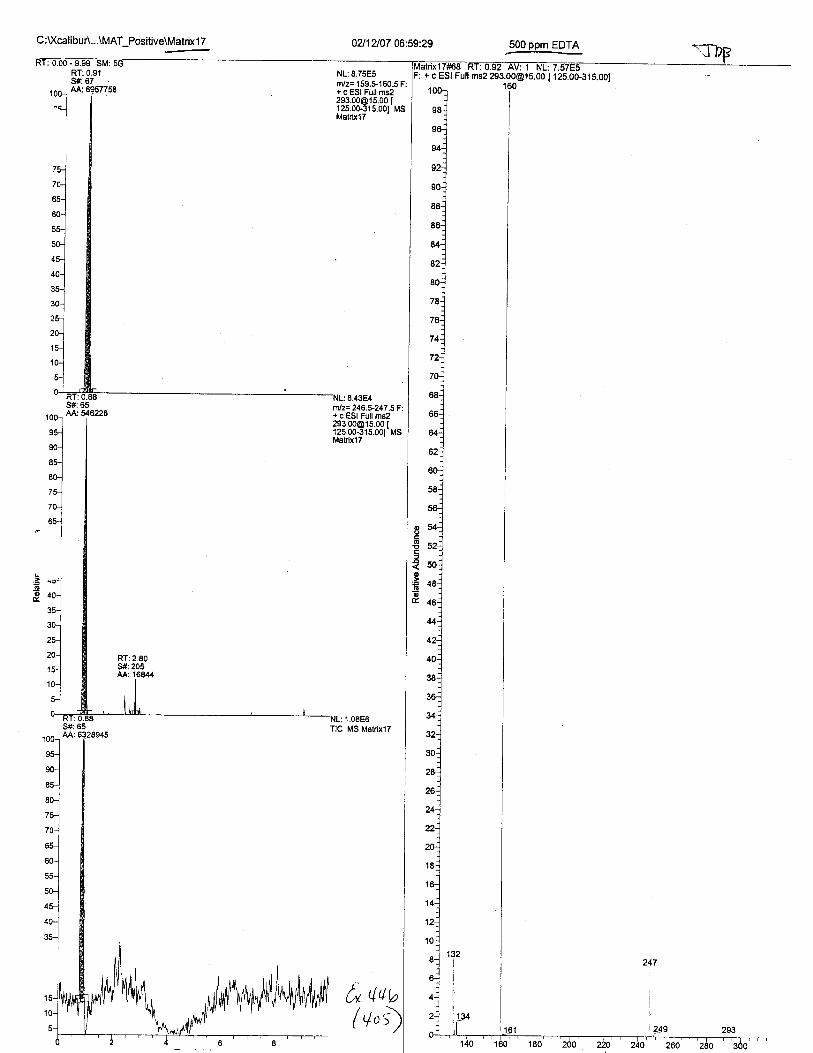
C:WcalibuA...\MAT_Positive\Matrix 1 7
RT:0.91S#:67
100- AA:
"..]
NL:8.75E5m/z: 159.$160.5 F:+ c ESI Full [email protected] [125.00-315.001 MSMatrirlT
t, ,tuu
1001
,5-l
s0J
es-l
eo]
tr-]r*l
I
"l
.2 +:r]
& 40-l
".-l*l30-1
I
25-.],I
201I
15-1
1o-l
100-l
*l
'l*1,l'l70J
^-lo'-luo-l
*lqn-l*loloo-1
*l
[+o;
+ c ESI Fuil ms2 [email protected] [ 125.00-315.001
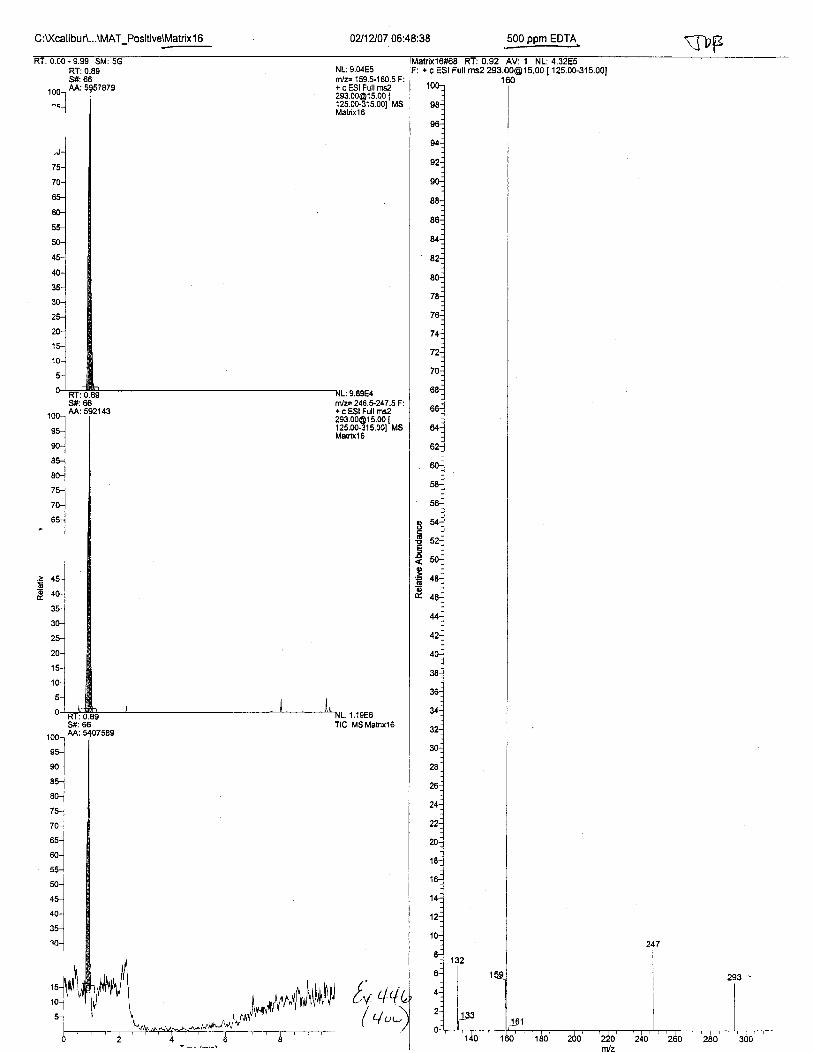
02112107 06:48:38C:\)(calibuA...\MAT_Positive\Matrix 1 6
NL:9.04E5rVF 159.$160.5 F:+ c ESI Full [email protected] |125.00.315.001 MSMatixl6
0.89oo
RT:S#:AA:1001
^c-l
nlz= 246.1247.5 Flr c ESI Full [email protected] [125.0G.315.001 MSMalrixl6
ob592143
s#:AA:100:
"J*lsGl
Inil*l80J
/ c-1
-^ltu1
--l
fv tl4( q,"
500 ppm EDTA
mx16#6E RT:0.92 AV: 1 NL:4.32E5+ c ESI Full ms2 [email protected] [ 125.00-315.001
{ilF
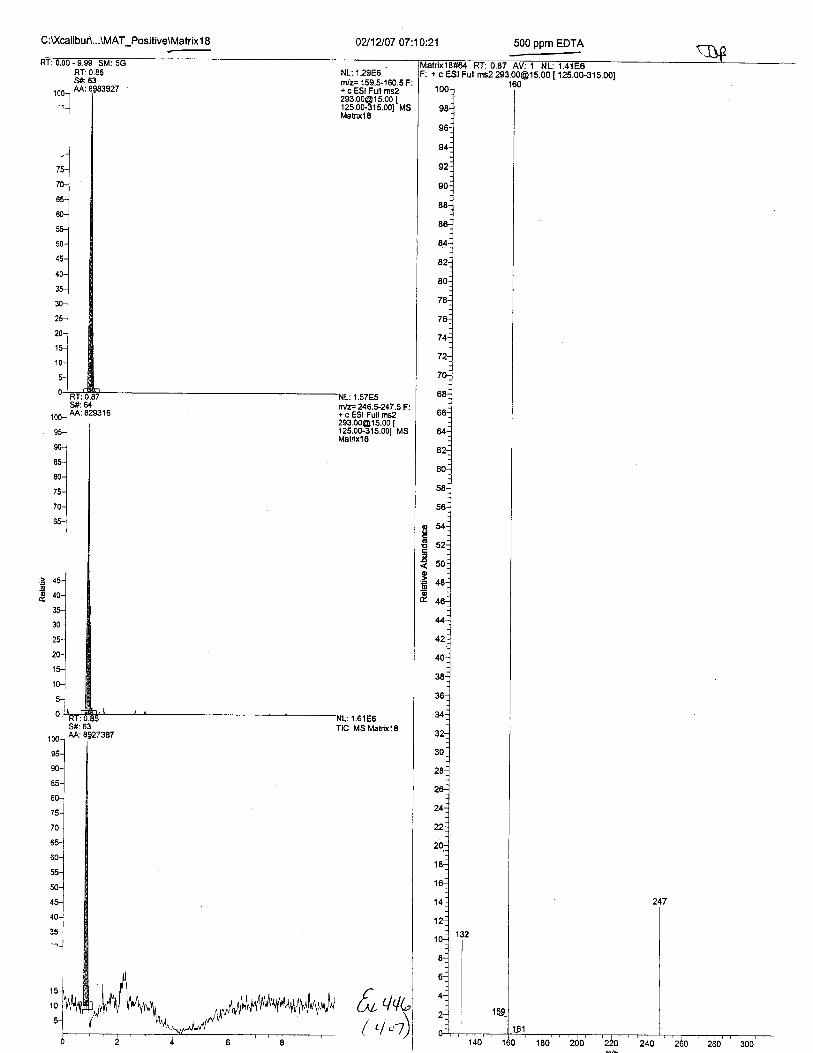
C:\i(calibuA...\MAT Positive\Matrixl 8 02112107 07:-10.'21
0.85RT:S#:
100r M:I.-l
NL:1.2986m/z= 159.5-160.5 F:+ c ESI Full [email protected] [125.00-315.001 MSMetrixlE
100-
o.-l*l9H
8J
"-]ru-l
?0-J
ul
ftlF246.5-247.5 F:+ c ESI Full [email protected] [125.00-315.001 MSMatrixlS
:1.57E5
1.61E6TIC MS MatrixlS
[*q, \|( 4 "t)1
500 ppm EDTA
F: + c ESI Full ms2 [email protected] [ 125.00-315.00]

Seq uence--MATRIX_neg. sld [Open]
Study:
Client:
Laboratory:
Company:
Phone:
Sample Type File Narne Sample lD Path
Unknown MATRIXOl 1 C :Xcalibur\Data\EDTA\BreweAMAT_Negative
lnst Method Proc Method Cal File Position InjVol Level Sample Wt
C :U(cal ibur\methods\EDTA_N eg_Swabs o 5.0 0.000
Sample Vol ISTD Amt Dil Factor
0.000 0.000 1.000
******************
MatrixSample Name:
Comment: Study:
Client:
Laboratory:
Company:
Phone:
Sample Type File Name Samole lD Path
Unknown MATRIXO2 02 C:Xcalibu AData\EDTA\BreweAMAT_Negative
Sample Vol ISTD Amt Dil Factor
0.000 0.000 1.000
********t***********
.<"I,lpl-l
€, q+b( +"',paqe 1

I
Sample Name:
C- -rnent:
Seq uence---MATRtX_neg. std [Open]
Matrix 8 ("50 ppm")
Study:
Client:
Laboratory:
Company:
Phone:
Sample Vol ISTD Amt DilFactor
0.000 0.000 1.000
********i********t***ttr******tr***t*tt*****t************t*****a***t**i**************************r***********r**#******r********t*****
Sample Name:
Comment:
ix 9 ("50 ppm")
Study:
Client:
Laboratory:
Company:
Phone:
Sample Type File Name Sample lD lPathUnknown MATRIXO4 U+ r./ : \Acat t0ur\uata\ts D t RtBrewer\MAT_Negative
Inst Method Proc Method uar rile PosIton InjVol Level Sample Wtrrsg_owaus 9 5.0 0.000
Sample Vol ISTD Amt DilFactor
0.000 rJ.000 1.000
****************************************ft*t*********t**************s*******t***t**********fi******
T"q
" lr: l;l
6o ,/,/u( +"r)
naaa')

Sample Name
C nent:
Seq uence---MATRIX_neg. sld [Open]
10 ("50
Study:
Client:
Laboratory:
Company:
Phone:
Sample Type File Name Sample lD Path
Unknown MATRIXO5 05 C :U(calibu AData\E DTA\BrewEnMAT-NEqative
Inst Method Proc Method CalFile Position nJvol Level Sample Wtu : \xcaltbu r\methods\EDTA_Neg_Swabs 10 5.0 0.000
Sample Vol ISTD Amt DilFactor
0.000 0.000 1.000
****it******************ts********i******l***********************************r******s**********
Sample Name: 50 ppm EDTA
Comment: Study:
Client:
Laboratory:
Company:
Phone:
Sample Type File Name Sample lD Path
Unknown MATRIXO6 06 u: xcat ibu r\Data\EDTA\Brewer\MAT_Negative
Inst Method Proc Method Cal File Posrtron InjVol Level Sample WtC:U(calibur\methods\EDTA_Neg_SweG 12 5.0 0.000
Sample Vol ISTD Amt DilFactor
0.000 0.000 1.000
**********t********t************#******t************************t*t*******************t*****************i
T,1,,''
t,t +,/("/ 4,,,\'./
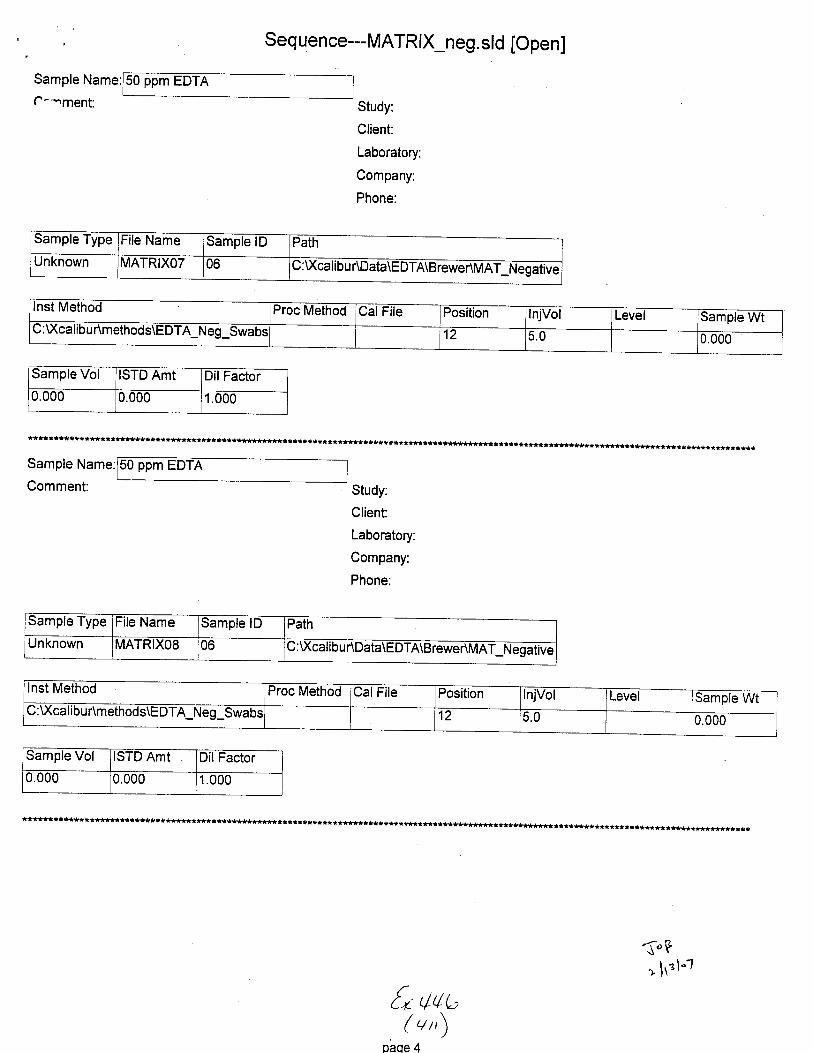
Sample Name:
C-'-'ment:
Seq uence---MATR|X_neg. sld [Open]
50 ppm EDTA
Study:
Client:
Laboratory:
Company:
Phone:
Sample Type File Name Sample lD Path
Unknown MATRIXOT 06 V(calibu r\Data\EDTA\BreweAMAT_Negatlve
Inst Method Proc Method CalFile Position InjVol Level Sample WtU : \Xcal tbu r\methods\EDTA_N eg_Swabs 12 5.0 0.000
Sample Vol ISTD Amt Dil Factor
0.000 0.000 1.000
Sample Name:
Comment:
***********t******************t*****r*******t******tt*t**tt****l*t*****i*****t**+********S*t*****************
50 ppm
Study:
Client:
Laboratory:
Company:
Phone:
Sample Type File Name Sample lD Path
Unknown MAIRIXOE i06 C :U(calibur\Data\EDTA\BrewenUAt_Negative
Inst Method Proc Method CalFile Position
T'-lnjVol Level Sample Wt
G: U(cal i bu r\methods\E DTA_Neg_Swabs b.u 0.000
Sample Vol ISTD Amt Dil Factor
0.000 0.000 1.000
*********t******t***********|****************s**1i
3Fr !1zl't
[+ 4(b/ ,/,,\/
paqe 4
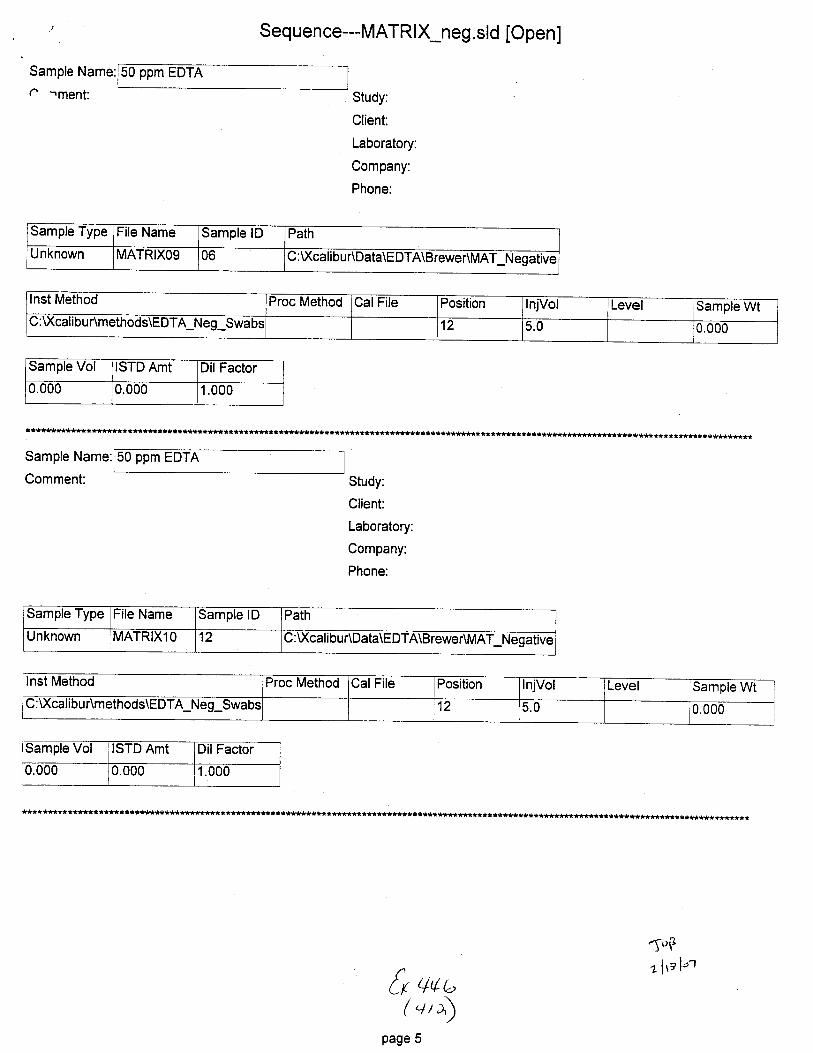
Sequence--MATRIX_neg. sld [Open]
Sample Name:
l^ .ment:50 ppm EDTA
Study:
Client:
Laboratory:
Company:
Phone:
Sample Type ile Name Sample lD Path
Unknown MATRIXO9 06 U : \Xcalibu r\Data\EDTA\Brewer\MAT_Negative
Inst Method Proc Method CalFile Position InjVol Level lSample WtG : xcali bu r\methods\E DTA_Neg_Swabs 12 5.0 0.000
Sample Vol ISTD Amt DilFactor
0.000 0.000 1.000
Sample Name:
Comment:
*t*********t************************************************t***********i****i*******i********t*t********
50 ppm EDTA
Study:
Client:
Laboratory:
Company:
Phone:
sample lype File Name Sample lD Path
Unknown MATRIXlO 12 C :U(cal ibur\Data\EDTA\Brewer\MAT_Negative
Inst Method Proc Method Cal File PositionI
InjVol Level Samole WtC :U(cal ibur\methods\EDTA_Neg_Swabs 112 5.0
Sample Vol ISTD Amt Dil Factor
0.000 0.000 1.000
f"i]+lel"'r
{r q(b( +,4
page 5

Sample Name:
C rent:
Seq uence---MATRIX_neg. sld [Open]
Matrix 1 ("500 ppm")
Study:
Client:
Laboratory:
Company:
Phone:
Sample Type File Name Sample lD Path
Unknown MATRIXI l 01 u: \ cailDu r\uata\tsDTA\Brewer\MAT_Negative
Inst Method Proc Method Cal File Position InJvol Level Sample WtC:U(calibur\methoW1 5.0 U.UUO
Sample Vol ISTD Amt DilFactor
0.000 0.000 1.000
tt*******t******t**i*********t**************************t******************t***********t**************ft**#**************r*******ffi******
Sample Name:
Comment:
Matrix ppm")
Study:
Client:
Laboratory:
Company:
Phone:
Sample Type File Name Sample lD Path
Unknown MATRIX12 02 C:U(calibu r\Data\E DTA\B rewer\MAT_N egative
Inst Method Proc Method Cal File Position InjVol Level Sample WtL;:\Xcattbur\methods\EDTA_Neg_swabs 2 5.0 0.000
Sample Vol ISTD Amt DilFactor0.000 0.000 1.000
****s*******************t**t***t*****i*************t**$*********i****************fr*************f**********
doFvltzl o1
v4b('l,l)
naoe 6
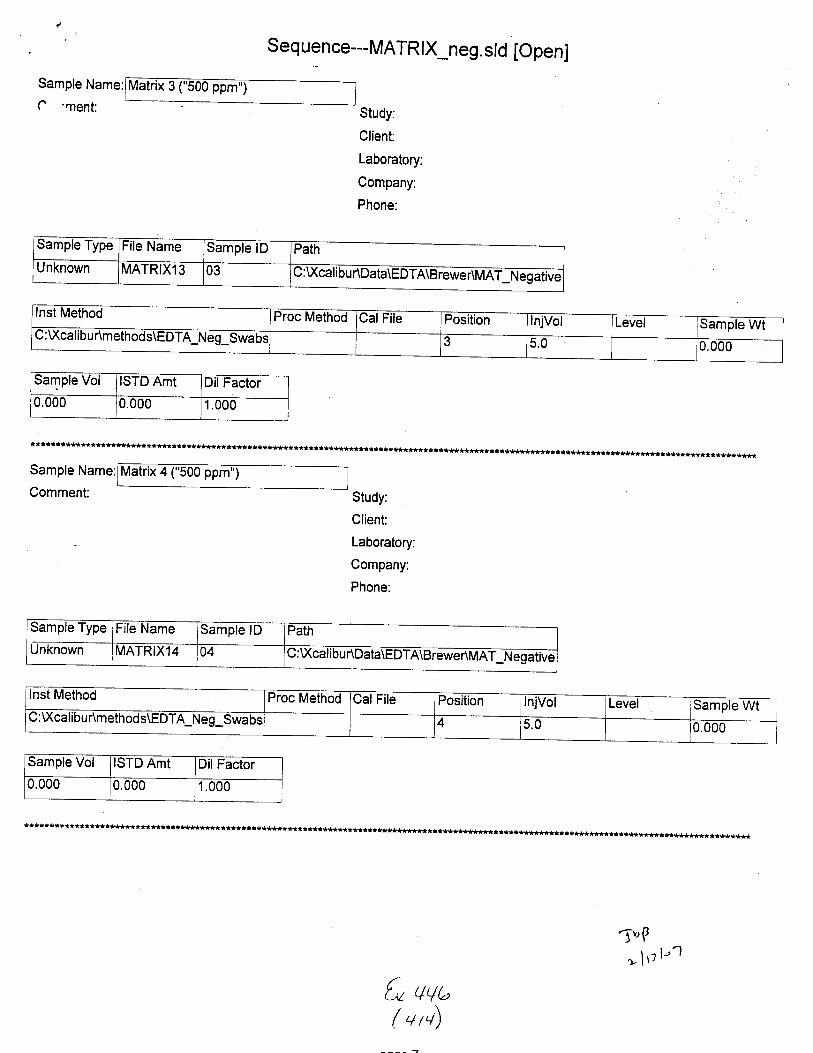
Sample Name:
C .'nent:
Seq uence---MATR tX_neg. std [Open]
)
Study:
Client:
Laboratory:
Company:
Phone:
Sample Vol ISTD Amt DilFactor0.000 0.000 1.000
**********i****************t***tt****t*****i**i**********************1***t******t**t***********************friit******t***r***t*********r
Sample Name: Matrix ppm")
Comment: Study:
Client:
Laboratory:
Company:
Phone:
Sample Type File Name Sample lD Path
Unknown MATRIXl4 04 U: \Xcati bur\Data\EDTA\Brewer\MAT_Negative
Sample Vol ISTD Amt DilFactor0.000 0.000 1.000
*******t**********************t******t*************************i***K****r**********************************
5"P> lrr l"]
C qqb( +,+)
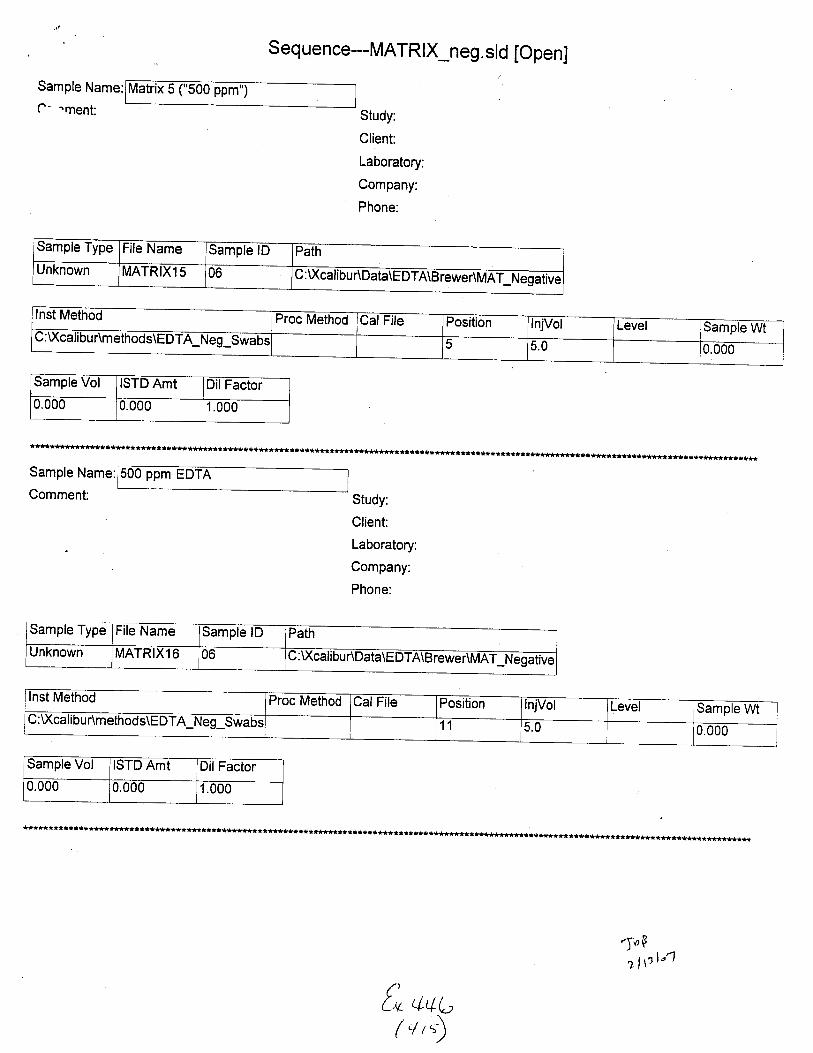
Sample Name:
C- .ment:
Sequence---MATRtX_neg. sld [OpenJ/
Study:
Client:
Laboratory:
Company:
Phone:
sample Type File Name Samole lD Path
Unknown MATRIXl5 06 u:\ canDur\lJata\EDTA\Brewer\MAT-Negative
Sample Vol ISTD Amt DilFactor
0.000 0.000 1.000
Sample Name:
Comment:
********t***************i*****t*t*************st**t******t***********ra************tr***
500 ppm EDTA
Study:
Client:
Laboratory:
Company:
Phone:
Sample Vol ISTD Amt DilFactor
0.000 0.000 1.tJ00
************i***ft**********************s****i*t**t*******i**i****t*r***********t***************tr******i*#
5rP') lfl"1
[+ rLAb(+,)

Sample Name:
C--.ment:
Seq uence---MATR lX_neg. sld [OpenJ
ppm EDTA
Study:
Client:
Laboratory:
Company:
Phone:
Sample Vol ISTD Amt DilFactor
0.000 0.000 1.u00
ffi*iff#s******#****lt*********i***ft*t*********a************t*ffi****t********t***********
Sample Name:
Comment:
ppm EDT,
Study:
Client:
Laboratory:
Company:
Phone:
Sample Type Ftle Name Sample lD Path
Unknown MATRIXlS 06 u ; \AcatrDu r\uala\tsD t Rtgrewer\MAT_Negative
Sample Vol ISTD Amt DilFactor0.000 0.000 1.000
*******il*******************+****t******i************i********i********t****************t****************H*****************s**t********
.PP
r, \ ttl "1
+Ale\z,\
Iq/b\'./

Seq uence--MATRIX_neg. sld [Open]
Sample Name:
C^-ment:
ppm EDTA
Study:
Client:
Laboratory:
Company:
Phone:
Sample Type File Name Sample lD Path
Unknown MATRIX19 06 C : Xcalibu r\Data\EDTA\Brewer\MAT_Negative
Inst Method Proc Method CalFile Position InjVol Level Sample WtC:Xcalibur\methods\EDTA Neq Swabs 11 5.0 0.000
Sample Vol ISTD Amt DilFactor
0.000 0.000 1.000
Sample Name:
Comment:
500 ppm EDTA
Study:
Client:
Laboratory:
Gompany:
Phone:
Sample Type File Name Sample lD Path
Unknown MATRIX2O 06 C:U(cal i bur\Data\EDTA\Brewer\MAT-N egative
Inst Method Proc Method CalFile Position InjVol Level lSample Wt
C:Xcalibur\methods\EDTA Neo Swabs 11 5.0 0.000
Sample Vol ISTD Amt DilFactor
0.000 0.0u0 1.000
********************t*
*?'r l1r l:1
tL TUc/+, 'r)',/
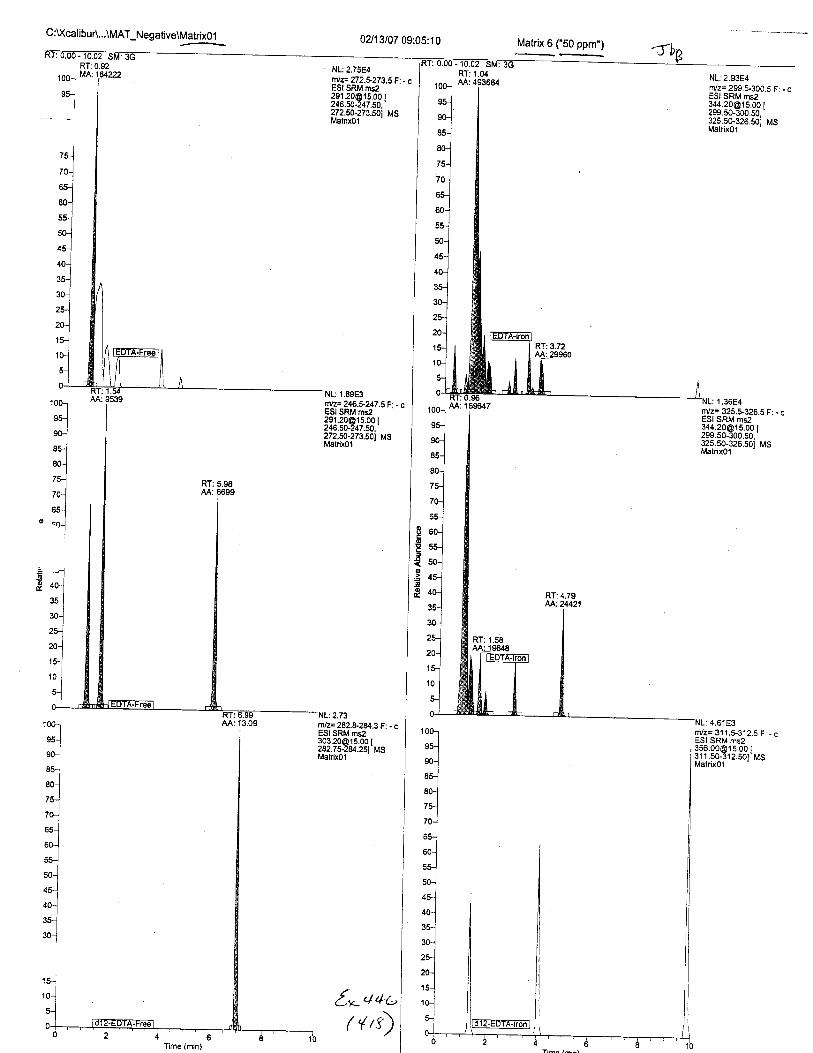
C :I(calibuA...\MAT_Negative\Matrix0 1
RT:0.92MA:
AA:9539
02113107 09:05r10 Matrix 6 ('50 ppm')
NL:2.75E4nlz= 272.5-273.5F: - cESI SRM [email protected] I246.fi-247,50.'272.50-273.50i MSMatrix0l
RT:1.04AA:493664 NL: 2.93E4
rvz= 299.5-300.5 F: - cESI SRM [email protected] I299.50-300.50.'325.s0-326.50t MSMatnx0l
RT:5.98AA:6699
I€
o.:.go
M:13.09 rnlz=282.8-2t43 F: - cESI SRM ms2
133?39#;'3't"'Matrixol
100
9
I7
70
:4.61E3m/z= 3l1.$312.5 F: . cESI SRM [email protected] l31 1.50-312.501-MsMatrix0l
Time (min)
f*++t

C :Xcali buA...\MAT_Negative!Q[i51Ql2.2 o ^'r
RT:0.92MA:164222
AA:9539
0Afi107 09:05:10
NL: 2.75E4rnlF 272.1273.5 F: - cESI SRM [email protected] t246.50-247.50.'272.50-273.s01 MsMarix0l
1001
nu-l
roJ
85J
8o-l
'5Jto-1
65--l
^.]
RT:1.00AA:6396
o
d
€0oo
rlF 282.8-2U.3 F: - cESI SRM [email protected] r282.75-2U.2g''MSMatrix0l
(4q
nVz= 311.9312.5 F: - cESI SRM [email protected] MSMalrix0l
RT:4.79M:24421
(u,')
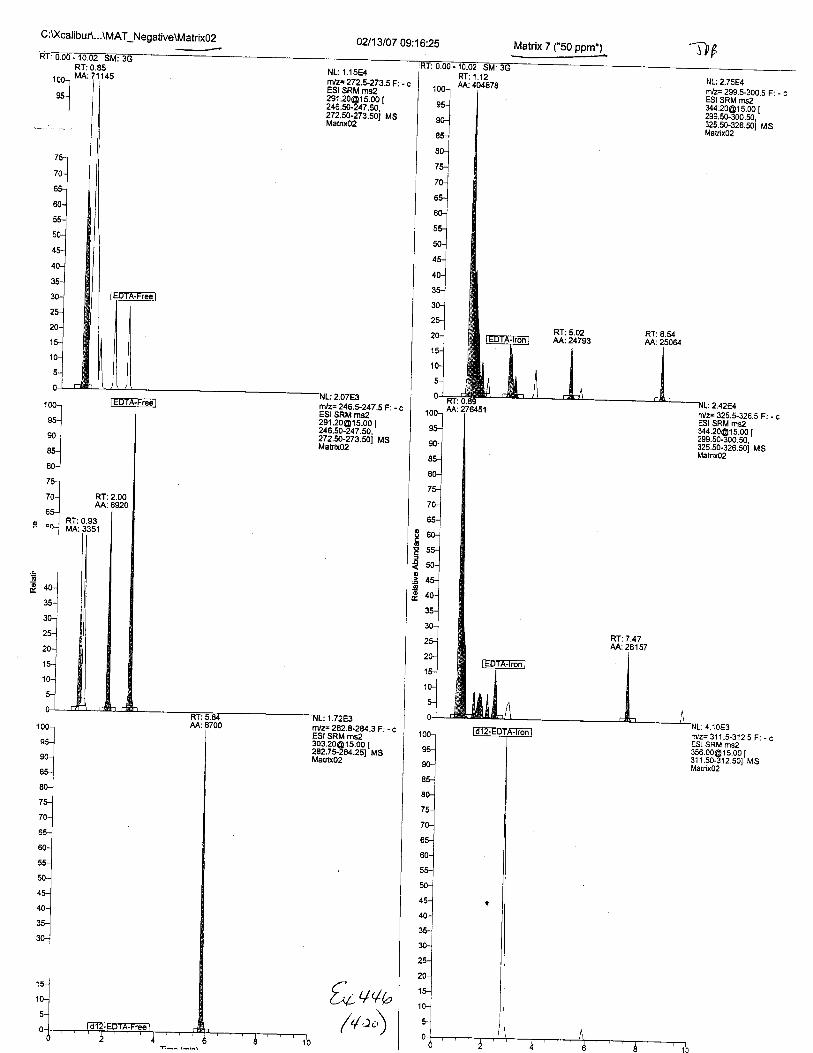
C :\)(calibuA...\MAT_Negative\Matrix02
t@r
"J
XI:MA:
n9t71145
02/13107 09:16:25 Matrix 7 ('50 ppm")
RT:5.02AA:24793
RT:1.12AA:404878
m/z= 299.$300.5 F: - cESI SRM [email protected] I299.50-300.50.'325.50-326.501 MSMatnx02
RT:8.54AA:25064
PGpI
o
o
RT: 7.47AA: 28157
4.1083trVz= 31 1.5-312.5 F: - cESI SRM [email protected] MSMatnx02
NL:2.42E4tr z= 325.t326.5 F: - cESI SRM ms2
li833gJ333r
RT:0.93
{auva
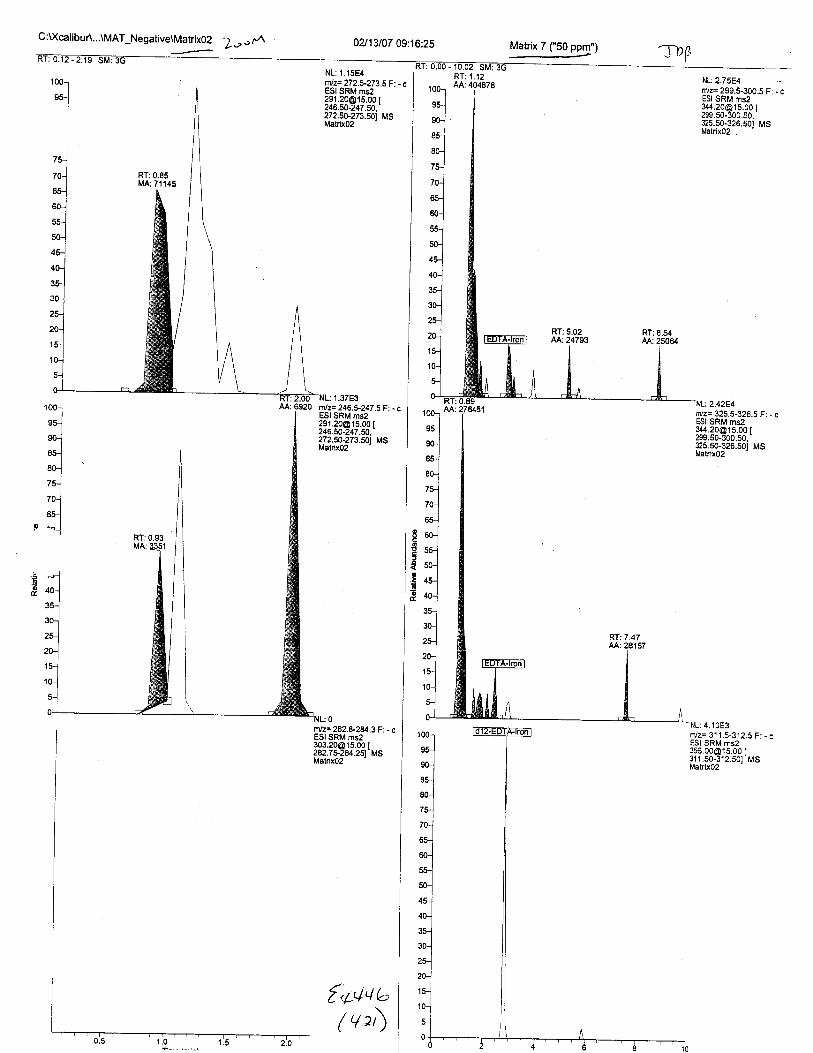
C:\Xcalibur\...\MAT_Negative\MatrixO2 Z u rA 0413107 09:16:25
RT:0.85MA: 71145
t'lz= 272.1273.5F: - cESI SRM ms2
3il33.9ii33,r272.50-273.501 MSMatrix02
f+aab(va)
RT: 1.12AA:404878
NL: 2.75E4rtz= 299.5-300.5 Fi - cESI SRM [email protected] I299.50-300.50.-tzs.so-gze.soi t,tsMatrix02
RT:5.02AA:24793
RT: 8.54AA:25064
xo
J
o
o
NL: 4.1 0E3nl/z= 31 1.5-312.5 F: - cESI SRM [email protected] [311.50-312.50t MSMatrix02

C :lKcalibur\...\MAT_Negative\Matrix03
RT:1.08MA:45079
NL:6.55E3rnlz= 272.5-273.5 F: . cESI SRM [email protected] [246.fi-247.50.272.50-273.501 MSMatix03
rnlz= 246.U247 .5 F: - cESI SRM [email protected] t246.&-247.sO.-272.s0.273.50i MSMatrixo3
02113107 09:27:20 (1,6RT: '1.11
M:yl440
RT:4.79AA:23007
M:722URT:1.08MA:
d
@
@
RT: 6.24M:5927
RT: 4.67AA:'15672
10hss-l
I
eoj^-l-'t
I
8o-J
--l,lro-J
*l^^l"r-l--lso-l
or-l
4o-lIa(J*l
301
M:70?4 NL: 4.91 E3m/z= 31 1.5.312.5 F: - cESI SRM [email protected] [311.50-312.501 MSMatrir03
NL:2.1184rTYz= 299.5-300.5 F: - cESI SRM [email protected] MSMatrix03
ttlz= 282 .8-294 .3 F i - cESI SRM [email protected] I282.7r2U.251 MSMatrixo3
{^t++t,
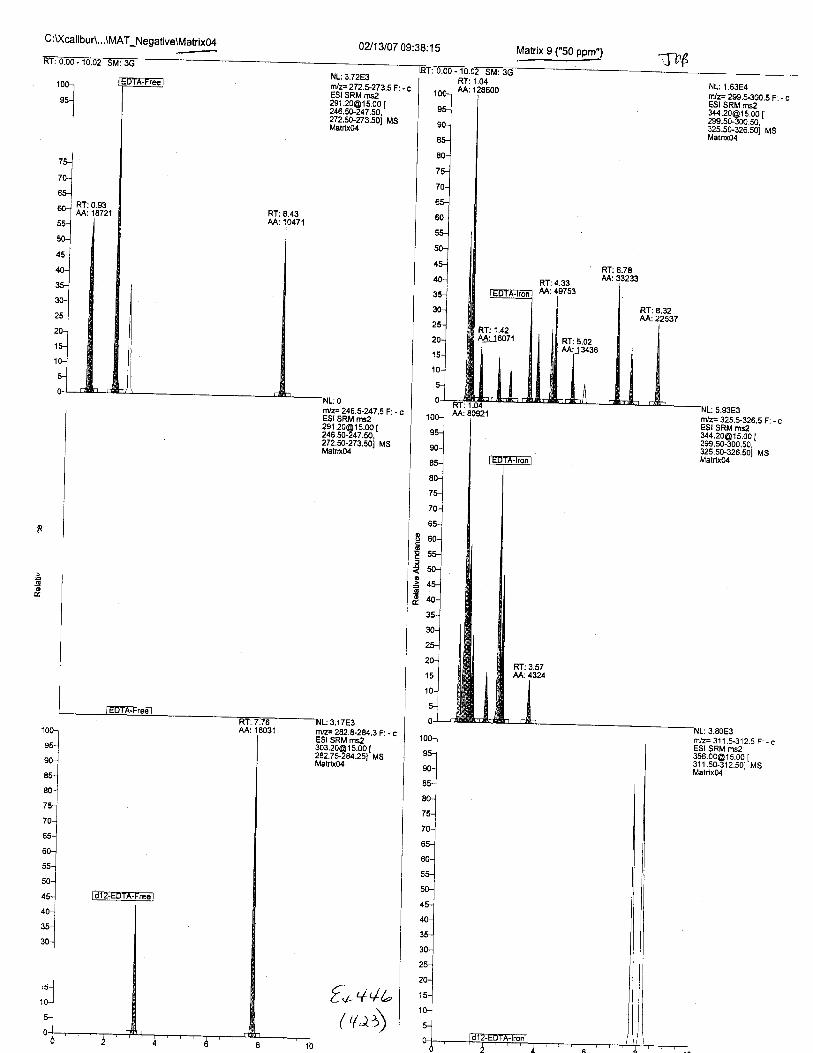
C :U(calibur\...\MAT_Negative\Matrix04
RT:0.93M:'18721
NL: 3.72E3rtlz=272.5-273.5F: - cESI SRM [email protected] I246.50-247.50.'272.s0-273.50i MSMatfix04
mlz=246.5-247.5 F: - cESI SRM [email protected] t246.50-247.50.-272.50-273.50i MSMatrix(X
02113107 09:38;15
RT:8.43AA:10471
o
@
eo
.!so
? t7tre
f '+ +41,(re)
1001
Yl
*-J^-l'l80-..1
__l'"-]
^-l"luo-1
ru-l
--tls-l
I
oo-l
J5J
^^lJu-1
g-fggr)
RT:6.78AA:33233
RT:4.33AA:49753
RT: 8.32
^d'|22537
RT:5.02AA:13436
AA:80921
PT. t E?
M:,4324

C:\Xca libur\...\MAT_Negative\Matrix05
10q
,tl
02113107 09:49:09
NL:3.45E3n/z=272.5-273.5 F:. cESI SRM ms2
lit?8.@;i.Ht272.50-273.s01 MsMatrix05
NL: 1.66E4rvz= 299.5-300.5 FESI SRM ms2
i33:38ffi3r325.50-326.501 MSMatdx0S
: 4.35E3rVz= 3'l 1.$312.5 F; - cESI SRM [email protected] I311.50-312.50t MsMatnx0S
{o4
@oo
o
_ao
:3.19E3m.tz= 282.E-284.3 F'. . cESI SRM [email protected] I282.7$284.251-MSMatdx05
( 4t*\
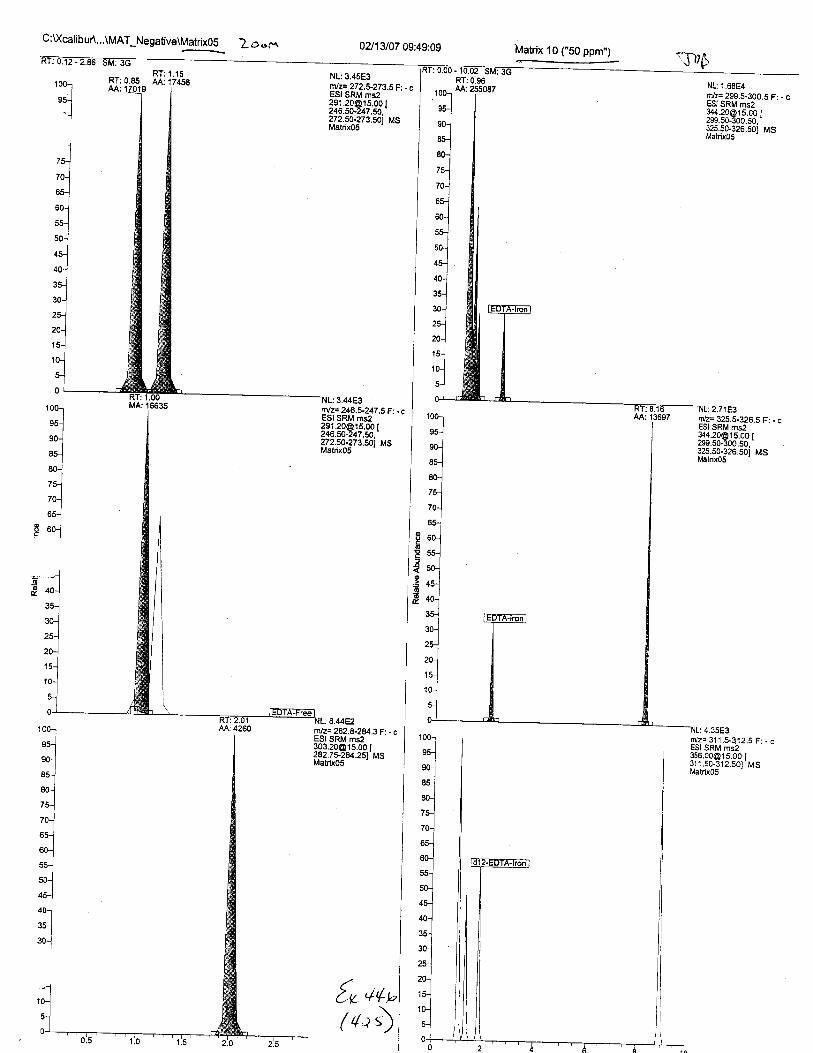
C :l(calib ur\...\MAT_Negative\Matrix05
RT:1.15RT:0.85AA:'170i
AA: 174569l
MA:16635
2ooc^ 02113107 09:49:09 'Matrix 10 ("50 ppm.) \),0
NL:3.4583rol
-l
rr'Jz= 272.5-273.5 F: . cESI SRM [email protected]
ms2!_5.99 t246.50-247.50.
272.50-273.501 MsMatnx0S
NL: 1.68E4ffz= 299.5300.5 F: - cESI SRM ms2
ti3 339J3 33 r
325.50-326.50t MsMatrix0S
10(
9l
ar
8C
75
70
9.0
2.71E3rVF 325.5-326.5 F: - cESI SRM [email protected] t sMatrixoS
ooo
Io
-qo
{e +vr,
/s, )
1{L:8.44E2nlz= 282.8-28/.3 F: - cESI SRM ms2
13!:?&_9lf39t",m/z= 3'1 1.$312.5 F: . cESI SRM [email protected] I311.50-312.501 MSMatrix05
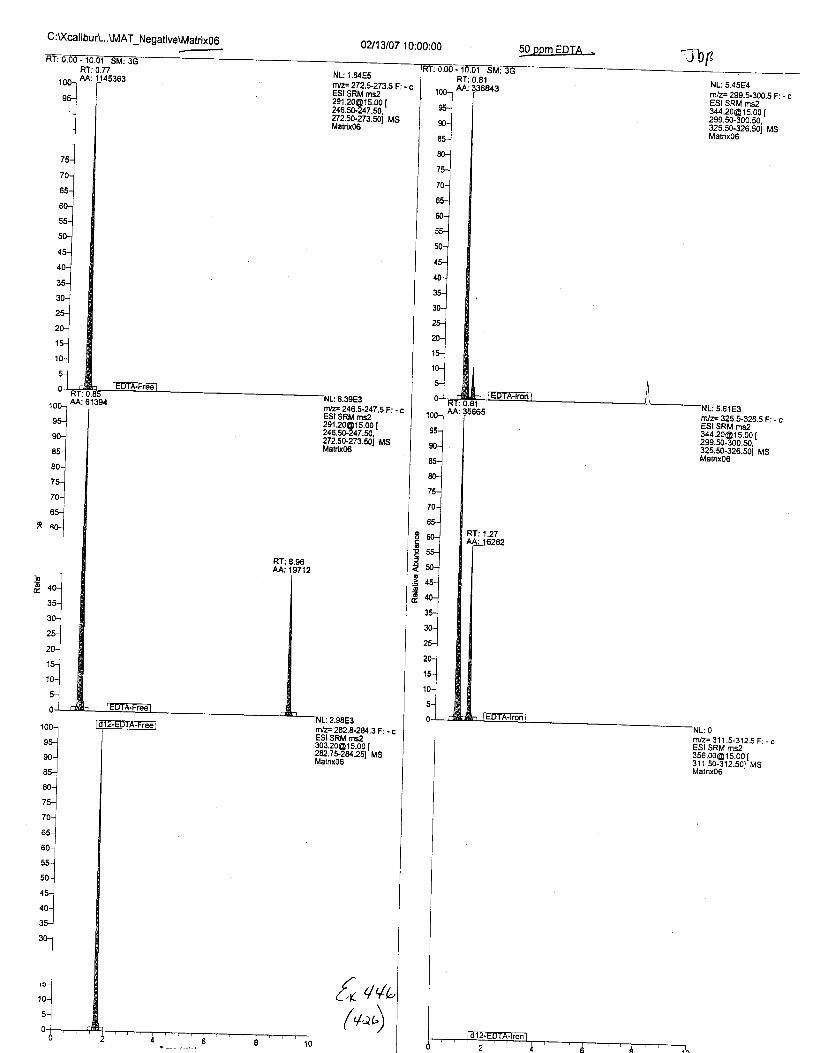
C :U(calibur\...\MAT_Negative\Matrix06
NL:5.45E4rvz= 299.5-300.5 F: . cESI SRM [email protected] |299.50-300.50.-325.50-326.50i MsMatrixo6
-NL: 6.39E3
m/z:2465247.5 F: - c
371'*;g1f H.l272.5G273.501 MsMatrix06
1001
,5-l
'oJr5-j
eo-..1
'JI
roJ
oc-lo ^^l"""-]
ESI SRM ms2
331?l_gJfi3lr",
{o qq'
t^)

C :\XcalibuA...\MAT_Negative\Matrix0702113107 10:10:S4
rnlz= 272.5-273.5 F: - cESI SRM ms2ms2
1s.00 [
50 ppm EDTA
RT:0.78AA:r00-l
q<-l*l3?l:3391i33272.50.273.sol272.50.273.501 MsMatdxoT
1 ftjlz=282.8-2A43F:-cESI SRM [email protected] [282.79284.251-MSMatix0T
rvz: 299.$300.5 F: - cESI SRM ms2
It3339J333r325.50-326.501 MSMatrixoT
rvz= 325.5-326.5 F: - cESI SRM msz
t63339J333r325.50-326.50t MSMatnxoT
miz= 3'11.5-3'12.5 F: . cESI SRM [email protected] l311.50.312.501 MSMalrix0T
ooJ
€oao
10G1
^-l'"-l--lru-J
r-ltrlto-]
*lro-l
*ls-l*l45-.{
,^lt:l"l?NJ'-t
taq( a
(*r)
NL:2.69E4rnlz= 246 .*247 .5 F : - cESI SRM ms2291.20@'15.00 |3ZtZ391iH.r272.50-273.sot MsMatrix0T6
I7
70
oo
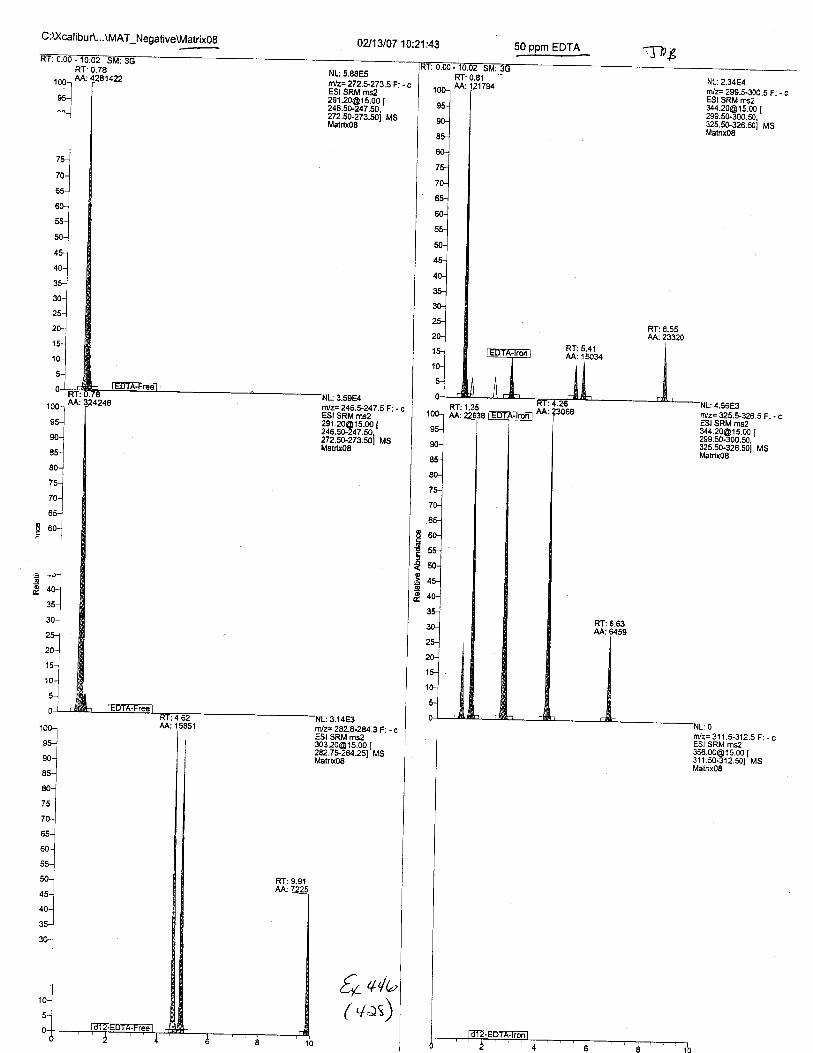
C :\Xcalib u r\...\MAT_Negative\Matrix0802113107 10:21:43 50 ppm EDTA
0.81o.78RT:
AA: NL:5.8885
29120@'t5246.50-247
ms2r5.00 I
rr/z= 272.1273.5F: - cESI SRM ms2
RT:AA: NL: 2.34E4
r/z= 299.$300.5 F: - cESI SRM ms2
!333&€J333r325.50-326.50i MSMatrix0S
r09
246.50-247.50.'272.50-273.s0t MsMatrix0S
ffilz=246.1247,5F: - cESI SRM ms2
72]6.391 :3.r272.50-273.50t MsMakixoS
6e +*.
RT:8.55AA:23320
RT:5.41M:15034
Io
f
eoao
RT: 1.35
n/z= 311.5-312.5 F; . cESI SRM [email protected] [311.50-312.501 MSMatrixoS
1+at)
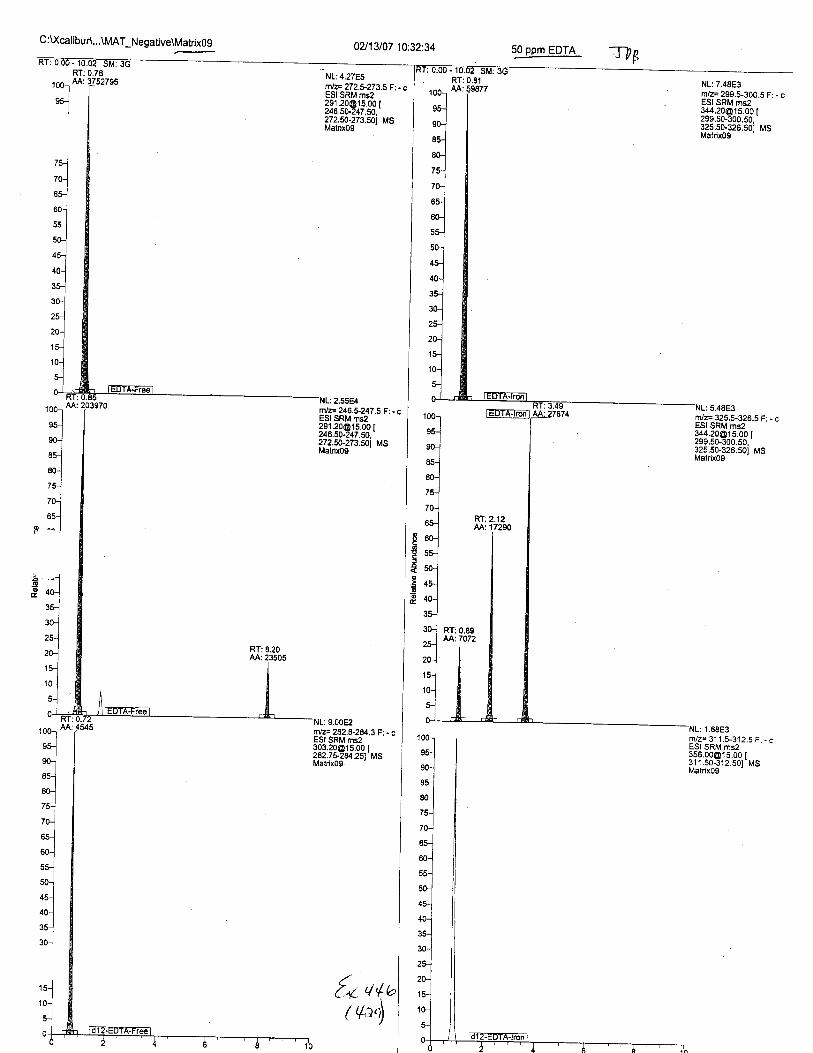
C :\j(calibuA...\MAT_Negative\Matrix090?/13107 10:32;34 50 ppm EDTA rxp
- tuRT:M:
0.78 NL:4.27E5rnlz= 272.5273.5 F:. cESI SRM [email protected] r246.s0.247.s0.'zzz.so.zzg.soi rr,rsMatrix09
NL: 7.48E3m/z= 299.5-300.5 F: - cESI SRM ms23/t4.20@15,00 t299.50-300.50,-325.50-326.501 MSMatrix09
RT:AA:
0.811001
ss-l
100
90
: 5.48E3rYz= 325.5-326.5 F:. cESI SRM [email protected] [299.50-300.50.-325.50-326.501 MSMatrixo96
80
a
RT:2.12Ai\:17290
oI6
a
.E
RT:0.89M:7072
RT:8.20AA:23505
filz= 282.6-2U.3 F:. cESI SRM [email protected] I282.75-2U.251 MS
ms21s.00 I
NL: '1.68E3
rvz= 31 1.5-3'12.5 F: - cESI SRM [email protected] [311.50-312.50t MSMatrix09

C :\lXcalibur\...\MAT_Negative\Matrix 1 0 02113107 10:43:28 50 ppm EDTA
RT:M: NL:2.64E5
nlz=272,5-273.5F: - cESI SRM [email protected] I246.50-247.50.'272.50-273.50i MSMatrix'|0
otr6
!
o.:Go
NL:4.87E3r/z= 31 1.5-312.5 F:. cESI SRM [email protected] l311.5G312.50t'MSMatrix'10
{^t Hu(+t)
1001
nl'l'lro1
7l7o-]
os]
1ocr
'"J"-J'lro-l
'-lzo-]
*-luo-1
*l*-l,u-l
40J
^-lJl.o-]
rilz= 325.5-325.5 F: - cESI SRM [email protected] t299.50.300.50.-ses.so-sze.soi l"tsMatrixl0

Matrix 1 ("500 ppm')
rol95-.{
*.]85-l
rol
;:los-]
o ^^l9",-]
1 00-^-l*le0-1
^-l--l80-l
I,R)I
70-J
^-lo"-l
^^lo"l*l*t4s-l
I
40-lI
--l^^l"u-l
fiYz= 325.$.326.5 F: - cESI SRM [email protected] I299.50-300.50,325.50-326.501 MSMatrixl l
ESI SRM [email protected] [311,50-312.501 MSMatrixl l
{*qt
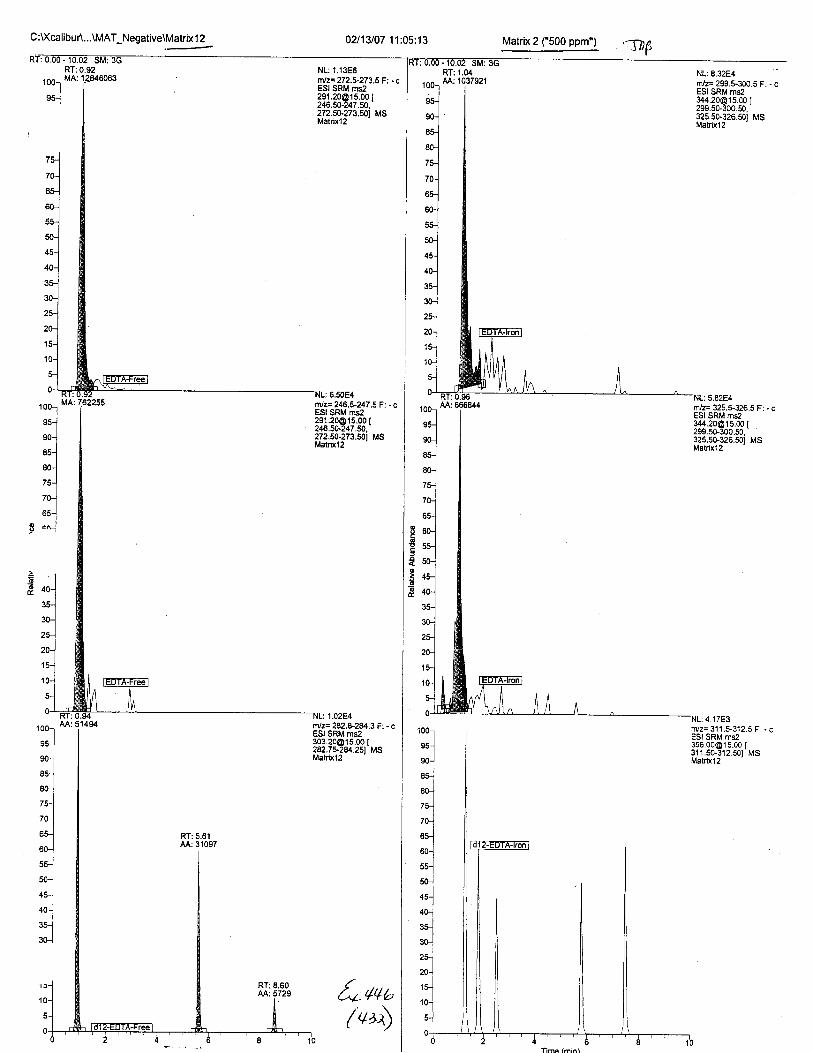
C :XcalibuA...\MAT_Negative\Matrix 1 2
1001
*l
0Z13lO7 11:05:13
'n,lz=272.*273.5F: -cESI SRM [email protected]
ms2r5.00 [
246.50-247.fi,272.50-273.50t MSMatrixl2
Matrix 2 ("500 ppm') nx(,0.1
RT:MA:
NL: 8.32E4r/z= 299.5-300.5 F: . cESI SRM [email protected] I299.50-300.50.325.50-326.501 MSMatrixl2
nl/z= 246.$.247.5 F: - cESI SRM [email protected] I246.50.247.50.272.50.273.501 MSMatdxl2
o3
€o
6
4.1 7E3nvz: 311 .t312.5 F: . cESI SRM [email protected] [3't '1.50-312.501 MSMatrix 12
fouqa

C:U(calibur\...\MAT_Negative\Matrixl 3 0?/13107 11:16:02 Matrix 3 ("500 ppm") qlp
rol
'l*-J'l1.1'l701
.'-]I ^*l
tnlz=246.5-247.5 F: - cESI SRM [email protected] [246.50-247.fi.272.s0-223.50i MsMatnxl3
fl,t'tt,
rvz= 31 1.5-312.5 F: - cESI SRM [email protected] I311.50-312.501 MSMatrixl3
rf'lz= 262.&1943 F: - cESI SRM [email protected] I282.7*28{251 MSMatrix'13
(4 3)

C :U(calibu r\...\MAT_Negative\Matrix 1 4 02J13107 11'.26:52 Matrix 4 ("500 ppm')
RT:4.25M:24620
RT:3.18AA:1E839
RT:1.15MA:2097890
RT: 1.27AA:1194082
NL:3.67E4rnlz= 299.$300.5 F: - cESI SRM [email protected] [299.50-300.50,325.50-326.50t MSMatrix'14
100r
,'-1
rnlz= 272.12735F: - cESI SRM [email protected] [246.50.247.50.272.5S273.501 MSMatrix'14
nlz= 242.8-2U3 F: - cESI SRM [email protected] I282.7r2U.251 MSMatrixl4
RT:6.78AA:27941
RT:7.7816
I
€o
.Eo
NL: 5.02E3rvz= 31 1 .t312,5 F: - cESI SRM [email protected] I311.50-312.50t MSMatrixl4
: 1.49E4
RT: '1.'15
fuqte,
RT: 4.12M:10676

C :\jXcalibur\...\MAT_Ne gative\Matrix 1 S 02/13n7 f:37:47<Jhg
NL: 4.94E4rnlz= 299.5-300.5 F: - cESI SRM [email protected] |299.50-300.50.-325.50-326.501 MSirlatnx'15
RT:6.86AA:54615
pT. ? na3562 RT: 5.10
AA: 50970
10(
80
/5
65
RT:0.93AA:138673
RT:3.84AA: 38576
RT:7.36AA:24214
Io
leo5oo
RT:6.06AA: 18141
RT:6.28AA:7102
5. q,/U
/ 4'.)
RT:2.57
Nz= 282.8-2U.3F: - cESI SRM [email protected]$2U.251 MSMatnxlS
: 1.78E3

C :Xcalibur\...\MAT_Negative\Matrix,t 6 02113107 11:48:42
RT:0.8S.rol*"rt*
'llNL:2.1286rnle 272.5-273.5 F: - cESI SRM ms2
lit?P;i#l272.50-273.501 MSMalix'16
oo
o
oo
ntz= 282.8-28(.3Fl. - cESI SRM [email protected] t282.7$284.251- MSMatrixl6
5.qru(+t)
clop- tuRT:AA:
0.89NL: 2.31 E5rvz= 299.$.300.5 F: - cESI SRM [email protected].'325.50.326.501 MSMatrixlS
: 4.38E3r/z= 325.5-326.5 F: - cESI SRM [email protected].'325.50-326.50t MsMatnxl6
RT: 1.27M:11820
RT:4,18AA:4894

C:U(calibur\...\MAT_Negative\Matrix I 7
RT:0.85AA:
100
90
NL:2.29E6trtz= 272.5-273.5 F: - cESI SRM [email protected] I246.s0. ,47.50.'272.50-273.50t MSMatrixlT
.'].lz= 246.5-247.5 F: - cESI SRM ms2
3il33g.'i33r272.50-273.501 MSMatrixlT
NL:2.5685trVz= 299.5-300.5 F:. cESI SRM [email protected] I299.50-300.50.'325.50-326,501 MsMatrix'17
m/z= 325.5-326.5 F: - cESI SRM ms2
i33339J333r325.50-326.501 MsMatnx'|7
0213107 11:59:36 500 ppm EDTA
RT:AA:
AA:29498
8
80RT: 0.86AA:38925
70
oc
oP
€@
!o
RT:1.73AA:
M:4728trVz= 31 1.5-312.5 F: . cESI SRM [email protected] I311.50-312.501 MsMalixlT
O,t4,/6io ( qtt\

C :\Xcatib u r\...\MAT_Neoative)gllx,lg_
't001
*t
AA:926981
fiilT= 272.*273.5 Ft . cESI SRM [email protected] [246.50-247.50.272.5G273.501 MSMatrixlE
.':r'z= 246.1247.5 F: - cESI SRM [email protected] [246.50-247.50.zzz.so-zzs.sol usMatflx18
mlz= 282.6284.3 F: - cESI SRM [email protected] [282.7U2U.251 MSMatrixlE
0?J13107 12:10:25 500 ppm EDTA
0.89
. tuRT:M: RT:
AA:
0.851511 NL:2.3385
rvz= 299.$300.5 F: - cESI SRM [email protected].'325.50-326.501 MSMatrixlS
oI6
J
{oEso
100
VJ
80
T'
70
ft+,+a

C:U(calibur\...\MAT_Negative\Matrix 1 9
1 00-
ar-l
RT:AA:
neE15f E
NL: 1.42E6ffilz= 272.5-273.5 F: - cESI SRM [email protected] [246.50-247.50,?72.s0-273.50t MSMalrixl9
NL: 2.82E5m2= 299.5-300.5 F: - cESI SRM [email protected] I299.50.300.50.325.50-326.50i MSMatrixl9
02113107 12:21:15 500 ppm EDTA <l-D6
RT:3.72AA:19293
o
€o
-qo
GDfFlroi-l
RT:4.56AA:6280
NL:3.99E3rr'lz= 282.A-2U3F: - cESI SRM [email protected] [282.7r2v.25t MSMatrixl9
44a
r/z= 311.5-312.5 F: - cESI SRM [email protected]'1.50-312.s01 MSMatnxl I
NL:6.55E4atz= 245.$247.5 F: - cESI SRM [email protected] I
(vtr)

C:l(calibur\...\MAT_Negative\Matrix2002113107 12:32:06
NL:1.67E6ntlr272.5-273.5F: - cESI SRM [email protected].'272.50-273.501 MSMatnx20
0.85169r
RT:AA: RT:0.96
,Qq:NL:2.18E5rnlz= 299.5-300.5 F: . cESI SRM ms2ms2
r5.00 I133339J33,1r325.50-326.50j MS
10(
ol
80
/5
70
t*r*lM'J*l8s-J
I
801
--l,t-.']
70-.i
^-l^^lou-'l
--l
'"-l*-lol40-l
^-l""1'oj
o6
o
o
trYz= 31 '1.5-312.5 F: - cESI SRM [email protected] [311.50.312.501 MSMatrir0
RT:5.38M:6106
Z^L (L4b( vuu)
7.12E3
RT: 3.11AA:'13513
RT: 8.85

Positive lonization Mode- Matrix Effect
EDTA free brood swabs- extracted then spiked to be 50 ppm EDTASampte Area of RIC ior base p""r tifo'*Ll12 33iff3:3 4ffi61154 28409525 12647507
AVERAGE . 6598351.4
Neat EDTA sotution- S0 ppmInjection Area of RIC for base peak (160 m/z)1 5578912 5505153 6155724 9453795 70773gAVERAGE
67s41g
Matrix Effect (50 ppm), % 976.9285687
Injection Area of RtC for base peak (160 m/z)1 59578792 69577583 69839274 62794875 36871037772030.8
EDTA free blood swabs- extracted then spiked to be s00 ppm EDTASample Area of RtC ior base peak (iOOrnlrl1 94101312 2$082973 180804884 229021365 1ilfl570AVERAGE
$169724.4
Neat EDTA sotution- 500 ppm
AVERAGE
Matrix Effect (500 ppm), % 233.7062843
{* +qa r,( u l.,ravF&,a,\

NEGATIVE lonization Mode- Matrix Effect
EDTA free blood swabs- extracted then spiked to be s0 ppm EDTASample Sum of Areas of free EDTA peaks (mtz 273 + 247)1 1706182 744963 791434 $7215 17019AVERAGE B7g4s
Neat EDTA sotution- S0 ppmInjection Sum of Areas of free
1
2
345
AVERAGE
Matrix Effect (50 ppm), %
EDTA free blood swabs- extracted then spiked to be s00 ppm EDTASample Sum of Areas of free EOTA peaks (mlz 273 + 247)1 109622622 p6083183 5697374 21477275 2144609AVERAGE
5766530.6
Neat EDTA solution- 500 ppmInjection
I
2
345
AVERAGE
Matrix Effect (500 ppm), %
EDTA peaks (mtz273 + 247)120675717906604605670395676529014832892267
3.040694376
Sum of Areas of free EDTA peaks (mlz2|3 + 247)147852671 889339216049375168318071 7809391
16873846.4
34.1743694
f* qqn( vva)
zlllt't1-pp
SPOT STZE L.O.D.
6 uuo(v+a)
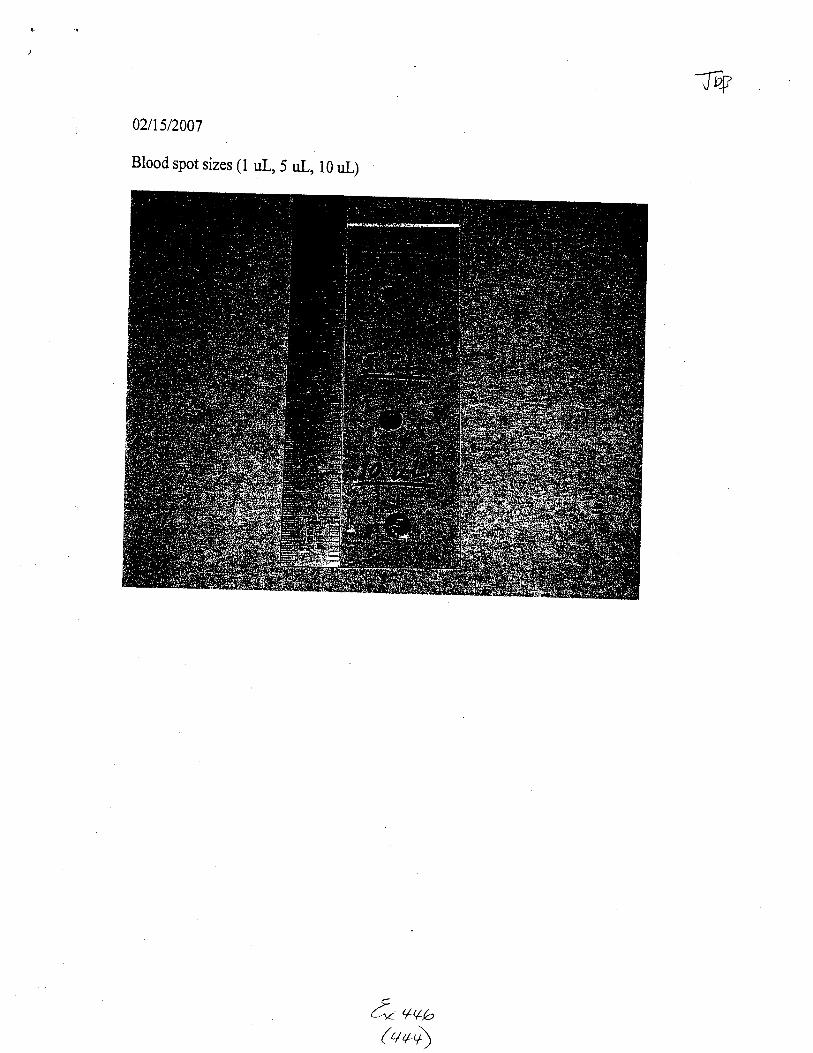
lw02tr5t2007
Blood spot sizes (l uL, 5 uL, 10 uL)
f* +vb&+v)
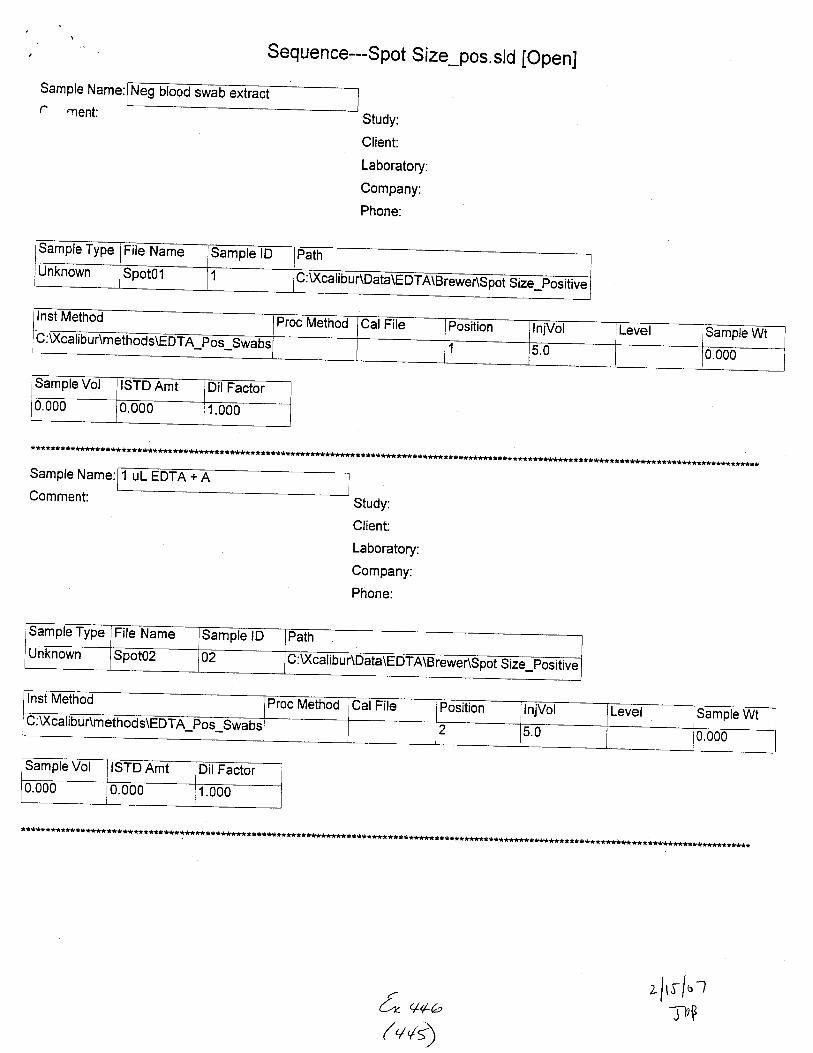
Sequence--Spot Size_pos.sfd [OpenJ
Study:
Client:
Laboratory:
Company:
Phone:
Sample Type File Name sample lD Path %Unknown :Spom-
I
1
C : U(ca li b u r\m -I odslEDil-F o s
Sample Vol ISTD Amt DilFactor0.000 0.000 1.000
*****t*******t*t**********t**********
Sample Name:
Comment:
t*******************t****t**l*************t*****************************t**********rr
Study:
Client:
Laboratory:
Company:
Phone:
1uL +A
lnst Method Proc Method CalFile Position InjVol'\Xnelihr r TA_Pos_Swa 2 5.0 j0.000
I
Sample Vol ISTD Amt DilFactor0.000 0.000 1.000
****l********************t**t**************t************************************t**********************************itr
& uo,z/rr/"r
Tl?P(vv;)

Sample Name:
C 'nent:
Seq uence--Spot Size_pos. sld [Open]
Study:
Client:
Laboratory:
Company:
Phone:
:Xcalibur\D@
Sample Vol ISTD Amt DilFactor0.000 0.000 1.000
*********************************t************************************i*******t*************************i*********r********r******i*****f*****
Sample Name:1t-lComment:
-
Study:
Ctient:
Laboratory:
Company:
phone:
Sample Vol ISTD Amt DilFactor0.000 0.000 1.000
**t***************************************************s****************t*******************************i*****i*tr**********************tr*****
f, urc( v+)
>ltr ["rttr{]
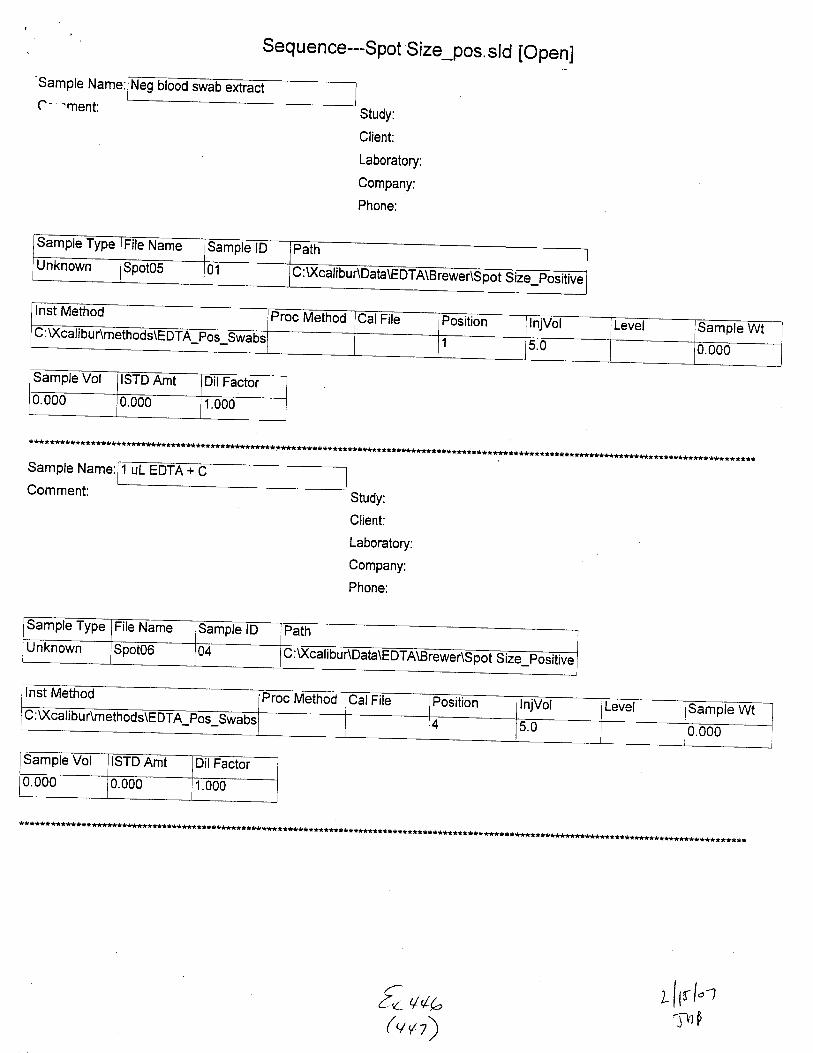
Sample Name:
C- -menf
Sequence--Spot Size_pos. sld [Open]
Study:
Client:
Laboratory:
Company:
Phone:
lnst Method Proc Method CalFile Position InjVol
53-Level Sample WttEUtuus\EU lA_f,os_Swabs 1 0.000
***********************************************************t***t***************************t*****************t***************f***************
Sample Name:
Comment:Study:
Client:
Laboratory:
Company:
Phone:
Sample TypG File Name Sample lD Path:Unknown Spot06 04 u. u\cat I our\uata\ts D I A\Brewer\s pot s ize_positive
lnst Method Proc Method CalFile Position lnjVol Level Sample Wt\Xcalihr rr\rnath;;.\trnr^4 5.0 0.000
sample Vol ISTD Amt Dil Factor0.000 0.000 1.000
*******t***********i******ft****H*t*****************************************************t*****************tr***********r*********i************
foq&kvt)
lgl"ts,)p

Sample Name:
C--.rnent:
Seq uence--Spot Size_pos. sld [Open]
Study:
Client:
Laboratory:
Company:
Phone:
A\Brewer\Spot Size_posi
Sample Vol ISTD Amt DilFactor0.000 0.000 1.000
Comment:Study:
Client:
Laboratory:
Company:
Phone:
uL +A
Inst Method Proc Method CalFile Position hJVol Level ple'J(caiiburimeiffic 5.0
Sample Vol ISTD Amt ]Dit Factor
u.000 0.000 1.000
t********t********t*****t***************t**t******************************r*********e*s*
o4-(v
4k-,q4
zlr l'tT]1P

Sample Name:
C^-.ment:
Sequence--Spot Size_pos.sld [Open]
blood swab extract
Study:
Client:
Laboratory:
Company:
Phone:
C:U(calibur\De
Sample Vol ISTD Amt Dil Factor
0.000 0.000 1.000
*******************i********************t*******i***t*************************************s******t*************************it************t*
Sample Name:
Comment:
5ULEDTA+B
Study:
Client:
Laboratory:
Company:
Phone:
Sample Vol ISTD Amt Dil Factor
0.000 0.000 1.000
f" uu"(u+r)
zls l,t5vp

Sample Name:
? rtent:
Sequence---Spot Size_pos. sld [Open]
Neg blood swab extract
Study:
Client:
Laboratory:
Company:
Phone:
Sample Type File Name Sample lD Path
Unknown Spot11 01 C :U(cal ibu r\OataE Otn@
lnst Method Proc Method Cal File Position InjVol Level Sample WtC :U(cali bur\metho0G\EDTn pos5vabs
1 5.0 0.000
Sample Vol ISTD Amt Dil Factor
0.000 0.000 1.000
Sample Name:
Comment:
5 uL EDTA +
Study:
Client:
Laboratory:
Company:
Phone:
Sample Type File Name Samole lD Path
Unknown Spot12 07 C: \)(cal i bur\Data\E DTA\eretedS pof S ite positive
Inst Method Proc Method Cal File Position InjVol Level Wt7 5.0 0.000
Sample Vol ISTD Amt DilFactor
0.000 10.000
1.000
CC'/ 4fu(+s")
zlrrl"'tg)p
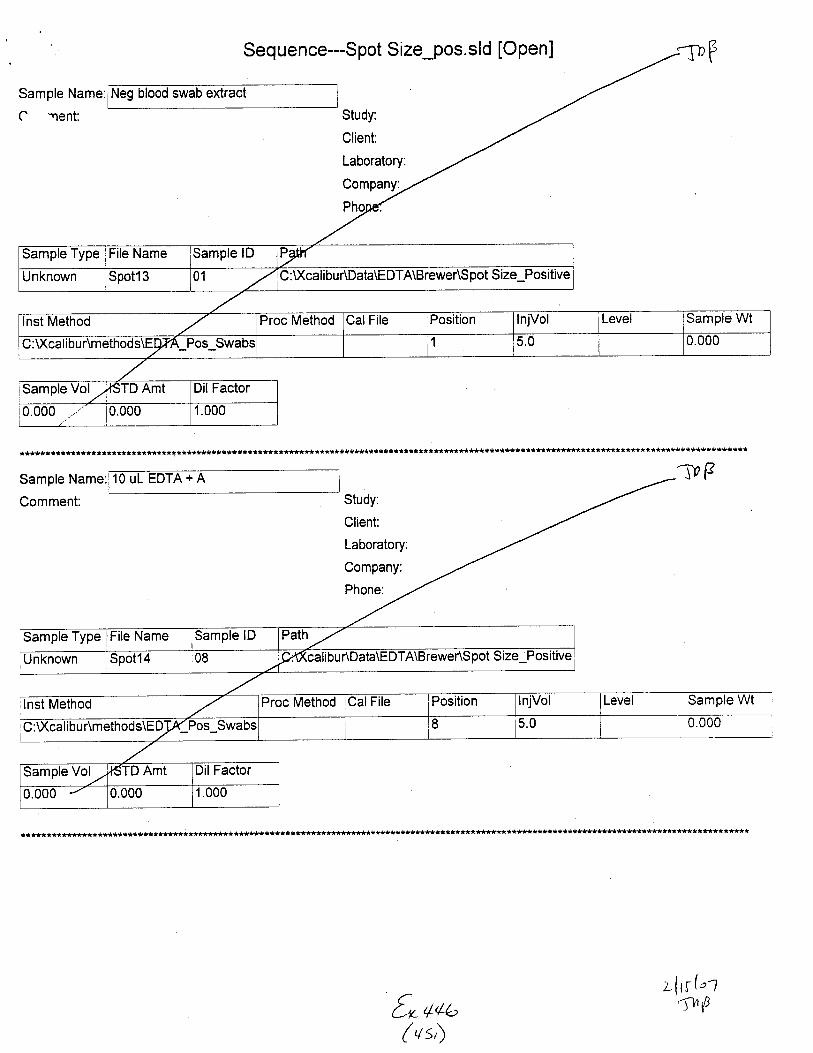
Sequence--Spot Size_pos.sld [Open]
Neg blood swab extract
Study:
Client:
Laboratory:
Company:
*******t****************f ****t*********i************ ****t*************l
TPFSample N
Comment:
10 uL EDTA + A
Study:
Client:
Laboratory:
Company:
Phone:
lSample Wt
8" +tt'zlrr("1
5W)
( vs)

Sequence---Spot Size_pos.sld [Open]
Sample Name:
C- 'nent:
blood swab extract
Study:
Client:
Laboratory:
Company:
Phone:
Sample Name:
Comment:
1O uL EDTA +T0flStudy:
Client:
Laboratory:
Company:
Phone:
***************t****t** *******t********************************t*i*********
LL q4b(v:4
>hr l"t./tp

Sequence--Spot Size-pos.sld [Open]
Neg blood swab extract
*****l**l*************t*****************
Sample Name: 1O uL EDTA + C
Study:
Client:
Laboratory:
Company:
Phone:
**i*i***a*****************t*************i************t***********f*s*****i*****
$FComment:
*******tt**************************************t*******
Study:
Client:
Laboratory:
Company:
Phone:
t* ++ai\t' 4S) \'/
nana O
> ls 1"1
1p
I Sample Wt

Sample Name:
C-'-nent:
Sequence--Spot Size-pos. sld [Open]
swab extract
Study:
Client:
Laboratory:
Company:
Phone:
**t*********a******i****t***i*it**********t*********************t****************************
*. 51''? f@
54-rots €2;24€^/ cG' &€TL 9," L wil ,
u"rttt€ fttCd^4zer-/ ot1eczeV .
(/Nctr { ^C
lhr
t* qon( v'4
vlrrl't5'rP
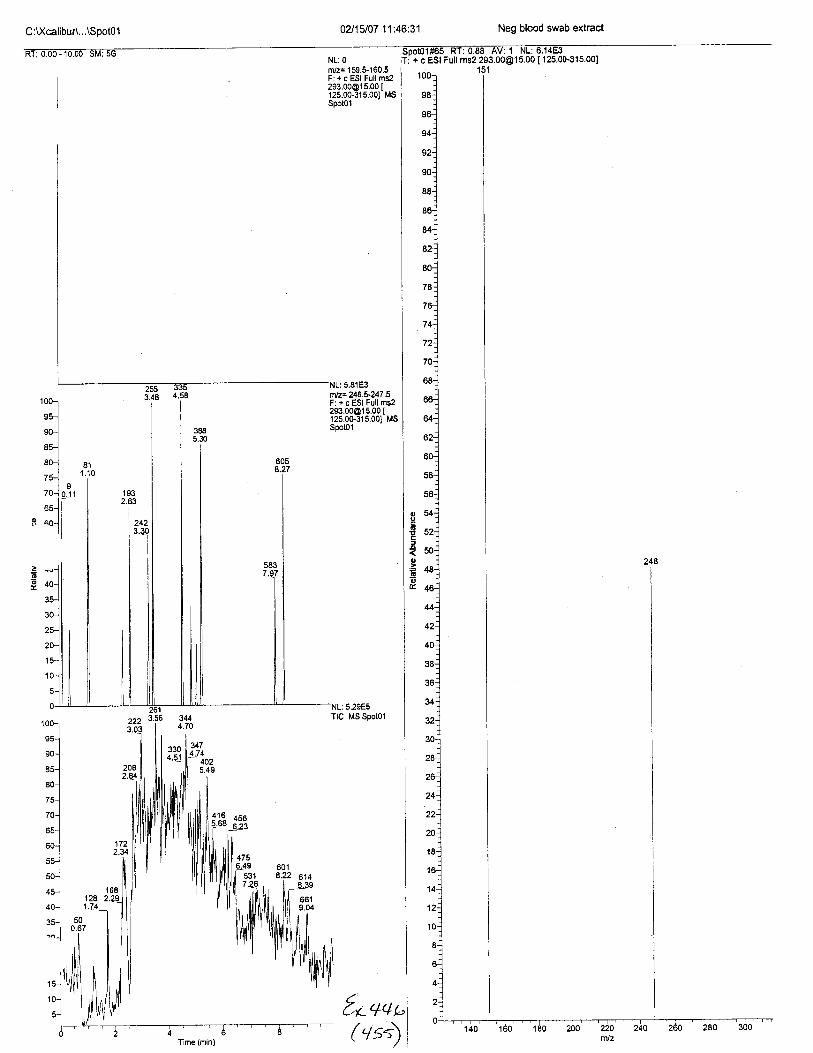
C:l(calibur\...\Soot0 1 0A15107 1'l:46:31
nvz= 159.$160.5F: + c ESI Full [email protected] [125.00-315.001 MSSpotol
293.00@1 5.00 [ 1 25.00€1 5.00]151
ms2Full
nlz-246.sl47.5F: + c ESI Full [email protected] I125.00-315.001 MSSpotol
t+-+a('/t)
Neg blood swab extract
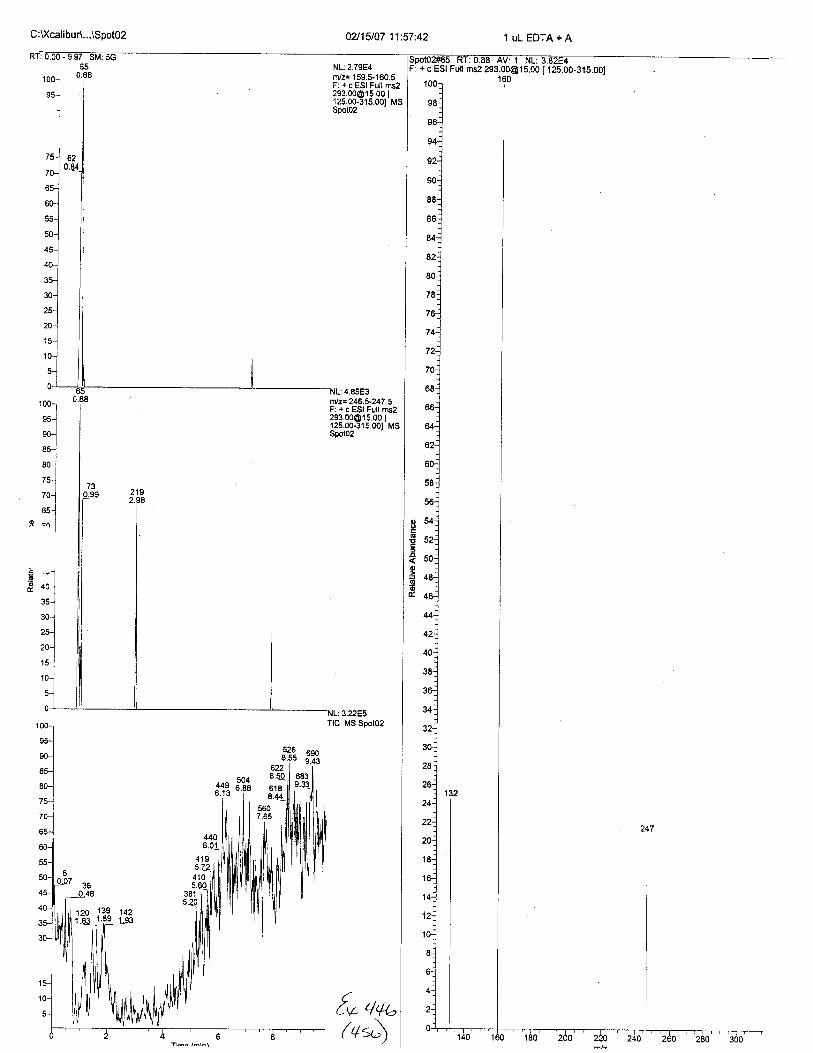
0?i15107 11i57'.42
NL:2.79E4nvz= '159.5-'160.5F: + c ESI Full [email protected] I125.00-315.001 MSSpot02
f* qqo
ftl
+ c ESI Full ms2 [email protected] [125.00-315.001

C:U(calibur\...\SpotO3 02115107 12:08:34
NL: O
r/z= 159.$.160.5F: + c ESI Full [email protected] [125.00-31s.001 MsSpoto3
'r],lz= 246.$247.5F:+cESl [email protected] [125.00-315.001 MSSpol03
4.08E3
: z.o/ EcTIC MS Spoto3
: (t{5
oo
aoo
-go
6:
8C
/a
7C
140,q
1201.63
619EJ6
71
3755.12
(+s)
Neg blood swab extract
+ c ESI Full ms2 [email protected] [ 125.00-315.001

02115107 12:19:30
NL:2.37E4rru2= 159.$150.5F: + c ESI Full [email protected] I125.00-315.001 MSSpot04
rnlz= 246.5-247 .5F: + c ESI Full [email protected] [125.00-315.001 MSSpot04
f^r 4ao
1001
nu-1
*lru-l
ro-J
75-1I
70-l--l--l
o ^^ll, "r-l
s97I ta
r b3b
( ts*)
+ c ESI Full ms2 293,[email protected] [ 12s.00-315.00]

C:U(calibuA...\SpotO5 02115107 12:30:35
NL: 2.93E5TIC MS Spotos
&-,tq,.(qs>
Neg blood swab extract
I c ESI Full ms2 [email protected] [12s.00-315.001
oo6ooo6E
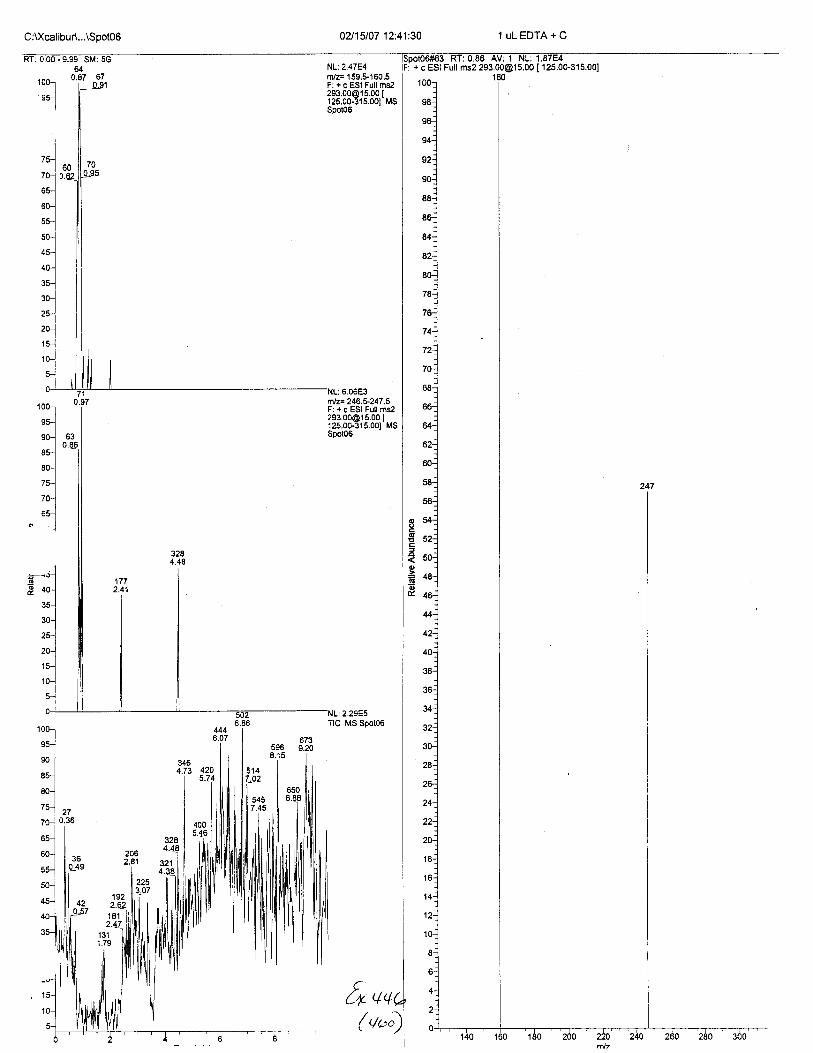
C:U(calibuA...\Sooto6
1001
^-l"lonl::l"lro-]
'l'-t-:l
2.81II
| 225fadT
fo uu
+ c ESI Full ms2 [email protected] [ 125.00-315.001
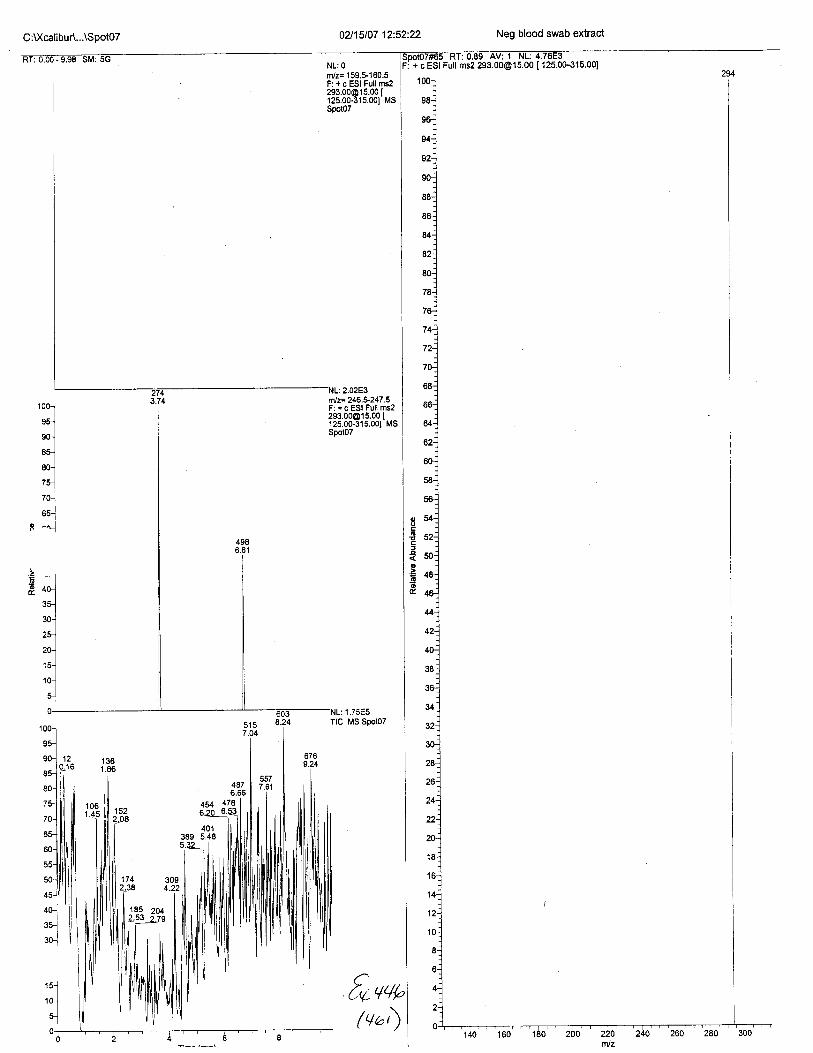
C:U(calibur\...\Spot07 02115107 12:52:22
:2.02EJ
1001
*l90-l
.J*lro-]
tr-]
70-1
cr-.1--lI ^"-l
rnlz= 246.*247 .5F: + c ESI Full [email protected] [125.00-3'l5.0ol MsSpotoT
oo6
o.26o
1.75E5MS Spoto7Tta
e
NL: O
rn/z= 159.$'160.5F: + c ESI Full [email protected] [125.00-315.001 MSSpot07
k)
Neg blood swab extract
ot07#65 RT:0.89 AV: 1 NL:4.76E3+ c ESI Full ms2 [email protected] [ 125.00-315.00]
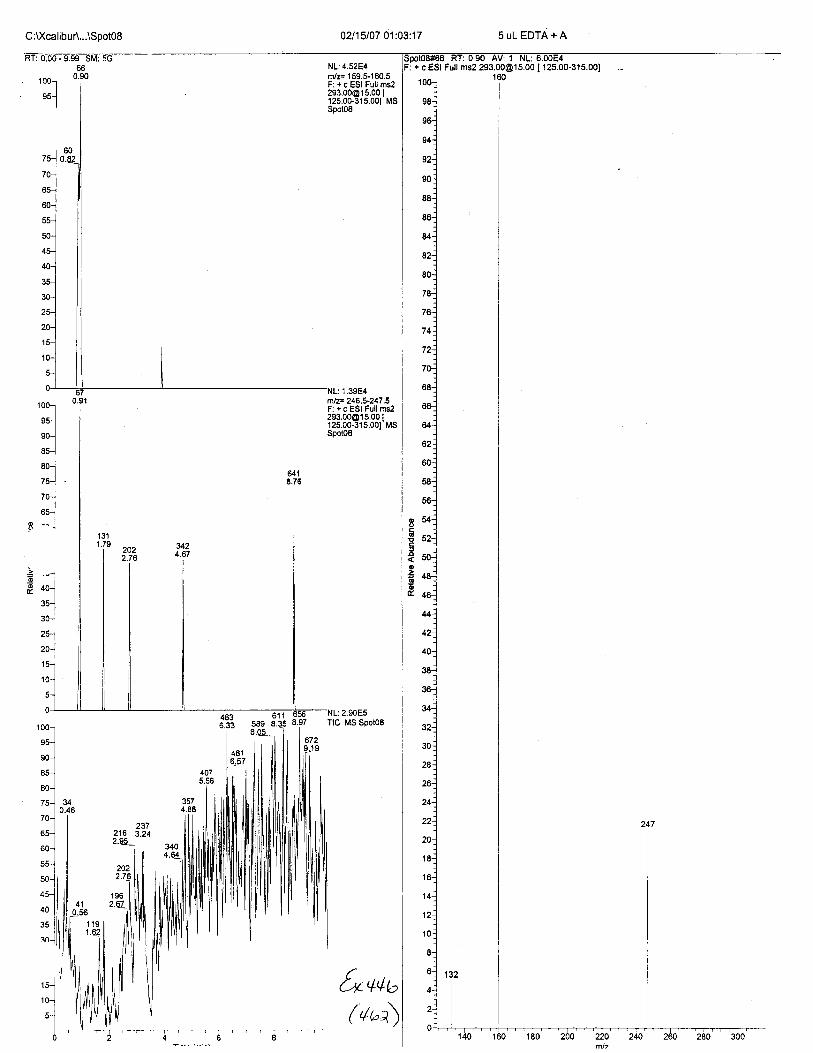
C:\)(calibuA...\Soot08 02115107 01:03:17
'100-l
^_l'"-l
NL: 4.5?E4n/z= 159.t160.5F: + c ESI Full [email protected] [125.00-315.001 MSSpot08
1.39E4
,::*lro-l
*tro-l
'l.-l6s-i
o --I
n/z= 246.5-247.5F: + c ESI Full [email protected] [125.00-315.001 MSSpot08
2373.24
656--NL:2.90Es8.97 TIC MS Sool08
&++,
2162.95
( +ua)
: + c ESI Full ms2 [email protected] [ 125.00-315.00]

C :Xcalibur\...\Spot09 02115107 01:14:09
NL:0rn/z= 159.$160.5F: + c ESI Full [email protected] [125.00-31s.001 MsSpoto9
6.45E3rnlz= 246.5-247 .5F: + c ESI Full [email protected] ['125,00-315.001 MSSpot09
TIC MS SpotO9
&ova(+,"t)
Neg blood swab extract
+ c ESI Full!ns2 [email protected] [ 125.00-315.00]
oooE:oooE
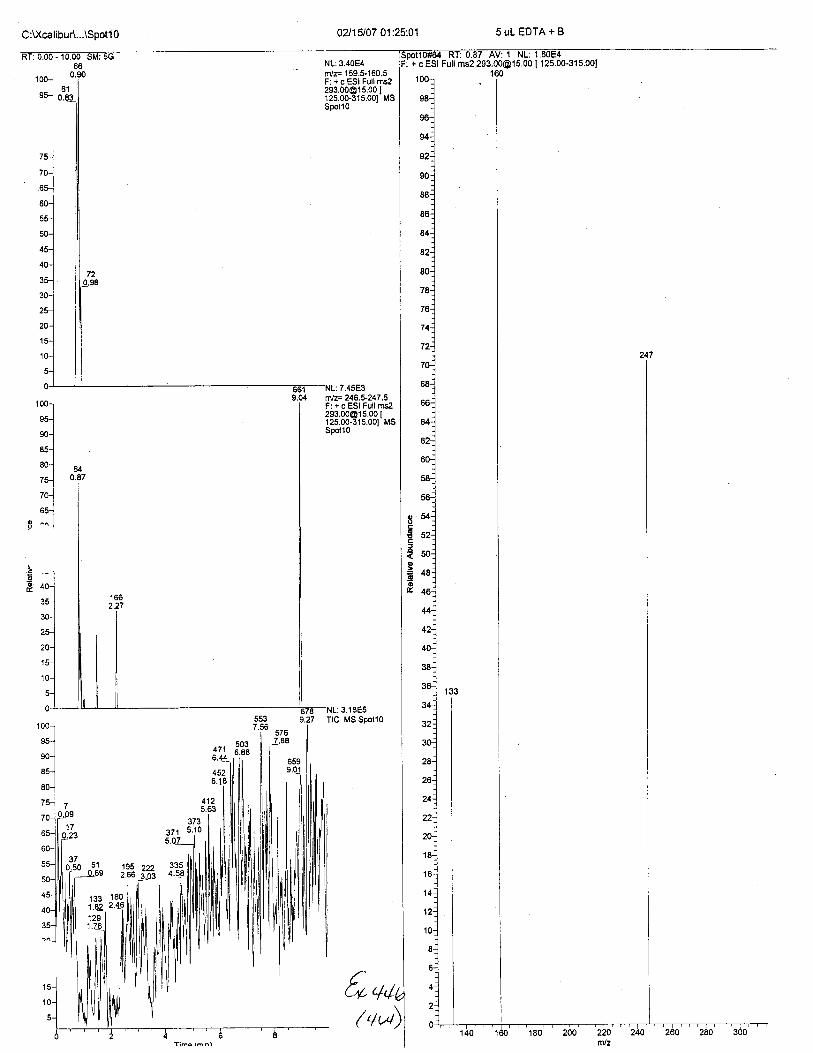
02115107 01 :25:01
NL:3.40E4nvz= 159.S160.5F: + c ESI Full [email protected] [125.00-315.001 MSSpot10
{*,/u(+u)
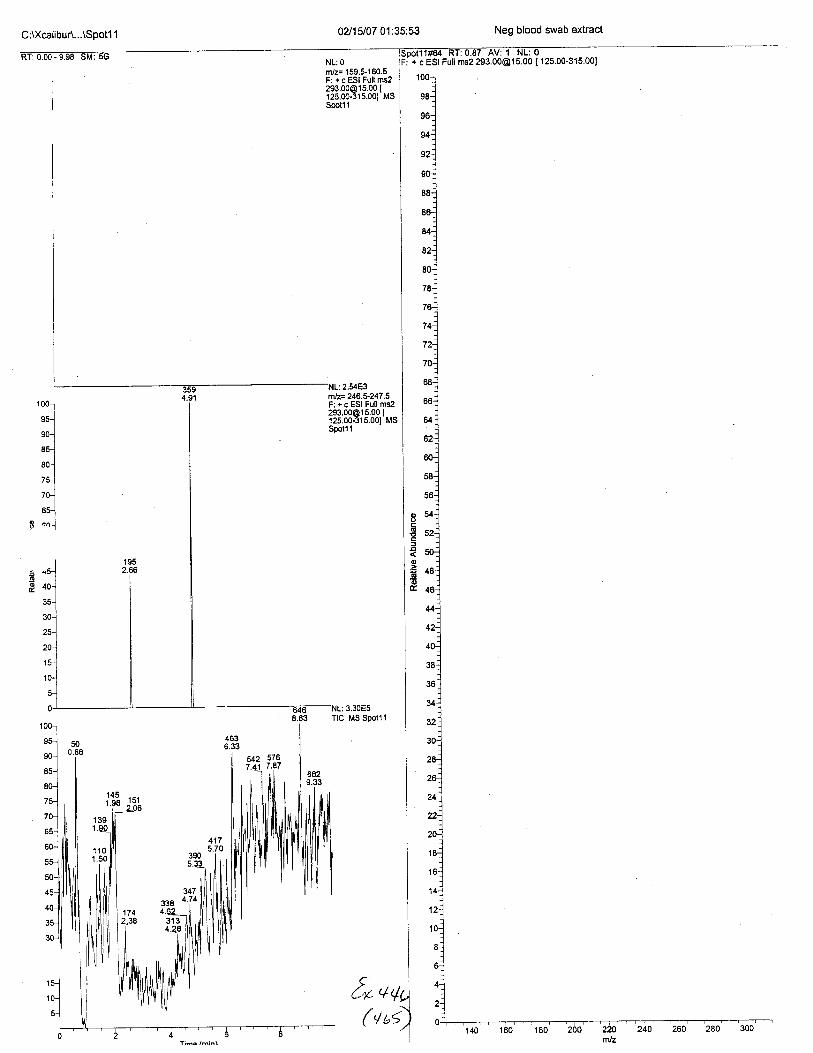
C:XcalibuA...\Spot1 1 02115107 01:35:53
NL:0n/z= 159.5-160.5F: + c ESI Full ms2
?!3:339i33&t*Spotl1
2.54E3
1 00-l
oo-l*l*-l--l
ro-.1I
/5-lI'l*l
o ^^l
nlz= 246.5-247.5F: + c ESI Full [email protected] I125.00-315.001 MsSpotl 1
f*u(,/ b<
Neg blood swab extract
i + c ESI Full ms2 [email protected] [ 125.00-315.001
ooo€oooEt
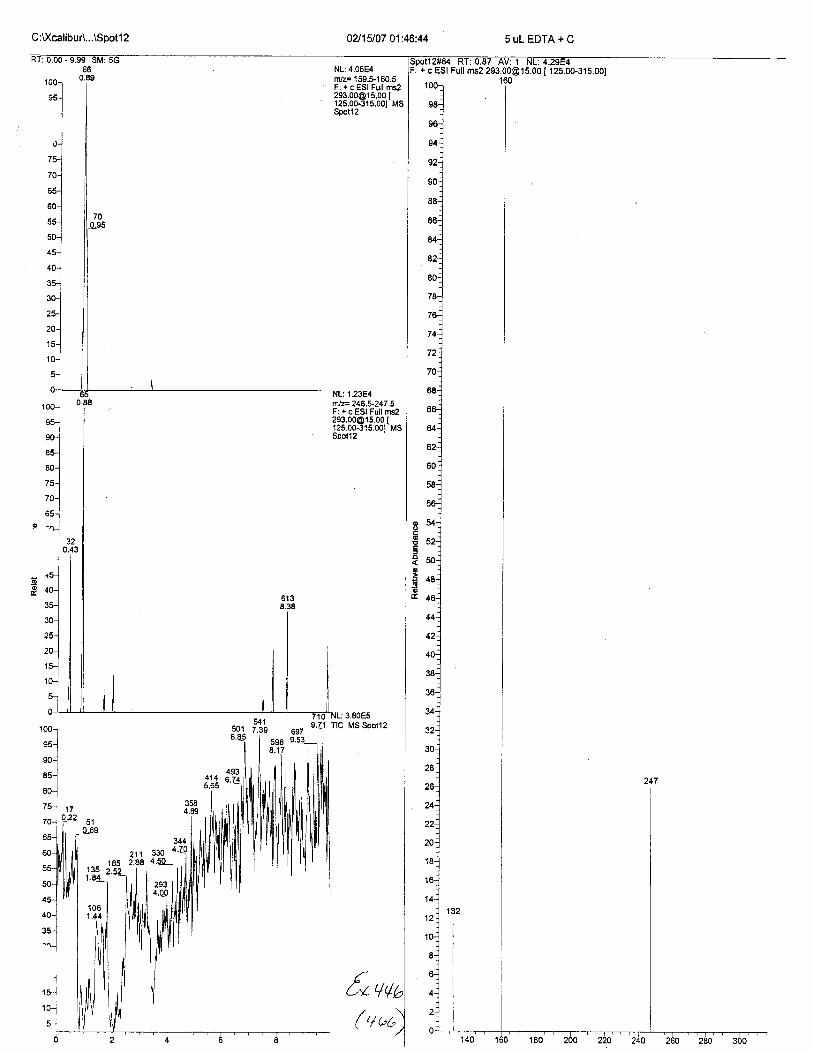
C:U(calibuA...\Spotl 2 02115107 01:46:44
':l*.]l
nVz= 159.$160.5F: + c 951 Pr1; *.,[email protected] [125.00-315.001 MSSpotl2
nlz= 246.5-247.5F: + c ESI Fult [email protected] [12s.00-315.001 MsSpot12
1.23E4
MS Spol12
66
o
o
f* q(,
4936.L4
3304.5C
2't 1
2.88
( qoo
5ULEDTA+C
+ c ESI Full ms2 [email protected] [ 125.00-315.00]

:
Sample Name:t -nent:
Seq uence---CT_Spot_neg. sld [O pen]
ive Blood extract
Study:
Client:
Laboratory:
Company:
Phone:
Sample Type File Name Sample lD Path
Unknown cTo1 1 U(calibu AData\EDTA\Brewer\CT_N egative
Inst Method Proc Method CalFile Position lnjVol Level Sample Wtu : \xca | | bur\methods\EDTA_Neg_swabs 11 5.0 0.000
Vol ISTD Amt Dil Factor
0.000 0.000 1.000
Sample Name: t-_Comment Study:
Client:
Laboratory:
Company:
Phone:
sample Iype File Name Samole lD Path
Unknown cT02 01 C: U(cal ibu AData\EDTA\BreweACT_N egative
nst Method Proc Method Cal File Position InjVol mple WtC : U(cal i b u r\methods\EDTA_N eg_Swabs I 5.0 0.000
Samole Vol ISTD Amt Dil Factor
0.000 0.000 1.000
*********************t************
/QY
,\tt t'"fo uno(+'t)

Sample Name:
" .nent:
Sequence---CT_Spot_neg. sld [Open]
Negative Blood extract
Study:
Client:
Laboratory:
Company:
Phone:
Sample Type File Name Sample lD Path
Unknown cTo3 11 C:Xcalibu AData\EDTA\Brewer\CT_Negative
Inst Method Proc Method CalFile Position lnjVol Level Samole WtC :\)(calibu r\method s\E DTA_N eg_Swabs 11 5.0 u.u00
Sample Vol STD Amt DilFactor
0.000 0.000 1.000
*i*i*t****t*********t****ff **********
Sample Name:
Comment:
Negative Blood extract
Study:
Client:
Laboratory:
Company:
Phone:
Sample Type File Name Sample lD Path
Unknown cT04 11 C :Xcali bu r\Data\E DTA\Brewer\CT_Negative
Inst Method Proc Method Cal File jPosition InjVol Level lSample Wt
C:Xcalibur\methods\EDTA Neo Swabs 11 5.010.000
Sample Vol ISTD Amt Dil Factor
0.000 U.UUU I.UUU
-tbs
r,\rj\"t+qb
I!:?
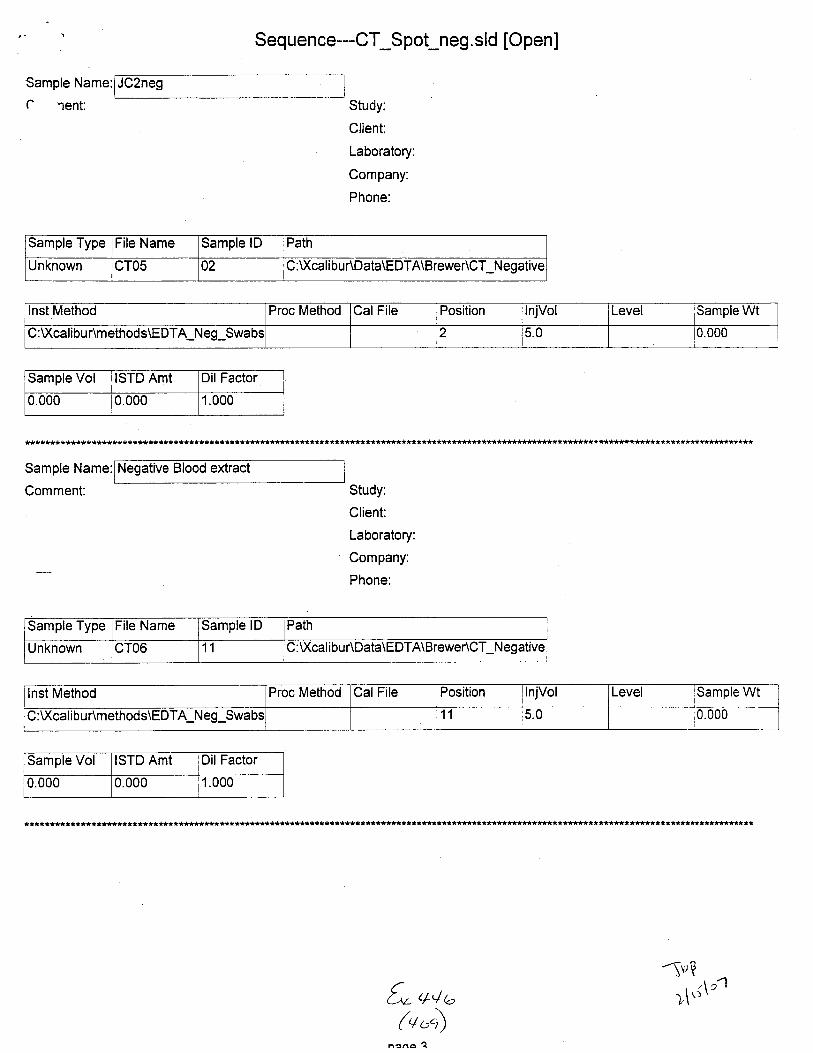
Sample Name:
c rent:
Seq uence---CT_Spot_neg. sld [Open]
JC2neg
Study:
Client:
Laboratory:
Company:
Phone:
Sample Type File Narne Sample lD Path
Unknown cT05 02 C : Xcali bu r\Data\EDTA\Brewer\CT_Negative
lnst Method Proc Method CalFile Position InjVol Level Sample Wt
C :U(ca libu r\method s\E DTA_N eg_Swabs 2 5.u 0.000
Sample Vol ISTD Amt Dil Factor
0.00u O.UUO 1.000
t*t*********t*****************t**********************************t*****r********i**t**
Sample Name:
Comment:
extract
Study:
Client:
Laboratory:
Company:
Phone:
Sample Type File Name Samole lD Path
UNKNOWN cT06 11 lC:U(calibur\Data\EDTA\Brewer\CT_Negative
lnst Method Proc Method Cal File Position InjVol Level tSamole Wt
C :Xcal ibu r\methods\EDTA_N eg_Swabs 11 i5.0 0.000
sampre vol ISTD Amt Dil Factor
0.000 0.000 1.000
{* uq,(+")
nana ?
-1vP
1\..(\'1

Sample Name:
C rent:
Seq uence---CT_Spot_neg. sld [Open]
Blood extract
Study:
Client:
Laboratory:
Company:
Phone:
Sample Type File Narne Sample lD Path
Unknown cTo7 11 C:U(calibuAData\EDTA\Brewer\CT tteoative
Inst Method Proc Method CalFile Position llnjVol Level Samole Wt:Xcal i bu r\methods\E DTA_Neg_Swabs 4atl 5.0 0.000
Sample Vol ISTD Amt Dil Factor
0.000 0.000 1.000
Sample Name: JC3neg
Comment: Study:
Client:
Laboratory:
Company:
Phone:
Sample Type File Name Sample lD Path
Unknown iCT08 03 C : \Xcalibu r\Data\E DTA\Brewer\CT_N egative
nst Method Proc Method Cal File Position llnjVol Level ;Sample Wtv. \/\sailour\melnoos\tr u I A_Neg_ ? 5.0 0.000
mple Vol ISTD Amt Dil Factor
0.000 0.000 1.U00
€o q,/ b(,/%)
n^da l
Rq
1lt(\"1

Sample Name:
C rent:
Seq uence---CT_Spot_neg. sld [Open]
extract
Study:
Client:
Laboratory:
Company:
Phone:
Sample Type File Narne Samole lD Path
Unknown cT13 11 C : U(cal ibu AData\E DTA\Brewer\CT_Negative
Inst Method Proc Method CalFile Position lnjVol Level Samole WtC:U(ca libu r\methods\EDTA_Neg_Swabx 11 5.0 0.000
Sample Vol ISTD Amt Dil Factor
0.000 0.000 1.000
Sample Name:
Comment:
JC5neg
Study:
Client:
Laboratory:
Company:
Phone:
Sample Type File Name Samole lD Path
unKnown cT14 05 :Xcalibur\Data\EDTA\Brewer\CT Neoative
Inst Method Proc Method CalFile Position InjVol Level Sample WtC : \Xca li b u r\methods\E DTA_Neg_Swa bs 5 5.0 0.000
Sample Vol ISTD Amt Dil Factor
0.000 0.000 1.000
l***********************t***t**************t*t*******t***********
f, +q,(+ tr)
nana 7
-1rq
,\,,\"
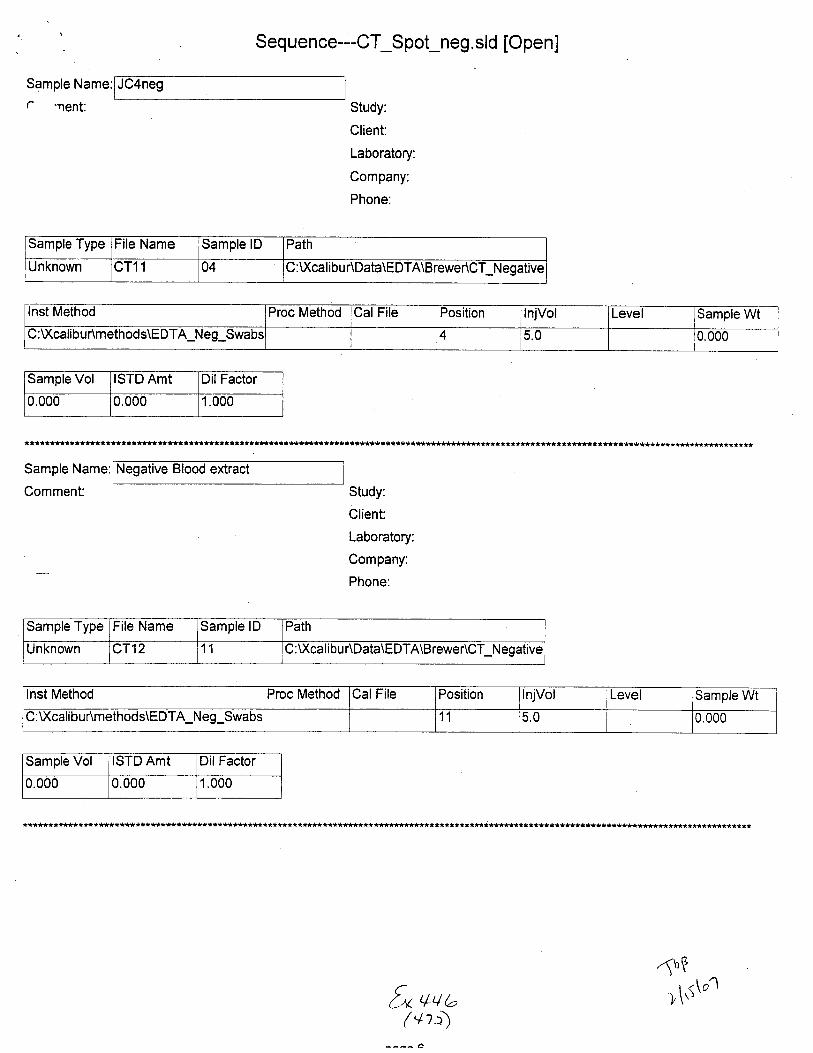
Seq uence--CT_Spot_neg. sld [Open]
Study:
Client:
Laboratory:
Company:
Phone:
Sample Type File Narne Sample lD Path
Unknown T11 04 C:U(calibur\Data\EDTA\Brewer\CT Neqative
Inst Method Proc Metnod CalFile Position InjVol Level Samole Wt
C :U(calibu r\methods\E DTA_Neg_Swabs 4 5.0 0.000
Samole Vol ISTD Amt Dil Factor
0.000 0.000 1.000
********************t****t******t******a*******t
Sample Name:
Comment:
Negative Blood extract
Study:
Glient:
Laboratory:
Company:
Phone:
a**r*******t****r**
Sample Type File Name Sample lD Path
Unknown cT12 11 C :U(calibu r\Data\EDTA\Brewer\CT Neqative
lnst Method Proc Method Cal File Position InjVol Level lSample Wt
C : U(calibu Amethod s\EDTA_N eg_Swabs 11 r5.0 0.000
Sample Vol ISTD Amt DilFactor
0.000 0.000 I.UUU
,$e
, \,.(\orf* +,/ (-(,t1;D

Sample Name:
c 'nent:
Seq uence---CT_Spot_neg. sld [Open]
extract
Study:
Client:
Laboratory:
Company:
Phone:
Sample Type File Name Sample lD Path
Unknown cT09 11 C :U(calibu r\Data\E DTA\BreweACT_Negative
Inst Method Proc Method Cal File Position InjVol Level Samole Wt
C : U(ca li bu r\methods\E DTA_N eg_Swabs 11 5.0 0.000
Sample Vol ISTD Amt Dil Factor
0.000 0.000 t.utlu
**********i**********t************************tr******************t********t*t*****************t**t*t*****t**********************************
Sample Name:
Comment:
extract
Study:
Client:
Laboratory:
Company;
Phone:
Sample Type Frle Name Sample lD Path
Unknown cT10 11 C : Xcalibur\Data\E DTA\Brewer\CT_N egative
lnst Method Proc Method Cal File Position InjVol Level Sample Wt
C : U(cal i bu r\methods\E DTA_Neg_Swabs 11 5.010.000
Sample Vol ISTD Amt Dil Factor
U.UUO 0.000 1.000
**a****i***t****t******t**t***********t******************tt**s*************
fuqau
^^(
u.' u)
,/r ut
-t\"\"'

Sample Name: Negative Blood extract
r rent:
Sequence---CT_Spot_neg. sld [Open]
Study:
Client:
Laboratory:
Company:
Phone:
Sample Type File Name Sample lD Path
Unknown cT15 11 : Xca I ibu r\Data\EDTA\Brewer\CT_Negative
Inst Method Proc Method CalFile Position lnjVol Level lSample WtC :U(cal i bur\method s\EDTA_Neg_Swabs 11 5.U u.000
Sample Vol ISTD Amt Dil Factor
0.000 0.000 1.000
*********************
Sample Name:
Comment:
Negative Blood extract
Study:
Client:
Laboratory:
Company:
Phone:
Sample Type Frle Name Sample lD Path
Unknown cT16 11 C:Xcalibur\Data\EDTA\Brewer\GT Neoative
Inst Method Proc Method CalFile Position InjVol Level Samole WtC : U(cal ibur\methods\EDTA_Neg_Swabs 11 5.0 r0.000
Sample Vol ISTD Amt Dil Factor
0.000 0.000 1.000
CCv 44Cz\( 47+S
.'ivq
)t.""''
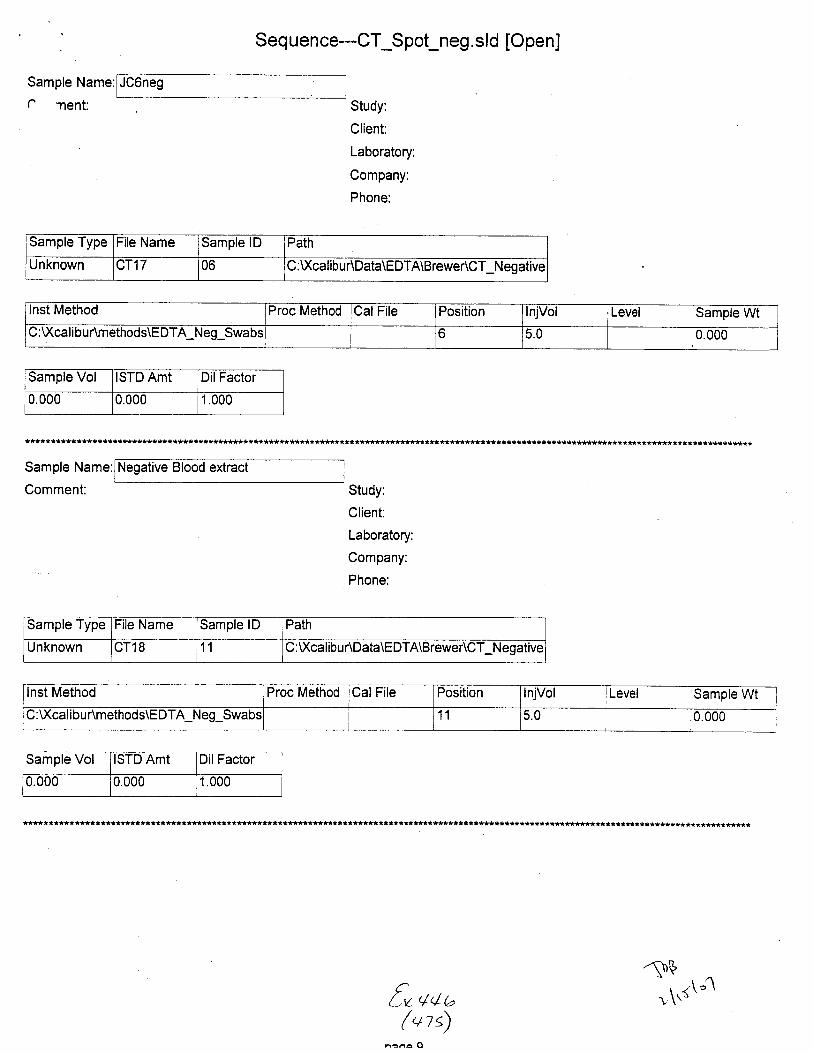
Sample Name:
c nent: Study:
Client:
Laboratory:
Company:
Phone:
Seq uence---CT_S pot_neg. sld [Open]
Sample rle Name Sample lD Path
Unknown CT17 06 C :XcalibuAData\E DTA\Brewer\CT_Negative
Inst Method Proc Method CalFile Position InjVol Level Sample WtC :\)(cali bu r\methods\E DTA_Neg_Swabs 6 5.0 0.000
Sample Vol STD Amt Dil Factor
0.000 0.000 1.000
****t***********r*t*********t****r
Sample Name:
Comment:
Negative Blood extract
Study:
Client:
Laboratory:
Company:
Phone:
*******************
Sample Type File Name Sample lD Path
Unknown cT18 11 C : Xcalibu AData\EDTA\Brewer\CT_Negative
Inst Method Proc Method CalFile Position InjVol Level Sample Wt
C :Xcalibur\methods\EDTA_Neg_Swabs 11 5.0 0.000
Sample Vol ISTD Amt DilFactor
0.000 0.000 1,000
CLu 44b(vts)
naaa O
11..'"

Sample Name:l Negative Blood extract
t' rent:
Seq uence---CT_S pot_neg. sld [Open]
Study:
Client:
Laboratory:
Company:
Phone:
Sample Type File Name Sample lD Path
unKnown cT19 11 C:XcalibuAData\EDTA\Brewer\CT Neoative
Inst Method Proc Method CalFile Position lnjVol Level lSample Wt
C :U(calibur\methods\E DTA_N eg_Swabs 11 5.0 0.000
Sample Vol ISTD Amt DilFactor
0.000 0.000 1.000
****t****t**+**************t****t*****1
Sample ttame:
Study:
Client:
Laboratory:
Company:
Phone:
Sample Type File Name Sample lD Path
Unknown f20 07 C : Xcalibu AData\EDTA\BreweACT_Negative
lnst Method Proc Method CalFile Position InjVol Level Wt
C:Xcalibur\methods\EDTA Neo Swabs 7 5.0 i0.000
Sample Vol STD Amt DilFactor
0.000 0.000 1.000
*******************t
11 ,''-'[o qq,(vto)
nana 1O

Sample Name:
C rent:
Seq uence---CT_Spot_neg. sld [Open]
extract
Study:
Client:
Laboratory:
Company:
Phone:
Sample Type File Name Samole lD lPath'l
Unknown cT21 11 :U(calibur\Data\EDTA\Brewer\CT Neoative
lnst Method Proc Method CalFile Position lnjVol Level Sample Wt
C:Xcalibur\methods\EDTA Neo Swabs 11 5.0 0.000
Sample Vol ISTD Amt Dil Factor
0.000 0.000 1.000
*****tt****t**
Sample Name:
Comment:
extract
Study:
Client:
Laboratory:
Company:
Phone:
Sample Type File Name Sample lD Path
Unknown CT22 11 C:U(calibur\Data\EDTA\Brewer\CT Neoative
lnst Method Proc Method Cal File Position InjVol lLevel lSample Wt
C:Xcalibur\methods\EDTA Neo Swabs 1 5.0 0.000
Sample Vol ISTD Amt Dil Factor
0.000 u.uuu I 1.uuu
,sq
[) q,t,- r\'(\"1(vzt)
naaa 14

Seq uen ce--CT_Spot_neg. sld [O pen]
Study:
Client:
Laboratory:
Company:
Phone:
Sample Type File Name lSample lDI
Path
Unknown cr23 108
C :U(calibu AData\EDTA\Brewer\CT_N egative
lnst Method Proc Method CalFile Position nJvol Level Samole Wt
C :U(ca I i bu r\methods\E DTA_N eg_Swabs 8 5.0 0.000
Sample Vol ISTD Amt Dil Factor
0.000 0.000 1.000
Sample Name:
Comment:
ative Blood extract
Study:
Client:
Laboratory:
Company:
Phone:
Sample Type File Name Sample lD Path
Unknown cT24 11 C :U(calibu r\Data\EDTA\BreweACT_N egative
nst Method Proc Method CalFile Position lnjVol Level lSample Wt
C :U(cal ibur\methods\EDTA_Neg_Swabs 11 5.0 0.000
{otL\,i\'1f* q'/o
--(:"'^t)
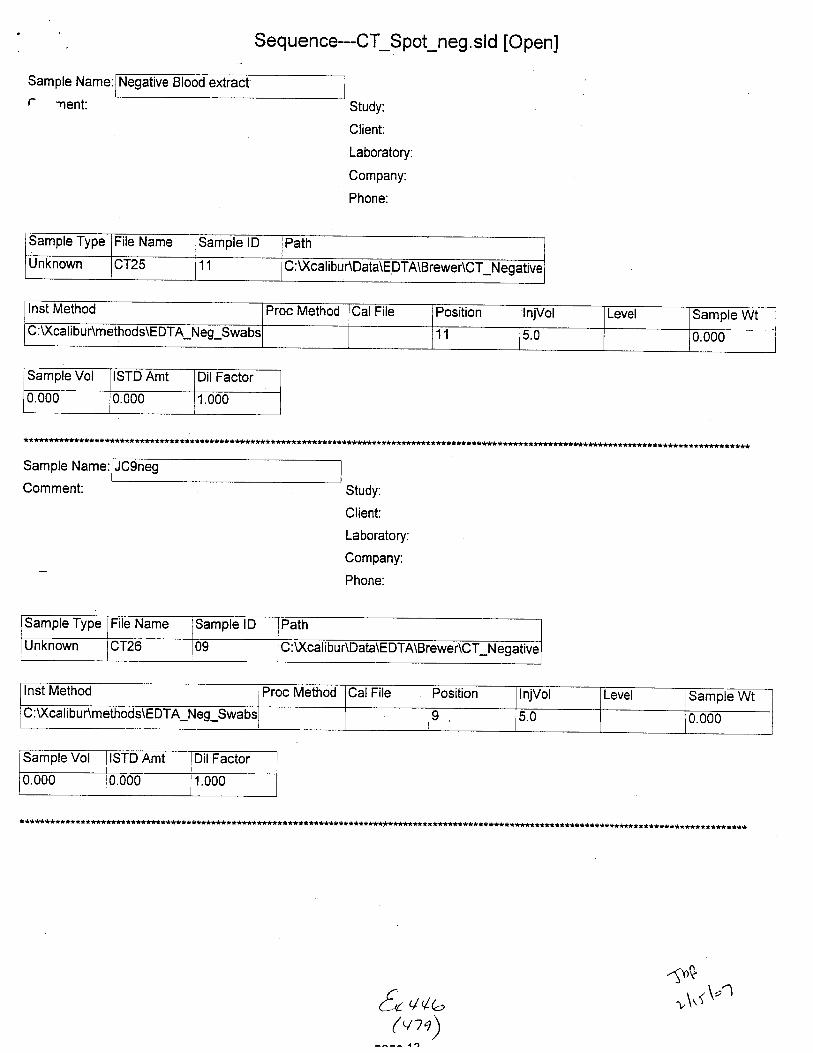
Sample Name:
r lent:
Seq uence---CT_Spot_neg. sld [Open]
Negative Blood extract
Study:
Client:
Laboratory:
Company:
Phone:
Sample Type File Name Sample lD Path
Unknown cT25 11 C :Xca I ibu r\Data\EDTA\Brewer\CT_Negative
lnst Method Proc Method CalFile Position InjVol Level Sample Wt11 b.u 0.000
Sarnple Vol ISTD Amt Dil Factor
u.000 0.000 1.000
Sample Name:
Comment:
JC9neg
Study:
Client:
Laboratory:
Company:
Phone:
Sample Type File Name lSample lDI
Path
Unknown cT26 09 C : U(cal ibu r\Data\EDTA\BreweACT_N egative
Inst Method Proc Method CalFile Position InjVol Level lSample WtC :Xcal i bu r\methods\EDTA_Neg_Sw{ 5.0 0.000
Sample Vol ISTD Amt Dil Factor
0.000 0.000 1.000
'sns
v\t(\"14 *.,lvtq\'/
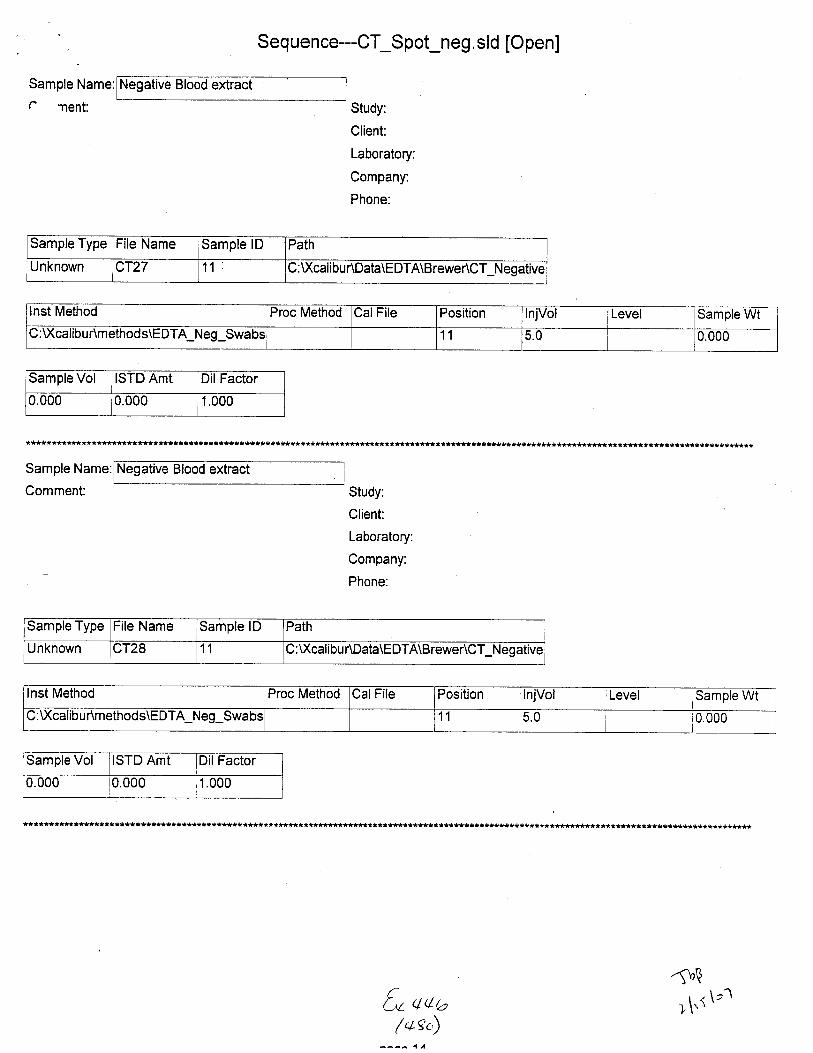
Sample Name:
r *nent:
Seq uence---CT_Spot_neg. sld [O pen]
Negative Blood extract
Study:
Client:
Laboratory:
Company:
Phone:
Sample Type File Name Sample lD Path
Unknown cT27 11 C:Xcalibur\Data\EDTA\Brewer\CT Neoative
Inst Method Proc Method CalFile Position njVol Level Sample WtC :U(calibur\methods\EDTA_Neg_Swa bs 5.0 0.000
Sample Vol ISTD Amt Dil Factor
u.0u0 0.000 1.000
*********t*********t*t************f**********************t****t*****t****t****i************t***t********t**********************i*********t*t*t
Sample tlame:
Study:
Client:
Laboratory:
Company:
Phone:
Sample Type File Name samDle lu Path
Unknown cT28 11 C:U(calibur\Data\EDTA\Brewer\CT Neqative
Inst Method Proc Method CalFile Position InjVol Level Sample Wt
:Xcalibur\methods\EDTA Neo Swabs 11i5.0 r0.000
Sample Vol ISTD Amt Dil Factor
0.000 0.000 1.000
*i**************
[v aqb(:,n.)
-frrq
)\'.i \:r

Seq uence---CT_Spot_neg. sld [Open]
Sample Name:
r rent:
0neg
Study:
Client:
Laboratory:
Company:
Phone:
Sample Type ile Narne lSample lD Path
Unknown cT29 10 C : U(cal ibur\Data\EDTA\BreweACT_Negative
Inst Method Proc Method CalFile Position InjVol Level Sample WtC :Xcal ibu r\methods\E DTA_N eg_Swabs 10 5.0 0.000
Sample Vol ISTD Amt Dil Factor
0.u00 0.000 1.000
Sample Name:
Comment:
ive Blood extract
Study:
Client:
Laboratory:
Company:
Phone:
$ample lype File Name Sample lD Path
Unknown cT30 11 C : U(calibur\Data\E DTA\BreweACT_N eg ative
ample Vol STD Amt lDil FactorI
0.000 0.000 1.000
fo u+a(+t,)
{1t,t.<\r

Sample Name:
C rent:
Seq uence---CT_Spot_neg. sld [Open]
extract
Study:
Client:
Laboratory:
Company:
Phone:
Sample Type File Name Sample lD Path
Unknown cT31 11 ; : \Xcalibu r\Data\EDTA\Brewer\CT_Negative
Inst Method Proc Method CalFile Position
iT-InjVol Level Sample Wt
C:\)(calibur\methods\ED1a_Neg:Swebi 5.O U.UOO
Sample Vol ISTD Amt DilFactor
0.000 0.000 1.000
t******t***********t******t*******t************************t*t*************t***********st***********r**ti**********************r************
Sample Name:
Comment:
Pos. Control EDTA btood eitStudy:
Client:
Laboratory:
Company:
Phone:
Sample Type File Name Sample lD Path
Unknown CT32 12 C : U(cali bu r\Data\EDTA\BrewerEfl*.|egaiite
Inst Method Proc Method CalFile Position lnjVol Level Sample Wtu : \xcat I bu r\methods\E DTA_Neg_Swabs 12 5.0 10.
Sample Vol STD Amt DilFactor
0.000 0.000 1.000
**********i**************************************t****i***t***************************i***
€u'/va
!u:')
,-\!t
)\r(\-n
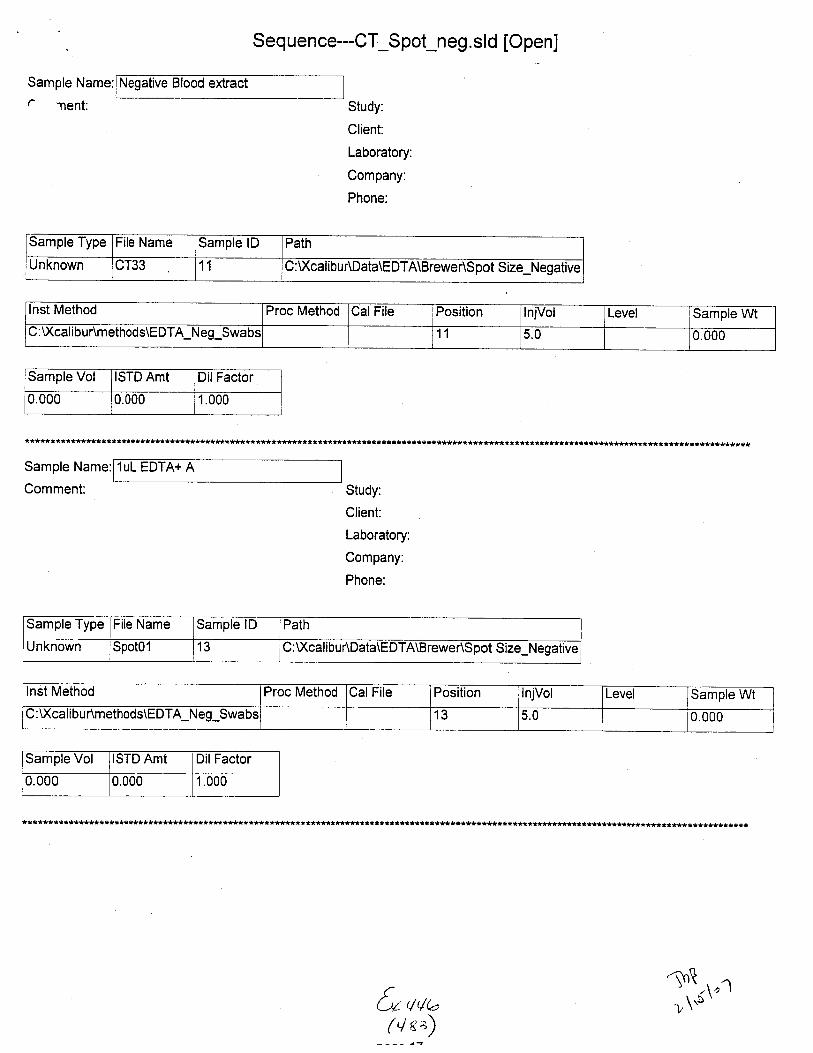
Sample Name:
. nent:
Seq uence---CT_Spot_neg. sld [Open]
Negative Blood extract
Study:
Client:
Laboratory:
Company:
Phone:
Sample Type ile Name Sample lD Path
Unknown 11 G :U(calibuAData\EDTA\Brewer\Spot Size_Negative
nst Method Proc Method Cal File Position njVol Level Sample WtG:Xcalibur\methods\EDTA Neo Swabs 11 5.0 0.000
Sample Vol ISTD Amt Dil Factor
U.UOU 0.000 1.000
Sample Name:
Comment:
1uL EDTA+ A
Study:
Client:
Laboratory:
Company:
Phone:
Sample Type File Name Samole lD Path
Unknown lSpotOl 13 C :U(calibu AData\EDTA\B rewer\Spot Size_Negative
Inst Method Proc Method CalFile Position njVol Level lSample WtI
C : Xcal i bu r\methods\EDTA_Neg_Swabs 13 5.0 0.000
Samole Vol ISTD Amt Dil Factor
0.000 0.000 1.000
LX(4
UWa(")
'int ^" '\a I
.. \.s'

Sample Name:
r nent:
Sequen ce---CT_Spot_neg. sld [Open]
ive Blood extract
Study:
Client:
Laboratory:
Company:
Phone:
Sample Type File Name Sample lD Path
Unknown SpotO1 11 C:U(cal ibu r\Data\EDTA\Brewer\Spot Size-Negative
Inst Method Proc Method CalFile Position InjVol Level Sample WtC : U(calibur\m eth od s\EDTA_Neg_Swabs 11 5.0 u.000
Sample Vol ISTD Amt Dil Factor
0.000 0.000 1.000
***************
Sample Name:
Comment:
1uL EDTA+ B
Study:
Client:
Laboratory:
Company:
Phone:
Sample Type File Name Sample lD Path
Unknown SpotO1 14 C : U(cali bu r\Data\EDTA\BreweASpot Size_Negative
t******r**t*********
44t 2-{$$
-t,ut"'( 4s1)
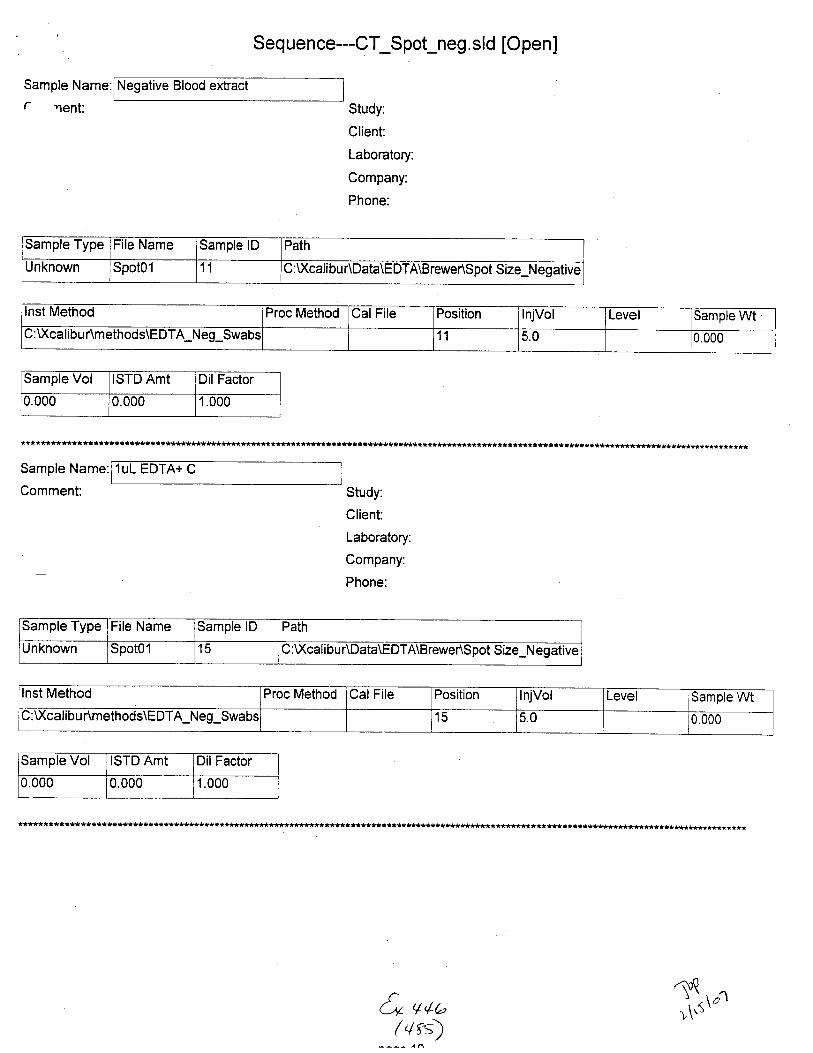
Sample Name: Negative Blood extract
f lent:
Seq uence---CT_Spot_neg, sld [Open]
Study:
Client:
Laboratory:
Company:
Phone:
Samp Frle Name Sample lD Path
Unknown Spot01 11 C:U(cali bu r\Data\E DTA\Brewer\Spot Size_N egative
lnst Method Proc Method ual Frle Position InjVol Level Samole WtC:Xcalibur\methods\EDTA Neq Swabs 11 5.0 U.OOU
Sample Vol ISTD Amt Dil Factor
0.000 U.UUU r.000
***************************t**t*****************t********t*t***
Sample Name:r-"'-lComment: Study:
Client:
Laboratory:
Company:
Phone:
Sample Type Ftle Name Samole lD Path
Unknown SpotO1 15 C :Xcali bu r\Data\EDTA\Brewer\Spot Size_N egative
Inst Method Proc Method CalFile Position lnjVol Level lSample WtC:U(calibur\methods\EDTA Neo Swabs 15 5.0 0.
Sample Vol ISTD Amt Dil Factor
0.000 0.000 1.000
& q,to( +rs)
n^Cl'v\' -\o I
r,\\J

Sample Name:
(' nent:
Seq uence---CT_S pot_neg. sld [Open]
Negative Blood extract
Study:
Client:
Laboratory:
Company:
Phone:
Sample Type File Name Sample lD Path
Unknown Spot01 11 C : Xcal ibu AData\EDTA\B rewer\Spot S ize_N egative
lnst Method Proc Method CalFile Position InjVol Level jSample WtI
C:U(calibur\methods\EDTA Neo Swabs 11 5.0 u.u00
Sample Vol ISTD Amt DilFactor
0.000 0.000 1.000
.tSample Name:
Comment: Study:
Client:
Laboratory:
Company:
Phone:
sample lype File Name Sample lD Path
Unknown SpotO1 to C :\)(cali bu r\Data\EDTA\B rewer\S pot S ize_N egative
lnst Method Proc Method CalFile Position lnjVol Level Sample Wt
C:Xcalibur\methods\EDTA Neo Swabs 16 b.u 0.000
Sample Vol ISTD Amt Dil Factor
U.UUU rJ.u00 1.000
**************t*************tt****t*t***************** a**************t*****
q+C2
1r^:r>'\nR,ra
r\$'

Sample Name:
r nent:
Seq uence---CT_Spot_neg. sld [Open]
Study:
Client:
Laboratory:
Company:
Phone:
extract
Sample Type l-rle Name Sample lD Path
Unknown Spot01 11 C:Xcali bu AData\EDTA\Brewer\Spot Size_Negative
Inst Method Proc Method Cal File Position lnjVol Level Sample Wt
: U(calibu r\methods\E DTA_Neg_Swabs 11 b.rJ U.OOU
Sample Vol ISTD Amt Dil Factor
0.000 0.000 t1.000
Sample Name:
Commenl
SuL EDTA+ B
Study:
Client:
Laboratory:
Company:
Phone:
Sample Type File Name Sample lD Path
Unknown iSpotOl 17 C :Xcalibu AData\EDTA\Brewer\Spot S ize_Negative
lnst Method Proc Method Cal File Position InjVol Level :Sample Wt
C:Xcalibur\methods\EDTA Neq Swabs 17 b.0 0.000
Sample Vol ISTD Amt DilFactor
0.000 0.000 1.000
&qqn11,1'"( vsz)

Sample.Name:
t' nent:
Sequence---CT_Spot_neg. sld [Open]
Negative Blood extract
Study:
Client:
Laboratory:
Company:
Phone:
sample lype File Name Sample lD Path
Unknown SpotO1 11 :Xcal i bu r\Data\EDTA\BreweAS pot Size_N egative
Inst Method Proc Method CalFile Position InjVol Level Sample WtC:U(calibu r\methods\E DTA_N eg_Swabs 11 5.0 0.000
Sample Vol ISTD Amt Dil Factor
0.000 0.000 1.000
Sample Name:
Comment:
5uL EDTA+ C
Study:
Client:
Laboratory:
Company:
Phone:
Sample Type File Name Sample lD Path
Unknown SpotO1 18 C:Xcalibu AData\E DTA\Brewer\S pot Size_N egative
Inst Method Proc Method CalFile Position InjVol Level lSample Wt
C :Xca I ibu r\method s\E DTA_N eg_Swabs 18 5.0 0.000
Sample Vol STD Amt Dil Factor
0.000 0.000 1.000
(/ rl (-(+s)
aaaa )r)
1\,rJrr\'. '
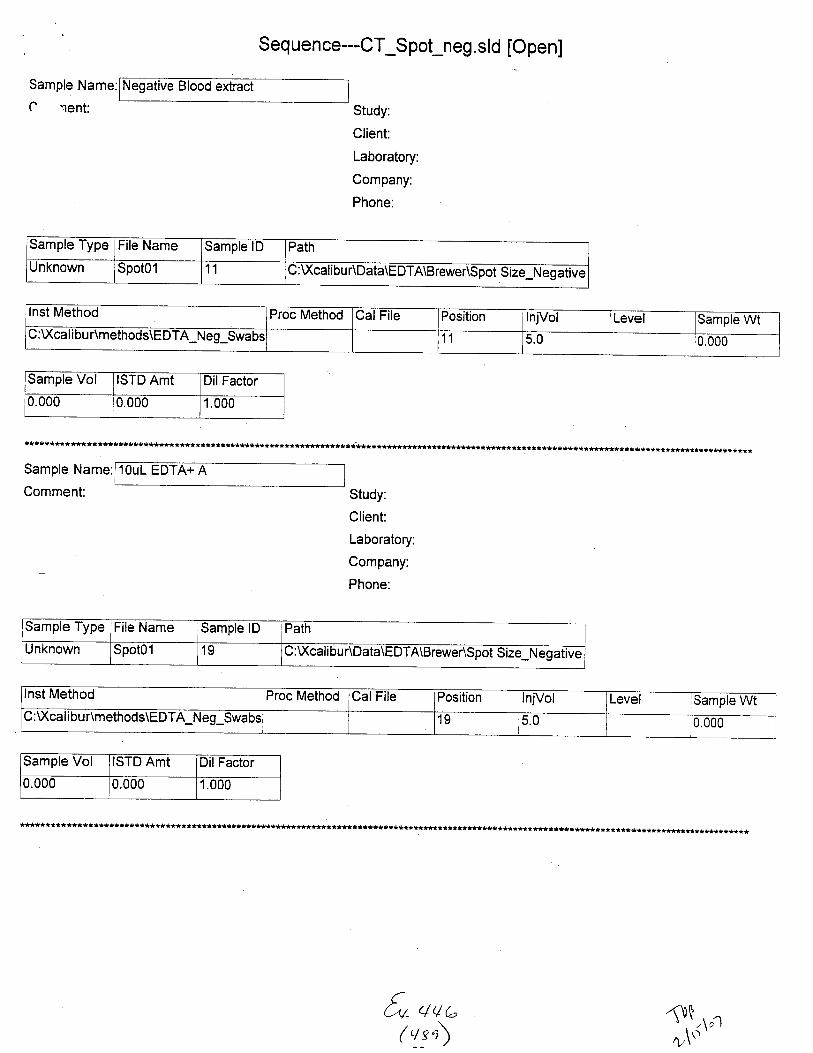
Sample Name:
C -rent:
Seq uence---CT_S pot_neg. sld [Open]
Negative Blood extract
Study:
Client:
Laboratory:
Company:
Phone:
Sample Type File Name Samole lD Path
Unknown Spot01 11 C : U(calibu r\Data\EDTA\Brewer\S pot Size_t tegative
Inst Method Proc Method CalFile Position InjVol Level Sample Wt; : \Xca I I bu r\methods\E DTA_N eg_Swabs 11 5.0 0.000
Sample Vol ISTD Amt Dil Factor
0.000 0.000 1.000
****t*******************t****t**************************t*****t************t**r*********************************************r*****i*t*****i
Sample Name:
Comment:
1OuL EDT
Study:
Client:
Laboratory:
Company:
Phone:
Sample Type File Name Samole lD Path
Unknown Spot01 19 :Xcal i bu r\Data\E DTA\Brewer\Spot S ize_frlegative
Inst Method Proc Method Cal File Position InjVol Level Sample WtC :U(ca I i bu r\m ethod s\EDTA_Neg_Swa bs 19 5.0 0.000
Sample Vol ISTD Amt Dil Factor
U.UUO 0.000 1.U00
r*************i************
C4L qqG/\(Vs'iS
st,,,..,4/\r'
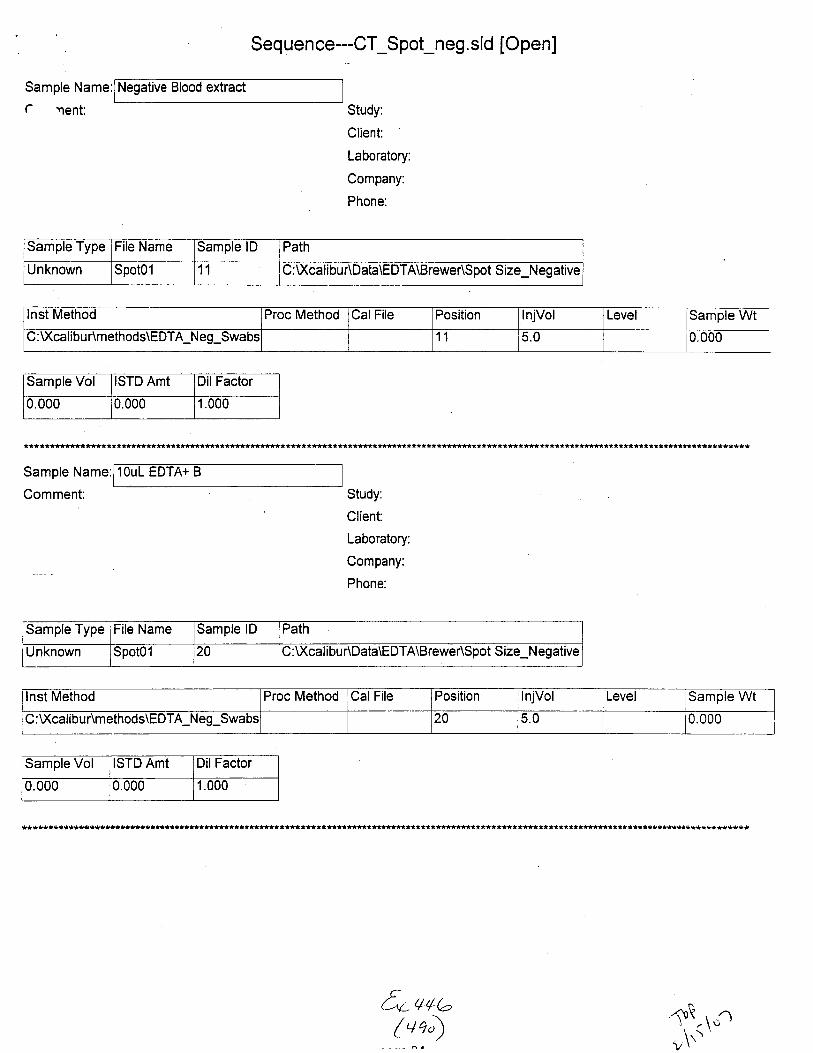
Seq uen ce---CT_Spot_neg. sld [Open]
Sample Name:
c rent:
Negative Blood extract
Study:
Client
Laboratory:
Company:
Phone:
Sample Type File Name Sample lD Path
Unknown SpotO1 11 C :U(cali bu r\Data\E DTA\Brewer\Soot S ize N eo ative
Inst Method Proc Method CalFile Position InjVol Level Samole Wt
C:U(calibur\methods\EDTA Neo Swabs 11 5.0 0.000
sample vol ISTD Amt DilFactor
0.000 0.000 1.000
***+********************t*************t*********************
Sample Name:
Comment: Study:
Client:
Laboratory:
Company:
Phone:
1 *
Sample Type File Name Sample lD Path
Unknown Spot01 20 C : U(cali bu r\Data\EDTA\Brewer\Spot Size_N egative
lnst Method Proc Method CalFile Position InjVol Level Sample Wt
C : U(calibu r\methods\EDTA_Neg_Swabs 20 5.0 0.000
Sample Vol ISTD Amt Dil Factor
O.UUU 0.000 1.000
********************t****r
6r++t-('/ q,) {\\*.1
V\

Sample Name:
C nent:
Seq uence---CT_Spot_neg. sld [Open]
Negative Blood extract
Study:
Client:
Laboratory:
Company:
Phone:
C:Xcalibur\Data\EDTA
Sample Vol ISTD Amt Dil Factor0.000 0.000 1.000
*************************************************************************i*********t**t************r***i******t****.****************************t
Sample Name:
Comment:
1OuL EDTA+
Study:
Client:
Laboratory:
Company:
Phone:
nst Method Proc Method ual Ftle Position InjVol Level Sample WtA_Neg_ 12 5.0 0.000
Sample Vol ISTD Amt Dil Factor
0.000 0.000 1.U00
*****t********************t*******t****************i*******t***********t***$******i***i*******i**********t****t*******
5r,/,/a(\:,) .i$$,1o1
-\i

Sample Name:
C '"nent:
Seq uence---CT_Spot_neg. sld [Open]
extract
Study:
Client:
Laboratory:
Company:
Phone:
Sample Type rle Name Sample lD Path
Unknown Spot01 11 C :U(cal ibu r\Data\E DTA\BreweASpot Size_Negative
Inst Method Proc Method CalFile Position InjVol Level Sample WtC :U(ca libu r\methods\E DTA_Neg_Swabs 11 5.0 0.000
Sample Vol ISTD Amt Dil Factor
u.00u 0.000 1.000
**************** *************ft**#*
fi v+o(48, 1l'+^

C:\XcalibuA...\Spot Size_Negative\Ct33 02116107 03:47:38
rlz= 272.5-273.5 F: - cESI SRM [email protected] [246.sO-247.50,272.50-273.501 MSc133
121E3mlz= 246-t247.5 F: - cESI SRM ms2291 [email protected]
ms2t5.00 [
246.50-247.50.272.50-273.s01 MSct33
Negative Blood extract TtBNL: 1.42E3nvz: 299.5-300.5 F: - cFSI SRM [email protected] I299,50.300.50,325.50.326.501 MScr33
Q
d
€og@
.I]/z= 282.a-28r'.,3 F'. - cESI SRM [email protected] [282.7r2U.251 MSct33
5r 4+o

C:\i(catibuA...\Spot01 oz16t\7 03:58:32 1 uL EDTA+ A
-llesJ Itlt
'-1 ll
: 4.43E3nlz=246.1247.5 F: - cESI SRM [email protected] [246.50-247.50,272.50-273.501 MSSpotol
nlz= 282.8-2U.3 F: - c
: E.55E3ff|/z= 325.5-326.5 F: - cESI SRM [email protected] MSSpoto l
o
6c
qo
ESI SRM [email protected] [282.7$284.251 MSSpoio'l
Time (min)Time (min)
froo,

C:XcalibuA. .\Spot01_0702 1 6040921|..-- 02116107 04:09:21 Negative Blood extract TDp
,::
;lNL:5.66E3tnlz=272.5-273.5 F: - cESI SRM [email protected] [246.fi-247.50,272.50-273.50t MSSpoto1-07021-6040921
fi12.282.8-2U3 Fi - cESI SRM [email protected] [282.75-284.251 MSSpoto1_07021-6040921
NL: 3.2483nvz: 299.5-300.5 F: - cESI SRM [email protected] [299.50-300.50,325.50-326.501 MSSpot01_07021'6040921
mfz= 325.t326.5 F: - cESI SRM [email protected] [299.50-300.50,325.50-326.501 MSSpoto1_07021 6040921
oo
Ec
€o
.Eo
ffVz= 31 1.5-312.5 F: - cESI SRM [email protected] [311.50-312.501 MSSpoto1_07021 6040921
Time (min)
fo,/+,

C:\Xcalibur\...\Sootl1 07 021 6042017
10(
Y:
EC
ta
7A
65
DU
5C
50
45
40
30
02j16107 04:20:17
NL:2.96E4nlz= 272.1273.5 Fi - cESI SRM [email protected] I246.50-247.50,272.50-273.501 MSSpoto'l_0702 1'504201 7
1.33E4m/z= 246.5-247.5 F: - cESI SRM [email protected] [[email protected] MSSpotol_07021'604201 7
(tlz= 2E2.8-2U.3 F: - cESI SRM [email protected] [282.75-2U.251 MSspotol_07021ir04201 7
NL: 3.74E4r/z= 299.5.300.5 F: - cESI SRM [email protected] [,oa qn-ann qn
325.50.326.501 MSSpotol_07021-6042Ol 7
45
40
Time {minl
&,%( vt)
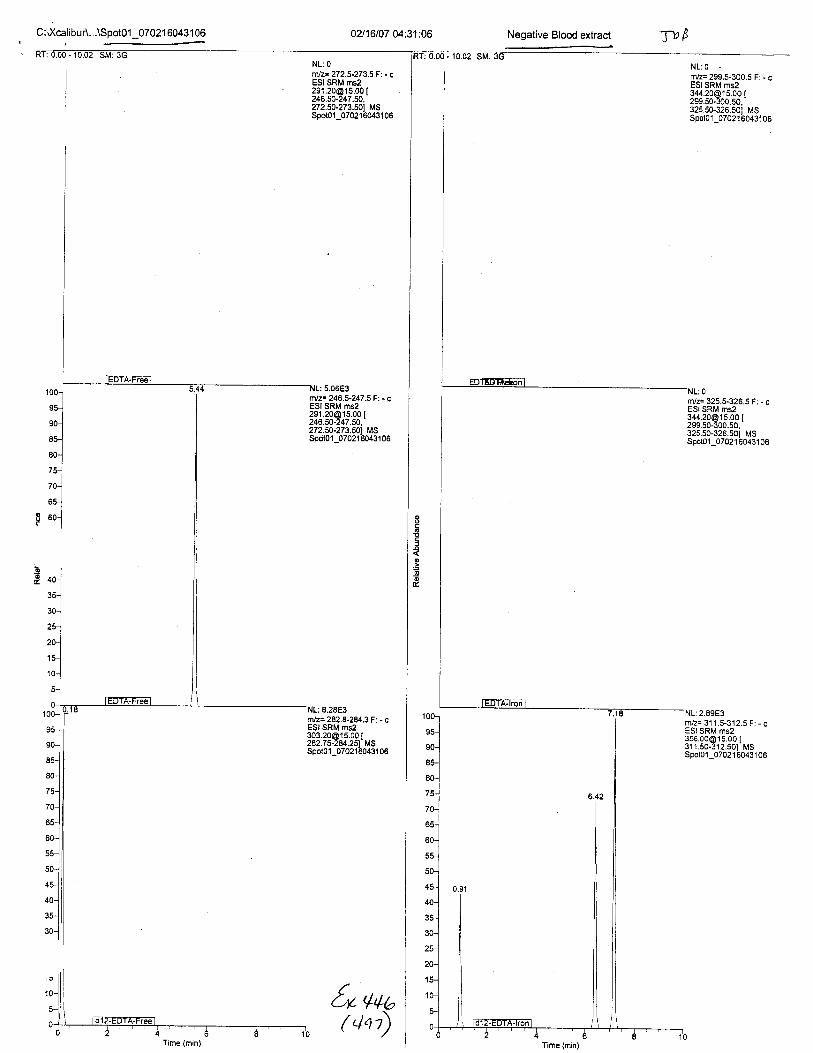
C:ti(calibuA. \Soot01 070216043106 02116107 04:31:06 Negative Blood extract Tvp
'10(
da
7a
7A
8oo
NL:0ttlz= 272.5-273.5 F: - cESI SRM [email protected] I246.50-247.50,272.s0-273.501 MSSpoto1_0702'1 60431 06
nlz= 246.5-247.5F'. - cESI SRM [email protected] [246.50-247.50.272,50-273.501 MSSpoto1_07021'60431 06
V,lb
nvz= 325.S326.5 F: - cESI SRM [email protected] [299.50-300.50.325.50-326.501 MSSpoto1_07021'50431 06
oaF
€o
50
Time (min) Time (min)
(,to)

C:U(calibur\...\S ool01 070216044202 02116107 04:42:02
.riz=272.5-273.5 F: - cESI SRM ms2
1uL EDTA+ C-rn3
u-6c NL: 3.9'1E4
rn/z= 299.$300.5 F: - cESI SRM [email protected] [z9v.JU-JUU.3U,325.50-326.s01 MSSpot01
-07021 -60,14202
NL:4.72E4nrlF 311.5.312.5 F: - cESI SRM [email protected] [311.50-312.501 MSSpoto1_07021'6044202
100-.1I*t
ms2| 5.00 [
246.fi-247.50,272.50-273.501 MSSpoto1_07021'60/t4202
dz:246.5-247 .5 F: - cESI SRM [email protected] [246.50-247.50.272.50-273.501 MSSpoto1_07021-6044202
I
o.a66
't0(
9(
8(
7!
nlz= 242.E-2U.3 Fi - cESI SRM [email protected] [282.75-284.251 MSspoto1_07021ii044202
5"w,,
70
5C
35
30
NL:'1.7784rvz= 325.5-326.5 F: - cESI SRM ms23,[email protected] I299.50-300.50,325.50-326.501 MSspot11 _070216044202
( 4os) i
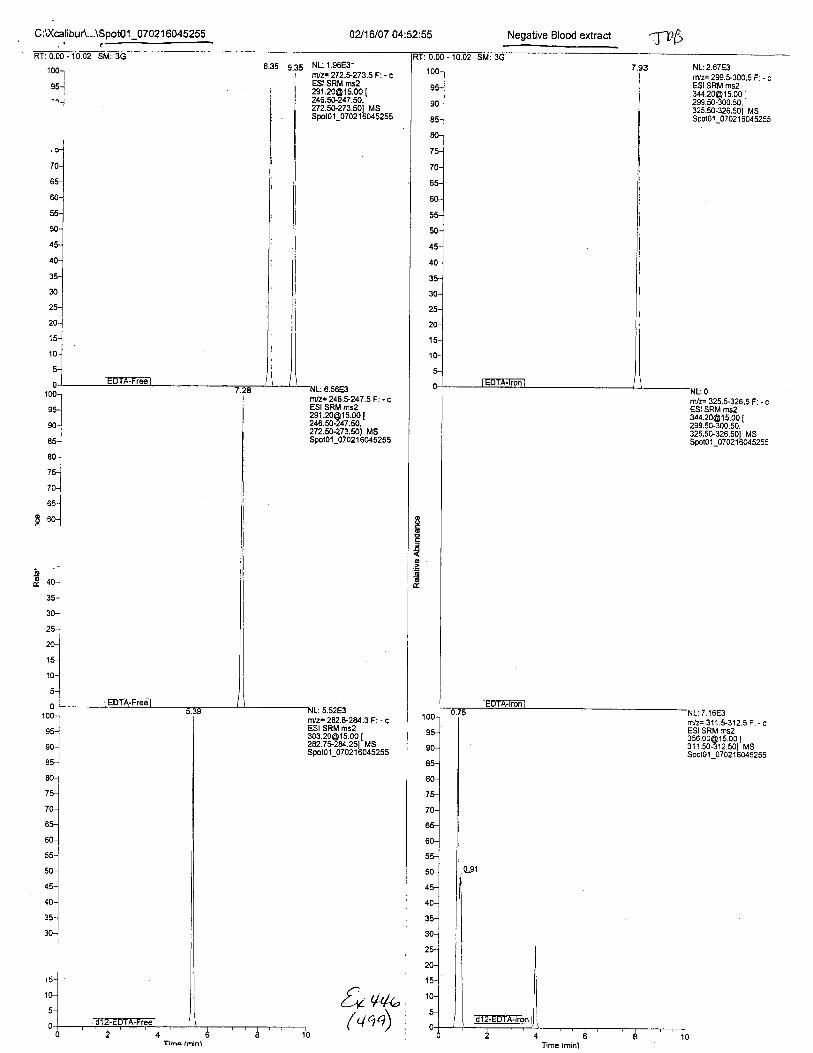
C:U(calibur\...\SpotO1 _07021 6M5255 0?/16107 04:52:55 Negative Blood extract {v(,
90
80
75
70
oc
Etlz= 272.U273.5 Fi - cESI SRM [email protected] [246.5G247.50.272.5c223.s0i MSSpot01_07021'5045255
rlz= 282.V2E'4..3 F: - cESI SRM [email protected] [282.7$2U.251 MSspoto1_0702 1b045255
NL: 2.67E3nvz= 299.5-300.5 F: - cESI SRM [email protected] [299.50-300.50,325.50-326.501 MSSpoto1_0702 16045255
m/z= 3'11.t312.5 F:- cESI SRM [email protected] [311.50-312.501 MSSpotol-070216045255
oPoE
€oEoo
100
90
85
80
75
70
65
55
JU
45
40
35
JU
a(,+
V46qq)
Time (min)
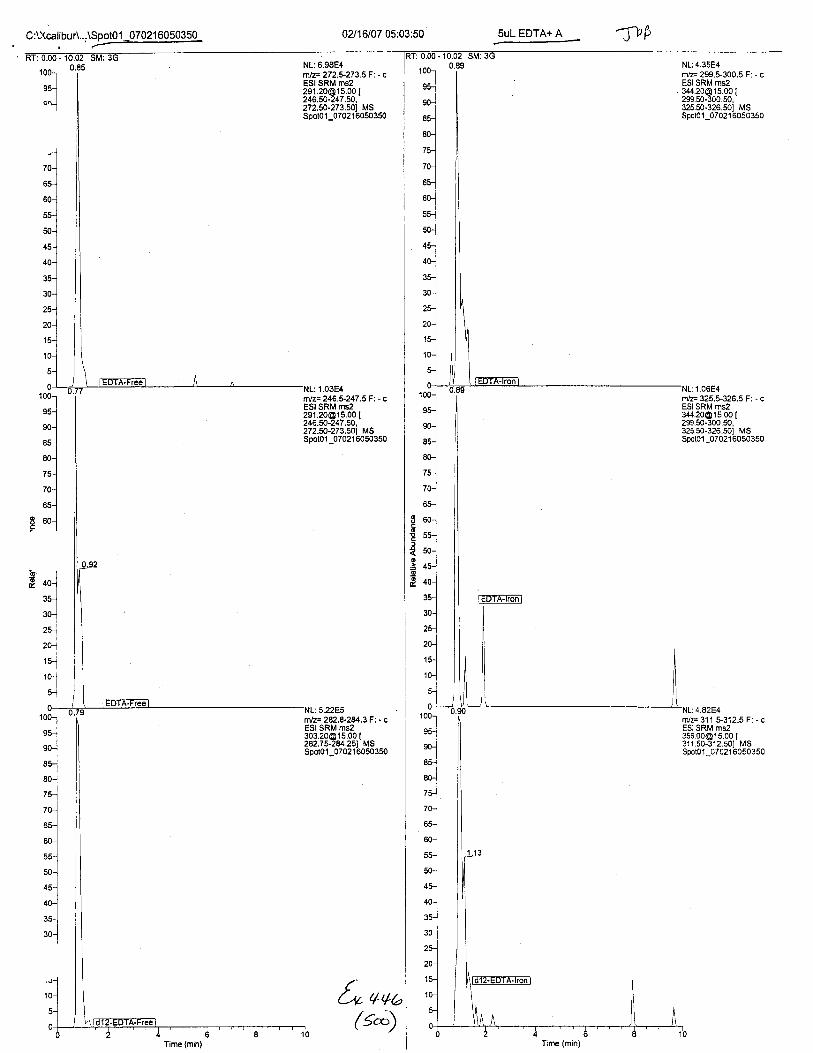
C:L\calibur\...\Soot01 070216050350 0A16107 05:03:50 5uL EDTA+ A--
-fip
1 00-t
o.-l*l".-l
NL:6.98E4(lz=272.5-273.5 F: - cESI SRM [email protected] [246.50-247.50,272.50-273.501 MSSpoto1-07021 6050350
NL:1.03E4.'].lz= 246.5-247 .5 F: - cESI SRM [email protected] [246.50-247.50.272.sO-273.501 MSSootol 070216050350
filz= 28?.8-2U.3 F'. - cESI SRM [email protected] [242.75-2U.25t MSSpotol-07021'6050350
qqb
NL: 4.35E4mh= 299.5-300.5 F: - cESI SRM [email protected] I299.50-300.50,325.50-326.501 MSSpot0 l_0702'l 6050350
1.06E4010(
9:
8(
7,
6a
8u
nVF 325.5-326.5 F: - cESI SRM [email protected] I299.50-300.50,325.50-326.501 MSSpot01_07021 6050350
r/z= 311.5-3'12.5 F: - cESI SRM [email protected] [311.50-312.s01 MSSpoto1_07021 6050350
o
o
a
oE
Time (min) Time (min)
(1
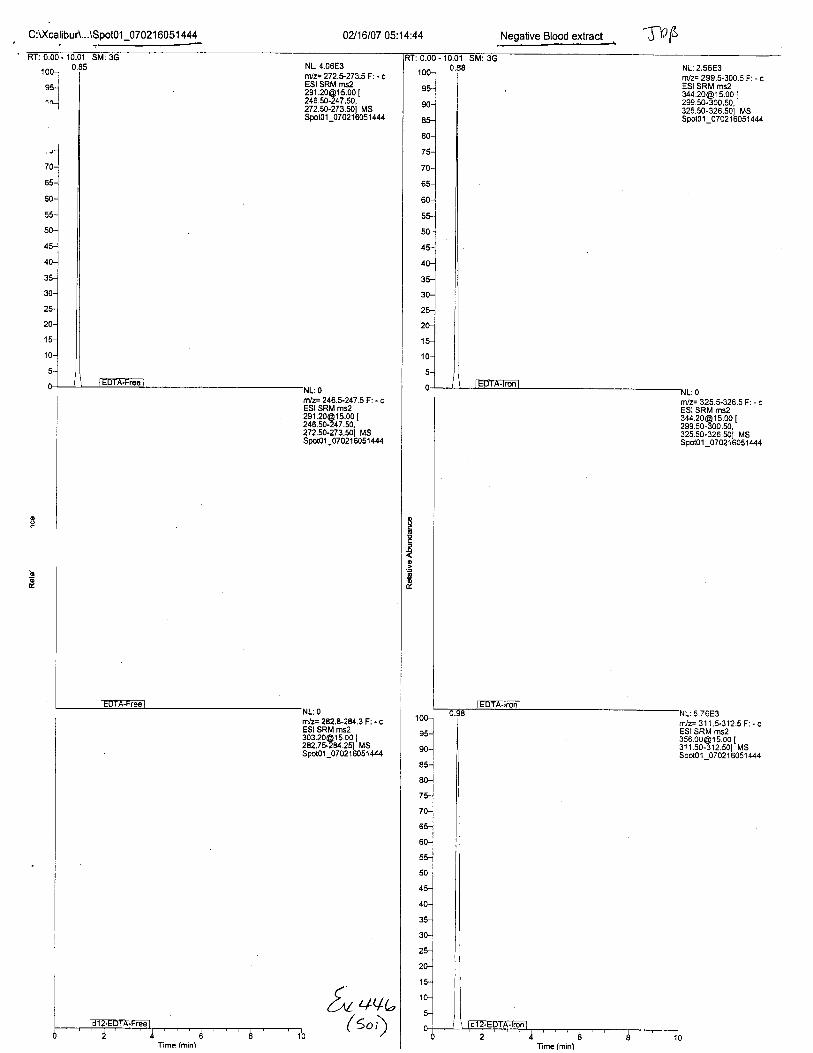
100-.1
I*l''-l
NL:0mlz=246.5-247.5 F: - cESI SRM [email protected] [246.50-247.50,272.50-273.s01 MSSpoto1_07021'6051444
C:l(calibur\.-.\SpotO1_07021 6051 444 02116107 05:14:44
NL: 4.06E3nllz= 272.*273.5 F: - cESI SRM [email protected] [246.50-247.fi,272.50-273.501 MSSpoto1_07021 6051,144
rnlz= 282.8-2U.3 Fi - cESI SRM [email protected] [282.75-284.251 MSsooto1 07021tt051444
Negative Blood extract lvpNL:2.56E3
Edc
o.z=6
FVz= 299.5-300.5 F: - cESI SRM [email protected].
ms2r5.00 I
299.50-300.50,325.50-326.501 MSSpolo1_07021 605'1444
mtz= 325.5-326.5 F: - cESI SRM [email protected] [299.50-300.50.325.50-326.501 MSSpoto1 _07021'6051 444
r/z= 31 1.5-312.5 F: - cESI SRM [email protected] [311.50-312.501 MSSpotol_07021'6051 444
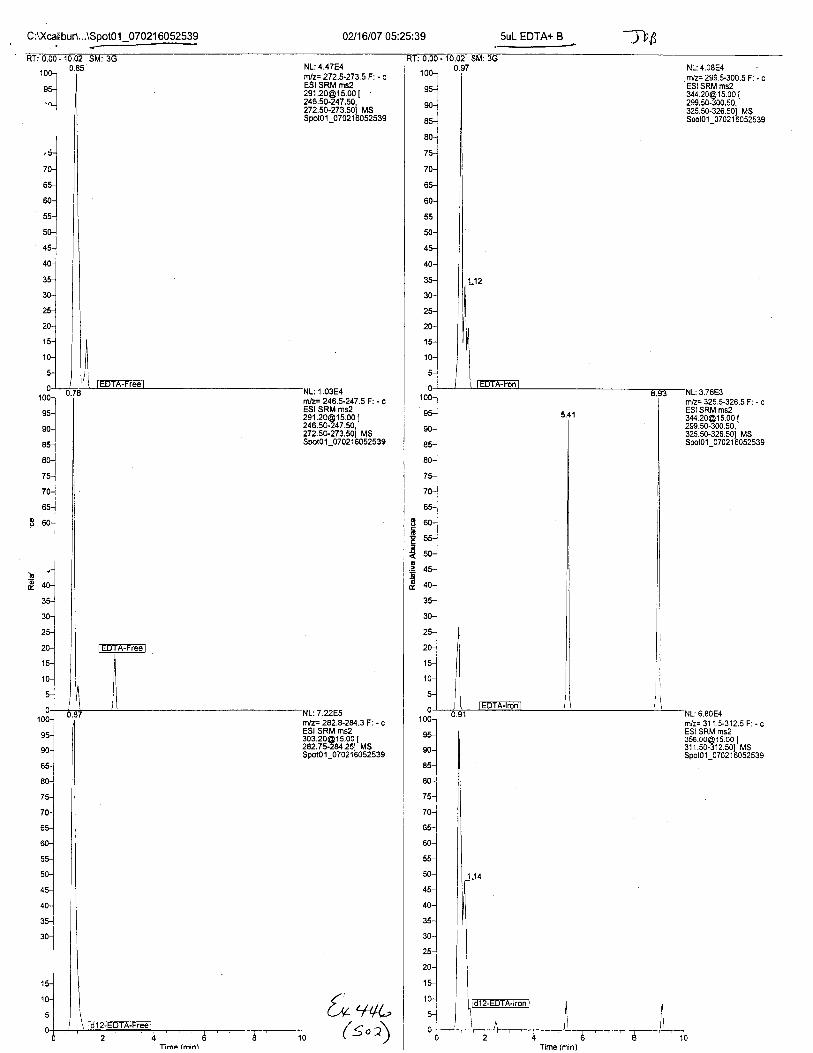
C:\J(calibur\.,.\SpotO 1 _07021 6052539 02116107 05:25:39 5uL EDTA+ B.-----jb3
NL: 4.47E4nlz= 272.5-2735 F: - cESI SRM ms2291 [email protected] I246.50-247.50,272.50.273.501 MSSpoto1-07021'6052539
NL: 1.03E4ftlz= 246.5-247.5 F: - cESI SRM [email protected] I246.50-247.50,272.50-273.501 MSSpoto1_07021 6052539
mlz= 282.8-2U.3 F'. - cESI SRM [email protected] I282.75-2U.251 MSSooto1 0702'16052539
[, qar-(s"\
NL:4.08E4trVz- 299.$300.5 F: . cESI SRM [email protected] [299.50-300.50,325.50.326.s01 MSSpoto1_0702'1 6052539
n/z= 325.$326.5 F: - cESI SRM [email protected] [299.50.300.50,325.50-326.501 MSSpoto'l_07021 6052539
1001
e5J
no-]I
--leo-l
I
ru-1
'"1^-l*l
p *-l
6.80E4nvz= 31 1.t312.5 F: - cESI SRM [email protected] [311.50-312.501 MSSpotol-0702 1 6052539
Time (min)
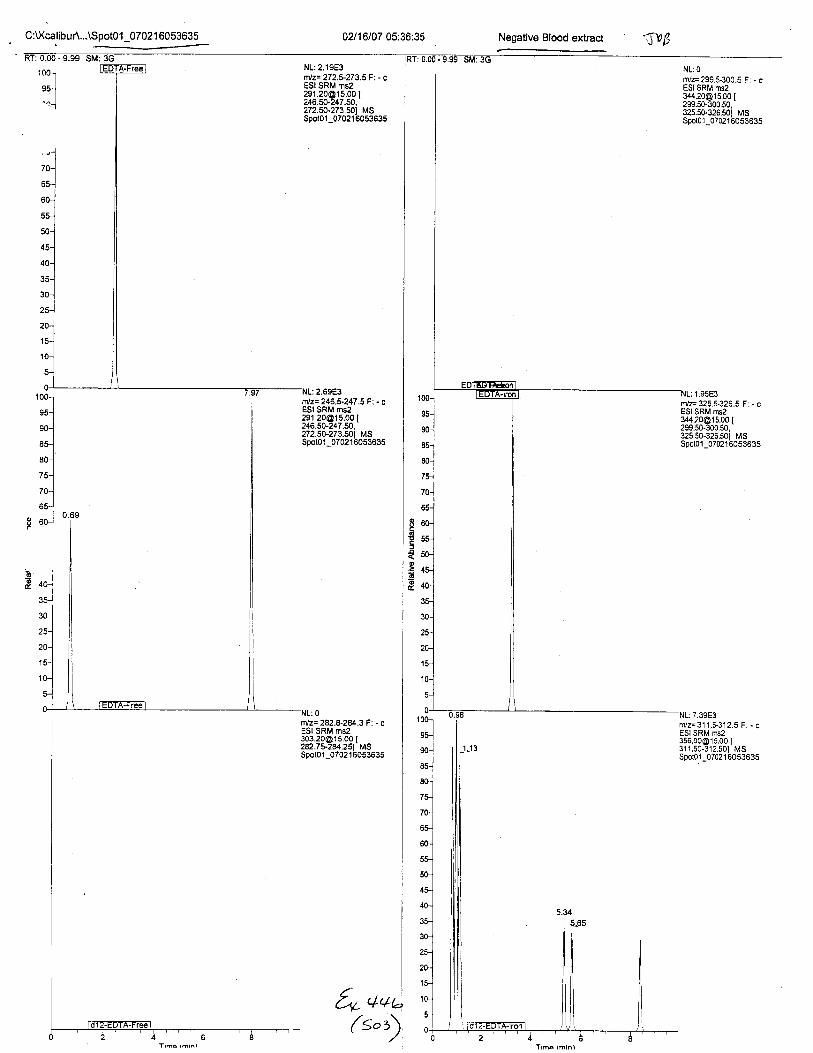
C:l(calibuA...\Spot01_07021 6053635
1 001
oJ*l'-l
NL:2.19E3nlz= 272.*273.5 F: - cESI SRM [email protected] [246.50-247.50,272.50.273.501 MSSpoto1_0702 1-6053635
Nz= 282.8-2U.3 F: - cESI SRM [email protected] [282.75-2U.251 MSspot01_07021it053635
Zo't*(sot
0U16107 05:36:35
oc
ooo
Negative Blood extract '.:fr8
- NL:onVr 299.5.300.5 F: - cESt SRM [email protected] I299.50-300.50,325.50.326.501Spoto 1_0702
501 MS121 6053635
1.9583mfz= 325.5.326.5 F: - cESI SRM [email protected] Izw.cu-JUu.tu,325.50-326.501 MSSpolol_07021 6053635
rvz= 311.$3'12.5 F: - cESI SRM [email protected] I311.50.312.501 MSSpot0'1_07021 6053635

C:VcalibuA...\Soot01 07021 60S726
iool "i''u-l I'r-J I
02116107 05:47''26
NL: 4.97E4tvz= 272.*273.5 F: - cESI SRM [email protected] [246.50-247.fi.272.50-273.50i MsSpoto1_07021 6054726
:2.71E9rnlz= 246.5-247 .5 F: - cESI SRM [email protected] [246.50-247.50,272.s0-273.50] MSSpoto1_07021 6054726
@o
@
@
do
NL:6.88E5nlz= 2E2.E-2U.3 F: - cESI SRM [email protected] I2A2.75-2U.251 MSspot0l_0702'1 i;054726
5uL EDTA+ C 'rvp
NL:6,68E4rvz: 299.5-300.5 F: - cESI SRM [email protected] [299.50-300.50,325.50-326.501 MSSpoto1_07021 6054726
NL:6.04E9r/z= 325.5-326.5 F:. cESI SRM [email protected] [299.50-300.50,325.50-326.501 MSSpolo1_07021 6054726
7.64E4m/2= 31 1 .5-312.5 F: - cESI SRM ms2a<a n6^r < nn I
311.50-312.501 MSSpot01_0702 1 6054726
10(
9i
8l
7a
d
42
2a
2(
1l
Tlme (min)
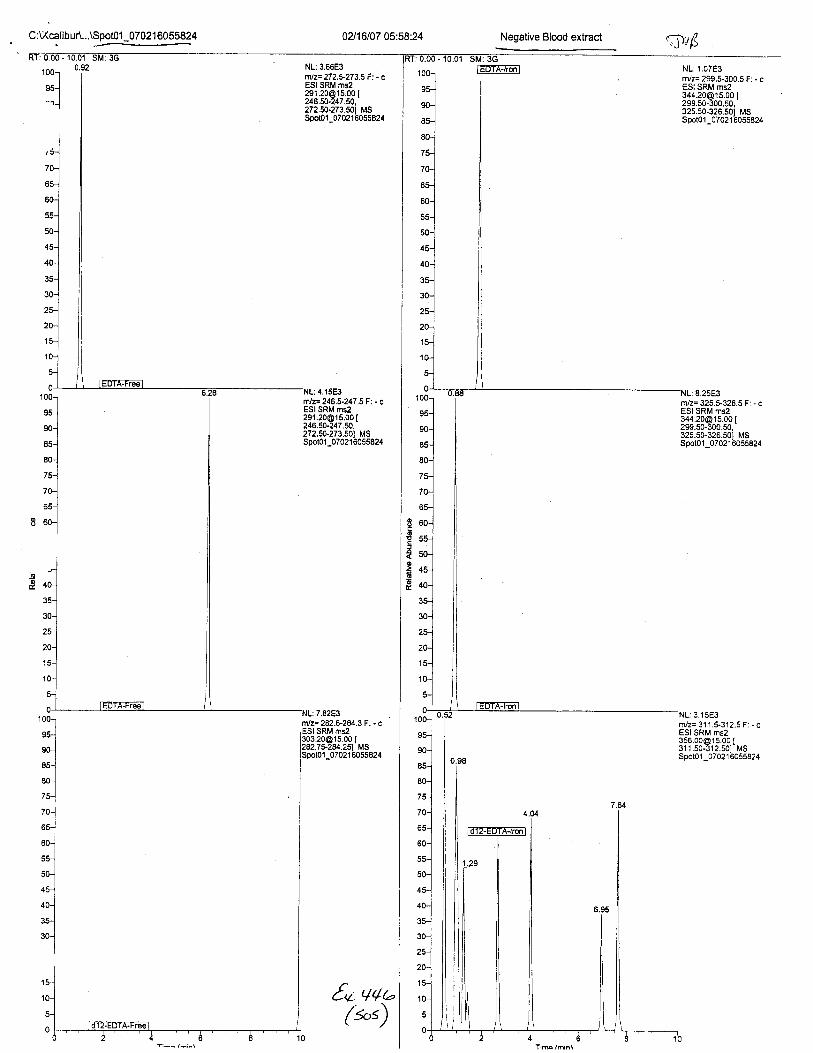
C:l'(calibuA...\Spot01_07021 6055824 02116107 05:58:24
NL: 3.66E3mlz=272.5-273.5 F: - cESI SRM [email protected] [246.fi-247.50,272.50-273.501 MSSpoto'l_07021'605582,1
NL:4.15E3mlz= 246.5-247 .5 F: - cESI SRM [email protected] [246.50-247.fi,272.50-273.501 MSSpoto l_07021 6055824
44a
Io
o
6
10{
8{
7!
7(
b:
5:
5L
35
3C
=282.+2U3F: - cms2
D15.00 [284.251 MS070216055824
(*')
Negative Blood extract^qjr6
NL:1.07E3rvz= 299.5-300.5 F: . cESI SRM [email protected],325.50-325.501 MSSpot01 _0702'l'6055E24
r/z= 325.5-326.5 F: - cESI SRM [email protected] [299.50-300.s0,325.50-326.501 MSSpoto1 _07021'6055824
NL: 3.1 5E3mfz= 31 1.5.312.5 F: - cESI SRM [email protected] [311.50-312.501 MSSpoto1 _07021'6055824
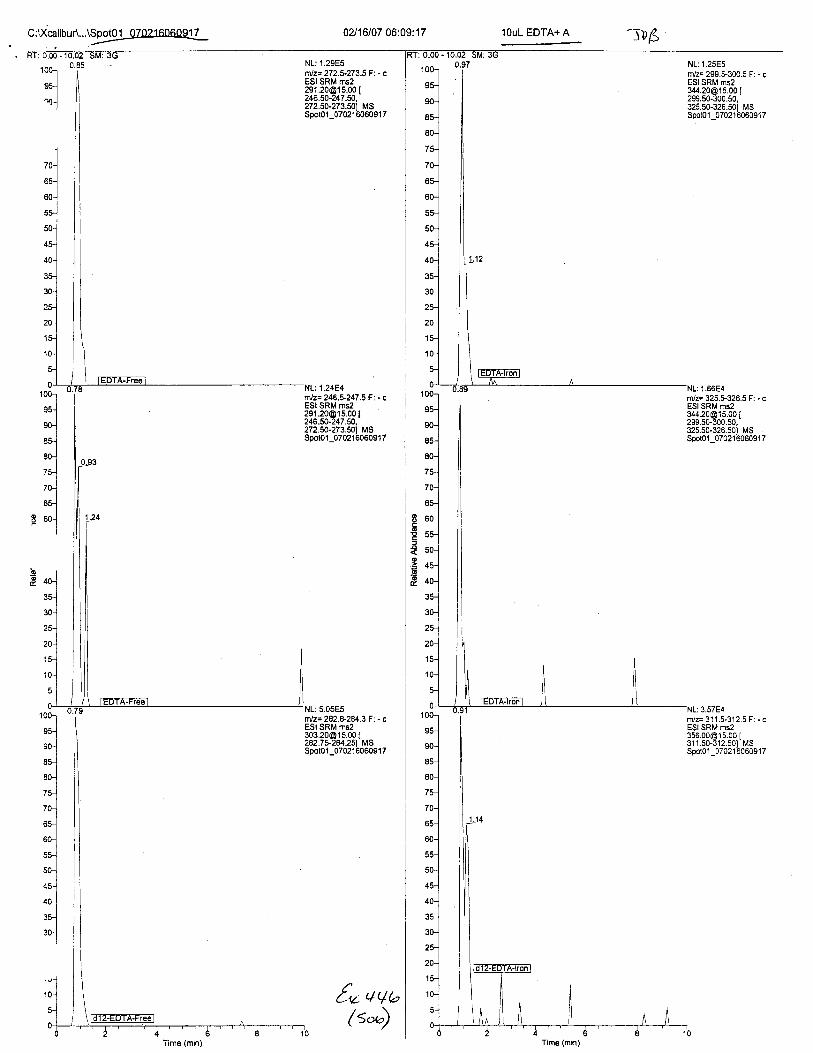
C:XcalibuA...\SootO1
'ol "it,u'l ll
'o-l I I
02116107 06:09:17 lOuL EDTA+ A llu/'NL: 1.29E5ntlz= 272.5-273.5 F: - cESI SRM [email protected] [246.50-247.fi,272.s0-273.501 MSSpoto l_07021 606091 7
m/z= 299.t300.5 F: - cESI SRM [email protected] I299.50-300.50,325,50-326.501 MSSpoto1 _07021606091 7
NL: 1.2484nlz= 246.5-247 .5 F: - cESI SRM [email protected] [246.50-247.50,272.50-273.501 MSSpoto l_070216060917
nlz=242.&2U.3 F: - cESI SRM [email protected] [282.75-2U.25) MSSpol01_07021 606091 7
1.66E4ruz= Jl5.+JZb.a f :- cESI SRM [email protected] [299.50-300.50,325.50-326.501 MSSpoto1_07021 60609'l 7
o
6E
€o
.!loE.
fo qqb(s4
Time (min) Time (min)

C:\j(calibur\...\SpotO1_07021 606201 3 02116107 06:20:13
NL:2.74E3fitlz=272.5-273.5 Fi - cESI SRM msz291 [email protected] [246.50-247.50,272.50-273.501 MSSpot01_07021 606201 3
Negative Blood extract TNB
1001
*loo_J
nvz= 299.$.300.5 F: - cESI SRM [email protected] I299.so.5oo.so,'325.50-326.501 MSspoto1_0702'tb062o.t 3
nfz= 31 1.9312.5 F: - cESI SRM [email protected] [311.s0-312.501 MSSpoto1_07021'606201 3
1001
9flI
s0-lqa-l*lroJ
rr-lto-l
es-]
E 60--1
rnlz=246.5.247.5 F: - cESI SRM ms2291 [email protected] [246.50-247.50.272.50-273.soi MsSpotol_07021 606201 3
nlz=282.8-Z8/..X F: - cESI SRM [email protected] [282.75-2U.251 MSSootol 070216062013
L/ tl
ocd
€o
6
Time (min)
(t.t)

C :\Xcalibur\...\SpotO1 _07021 60631 08..,------ 02116107 06:31:08
mlz= 272.5-273.5 F'. - cESI SRM msz' [email protected] [246.50-247.50.272.50-273.s0i MsSpoto1_07021 606310E
NL: '1.03E4
trlz=246.*247.5F:-c
&. +vro( s"r)
1oo-l 'i'"-lil^!il
NL; 8.64E4n/z= 299.5-300.5 F: - cESI SRM [email protected] [299.50-300.50.325.50-326.501 MSSpoto1_07021'6063 1 O8
1001
qr-.1*tso-l
i
--i80-]
I
tu-]
roloc-1
e .o-l
ESI SRM [email protected] I246.50-247.50,272.50-273.50t MSSooto1 070216063'106
.rJ/z= 242.8-28/..3 F: - cESI SRM [email protected] {2A2.75-2U.251 MSSpoto l_07021 60631 08
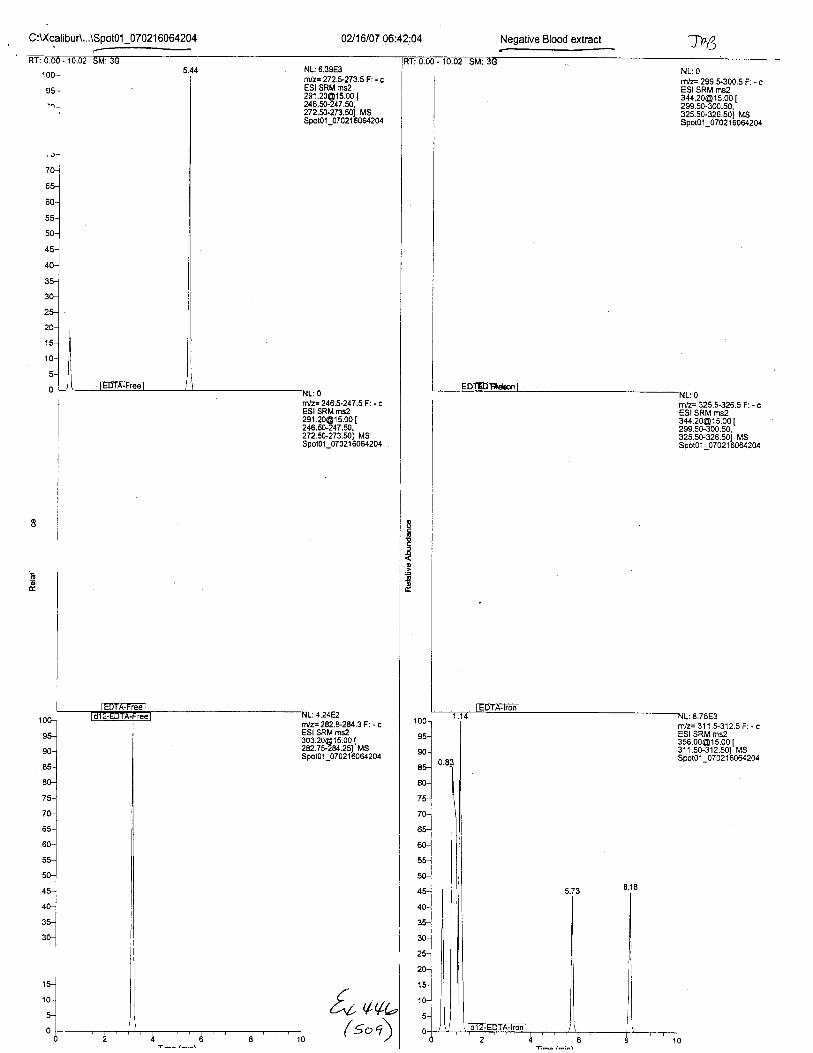
C :!Xcalibur\-..\Spot01_0702 1 6064204 02116107 06:42:04 Negative Blood extract -T1)a
r/z= 325.5-326.5 F: - cESI SRM [email protected] [299.5G.300.50,325.50-326.501 MSSpoto1_07021'6064204
100-.]l*l
'I
NL:6.39E3rnlz=272.?273.5F: - cESI SRM [email protected] [246.fi-247.50,272.50-273.501 MSSpoto1_07021'6064204
nlz=246.5-247.5 Fi - cESI SRM [email protected] [246.fi-247.50.272.50-273.501 MSSpoto1_07021 6064204
NL:4.2482ff'lz=282.*2U3F.- cESI SRM [email protected] (
282.75-2U.251 MSSpol01_07021 6064204
o
oE:
do
m/z= 31 1.5-312.5 F: . cESI SRM [email protected] [311,50-312.501 MSSpoto1_07021 6064204

C:LXcalibur\...\Spot01 _0702 1 6065301 02116107 06:53:01 lOuL EDTA+ C
.lj/z=272.5-273.5F: - cESI SRM [email protected] [246.50-247.50,272.50-273.501 MSSpoto1-07021'6065301
mlz= 282.*2U.3 F: - cESI SRM [email protected] [282.75-2U.251 MSSpot01-07021-6065301
Oqv
NL: 1.42E5miz= 299.5-300.5 F: - cESI SRM [email protected] [299.50-300.50,325.50-326.501 MSSpot01_0702 1 6065301
o.-l*l*-l
*.1I
^-lro-]
ru-l
$ *-1
nz= Jz5.'Jzb.5 F: . cESI SRM [email protected] [299.50-300.50,325.50-326.501 MSSpot01_0702'16065301
(t,")
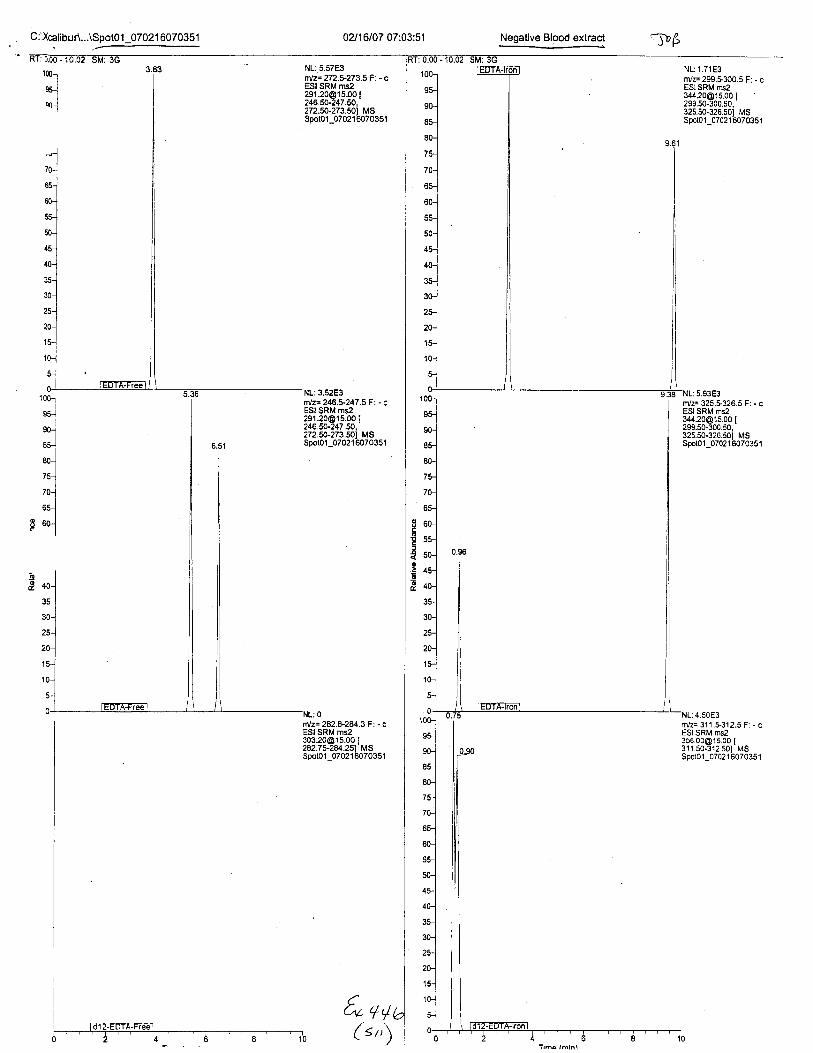
C:'Xcalibur\...\SootO1 07021 6070351 02116107 07:03:51
r,1z= 272.5-273.5 F: - cESI SRM [email protected]
rl.s2r5.00 [
246.50-247.50.272.50-273.501 MSSpoto1_07021-6070351
ESI SRM [email protected] [246.50-247.50,272.50-273.501 MSSpoto1-07021'6070351
mlz=282.&2U3 Fi - cESI SRM [email protected] [282.7t2U.251 MSsootol 07021b070351
Negative Blood extract
-
ltD6
t*rni.oJ
NL: 1.71 E3rniz= 299.9300.5 F: - cESI SRM [email protected] I299.50-300,s0.325.50-326.501 MSSpoto1_07021 6070351
NL:5.93E3r/z= 325.$326.5 F: - cESI SRM ms234420@15,00 [299.50-300.50,325.50-326.501 MSSpoto 1_07021'607035'l
o
o
4.50E3nvz= 31 L5-31 2.5 F: - cESI SRM [email protected] I311.50.312.s01 MSSpot01_07021 6070351
6" ++(s t,)
i

TM IDIAGNOSTICS
t" 4*ui rz-r)

C:U(uElibur\...\EDTA\BreweA021 507U1 501
t::*lro-l
ru-]
ro-]
tul
^-l6s-1
o ^^ls, ."1
nlz=246.1247,5F: + c 951 Pr', t"[email protected] I125.00.315.00t MS21501
[<. aa'^/ '\*iJruqMA
^ ,,, A"'vV YV\,ry'\,\
( <,t
100 ppm EDTA tm
r#sE RT:0.79 AV: 1
+ c ESI Full ms2 [email protected] [ 125.00-315.001
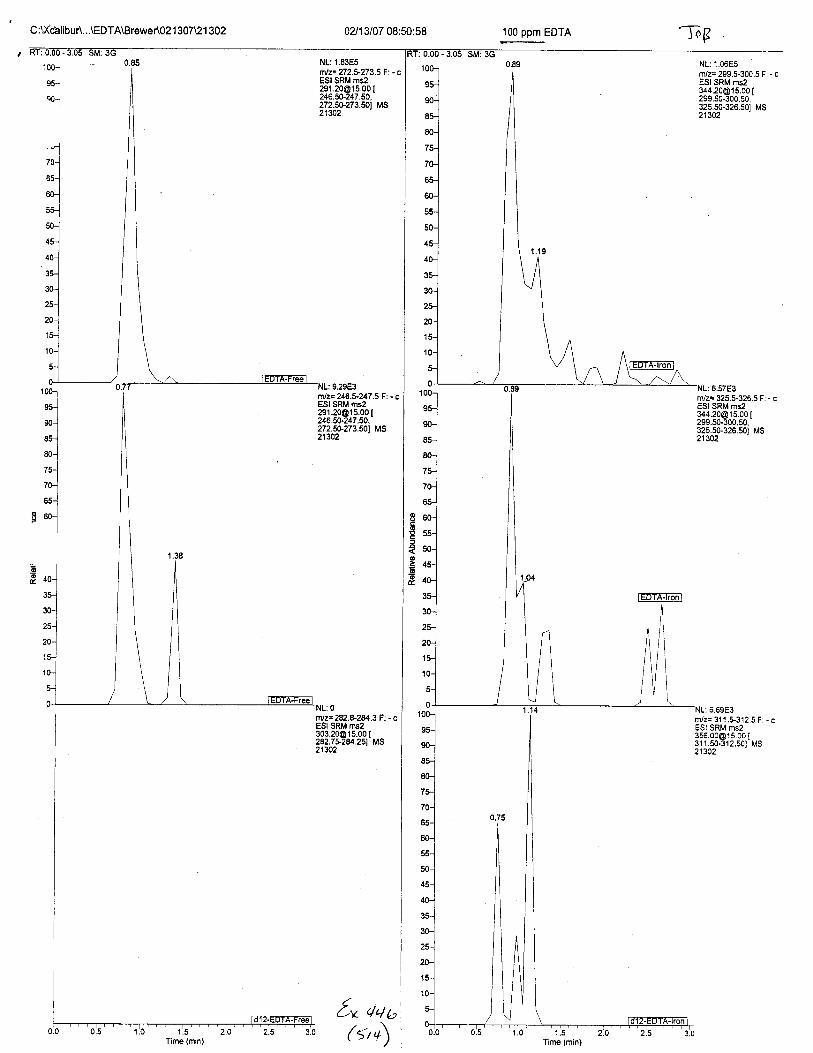
ClXcelibuA...\EDTA\BreweA02 1 307U1 302 0U13107 08:50:58 100 ppm EDTA -l?p
NL: 1.06E5nvz= 299.5-300.5 Ft . cESI SRM [email protected] [299.50-300.50,32s.50-326.501 MS21302
ED'fFronl
oooE:oo6
r/z= 325.t326.5 Fi - cESI SRM [email protected] [299.5G300.50,325.5G326.s01 MS21302
m/z= 311.t312.5 F: - cESI SRM [email protected] MS21302
rnlz=282.E-2U3F: -cESI SRM [email protected] [282.7r2U.251 MS21302
f* ,/r/ o(*\
Time (mrn)

' C :L\calibur\...\EDTA\Brewe rl}ZlzdlUlZ}i\t 0?/1407 02:33:58
rolrul
"-l811
eo-l
'JJ--l
o ^^l"*l
NL:2.87E5fiVz:159.$160.5F:+cESl [email protected] [125.0e315.001 MS21206
NL: 3.71E5Ttc Ms 21206
f*+
NL:5.52E4r.lz=246.*247.5F: + c ESI Full [email protected] [125.00-315.001 MS21206
(<,)
( tOO ppm EDT]) 76.r\----+ c ESI Full ms2 [email protected] [ 125.00-315.00]
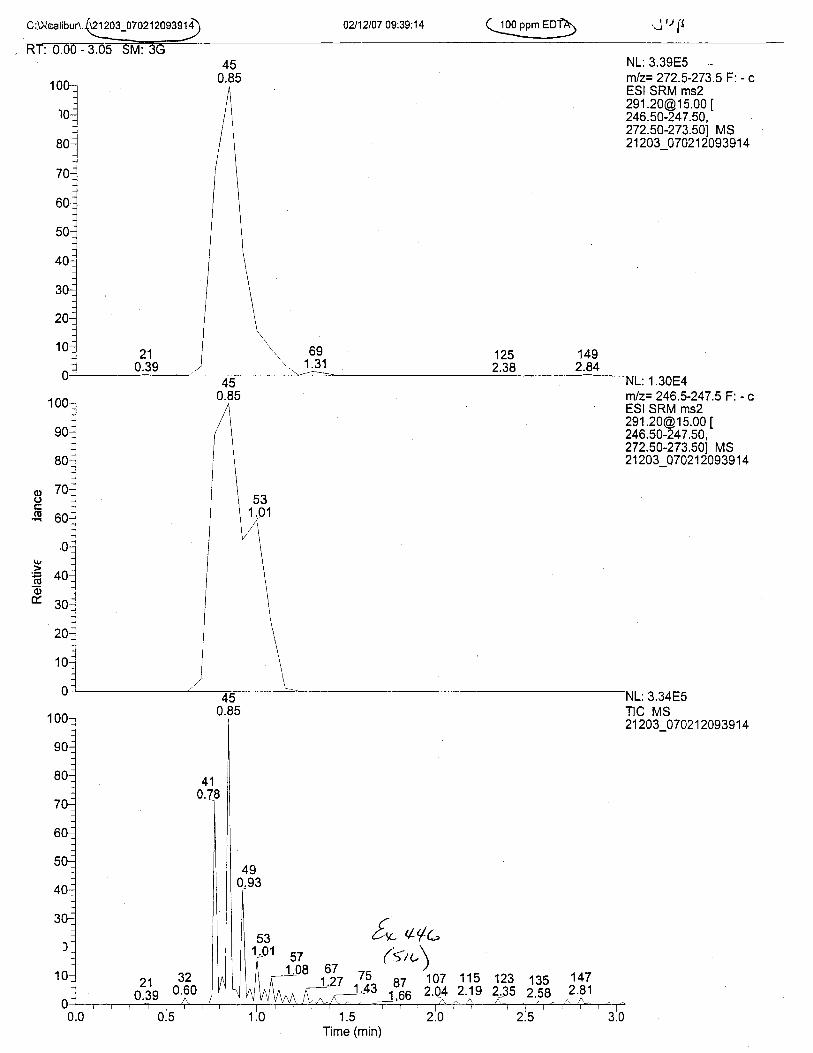
\21203 07021209391
\6e
NL:3.39E5mlz= 272.5-273.5 F: - cESI SRM [email protected] [246.50-247.50.272.50-273.501 MS21203 070212093914
L: 1.30E4mlz-- 246.5-247.5 F: - cESI SRM [email protected] [246.50-247.50,272.50-273.501 MS21203_Q7021 209391 4
TIC MS21203_070212A93914
o)oo
_gq)E,
fo ngt(*u\
123 1352,35 2.SB
1472.81
1qTime (min)
% ;:J_^
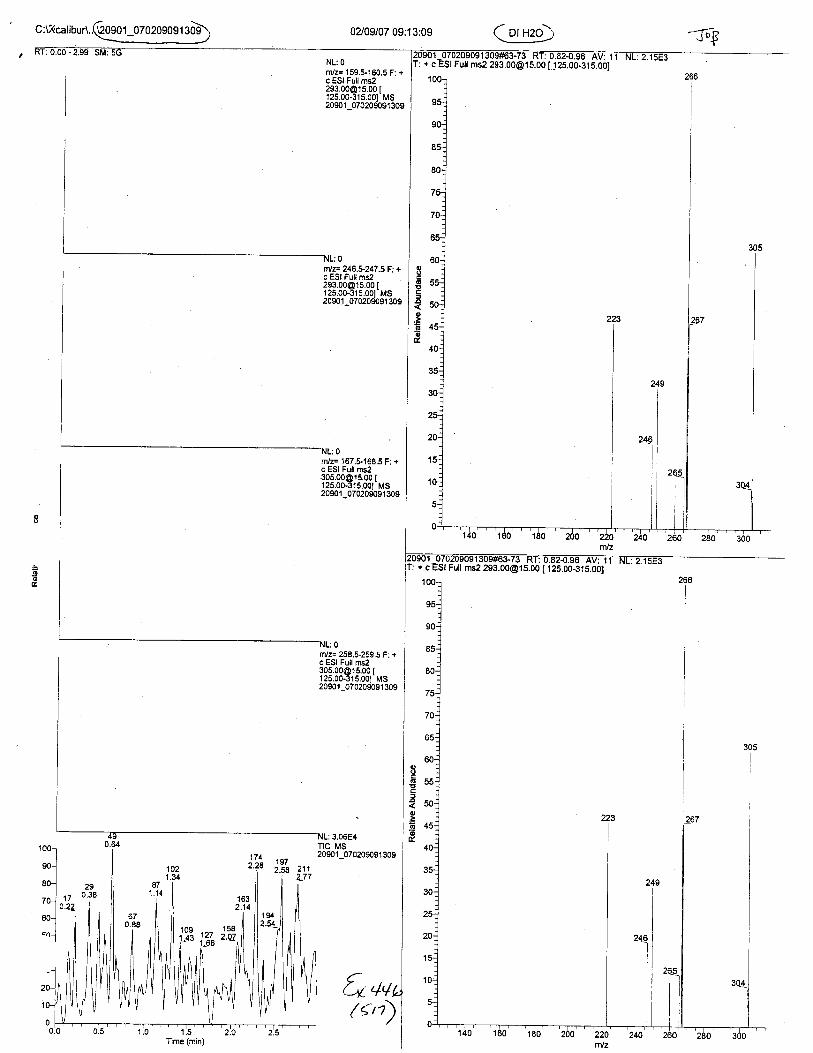
c:\Xcatibur\..Q{!1-o7o20s0sl 3d}'\ 0?/09107 09:13:09 QsD -fpn
r/z= 159.$160.5 F: +c ESI [email protected] MS20901_o7o2oEo91 309
NL:0fflz= 246.*247.5 F: +c ESI [email protected] [12s.00-31s.001 Ms20901_07020fu9,1309
rnlz= 258.t259.5 F: +c ESI Full [email protected] [125.00.315.00t MS20901_0702orh91 309
!,ooE
o':Eo
r: + cESt rulinilisS.ooqnd.bb iizs.obnri.obf
:3.06E4TIC MS2090 1_070209091 309
4q
Full ms2 [email protected] [ ]2s.00-315.001
trr/z= 157.$'168.5 F: +c ESI Full [email protected] [125.00-315.00t MS2090 1_07020sh91309
({,')
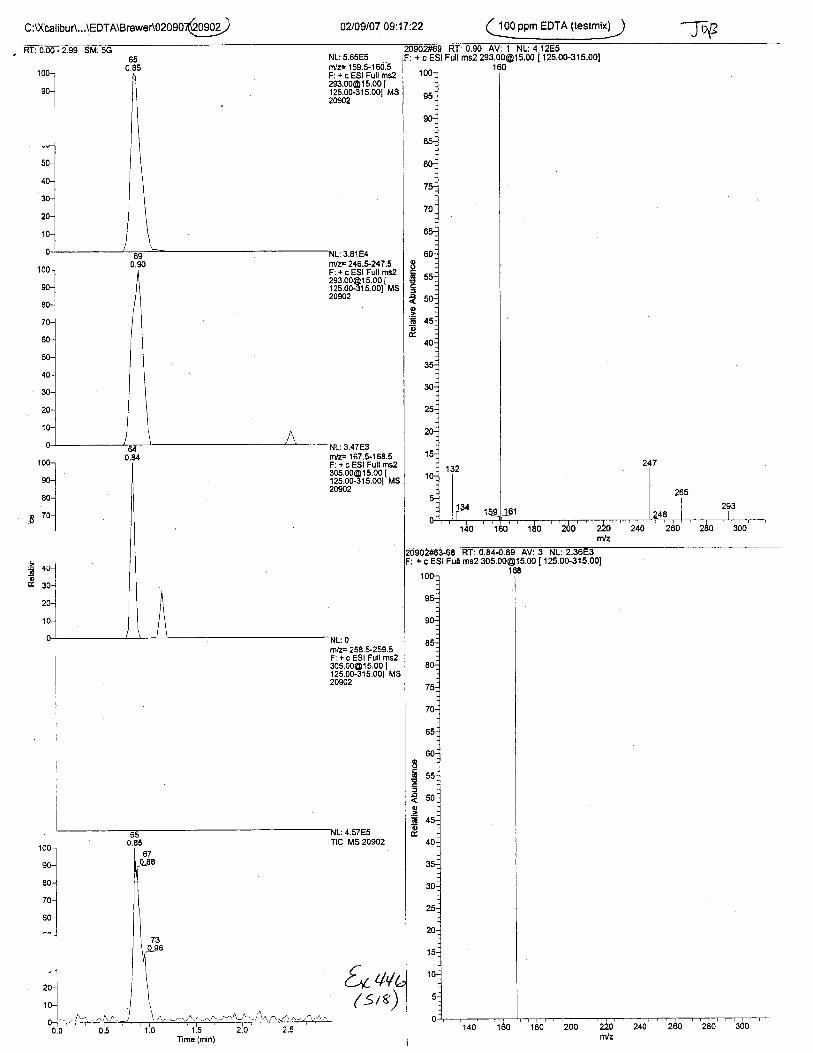
/\C :\XcalibuA...\EDTA\Brewer\02090iw91 02109107 09:17:22 -trF
:,1
NL:5.65E5nr/z= 159.S1605F: + c ESI Full [email protected] [125.00-315.001 MS20902
li:,lz=246.+247.5F: + c ESI Full [email protected] MS20902
:3.81E4
:3.47E3
:4.57E5Tlc MS 20902
rn/z= 167.$168.5F: + c ESI Full ms2305,[email protected] [125.00-315.001 MS20902
rrz= 258.5-259.5F: + c ESI Full [email protected] [125.00-315.001 MS20902
Eo
:ooGE
oo
o
Go
f,*u{
100-l
qnl--l.ol.^l:^.1*-l--.1
( srt)

C:\Xt]alibuA...\EDTA\BreweAO2090700903 J 0209107 09:25:27 (sss onm each EDrA, d12 EDTA )U., -.) J 9f
'::l-.]
NLr 4.38E5nVz= 159.5-'160.5F: i c ESI Full [email protected] [125.00-315.001 MS20903
rnlz=246.*247.5F: + c ESI Full [email protected] [125.00-315.001 MS20903
: 4.'19E4
6.67E5
oo6p
oooE
oo6
ao
.oo
10or
*-].o-l
. ,O-lel
'E .oe830
20
m/z= 167.$168.5F: + c ESI Full [email protected] [125.00-315.001 MS20903
ruz= z5d.+4Y.cF: + c ESI Full [email protected] [125.00-3'15.001 MS20903
foq
C903#6&71 RT: 0.66.0.91 AV: 3 NL: 6.70E5: + c ESI Full ms2 [email protected] [ 125.00-315.001
168
+ c ESI Full ms2 [email protected] [ 125.00-315.00]
Time (min)
(sre)
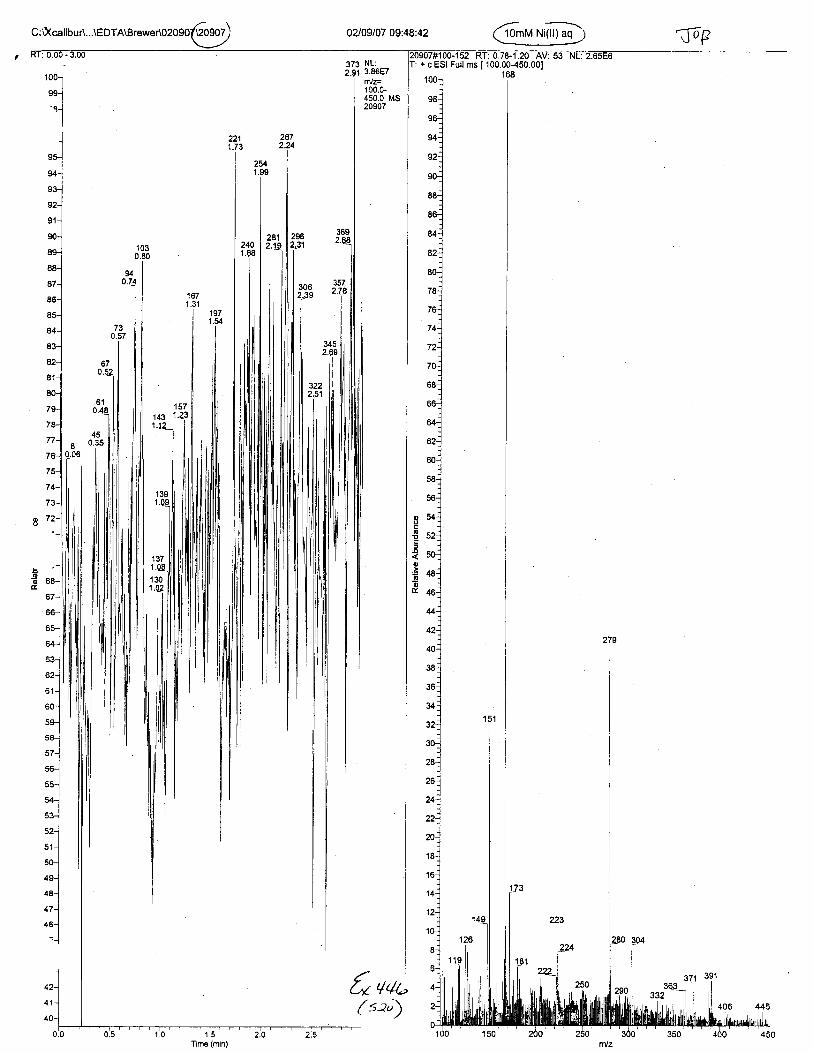
@v@+ c ESI Full ms [ 1 00.00-450.001
02109107 09:48:42C:rXcalibuA...\EDT
NL:J.OOEf
m'Jz=100.0-450.0 MS20907
1001
ooJ--l
221 2871.73 ?.24
610.4r
45I
9F
94-
90-
89-
88-
a7-
AF-
85-
E4-
A?-
a2-
81-
80-
79-
7A-
76-
/c-
74-
72-
,-
ilt 2le
ooE
o
oo
&,
@
o

Rn{-I6:
C:B(calibur1...\EDTA\BreweA0209o(999) 02109107 09r59:35 ( eorn neg swab (2tzo7i,1\-------.- J e(t
NL:0nVz= 159.$160.5F: + c ESI Full [email protected] [125.00-31s.ool Ms2090E
rn!z= 246.$247 ,5F: + c ESI Full [email protected] [125.00-315.001 MS20908
+ c ESI Full ms2 [email protected] [ 125.00-315.001
:1.23E4
oooE
o
66
oo6
6
oo6
740.97
I
,l
r/z= 1675168.5F: + c ESI Full [email protected] [125,00-3'15.001 Ms20908
3.44E4MS 20906
{n lvu( sat)
w6*IS-1o t(t:U.9/{r.99 AV: Z NL: t.t9E/t+ c ESI Full ms2 [email protected] [ 125.00-315.00]
z.za167Z.E
720.94
I
I
lzo
479
Tlme (min)

C :\Xb€ libu r\...\EDTA\BreweA02O907€@ OAOglO710:10:53 @, FT-030.-i
0909#6E-76 RT: 0.90-0.98 AV: I: + c ESI Full ms2 [email protected] [
:7.09E3rVz= 167.5-168.5F: + c ESI Full ms2
?33:3&@.13193tu'20909
NL: 2.E'1E3nl/z= 258.$259.5F: + c ESI Full [email protected] I125.00-315.001 MS20909
I
t.lqIEtoI<lol6
7.s3Es | ,9Ms2osos
j
I
I
I
6uo')&rlI
NL:9.35E5rn/z= 'l 59.5-1 60.5F: + c ESI Full [email protected] [125.00-315.001 MS20909
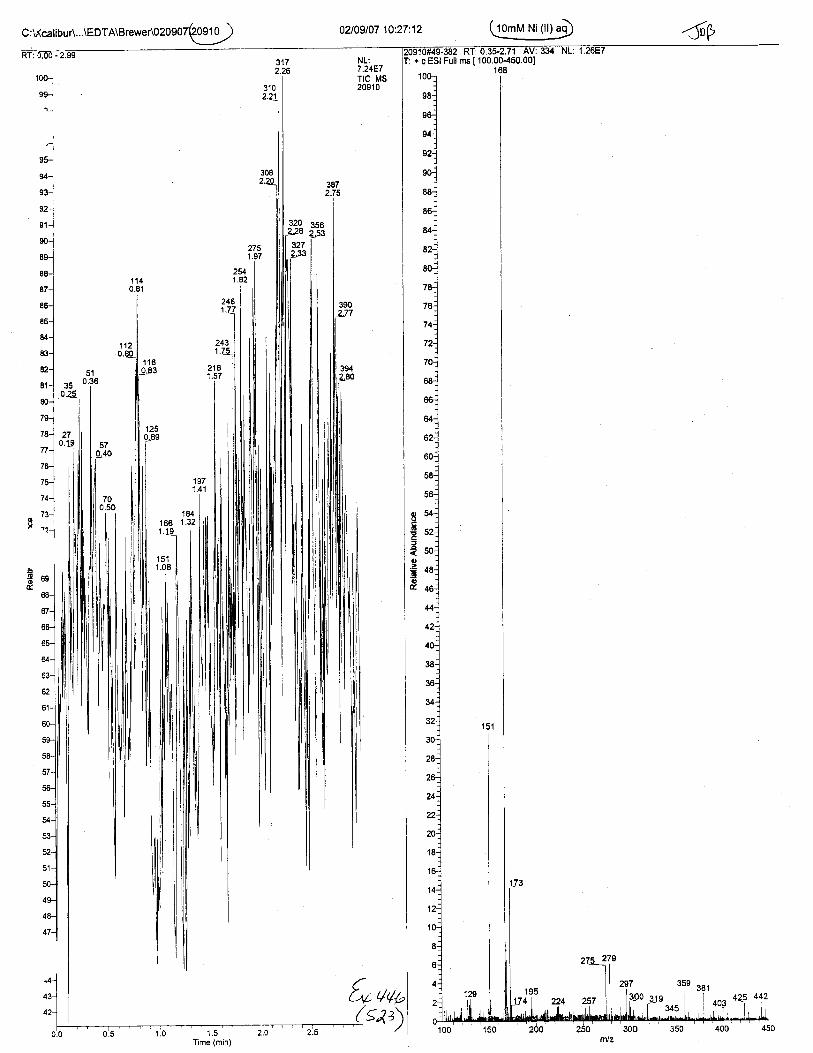
243
2141.57
94-
92-
91-
90-
8E-
87-
E6-
t<-
84-
q?-
82-
81-
80-
79-
t6-
I)-
74-
73-o'a-
C:\i(calibur\...\EDTA\Brewer\020907Q0910 ) oztogloT lO:27:12 (tomy1y@ 5P
TIC MS20910
5l35 -;-
t"u
:417 NL: lT: + c ESI Full ms [ 100.00450.00]i.ils 7.24Et I .^^ 168
oo6E
ooG6t
(Ea) *1 o'5, oot',

REFERENCES
to+,to(<^+)
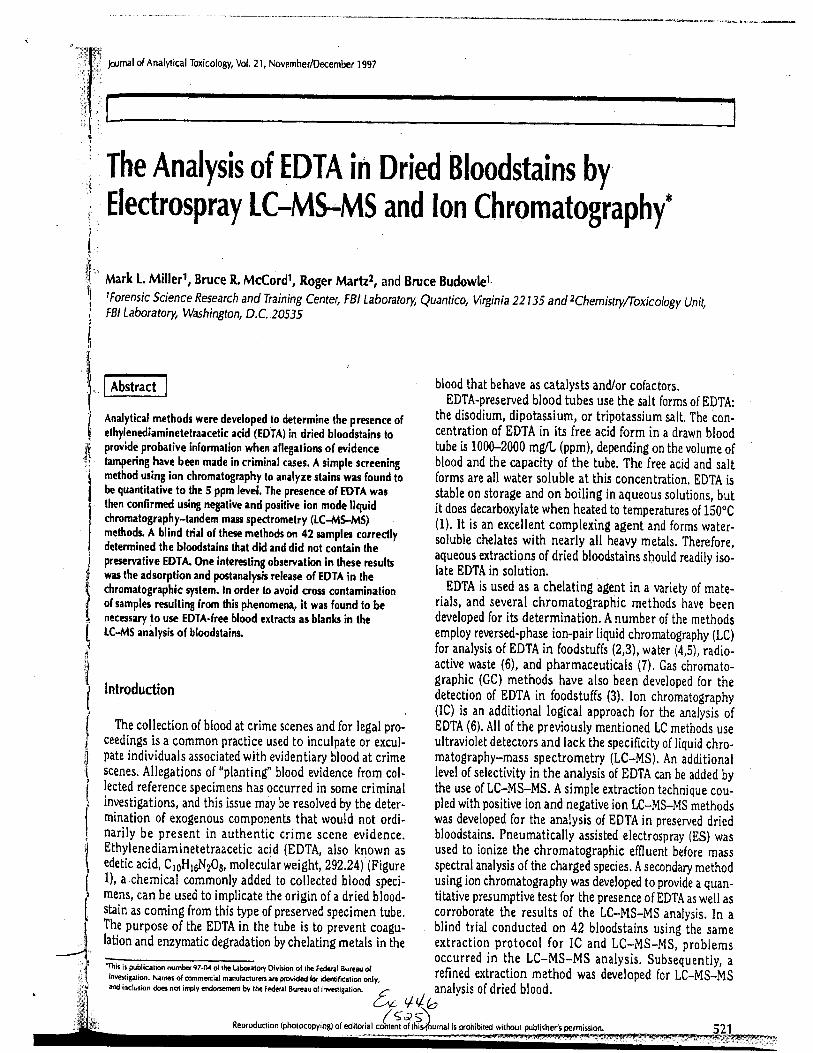
Joumal of Analytical Toxicology, Vol, 21, November/December I 997
1
r
L
t:1f1ttliq
The Analysis of EDTA in Dried Bloodstains byElectrospray LC-MS-MS and lon Chromatography-
Mark [. Millerl, Bruce R. McCordl, Roger Martz2, and Bruce Budowlet.tForensic Science Research and Training Center, FBI Labotatory, Quantico, Vrginia 22135 and zChemistryIoxicology L)nit,FBI Laboratory, Washington, D.C. 20535
blood that behave as catalysts and/or cofactors,EDTA-preserved blood tubes use the salt forms of EDTA:
Analytical methods were developed to determine the presence of the disodium, dipotassium, or tripotassium salt, The con-ethylenediaminetetnacetic acid'(EDTA) in dried bloodsrains ro centration of EDTA in its free acid form in a drawn bloodprovide probative information when allegations of evidence tube is 1000-2000 mg/L (ppm), depending on the volume oftanpering have been made in criminal cases. A simple screening blood and the capacity of the tube. The free acid and saltmethod using ion chromato6nphy to analyze slains was found to forms are all water soluble at this concentration. EDTA isbe quantitative to lhe 5 ppm level. The presence ofEDTA was stable on storage and on boiling in aqueous solutions, butthen confirmed usingnegative and positive ion mode tiquid it does decarboiylate when heatel to temperatures of l!g"Cchmmatography-tandem mass spectrometry (LC-[tsMS) .. (I). lt is an excellent comprexing agent and forms water-
ff*ttl|ii,*ill*T"L'$:|,ofi"1:"T[li?,"'il:o't '.ilui,ir',r.tes with neaity auieavy metars. Thererore,
preservative EDTA. one intensting observalion in these ns'ults aqleous exhactions of dried bloodstains should readity iso-
was the adsorption and postanalysi-s release of EDTA i" il;-'- late^E-DTA in solution.
chromatograpiic system. In order to avoid cros contamination . IDTA is used as a chelating agent in a variety of mate-of samplei resulting from this phenomem, it was found to bc rials, and several chromatographic methods have beennec€ssary to use EDTA-free blood extracls as btanks in the developed for its determination. A number of the methods[C-MS analysis of bloodstains. employ reversed-phase ion-pair liquid chromatography (LC)
for analysis of EDTA in foodstuffs (2,3), water (4,5), radio-active waste (6), and pharmaceuticals (7), Gas chromato-rntroduction i:ill[Jr,?Lffiflj.,,:'J,ffi[i$:1?",:""f1,.1ffi1;(lC) is an additional logical approach for the analysis of
The collection of blood at crime scenes and for legal pro- EDTA (6). All of the previously mentioned LC methods useceedings is a common practice used to inculpate or excul- ultraviolet detectors and lack the specificity of liquid chro-pate individuals associated with evidentiary blood at crime matography-mass spectrometry {LC-MS). An additionalscenes. Allegations of "planting" blood evidence from col- level ofselectivity in the analysis of EDTA can be added bylected reference specimens has occurred in some criminat the use of LC-MS-MS. A simple extraction technique cou-investigaiions, and this issue may be resolved by the deter- pled with positive ion and negltive ion LC-M$-MS methodsmination of exogenous components that would not ordi- was developed for the analysis of EDTA in preserved driednarily be present in authentic crime scene evidence. bloodstains. Pneumatically assisted electrospray (ES) wasEthylenediaminetetraacetic acid (EDTA, also known as used to ionize the chromatographic efflueni before massedetic acid,. C 1eH16N20s, molecular weight,292.24) (Figure spectnl analysis of the charged species. A secondary methodl), a chemical commonly added to collected blood speci- using ion chromatography was devetoped to provide a quan-mens, can be used to implicate the origin of a dried blood- titative presumptive test for the presence of EDTA as will asstain as coming from this type of preserved specimen tube. corroborate the results of the LC-lvlS-MS analysis. In aThe purpose of the EDTA in the tube is to prevent coagu- blind trial conducted on 42 bloodstains using it', rimlation and enzymatic degradation by chelating metals in lhe extraction protocol for IC and LC-MS-MS;problems_occurredintheLC-Iv1S-Iv1Sanalysis.Subsequently,allll;.1?::iil:Ttr'#1,'::::Hil1::,ffi:iffff,#f"T9,,, refined extraction method was developeo ror rb_usjr,riatdincluiondcndimptyendffi€rnbythcFcdart Burcauoltru€nisarim. - analySiS Of dfigd blOOd.
4"1 44bReproduoion (photocopyint) of edito{ial ."(.ff,r?),"a1 is prohibired wirhout pubtisher's permission.
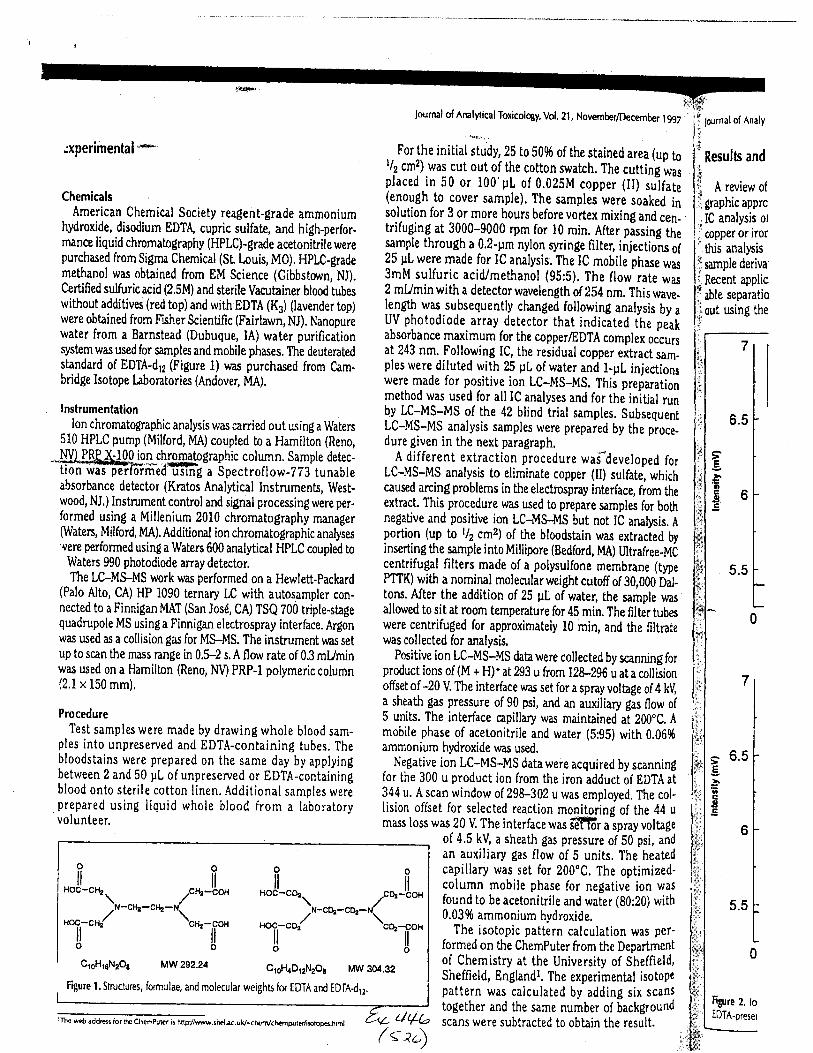
;xperimental*
ChemicalsAmerican Chemical Society reagent-grade ammonium
hydroxide, disodium EDTd cupric sulfate, and high-perfor.mance liquid chromatography (HPLC)-grade acetonitrile werepurchased from Sigma Chemical (St. Louis, M0), HplO-grademethanol was obtained from EM Science (Cibbsto,vn, NJ).Certified sulfuric acid (2.5M) and sterile Vacutainer blood tubeswithout additives (red top)and with EDTA (K3) (lavender top)were obtained from Fisher Scientific (Fairlawn, NJ). Nanopurewater from a Barnstead (Dubuque, IA) water purificationsystem was used for sampla and mobile phases. The deuteratedstandard of EDTA-dp (Figure 1) was purchased from Cam-bridge Isotope Laboratories (Andover, MA).
Instrumentation
Ion chromatographic analysis was carried out using a Waters510 HPLC pump (Milford, MA) coupled to a Hamilton (Reno,
$UtgRAlg0#Lchromatoeraphic column, sample detec-ruon was perrormed us'fi'g; bpectroflow-273 tunableabsorbance detector (Kratos Analytical Instruments, West-wood, NJ.) Instnrment control and signal procasingwere per.formed using a Millenium 2010 chromatography manager(Waten, Milford, MA), Additional ion chromatographic analyses'lere performed using a Waters 600 analytical HPLC coupled to
Waters 990 photodiode array detector.The LC-MS-MS work was performed on a Hewlett-Packard
(Palo Alto, CA) HP 1090 ternary LC with autosampler con.nected to a Finnigan MAI (San Josd, CA) TSQ 700 triple*tagequadrupole MS using a Finnigan electrospray interface. Argonwas used as a collision gas for MS-MS. The instrument was setup to scan the mass nnge in 0.5-2 s. A flow rate of 0.3 mUminwas used on a Hamilton (Reno, M PRP-I polymeric column(2.1 x 150 mm).
Procedure
Test samples were made by drawing whole blood sam-ples into unpreserved and EDTA-containing tubes, Thebloodstains were prepared on the same day by applyingbetween 2 and 50 pL ofunpreserved or EDTA-containingblood onto sterile cotton Iinen. Additional sarnples wereprepared using liquid whole blood from a laboratoryvolunteer.
loumal ofAnalytical Toxicology, Vol. 21, November/December 1997
. For the initial study, 25 to 5096 of the stained area (up t0tl2 cm2l was cut out of the cotton swatch. The cutting waiplaced,in 50 or 100'pL of 0,02SM copper (il) sulfate(enough
.to _cover sample). The samples were soaked insolution for 3 or more hours before vortex mixing and cen-trifuging at 3000-9000 rpm for l0 min. After passing thegmqle through a 0.2-pm nylon syringe filter, injections oi25 pL were made for lC analysis, The IC mobile phase was3mM sulfuric acid/methanot (g5:5). The flow rate was2 mUmin with a detector wavelength of 25{ nm. This wave.length was. subsequently changed following analysis by aUV photodiode array detector that indicatea fne pea[absorbance maximum for the copper/EDTA complex occursat 243 nm. Following IC, the residual copper extract sam-ples were diluted with 25 pL ofwater and l-pl injectionswere made for positive ion LC-MS-MS. This preparationmethod was used for all IC analyses and for thi initial runby LC-MS-MS of the 42 blind trial samples. SubsequenrLC-MS-MS analysis samples were prepared by the proce_dure given in the next paragraph.
A different extraction procedure wai*developed forLC-IIS-MS analysis to eliminate copper (ll) sulfate, whichcaused arcing problems in the electrospray interface, from theextnct. This procedure was used t0 prepare samples for bothnegative and positive ion LC-MS-MS but not IC analpis. Aportion (up to l/2 cm2) of the bloodstain was extracted bvinserting the sample into Millipore (Bedford, I'4A) Ljltrafree-Micentrifugal filters made of a polysulfone membnne (typePTTK) with a nominal molecularweight cutoff of 30,000 DiLtons. AIter the addition of 25 pL of water, the sample wasallowed to sit at room temperature for 45 min. The filter tubeswere centrifuged for approximately l0 min, and the filtntewas collected for analysis.
Positive ion LC-MS-MS data were collected by scanning forproduct ions of (M + H)+ at 293 u from 12&296 u at a collisionoffset of-20 V The interface was set for a spray voltage of4 kV,
a sheath gas pressure of 90 psi, and an auxiliary gis flow of5 units. The interface capillary was maintained at 200"C. A
mobile phase of acetonitrile and water (S:95) with 0.06%ammonium hydroxide was used.
Negative ion LC*MS-MS data were acquired by scanningfor the 300 u product ion from the iron adduct of UOtl at344 u. A scan window of 29&302 u was emptoyed. The col-lision offset for selected reaction monitorin{ of the 44 u
mass loss was 20 V The interface was ieT6r aiptay voltage
1 lournal of Analy
'Results and
lt*i A revlew 0lE .,:. grapnlc appro
,,lC analysis ot
" copper or iror
'this analysis
llsample deriva
E
o56
t0
r 6.5E
acoc
of 4.5 kV a sheath gas pressure of 50 psi, andan auxiliary gas flow of 5 units. The heatedcapillary was set for 200"C. The optimized-column mobile phase for negative ion wasfound to be acetonitrile and water (80:20) with0.03% ammonium hydroxide.
The isotopic pattern calculation was per-formed on the ChemPuter from the Departmentof Chemistry at the University of Sheffield,Sheffield, Englandt, The experimental isotopepattern was calculated by adding six scanstogether and the same number of backgroundscans were subtracted to obtain the result.
5.5
Fi6'ure 2. loE0TA-preset
Figure 1. Structures, formulae, and molecular weights for EDTA and EDTAdl2,
'Thf w€b .ddr6r for tfE Chefipuler is hnp.//ffi,sh€{&.uw-chcny'cfrmplrcrtElop6.hht, tJtlb

rr/Decemberof Analytica I Toxicology, Vol. 2 1, Novemlrer/December I 997
ts and Discussioned area.rtting
)s A review of the litenture indicated that ttre best chromato- I l- -rt J ',04 approach for the determination of EDTA used HPLC or
nng andi analysis of colored complexa formed between EDTA andor iron (2-6). Although procedures uist for performing
ile phase
ow rate
analysis by GC, thae methods rcquire time-consumingle derivatization and are prone to matrix interferenca (3).
n. Thisanalysis
ed theusing the ion exchange column PRP X-100 with sulfuric
nplexextract
tL iniprepar
re initialSu
Y the
veloped
rlfate,
.rce, from:les for
:xtracted
brane
nt applications published by Hamilton indicated accept-separations of EMA+opper complexes could be canied
acid/methanol mobile phases (8). Initial IC tating with Wdetection was carried out on standard samples of S0-100 ppmEDTA disolved in 0.025M copper (lI) sulfate. The results withthis eluent system were encounging; therefon, further testswere carid out on samples of liquid blood. IC samples were pre-pared from 200 pL of whole blood (EDTA preserved) by fintdiluting il to 2 mL with water and then diluting *re solution l:lwith 0.05M copper (ll) zulhte. This prepantionwas centrifugedfor 7 min, which left a clear supernahnt with a brown preripi-tate at the bottom. A large orcas of copper (II) sulfate helped toensure conversion of all free EDIA to the copper complet The
r passing
injection
^" 400
'le
If{llii{w"i&l
":,$t'1
ti!.i
ffi,.q
ili
ritii
fl
}iii
ule ll
canning
taage of4gas flowt 200"c.ith
'scannfEDTAl. Thethe 44
ry vol) psi,
re hea
'timiion
;20) ';20)witBdil
.vas pei,!
rartmer{:effieldisotonr{
500,000
400,000
F 300'000oo
200,000
100,000
00.2 4.4 0.6 0.8 1 1.2 1.4
Time (mln)
500,000
400,000
.B 300'0006g
2o0,oo0
100,000
Tlme (mln)
Figure 3. EDTA analysis of the proton adduct ion rnlz 293 by positive ion
full scan LC-MS-MS. Reconstructed ion chromatogram (solid line, scan
range 128-296 u) and EDTA product ion rnlz 160 (dashed line) traces
from unpreserved (A) and EDTA-preseved (8) blood stain extracts,
0 0.2 0.4 0.6 0.8 I 1.2 1.402468
Iime (mln)
Figurc 2. lon chromatograms of a 50 ppm EDTA standard (A) and anEDTAareserved blood extracl (B) at a detection wavelength of 254 nm.
scaru:
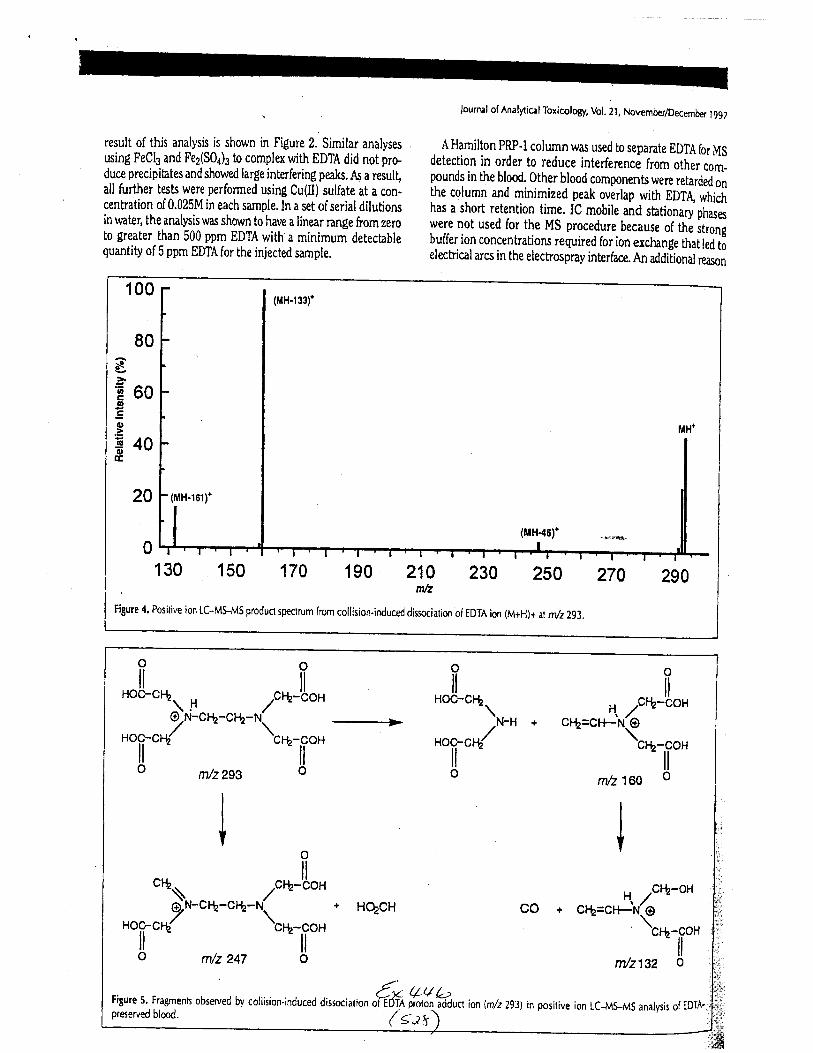
result of this analysis is shown in Figure 2. Similar analyses
using FeCl3 and Fe2(S04)3 to complex with EDTA did not preduce precipibtes and showed large interfering peal$. fu a resulfall further tests were performed using Cu(lI) sulfate at a con-centraiion of 0.025M in each sample. In a set of serial dilutionsin water; the analysis wu shown to have a linear nnge from zeroto greater than 500 ppm EDTA with a minimum detectablequantity of 5 ppm EDTA for the injected sample.
,lourna I of Ana lytica I Toxicology, Vol. 2 t, November/December I 997
A Hamilton PRP-I column was used to sepante EDTA for MSdetection in order to reduce interference from other comlpounds in the blood. Other blood components were retarded onthe column and minimized peak overlap with EDTA whichhas a short retention time. IC mobile and stationary phaseswere not used for the MS procedure because of the strongbuffer ion concentrations required for ion exchange that led ioelechical arcs in the electrospray interface. An additionar reason
IEaaEOU0,
.go-l840E
100
80
20
130 150 170 190 210 230 250mh
Figure 4. Positive ion LC-MIMS product spctrum from collision-induced dissociation of EDTA ion (M+H)+ at n/zzg3.
OOiliiHoC-cq\.H /cft-'bon
?N-c'.h-o-rr-Ni __+'of"* .,t-,1o"
o m/2p93 0
I
I
fo
"t\ t"u)LoEN-clt-clt-N\ * HqCH
Hoc.c/ tcq-coH
ll lo m/z 247 o
H /ct+z-o$co + cFl=61;-'\*-.o,-il
ny'z1\2 o
otl
HOC-CFtz\
N-H " CFh./noc-ct{/
tlo
rn/z 160
I
I
t
Figure 5. Fra8rnents observed by collision-induced dissociation "€tt^f^{€"ucr ion (m/2293) in posirive ion LCrvlMS analysis of EDTA, T
preserved blood. /( gty\' f:i::)'.
11"',r:,;
l:ttt.)*:,ffi
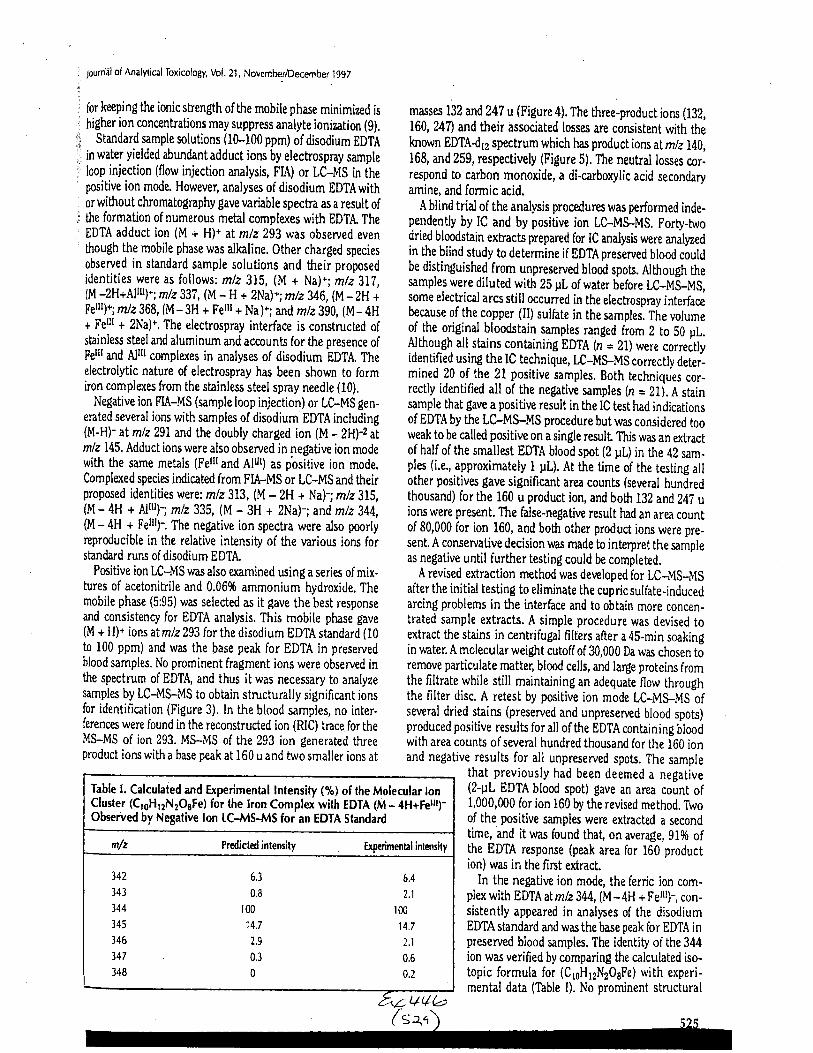
l6urnil of Analytical Toxicology, Vol. 2l , November/December I 997
. for keeping the ionic shength of the mobile phxe minimized is
I higher ion concentrations may suppress analyte ionization (g).,i Standard sample solutions (10-100 ppm) of disodium EDTA
i in water yielded abundant adduct ions by electrospray sample
:, loop injection (flow injection analysis, FIA) or Li-ltS in inepositive ion mode. However, analysa of disodium EDTA withor without chromatography gave variable spectra as a result of
;:, the formation of numerous metal complues with EDTA The' DDTA adduct ion (lvl + H)+ at mlz 293 was observed even' though the mobile phase was alkaline. Other charged species
observed in standard sample solutions and their proposed
identities were as follows: mlz 3I5, (M + Na).; m/23!7,(M -2H+dlttt;-. mlz 337 , (M - H + ZNal+; mlz 346, (M - 2H +Fettt)+; mlz 368, (M - 3H + Felll + Na )*; and mlz jgl, (M - 4H+ Feill + 2Na)*. The electrospny interface is constructed ofstainless steel and aluminum and accounts for the presence ofFelil and Allll complexes in analysa of disodium EDTA. Theelectrolytic nature of electrospray has been shown to formiron complexes from the stainles steel spny needle (10).
Negative ion FIA-MS (sample loop injection)or LGMS gen-
ented several ions with sampla of disodium EDTA including(l'l-H)- at mlz 29I and the doubly charged ion (M - 2H;-z utmlz 145. Adduct ions were also observed in negative ion modewith the same metals (pstll and Alllt) as pbsitive ion mode.Complexed species indicated from FIA-MS or LC-MS and theirproposed identities were: mlz 313, (M - 2H + Nah m/z 315,(M - 4H + Alrr)- mlz 335, (M - 3H + 2Na)-; and mlz 3M,(M - 4H + Fer)-. The negative ion spectra were also poorlyreproducible in the relative intensity of the various ions forsiandard runs ofdisodium EDTA,
Positive ion LC-MS was also oramined using a series of mix-tures of acetonitrile and 0.06% ammonium hydroxide. Themobile phue (5:95) was selected as it gave the best responseand consistency for 0DTA analysis. This mobile phase gave(M + H). ions atmlz293 for the disodium EDTA standard (10to 100 ppm) and was the base peak for EDTA in preservedblood samples, No prominent fragment ions were observed inthe spectrum of EDTA, and thus it was necessary to analyzesamples by LC-M$-MS to obtain structunlly significant ionsfor identification (Figure 3), In the blood samples, no inter-ferences were found in the reconstructed ion (RIC) tnce for theMS-MS of ion 293. MS-MS of the 293 ion generated threeproduct ions with a base peak at 160 u and two smaller ions at
masses 132 nd247 u (Figure 4). The three-product ions (132,
160, 247) and their associated losses are coruistent with theknown EDTA{12 spectrum which has product ions at mlz 140,168, and 259, respectively (Figure 5). The neutral losses cor.respond to carbon monoxide, a di-carboxylic acid secondaryamine, and formic acid.
A blind trialof the analysis procedura was performed inde-pendently by IC and by positive ion LC-MS-I"1S. Forty-twodried bloodstain extncts prepared for IC analysis were analyzedin the blind study to determine if BDTA preserved btood couldbe distinguished from unpreserved blood spots. Although thesamples were diluted with 25 pL of water before LC_MS_MS,some electrical arcs still occurred in the elecbospray interfacebecause of the copper (ll) sulfate in the samplej. Tire volumeof the original bloodstain samples ranged from 2 to 50 pL.Although all stains containing EDTA (n = 2l) were correctlvidentified using the IC technique, LC-MS-Mscorrectly deter-mined 20 of the 2l positive samples, Both techniques cor-rectly identified all of the negative samples (n = Zli. A stainsample that gave a positive result in the IC test had indicationsof DDTA by the LC-MS-MS procedure but was considered tooweak to be called positive on a single resull This was an extractof half of the smallest EDTA blood spot (2 pL) in the 42 sam.ples (i.e., approximately t UL). At the time of the testing allother positives gave significant area counts (several hundredthousand) for the 160 u product ion, and both 132 and 24? uions were present. The false-negative result lnd an area countof 80,000 for ion 160, and both other product ions were pre-sent. A conservative decision was made to interpret the sampteas negative until further testing could be completed.
A revised extraction method was dewloped for LC-MS-MSafter the initial testing to eliminate the cupric sulfate-inducedarcing problerns in the interface and to obtain more concen-trated sample extracts. A simple procedure was devised toextract the stains in centrifugal filters after a A5-min soakingin water. A molecular weight cutoff of 30,000 Da was chosen toremove particulate matter, blood cells, and large proteins fromthe filtrate while still maintaining an adequate flow throughthe filter disc, A retest by positive ion mode LC-MS-MS ofseveral dried stains (preserved and unpresennd btood spots)produced positive results for all of the EDTA containing bloodwith area counts ofseveral hundred thousand for the 160 ionand negative results for all unpreserved spots. The sample
that previously had been deemed a negative(2-trL EDTA blood spot) gave an area count of1,000,000 for ion 160 by the revised method.'iboof the positive sampies were extnctd a secondtime, and it was found that, on average, 9l% ofthe EDTA response (peak area for 160 production) was in the first extract.
In the negative ion mode, the ferric ion com-plex with EDTAatmlz344, (M -4H * p.rrl)-, c0n-sistently appeared in analyses of the disodiumEDTA standard and was the base peak for EDTA inpreserved blood samples. The identity of the 344ion wu verified by comparing the calculated iso-topic formula for (C1jH12N206Fe) with experi-mental data (Table I). No prominent structural
Table l. Calculated and Experimenlal tntensity (%) of the Molecular lonCluster (CrgHr2N2OsFe) for the lron Complex with EDTA (M - lH+Fettt;-Observed by Negative lon LC-M$-i4S for an EDTA Standard
n/z Predicled intensity Experimental intensity
342
343
344
J{)
346
JqI
348
6,3
0.8
f00
2.9
U.J
U
6.4
2.1
t001t,
/.. I
u,o
0.2
u4b( szo

peaks were observed in the LC-MS spectrum of this complex,
MS-MS of the 344 ion gave a strong signal for the product ion
atrnlz 300 (M - C02f. A second LC-MS-MS method, in neg-
ative ion mode, was developed to screen for the presence ofEDTA in bloodstains by observing the mass-toclnrge ratiotnnsition from 344 to 300 in the selected reaction moniiorinfmode (SRM). This method of MS-MS operation is selective
-1L
Journal of Analy,tical Toxicology, Vol. 21 , November/December I 997
and sensitive because the instrument scaru over a limited mass
range while measuring a specific trarsition resulting frorncollision-induced dissociation. The MS-MS ion tnce of rnlz300 and the RIC show no extnneous signals other than themajor peak for the EDTA derived species from blood extracti(Figure 6). Some lmown (n = 4) and unknown (n = 2) blood
samples were successfully tested as a trial of the negative ionmethod.
A comparison of negative ion and positive ion LC-MS-MS of
a blood stain revealed an 80-fold difference in intensity ofEDTA signal for the 160 ion (positive) over the 300 ion (nega.
tive). Because of [he use of MS-MS in both techniques,responses from other components in the blood were notobserved, and, therefore, boih analyses were deemed selectiveThe positive ion mode is a better means of confirmationbecause there are three structurally significant product iorucompared with only one for the negative ion mode.
The IC, negative ion and positive ion LC-MS-MS methodswere used on investigative case samples (n = 9) to determine ilevidentiary crime scene blood might have been tampered evi-
dence. A phenolphtlulein-presumptive test for blood ( 1l ) wapositive on all testd stains (n = 4). In addition, all extncts of
the stains appeared red in color as supportive evidence for the
praence of blood. All three techniques were negative for EDTA ;
in the bloodstains. Howarer, in the positive ion SRM (mlz tnw a,
sition 293 to 160) LC-MS-MS analysis of one of the stairu.
from a sock, a small peak appeared with the correct retentiontime for EDTA" IC and negative ion results did not indicatr
EDIA in the sample and positive ion full scan LC-MS-MScould not confirm all three EDTA product ions from the parent
ion at 293 u. In known EDTA samples, the three techniqueshad consistently agreed, and intersities were strong enough for
ihe known samples to confirm the three product ions by
MS-MS of the parent ion at 293 u. A potential criticism of the
evaluation of the results is the inabilig to determine the exact
quantity of blood in a sample. In these studies, it was found that
sample sizes as small as I pL of blood generated more than adrquate signal for EDTA. A sample of this size would leave a
dried blood spot of 0.1 cm2 on a swatch of cotton linen.A study wu conducted to determine if the small uncon-
firmed signalobserved in the case sample could result froma
carry-over in the system. An EDTA-dt2 standard was used fot
this work to prevent interference from endogenous levelsof
EDTA After sevenlinjections of ttre EDTA-drz standard (500
ppm), blank samples of different substances were run. No
signal by LC-I'IS-MS was observed after a single injection dblanls such as water, mobile phue, or salt solutions. Howevet,
injection of EDTA free blood extrach, following a blank injec'
tion, gave a response for the EDTA-d12 compound tha[,
decreased with each repetition (Figure 7). The low signal in ti8icase mentioned above was likely a result of an interferendresulting from the previously injecterl standard. It is theoiril'that, when a blank blood matrix is injected onto the s.vstefn,
residualEDTA adsorbed onto sita in the column and hrbintisreleased by competing metal ions in the blood extract. There'
fore, it is recommended that the only suitable blank after injr;tioru of EDTA is EDTA-free blood extncl Multiple injections ot
EDTA-free blood extract should be made uniii no observablqt
10,000
8000
6000
4000
2000
04.2 0.4
Time (min)
10,000
8000
6000
4000
2000
01.2
Fi8ure 6. EDTA analysis of the iron addud ion at ndz344 by negative ion
SRM LC-MtMS. Reconstrucled ion chromatogram (solid line, scan range
297-JO2 u) ard EDTA product ion r/z 100 (dashed line) traces from
unpreservd (A) and tDTA-presewed (B) blood sain exrfacts.
/r-: \::,:1,
i#

purnal of Analytical Toxicology, Vol. 21, November/December 1997
EDTA peak is detected before any case samples are anatyzed bthis method.
EDTA is an additive in a variety of foods, such as pickla,
canned mushrooms, and salad dresings, and potentially could
occur in human blood at low lewls. However, in a study of
radio-labeled EDTA" ingated samples were found to be elimi-
nated mainly by excretion with minimalgastrointestinal tract
absorption (12). Thus, it is unlikely that measurable quantities
would be found in the blood by the employed techniques,
Attempts to measure EDTA in unpreserved blood by the use of
samples up to I mL in volume were negative. A search of the
literature did not find any measurements of EDTA in blood
from dietary consumption levels.
Another concem in the analysis ofbloodstains is the stability
of EDTA in the dried spots after extended periods of storage.
Samples of EDTA preserved bloodstains (n = 2) were analyzed
after 2 yean of storage at room temperature. LC-MS-MSanalysis of the additive-free samples were negative and the
preserved samples were positive for EDTA"
Conclusion
Methods described herein demonstnte the abili$ to deter-
mine if tampering of bloodstains may have occurred using
EDTA-preserved blood The coupling of a quantitative tech-
nique with the specificity of the LC-MS-MS procedures is apowerful analytial protocol. Specific procedures were devel-
oped to identifu and control the effect of matrix interference on
the umples. MaFix interference can be minimized by injecting
EDTAlree blood artncts before the analysis of any samples.
The accuracy ofthe determination was supported through the
use of simulated investigative case samples. Experiments on
aged, dried blood indicate it is possible to determine EDTA in
stains after at least 2 years of storage.
Acknowledgments
The authors would like to acknowledge the assistance of
Kelly Hargadon lvtount Jill Smerick, Kathleen Keys, Barban
Koons, Tim Mchughlin, John Paulson, Dean Fetterolf, and
Robert Mothershead, II.
References
M. Windholz, Ed. The Merck /ndex. Merck & Co., Rahway, Nl,'1976, p 463.
,1, De Jon8, A. Van Polanen, and J,J.M. Oriessen. Determination of
ethylenediaminetekaacetic acid and its salts in canned mush-
rooms by revased-phase ion-pair liquid chromatography. /. Chromatogt.553i 243-48 (1 991).
C. Retho and L. Diep. Low-level determination of ethylenedi-aminetetraacetic acid in complex matiices. Z, Lebensm Unters
Forsch. 188: 223-26 (l 989).
B. Nowack, F.C. Kari, S.U. Hilger, and L.Sigg. Determination o{
dissolved and adsorbed EDTA species in water and sediments by
HPLC, Anal. Chen. 68:561-66 (1 996).
P.J.M. Eergers and A.C. De Croot. The analysis of EDTA in water
by HPLC, Wat Res.28:639-42 (1994).
M. Unger, E. Mainka, and W, Konig. Quantitative determinationof EDTA and its behavior in radioactive waste solutions using
HPLC. Fresenius J. Anal. Chem.329: 50-54 (1 987).
1,
2.
c
6.
0.2 0.4 0.6 0.8 1 1.2 1.4
Time (min)
0 0.2 0.4 0.6 0.8 1 1.2 1.4
nme (min)
Figure 7. Sample carry over experiment to demonstrate the matrix effecl
of blood extracts. The top chart (A) is an injection of mobile phase after
tire injections of 500 ppm EDTAdl2 standard. The chart on the bottom (8)
shows the results of injecting an extract from a non-EDTA-preserved
blod tube after the blank analysis in (A). EDTA-d12 analysis of the proton
adducl ion n/z 305 W positive ion iull scan LC-M!MS, Reconstructed
ton chromatogram (solid line) and EDTAdl2 product ion r/z 1 68 (dashed
itne) traces,
4L/b
E,L. Inhan, R.L. Clemens, and I'A. Olsen. Determination of
EDTA in vancomycin by liquid chromatography with absorbance
ratioing for peak identification. J. Pharm. BioM. AnaL S (6):
513-20 (1990).
Hamilton application note #286,287.
P. Kebarle and L. Tang. From ions in solution to ions in the gas
ohase, Anal. Chern. 55(22)1 9724-86A (1 993).
C.f. tjames, R.C Dutky, and H.M. Fales. lron carboxylate oxygen-triangle complexes detected during electrospray use of organicacid modifien with a comment on the Finnigan TSQ'70 elec'trospray inlet system. /. Arn. Soc. Mass Spec, 5: I 226-31 (l 995).
Journal of Analytical Toxicology, Vol. 21, November/Decemhr 1997
ll, W,C. Eckert and S.H. lames. lnterytetation of Blodstain Evi.dence at Crime Scenes. CRC Press, Ann Arbor, Ml, 1993, p 120.
12. H. Foreman and T.T. Trujillo. The metabolism of raC labeldethylenediaminetetraacetic acid in human beings, /, Lab. Clin,Med.43;566-71 (1954).
Manuscript received January 31, 1997;revision received Aoril 29, 1997.
8.
'10.
I!F
I
Tl
ol
wCG
(x
nt€
nl
ool
dr
a1
hi
lr0nl
Irhi
ul
m
w
m
!,
t;lrfc,el
otr
t" v+b5:-r\
AC 8197: Determining EDTA in Blood
Analytical ChemistrY
August l, L997
Analytical Chemistry 1991,69, 477 A-480L'
Copyright @ lggi by the American Chemical Society'
Page I of6
Determining EDTA in Bloodb
Amurdertrialshedslightontheneedforabetteranalyticalmethod
Robjn-,L-,-$he-p,pardJaskH-enion
Cornell UniversitY
It is not often that a story on the national evening news uses words such as "liquid chromatography" and
,,mass spectrometry'i"Ai"iyti";l chemists who lieard such reports.during the murder tnalrhe state of
carifurnia v. orentharT"riiiii^pson immediately perked up their ears, amazed that the analytical
J.tuits of FBI laboratory testing were actually making headlines'
The subject of the testing was EDTA (ethylenediaminetetraacetic acid) issue was whether police had
,,planted,, or tampereJ *Ttn Utooa evidencl in an attempt to shore up the case against Simpson' The
possibre outcomes "r,r,. i"Jirg were simple: Either EbTA-was present or it wasn't. Qualitative testing
began (i), but as is usually the iase, l:lfrllg is that simple. There was eYidence of some EDTA, at levels
much lower than in;DTi-;r"served bloodl The questions "How much EDTA is there?" and "Are the
detected levels "orrririrnt
with'normal' levels or those that would result from tainted blood collected in
E iA anticoagulant blood tubes?" arose immediately.
The lead prosecutor, Marcia Clark, tried her best to present this scientific evidence. But how do you
convince a jury or.itir.", that knows little about analytical chemistry that the EDTA came not from a
lavender-stoppered lrrt. u,rt from a bleeding o.J. Simpson? Althoug! i!.mav not have been the only
weak point in the prosecution's case, it certiinly *ur u factor in the trial's outcome. Because of this
criminal case, determining EDTA in human blood has become a topic of renewed interest'
what was wrong with the laboratory testing? First, it was not clear whether the method had ever been
fq-(
//tlbsar)http :i/pubs. acs'org/hot artcll acl 97 laugldet'html 2t912007
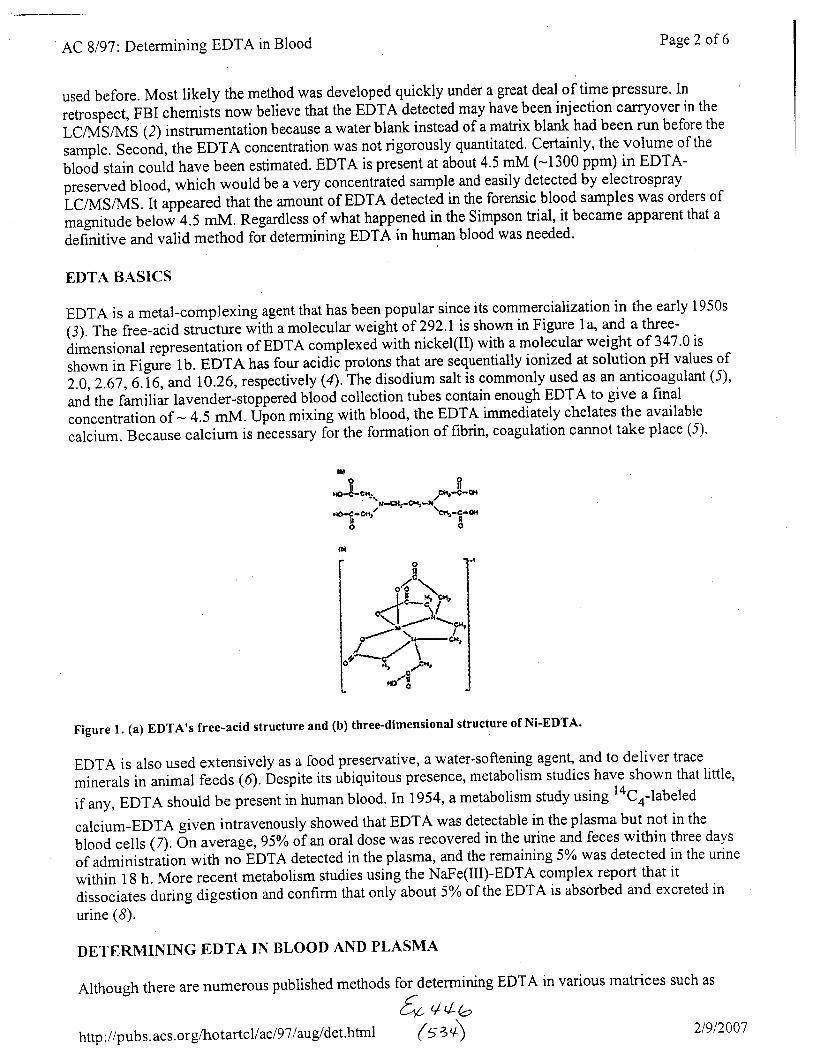
AC8197 Determining EDTA in Blood Page 2 of 6
used before. Most likely the method was developed quickly under a great deal of time pressure. In
,etrorpe"t, FBI chemisti now believe that the EDTA detected may have been injection carryover in the
lCnfSnrnS (2) instrumentation because a water blank instead of a matrix blank had been run before the
*-pf. Se.oni, the EDTA concentration was not rigorously quantitated, Cert-ainly, the volume of the
blood stain could have been estimated. EDTA is present at about 4.5 mM (-1300 ppm) in EDTA-
preserued blood, which would be a very concentrated sample and easily detected by electrospray
LC1MS/I\4S. It appeared that the amount of EDTA detected in the forensic blood samples was orders of
magnltuae below 4.5 mM. Regardless of what happened in the Simpson trial, it became apparent that a
definitive and valid method foi determining EDTA in human blood was needed.
EDTA I}ASTCS
EDTA is a metal-complexing agent that has been popular since its commercialization in the early 1950s
i-rj. rr* free-acid structure *itrr u molecular weight of 292.1 is shown in Figure 1a, and a three-
dimensional representation of EDTA complexed with nickel(Il) with a molecular weight of 347.0 is
shown in Figure lb. EDTA has four acidii protons t!{ are sequentially ionized at solution pH values of
2I,2.67,6.i6, and lo.z6,respectively ({. The disodium salt is commonly used as an anticoagulant (5)'
and the familiar lavender-stoppered biood collection tubes contain enough EDTA to give a final
concentration of - 4.5 mM. Uion mixing with blood, the EDTA immediately chelates the available
calcium. Because calcium is necessary for the formation of fibrin, coagulation cannot take place (5).
dor ,*S*oru&z'4't{O-i-*
Figure 1. (a) EDTA's free-acid structure and (b) three-dimensional structure of Ni-EDTA'
EDTA is also used extensively as a food preservative, a water-softening agent, and to deliver trace
minerals in animal feeds (e. bespite its ubiquitous presence, metabolism studies have shown that little,
if any, EDTA should be present in human blood. In 1954, a metabolism study using laco-lubel.d
calcium-EDTA given intravenously showed that EDTA was detectable in the plasma but not in the
blood cells ( Z). 6r, u,u"rug e, 95o/o of an oral dose was recovered in the urine and feces within three days
of administration with no EDTA detected in the plasma, and the remaining 57o was detected in the urine
within 1g h. More recent metabolism studies using the NaFe(III)-EDTA complex report that it
dissociates during digestion and confirm that only about 5% of the EDTA is absorbed and excreted in
urine (8).
DETERMINING EDTA IN BLOOD AND PLASMA
Although there are numerous published methods fo).a.t"t-ining EDTA in various matrices such as
a-.^L +(9http://pubs.acs.orgAro tartcllaclgT/augidet.htmt (S Z+) 2191200'7
trloil|F
W-so
tDl
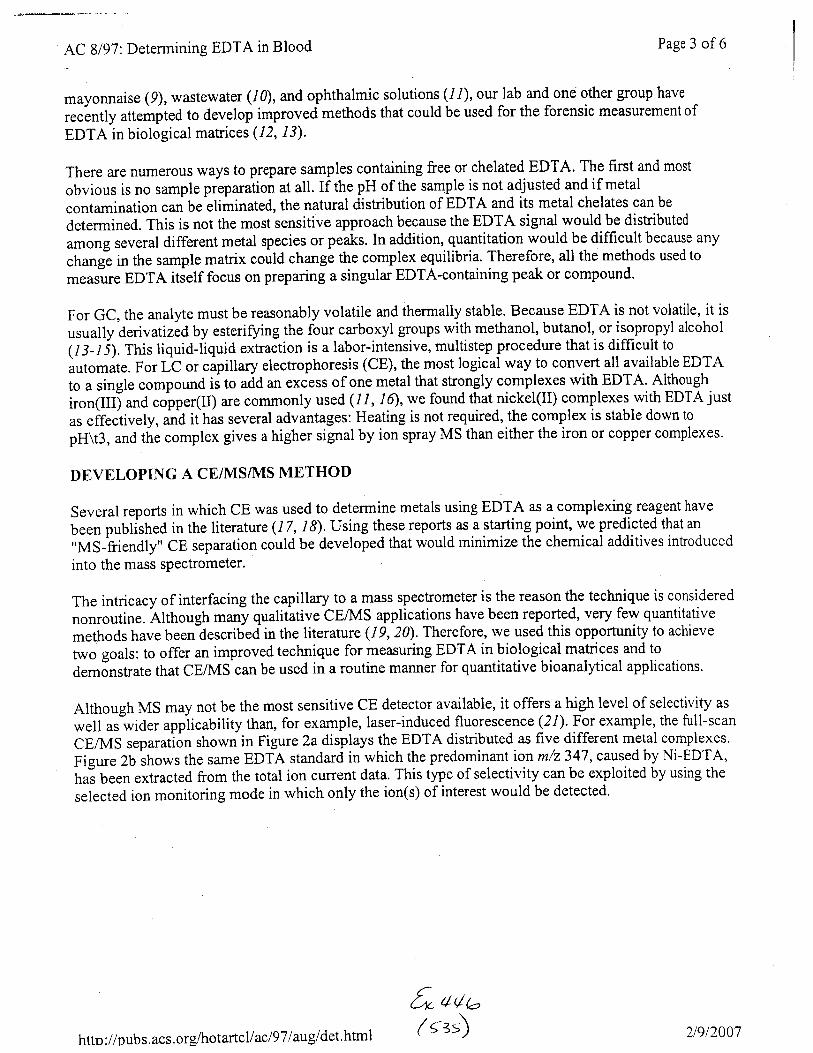
AC 8197: Determining EDTA in Blood Page 3 of6
mayonnaise (9), wastewater (/0), and ophthalmic solutions (11), our lab and one other group have
reclntly attempied to develop improved methods that could be used for the forensic measurement of
EDTA in biological matrices (12, 13).
There are numerous ways to prepare samples containing free or chelated EDTA. The first and most
obvious is no sample pieparation at all. If the pH of the sample is not adjusted and if metal
contamination can be eliminated, the natural distribution of EDTA and its metal chelates can be
determined. This is not the most sensitive approach because the EDTA signal would be distributed
among several different metal species or peaks. In addition,.quantitation would be difficult because any
chang-e in the sample matrix could change the complex equilibria. Therefore, all the methods used to
*""r-ur" EDTA itielf focus on preparing a singular EDTA-containing peak or compound.
For GC, the analyte must be reasonably volatile and thermally stable. Because EDTA is not volatile, it is
usually derivatized by esterifying the four carboxyl groups with methanol, butanol, or isopropyl aicohol
(13-l i). This liquid-iiquid extraction is a labor-intensive, multistep procedure that is difficult to
automate. For L-C or capillary electrophoresis (CE), the most logical way to convert all available EDTA
to a single compound is to aOA an exCess of one metal that strongly complexes with EDTA. Although
iron(Illj and copper(Il) are commonly used (,11, 16),we found that nickel(Il) complexes with EDTA just
u. "if.rtiu"ty,
anA iihas several advantages: Heating is not required, the complex is stable down to
pH\t3, and the complex gives a higher signal by ion spray MS than either the iron or copper complexes.
DEVELOPING A CE/MS/MS METHOD
Several reports in which CE was used to determine metals using EDTA as a.complexing reagent have
been published in the literature (17, /8). Using these reports as a starting point, we predicted that an
"MS-hendly" CE separation could be developed that would minimize the chemical additives introduced
into the mass sPectrometer.
The intricacy of interfacing the capillary to a mass spectrometer is the reason the technique is considered
nonroutine. Although many qualitative CEA{S applications have been reported, very few quantitative
methods have been described in the literature (19,20). Therefore, we used this opportunity to achieve
two goals: to offer an improved technique for measuring E-DTA in biological matrices and to
deminstrate that CE/MS can be used in a routine manner for quantitative bioanalytical applications.
Although MS may not be the most sensitive CE detector available, it offers a high level of selectivity as
well asaider appiicability than, for example, laser-induced fluorescence (21). For example, the full-scan
CEI11{S separation shown in Figure 2a displays the EDTA dishibuted as five different metal complexes.
Figure 2b shows the same EDTA standard in which the predominant ion m/2347, caused by Ni-EDTA,
ha! been extracted from the total ion current data. This type of selectivity can be exploited by using the
selected ion monitoring mode in which only the ion(s) of interest would be detected.
5. u,t,-
http ://pubs. acs. orgftto lartcll acl 97laug/det'html( qz)
2t9t2007
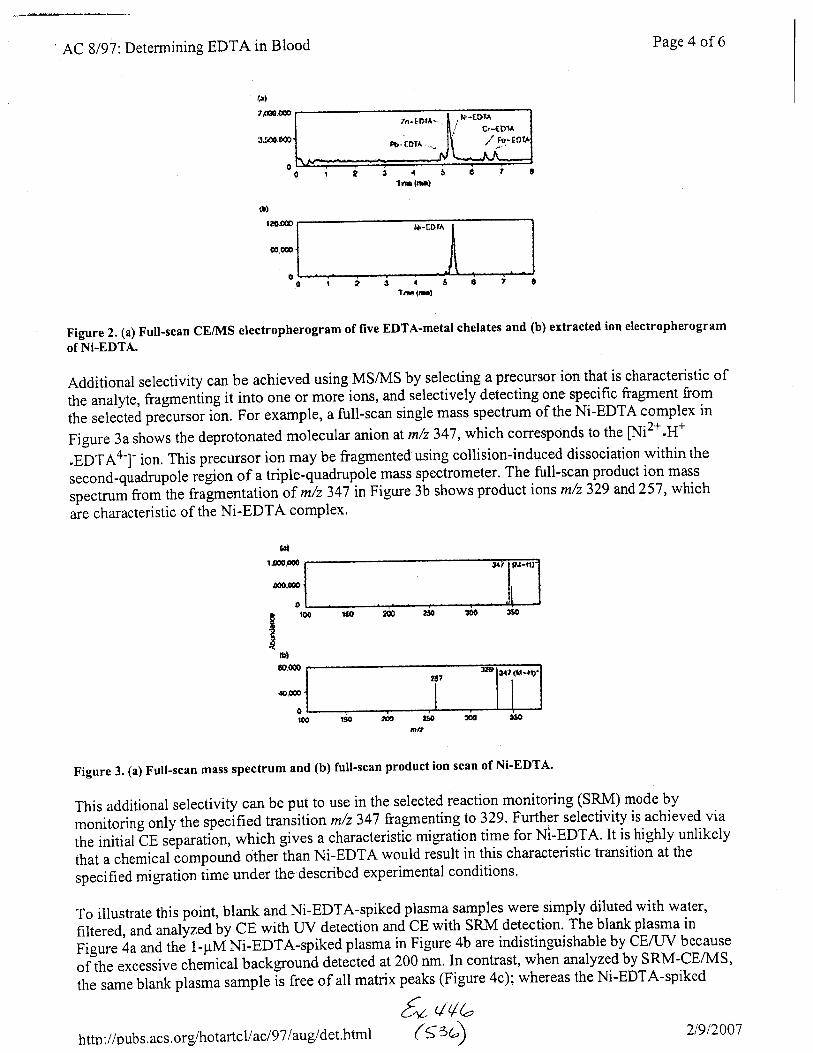
AC 8/97: Determining EDTA in Blood Page 4 of 6
trl,&@
3,N4C.$00'
0
{r}rts.ff
!o.40
q
?n^tnt^* I ' h'-eorr
ll .' Cr'-tDlrqr cDI^ - ll z'r"'eo
t{1fitml
Figure 2. (a) Full-scan GE/IVIS electropherogram of five EDTA-metal chelates and (b) extracted ion electropherogram
of Ni-EDTA.
Additional selectivity can be achieved using MS/TvIS by selecting a precursor ion that is characteristic of
the analyte, fragmenling it into one or more ions, and selectively detecting on€ specific fragment from
the selected prJcurso. i6n. For example, a full-scan single mass spectrum of the Ni-EDTA complex in
Figure 3a shows the deprotonated molecular anion at m/z 347, which corresponds to the [Ni2+"H+
,gbre4-]- ion. This precursor ion may be fragmented using collision-ind1cgd dissociation within the
.econd-quadrupole region of a triple-quadrupole mass spectrometer. The full-scan product ion mass
;;;il; from the fralmentation-of m/z 347-inFigure 3b shows product ions m/z 329 and 257, which
are characteristic of the Ni-EDTA complex'
,1 5lrrflaf
r{i-[Dt
t87i4t {lt
tsf
t,&pqt
6o'0s
o
otm ,so
nt
Figure 3. (a) Fult-scan mass spectrum and (b) full-scan product ion scan of Ni-EDTA'
This additional selectivity can be put to use in the selected reaction m-onitoring ISnfuO mode by
monitoring only the rpr.ifi.d traniition m/z 347 fragmenting to 3.29.l"t*:=fctivity is achieved via
the initial LE separation, which gives a characteristic migration time for Ni-EDTA. It is highly unlikely
that a chemical compound otherihan Ni-EDTA would result in this characteristic transition at the
specifred migration iime under the described experimental conditions'
To illustrate this point, blank and Ni-EDTA-spiked p!a9m1 samples were simply diluted with water'
filtered, and analyzed 6y CE with tIV detection and CE with SRM detection. The blank plasma in
Figur. '4a
andthe t-pvrNi-EDTA-spiked plasma in Figure_4b are indistinguishable by CE/W because
ofrn. excessive chemical background detected at200 nm. In contrast, when analyzed by SRM-CE^VIS'
the same blank plasma sample i-s free of all matrix peaks (Figure 4c); whereas the Ni-EDTA-spiked
€" q'/U
http://pubs.acs.org,4rot artcllaclgT hugidet'html G3b) 2t9t2007
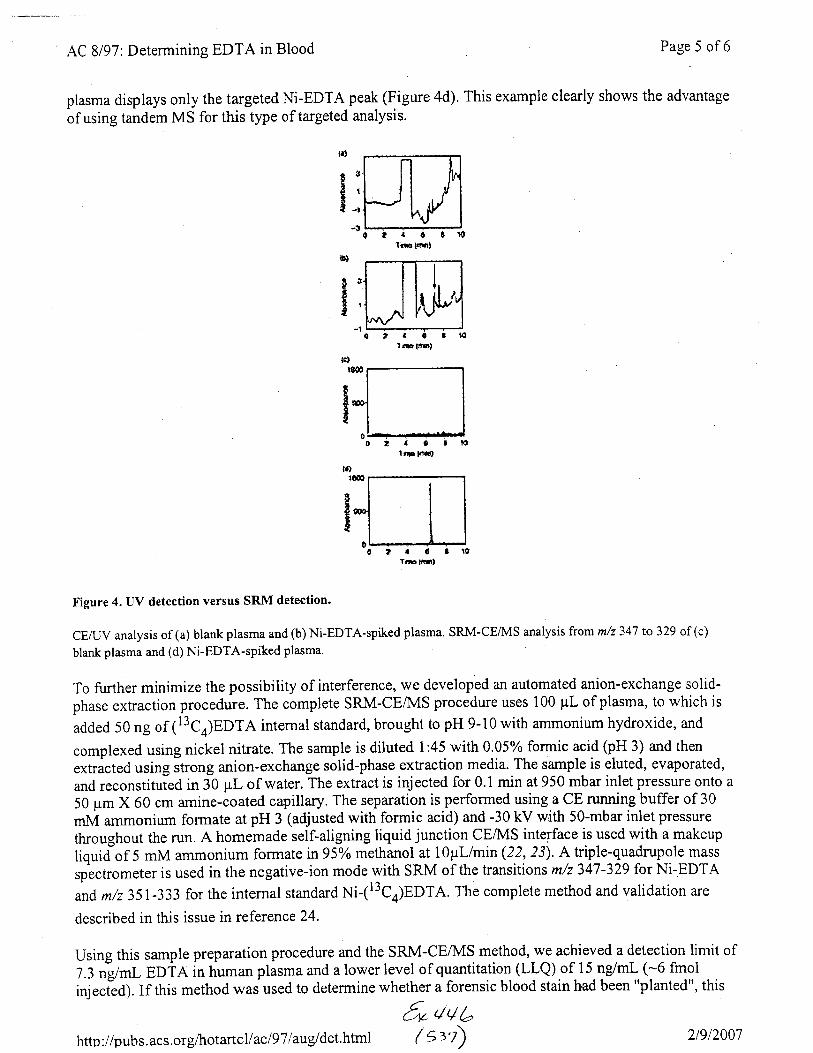
AC 8197 Determining EDTA in Blood
plasma displays only the targeted Ni-EDTA peak (Figure 4d).
of using tandem MS for this type of targeted analysis.
This example clearly
Page 5 of6
shows the advantage
tr)
t3t'l-r't
4
243rrulnul
aatrfmF{6}
?46frhlt!|il
Figure 4. UV detection versus SRM detection.
CEruV analysis of (a) blank plasma and (b) Ni-EDTA-spiked plasma. SRM-CEA4S analysis from m/z 347 to 329 of (c)
blank plasma and (d) Ni-EDTA-spiked plasma.
To further minimize the possibility of interference, we developed an automated anion-exchange solid-
phase extraction procedure. The complete SRM-CEA4S procedure uses 100 pL of plasma, to which is
added 50 ng of 113C0;EDTA internal standard, brought to pH 9-10 with ammonium hydroxide, and
complexed using nickel nitrate. The sample is diluted 1:45 with 0.05% formic acid (pH 3) and then
extracted using itrong anion-exchange solid-phase extraction media. The sample is eluted, evaporated,
and reconstituied in 30 pL of water. The extract is injected for 0.1 min at 950 mbar inlet pressure onto a
50 pm X 60 crn amine-coated capillary. The separation is performed using a CE running buffer of 30
*M u--onium formate atpH 3 (adjusted with formic acid) and -30 kV with 50-mbar inlet pressure
throughout the run. A homemade self-aligning liquid junction CEA4S interface is used with a makeup
liquiJof 5 mM ammonium formate in95o/o methanol at lOpl/min(22,23). Atriple-quadrupole mass
splctrometer is used in the negative-ion mode with SRM of the transitions m/z 347-329 for Ni-EDTA
and m/z 35 1-333 for the internal standard Ni-(13C4)EDTA. The complete method and validation are
described in this issue in reference24,
Using this sample preparation procedure and the SRM-CE/\4S method, we achieved a detection limit of7.3 n:glmL EDiA in human plasma and a lower level of quantitation (LLQ) of 15 ng/ml (-6 frnol
iniecled). If this method waJused to determine whether a forensic blood stain had been "planted", this
1i" uu bhttp://pubs.acs.orgAtotartcllaclgT/aug/det.html ( 5t'D
Ifto Frrif
2t912007

AC 8197: Determining EDTA in Blood Page 6 of6
LLQ conesponds to "planting" 1-3 nL of EDTA-preserved blood. Because it would be physically
difficult to manipulate such a small volume, any such forensic sample would probably contain at least I
pL. This hypothetical scenario illustrates the excellent sensitivity and potential forensic usefulness of the
method. Similarly, the GCilvIS/I4S method developed by Ballard and colleagues demonstrated a
comparable detection limit of 10 ng/sample, which corresponds to -7 or 8 nL of EDTA-preserved blood
(13).
CONCLT-ISIONS
Many techniques have been used over the years to determine EDTA in various matrices, and most can
be adapted to biological samples. Howevet, SRM-CEA4S provides the highest specificity and the best
detection level of any method currently published. .
We have been able to demonstrate that typical human plasma samples do contain detectable EDTA, but
at levels that are lower than the LLQ reported in this work. The LLQ of our method, at 15 ng/ml, is a
factor of 105 lower than the typical concentration found in EDTA-preserved blood (4.5 mM or 1.3 X 10⁶
ng/ml.). But more importantly, we have demonstrated that CE/lvIS methods can be used for routine
bioanalytical analysis with acceptable precision, accuracy, and adequate detection levels for quantitation
of trace-level concentrations (24).
CE/MS techniques will undoubtedly become an important forensic technique because of the low
volumes of sample required for analysis, as well as the ability to use the mass spectrometer to achieve
selectivity higher than with any other on-line detector.
The question of blood-evidence tampering in a oriminal trial has led not only to improved analytical
techniques for the determination of EDTA, but also to the demonstration that a relatively new technique
is ready to be used as credible scientific evidence in the courtroom.
REFERENCES
tF ChemCent"t m Pubs Div. I'lome Page
Copyright @ 1997 by the American Chemical Society.
q(bhttn' //nrrhs. acs.ors/ho tartcll acl 97laug/det.html (s;r) 2t9t2007
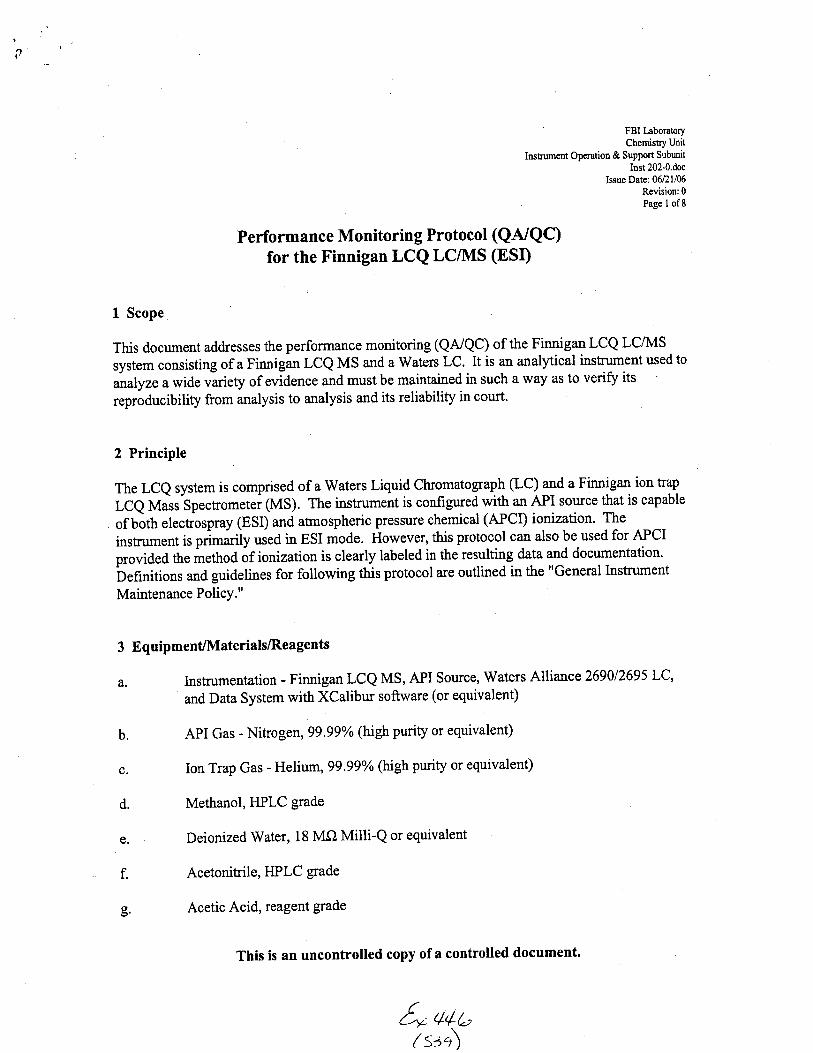
n
:?:H:fff#Insrumert Opcrattoo g SunniLs2:.b;:
Issue Date: 0621/06
l:;lfl;3
Performance Monitoring Protocol (QA/QC)for the Finnigan LCQ LClMS @Sf)
1 Scope
This document addresses the performance monitoring (QA/QC) of the Finnigan LCQ LC/MS
system consisting of a Finnigan LCQ MS and a Waters LC. It is an analytical instrument used to
11nalyzea wide u*i.ty of evidence and must be maintained in such away as to verify its
reproducibility from analysis to analysis and its reliability in court.
2 Principle
The LCe system is comprised of a Waters Liquid Cluomatograph (LC) and a Finnigan ion trap
LCe Mass Spectrometei (VfS). The instrument is configured with an API source that is capable
of Uotn electrospray (ESI) and atnospheric pressure chemical (APCI) ionization. The
instrument is primariiy used in ESI mode. However, this protocol can also be used for APCI
provided the method of ionization is clearly labeled in the resulting data and documentation.
befinitions and guidelines for following this protocol are outlined in the "General lnstrument
Maintenance PolicY."
3 EquipmenUMaterials/Reagents
a. lnstrumentation - Finnigan LCQ MS, API Source, Waters Alliance 269012695 LC,
and Data System with XCalibur software (or equivalent)
b. API Gas - Nitrogen, 99.99% (high purity or equivalent)
c. Ion Trap Gas - Helium,99.99yo (high purity or equivalent)
Methanol, HPLC grade
Deionized Water, 18 M(.l Milli-Q or equivalent
Acetonitrile, HPLC grade
Acetic Acid, reagent grade
This is an uncontrolled copy of a controlled document.
44b
d.
g
( s;.,i]1
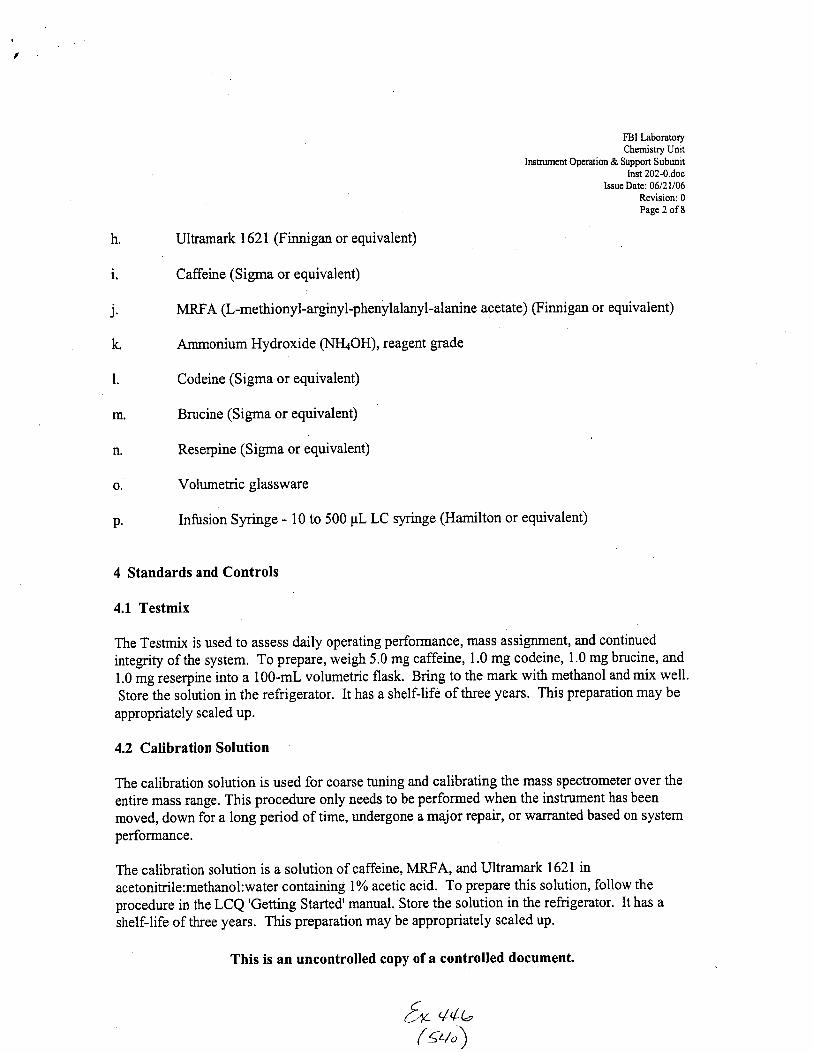
/
r,:*lfff#Insrumurt Operation & Support.Subunit
Issue Date: 06121106
l:;:tr3
h. Ulftamark 1621 (Finnigan or equivalent)
i. Caffeine (Sigrna or equivalent)
j. MRFA (L-methionyl-arginyl-phenylalanyl-alanine acetate) (Finnigan or equivalent)
k. Ammonium Hydroxide (NruOD, reagent grcde
l. Codeine (Sigma or equivalent)
m. Brucine (Sigma or equivalent)
n. Reserpine (Sigma or equivalent)
o. Volumetric glassware
p. Infusion Syringe - 10 to 500 pL LC syringe (Hamilton or equivalent)
4 Standards and Controls
4.1 Testmix
The Testrnix is used to assess daily operating performance, mass assignment, and continued
integrity of the system. To prepare, weigh 5.0 mg caffeine, 1.0 mg codeine, 1.0 mg brucine, and
1.0 mg reserpine into a 100-mL volumetric flask. Bring to the mark with methanol and mix well.
Store the solution in the refrigerator. It has a shelf-life of three years. This preparation may be
appropriately scaled up.
4.2 Cahbrttion Solution
The calibration solution is used for coarse tuning and calibrating the mass spectrometer over the
entire mass range. This procedure only needs to be performed when the instrument has been
moved, down for a long period of time, undergone a major repair, or warranted based on system
performance.
The calibration solution is a solution of caffeine, MRFA, and Ulhamark 1621 in
acetonitrile:methanol:water containing l% acetic acid. To prepare this solution, follow the
procedure in the LCQ 'Getting Started' manual. Store the solution in the refrigerator. It has a
shelf-life of three years. This preparation may be appropriately scaled up.
This is an uncontrolled copy of a controlled document.
fn q*,-( s+")
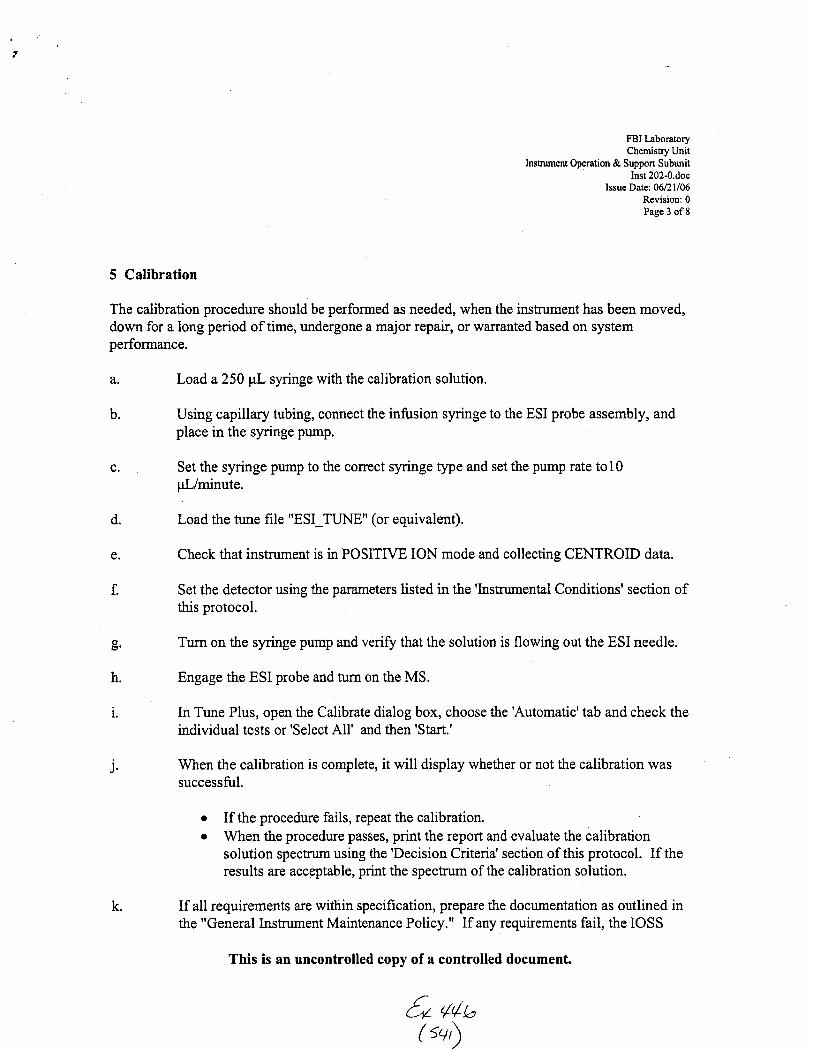
FBI LaboraoryChemistry Unit
Insrument Operation & Support SubunitInst 202-0.doc
Issue Date: 06nl/06Revision: 0
Pase 3 of 8
5 Calibration
The calibration procedure should be performed as needed, when the instrument has been moved,down for a long period of time, undergone a major repair, or warranted based on systemperformance.
a. Load a 250 pL syringe with the calibration solution.
b. Using capillary tubing, connect the infusion syringe to the ESI probe assembly, andplace in the syringe pump.
c. Set the syringe pump to the correct syringe type and set the pump rate tol0pl/minute.
d. Load the tune file "ESI TLTNE" (or equivalent).
e. Check that instrument is in POSITIVE ION mode and collecting CENTROID data.
f. Set the detector using the parameters listed in the 'Instrumental Conditions' section ofthis protocol.
g. Turn on the syringe pump and verifu that the solution is flowing out the ESI needle.
h. Engage the ESI probe and turn on the MS.
i. In Tune Plus, open the Calibrate dialog box, choose the'Automatic'tab and check theindividual tests or'Select All' and then 'Start.'
j. When the calibration is complete, it will display whether or not the calibration wassuccessful.
o If the procedure fails, repeat the calibration.. When the procedure passes, print the report and evaluate the calibration
solution spectrum using the 'Decision Criteria' section of this protocol. If theresults are acceptable, print the spectrum of the calibration solution.
k. If all requirements are within specification, prepnre the documentation as outlined inthe "General Instrument Maintenance Policy." If any requirements fail, the IOSS
This is an uncontrolled copy of a controlled documenl
/4{.( sr)

H:#ltr"f#Insu,ment Operatt"" U r
"*:to!:oblillIssue Date: 06/21106
lil:'lr3Manager will determine the corrective action to be taken.
6 Sampling
Not applicable.
7 Procedures
7.1 Daily Checks
The following steps are to be performed daily. Enter the appropriate information in the QA/QClog for tracking purposes.
a. Record the remaining disk space on the hard drive. Use Windows Explorer program(WindowsNT) to verify that the hard disk has at least 100 MB of free disk space. Donot use if less than 100 MB remain.
Record the line pressure of the building nifrogen supply (API gas). The regulatorshould read between 60 and 100 p.s.i. If it cannot maintain this pressure, contactIOSS. If the nitrogen'is supplied by a gas cylinder, record the tank pressure. changethe tank if less than 100 p.s.i. remaining.
Record the line pressure of the building helium supply (ion trap gas). The regulatorshould read between 30 and 60 p.s.i. If it cannot maintain this pressure, contactIoss. If the helium is supplied by a gas cylinder, record the tank pressure. changethe tank if less than 100 p.s.i. remaining.
Check the Ion Gauge to ensure that no significant leaks are present in the system. Donot use if the pressure is higher than I x 10* torr.
Prepare the instrument for analysis of Testnix. Verify that the instrument has theconect source probe installed (ESI), the correct tune file loaded (esi_tune orequivalent), positive ion mode selected, and centroid data being collected. If acolumn is installed, remove it from that system and replace it with the infusioncapillary tube.Perform an analysis of the Testnix prior to the analysis of evidence using parameterslisted in the'Instrumental Conditions'section of this protocol. Start the HPLC pump.Engage the ESI probe and turn on the MS. Start an acquisition using a filename such
This is an uncontrolled copy of a controlled document.
O,g"(sqi
b,
c.
d.
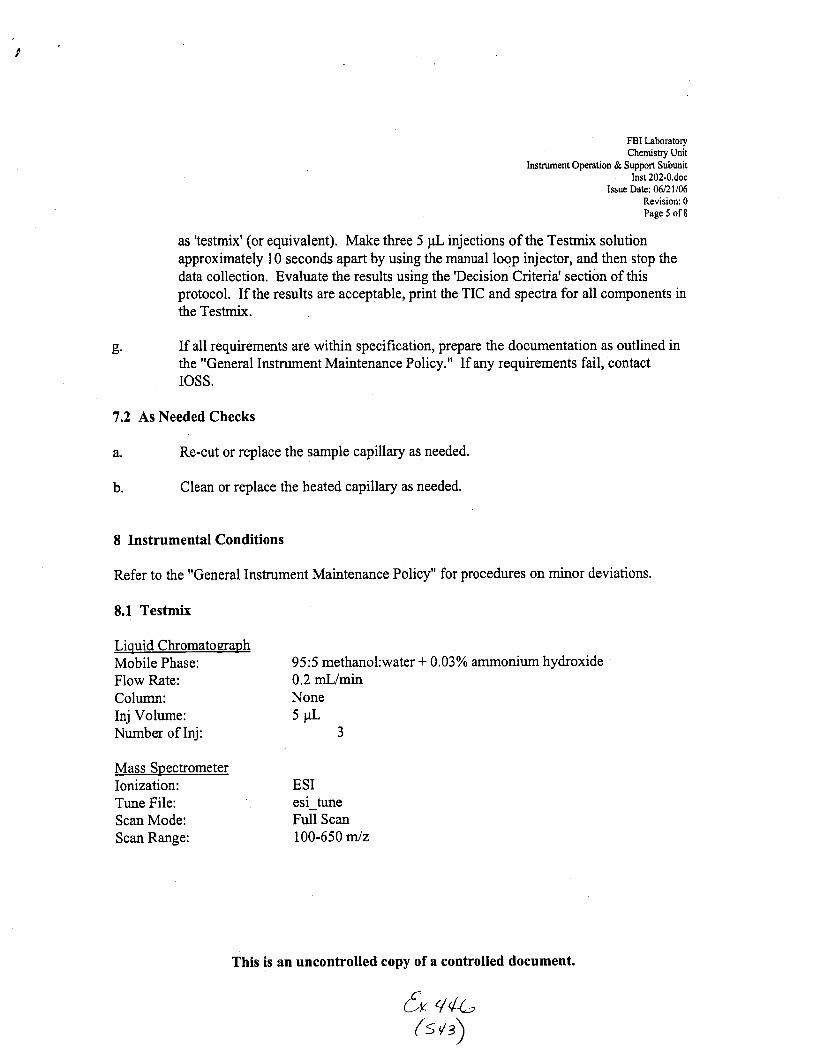
FBI Laboraiory
rnstnrment operati"" o rififf Hff llInst 202-0.doc
Issue Date: 06nll06
lilii:i3
as 'testmix' (or equivalent). Make three 5 pL injections of the Testnix solutionapproximately 10 seconds apart by using the manual loop injector, and then stop thedata collection. Evaluate the results using the 'Decision Criteria' section of thisprotocol. If the results are acceptable, print the TIC and spectra for all components inthe Tesrnix.
g. If all requirements are within specification, prepare the documentation as outlined inthe "General lnstrument Maintenance Policy." If any requirements fail, contactIOSS.
7.2 As Needed Checks
a. Re-cut or replace the sample capillary as needed.
b. Clean or replace the heated capillary as needed.
8 Instrumental Conditions
Refer to the "General Instument Maintenance Policy" for procedures on minor deviations.
8.1 Testmix
Liquid ChromatoeraphMobile Phase:
Flow Rate:Column:lnj Volume:Number of Inj:
Mass SpectrometerIonization:Tune File:Scan Mode:Scan Range:
95:5 methanol:water + 0.03% ammonium hydroxide0.2 ml/minNone5pL
aJ
ESIesi_tuneFull Scan100-650 miz
This is an uncontrolled copy of a controlled document.
C-(s
4(6/')
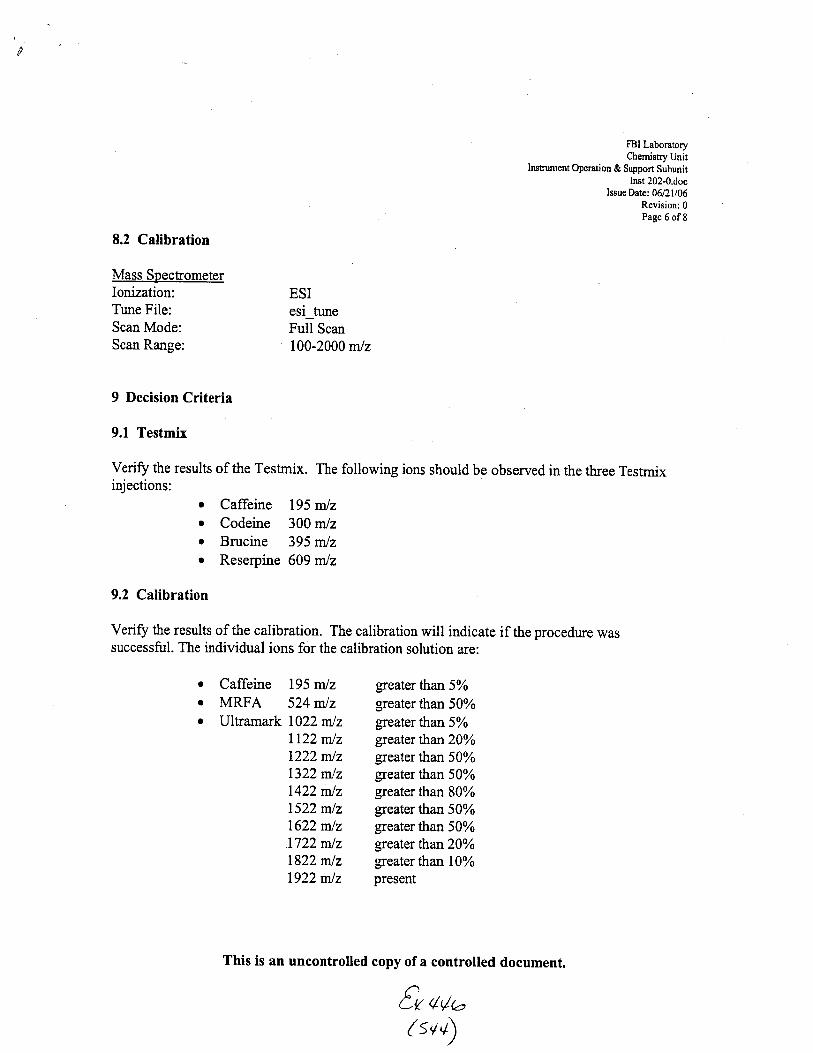
FBI LaboratoryChemistry Unit
Insrument Operation & Support SubunitInst 2024.doc
Issue Date: 06nl/06Revision: 0page 6 of 8
8.2 Calibration
Mass SpectrometerIonization:Tune File:Scan Mode:Scan Range:
9 Decision Criteria
ESIesi_tuneFull Scan100-2000 mlz
9.1 Testmix
Verify the results of the Tesftnix. The following ions should be observed in the three Testrnixinjections:
. Caffeine I95 mlz
. Codeine 300 mlzo Brucine 395 mlzr Reserpine 609 mlz
9.2 Calibration
Veri$ the results of the calibration. The calibration will indicate if the procedure wassuccessful. The individual ions for the calibration solution are:
r Caffeiner MRFAr Ultramark
L95 mlz524 mlz1022m/zIl22 mlzL222mJz1322m/z1422 mlz1522 m/z1622 mlz1722 mlz1822 mlzL922 mlz
greater than 5%greater than 50%greater than 5o/o
greater than2DYogreater than 50%greater than 50%greater than 80%greater than 50%greater than 50%greater 'han 20o/o
greater than l0%o
present
This is an uncontrolled copy of a controlled document.
Eo q,/,(sv+)
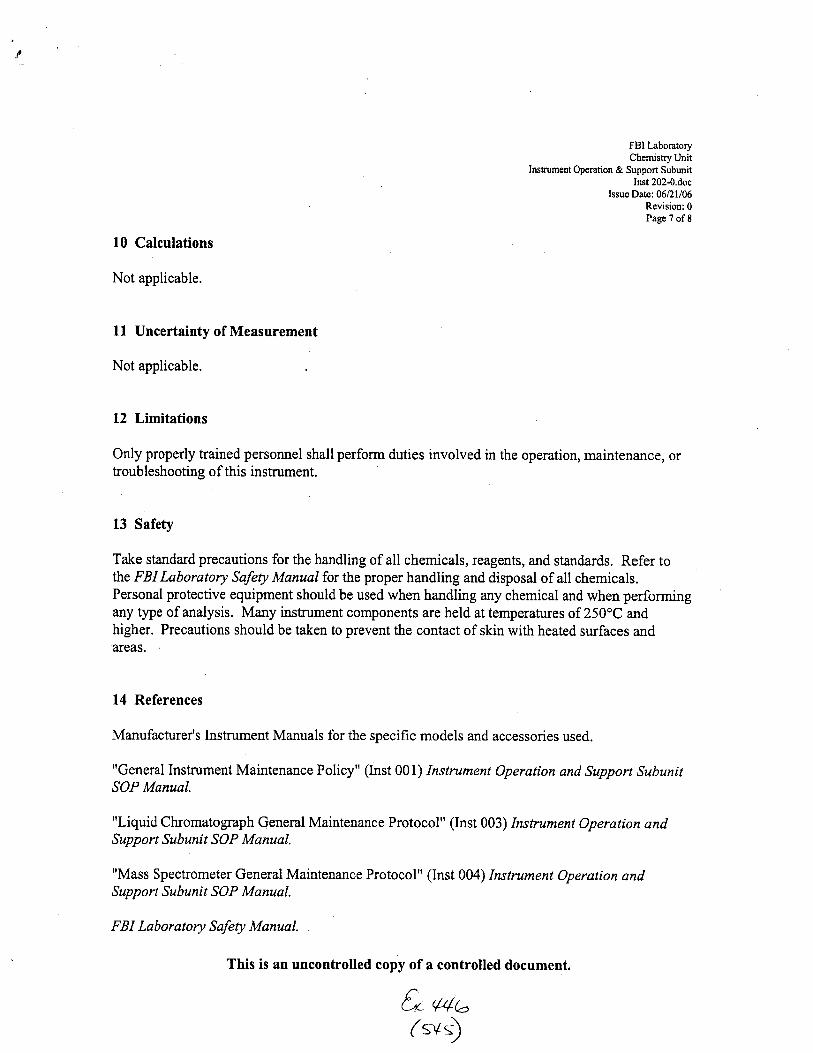
FBI laboratory
Instrument operatt"" & s:lof,t'HbYJ l:Inst 202-0.doc
Issue Date: 06/21/06Revision: 0Page 7 of 8
10 Calculations
Not applicable.
11 Uncertainty of Measurement
Not applicable.
12 Limitations
Only properly trained personnel shall perform duties involved in the operation, maintenance, ortroubleshooting of this instrument.
13 Safety
Take standard precautions for the handling of all chemicals, reagents, and standards. Refer tothe FBI Laboratory Sof"ty Manual for the proper handling and disposal of all chemicals.Personal protective equipment should be used when handling any chemical and when performingany t)?e of analysis. Many instrument components are held at temperatures of 250oC andhigher. Precautions should be taken to prevent the contact of skin with heated surfaces andareas.
14 References
Manufacturer's lnsfument Manuals for the specific models and accessories used.
"General Instrument Maintenance Policy" (Inst 001) Instrument Operation and Support SubunitSOP Manual.
"Liquid Chromatograph General Maintenance Protocol" (Inst 003) Instrument Operation andSupport Subunit SOP Manual.
"Mass Spectrometer General Maintenance Protocol" (Inst 004) Instrument Operation andSupport Subunit SOP Manual.
FBI Laboratory Safety Manual.
This is an uncontrolled copy of a controlled document.
&. vu,-1*9

F[{ l.cboaurCStrrmq Udt
Inrtrurr*x *pc'ltwr & llpporr lubrxitltx{ l*1'{i.dcx"
l.t!r}c &tc {l*,,1 t ll}sKsy.i*irn: tlF*g |t of8
Ruv. # lssuc Date History
(16,: llUS Ncw dscum{nl rvhich rsB}$t$s original titlsd "Perhrrruurcchlonituring Pn:t*cgl iQArQCl fr:r &e llinnigau I"CQ l*C/lvlsfrsll,"
Anpnrvnl
Chemisq' Llnit Chief:
0A,Anrrrqvsl
Quality h,lanagcr:
lssunnce
IOSS S{anager: Ilare: Alu lot---r7-
This is an uncontrolled copy of a controlled document.
€v a(bGv)
l!{arc .4. LeB*su

INSTRTIMENTMAINTENANCE
AI{I)CALIBRATION
€" +'t5( s+z)


,|"G,
IN,la>Iw\r\"1liq-ll l"il+iat
l'lo',lt 1"",
-t "l'-f te f"
'.lr<la-l rt, l"
I r(-
o'7
oF
ft
ll l"r? lo?
t 1"1
1l't'l-
I
ulr)ul
tl
1,l"lta f'rfrrlo
1,1
^ l-)
wJq-{nepw
'Spfipf,r'g
:flc
{vp6pfupfr6pTl,p
Co -,--- t11'
Tn't o/g-^-rg-^ -,14, fi^rqoooz
6ffWi Atr* Wt,
ac..J +^. P.
,!'tu(!*qt..r*t.-- AtrvVJ
f\iwi{M f,SL-I
fr^ 6st-1-rM Esailvl tsT
VAfutairf'cnl
vAut P ffi'oil| flt,r$f7,,,,,1
(eoa)
(*a)(vw+)
hu)t'l rt' Ut $ rft< ,")
Trq Fsf,-
TN\ FstFb-(A
Fvwrltt4
r'-/T/v\
1A
T^4
VAr-tD$rr.-r..! (aUA'V
Ar,ot-r.,.{ (r"r*)V&uroAr.=n: (w<$
^
uhL1sffi.oJ (**)j OloLo\ots
r.l
i,l
Lo ++u( s4?\
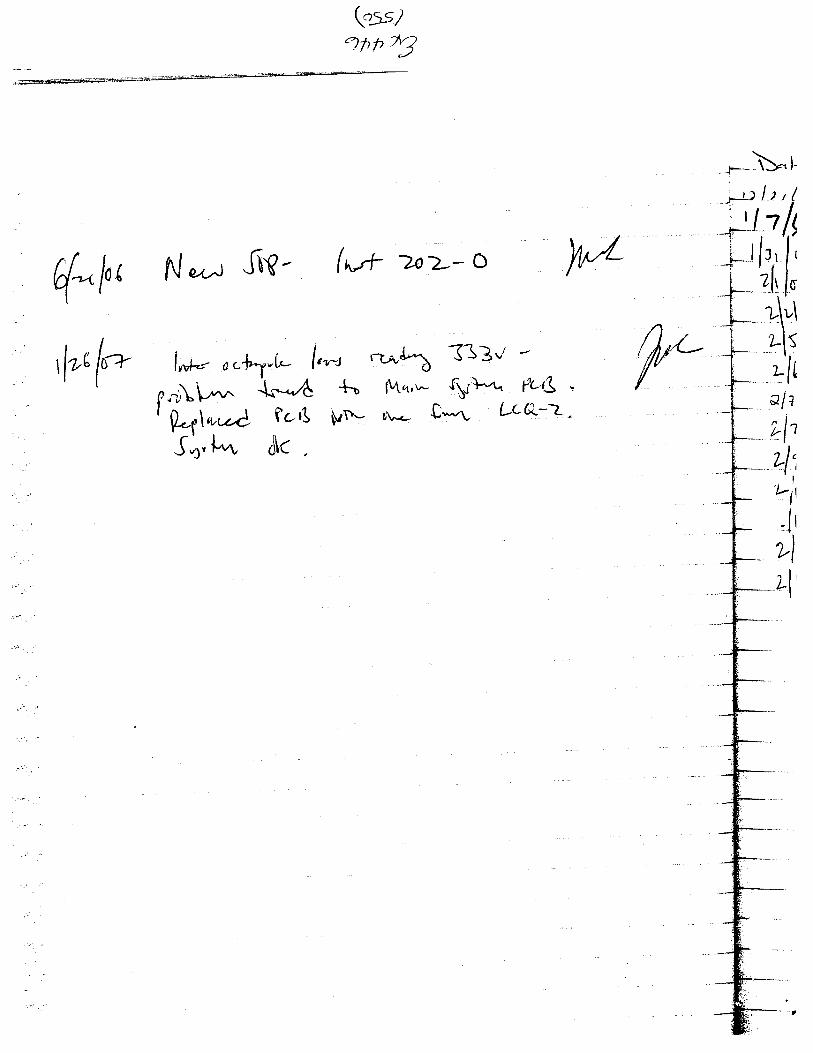
(">q/otnU
f(-^, ${- (* 2A>- a Wq-"bt
rlaul* .t^\ ilEv /M,,,* \il-4" (c',3 !d\^<- C*n- LL(L-a,
i*' a '1\,L l"'o
f ,l,\U" +-*,4 $"
' 0.-r\ ,ri t'c rs $/r\-
J;'f^^ .i\(
-*-\^t-'*tlt,/
;ttlt-j-t1,, l.f,[ loj* ,\.\f 'llF_ ,tr
+- al,*
L__11,,
*- rl',
J- 'Dl
| .1,'
J- LI
i- il

\,o)'znh 3F --ou_) a OJ
!r5zi.
=r{ ti6
ohC Ar)o.f .
{
a
-Fl
0olr
zoE!'t
o
-Fl
ozH
--
t-
ts6o
A'vAvbIsa\':.F
Bt\
Rquj
:s
I
e.
IG
G
6
10(DJ
;.. o!t{tr
iv
yr

("st qnfi UH_-6?fiar5-oZYE\t 5\s3rio
ohEtLJc r.
{
ot-H
aa
zol=l
aEr' F-Fl
ozFl7
--LJ
FIF.
Sa
uq:
b
NFI;E"
EIl'
tsto
tottIGt:IF
_3 <o(D=o+;;O(!{rt
o=Ery NN
,,
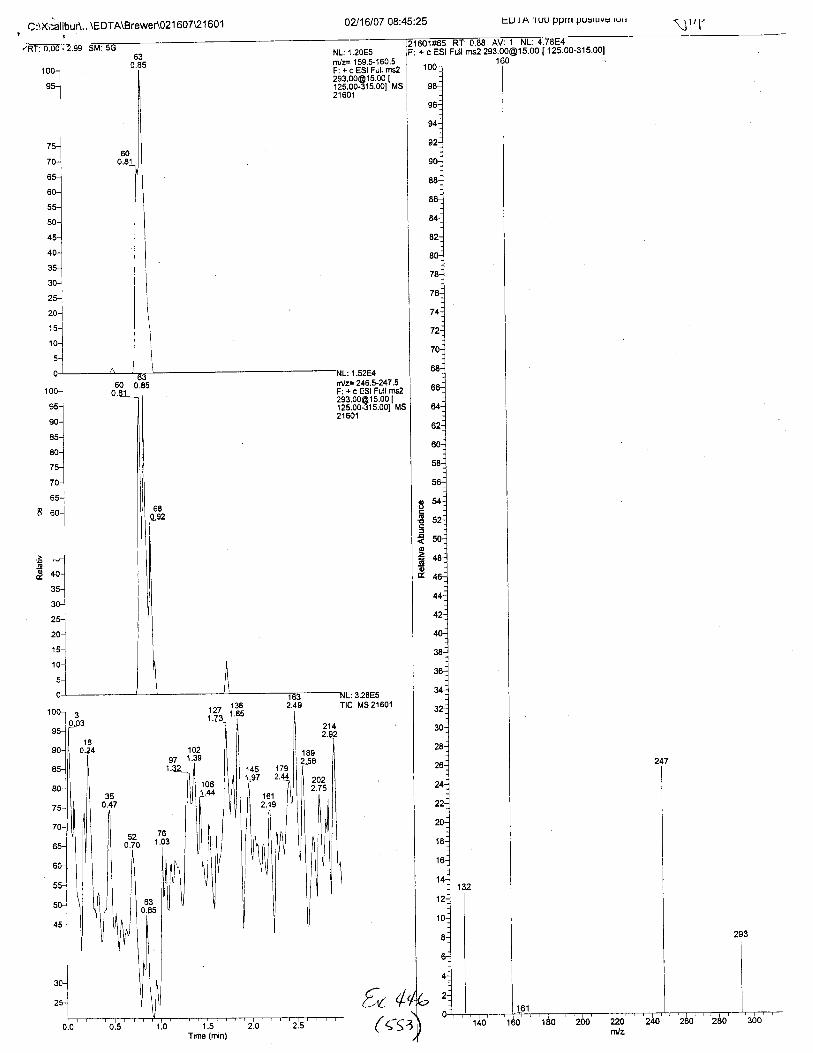
(utui) aullts>)7, o3
,!gDog
Doo
l09lz
'^rl'3.31633:33i Zsu llnl lS3 t + :J9' LIZ*'9,Z =zfJr
e8
L
L
rB
ro
r0t
t^^
Loo,
loo sle-oo'szl I oo'91@oo eoz zsur llnJ ls3 5 1
980
t09tz srit 3llllEc I .
r rnr rrnrqod tldd nn t. v t nl9Z:9t:80 l0l9tlzot09 tal09 ! zovoM€rgwloS\ "Vnqllsrx\:3

!s5)h3
lOO gre-Oo'SZl I OO Sr@OO eOZ Zsur finl lsf c+
l09ta/09tzgva/v\arEvlo3\"'1rn(r1dc5:3 I

. zoEt?,sn t09'9zE-09'gze
'09 00e-09'662ioo st@oz lle
zsu y'{us ts33 -:l 9 9Z8€'9ZE =zl!
. zoerzsm t09 9zE-09'9zE
'09 00e-09'662. loo gr@oz ffE
zsur y{us tsf3 - :J 9 00€€ 662 =zI!
9390 t :'tN
(u||u, aul1
(:.ul4?1h
3
z)tLzsy{ {o9 zre-09'! !E
I oo'9 r@oo'gsEzsu !!us tsl c-:J9Zle€ t!e=z !
ooo
qDoo
- ziEtzsn t09 U,z{g'zzz
'09'ttz-09'9'zI oo'9 r@oz !62
zsu ltus ts32-:!9't Z*gtz=ztt
e36Z'6:'lN.
- ziEtzsn t09 ezz-og'zrz
'09'ttz'09'9tzI oo gr@oz !62
zsul llus ls37 -:J9 EIZ-SI'ZLZ =z.tu)
93ES t :'lN
)y;y163 urdd 96189:09:80 L1ttVZlz0etru0etzgva/'^aigvlof\"1ni1;glcp.:9 I

l'.lJ,
\l
9t0ts-s ) ;ir!
001nozrzoL0
Loztzowlsvrt 9'609
€'s09
uldu !
!qD=o
oit
oo
o
soo
loooegoo'oo!]suc+:1
[oo'09*oooot]sutc+:
001veozrzoro/0elzotllsr,{ 9 008
€ 562=zltJ
93ee't
001,leozLaoL0
LozLzowlshr l,'96r
- L't6l=zlu
83tl'l
002flBOZTZ0LO
toztzowlslt 9't0t
€ eot
001IeiztzoL0Llztzjwlshr 9 960
f t6e
8319't:1N
L
[^l*L00 I
\a\.1lll1
\1"'I
--*;i\ [.0-r,\ [c""t;;;t \/ _ti\l*'\i \lli
ooz\lll W0zta0r0 'rl \l Lozrzowt il \lsn ct_r lr \i63erz - | Bo.o :'tN gt't
eprxo.rp,{q ulnruouluJe 7ee0'0 N9gH3:ozH 08:02o0 tw1ztzI L0 Loz tzourl\"'vnqlteen:3
77C
t0E
t0:Lt:80 lltzvzj E0L0 lol surpl LrIl

z ez'
c,
Q")Itttl a?
l.060zourlsW 9'609
-9 809=2ld
L'VL O
t060z0r!ls$t 9't0l
f'e0t=zlt)
z3e9 r
nod=,o
oDoo
oD
o
oDI
oo
og
oDoo
l.060z0ulsl^l 9 96e
€ t6e
aSzL'l
t060zoursw 9'00e
€ 662=zfu
I
IOO'OS*OO OOI I sru 11n3 c + :
IOO OggOO OOt ] sur llnJ c + :l
o
B5o
I
)E
tv
)9
)9
)L
)g
)6
)0tl
IL
1060z0ulsn /'96r
'1.'t6t=zlw
1309'z:1N
t060z0ulI I sncll
t9t
IOO'OS*OO OOI ] sur 11n3 c +
z9z-000;l_dunruoulule %90'0 NSsHc:ozH 9:96 ' xlurlsel lsf e0/0 lo"lz9:92:80 L0t60tz01.06020u4\xlurlsel\elepv nq rle.n: c

L,izsf"\ Itl Or-!-\
t€ 9t
eE r ivzl
r0'0 tt 0
Lrz 9t
f::l-uo
rrt*-o0t
i o, Iocu
out
[OO'Og+OO'Ogl I sur 11ng c + :
IOO OS9OO OS I l sw 11ng c + :
roL0z0uLsht 9 96e
€ t6e=z/t!
83e'' I
It0
9.DE'o
oDoo
oo
o
o
o
t0t0z0uu.sw crl
:'lN
i-ouI
-00r
[OO'OS*OO OSI ] stl 1ng c +
I 9z'
ls? l
xru4s018Z:09:0t Lllt0tz0eprxorplq urnruourure %00'0 raleM:loueqlahl g:96
l.0l.0z0urL\xlu4sef \elBpunqrlpc)0: g
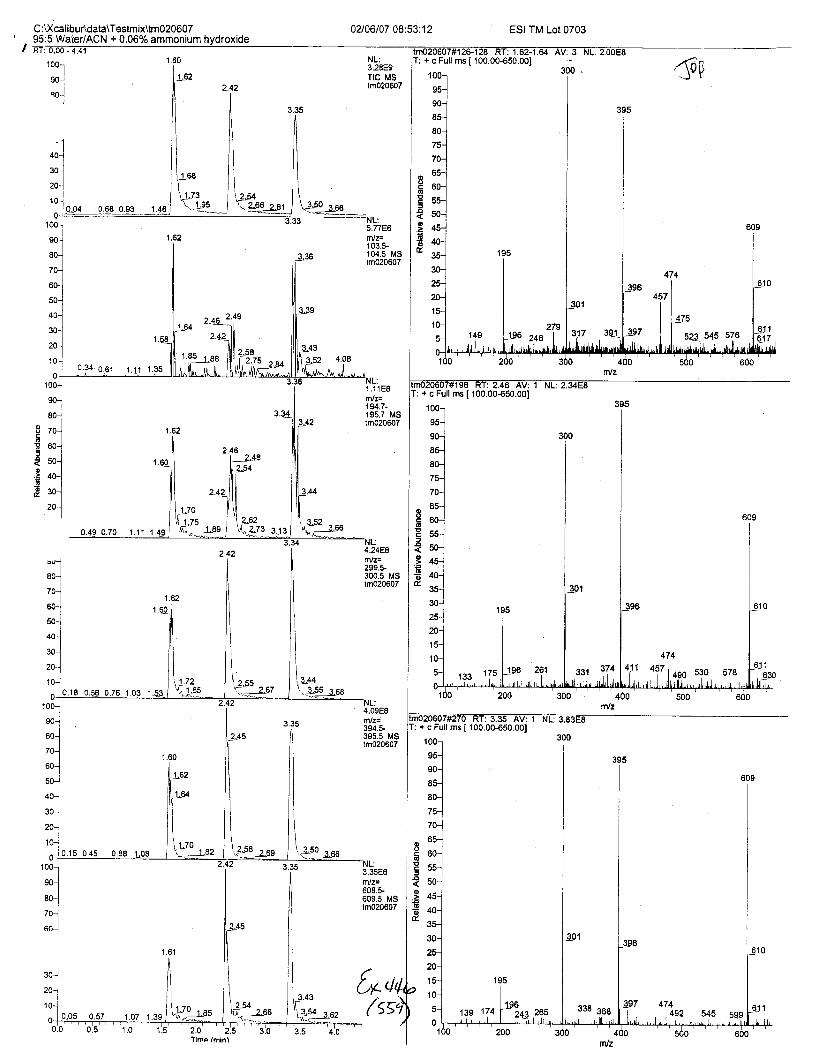
ss/'ht
I
lozl0€ d ldF-or ZloFos B
D
Fo/ nt*l-0eI
t06!00t
l090zoulslt 9
'0r € Eot4tr gfLl.9
:1N
aprxo.rpr{q urnruourure o/o90'0 + Ncv/ieieA\ 9:96/09020u4\xrurtsel\elepv nqt lm)0,: c

u{1.09020sW 9008
s'662=zltJ)
gSrz'z:1N
I
r0zrvL o
Fot ?loFos B
IEI
l-0s I
f06l!00 I
see 6ie
loo ossoo oor t u nnr " ' 'rl-
t=K
Lnut--r06Loo r
ujnruoruuJe 7o90'0 + Ncv/eFAr\ 9:96rlllL09020\x!urlsal\slepv nq!le3F: 3

t15 )htrl
Iu'r0/
fo'rou-00 I
a\L0z0z0S!11 9'609
9.o-,o
oco
1.,
t--roF09t^^l"tnJ
r106l-o0,
fo
IOO OS*OO.OO l I sur 1nJ r +
7oD
o
D
o
oo
=' orEooo
4!tLgzozosn 9 96e
€ t6c .r'=ztu ./ ezrs r / :'lN
zu.l'tL0z0z0sW 9'00s
*'662
au4.Lozozosn 9't0t
{ 00r=zlu
931.9't
./ drlL1Z1ZO -,'shl 3r1 "
6380'Z:'lN
f'809
,irfr ,/
=zlu ,-s38l.q /
unluouJule %90'0 + NCV/eleM 9:96zu4l.0z0z0\xlu4sel\elepvnqt lecx.: g
vgD
og
a!)oo
e0/0 lot u4 tsft0:8t:!0 L0E0tz0

[OO OS9OO OOI ] sur 11n3 c +
LnoI*l'- r08t^^[*-00t
IoFo!
l.0t0z0urlsn 3|l.63t0E
:'lN
z0 L 020u4\x!u4sef\elepunqrle3)3.:c e0/0# lo'1 - xrrltsal ls38 !:0t:60 /0tLotzj

,?s )ltv3
z0tetouLsvr 9'609
€ 809=zM
otvt u:fN
l.0tttourlsy{ ctl.63tZ r
:'1N
/0tetourst/{ 9't0t
€'e0l=2.[!
93€1.'S:1N

(,tCI,t-t1fi3
lJlH
N
}tr
o\
H
HA
HOl
HN)
H
E{
toHF.{
tr.m+ct"FJt\)H\ORHvrt
11F:H..F
Hoci 'rJH
3r :., (-,I Pl
'l-t-w;- @
E FS: 35s ?\\ u'|t H::N{
rtr
=-N
\-t\)_.- tn
6
_oor
FBc
PHNN)
o
t$DTat\
H(l)NN]
N
zE{
AUJo|0T
H@N)N)
P
H|ANN
H
tJN)
OHOlN)N
O
+
{F-
N)
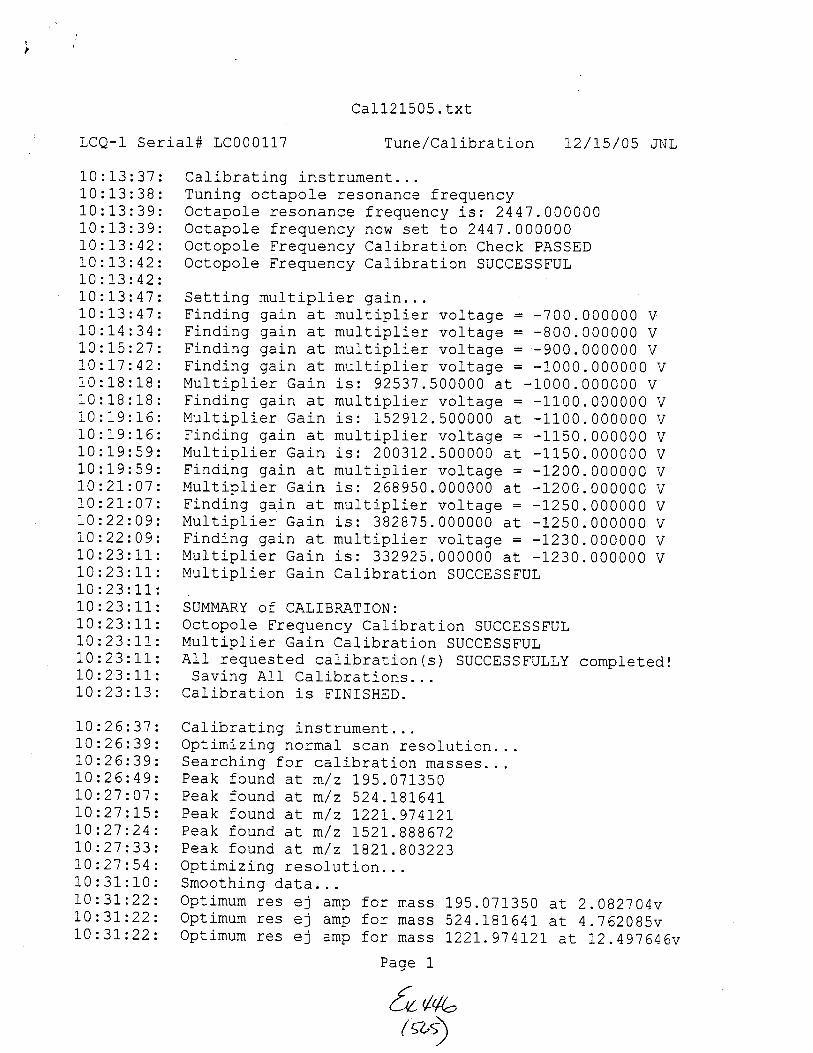
Qu)%79
1 a6e6
^9V9 L6V'ZT f e lzTv L6 - IZZT ssPru
^gg 0zg L' v 1P MT?I.VZE ssEru
^v0 LZ80'z fe 09eT10.96T sseu
Tnr rilrrrn l-r -^T tttnrrrrrAn 4vJ uus Ls >srJ urrl(u L -+Ltuf,oJ dure [a se: r:rnur11dgTn r rltrro l-r ort tttnrrrrrzlln 4v j sus Le DE J uLtur L +LIU
' ' 'ef ep butqloourg'''uorJnToser bu:rzTixTf,dO
tzztog.IZ8I z/ur 1e punoJ {eadzLgggg.IZ9T z/w le punoJ )tPodIZTVL6.IZZI z/u 1e punoJ )ieedMTSI'bzg z/w 1e punoJ {PedOgtTLO.96I z/w le punoJ {Pad
' "sesseu uorJe-rqrTec :og 6ulqcfeas'''uorJnTose.r uEOs feurou butzTluTfdo
' ' 'Jueun.TlsuT 6ur1e:qr1e3
'0SHSINIJ sT uorfe_rqrTPS' ' 'suorJ€.rqrTeO 119 6u'rleg
:nrrrr.i[ttr^^ /^\?ipcf efouoo ITT1JSSgf,OnS (s)uorferqTTe3 pelsanbe: TTV
TnJSSt3CnS uoTf,erqTTeO uTpt :at1dt11n61TnJSSEOC6S uoTferqTTeJ dcuenba-:g elodolcg
:NOT.I\'dETTV3 JO I.UVNNNS
TnJSSECO1S uorlerqTTEC uTpg .:at1dr11n61A 000000'0t.ZI- tp 000000 .9Z6Zt.t : sT ureg :ar1dr11n61A 000000'OtZI- : e6e11oa :er1dr11nu 1e uTeb burpurgA 000000'092T- f p 000000 .9 Lgzgt : sT ureg :a'r1dr11n61A 000000'0gZI- : ebelloa :er1dt11nu Je u-reb burpurgA 000000'002I- fp 000000.096892 : sr uTeO .zer1d111ni4A 000000'OOZI- = a6e11oa :a-r1dr11nu te u-reb 6utpurgA 000000'0ETT- fe 000009'ZIt00Z :sT uTeg:ar1dt11npqA 000000'OgTT- : a6e11oa terldrllnu le u1e6 6urpurgA 000000'00IT- fe 000009'Z16Z;T :s-t uTeg :at1dr11n6iA 000000'O0IT- = e6e11oa f,erTdTfTnu 1e ure6 6urputgA 000000'000T- 1e 000009'Lt9Z6 :sT uTeO :er1dt11n51
A 000000'O0OT- = e6e11oa rerldrllnu Je u1e6 butpurgA 000000'006- = abelloa :er1dt11nu Jp u1e6 6u'rpurgA 000000'OOB- = abelloa :er1dr11nu Je ure6 6u'rpurgn 000000'0OL- : e6e11ozr :ar1d-r11nu 1e u1e6 butpurg
.,,ThA ?^--.{-- --,,, A,,-- - ^^ uLsv 4s L Lu !+ Lrrur l!/u f++rrb
TSJSSgCCnS uoTferqTTpJ frcuanba.:g elodolcgCISSVd >{ceq3 uor]e.rqr1e3 Acuenba:g elodolcg
000OOO'LVVZ ot les Aou {cuenba:g: elodelcg0o0o oo' Lvvz : s1 r{cuanbe.:J: esueuosa.T elodelca
,f,arranF.r-- ^^r"h*AaA- ^-^J--^^ A"-"* - /\JUSLTU9JJ 9rJLrgLr\J>gJ rJ L\JLrg+\.r(J l.JLl L (,.ttJJ
' 'Juarunrf suT 6ur1erqt1e3
-+^++h^ /^'uoTlE.rqTIe) / aunl
IZZ2ZZ:zz
OT
v9t€VZ.T
LO
6V6t6t
CTIIITIIITITITTTII
IIITIIITLZLZLZLZLZ9Z9Z9Z9Z
EZI,Ztz
EZCZEZtzI,ZZZZZIZTZ
8T8TLT9TVI€IET
OT
OT
OIOT
OT
OT
OIOIOIOIOIOT
OT
OT
OT
OT
ez20r
.ou
LO69o:9T9I8I8T7,V
LZ
LVLVzvZVZV6E6t8eLt
.o L
:67:67
OTNTUL
OT
OT
OT
OT
OT
OT
OT
OT
OT
OIOT
OT
OT
OT
OT
OT
OT
OT
TI: OT
TTETETTTTTtT
OT
OT
OT
OIOT
OI
TNI EO/9I/ZT
lxf'909TZIIP)
LTI0003T #Ter.ras I-037

/I q.t< )\' ,-J
qTrh 27 abe4
' na- ^-'r"'^^ i pc+ir Loruoc ITT1JSSICJ1S (s ) uotlerqTf Ec pelsanbe: TTVTnJSSgCSnS uoTlerqTTec sseht uess cgv
TOJSSSSJnS uorlefqrTeJ ssEt{ uecs TElxf,oNTn.{ssgJcns uoTlpfqTTec uoTlnTosou u€cs Tplu.roN
:NOI,IVUSITVS fo TUVUNnS
TOJSSgSSnS uo-!lErqTTec sspht uecs 3evzlee?z'9 :NHMJ qf,T^l (TZ000t'0- :f JTp)
6 L6ZEi'IZST z /rr 1e punoJ 000t 96. Tzgl z /wt81959't :}JHMJ r{l-!iq (ZAAATt'O :f JTp)
z6616Z'ZZ9I z/w fe punoJ 000216-TZET z/wI69T7Z'V :rdHMJ qf -!A (9000t0'T :JtTp)
900Ie0'EZZT z/ur 7e punoJ 000T66.TZ7T z/ur299929'V :liHMJ qlTA (0T000t '0- : JJTp)066V98'ezg z /ur 7e punoJ 00099 z'vzg z /vr
BLZg06'Z :NHMJ qlTA (86666t'0- :JtTp)202889'v6T z/w le punoJ 002880'96T z/w
' ' 'e:1cads 6utbe.zeng"'uoTl€.rqrTpc sseu ue3s 3gV 6uT>tcaq3
" 'e:1ceds 6ur6e:enq'. 616299'IZ7T z/lrr 1e PunoJ {ead
z6616Z'ZZET z /w 1e punoJ {Ead900Tt0'EzzT z/u 1e punoJ >{Pad
I96V89'VZi z/'rr 1e punoJ lPedt0z80t'96I z/Dr 1P punoJ {eed
' ' 'sesseu uoTlE.rqTTec f,oJ 6urqc:eegusJbo;o JlS fol sassElu DuTle-IqrTeC
TnJSSgSCnS 'qTTe3 ssehl 3 uorfnTosau uEcs rPiu.roN06zLt9'0 :hiHMJ r{f Tr (IZLgT0'0- :f lTp)
6LZ9e6'IZ8I z/u 7e punoJ 000t96'IZ8T z/1It9Tt99'0 :IdHMJ q1-!1"1 (6216 t0'0 : JJTp)
6ZLIZj'ZZ9I z/u1 fe punoJ 000216'TZET z/wvvzg t9'0 :rdHMJ qlT/" nLL6t0'0 : JlTp)
TLLjV0'ZZZT z/u 1,e punoJ 000T66'TZZI z/urLV90LV'0 :NHMJ r{f,T1"1 (It8gI0'0- :JlTp)69T8VZ'VZ] z/vr 2,e punoJ 000992'vz? z/D1
IL96Tt'0 :NHMJ qfT/ur (OEegT0'0- :JlTp)09EIL0'96I z/w 1e punoJ 002880'96T z/Dr
'''e.r1cads 6utbe.rerrg'' "uoTte.rqrTec sseu pue uoTlnTos"r y:?:_Tplurou 6ur1ceq3
- - 'e:1ceds 6u16e:eag"'uecs Teu.fou .roJ sasspru 6ur1e:q'r1e3ipeqsrurJ sT uoTlpzrurlldo uorfnTosa6
tVgLOg'I :1dec-ra1ut Iasa-r Aau LOVg00'0 :ado1s Iasa: meu
L6BV86'0 :1dac:e1ur Iasa: p1o Zgggo0'0 :ado1s Iese: p1o
^TT0g9Z'g fe EZZ; 08'IZ8I sselu ;oJ dure Ie sa.r u,rnurlldg
^Ot€E99'IT ?e ZLggBB'IZgI ssplu roJ dure [e sar urnr:r11dg
v0t0t0t0v0t0v0t0v0v0?0t0v0t0t0v0v08T8T0t0tttLZOZ>l
9090v0t0v0t0v0t0
v0
v0t00000LZLZtzzz7,2
ZZZZ
:9t.YL.vLi9t.vL:9t.vL:9t.YL
9e9E9t9t9e9t9t
.YL
.:L
.:L
vtVL
vtvevt
VL
vt
vt.
VL
vtttVL
eeTETETCLL
TC
TTTC
IT
OIOT
OT
OT
OIUL
OT
OT
OT
OT
OT
OT
OT
OT
OT
OT
OT
OT
OT
OT
OT
OT
OT
OT
OT
OT
OT
OT
OT
OT
OT
OT
OT
OT
OT
OT
OT
OT
OT
OT
OT
OT
OT
OT
OT
OT
OT
OT1xr'909TZTTe3

9tr900'9200tTTZ'0t
000000'8tT Jo du000000'vzr Jo Ju000000'90I Jo JU
000000'09 Jo JU000000'88 fo JU
'serJTsueluT
/vls) avhg
^ ^A-. L evsd
:JurJ.ruor Aau z6tgg0-0 :edoTsJ.ruor Aeu:fuTJruoT pTo vttzg0.0 :edoTs::.ruoT pTo
ful le tgLLL6'IZ7I z/u Jo F11sue1ur xp6[ul fp 9zg966'IZ7I z/w Jo .,t11sue1ut xe6[ul 1E gLZZ7O'ZZZI z/ur to d11sue1u1 xe6'[ul fe LT667Z'VZg z/Dr Jo dlrsuelut xe6'[ul fe LtgtIT'96I z/w ;o r{11suefuT xpry
"'e?ep butzrTeru.roN' ' 'ef pp Eulqloourg
uoT unurTxpur .roJ JU uorfca[ut bulzTurTldo
LCLILILLLELtLt8Z8Ztt€t9ZLTOU
TO
z9Z9T9TET9T9T9IJ:
tr\
09\J :I
7h
OEt7/n/
n76T6VThIVLVth
VTETTT5UY59E
IO: TTTO: TTTO: TTIO : TTTO : TITO: TTTO: TTTO: TTIO:TT99:0799:07Y: . U L
Y:. U L
Y: . U L
Y: . U L
99:07
99:07::.UL
::1 'U L
::. U L
Y: . U L
Y:'ULY:'UL
Y:.U L
t9:07I/: . U L
Y:I'U L
E9:OTL: . U L
Z9:OT2920r
T9:01T9: OT
T9: OT
T9:OTIE: OT
09:0709:07
tgtlL6'IZSI z/ut 7e punol: leed9zg966'TZgl z/w 1e punoJ >teedELZZSj'ZZZT z/w 1e punoJ >{eedLI66SZ'VZg z/w le puno] >{eadLtOtTI'96T z/w 7e punoJ {Ead
"sasseur uoTfp.rqrTec roJ 6u1qc:eag'''JU uotlca[u1 6ur1e:qt1e3
TnJSSg33nS uoTferqrle3 .dcuanba:g7ur:oJerrpMxo sr uorfe^Tlce uoT fof uoTf,e.rqrlec r{cuanbe.zg
zH4 ZgL660' 89 :dcuenba:;. pe^.resqO' ' 'zH)t 0O00gI'g9 :fcuenba:g: pelcedxg
'uoTlp-rqTTE3 {cuenba:g: uorJplrlce SN/SI/i 6ur>1ceq3XO s1 dcualrTJle uorleTosl
palce Ia gIZgVZ' 9Zg z /w Jo luec.zad T LgV96 . 66
h^- ^- r^ yv_1vvud 9IZgV7,'VZg z/w Jo Juec.rad LTvgvg.66paurele.r gIZgVZ'gzg z /ut Jo luac.red gtVV LE .96
'''9TT.7VZ' gzg z /w 6ur2teTosI'uoTJefqTTPc u{cuenbe:; uoTfpTosr tu-roJa^er'r 6u-r1caq3
rrrrrilrrrna f^t'^-t-^?+ /ii'-^+^ ^ ' e-lelouoc uoTfeJqTTec ncuenDe.rJlu_roJaApM0000 gZ' O Jo b f,oJ uoTf e.rqrlec 6urf pTn3TeO
6uluuecs euoq000092'0 fo b 1e OOOZL;'TZ;T sseu 6uluuecg
buruuecs auog000092'0 Jo b 1e 00zgg0'96I sseu 6uluuecg00O0tB'0 Jo b f,oJ uoTfprqTlec 6urfeTncTe3
6uruuecs auo600goeB'0 Jo b f,p OOOZL6'TZEI sseu 6utuuecg
buruuecs euogO000Eg'0 f o b f,e OOZgg0'96T sspur 6utuuecg
' ' 'sruroJelen 6u11e:qr1e39zg966'T7,gI z/w le punoJ {eedLtOtII'96T z/w 7e punoJ >{Ped
'''sosseu uorlp;qrTEc .roJ 6u1qc:eag' ' 'lueunJfsuT 6u11e:qr1e3
'oSHSINI.{ sr uoTlefqTTe3' ' 'suoTlErqTTeC 119 6urneg
f,Xf,'EOETZTTEJ
EO
v0YL9e
OT
OT

(ws )qfiU
7 abe6
TnJSSgS3nS uoTlp.rqTTeS sseN ! uoTfnToseu uecs uoozEtr09T'0 :rdHMJ 1-{1Tm (9686r0'0- :++lp)
E0Tet6'TZ8I z/w }e punoJ 000t96.I28T z/w880T9I'0 :NHMJ Q11n (tt66I0'0 :flTp)
ev6T66'TZEI z/w 1e punoJ 000zL6.IZEI z/wLV6LtI'0 :rdHMJ qlTA (698tT0'0 :JlTp)
698900'ZZZ\ z/\r 7e punoJ 000T66.TZZT z/wz6qltT'0 :I{HMJ qfTM (0009I0'0- :JJTp)000092'vzE z/ur 1e puno] 000992.v29 z/w9L9LTI'0 :tdHMJ r{fT/'r (6L6Vt0'0 :JlTp)6LTttI'96I z/u 1te punoJ 00zg80.96T z/w
" 'e:1cads 6ur6e:eaq,"'uorlerqTTec sseu pue uoTfnTosar uecs uooz 6ur>1ceq3
" 'e:1ceds 6urbe:eaq."'upos ruooz f,oJ sesseu 6u11e:qr1e3
ipaqsrurJ sT uorlezlurldo uorfnToseu060919'0 :1dec:e1ur Iese: mau L69ZOO. O :edo1s Iese.r mauOI7ZZZ'I :ldec:a1ur [esa: p1o 999T00.0 :edo1s Iesa-z pTo
^TEt gzg'V f e 8969 gg'IZ9T sseu roJ dure [a se.r urnurtldg
^T Bt tZ6' t 1e V 109 L6'TZZT sseiu f,oJ dure [e sa: urnurrldg
^VZt gIL'I fp IL66TZ'VZg sseu f,oJ dure [e sa: urnurrldg
^ge LZ,gZ'T 1e 0tTe6O'96I sselu roJ dure [a se.: u:nurtldg
. . .,,or.,,;;:3:rr:;iT;::H3i{eo/vl oo1 000t96'IZ1I z/ur 7e leubtg
i000t96'TtgI pue 000t96'T0gT z/u uee/qfaq punoJ lou Ieedtg6ggg'IZgT z/Dr 7e punoJ leedv 109 L6'IZZI z /w le punoJ >ieedIL66TZ'VZi z/w 7e puno!: {eed0LTE60'96T z/w te punoJ leed
' ' 'sessplu uoTJeJqTTec roJ 6utqc.zeeg'''uoTfnTosa.r up3s luooz bulzTurTldo
- - +udr.urrr -+SUT DuTlpf qTTeC
'atnFIsTNT.d sT uoTte.fqTTei :
'suoTJerqTTeJ 11y 6urae5 :'n=trrArrrnr r-rnr---^^n - /c\ rrnrrDTdrrE- n3rarn-nr? rrrr .I Vq+e LuuvJ A l_ Ill.1 bbilJJllb \ >,1 uv | +q4y ! L trJ yc+beLr.rrdr L LV
TnJSStSSnS uoTle"rqTreS JE uoTfceLuI :
TnJSSgDOnS uoTlerqTfe3 .{cuenbe.:J/ur-roJe^pg: NOTTVUETTVS JO I.UVIdNNS
TnJSSEJC3S uoTlerqrfe3 JU uo11ce [u1LIBL96'tVT :JU Iur po^]osqO !LIgL96'gtI :JU [uf pelETncTeJ
00Ot96'TZ1I z/w :.te uoTfe.rq-!TeO JU uo11ce[u1 6ut>1ceq3V99Lg6'Lt :JU luf pa^.resqo !V99Lg6'Lt. :JU [uf paleTnoTe3
00ZBB0'96 T z /ut lp uorlerqTTeC JU uorlca[u1 6ur>1ceq3'pet{srurJ sT uoTferqrTE3 JU uorlce[u1
: TO: LT'Tn. / T
IO: LTIO: LTIO: LIIO: LIIO: LTIO: LTTO: LTIO: LIIO: LT0z2vrOZIVT
TTTTTTIITITTTTTITTTTTTTIITTTTTTTTTTIITTITITITITIITTIITITTITIIIITTTTI
LE: TILE: TTe t : tTzt.trZE: T.T
ZE: ETZEZETZE: CIZI.: EI6T : CTET : II0t:0IUtl.UL
99:609e:60L L. OU
8E:80.OU.UU. ou.6u. ou.6u
6ZLZLZLZLZLZLZLZLZLOqn
vvtv
z0z07,0
ZO
z0ZO7n
ZO
ZO
z0ZO
IOTO
TTIITIITIIITITTTTITTTTITTI
fxl'90EIZITeC

/.\6'15 /
-lm x'r 'f -' {..2
^ ^tr--
'0gHSINIJ sr uoTlelqTTEc'suoTlef,qTTe3 119 6u1aeg
.^^^a-Arrrna rfrn^rdd-^z\ncr rel rr.)T'tltTctTTpi nCI vs+e Lsuvv n r roJSSE3S3S ,r, ,ror*t;qrTes palsanbe: TTV
TnJSSl3SnS uorlejqTTec ssPl^l uEsS luooz'
TnJSSISJnS uorJe.rqrTES uoTfnToseu uecs uooz: NOII\'dgITVS !:O AUVNNNS
f,Xf.9OEIZTTPC
ZO
TO
TO
IOTO
TO
LTLTL1LILILI
ITITITITTTIT

Vts),lfr 7?
SAJ
nl5rr y
'sesmoo {ronloqel pue am1cel f4snuaqc praueE q6neg
lnrqcouuoC lla^BHlsed\ue^E{
^reN Jo r(lrselrunJopnrlsuJ ,{.lxs;ueq3
rqlnserrr9ruoqq1o^,**:":"f,lj j?,H:#St5'1:'ffi tg;n"trffjpuu rueuou4sod uo sev(1auu pgelocrperu peu-rog.red :eJodei droprogq IBrcWo perfrs puu pa^\er^er ifroleroqel faol0cxol j,s*ro; erpJo uorl"redo {Jep eq1 paEuuE4l
ecr#o s,reurusxa r**"#T:fl: Ilil 1ffi3rosl,uadng,{ilo;ocgxoa rlsuorog
surulc Euuedurel pnpord olur suo4eSqsegrJ pug suosrrsduoc 4ur .sfesse
edp ryuq 'suoq'rrrr*)€ enplser 6nrp pue anrp 'sei4are priaol*1*o1 sealo^u {Jo^res"ctpn d4qruag3 erfl ol pqrluqns eeueprle uo suorlsurursxe crsrnJoJ peurro#ed
'J'O.uotEqqseAuo4eErlsarrul go nsamg Freped
droluroqrl 1ggppoloc;roa / 1s!uraqC rr$ueJod
uosuoqsuru",€c$ualorroec*,-df f#Jffi ""rff ffi *ff::T,Hfi ;; uopzurpJooc 'leuuos-redJo auplT'groder Fcluqceuo A\er^eJ .sesbJo luaturcrssu puu
acueqdecce sapnlcu filJrgrsuodsog ?lun ,qsFuaqJ eBJo uoqs.1add,qpp eql aEegepri
'c'o'uo€qgs€/l\uoqeEqseluryo memg Jerepe,rl
droterogrl lggtq tleq J,f.roq,r"radng / Jel qC rlun
0661rdv- 886I ldes
t66l],.o- 066I eunf
000zdes-?66I lco
ueserd - 6g0Z dag
rrvL-789 (eOr) Xvg sovL-zls GoL)gEtZZ yl.ocqten|
fe,tqrad uorpE4searq 1gg7uorpE4selul Jo neerng Isreped
gZZt rtrooU lrun,(lsrureq3drop-loqe11gg
'Q.tld ,nnagaT .v stolN
lIJN!trWdCI TVNOIS SIdOUd
9002/81/27 :pelJlpoht rsrlglrJ,IA I/\inTOJnfUnJ

n75h 13
dEoJocrxo;{gdosolq4go eprolro(I
pu?l&ql4l .erour4Jeg
oJo rulflBg - puBlfJBIt lo,ggua,r1uqs00z cec- ,66I deg
{Eolocxo; :uoq?4uecuoC,(Eo1oq1e4 :rofu;41
Irol{\ esmoc epnpBrgtmossrI J
.srno-J ltnEs
,{1;sra,r;ug slnoT lulBs ?66t ,(FI _ 066I EnV
ecuarcs crsueJod :-rofuygaarEeq ecuelcs Jo relsql4J
1ncqceuuoC te^?H$e \uaacH aeNJo rQ;erea;u1 066I eunf _ 886I deg
ecFsnl I?uFulrC ? l(4sluregf, :uofeyrleerEeg suyJo roleqceg
rmossrt4 .EmgsuerruTyl
d1gs.ra,r;uq otBlg rrnoss!trAl lurtueJ g86I fqn-rg6I EnV
NOIlVf,norr
'ses{pua Ftueun-qsur puc suoqce4xe peuuoled
Fnossrl^l .smo.I
llnss{ueduro3 l?cFrreqC olrr?suoI4l
uBlJluqJal rf.rolu.roqe1 9g6I ? sg6l srauruns
'ses{puu esm qI/$ slslluetcs pe6rss? ifEolocxolcrsueroJ prrE lqueuuor^ue Jo saldrcuud paureal Spomesec crsueroJ Jo rosra:edns pelsrsry
enrealfsuua;'enorg aolll/t\secr^Jes Isclpenl FuoF?N
uJelr{686I rdes-686I flnl
91 go g e8e4nBega.J.YuSW

\L r{aTrh'
poome'pg 'spunorc Eupor4 ueep.,,qv rsuesrv pooao"'pg 'ssauatoay tua*y atof.o^'#:.m'Eqqaewlsnuuvlsls-socuelcsslslleJodJoi(ruapecyuecFeruv
6661 .wntsodw$c$aaloly:ouontuo|tg
'ocrxelAl A\aN'enbrenbnqly '8urpery ISVLUICOS 9661 .,fu4awoacadg sso1,r1 uou2zluol loaryaqJ
'ocr:<aIAI ,rteN,enbrenbnqly .Eurpe141 If,VLUJgOS 9661 1oudQt1og
'cu1 'ser8olouqceJ l€crueqJ pequn aoucntry asottd pllos{o acuaps eql'Eulpey41
l"nuuv WgS - sE cuercs crsrreJodJo ,(,uepscv rncuetuv .cuaryu$ puo lpJuDN :sauuau4dttl
crsrrerodJo funpecy u?crreruv .gqocgol puo taeouy,,aop"o*rorlffi|4rffirmt ;ffi;;;,
ql09 - s$uarcs crsueJodJo durepecy uscrJaruv .ttotptoqvf acuarcs ?rsui,tod ,r, ,r r**i,jffi#)#W'fuedruo3 prY:lced-Uellnel1 .spatoqdat1ca7 rfuo1ydo7
'^unpecv Jgdle uoqs4suounp .cuJ.sacrleuv 1X1 .Eututotl actrag ttunaas IuDg
'Euqearu 1enuuv ql6t - seorraros crflrerod
3o fruapecy IrBcIJeItrv 'atwuattpv pa8opcaoJ{o sapocaq a)"ril ,ptr*og pup ptonqoDg EuqooT
'Eqleeyq pnuuv rF6? - secueps rrsuerodJo,(uepucy uecrreruv .acuapg BuanT y :go1auo1 crsua.nr
- s3cuelcs clslrelodJo druepucy rrBcrreurv 'shtug aaN puD nolo uo11o7atd.ta7u1#YHW|'droluroqe-1 1gg'stostuadng tCtoyanoqt7 .to{Eutu7o.t1 Tuawahouo7,tJ
.srepanbpeell 1gg .Buno.q setryg
'elrtlusq 1y41 ueEruurl 'asrnoJ suoaondg g}p
'EuqaeI^Ji{resra'rtuuy rpEg - quEoloclxoJ cIsIEJog;o dlenog 'sc1do1 pcu/clDuv :,EolocnoJ crsua,pl pacup pV
slstEoJoctxo; crsuerodJo drpog 'ndol aaaptatdtawl puo ctuolocouoaa ,arff;1"7;gfrt**
'6upel4l dresreruuuytFgZ - sosrEolocrxoJ crsueJoggo fleycog .astnoJ clmg y :,GolocraoJ a$aatogp;lDruawnryn7
'uoqe8gserrul Jo msmg IErspeC .asno3 Eululz.u .tawwoxg onuatoi
'arnfqsul J\114I usEpqg .astnoJ cuotrotilO 0001 OSX
froprcqr1 Igd eql fq perozuodg .aruaos ctsuatol ut spo.lrary cuydot&olowant13
''ftr$laqJIBclullJ roJ uop8lcossv u€cueurv eqt {q perosuodg 'ueuay y :Gopctxol ut acumt4 puotssapi4
'qql Igd a111 dq perozuodg .6o1octxo1 crsuatol uo wnnodwtg puolrnuragl uV
:6661rdy
:666I qed
;866I lco
:866I lco
:866I {EAI
;866t ged
;866I qeg
:866t qe.:I
:1,66t Inf
:L66I Inf
:t66I qed
:t66I qed
:/66I qed
:966I cec
:9661Eny
:966I unf
:s66I rco
:s66l1ro
:s66I rO
:S66I JqI I
;s66I qad
;?66I ce(I
:€66I unl
:z66lunI
9NINIVII TVNOISSSCOUd
91 go g eEe4nBage.I 'v UBI^J
-sahh g
'aasseuuel'aJpnqsep .Eu4eery gggs S0OZ .uoqqerdrepl fEolocrxo; uegou4sod
.aessnuuel .allhqsuN .Eupearu JSOS S00Z
.uor1e1ode4xg uorp4rncuo3 loqoclv poolg
lteQqcy4i 'roqrv uuv 'ue6qcr613o ,(Iuelrul - ssoulsngJo looqrs ssoa 'urnrsodrufg luerudolalec droteroqrl arurrJ
'ueflqcy1 .Ernsuel .esJnoC Eururcrl Jossessv lnao.a pu.tauJ g;qr1-(1JSV
'eplEryn .ocpuen| .fiuepecy Igd
.efnfpsul lrnurdoleaeg elqncexg
- roEerg .pueluod .Eu$eqAI
ISOS g00Z ,(tgW){6o1ocrxol clsllerodJo PJ"og u"cuaurv eq1 dg uo4qrpeo"{ noruoqrl .rog Euruuel4 pue uo4aredar4
'1'g41 'srlodeauur6Jtueurdoprcg froleroqrl eruuJ uo umrsodru,(g lsnuuv ,I€
.sdlqsnqreg qEnorql """"lfnog
Eqrcyqcy
'v5 'auepy asuodseg pue ssauperedsr4 :rmuouer ro3 &rmuoddg 30 spaEy l?cl.,,eqc
'CO'uolEurqse l ?ugqzrl aoeld4ro7g earg-Eruq drosrir.ndng s.tue-6or4 acuer-repq Enrg
'LmossrlN'slnor ls tuerudopaeg qql eullrc uo umtsodrufs Igd Imuuv qro€ suoF€zr-uuErg cgquercs aqp;i
'Equlert eull-uo {ro^qeN esnoH tpurp .drqs-rapee.J Jsuop?rqls
'oqep1 ,{s1pn uns 'ecuercJuoJ rpeeq qluvr Eurcueg :s8nrg qn13
'quroJllsf, 'oEerq ue5 'Eqryers puu Jpessy l"ru{es 'ecuelorn cqseruo6l uo ecuareJuoJ lguorl€uelql
'uo16urqsel11'ol$?as .Eupe4pnuuv pJEs - seouercs cr$r)jogJo ,(uepecy u?crj{rulv 'atry\n3 Eug.ltnof, .AaN aw puo ,sqn7ut1nt77 Saavg
'ulsuqJ$lV\ 'ee{m^r\lrw 'Eu4eel I rdos 0002 'sa&ua170r13 lmUQouy puo,Eo10counot14 :sautdamtpozuag
'Irt\ €eern"inlr61 'Eurpery ldos 0002 ztusua) 7s77 aqt{o Eutuu&ag aqt w sru/Jilo swouocttddy csuarog
'*srroJsrly\ 'ee{n?rlrllhi 'Eu4eeI I rdOS 0002 'wsuaual 70cwat11p xcadsy luc&o\,ctxoJ ctsuaror aLl
'sreuenbp€eH 1gg 8utuw.t1 scttltg
'Euqee;41 l"nuuv puzg - secmns crsueroJJo fuapecy u"clreury gggT -ssatoqdo4ca1g fun1pdo7p suouocllddV c$uarol
'Eupeary pnuuv puZS - secueps crsuarodgo furapmy u?rrrerrv gpgT'Gopcaol pcut1ouy ur swartg,(issoounwuJ awldel"11rgj,
"r2 "r11
:s002lco
:s002l3o
;S002 EnV
:s002 fry\I
:s002 qeg
:€002lco
:9002 des
:€002 u?f
:z0oztco
:7967 ldeg
:7997 ^sIN
:7gg7 rdy
:2002 IEI^I
:1002 qed
:0002lco
:0002lco
:0002lco
:6667 rdy
:0002 qed
:0002 qec
:6661Eny
61 go p e8e4nragrl .v trBl4l
'emlpsul JVI4J u?quuld .ailnoJ tuuu.rl tnquDcx

SL
"fih'S002 FnEnvl,(nt lS 'oN.6Z lo1 'Idvtt pue ISOS3o Euqeeyq lulor t00z eql ol pelgclpap tsolocuol lnwQouyp lo nolp anitl lq*oiL$J" ro{pe-oc
.I{VII PU8ICOSJo Eurpel4l rulof tOgZ eW q pel?cfpep g rtt1do.t&o1owott13{o louno1ro ensq Iscedg aqlgo roflpe-oJ
's002 tegopo 't 'oN'EsI 'lo^ 'JJrvf,L pu?Jdos Jo E*teew turor t00z eql ol pepcpep /puottouatul acuaps ,Eua' glo enssf lqreog
"i[go ]oilpe-oc
ea$unuo3 srs{ nypcl8olocxo; cqeuelsfg OWff) qsEolocrxo; crsueJodJo uor1enossv Isuoq€uJelql orll Jo raqruelt
ee$rururoJ qsquercs 6moa OWff) silsrEoloolxo; crsuerJoJJo uoq?rcossv Fuoq?rr*re$J orll Jo Jeqrue4
uouputwoxiJ c tsualo! ilnossYIntxas aqt n{ sptoptalg PuoupN ps ol ee$ururoJ - aJISO s.ueruod\ lsuleEy ecnalorj eql ol lueqnsuoJ
UCUtprAg wsuo,ual lD.rtwaqJ-fo saQouy usaa"rog aq| uo dnotg EuatolX cgfuuang erg go [IsuulBrlC
ae$ruruoC {Eolocrxol - scrsu.rrod flpn} ol lue+lnsuoC
leued qnDlsy pnxEs papt!ilcog-8ug elo'rtJ Jo su{lrl1 roJ ecSO Jo reqrue}11
qsfoJorxo; orslreJodJo uoqercossv Fuog?uJelqJ eql pu? sls6o1orrxo1 crsrEJodJo ,gercos arygo Euqae}tl lulof pug fEolocxol crsrprod uo umrsodurdg droproqrl Isd t00z atlrgo rt"q3
aailluuoJ ooH-pv uouampg BunuiloS I{OS Jo reqruel{
aailtwwo) coH-pv ilnasry Tnuag patwgtcog-Euq I{OS Jo usru{al3
ropedsulpellpJeC (Wf-AfCSV) Pr€og uoll€$pe-ptv ,fto1aoqe1 - slopenq drolaoqrl eu4:3go {prcog rrgclJeruv
eailrururoJ ,,$puep1 crsuerog-slsr8olor;led rr?clJsruvJo eEalo3 eql ol lugllnsuoJ
suouo:Jlunwwo) aauaos ctsualocJo pJEog Isuolpg er{lJo JeqIIIeIAI
prn4iloy pawqcog Euq aoqsnlJo fueuqrdeq
earlulueserdaa froproqel lgl,- (gnv1D.ilg) s&ntg paztag{o stseouy aqt rcldnotgBu14.to6 cg[uuaag
'8o1oc1xo1 u1
3u1u1ot1 Wp uorttcnry uo aaulutwoJ tqol aW o1 e^qslucrsnJdeg secuarcg cr$eJodJo dunpecy umlJeruv
prlm,4 Go1ouqca1 Suusal8ru6r ecnsn1 go ernrpsql puoqsN
Jeque gng iqqEolocxol crsrnroggo dprco5
JequreI I iqqEoloclxol rtstrarod Jo uollacossv 1euor1eruepl eql
d:fqunqC IpcIr{lJ roJ uoqercossv uecueuy
flerco5 leclu€qC uBcrreuv
/(olleJ isecuarcg crsueJod eqlgo {uepecy u?cuetuv
sr)
ry:s002
;s002
:s002
:tusrd-€002
:rusrd-Z002
it@z-zojz
lusrd-2002
:9NZ-ZWZ
:0002
:ffiz.6,66l
:t002-66,61
:lusrd-666I
:rusrd-666I
:zffiz-661
:rusrd-666I
:866t
:0n,OZ.L6I
:6r,6t-L561
:8661-L56l
:lusrd-s66I
:rusrd-s66I
:t661
:066I-886I
:lusrd-6961
SAIILLU^U^IOJ / SNOIIWIL:L{V TVNOISSIIdOUd
g1 P 5 eEu4n8itge.J 'v rrBl{l

c')/ <j?h 9
Mawacuo py cg[iluaog Sutpuotung rctp"rouy s.topanc[.uoquEqsalulJo ngomg lgrepad
' p,to my actmw.nfia4 1ro4aEr6erru1 Jo npamg lenped bopsnl Jo luer4redeq
uo4eEpselul Xru\I5yf - luarueae-rqcv Jo epcgg.leJ
'uo4uE4saau1 VA\l - rueue^eFlcvJo e1ecgrueJ
'ptoay da4g t711wtfi 'uone'qse^ulJo ruemg l?repad
pto,*y actmwtofla4 lrogeE4sanuJ Jo neemg IBJeped .acpsnl
;o fueuqJodeq
prD&V acwwroga4 \oqe8qseluJJo n"eJng I?JaF{ .eopsnfJo
luauqJedeq
.p,to,tty dalg ttn*O .uoqe8gseaulJo nBamg l?Jeped
'prDav acuDwrotta4 \rcqeflgse^uJJo nsemg IsrepeC .eopsnfJo
lnu4redeq
'p"tD&y auuacaT 'uoqe8gseauJJo nmmg IBJepeJ
'ptD&V acuDuuo{ta4 \oge?rlse^ql Jo neamg Isnped (ecpsnf
Jo luaugrudeq
'ptoay aeuouo{,ta4 torpE4se,,ru1 Jo nseJng Is.teped .ecqsnl go peurgedeg
:tffiz
:0002
:6561
:6f,61
:6r,61
:666I
:866I
:866I
:L661
:L6[
:966r
:s66I
AW ? SNOIIVSICIIUAJ
pl"og J8lrollpg,Go\ocnol pcuQouyp lDunof Jo raqule]Al
Soyocttol loclltlouy{o luurnof Joenssl prradg ISOS eBJo rollpg $eng
:ru$d-9002
:9ffi2
91 go 9 e8e4nregerl'YJTTI{I

ah h ?u3
'oJrN oland'rql^( orll 'Euqeel I ISOS 666I gMD Wp OH2D acndspoap Bu,m 7gg WD gHg .ro{ splqpg lo ,1rfi"uy praog
'ocr5 ouond'rury ory 'Eupaeprq g969 666I .stlt DssV patulltmg-Eug Eupuno,ung sanssl locrltQouy
't{4fl'&13 e:Ju1ll?S 'Jeuuosred q?T eurlrC pu? oorlod f13 elry 1pg .stppssv
fmxas paptrycoi_Eu1{o uouofiusaul at11
'erur8rrn'oc4uen| - tJI^JeS-uI urarEor4 srostruadng ecrrrpr g 'acuap.ug tCr1stlrraq){o uolsstwqfls
'u1qE4n 'qceag eurErr1 - uogsrcossylueuecJoJug inrl sndurc3 epf4n 'stpossv pnxas pa|n\rycng-Entqp uo110&psanu| p-cgopcaol at11
fncqselruoc'uepuelt €$tllsul ea1 ,fuue11 'silnwsY prrxas patqlllclC-SrueIo uollo&usadul 1oc8o1ocuo1 at11
's?xeJ tolmoH- quEolocrxogJo uo4snossv uJerpnos -st.rrlassy pruas pauo4\cog-EnteIo uoup&ase,tuJ p-a&oficuo1 aq1
'Bplrold'opu?lro 'Eqpelq Fnuuv lsIS - secuercs crsuerodgo duepecy rrccuaurv '97'ty37 to.tdsatlcalg tg n41oqepw w wdam4un14 p{sp1i{o1g!o ilsewy atg
1JoA ^\eN 'frmo3 sueen} ''cul 'elnrpsq Suurur; sJo4nresord {JoA ^raN Unossy pnrcS paw113cog-Bntg
'o3rx3l^I ^reN
bnbrenbnqly 'EurlgeIAI J.{yI^UtuIOS g66 I ',au110t1c1tutccng tof ny1 p nstpuy Tcatg
':lJoI ^reN'dueqfV - Jsurues
,(Eoloctxol slsueJod elels {Jo^ r*eN srltt".s,rf ptxas paplloog-Euq{o uouonusaruJ pcdoloctxoJ a,ll
'epqE471 'elrpue:@lv - ecu.LteJuoJ ?ururu; Isuoqsureful VgA .go1ocuo1
4sua"@l
'froleroqel 1gg aqJ ,q perosuodg z,uirns crsran{ 4 sporpg4 cgrldttfupuottp'suorlDurwnq pc&oloctxol orsuatof 4 thtauoacads sso7aJpuo ft1du&o1owott|2to asn atlJ
'?lulE{A 'ocqusnd - eol^Jes-ul ure-6or4 arrnpr^g zouap^g ,{,4stwaq3lo uolsslwqns
'drolsJogqt Igd erLl fq pe.rosuodg an4DS "tstatof, 4 spotlplq cgtldotfuSourottp
'saouourwpql 1w1&o7oc7xo1 ctsua.rcg ur,ttlawo4cadg ssoq puo t1|da8o\owo.u13{o asn aql
'aEroeg?uePV - slsFueqJ IsclulCJo uollercossv u?rrreruv eqlgo Euqe€W l"nuuv WV 'uostod r(q opnyg
'droleroqrl lgd aql {q pe.rosuodgTJ\DW
"lsua&rtr 4 npoqpfl "ltldot&ogttottlS
'Boloctxol cwuatol ut tl1dot&o4outolq2p as2 a41
"IulE{A 'unpuexaly - ecuereJuoC 6upp.r1 Isuo4srue}ql vgA
-t&o1muo1 c$aato4
'upprln 'ocqnun| - ecr JeS-q ruurEor6 eouapr^g .acuaryg tttsruaq2p uotsstwqns
'tut6rrn'ocqmnb - eJI^€S-uI uru.€or4 acrc pr^g . acuapry t tlsruaq3 p uotssrzzlqns
llulE41 'eupuaoJy - ecusraJuoC Eupplt Isuo4sureluMq .Bo1oc1xo1 ilsuato!
'puelfrEal 'agyqcog - 'cu1 'suragsfs uedsv .Boloctxol WD ftijsryaqJ crsuato!
'upf4n 'BIJprrBxefV - ecue-EJirroJ EoIuprI leuoq"uJeluJ ygq .t8olocaoJ crsua,tog
:666I lco
:6661lto
:666I ldes
:6661Eny
:666I unf
:666I unf
:6661-rdy
:6661qed
:866I ^oN
:866I lco
:866t des
:g661Eny
;866I TNI
:866I JqIAI
:865I.rEy\i
tL66l ltrf
:166I Inf
:166I unf
:2661 fvyl
:L66I lsIN
:966I das
:9661 FI
:966I mI
NOICNUISM TVCINHJIII ? SNOIIVINSSITUd
61 go 4 o6e4nB"ge.J'v rr8Ill
ii'3uope'"ossv sropE4senul lrn'ssv rsn,€s "ruoJ:rr'J
'sun*ssy ,^as;t#ti;:P;X:,'?"#;:##,'uo1Eurqse7l .epleeg .Euqeey4i pnuuy
p.rgg - sertnrcs crsrrerodJo {uapecy u"cuotuv -iloy palqqpogEruq ut uoucanq Bnte u! saeuo^pv
.uofurqsull .s;gues .Eu4ee141 lertuuv
PJ€g - secualcs clslreJodJo fuepecy usctr)ruv zdDV pawillcogErug ut sa&ualptl2 avo&usatvlBul,tlog
'uofuqseTl'epleag'EuqaeI I luttuuvpr€S - secuercs crsu€JogJo ,{urepecy u"cuetuv 'aa.ucadsta4 Jgg uV :rppssv lorrxas papqllcog-Eug
crsuero{ Jo duapacy uecrreruv'uofuqsull 'enr?es '6ugee4 pnuuy pr€S - smuerJs
'sasDJ tppssy pnxag patWqqcog-8ntq u1 3u1,{usa1 puo Eu8ouol,tJ
uo1Eulqse/h'epleeg '6uqae141 Isnuuy pJ€S - seclrorcs clsu{rrodJo,,(urepecy uecrlsruv 'tButuosto4 loptclwoH
'JO
. trol6uqs?t|erurc lgrepedJo srqpl^ uo umrsodtuds Isuorl?N prr.\r.silnosry lottxas pateqnog-Btug
'oHo'suerpv 'ecuareJuoJ qnBssv lrnxes pers{llced Enrq fi1uerr1un o1q6 .tppssv pnxas paptilpof-Bnrcl
'ursuocsrl['ee{nB/t\lrw'Eu1na11
J1IOS 0O0Z 'gpg noua&opugp qa,ta7 fuouu2 ur suotloupl pnryWuaul Wp -DuuI
'rnsuocsrd\'ee4ru/$lr6'Eupee1,11;ggs 0002 ',Qwg asoS y :sts$louV sautdazotpozuag ot saqcwddv Twuawrutsu1lo uosuodwoS y
'ursuotsrd\'ee{n?.!\llh['6uqeahiISOS 0002 ' 8o1ocao1clsuarc! u1 sa&uayotl3 Tuclteouy aqos ot SW).I Wo Sw)ilo asn aqJ
'puslulg 'plqslaH 'Eupeayq lgyg .auun u, sp^q gHg mouaSopug uo atngotadwal a&otolgp na$g eq1
1uouue1'uo16urlmg'rurr8o.r4 uoqecnpg l?lc1pnf IsuoFsN - ueruol[Jo uo4ezueBrg Isuoq?N 'sqnDSsV lpnxas pawtUltol-EnJcl
lro1 /neN te6eqcoU 'urea1 freuqdpqppFr^i ?erv-rqsegrol{ .stpossy pnaas paptllpof-Bnre
IroA 1IleN't(ueqtV 'rsulues osIreSO xes ecllod el€+S ryol /deN 'srlnrssf pwos patqillcog-Etugp suouo&nsa,tu1
'nrer6or4 uoq'cnpg Hcrpnf Isuon€N - ueuo/v\Jo uo*zrue'rg JsuoqBN .tt*ossy p^as;,:#lh:;:3ffi
'ecloqr l slu?S 'Jelue) lueuq'e{ edzg rcruol4i sltss 'rl,r,rsF'
lorrxas pa*ilpog-Entg{o,orrh;H:rin
'?ruroJrlua) 'sala8uyso'J Jeuuosred qql etu.uC pw ecllod saleEuy so'I'sqtwssy puas patarllaog-Eruqp uouo&asatuJ ar11
'sp€^eN'oueg'Euqee141 Isnuuv puZS - secuenscrsrrerodJo dunpecy u?c\nw 'SWSWSW)1 Wo Sh[/J1 twdso,scalg tq uouocgfuuapl wnocoflplg
:IOOZ JEAI
:1002 qeJ
;1002 qad
:1002 qad
:1002 qed
;1002 qed
:1002 u?f
:0002 cec
:0002 rco
:0002 rco
:000213o
:6667 Eny
:0002 unl
:0002 unl
:0002 Kqhl
:9ggg ,(e1a1
:grggg rdy
:969g rdy
:0002 qe{
?pB eN'oue11 '6ur1eey41 IsnuuvpuZS - sacuercs crsrrero{Jo ,funpecy rrecrraruv '(tdSWCC,q uoolrsd pup aqualo{ng{o uoltoguan{1g :0002 qeC
g1 go g e8egnGoge.I'v rrqAl

(,
1lrh'puBIJezlrA\S
leseg'fEolortxol l"JrurlJ pua Euuolruory6n:g c4nadenql uo sserEuo3 lsuoqsuJeryI gggT 'ascadsttals n ,rU :ilnossv luwas pa1o1tr11rog-B*q
'sloulIlI llnussyI"ru€s lsureEy uolu"oJ {pno3 ewrx 'qnDssy puds pawrpog-Etugp suouoilusanui \oi1ao1-ocoo1
'op?.roJo J'eEpuuerlcerg
- {mssv p'€s lsq?Ev uoqrpo3 ope,oloo rppssy lpnxas pa|agpog-Euq{o suopo*usiniJ pi,soloiool
'ettetsmo.J 'surelJo ,rreN - ecrnreJuoJ u€el asuodsaalF?ssv l?rDcs IsuoqsN puoJ€s. 'paaccns tmJ ail. ,t|uV"'lr7l atil /ftul :tlnassv ptaas paotutcog-gug
uo qEqrodg :eprftnq,{xorp{g aururug 'sanssl crsua'or p,.a pc*p..#li#Fl:, "}::i;{n#&lanxes purcEy ecuerllv fil3 4roame51
IroIAreN lro^ ,t\eN lpassy'qnDssv pnxas pao411cog-8uq lo suouo8usatul 1oc1Bo1ocao1
'ueftqc161t:oqreeq 'Eurpe141 ISOS Z00Z
.saszJ ilnossv praas paptrycog-Btuq ut Eu1,{usa1 puo Eugouilrrl
'acuurd'sue6 'EuBeeIAI ISVII ZOOT,.ST{/SW)7 puo SWJT tq nop ut yt1to4uag
'?pB eN'se6a1 sa1 'ecuera;uo3 sseq/t\tuqrf1uorlE4slunupv }llerusoJoJug EntO,ZNZ lppss7 pnxas pa1orypog-Entg{o tuouo&usa,rul 1oc8o1ocuo1
'oqep1 '{eJpn mg bcrgg s.feuropy saFls perun dq perosuodg 'qwag qt,*Eunuog :sBrug qn13
'rmossrt4'qceeg a8esg .Eururer; epp\emsEuFrdg seJr^ns uoqncesoJdJo oclgo .rJnossrl4l 7gg7
.suouo&usa,rry ilnDssvIDnxaS pa1aglcog-Etuq
'?u?rsmo.J'swalJo /rcN'eclIereJuoJ qEmqsnH 7gg7 'srtouo&asanuJ tlnossv lonxas pawytcog-&nrg/o sa&ualloqJ dt[ Eugwouatg
'qrloJlteJ 'o8arq ueg .Eun11ag pu? rFBssV lenr€S .acuelorn cqseuo(J
uo etueJeJuoC puoqsulelq p"Z'aouX ol paaN nof, Toqa :SoloctxoJ - tppssy IDnxaS palv\laog-Eug
'a8roeg ?uspv €u4ee141Sdyy Z00Z'doqqrort waqord a.aN 'a"uprsqns nO :gHg Io yed sz suawrcadg pa&olopg ul gHD{o uolop,rdtailI atn
'su?rsrnol'sueepg,neN .Euqeeni lggg
rc02 I,SHD snouaSoprgto qadaT funuup ut suotloupl eqt asa-arcae uoutzrlDw.toN-aututtDar) saoe
'CC'uorEurqseTl - dEolocFoJ, IecFllC pue Eurro1ruo141 Eruq cqnedaraqlgo sser8uoC puo4surelulqlL 'sasvC qnpssY IDnxaS patA111mg-Etug ut uo4calp) acuap^fl pup suotjoflUsa,tul p-a1Bo1ocgo1
'cqqnde11 qcez3'enEarg 'Eupent ISVIJ I0OT,
.SHD moua&opugp s1ana7 rfuouu1 ut suououp/l lenryrryu4q puo -DsuI
'ssr€J'oruoluv UBS - scueJa.luoJ uI?eJesuodseg lp"ssY 1"ru€S I?uoqBN lslld 'sqnDssv prcas pamqpog-8tug/o saouoBusatul Toc&olocaol
'?IuroJrlPJ 'oEerq ueg Eupaery {1-ra1en} qsrEolorxo;Jo uoqsrlossv ".ruoJIIeC
's&uruosto4 ToptctwopJ
?u?rpuJ'duuqyy,rrag - pefor4 8qqturt lln"ssv Pru€S euelpuJ IIJoqtnoS 'sUnpssy ptaas parqiltcp-{-Bnrcl{o suo4o&usaiul
:9619g deg
:6699 Eny
:€002,(qI {
:ggg7 f,u14
:ggg7 [sIN
:z00zce(J
:zwz15o
:2002 rdes
:7gg7Erog
:7,OOT,Ittdq
:z00zJSIN
:2002 ruI I
:2002 lgIAI
:2007,qe[.
;I002 lco
:I002 des
:1999 6ny
:1002 ,(qy\I
: I00z {qnt
:1967 rdy
91 go 6 eEe4nBitge.J 'v rrBIiI

anh'BulloJBJ qrnos ?rgumloS .ecrrarEJrroJ
.srol?urpJoo3 pn€rJ ersc rFJ?eH .wottr anJ wloaH
sItIJoJrl"3'sele6uv so-I'ecuere-IuoC ecllod Jo J9II{J seleEuv su1 'tpossY ltmxas papllltcog-Entg EuuoqwoS to{ suortoryawwocay
'puelfruyq'erournleg Eutl11eS pue .ecuayorn
cqseuo(I 1pesry Isnxes uo acuereJuoJ 1uuoyurerul 71\v1a eqyuttDssv lwaas papttJltog-Euq
'3q 1tofulqse6'sdro3 ec?ed eqJ .
ilnnssv puas pa7o711 Tcog-Btuq
'e1up4n leyrug lpessy pn:<eg NureEv uoqrluoC x"Jn?d .qnDssvpmas pa1o1111cog_Brug
'seJo)[ qlnos'poeg'acuere3:uo3 $srEolocrxol rrsueJod Jo uorlsrcosryI€uoqsualul aql'SHD snoua&oprTp suo,ioauacuo7 fuouu2p saouDuql aqt uo tpug ausuaqatduo3 V
'?urloJ"3 qlnos '.slqulnlpJ 'saso) qnDssv pntcas pa107117cog-Erug ur acuepag pcEo\^cuoJ aql
'EIuJoJllBf, 'orsrcuard uBs .ecueJeJuoc
Euplerl ruvs Isuop?N prlr{,1 Tlnossy louag pa4o1glcog-Bntg Buaoqwo2,rof suo4opuawwocEv
'au?lsrnoT'aEno1 uoleg'rue.6ord r.lrvs/aNvs "uasmo.I
'tlnpssv puas p4ntllner-Eue{o sa&ualprlS ar11
'e6roeg ?uqtv 'ewlrCJo sruFcln roJ eJrnieJuoC l"reped SOOZ Jpassv praas papllong-Btug
'Bu?tsmo.I 'sueepg mep 'Eqfe4 Sdyy g00Z '/Clotoroqwl IgC aqt puo qco4 a,(g tQ1.tltoas yuzg
fncqcauuoc bpsd6 'aou€re$ro3 sdvilN 'stsuuatqg zlsuatoglo{Eutuanl tppssv pnxas patoqlltDl-tnrQ
'?pe€N'seEan se1'eruareJuoc gl{c uo tqElpodg 'saso) qn//ssv IDEas paptlaog-Etug u1
""u"p^g-1o"8i1ocnoJ atlJ
'co tro€uHsea 'r(Eolocrxo; rrsrprod uo umrsodrudg ,ftoproqe-1 IsJ tooz 'ysro{o sasoSBuBouoTaJ
3C toFurqsql6 'dEolorxo; clsuerod uo runrsodur,{g froleroqel ISg t00Z 'tCt4s1waq3 crsuaroi
'pue1,{rEa1 'uqum1o3 'tlmssv pnxag tsuruEy UoFIIEoC puelfnry .tryocsv pnxas papt#co-t-E/uq
'uoEerg'eueEng'EquIerI
JUVS 'ecrod Is€I iln?ssv Fru€S s.FreueC {eurogy UnDssy pmas paw1rycog-Entq{o n&uayoqS
'uoEa.rg'emEng €rmrra.g ply g'ecrog:1se1 lF"ssv Fnxas s.IBJeueO fauropy 'ilnossy IDlu;aS pa1o111tcog-&ntg,tof uoaca11o7 acuapt g
'dtruureg 'qcr-un4 't6OZ etuareJuo3 ucrilpuy 'ttotonqul Jgg arg w &tts1waq3 pcllttloufio uouocllddy
'r(ase1 melq lcuarg Euol -t1nsssv Isrxes lsq?Ev uonrrcoC ,(asre1 arap 'eoualor1
IBnxeS pug ol pusls B Euppl UoIAI :uoqnlos erpJoJIqH rerfro aqJ Tppssy lwuas pataqlcogSntg
'srqerv pneg 'qped;g - ecrlod Isuoq€N ?rqsrv lpne5 ',tanuaqJ cpuarol
'?IruoJllsJ lceag 11eqg- ?ugaeyg uogeposs"V sropE4sanuJ tlnsssv lenxas
"FuoJII"J .yggq
eLil ^aN s,tpq/A :suouoZusatq yggg
:9002 qed
:sooz ^oN
:s0021.o
:E6rgg rdeg
:s002 das
;ggg3 Eny
:E002 pI
:9002 rml
:s002 rsl i
:s002rql I
:s002 qed
:v00zpo
:yg6g rdeg
:yg6g Eny
:ygg7 Eny
:?002 unl
:t002 unl
:t002 e(mf
:pgg7 Auyl
:pgg7 rdy
:yggg rdy
:w0z ruIN
:€002 ^oN
'?rl"4snv'eurnoqlary'6upsayg 1t1;f,t EO1Z' tprDssv IDnxaS paptilnogSrug
?lp4snv',{eup[S'dlepog ecuercs cr$rerod
"rlg"qsnv pu€ puqs?z
^leN 'qnDssv lowas paw4ltcog-Erug/o saBualpq3 aq1 :€002
^oN
. €I Jo 0I e&dnfirgel .v rrBW
'7711 3
'suxe; h4sny 'Eupaayg pnuuv qstEolotxolcrsueJodJo &a1cog 'qnDssy lrlnxas palol11tcog-Zntg{o saBualpqS 7n8o1ocuo1 aqlEutwouartg
'ssi€It4tsnv 'Eurpeyq pnuuv $srEolocrxol crsuaJodJo fiercog 'sTuauatnso'ary argotgtmnfilo t1utwacun
'etue^ols'euefi1qnfu 'Euqeey4i pnuuv eqEolocxolcrsuarodJo uoqzrcossv leuoquursluleql'auun4 gHD{o uotpnrud o4lluJfo acuapag raqunl
'sue^ols'su?[lqn [T'Eunaery IBnuuV s1st6o1ocxolcrsuerogJo uo4srcosry 1auollzrueut eql 'S7I/SW)T puo nW)7 /q salloqotary pup ununcptrn
'3q lrofurqsel6'ecuere;uoC AWAA 'rpossv In xas paptrJtcptr-8ruQ
'fuerureg 'reeg !3nqcqlaseg eqcsqnezsursqdeqcs]ne6; 'sawuJ pato1ulcog-&ug{o sa&ua11ot13
'unossr4'&r3 sesuuy'ecuareJiuo3 /1WAS' rrypssY PmaS pamqpp4'Eu1
'pueldrup,q'ellr^{gol{'*rualoln Isru<as tsumEy acueraguo3
d8olorpe4go a$lqsuJ secrod peuuv TpossY pnxas pawtrlpog-Etug Euuoqwo3 ,to{suouopuewwooaq
:9002lco
:9002Iro
:9999 Eny
:9tgg7 6ny
:9002 InI
:9002 unf
:9rggg rdy
:9997 rdy
:9002 rql I
913o 11 eEe4nBagal'Y JJSIAI
'e6roeg ?wpv llnessy pnxes Pug ot {ro qe51 erEroeg 'qnpssv PuaS patwtllcog-Eug
e8.ga75h
'9WZ,W eumlo1 .anualcg crqdaEopurorqJ Jo lerunof 't4ewo4cadg ssvltp&7dot3o1ouo.tq) sDD wp uouczsxaonw asotld-puog rq saiaaa ryngiuipldrr uo"lioipiaq"or puo atq ryog{o Mnouv atuJto stsrQouy l4I treege'I pue ''v c treiauruuag':1 "req"i,l*qJs ,.r.r.r .au\oqre.I ..g.oepre3e1
'9002'08 sumloA',{Eolorrxol pqfpuygo Isu.mof 'ggg mouaSoprglo suououuacuo)ttouu7p suot ou,l aqt uo t(pryg aatsuaqatdwo7 y ''g'auraa-1 'v tHBa( ''at ggrrcs ;c 14so1n;-i1uow.ivTr,r .,oeruo&uort vI^I.nog.l
'0€ eunlo6'fEolocxol IBcI$puvJo lsumol rc4awo4cadg ssnw wapuoJtftldan*opwattp p1nb17 tq ,rrnr, *"uoffi u! sTcn4ld u$oplDatg sfl puo wnuncoxoqfo uollocgfuuapl a^gpryDn}'I'V 'suD1uef ''y141 ;neege1l.yyrf,fteurogluo141
.SNZ ,62 strx\on .fEololxoJ IEcSdIBuV Jo Fumof
.saldwog 1ocgo1o1g 4 saqloqqary puo wnurcoaryalfo uoutcgfuuapl aru y scceqeu'DJnI pue '''I )trs]v:reil[^{ ;'yir"ygh*i"l ..V euqepqni .draruogguory
' W1Z
. Z JequmN .9 aumlon .suoqsc runruruo J ecueps crsrrerod
'wsuo'ual paryaq3p ssQouV ctsuatog &u1tuorta4 sauornroqql tq sauilapryg a)uotnssy tt11onfi-,.y c'itltognf'8002'Lz eumloA 'sanssrl lottuo3 aaun&a1,[ u1 pagftTuapJ awlotlnuowlfuacng 'g'3 '.lezuan| pu" yTtI heeg'rT
'zooz'92 eIrmJoA'{EoJoctxol pcp{puyJo Isurnof '(gnc) alottQnqtranpfiJ-owwDD snoua&opugp suottDruacuoJ rcrouu7u, suoaDuol lvrrp^WuaWJ WD -D4uJ .vlAI .sS$nH pu? ..d..|\ lnrlreq ..S .eq^a.I ..g1 .uosuaplJrlJ ,.VIAI .nBeSoT
'I0OZ 'uoq?4srtnupv lueuecro3rug Eruq bcpsnl3o peugredeq 'g'n'vsttlor,typ cryqtary pw ,*atmtnsc t&aonfi ,Eututotl
Wo uotjo:Jnrel rcf saollopuawwqeaL DnvClDilS'1002'I regurnN .02 eumloA .lgrunof
JCVAN .ttototoqo,f Ig,I aqt w Bolocaol ?tsua.pg .VJ^I hpe8,eT
:sserd crurepBcv '(tooz) 'spgluefgzowJsrqsv prre ruegel y crsIAI 700qpu,H atsuarol v qnDssylmras orrrorffiJfr' IOOZ'SZ eumlo1'dEolanrxol Fcqfpuv Jo launof 'saldwvg poolg u1 uqnsuLp uoumguonS rc!potpaprJ cutawo4cadg ssoya1 l, I4l heege-I pue .lI lratry .ttt .rollrl
i ..g .fqreq
' IWZ' Q)61 I eumlo1 .puo4uure1u1
soueps clsuerod 'auun u! sp^aI gHD snouaaopug uo atryondual aSoggp TcaSg'g 'aune.I pue .l^I ,railIr{ i}l hEegeT
I?cF,(IBuvJo leumo. poolg pansng atujrJ ut gHD papiar !\r'reu,, r prrp .r{.r*r,9rff*Jfr3il1fr.fi:l?t#'0007,'vr, eumlon'fEol0crxo; pcpdpuyJ0 IsrmorswJg pw owSg acdspoall rQ (7gg) auotco\0rt1ng-owwog
pup (Snd atoltQnqtrotptp-owwng.totsptn{owIo stsrQouy 'S lapretumg pw'ry.ra1g1n1'.ry.neruoa1uil^u.n,n6ge-J
'0002 'S ragtunN 'gt aumlo^ .secuercs crsuaJo{Jo tsu.mof .tfulawotlcads ssol,gtt&7do,t&otowant13 pubtT tntdsotcalg
tq sa41oqo1a9ypw wodazutturyg.rc{sptnlptgp sts,Qouy }1t .,elu^i pus ..f Gube6 .w.rpruoauow.}{ heegal
'MZ'g requmN'€6 eumloA 'letunof IBclpeW uraqlnos '@doy awq) unDssy lDttxas paptiltcpr-*tuo nI 'n€egel ''g'-raap6 ;tr t ur q"s
'666I 'I regumN'l orunlo1'suoqecnmuuo3 ooueps crsue,Jod '$lnossv llanxas pawtlllcog_Etug{o saouo&usa,rul lo"rSolocioj ft r*er
Jo rs&mor s|Fpssv pnxas pa,oqoos-Erusp suo,ouusaru1,#:,ffi:;;;ni;fr:tr:w;T1fiffiJj{'ootxeI{ /heN 'enbrenbnqly 'Eupean ISVIL11SOS
866 I eln Jo supeecor6 :urauuotlclttnccns rc{ auuLto stsQouv nano ]aI 'rellln pue '141 l-rf.reruoaruoa ]tlTu"gfl
vcnsnd
91 go g1 e8a4n8afle.J 'v rrBl4l

€7s )qhrt *7
'sseJd uI ('sPg 'ourprer5 oleauvptr? 'sseErna uuv '^?rpe.I wluJ]r'swl4cr| qnpv :qnassv puo affiqY lonxas uI llnBssv Isnxes PslsIIlcBJ-Eruo IAI h€ege'I
'sseJd uI'rolrpfl uorpeg 'reururruq;el1 'nuaps nsuatog{o olpadolc'{cug uI saluuJ petelpceg-Erug 141 heegal
'uogec[qnd roJ pedarcV 'Juuo4eura1u1 ecuetcs clsueJod 'saldwog auun ut
g4Dlo uoucnryd outA u1p nuapl,tg taqunl'y 'uFfBaC prm ''I 'gisqcs ''O "rltorlnt-sFlo1,tl
'14J 'freuroE1uo141 fAI 'nuegeT
'3q tofulqseTyl'ssar4 JJyV'(sooZ) lroplpe poZ ''pE 'eupa1 f,t:rug '6o1ocao1 cwa"og fo sa1dn4t4 ur. (s{C) prcy cu&nq{xorpt$1-utuueg }I 'ruege"I
'9997 [uIN '€ JequrnN 'IS eumlo1'sacrnrc5 clsuctroJJo Pumof 'caqcpry Pugadol nng to{tpn1g uouoptlorl 1z 'V111 heegal puu'I I'C lq8l.rrtt ''dIAi'qc€que{try ''C'd'emo'I ''t1t ',€eay ''11a1 ',{elpurg
51 go 91 e8e4ncr{qJ'vu8lll
hss )tnn !
'suorlecr;dde JolcnpuocttuesJO]
^Srrllu eprxorp uoorlrs. Jo^ uorlepulru euse;d Oururacuoc uorleuossrp qcJeeseJ;eur6lro ue peleJeuac 'dnor6 qcJeesa.r ol selcrue lue^eler palueiaia pr,
"rn1o";,1 cu[uercs peqsJeaseu 's]lnser luecrlru6rs papode.r r{llecrpouad lelep alqecrtdde .reqlopue a6e11on-ecueltcedec.'Idocsolclui eoJol ciruole'rtlarlosOrlja crdocso4c'eds'palaldtelurpue palcalloc lsluatuuadxa uorlrsodep ulu-utqt ,ujnnce^ q6jq pauro;red pue'pau6rsag
CN'lilH gedeq3tttH tadeqC le eutloJeC LIUoN Jo rilsranru;1 eq1
{4sruraq31o luaupeda6luelstssv rlcreasou eOgZ 6nV- 966L 6nV
'llun ,tlsruraqS 'fuoleroqe1 lgJ eLll ol sllnsal paluaserd pue syodar ripayenb 10uorlelederd ur polslssv 's;eu:nof pai erlal raad ur qlnsal paqsrlqnd pue s6u[aau clj[uarcsle rJo^ peluasaJd '(nusrlc) lrun qcJeesau ecuercs srsueJol pue ursrjoJJeuelunoc'[:o1eroqe1 rgr aql lp rur ur sarp crue6ro Jo uouecurluapr eqr rol spoqla'.r mau padoianag
vn'm[uenouoqe6qsanul lo neaJng leJapoJ
tuo1aoqe1 193(gStUO) uo[ecnpf pue ecueos roJ aln]tsul e6plg 1eg
(p;1ue1cg 6ur1sr1) ^
o1al leropoplsod tgOZ ^oN
- ,OOZ uel
'suirloulun ;e:aue6 pue slul'srterds reddad 'sogrAep $uncas lueq 'secuelsqns pelloJluoc Jo seale aql ur suorlebrlsenurleuttutJc ul llun fu1sruaq3 aql ol poilulqns asuept^e uo suotleutruexe ctsueJol patrlloJJad
vn'ootluenouorle6usaaul lo nee:ng lelepel
fuo1eroqe1 1g3lsturaqC 9O0Z das - t00Z
^oN'sesIleue lmtulaqo Jo sllnsel 6urp:e6ar Auounsal sseult/v\ pedxe eprnold pue spodet
uellll/A e:eda:d 'e1ep 1a:dle1u; 'su/rloulun 1e:aue6 pue 6ur1rlr,a leJces ,sluesuqnl ,srul'sIe:ds laddad 's€ctnep lluncas lueq 'seouqsqns pelloJluoc lo seeJe eql ur suoile6rlsanurleulullJc u! llun fulstuleqg elll ol pellltlqns aouaprle uo suotleutulexa ctsuaJo1 qlJolad
vn'oclluenouorlebrlsanul lo neeJng leJepaJ
fuo1e:oqe1 1g1Jauluexl lslureqC clsuaroJ luasard - gO0Z das
lcNf tuldxS lvNotssf Joud
LZeL-Ztl (eOL)gtrzz vn'ocrlueno
Aerqre6 uorlebrlsenul L0gZgZZt uloou '1ru61 fu1srureq3
uorleOrlsanul Jo neeJng lBJepeJ
Ja/naJg'o uoser
3vrn wn-rncruunc I
90oz raqolog I
71o I ebe6 I
Ja/v\aJg 'O uosef r ]"r

5s's/7hh 3
fu1srueq3 :.rofey1earOeg ecuetcs Jo Jolaqcpg
y1'6.tnquosu:ep1r$sla4up uoslppl l sauef
fugslrueq3 :.rofey1ealOag lqdosolrq6 Jo Jolcoq
cN ,illH
tadeqSlllH ladeqC lp putlorpC rlyoN lo fi1s.ranrup aq1
866r - t66r
r00z - 866 r
NOtrvcnos
'ebuel (nf:)lun bururell srlJeal1elll le soueuacs 1e6le1 peutelulet! pue pezrueo:o iuorlrunuu.re petnqulsip pue pan601e1e3
vn'ostluenouo[ebrlsenul lo neaJn8 leJepel
uotstntq 6ururel1lg1uJalut 9661 6nV - 966;
^en1'CUV-49| 1e unrsodlu,{s
Llcreasai e le sllnsal peluaseld .ue:6o.rd qcJeesal Jeululns OUV_tilgl/nSlS/lSNlulol e ]o ued se seuel;rdec ecrlrs-pesnl Jo uorlecrJrpor! lBcruraLlc eql pelpn]s
vc'uepeulv(CUV-net) ralua3 qcreasau uepeultv 1l\lgl
ylgl / (nsrc) rfrs.renrul elels esot ues / (JSN) uonepuno1 ecuetcs teuo[eNuJalul
's6u[aau cUtluatcsle sllnsal peluaseJd 'sleyodal Jelncalout se suorlecrldde lo1 sele:olqcled (1) urnrueqr(aurlorqlueueqd-ot'L-,1-9) (aurpuld-]-7) (1r(uoqrecul) 1er-nes pezlsaqluAs'pue pj1e6r1sanu1
y1 '6lnquosureplftrs:aruup uostperu seueffu1sruaq3lo luauyeda6
luPls!ssv rlorPasou
' uelsr{s uo[ezt leJlneu Je]e/'Aelse^ e pauteluteuj
pue paleilul 'slele^/\ uocllls 1e1sfuc-a16urs 1o 6ur1se1 pue Ouunlce;nuerrl eql ut polstssv
/66 f 6nV - /661 IeU\l
866 t IeU{ - 9661 Ie1l\t
y1 '6:nqslctJapeJJ'cul'Jopnpuo3tuas egurfu rn
urolut g66L 6nV - 966L Ien'll pue I qe-1 fulsruaqO leJeuee pue (ldocso.rcryl
6utpauunl 6uruuecg) qe1 fulsruaqg lecrsrq6 u! sluepnls' pelenlena pue palcn4sul
CN ,1tH
Jadeq31111.1 ledeqg le eutloreC qUoN Jo r{lstanrup aq1
fu1srueq3;o luerlyeda6luplslssv Eurqceel 00OZ le1l! - 966! OnV
3VilA yunlnC|UUnCg00z Jaqolso
y 1o 7 e6e6JArV\gJg .O UOSPI.

qss)a75h ry
,,'esueuosau uor101c[g uo4calS pe]srssv euJseld r{cuanbarl-otpeu [q aprxorouosrlrs leujjeqf ur uorlerodrocu; ue60.r11Jo scrleury,, 'vy! 'uolsog '6ur1aayr1 llel suy!
ereo uo,rereu"e ,"i1"13"^,t;';::Hi"iilil i;J"?,tr'f'H,i:;:31,i1ffi$i:l:fil';!",ii
,,'ecueuosau uo.rlolcIg uojlcelf palstssv euJseld rtcuanbal3_olpeu Iqpelrsode6 surllJ ^N'ols 1o,{pn1g,, 'vc 'ocsrcueJJ ues 'unrsodur,iS leuorleuJe}ul urgt snv
,,'setpnls aptxotc uoctlts Jo uotlepultN eutseld,, .cN'111|-{ ledeq3 'tttF{ tadeqc le eurloreS quoN lo firs:anru6 eql 'uorleuessro leJolsog lEuroug
,,'srsatoqdollcal3 fue;1rde3 Iq srslleuv Iul,, .Vn ,oc[ueng ,fuo1eloqe-1
1g3
,,'srsaJoqdoJlcal3 fue11rdeg 6ursp slul ued lurodlgeg 1o srsr(leuycrsue.lol,, 'oyu 'IcuapoJS 'scruoeloJdlfc uo ecuarejuoc lcuapaJJ tenuuv qrgf eql
0002 ^oN
t00z reu\
L00z 130
8002 6nv
t00e ^Et/\t
t00z lco
VC 'r.rtrsqeuV 'SCV 'srsaloqdo:pa;3 ,te;1rde3 lectlcpJdVn 'octluenD 'fuo1e:oqe1 l€l 'sJeleM 'uo4eradg pue fuoeql JOI-O ctseg
Vn 'ocrlueno 'fuogaoqe1 lgl 'uotleJedar6 aldureg Euneurolnv Jol uotpe4xf autl-uoVn'octluenO 'fuo1e:oqe1 lgl 'sJeleM'uorlaadg Sry JO1-OO
Vn'ocqueng 'fuo1eloqe1 lgl 'lul 1urodl1eg 1o 33Vn'octlueno'fu o1aoqe1 lgl'sJeleM'6u[ooqselqnoJl pue uorle.redg 9-16 9
y1 '6urpa1g 'y36 ':eurLues lstuaqC ctsueJoJcu\ 'erqurnloc.'nzpeullr.ls 'slN/cg lo actlcerd urapoy\
Vn 'ocrluenp 'Iuapecy 191 'srs[peuy aoerl JoJ fuleurorlcadg g;Vn 'ocnueno 'r{tuapecy lenun lgJ 'ssaocv ouruurbag :OO0Z e3tgo UosoJety\
vn 'ocqueno 'r{uepecy lenuln lgl 'ssecsv e}etperrJalul :o0oz e3uJo uosoJcty!11 'o6ecrqg 'elnylsul rlcJeasau euoJCcf! 'ridocso.rcryl ueuleu
SNOIIVI.N3SSUd
,002 revl,002)aot00z cac9002 uer9002 uel9002 qal9002 qal9002 qa_r
9002 rPt9002 rdv9002 unl9002 6nv
(SCV) Alercog lecruleLlC uecuarrrv(SUyrt),{larcog qcieeseu sletJeley\
(g1y) ,tlarcos urnnoen uectreurvOCVICnnS) usuolal lectuleqC 1o srslleuy otsueJoJ eW uo dnorg 6ur1ro14 cgtluetcs
o3AtSCf U ONINtVUl- "tVNOtSSflOUd
0002 - 966 tt00z - 0002z00z- 1002
luaserd - g00z rew
luardrcag pJel V 'cul 'pcuaulv qcsa6a6 eq1drqsmolla3 alqeuan'd stcueJl 11rg gadeq3 te CNn
drqueloqcg le^erl ueulJJoH 'S Uef pue 'y! ,(q1olo6 g1ylsrleurj pJel v sJelutM pue utnqoc 'uorsrruq ,t6olouqcel pue ecuelcs eulseld snv
drqs^ olleJ elqeuen'd slcuel3 lgrg ladeqg le CNn(uorlru6ocel llor'nasec) ple^Av IEJ
sNoH_vnHrv lvNotss3loud
866r666t - 8661
t00zt00z
z00z'10029002
SUONOH ONV SOUVMV
3VJA rilnlnCIUUnc9002 Jaqolco
7 1o g a6e4Jal aJE 'o uoser
(css)7n3
'(r.ooz)zt. '(r.)sly l5olouqcel pue acuarcs wnnceA Jo puJnof ,,'uorlrsodnroc pue eJnlcn4s taIel :agueuosal uo:lo;clc uoJloele
pelsrsse euse;d Acuenba:1-olper rtq sullJ zOlS leruJarlllo uollepultN,,'aual1 'V'3 pue la/,^alg 'O'f 'qaneg 'V
'(t OOZ) 6'(t)6t y fidolouqcalpue ecueps wnnceA lo puJnof .'sJeleLueJed ssaco.rd pue sapol,lJ eurseld Jo lce]Jj :acupuoseJ uo.rlolcric uo4oela
pelsrsse euse;d ,{cuanbel;-orper Iq sul!} aOlS lerlleql Jo uonepultN,, 'eueJ; 'V'3 pue JeA aJg 'C'f 'qaAeU 'V
'gO0Z
^lnf '(g) 2 suotpcrunwwoC ocualos cr;ualoJ,,'srse:oqdorlca;3
fue11tde3 6uts1-1 s1u1 ue6 lurodlpeg lcelg Jo srstr;euy crsuero3,, 'ue6eg 'y pue Ja/'^aig '6'p 'ue63 'y1'p
'9OOZ Alnf '(g)I suonectunwwo7 acualos cEuaJoJ ,,'srsaloqdo:1ca13fuel1tdeg 6urs1s1u1 ue61urod1leg enlg Jo srsrtpeuycrsua:ol,,'uebe;-1 ') pue ue63 'y1'1.'Ja/v\a.J€ 'C'f
'(SOOZ) /e '(t)6 srourwexl luawncoe pauonsen1 p ftenog ueouawv aqlp leulnof ,,'slul ued gurodlleg ;o srsaloqdollcal3 fue;;rdeo,, 'ollerls 'l'C pue ue6eg 'V'y 'la^ eJ€ '6'1' 'ue63 'y1'p
,,'srayodeg Jelnoelof1 se saxa;duroC ellectnj (1) unruaqg;o suorlecrlddy,,'CS 'ellrluaarg '{lercog lectulaLl3 uecuautv aql1o 6uueeyl leuor6eg lseerllnos
,,'seue;1rde3 mrlrs-pesn3 Jo uotleotltpoy\lecrrrtarlC pue 6urqc13 eql''VC'uepeullv'unrsodulAg qcJeeseu CUV-t/{g l/nSrc/JSN
,,'eoueuoseg uo:lo1c{g uoJlcol3 pelstssv euseld [cuenbelg-olpeu Aq pecnpor4 su,lltJ apultulxg uocrlrg 1o,{pn1g,, 'Vn 'uolsog '6urgaay1 lleJ SUy!
sNotlvcnsnd
966! ^oN
/661 6nV
0002 ^oN
:lvln WnlnC|UUnC9002 Jaqolco
7 1o y a6e6JameJg'o uosef
I

8s5 )7rt/,
'suercrsrtqd lstsse ol Japto ul sluatled uotlezueleqlec cetplee Jouoqsunl pue eulnlo^ Jelnculua^ oururuulalep :o1 srsrleue lalnduoc e paulJoled'sbnrp snouen 1o saslJeue ctleutlocerlreqd 1o sesle aql ut qoJeeseJ pauJolad
11 'p1e46ut:dgeurctpen leuJalulJo lueuuedeg eql pue r{bo;oceuleq6lo luaurpedag
eutotpef! ]o looqcs firslenrup stoutlll ureqlnosraqsJeosau 886t cec - 996L eunr
'sasIleue Jo sllnseJ 6urplebelIuourrgsal yadxe paprnold pue spode.r uellu/rl paredel6 's6n.rp pue loLlocle1o ecuesald aLll Jol sprng lecrDolorq 1o srs,(leue ctsuaJo1 eql papnlcut setln6
11 'plagDuudg
r{.ro1eroq e1 ac u arcs .[lffi: i'""fi?;:*asrlod alels srourlll
lslluelcs clsuoJoJ L66L lco - 0661 uel
'sasAleue Jo sllnsal 6urprebe.rriuourrlsal Uedxe paprno.rd pue spode.r ueilu/v\ petede.r6 'sbn:p pue loqocle1o ecuesard oql tol sprng lecr6olorq 1o srsfleue otsualoJ arll pepnlout satlnC
-11 'poor'lrieyrluorleas r{6olocrxo1
fuo1e:oqe1 acuercs crsuarol o6ecrq3 ueqlnqnSesrlod elBls srourlll
lslluelcs clsuorol 7661,1sn6ny -1661 lco
'sasf;eue leot[!eqc JosllnseJ Ourp:eber r{uounsel padxa septnoJd 'syodel ueiltJn sa:edatd pue 'elepsA arneJ 'slsruraqc sesrruedng 'sulloulun ;elaua6 pue 's{elds .reddad 'sectnepfiuncas lueq 'secuelsqns pelloJluoc Jo seeJe aql ul suorlebqsenut leutultJoul llun fulsrueqg aql ol peptuiqns ecueptna uo suotleutuJexe otsueJo; srr.to;.tad
Vn'ocrluenO /'C'O uol6urqse6uorlebqsanul Jo neeJng leJepeJ
fuo1eroqe1 193Jeu!uex3 lsrueqS c!suotoJluesard - t66f ldos
33Nf tU3dX3'lVNOrSSSlOUd
zzvL-z$ (e}L)?EIZZ Vn'ocrlueno
{em4e4 uor}e6r}se^ul !OgZgZZt ruoou Jrul {.rlsrueqg
uorleOrlsanul lo neernE lerepel
u30N|NVM Stuvht N331tf9gg7 lsnbny
g 1o 1 e6e6ra6uruell'3
3VJ.IA WnrnCrUUn3
\6: sqhh
(11 '6rnquneqcg) scrlsou6erg eqcog '6u1u1et1eJW seqoC spunoy puerg aqcog(y1'ocllueng),(uapecy 193'6u1u1et1 Jowwex7 crsueJoJ tgJ
(y4'ocquenp) r(uepecy lgl'agua/cs clsuaJo! ul spoqla4 uqdefiopwottqS(HO'rleuutcutC)
alnl[sul 1yy1 ueoruulJ 'osJnog suo4ercdg rclawo4cadg sse& 0OOl6gy uebtuurlbO 'uol6u!ttse14) steyenbpeeg p1 '6u1u1e4 ssouare/Av uo1epeA
(gg 'uog6urqseg) 6g3-Ilales ler.lstl '6u1u1e4 JuawureluoC pue p4uog 11tdg(36 ' uol6urrlseM) Iueduro3lueulrulsulleloctN 'asJno3 6u1u1e4 At-Jt quwo lepcrN
(ll 'qceeg elernlg) alnl[sul]senooureqf 'esJno3 uonercdg c/spg DCI(O1l\'elltDlcog)'slsrluercg
clsueJol Jo uolletoossv ctluellv-p1y1'dotqs>1to114 suo4eb4senul fuo1ercqe1 euqsapuelC(ll 'obecrqO) '6u1u1e4 rc1cadsu1 EWOICSV)
pleog uo1eypoJccv fuo1etoqe1 sJoloeJlg r$o1ercqe1 awpg 1o fiarcog uecuawv(16'fu:ag
s:ad:eg) sls[uercs clsueJol lo uonetcossv ct]ue[V-pty1 'dot7s>1to114 fulawo4cadg sseyy(y1 'rtglrlueqg) fuoleloqe''l qcJeasau pue Ourlsal lercadg 'reurwes lslwoLtg csuaroJ VJO
(96'uol6urqsep1'srepenbpeaH lg3) 'uorlelod.rog steleM 'spot4lery SW/Cl pctgleuy ursJu€waoue^pv
(39'uo16urqse6)srapenbpeeg p7'6u1u1et1 uogeyodsue4 QyyyTyfl qeya4eq snoprezeH aseg
(y6':e1secue1) laloct 1r1' I6o1ou qcel 1urpweson yy A I u sluew ecue^pv(11'obec;qg) elnpsul qcJeeseu euoJ3cf!'ttdocsotctyy cEueJoJ
(y71 'ocrluenp),tuepecy lel 'Jewwag yewabeuery srostNedng yoddng p7(y1 'a6puqpooltl) buue4rossessy puoneuralut - 1V1/O1CSV
(y1'octlueng)uorlerod:og $aleM 'fupwo4cedg sselzy dursli slsAleuy enplsau eNlelnuen\
(y1 'ocrlueng) 'sseuro.rclU\/uoue:od.roC sJeleM 'uotptedg pue fuoeql JO_l-0 o/seg(y1 'ocrlueng) 'Cg pue g1rc1deg eldweg duqewopy toJ uollce4xg oull-uo
(y1 'ocr1uen6) 'uorlelodJog sreleM 'bunooqsalqnoU pue uouetedg CldH(1y1 'roqry uuy) 'unrsodwlg yewdoleaeq fuoyetoqe1€wtJC pnuuv ;te
)ry
e66 L
t66 t166 t
966 |.
966 r966 r/66 L
866 r
866 r
666 L
ooo l,
L00z
tajz
z00zz00zz00zz00zv00z
,002v00z,00290029002
11 'ppegOuudgpay{-eJd ::ofey1
ear6ag sUV uleleroossvs!oulllt u1 a6al;og ptaUOulrdS
'll 'allr^uoslcelIbogotg pue I.4srr.uaq3 :uofeyl
earbe6 ecuercs Jo Joleqoege6e11o3 slou!lll
11 'plagbur.rdguo|le4sruru,rpv sseursng ur seslnoc elenpeJe
r$rsran1ul ele1g uourebueg
9NINIVUI IVNOISSSIOUd
t86 L-286 t
986r-186 L
0661 - 686r
NOTIVCnCS
gggg lsnbnyg 1o 7 a6e6
rabu;ue6'33VJ_|A riln']nctuunc

ob"5
'g 'oN '6t 'lon 'lcs ctsuaroJ 'flo srsAleuv S6/Cl pue uo[eztlensln 't002,{eW ''g epoluelca
'sAerdg redda6 ssepoloC''f lelnJy ''3.reburue1111 ''n ileAeO
IAr')J ahrt
'gg 'uol6urqseM'lueulpedaq acrlo6 ue1rlodo4ay1 '6u1u1et1uolss/ugns eouapAz
"ll 'eueqJn-u6tedrueqg 'unrsodr,n,{g sreereC stoutlll;o firs:eruu1 '11u2{4qwatp fuo1enqe1 El aql
'C1l\ 'lcrJepel3 '6ur1aey1 lenuuV slstluatcs ctsueJol Jo uotletcossv ctlue[V-p111t1 'eyepdp Z00Z bnAOg/Ag sbntg pezlas p lslpuy eqt ro! dnotg 6u14to1t4 cl1que,r,s
'r{1e11 'enpe6 'enped 1o firslanrul 's1cadso.r6 pue UV erj} lo ele}S:$uel3s cfsueJol Jo /'Aarrue^o 'fuo1etoqe1 Et €tll7e Idoloctxol pue tfuptwaqc cBueJoJ
'ri1e1| 'euog 'V'lu\lls;o 6unaeyl leuolleN lenuuv 'fuo1ercqe1 EJ aql p fu1srueq3 clsusroJ
sNolJ_vcnEnd
/66 t
0002
e00z
9002
9002
sNotIVt-N3S3Ud
(evvorcsv)preog uouelrpaJccv fuoleloqe-1 sJolceJtO fuo1eloqe1 euuC lo fiarcog ueoueulv
:olcedsul fuo1eroqe1 luese:d - 6661
anrleluesa:dar fuo1eroqe1 193(CnUOennS) s6rug pezres 1o srs,{1euy eql roJ dnorg 6ur4ropi c4rluatos
Jeqrueur 'slsquetcs clsuelol lo uoBetcossv c[uellv-pt!!Jaq llAlri'Slsl]ualcs clsuaJol Jo uo[elCOSsV ul alsA/upl y\l
sNorlvSHtlu=9
lueserd - 00OZluesa:d - t66tluasa:d - t66t
sNo|lvt'IJJV'tvNorssf Joud
(11'plag6ultdg)'cu1 qel-rxof 'doqs>1to1111 qe14xo!(1; 'pgagOuudg) firsrenrun alels uouebueg 'Jalseues 1e1'Ibolocrxo! pJuewuor!^u3
(1 1'e1 ; rruade p ) p:e1ce6-Iel/\^a H' Jeu ! w € S I q d e$o1e w o4 g p1 n bg a s e g pJ eX c e d -lle tma H(tt 'ptaU6uudg) prelce6-Uel^^oH 'oslno3 6u1upt1s,rclercdo SWCg pre4ced-ilalwaH
('11' plegbuudg) {rsraruul elels uorleEueg'lalsaurag 6uudg'i6o1oceueq4('11 '1oo:q1e6) uorlerod.ro3 lelseg 'Jewwas lt1defioyewoqg fue11deC \€lsay
('r I
'6:nquneqcA) ueOruurg pue 'cul qe'l-rxof 'suo1oerJx7 qeTxot wo4 uo7ewryuog SWC1 Z66L
9997 lsnbnyg 1o g a6e6
raburue6'33VltA tfln']n3ruun3
066 t066 r066 t066tL66t266'
'Tth(gy1 'e:ourr1leg) 'cu1 scnsou6er6 slsuy 'sse1g \wwetl qelxo!
(y9 'e1ue|1y) uorlerodro3 prelced uel/v\eH 'butyoday pue stsr{1euy eleo uole\swaqc gsw-cg(yy1 'uo1ur1do;1) uorlelod.ro3 1.rer.r.rr(2 .aoerf ptdeg nol q11n 6up1to1t11
(y4'xep1e3) uorle4srurr.npV lueuJacrolu3 6n.rg 'reuMeS puet11 6ntg(-ll 'olllnsauteg) 'cu1 'pJeog uotlectlruaC fi6olocrxo1 crsualoJ 'dotqs4to1t4 ttloloctxol c,suaJoJ
(y1'ocrlueng),iuapecy p7'r{qde$olewoJtlC lo saloeql(y3 'asop ueg)scnsouber6 Ouuqag '6u1u1e4 sn/d SIJ yn^S
666 t666 I866 t/66 tL66r/66 L
966 t
L4srueqg ur ael6eq eouatcs to JolaLlceg
96'uol6urqsegflrsrenru I uo16u gqse6 a6.roag
A6olocrxol crsuaJoJ pue ecuatcs ctsualo3 utlJo/v\asJnoC elenpeJC3q'uol6ulqseg
firstenlu 1 uo16u gqsery1 e6loeg
9NINIVUI IVNOISSf IOUd
966 t-e66 L
0002-866 r
NOtIVCnOS
. 'slecrtuaqc ui\Aoulun Jo uotlecutluapt pue 'sanptsal a^p fiunces lueq ]o srs,{;eue'saseo anprseJ 6n:p pue 6nrp 'rtbolocrxol papnlcur uoqeurulexe Jo speJv 'suorlebqsanur
leuruJrJo ul llun fulsrueqg lg1 eql ol peptuqns e3ueprna lo uoqeuruexa papnlcut satln6
96'uo16urqse14uorleOrlserul lo neeJng leJepal
A:oteroqel lgllsrueqC clsuaroJ L00Z uef - 9661
^ey\l'fuourrlse] leJo pue spodar uegu/n Jo urJo1 eql
ur sllnser 1o suorlelardlagur 6urprno:d pue 'ses{leue Jo sllnsal 6ur1e:d:a1ur 'uor}eluaurn:}sul
;ecry{1eue 6ursn slcerlxa paredard 6urz,(;eue 'saculeu: pool pue se;dues lecrDolorq uollsuosrod pue s6n:p elelosr o1 saldrcur.rd uorpeJye lecrrleLlc 6ursn 'ecueprna burfuoluanurtol a;qrsuodsag 'uorleogrluap! lmruaLlc pue l6olocrxol Jo eere eql ur suorle6rlsanurleurrluc u! llun fugsruaq3 lgl eql ol pailruqns ecuaprle Jo uorleurupxa epnlour se[ng
vn'mrlueno96'uolOurqsep1
uo[ebrlsanul ]o neaJng leJepelfuote:oqel lgJ
Jou!ruEx3 lsluraqo 3!suoJoJluasero - L00z uef
gZVL-Zt! G,1L)gerzz vn'ocllueno
ferupe6 uorlebrlsenul LOgegZZt uroog lrup fu1srueq3
uorle6rlsenul Jo neeJng lerapol
fuauobluol l 'V aurlopel t
3CN3 tU3dXf tVNOrSSSrOUd
3vrn nntn3tuuncLOOZ'LZ fuenrqa3
71o 1 a6e6fu auro61uo61'V aullapey1
_l
qhh -^3
(1y'u[l1oorg) acUO s,,{eulolly lculsto,{1unog 6ury TlnessV pnxas pe1e1r1tcel-bntg
6uneurploog acualotn lenxas pue [1rue3 rguno3 ple/noH
lueuJsseJeH pue ilnessv lenxes uo esuaJeluos leuotleujalul
(Oyrt ',{ltC lloolt3) lrcuno3?/nassy /Pnxas paley pe 46nt q
(13 'eauurssry) sndueg uo?nessy /enxas: papypceybntg
z00z
z00z
t00z
L00z
L00z
0002
0002
0002
0002
(y1 'suea;rg nnep)Euneeyrl s1sr6o;ocrxol crsueroJ 1o {lercog lenuuv 'plrn pue raqlow ulsls0puy wedizewej
(y6'agpeeg) 6ur1ae61 socuetcsclsueJol 1o luepecy uPcueu/V lenuuV ?/nessy /enxos peleypceybnJ1 pue saudezetpozuag
(fN 'AllC crluepy) unrsodnrAg gecrp(;euy urelse3 lenuuV .senbtuqcel (A)SW-C1
pue otJ-cg ecedspeap 6up2 eletAlnqfixotptrl-1-ewweg Jo! suewr,edg pc160101g 10 slslleuy(ltt ',tttC crluegy) unrsodurlg lecrfileuy
uralseS lenuuv 'sr4/-c7 ledso4cep ttq sa111oqe1ayy pue wedeze4runH loJ splntplg lo slst(puy( 1p1'ae1 nervr;r61) 6ur1aay1 qsr6o;ocrxol
clsueJoJ 1o llatcoS lenuuv '6uruosro4 awqdtoyy 1o osec B o1 uoqectpdy :epuplquy cllacv-9p r.l1!/^ uotlez\eNrao pue uollceqx]lua^ps lq se1e1d6 ro! suawpedg pc16o1o1g 1o srsr{1euy
fi1p 'ouag) bunaeyl sacuatcscrsueJol lo lulapecy uesuauv lenuuv '1dswtcg lq euue\olng pue ur{co1ts41o uo\e\ueJelJto
(Ve'eluellv) uorluenar6pue lorluoC aseestq roJ eeluaC 'SWSWOI Iq sayloqepyy pJelsnry ua6o4t1y 1o slstrpuy
(y9 'e1ue;1y) uorguana:6 pue lorluo3 aseastg JoJ srelue3 'SWSW/71Iq au1u1c1g 1o srstrleuy(yg 'e1ue;1y) uorluenal6 pue lorluoC aseasl6
ro1 srelueC 3WSW/C1lq euuJl u!seilpqelory yeby aNaN aleqdsotqdouefu1 p stsr{puy(Vn'ocrluenp) gW CICSV'6u1u1e4rosssssy puo7euralut gV1/O1gSV
(y1 'ocrlueno) gy1 OTCSV '6u1u1e4 gOOZ,:gZOtL CJUOST(yg 'egue11y) uorluenel6 pue loJluoC espeslg lol sraluaC 'dotqs4lo1t4 uply tCVJgflS
(uo'puelyo6) bunaayl s1st6o;octxog crsueJol;o fiarcog lenuuv 'wooA icuafuew3 et11ut l1olocrxol
(yg 'e1ue;1y) ,{6opouqcal lectpoU\ loe6a11o3 uecuaurv 'esuodsey pue sseup€Jedet4 :wsuoJla! Jo! fitunyoddg 1o slueby puwaqC
(y1 '6rnqsael) lg3 'gru61 asuodseu sleualeyl snopJezeH 'suoqercdg Eelralery snoprezeH(36 'uol6urur1rp$ sar6olouqcef lualrby 'uo4end6 erel lJoS pue senbrutqcal OSq/91
(y1 'ocrluenp) l€J '6u1u1e4 weel esuodsaA ecuept^J(yg'apeeg) 6ur1eary s1sr6o;ocrxol ctsuaJoJ 1o fiercog
lenuuV 'VWOW Jo slcedsy pclioloctxol pue 'pct5oloqled 'leclulp :lselsca 7o {uoby eq1(1p1'ee1nern1ry1) 6ur1eey1
s1stEo;octxol crsueJol 1o Igercog lenuuV 'ws2oJJal pcwaLlC,ro slcadsy pcrboloctxol asuaJoJ(1p1'ae1 narvrl ly1 ) 6uneayl slsr 6o1ocrxo1
clsueJol lo rlatcog lenuuV 'sebuelletp pc4lleuy pue fi^olocewJeqd :sewdezerpozu,ag(lM
'aa1nerrlry1) Ouuaayl slsrOo;ocrxof 3tsuaJol lo fletcog lenuuV 'SWCI lo suonealddy asuaJoJfu1p 'ouag) 6utleayl sacuercs olsueJoJ 1o luepecy uecuouJv lenuuV 'stsetoqdotlcep fi.tepdeg
(y1'ocuueng) uorlerodroC uo3gul '6u1u1e4 e1sdeg uoalul(g4 'uenp ueg) 6ur1aayr1
slsrbolocrxol orsuero1 1o fia1cog lenuuv 'fuageg /enxes pslellpeJ 6ntq p uo4e64seau1(g6 'uenp ueg)
6ut1aayr1 slst6oloctxol ctsueJoJ 1o rlatcog lenuuv 'sbntq / aN palcopsf .'s/vla/ aU l6o1oceuet14(96 'uenp ueg) buueayl s1stEo;octxof crsueroJ 1o fiercog lenuuV 'slsrboloctxol tol l6o1oq1e4
(y9 'eluepy) uorlerodro3 pJeloed Uel/\ aH '6wwwefio4 orcery dH(11'obecrq3) alnpsul lsanbotuaql'asJnog dtyWetl rnqqecxJ
(g Yrl 'Pooraa6P3)JaluaO lecnAleuy ctsuaJo1 1eo6o1org pue leotuJeq3 poomebp3 'ssaueJen4y yaby poruaqo
SNOIIV1N3S3Ud
t00z
e00zt00zt00zL00z
,002
0002
0002
00020002666 r
666 t
666 r666 t666 t666f
666 t
3vrn wnrncruunSLOOZ'LZ fuenrqeg
Vp7a6e4fueruobluoyg'V eullapehl
90029002
9002900290029002
a?fr'(OOOZ) tgg-tgt :VZ 1octxot
'(oooz) gzr-Lz, :tz'puxo! 'leuv'f Sy\l/Cg pue 0ll/Ce ecedspeeg Iq (feg)euolce;otfin8-euruieg pue (gHg)a1et,{1nq,ixolp,t-1.1-eruueo Jol sptnuotg lo srsf;euy 'g's 'relsteurng puE ,.1.1 ,lellll
tr '.y.y1 ,&auro61uoy1 ,.y.y1 ,neagal
(oooz),Vlr-$tL :9t /eS asuaroJ'1 'fuleuiot1cedg sseylTAqderboleruorqg prnbrl Ae.rdso.r1ca13,tq sa1r1oqe1ey1
pue uledaze4tunlJ Jol sptnuotg 1o srs,{;euy "l't 'Jellllll pue ''u'r ':au6eg ,.y.y1 ,fuauo61uoy1 '.v'u\ ,neagal
(gOOz)96!-Oo! :Leg 'g woJttC'p 'seldureg lecrbolorg ruorl pal3ellx3 suoruv snouosrod Jobutuaalcg stsatoqdo.tlca;3 Lre1lrde3 'M'c 'qsnJqsnn pue ''y'y1 'I:euo61uoy1 ''l'll\ ':elMirl1'ytg'p 'a|,{o[ t'u ,"u"lllg
requey\-.1.,0o1o",i31':,:ilf i:3"#;l?i"r.yJ'1"13i""'i"ilii,:??roqureyl uJSrJoJJef leotueqC 1o srsf;euy ctsuaroJ eql uo dnolg 6uryopl c4tluelcs
Jequray\l luepnls - secuetcs otsuaJoJ 1o Iuepecy ueouerlvJaqu,ralA aepluiuloC llnessv lenxes pa1e1r1rce3-6n.rg s1srOo;octxol ctsuelog lo fiarcog
Jaqruey\l 11n3 - slsrboloctxol ctsuelol1o rtlercog
sNotl-vcnSnd
luesard-ggg7luesard-ygg7
9002-2002z00z-0002
lueserd-ggg7lueserd-6661,
ueg) 6uuaayl secuercs crsueJoJ 1o Iurapecy ueorJeruv lenuuV 'sewdazetpozuag - sew4opa1ey1ne7-6nr1 lo uoqedqsaaul pcr1olocrxol eql1uuto.tdwl :4ce1sleg aql u apaaN et116u1pu11
(CO 'uol6urt,lse1fl uogburqseM Jo ,lercoglrcluraqC 'ung lutyows oq, s/ yodag lbolocrxol aqf uaqAA .;/nessy pnxos peleypeT-bntg
'(93 'uadsy) srole6rlsanul seruuo xes Jo uotletoossv operoloo ?/nessy /enxas paleylneg-1rug'(1p'olegng) acue:a1uo3
llnessv lenxas lsureOy uotltleoC alels IJoA rnaN ?nessv pnxes paleylnegbntg 6u4uarct4'(yn'ocrlueng)
looqos Iqder6ogeuuo:q3 {uapecv lgJ 'A6o1octxo1 osusroJ )oJ suoneqddy lttrdefio1ewo4g'(pp'toqleg 663) ecua:e1uo3 6ur.reqg
uolleurrolul serlrJ3 xas lenuuv qlLl6lf eLll 'Jlnessv pnxas pe1e11pce46nr1 u!scldol pacue^pv(p1'allrnqsep) burgaayl
slsrbolocrxol crsusJo1 1o llercog lenuuV 'seldureg pc16o1o1g woJ! s€ilpqelary pue wnunceNry(gq 'uo16urqse14) ecuereluoC lenuuV ertttrg
Jo sulncrn JoJ relue3 leuorleN aql 'suonnps pue sebuelleqg .J/nessy pnxos papypcegbntq(6y1'epsaqleg) 6ururerg
ueal llnessv lenxes asuala6 1o lueupedag 'Idolocrxol pue ilnessv /enxas pepllpeg-1ntg(epenay'oueg) llnessv lenxas
lsureOy uorlleoC epe^aN 'sebueyeq3 eql pue s6rug aq! - lnessv pnxes peleyycel-bntg(erlerlsny'aulnoqlayl)
6ur1aayr1 lenuuV s1srbo;ocrxol lo uo[etoossv leuotleuJelul aql 'rIyawo4cadg ssery wepue!Iqdefiolewotp p1nb11Ig qcnpo4 ul oplesJg sltpuv wnuncexo1 lo uoycala1 w€lroryisod
(p;'plagurel6) e1ny1sul rlorpesau s,rolncasord uecueuv ?nessy /enxas pepypeT-1ntg(p1 'elgrnxouy)egnlrlsug LlcJeesau s,Jolncasold ueeueulv ?/nessy pnxas peleyycel-1ntg
(ecuer3 'sue6) 6unaayl lenuuV slsr6olocrxol lo uotletcossvleuo[eurelul eql 'S/V-S/V-C1 pue SW-CT lq ststrleuy ougwUoA-HO-LL pue eugwqo1
(tn ',tl3 alel lles) alnillsul rloJeeseu s,Jolncasord umueuv ?/nessy /pnxas paleypeT-bntq(1p 's6uudg ebolereg)
uorleroossv {lunceg sotltsJentun pue sabe;lo3lseaqUoN ?/nessy pnxas papypel-6ntg
SNOIIVIlIIIV]VNOISSf JOUd
(y1'oruoluy
ann'T
9002
9002
9002
9002
9002
9002
3VIIA tltn-'tnctuunSLOOZ'LZ fuenrqa3
y go g a6e6fuauo61uo11g'V aullepe4
LO0Z
90029002
e00ze00zz00z
z00zz00z
z00z
It\
i\
it'-1
'(SOOZ) Zrg-Leg'.62 'loctxo!'puv 'f 'saldueg lecrOolorgur salrloqelaW pue rrnuneelr17\ Jo uorleerlluapl aql 'V'U 'JaJnf pue ''''l'n 'ielM1l ''V'W 'neegal ''y'y1 'fuauo61uoyr1
'(gooz) og-zs :ot'pcrxo!'puv'f '&laurorlceds sse6 uapuel-rtqderEoleurorq3 prnbrl Iq sprnll urayou4sod ur slcnpord
u/r^oplearE sll pue ununcexoo lo uoqmurluepl e^rlelrleno 'f'v 'surluel puE ''v'w 'neega'] ''y'y1 'rteuro6luoy1
'(gooz) 90t-86 tot loctxof 'puv'f '(gHg) e1e:r$nqrftorpfiq-euu:e6 snouaOopu3 Jo suorlp4uacuo3 fueur.rp ur suorleuen aql uo r{pnls
anrsuaqarduroC V 'g 'aurAal pue ''V 'urlee6 ''3'f 'JJeqcS ''C 'rlsolny-srJJol l ''V'ttrj 'fueuo61uoy1 ''V'W 'neage'l
3Vl_|n l,un'lncruun3LOOZ 'LZ rtrenrqe3
y 1o y e6egfuatuobluo;11'V eullspe4

Grn)znn!
SISf,I AJNIf,If,dWOJIAJNIf,IfIf,OTTd

?'"s )ahr\*2
do'51 '6 :ero
:,(g penraceX
uA' 'tVVU \-/
:alec
:,tg penssl
'poolq pa^Fserd-uou ro poolq peuesard yJOAuo.g sI q4s oqlJr euuuolop osuold lr€N poolq peup ? qlr^\ q?^\s (1) ouo sululuoc adolorrue qceg
0Icf
6Cf
LJT
nJl
ICf
:s/holloJ su 'rogquepJ anbrun ? qlr,l peryulu qcue 'sadole,ruaallqn apredes (g) arg q no,{ ol pollruqns Srnoq ere Nat ,(cualedruoC poolgr/VJCIA roJ suell
pa1 ,{cueleduro3 :3U
4re13'y,{u1 :ruog
(lgg) (cr)'v cuvnt'nvaga'I :oJ-
L007,lsl/z :qec
lssl'(crle1edunc

\Lbs )nhh
3
vLclf rol a^le6aN :0lcf
vIcS roj e^rusod :6cl
vIcS roj e^[e6€N :zcr
v1o3 Jol a^ilsod :tcl
vlo= rol e^[e6aN :Lcf
:s^ olloJ se ere dos sutslspoolg u! vl_o3 eql JoJ lsel ^cueladuroc ^ul
lo sllnseJ eql
sllnsau lsel ^cualeduloc
r$\ n""ge'1cren
Dlsoln)-slxoy1 erqlulg '4e19 {ep
L00zt9Ltz
EIU
!urou
:ol:aleo
olfraul

(rusln/.hy
'louprp sauo qclqiy\ prrp vJog peuptuoc seldruus poolq r{crq1ll pogpuopl fltceuoc %001eH .dos
sul?tspoolg ul VJCIS eql roJ Nel ,(cueleduroc sn1 peleldruoc .(llgsseccns neegeT .JCl
VJCA .{cueleduro3
LA1Z'9Z,fteruqeg
:1ce[qng:Olu(I
:ItrOJd:OI 4 Hso{n)-sl"uoryT erqu,{3
nsege'I'v cr€htr
(
oruaru
tt
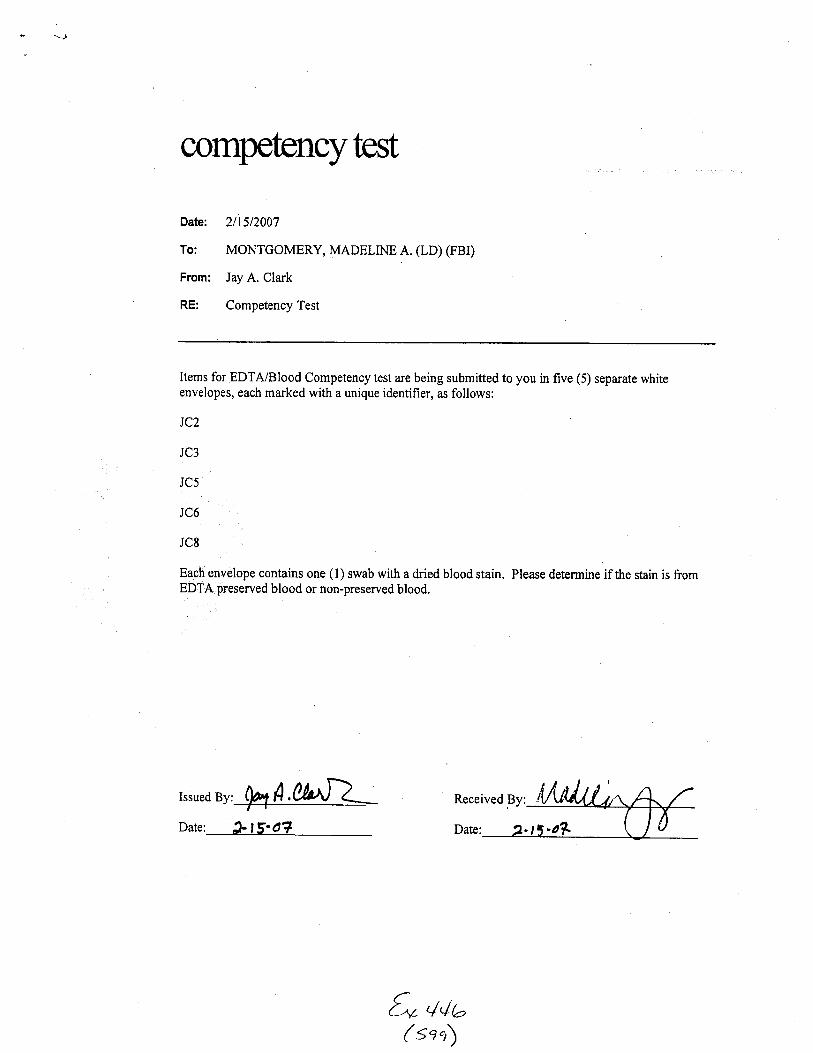
\,, us )n/,h 3
Lg-Sl'€ :olECI
@:,{spenssl
'poolq peuasard-uou ro poolq pa,ueserd y;ggtuo{ sr uuls orpJr auuuelep os?eld 'ur€ls poolq peup € qilm qg^\s (1) euo stn€tuoc odolenua qcug
8Cf
93f
scf
€cf
z)t
:s^/rolloJ se 'rogrluopr onbrun ? qlud pe{JBlu qcea ,sadolalua
elrqm aleredes (g) eng u no,( o1 pa$ruqns Suraq are 1sa1 ,(cueledruoC poolg6/Iqg JoJ sruoU
6e1 Kcueledruo3 :lU
4re13 'y ,{e1 :uloJJ
(rsa)(or)'vilNrraovw',l.uaruooJNorN :or
L007,l9vz :epo
lsolr(cuepduoc

(ooq )lhh 3
VJC1I ro; ea,r1eEe51 :331a1dutzg
VIOS roJ el4lsod :931e1dueg
VJC1I rog e,rlteEep :g31e1duug
VIOS roJ ellllsod :g31e1dtuug
VIOS roJ e^Illsod :731e1duug
I L;lSIl1uo Jeil\erg '1 ,(q pelnbc€ €lsp aql Eur,ner,rer teXB sllnseJ Eurrt"ollog olil u/y\?rp e^eq I
suorsnlcuoc ue1,{cuelodruo3 vJCg, Ljlgllz
VYlfU,irouro8luonl'Y1n€ege'I'htr
:1ca[qng:elBo
:TUOJ{
:OI
ol,uol l

I
Memo
To: Madeline A. Montgohory, Marc A. LeBeautr'rom: Cynthia L. Morris-Kukoski uLDate: February 26,2007Subject: Competency EDTA
Madeline Montgomery successfully completed her competency test for the EDTA inBloodstains SOP. She 100% correctly identified which blood samples contained EDTA andwhich ones did not.
Q,t+e,( uot)
t
competnrcytest
Date: 212012007
To: LEBEAU, MARC A. (LD) (FBD
From: Jay A. Clark ,5['
RE: Competency Test
Congratulations, you have successfully completed your competency exam for the Analysis of EDTA
in Blood Stains.
Please see the attached Key for the correct answers, and the procedure for the preparation of the test
samnles.
€v'/4u(u"4
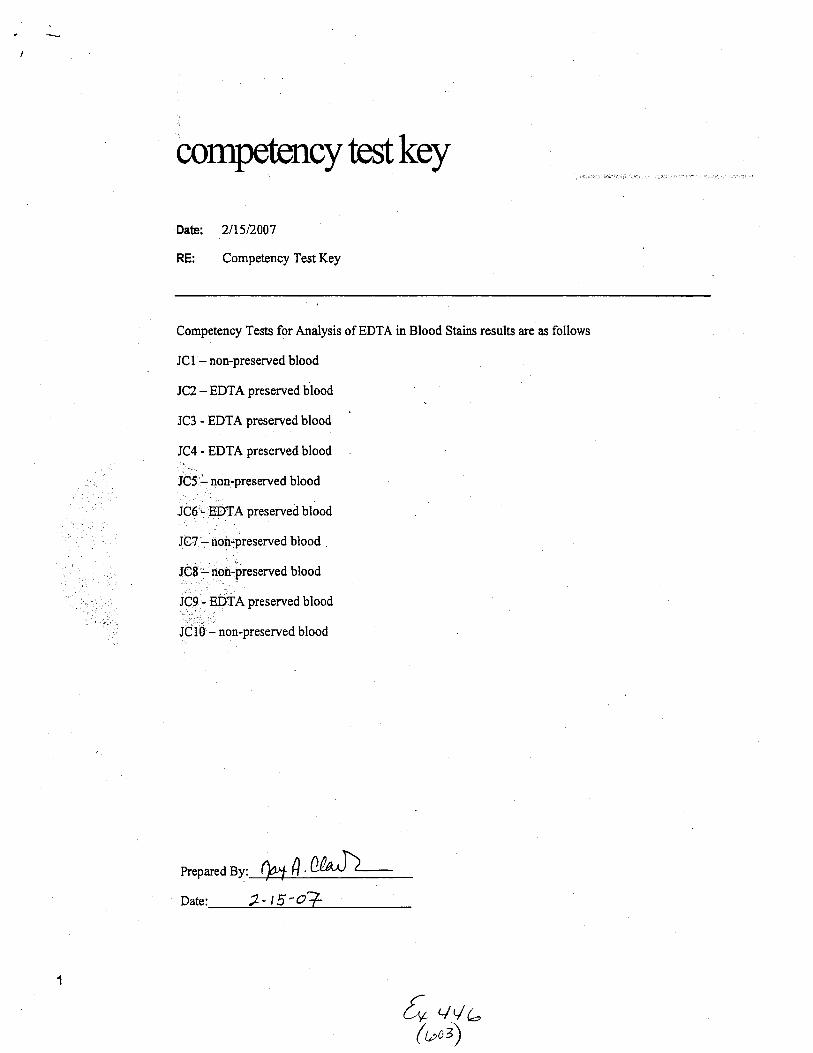
competnrcytestkey
Date: 211512007
RE: Competency Test Key
Competency Tests for Analysis of EDTA in Blood Stains results are as follows
JCI - non-preserved blood
JC2 - EDTA preserved blood
JC3 - EDTA preserved blood
JC4 - EDTA preserved blood
JQJ:- norypreserved blood
JC6'- EDTA preserved blood.':JC7 - noir:preserved blood
t:
J :cB
t n*-Pteserved blood
JC9 - EDTA preserved blood:l''"rl r
ldt0 - non-preserved blood
Prepared Yy, (htT.}la'h--
fn qqL
Date: 1- t5-07
(t *)
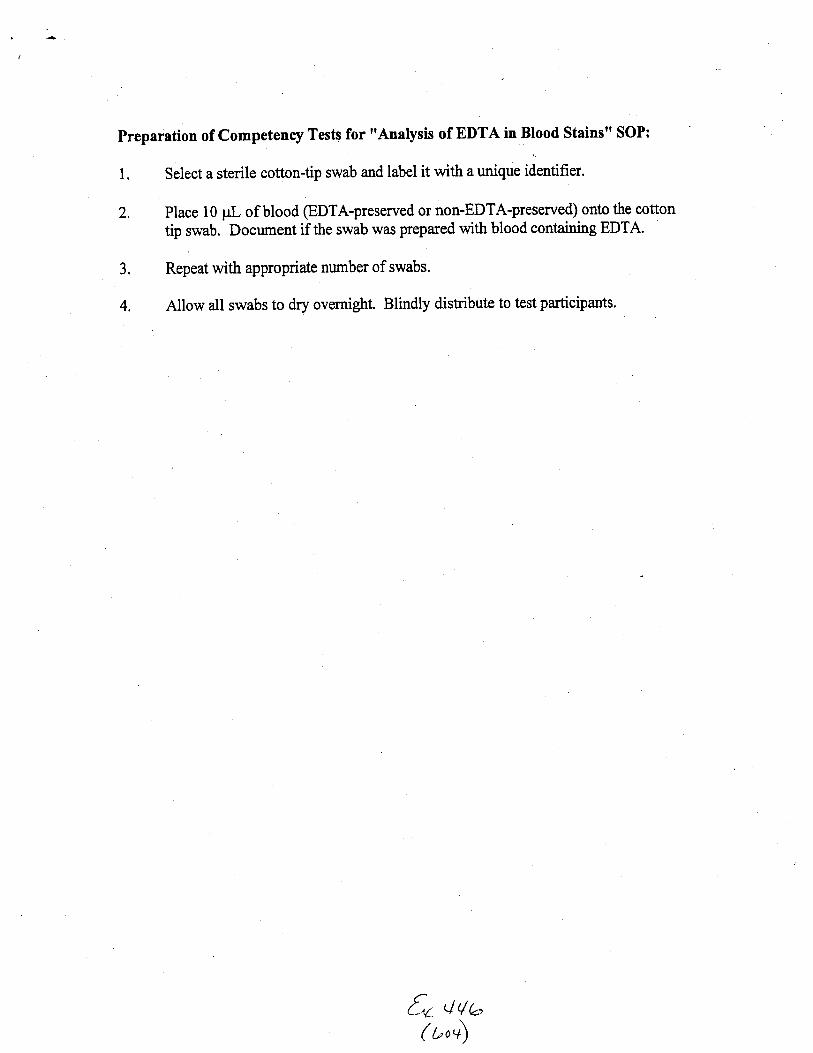
Preparation of Competency Tests for "Analysis of EDTA in Blood Stains" SOP:
1. Seiect a sterile cotton-tip swab and label it with a unique identifier.
Z. Place l0 pL of blood @DTA-preserved or non-EDTA-preserved) onto the cotton
tip swab. Document if the swab was prepared with blood containing EDTA.
3. Repeat with appropriate number of swabs.
4, Allow all swabs to dry overnight. Blindly distibute to test participants.
f" '-tqr-( u'4

$etailed uaXifications and Froficlency Test RepoftDatez 2/2812007
'leport Description:ATU Personnel use this to view detailed ifications and test for selected staff.
Detailed Qualifications and Proficiency Test Report for JASON D BREWER 0731'0000
Controlled Substance
Qualifications Date
81412005 12:00:00AM
Drug Analysis
Most Recent Proficiency Test
Sample Prep.,Wet Chem. & Inst. Analysis
Expiration Date without a new PT QualTypeLinklD
912312007 11:59:58PM 000000000000223
Identifier 05'15C
Staff Position
Test Source External
Source Unit
Other Comments CTS 05-502 saUsfactory completion
Supplier Collaborative Testing Services
Preparer Name
Verifier Name
Validator Name
LT-PTPM Notificauon of Test 9/8/2005 12:00:00AM
LD-PTPM Review NoUfied
UC Designee Final Eval
LD-PTPM Eval
Distribuuon Date
Due Date
PT Complete Date
Testee Feedback
8/1U2005 12:00:00AM
912312005 11:59:59PM
91812005 12:00:00AM
LtlLl2005 12:00:00AM
'entifier 06-17D
-aff Position
Test Source External
Source Unit
Other Comments
Distribution Date
Due Date
PT Complete Date
Testee Feedback
B/10/2006 12:00r00AM
912212006 11:59:59PM
91t212006 12:00:00AM
L2l5lZ006 12:00:00AM
Supplier Collaborative Testjng Services
PreDarer Name
Verifler Name
Validator Name
LT-PTPM Notification of Tesf. 911212006 12:00:00AM
LD-P|PM Review NoUfied
UC Designee Final Eval
LD-PTPM Eval
€,c ,/r/r-( t"os)
Fage L of 1

Deta!!ed Qual$flcatiosls amd Froficie T"est ReportDate: 212812007
Report Descripticn:\TU Personnel use this
Trace Analysis (Chem.)
Qualifications Date
5/10/2005 12:00:00AM
to view detailed
Bank Dyes
Most Recent Profiiiency Test
ns and test for selected staff.
Sample Prep.,Wet Ctrem. & Inst. Analysis
Expiration Date without a new pT QualTypeLinUD
71L12007 11:59:58PM 000000000000260
Detailed Qualifications and Proficiency Test Repo* for JASON D BREWER 0ZB1-S0O0
IdentiRer 05-16C
Staff Position
Test Source Intemal
Source Unit Chemistry
Other Comments Test set #4- satisfactory completion
Supplier
Preparer Name Deborah Wang
Verifier Name Robert Mothershead
Validator Name Deborah Wang
LT-PTPM Noufication of Test LZlSlZOOS 12:00:00AMLD-PTPM Review Notified
UC Designee Final Eval
LD-PTPM Eval
Distribution Date
Due Date
PT Complete Date
Testee Feedback
1012712005 12:00:00AM
L21L212005 11:59:59PM
L21512005 12:00:00AM
L21612005 12:00:00AM
'ntifler 06-25C
..rff Position
Test Source Internal
Source Unit Chemistry Unit
Other Comments
Distribution Date
Due Date
PT Complete Date
Testee Feedback
slL8l2006613012006
sl3Ll2006I
12:00:00AM
11:59:59PM
12:00;00AM
12:00:00AM
Supplier
Preparer Name Pamela Reynolds
Verifler Name Eileen Waninger
Validator Name Jason Brewer
LT-ffPM Noufication of Test 5/31/2006LD-ffPM Review NotiRed
UC Designee Final Eval
LD-PTPM Eval
qlb
l2:00;0OAM
( n'4Paae t of 1

Deta!led {,saIlfications and Fnoficiency Test ReportDare: 212812007
?,eport Description:TU Personnel use this to view detailed test for selected staff.
Toxicology
Qualifications Date
t/t/1999 12:00:00AM
QuanUtaUve - Drug Analysis
Most Recent Proficiency Test Expiration Date without a new PT
612912007 12:00:00AM
QualTypeLinkID
000000000000739
Detailed Qualifications and Proficiency Test Repoft for MARC A LEBEAU 0781-0000
Identifier 05-58
Staff Position
Test Source External
Source Unit
Other Comments FTC-A- satisfactoy completion
Distribution Date 3/!71?oo5 12:00:00AMDue Date SI5IZOOS 11:59:59pMPT Complete Date SF12OO5 12:00:00AMTestee Feedback 8/5/2005 12:00:00AM
Supplier College of American pathologists
Preoarer Name
Verifier Name
Validator Name
LT-PTPM Notification of Test 5/5/2005 12:00:00AMLD-PTPM Review Notified
UC Designee Frinal Eval
LD-PTPM Eval
rntifier 06-38
-.aff Position
Test Source Extemal
Source Unlt
Other Comments
Distribution Date
Due Date
PT Complete Date
Testee Feedback
311612006 12:00:00AM
5/812006 11:59:59PM
5/312006 12:00:00AM
612012006 12:00:00AM
Supplier College of American Pathologisb
Preparer Name
Verifier Name
Validator Name
LT-PTPM Notification of Te'i'. 51312006 12:00:00AMLD-PTPM Review Notified
UC Designee Final Eval
LD-PTPM Eval
rCy- 4 y'b( crt)
traoe 1 nf l.

Detalled ualiiications and Froficlen Test ReportDate: 212812007
Q.eport DescriptionrATU Personnel use this to view detailed and test for selected staff.
Detailed Qualifications and Proficiency Test Repo* for MARC A LEBEAU 0731-0000
Toxicology
QualificaUons Date
tlLlI999 12:00:00AM
Quantitative - Drug Analysis
Most Recent Proficiensy Test
413012002 11:59:59PM
Complete Examination & Analysis
Expiration Date without a new PT QualTypeLinklD
LLl5l2004 11:59:59PM 000000000000275
Identifier 99-18A
Staff Position SUPERVISORY CHEMIST-UNIT CHIEF
Test Source Extemal
Source Unit Chemistry Unit
Other Comments
Distribution Date
Due Date
PT Complete Date
Supplier CAP
Preparer Name
Verifier Name
Validator Name
LT-mM Noufication of Test 5/1/2000 12:00:00AM
LD-PTPM Review NoUfied
UC Designee Final Eval
rntifier 00-17
-rff Position SUPERVISORY CHEMIST-UNIT CHIEF
Test Source Extemal
Source Unit
Other Comments
Distribution Date
Due Date
PT Complete Date
Testee Feedback
Distribution Date
Due Date
PT Complete Date
Testee Feedback
LIlLlt999 12:00:00AM
L2lL6lL999 12:00:00AM
l2ltllL999 12:00:00AM
ltlL6l2000 12:00;00AM
L2lZLl2000 11:59:59PM
1212612000 12:00:00AM
5/712001 12:00:00AM
8lL3l200L 12:00:00AM
91251200L 12:00:00AM
91251200L 12:00:00AM
t2l3t/200t 12:00:00AM
Testee Feedback 5/3/2000 12:00:00AM LD-PTPM Eval
Supplier College of American PathologisE
Preparer Name
Verifier Name
Validator Name
LT-mM Noufication of Test 51217001 12:00:00AM
LD-FI?M Review Notified
UC Designee Final Eval
LD.MM EVaI
Supplier CAP
Preparer Name
Verifier Name
Validator Name
LT-ffiM NoUfication of Test 12731/2001 12:00:00AMLD-mM Review Notified LZl3tlZ}}L 12:00:00AM
UC Desisnee Final Eval 1213112001 12:00:00AMLD-PTPM Eval
Identifier 01-15
Staff Position SUPERVISORY CHEMIST-UNIT CHIEF
Test Source Extemal
Source Unit Chemistry Unit
Other Comments
IdenUfier 02-2
Staff Position SUPERVISORY CHEMIST-UNIT CHIEF
Test Source External
'rce Unit
Supplier College of American Pathologists
Preparer Name
Verifier Name
Validator Name
CqtGbo8
ffiWWEWW Ii{rTi-{q'. ffi3:1 ft-I i g.rlrF-l fi iIFi ffr]TKl I I I tll t E }r,8PEreEm
vrner Comments
age

Setailed Qua$ifications and Froficiency Test R ort*ate: 217812007
qeport Description:ATU Personnel use this to view detailed test for selected staff.
Detailed Qualifications and Profrciency Test Report for MARC A LEBEAU 0781-0000
31L812002 12;00:00AM
413012002 11:59:59PM
413012002 12:00:00AM
71L612002 12:00:00AM
of Test 71L612002 12:00:00AMDue Date
PT Complete Date
Testee Feedback
LD-PTPM Review Notified
UC Designee Final Eval
LD.PTPM EvaI
Identifier 03-27A
Staff Position SUPERVISORY CHEMIST-UNIT CHIEF
Test Source External
Source Unit
Other Comments See attached memos
Supplier College of American Pathologists
Preparer Name
Verifier Name
Validator Name
LT-PTPM NoUfi cation of Test 1/15/2004 12:00:00AMLD.PTPM Review NoUfied
UC Designee Final Eval
LD-PTPM Eval
Distribution Date
Due Date
PT Complete Date
Testee Feedback
L012712003 12:00:00AM
LLl712003 11:59:59PM
t2l9lZ003 12:00:00AM
L012004 12:00:00AM
[u- (,/("( r"ro\
Fase 2 of 2

Setalled Qualifications and F Test Report
test for selected staff.
Oate; 212812007
aepo* *escription;iTU Personnel use this lo view detailed
Toxicology
Qualifications Date
L/t/L999 12:00:00AM
QualitaUve - Drug Analysis
Most Recent Proficiency Test
Interprebuon of Results
Expiration Date without a new PT QuaffypeLinklD
519/2007 11:59:5BPM 000000000000738
Detailed Qualifications and Proficiency Test Report for MARC A LEBEAU 0731-0000
Identifier 05-58
Staff Position
Test Source External
Source Unlt
Other Comments FTC-A- satisfactory compleUon
Distribution Date 3fl7lzOOS 12:00:00AMDue Date SfinOOS 11:59:59pMPT Complete Date SF?OOS 12;00;00AMTestee Feedback Bl5l2OOS t2:00:00AM
Supplier College of American PathologisE
Preparer Name
Verifier Name
Validator Name
LT-PTPM Notification of Test 5/5/2005 12:00:00AMLD-PTPM Review Notified
UC Designee Final Eval
LD-PTPM Eval
ntifier 06-38
-aff Position
Test Source External
Source Unit
Other Comments
Distribution Date
Due Date
PT Complete Date
Testee Feedback
12:00:00AM
11:59:59PM
i2:00:00AM
12:00:0OAM
3/t612006
sl8l2oo5513/2006
Supplier College of American Pathologists
Preparer Name
Verifier Name
Validator Name
LT-PTPM Notification of Test 5/3/2006 12:00:00AMLD-FIPM Review Notified
UC Designee Final Eval
LD-PTPM Eval
vlb( u,,)
Page ,. of 1

Setailed nralificatiosrs and FrofEclency Test ReportDate; 212812007
R.eport Description:ATU Personnel use this to view detailed ualifications and test for selected staff.
Detailed Qualifications and Proficiency Test Repoft for MARC A LEBEAU 0731-0000
Toxicology
Qualifications Date
LltlL999 12:00:00AM
Qualibative - Drug Analysis
Most Recent Proficiency Test
413012002 11:59:59PM
Complete Examination &,Analysis
Expiration Date without a new PT Qual[ypeLinklD
Lt/512004 11:59:59PM 000000000000274
Identifier 994Staff Position SUPERVISORY CHEMIST-UNIT CHIEF
Test Source External
Source Unit Chemistry Unit
Supplier CAP
Preparer Name
Verifier Name
Validator Name
LT-mM Notificauon of feC(. 31L711999 12:00:00AM
LD-PIPM Review Notifled 7lt3lt999 12:00:00AM
UC Desisnee FinalEval 8/10/1999 12:00:00AMLD-PTPM Eval 3/15i2000 12:00:00AM
Supplier CAP
Preparer Name
Verifler Name
Valldator Name
LT-PTPM Notification of Test 8/30/2000 12:00:00AM
LD-PTPM Review Notified 8/30/2000 12:00:00AM
Uc Deslgnee Final Eval 812912000 12:00:00AMLD.PTPM EVaI
'entifier 00-6
rff Position SUPERVISORY CHEMIST-UNIT CHIEF
Test Source Elternal
Source Unit Chemistry Unit
Other CommenE
Distribution Date
Due Date
PT Complete Date
Testee Feedback
Other Comments
Distribution Date
Due Date
PT Complete Date
Testee Feedback
Other Comments
Distribution Date
Due Date
PT Complete Date
Testee Feedback
3lL7/t999 12:00:00AM
31291t999 12;00:00AM
71211999 12:00:00AM
81411999 12:00:00AM
61712000 12:00:00AM
61t912000 12:00:00AM
6ltgl2010 12;00:00AM
8/30/2000 12:00:00AM
8/13/2001 12:00:00AM
9125/?00t 12:00:00AM
9lZ5l200L 12:00:00AM
L2/3U200L 12:00:00AM
Identifier 01-15
Staff Position SUPERVISORY CHEMIST-UNIT CHIEF
Test Source External
Source Unit Chemistry Unit
Supplier CAP
Preoarer Name
Verifier Name
Validator Name
LT-PTPM Notification of Test 1213U2001 12;00:00AMLD-PTPM Review Notified Lzl3tl200t 12:00:00AM
UC Desisnee FinalEval 1213112001 12:00:00AMLD-PTPM Eval
Supplier College of American Pathologisb
Preparer Name
Verifler Name
Validator Name
IdenUfier 02-24
Staff Position SUPERVIS0RY CHEMIST-UNIT CHIEF
Test Source External'''Jrce
Unit
5o q,/U( 1,,,
-rher Comments
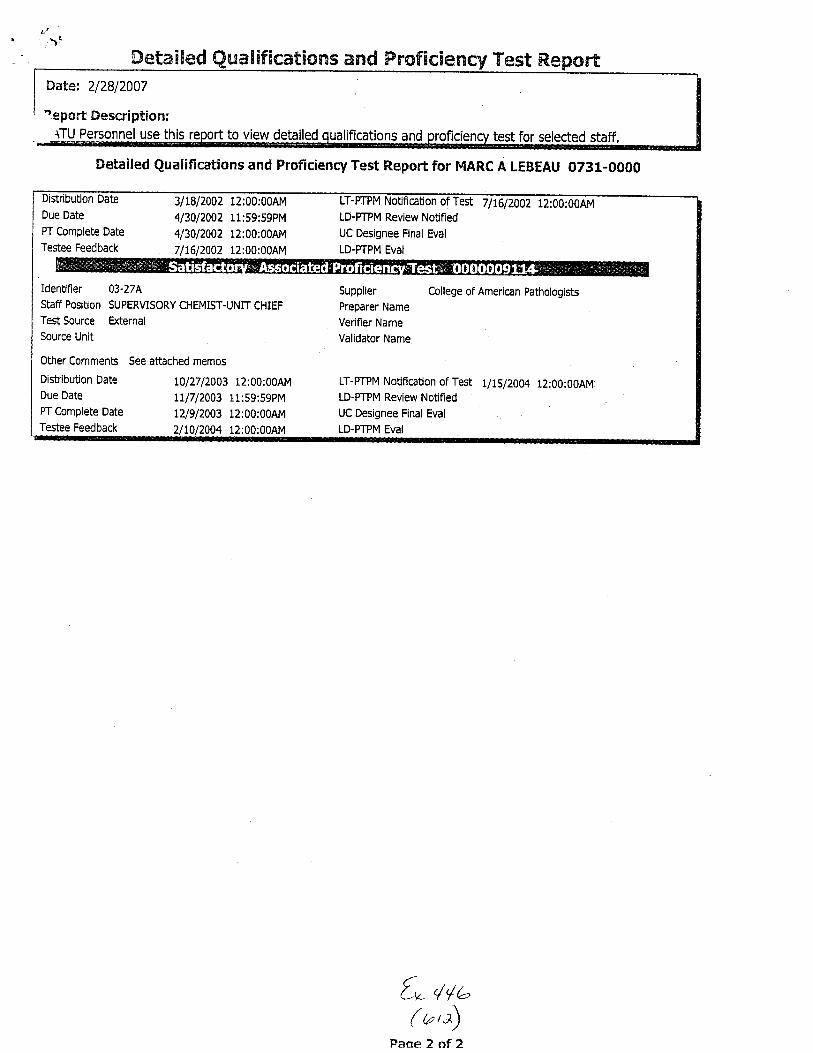
Detailed Qaratriflcatissts and Fg'oficiency Test Re*ate:, 212812007
'eport Description:\TU Personnel use this to view detailed qualifications and test for selected staff.
Detailed Qualifications and Proficiency Test Report for MARC A LEBEAU 0731-0000
DistribuUon
Due Date
PT Complete Date
Testee Feedback
3lt9l2002 12:00:00AM
413012002 11:59:59PM
4/3012002 12:00:00AM
71t612002 12:00:00AM
LT-ffiM Notification of 7lt6lZ002 12:00:00AMLD-ffiM Review NoUfied
UC Designee Final Eval
LD-PTPM Eval
Identifier 03-27A
Staff Position SUPERVISORY CHEMIST-UNIT CHIEF
Test Source External
Source Unit
Supplier College of American Pathologists
Preparer Name
Verifier Name
Validator Name
LT-PTPM Notifi cation of Test 1/15/2004 12:00:00AMLD-PTPM Review Notified
UC Designee Final Eval
LD-PTPM Eval
Other Commenb
Distribution Date
Due Date
PT Complete Date
Testee Feedback
See attached memos
t012712003 12:00:00AM
LLl712003 11:59:59PM
LZl9l2003 12:00:00AM
2/1012004 12:00:00AM
C / /,Cv Vlb/\( utal
Fnoe 2 nf 2
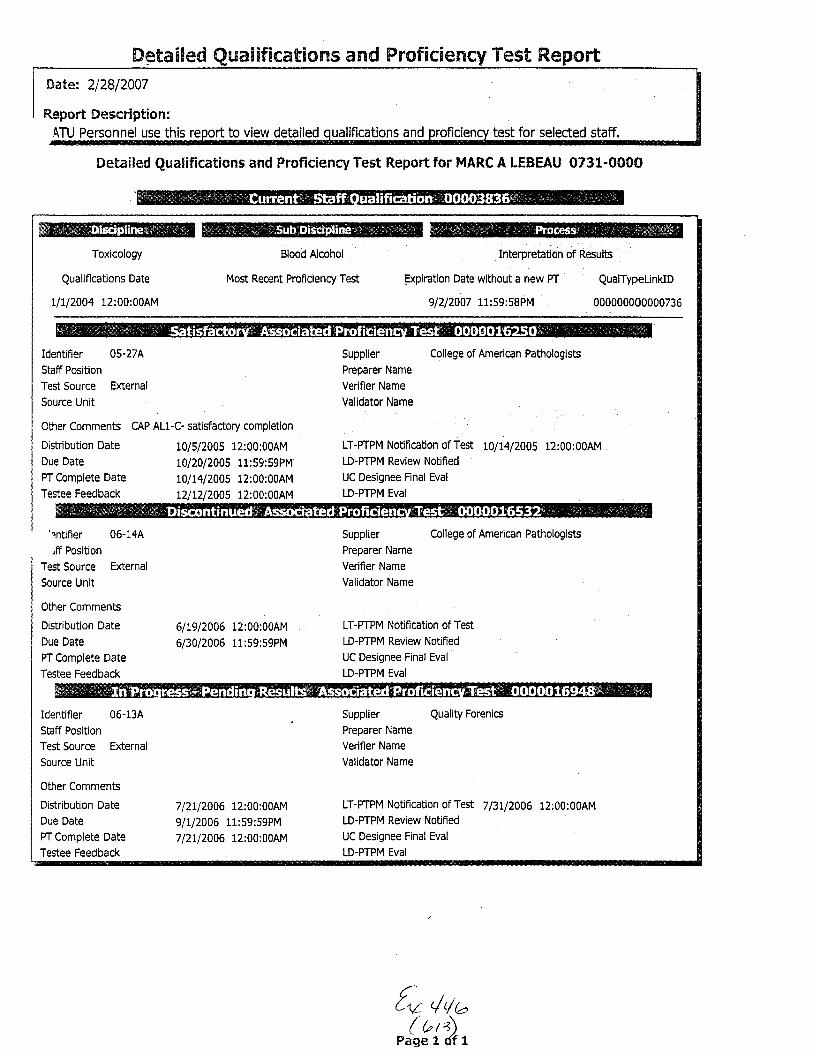
S-etailed Quallfications and Froflclenr T'est RepoftDate: 2128120Q7
Repoff DescriptionlATU Personnel use this to view detailed oualifications and test for selected staff.
Detailed Qualifications and Proficiency Test Repoft for MARC A LEBEAU 0731-0000
Toxicology
Qualifications Date
L/t12004 12:00:00AM
Blood Alcohol
Most Recent Proficiency Test
Interpretation of Resulb
Expiration Date wlthout a new PT QuaflypeLinklD
IdenUfier 05-27A
Staff Position
Test Source External
Source Unit
Other Comments CAP AL1-C- satisfactory completion
Distribution Date
Due Date
PT Complete Date
Testee Feedback
91212007 11:59:58PM 000000000000736
Supplier College of American PathologisB
Preparer Name
Verifier Name
Validator Name
LT-PTPM Notification of Test 10/1412005 12:00:00AM
LD-F|PM Review Notified
UC Designee Final Eval
LD-PTPM EVaI
'rntifier 06-14A
,ff Position
Test Source External
Source Unit
Other Comments
Distribution Date
Due Date
PT Complete Date
Testee Feedback
Identifier 06-13A
Staff Position
Test Source External
Source Unit
Other Comments
Distribution Date
Due Date
PT Complete Date
Testee Feedback
10i5l2005 12:00:00AM
L012012005 t1:59:59PM
t011412005 12:00:00AM
L21t212005 12:00:00AM
61t912006 12:00:00AM
613012006 11:59:59PM
712112006 12:00:00AM
91t12006 11:59:59PM
712112006 12:00:00AM
Supplier College of American Pathologists
Preparer Name
Verifier Name
Validator Name
LT-PTPM Notification of Test
LD-PTPM Review NoUfied
UC Designee Final Eval
LD.PTPM EvaI
Supplier Quality Forenics
Preparer Name
Verifier Name
Validator Name
LT-PrPM Notification of Telr. 7FI:Z006 12:00:00AM
LD-PTPM Review Notifled
UC Designee Final Eval
LD-PTPM EVaI
Y /,cv VVb/'\( {zrs7Paqe L df 1

Setailed ualificaticns andDate: 2lZBIZOOT
Q.eport Descriptionl\TU Personnel use this to.Jlgw detailed ualifications and
Test R
Lest for selected staff.
Complete Examination & Analysis
Expiration Date witfrout a new pT QualTypeLinklD
@Toxicology
Qualifications Date
t/t/L999 12;00:00AM
Detailed euafifications and proficiency Test Report
Blood Alcohol
Most Recent proficiency Test
L0/20/2004 12:00;00AM
for MARC A LEBEAU 0731-0000
L0/20/20C4 11:S9:S9PM 000000000000272
Other Comments
Distribution Date
Due Date
PT Complete DateTestee Feedback
Other Commenb
Distribution DateDue Date
PT Complete DateTestee Feedback
IdenUfier
Staff Position
Test Source
Source Unit
Other Comments
Distribution DateDue Date
PT Complete DateTestee Feedback
IdentifierStaff Position
Test Source,rce Unit
6/1511999 12:00:00AM6/2s11999 12:00:00AM6/2211999 12:00:00AM8/4/1999 12;00:00AM
Supplier CApPreparer Name
Verifier Name
Validator Name
LT-PTPM NoUfi cation of TestLD-PTPM Review NoUfiedUC Designee Final EvalLD.PTPM Eval
6/15/1999 12;00:00AM6/24/1999 12:00;00AM8/10/1999 12:00:00AM
Identifier 9g-7Staff PosiUon SUPERVISORY CHEMIST_UNIT CHIEFTest Source ExternalSource Unit Chemistry Unit
'ntifier 00-12,ff Position SUPERVISORY CHEMIST-UNIT CHIEF
Test Source ExternalSource Unit
3/15/2000 12:00:00AM
Supplier College of American pathologistsPreparer Name
Verifler Name
Validator Name
LT-PTPM Noufication of TestLD-PIPM Review NotifiedUC Designee Final EvalLD-PTPM Eval
t2/4/2000 12;00:00AM
9/1912000
9/2912000
9/2912000
L2/18/2000
12;00:0OAM
11:59:59pM
12;00:00AM
12:00:00AM
01-164
SUPERVISORY CHEMIST.UNIT CHIEFExternal
Chemistry Unit
Supplier CApPreparer Name
Verifier Name
Validator Name
LT.PTPM Nouficauon of TestLD-PTPM Review NoUfiedUC Designee Final EvalLD-PTPM Eval
9/t81200t9/27/200t9/241200t
2/18/2002
12:00:0oAM
12:00:0OAM
12:00:0OAM
12:00:0OAM
2/18/20022/18/20022t6t2002
12:00:0oAM
12:00:0OAM
12:00:00AM
02-188
SUPERVISORY CHEMIST-UNTT CHIEFExternal
Supplier College of American pathologis8Preparer Name
Verifier Name
Validator Name
5o,(a
vLner Comments

iletailed Quallfications and Fnofic T'est ReDate: 212812007
teport Description;ATU Personnel use this to view detailed test for selected staff.
Detailed Qualifications and Proficiency Test Report for MAR.C A LEBEAU 0731-0000
Distribution Date
Due Date
PT Complete Date
Testee Feedback
t0lt9l2002 12:00:00PM
t0/2512002 11:59:58PM
1012512002 11:00:00AM
tU26/2002 12:00:00AM
LT-ffiM Notification of 1012512002 11:00:00AMLD-PTPM Review NoUfied
UC Designee Final Eval
LD-PTPM EvaI
Identifier 03-25A
Staff Position SUPERVISORY CHEMIST-UNIT CHIEF
Test Source External
Source Unit
Supplier College of American pathologisb
PreDarer Name
Verifier Name
Validator Name
LT-PTPM Notification of Test t0/2112003 12:00:00AMLD-PTPM Review NoUfied
UC Designee Final Eval
LD-PTPM Eval
Other Comments
Distribution Date
Due Date
PT Complete Date
Testee Feedback
10/15/2003 12:00:00AM
t012812003 11:59:59PM
1012t12003 12:00:00AM
Lt/24/2003 12:00:00AM
{* u+e,( o,)
Paqe 2 of ?

Setailed Qerafrlfications asld Ps's$iclency Test Repoft*ate: 212812007
Repo* DescrlptionlATU Personnel use this to view detailed and test for selected staff,
Detailed Qualifications and Proficiency Test R.eport for MARC A LEBEAU 0731-0000
Controlled Substance
Qualifications Date
L/r/t999 12:00:00AM
Drug Analysis
Most Recent Proficiency Test
Complete ExaminaUon & Analysis
Expiration Date without a new PT QualTypeLinkID
000000000000224
Identifier 99-5A
Staff Position SUPERVISORY CHEMIST-UNIT CHIEF
Test Source Extemal
Source Unit Chemistry Unlt
Supplier CTS
Preparer Name
Verifier Name
Validator Name
LT-PTPM Notification oF Test
LD-PTPM Review Notifled
UC Designee Final Eval
LD-PTPM Eval
Other Comments
Distribution Date
Due Date
PT Complete Date
Testee Feedback
5/18/1999 12;00:00AM
7181t999 12:00:00AM
7lUL999 12:00:00AM
8141t999 12r00:00AM
7lL3lL999 12:00:00AM
ilt31t999 12:00:00AM
8/10/1999 12:00:00AM3/15/2000 12100:00AM
':ntifier 00-38
"aff Position SUPERVISORY CHEMIST-UNIT CHIEF
Test Source External
Source Unit Chemistry Unit
Supplier CTS
Preparer Name
Verifier Name
Validator Name
LT-PTPM NoUfi cation of Test
LD-PTPM Review Notified
UC Designee Final Eval
LD-PTPM Eval
Other Comments
Distribution Date
Due Date
PT Complete Date
Testee Feedback
51312000 12:00:00AM
612812000 12:00:00AM
611312000 12:00:00AM
817/2000 12:00:00AM
81712000 12:00:00AM
8/712000 12:00:00AM
712812000 12:00:00AM
{o qqu( r'd
Page 1 a{ L
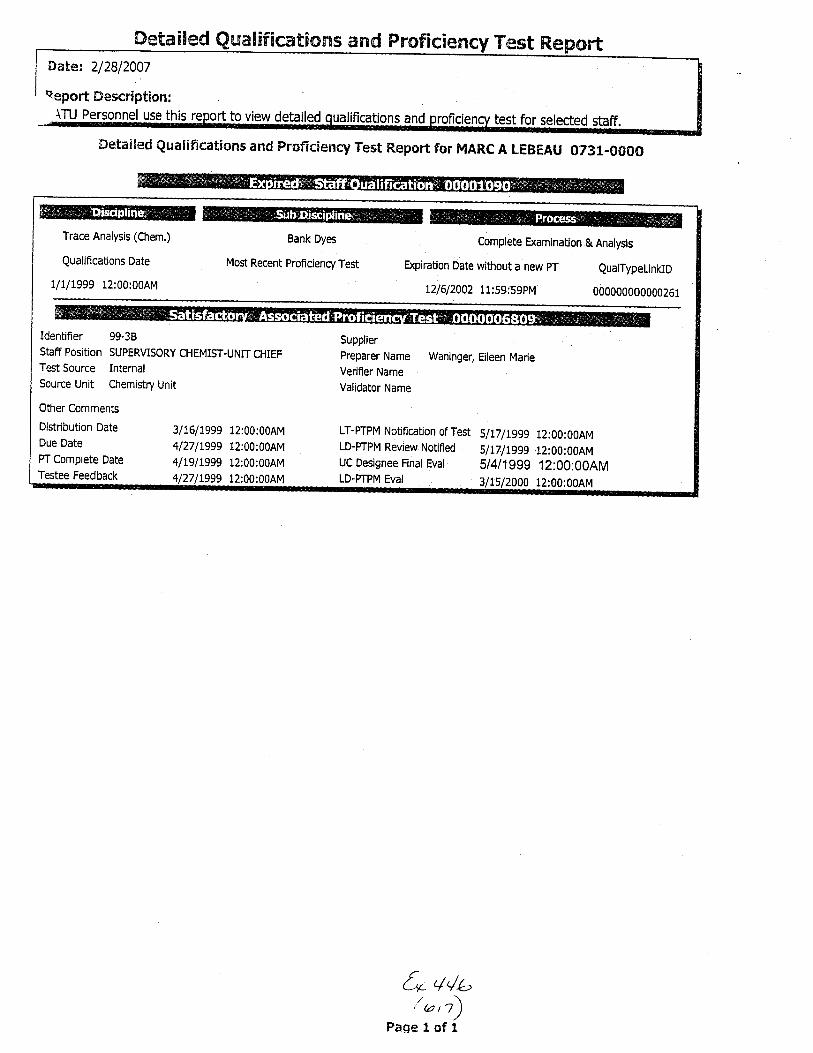
Detalled Qwalificatiosrs and F*atet 2/2812007
{epoft Sescription;\TU Personnel use this to view detailed qualifications and legt for selected staff.
iletailed Qualifications and Froficienry Test Report for MARC A LE8EAU 0yBt-000O
Trace Analysis (Chem,)
Qualifications Date
LltlL999 12:00:00AM
Bank Dyes
Most Recent Profi ciency Test
Complete Examination & Analysis
Expiration Date wi$rout a new pT QualTypeLinklD
t21612002 11:59:59pM 000000000000261
Identifier 99-38
Staff Position SUPERVISORY CHEMIST-UNIT CHIEFTest Source Internal
Source Unit Chemistry Unit
Supplier
Preparer Name Waninger, Eileen MarieVerifier Name
Validator Name
LT-PTPM Notifi cauon of TeSt Sl L7 / 1999 12:00:00AMLD-PTPM Review Notified Sn7/Lggg 12:00:00AMUC Designee Finat Evat 5/4/1ggg 12:00:00AMLD-PTPM Eval 31IS/ZOOO 12:00:00AM
Oher Comments
Distribution Date
Due Date
PT Complete Date
Testee Feedback
3lt6lL999 12:00:00AM
41271t999 12:00:00AM
4/t91L999 12:00:00AM
41271L999 12;00:00AM
&,/qa,r'r,l)
Page I of 1

f d' -t'
a Setailed Quallfications aEld Froficlemcy Test Report*ate; 212812007
?eport ilescription:\TU Personnel use this
Toxicology
QualifioUons Date
LlIlL999 12:00:00AM
to view detalled ifications and
Quantibtive - Drug Analysis
Most Recent Proficiency Test
L2lL6lt999 12;00;00AM
Expiration Date without a new PT
512512002 1l:59:SBPM
test for selected staff.
QuaftypeLinklD
000000000000275
Detailed Qualifications and Froficiency Tast Repont for MADELINE A MONTGOMER.Y 07It-0S00
Sample Prep.,Wet Chem. & Inst. Analysis
Identifier 99-18A
Staff Position CHEMIST-FORENSIC EGMINERTest Source External
Source Unit Chemistry Unit
Supplier CAP
Preparer Name
Verifier Name
Validator Name
LT-PTPM Notification of Test 5/1/2000 12:00:00AMLD-PTPM Review Notlfled
UC Designee Final Eval
LD-PTPM Eval
Other Comments
Distribution Date
Due Date
PT Complete Date
Testee Feedback
LllLl1999 12:00:00AM
LZlt6lL999 12:00:00AM
tZlL0lL999 12:00:00AM
51212000 12:00:00AM
.ntifier 00-17
,ff Position CHEMIST-FORENSIC EGMINER
Test Source External
Source Unit
Supplier College of American Pathologists
Preparer Name
Verifier Name
Validator Name
LT-PTPM Noufication of TeSt 5/7 12001 12:00:00AMLD-PTPM Review NoUfied
UC Designee Final Eval
LD-PTPM Eval
Other Comments
Distribution Date
Due Date
PT Complete Date
Testee Feedback
ILl612000 12:00:00AM
t2/21/2000 11:59:59PM
1212612000 12:00:00AM
5l14/2001 12:00:00AM
Identifier 01-3
stAff Position CHEMIST.FORENSIC EKAMINER
Test Source External
Source Unit Chemistry Unit
Supplier CAP
Preparer Name
Verifier Name
Validator Name
LT-PTPM Notification of Test
LD-PTPM Review NoUfied
UC Designee Final Eval
LD-PTPM Eval
Other Comments
Distribution Date
Due Date
PT Complete Date
Testee Feedback
3lL6l200L 12:00:00AM
412612001 12;00:00AM
41201200L 12:00:00AM
614/200t 12:00:00AM
6/5/2041 12:00:00AM
6151200t 12:00:00AM
61412001 12:00:00AM
Identifier 02-4
Staff Position CHEMIST-FORENSIC E0MINERTest Source External
'rce Unit
Supplier College of American Pathologists
Preparer Name
Verifier Name
Validator Name
5) qqcvtner comments
(,o's

Setal$ed atificatlems arnd Fnoff,cfencv T'est R
*are; 2l2Bl20Q7
-eport Fescripticn:
[!_fg1so-nnel use this report to view detailed qualifications and test for selected staff.
Distribution Date 312S1ZOOZ !Z:OO:ODue Date 5?4l2ooz 11:59:59pM LD-prpM Review NoufiedPT Complete Date SI2IZOOZ 12:00:00AM UC Designee Final EvalTestee Feedback LL14/ZOOI 12:00:O0AM LD-pTpM Eval
Detailed Qualifications and Froficiency Test Report for MADELINE A Mor.{TGOMERY 0731-0000
{* +v^( t: rZ)na^^ .?
^3 -t
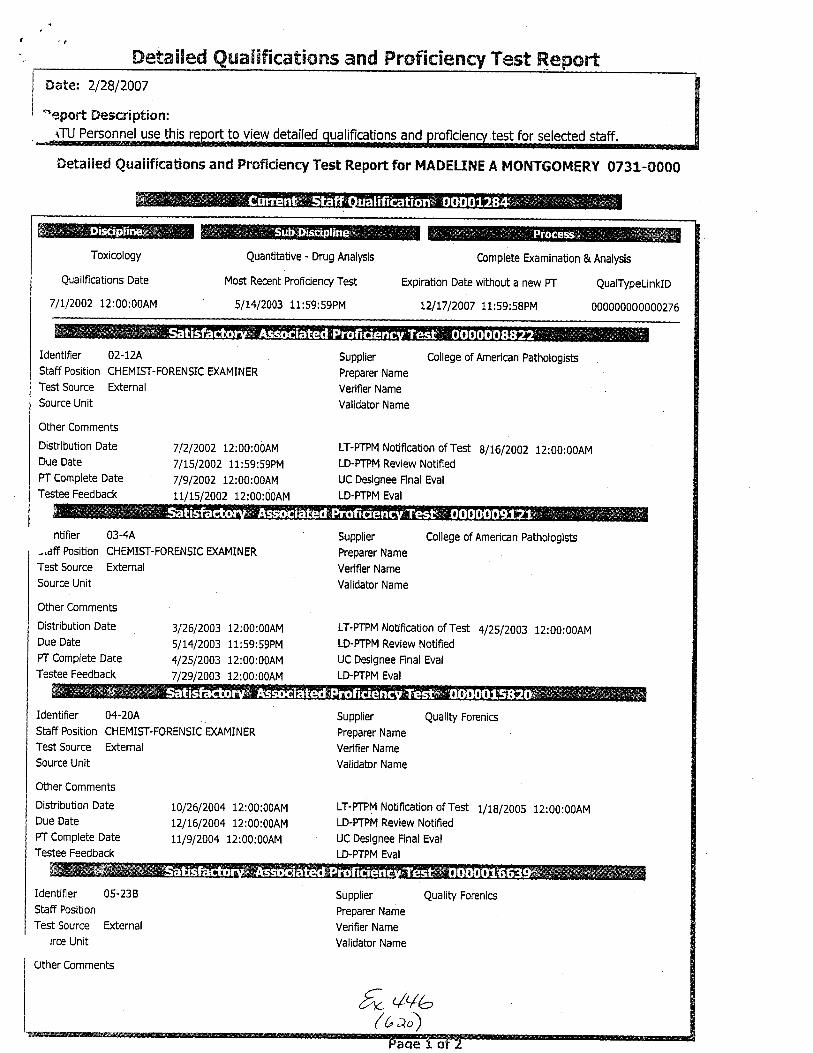
Setailed &saFlficatios'rs and frsfici Test Repoft*ate: 212812007
'eport Description:rTU Personnel use this to view detailed test for selected staff.
Toxicology
Qualifications Date
7/t12002 12:00:00AM
Quantitative - Drug Analysis
Most Recent Proficienry Test
511412003 11:59:59PM
Expiration Date without a new PT
L211712007 11:59:58PM
QualTypeLinkID
000000000000276
Oetailed Qualifications and Proficiency Test Report for IvIADELINE A MONTGOMERY 0791-0000
Identlfier 02-12A
Staff Position CHEMIST-FORENSIC EXAMINER
Test Source External
Source Unit
Supplier College of American PathologisbPreDarer Name
Verifier Name
Validator Name
LT-mM NoUflcation of Test 8/16/2002 12:00:00AMLD-FTPM Review Notified
UC Designee Final Eval
LD.PTPM EVaI
Other Comments
Distribution Date
Due Date
PT Complete Date
Testee Feedback
7/2/2002 12:00:00AM
7lt5l2002 11:59:59PM
7/9/2002 12:00:00AM
ItlL5l2002 12:00:00AM
'ntifier 03-4A
-.aff Position CHEMIST-FORENSIC EXAMINER
Test Source Extemal
Source Unit
Supplier College of American Pathologisb
Preparer Name
Verifier Name
Validator Name
LT-mM NotificaUon of fegr 4/ZS1Z003 12:00:00AMLD-PTPM Review Notified
UC Designee Final Eval
LD-PTPM Eval
Other Comments
Distribution Date
Due Date
PT Complete Date
Testee Feedback
312612003 12;00:00AM
511412003 11:59:59PM
4/25/2003 12:00:00AM
712912003 12:00:00AM
Identifier 04-20A
StAff Position CHEMIST.FORENSIC ENMINERTest Source External
Source Unit
Supplier Quality Forenics
Preparer Name
Verifier Name
Validator Name
LT-my Notificauon of Test 1/18/2005 12:00:00AMLD-PTPM Review Notified
UC Designee Final Eval
LD-PTPM Eval
Other Comments
Distribution Date
Due Date
PT Complete Date
Testee Feedback
L0/2612004 12:00:00AM
1211612004 12:00:00AM
LL/9/2004 12:00:00AM
Identifier 05-238
Staff Position
Test Source External
rrce Unit
other Comments
Supplier Quality Forenics
Preparer Name
Verifier Name
Validator Name
UY VVb/\(bao1

Setnlled uallfications amd Fs'oficierucy ?est Reaate: 212812007
oeport Description:rTU Personnel use this to view detailed qualifications and test for selected staff.
Oetailed Qualifications and Proficiency Test Report for MADE!-trNE A MONTGOMERY 073t.-0S00
Due Date
PT Complete Date
Testee Feedback
Ltl712005 12:00:00AM
t21L612005 11:59:59PM
L211412005 12:00:00AM
121t412006 12:00:00AM
LT-PTPM
LD-PTPM Review NoUfied
UC Designee Final Eval
LD-PTPM Eval
t21L412005 12:00:00AM
Identifier 06-34
Staff Position
Test Source E*ernal
Source Unit
Other Comments
Distribution Date
Due Date
PT Complete Date
Testee Feedback
312212046 12:00:00AM
5/812006 11:59:59PM
411312006 12:00:00AM
16i2006 12:00:00AM
Supplier College of American Pathologisb
Preoarer Name
Verifier Name
Validator Name
LT-PTPM NoUfi cauon of T etr 4 I L3 12006 12:00:00AMLD-FIPM Review NoUfied
UC Designee Final Eval
LD-PTPM Eval
E, q4'1o'4Faqe 2 of 2

. ;:{
Detailed arailficatlsns and Fnsfic[e*ate: 2128120Q7
Report Description:\TU Personnel use this to view detailed ifications and test for selected staff.
Toxicology
Qualifications Date
71t12002 12:00:00AM
Qualitative - Drug Analysis
Most Recent Proficiency Test
5/14/2003 11:59:59PM
Complete Examination & Analysis
Expiration Date without a new PT QualTypeLinklD
L211512007 11:59:58PM 000000000000274
Detailed Qualifications and Froficiency Test Report for MADELINE A MONTGOMERY 0Ig1-0000
ryryWW q I I I { { i I dws.'I {:1 a KTJTFI n ff*l ff-;K I I I J I I | | yJ : ts WgreffiWre
IdenUfier 02-12A
StafF Position CHEMIST-FORENSIC EXAMINER
Test Source External
Source Unit
Supplier College of American Pafrologists
Preparer Name
Verifier Name
Validator Name
LT-PTPM Notifi cation of Test 8/16/2002 12: 00:00AMLD-PTPM Review NoUfied
UC Designee Final Eval
LD-PTPM Eval
Other Comments
Distribution Date
Due Date
PT Complete Date
Testee Feedback
Other Comments
Distribution Date
Due Date
PT Complete Date
Testee Feedback
712/2002 12:00:00AM
711512002 11:59:59PM
7/9/2007 12:00:00AM
Ltlt5l2002 12:00:00AM
312612003 12:00:00AM
51L412003 11:59:59PM
4/2512003 12:00:00AM
712912003 12:00:00AM
rnUfier 03-4A
.rff Position CHEMIST-FORENSIC EXAMINER
Test Source External
Source Unit
Supplier Collaborative Testing Services
Preparer Name
Verifier Name
Validator Name
LT-ffiM Notifi cation ot Test 4 l2S/2003 12:00:00AMLD-PFPM Review Notified
UC Designee Final Eval
LD-PTPM EVaI
Identifier 04-204
Staff Position CHEMIST-FORENSIC EKAMINER
Test Source External
Source Unit
Supplier Quality Forenics
Preparer Name
Verifier Name
Validator Name
LT-PTPM Notification of Test 1/19/2005 12:00:00AMLD-PTPM Review NoUfied
UC Designee Final Eval
LD-PTPM Eval
Supplier Quality Forenics
Preparer Name
Verifier Name
Validator Name
Other Comments
Distribution Date
Due Date
PT Complete Date
Testee Feedback
Identifier 05-238
Staff Position
Test Source External
'rrce Unit
wcher Comments
1012612004 12:00:00AM
L2/t612004 12:00:00AM
LUgl2A04 12:00:00AM
Ll1812005 12:00:00AM
+ 4&-b2^

ffietaiBed uaE$ficatiosls arnd FnoSIci
*ate: 212812007
aeport Description:\TU Personnel use this to view detailed oualifications and test for selected staff.
Detailed Qualifications and Profrciency Test Repo* for MADELINE A MONTCOMERY 0731-00$$
LIl712005 12:00:00AM
LZlL4l2005 11:59:59PM
L211412005 12:00:00AM
L211412006 12:00:00AM
LT-FIPM NotiflcaUon of Test L21L412005 12:00:00AMDue Date
PT Complete Date
Testee Feedback
LD-PTPM Review Notified
UC Designee Final Eval
LD-PTPM Eval
Identifier 06-3A
Staff Position
Test Source E*ernal
Source Unit
Other Comments
Distribution Date
Due Date
PT Complete Date
Testee Feedback
Supplier
Preparer Name
Verifier Name
Validator Name
College of American Pathologists
312212006 12:00:00AM
51812006 11:59:59PM
41t312006 12:00:00AM
LT-PTPM NoUfication of Test
LD-P|PM Review Notifled
UC Designee Final Eval
LD.PTPM EVaI
41t312006 12:00:00AM
16/2006 12:00:00AM
5o qVa( c' az)
$:nn ? nf ?

SetaiHed Qua6liicatiorss arrd Proficfiency Test Repo$sat* 212812007
-eport Sescniption:,TU Personnel use this to view detailed ualifications and
Toxicology
Qualifications Date
tltlL999 12:00:00AM
QualitaUve - Drug Analysis
Most Recent Proficiency Test
512412002 11:59:59PM
test for selected staff.
Sample Prep,,Wet Chem. & Inst. Analysis
Expiration Date without a new pT eualTypeLinklD
5/25/2002 11:59:58PM 000000000000273
Detailed Qualifications and Proficiency Test Report for M^ADEUNE A MoNTGoMERy 0731-0000
Identifier 994Staff Position CHEMIST-FORENSIC E0MINERTest Source Extemal
Source Unit Chemistry Unit
Supplier CAP
Preparer Name
Verifier Name
Validator Name
LT-PTPM Notification of Test
LD-PTPM Review Notified
UC Designee Final Eval
LD-PTPM Eval
Other Comments
Distribution Date
Due Date
PT Complete Date
Testee Feedback
3lL7/1999 12:00:00AM
312911999 12:00:00AM
7121t999 12:00:00AM
8141t999 12:00:00AM
3lL7/1999 12:00:00AM
7lI3lL999 12:00:00AM
8/10/1999 12:00:00AM31t512000 12:00:00AM
ntifier 00-6
-,aff Position CHEMIST-FORENSIC E0MINERTest Source External
Source Unit Chemistry Unit
Supplier CAP
Preparer Name
Verifier Name
Validator Name
LT-FIPM NoUfication of Test
LD-ffPM Review Notified
UC Designee Final Eval
LD-PTPM Eval
Other Comments
Distribution Date
Due Date
PT Complete Date
Testee Feedback
61712000 12:00:00AM
6/t912000 12:00:00AM
611912000 12:00:00AM
8/30/2000 12:00:00AM
8/30/2000 12:00:00AM
8/30/2000 12:00:00AM
812912000 12:00:00AM
Identifier 01-3
Staff Position CHEMIST-FORENSIC EXAMINER
Test Source Extemal
Source Unit Chemistry Unit
Supplier CAP
Preparer Name
Verifler Name
Validator Name
LT-PTPM NoUfi cation of Test
LD-ffPM Review Noufied
UC Designee Final Eval
LD-PTPM Eval
Other Comments
Distrlbution Date
Due Date
ff Complete Date
Testee Feedback
3/16/200t 12:00:00AM
312912001 12:00:00AM
3/281200t 12:00:00AM
6/4/200t 12:00:00AM
6/5/2001 12:00:00AM
6/51200L 12:00:00AM
61412001 12:00:00AM
Identifier 02-4
Staff Position CHEMIST-FORENSIC EKAMINER
Test Source External
rrce Unit
Supplier College of American Pathologisb
Preparer Name
Verifier Name
Validator Name
Ew,Other Comments
b2c
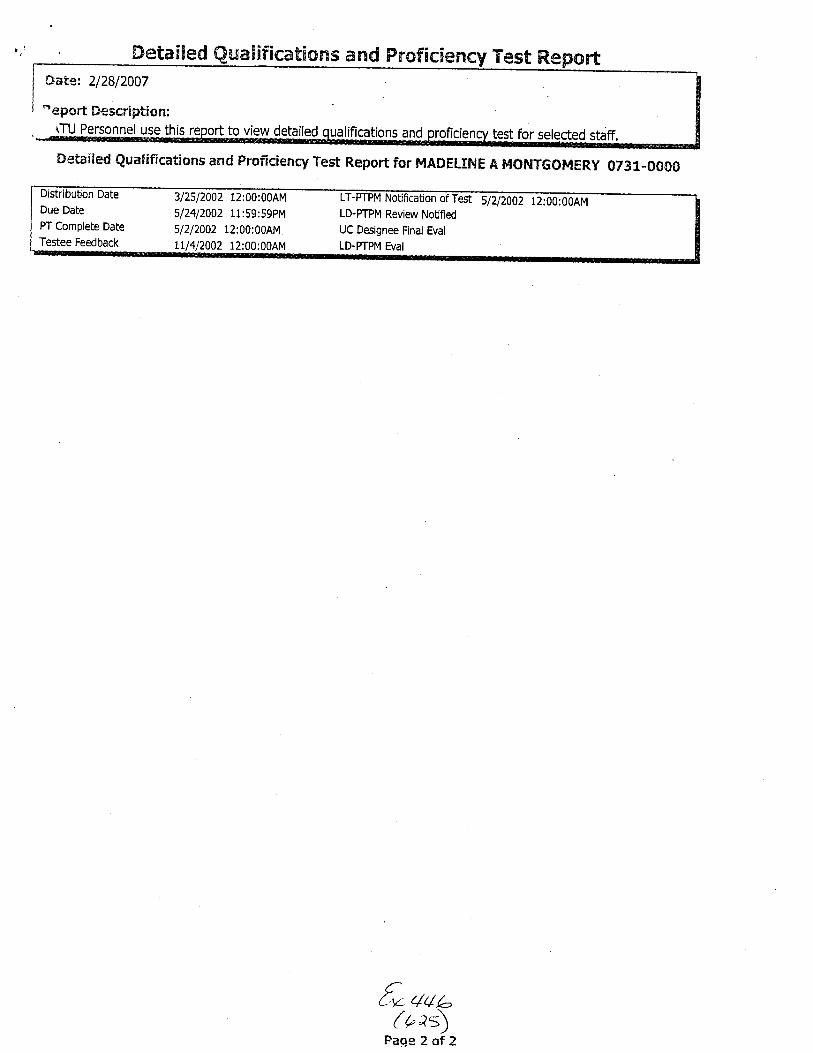
*sta!$ed QLsa$ffficatfiorns amd Fnoficiency Test*at€: 2/2812007
-epoft Eescription;rTU Personne_!,use this report to view detailed test for selected staff.
Detailed Qualifications and Proficiency Test Report for MADELINE A MoNTGoMERy 0731-0000
DistribuUon Date 3/25/200t 12Due Date 5/2412002 l1:59:59pM LD-pTpM Review NotifiedPT complete Date sl2l20o2 12:00:00AM uc Designee Final EvalTestee Feedback Ltl4lZO}Z 12:00:00AM LD_pTpM Eval
[, qu^(o as)
Fage 2 of 2

Date: 212812007
-epott Description:ATU Personnel use this to view detailed
N1o-fEciency Test Repoft
test for selected staff.
Toxicology
QualificaUons Date
7/L/2002 12:00:00AM
Blood Alcohol
Most Recent Proficiency Test
7/712003 11:59:59PM
Complete Examination & Analysis
Expiration Date without a new pT Qual[ypeLinklD
LZl2l2007 11:59:58PM 000000000000272
Detailed Qua$ifications and
Detailed Qualifications and Proficiency Test Report for MADELINE A MoNTGoMERy 0731-0000
Identifier 02-12A
Staff Position CHEMIST-FORENSIC EXAMINER
Test Source External
Source ljnit
Other CommenE
Distribution Date TZ|ZOOZ 12:00:00AMDue Date 7ftSlZOO2 11:59:59pMPT Complete Date TpnOOZ t2:00:00AMTestee Feedback
Supplier College of American pathologisE
Preparer Name
Verlfier Name
Validator Name
LT-PTPM NoUfi cation of 'f e*. 7 / tS 12002 12:00:00pMLD-PTPM Review Notifled
UC Designee Final Eval
LD-PTPM Eval
ntifier 03-9A
-Laff PosiUon CHEMIST-FORENSIC EXAMINER
Test Source External
Source Llnit
Supplier College of American pathologists
Preparer Name
Verifier Name
Validator Name
LT-PTPM Notifi cation of TesI 7 / Ll 2003 12:00:00AMLD-FIPM Review NoUfied
UC Designee Final Eval
LD-PTPM Eval
Other Ccmmen6
Distribution Date
Due Date
PT Complete Date
Testee Feedback
6/23/2003 12:00:00AM
71712003 11;59:59PM
7/t12003 12:00:00AM
712912003 12:00:00AM
Identifler 04-2A
Staff Position CHEMIST-FORENSIC EXAMINER
Test Source External
Source Unit
Other Comments
Distribution Date 3D12OO4 12:00:00AMDue Date 3123/2004 11:59:59pMPT Complete Date 3fl7lZOO4 12:00:00AMTestee Feedback 4lL2l2OO4 12:00:00AM
Supplier College of American pathologists
Preoarer Name
Verifier Name
Validator Name
LT-P|PM Notification of Test 3/1712004 12:00:00AMLD-PTPM Review NoUfied
UC Designee Final Eval
LD-PTPM Eval
Identifier 05-3A supplier college of American pathologisEStaff Position preparer NameTest Source External Verifier Name
'rce Unit Validator Name
Other Cornments CAP #&5L70LlALI-A: satisfactory completion
t/(b( oac
zno

Setailed Qe,ua$$ficat!CIms and FnofE
Datet 212812007
eepod Description:tTU Personnel use this to view detailed oualifications and test for selected staff.
Detailed Qualifications and Proficiency Test R.eport for MADELINE A MONTGOMER.Y 0731-0000
Distribution Date 31812005 12:00:00AM LT-PTPM Notification of Test 3/11i2005 12:00:00AM
Due Date 3lZZlZ00S 1t:59:59pM LD-PTPM Review Notified
PT Complete Date 3lfil1111 1Z:00:00AM UC Designee Final Eval
Testee Feedback 7ltBlZ}lS 12:00:00AM LD-PTPM Eval
Identifler 06-22A Supplier Collaborative Testing Services
Staff Position Preparer Name
Test Source External Verifier Name
Source Unit Validator Name
Other Comments
Distribution Date to/10/2006 12:00:00AM LT-PTPM Notification ofTest 11/20/2006 12:00:00AM
Due Date rzlLlzoo6 11:59:59pM LD-PTPM Review Notified
PT Complete Date Lllzol2oo6 t2:00:00AM UC Designee Final Eval
Testee Feedback ZlLl2007 12:00:00AM LD-PIPM Eval
6 +vu(uat)
Faqe 2 af 2

Setal$ed SuaEiliicatioms amd Froflcie Test Re
Date: 212812007
4.epott Descripticn:\TU Personnel use this to view detailed ions and test for selected staff.
Toxicology
Qualifications Date
Lll/L999 12:00:00AM
Blood Alcohol
Most Recent Proficiency Test
Sample Prep,,Wet Ctem. & Inst. Analysis
ExpiraUon Date without a new PT Qual-l-ypeUnklD
000000000000225
Identifier 99-7
Staff Position CHEMIST-FORENSIC EXAMINER
Test Source External
Source Unit Chemistry Unit
Supplier CAP
Preparer Name
Verifier Name
Validator Name
LT-FfPM Notification of Test 6/15/1999 12:00:00AMLD-PTPM Review Notified 612411999 t2:00:00AMUC Designee Final Eval 8/10/1999 12:00:00AMLD-PTPM Eval 3lt5l2000 12:00:00AM
Supplier CAP
Preparer Name
Verifier Name
Validator Name
LT-PTPM Notificauon 0f Test 12118/2000 12:00:00AM
LD-PTPM Review Noufied tzltBlZ000 12:00:00AM
UC Desisnee Final Eval 121412000 12:00:00AMLD-PTPM Eval
,ntifier 00-12
:ff Position CHEMIST-FORENSIC EXAMINER
Test Source Extemal
Source Unit Chemistry Unit
Other Comments
Distribution Date
Due Date
PT Complete Date
Testee Feedback
Other Comments
Distribution Date
Due Date
PT Complete Date
Testee Feedback
Other Comments
Distribution Date
Due Date
PT Complete Date
Testee Feedback
6lt5l|999 12:00:00AM
61251t999 12:00:00AM
61221t999 12;00:00AM
8141t999 12:00:00AM
9/1912000 12:00:00AM
9l2912OOO 12:00:00AM
9/2912000 12:00;00AM
L211812000 12:00:00AM
Identifier 01-68
Staff Position CHEMIST-FORENSIC EXAMINER
Test Source External
Source Unit Chemistry Unit
Supplier CAP
Preparer Name
Verifier Name
Validator Name
LT-PTPM Notiflcation of Test.. 71212001 12:00:00AMLD-PTPM Review Notified 7/2la00t 12:00:00AMUC Designee FinalEval 71212001 12:00:00AMLD-PTPM Eval
5lt4lz00tsl23l200rsl2Ll200L
12:00:00AM
12:00:00AM
12:00:00AM
12:00:00AM
{* uot( tr t*)
Faae L of 1
CIetailed Qualification$ and Proficiency Test Report for MADELINE A MONTGOMER.Y 0731-0S00
Bwffi#ffie$ffi q r il-a {ii i$fr;\ a;l i g cll}-l n iT-il {Ffig r i r I r l il | r# !.: ;ffi8n
7 t2t2001

FetaEled uaBlficatloils and Froflciency Test Report*at*; 212812007
qepogt sescription;tTU Personnel use this to view detailed ifications and test for selected staff.
Controlled Substance
Qualifications Date
7/t12002 12:00:00AM
Drug Analysis
Most Recent Proficiency Test
911012003 11;59:59PM
Complete Examination & Analysis
Expiration Date without a new PT QuatTypeLinklD
912312007 l1:59:58PM 000000000000224
Oetailed Qualifications and Frcficiency Test Report for MADELINE A MOr-|TGOMERY 0731-0000
Identifier 03-12A
Staff Position CHEMIST-FORENSIC EXAMINER
Test Source External
Source Unit
Supplier Collaborative Testing Services
Preparer Name
Verifier Name
Validator Name
LT-PTPM Noufication of Test 8/13/2003 t2:00:00AMLD-PTPM Review NoUfied
UC Designee Final Eval
LD-PTPM Eval
Other Comments
Distribution Date
Due Date
PT Complete Date
Testee Feedback
7/30/2003 12:00:00AM
911012003 11:59:59PM
B/13/2003 12:00:00AM
L2/212003 12:00:00AM
'ntifier 04-13A
.rff Position CHEMIST-FORENSIC EXAMINER
Test Source External
Source Unit
Supplier Collaborative Testing Services
Preparer Name
Verifier Name
Validator Name
LT-PTPM Notification of Test 10/2612004 12:00r00AMLD-PTPM Review Notifled
UC Designee Final Eval
LD-PTPM Eval
Other Comments
Distribution Date
Due Date
PT Complete Date
Testee Feedback
7/L512004 12:00:00AM
Bl26l20M 11:59:59PM
L0/2612004 12:00:00AM
1012612004 12:00:00AM
Identifier 05-15A
Staff Position
Test Source Extemal
Source Unit
Other Comments CTS 05-502- saUsfactory completion
Distribution Date BIfiIZOOS 12:00:00AMDue Date 9lZ3lZ00S 11:59:59pMPT Complete Date yL2lz005 12:00:00AMTestee Feedback L1.lLlZ}lS 12:00:00AM
Supplier CollaboraUve Testing Services
Preparer Name
Verifier Name
Validator Name
LT-PTPM Notification of lesI 91L212005 12:00:00AMLD-P|PM Review Notified
UC Designee Final Eval
LD-PTPM Eval
Identifier 06-3A
Staff Position
Test Source External
rrce Unit
uther Comments Mistaken entry
Supplier Collaborative Testing Services
Preparer Name
Verifier Name
Validator Name
[r ,tqb( aa'lagelt3
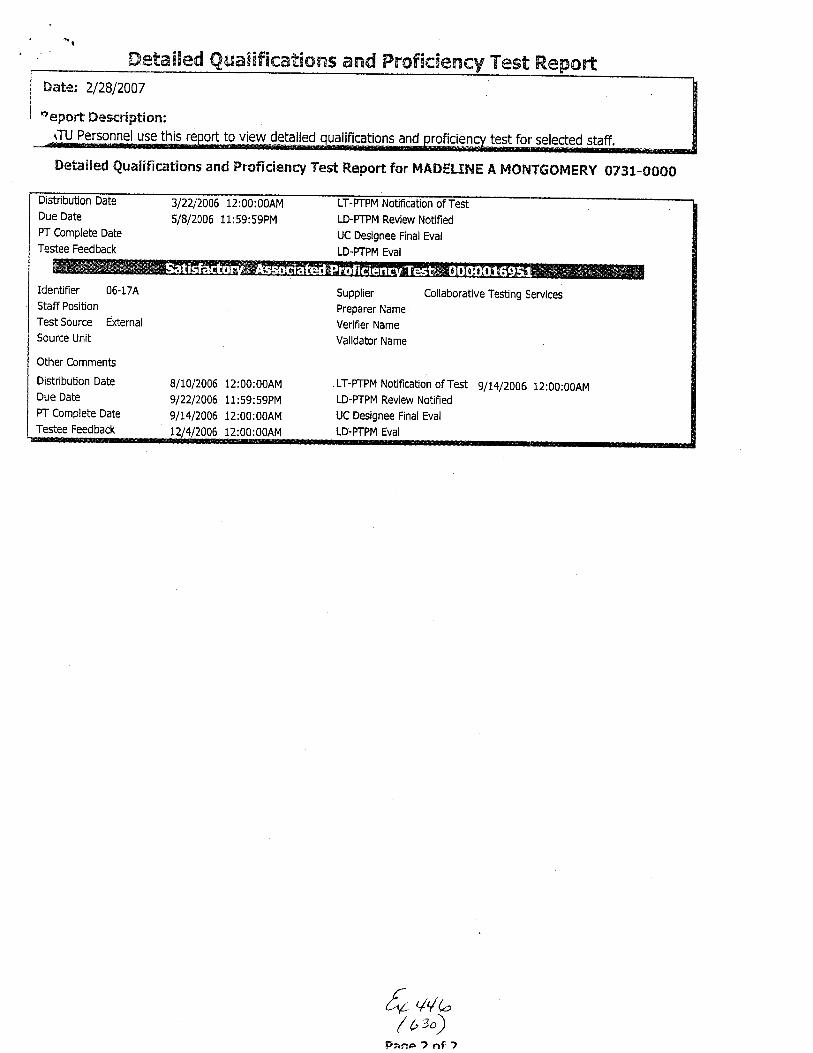
setaiHed Q{ea$fficat$orss and Fnof$ciemcy Test ReportDate: 2/2812007
qeport Description:rTU Personnel use this to view detailed qualifications and test for selected staff.
Detailed Qualifications and Froficiency Test Report for MADELINE A MoNTsoMER.y 0731-0000
Distribution Date
Due Date
PT Complete Date
Testee Feedback
3/2212006 12:00:00AM
51812006 11:59:59PM
Notification of T
LD-ffiM Review Notified
UC Designee Final Eval
LD-PTPM Eval
Identifier 06-174
Staff Position
Test Source Extemal
Source Unit
Other CommenE
Distribution Date
Due Date
PT Complete Date
Testee Feedback
8/10/2006 12;00:00AM
912212005 11:59:59PM
91t412006 12:00:00AM
12/412006 12:00:00AM
Supplier Collaborative Testing Services
Preparer Name
Verifier Name
Validator Name
.LT-PTPM Noufication of TesI 91t412006 12:00:00AMLD-ffiM Review NoUfied
UC Designee Final Eval
LD-F:I-PM Eval
fo q+bl ot')
Farrp ? nf ?
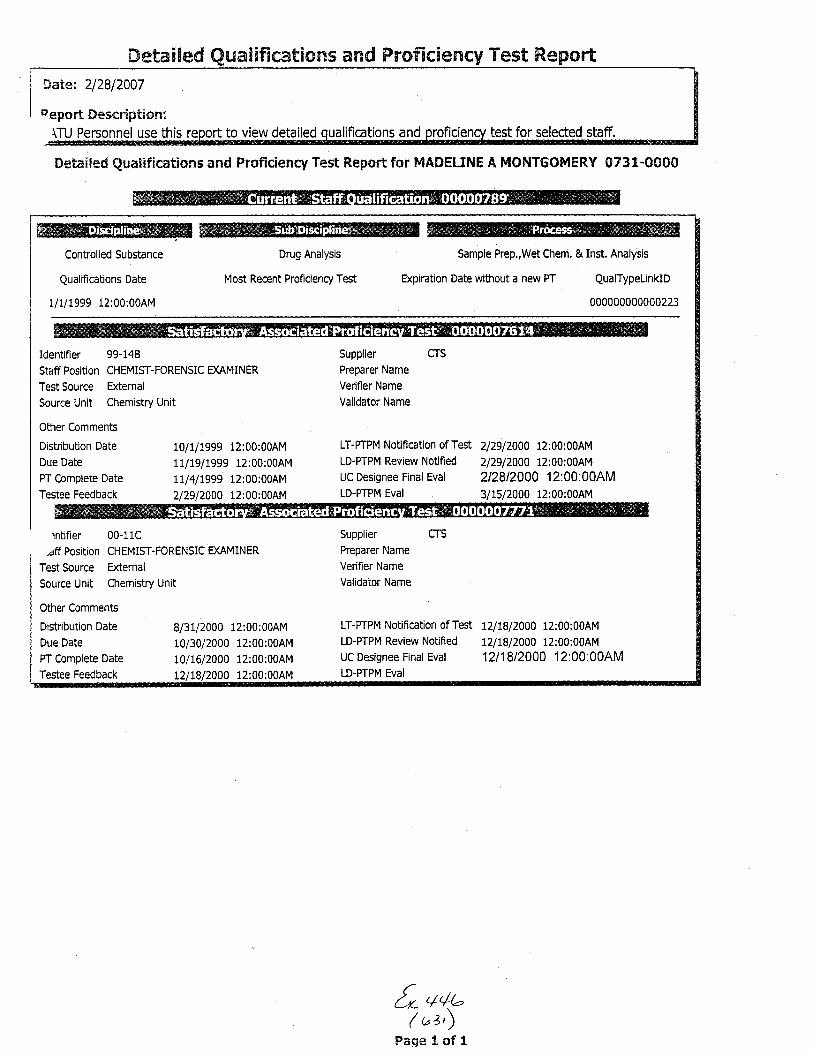
*eta!led QualEflcations and FroficleDatet, 212817007
aeport Description:\TU Personnel use this to view detailed fications and test for selected staff.
Detailed Qualifications and Froficiency Test Report for MADEUNE A MONTGOMERY 0731-0000
W6&Wggffi qrmTff &'t EI i 4rtrFl n rrfr I ir'IEn I I I I t I I I I tJ : g ffi f EFWil
Controlled Substance
QualificaUons Date
IlLlL999 12:00:00AM
Drug Analysis
Most Recent Proficiency Test
Sample Prep.,Wet Chem. & Inst. Analysis
Expiration Date wlthout a new PT QualTypeLinklD
000000000000223
Identifier 99-148
Staff Position CHEMIST-FORENSIC EUMINER
Test Source External
Source Unit Chemistry Unit
Supplier CIS
Preparer Name
Verifier Name
Validator Name
LT-ffPM NoUfi cation of Test
LD-PTPM Review NoUfied
UC Designee Final Eval
LD-PTPM Eval
Other Comments
DistribuUon Date
Due Date
PT Complete Date
Testee Feedback
L0ltl1999 12:00:00AM
tLlL9lt999 12:00:00AM
LLl4lL999 12:00r00AM
212912000 12:00:00AM
212912000 12:00:00AM
2l29l2OOO 12:00:00AM
212812000 12:00:00AM3/15/2000 12:00:00AM
rntifier 00- 11C
-dff Position CHEMIST-FORENSIC EOMINER
Test Source External
Source Unit ChemisW Unit
Supplier CTS
Preparer Name
Verifier Name
Validator Name
LT-P|PM Noufication of Test
LD-PTPM Review NoUfied
UC Designee Final Eval
LD-PTPM EVaI
Other Comments
Distribution Date
Due Date
PT Complete Date
Testee Feedback
813112000
10/30/20oo
10/16/2000
L?/L8t2000
12:00:00AM
12:00:00AM
12:00:00AM
12;00:00AM
L2lLBl2000 12:00:00AM
L211812000 12:00:00AM
1211812000 12:00:00AM
fo u+1-( r"l,;
Page 1 of 1
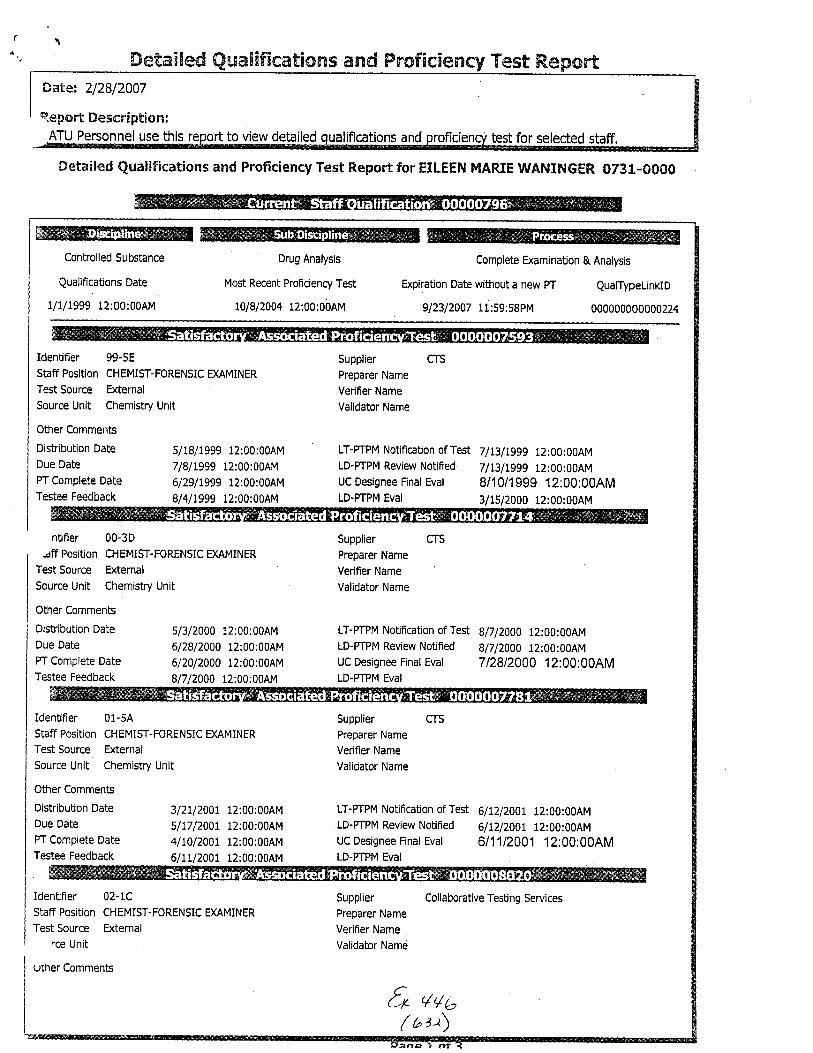
\
sate: 2/2812007
sl.epott Descniption;ATU Personnel use this to view detailed ifications and test for selected stafi.
Setalled ua$*fications amd Froflciency Test Report
Controlled Substance
Qualifications Date
L/t/1999 12:00:00AM
Drug Analysis
Most Recent Proficiency Test
Iol8l2o04 12:00:0bAM
Complete Examination & Analysis
ExpiraUon Date without a new PT QualTypeLinKD
912312007 11:59:58PM 000000000000224
Detailed Qualifications and Proficiency Test Report for EILEEN MARIE WANINGER 0731-00S0
Identifier 99-5E
Staff Position CHEMIST-FORENSIC EXAMINER
Test Source External
Source Unit Chemistry Unit
Supplier CTS
Preparer Name
Verifier Name
Validator Name
LT-PTPM Notification of Test
LD-PTPM Review Notifled
UC Designee Final Eval
LD-PTPM Eval
Other Comments
Distribution Date
Due Date
PT Complete Date
Testee Feedback
5l18/1999 12:00:00AM
7lB/L999 12:00:00AM
61291t999 12:00:00AM
81411999 12:00:00AM
7ll3lt999 12:00:00AM
7/131t999 12:00:00AM
8/10/1999 12:00:00AM31t512000 12:00:00AM
ntifier 00-3D
-aff Position CHEMIST-FORENSIC ryAMINER
Test Source E*ernalSource Unit Chemistry Unit
Supplier CfsPreparer Name
Verifier Name
Validator Name
LT-F|PM NoUfication of Test
LD-PfPM Review NoUfied
UC Designee Final Eval
LD-PTPM Eval
Other Commenb
Distribution Date
Due Date
PT Complete Date
Testee Feedback
51312000 12:00:00AM
6/2812000 12:00:00AM
612012000 12:00:00AM
8/7/2000 12:00:00AM
8/7/2000 12:00:00AM
8/712000 12:00:00AM
712812000 12:00:00AM
Identifier 01-5A
Staff Position CHEMIST-FORENSIC E0MINERTest Source External
Source Unit Chemistry Unit
Supplier CTS
Preparer Name
Verifier Name
Validator Name
LT-PTPM NoUfication of Test
LD-PTPM Review Notified
UC Designee Final Eval
LD-PTPM Eval
Other Comments
Distribution Date
Due Date
PT Complete Date
Testee Feedback
3/2I/2001 12:00:00AM
5/17/200L 12:00:00AM
4lt0l200L 12:00:00AM
6/Lt/200L 12:00:00AM
6lL2l200t 12:00:00AM
6lL2l200L 12:00:00AM
611112001 12:00:00AM
Identifier 02-lCStaff Position CHEMIST-FORENSIC EGMINER
Test Source External
'ce Unit
Supplier Collaborative Testing Services
Preparer Name
Verifier Name
Validator Name
V((,bu)
&uther Comments
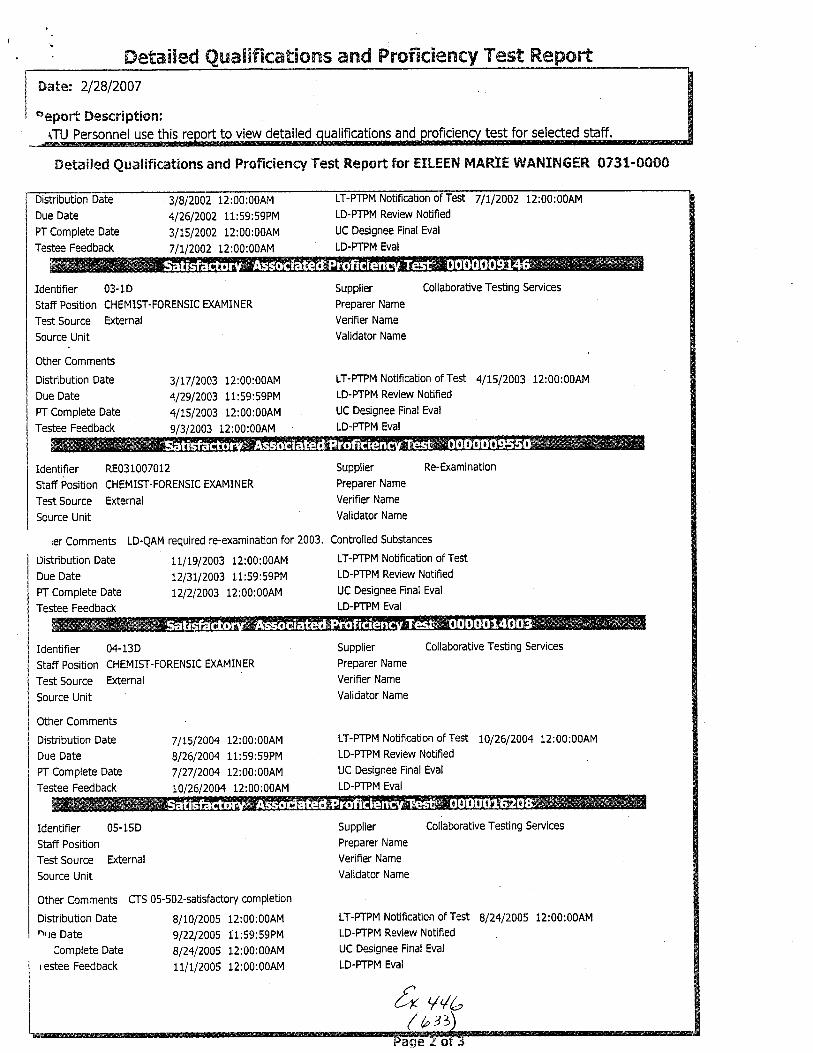
Detailed Qssalificatloffis and Fnoflciemcy Test R.epoft
Sate: 2/2812007
Deport Description;rTU Personnel use this
Distribution Date
Due Date
PT Complete Date
Testee Feedback
31812002 12:00:00AM
412617002 11:59:59PM
31t512002 12:00:00AM
71112002 12:00:00AM
rt to view detailed ualifications and
LT-PTPM Notification esl T | 112002 12:00:00AM
LD-PTPM Review NoUfied
UC Designee Final Eval
LD-PTPM Eval
test for selected staff.
Setailed Qualifications and Proficiency Test Report for EILEEN MARIE WANINGER 0731-00S0
Identifier 03-1D
Staff Position CHEMIST-FORENSIC EXAMINER
Test Source External
Source Unit
Other CommenE
Distribution Date
Due Date
PT Complete Date
Testee Feedback
Supplier Collaborative Testing Services
Preparer Name
Verifier Name
Validator Name
LT-PTPM Notiflcation of Test 41L512003 12;00:00AM
LD-PTPM Review Notified
UC Designee Flnal Eval
LD-PTPM Eval
3lL7lZ003 12:00:00AM
412912003 11:59:59PM
411512003 12:00:00AM
91312003 12:00:00AM
Identifier RE031007012
Staff iosition CHEMIST-FORENSIC EXAMINER
Test Source External
Source Unit
rer Comments LD-QAM required re-examination for 2003.
Distribution Date 1U19/2003 12:00:00AM
Due Date t213112003 11:59:59PM
PT Complete Date 121212003 12:00:00AM
Testee Feedback
Supplier Re-Examination
Preparer Name
Verifier Name
Validator Name
Controlled Substances
LT-PTPM Notification of Test
LD-PTPM Review Notifled
UC Designee Final Eval
LD-PTPM Eval
Identifier 04-13D
Staff PositioN CHEMIST.FORENSIC EXAMINER
Test Source External
Source Unit
Supplier Collaborative Testing Services
Preparer Name
Verifier Name
Validator Name
LT-PTPM Noufication of Test 10/2612004 12:00:00AM
LD-PTPM Review Notifled
UC Designee Final Eval
LD-PTPM Eval
Other Comments
Distribution Date
Due Date
PT Complete Date
Testee Feedback
7/t512004 12:00:00AM
817612004 11:59:59PM
712712004 12:00:00AM
t012612004 12;00:00AM
Identifier 05'15D
Staff Position
Test Source External
Source Unit
Other Comments
Distribution Date
^'re Date
Complete Date
r estee Feedback
CTS 05-502-saUsfactory completion
B/10/2005 12:00:00AM
912212005 11:59:59PM
8/2412005 12:00:00AM
1U1l2005 12:00:00AM
Supplier Collaborative Testing Services
Preparer Name
Verifier Name
Validator Name
LT-ffPM Notification of TesI 812412005 12:00:00AM
LD-P-[PM Review Notified
UC Designee Final Eval
LD-PTPM Eval
f* vq( uzt
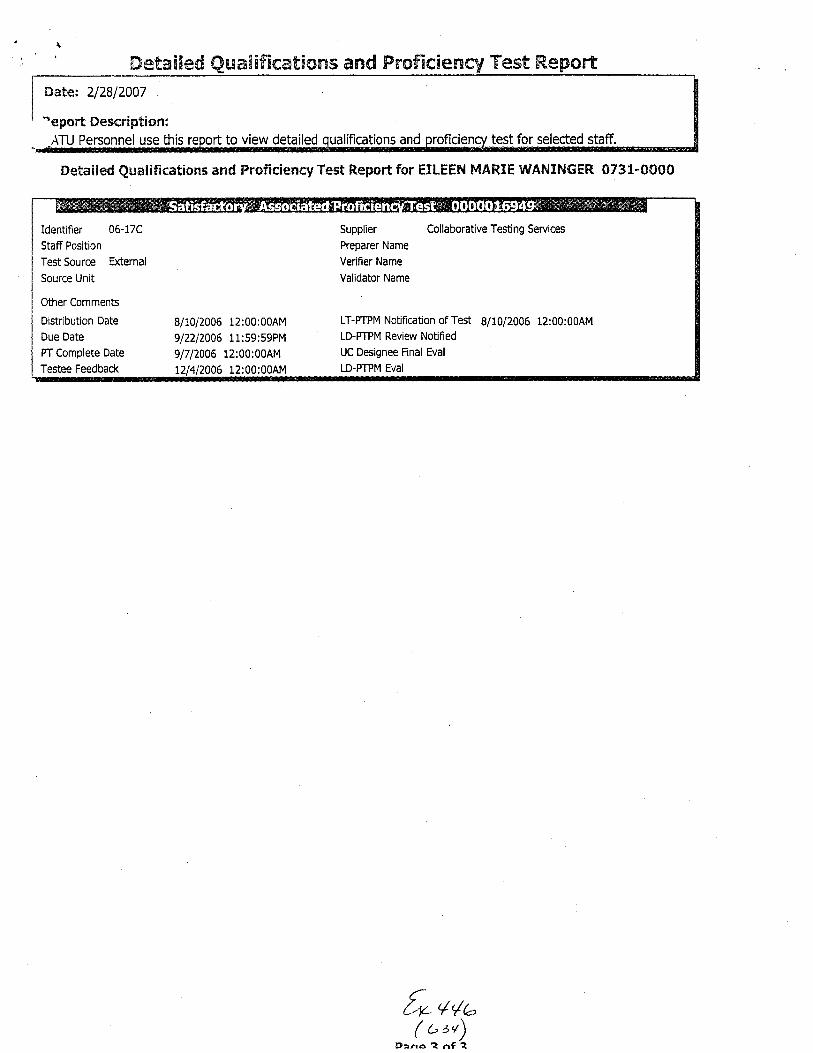
SstaiBed Suse$lflcatiosls amd Fnoficie Yest Repoffisate: 2/2812007
-epo* Description:ATU Personnel use this to view detailed test for selected staff.
Detailed Qualifications and Prcflciency Test R.epcrt for EILEEN MAruE WAHINSER 0731-0000
Identifier 06-17C Supplier CollaboraUve Testing Services
Staff Position Preparer Name
Test Source External Verifier Name
Source Unit Validator Name
Other Comments
Distribution Date 8ln?006 12:00:00AM LT-PTPM Noufication of Test 8/10/2006 12:00:00AM
Due Date 912212006 11:59:59PM LD-FrPM Review Noufled
rr complete Date 91712006 12:00:00AM UC Designee Final Eval
Testee Feedback 121412006 12:00:00AM LD-PTPM Eval
ftq%( r, sv)
Drno ? nf ?
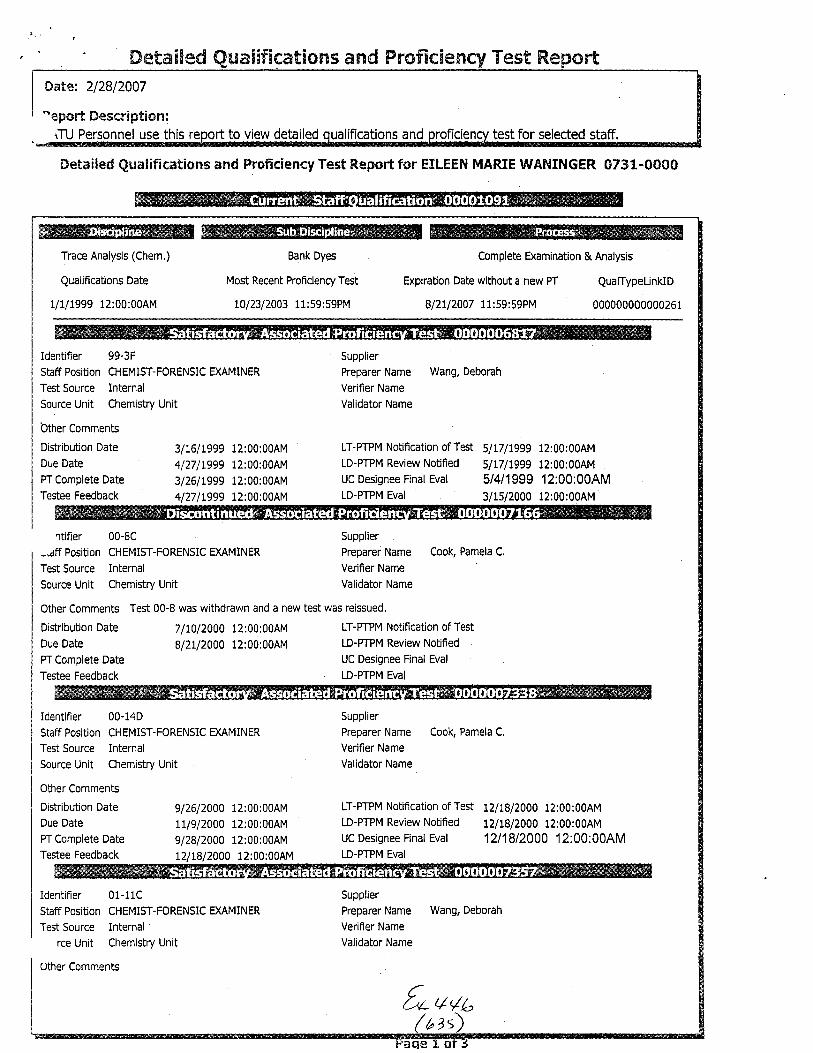
ffietaiEed q.sallfications amd Freficle Test R
Dat"et 212812007
-eport *escription;rTU Personnel use this rt to view detailed ualifications and test for selected staff.
Setailed Qualifications and Proficiency Test Report for EILEEI{ MARIE WANINGER 0731-00S0
WWffW4Tr-{TnW-'{f; liqelrFlnrrfr i{T:rIGKrlrlf lll{tliF&mffi W&ffi @F
Trace Analysis (Chem.)
Qualifications Date
LlLlL999 12:00:00AM
Bank Dyes
Most Recent Proficiency Test
L012312003 11:59:59PM
Complete Examination & Analysis
Expiration Date without a new PT Quafl'ypeLinklD
812L12007 11;59:59PM 000000000000261
Identifier 99-3F
Staff Position CHEMIST-FORENSIC EXAMINER
Test Source Internal
Source Unit Chemistry Unit
Supplier
Preparer Name Wang, Deborah
Verifier Name
Validator Name
LT-FrPM Noufication of :]5I 5lL7lL999 12:00:00AM
LD-PTPM Review Notified SlL7lL999 12:00:00AM
UC Designee Final Eval 51411999 12:00:00AMLD-PTPM Eval 3/1s/2000 12:00:00AM
Supplier
Preparer Name Cook, Pamela C.
Verifier Name
Validator Name
Ofier Commenb Test 00-B was withdrawn and a new test was reissued.
LT-PTPM Notification of Test
LD-PTPM Review Notified
UC Designee Final Eval
LD-PTPM Eval
Supplier
Preparer Name Cook, Pamela C.
Verifier Name
Validator Name
LT-FrPM Notification of Test 12118/2000 r2:00:00AMLD-PTPM Review NoUfled !2/1812000 12:00:00AM
UC Desisnee FinalEval 1211812000 12:00:00AMLD-PTPM Eval
Supplier
Preparer Name Wang, Deborah
Verifier Name
Validator Name
fo uvt
rtifier 00-8C
-.aff Position CHEMIST-FORENSIC E$MINER
Test Source internal
Source Unit Chemistry Unit
bther Comments
DistribuUon Date
Due Date
PT Complete Date
Testee Feedback
Distribution Date
Due Date
PT Complete Date
Testee Feedback
Other Comments
Distribution Date
Due Date
PT Complete Date
Testee Feedback
3/t61L999 12:00:00AM
41271t999 12:00:00AM
3/261L999 12:00:00AM
41271L999 l2:00:00AM
711012000 12:00:00AM
Bl2Il2O00 12:00:00AM
9/2612000 12:00:00AM
Ltl9l2000 12:00:00AM
912812000 12:00:00AM
LZlt9l2000 12:00:00AM
Identifier 00-14D
Staff Position CHEMIST-FORENSIC E$MINER
Test Source Internal
Source Unit Chemistry Unit
Identifier 01-11C
Staff Position CHEN4IST-FORENSIC EXAMINER
Test Source Intemal
rce Unit Chemistry Unit
Other Comments
b3s
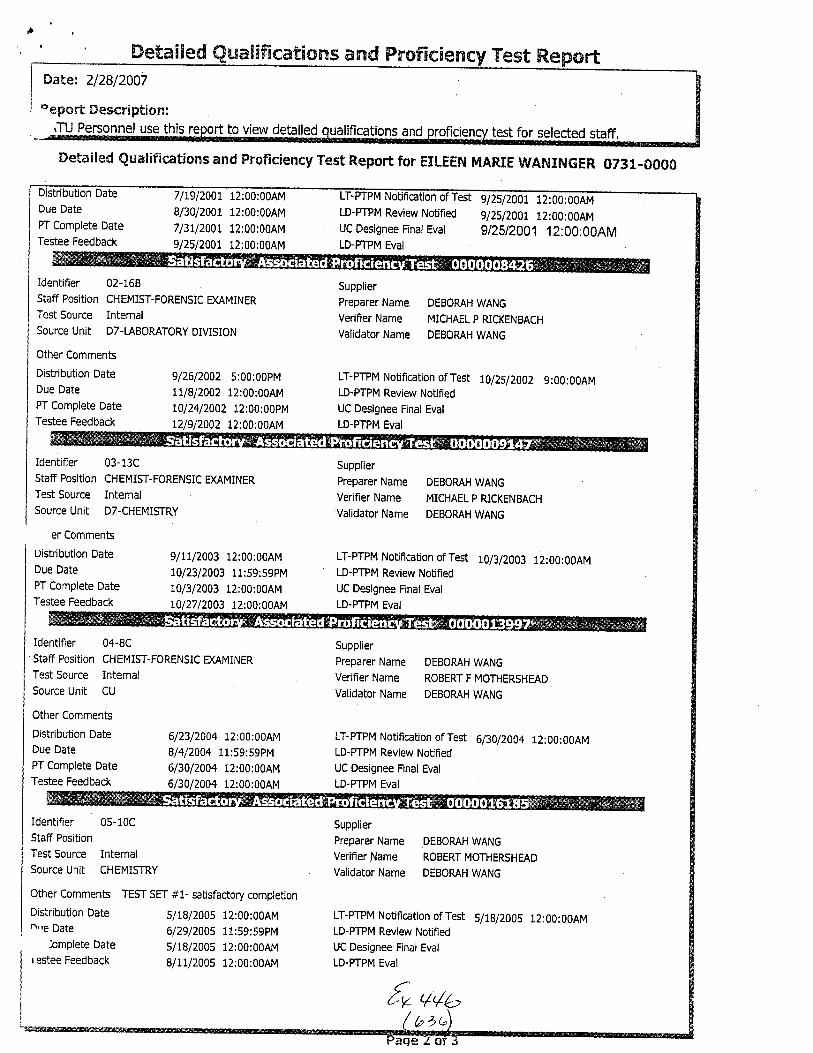
Setai[ed X$ficatias, s and Pogftgtency Test Report&ate: Zl2el2007
ceport Description:rTU Personnel use this
bution Date
Due Date
PT Complete Date
Testee Feedback
to view detailed
71L912001. 12:00:00AM
8/3012007 12:00:00AM
7/3112001 12:00:00AM
91251200t 12;00:00AM
LD-PTPM Review NoUfied
UC Designee Final Eval
LD-PTPM Eval
test for selected staff,
912512001 12:00:00AM
91251200t 12:00:00AM
912512001 12:00:00AM
Detailed Qualificaticns and Proficiency Test Report for EILEEN MARIE WANINGER 0731-0000
Identifier 02-168
Staff Position CHEMIST-FORENSIC EGMINERTest Source Intemal
Source Unit D7-LABORATORY DIVISION
Supplier
Preparer Name DEBOMH WANG
Verifier Name MICHAEL P RICKENBACH
Validator Name DEBOMH WANG
LT-PrPM Noufication ofTest 10/2512002 9:00:00AMLD-ffPM Review NoUfied
UC Designee Final Eval
LD-PTPM Eval
Other Comments
DistribuUon Date
Due Date
PT Complete Date
Iestee Feedback
9/2612002 5:00:00PM
ttl8l2002 12:00:00AM
L0/24/2002 12:00;00PM
t2l9/2002 12:00:00AM
Identifler 03-13C
Staff Position CHEMIST-FORENSIC EGMINERTest Source Internal
SourceUnit D7-CHEMISTRY
Supplier
Preparer Name DEBOMH WANG
Verifier Name MICHAEL p RICKENBACH
Validator Name DEBOMH WANG
LT-PTPM NotlficaUon of Test 10/3/2003 12:00:00AMLD-PTPM Review NoUfied
UC Designee Final Eval
LD-PTPM Eval
er Comments
Distribution Date
Due Date
PT Complete Date
Testee Feedback
9lLLl2003 12:00:00AM
LO/2312003 11:59:59PM
101312003 12:00:00AM
L0/2712003 12:00:00AM
Identifter 04-BC
Staff Position CHEMIST-FORENSIC EOMINER
Test Source Intemal
Source Unit CU
Supplier
Preparer Name DEBOMH WANG
Verifier Name ROBERT F MOTHERSHEAD
Validator Name DEBOMH WANG
LT-PTPM Notjfication of TesI 6n012004 12:00:00AMLD-PTPM Review Notified
UC Designee Final Eval
LD-PTPM Eval
Other Comments
Distribution Date
Due Date
PT Complete Date
Testee Feedback
6/23/2004 12:00:00AM
8/412004 11:59:59PM
613012004 12:00:00AM
6/30/2004 12:00:00AM
Identifier 05-10C
Staff Position
Test Source Internal
Source Unit CHEMISTRY
Other Comments
Distribution Daten're Date
:omplete Date
r estee Feedback
TEST SET #1- satisfactory compleuon
5/18/2005 12:00:00AM
6129/2005 11:59;59PM
5/1812005 12:00:00AM
8lLLl2005 12:00:00AM
Supplier
Preparer Name DEBOMH WANG
VerifierName ROBERTMOTHERSHEAD
Validator Name DEBORAH WANG
LT-PTPM Noufication of Test 5/19/2005 12:00:00AMLD-PTPM Review Notified
UC Designee Final Eval
LD-PTPM Eval
&,/,1,b)t

Setalled Qura$$ficatiosls and Froficiency Test Reportsate: 2/2812007
oeport Sescription:.\TU Personnel use this to view detailed test for selected staff.
Detailed Qualifications and Proficiency Test Report for EILEEN MARIE WANINGER 0731-0000
Identifier 06-258 Supplier
Staff Position Preparer Name Pamela Reynolds
Test Source Internal Verifier Name Eileen Waninger
Source Unit Chemistry Validator Name Jason Brewer
Other Comments
Distribution Date 5/18/2006 12:00:00AM LT-PTPM Nouflcation ofTest 5/2612006 12:00:00AMDue Date 613012006 11:59:59PM LD-PTPM Review Noufied
PT Compfete Date 512612006 12:00100AM UC Designee Final Eval
Testee Feedback 6lL'lz006 12:00:00AM LD-FTPM Eval
4(6(aslPase 3 of3
Related Documents


