Journal of Applied Ecology 2005 42, 659–671 © 2005 British Ecological Society Blackwell Publishing, Ltd. Trends in the use of private gardens by wild birds in Great Britain 1995 –2002 ANDREW R. CANNON,* DAN E. CHAMBERLAIN,† MIKE P. TOMS,† BEN J. HATCHWELL* and KEVIN J. GASTON* *Department of Animal and Plant Sciences, University of Sheffield, Sheffield S10 2TN, UK; and †British Trust for Ornithology, The Nunnery, Thetford IP24 2PU, UK Summary 1. Wild birds are commonly observed in private residential gardens in Great Britain. However, little is known about how their use of this significant and increasingly important habitat is changing and how such changes relate to their population status. 2. Trends in the use of private residential gardens by wild birds in Great Britain were investigated using weekly bird records from 18 300 gardens over 8 years. 3. We showed that the use of this habitat is seasonal and cyclic, with the timing and regularity of its periodicity variable between species. 4. We evaluated the significance of the underlying trends in the cyclic reporting rates. Eighteen species showed clear trends, the three with the most negative year term parameter estimates being ‘red-listed’ as high conservation concern. 5. Examining correlations with national scale survey data suggested that garden reporting rates are related to general population trends in a number of species, including several of conservation importance. Other species exhibit important differences between national and garden trends. 6. Synthesis and applications. Our analysis demonstrates ecologically meaningful trends and provides novel insights into seasonal cycles of habitat exploitation, using relatively simple and cost-effectively collected data. This will lead to greater understanding of the relationships between gardens and general bird populations and of the times of year at which garden habitats are most important for birds. We have demonstrated the practi- cality and productivity of ‘citizen science’ in this context, and provided new information on the status of some birds of conservation concern. Key-words: monitoring, periodic logistic regression, population trends, reporting rates, urban greenspace Journal of Applied Ecology (2005) 42, 659–671 doi: 10.1111/j.1365-2664.2005.01050.x Introduction In Great Britain private gardens contribute a signifi- cant proportion of the total habitat available to birds, garden ownership being a traditional and widely held aspiration. Owen (1991) estimated the total area of gardens in England and Wales as 485 000 ha or 3% of the total land area. Based on a net annual increase in residential land use of 5000 ha year −1 in England (ODPM 2003), and assuming around one-third of such development is garden, gardens may cover as much as 500 000 ha of England and Wales today. This compares well with the approximately 120 000 ha of national and local nature reserves in England (English Nature 2004) and 115 000 ha of Royal Society for the Protection of Birds (RSPB) reserves in the UK (RSPB 2002). Human residential habitats in which gardens are the primary resource support a significant proportion of the national populations of a number of wild bird spe- cies (Gregory & Baillie 1998), perhaps more important than previously suspected (Bland, Tully & Greenwood 2004), and appear to be refuges for some declining spe- cies, such as the song thrush Turdus philomelos CL Brehm (Mason 2000; Peach et al . 2004). Although most typical gardens support only a reduced avifauna as a result of a variety of factors, including high levels of disturbance and predation, lack of nesting cover and Correspondence: Andrew Cannon, Biodiversity and Macr- oecology Group, Department of Animal and Plant Sciences, University of Sheffield, Sheffield S10 2TN, UK (e-mail [email protected]).

Welcome message from author
This document is posted to help you gain knowledge. Please leave a comment to let me know what you think about it! Share it to your friends and learn new things together.
Transcript
Journal of Applied Ecology
2005
42
, 659–671
© 2005 British Ecological Society
Blackwell Publishing, Ltd.
Trends in the use of private gardens by wild birds in Great Britain 1995–2002
ANDREW R. CANNON,* DAN E. CHAMBERLAIN,† MIKE P. TOMS,† BEN J. HATCHWELL* and KEVIN J. GASTON*
*
Department of Animal and Plant Sciences, University of Sheffield, Sheffield S10 2TN, UK; and
†
British Trust for Ornithology, The Nunnery, Thetford IP24 2PU, UK
Summary
1.
Wild birds are commonly observed in private residential gardens in Great Britain.However, little is known about how their use of this significant and increasingly importanthabitat is changing and how such changes relate to their population status.
2.
Trends in the use of private residential gardens by wild birds in Great Britain wereinvestigated using weekly bird records from 18 300 gardens over 8 years.
3.
We showed that the use of this habitat is seasonal and cyclic, with the timing andregularity of its periodicity variable between species.
4.
We evaluated the significance of the underlying trends in the cyclic reporting rates.Eighteen species showed clear trends, the three with the most negative year term parameterestimates being ‘red-listed’ as high conservation concern.
5.
Examining correlations with national scale survey data suggested that gardenreporting rates are related to general population trends in a number of species, includingseveral of conservation importance. Other species exhibit important differences betweennational and garden trends.
6.
Synthesis and applications.
Our analysis demonstrates ecologically meaningful trendsand provides novel insights into seasonal cycles of habitat exploitation, using relativelysimple and cost-effectively collected data. This will lead to greater understanding of therelationships between gardens and general bird populations and of the times of year atwhich garden habitats are most important for birds. We have demonstrated the practi-cality and productivity of ‘citizen science’ in this context, and provided new informationon the status of some birds of conservation concern.
Key-words
: monitoring, periodic logistic regression, population trends, reporting rates,urban greenspace
Journal of Applied Ecology
(2005)
42
, 659–671doi: 10.1111/j.1365-2664.2005.01050.x
Introduction
In Great Britain private gardens contribute a signifi-cant proportion of the total habitat available to birds,garden ownership being a traditional and widely heldaspiration. Owen (1991) estimated the total area ofgardens in England and Wales as 485 000 ha or 3% ofthe total land area. Based on a net annual increase inresidential land use of 5000 ha year
−
1
in England(ODPM 2003), and assuming around one-third of suchdevelopment is garden, gardens may cover as much as
500 000 ha of England and Wales today. This compareswell with the approximately 120 000 ha of national andlocal nature reserves in England (English Nature 2004)and 115 000 ha of Royal Society for the Protection ofBirds (RSPB) reserves in the UK (RSPB 2002).Human residential habitats in which gardens are theprimary resource support a significant proportion ofthe national populations of a number of wild bird spe-cies (Gregory & Baillie 1998), perhaps more importantthan previously suspected (Bland, Tully & Greenwood2004), and appear to be refuges for some declining spe-cies, such as the song thrush
Turdus philomelos
CLBrehm (Mason 2000; Peach
et al
. 2004). Although mosttypical gardens support only a reduced avifauna as aresult of a variety of factors, including high levels ofdisturbance and predation, lack of nesting cover and
Correspondence: Andrew Cannon, Biodiversity and Macr-oecology Group, Department of Animal and Plant Sciences,University of Sheffield, Sheffield S10 2TN, UK ([email protected]).
660
A. R. Cannon
et al.
© 2005 British Ecological Society,
Journal of Applied Ecology
,
42
, 659–671
predominantly alien plant species, some garden birdspecies are effectively subsidized in this habitat by arti-ficial feeding and provision of nest boxes (Cannon 1999;Beebee 2001). Despite the recent upsurge in urbanornithological activity (Marzluff, Bowman & Donnelly2001), most research has remained focused on largergreen spaces, such as parks, and gradient studies. How-ever, in many cities the overall area of private gardensmay be very extensive; for example, gardens cover anestimated 23% of Sheffield, England (Gaston
et al
.2005) and an estimated 27% of Leicester, England(Jeffcote 1993). Questionnaire data suggest thatSheffield’s private gardens contain 25 000 ponds, 350 000trees and 45 000 bird nest boxes (Gaston
et al
. 2005), avery significant habitat resource.
Gardens are amenable to detailed year-round moni-toring by volunteers; this represents an obvious oppor-tunity to increase public engagement in bird conservationand obtain data on a population that is otherwise inad-equately monitored despite its potential conservationimportance. Volunteer garden bird surveys have beenattempted in a number of countries (Cannon 1999). Since1970, in the UK, around 250 volunteers have recordedexact numbers of birds using feeding stations over thewinter period for the British Trust for Ornithology (BTO)Garden Bird Feeding Survey (Toms 2003; Chamberlain
et al
. 2005), which offers a unique, long time series offeeder-use data, but it is limited by small scale andissues with modelling the free-format data. At the otherextreme of scale, Project FeederWatch collects data fromthousands of volunteers across North America, demon-strating continental-scale movements as well as trends(Wells
et al
. 1998), but unfortunately only in the winterhalf of the year. The Canberra bird survey (Veerman2002) exemplifies the very comprehensive data availablefrom smaller geographical scales, but resources generallylimit this intensive approach to localized survey areas.We believe that the BTO/CJ Wildbird Foods Ltd Gar-den BirdWatch (GBW) in the UK is presently the onlygarden bird survey collecting systematic weekly datafrom thousands of sites at a national scale and through-out the year (Cannon 2000; Toms 2003). In this study,we used the first 8 years of data from GBW to deter-mine seasonal patterns of garden usage and their vari-ation between species, and the occurrence or otherwiseof interannual directional trends and other temporalvariations. By comparing GBW reporting rates withnational population indices, we investigated the extent towhich changes in garden usage by bird species reflect ordiffer from patterns in overall population levels, and con-sider the implications for species of conservation concern.
Methods
:
/
GBW is an open-access project funded by volunteers’subscriptions; participation has grown from around
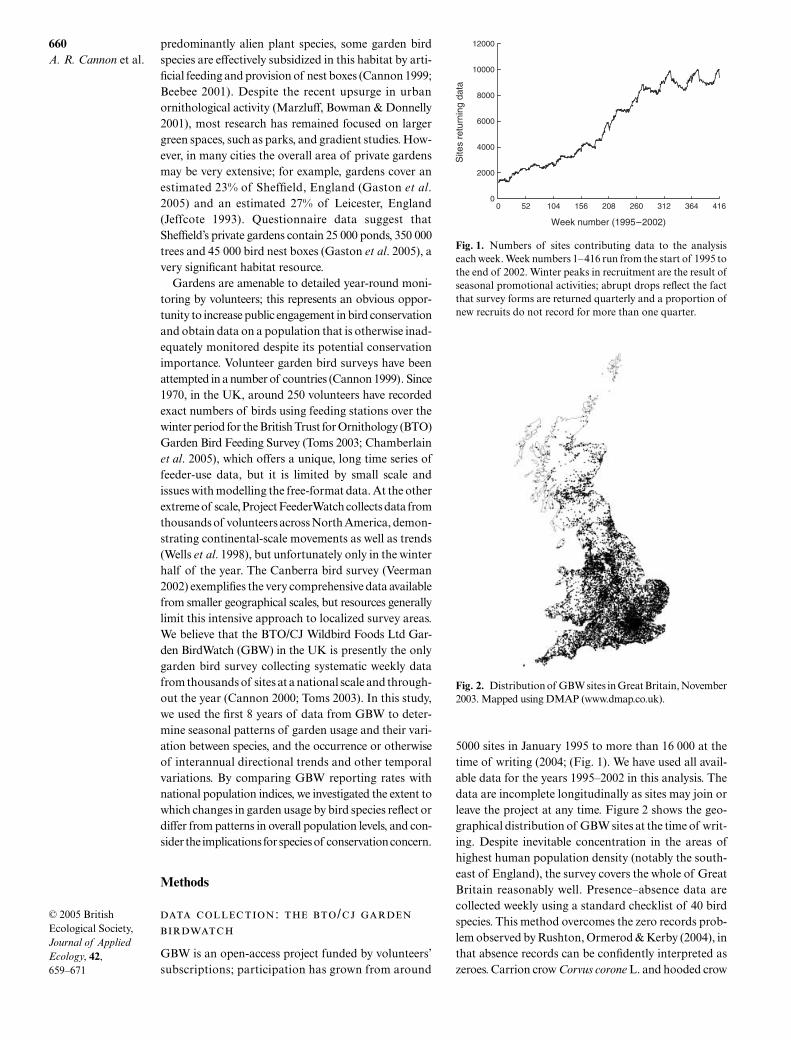
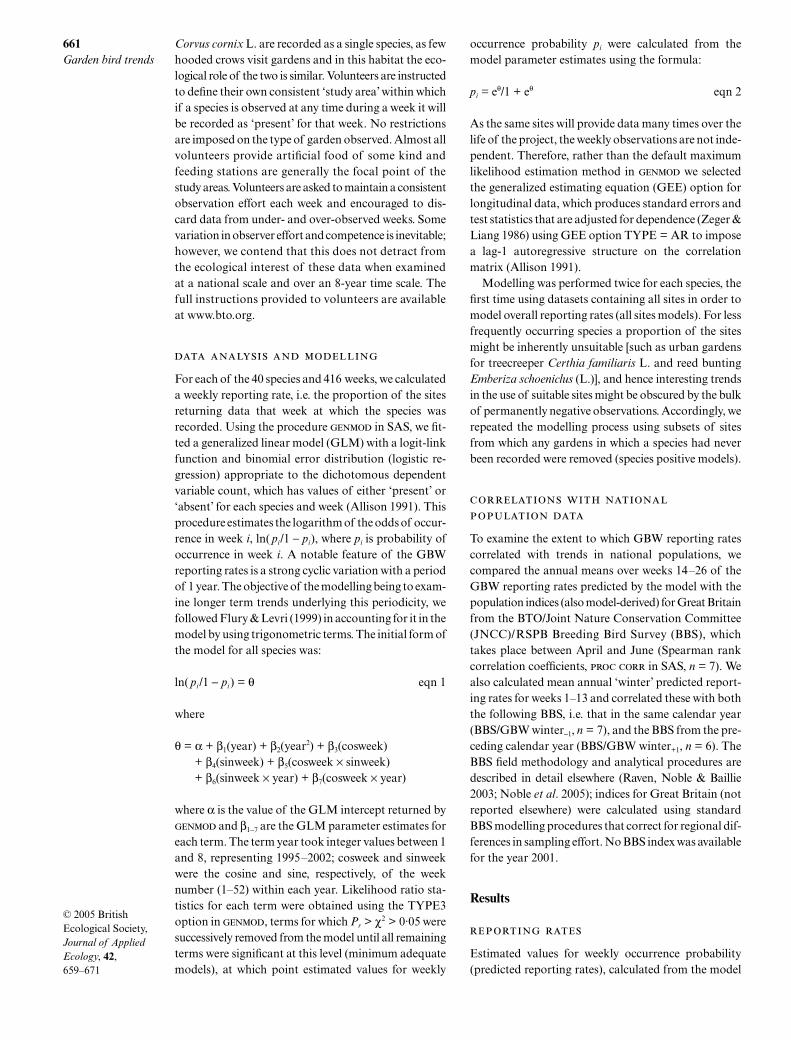
5000 sites in January 1995 to more than 16 000 at thetime of writing (2004; (Fig. 1). We have used all avail-able data for the years 1995–2002 in this analysis. Thedata are incomplete longitudinally as sites may join orleave the project at any time. Figure 2 shows the geo-graphical distribution of GBW sites at the time of writ-ing. Despite inevitable concentration in the areas ofhighest human population density (notably the south-east of England), the survey covers the whole of GreatBritain reasonably well. Presence–absence data arecollected weekly using a standard checklist of 40 birdspecies. This method overcomes the zero records prob-lem observed by Rushton, Ormerod & Kerby (2004), inthat absence records can be confidently interpreted aszeroes. Carrion crow
Corvus corone
L. and hooded crow
Fig. 1. Numbers of sites contributing data to the analysiseach week. Week numbers 1–416 run from the start of 1995 tothe end of 2002. Winter peaks in recruitment are the result ofseasonal promotional activities; abrupt drops reflect the factthat survey forms are returned quarterly and a proportion ofnew recruits do not record for more than one quarter.
Fig. 2. Distribution of GBW sites in Great Britain, November2003. Mapped using DMAP (www.dmap.co.uk).
661
Garden bird trends
© 2005 British Ecological Society,
Journal of Applied Ecology
,
42
, 659–671
Corvus cornix
L. are recorded as a single species, as fewhooded crows visit gardens and in this habitat the eco-logical role of the two is similar. Volunteers are instructedto define their own consistent ‘study area’ within whichif a species is observed at any time during a week it willbe recorded as ‘present’ for that week. No restrictionsare imposed on the type of garden observed. Almost allvolunteers provide artificial food of some kind andfeeding stations are generally the focal point of thestudy areas. Volunteers are asked to maintain a consistentobservation effort each week and encouraged to dis-card data from under- and over-observed weeks. Somevariation in observer effort and competence is inevitable;however, we contend that this does not detract fromthe ecological interest of these data when examinedat a national scale and over an 8-year time scale. Thefull instructions provided to volunteers are availableat www.bto.org.
For each of the 40 species and 416 weeks, we calculateda weekly reporting rate, i.e. the proportion of the sitesreturning data that week at which the species wasrecorded. Using the procedure
in SAS, we fit-ted a generalized linear model (GLM) with a logit-linkfunction and binomial error distribution (logistic re-gression) appropriate to the dichotomous dependentvariable count, which has values of either ‘present’ or‘absent’ for each species and week (Allison 1991). Thisprocedure estimates the logarithm of the odds of occur-rence in week
i
, ln(
p
i
/1
−
p
i
), where
p
i
is probability ofoccurrence in week
i
. A notable feature of the GBWreporting rates is a strong cyclic variation with a periodof 1 year. The objective of the modelling being to exam-ine longer term trends underlying this periodicity, wefollowed Flury & Levri (1999) in accounting for it in themodel by using trigonometric terms. The initial form ofthe model for all species was:
ln(
p
i
/1
−
p
i
) =
θ
eqn 1
where
θ
=
α
+
β
1
(year) +
β
2
(year
2
) +
β
3
(cosweek) +
β
4
(sinweek) +
β
5
(cosweek
×
sinweek) +
β
6
(sinweek
×
year) +
β
7
(cosweek
×
year)
where
α
is the value of the GLM intercept returned by
and
β
1
−
7
are the GLM parameter estimates foreach term. The term year took integer values between 1and 8, representing 1995–2002; cosweek and sinweekwere the cosine and sine, respectively, of the weeknumber (1–52) within each year. Likelihood ratio sta-tistics for each term were obtained using the TYPE3option in
, terms for which
P
r
>
χ
2
>
0·05 weresuccessively removed from the model until all remainingterms were significant at this level (minimum adequatemodels), at which point estimated values for weekly
occurrence probability
p
i
were calculated from themodel parameter estimates using the formula:
p
i
=
e
θ
/1 + e
θ
eqn 2
As the same sites will provide data many times over thelife of the project, the weekly observations are not inde-pendent. Therefore, rather than the default maximumlikelihood estimation method in
we selectedthe generalized estimating equation (GEE) option forlongitudinal data, which produces standard errors andtest statistics that are adjusted for dependence (Zeger &Liang 1986) using GEE option TYPE = AR to imposea lag-1 autoregressive structure on the correlationmatrix (Allison 1991).
Modelling was performed twice for each species, thefirst time using datasets containing all sites in order tomodel overall reporting rates (all sites models). For lessfrequently occurring species a proportion of the sitesmight be inherently unsuitable [such as urban gardensfor treecreeper
Certhia familiaris
L. and reed bunting
Emberiza schoeniclus
(L.)], and hence interesting trendsin the use of suitable sites might be obscured by the bulkof permanently negative observations. Accordingly, werepeated the modelling process using subsets of sitesfrom which any gardens in which a species had neverbeen recorded were removed (species positive models).
To examine the extent to which GBW reporting ratescorrelated with trends in national populations, wecompared the annual means over weeks 14–26 of theGBW reporting rates predicted by the model with thepopulation indices (also model-derived) for Great Britainfrom the BTO/Joint Nature Conservation Committee(JNCC)/RSPB Breeding Bird Survey (BBS), whichtakes place between April and June (Spearman rankcorrelation coefficients,
in SAS,
n
= 7). Wealso calculated mean annual ‘winter’ predicted report-ing rates for weeks 1–13 and correlated these with boththe following BBS, i.e. that in the same calendar year(BBS/GBW winter
−
1
,
n
= 7), and the BBS from the pre-ceding calendar year (BBS/GBW winter
+1
,
n
= 6). TheBBS field methodology and analytical procedures aredescribed in detail elsewhere (Raven, Noble & Baillie2003; Noble
et al
. 2005); indices for Great Britain (notreported elsewhere) were calculated using standardBBS modelling procedures that correct for regional dif-ferences in sampling effort. No BBS index was availablefor the year 2001.
Results
Estimated values for weekly occurrence probability(predicted reporting rates), calculated from the model
662
A. R. Cannon
et al.
© 2005 British Ecological Society,
Journal of Applied Ecology
,
42
, 659–671
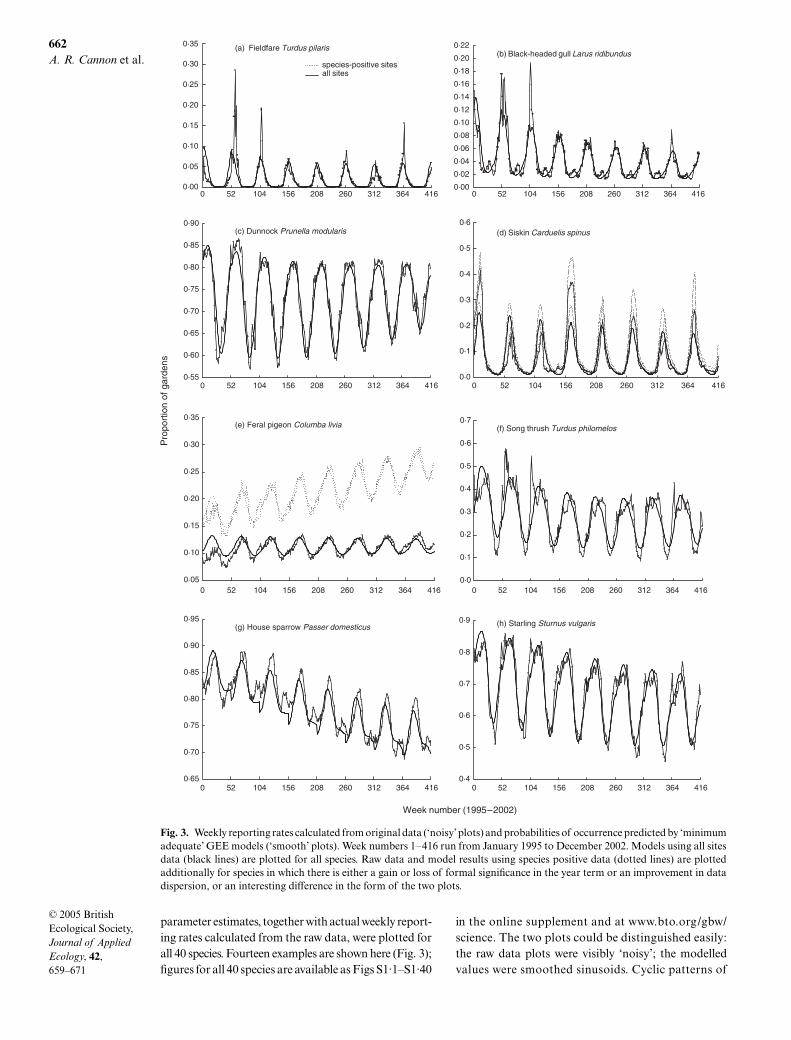
parameter estimates, together with actual weekly report-ing rates calculated from the raw data, were plotted forall 40 species. Fourteen examples are shown here (Fig. 3);figures for all 40 species are available as Figs S1·1–S1·40
in the online supplement and at www.bto.org/gbw/science. The two plots could be distinguished easily:the raw data plots were visibly ‘noisy’; the modelledvalues were smoothed sinusoids. Cyclic patterns of
Fig. 3. Weekly reporting rates calculated from original data (‘noisy’ plots) and probabilities of occurrence predicted by ‘minimumadequate’ GEE models (‘smooth’ plots). Week numbers 1–416 run from January 1995 to December 2002. Models using all sitesdata (black lines) are plotted for all species. Raw data and model results using species positive data (dotted lines) are plottedadditionally for species in which there is either a gain or loss of formal significance in the year term or an improvement in datadispersion, or an interesting difference in the form of the two plots.
663
Garden bird trends
© 2005 British Ecological Society,
Journal of Applied Ecology
,
42
, 659–671
seasonal habitat use were visible for almost all species,the primary cause of which was likely to be variation inexploitation of garden food supplies. Detailed exam-ination of these cycles was beyond the scope of thepresent study, but other causal factors (varying in rel-ative importance between species) probably includedthe effects of moult on bird visibility, preferential use ofsome types of artificial food by juveniles and the extentto which gardens were used as breeding, rather thanmerely feeding, habitat. Non-breeding winter visitorswere clearly differentiated from residents, migrants[fieldfare
Turdus pilaris
L. (Fig. 3a), redwing
Turdusiliacus
L. and brambling
Fringilla montifringilla
L.]having reporting rates of zero in the summer monthsand species using gardens almost exclusively for winterfood (black-headed gull
Larus ridibundus
L.; Fig. 3b)having very low summer reporting rates.
Several species showed progressive temporal reduc-tion in the amplitude of their periodic seasonal cycles,notably dunnock
Prunella modularis
L. (Fig. 3c), robin
Erithacus rubecula
L., blue tit
Parus caeruleus
L., greattit
Parus major
L., greenfinch
Carduelis chloris
(L.) andperhaps starling
Sturnus vulgaris
L. and chaffinch
Fringilla coelebs
L. General population increases lead-ing to increased garden residency were a possible expla-nation, as was a general increase in year-round provisionof artificial food (Cannon 2000). Reporting rates forwinter visitors, including siskin
Carduelis spinus
(L.)(Fig. 3d), which increasingly breeds in Great Britain,were irregular from year to year, as would be expected,but notable irregularity was also present in the datafor pied wagtail
Motacilla alba
L., wren
Troglodytestroglodytes
(L.) and goldcrest
Regulus regulus
(L.),insectivorous species whose garden use is strongly
Fig. 3. Continued
664
A. R. Cannon
et al.
© 2005 British Ecological Society,
Journal of Applied Ecology
,
42
, 659–671
weather-dependent, and for jay
Garrulus glandarius
(L.), nuthatch
Sitta europaea
L. and bullfinch
Pyrrhulapyrrhula
(L.), species for which most gardens are prob-ably ‘emergency’ habitat, there were a low reportingrates.
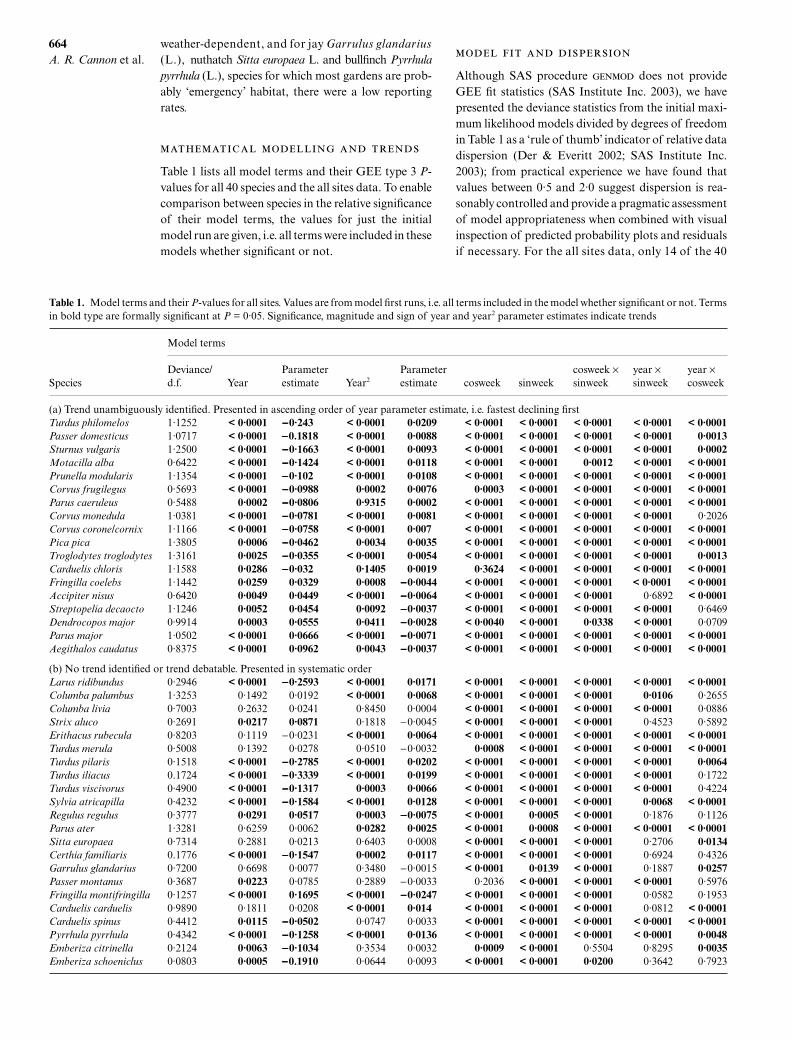
Table 1 lists all model terms and their GEE type 3
P
-values for all 40 species and the all sites data. To enablecomparison between species in the relative significanceof their model terms, the values for just the initialmodel run are given, i.e. all terms were included in thesemodels whether significant or not.
Although SAS procedure
does not provideGEE fit statistics (SAS Institute Inc. 2003), we havepresented the deviance statistics from the initial maxi-mum likelihood models divided by degrees of freedomin Table 1 as a ‘rule of thumb’ indicator of relative datadispersion (Der & Everitt 2002; SAS Institute Inc.2003); from practical experience we have found thatvalues between 0·5 and 2·0 suggest dispersion is rea-sonably controlled and provide a pragmatic assessmentof model appropriateness when combined with visualinspection of predicted probability plots and residualsif necessary. For the all sites data, only 14 of the 40
Table 1. Model terms and their P-values for all sites. Values are from model first runs, i.e. all terms included in the model whether significant or not. Termsin bold type are formally significant at P = 0·05. Significance, magnitude and sign of year and year2 parameter estimates indicate trends
Species
Model terms
Deviance/d.f. Year
Parameter estimate Year2
Parameter estimate cosweek sinweek
cosweek ×sinweek
year ×sinweek
year × cosweek
(a) Trend unambiguously identified. Presented in ascending order of year parameter estimate, i.e. fastest declining firstTurdus philomelos 1·1252 < 0·0001 −−−−0·243 < 0·0001 0·0209 < 0·0001 < 0·0001 < 0·0001 < 0·0001 < 0·0001Passer domesticus 1·0717 < 0·0001 −−−−0.1818 < 0·0001 0·0088 < 0·0001 < 0·0001 < 0·0001 < 0·0001 0·0013Sturnus vulgaris 1·2500 < 0·0001 −−−−0·1663 < 0·0001 0·0093 < 0·0001 < 0·0001 < 0·0001 < 0·0001 0·0002Motacilla alba 0·6422 < 0·0001 −−−−0·1424 < 0·0001 0·0118 < 0·0001 < 0·0001 0·0012 < 0·0001 < 0·0001Prunella modularis 1·1354 < 0·0001 −−−−0·102 < 0·0001 0·0108 < 0·0001 < 0·0001 < 0·0001 < 0·0001 < 0·0001Corvus frugilegus 0·5693 < 0·0001 −−−−0·0988 0·0002 0·0076 0·0003 < 0·0001 < 0·0001 < 0·0001 < 0·0001Parus caeruleus 0·5488 0·0002 −−−−0·0806 0·9315 0·0002 < 0·0001 < 0·0001 < 0·0001 < 0·0001 < 0·0001Corvus monedula 1·0381 < 0·0001 −−−−0·0781 < 0·0001 0·0081 < 0·0001 < 0·0001 < 0·0001 < 0·0001 0·2026Corvus corone/cornix 1·1166 < 0·0001 −−−−0·0758 < 0·0001 0·007 < 0·0001 < 0·0001 < 0·0001 < 0·0001 < 0·0001Pica pica 1·3805 0·0006 −−−−0·0462 0·0034 0·0035 < 0·0001 < 0·0001 < 0·0001 < 0·0001 < 0·0001Troglodytes troglodytes 1·3161 0·0025 −−−−0·0355 < 0·0001 0·0054 < 0·0001 < 0·0001 < 0·0001 < 0·0001 0·0013Carduelis chloris 1·1588 0·0286 −−−−0·032 0·1405 0·0019 0·3624 < 0·0001 < 0·0001 < 0·0001 < 0·0001Fringilla coelebs 1·1442 0·0259 0·0329 0·0008 −−−−0·0044 < 0·0001 < 0·0001 < 0·0001 < 0·0001 < 0·0001Accipiter nisus 0·6420 0·0049 0·0449 < 0·0001 −−−−0·0064 < 0·0001 < 0·0001 < 0·0001 0·6892 < 0·0001Streptopelia decaocto 1·1246 0·0052 0·0454 0·0092 −−−−0·0037 < 0·0001 < 0·0001 < 0·0001 < 0·0001 0·6469Dendrocopos major 0·9914 0·0003 0·0555 0·0411 −−−−0·0028 < 0·0040 < 0·0001 0·0338 < 0·0001 0·0709Parus major 1·0502 < 0·0001 0·0666 < 0·0001 −−−−0·0071 < 0·0001 < 0·0001 < 0·0001 < 0·0001 < 0·0001Aegithalos caudatus 0·8375 < 0·0001 0·0962 0·0043 −−−−0·0037 < 0·0001 < 0·0001 < 0·0001 < 0·0001 < 0·0001
(b) No trend identified or trend debatable. Presented in systematic orderLarus ridibundus 0·2946 < 0·0001 −−−−0·2593 < 0·0001 0·0171 < 0·0001 < 0·0001 < 0·0001 < 0·0001 < 0·0001Columba palumbus 1·3253 0·1492 0·0192 < 0·0001 0·0068 < 0·0001 < 0·0001 < 0·0001 0·0106 0·2655Columba livia 0·7003 0·2632 0·0241 0·8450 0·0004 < 0·0001 < 0·0001 < 0·0001 < 0·0001 0·0886Strix aluco 0·2691 0·0217 0·0871 0·1818 −0·0045 < 0·0001 < 0·0001 < 0·0001 0·4523 0·5892Erithacus rubecula 0·8203 0·1119 −0·0231 < 0·0001 0·0064 < 0·0001 < 0·0001 < 0·0001 < 0·0001 < 0·0001Turdus merula 0·5008 0·1392 0·0278 0·0510 −0·0032 0·0008 < 0·0001 < 0·0001 < 0·0001 < 0·0001Turdus pilaris 0·1518 < 0·0001 −−−−0·2785 < 0·0001 0·0202 < 0·0001 < 0·0001 < 0·0001 < 0·0001 0·0064Turdus iliacus 0.1724 < 0·0001 −−−−0·3339 < 0·0001 0·0199 < 0·0001 < 0·0001 < 0·0001 < 0·0001 0·1722Turdus viscivorus 0·4900 < 0·0001 −−−−0·1317 0·0003 0·0066 < 0·0001 < 0·0001 < 0·0001 < 0·0001 0·4224Sylvia atricapilla 0·4232 < 0·0001 −−−−0·1584 < 0·0001 0·0128 < 0·0001 < 0·0001 < 0·0001 0·0068 < 0·0001Regulus regulus 0·3777 0·0291 0·0517 0·0003 −−−−0·0075 < 0·0001 0·0005 < 0·0001 0·1876 0·1126Parus ater 1·3281 0·6259 0·0062 0·0282 0·0025 < 0·0001 0·0008 < 0·0001 < 0·0001 < 0·0001Sitta europaea 0·7314 0·2881 0·0213 0·6403 0·0008 < 0·0001 < 0·0001 < 0·0001 0·2706 0·0134Certhia familiaris 0.1776 < 0·0001 −−−−0·1547 0·0002 0·0117 < 0·0001 < 0·0001 < 0·0001 0·6924 0·4326Garrulus glandarius 0·7200 0·6698 0·0077 0·3480 −0·0015 < 0·0001 0·0139 < 0·0001 0·1887 0·0257Passer montanus 0·3687 0·0223 0·0785 0·2889 −0·0033 0·2036 < 0·0001 < 0·0001 < 0·0001 0·5976Fringilla montifringilla 0·1257 < 0·0001 0·1695 < 0·0001 −−−−0·0247 < 0·0001 < 0·0001 < 0·0001 0·0582 0·1953Carduelis carduelis 0·9890 0·1811 0·0208 < 0·0001 0·014 < 0·0001 < 0·0001 < 0·0001 0·0812 < 0·0001Carduelis spinus 0·4412 0·0115 −−−−0·0502 0·0747 0·0033 < 0·0001 < 0·0001 < 0·0001 < 0·0001 < 0·0001Pyrrhula pyrrhula 0·4342 < 0·0001 −−−−0·1258 < 0·0001 0·0136 < 0·0001 < 0·0001 < 0·0001 < 0·0001 0·0048Emberiza citrinella 0·2124 0·0063 −−−−0·1034 0·3534 0·0032 0·0009 < 0·0001 0·5504 0·8295 0·0035Emberiza schoeniclus 0·0803 0·0005 −−−−0.1910 0·0644 0·0093 < 0·0001 < 0·0001 0·0200 0·3642 0·7923
665Garden bird trends
© 2005 British Ecological Society, Journal of Applied Ecology, 42, 659–671
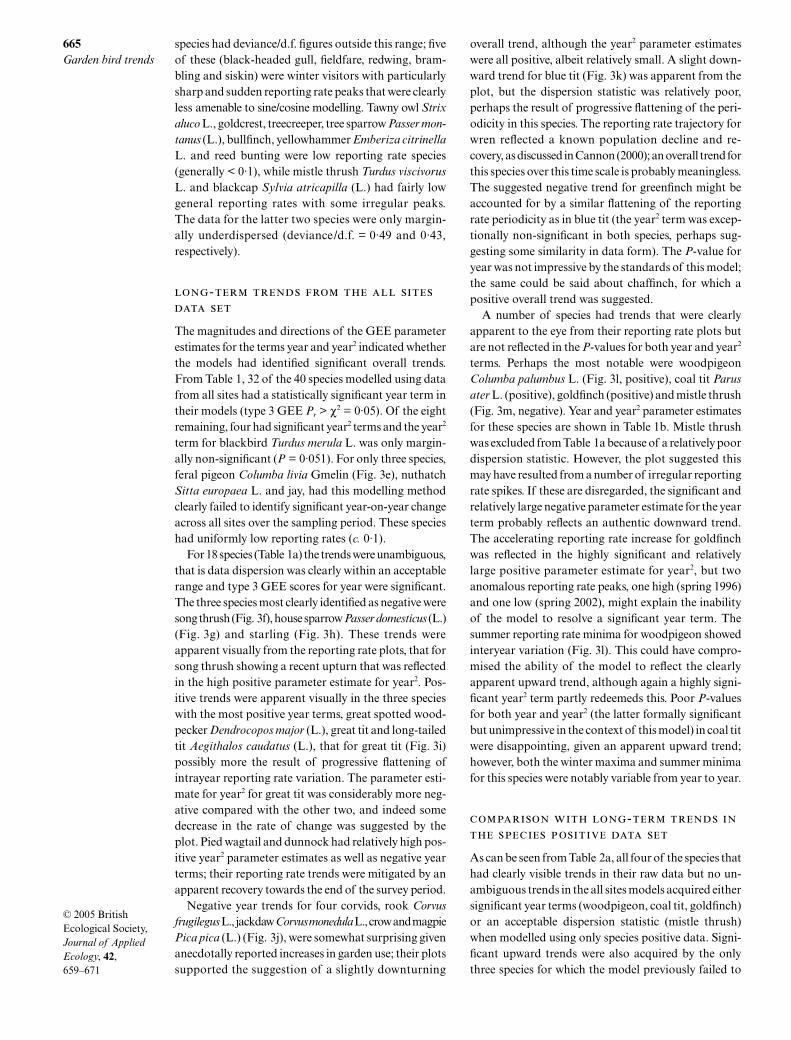
species had deviance/d.f. figures outside this range; fiveof these (black-headed gull, fieldfare, redwing, bram-bling and siskin) were winter visitors with particularlysharp and sudden reporting rate peaks that were clearlyless amenable to sine/cosine modelling. Tawny owl Strixaluco L., goldcrest, treecreeper, tree sparrow Passer mon-tanus (L.), bullfinch, yellowhammer Emberiza citrinellaL. and reed bunting were low reporting rate species(generally < 0·1), while mistle thrush Turdus viscivorusL. and blackcap Sylvia atricapilla (L.) had fairly lowgeneral reporting rates with some irregular peaks.The data for the latter two species were only margin-ally underdispersed (deviance/d.f. = 0·49 and 0·43,respectively).
-
The magnitudes and directions of the GEE parameterestimates for the terms year and year2 indicated whetherthe models had identified significant overall trends.From Table 1, 32 of the 40 species modelled using datafrom all sites had a statistically significant year term intheir models (type 3 GEE Pr > χ2 = 0·05). Of the eightremaining, four had significant year2 terms and the year2
term for blackbird Turdus merula L. was only margin-ally non-significant (P = 0·051). For only three species,feral pigeon Columba livia Gmelin (Fig. 3e), nuthatchSitta europaea L. and jay, had this modelling methodclearly failed to identify significant year-on-year changeacross all sites over the sampling period. These specieshad uniformly low reporting rates (c. 0·1).
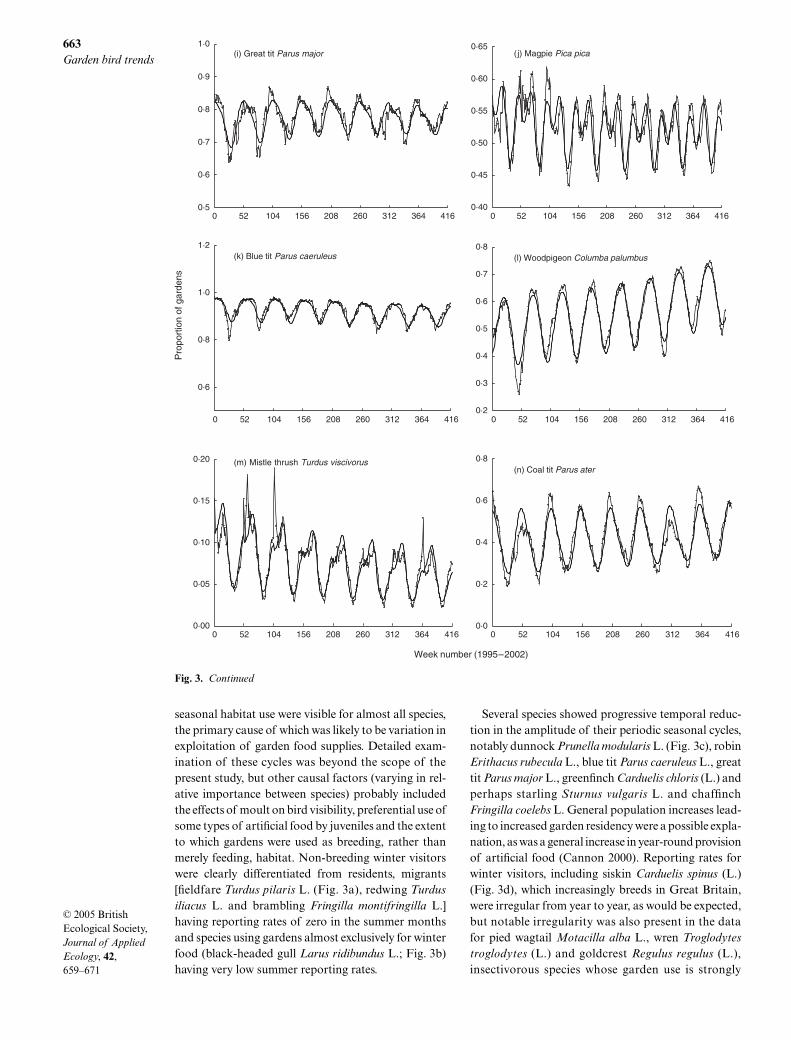
For 18 species (Table 1a) the trends were unambiguous,that is data dispersion was clearly within an acceptablerange and type 3 GEE scores for year were significant.The three species most clearly identified as negative weresong thrush (Fig. 3f), house sparrow Passer domesticus (L.)(Fig. 3g) and starling (Fig. 3h). These trends wereapparent visually from the reporting rate plots, that forsong thrush showing a recent upturn that was reflectedin the high positive parameter estimate for year2. Pos-itive trends were apparent visually in the three specieswith the most positive year terms, great spotted wood-pecker Dendrocopos major (L.), great tit and long-tailedtit Aegithalos caudatus (L.), that for great tit (Fig. 3i)possibly more the result of progressive flattening ofintrayear reporting rate variation. The parameter esti-mate for year2 for great tit was considerably more neg-ative compared with the other two, and indeed somedecrease in the rate of change was suggested by theplot. Pied wagtail and dunnock had relatively high pos-itive year2 parameter estimates as well as negative yearterms; their reporting rate trends were mitigated by anapparent recovery towards the end of the survey period.
Negative year trends for four corvids, rook Corvusfrugilegus L., jackdaw Corvus monedula L., crow and magpiePica pica (L.) (Fig. 3j), were somewhat surprising givenanecdotally reported increases in garden use; their plotssupported the suggestion of a slightly downturning
overall trend, although the year2 parameter estimateswere all positive, albeit relatively small. A slight down-ward trend for blue tit (Fig. 3k) was apparent from theplot, but the dispersion statistic was relatively poor,perhaps the result of progressive flattening of the peri-odicity in this species. The reporting rate trajectory forwren reflected a known population decline and re-covery, as discussed in Cannon (2000); an overall trend forthis species over this time scale is probably meaningless.The suggested negative trend for greenfinch might beaccounted for by a similar flattening of the reportingrate periodicity as in blue tit (the year2 term was excep-tionally non-significant in both species, perhaps sug-gesting some similarity in data form). The P-value foryear was not impressive by the standards of this model;the same could be said about chaffinch, for which apositive overall trend was suggested.
A number of species had trends that were clearlyapparent to the eye from their reporting rate plots butare not reflected in the P-values for both year and year2
terms. Perhaps the most notable were woodpigeonColumba palumbus L. (Fig. 3l, positive), coal tit Parusater L. (positive), goldfinch (positive) and mistle thrush(Fig. 3m, negative). Year and year2 parameter estimatesfor these species are shown in Table 1b. Mistle thrushwas excluded from Table 1a because of a relatively poordispersion statistic. However, the plot suggested thismay have resulted from a number of irregular reportingrate spikes. If these are disregarded, the significant andrelatively large negative parameter estimate for the yearterm probably reflects an authentic downward trend.The accelerating reporting rate increase for goldfinchwas reflected in the highly significant and relativelylarge positive parameter estimate for year2, but twoanomalous reporting rate peaks, one high (spring 1996)and one low (spring 2002), might explain the inabilityof the model to resolve a significant year term. Thesummer reporting rate minima for woodpigeon showedinteryear variation (Fig. 3l). This could have compro-mised the ability of the model to reflect the clearlyapparent upward trend, although again a highly signi-ficant year2 term partly redeemeds this. Poor P-valuesfor both year and year2 (the latter formally significantbut unimpressive in the context of this model) in coal titwere disappointing, given an apparent upward trend;however, both the winter maxima and summer minimafor this species were notably variable from year to year.
-
As can be seen from Table 2a, all four of the species thathad clearly visible trends in their raw data but no un-ambiguous trends in the all sites models acquired eithersignificant year terms (woodpigeon, coal tit, goldfinch)or an acceptable dispersion statistic (mistle thrush)when modelled using only species positive data. Signi-ficant upward trends were also acquired by the onlythree species for which the model previously failed to
666A. R. Cannon et al.
© 2005 British Ecological Society, Journal of Applied Ecology, 42, 659–671
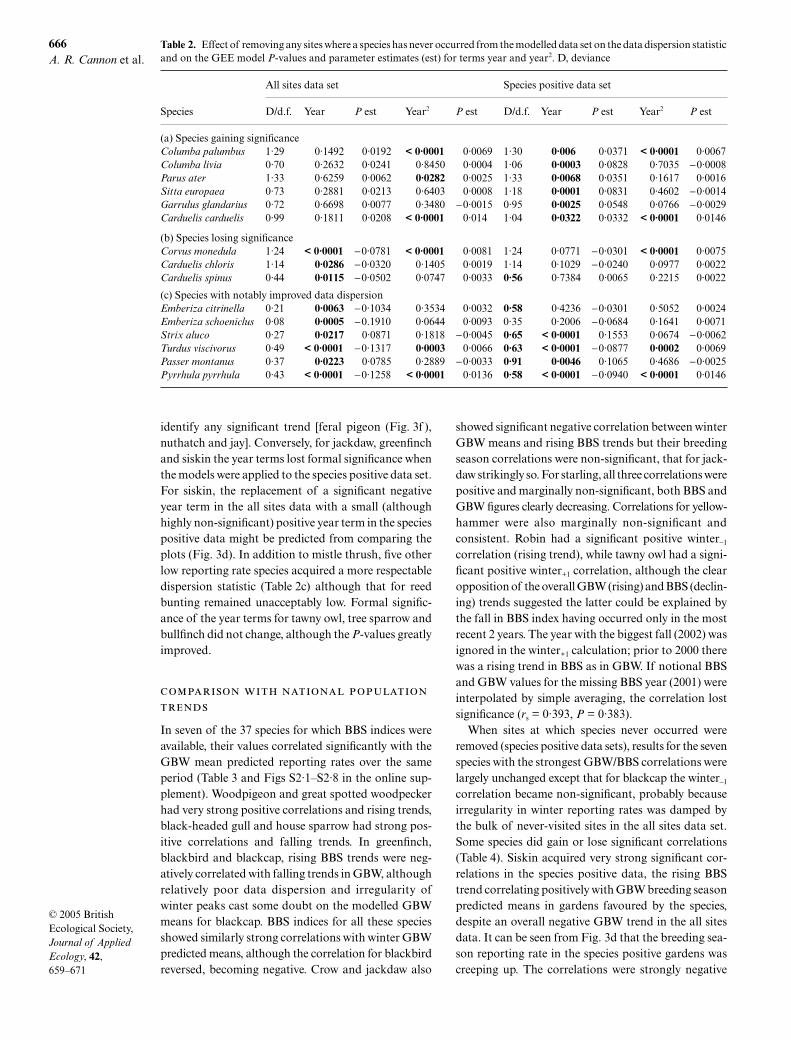
identify any significant trend [feral pigeon (Fig. 3f ),nuthatch and jay]. Conversely, for jackdaw, greenfinchand siskin the year terms lost formal significance whenthe models were applied to the species positive data set.For siskin, the replacement of a significant negativeyear term in the all sites data with a small (althoughhighly non-significant) positive year term in the speciespositive data might be predicted from comparing theplots (Fig. 3d). In addition to mistle thrush, five otherlow reporting rate species acquired a more respectabledispersion statistic (Table 2c) although that for reedbunting remained unacceptably low. Formal signific-ance of the year terms for tawny owl, tree sparrow andbullfinch did not change, although the P-values greatlyimproved.
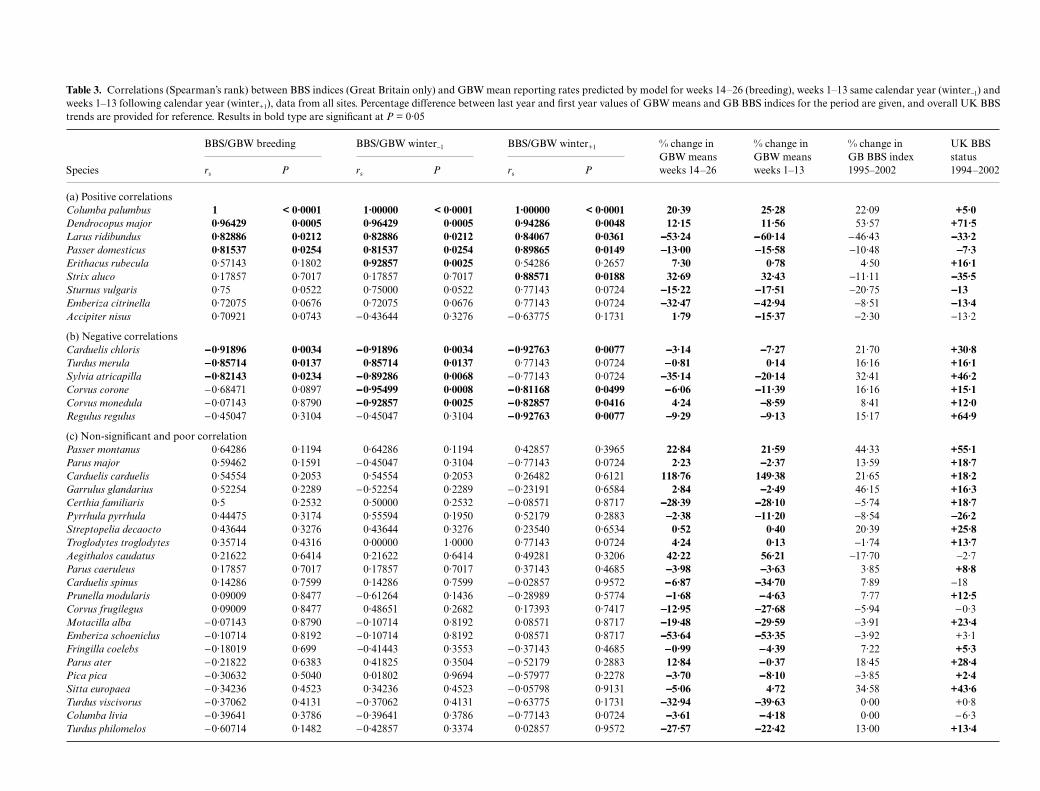
In seven of the 37 species for which BBS indices wereavailable, their values correlated significantly with theGBW mean predicted reporting rates over the sameperiod (Table 3 and Figs S2·1–S2·8 in the online sup-plement). Woodpigeon and great spotted woodpeckerhad very strong positive correlations and rising trends,black-headed gull and house sparrow had strong pos-itive correlations and falling trends. In greenfinch,blackbird and blackcap, rising BBS trends were neg-atively correlated with falling trends in GBW, althoughrelatively poor data dispersion and irregularity ofwinter peaks cast some doubt on the modelled GBWmeans for blackcap. BBS indices for all these speciesshowed similarly strong correlations with winter GBWpredicted means, although the correlation for blackbirdreversed, becoming negative. Crow and jackdaw also
showed significant negative correlation between winterGBW means and rising BBS trends but their breedingseason correlations were non-significant, that for jack-daw strikingly so. For starling, all three correlations werepositive and marginally non-significant, both BBS andGBW figures clearly decreasing. Correlations for yellow-hammer were also marginally non-significant andconsistent. Robin had a significant positive winter−1
correlation (rising trend), while tawny owl had a signi-ficant positive winter+1 correlation, although the clearopposition of the overall GBW (rising) and BBS (declin-ing) trends suggested the latter could be explained bythe fall in BBS index having occurred only in the mostrecent 2 years. The year with the biggest fall (2002) wasignored in the winter+1 calculation; prior to 2000 therewas a rising trend in BBS as in GBW. If notional BBSand GBW values for the missing BBS year (2001) wereinterpolated by simple averaging, the correlation lostsignificance (rs = 0·393, P = 0·383).
When sites at which species never occurred wereremoved (species positive data sets), results for the sevenspecies with the strongest GBW/BBS correlations werelargely unchanged except that for blackcap the winter−1
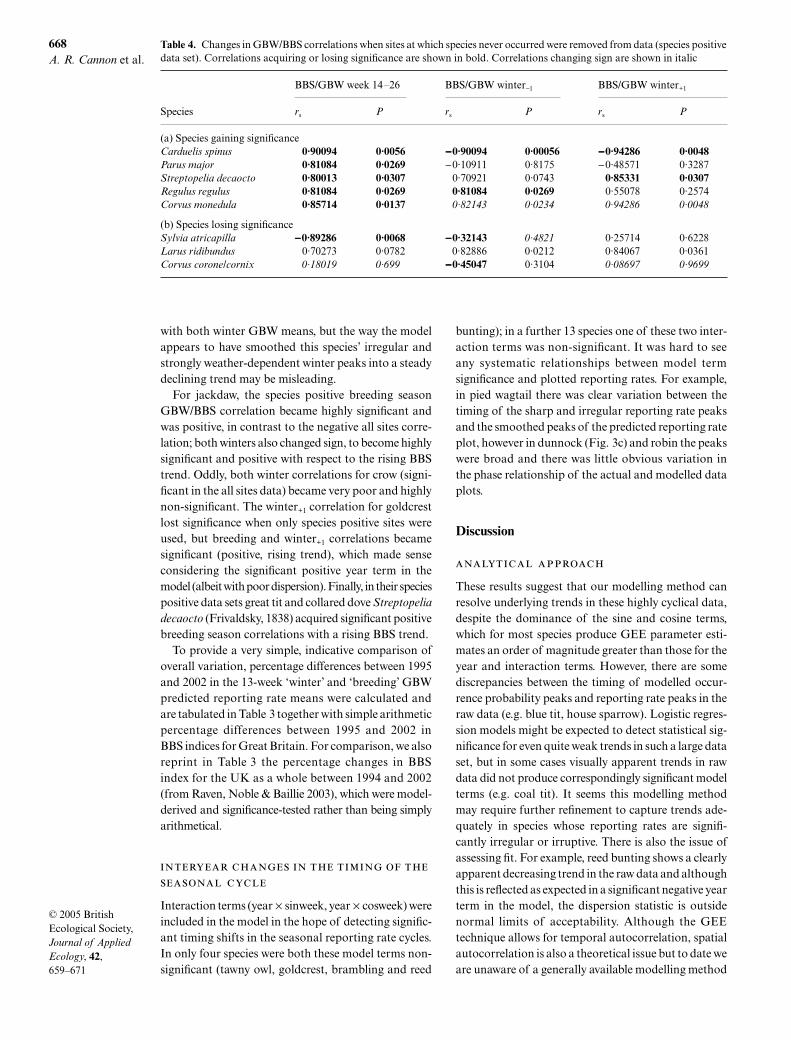
correlation became non-significant, probably becauseirregularity in winter reporting rates was damped bythe bulk of never-visited sites in the all sites data set.Some species did gain or lose significant correlations(Table 4). Siskin acquired very strong significant cor-relations in the species positive data, the rising BBStrend correlating positively with GBW breeding seasonpredicted means in gardens favoured by the species,despite an overall negative GBW trend in the all sitesdata. It can be seen from Fig. 3d that the breeding sea-son reporting rate in the species positive gardens wascreeping up. The correlations were strongly negative
Table 2. Effect of removing any sites where a species has never occurred from the modelled data set on the data dispersion statisticand on the GEE model P-values and parameter estimates (est) for terms year and year2. D, deviance
Species
All sites data set Species positive data set
D/d.f. Year P est Year2 P est D/d.f. Year P est Year2 P est
(a) Species gaining significanceColumba palumbus 1·29 0·1492 0·0192 < 0·0001 0·0069 1·30 0·006 0·0371 < 0·0001 0·0067Columba livia 0·70 0·2632 0·0241 0·8450 0·0004 1·06 0·0003 0·0828 0·7035 −0·0008Parus ater 1·33 0·6259 0·0062 0·0282 0·0025 1·33 0·0068 0·0351 0·1617 0·0016Sitta europaea 0·73 0·2881 0·0213 0·6403 0·0008 1·18 0·0001 0·0831 0·4602 −0·0014Garrulus glandarius 0·72 0·6698 0·0077 0·3480 −0·0015 0·95 0·0025 0·0548 0·0766 −0·0029Carduelis carduelis 0·99 0·1811 0·0208 < 0·0001 0·014 1·04 0·0322 0·0332 < 0·0001 0·0146
(b) Species losing significanceCorvus monedula 1·24 < 0·0001 −0·0781 < 0·0001 0·0081 1·24 0·0771 −0·0301 < 0·0001 0·0075Carduelis chloris 1·14 0·0286 −0·0320 0·1405 0·0019 1·14 0·1029 −0·0240 0·0977 0·0022Carduelis spinus 0·44 0·0115 −0·0502 0·0747 0·0033 0·56 0·7384 0·0065 0·2215 0·0022
(c) Species with notably improved data dispersionEmberiza citrinella 0·21 0·0063 −0·1034 0·3534 0·0032 0·58 0·4236 −0·0301 0·5052 0·0024Emberiza schoeniclus 0·08 0·0005 −0.1910 0·0644 0·0093 0·35 0·2006 −0·0684 0·1641 0·0071Strix aluco 0·27 0·0217 0·0871 0·1818 −0·0045 0·65 < 0·0001 0·1553 0·0674 −0·0062Turdus viscivorus 0·49 < 0·0001 −0·1317 0·0003 0·0066 0·63 < 0·0001 −0·0877 0·0002 0·0069Passer montanus 0·37 0·0223 0·0785 0·2889 −0·0033 0·91 0·0046 0·1065 0·4686 −0·0025Pyrrhula pyrrhula 0·43 < 0·0001 −0·1258 < 0·0001 0·0136 0·58 < 0·0001 −0·0940 < 0·0001 0·0146
667G
arden bird trends
© 2005 B
ritish E
cological Society, Journal of A
pplied E
cology, 42, 659–671Table 3. Correlations (Spearman’s rank) between BBS indices (Great Britain only) and GBW mean reporting rates predicted by model for weeks 14–26 (breeding), weeks 1–13 same calendar year (winter−1) andweeks 1–13 following calendar year (winter+1), data from all sites. Percentage difference between last year and first year values of GBW means and GB BBS indices for the period are given, and overall UK BBStrends are provided for reference. Results in bold type are significant at P = 0·05
Species
BBS/GBW breeding BBS/GBW winter−1 BBS/GBW winter+1 % change in GBW means weeks 14–26
% change in GBW means weeks 1–13
% change in GB BBS index 1995–2002
UK BBS status 1994–2002rs P rs P rs P
(a) Positive correlationsColumba palumbus 1 < 0·0001 1·00000 < 0·0001 1·00000 < 0·0001 20·39 25·28 22·09 +5·0Dendrocopus major 0·96429 0·0005 0·96429 0·0005 0·94286 0·0048 12·15 11·56 53·57 +71·5Larus ridibundus 0·82886 0·0212 0·82886 0·0212 0·84067 0·0361 −−−−53·24 −−−−60·14 −46·43 −−−−33·2Passer domesticus 0·81537 0·0254 0·81537 0·0254 0·89865 0·0149 −−−−13·00 −−−−15·58 −10·48 −−−−7·3Erithacus rubecula 0·57143 0·1802 0·92857 0·0025 0·54286 0·2657 7·30 0·78 4·50 +16·1Strix aluco 0·17857 0·7017 0·17857 0·7017 0·88571 0·0188 32·69 32·43 −11·11 −−−−35·5Sturnus vulgaris 0·75 0·0522 0·75000 0·0522 0·77143 0·0724 −−−−15·22 −−−−17·51 −20·75 −−−−13Emberiza citrinella 0·72075 0·0676 0·72075 0·0676 0·77143 0·0724 −−−−32·47 −−−−42·94 −8·51 −−−−13·4Accipiter nisus 0·70921 0·0743 −0·43644 0·3276 −0·63775 0·1731 1·79 −−−−15·37 −2·30 −13·2
(b) Negative correlationsCarduelis chloris −−−−0·91896 0·0034 −−−−0·91896 0·0034 −−−−0·92763 0·0077 −−−−3·14 −−−−7·27 21·70 +30·8Turdus merula −−−−0·85714 0·0137 0·85714 0·0137 0·77143 0·0724 −−−−0·81 0·14 16·16 +16·1Sylvia atricapilla −−−−0·82143 0·0234 −−−−0·89286 0·0068 −0·77143 0·0724 −−−−35·14 −−−−20·14 32·41 +46·2Corvus corone −0·68471 0·0897 −−−−0·95499 0·0008 −−−−0·81168 0·0499 −−−−6·06 −−−−11·39 16·16 +15·1Corvus monedula −0·07143 0·8790 −−−−0·92857 0·0025 −−−−0·82857 0·0416 4·24 −−−−8·59 8·41 +12·0Regulus regulus −0·45047 0·3104 −0·45047 0·3104 −−−−0·92763 0·0077 −−−−9·29 −−−−9·13 15·17 +64·9
(c) Non-significant and poor correlationPasser montanus 0·64286 0·1194 0·64286 0·1194 0·42857 0·3965 22·84 21·59 44·33 +55·1Parus major 0·59462 0·1591 −0·45047 0·3104 −0·77143 0·0724 2·23 −−−−2·37 13·59 +18·7Carduelis carduelis 0·54554 0·2053 0·54554 0·2053 0·26482 0·6121 118·76 149·38 21·65 +18·2Garrulus glandarius 0·52254 0·2289 −0·52254 0·2289 −0·23191 0·6584 2·84 −−−−2·49 46·15 +16·3Certhia familiaris 0·5 0·2532 0·50000 0·2532 −0·08571 0·8717 −−−−28·39 −−−−28·10 −5·74 +18·7Pyrrhula pyrrhula 0·44475 0·3174 0·55594 0·1950 0·52179 0·2883 −−−−2·38 −−−−11·20 −8·54 −−−−26·2Streptopelia decaocto 0·43644 0·3276 0·43644 0·3276 0·23540 0·6534 0·52 0·40 20·39 +25·8Troglodytes troglodytes 0·35714 0·4316 0·00000 1·0000 0·77143 0·0724 4·24 0·13 −1·74 +13·7Aegithalos caudatus 0·21622 0·6414 0·21622 0·6414 0·49281 0·3206 42·22 56·21 −17·70 −2·7Parus caeruleus 0·17857 0·7017 0·17857 0·7017 0·37143 0·4685 −−−−3·98 −−−−3·63 3·85 +8·8Carduelis spinus 0·14286 0·7599 0·14286 0·7599 −0·02857 0·9572 −−−−6·87 −−−−34·70 7·89 −18Prunella modularis 0·09009 0·8477 −0·61264 0·1436 −0·28989 0·5774 −−−−1·68 −−−−4·63 7·77 +12·5Corvus frugilegus 0·09009 0·8477 0·48651 0·2682 0·17393 0·7417 −−−−12·95 −−−−27·68 −5·94 −0·3Motacilla alba −0·07143 0·8790 −0·10714 0·8192 0·08571 0·8717 −−−−19·48 −−−−29·59 −3·91 +23·4Emberiza schoeniclus −0·10714 0·8192 −0·10714 0·8192 0·08571 0·8717 −−−−53·64 −−−−53·35 −3·92 +3·1Fringilla coelebs −0·18019 0·699 −0·41443 0·3553 −0·37143 0·4685 −−−−0·99 −−−−4·39 7·22 +5·3Parus ater −0·21822 0·6383 0·41825 0·3504 −0·52179 0·2883 12·84 −−−−0·37 18·45 +28·4Pica pica −0·30632 0·5040 0·01802 0·9694 −0·57977 0·2278 −−−−3·70 −−−−8·10 −3·85 +2·4Sitta europaea −0·34236 0·4523 0·34236 0·4523 −0·05798 0·9131 −−−−5·06 4·72 34·58 +43·6Turdus viscivorus −0·37062 0·4131 −0·37062 0·4131 −0·63775 0·1731 −−−−32·94 −−−−39·63 0·00 +0·8Columba livia −0·39641 0·3786 −0·39641 0·3786 −0·77143 0·0724 −−−−3·61 −−−−4·18 0·00 −6·3Turdus philomelos −0·60714 0·1482 −0·42857 0·3374 0·02857 0·9572 −−−−27·57 −−−−22·42 13·00 +13·4
668A. R. Cannon et al.
© 2005 British Ecological Society, Journal of Applied Ecology, 42, 659–671
with both winter GBW means, but the way the modelappears to have smoothed this species’ irregular andstrongly weather-dependent winter peaks into a steadydeclining trend may be misleading.
For jackdaw, the species positive breeding seasonGBW/BBS correlation became highly significant andwas positive, in contrast to the negative all sites corre-lation; both winters also changed sign, to become highlysignificant and positive with respect to the rising BBStrend. Oddly, both winter correlations for crow (signi-ficant in the all sites data) became very poor and highlynon-significant. The winter+1 correlation for goldcrestlost significance when only species positive sites wereused, but breeding and winter+1 correlations becamesignificant (positive, rising trend), which made senseconsidering the significant positive year term in themodel (albeit with poor dispersion). Finally, in their speciespositive data sets great tit and collared dove Streptopeliadecaocto (Frivaldsky, 1838) acquired significant positivebreeding season correlations with a rising BBS trend.
To provide a very simple, indicative comparison ofoverall variation, percentage differences between 1995and 2002 in the 13-week ‘winter’ and ‘breeding’ GBWpredicted reporting rate means were calculated andare tabulated in Table 3 together with simple arithmeticpercentage differences between 1995 and 2002 inBBS indices for Great Britain. For comparison, we alsoreprint in Table 3 the percentage changes in BBSindex for the UK as a whole between 1994 and 2002(from Raven, Noble & Baillie 2003), which were model-derived and significance-tested rather than being simplyarithmetical.
Interaction terms (year × sinweek, year × cosweek) wereincluded in the model in the hope of detecting signific-ant timing shifts in the seasonal reporting rate cycles.In only four species were both these model terms non-significant (tawny owl, goldcrest, brambling and reed
bunting); in a further 13 species one of these two inter-action terms was non-significant. It was hard to seeany systematic relationships between model termsignificance and plotted reporting rates. For example,in pied wagtail there was clear variation between thetiming of the sharp and irregular reporting rate peaksand the smoothed peaks of the predicted reporting rateplot, however in dunnock (Fig. 3c) and robin the peakswere broad and there was little obvious variation inthe phase relationship of the actual and modelled dataplots.
Discussion
These results suggest that our modelling method canresolve underlying trends in these highly cyclical data,despite the dominance of the sine and cosine terms,which for most species produce GEE parameter esti-mates an order of magnitude greater than those for theyear and interaction terms. However, there are somediscrepancies between the timing of modelled occur-rence probability peaks and reporting rate peaks in theraw data (e.g. blue tit, house sparrow). Logistic regres-sion models might be expected to detect statistical sig-nificance for even quite weak trends in such a large dataset, but in some cases visually apparent trends in rawdata did not produce correspondingly significant modelterms (e.g. coal tit). It seems this modelling methodmay require further refinement to capture trends ade-quately in species whose reporting rates are signifi-cantly irregular or irruptive. There is also the issue ofassessing fit. For example, reed bunting shows a clearlyapparent decreasing trend in the raw data and althoughthis is reflected as expected in a significant negative yearterm in the model, the dispersion statistic is outsidenormal limits of acceptability. Although the GEEtechnique allows for temporal autocorrelation, spatialautocorrelation is also a theoretical issue but to date weare unaware of a generally available modelling method
Table 4. Changes in GBW/BBS correlations when sites at which species never occurred were removed from data (species positivedata set). Correlations acquiring or losing significance are shown in bold. Correlations changing sign are shown in italic
Species
BBS/GBW week 14–26 BBS/GBW winter−1 BBS/GBW winter+1
rs P rs P rs P
(a) Species gaining significanceCarduelis spinus 0·90094 0·0056 −−−−0·90094 0·00056 −−−−0·94286 0·0048Parus major 0·81084 0·0269 −0·10911 0·8175 −0·48571 0·3287Streptopelia decaocto 0·80013 0·0307 0·70921 0·0743 0·85331 0·0307Regulus regulus 0·81084 0·0269 0·81084 0·0269 0·55078 0·2574Corvus monedula 0·85714 0·0137 0·82143 0·0234 0·94286 0·0048
(b) Species losing significanceSylvia atricapilla −−−−0·89286 0·0068 −−−−0·32143 0·4821 0·25714 0·6228Larus ridibundus 0·70273 0·0782 0·82886 0·0212 0·84067 0·0361Corvus corone/cornix 0·18019 0·699 −−−−0·45047 0·3104 0·08697 0·9699
669Garden bird trends
© 2005 British Ecological Society, Journal of Applied Ecology, 42, 659–671
that can allow for this in binary data. Given the 8-yeartime scale and the wide distribution of sites at a nationalscale (Fig. 2), we contend that broad-scale long-termtrends will greatly outweigh local spatial autocorrelationeffects in these data. Adding further complication tothe modelling would be practically unfeasible; as it is,data from a total of 16 172 different sites were includedin data sets having typically between 2·3 and 2·5 millionobservations; calculating GEE models with auto-regression across 416 weeks for data sets of this size wasextremely computationally intensive. The high sensitiv-ity of the models to small interactions leaves us unable toassess meaningfully interyear changes in the timing ofgarden use by this method alone, although inspectionof the GBW data suggests that such changes arebecoming apparent in some species and will be worthyof further investigation. However, Fig. 3g shows thatfor house sparrow the model fails to keep pace with thepeak in actual reporting rates, which is becomingsteadily later each year, and also has trouble trackingthe small post-breeding reporting rate peak despite theexcellent dispersion statistic (1·07).
Given the very large sample size and excellent geo-graphical coverage we contend that GBW is effectivelymonitoring the specific target habitat, private resid-ential gardens. One point frequently raised in discussionof volunteer garden surveys is that virtually all GBWvolunteers provide supplementary food. Given thatsupplementary food is extremely widespread andfrequently superabundant in British gardens, and thatpreliminary survey data from Sheffield (A. R. Cannon,unpublished data) suggest that around one-third ofBritish households provide food for birds, we make noapology for monitoring ‘gardens with supplementaryfood’ as an important habitat in their own right. Fur-thermore, most British gardens are smaller than thenormal territory (and considerably smaller than thewinter feeding range) of most species considered here.A mobile bird exploiting supplementary food in onegarden will also be exploiting the two unfed gardenseither side, hence presence–absence data from fed gar-dens is likely to be representative of the British gardenhabitat as a whole, certainly as far as the 40 more com-mon species covered by GBW are concerned. Therehave been some changes in the timing and types of foodprovided over the period considered (Toms 2003) and itis possible that these are affecting reporting rates. Forexample, the reduction in amplitude of the seasonalcycles noted in several species might be partly the resultin a shift from winter-only to year-round provisioning.If the relative proportions of various garden types inthe survey changed as participation increased over theperiod considered, this might affect reporting rates forsome species, but we have no evidence of this and therecruiting methods and target audience have remainedlargely unchanged.
:
The reporting rate data document a period of almostuniversal change in garden usage rate by most of themore common species that exploit British gardens reg-ularly, and we have successfully captured significanttrends for several important species in our mathem-atical models. Of the 18 species with trends clearly iden-tified by the model, the three with the most negativeyear term parameter estimates are ‘red-listed’ as beingof high conservation concern (song thrush, house spar-row and starling) and that with the fifth most negative(dunnock) is ‘amber listed’ as being of medium concern(Gregory et al. 2002) Five are designated ‘pest’ speciesof economic importance (rook, jackdaw, crow, magpieand collared dove) (DEFRA 2004); for all of thesethe model has successfully identified significant yeartrends, all negative except for collared dove, which ispositive, as would be expected from the > 25% nationalpopulation increase over this period. Crow, magpie andjackdaw all have generally increasing populations, sothe negative trends in the garden reporting rates areinteresting and conflict with anecdotal evidence of ageneral increase in corvids’ use of residential gardens.The models failed to identify significant trends acrossall sites in four red-listed (tree sparrow, bullfinch, yellow-hammer and reed bunting) and five amber-listed(black-headed gull, redwing, fieldfare, mistle thrushand goldcrest) species. None of these species is a typicalgarden resident, being either a seasonal visitor or pri-marily associated with other types of habitat. Three‘pests’ also fail to show a significant trend across allsites, although all three (woodpigeon, feral pigeon andjay) do have significant and positive year terms in thespecies positive gardens.
The presence and detectability of underlying trends inthe GBW data enable us to examine whether trendsin this habitat differ from those in general populationsin direction or timing, perhaps because gardens act as arefuges or because of temporal resource partitioning.Of the species with significant BBS/GBW correlations,positive correlations on rising trends (e.g. woodpigeon,great spotted woodpecker) suggest that increasing popu-lations are colonizing gardens, while those with fall-ing trends (e.g. house sparrow, starling) suggest thatgarden reporting rates can reflect known serious declinesin species of conservation concern. Other species havenegative correlations, notably greenfinch and, perhapssurprisingly for a well-established garden-breedingspecies, blackbird (although the GBW decline for thelatter is very slight, suggesting this correlation shouldbe treated with caution). Negative winter correlationsin jackdaw, crow and goldcrest support a conclusionthat some species are using gardens differently fromothers. That greenfinch (negative correlation) and house
670A. R. Cannon et al.
© 2005 British Ecological Society, Journal of Applied Ecology, 42, 659–671
sparrow (positive correlation) are using gardens in verydifferent ways is supported by the large timing differencebetween their reporting rate peaks. For some species,garden usage may well reflect breeding populations,whereas for others it may primarily reflect winter feed-ing behaviour. A previous study found significant cor-relations between average percentages of winter gardenfeeders visited and US BBS indices across 13 states fornine North American species (Wells et al. 1998) buttemporal correlations across a 7-year period were lesssuccessful, significant only for Carolina wren Thryot-horus ludovicianus Latham and house sparrow, whereaswe have found significant correlations for 15 speciesover 8 years. The detection of significant trends and thedemonstration of so many correlations with trends inthe general population over a relatively short time scaleshow that GBW has great potential as a monitoringtool for a habitat that is important in its own right andnot adequately covered by other monitoring schemes.It provides a wealth of data that it would not be afford-able or practicable to collect by any other means, and itis ongoing, so the value and information content of thedata can only increase.
Acknowledgements
Individual GBW volunteers, 18 300 in total, contrib-uted data to this analysis for a mean of 130 weeks each,and we are grateful to them all, from the 48 supplyingonly a single week’s data to the 19 who supplied data forall 416 weeks. Jacky Prior, Carol Povey, Tracey Brookesand Derek Toomer worked on GBW during this period,and many other BTO staff and volunteers were involvedin the processing of survey forms. Nigel Clark, ChrisWhittles and the late Chris Mead were instrumental inestablishing and supporting the project, which is funded byvolunteers’ subscriptions and supported by CJ WildbirdFoods Ltd. Stuart Newson supplied the BBS indices.The BBS is organized by the BTO and funded by theBTO, the Joint Nature Conservation Committee (onbehalf of the Countryside Council for Wales, EnglishNature, Scottish Natural Heritage and the Departmentof the Environment for Northern Ireland) and theRoyal Society for the Protection of Birds. Robert Freck-leton and two referees provided useful comments. SteveFreeman and Rob Robinson advised on modelling. A.R. Cannon is funded by a Natural EnvironmentResearch Council studentship with the BTO as CASEpartner.
Supplementary material
The following supplementary material is available forthis article online.
Figures S1·1–S1·40. Weekly reporting rates calculatedfrom original data (‘noisy’ plots) and probabilities ofoccurrence predicted by ‘minimum adequate’ GEEmodels (‘smooth’ plots)
Figures S2·1–S2·8. Mean values of predicted GBWreporting rates over weeks 14–26, plotted with corre-sponding Great Britain BBS indices, years 1995–2002(2001 missing) for eight species with significant and/orinteresting correlations
References
Allison, P.D. (1991) Logistic Regression Using the SAS System.SAS Institute Inc., Cary, NC.
Beebee, T.J. (2001) British wildlife and human numbers: theultimate conservation issue? British Wildlife, 13, 1–8.
Bland, R.L., Tully, J. & Greenwood, J.J.D. (2004) Birds breed-ing in British gardens: an underestimated population? BirdStudy, 51, 96–106.
Cannon, A. (1999) The significance of private gardens for birdconservation. Bird Conservation International, 9, 287–298.
Cannon, A. (2000) The Garden Birdwatch Handbook, 2nd edn.British Trust for Ornithology, Thetford, UK.
Chamberlain, D.E., Vickery, J.A., Glue, D.E., Robinson,R.A., Conway, G.J., Woodburn, R.J.W. & Cannon, A.R.(2005) Annual and seasonal trends in the use of gardenfeeders by birds in winter. Ibis, in press.
DEFRA (2004) General Licences Under the Wildlife andCountryside Act 1981. Department for Environment, Foodand Rural Affairs, London, UK. http://www.defra.gov.uk/wildlife-countryside/vertebrates/General-licence.htm [website visited 14 April 2004].
Der, G. & Everitt, B.S. (2002) A Handbook of Statistical AnalysesUsing SAS, 2nd edn. Chapman & Hall /CRC, Boca Raton, FL.
Dunnett, N.P. & Beer, A. (2001) The forgotten elements: the con-tribution of suburban residential gardens to achieving greaterenvironmental sustainability. Developing a New Architecturefor Suburbia. Robert Gordon University, Aberdeen, UK.
English Nature (2004) Fact and Figures. English Nature, London,UK. http://www.english-nature.org.uk/about/annual_report/facts.htm [web sited visited November 2004].
Flury, B.D. & Levri, E.P. (1999) Periodic logistic regression.Ecology, 80, 2254–2260.
Gaston, K.J., Warren, P.H., Thompson, K. & Smith, R.M.(2005) Urban domestic gardens. IV. The extent of theresource and its associated features. Biodiversity and Con-servation, in press.
Gregory, R.D. & Baillie, S.R. (1998) Large-scale habitat useof some declining British birds. Journal of Applied Ecology,35, 785–799.
Gregory, R.D., Wilkinson, N.I., Noble, D.G., Robinson, J.A.,Brown, A.F., Hughes, J.D.A.P., Gibbons, D.W. & Galbraith,C.A. (2002) The population status of birds in the UnitedKingdom, Channel Islands and Isle of Man: an analysisof conservation concern 2002–07. British Birds, 95, 410–450.
Jeffcote, M.T. (1993) Wildlife conservation and private gardensin the city of Leicester. Urban Nature Magazine, 1, 151–154.
Marzluff, J.M., Bowman, R. & Donnelly, R. (2001) AvianEcology and Conservation in an Urbanizing World. KluwerAcademic Publishers, Norwell, MA.
Mason, C.F. (2000) Thrushes now largely restricted to thebuilt environment in eastern England. Diversity and Distribu-tions, 6, 189–194.
Noble, D.G., Newson, S.E., Baillie, S.R., Raven, M.J. &Gregory, R.D. (2005) Recent changes in UK bird pop-ulations measured by the Breeding Bird Survey. Bird Study,in press.
ODPM (2003) Land Use Change in England. No. 18A.Office of the Deputy Prime Minister, London, UKhttp://www.odpm.gov.uk/stellent/groups/odpm_planning/documents/page/odpm_plan_024948.pdf [web site visited14 April 2004].
671Garden bird trends
© 2005 British Ecological Society, Journal of Applied Ecology, 42, 659–671
Owen, J. (1991) The Ecology of a Garden. Cambridge Univer-sity Press, Cambridge, UK.
Peach, W.J., Denny, M., Cotton, P.A., Hill, I.F., Gruar, D.,Barritt, D., Impey, A. & Mallord, J. (2004) Habitat selec-tion by song thrushes in stable and declining farmlandpopulations. Journal of Applied Ecology, 41, 275–293.
Raven, M.J., Noble, D.G. & Baillie, S.R. (2003) The BreedingBird Survey 2002. Report No. 8. British Trust for Ornithology,Joint Nature Conservation Committee and Royal Societyfor the Protection of Birds, Thetford, UK.
RSPB (2002) RSPB Home Page. Royal Society for the Pro-tection of Birds, Sandy, UK. http://www.rspb.org.uk [website visited 9 December 2002].
Rushton, S.P., Ormerod, S.J. & Kerby, G. (2004) Newparadigms for modelling species distributions? Journal ofApplied Ecology, 41, 193–200.
SAS Institute Inc. (2003) Technical FAQ No. 1808: Is There a
Goodness-of-fit Statistic or Test? SAS Institute Inc., Cary,NC. http://support.sas.com/faq/FAQ01808.html [web sitevisited 19 November 2003].
Toms, M.P. (2003) The BTO/CJ Garden Birdwatch Book. Bri-tish Trust for Ornithology, Thetford, UK.
Veerman, P.A. (2002) Canberra Birds. A Report on the First 18Years of the Garden Bird Survey. Canberra Ornithologists’Group, Canberra, Australia.
Wells, J.V., Rosenberg, K.V., Dunn, E.H., Tessaglia-Hymes,D.L. & Dhondt, A.A. (1998) Feeder counts as indicatorsof spatial and temporal variation in winter abundance ofresident birds. Journal of Field Ornithology, 69, 577–586.
Zeger, S.L. & Liang, K.-L. (1986) Longitudinal data analysis fordiscrete and continuous outcomes. Biometrics, 42, 121–130.
Received 16 September 2004; final copy received 28 February 2005Editor: Rob Freckleton
Related Documents