Trends in oceanic captures and clustering of large marine ecosystems Two studies based on the FAO capture database FAO FISHERIES TECHNICAL PAPER 435 ISSN 0429-9345

Welcome message from author
This document is posted to help you gain knowledge. Please leave a comment to let me know what you think about it! Share it to your friends and learn new things together.
Transcript
Trends in oceanic capturesand clustering of large marine ecosystemsTwo studies based on the FAO capture database
FAOFISHERIES
TECHNICALPAPER
435
ISSN 0429-9345
PREPARATION OF THIS DOCUMENT
The two studies that form this document are based on the data held in the FAO capturefisheries production database, for which species items have been classified as oceanic orliving on the continental shelves. A preliminary work on the feasibility of the re-arrangementof FAO capture data into Large Marine Ecosystems’ borders was prepared in September 1999with reference to a visit to FAO by Prof. Sherman, one of the leading authors on this subject.However, the work to re-assign the FAO capture statistics organized by 19 marine fishingareas into the 50 LMEs proved to be quite complex and time consuming. Regional sub-setsof the national data reported by some countries had to be retrieved from national publicationsand web sites, compared with the data already in the FAO database and computerized. SomeLMEs had to be excluded from this exercise, as relevant data are not available. For thesereasons, the data retrieved cover only a limited period of 10 years (1990-99). Given theselimitations, the analysis of the statistics by LME, rather than focusing on changes in the catchtrends, has aimed to identify similarities among the LMEs’ catch patterns, to provide aninsight to the fishery characteristics of the LMEs which have already been extensively studiedfor their ecological and oceanographic conditions.
While the work on LMEs was in progress, the World Resources Institute (WRI)offered to fund the FAO Fishery Information, Data and Statistics Unit (FIDI) to undertake astudy on oceanic fisheries based on the data contained in the FAO fishery statistics databases.Oceanic species in the FAO capture database were identified and subdivided into epipelagicand deep-water species. The complete report, also including analyses of other FIDI statisticson oceanic fishers and fishing vessels, was delivered to WRI in September 2001. As aconsequence of the completion of this work, it was decided to revise the species included inthe LME project, excluding those categorized as oceanic to obtain two complete separate setsof species items from the FAO capture database. The species included in the LME study arethose classified as spending most of their life cycle on the continental shelf whereas thespecies categorized as oceanic are those living beyond the shelf. The section of the report toWRI on trends of oceanic catches, analysed over a 50-year period (1950-99) and by FAOfishing area, is published here with some modifications thanks to an agreement between FAOand WRI which allows both institutions to disseminate the results of the study separately.
ACKNOWLEDGEMENTS
The authors are greatly indebted to:
Ms S. Busilacchi, who established the database for the LME study, and searched,scrutinized and input the data from additional sources for the period 1990-98; and
Mr R. Grainger, Chief, FAO-FIDI, and Ms A. Crispoldi, Senior Fishery Statistician,FAO-FIDI, for their continuous support to these projects and the valuable comments to themanuscript.
iii
Distribution:
Marine Fisheries listFisheries Statistics listDirectors of Fisheries listFAO Fisheries DepartmentFAO Regional and Subregional offices
iv
Garibaldi, L.; Limongelli, L.Trends in oceanic captures and clustering of Large Marine Ecosystems:
two studies based on the FAO capture database.FAO Fisheries Technical Paper. No. 435. Rome, FAO. 2002. 71p.
ABSTRACT
Species items reported in the FAO capture fisheries production database havebeen classified as oceanic or living on the continental shelf. Catch trends ofoceanic species, further subdivided into epipelagic and deep-water species, havebeen analysed over a 50-year period (1950-99) while statistics for shelf specieshave been re-assigned to Large Marine Ecosystems (LMEs) for a shorter period(1990-99) and used to investigate catch patterns among the various LMEs.
Oceanic fisheries constitute, both in terms of number of species items and inquantities of recent catches, about 10% of global marine catches. Catches ofepipelagic species (mostly tunas) and of deep-water species (mostlyGadiformes) have been continuously increasing and reached 8.6 million tons in1999. Oceanic catches by Distant Water Fleets (DWFs), mostly targeting tunas,have been decreasing in recent years although their share of total DWF catcheshas increased due to the concurrent drop of non-oceanic DWF catches. Trends ofoceanic catches and the contribution of DWFs are examined for all FAO marinefishing areas which show different patterns, mainly depending upon whetherthey are temperate or tropical areas.
Eleven clusters of LMEs have been identified on the basis of similarities in theircatch composition classified into eleven species groupings. For each cluster, thedistinguishing catch pattern and recent trends by species groupings in each LMEare discussed, and considered in relation to information on primary productivityand the abiotic characteristics of the LME.
TABLE OF CONTENTS
Trends in oceanic captures: an analysis of 50 years’ data by FAO fishing areas
Page1. THE OCEANIC REGION ...................................................................................... 1
1.1 Physical environment .................................................................................. 11.2 Biological resources and their exploitation ................................................. 3
2. CAPTURE TRENDS OF OCEANIC SPECIES ..................................................... 52.1 Species selected from the FAO capture database ........................................ 52.2 Global trend ................................................................................................. 8
2.2.1 Oceanic catches of Distant Water Fleets (DWFs) ........................... 92.3 Capture trends by FAO fishing area ............................................................ 11
2.3.1 Northwest Atlantic (FAO Area 21) ................................................. 112.3.2 Northeast Atlantic (FAO Area 27) .................................................. 122.3.3 Western Central Atlantic (FAO Area 31) ........................................ 142.3.4 Eastern Central Atlantic (FAO Area 34) ......................................... 152.3.5 Mediterranean and Black Sea (FAO Area 37) ................................. 162.3.6 Southwest Atlantic (FAO Area 41) ................................................. 182.3.7 Southeast Atlantic (FAO Area 47) .................................................. 192.3.8 Western Indian Ocean (FAO Area 51) ............................................ 202.3.9 Eastern Indian Ocean (FAO Area 57) ............................................. 212.3.10 Northwest Pacific (FAO Area 61) ................................................... 222.3.11 Northeast Pacific (FAO Area 67) .................................................... 232.3.12 Western Central Pacific (FAO Area 71) .......................................... 242.3.13 Eastern Central Pacific (FAO Area 77) ........................................... 252.3.14 Southwest Pacific (FAO Area 81) ................................................... 262.3.15 Southeast Pacific (FAO Area 87) .................................................... 282.3.16 Arctic and Antarctic Areas (FAO Areas 18, 48, 58, 88) ................. 29
3. CONCLUSION ....................................................................................................... 30
4. REFERENCES ........................................................................................................ 31
Clustering Large Marine Ecosystems by capture data
Page1. INTRODUCTION ................................................................................................... 35
1.1 Overview and scope of the work ................................................................. 35
2. METHODS .............................................................................................................. 372.1 Re-arrangement of FAO capture statistics by LME and grouping of
species items ................................................................................................ 372.2 Cluster analysis ............................................................................................ 38
3. CLUSTERS OF LARGE MARINE ECOSYSTEMS ............................................. 393.1 Discussion by cluster ................................................................................... 41
v
3.1.1 Cluster 1 ........................................................................................... 413.1.2 Cluster 2 ........................................................................................... 423.1.3 Cluster 3 ........................................................................................... 433.1.4 Cluster 4 ........................................................................................... 443.1.5 Cluster 5 ........................................................................................... 453.1.6 Cluster 6 ........................................................................................... 463.1.7 Cluster 7 ........................................................................................... 483.1.8 Cluster 8 ........................................................................................... 493.1.9 Cluster 9 ........................................................................................... 503.1.10 Cluster 10 ......................................................................................... 513.1.11 Cluster 11 ......................................................................................... 53
4. CONCLUSION ....................................................................................................... 54
5. REFERENCES ........................................................................................................ 55
APPENDIX 1. – Additional sources ................................................................................... 61APPENDIX 2. – Capture trends (1990-1999) of each LME by cluster .............................. 63APPENDIX 3. – Map of the 50 LMEs ................................................................................ 71
vi
Trends in oceanic captures: an analysis of 50 years’ databy FAO fishing areas
1. THE OCEANIC REGION
1.1 Physical environment
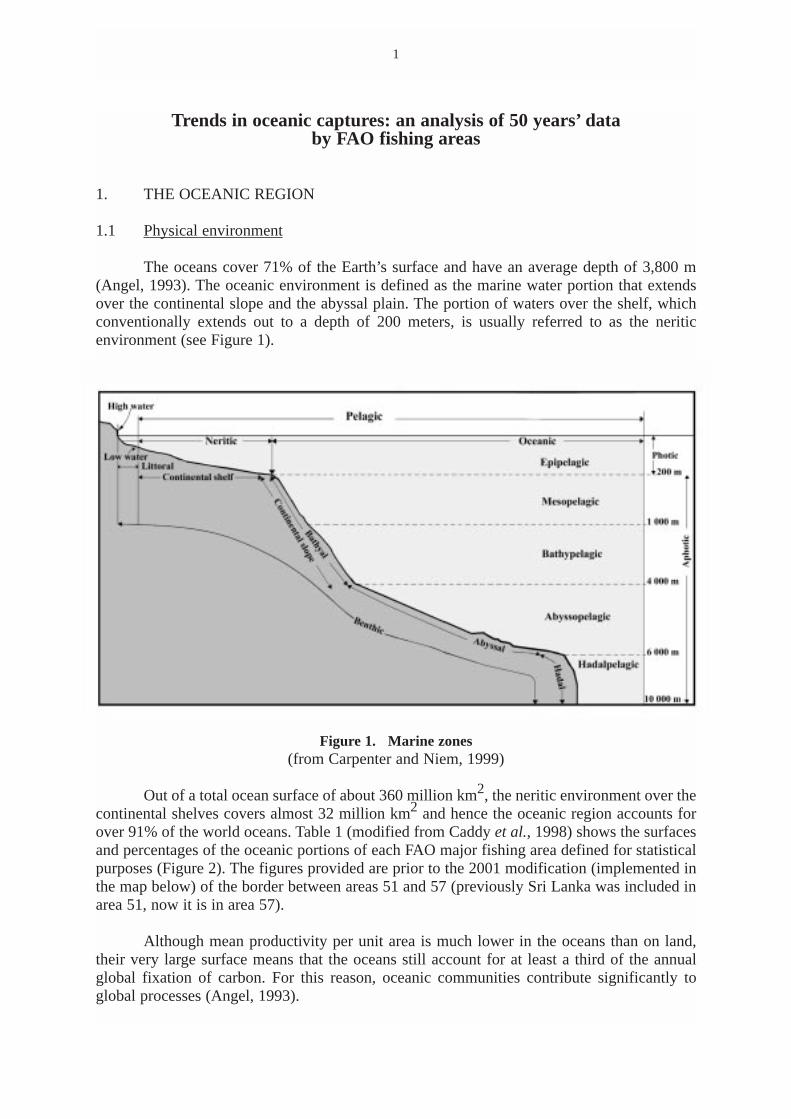
The oceans cover 71% of the Earth’s surface and have an average depth of 3,800 m(Angel, 1993). The oceanic environment is defined as the marine water portion that extendsover the continental slope and the abyssal plain. The portion of waters over the shelf, whichconventionally extends out to a depth of 200 meters, is usually referred to as the neriticenvironment (see Figure 1).
Figure 1. Marine zones(from Carpenter and Niem, 1999)
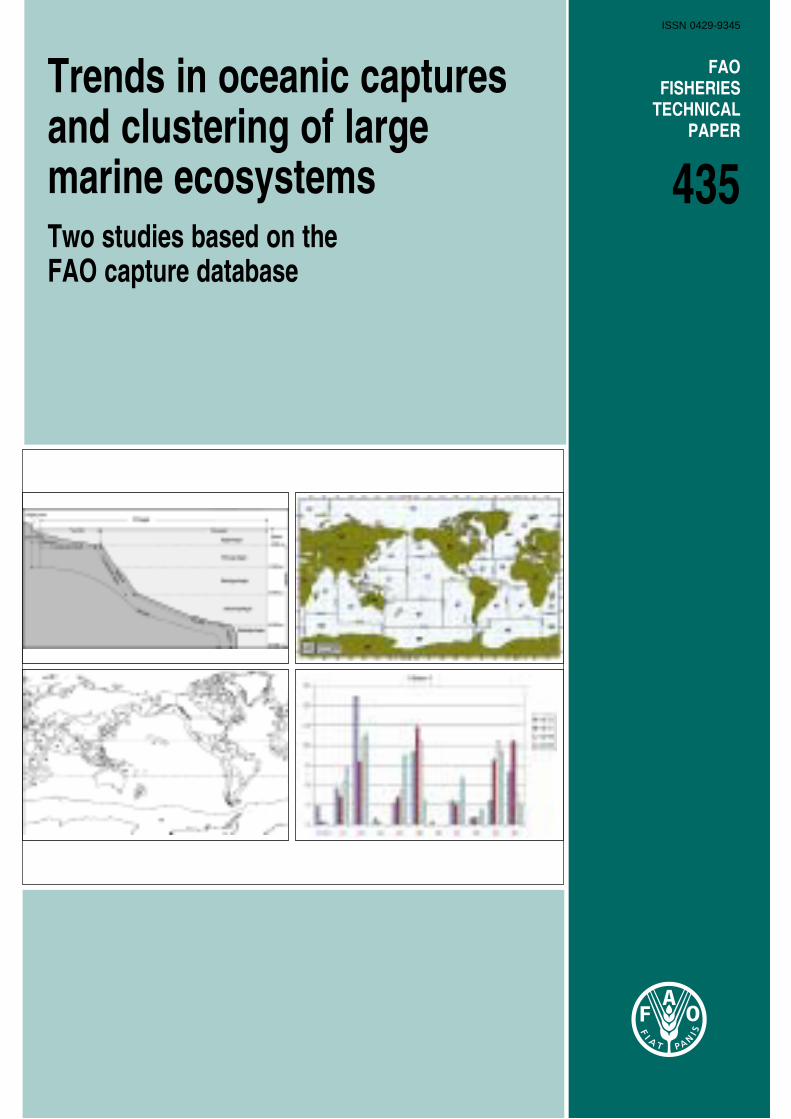
Out of a total ocean surface of about 360 million km2, the neritic environment over thecontinental shelves covers almost 32 million km2 and hence the oceanic region accounts forover 91% of the world oceans. Table 1 (modified from Caddy et al., 1998) shows the surfacesand percentages of the oceanic portions of each FAO major fishing area defined for statisticalpurposes (Figure 2). The figures provided are prior to the 2001 modification (implemented inthe map below) of the border between areas 51 and 57 (previously Sri Lanka was included inarea 51, now it is in area 57).
Although mean productivity per unit area is much lower in the oceans than on land,their very large surface means that the oceans still account for at least a third of the annualglobal fixation of carbon. For this reason, oceanic communities contribute significantly toglobal processes (Angel, 1993).
1
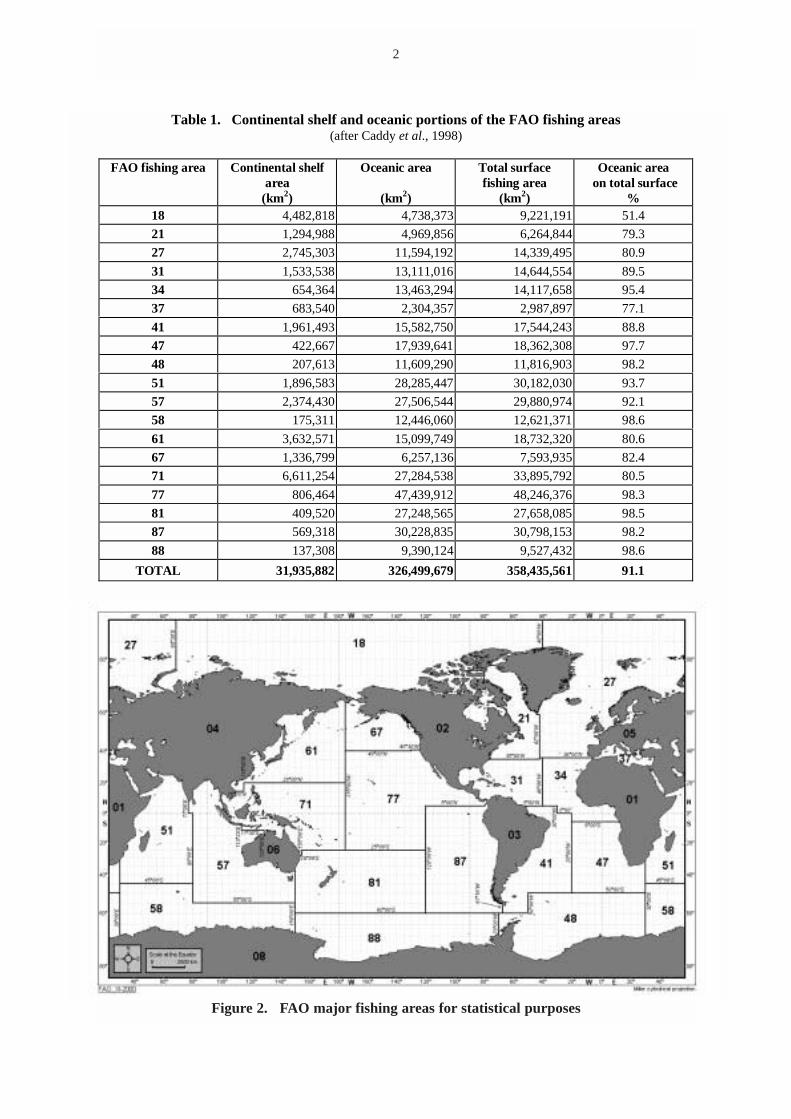
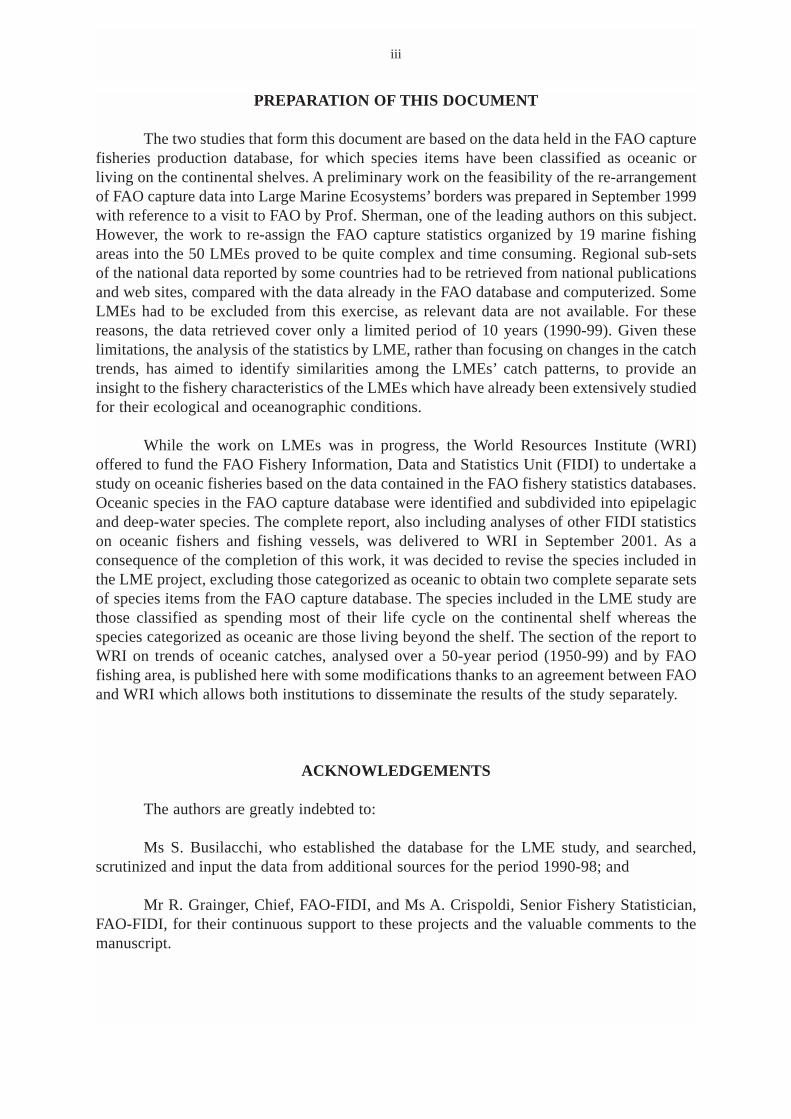
Figure 2. FAO major fishing areas for statistical purposes
2
Table 1. Continental shelf and oceanic portions of the FAO fishing areas(after Caddy et al., 1998)
FAO f is h in g a rea C on tinen ta l s helf a rea
( km2)
O cean ic area
( km2)
Tot al s u rf acef is hing area
( km2)
O cean ic area on t ot a l su rfa ce
%18 4,482,818 4 ,7 38 ,3 7 3 9 ,2 21 ,1 9 1 5 1.4
21 1,294,988 4 ,9 69 ,8 5 6 6 ,2 64 ,8 4 4 7 9.3
27 2,745,303 1 1,59 4,1 92 1 4,33 9,4 95 8 0.9
31 1,533,538 1 3,11 1,0 16 1 4,64 4,5 54 8 9.5
34 654,364 1 3,46 3,2 94 1 4,11 7,6 58 9 5.4
37 683,540 2 ,3 04 ,3 5 7 2 ,9 87 ,8 9 7 7 7.1
41 1,961,493 1 5,58 2,7 50 1 7,54 4,2 43 8 8.8
47 422,667 1 7,93 9,6 41 1 8,36 2,3 08 9 7.7
48 207,613 1 1,60 9,2 90 1 1,81 6,9 03 9 8.2
51 1,896,583 2 8,28 5,4 47 3 0,18 2,0 30 9 3.7
57 2,374,430 2 7,50 6,5 44 2 9,88 0,9 74 9 2.1
58 175,311 1 2,44 6,0 60 1 2,62 1,3 71 9 8.6
61 3,632,571 1 5,09 9,7 49 1 8,73 2,3 20 8 0.6
67 1,336,799 6 ,2 57 ,1 3 6 7 ,5 93 ,9 3 5 8 2.4
71 6,611,254 2 7,28 4,5 38 3 3,89 5,7 92 8 0.5
77 806,464 4 7,43 9,9 12 4 8,24 6,3 76 9 8.3
81 409,520 2 7,24 8,5 65 2 7,65 8,0 85 9 8.5
87 569,318 3 0,22 8,8 35 3 0,79 8,1 53 9 8.2
88 137,308 9 ,3 90 ,1 2 4 9 ,5 27 ,4 3 2 9 8.6
TOTAL 3 1,93 5,8 82 3 26 ,4 99 ,67 9 3 58 ,4 35 ,56 1 9 1.1
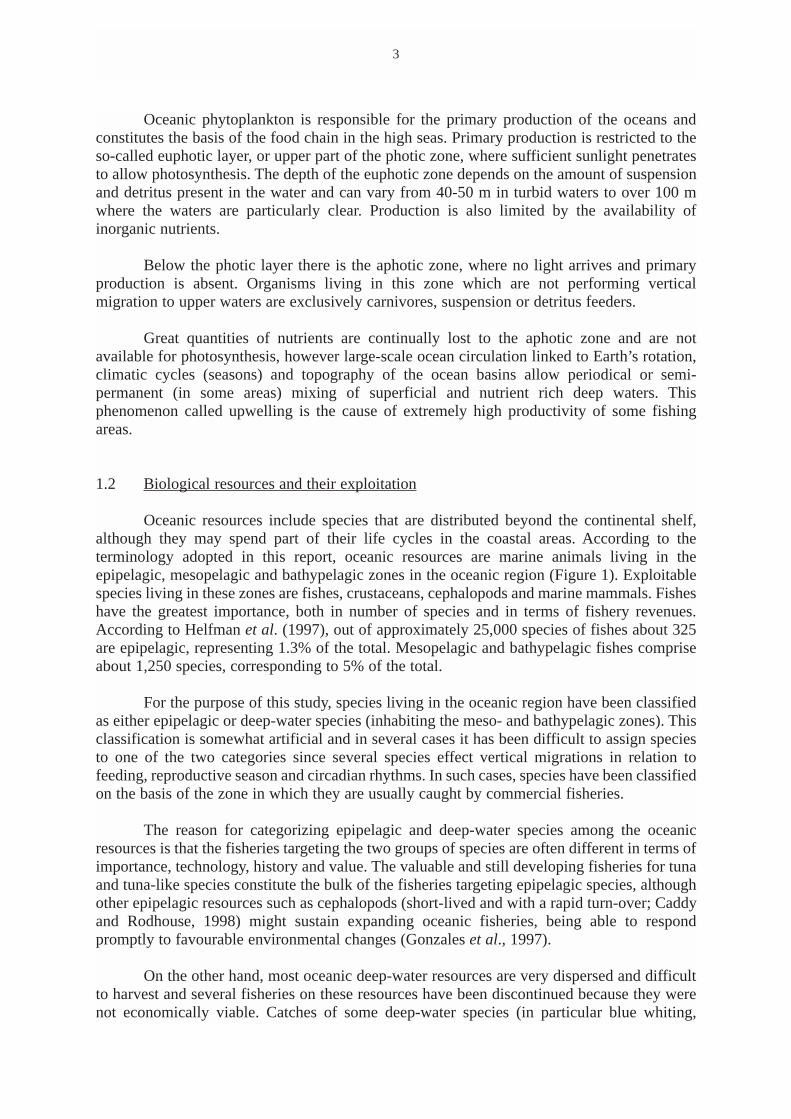
Oceanic phytoplankton is responsible for the primary production of the oceans andconstitutes the basis of the food chain in the high seas. Primary production is restricted to theso-called euphotic layer, or upper part of the photic zone, where sufficient sunlight penetratesto allow photosynthesis. The depth of the euphotic zone depends on the amount of suspensionand detritus present in the water and can vary from 40-50 m in turbid waters to over 100 mwhere the waters are particularly clear. Production is also limited by the availability ofinorganic nutrients.
Below the photic layer there is the aphotic zone, where no light arrives and primaryproduction is absent. Organisms living in this zone which are not performing verticalmigration to upper waters are exclusively carnivores, suspension or detritus feeders.
Great quantities of nutrients are continually lost to the aphotic zone and are notavailable for photosynthesis, however large-scale ocean circulation linked to Earth’s rotation,climatic cycles (seasons) and topography of the ocean basins allow periodical or semi-permanent (in some areas) mixing of superficial and nutrient rich deep waters. Thisphenomenon called upwelling is the cause of extremely high productivity of some fishingareas.
1.2 Biological resources and their exploitation
Oceanic resources include species that are distributed beyond the continental shelf,although they may spend part of their life cycles in the coastal areas. According to theterminology adopted in this report, oceanic resources are marine animals living in theepipelagic, mesopelagic and bathypelagic zones in the oceanic region (Figure 1). Exploitablespecies living in these zones are fishes, crustaceans, cephalopods and marine mammals. Fisheshave the greatest importance, both in number of species and in terms of fishery revenues.According to Helfman et al. (1997), out of approximately 25,000 species of fishes about 325are epipelagic, representing 1.3% of the total. Mesopelagic and bathypelagic fishes compriseabout 1,250 species, corresponding to 5% of the total.
For the purpose of this study, species living in the oceanic region have been classifiedas either epipelagic or deep-water species (inhabiting the meso- and bathypelagic zones). Thisclassification is somewhat artificial and in several cases it has been difficult to assign speciesto one of the two categories since several species effect vertical migrations in relation tofeeding, reproductive season and circadian rhythms. In such cases, species have been classifiedon the basis of the zone in which they are usually caught by commercial fisheries.
The reason for categorizing epipelagic and deep-water species among the oceanicresources is that the fisheries targeting the two groups of species are often different in terms ofimportance, technology, history and value. The valuable and still developing fisheries for tunaand tuna-like species constitute the bulk of the fisheries targeting epipelagic species, althoughother epipelagic resources such as cephalopods (short-lived and with a rapid turn-over; Caddyand Rodhouse, 1998) might sustain expanding oceanic fisheries, being able to respondpromptly to favourable environmental changes (Gonzales et al., 1997).
On the other hand, most oceanic deep-water resources are very dispersed and difficultto harvest and several fisheries on these resources have been discontinued because they werenot economically viable. Catches of some deep-water species (in particular blue whiting,
3
Micromesistius poutassou, which constitutes almost half of the deep-water catches in the lasttwenty years) are mostly destined for reduction into fishmeal because of the rapid deteriorationof their flesh, the presence of parasites, and the low market value for the fresh or processedproduct (Torry Research Station, 1980). In addition, the lack of sound biological informationis often a major source of uncertainty on the long-term sustainability of such fisheries (Clark,1998). Deep-water species are in general characterized by slow growth rates and late age atfirst maturity (e.g. 25 years for orange roughy, Hoplostethus atlanticus; Smith et al., 1995),which led to weak biological compensation of fishing mortality (Clark, 1998).
Oceanic resources are usually exploited by long-range fleets operating in areas wheretarget species concentrate for feeding or reproduction. The more rapid increase of worldfishery fleet sizes as compared to catches and the contemporaneous depletions of some coastalresources have contributed to the increase of fishing effort in oceanic areas (FAO, 1994).
Given the complex interrelations between economic and political factors and the scarceknowledge of oceanic stocks, the issue of oceanic resources management is increasinglycoming to international attention in the light of a growing world human population and limitedfood fish supplies. Furthermore, considering that oceanic species live in a virtually boundlessenvironment and exhibit extensive migratory behaviour amongst high seas and nationaljurisdictions, their management has necessitates international cooperation. For these reasons,issues concerning highly valuable oceanic stocks such as tuna species are of paramountimportance and complexity (FAO, 1994).
4
2. CAPTURE TRENDS OF OCEANIC SPECIES
2.1 Species selected from the FAO capture database
The FAO database for capture fishery statistics released in 2001 (FAO, 2001a) coversa period of 50 years, from 1950 to 1999. For the 1950-1969 period, aquaculture production hasnot yet been separated from capture fisheries production. However, this does not affect oceanicspecies, since data for the only two oceanic species that have aquaculture production (i.e.northern and southern bluefin tunas) start later in the time series.
The 2001 release of the FAO database included capture statistics for 1,205 speciesitems. “Species items” is the term used to identify the statistical taxonomic unit, which cancorrespond to species, genus, family or to higher taxonomic levels.
The first step to identify oceanic species among those included in the FAO databaseconsisted in the consultation of two lists already existing: Annex 1 of the 1982 Convention onthe Law of the Sea which lists highly migratory species (FAO, 1994) and the oceanic and deep-water resources listed in Table 3 of Caddy et al. (1998). These two lists have been expandedby the addition of other species items recently included in the FAO database and, after theconsultation of current literature, amended in a few cases.
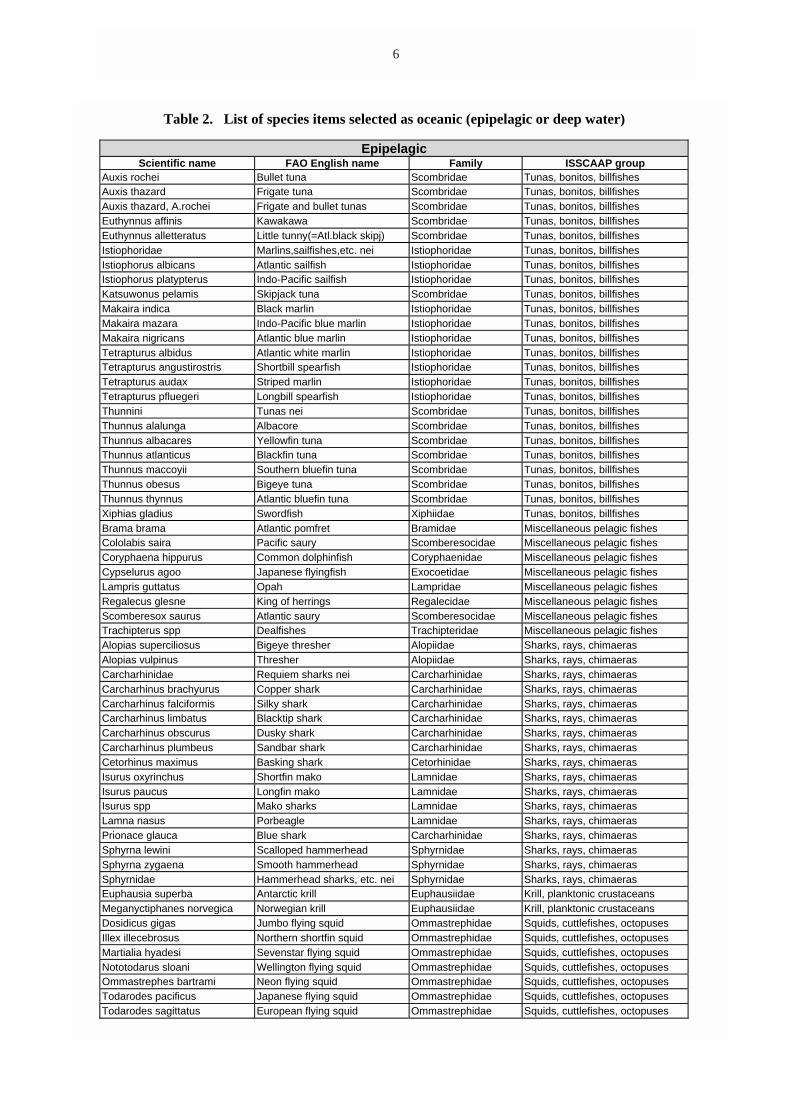
Out of 1,205 species items, 120 have been recognized as oceanic because they spendmost of their adult life or are caught in the epipelagic, mesopelagic or bathypelagic zones(Figure 1). These species items were further divided into epipelagic (58 species items) anddeep-water species (62 items). See Table 2 for the full list of the oceanic species items selected.
The epipelagic group consists of 49 fish, 2 crustacean (krill) and 7 cephalopod (familyOmmastrephidae) species items. The two main groups of epipelagic fishes are tuna and tuna-like species (24 species items), which belong to group 36 (Tunas, bonitos, billfishes) of the‘International Standard Statistical Classification for Aquatic Animals and Plants’ (ISSCAAP)classification used in compiling the FAO fishery statistics, and oceanic sharks (17 speciesitems). The deep-water group consists of 55 fish and 7 crustacean (shrimps and crabs) speciesitems. Several families and orders are represented among the fish species but the mostsignificant group, both in terms of number (15 species items) and economic importance, is thatof the Gadiformes.
Marine mammals have not been considered in this study because fishery statistics forblue-, fin-, sperm- and pilot-whales included in the FAO database are given in number ofspecimens and this does not allow for aggregations with the other data which are all expressedin metric tonnes.
A data sub-set containing capture statistics of the selected oceanic species has beencreated from the FAO database. Catches reported by flag States for vessels fishing in areasother than those adjacent to the flag State have been classified as Distant Water Fleet (DWF)catches. Vessels fishing in the same FAO fishing area in which their flag State has access tothe sea are instead referred to as “bordering countries” throughout the document.
5
6
Table 2. List of species items selected as oceanic (epipelagic or deep water)
EpipelagicScientific name FAO English name Family ISSCAAP group
Auxis rochei Bullet tuna Scombridae Tunas, bonitos, billfishesAuxis thazard Frigate tuna Scombridae Tunas, bonitos, billfishesAuxis thazard, A.rochei Frigate and bullet tunas Scombridae Tunas, bonitos, billfishesEuthynnus affinis Kawakawa Scombridae Tunas, bonitos, billfishesEuthynnus alletteratus Little tunny(=Atl.black skipj) Scombridae Tunas, bonitos, billfishesIstiophoridae Marlins,sailfishes,etc. nei Istiophoridae Tunas, bonitos, billfishesIstiophorus albicans Atlantic sailfish Istiophoridae Tunas, bonitos, billfishesIstiophorus platypterus Indo-Pacific sailfish Istiophoridae Tunas, bonitos, billfishesKatsuwonus pelamis Skipjack tuna Scombridae Tunas, bonitos, billfishesMakaira indica Black marlin Istiophoridae Tunas, bonitos, billfishesMakaira mazara Indo-Pacific blue marlin Istiophoridae Tunas, bonitos, billfishesMakaira nigricans Atlantic blue marlin Istiophoridae Tunas, bonitos, billfishesTetrapturus albidus Atlantic white marlin Istiophoridae Tunas, bonitos, billfishesTetrapturus angustirostris Shortbill spearfish Istiophoridae Tunas, bonitos, billfishesTetrapturus audax Striped marlin Istiophoridae Tunas, bonitos, billfishesTetrapturus pfluegeri Longbill spearfish Istiophoridae Tunas, bonitos, billfishesThunnini Tunas nei Scombridae Tunas, bonitos, billfishesThunnus alalunga Albacore Scombridae Tunas, bonitos, billfishesThunnus albacares Yellowfin tuna Scombridae Tunas, bonitos, billfishesThunnus atlanticus Blackfin tuna Scombridae Tunas, bonitos, billfishesThunnus maccoyii Southern bluefin tuna Scombridae Tunas, bonitos, billfishesThunnus obesus Bigeye tuna Scombridae Tunas, bonitos, billfishesThunnus thynnus Atlantic bluefin tuna Scombridae Tunas, bonitos, billfishesXiphias gladius Swordfish Xiphiidae Tunas, bonitos, billfishesBrama brama Atlantic pomfret Bramidae Miscellaneous pelagic fishesCololabis saira Pacific saury Scomberesocidae Miscellaneous pelagic fishesCoryphaena hippurus Common dolphinfish Coryphaenidae Miscellaneous pelagic fishesCypselurus agoo Japanese flyingfish Exocoetidae Miscellaneous pelagic fishesLampris guttatus Opah Lampridae Miscellaneous pelagic fishesRegalecus glesne King of herrings Regalecidae Miscellaneous pelagic fishesScomberesox saurus Atlantic saury Scomberesocidae Miscellaneous pelagic fishesTrachipterus spp Dealfishes Trachipteridae Miscellaneous pelagic fishesAlopias superciliosus Bigeye thresher Alopiidae Sharks, rays, chimaerasAlopias vulpinus Thresher Alopiidae Sharks, rays, chimaerasCarcharhinidae Requiem sharks nei Carcharhinidae Sharks, rays, chimaerasCarcharhinus brachyurus Copper shark Carcharhinidae Sharks, rays, chimaerasCarcharhinus falciformis Silky shark Carcharhinidae Sharks, rays, chimaerasCarcharhinus limbatus Blacktip shark Carcharhinidae Sharks, rays, chimaerasCarcharhinus obscurus Dusky shark Carcharhinidae Sharks, rays, chimaerasCarcharhinus plumbeus Sandbar shark Carcharhinidae Sharks, rays, chimaerasCetorhinus maximus Basking shark Cetorhinidae Sharks, rays, chimaerasIsurus oxyrinchus Shortfin mako Lamnidae Sharks, rays, chimaerasIsurus paucus Longfin mako Lamnidae Sharks, rays, chimaerasIsurus spp Mako sharks Lamnidae Sharks, rays, chimaerasLamna nasus Porbeagle Lamnidae Sharks, rays, chimaerasPrionace glauca Blue shark Carcharhinidae Sharks, rays, chimaerasSphyrna lewini Scalloped hammerhead Sphyrnidae Sharks, rays, chimaerasSphyrna zygaena Smooth hammerhead Sphyrnidae Sharks, rays, chimaerasSphyrnidae Hammerhead sharks, etc. nei Sphyrnidae Sharks, rays, chimaerasEuphausia superba Antarctic krill Euphausiidae Krill, planktonic crustaceansMeganyctiphanes norvegica Norwegian krill Euphausiidae Krill, planktonic crustaceansDosidicus gigas Jumbo flying squid Ommastrephidae Squids, cuttlefishes, octopusesIllex illecebrosus Northern shortfin squid Ommastrephidae Squids, cuttlefishes, octopusesMartialia hyadesi Sevenstar flying squid Ommastrephidae Squids, cuttlefishes, octopusesNototodarus sloani Wellington flying squid Ommastrephidae Squids, cuttlefishes, octopusesOmmastrephes bartrami Neon flying squid Ommastrephidae Squids, cuttlefishes, octopusesTodarodes pacificus Japanese flying squid Ommastrephidae Squids, cuttlefishes, octopusesTodarodes sagittatus European flying squid Ommastrephidae Squids, cuttlefishes, octopuses
7
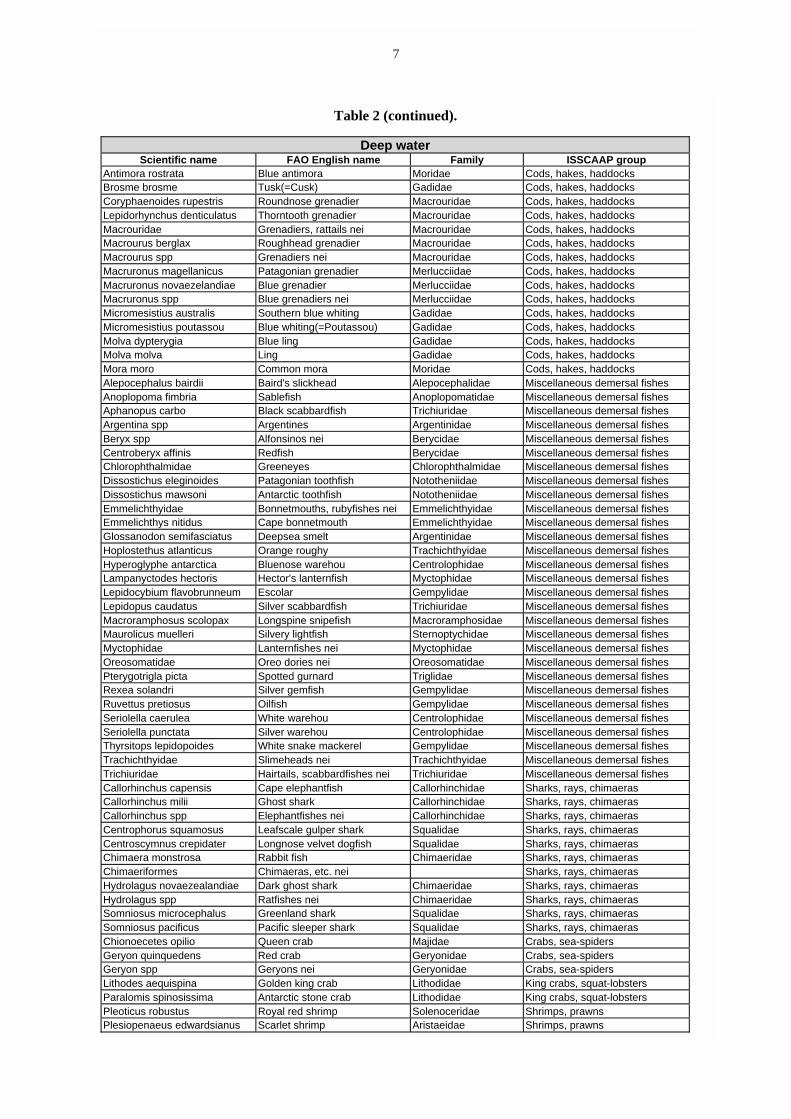
Table 2 (continued).
Deep waterScientific name FAO English name Family ISSCAAP group
Antimora rostrata Blue antimora Moridae Cods, hakes, haddocksBrosme brosme Tusk(=Cusk) Gadidae Cods, hakes, haddocksCoryphaenoides rupestris Roundnose grenadier Macrouridae Cods, hakes, haddocksLepidorhynchus denticulatus Thorntooth grenadier Macrouridae Cods, hakes, haddocksMacrouridae Grenadiers, rattails nei Macrouridae Cods, hakes, haddocksMacrourus berglax Roughhead grenadier Macrouridae Cods, hakes, haddocksMacrourus spp Grenadiers nei Macrouridae Cods, hakes, haddocksMacruronus magellanicus Patagonian grenadier Merlucciidae Cods, hakes, haddocksMacruronus novaezelandiae Blue grenadier Merlucciidae Cods, hakes, haddocksMacruronus spp Blue grenadiers nei Merlucciidae Cods, hakes, haddocksMicromesistius australis Southern blue whiting Gadidae Cods, hakes, haddocksMicromesistius poutassou Blue whiting(=Poutassou) Gadidae Cods, hakes, haddocksMolva dypterygia Blue ling Gadidae Cods, hakes, haddocksMolva molva Ling Gadidae Cods, hakes, haddocksMora moro Common mora Moridae Cods, hakes, haddocksAlepocephalus bairdii Baird's slickhead Alepocephalidae Miscellaneous demersal fishesAnoplopoma fimbria Sablefish Anoplopomatidae Miscellaneous demersal fishesAphanopus carbo Black scabbardfish Trichiuridae Miscellaneous demersal fishesArgentina spp Argentines Argentinidae Miscellaneous demersal fishesBeryx spp Alfonsinos nei Berycidae Miscellaneous demersal fishesCentroberyx affinis Redfish Berycidae Miscellaneous demersal fishesChlorophthalmidae Greeneyes Chlorophthalmidae Miscellaneous demersal fishesDissostichus eleginoides Patagonian toothfish Nototheniidae Miscellaneous demersal fishesDissostichus mawsoni Antarctic toothfish Nototheniidae Miscellaneous demersal fishesEmmelichthyidae Bonnetmouths, rubyfishes nei Emmelichthyidae Miscellaneous demersal fishesEmmelichthys nitidus Cape bonnetmouth Emmelichthyidae Miscellaneous demersal fishesGlossanodon semifasciatus Deepsea smelt Argentinidae Miscellaneous demersal fishesHoplostethus atlanticus Orange roughy Trachichthyidae Miscellaneous demersal fishesHyperoglyphe antarctica Bluenose warehou Centrolophidae Miscellaneous demersal fishesLampanyctodes hectoris Hector's lanternfish Myctophidae Miscellaneous demersal fishesLepidocybium flavobrunneum Escolar Gempylidae Miscellaneous demersal fishesLepidopus caudatus Silver scabbardfish Trichiuridae Miscellaneous demersal fishesMacroramphosus scolopax Longspine snipefish Macroramphosidae Miscellaneous demersal fishesMaurolicus muelleri Silvery lightfish Sternoptychidae Miscellaneous demersal fishesMyctophidae Lanternfishes nei Myctophidae Miscellaneous demersal fishesOreosomatidae Oreo dories nei Oreosomatidae Miscellaneous demersal fishesPterygotrigla picta Spotted gurnard Triglidae Miscellaneous demersal fishesRexea solandri Silver gemfish Gempylidae Miscellaneous demersal fishesRuvettus pretiosus Oilfish Gempylidae Miscellaneous demersal fishesSeriolella caerulea White warehou Centrolophidae Miscellaneous demersal fishesSeriolella punctata Silver warehou Centrolophidae Miscellaneous demersal fishesThyrsitops lepidopoides White snake mackerel Gempylidae Miscellaneous demersal fishesTrachichthyidae Slimeheads nei Trachichthyidae Miscellaneous demersal fishesTrichiuridae Hairtails, scabbardfishes nei Trichiuridae Miscellaneous demersal fishesCallorhinchus capensis Cape elephantfish Callorhinchidae Sharks, rays, chimaerasCallorhinchus milii Ghost shark Callorhinchidae Sharks, rays, chimaerasCallorhinchus spp Elephantfishes nei Callorhinchidae Sharks, rays, chimaerasCentrophorus squamosus Leafscale gulper shark Squalidae Sharks, rays, chimaerasCentroscymnus crepidater Longnose velvet dogfish Squalidae Sharks, rays, chimaerasChimaera monstrosa Rabbit fish Chimaeridae Sharks, rays, chimaerasChimaeriformes Chimaeras, etc. nei Sharks, rays, chimaerasHydrolagus novaezealandiae Dark ghost shark Chimaeridae Sharks, rays, chimaerasHydrolagus spp Ratfishes nei Chimaeridae Sharks, rays, chimaerasSomniosus microcephalus Greenland shark Squalidae Sharks, rays, chimaerasSomniosus pacificus Pacific sleeper shark Squalidae Sharks, rays, chimaerasChionoecetes opilio Queen crab Majidae Crabs, sea-spidersGeryon quinquedens Red crab Geryonidae Crabs, sea-spidersGeryon spp Geryons nei Geryonidae Crabs, sea-spidersLithodes aequispina Golden king crab Lithodidae King crabs, squat-lobstersParalomis spinosissima Antarctic stone crab Lithodidae King crabs, squat-lobstersPleoticus robustus Royal red shrimp Solenoceridae Shrimps, prawnsPlesiopenaeus edwardsianus Scarlet shrimp Aristaeidae Shrimps, prawns
2.2 Global trend
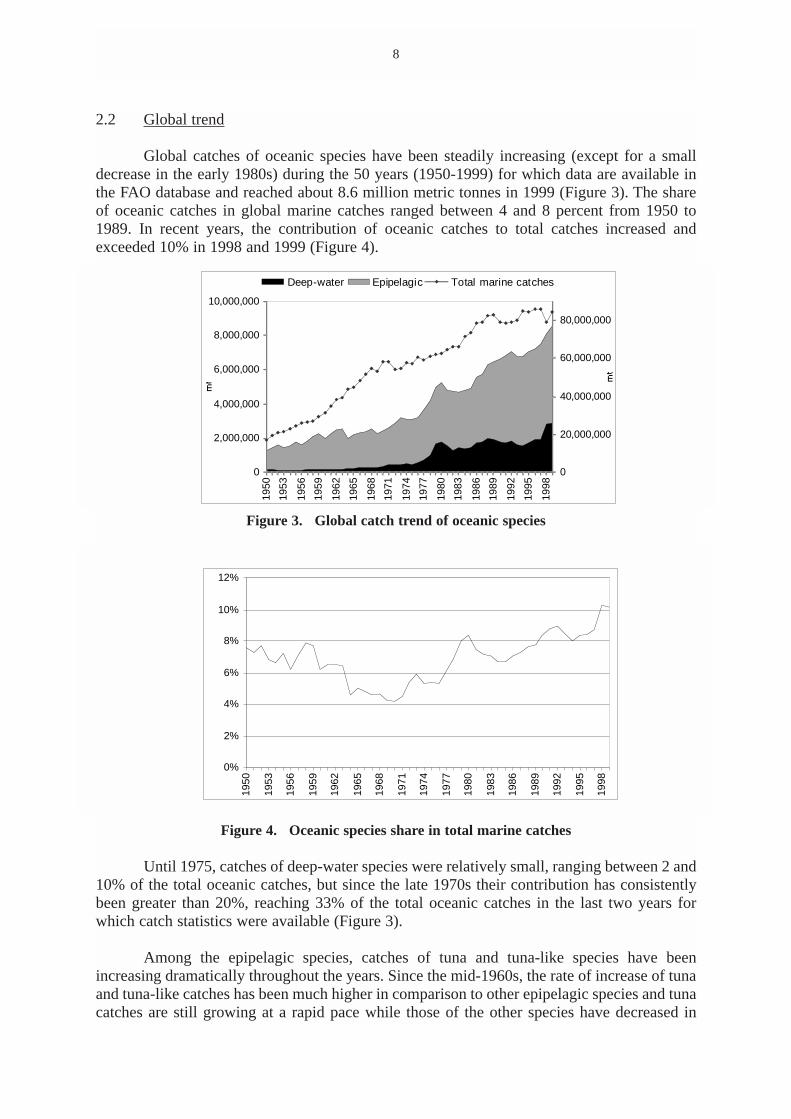
Global catches of oceanic species have been steadily increasing (except for a smalldecrease in the early 1980s) during the 50 years (1950-1999) for which data are available inthe FAO database and reached about 8.6 million metric tonnes in 1999 (Figure 3). The shareof oceanic catches in global marine catches ranged between 4 and 8 percent from 1950 to1989. In recent years, the contribution of oceanic catches to total catches increased andexceeded 10% in 1998 and 1999 (Figure 4).
Figure 3. Global catch trend of oceanic species
Figure 4. Oceanic species share in total marine catches
Until 1975, catches of deep-water species were relatively small, ranging between 2 and10% of the total oceanic catches, but since the late 1970s their contribution has consistentlybeen greater than 20%, reaching 33% of the total oceanic catches in the last two years forwhich catch statistics were available (Figure 3).
Among the epipelagic species, catches of tuna and tuna-like species have beenincreasing dramatically throughout the years. Since the mid-1960s, the rate of increase of tunaand tuna-like catches has been much higher in comparison to other epipelagic species and tunacatches are still growing at a rapid pace while those of the other species have decreased in
8
0
2,000,000
4,000,000
6,000,000
8,000,000
10,000,000
1950
1953
1956
1959
1962
1965
1968
1971
1974
1977
1980
1983
1986
1989
1992
1995
1998
0
20,000,000
40,000,000
60,000,000
80,000,000
Deep-water Epipelagic Total marine catches
0%
2%
4%
6%
8%
10%
12%
1950
1953
1956
1959
1962
1965
1968
1971
1974
1977
1980
1983
1986
1989
1992
1995
1998
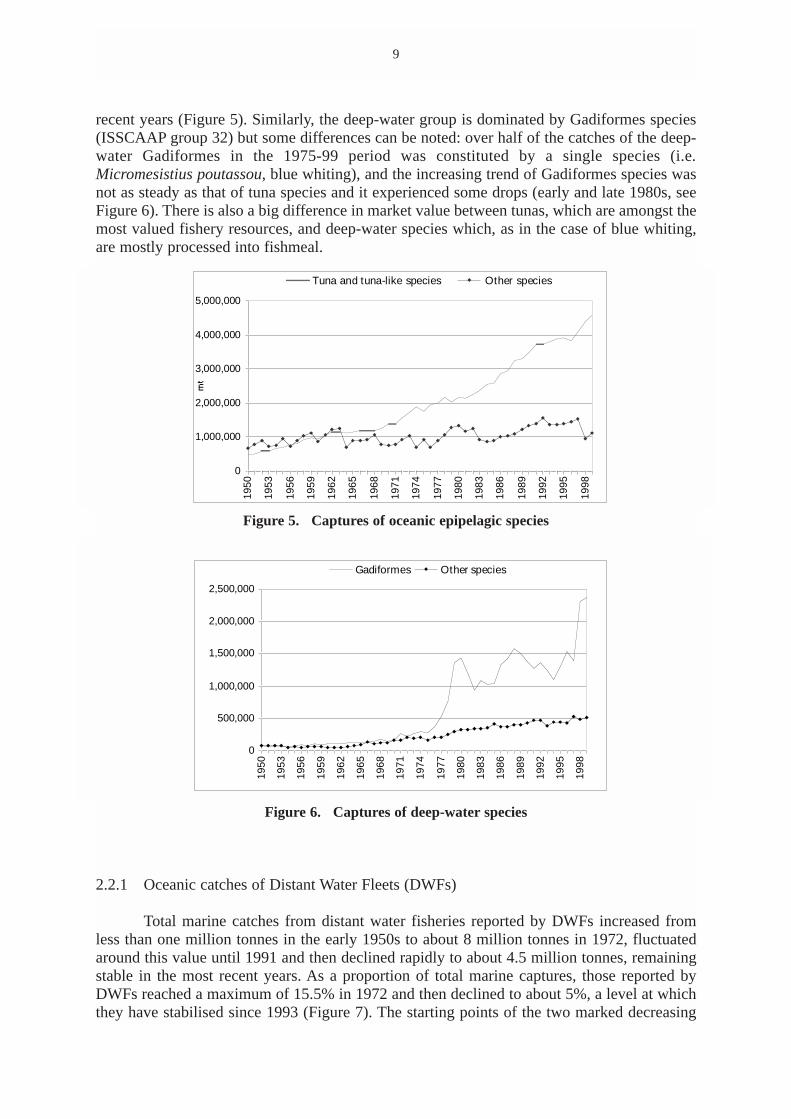
recent years (Figure 5). Similarly, the deep-water group is dominated by Gadiformes species(ISSCAAP group 32) but some differences can be noted: over half of the catches of the deep-water Gadiformes in the 1975-99 period was constituted by a single species (i.e.Micromesistius poutassou, blue whiting), and the increasing trend of Gadiformes species wasnot as steady as that of tuna species and it experienced some drops (early and late 1980s, seeFigure 6). There is also a big difference in market value between tunas, which are amongst themost valued fishery resources, and deep-water species which, as in the case of blue whiting,are mostly processed into fishmeal.
Figure 5. Captures of oceanic epipelagic species
Figure 6. Captures of deep-water species
2.2.1 Oceanic catches of Distant Water Fleets (DWFs)
Total marine catches from distant water fisheries reported by DWFs increased fromless than one million tonnes in the early 1950s to about 8 million tonnes in 1972, fluctuatedaround this value until 1991 and then declined rapidly to about 4.5 million tonnes, remainingstable in the most recent years. As a proportion of total marine captures, those reported byDWFs reached a maximum of 15.5% in 1972 and then declined to about 5%, a level at whichthey have stabilised since 1993 (Figure 7). The starting points of the two marked decreasing
9
0
1,000,000
2,000,000
3,000,000
4,000,000
5,000,000
1950
1953
1956
1959
1962
1965
1968
1971
1974
1977
1980
1983
1986
1989
1992
1995
1998
Tuna and tuna-like species Other species
0
500,000
1,000,000
1,500,000
2,000,000
2,500,000
1950
1953
1956
1959
1962
1965
1968
1971
1974
1977
1980
1983
1986
1989
1992
1995
1998Gadiformes Other species
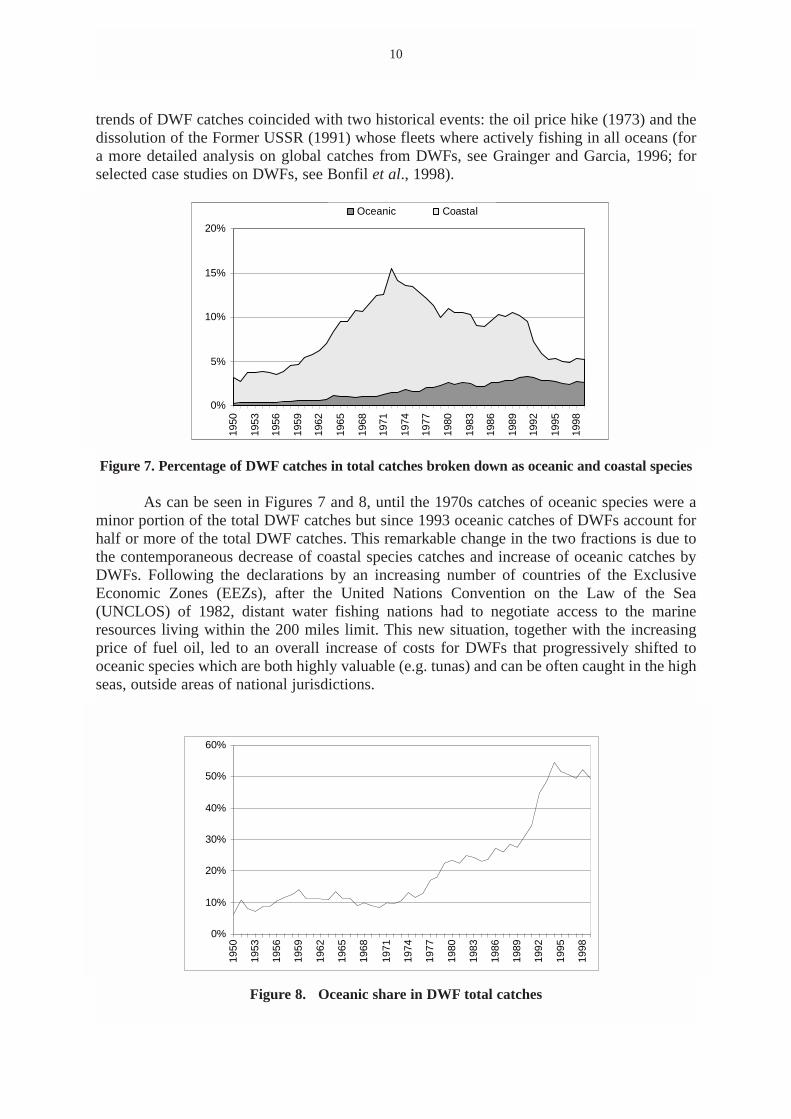
trends of DWF catches coincided with two historical events: the oil price hike (1973) and thedissolution of the Former USSR (1991) whose fleets where actively fishing in all oceans (fora more detailed analysis on global catches from DWFs, see Grainger and Garcia, 1996; forselected case studies on DWFs, see Bonfil et al., 1998).
Figure 7. Percentage of DWF catches in total catches broken down as oceanic and coastal species
As can be seen in Figures 7 and 8, until the 1970s catches of oceanic species were aminor portion of the total DWF catches but since 1993 oceanic catches of DWFs account forhalf or more of the total DWF catches. This remarkable change in the two fractions is due tothe contemporaneous decrease of coastal species catches and increase of oceanic catches byDWFs. Following the declarations by an increasing number of countries of the ExclusiveEconomic Zones (EEZs), after the United Nations Convention on the Law of the Sea(UNCLOS) of 1982, distant water fishing nations had to negotiate access to the marineresources living within the 200 miles limit. This new situation, together with the increasingprice of fuel oil, led to an overall increase of costs for DWFs that progressively shifted tooceanic species which are both highly valuable (e.g. tunas) and can be often caught in the highseas, outside areas of national jurisdictions.
Figure 8. Oceanic share in DWF total catches
10
0%
5%
10%
15%
20%19
50
1953
1956
1959
1962
1965
1968
1971
1974
1977
1980
1983
1986
1989
1992
1995
1998
Oceanic Coastal
0%
10%
20%
30%
40%
50%
60%
1950
1953
1956
1959
1962
1965
1968
1971
1974
1977
1980
1983
1986
1989
1992
1995
1998
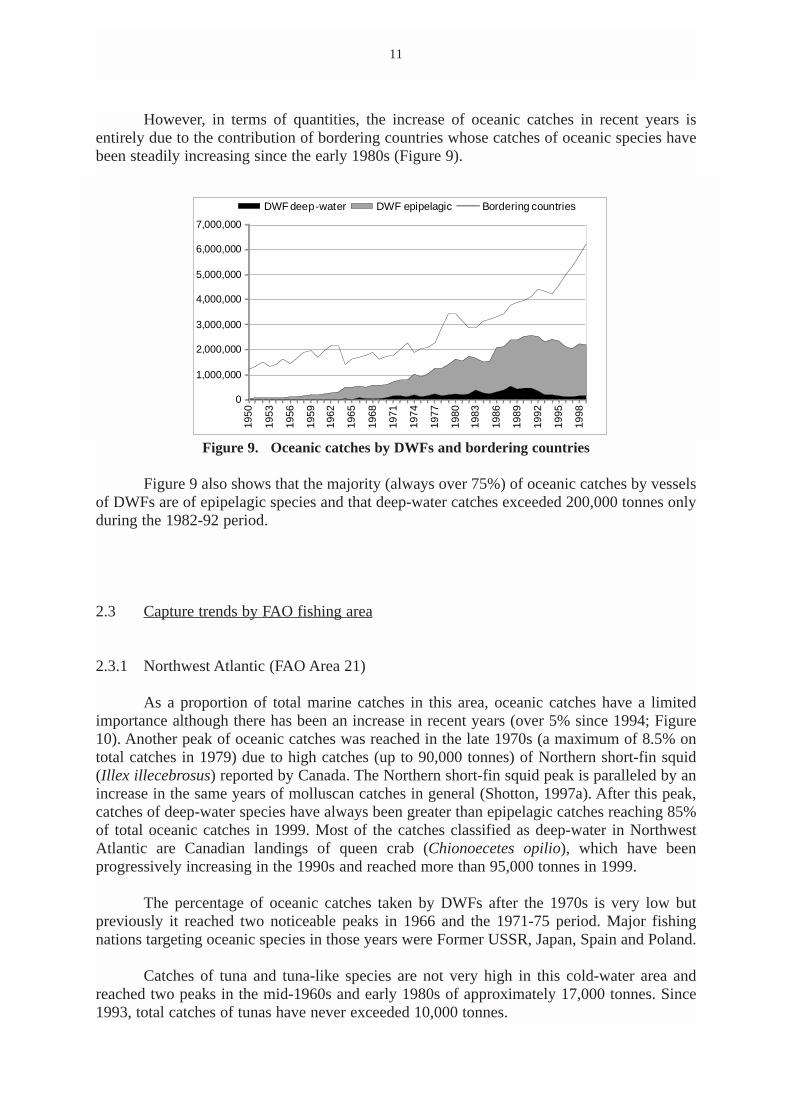
However, in terms of quantities, the increase of oceanic catches in recent years isentirely due to the contribution of bordering countries whose catches of oceanic species havebeen steadily increasing since the early 1980s (Figure 9).
Figure 9. Oceanic catches by DWFs and bordering countries
Figure 9 also shows that the majority (always over 75%) of oceanic catches by vesselsof DWFs are of epipelagic species and that deep-water catches exceeded 200,000 tonnes onlyduring the 1982-92 period.
2.3 Capture trends by FAO fishing area
2.3.1 Northwest Atlantic (FAO Area 21)
As a proportion of total marine catches in this area, oceanic catches have a limitedimportance although there has been an increase in recent years (over 5% since 1994; Figure10). Another peak of oceanic catches was reached in the late 1970s (a maximum of 8.5% ontotal catches in 1979) due to high catches (up to 90,000 tonnes) of Northern short-fin squid(Illex illecebrosus) reported by Canada. The Northern short-fin squid peak is paralleled by anincrease in the same years of molluscan catches in general (Shotton, 1997a). After this peak,catches of deep-water species have always been greater than epipelagic catches reaching 85%of total oceanic catches in 1999. Most of the catches classified as deep-water in NorthwestAtlantic are Canadian landings of queen crab (Chionoecetes opilio), which have beenprogressively increasing in the 1990s and reached more than 95,000 tonnes in 1999.
The percentage of oceanic catches taken by DWFs after the 1970s is very low butpreviously it reached two noticeable peaks in 1966 and the 1971-75 period. Major fishingnations targeting oceanic species in those years were Former USSR, Japan, Spain and Poland.
Catches of tuna and tuna-like species are not very high in this cold-water area andreached two peaks in the mid-1960s and early 1980s of approximately 17,000 tonnes. Since1993, total catches of tunas have never exceeded 10,000 tonnes.
11
0
1,000,000
2,000,000
3,000,000
4,000,000
5,000,000
6,000,000
7,000,000
1950
1953
1956
1959
1962
1965
1968
1971
1974
1977
1980
1983
1986
1989
1992
1995
1998
DWF deep-water DWF epipelagic Bordering countries
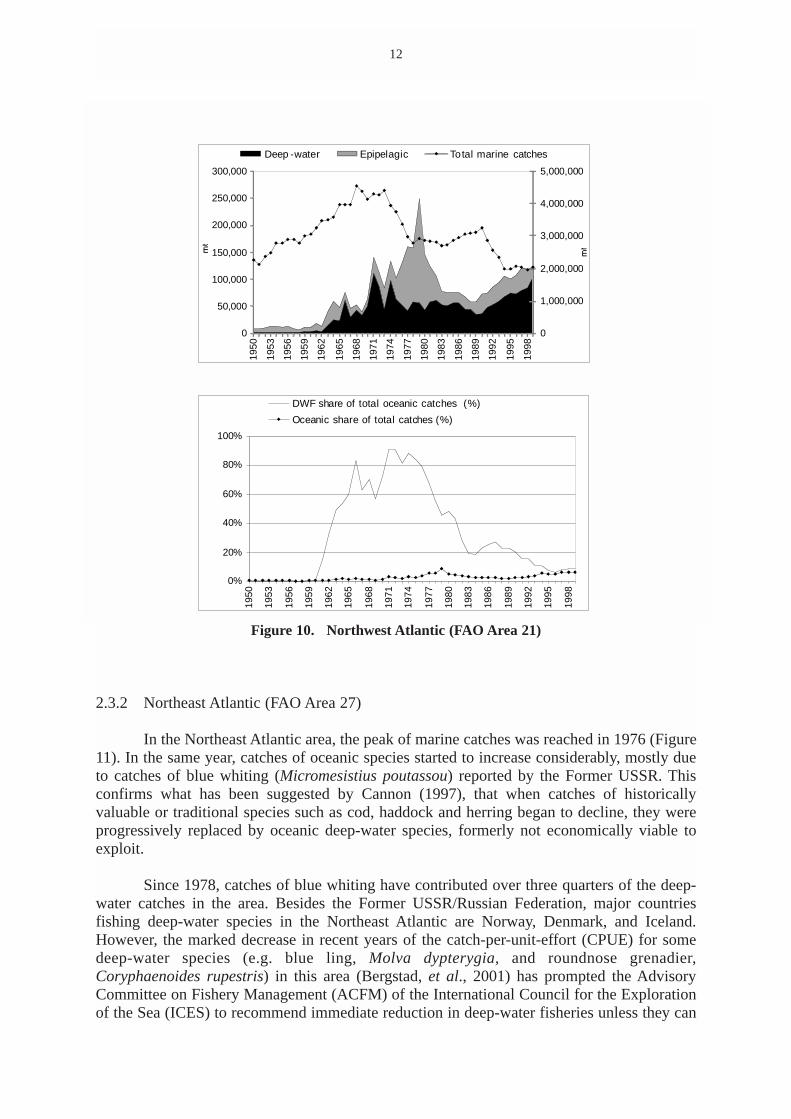
Figure 10. Northwest Atlantic (FAO Area 21)
2.3.2 Northeast Atlantic (FAO Area 27)
In the Northeast Atlantic area, the peak of marine catches was reached in 1976 (Figure11). In the same year, catches of oceanic species started to increase considerably, mostly dueto catches of blue whiting (Micromesistius poutassou) reported by the Former USSR. Thisconfirms what has been suggested by Cannon (1997), that when catches of historicallyvaluable or traditional species such as cod, haddock and herring began to decline, they wereprogressively replaced by oceanic deep-water species, formerly not economically viable toexploit.
Since 1978, catches of blue whiting have contributed over three quarters of the deep-water catches in the area. Besides the Former USSR/Russian Federation, major countriesfishing deep-water species in the Northeast Atlantic are Norway, Denmark, and Iceland.However, the marked decrease in recent years of the catch-per-unit-effort (CPUE) for somedeep-water species (e.g. blue ling, Molva dypterygia, and roundnose grenadier,Coryphaenoides rupestris) in this area (Bergstad, et al., 2001) has prompted the AdvisoryCommittee on Fishery Management (ACFM) of the International Council for the Explorationof the Sea (ICES) to recommend immediate reduction in deep-water fisheries unless they can
12
0
50,000
100,000
150,000
200,000
250,000
300,000
1950
1953
1956
1959
1962
1965
1968
1971
1974
1977
1980
1983
1986
1989
1992
1995
1998
0
1,000,000
2,000,000
3,000,000
4,000,000
5,000,000
Deep -water Epipelagic Total marine catches
0%
20%
40%
60%
80%
100%
1950
1953
1956
1959
1962
1965
1968
1971
1974
1977
1980
1983
1986
1989
1992
1995
1998
DWF share of total oceanic catches (%)
Oceanic share of total catches (%)
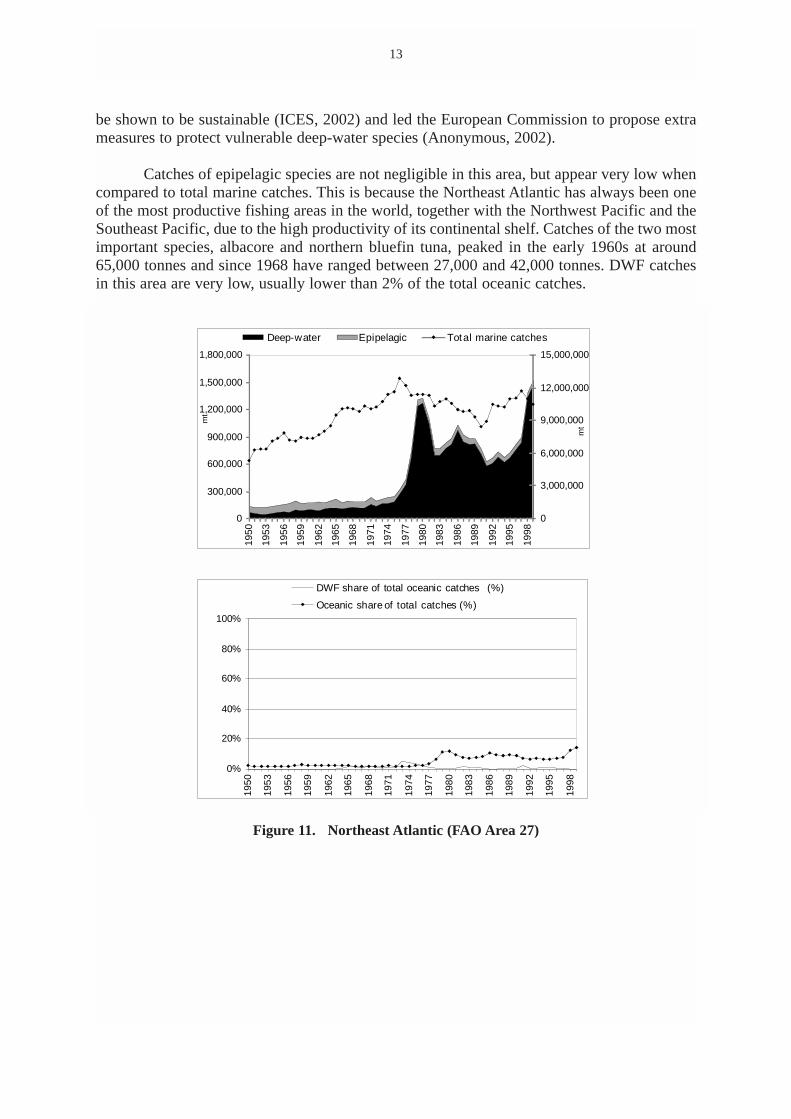
be shown to be sustainable (ICES, 2002) and led the European Commission to propose extrameasures to protect vulnerable deep-water species (Anonymous, 2002).
Catches of epipelagic species are not negligible in this area, but appear very low whencompared to total marine catches. This is because the Northeast Atlantic has always been oneof the most productive fishing areas in the world, together with the Northwest Pacific and theSoutheast Pacific, due to the high productivity of its continental shelf. Catches of the two mostimportant species, albacore and northern bluefin tuna, peaked in the early 1960s at around65,000 tonnes and since 1968 have ranged between 27,000 and 42,000 tonnes. DWF catchesin this area are very low, usually lower than 2% of the total oceanic catches.
Figure 11. Northeast Atlantic (FAO Area 27)
13
0
300,000
600,000
900,000
1,200,000
1,500,000
1,800,000
1950
1953
1956
1959
1962
1965
1968
1971
1974
1977
1980
1983
1986
1989
1992
1995
1998
mt
0
3,000,000
6,000,000
9,000,000
12,000,000
15,000,000
mt
Deep-water Epipelagic Total marine catches
0%
20%
40%
60%
80%
100%
1950
1953
1956
1959
1962
1965
1968
1971
1974
1977
1980
1983
1986
1989
1992
1995
1998
DWF share of total oceanic catches (%)
Oceanic share of total catches (%)
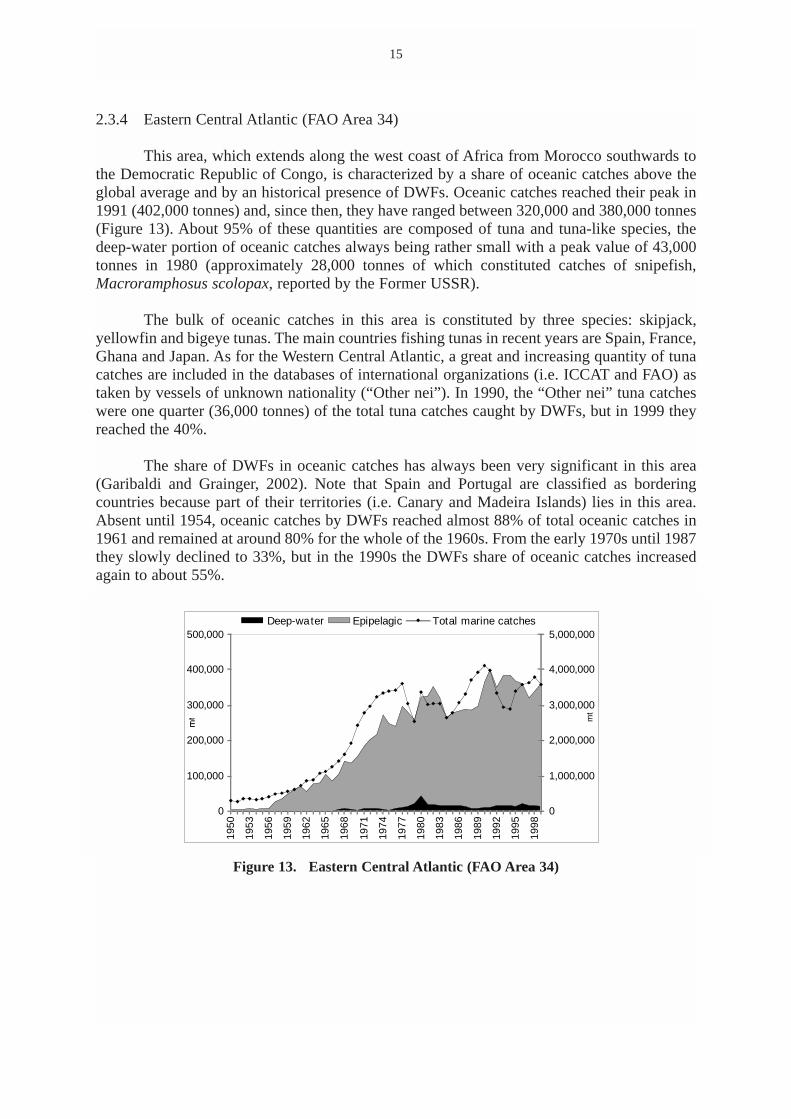
2.3.4 Eastern Central Atlantic (FAO Area 34)
This area, which extends along the west coast of Africa from Morocco southwards tothe Democratic Republic of Congo, is characterized by a share of oceanic catches above theglobal average and by an historical presence of DWFs. Oceanic catches reached their peak in1991 (402,000 tonnes) and, since then, they have ranged between 320,000 and 380,000 tonnes(Figure 13). About 95% of these quantities are composed of tuna and tuna-like species, thedeep-water portion of oceanic catches always being rather small with a peak value of 43,000tonnes in 1980 (approximately 28,000 tonnes of which constituted catches of snipefish,Macroramphosus scolopax, reported by the Former USSR).
The bulk of oceanic catches in this area is constituted by three species: skipjack,yellowfin and bigeye tunas. The main countries fishing tunas in recent years are Spain, France,Ghana and Japan. As for the Western Central Atlantic, a great and increasing quantity of tunacatches are included in the databases of international organizations (i.e. ICCAT and FAO) astaken by vessels of unknown nationality (“Other nei”). In 1990, the “Other nei” tuna catcheswere one quarter (36,000 tonnes) of the total tuna catches caught by DWFs, but in 1999 theyreached the 40%.
The share of DWFs in oceanic catches has always been very significant in this area(Garibaldi and Grainger, 2002). Note that Spain and Portugal are classified as borderingcountries because part of their territories (i.e. Canary and Madeira Islands) lies in this area.Absent until 1954, oceanic catches by DWFs reached almost 88% of total oceanic catches in1961 and remained at around 80% for the whole of the 1960s. From the early 1970s until 1987they slowly declined to 33%, but in the 1990s the DWFs share of oceanic catches increasedagain to about 55%.
Figure 13. Eastern Central Atlantic (FAO Area 34)
15
0
100,000
200,000
300,000
400,000
500,000
1950
1953
1956
1959
1962
1965
1968
1971
1974
1977
1980
1983
1986
1989
1992
1995
1998
0
1,000,000
2,000,000
3,000,000
4,000,000
5,000,000
mt
Deep-water Epipelagic Total marine catches
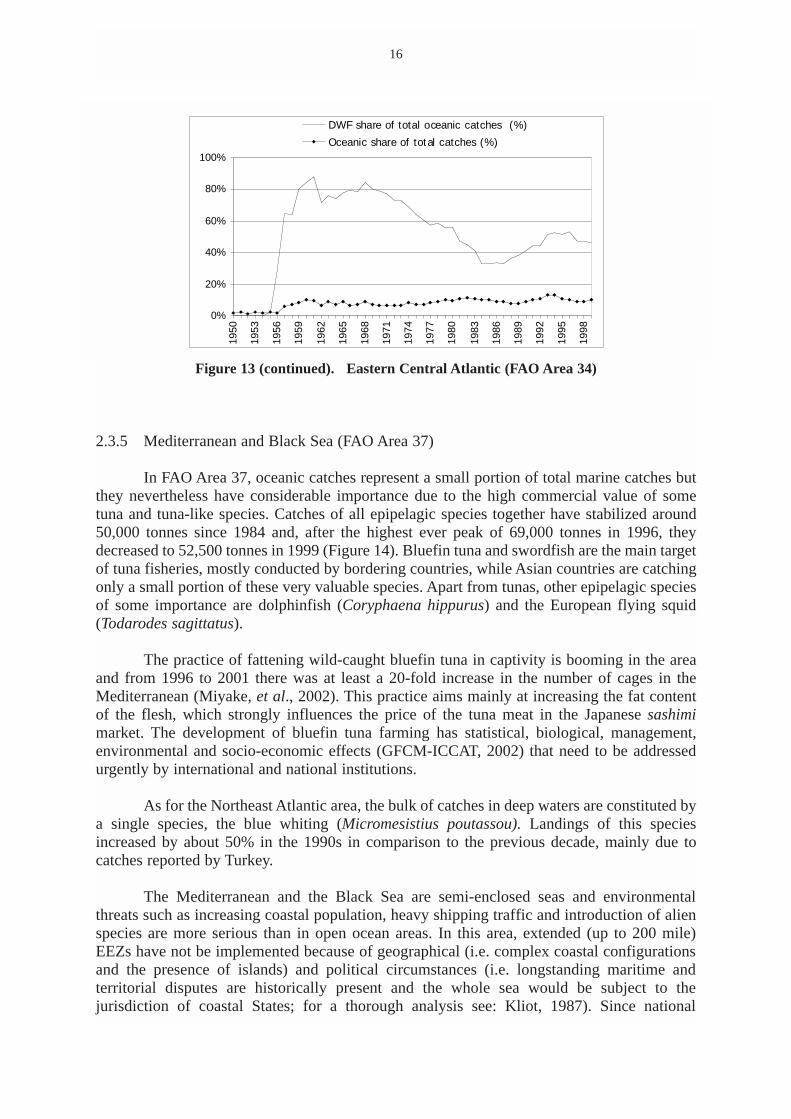
Figure 13 (continued). Eastern Central Atlantic (FAO Area 34)
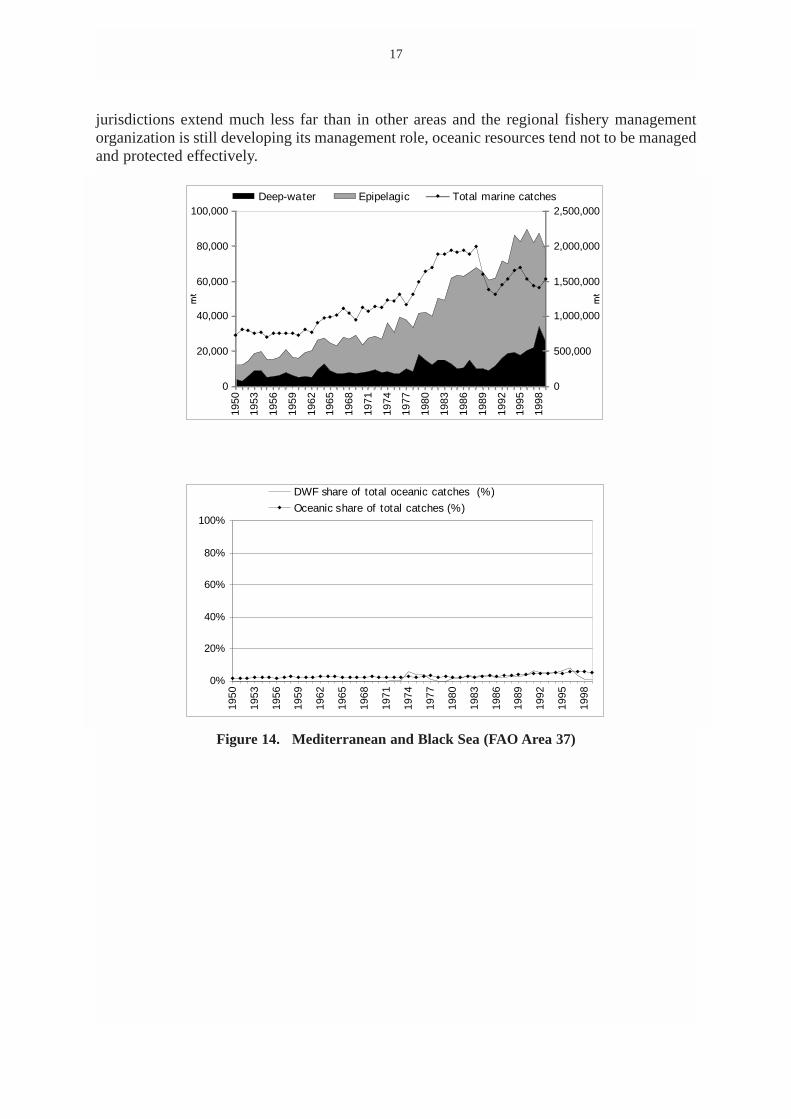
2.3.5 Mediterranean and Black Sea (FAO Area 37)
In FAO Area 37, oceanic catches represent a small portion of total marine catches butthey nevertheless have considerable importance due to the high commercial value of sometuna and tuna-like species. Catches of all epipelagic species together have stabilized around50,000 tonnes since 1984 and, after the highest ever peak of 69,000 tonnes in 1996, theydecreased to 52,500 tonnes in 1999 (Figure 14). Bluefin tuna and swordfish are the main targetof tuna fisheries, mostly conducted by bordering countries, while Asian countries are catchingonly a small portion of these very valuable species. Apart from tunas, other epipelagic speciesof some importance are dolphinfish (Coryphaena hippurus) and the European flying squid(Todarodes sagittatus).
The practice of fattening wild-caught bluefin tuna in captivity is booming in the areaand from 1996 to 2001 there was at least a 20-fold increase in the number of cages in theMediterranean (Miyake, et al., 2002). This practice aims mainly at increasing the fat contentof the flesh, which strongly influences the price of the tuna meat in the Japanese sashimimarket. The development of bluefin tuna farming has statistical, biological, management,environmental and socio-economic effects (GFCM-ICCAT, 2002) that need to be addressedurgently by international and national institutions.
As for the Northeast Atlantic area, the bulk of catches in deep waters are constituted bya single species, the blue whiting (Micromesistius poutassou). Landings of this speciesincreased by about 50% in the 1990s in comparison to the previous decade, mainly due tocatches reported by Turkey.
The Mediterranean and the Black Sea are semi-enclosed seas and environmentalthreats such as increasing coastal population, heavy shipping traffic and introduction of alienspecies are more serious than in open ocean areas. In this area, extended (up to 200 mile)EEZs have not be implemented because of geographical (i.e. complex coastal configurationsand the presence of islands) and political circumstances (i.e. longstanding maritime andterritorial disputes are historically present and the whole sea would be subject to thejurisdiction of coastal States; for a thorough analysis see: Kliot, 1987). Since national
16
0%
20%
40%
60%
80%
100%
1950
1953
1956
1959
1962
1965
1968
1971
1974
1977
1980
1983
1986
1989
1992
1995
1998
DWF share of total oceanic catches (%)
Oceanic share of total catches (%)
jurisdictions extend much less far than in other areas and the regional fishery managementorganization is still developing its management role, oceanic resources tend not to be managedand protected effectively.
Figure 14. Mediterranean and Black Sea (FAO Area 37)
17
0
20,000
40,000
60,000
80,000
100,000
1950
1953
1956
1959
1962
1965
1968
1971
1974
1977
1980
1983
1986
1989
1992
1995
1998
0
500,000
1,000,000
1,500,000
2,000,000
2,500,000Deep-water Epipelagic Total marine catches
0%
20%
40%
60%
80%
100%
1950
1953
1956
1959
1962
1965
1968
1971
1974
1977
1980
1983
1986
1989
1992
1995
1998
DWF share of total oceanic catches (%)
Oceanic share of total catches (%)
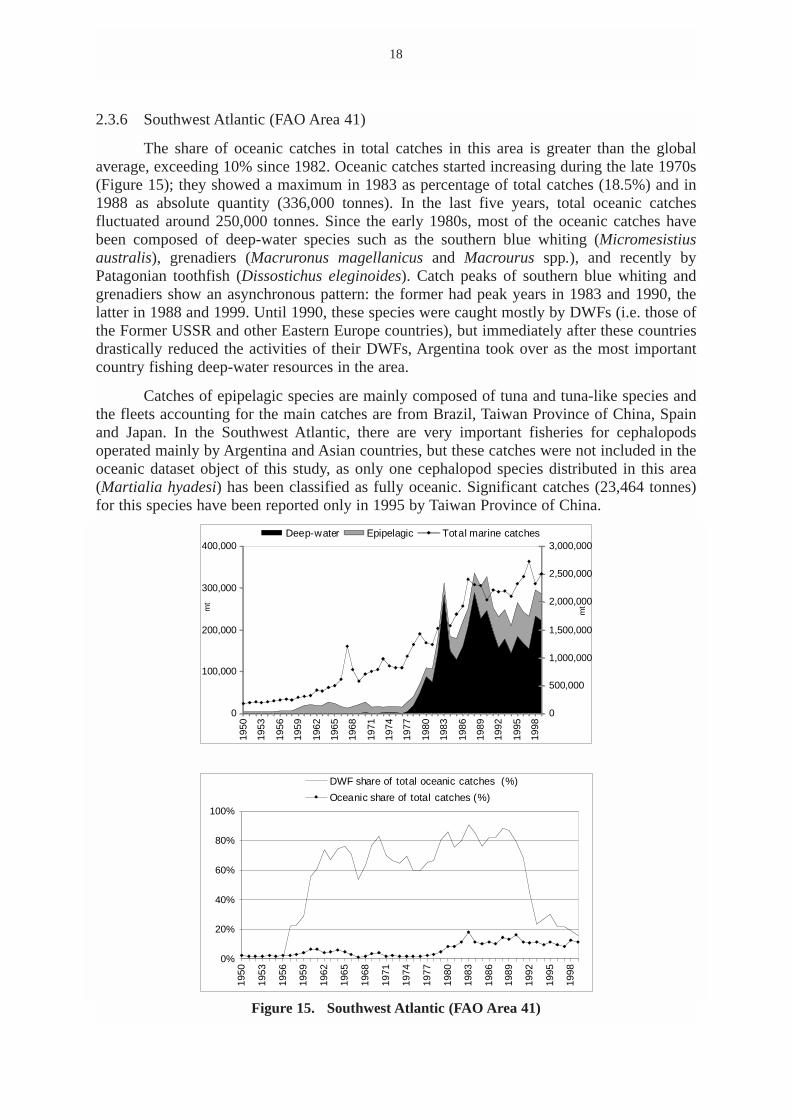
2.3.6 Southwest Atlantic (FAO Area 41)
The share of oceanic catches in total catches in this area is greater than the globalaverage, exceeding 10% since 1982. Oceanic catches started increasing during the late 1970s(Figure 15); they showed a maximum in 1983 as percentage of total catches (18.5%) and in1988 as absolute quantity (336,000 tonnes). In the last five years, total oceanic catchesfluctuated around 250,000 tonnes. Since the early 1980s, most of the oceanic catches havebeen composed of deep-water species such as the southern blue whiting (Micromesistiusaustralis), grenadiers (Macruronus magellanicus and Macrourus spp.), and recently byPatagonian toothfish (Dissostichus eleginoides). Catch peaks of southern blue whiting andgrenadiers show an asynchronous pattern: the former had peak years in 1983 and 1990, thelatter in 1988 and 1999. Until 1990, these species were caught mostly by DWFs (i.e. those ofthe Former USSR and other Eastern Europe countries), but immediately after these countriesdrastically reduced the activities of their DWFs, Argentina took over as the most importantcountry fishing deep-water resources in the area.
Catches of epipelagic species are mainly composed of tuna and tuna-like species andthe fleets accounting for the main catches are from Brazil, Taiwan Province of China, Spainand Japan. In the Southwest Atlantic, there are very important fisheries for cephalopodsoperated mainly by Argentina and Asian countries, but these catches were not included in theoceanic dataset object of this study, as only one cephalopod species distributed in this area(Martialia hyadesi) has been classified as fully oceanic. Significant catches (23,464 tonnes)for this species have been reported only in 1995 by Taiwan Province of China.
Figure 15. Southwest Atlantic (FAO Area 41)
18
0
100,000
200,000
300,000
400,000
1950
1953
1956
1959
1962
1965
1968
1971
1974
1977
1980
1983
1986
1989
1992
1995
1998
mt
0
500,000
1,000,000
1,500,000
2,000,000
2,500,000
3,000,000
mt
Deep-water Epipelagic Total marine catches
0%
20%
40%
60%
80%
100%
1950
1953
1956
1959
1962
1965
1968
1971
1974
1977
1980
1983
1986
1989
1992
1995
1998
DWF share of total oceanic catches (%)
Oceanic share of total catches (%)
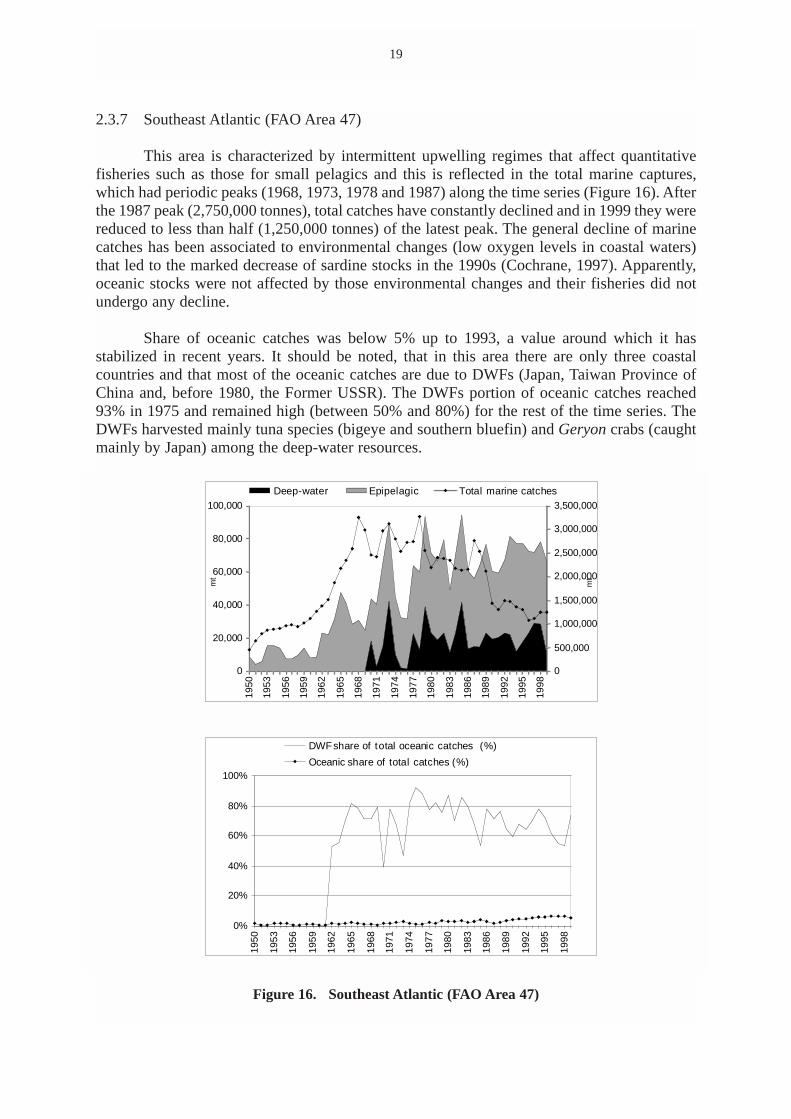
2.3.7 Southeast Atlantic (FAO Area 47)
This area is characterized by intermittent upwelling regimes that affect quantitativefisheries such as those for small pelagics and this is reflected in the total marine captures,which had periodic peaks (1968, 1973, 1978 and 1987) along the time series (Figure 16). Afterthe 1987 peak (2,750,000 tonnes), total catches have constantly declined and in 1999 they werereduced to less than half (1,250,000 tonnes) of the latest peak. The general decline of marinecatches has been associated to environmental changes (low oxygen levels in coastal waters)that led to the marked decrease of sardine stocks in the 1990s (Cochrane, 1997). Apparently,oceanic stocks were not affected by those environmental changes and their fisheries did notundergo any decline.
Share of oceanic catches was below 5% up to 1993, a value around which it hasstabilized in recent years. It should be noted, that in this area there are only three coastalcountries and that most of the oceanic catches are due to DWFs (Japan, Taiwan Province ofChina and, before 1980, the Former USSR). The DWFs portion of oceanic catches reached93% in 1975 and remained high (between 50% and 80%) for the rest of the time series. TheDWFs harvested mainly tuna species (bigeye and southern bluefin) and Geryon crabs (caughtmainly by Japan) among the deep-water resources.
Figure 16. Southeast Atlantic (FAO Area 47)
19
0
20,000
40,000
60,000
80,000
100,000
1950
1953
1956
1959
1962
1965
1968
1971
1974
1977
1980
1983
1986
1989
1992
1995
1998
mt
0
500,000
1,000,000
1,500,000
2,000,000
2,500,000
3,000,000
3,500,000
mt
Deep-water Epipelagic Total marine catches
0%
20%
40%
60%
80%
100%
1950
1953
1956
1959
1962
1965
1968
1971
1974
1977
1980
1983
1986
1989
1992
1995
1998
DWFshare of total oceanic catches (%)
Oceanic share of total catches (%)
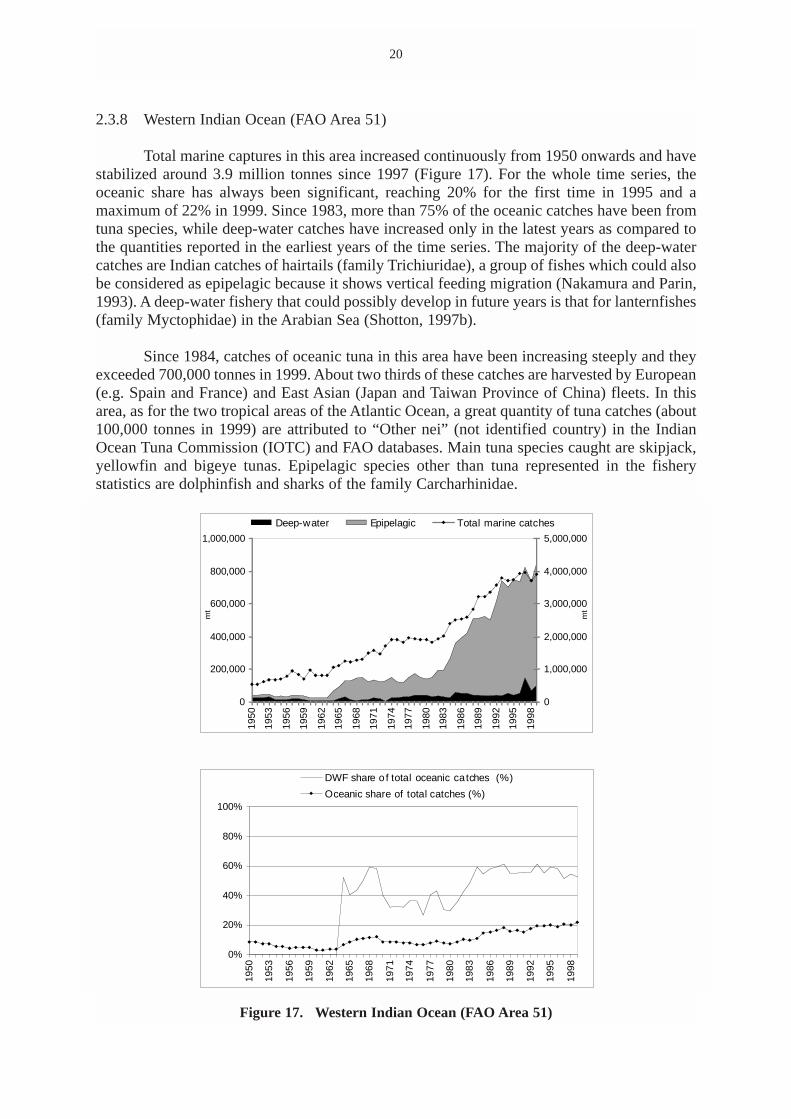
2.3.8 Western Indian Ocean (FAO Area 51)
Total marine captures in this area increased continuously from 1950 onwards and havestabilized around 3.9 million tonnes since 1997 (Figure 17). For the whole time series, theoceanic share has always been significant, reaching 20% for the first time in 1995 and amaximum of 22% in 1999. Since 1983, more than 75% of the oceanic catches have been fromtuna species, while deep-water catches have increased only in the latest years as compared tothe quantities reported in the earliest years of the time series. The majority of the deep-watercatches are Indian catches of hairtails (family Trichiuridae), a group of fishes which could alsobe considered as epipelagic because it shows vertical feeding migration (Nakamura and Parin,1993). A deep-water fishery that could possibly develop in future years is that for lanternfishes(family Myctophidae) in the Arabian Sea (Shotton, 1997b).
Since 1984, catches of oceanic tuna in this area have been increasing steeply and theyexceeded 700,000 tonnes in 1999. About two thirds of these catches are harvested by European(e.g. Spain and France) and East Asian (Japan and Taiwan Province of China) fleets. In thisarea, as for the two tropical areas of the Atlantic Ocean, a great quantity of tuna catches (about100,000 tonnes in 1999) are attributed to “Other nei” (not identified country) in the IndianOcean Tuna Commission (IOTC) and FAO databases. Main tuna species caught are skipjack,yellowfin and bigeye tunas. Epipelagic species other than tuna represented in the fisherystatistics are dolphinfish and sharks of the family Carcharhinidae.
Figure 17. Western Indian Ocean (FAO Area 51)
20
0
200,000
400,000
600,000
800,000
1,000,000
1950
1953
1956
1959
1962
1965
1968
1971
1974
1977
1980
1983
1986
1989
1992
1995
1998
mt
0
1,000,000
2,000,000
3,000,000
4,000,000
5,000,000
mt
Deep-water Epipelagic Total marine catches
0%
20%
40%
60%
80%
100%
1950
1953
1956
1959
1962
1965
1968
1971
1974
1977
1980
1983
1986
1989
1992
1995
1998
DWF share o f total oceanic catches (%)
Oceanic share of total catches (%)
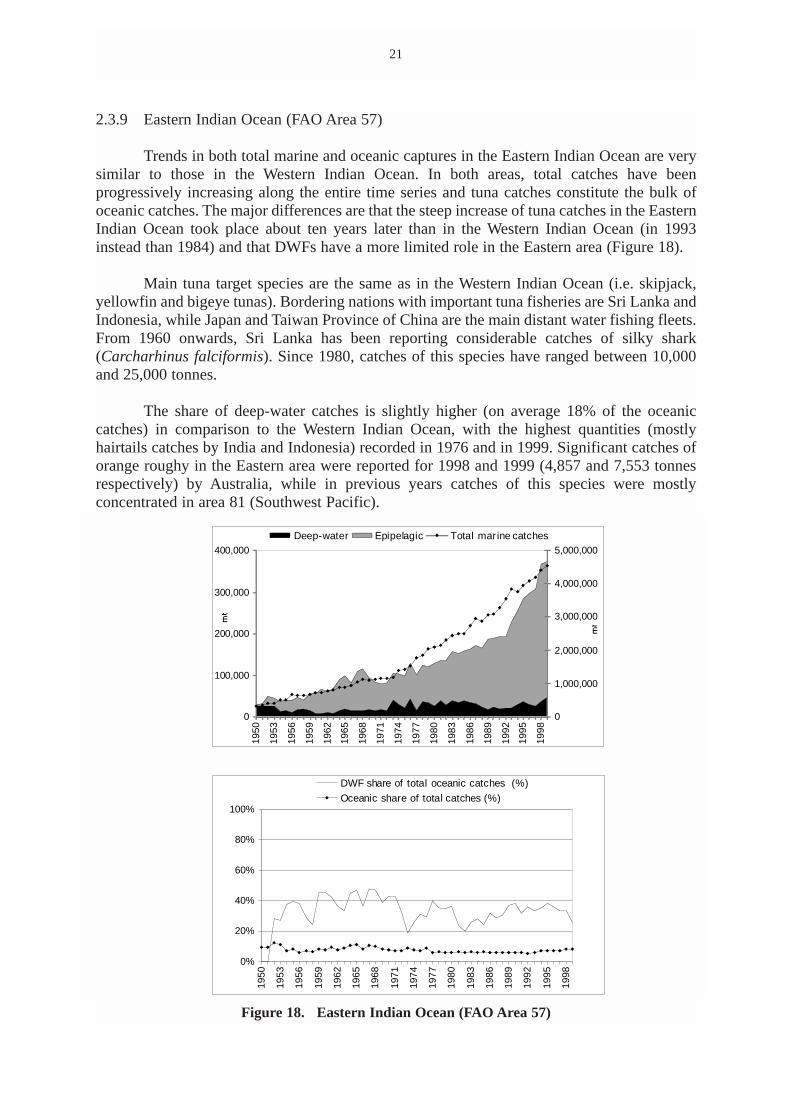
2.3.9 Eastern Indian Ocean (FAO Area 57)
Trends in both total marine and oceanic captures in the Eastern Indian Ocean are verysimilar to those in the Western Indian Ocean. In both areas, total catches have beenprogressively increasing along the entire time series and tuna catches constitute the bulk ofoceanic catches. The major differences are that the steep increase of tuna catches in the EasternIndian Ocean took place about ten years later than in the Western Indian Ocean (in 1993instead than 1984) and that DWFs have a more limited role in the Eastern area (Figure 18).
Main tuna target species are the same as in the Western Indian Ocean (i.e. skipjack,yellowfin and bigeye tunas). Bordering nations with important tuna fisheries are Sri Lanka andIndonesia, while Japan and Taiwan Province of China are the main distant water fishing fleets.From 1960 onwards, Sri Lanka has been reporting considerable catches of silky shark(Carcharhinus falciformis). Since 1980, catches of this species have ranged between 10,000and 25,000 tonnes.
The share of deep-water catches is slightly higher (on average 18% of the oceaniccatches) in comparison to the Western Indian Ocean, with the highest quantities (mostlyhairtails catches by India and Indonesia) recorded in 1976 and in 1999. Significant catches oforange roughy in the Eastern area were reported for 1998 and 1999 (4,857 and 7,553 tonnesrespectively) by Australia, while in previous years catches of this species were mostlyconcentrated in area 81 (Southwest Pacific).
Figure 18. Eastern Indian Ocean (FAO Area 57)
21
0%
20%
40%
60%
80%
100%
1950
1953
1956
1959
1962
1965
1968
1971
1974
1977
1980
1983
1986
1989
1992
1995
1998
DWF share of total oceanic catches (%)
Oceanic share of total catches (%)
0
100,000
200,000
300,000
400,000
1950
1953
1956
1959
1962
1965
1968
1971
1974
1977
1980
1983
1986
1989
1992
1995
1998
0
1,000,000
2,000,000
3,000,000
4,000,000
5,000,000
Deep-water Epipelagic Total marine catches
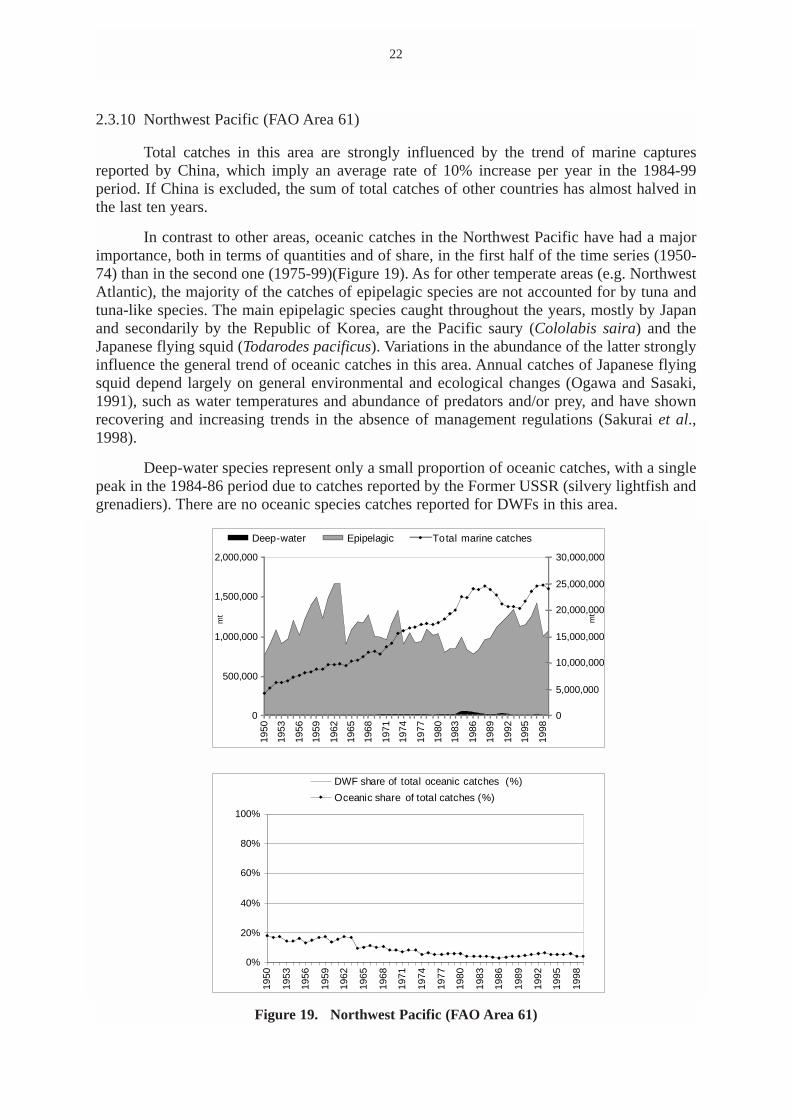
2.3.10 Northwest Pacific (FAO Area 61)
Total catches in this area are strongly influenced by the trend of marine capturesreported by China, which imply an average rate of 10% increase per year in the 1984-99period. If China is excluded, the sum of total catches of other countries has almost halved inthe last ten years.
In contrast to other areas, oceanic catches in the Northwest Pacific have had a majorimportance, both in terms of quantities and of share, in the first half of the time series (1950-74) than in the second one (1975-99)(Figure 19). As for other temperate areas (e.g. NorthwestAtlantic), the majority of the catches of epipelagic species are not accounted for by tuna andtuna-like species. The main epipelagic species caught throughout the years, mostly by Japanand secondarily by the Republic of Korea, are the Pacific saury (Cololabis saira) and theJapanese flying squid (Todarodes pacificus). Variations in the abundance of the latter stronglyinfluence the general trend of oceanic catches in this area. Annual catches of Japanese flyingsquid depend largely on general environmental and ecological changes (Ogawa and Sasaki,1991), such as water temperatures and abundance of predators and/or prey, and have shownrecovering and increasing trends in the absence of management regulations (Sakurai et al.,1998).
Deep-water species represent only a small proportion of oceanic catches, with a singlepeak in the 1984-86 period due to catches reported by the Former USSR (silvery lightfish andgrenadiers). There are no oceanic species catches reported for DWFs in this area.
Figure 19. Northwest Pacific (FAO Area 61)
22
0
500,000
1,000,000
1,500,000
2,000,000
1950
1953
1956
1959
1962
1965
1968
1971
1974
1977
1980
1983
1986
1989
1992
1995
1998
mt
0
5,000,000
10,000,000
15,000,000
20,000,000
25,000,000
30,000,000
mt
Deep-water Epipelagic Total marine catches
0%
20%
40%
60%
80%
100%
1950
1953
1956
1959
1962
1965
1968
1971
1974
1977
1980
1983
1986
1989
1992
1995
1998
DWF share of total oceanic catches (%)
Oceanic share of total catches (%)
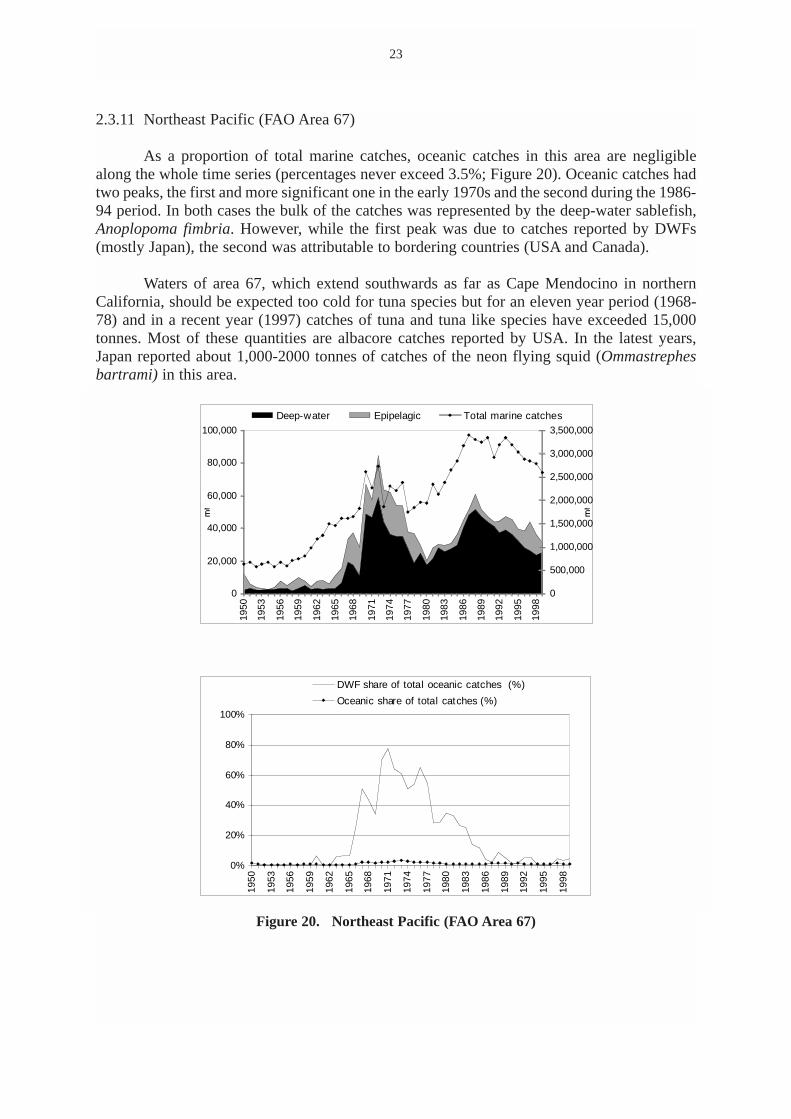
2.3.11 Northeast Pacific (FAO Area 67)
As a proportion of total marine catches, oceanic catches in this area are negligiblealong the whole time series (percentages never exceed 3.5%; Figure 20). Oceanic catches hadtwo peaks, the first and more significant one in the early 1970s and the second during the 1986-94 period. In both cases the bulk of the catches was represented by the deep-water sablefish,Anoplopoma fimbria. However, while the first peak was due to catches reported by DWFs(mostly Japan), the second was attributable to bordering countries (USA and Canada).
Waters of area 67, which extend southwards as far as Cape Mendocino in northernCalifornia, should be expected too cold for tuna species but for an eleven year period (1968-78) and in a recent year (1997) catches of tuna and tuna like species have exceeded 15,000tonnes. Most of these quantities are albacore catches reported by USA. In the latest years,Japan reported about 1,000-2000 tonnes of catches of the neon flying squid (Ommastrephesbartrami) in this area.
Figure 20. Northeast Pacific (FAO Area 67)
23
0
20,000
40,000
60,000
80,000
100,000
1950
1953
1956
1959
1962
1965
1968
1971
1974
1977
1980
1983
1986
1989
1992
1995
1998
0
500,000
1,000,000
1,500,000
2,000,000
2,500,000
3,000,000
3,500,000
Deep-water Epipelagic Total marine catches
0%
20%
40%
60%
80%
100%
1950
1953
1956
1959
1962
1965
1968
1971
1974
1977
1980
1983
1986
1989
1992
1995
1998
DWF share of total oceanic catches (%)
Oceanic share of total catches (%)
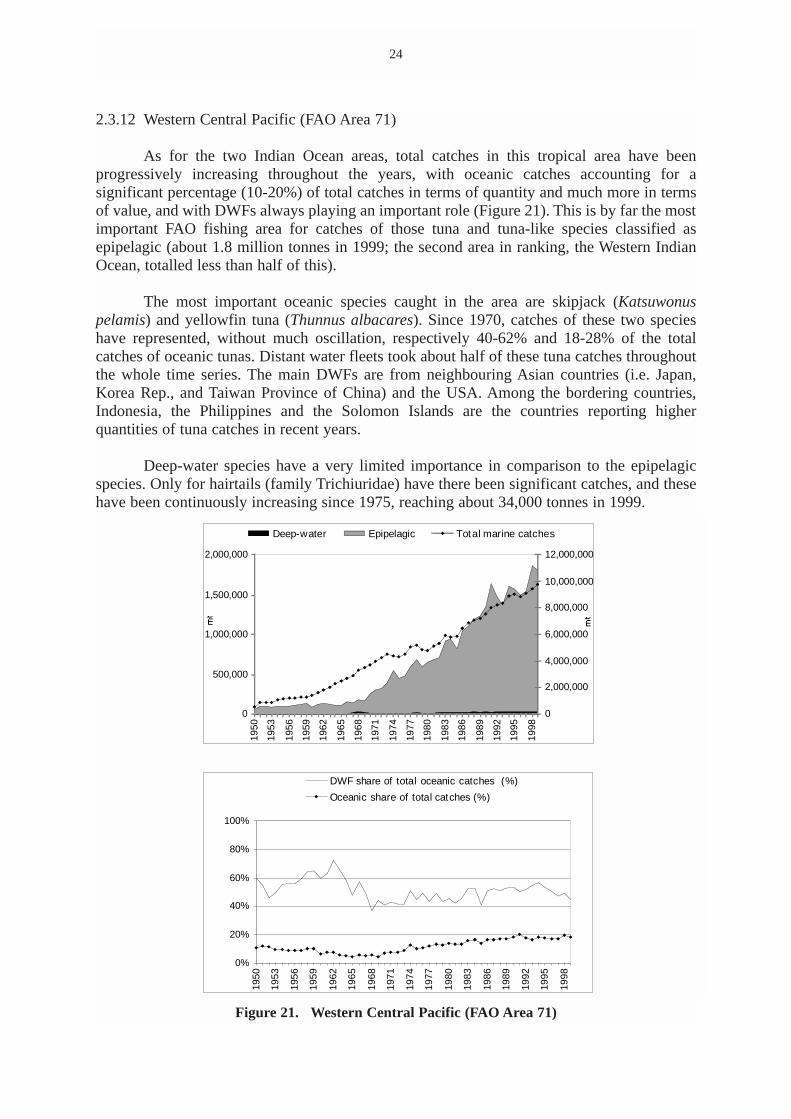
2.3.12 Western Central Pacific (FAO Area 71)
As for the two Indian Ocean areas, total catches in this tropical area have beenprogressively increasing throughout the years, with oceanic catches accounting for asignificant percentage (10-20%) of total catches in terms of quantity and much more in termsof value, and with DWFs always playing an important role (Figure 21). This is by far the mostimportant FAO fishing area for catches of those tuna and tuna-like species classified asepipelagic (about 1.8 million tonnes in 1999; the second area in ranking, the Western IndianOcean, totalled less than half of this).
The most important oceanic species caught in the area are skipjack (Katsuwonuspelamis) and yellowfin tuna (Thunnus albacares). Since 1970, catches of these two specieshave represented, without much oscillation, respectively 40-62% and 18-28% of the totalcatches of oceanic tunas. Distant water fleets took about half of these tuna catches throughoutthe whole time series. The main DWFs are from neighbouring Asian countries (i.e. Japan,Korea Rep., and Taiwan Province of China) and the USA. Among the bordering countries,Indonesia, the Philippines and the Solomon Islands are the countries reporting higherquantities of tuna catches in recent years.
Deep-water species have a very limited importance in comparison to the epipelagicspecies. Only for hairtails (family Trichiuridae) have there been significant catches, and thesehave been continuously increasing since 1975, reaching about 34,000 tonnes in 1999.
Figure 21. Western Central Pacific (FAO Area 71)
24
0
500,000
1,000,000
1,500,000
2,000,000
1950
1953
1956
1959
1962
1965
1968
1971
1974
1977
1980
1983
1986
1989
1992
1995
1998
0
2,000,000
4,000,000
6,000,000
8,000,000
10,000,000
12,000,000
Deep-water Epipelagic Total marine catches
0%
20%
40%
60%
80%
100%
1950
1953
1956
1959
1962
1965
1968
1971
1974
1977
1980
1983
1986
1989
1992
1995
1998
DWF share of total oceanic catches (%)
Oceanic share of total catches (%)
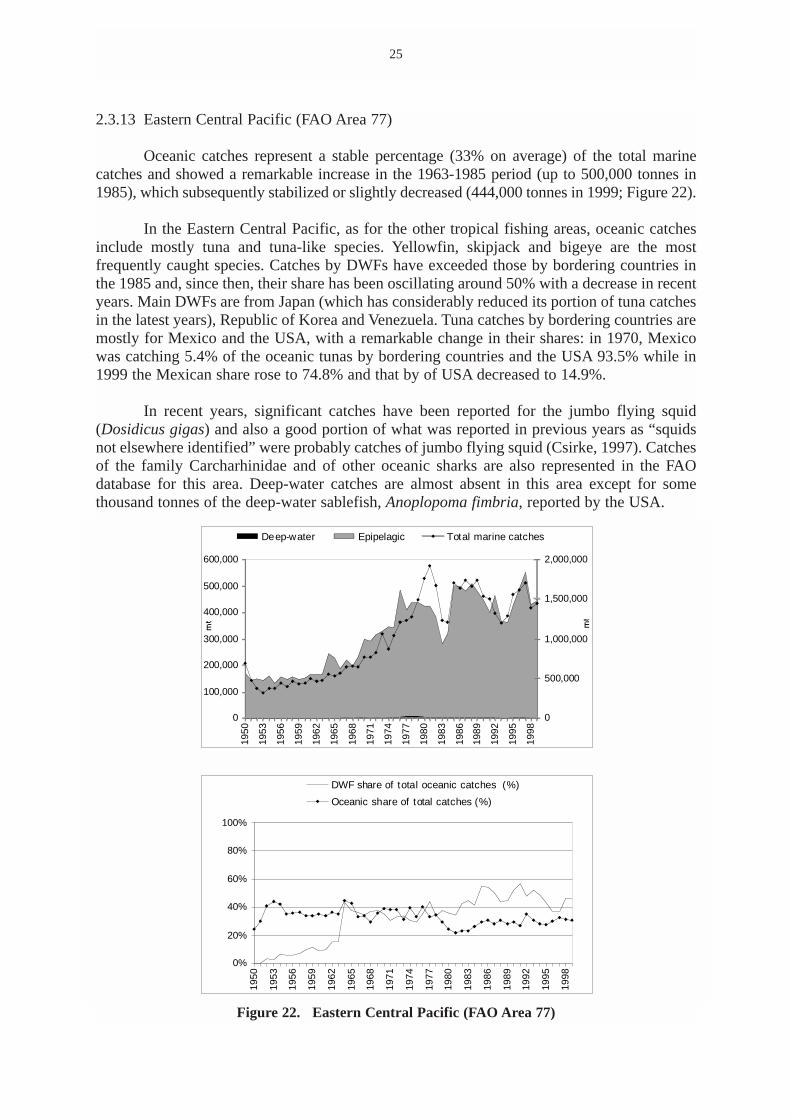
2.3.13 Eastern Central Pacific (FAO Area 77)
Oceanic catches represent a stable percentage (33% on average) of the total marinecatches and showed a remarkable increase in the 1963-1985 period (up to 500,000 tonnes in1985), which subsequently stabilized or slightly decreased (444,000 tonnes in 1999; Figure 22).
In the Eastern Central Pacific, as for the other tropical fishing areas, oceanic catchesinclude mostly tuna and tuna-like species. Yellowfin, skipjack and bigeye are the mostfrequently caught species. Catches by DWFs have exceeded those by bordering countries inthe 1985 and, since then, their share has been oscillating around 50% with a decrease in recentyears. Main DWFs are from Japan (which has considerably reduced its portion of tuna catchesin the latest years), Republic of Korea and Venezuela. Tuna catches by bordering countries aremostly for Mexico and the USA, with a remarkable change in their shares: in 1970, Mexicowas catching 5.4% of the oceanic tunas by bordering countries and the USA 93.5% while in1999 the Mexican share rose to 74.8% and that by of USA decreased to 14.9%.
In recent years, significant catches have been reported for the jumbo flying squid(Dosidicus gigas) and also a good portion of what was reported in previous years as “squidsnot elsewhere identified” were probably catches of jumbo flying squid (Csirke, 1997). Catchesof the family Carcharhinidae and of other oceanic sharks are also represented in the FAOdatabase for this area. Deep-water catches are almost absent in this area except for somethousand tonnes of the deep-water sablefish, Anoplopoma fimbria, reported by the USA.
Figure 22. Eastern Central Pacific (FAO Area 77)
25
0
100,000
200,000
300,000
400,000
500,000
600,000
1950
1953
1956
1959
1962
1965
1968
1971
1974
1977
1980
1983
1986
1989
1992
1995
1998
0
500,000
1,000,000
1,500,000
2,000,000
Deep-water Epipelagic Total marine catches
0%
20%
40%
60%
80%
100%
1950
1953
1956
1959
1962
1965
1968
1971
1974
1977
1980
1983
1986
1989
1992
1995
1998
DWF share of total oceanic catches (%)
Oceanic share of total catches (%)
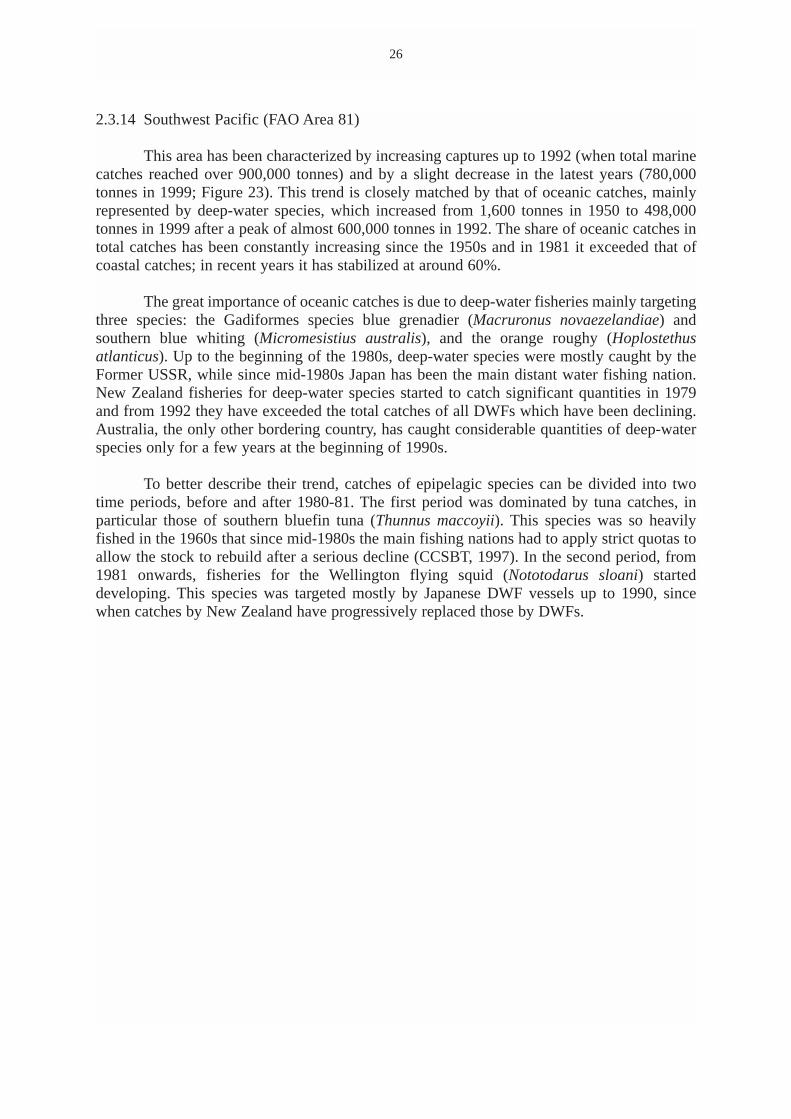
2.3.14 Southwest Pacific (FAO Area 81)
This area has been characterized by increasing captures up to 1992 (when total marinecatches reached over 900,000 tonnes) and by a slight decrease in the latest years (780,000tonnes in 1999; Figure 23). This trend is closely matched by that of oceanic catches, mainlyrepresented by deep-water species, which increased from 1,600 tonnes in 1950 to 498,000tonnes in 1999 after a peak of almost 600,000 tonnes in 1992. The share of oceanic catches intotal catches has been constantly increasing since the 1950s and in 1981 it exceeded that ofcoastal catches; in recent years it has stabilized at around 60%.
The great importance of oceanic catches is due to deep-water fisheries mainly targetingthree species: the Gadiformes species blue grenadier (Macruronus novaezelandiae) andsouthern blue whiting (Micromesistius australis), and the orange roughy (Hoplostethusatlanticus). Up to the beginning of the 1980s, deep-water species were mostly caught by theFormer USSR, while since mid-1980s Japan has been the main distant water fishing nation.New Zealand fisheries for deep-water species started to catch significant quantities in 1979and from 1992 they have exceeded the total catches of all DWFs which have been declining.Australia, the only other bordering country, has caught considerable quantities of deep-waterspecies only for a few years at the beginning of 1990s.
To better describe their trend, catches of epipelagic species can be divided into twotime periods, before and after 1980-81. The first period was dominated by tuna catches, inparticular those of southern bluefin tuna (Thunnus maccoyii). This species was so heavilyfished in the 1960s that since mid-1980s the main fishing nations had to apply strict quotas toallow the stock to rebuild after a serious decline (CCSBT, 1997). In the second period, from1981 onwards, fisheries for the Wellington flying squid (Nototodarus sloani) starteddeveloping. This species was targeted mostly by Japanese DWF vessels up to 1990, sincewhen catches by New Zealand have progressively replaced those by DWFs.
26
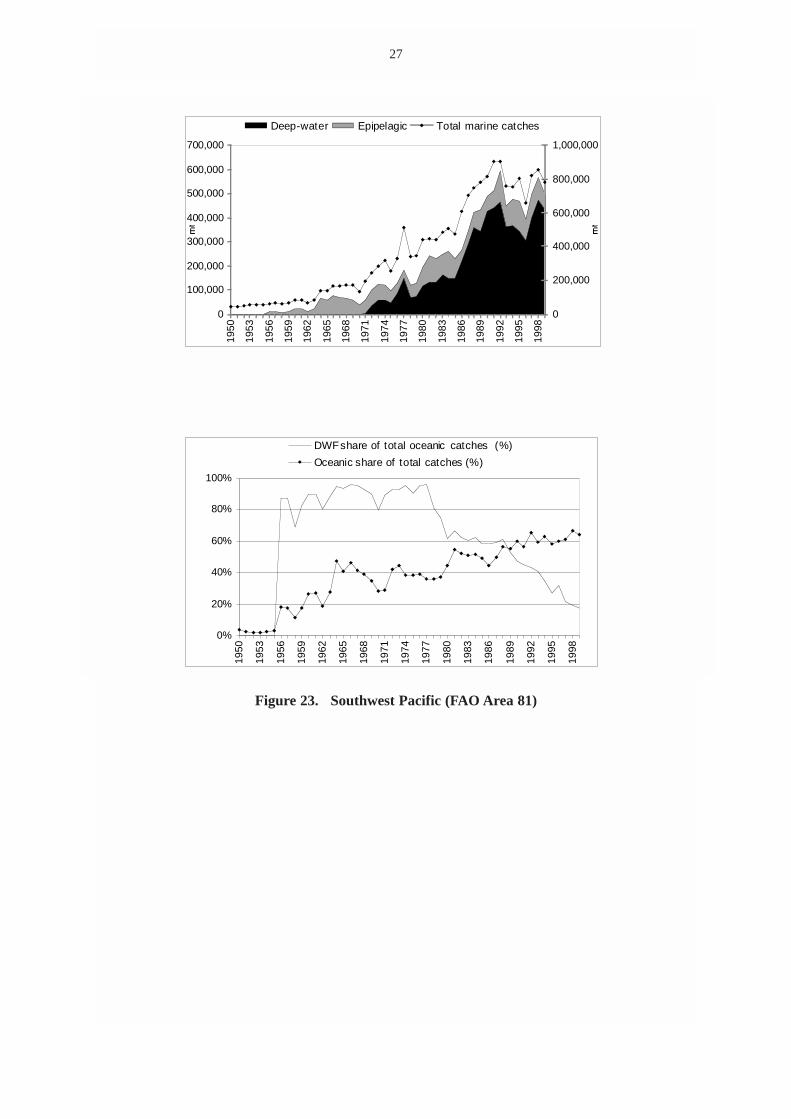
Figure 23. Southwest Pacific (FAO Area 81)
27
0
100,000
200,000
300,000
400,000
500,000
600,000
700,000
1950
1953
1956
1959
1962
1965
1968
1971
1974
1977
1980
1983
1986
1989
1992
1995
1998
0
200,000
400,000
600,000
800,000
1,000,000
Deep-water Epipelagic Total marine catches
0%
20%
40%
60%
80%
100%
1950
1953
1956
1959
1962
1965
1968
1971
1974
1977
1980
1983
1986
1989
1992
1995
1998
DWFshare of total oceanic catches (%)
Oceanic share of total catches (%)
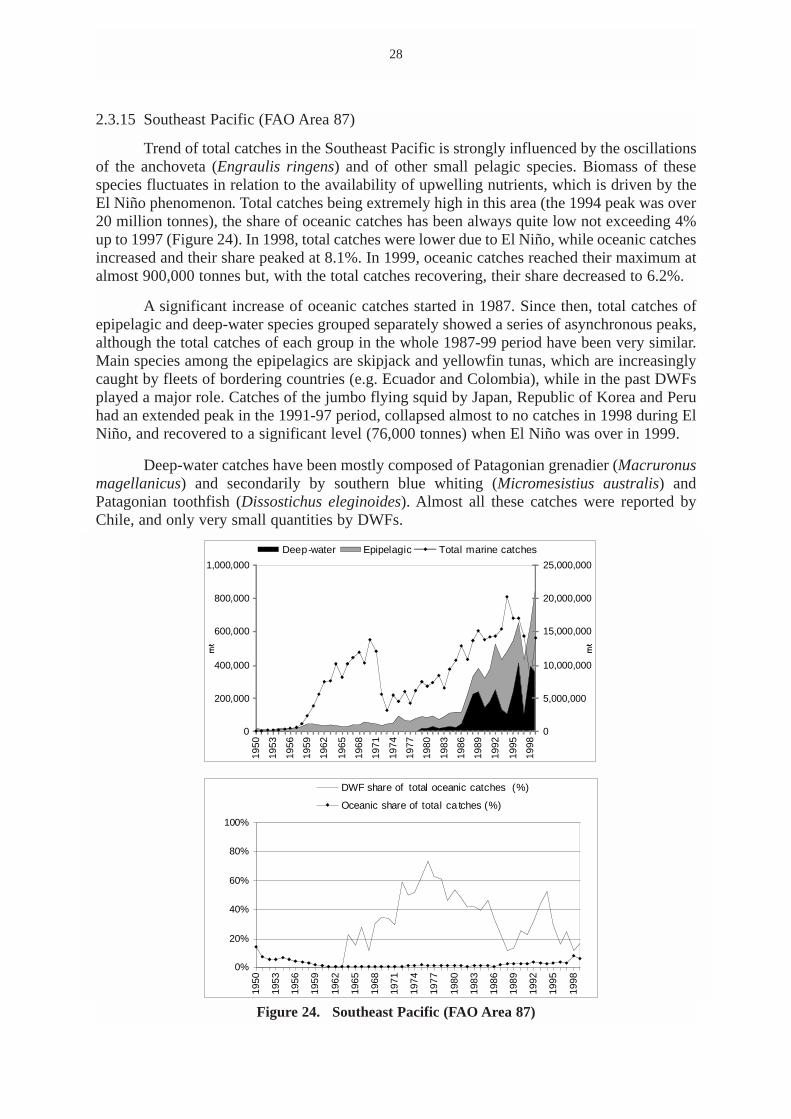
2.3.15 Southeast Pacific (FAO Area 87)
Trend of total catches in the Southeast Pacific is strongly influenced by the oscillationsof the anchoveta (Engraulis ringens) and of other small pelagic species. Biomass of thesespecies fluctuates in relation to the availability of upwelling nutrients, which is driven by theEl Niño phenomenon. Total catches being extremely high in this area (the 1994 peak was over20 million tonnes), the share of oceanic catches has been always quite low not exceeding 4%up to 1997 (Figure 24). In 1998, total catches were lower due to El Niño, while oceanic catchesincreased and their share peaked at 8.1%. In 1999, oceanic catches reached their maximum atalmost 900,000 tonnes but, with the total catches recovering, their share decreased to 6.2%.
A significant increase of oceanic catches started in 1987. Since then, total catches ofepipelagic and deep-water species grouped separately showed a series of asynchronous peaks,although the total catches of each group in the whole 1987-99 period have been very similar.Main species among the epipelagics are skipjack and yellowfin tunas, which are increasinglycaught by fleets of bordering countries (e.g. Ecuador and Colombia), while in the past DWFsplayed a major role. Catches of the jumbo flying squid by Japan, Republic of Korea and Peruhad an extended peak in the 1991-97 period, collapsed almost to no catches in 1998 during ElNiño, and recovered to a significant level (76,000 tonnes) when El Niño was over in 1999.
Deep-water catches have been mostly composed of Patagonian grenadier (Macruronusmagellanicus) and secondarily by southern blue whiting (Micromesistius australis) andPatagonian toothfish (Dissostichus eleginoides). Almost all these catches were reported byChile, and only very small quantities by DWFs.
Figure 24. Southeast Pacific (FAO Area 87)
28
0
200,000
400,000
600,000
800,000
1,000,000
1950
1953
1956
1959
1962
1965
1968
1971
1974
1977
1980
1983
1986
1989
1992
1995
1998
0
5,000,000
10,000,000
15,000,000
20,000,000
25,000,000
Deep-water Epipelagic Total marine catches
0%
20%
40%
60%
80%
100%
1950
1953
1956
1959
1962
1965
1968
1971
1974
1977
1980
1983
1986
1989
1992
1995
1998
DWF share of total oceanic catches (%)
Oceanic share of total ca tches (%)
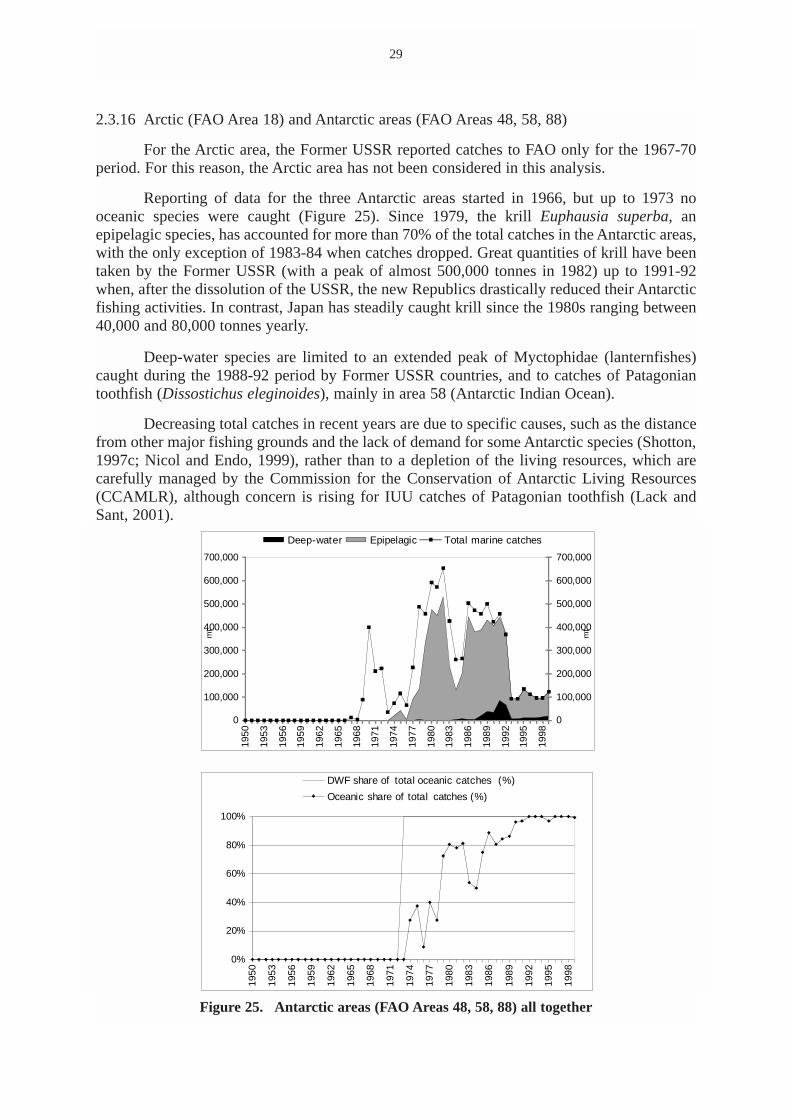
2.3.16 Arctic (FAO Area 18) and Antarctic areas (FAO Areas 48, 58, 88)
For the Arctic area, the Former USSR reported catches to FAO only for the 1967-70period. For this reason, the Arctic area has not been considered in this analysis.
Reporting of data for the three Antarctic areas started in 1966, but up to 1973 nooceanic species were caught (Figure 25). Since 1979, the krill Euphausia superba, anepipelagic species, has accounted for more than 70% of the total catches in the Antarctic areas,with the only exception of 1983-84 when catches dropped. Great quantities of krill have beentaken by the Former USSR (with a peak of almost 500,000 tonnes in 1982) up to 1991-92when, after the dissolution of the USSR, the new Republics drastically reduced their Antarcticfishing activities. In contrast, Japan has steadily caught krill since the 1980s ranging between40,000 and 80,000 tonnes yearly.
Deep-water species are limited to an extended peak of Myctophidae (lanternfishes)caught during the 1988-92 period by Former USSR countries, and to catches of Patagoniantoothfish (Dissostichus eleginoides), mainly in area 58 (Antarctic Indian Ocean).
Decreasing total catches in recent years are due to specific causes, such as the distancefrom other major fishing grounds and the lack of demand for some Antarctic species (Shotton,1997c; Nicol and Endo, 1999), rather than to a depletion of the living resources, which arecarefully managed by the Commission for the Conservation of Antarctic Living Resources(CCAMLR), although concern is rising for IUU catches of Patagonian toothfish (Lack andSant, 2001).
Figure 25. Antarctic areas (FAO Areas 48, 58, 88) all together
29
0
100,000
200,000
300,000
400,000
500,000
600,000
700,000
1950
1953
1956
1959
1962
1965
1968
1971
1974
1977
1980
1983
1986
1989
1992
1995
1998
mt
0
100,000
200,000
300,000
400,000
500,000
600,000
700,000
mt
Deep-water Epipelagic Total marine catches
0%
20%
40%
60%
80%
100%
1950
1953
1956
1959
1962
1965
1968
1971
1974
1977
1980
1983
1986
1989
1992
1995
1998
DWF share of total oceanic catches (%)
Oceanic share of total catches (%)
3. CONCLUSION
The classification of the oceanic species items (either epipelagic or deep water)included in the FAO capture fisheries database has allowed a description of the increasingshare of oceanic catches in total global marine catches. In the 1990s, concurrent with a slightlydeclining trend in total coastal species catches (excluding Peruvian anchoveta), both groups ofoceanic species have increased their catches by 1 million tonnes, epipelagics from 4.8 to 5.7million tonnes and deep-water species from 1.8 to 2.9 million tonnes.
The majority of oceanic epipelagic catches (mainly tuna and tuna-like species) is fromtropical areas whereas deep-water species are mostly caught in temperate regions. In the lastdecade, a continuous increase of epipelagic catches has occurred in the tropical areas of theIndian and Pacific Oceans whereas in the two tropical Atlantic areas they have been oscillatingand in 1999 totalled catches similar to those of 1990. Deep-water catches have recentlyincreased remarkably in the North Atlantic, probably due to a shift of fishing effort to newtarget species after the decline of other marine resources in the area, although there have beensigns of declining catches in other areas (e.g. Southwest Atlantic, Northeast Pacific andSouthwest Pacific) where deep-water species have been caught in significant quantities duringthe 1980s and in the early 1990s.
However, due to the peculiar biological characteristics of deep-water species, concernis rising on the sustainability of deep-water fisheries and, in particular in the NortheastAtlantic, regional fishery commissions and related institutions are proposing action to protectthe deep-water stocks (Anonymous, 2002; ICES, 2002). With regard to oceanic tunas and tuna-like species, differences in life history traits between tropical tunas and temperate tunas mayresult in different responses to fishing pressure (Fromentin and Fonteneau, 2001) and partiallyexplain why catches of tropical species are still growing whereas stocks of temperate bluefintuna species have shown serious declines in biomass and catches.
30
4. REFERENCES
Angel, M.V. 1993. “Biodiversity of the pelagic ocean”. Conservation Biology. 7(4): 760-766.
Anonymous. 2002. “EU to protect deep-water species”. Worldfish Report. 2002. No. 161,March 6, 2002. Agra Europe, London, UK.
Bergstad, O.A., J.D..M. Gordon , and P. Large. 2001. “Is time running out for deep-seafish?” ICES Newsletter. No. 38. December 2001.
Bonfil, R., G. Munro, U.R. Sumaila, H. Valtysson, M. Wright, T. Pitcher, D. Preikshot,N.Haggan, and D. Pauly. 1998. “Impacts of distant water fleets: an ecological, economicand social assessment”. In: WWF. The Footprint of Distant Water Fleet on WorldFisheries. Endangered Sea Campaign, WWF International, Godalming, Surrey, UK.
Caddy, J.F., F. Carocci, and S. Coppola. 1998. “Have peak fishery production levels beenpassed in continental shelf? Some perspectives arising from historical trends inproduction per shelf area”. Journal of Northwest Atlantic Fishery Science. 23: 191-219.
Caddy, J.F. and P.G. Rodhouse. 1998. “Cephalopod and groundfish landings: evidence forecological change in global fisheries?” Reviews in Fish Biology and Fisheries. 8(4):431-444.
Cannon, J. 1997. “Northeast Atlantic”. In: FAO, Review of the State of World FisheryResources: Marine Fisheries. FAO Fisheries Circular No. 884. FAO, Rome, Italy.
Carpenter, K.E. and V.H. Niem (eds.). 1999. FAO species identification guide for fisherypurposes. The living marine resources of the Western Central Pacific. Volume 3. Batoidfishes, chimaeras and bony fishes part 1 (Elopidae to Linophrynidae). FAO, Rome, Italy.
CCSBT (Commission for the Conservation of Southern Bluefin Tuna). 1997. “Fact Sheet”.On-line at: http://www.home.aone.net.au/ccsbt/facts.html. Viewed 28/08/01.
Clark, M. 1998. “Are deep-water fisheries sustainable? The example of orange roughy inNew Zealand”. In: International Council for the Exploration of the Sea (ICES), ICESTheme Session on Impact of Cephalopods in the Food Chain. ICES-CM-1998/O:14.ICES, Copenhagen, Denmark.
Cochrane, K. 1997. “Southeast Atlantic”. In: FAO, Review of the State of World FisheryResources: Marine Fisheries. FAO Fisheries Circular No. 884. FAO, Rome, Italy.
Csirke, J. 1997. “Eastern Central Pacific”. In: FAO, Review of the State of World FisheryResources: Marine Fisheries. FAO Fisheries Circular No. 884. FAO, Rome, Italy.
FAO (Food and Agriculture Organization of the United Nations). 1994. “World review ofhighly migratory species and straddling stocks”. FAO Fisheries Technical Paper. No.337. FAO, Rome, Italy.
FAO (Food and Agriculture Organization of the United Nations). 2001. Yearbook of FisheryStatistics – Capture Production 1999. Vol. 88/1. FAO, Rome, Italy. Downloadable at:http://www.fao.org/fi/statist/FISOFT/FISHPLUS.asp
31
Fromentin, J-M. and A. Fonteneau, 2001. “Fishing effects and life history traits: a case studycomparing tropical versus temperate tunas”. Fisheries Research. 53: 133-150.
Garibaldi, L. and R.J.R. Grainger. 2002. “Chronicles of catches from marine fisheries in theEastern Central Atlantic for 1950-2000”. In: Ba, M., P. Chavance, D. Gascuel, D. Paulyand M. Vakily (eds.), Proccedings of the Symposium “Marine fisheries, ecosystems, andsocieties in West Africa: half a century of change”, Dakar, Senegal, 24-28 June 2002.ACP-EU Fisheries Research Report of the European Union, in press.
GFCM (General Fisheries Commission for the Mediterranean) - ICCAT (InternationalCommission for the Conservation of Atlantic Tunas). 2002. Report of the sixth GFCM-ICCAT meeting on stocks of large pelagic fishes in the Mediterranean. Sliema, Malta,15-19 April 2002. On-line at: http://www.iccat.es/.
Gonzales, A.F, P.N. Trathan, C. Yau, and P.G. Rodhouse. 1997. “Interactions betweenoceanography, ecology and fishery biology of the ommastrephid squid Martialiahyadesi in the South Atlantic”. Marine Ecology Progress Series. 152 (1-3): 205-215.
Grainger, R.J.R. and S.M. Garcia. 1996. “Chronicles of marine fishery landings (1950-1994): Trend analysis and fisheries potential”. FAO Fisheries Technical Paper. No. 359.FAO, Rome, Italy.
Helfman, G.S., B.B. Collette, and D.E. Facey. 1997. The diversity of fishes. BlackwellScience, Inc., Malden (Mass.), USA.
ICCAT (International Commission for the Conservation of Atlantic Tunas). 2001. ICCATReport to the Nineteenth Session of the Coordinating Working Party on FisheryStatistics. Noumea, New Caledonia, July 10-13, 2001. On-line at:ftp://ftp.fao.org/fi/document/cwp/cwp_19/CWP-19-iccat.pdf . Viewed 31/08/01.
ICES (International Council for the Exploration of the Sea). 2002. Advisory Committee onFishery Management (ACFM) – 2002 Report. On-line at:http://www.ices.dk/committe/acfm/comwork/report/2002/oct/o-3-13.pdf .Viewed13/12/02.
Kliot, N. 1987. “Maritime boundaries in the Mediterranean: aspects of cooperation anddispute”. In: G. Blake, ed. Maritime Boundaries and Ocean Resources. Croom Helm,London, UK.
Lack, M. and G. Sant. 2001. “Patagonian toothfish: are conservation and trade measuresworking?” Traffic Bulletin. 19 (1): 15-32.
Miyake, P.M., J.M. de la Serna, A. Di Natale, A. Farrugia, I. Katavic, N. Miyabe, and V.Ticina. 2002. “General review of bluefin tuna farming in the Mediterranean area”. SixthGFCM-ICCAT meeting on stocks of large pelagic fishes in the Mediterranean. Sliema,Malta, 15-19 April 2002. ICCAT-SCRS/02/36.
Nakamura, I. and N. V. Parin. 1993. Snake mackerels and cutlassfishes of the world. FAOFisheries Synopsis No. 125, vol. 15. FAO, Rome, Italy.
32
Nicol, S. and Y. Endo. 1999. “Krill fisheries development, management and ecosystemimplications”. Aquatic Living Resources. 12(2): 105-120.
Ogawa, Y. and T. Sasaki. 1991. “Catch-fluctuation patterns of Todarodes pacificus(Steenstrup) in northern Japanese coastal waters of the Pacific Ocean”. Can. Transl.Fish. Aquat. Sci. 5523: 1-24.
Sakurai, Y., J.R. Bower, H. Kiyofuky, S. Saitoh, T. Goto, Y. Hiyama, K. Mori, and Y.Nakamura. 1998. “Changes in inferred spawning sites of Todarodes pacificus(Cephalopoda: Ommastrephidae) due to changing environmental conditions”. In:International Council for the Exploration of the Sea (ICES), ICES Theme Session onImpact of Cephalopods in the Food Chain. ICES-CM-1998/M:18. ICES, Copenhagen,Denmark.
Shotton, R. 1997a. “Northwest Atlantic”. In: FAO, Review of the State of World FisheryResources: Marine Fisheries. FAO Fisheries Circular No. 884. FAO, Rome, Italy.
Shotton, R. 1997b. “Lanternfishes: a potential fishery in the Northern Arabian Sea?”. In:FAO, Review of the State of World Fishery Resources: Marine Fisheries. FAO FisheriesCircular No. 884. FAO, Rome, Italy.
Shotton, R. 1997c. “Southwest Pacific”. In: FAO, Review of the State of World FisheryResources: Marine Fisheries. FAO Fisheries Circular No. 884. FAO, Rome, Italy.
Smith, D.C., G.E. Fenton, S.G. Robertson, and S.A. Short. 1995. “Age determination andgrowth of orange roughy (Hoplostethus atlanticus): a comparison of annulus countswith radiometric ageing”. Canadian Journal of Fisheries and Aquatic Sciences. 52(2):391-401.
Torry Research Station. 1980. “Handling and Processing Blue Whiting”. Torry AdvisoryNote. No. 81. Torry Research Station, Aberdeen, UK.
33
Clustering Large Marine Ecosystems by capture data
1. INTRODUCTION
The Johannesburg Plan of Implementation of the World Summit on SustainableDevelopment (Anonymous, 2002a), noting the Reykjavik Declaration on ResponsibleFisheries in the Marine Ecosystem (Anonymous, 2001), set the goal of encouraging theapplication by 2010 of the ecosystem approach to responsible fisheries (paragraph 29(d) ofthe Plan). This is an internationally agreed starting point for a new approach to fisheriesmanagement and fishery related studies utilizing a multinational, interdisciplinaryapproach, which integrates information concerning productivity, ecology, fisheries, socio-economic aspects and governance. Since mid-1980s, it has been developed the definitionof Large Marine Ecosystems (LMEs) that represented a proposal to give an ecology-basedpartition of global oceans. The LMEs project called for a more ecologically sensiblemonitoring of fishery resources, to go beyond the purely biological and socio-economicview of marine resources and improve the awareness of shared resources among countries(Sherman and Alexander, 1986, 1989; Sherman et al., 1990, 1991, 1993).
Initially, 49 LMEs were identified (Sherman and Alexander, 1986) and then anadditional 50th was proposed (Bakun et al., 1999). LMEs were defined on the basis of“…consideration of distinct bathymetry, hydrography, productivity, and trophicallydependent populations…” (Sherman et al., 1993). This definition is rather broad. For someof the 50 LMEs, not only the ecological aspects but also geopolitical aspects have beenconsidered. In others LMEs, distinct habitats and ecosystems have been put together. Forthese reasons, and following the publication of numerous papers, books and researchresults, the list has been expanded and some LMEs subdivided in order to increase theirecological significance, and to expand the coverage of all main shelf areas. The latest list,available at the LME web site managed by NOAA (2002), includes 64 LMEs. However, asthe background work for this study initiated in 1999, the paper is based on the 50 LMEsdescribed at that time (see list in Table 1 and map in Appendix 3).
1.1 Overview and scope of the work
The initial purpose of the present work was mainly to made available capturefishery production statistics by LME to scientists carrying out studies on individual LMEs.This encompassed the re-arrangement of the statistics included in the FAO capturedatabase, which are organized into 19 marine fishing areas, and the research of data at thesub-national level needed to disaggregate the national data reported to FAO into definedregions which belong to different LMEs. Preliminary work on the feasibility of re-arranging the FAO capture statistics into the LMEs’ borders was carried out and thecongruences and incongruences between the two partitions identified. However, in thecourse of the work, several difficulties have been encountered both in re-assigning the FAOstatistics to LMEs and in the availability of additional data from national sources.
35
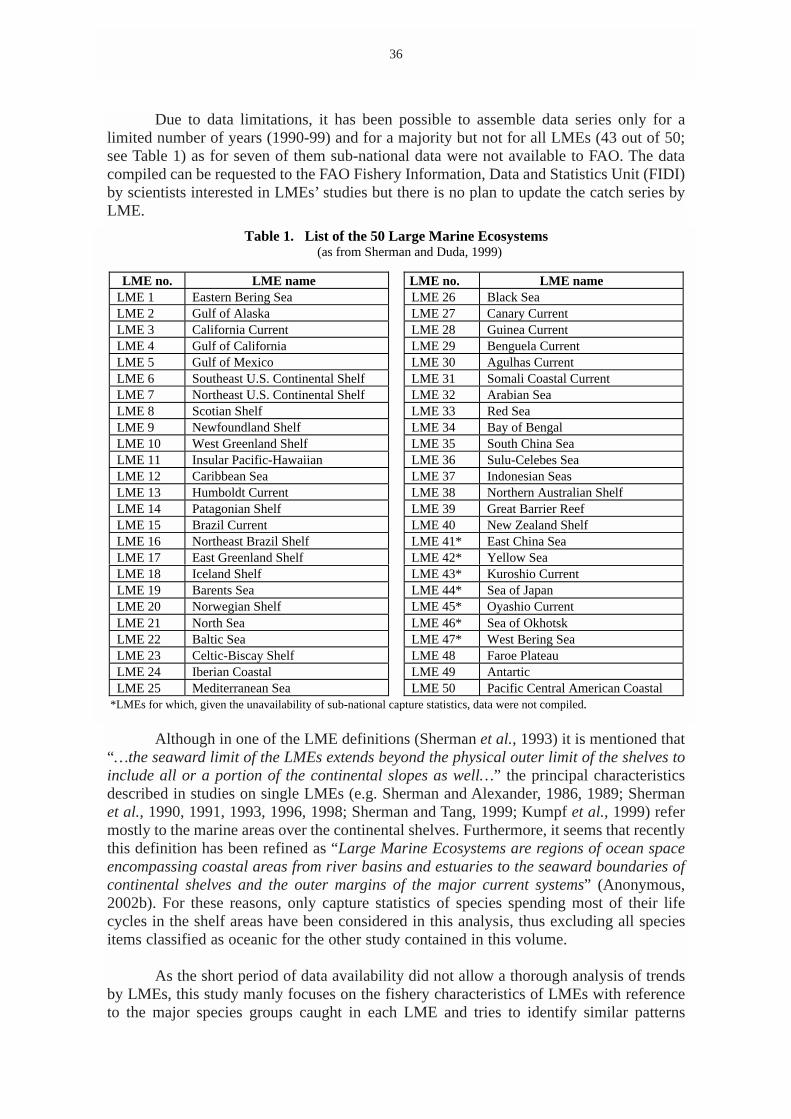
Due to data limitations, it has been possible to assemble data series only for alimited number of years (1990-99) and for a majority but not for all LMEs (43 out of 50;see Table 1) as for seven of them sub-national data were not available to FAO. The datacompiled can be requested to the FAO Fishery Information, Data and Statistics Unit (FIDI)by scientists interested in LMEs’ studies but there is no plan to update the catch series byLME.
Although in one of the LME definitions (Sherman et al., 1993) it is mentioned that“…the seaward limit of the LMEs extends beyond the physical outer limit of the shelves toinclude all or a portion of the continental slopes as well…” the principal characteristicsdescribed in studies on single LMEs (e.g. Sherman and Alexander, 1986, 1989; Shermanet al., 1990, 1991, 1993, 1996, 1998; Sherman and Tang, 1999; Kumpf et al., 1999) refermostly to the marine areas over the continental shelves. Furthermore, it seems that recentlythis definition has been refined as “Large Marine Ecosystems are regions of ocean spaceencompassing coastal areas from river basins and estuaries to the seaward boundaries ofcontinental shelves and the outer margins of the major current systems” (Anonymous,2002b). For these reasons, only capture statistics of species spending most of their lifecycles in the shelf areas have been considered in this analysis, thus excluding all speciesitems classified as oceanic for the other study contained in this volume.
As the short period of data availability did not allow a thorough analysis of trendsby LMEs, this study manly focuses on the fishery characteristics of LMEs with referenceto the major species groups caught in each LME and tries to identify similar patterns
36
Table 1. List of the 50 Large Marine Ecosystems(as from Sherman and Duda, 1999)
LME no. LME name LME no. LME nameLME 1 Eastern Bering Sea LME 26 Black SeaLME 2 Gulf of Alaska LME 27 Canary CurrentLME 3 California Current LME 28 Guinea CurrentLME 4 Gulf of California LME 29 Benguela CurrentLME 5 Gulf of Mexico LME 30 Agulhas CurrentLME 6 Southeast U.S. Continental Shelf LME 31 Somali Coastal CurrentLME 7 Northeast U.S. Continental Shelf LME 32 Arabian SeaLME 8 Scotian Shelf LME 33 Red SeaLME 9 Newfoundland Shelf LME 34 Bay of BengalLME 10 West Greenland Shelf LME 35 South China SeaLME 11 Insular Pacific-Hawaiian LME 36 Sulu-Celebes SeaLME 12 Caribbean Sea LME 37 Indonesian SeasLME 13 Humboldt Current LME 38 Northern Australian ShelfLME 14 Patagonian Shelf LME 39 Great Barrier ReefLME 15 Brazil Current LME 40 New Zealand ShelfLME 16 Northeast Brazil Shelf LME 41* East China SeaLME 17 East Greenland Shelf LME 42* Yellow SeaLME 18 Iceland Shelf LME 43* Kuroshio CurrentLME 19 Barents Sea LME 44* Sea of JapanLME 20 Norwegian Shelf LME 45* Oyashio CurrentLME 21 North Sea LME 46* Sea of OkhotskLME 22 Baltic Sea LME 47* West Bering SeaLME 23 Celtic-Biscay Shelf LME 48 Faroe PlateauLME 24 Iberian Coastal LME 49 AntarticLME 25 Mediterranean Sea LME 50 Pacific Central American Coastal
*LMEs for which, given the unavailability of sub-national capture statistics, data were not compiled.
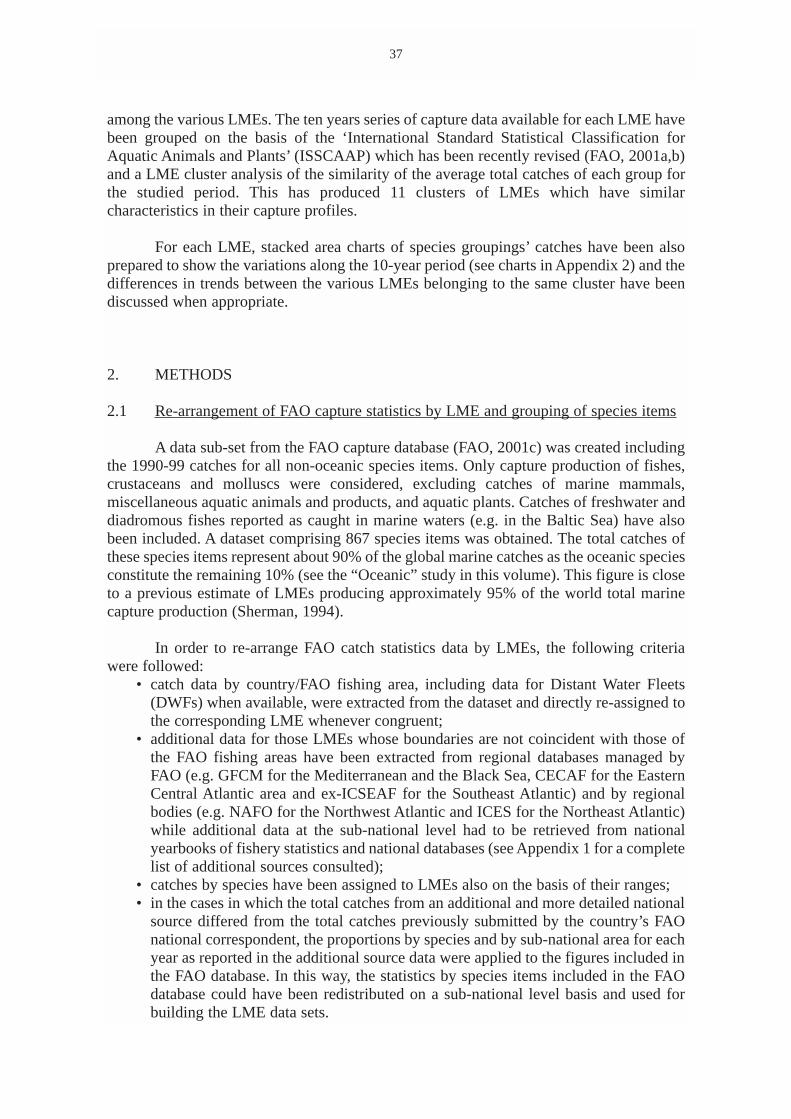
among the various LMEs. The ten years series of capture data available for each LME havebeen grouped on the basis of the ‘International Standard Statistical Classification forAquatic Animals and Plants’ (ISSCAAP) which has been recently revised (FAO, 2001a,b)and a LME cluster analysis of the similarity of the average total catches of each group forthe studied period. This has produced 11 clusters of LMEs which have similarcharacteristics in their capture profiles.
For each LME, stacked area charts of species groupings’ catches have been alsoprepared to show the variations along the 10-year period (see charts in Appendix 2) and thedifferences in trends between the various LMEs belonging to the same cluster have beendiscussed when appropriate.
2. METHODS
2.1 Re-arrangement of FAO capture statistics by LME and grouping of species items
A data sub-set from the FAO capture database (FAO, 2001c) was created includingthe 1990-99 catches for all non-oceanic species items. Only capture production of fishes,crustaceans and molluscs were considered, excluding catches of marine mammals,miscellaneous aquatic animals and products, and aquatic plants. Catches of freshwater anddiadromous fishes reported as caught in marine waters (e.g. in the Baltic Sea) have alsobeen included. A dataset comprising 867 species items was obtained. The total catches ofthese species items represent about 90% of the global marine catches as the oceanic speciesconstitute the remaining 10% (see the “Oceanic” study in this volume). This figure is closeto a previous estimate of LMEs producing approximately 95% of the world total marinecapture production (Sherman, 1994).
In order to re-arrange FAO catch statistics data by LMEs, the following criteriawere followed:
• catch data by country/FAO fishing area, including data for Distant Water Fleets(DWFs) when available, were extracted from the dataset and directly re-assigned tothe corresponding LME whenever congruent;
• additional data for those LMEs whose boundaries are not coincident with those ofthe FAO fishing areas have been extracted from regional databases managed byFAO (e.g. GFCM for the Mediterranean and the Black Sea, CECAF for the EasternCentral Atlantic area and ex-ICSEAF for the Southeast Atlantic) and by regionalbodies (e.g. NAFO for the Northwest Atlantic and ICES for the Northeast Atlantic)while additional data at the sub-national level had to be retrieved from nationalyearbooks of fishery statistics and national databases (see Appendix 1 for a completelist of additional sources consulted);
• catches by species have been assigned to LMEs also on the basis of their ranges;• in the cases in which the total catches from an additional and more detailed national
source differed from the total catches previously submitted by the country’s FAOnational correspondent, the proportions by species and by sub-national area for eachyear as reported in the additional source data were applied to the figures included inthe FAO database. In this way, the statistics by species items included in the FAOdatabase could have been redistributed on a sub-national level basis and used forbuilding the LME data sets.
37
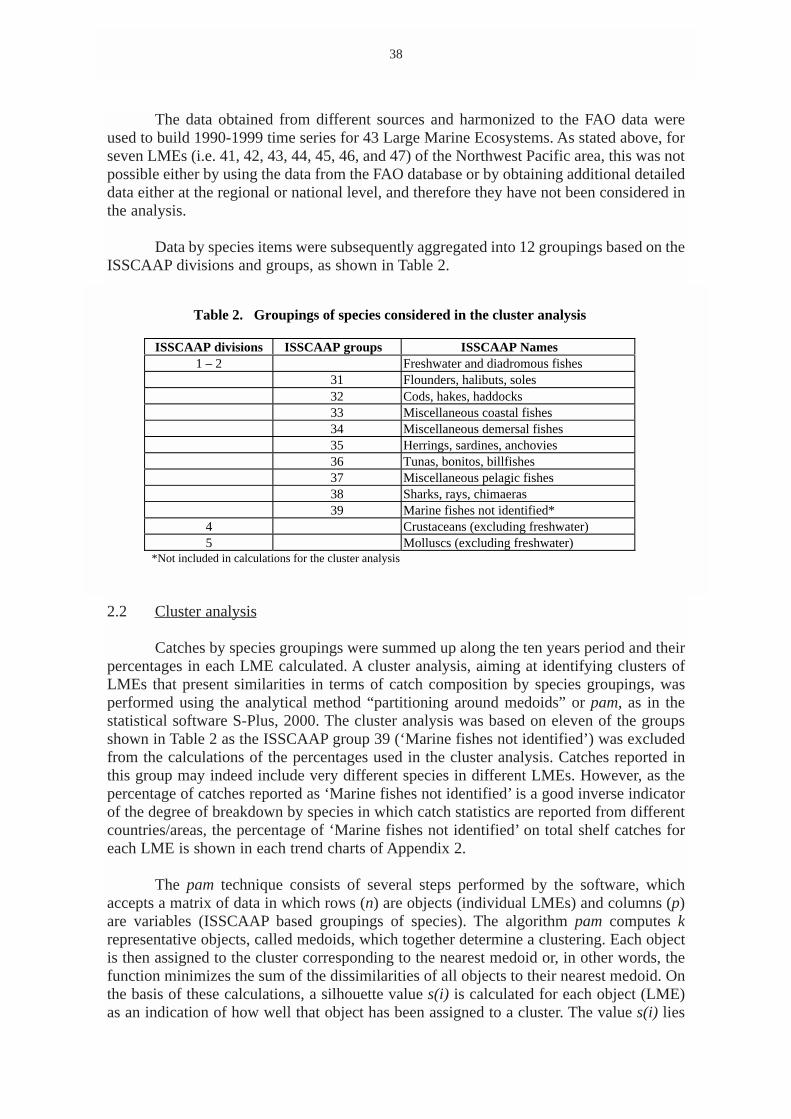
The data obtained from different sources and harmonized to the FAO data wereused to build 1990-1999 time series for 43 Large Marine Ecosystems. As stated above, forseven LMEs (i.e. 41, 42, 43, 44, 45, 46, and 47) of the Northwest Pacific area, this was notpossible either by using the data from the FAO database or by obtaining additional detaileddata either at the regional or national level, and therefore they have not been considered inthe analysis.
Data by species items were subsequently aggregated into 12 groupings based on theISSCAAP divisions and groups, as shown in Table 2.
2.2 Cluster analysis
Catches by species groupings were summed up along the ten years period and theirpercentages in each LME calculated. A cluster analysis, aiming at identifying clusters ofLMEs that present similarities in terms of catch composition by species groupings, wasperformed using the analytical method “partitioning around medoids” or pam, as in thestatistical software S-Plus, 2000. The cluster analysis was based on eleven of the groupsshown in Table 2 as the ISSCAAP group 39 (‘Marine fishes not identified’) was excludedfrom the calculations of the percentages used in the cluster analysis. Catches reported inthis group may indeed include very different species in different LMEs. However, as thepercentage of catches reported as ‘Marine fishes not identified’ is a good inverse indicatorof the degree of breakdown by species in which catch statistics are reported from differentcountries/areas, the percentage of ‘Marine fishes not identified’ on total shelf catches foreach LME is shown in each trend charts of Appendix 2.
The pam technique consists of several steps performed by the software, whichaccepts a matrix of data in which rows (n) are objects (individual LMEs) and columns (p)are variables (ISSCAAP based groupings of species). The algorithm pam computes krepresentative objects, called medoids, which together determine a clustering. Each objectis then assigned to the cluster corresponding to the nearest medoid or, in other words, thefunction minimizes the sum of the dissimilarities of all objects to their nearest medoid. Onthe basis of these calculations, a silhouette value s(i) is calculated for each object (LME)as an indication of how well that object has been assigned to a cluster. The value s(i) lies
38
Table 2. Groupings of species considered in the cluster analysis
ISSCAAP divisions ISSCAAP groups ISSCAAP Names1 – 2 Freshwater and diadromous fishes
31 Flounders, halibuts, soles32 Cods, hakes, haddocks33 Miscellaneous coastal fishes34 Miscellaneous demersal fishes35 Herrings, sardines, anchovies36 Tunas, bonitos, billfishes37 Miscellaneous pelagic fishes38 Sharks, rays, chimaeras39 Marine fishes not identified*
4 Crustaceans (excluding freshwater)5 Molluscs (excluding freshwater)
*Not included in calculations for the cluster analysis
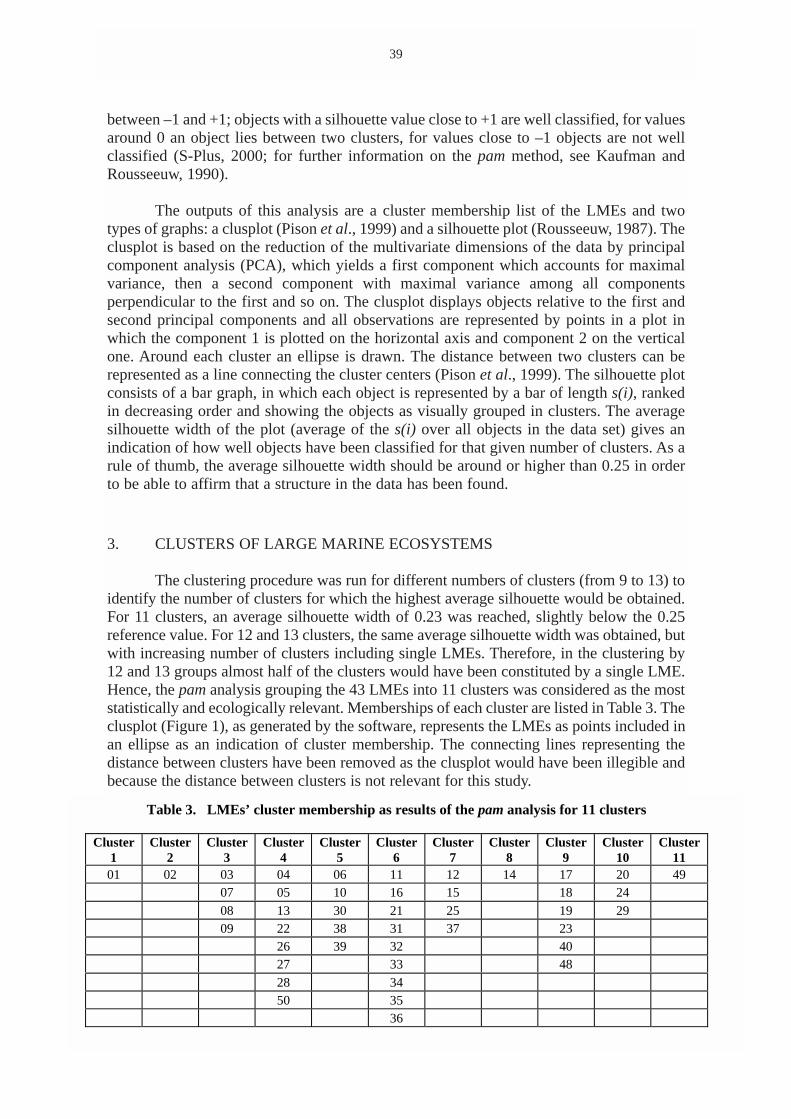
between –1 and +1; objects with a silhouette value close to +1 are well classified, for valuesaround 0 an object lies between two clusters, for values close to –1 objects are not wellclassified (S-Plus, 2000; for further information on the pam method, see Kaufman andRousseeuw, 1990).
The outputs of this analysis are a cluster membership list of the LMEs and twotypes of graphs: a clusplot (Pison et al., 1999) and a silhouette plot (Rousseeuw, 1987). Theclusplot is based on the reduction of the multivariate dimensions of the data by principalcomponent analysis (PCA), which yields a first component which accounts for maximalvariance, then a second component with maximal variance among all componentsperpendicular to the first and so on. The clusplot displays objects relative to the first andsecond principal components and all observations are represented by points in a plot inwhich the component 1 is plotted on the horizontal axis and component 2 on the verticalone. Around each cluster an ellipse is drawn. The distance between two clusters can berepresented as a line connecting the cluster centers (Pison et al., 1999). The silhouette plotconsists of a bar graph, in which each object is represented by a bar of length s(i), rankedin decreasing order and showing the objects as visually grouped in clusters. The averagesilhouette width of the plot (average of the s(i) over all objects in the data set) gives anindication of how well objects have been classified for that given number of clusters. As arule of thumb, the average silhouette width should be around or higher than 0.25 in orderto be able to affirm that a structure in the data has been found.
3. CLUSTERS OF LARGE MARINE ECOSYSTEMS
The clustering procedure was run for different numbers of clusters (from 9 to 13) toidentify the number of clusters for which the highest average silhouette would be obtained.For 11 clusters, an average silhouette width of 0.23 was reached, slightly below the 0.25reference value. For 12 and 13 clusters, the same average silhouette width was obtained, butwith increasing number of clusters including single LMEs. Therefore, in the clustering by12 and 13 groups almost half of the clusters would have been constituted by a single LME.Hence, the pam analysis grouping the 43 LMEs into 11 clusters was considered as the moststatistically and ecologically relevant. Memberships of each cluster are listed in Table 3. Theclusplot (Figure 1), as generated by the software, represents the LMEs as points included inan ellipse as an indication of cluster membership. The connecting lines representing thedistance between clusters have been removed as the clusplot would have been illegible andbecause the distance between clusters is not relevant for this study.
39
Table 3. LMEs’ cluster membership as results of the pam analysis for 11 clusters
Cluster1
Cluster2
Cluster3
Cluster4
Cluster5
Cluster6
Cluster7
Cluster8
Cluster9
Cluster10
Cluster11
01 02 03 04 06 11 12 14 17 20 4907 05 10 16 15 18 2408 13 30 21 25 19 2909 22 38 31 37 23
26 39 32 4027 33 4828 3450 35
36
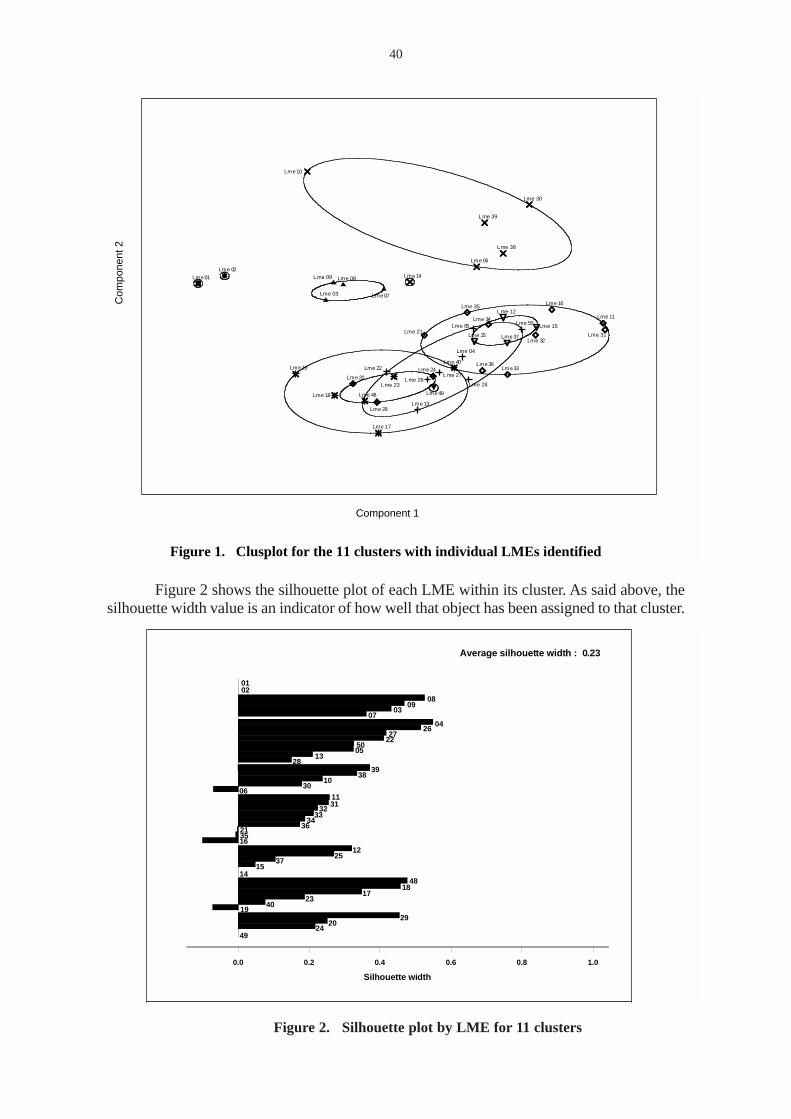
Figure 2 shows the silhouette plot of each LME within its cluster. As said above, thesilhouette width value is an indicator of how well that object has been assigned to that cluster.
Figure 2. Silhouette plot by LME for 11 clusters
40
Lme 01
Lme 02
Lme 03
Lme 04
Lme 05
Lme 06
Lme07
Lme 08L me 09
Lme 10
Lme 11L me 12
Lme 13
Lme14
Lme 15
Lme 16
Lme 17
Lme 18
Lme 19
Lme 20
Lme 21
Lme 22
L me 23
Lme 24
Lme 25
L me 26L me 27
Lme 28
Lme 29
Lme 30
Lme 31Lme 32
Lme33
Lme 34
Lme 35
Lme 36
Lme 37
L me 38
L me 39
Lme 40
Lme 48 Lme49
Lme 50
Component 1
Figure 1. Clusplot for the 11 clusters with individual LMEs identified
Com
pone
nt2
0.0 0.2 0.4 0.6 0.8 1.0
Silhouette width
Average silhouette width : 0.23
0102
1030
061131
3233
343621
35
1237
1514
4818
1723
40
2024
49
0809
0307
0426
2722
5005
1328
3938
16
25
1929
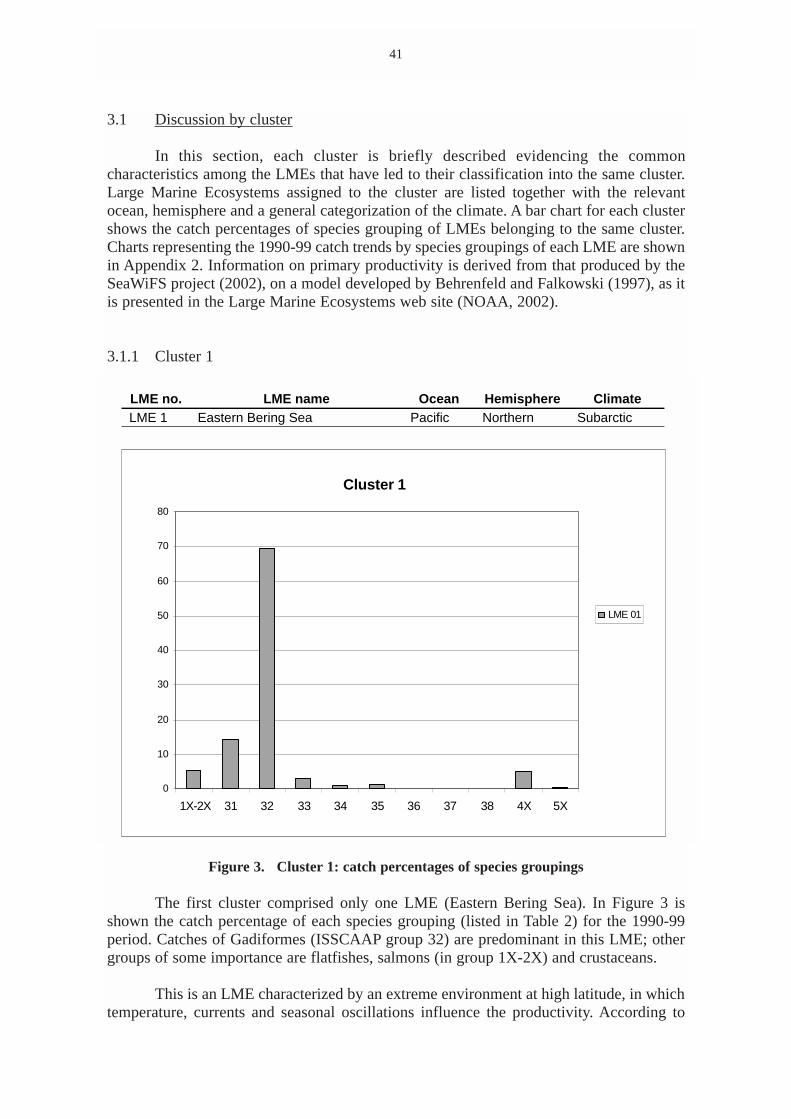
3.1 Discussion by cluster
In this section, each cluster is briefly described evidencing the commoncharacteristics among the LMEs that have led to their classification into the same cluster.Large Marine Ecosystems assigned to the cluster are listed together with the relevantocean, hemisphere and a general categorization of the climate. A bar chart for each clustershows the catch percentages of species grouping of LMEs belonging to the same cluster.Charts representing the 1990-99 catch trends by species groupings of each LME are shownin Appendix 2. Information on primary productivity is derived from that produced by theSeaWiFS project (2002), on a model developed by Behrenfeld and Falkowski (1997), as itis presented in the Large Marine Ecosystems web site (NOAA, 2002).
3.1.1 Cluster 1
Figure 3. Cluster 1: catch percentages of species groupings
The first cluster comprised only one LME (Eastern Bering Sea). In Figure 3 isshown the catch percentage of each species grouping (listed in Table 2) for the 1990-99period. Catches of Gadiformes (ISSCAAP group 32) are predominant in this LME; othergroups of some importance are flatfishes, salmons (in group 1X-2X) and crustaceans.
This is an LME characterized by an extreme environment at high latitude, in whichtemperature, currents and seasonal oscillations influence the productivity. According to
41
LME no. LME name Ocean Hemisphere ClimateLME 1 Eastern Bering Sea Pacific Northern Subarctic
Cluster 1
0
10
20
30
40
50
60
70
80
1X-2X 31 32 33 34 35 36 37 38 4X 5X
LME 01
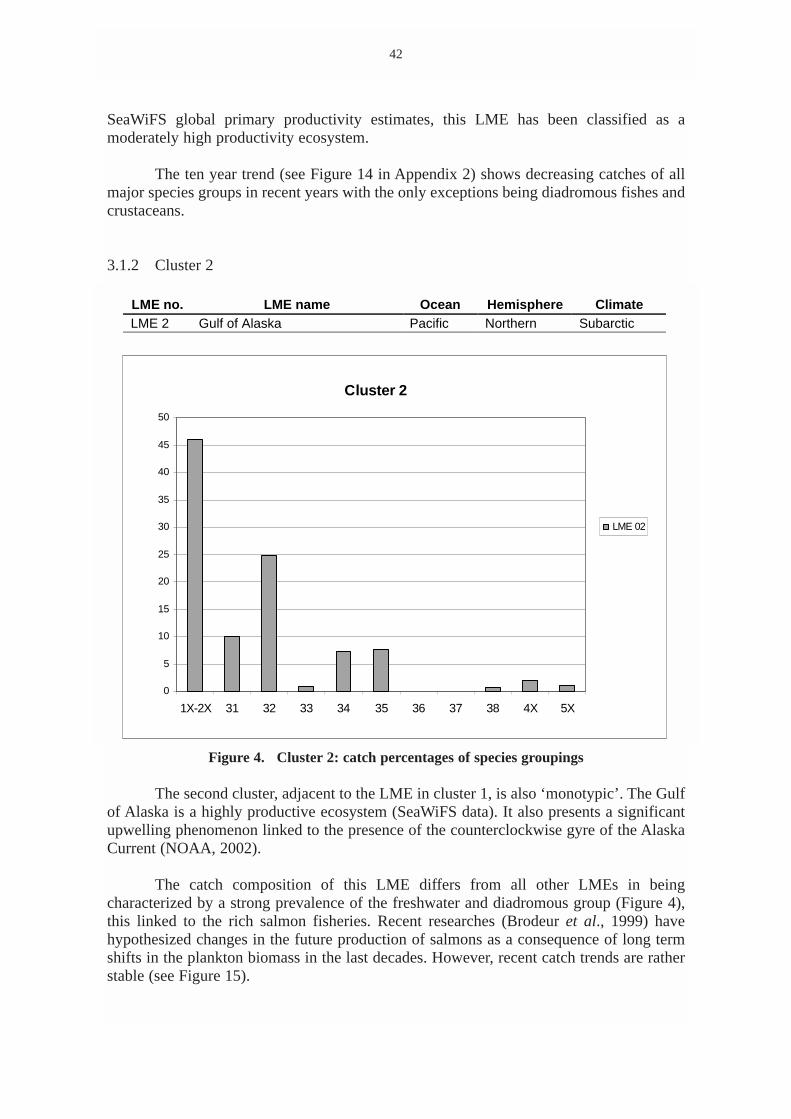
SeaWiFS global primary productivity estimates, this LME has been classified as amoderately high productivity ecosystem.
The ten year trend (see Figure 14 in Appendix 2) shows decreasing catches of allmajor species groups in recent years with the only exceptions being diadromous fishes andcrustaceans.
3.1.2 Cluster 2
Figure 4. Cluster 2: catch percentages of species groupings
The second cluster, adjacent to the LME in cluster 1, is also ‘monotypic’. The Gulfof Alaska is a highly productive ecosystem (SeaWiFS data). It also presents a significantupwelling phenomenon linked to the presence of the counterclockwise gyre of the AlaskaCurrent (NOAA, 2002).
The catch composition of this LME differs from all other LMEs in beingcharacterized by a strong prevalence of the freshwater and diadromous group (Figure 4),this linked to the rich salmon fisheries. Recent researches (Brodeur et al., 1999) havehypothesized changes in the future production of salmons as a consequence of long termshifts in the plankton biomass in the last decades. However, recent catch trends are ratherstable (see Figure 15).
42
LME no. LME name Ocean Hemisphere ClimateLME 2 Gulf of Alaska Pacific Northern Subarctic
Cluster 2
0
5
10
15
20
25
30
35
40
45
50
1X-2X 31 32 33 34 35 36 37 38 4X 5X
LME 02
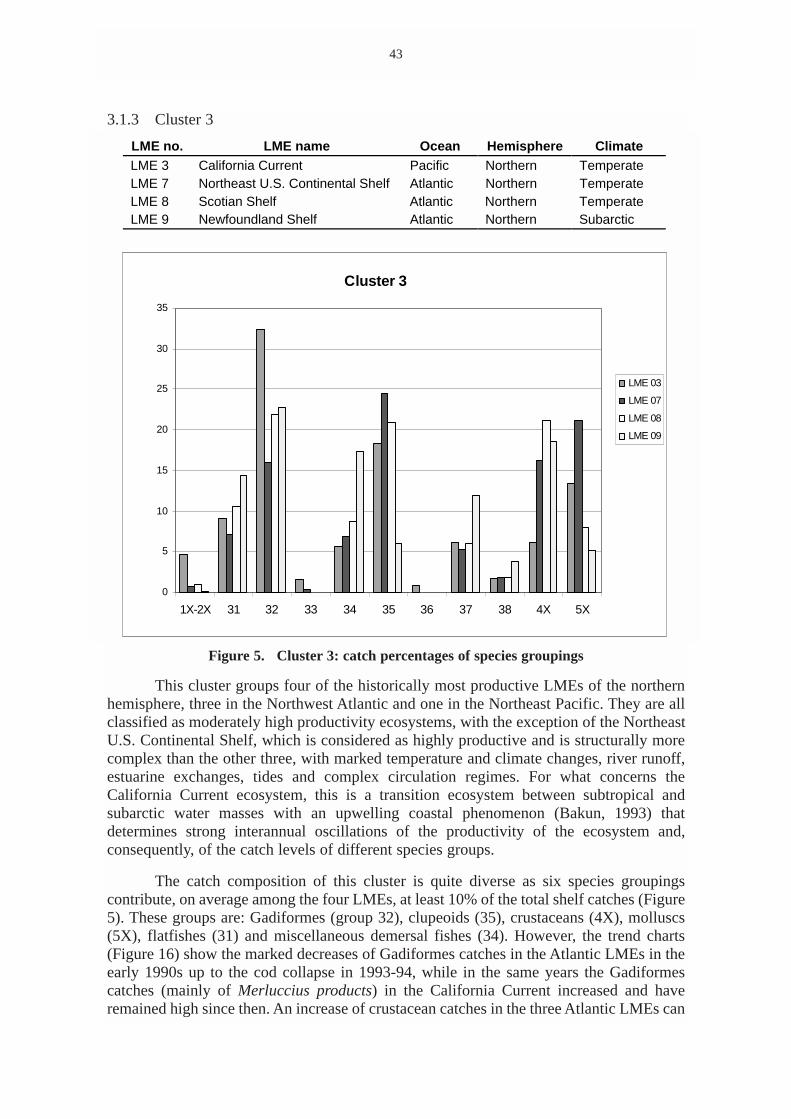
3.1.3 Cluster 3
Figure 5. Cluster 3: catch percentages of species groupings
This cluster groups four of the historically most productive LMEs of the northernhemisphere, three in the Northwest Atlantic and one in the Northeast Pacific. They are allclassified as moderately high productivity ecosystems, with the exception of the NortheastU.S. Continental Shelf, which is considered as highly productive and is structurally morecomplex than the other three, with marked temperature and climate changes, river runoff,estuarine exchanges, tides and complex circulation regimes. For what concerns theCalifornia Current ecosystem, this is a transition ecosystem between subtropical andsubarctic water masses with an upwelling coastal phenomenon (Bakun, 1993) thatdetermines strong interannual oscillations of the productivity of the ecosystem and,consequently, of the catch levels of different species groups.
The catch composition of this cluster is quite diverse as six species groupingscontribute, on average among the four LMEs, at least 10% of the total shelf catches (Figure5). These groups are: Gadiformes (group 32), clupeoids (35), crustaceans (4X), molluscs(5X), flatfishes (31) and miscellaneous demersal fishes (34). However, the trend charts(Figure 16) show the marked decreases of Gadiformes catches in the Atlantic LMEs in theearly 1990s up to the cod collapse in 1993-94, while in the same years the Gadiformescatches (mainly of Merluccius products) in the California Current increased and haveremained high since then. An increase of crustacean catches in the three Atlantic LMEs can
43
LME no. LME name Ocean Hemisphere ClimateLME 3 California Current Pacific Northern TemperateLME 7 Northeast U.S. Continental Shelf Atlantic Northern TemperateLME 8 Scotian Shelf Atlantic Northern TemperateLME 9 Newfoundland Shelf Atlantic Northern Subarctic
Cluster 3
0
5
10
15
20
25
30
35
1X-2X 31 32 33 34 35 36 37 38 4X 5X
LME 03
LME 07
LME 08
LME 09
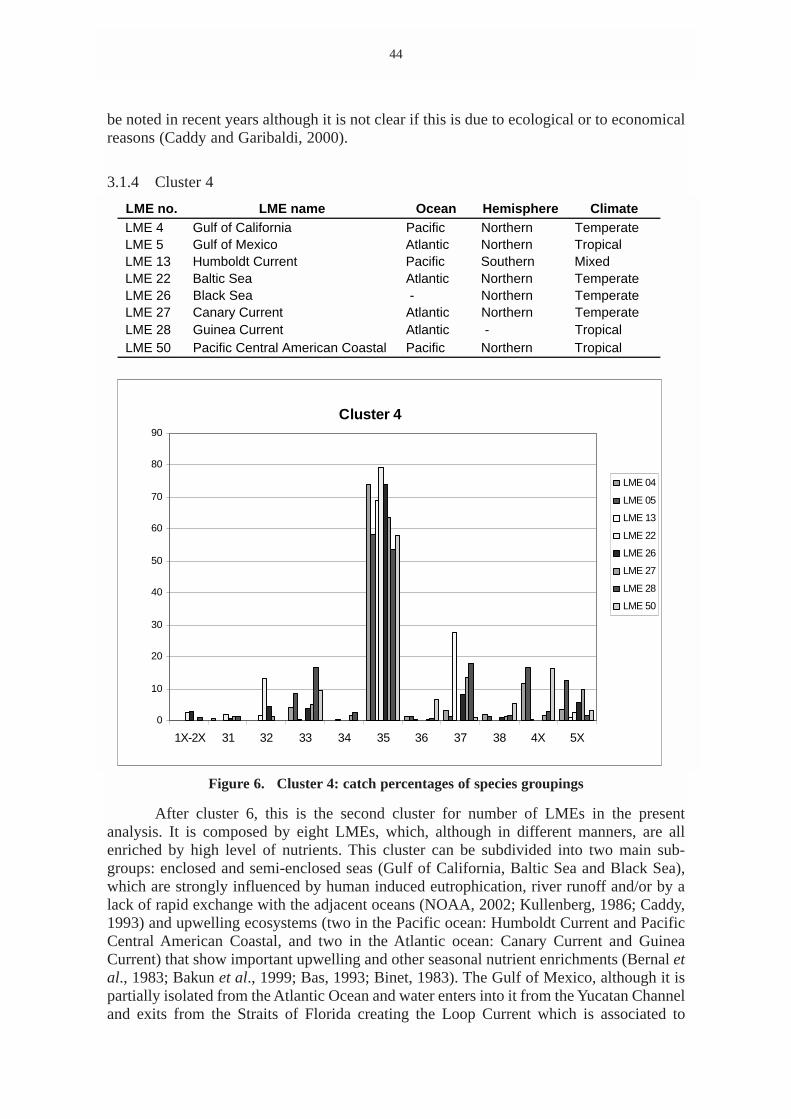
be noted in recent years although it is not clear if this is due to ecological or to economicalreasons (Caddy and Garibaldi, 2000).
3.1.4 Cluster 4
Figure 6. Cluster 4: catch percentages of species groupings
After cluster 6, this is the second cluster for number of LMEs in the presentanalysis. It is composed by eight LMEs, which, although in different manners, are allenriched by high level of nutrients. This cluster can be subdivided into two main sub-groups: enclosed and semi-enclosed seas (Gulf of California, Baltic Sea and Black Sea),which are strongly influenced by human induced eutrophication, river runoff and/or by alack of rapid exchange with the adjacent oceans (NOAA, 2002; Kullenberg, 1986; Caddy,1993) and upwelling ecosystems (two in the Pacific ocean: Humboldt Current and PacificCentral American Coastal, and two in the Atlantic ocean: Canary Current and GuineaCurrent) that show important upwelling and other seasonal nutrient enrichments (Bernal etal., 1983; Bakun et al., 1999; Bas, 1993; Binet, 1983). The Gulf of Mexico, although it ispartially isolated from the Atlantic Ocean and water enters into it from the Yucatan Channeland exits from the Straits of Florida creating the Loop Current which is associated to
44
LME no. LME name Ocean Hemisphere ClimateLME 4 Gulf of California Pacific Northern TemperateLME 5 Gulf of Mexico Atlantic Northern TropicalLME 13 Humboldt Current Pacific Southern MixedLME 22 Baltic Sea Atlantic Northern TemperateLME 26 Black Sea - Northern TemperateLME 27 Canary Current Atlantic Northern TemperateLME 28 Guinea Current Atlantic - TropicalLME 50 Pacific Central American Coastal Pacific Northern Tropical
Cluster 4
0
10
20
30
40
50
60
70
80
90
1X-2X 31 32 33 34 35 36 37 38 4X 5X
LME 04
LME 05
LME 13
LME 22
LME 26
LME 27
LME 28
LME 50
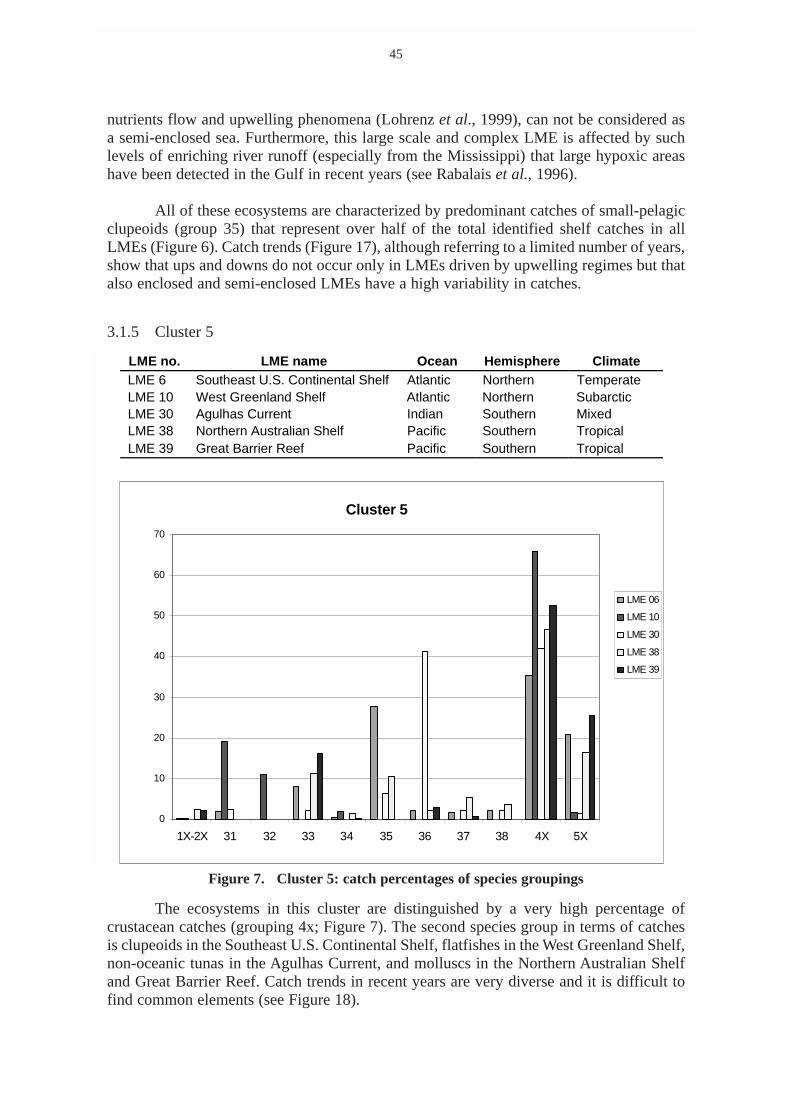
nutrients flow and upwelling phenomena (Lohrenz et al., 1999), can not be considered asa semi-enclosed sea. Furthermore, this large scale and complex LME is affected by suchlevels of enriching river runoff (especially from the Mississippi) that large hypoxic areashave been detected in the Gulf in recent years (see Rabalais et al., 1996).
All of these ecosystems are characterized by predominant catches of small-pelagicclupeoids (group 35) that represent over half of the total identified shelf catches in allLMEs (Figure 6). Catch trends (Figure 17), although referring to a limited number of years,show that ups and downs do not occur only in LMEs driven by upwelling regimes but thatalso enclosed and semi-enclosed LMEs have a high variability in catches.
3.1.5 Cluster 5
Figure 7. Cluster 5: catch percentages of species groupings
The ecosystems in this cluster are distinguished by a very high percentage ofcrustacean catches (grouping 4x; Figure 7). The second species group in terms of catchesis clupeoids in the Southeast U.S. Continental Shelf, flatfishes in the West Greenland Shelf,non-oceanic tunas in the Agulhas Current, and molluscs in the Northern Australian Shelfand Great Barrier Reef. Catch trends in recent years are very diverse and it is difficult tofind common elements (see Figure 18).
45
LME no. LME name Ocean Hemisphere ClimateLME 6 Southeast U.S. Continental Shelf Atlantic Northern TemperateLME 10 West Greenland Shelf Atlantic Northern SubarcticLME 30 Agulhas Current Indian Southern MixedLME 38 Northern Australian Shelf Pacific Southern TropicalLME 39 Great Barrier Reef Pacific Southern Tropical
Cluster 5
0
10
20
30
40
50
60
70
1X-2X 31 32 33 34 35 36 37 38 4X 5X
LME 06
LME 10
LME 30
LME 38
LME 39
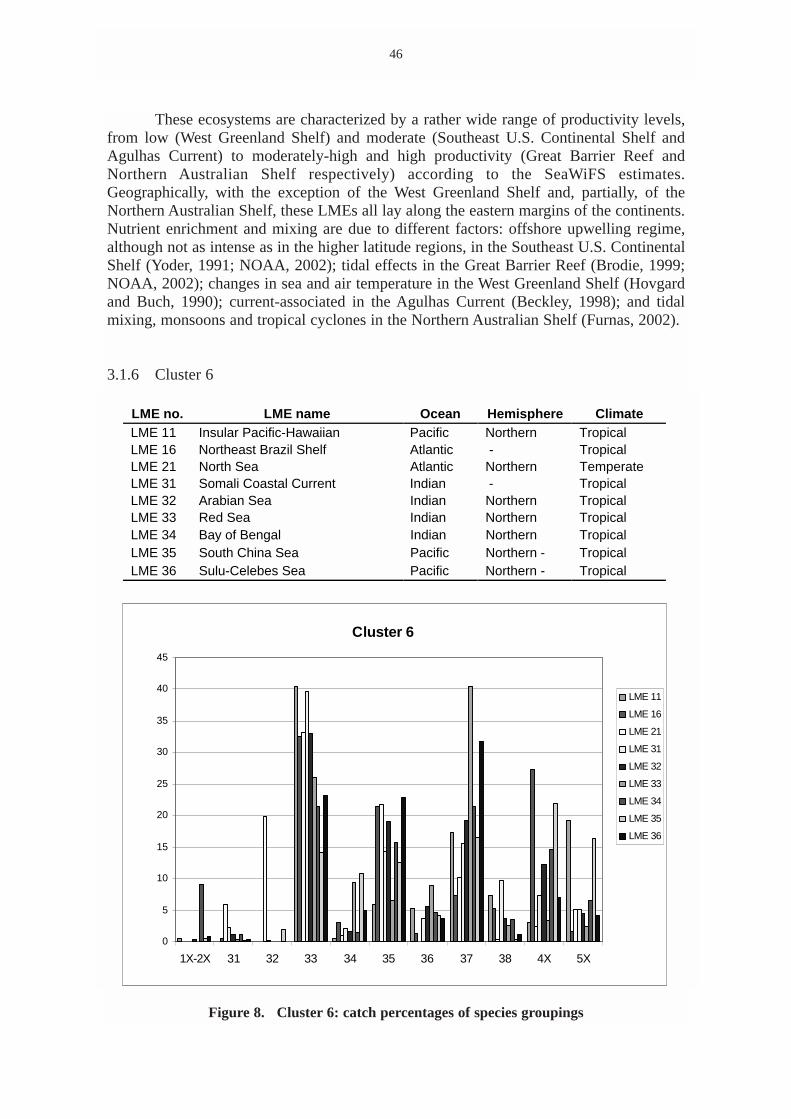
These ecosystems are characterized by a rather wide range of productivity levels,from low (West Greenland Shelf) and moderate (Southeast U.S. Continental Shelf andAgulhas Current) to moderately-high and high productivity (Great Barrier Reef andNorthern Australian Shelf respectively) according to the SeaWiFS estimates.Geographically, with the exception of the West Greenland Shelf and, partially, of theNorthern Australian Shelf, these LMEs all lay along the eastern margins of the continents.Nutrient enrichment and mixing are due to different factors: offshore upwelling regime,although not as intense as in the higher latitude regions, in the Southeast U.S. ContinentalShelf (Yoder, 1991; NOAA, 2002); tidal effects in the Great Barrier Reef (Brodie, 1999;NOAA, 2002); changes in sea and air temperature in the West Greenland Shelf (Hovgardand Buch, 1990); current-associated in the Agulhas Current (Beckley, 1998); and tidalmixing, monsoons and tropical cyclones in the Northern Australian Shelf (Furnas, 2002).
3.1.6 Cluster 6
Figure 8. Cluster 6: catch percentages of species groupings
46
LME no. LME name Ocean Hemisphere ClimateLME 11 Insular Pacific-Hawaiian Pacific Northern TropicalLME 16 Northeast Brazil Shelf Atlantic - TropicalLME 21 North Sea Atlantic Northern TemperateLME 31 Somali Coastal Current Indian - TropicalLME 32 Arabian Sea Indian Northern TropicalLME 33 Red Sea Indian Northern TropicalLME 34 Bay of Bengal Indian Northern TropicalLME 35 South China Sea Pacific Northern - TropicalLME 36 Sulu-Celebes Sea Pacific Northern - Tropical
Cluster 6
0
5
10
15
20
25
30
35
40
45
1X-2X 31 32 33 34 35 36 37 38 4X 5X
LME 11
LME 16
LME 21
LME 31
LME 32
LME 33
LME 34
LME 35
LME 36
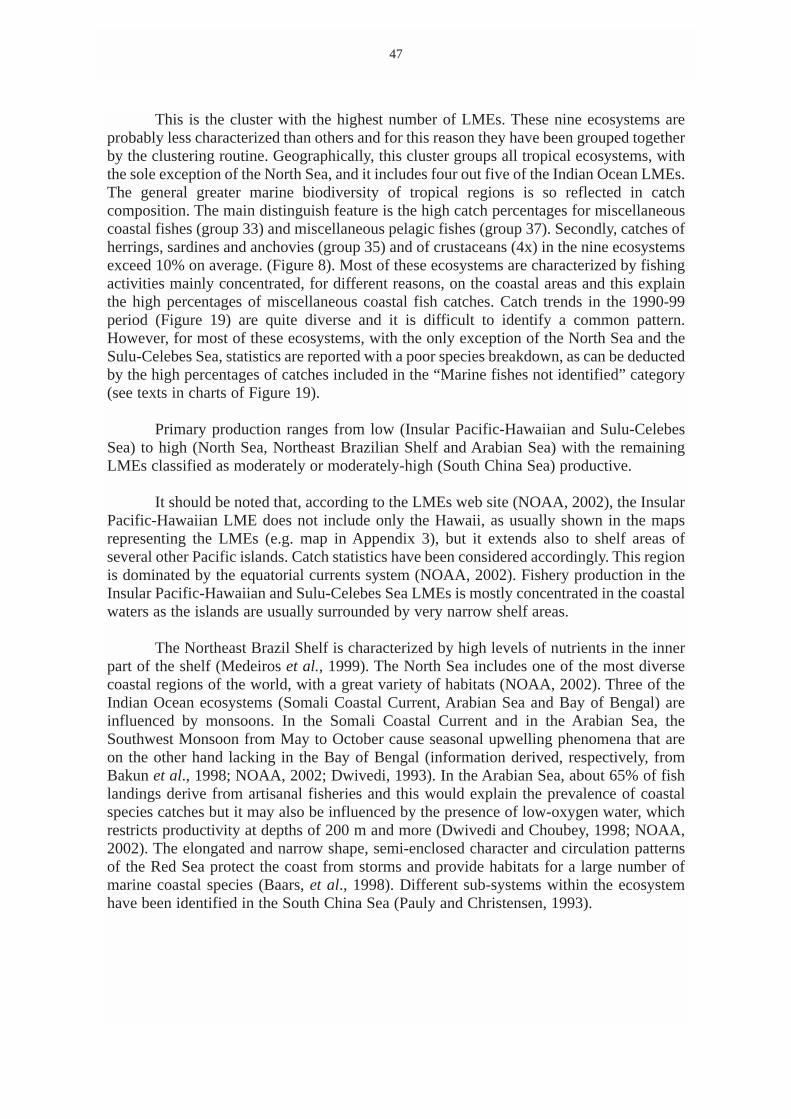
This is the cluster with the highest number of LMEs. These nine ecosystems areprobably less characterized than others and for this reason they have been grouped togetherby the clustering routine. Geographically, this cluster groups all tropical ecosystems, withthe sole exception of the North Sea, and it includes four out five of the Indian Ocean LMEs.The general greater marine biodiversity of tropical regions is so reflected in catchcomposition. The main distinguish feature is the high catch percentages for miscellaneouscoastal fishes (group 33) and miscellaneous pelagic fishes (group 37). Secondly, catches ofherrings, sardines and anchovies (group 35) and of crustaceans (4x) in the nine ecosystemsexceed 10% on average. (Figure 8). Most of these ecosystems are characterized by fishingactivities mainly concentrated, for different reasons, on the coastal areas and this explainthe high percentages of miscellaneous coastal fish catches. Catch trends in the 1990-99period (Figure 19) are quite diverse and it is difficult to identify a common pattern.However, for most of these ecosystems, with the only exception of the North Sea and theSulu-Celebes Sea, statistics are reported with a poor species breakdown, as can be deductedby the high percentages of catches included in the “Marine fishes not identified” category(see texts in charts of Figure 19).
Primary production ranges from low (Insular Pacific-Hawaiian and Sulu-CelebesSea) to high (North Sea, Northeast Brazilian Shelf and Arabian Sea) with the remainingLMEs classified as moderately or moderately-high (South China Sea) productive.
It should be noted that, according to the LMEs web site (NOAA, 2002), the InsularPacific-Hawaiian LME does not include only the Hawaii, as usually shown in the mapsrepresenting the LMEs (e.g. map in Appendix 3), but it extends also to shelf areas ofseveral other Pacific islands. Catch statistics have been considered accordingly. This regionis dominated by the equatorial currents system (NOAA, 2002). Fishery production in theInsular Pacific-Hawaiian and Sulu-Celebes Sea LMEs is mostly concentrated in the coastalwaters as the islands are usually surrounded by very narrow shelf areas.
The Northeast Brazil Shelf is characterized by high levels of nutrients in the innerpart of the shelf (Medeiros et al., 1999). The North Sea includes one of the most diversecoastal regions of the world, with a great variety of habitats (NOAA, 2002). Three of theIndian Ocean ecosystems (Somali Coastal Current, Arabian Sea and Bay of Bengal) areinfluenced by monsoons. In the Somali Coastal Current and in the Arabian Sea, theSouthwest Monsoon from May to October cause seasonal upwelling phenomena that areon the other hand lacking in the Bay of Bengal (information derived, respectively, fromBakun et al., 1998; NOAA, 2002; Dwivedi, 1993). In the Arabian Sea, about 65% of fishlandings derive from artisanal fisheries and this would explain the prevalence of coastalspecies catches but it may also be influenced by the presence of low-oxygen water, whichrestricts productivity at depths of 200 m and more (Dwivedi and Choubey, 1998; NOAA,2002). The elongated and narrow shape, semi-enclosed character and circulation patternsof the Red Sea protect the coast from storms and provide habitats for a large number ofmarine coastal species (Baars, et al., 1998). Different sub-systems within the ecosystemhave been identified in the South China Sea (Pauly and Christensen, 1993).
47
3.1.7 Cluster 7
Figure 9. Cluster 7: catch percentages of species groupings
Also in this cluster, group 35 (clupeoids: herrings, sardines and anchovies) is themost important species group in shelf catches but, unlike for cluster 4, other groups (i.e.mostly coastal fishes but also crustaceans, molluscs and miscellaneous demersal fishes forthe Indonesian Seas) also contribute significant capture production (Figure 9). Catch trendshave been rather stable in recent years (Figure 20) with moderate increases in total shelfcatches if comparing the last year (1999) respect to the first year (1990) of the consideredperiod, with the exception of the Indonesian Seas where catches have been quite steadilyincreasing.
As for its catch composition, the Mediterranean Sea seems one of the most diverseand stable LME in terms of species groupings, their shares in total catches and trends. Itsunusual biodiversity for a temperate sea is confirmed by the fact that the Mediterranean andBlack Sea together cover only the 0.8% of the total surface of the oceans but representabout 5.5% of the total world marine fauna (Fredj et al., 1992).
According to the productivity classification by SeaWiFS, the four LMEs in thiscluster are moderately-high (Indonesian Seas), moderately (Brazil Current) or lownaturally productive ecosystems (Caribbean Sea and Mediterranean Sea) but the
48
LME no. LME name Ocean Hemisphere ClimateLME 12 Caribbean Sea Atlantic Northern TropicalLME 15 Brazil Current Atlantic Southern MixedLME 25 Mediterranean Sea - Northern TemperateLME 37 Indonesian Seas Pacific - Tropical
Cluster 7
0
5
10
15
20
25
30
35
40
45
1X-2X 31 32 33 34 35 36 37 38 4X 5X
LME 12
LME 15
LME 25
LME 37
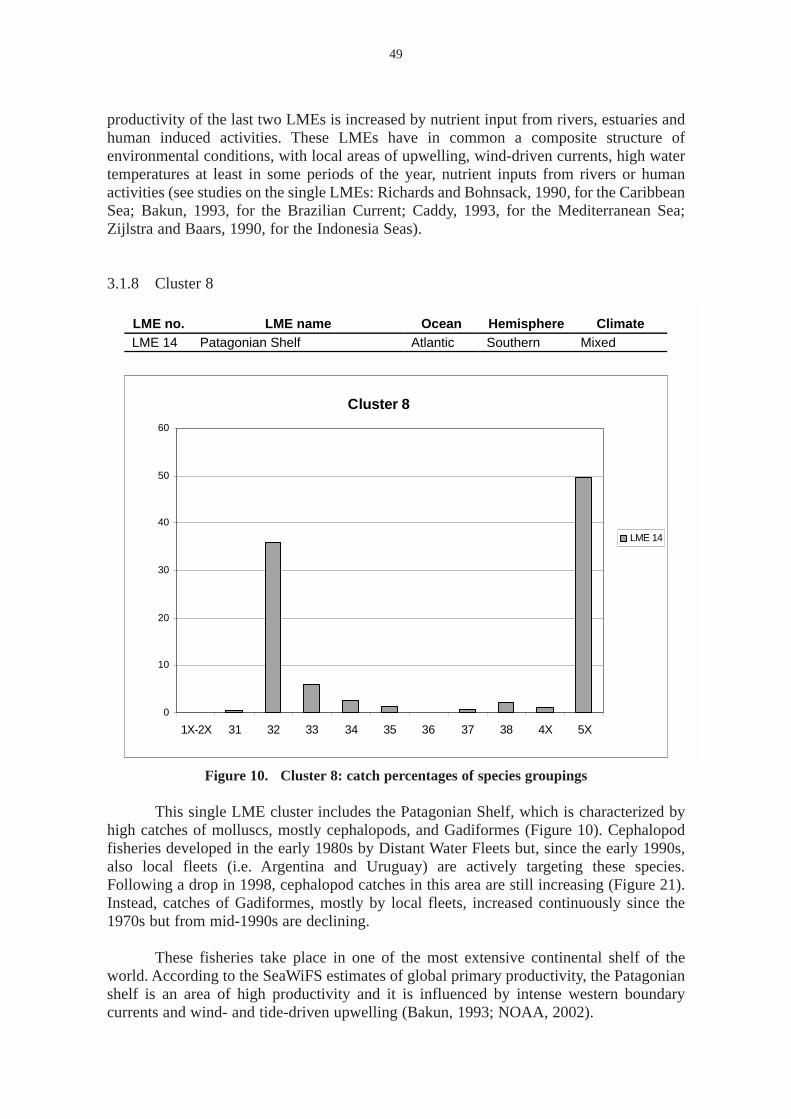
productivity of the last two LMEs is increased by nutrient input from rivers, estuaries andhuman induced activities. These LMEs have in common a composite structure ofenvironmental conditions, with local areas of upwelling, wind-driven currents, high watertemperatures at least in some periods of the year, nutrient inputs from rivers or humanactivities (see studies on the single LMEs: Richards and Bohnsack, 1990, for the CaribbeanSea; Bakun, 1993, for the Brazilian Current; Caddy, 1993, for the Mediterranean Sea;Zijlstra and Baars, 1990, for the Indonesia Seas).
3.1.8 Cluster 8
Figure 10. Cluster 8: catch percentages of species groupings
This single LME cluster includes the Patagonian Shelf, which is characterized byhigh catches of molluscs, mostly cephalopods, and Gadiformes (Figure 10). Cephalopodfisheries developed in the early 1980s by Distant Water Fleets but, since the early 1990s,also local fleets (i.e. Argentina and Uruguay) are actively targeting these species.Following a drop in 1998, cephalopod catches in this area are still increasing (Figure 21).Instead, catches of Gadiformes, mostly by local fleets, increased continuously since the1970s but from mid-1990s are declining.
These fisheries take place in one of the most extensive continental shelf of theworld. According to the SeaWiFS estimates of global primary productivity, the Patagonianshelf is an area of high productivity and it is influenced by intense western boundarycurrents and wind- and tide-driven upwelling (Bakun, 1993; NOAA, 2002).
49
LME no. LME name Ocean Hemisphere ClimateLME 14 Patagonian Shelf Atlantic Southern Mixed
Cluster 8
0
10
20
30
40
50
60
1X-2X 31 32 33 34 35 36 37 38 4X 5X
LME 14
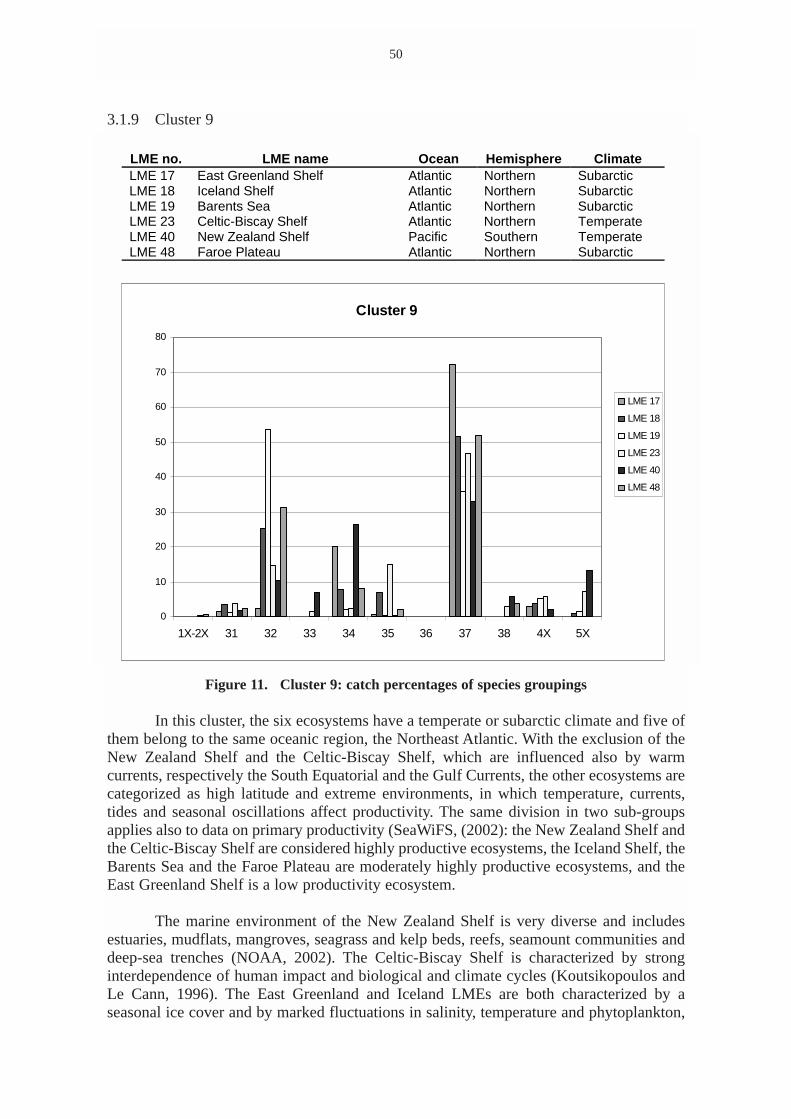
3.1.9 Cluster 9
Figure 11. Cluster 9: catch percentages of species groupings
In this cluster, the six ecosystems have a temperate or subarctic climate and five ofthem belong to the same oceanic region, the Northeast Atlantic. With the exclusion of theNew Zealand Shelf and the Celtic-Biscay Shelf, which are influenced also by warmcurrents, respectively the South Equatorial and the Gulf Currents, the other ecosystems arecategorized as high latitude and extreme environments, in which temperature, currents,tides and seasonal oscillations affect productivity. The same division in two sub-groupsapplies also to data on primary productivity (SeaWiFS, (2002): the New Zealand Shelf andthe Celtic-Biscay Shelf are considered highly productive ecosystems, the Iceland Shelf, theBarents Sea and the Faroe Plateau are moderately highly productive ecosystems, and theEast Greenland Shelf is a low productivity ecosystem.
The marine environment of the New Zealand Shelf is very diverse and includesestuaries, mudflats, mangroves, seagrass and kelp beds, reefs, seamount communities anddeep-sea trenches (NOAA, 2002). The Celtic-Biscay Shelf is characterized by stronginterdependence of human impact and biological and climate cycles (Koutsikopoulos andLe Cann, 1996). The East Greenland and Iceland LMEs are both characterized by aseasonal ice cover and by marked fluctuations in salinity, temperature and phytoplankton,
50
LME no. LME name Ocean Hemisphere ClimateLME 17 East Greenland Shelf Atlantic Northern SubarcticLME 18 Iceland Shelf Atlantic Northern SubarcticLME 19 Barents Sea Atlantic Northern SubarcticLME 23 Celtic-Biscay Shelf Atlantic Northern TemperateLME 40 New Zealand Shelf Pacific Southern TemperateLME 48 Faroe Plateau Atlantic Northern Subarctic
Cluster 9
0
10
20
30
40
50
60
70
80
1X-2X 31 32 33 34 35 36 37 38 4X 5X
LME 17
LME 18
LME 19
LME 23
LME 40
LME 48
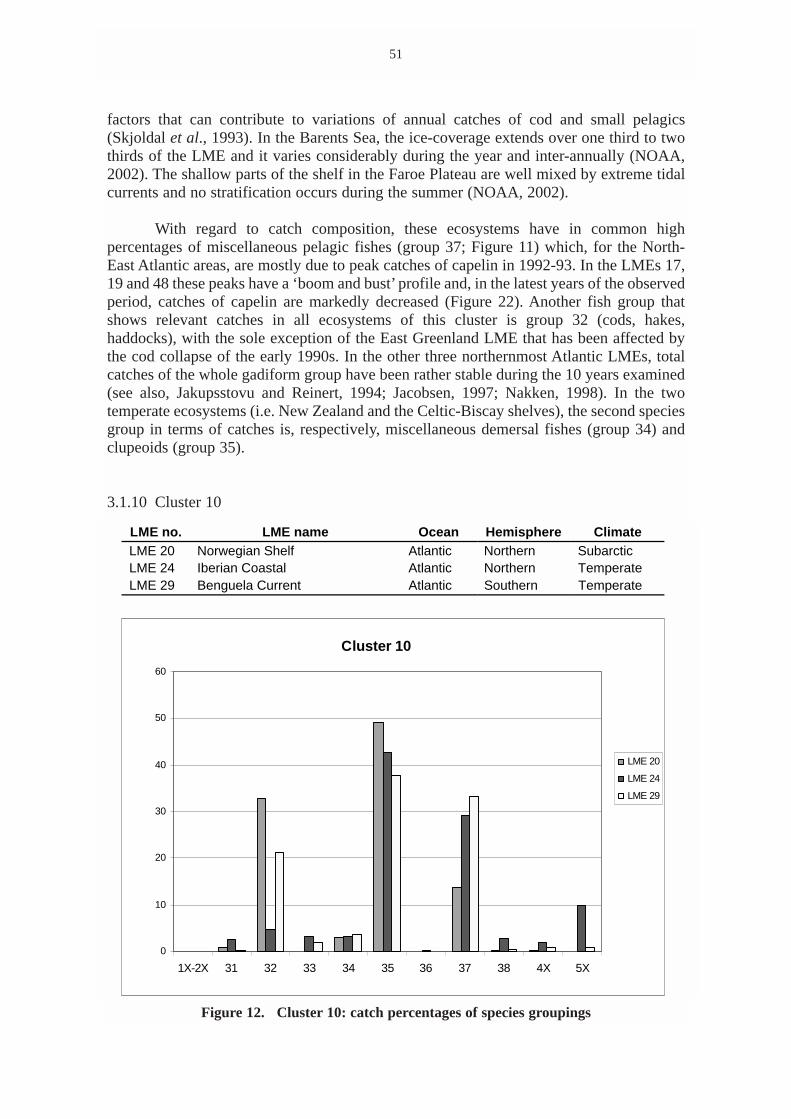
factors that can contribute to variations of annual catches of cod and small pelagics(Skjoldal et al., 1993). In the Barents Sea, the ice-coverage extends over one third to twothirds of the LME and it varies considerably during the year and inter-annually (NOAA,2002). The shallow parts of the shelf in the Faroe Plateau are well mixed by extreme tidalcurrents and no stratification occurs during the summer (NOAA, 2002).
With regard to catch composition, these ecosystems have in common highpercentages of miscellaneous pelagic fishes (group 37; Figure 11) which, for the North-East Atlantic areas, are mostly due to peak catches of capelin in 1992-93. In the LMEs 17,19 and 48 these peaks have a ‘boom and bust’ profile and, in the latest years of the observedperiod, catches of capelin are markedly decreased (Figure 22). Another fish group thatshows relevant catches in all ecosystems of this cluster is group 32 (cods, hakes,haddocks), with the sole exception of the East Greenland LME that has been affected bythe cod collapse of the early 1990s. In the other three northernmost Atlantic LMEs, totalcatches of the whole gadiform group have been rather stable during the 10 years examined(see also, Jakupsstovu and Reinert, 1994; Jacobsen, 1997; Nakken, 1998). In the twotemperate ecosystems (i.e. New Zealand and the Celtic-Biscay shelves), the second speciesgroup in terms of catches is, respectively, miscellaneous demersal fishes (group 34) andclupeoids (group 35).
3.1.10 Cluster 10
Figure 12. Cluster 10: catch percentages of species groupings
51
LME no. LME name Ocean Hemisphere ClimateLME 20 Norwegian Shelf Atlantic Northern SubarcticLME 24 Iberian Coastal Atlantic Northern TemperateLME 29 Benguela Current Atlantic Southern Temperate
Cluster 10
0
10
20
30
40
50
60
1X-2X 31 32 33 34 35 36 37 38 4X 5X
LME 20
LME 24
LME 29
The three ecosystems in this cluster are all western boundary ecosystems. TheNorwegian Shelf and the Benguela Current are characterized by a high productivityaccording to the SeaWiFS classification, whereas the Iberian Coastal LME is considered asmoderately productive. The catch composition pattern is dominated by three groups:herrings, sardines and anchovies (group 35), miscellaneous pelagic fishes (group 37) andcods, hakes and haddocks (group 32; Figure 12). Catches of Gadiformes are however verysignificant, and important for their value, only in the Norwegian Shelf and BenguelaCurrent areas.
The Norwegian Shelf LME has a complex fishery history with concomitantinfluences of ecological anomalies, high fishery mortality and early implementation ofmanagement measures (Blindheim and Skjoldal, 1993; NOAA, 2002). Its high productivityis probably to be linked to the nutrient rich, cold arctic waters that characterize this LME(Furnes and Sundby, 1980). Since the early 1990s there has been a significant increase inClupea harengus catches (Figure 23) which stock recovered after two decades of very lowabundance.
The Iberian Coastal LME’s productivity is climate and upwelling driven. It ischaracterized by favorable factors for the production of clupeoids and other small pelagicfishes (Wyatt and Perez-Gandaras, 1989). Trends in catches by species groupings havebeen quite steady in recent years (Figure 23).
In the Benguela Current LME is one of the most strongly wind-driven coastalupwelling systems known and it presents favorable conditions for a rich production ofsmall pelagics of groups 35 and 37 (Bakun, 1993). Harvests are characterized by stockfluctuations according to the variations in the primary and secondary level productivity.
52
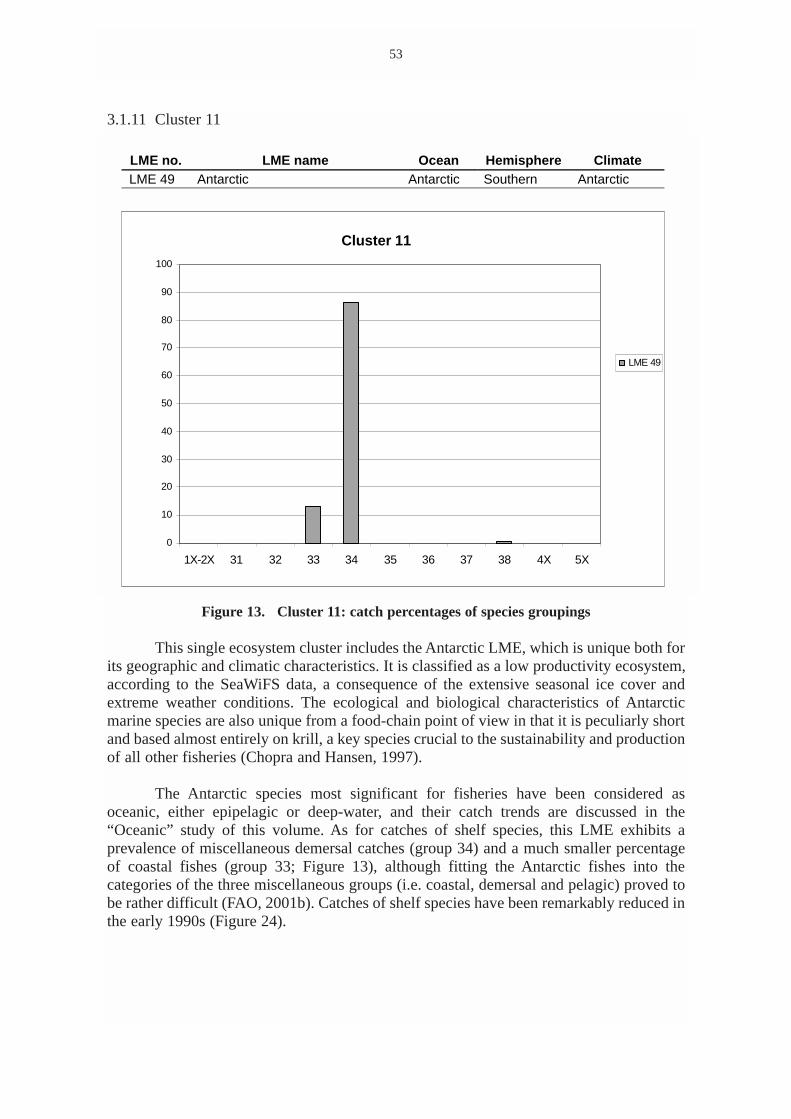
3.1.11 Cluster 11
Figure 13. Cluster 11: catch percentages of species groupings
This single ecosystem cluster includes the Antarctic LME, which is unique both forits geographic and climatic characteristics. It is classified as a low productivity ecosystem,according to the SeaWiFS data, a consequence of the extensive seasonal ice cover andextreme weather conditions. The ecological and biological characteristics of Antarcticmarine species are also unique from a food-chain point of view in that it is peculiarly shortand based almost entirely on krill, a key species crucial to the sustainability and productionof all other fisheries (Chopra and Hansen, 1997).
The Antarctic species most significant for fisheries have been considered asoceanic, either epipelagic or deep-water, and their catch trends are discussed in the“Oceanic” study of this volume. As for catches of shelf species, this LME exhibits aprevalence of miscellaneous demersal catches (group 34) and a much smaller percentageof coastal fishes (group 33; Figure 13), although fitting the Antarctic fishes into thecategories of the three miscellaneous groups (i.e. coastal, demersal and pelagic) proved tobe rather difficult (FAO, 2001b). Catches of shelf species have been remarkably reduced inthe early 1990s (Figure 24).
53
LME no. LME name Ocean Hemisphere ClimateLME 49 Antarctic Antarctic Southern Antarctic
Cluster 11
0
10
20
30
40
50
60
70
80
90
100
1X-2X 31 32 33 34 35 36 37 38 4X 5X
LME 49
Fi 13 Cl 11 h f i i

4. CONCLUSION
The general analysis of cluster composition, common characteristics and catchtrends (see Appendix 2) of LMEs in the same cluster presented some unexpected analogiesbetween ecosystems of different marine regions and confirmed similarities between areasin which well known ecological phenomena take place (e.g. upwelling regimes).
As expected, ecosystems with extreme characteristics (i.e. northernmost Pacific andAntarctic LMEs) have peculiar catch patterns and, not presenting similarities with otherLMEs, have been included in single clusters. Another cluster that includes only a singleLME (Patagonian Shelf), is characterized by predominant catches of cephalopods andGadiformes.
Three clusters (i.e. 4, 7 and 10) are dominated by catches of clupeoids, but somedifferences between the three groups of LMEs can be noted. The large marine ecosystemsin cluster 4 are highly productive, enriched by nutrients as they are either semi-enclosedseas or have upwelling regimes, with clupeoids representing about 50-70% of the catchesin their shelf areas (excluding catches reported as “Marine fishes not identified”). AlsoLMEs in cluster 10 are highly productive and, in addition to clupeoids, they arecharacterized by catches of Gadiformes and non-clupeoid small pelagics. In contrast,LMEs in cluster 7 have moderate or low productivity and theirs catch composition is morediverse with several other groups (i.e. coastal fishes, crustaceans, molluscs andmiscellaneous demersal fishes) represented by significant catches.
An unexpected finding was a cluster of five ecosystems where the majority(between 30 and 65%) of identified catches on the continental shelf are made of crustaceanspecies. This seems to be the only common feature amongst the LMEs of cluster 5, whichare quite diverse in their productivity, climate, and second ranking species group in termsof catches. The remaining clusters are characterized by catches distributed quite evenlyamongst the major groups of species (i.e. clusters 3 and 6) or with a slight predominanceof miscellaneous pelagic fishes (cluster 9).
However, given the global coverage and the limitations in data availability, thisstudy only aimed at providing basic information on catch composition by LME for futurestudies on single LMEs and some possible starting points for more in-depth ecologicallyoriented researches on fishery trends.
54
5. REFERENCES
Anonymous. 1998. An Ecosytem Strategy for the Assessment and Management ofInternational Coastal Ocean waters. Leaflet issued by IUCN, NOAA and IOC. 8 p.
Anonymous. 2001. Reykjavik Declaration on Responsible Fisheries in the MarineEcosystem. On-line at: http://www.refisheries2001.org/index.htm . Viewed 06/11/02.
Anonymous. 2002a. World Summit on Sustainable Development - Plan ofImplementation. On-line at:http://www.johannesburgsummit.org/html/documents/summit_docs/plan_final1009.doc . Viewed13/12/02.
Anonymous. 2002b. Oceans and the World Summit on Sustainable Development. A LargeMarine Ecosystems Strategy for the assessment and management of internationalcoastal waters. Leaflet issued by IUCN, NOOA and IOC, 8 p.
Baars, M.A., P.H. Schalk, and M.J.W. Veldhuis. 1998. “Seasonal fluctuations in planktonbiomass and productivity in the ecosystems of the Somali Current, Gulf of Aden,and Southern Red Sea”. In: K. Sherman, E.N. Okemwa, and M.J. Ntiba (eds.), LargeMarine Ecosystems of the Indian Ocean: assessment, sustainability, andmanagement. 143-174 p. Blackwell Science, Inc., Malden (Mass.), USA.
Bakun, A. 1993. “The California Current, Benguela current, and Southwestern AtlanticShelf ecosystems: a comparative approach to identifying factors regulating biomassyields”. In: K. Sherman, L.M. Alexander, B.D. Gold (eds.). Large MarineEcosystems: Stress, Mitigation, and Sustainability. 143-174 p. AAAS Press.Washington DC, USA.
Bakun, A., C. Roy, and S. Lluch-Cota. 1998. “Coastal Upwelling and other processesregulating ecosystem productivity and fish production in the Western Indian Ocean”.In: K. Sherman, E.N. Okemwa, and M.J. Ntiba (eds.), Large Marine Ecosystems ofthe Indian Ocean: assessment, sustainability, and management. 103-141 p.Blackwell Science, Inc., Malden (Mass.), USA.
Bakun, A., J. Csirke, D. Lluch-Belda, and R. Steer-Ruiz. 1999. “The Pacific CoastalLME”. In: K. Sherman, K. and Q. Tang (eds.). Large marine ecosystems of thePacific Rim: assessment, sustainability, and management. 268-280 p. BlackwellScience, Inc., Malden (Mass.), USA.
Bas, C. 1993. Long-term variability in the food chains, biomass yields, and oceanographyof the Canary Current ecosystem. In: K. Sherman, L.M. Alexander, B.D. Gold (eds.).Large Marine Ecosystems: Stress, Mitigation, and Sustainability. 94-103 p. AAASPress. Washington DC, USA.
Beckley, L.E. 1998. “The Agulhas Current Ecosystem with particular reference todispersal of fish larvae”. In: K. Sherman, E.N. Okemwa, and M.J. Ntiba (eds.),Large Marine Ecosystems of the Indian Ocean: assessment, sustainability, andmanagement. 255-276 p. Blackwell Science, Inc., Malden (Mass.), USA.
55
Behrenfeld, M. and P.G. Falkowski. 1997. “Photosynthetic rates derived from satellite-based chlorophyll concentration”. Limnol. Oceanogr. 42 (1): 1-20.
Bernal, P.A., F.L. Robles, and O. Rojas. 1983. “Variabilidad física y biológica en laregión meridional del sistema de corrientes Chile-Perú”. In: G.D. Sharp and J.Csirke (eds.) Proceedings of the Expert Consultation to examine changes inabundance and species of neritic fishe resources. San José, Costa Rica, 28-29 April1983. FAO Fisheries Report. No. 291, Vol. 3, 683-711 p.
Binet, D. 1983. “Phytoplancton et production primaire des regions côtiérs à upwellingssaissoniers dans le Golfe de Guinée”. Océanogr. Trop. 18: 331-355.
Blindheim, J. and H.R. Skjoldal. 1993. “Effects of climate changes on the biomass yieldof the Barents Sea, Norwegian Sea, and West Greenland large marine ecosystems”.In: K. Sherman, L.M. Alexander, B.D. Gold (eds.). Large Marine Ecosystems: Stress,Mitigation, and Sustainability. 185-198 p. AAAS Press. Washington DC, USA.
Brodeur, R.D., B.W. Frost, S.R. Hare, R.C. Francis, and W.J. Jr. Ingraham. 1999.“Interannual variations in zooplankton biomass in the Gulf of Alaska, andcovariation with California Current zooplankton biomass”. In: K. Sherman, K. andQ. Tang (eds.). Large marine ecosystems of the Pacific Rim: assessment,sustainability, and management. 106-138 p. Blackwell Science, Inc., Malden(Mass.), USA.
Brodie, J. 1999. “Management of the Great Barrier Reef as a Large Marine Ecosystem”.In: K. Sherman, K. and Q. Tang (eds.). Large marine ecosystems of the Pacific Rim:assessment, sustainability, and management. 428-437 p. Blackwell Science, Inc.,Malden (Mass.), USA.
Caddy, J.F. 1993. “Contrast between recent fishery trends and evidence for nutrientenrichment in two large marine ecosystems: the Mediterranean and the Black Seas”.In: K. Sherman, L.M. Alexander, B.D. Gold (eds.). Large Marine Ecosystems: Stress,Mitigation, and Sustainability. 137-147 p. AAAS Press. Washington DC, USA.
Caddy, J.F. and L. Garibaldi. 2000. “Apparent changes in the trophic composition ofworld marine harvests: the perspective from the FAO capture database”. Ocean andCoastal Management. 43 (8-9): 615-655.
Chopra, S. and C. Hansen. 1997. “Deep ecology and the Antarctic marine living resources:lessons for other regimes”. Ocean and Coastal Law Journal. 3(1-2): 117-148.
Dwivedi, S.N. 1993. “Long term variability in the food chains, biomass yield, andoceanography of the Bay of Bengal ecosystem”. In: K. Sherman, L.M. Alexander,B.D. Gold (eds.). Large Marine Ecosystems: Stress, Mitigation, and Sustainability.43-52 p. AAAS Press. Washington DC, USA.
Dwivedi, S.N. and A.K. Choubey. 1998. “Indian Ocean large marine ecosystems: Needfor national and regional framework for conservation and sustainable development”.In: K. Sherman, E.N. Okemwa, and M.J. Ntiba (eds.), Large Marine Ecosystems ofthe Indian Ocean: assessment, sustainability, and management. 327-333 p.Blackwell Science, Inc., Malden (Mass.), USA.
56
FAO (Food and Agriculture Organization of the United Nations). 2001a. “Report of thenineteenth session of the Coordinating Working Party on Fishery Statistics”.Nouméa, New Caledonia, 10-13 July 2001. FAO Fisheries Report. No. 656. 91 p.
FAO (Food and Agriculture Organization of the United Nations). 2001b. “Proposal for arevision of the ISSCAAP groups of the Marine Fishes division”. In: FAO AgencyReport to the Coordinating Working Party on Fishery Statistics. Nouméa, NewCaledonia, 10-13 July 2001, 42-49 p. On-line atftp://ftp.fao.org/fi/document/cwp/cwp_19/CWP-19-fao.pdf .
FAO (Food and Agriculture Organization of the United Nations). 2001c. Yearbook ofFishery Statistics – Capture Production 1999. Vol. 88/1. FAO, Rome, Italy.Downloadable at: http://www.fao.org/fi/statist/FISOFT/FISHPLUS.asp
Fredj, G., D. Bellan-Santin and M. Meinardi. 1992. “Etat des connaissances sur la faunemarine méditerranéenne”. In: D. Bellan (ed.), Spéciation et biogéographie en merMéditerranée, Bull. Inst. Océanogr. Monaco, no. sp. 9, 133-145 p.
Furnas, M.J. 2002. Land-sea interactions and oceanographic processes affecting thenutrient dynamics and productivity of Australian marine ecosystems. On-line at:http://www.ea.gov.au/coasts/publications/somer/annex1/land-sea.html#HDR7 .Viewed 25/07/02.
Furnes, G.K. and S. Sundby. 1980. “Upwelling and wind induced circulation inVestfjorden”. In: R. Saetre and M. Mork (eds.), Proceedings from NorwegianCoastal Current Symposium. University of Bergen, Geilo, Norway, 9-12 September1980.
Hovgard, H. and E. Buch, E. 1990. “Fluctuation in the cod biomass of the WestGreenland Sea Ecosystem in relation to climate”. In: K. Sherman, L.M. Alexander,and B.D. Gold (eds.). Large Marine Ecosystems: Patterns, Processes, and Yields.36-43 p. AAAS Publications Washington DC,.USA.
Jacobsen, O. 1997. “Skilled fishers, bungling economy”. SAMUDRA Report. No. 18, 20-25p.
Jakupsstovu, S.H. and J. Reinert. 1994. “Fluctuations in the Faroe Plateau stock”. In: J.Jakobsson, O.S. Astthorsson, R.J.H. Beverton, B. Bjoernsson, N. Daan, K.T.Frank, J.Meincke, B. Rothschild, S. Sundby, S. Tilseth (eds.). Cod and climate change.Proceedings of a symposium held in Reykjavik, 23-27 August 1993. ICES MarineScience Symposia. Vol. 198, 194-211 p.
Kaufman, L. and P.J. Rousseeuw. 1990. Finding groups in data: An introduction toCluster Analysis. Wiley, New York.
Koutsikopoulos, C. and B. Le Cann. 1996. “Physical processes and hydrologicalstructures related to the Bay of Biscay anchovy”. Scientia Marina, Vol. 60, suppl. 2,9-19 p.
Kullenberg, G. 1986. “Long-term changes in the Baltic Ecosystem”. In: K. Sherman andL.M. Alexander (eds.). Variability and Management of Large Marine Ecosystems,AAAS Selected Symposium 99, Westview Press, Boulder, CO, USA.
57
Kumpf, H., K. Steidinger, and K. Sherman. 1999. The Gulf of Mexico Large Marine Ecosystem:Assessment, Sustainability, and Management. Blackwell Science, Inc., Malden (Mass.),USA. 736 p.
Lohrenz, S.E., D.A. Wiesenburg, R.A. Arnone, and X. Chen. 1999. “What ControlsPrimary Production in the Gulf of Mexico?” In: H. Kumpf, K. Steidinger, and K.Sherman. 1999. The Gulf of Mexico Large Marine Ecosystem: Assessment, Sustainability, andManagement. Blackwell Science, Inc., Malden (Mass.), USA.
Medeiros, C., S.J. Macedos, F.A.N. Feitosa, and M.L. Koenig. 1999. “Hydrography andphytoplankton biomass and abundance of north-east Brazilian waters”. Arch. Fish.Mar. Res./Arch. Fisch. Meeresforsch. Vol. 47, no. 2-3, 133-151 p.
Nakken, O. 1998. “Past, present and future exploitation and management of marineresources in the Barents Sea and adjacent areas”. Fisheries Research. Vol. 37, No. 1-3, 23-25 p.
NOAA (National Oceanic and Atmospheric Administration). 2002. Large marineecosystems of the world. On line at: http://www.edc.uri.edu/lme/default.htm .Viewed 18/04/2002.
Pauly, D. and V. Christensen. 1993. “Stratified models of Large Marine Ecosystems: ageneral approach and an application to the South China Sea.”. In: K. Sherman, L.M.Alexander, B.D. Gold (eds.). Large Marine Ecosystems: Stress, Mitigation, andSustainability. 148-174 p. AAAS Press. Washington DC, USA.
Pison, G., A. Struyf, and P.J. Rousseeuw. 1999. “Displaying a clustering withCLUSPLOT”. Computational statistics & data analysis, 30(4): 381-392.
Rabalais, N.N., W.J. Jr. Wiseman, R.E. Turner, D. Justic, B.K. Sen-Gupta and Q. Dortch.1996. “Nutrient changes in the Mississippi River and system responses on theadjacent continental shelf”. Estuaries. Vol. 19 (2B): 386-407.
Richards, W.J. and J.A. Bohnsack. 1990. “The Caribbean Sea: a Large Marine Ecosystemin crisis”. In: K. Sherman, L.M. Alexander, and B.D. Gold (eds.). Large MarineEcosystems: Patterns, Processes, and Yields. 44-53 p. AAAS PublicationsWashington DC,.USA.
Rousseeuw, P.J. 1987. “Silhouettes: A graphical aid to the interpretation and validation ofcluster analysis”. J. Comput. Appl. Math. 20: 53-65.
SeaWiFS (Sea-viewing Wide Field-of-view Sensor) Project. 2002. On-line at:http://seawifs.gsfc.nasa.gov/SEAWIFS.html .
Sherman, K. 1994. “Sustainability, biomass yields, and health of coastal ecosystems: anecological perspective”. Mar. Ecol. Prog. Ser. 112: 277-301.
Sherman, K. and L.M. Alexander (eds.). 1986. Variability and Management of LargeMarine Ecosystems. AAAS Selected Symposium 99, Westview Press, Boulder, CO,USA. 319 p.
58
Sherman, K. and L.M. Alexander (eds.). 1989. Biomass Yields and Geography of LargeMarine Ecosystems. AAAS Selected Symposium 111. Westview Press, Boulder, CO,USA. 493 p.
Sherman, K. and A.M. Duda. 1999. “Large marine ecosystems: an emerging paradigmfor fishery sustainability”. Fisheries. 24(12): 15-26.
Sherman, K. and Q. Tang (eds). 1999. Large Marine Ecosystems of the Pacific Rim: Assessment,Sustainability, and Management. Blackwell Science, Inc., Malden (Mass.), USA. 465 p.
Sherman, K., L.M. Alexander, and B.D. Gold (eds.). 1990 (2nd printing 1992). LargeMarine Ecosystems: Patterns, Processes, and Yields. AAAS PublicationsWashington DC, USA. 242 p.
Sherman, K., L.M. Alexander, and B.D. Gold (eds.). 1991. Food Chains, Yields, Models,and Management of Large Marine Ecosystems. Westview Press, Inc. Boulder, CO.320 p.
Sherman, K., L.M. Alexander, B.D. Gold (eds.). 1993. Large Marine Ecosystems: Stress,Mitigation, and Sustainability. AAAS Press. Washington DC, USA. 376 p.
Sherman, K., N.A. Jaworski, and T.J. Smayda (eds). 1996. The Northeast Shelf Ecosystem:Assessment, Sustainability, and Management. Blackwell Science, Inc., Malden (Mass.), USA.564 p.
Sherman, K., E.N. Okemwa, and M.J. Ntiba (eds). 1998. Large Marine Ecosystems of the IndianOcean: Assessment, Sustainability, and Management. Blackwell Science, Inc., Malden(Mass.), USA. 394 p.
Skjoldal, H.R., T.T. Noji, J. Giske, J.H. Fossaa, J. Blindheim, and S. Sundby, S. 1993. Marecognitum. Science plan for research on marine ecology of the Nordic Seas (Greenland,Norwegian, Iceland Seas) 1993-2000. A regional GLOBEC program withcontributions also to WOCE and JGOFS. Inst. Mar. Res., Bergen, Norway, 162 p.
S-PLUS. 2000. Professional Edition for Windows, Release 3 (August 2000). MathSoft,Inc., Seattle, Washington.
Wyatt, T. and G. Perez-Gandaras. 1989. “Biomass Changes in the Iberian Ecosystem”. In:K. Sherman and L.M. Alexander (eds.). Biomass Yields and Geography of LargeMarine Ecosystems. AAAS Selected Symposium 111. Westview Press, Boulder, CO,USA.
Yoder, J.A. 1991. “Warm-temperate food chains of the Southeast Shelf ecosystem”. In: K.Sherman, L.M. Alexander, and B.D. Gold (eds.). Food Chains, Yields, Models, andManagement of Large Marine Ecosystems. 49-66 p. Westview Press, Inc. Boulder,CO, USA.
Zijlstra, J.J. and M.A. Baars. 1990. “Productivity and fisheries potential of the Banda Seaecosystem”. In: K. Sherman, L.M. Alexander, and B.D. Gold (eds.). Large MarineEcosystems: Patterns, Processes, and Yields. 54-65 p. AAAS PublicationsWashington DC,.USA.
59
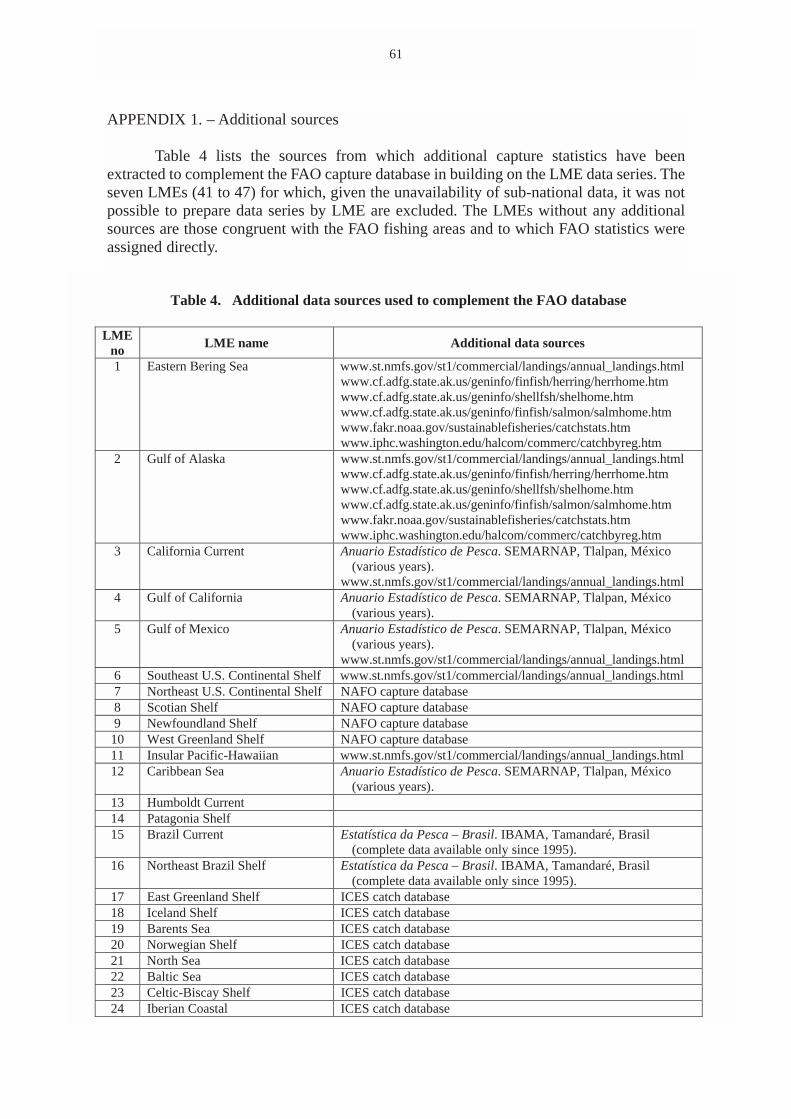
APPENDIX 1. – Additional sources
Table 4 lists the sources from which additional capture statistics have beenextracted to complement the FAO capture database in building on the LME data series. Theseven LMEs (41 to 47) for which, given the unavailability of sub-national data, it was notpossible to prepare data series by LME are excluded. The LMEs without any additionalsources are those congruent with the FAO fishing areas and to which FAO statistics wereassigned directly.
61
Table 4. Additional data sources used to complement the FAO database
LMEno LME name Additional data sources
1 Eastern Bering Sea www.st.nmfs.gov/st1/commercial/landings/annual_landings.htmlwww.cf.adfg.state.ak.us/geninfo/finfish/herring/herrhome.htmwww.cf.adfg.state.ak.us/geninfo/shellfsh/shelhome.htmwww.cf.adfg.state.ak.us/geninfo/finfish/salmon/salmhome.htmwww.fakr.noaa.gov/sustainablefisheries/catchstats.htmwww.iphc.washington.edu/halcom/commerc/catchbyreg.htm
2 Gulf of Alaska www.st.nmfs.gov/st1/commercial/landings/annual_landings.htmlwww.cf.adfg.state.ak.us/geninfo/finfish/herring/herrhome.htmwww.cf.adfg.state.ak.us/geninfo/shellfsh/shelhome.htmwww.cf.adfg.state.ak.us/geninfo/finfish/salmon/salmhome.htmwww.fakr.noaa.gov/sustainablefisheries/catchstats.htmwww.iphc.washington.edu/halcom/commerc/catchbyreg.htm
3 California Current Anuario Estadístico de Pesca. SEMARNAP, Tlalpan, México(various years).
www.st.nmfs.gov/st1/commercial/landings/annual_landings.html4 Gulf of California Anuario Estadístico de Pesca. SEMARNAP, Tlalpan, México
(various years).5 Gulf of Mexico Anuario Estadístico de Pesca. SEMARNAP, Tlalpan, México
(various years).www.st.nmfs.gov/st1/commercial/landings/annual_landings.html
6 Southeast U.S. Continental Shelf www.st.nmfs.gov/st1/commercial/landings/annual_landings.html7 Northeast U.S. Continental Shelf NAFO capture database8 Scotian Shelf NAFO capture database9 Newfoundland Shelf NAFO capture database
10 West Greenland Shelf NAFO capture database11 Insular Pacific-Hawaiian www.st.nmfs.gov/st1/commercial/landings/annual_landings.html12 Caribbean Sea Anuario Estadístico de Pesca. SEMARNAP, Tlalpan, México
(various years).13 Humboldt Current14 Patagonia Shelf15 Brazil Current Estatística da Pesca – Brasil. IBAMA, Tamandaré, Brasil
(complete data available only since 1995).16 Northeast Brazil Shelf Estatística da Pesca – Brasil. IBAMA, Tamandaré, Brasil
(complete data available only since 1995).17 East Greenland Shelf ICES catch database18 Iceland Shelf ICES catch database19 Barents Sea ICES catch database20 Norwegian Shelf ICES catch database21 North Sea ICES catch database22 Baltic Sea ICES catch database23 Celtic-Biscay Shelf ICES catch database24 Iberian Coastal ICES catch database
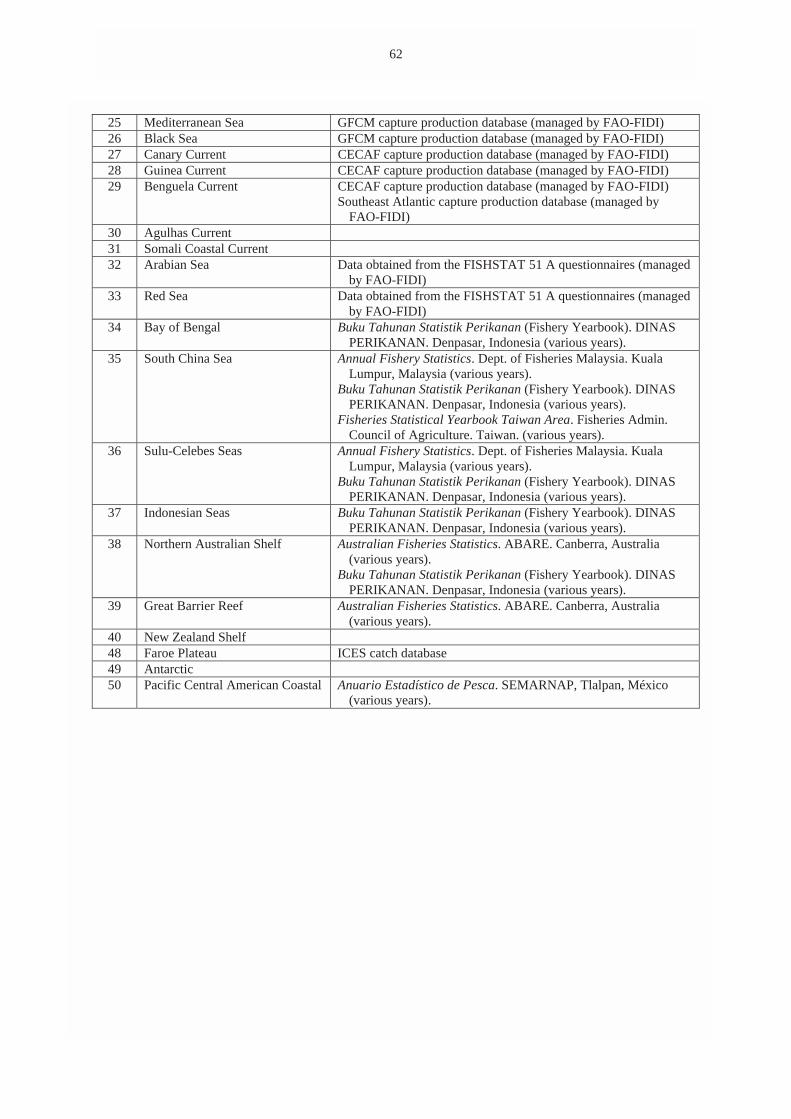
62
25 Mediterranean Sea GFCM capture production database (managed by FAO-FIDI)26 Black Sea GFCM capture production database (managed by FAO-FIDI)27 Canary Current CECAF capture production database (managed by FAO-FIDI)28 Guinea Current CECAF capture production database (managed by FAO-FIDI)29 Benguela Current CECAF capture production database (managed by FAO-FIDI)
Southeast Atlantic capture production database (managed byFAO-FIDI)
30 Agulhas Current31 Somali Coastal Current32 Arabian Sea Data obtained from the FISHSTAT 51 A questionnaires (managed
by FAO-FIDI)33 Red Sea Data obtained from the FISHSTAT 51 A questionnaires (managed
by FAO-FIDI)34 Bay of Bengal Buku Tahunan Statistik Perikanan (Fishery Yearbook). DINAS
PERIKANAN. Denpasar, Indonesia (various years).35 South China Sea Annual Fishery Statistics. Dept. of Fisheries Malaysia. Kuala
Lumpur, Malaysia (various years).Buku Tahunan Statistik Perikanan (Fishery Yearbook). DINAS
PERIKANAN. Denpasar, Indonesia (various years).Fisheries Statistical Yearbook Taiwan Area. Fisheries Admin.
Council of Agriculture. Taiwan. (various years).36 Sulu-Celebes Seas Annual Fishery Statistics. Dept. of Fisheries Malaysia. Kuala
Lumpur, Malaysia (various years).Buku Tahunan Statistik Perikanan (Fishery Yearbook). DINAS
PERIKANAN. Denpasar, Indonesia (various years).37 Indonesian Seas Buku Tahunan Statistik Perikanan (Fishery Yearbook). DINAS
PERIKANAN. Denpasar, Indonesia (various years).38 Northern Australian Shelf Australian Fisheries Statistics. ABARE. Canberra, Australia
(various years).Buku Tahunan Statistik Perikanan (Fishery Yearbook). DINAS
PERIKANAN. Denpasar, Indonesia (various years).39 Great Barrier Reef Australian Fisheries Statistics. ABARE. Canberra, Australia
(various years).40 New Zealand Shelf48 Faroe Plateau ICES catch database49 Antarctic50 Pacific Central American Coastal Anuario Estadístico de Pesca. SEMARNAP, Tlalpan, México
(various years).
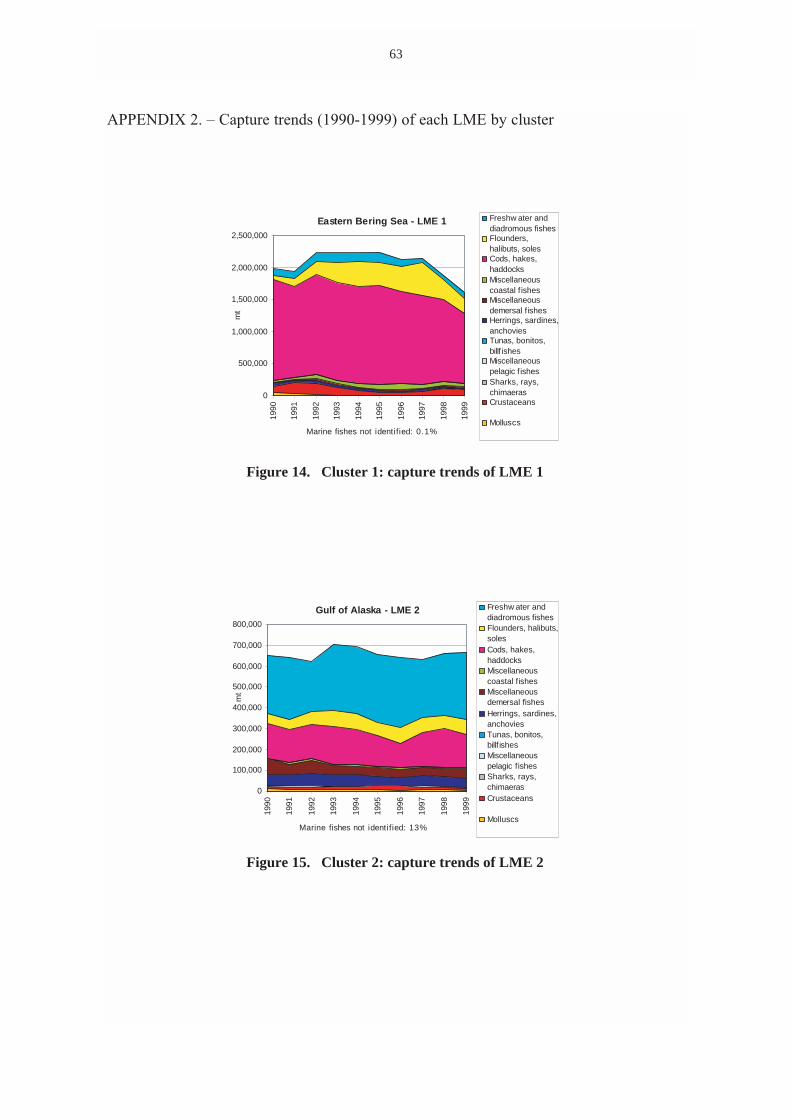
������������� ����������������������������� ��� !��"#��$�����
63
0
500,000
1,000,000
1,500,000
2,000,000
2,500,000
1990
1991
1992
1993
1994
1995
1996
1997
1998
1999
mt
Freshw ater anddiadromous fishesFlounders,halibuts, solesCods, hakes,haddocksMiscellaneouscoastal f ishesMiscellaneousdemersal f ishesHerrings, sardines,anchoviesTunas, bonitos,billf ishesMiscellaneouspelagic f ishesSharks, rays,chimaerasCrustaceans
Molluscs
Eastern Bering Sea - LME 1
Marine fishes not identified: 0.1%
Figure 14. Cluster 1: capture trends of LME 1
0
100,000
200,000
300,000
400,000
500,000
600,000
700,000
800,000
1990
1991
1992
1993
1994
1995
1996
1997
1998
1999
mt
Freshw ater anddiadromous fishesFlounders, halibuts,solesCods, hakes,haddocksMiscellaneouscoastal f ishesMiscellaneousdemersal fishesHerrings, sardines,anchoviesTunas, bonitos,billf ishesMiscellaneouspelagic fishesSharks, rays,chimaerasCrustaceans
Molluscs
Gulf of Alaska - LME 2
Marine fishes not identified: 13%
Figure 15. Cluster 2: capture trends of LME 2
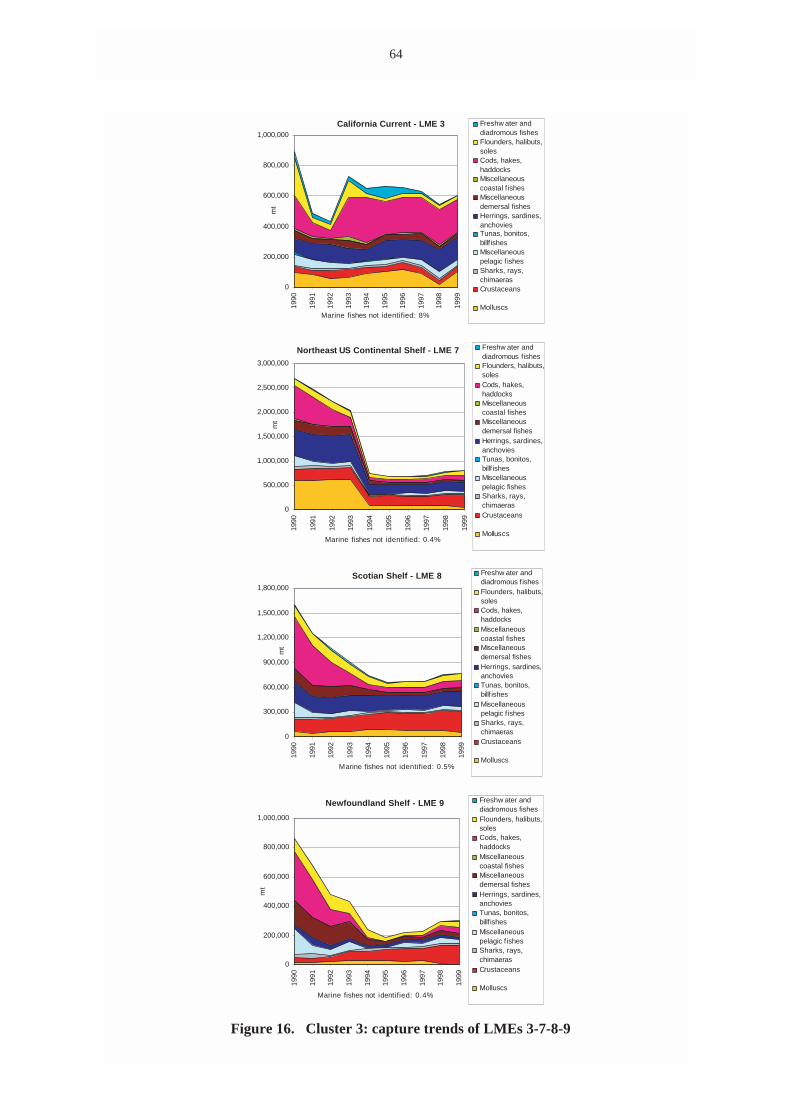
64
0
200,000
400,000
600,000
800,000
1,000,000
1990
1991
1992
1993
1994
1995
1996
1997
1998
1999
mt
Freshw ater anddiadromous fishesFlounders, halibuts,solesCods, hakes,haddocksMiscellaneouscoastal f ishesMiscellaneousdemersal fishesHerrings, sardines,anchoviesTunas, bonitos,billf ishesMiscellaneouspelagic f ishesSharks, rays,chimaerasCrustaceans
Molluscs
California Current - LME 3
Marine fishes not identified: 8%
0
500,000
1,000,000
1,500,000
2,000,000
2,500,000
3,000,000
1990
1991
1992
1993
1994
1995
1996
1997
1998
1999
mt
Freshw ater anddiadromous fishesFlounders, halibuts,solesCods, hakes,haddocksMiscellaneouscoastal fishesMiscellaneousdemersal fishesHerrings, sardines,anchoviesTunas, bonitos,billf ishesMiscellaneouspelagic fishesSharks, rays,chimaerasCrustaceans
Molluscs
Northeast US Continental Shelf - LME 7
Marine fishes not identified: 0.4%
0
300,000
600,000
900,000
1,200,000
1,500,000
1,800,000
1990
1991
1992
1993
1994
1995
1996
1997
1998
1999
mt
Freshw ater anddiadromous f ishesFlounders, halibuts,solesCods, hakes,haddocksMiscellaneouscoastal fishesMiscellaneousdemersal fishesHerrings, sardines,anchoviesTunas, bonitos,billf ishesMiscellaneouspelagic f ishesSharks, rays,chimaerasCrustaceans
Molluscs
Scotian Shelf - LME 8
Marine fishes not identified: 0.5%
0
200,000
400,000
600,000
800,000
1,000,000
1990
1991
1992
1993
1994
1995
1996
1997
1998
1999
mt
Freshw ater anddiadromous fishesFlounders, halibuts,solesCods, hakes,haddocksMiscellaneouscoastal fishesMiscellaneousdemersal fishesHerrings, sardines,anchoviesTunas, bonitos,billf ishesMiscellaneouspelagic f ishesSharks, rays,chimaerasCrustaceans
Molluscs
Newfoundland Shelf - LME 9
Marine fishes not identified: 0.4%
Figure 16. Cluster 3: capture trends of LMEs 3-7-8-9
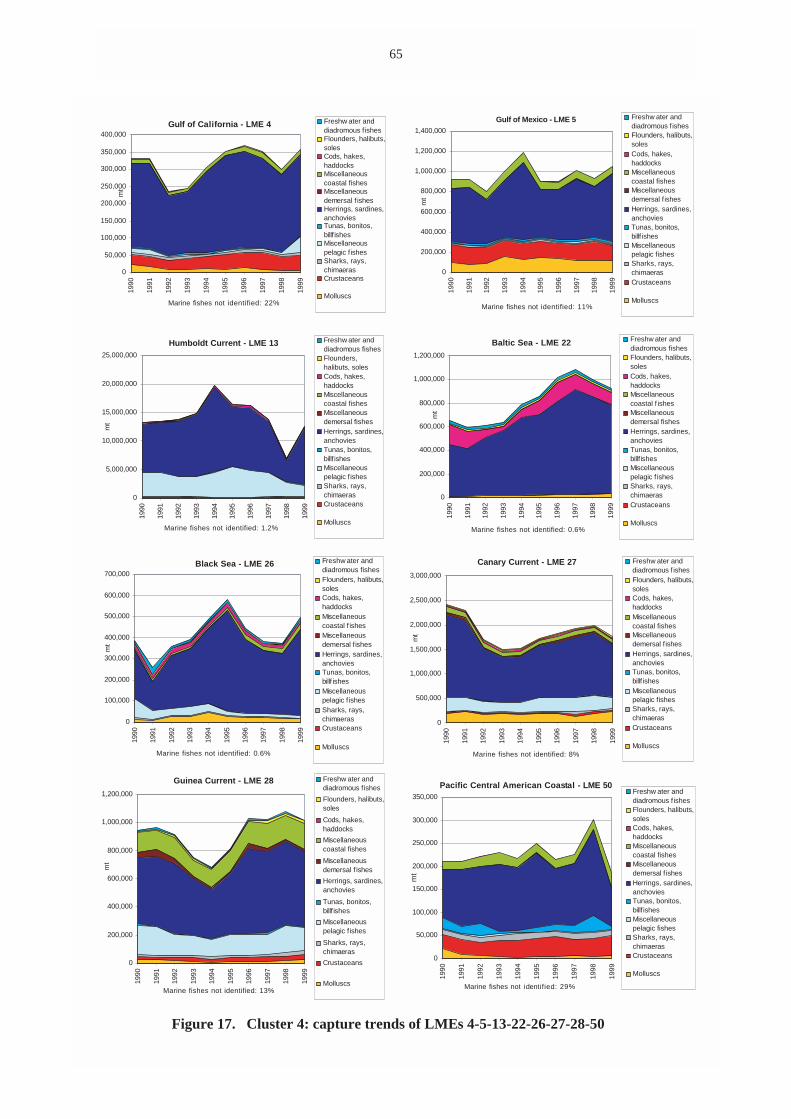
65
0
50,000
100,000
150,000
200,000
250,000
300,000
350,000
400,00019
90
1991
1992
1993
1994
1995
1996
1997
1998
1999
mt
Freshw ater anddiadromous fishesFlounders, halibuts,solesCods, hakes,haddocksMiscellaneouscoastal fishesMiscellaneousdemersal f ishesHerrings, sardines,anchoviesTunas, bonitos,billf ishesMiscellaneouspelagic fishesSharks, rays,chimaerasCrustaceans
Molluscs
Gulf of California - LME 4
.
Marine fishes not identified: 22%
0
200,000
400,000
600,000
800,000
1,000,000
1,200,000
1,400,000
1990
1991
1992
1993
1994
1995
1996
1997
1998
1999
mt
Freshw ater anddiadromous f ishesFlounders, halibuts,solesCods, hakes,haddocksMiscellaneouscoastal fishesMiscellaneousdemersal fishesHerrings, sardines,anchoviesTunas, bonitos,billf ishesMiscellaneouspelagic fishesSharks, rays,chimaerasCrustaceans
Molluscs
Gulf of Mexico - LME 5
Marine fishes not identified: 11%
0
5,000,000
10,000,000
15,000,000
20,000,000
25,000,000
1990
1991
1992
1993
1994
1995
1996
1997
1998
1999
mt
Freshw ater anddiadromous fishesFlounders,halibuts, solesCods, hakes,haddocksMiscellaneouscoastal fishesMiscellaneousdemersal fishesHerrings, sardines,anchoviesTunas, bonitos,billf ishesMiscellaneouspelagic fishesSharks, rays,chimaerasCrustaceans
Molluscs
Humboldt Current - LME 13
Marine fishes not identified: 1.2%
0
200,000
400,000
600,000
800,000
1,000,000
1,200,000
1990
1991
1992
1993
1994
1995
1996
1997
1998
1999
mt
Freshw ater anddiadromous fishesFlounders, halibuts,solesCods, hakes,haddocksMiscellaneouscoastal f ishesMiscellaneousdemersal fishesHerrings, sardines,anchoviesTunas, bonitos,billf ishesMiscellaneouspelagic f ishesSharks, rays,chimaerasCrustaceans
Molluscs
Baltic Sea - LME 22
Marine fishes not identified: 0.6%
0
100,000
200,000
300,000
400,000
500,000
600,000
700,000
1990
1991
1992
1993
1994
1995
1996
1997
1998
1999
mt
Freshw ater anddiadromous fishesFlounders, halibuts,solesCods, hakes,haddocksMiscellaneouscoastal f ishesMiscellaneousdemersal fishesHerrings, sardines,anchoviesTunas, bonitos,billf ishesMiscellaneouspelagic f ishesSharks, rays,chimaerasCrustaceans
Molluscs
Black Sea - LME 26
Marine fishes not identified: 0.6%
0
500,000
1,000,000
1,500,000
2,000,000
2,500,000
3,000,000
1990
1991
1992
1993
1994
1995
1996
1997
1998
1999
mt
Freshw ater anddiadromous f ishesFlounders, halibuts,solesCods, hakes,haddocksMiscellaneouscoastal fishesMiscellaneousdemersal fishesHerrings, sardines,anchoviesTunas, bonitos,billf ishesMiscellaneouspelagic fishesSharks, rays,chimaerasCrustaceans
Molluscs
Canary Current - LME 27
Marine fishes not identified: 8%
0
200,000
400,000
600,000
800,000
1,000,000
1,200,000
1990
1991
1992
1993
1994
1995
1996
1997
1998
1999
mt
Freshw ater anddiadromous fishes
Flounders, halibuts,soles
Cods, hakes,haddocks
Miscellaneouscoastal fishes
Miscellaneousdemersal f ishes
Herrings, sardines,anchovies
Tunas, bonitos,billf ishes
Miscellaneouspelagic fishes
Sharks, rays,chimaeras
Crustaceans
Molluscs
Guinea Current - LME 28
Marine fishes not identified: 13%
0
50,000
100,000
150,000
200,000
250,000
300,000
350,000
1990
1991
1992
1993
1994
1995
1996
1997
1998
1999
mt
Freshw ater anddiadromous fishesFlounders, halibuts,solesCods, hakes,haddocksMiscellaneouscoastal fishesMiscellaneousdemersal f ishesHerrings, sardines,anchoviesTunas, bonitos,billf ishesMiscellaneouspelagic fishesSharks, rays,chimaerasCrustaceans
Molluscs
Pacific Central American Coastal - LME 50
Marine fishes not identified: 29%
Figure 17. Cluster 4: capture trends of LMEs 4-5-13-22-26-27-28-50
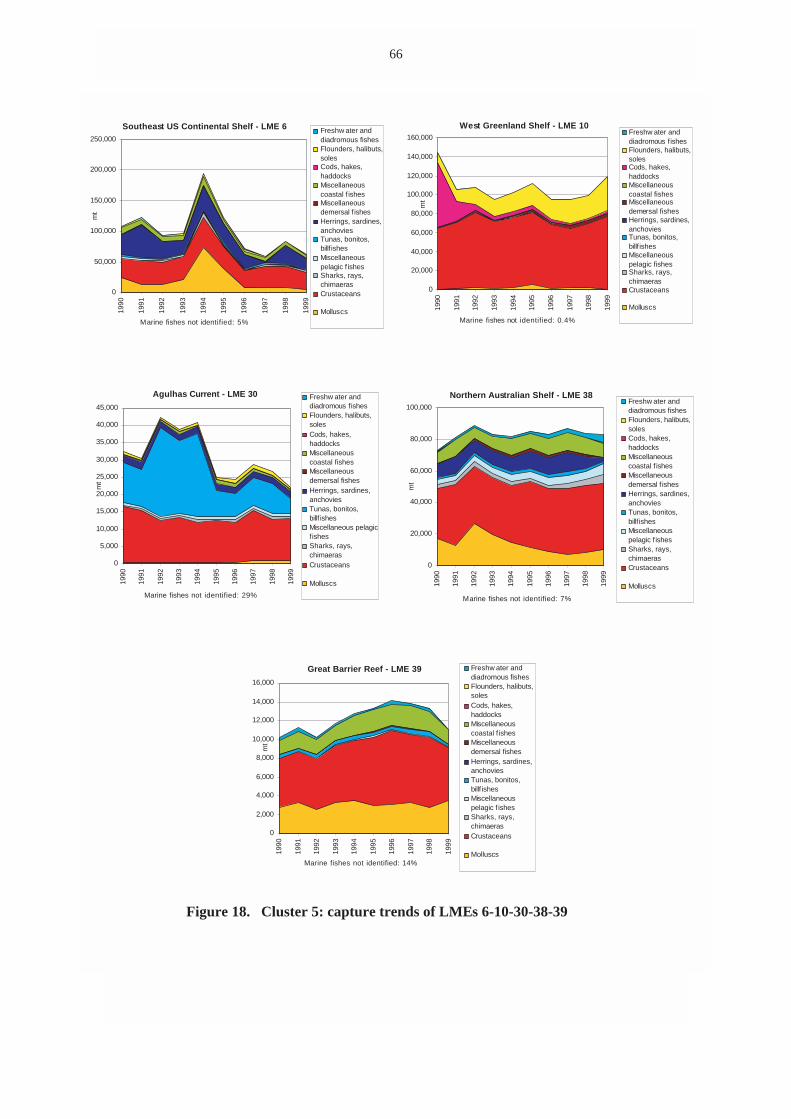
66
0
50,000
100,000
150,000
200,000
250,000
1990
1991
1992
1993
1994
1995
1996
1997
1998
1999
mt
Freshw ater anddiadromous fishesFlounders, halibuts,solesCods, hakes,haddocksMiscellaneouscoastal f ishesMiscellaneousdemersal f ishesHerrings, sardines,anchoviesTunas, bonitos,billf ishesMiscellaneouspelagic f ishesSharks, rays,chimaerasCrustaceans
Molluscs
Southeast US Continental Shelf - LME 6
Marine fishes not identified: 5%
0
20,000
40,000
60,000
80,000
100,000
120,000
140,000
160,000
1990
1991
1992
1993
1994
1995
1996
1997
1998
1999
mt
Freshw ater anddiadromous fishesFlounders, halibuts,solesCods, hakes,haddocksMiscellaneouscoastal fishesMiscellaneousdemersal fishesHerrings, sardines,anchoviesTunas, bonitos,billf ishesMiscellaneouspelagic fishesSharks, rays,chimaerasCrustaceans
Molluscs
West Greenland Shelf - LME 10
Marine fishes not identified: 0.4%
0
5,000
10,000
15,000
20,000
25,000
30,000
35,000
40,000
45,000
1990
1991
1992
1993
1994
1995
1996
1997
1998
1999
mt
Freshw ater anddiadromous fishesFlounders, halibuts,solesCods, hakes,haddocksMiscellaneouscoastal fishesMiscellaneousdemersal fishesHerrings, sardines,anchoviesTunas, bonitos,billf ishesMiscellaneous pelagicfishesSharks, rays,chimaerasCrustaceans
Molluscs
Agulhas Current - LME 30
Marine fishes not identified: 29%
0
20,000
40,000
60,000
80,000
100,000
1990
1991
1992
1993
1994
1995
1996
1997
1998
1999
mt
Freshw ater anddiadromous fishesFlounders, halibuts,solesCods, hakes,haddocksMiscellaneouscoastal f ishesMiscellaneousdemersal f ishesHerrings, sardines,anchoviesTunas, bonitos,billf ishesMiscellaneouspelagic f ishesSharks, rays,chimaerasCrustaceans
Molluscs
Northern Australian Shelf - LME 38
Marine fishes not identified: 7%
0
2,000
4,000
6,000
8,000
10,000
12,000
14,000
16,000
1990
1991
1992
1993
1994
1995
1996
1997
1998
1999
mt
Freshw ater anddiadromous fishesFlounders, halibuts,solesCods, hakes,haddocksMiscellaneouscoastal f ishesMiscellaneousdemersal fishesHerrings, sardines,anchoviesTunas, bonitos,billf ishesMiscellaneouspelagic f ishesSharks, rays,chimaerasCrustaceans
Molluscs
Great Barrier Reef - LME 39
Marine fishes not identified: 14%
Figure 18. Cluster 5: capture trends of LMEs 6-10-30-38-39
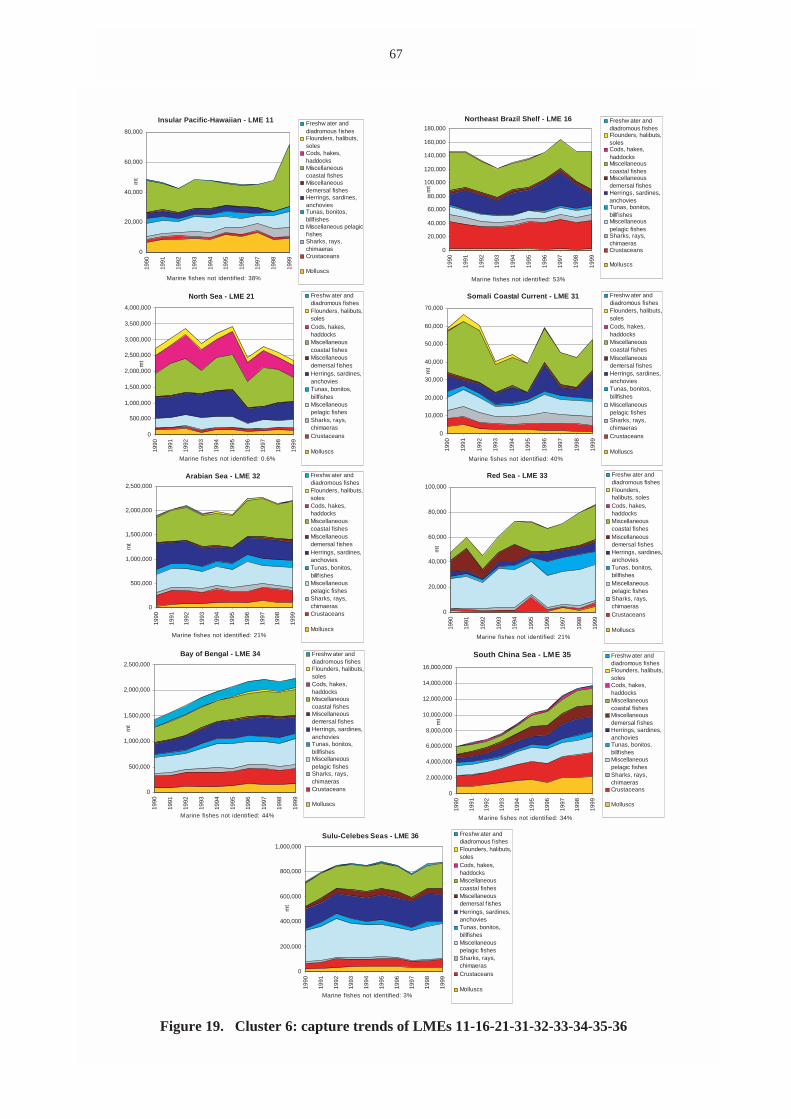
67
0
20,000
40,000
60,000
80,000
1990
1991
1992
1993
1994
1995
1996
1997
1998
1999
mt
Freshw ater anddiadromous fishesFlounders, halibuts,solesCods, hakes,haddocksMiscellaneouscoastal fishesMiscellaneousdemersal fishesHerrings, sardines,anchoviesTunas, bonitos,billf ishesMiscellaneous pelagicf ishesSharks, rays,chimaerasCrustaceans
Molluscs
Insular Pacific-Hawaiian - LME 11
Marine fishes not identified: 38%
0
20,000
40,000
60,000
80,000
100,000
120,000
140,000
160,000
180,000
1990
1991
1992
1993
1994
1995
1996
1997
1998
1999
mt
Freshw ater anddiadromous fishesFlounders, halibuts,solesCods, hakes,haddocksMiscellaneouscoastal fishesMiscellaneousdemersal fishesHerrings, sardines,anchoviesTunas, bonitos,billf ishesMiscellaneouspelagic fishesSharks, rays,chimaerasCrustaceans
Molluscs
Northeast Brazil Shelf - LME 16
Marine fishes not identified: 53%
0
500,000
1,000,000
1,500,000
2,000,000
2,500,000
3,000,000
3,500,000
4,000,000
1990
1991
1992
1993
1994
1995
1996
1997
1998
1999
mt
Freshw ater anddiadromous fishesFlounders, halibuts,solesCods, hakes,haddocksMiscellaneouscoastal fishesMiscellaneousdemersal f ishesHerrings, sardines,anchoviesTunas, bonitos,billfishesMiscellaneouspelagic fishesSharks, rays,chimaerasCrustaceans
Molluscs
North Sea - LME 21
Marine fishes not identified: 0.6%
0
10,000
20,000
30,000
40,000
50,000
60,000
70,000
1990
1991
1992
1993
1994
1995
1996
1997
1998
1999
mt
Freshw ater anddiadromous fishesFlounders, halibuts,solesCods, hakes,haddocksMiscellaneouscoastal fishesMiscellaneousdemersal fishesHerrings, sardines,anchoviesTunas, bonitos,billfishesMiscellaneouspelagic fishesSharks, rays,chimaerasCrustaceans
Molluscs
Somali Coastal Current - LME 31
Marine fishes not identified: 40%
0
500,000
1,000,000
1,500,000
2,000,000
2,500,000
1990
1991
1992
1993
1994
1995
1996
1997
1998
1999
mt
Freshw ater anddiadromous fishesFlounders, halibuts,solesCods, hakes,haddocksMiscellaneouscoastal fishesMiscellaneousdemersal f ishesHerrings, sardines,anchoviesTunas, bonitos,billf ishesMiscellaneouspelagic fishesSharks, rays,chimaerasCrustaceans
Molluscs
Arabian Sea - LME 32
Marine fishes not identified: 21%
0
20,000
40,000
60,000
80,000
100,000
1990
1991
1992
1993
1994
1995
1996
1997
1998
1999
mt
Freshw ater anddiadromous fishesFlounders,halibuts, solesCods, hakes,haddocksMiscellaneouscoastal fishesMiscellaneousdemersal fishesHerrings, sardines,anchoviesTunas, bonitos,billfishesMiscellaneouspelagic fishesSharks, rays,chimaerasCrustaceans
Molluscs
Red Sea - LME 33
Marine fishes not identified: 21%
0
500,000
1,000,000
1,500,000
2,000,000
2,500,000
1990
1991
1992
1993
1994
1995
1996
1997
1998
1999
mt
Freshw ater anddiadromous fishesFlounders, halibuts,solesCods, hakes,haddocksMiscellaneouscoastal fishesMiscellaneousdemersal fishesHerrings, sardines,anchoviesTunas, bonitos,billfishesMiscellaneouspelagic fishesSharks, rays,chimaerasCrustaceans
Molluscs
Bay of Bengal - LME 34
Marine fishes not identified: 44%
0
2,000,000
4,000,000
6,000,000
8,000,000
10,000,000
12,000,000
14,000,000
16,000,000
1990
1991
1992
1993
1994
1995
1996
1997
1998
1999
mt
Freshw ater anddiadromous fishesFlounders, halibuts,solesCods, hakes,haddocksMiscellaneouscoastal fishesMiscellaneousdemersal f ishesHerrings, sardines,anchoviesTunas, bonitos,billf ishesMiscellaneouspelagic fishesSharks, rays,chimaerasCrustaceans
Molluscs
South China Sea - LME 35
Marine fishes not identified: 34%
0
200,000
400,000
600,000
800,000
1,000,000
1990
1991
1992
1993
1994
1995
1996
1997
1998
1999
mt
Freshw ater anddiadromous fishesFlounders, halibuts,solesCods, hakes,haddocksMiscellaneouscoastal fishesMiscellaneousdemersal f ishesHerrings, sardines,anchoviesTunas, bonitos,billfishesMiscellaneouspelagic fishesSharks, rays,chimaerasCrustaceans
Molluscs
Sulu-Celebes Seas - LME 36
Marine fishes not identified: 3%
Figure 19. Cluster 6: capture trends of LMEs 11-16-21-31-32-33-34-35-36
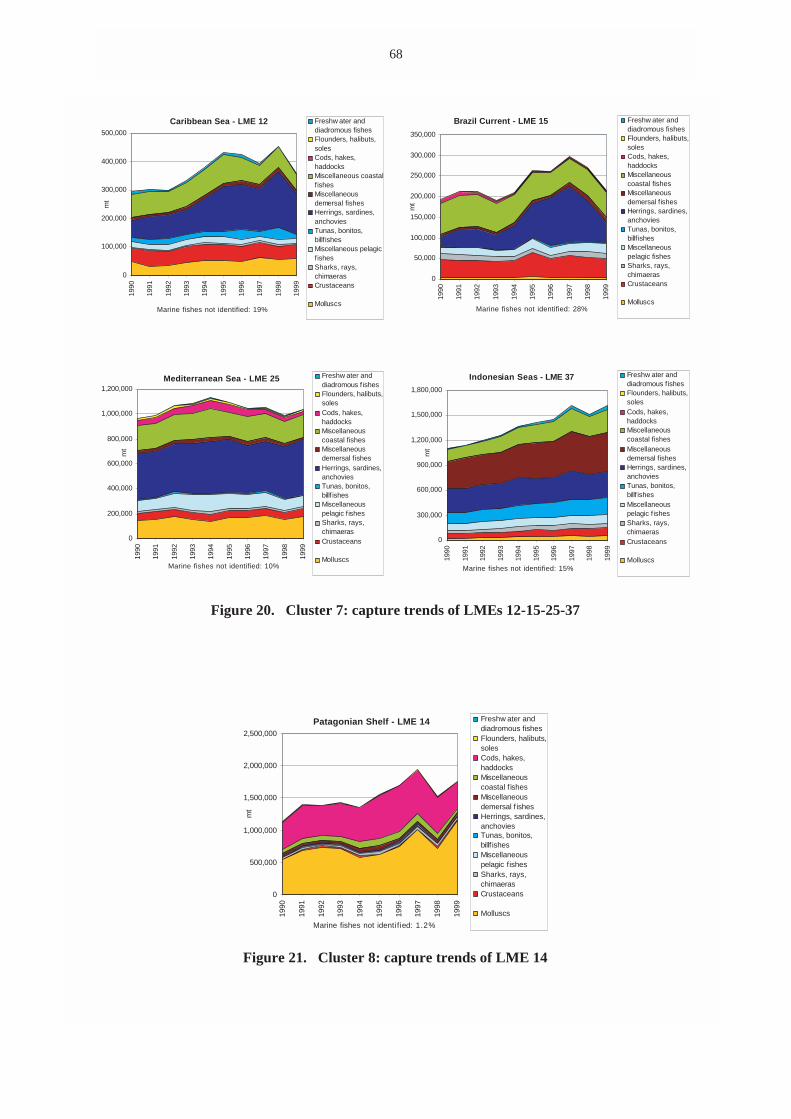
68
0
100,000
200,000
300,000
400,000
500,00019
90
1991
1992
1993
1994
1995
1996
1997
1998
1999
mt
Freshw ater anddiadromous fishesFlounders, halibuts,solesCods, hakes,haddocksMiscellaneous coastalf ishesMiscellaneousdemersal fishesHerrings, sardines,anchoviesTunas, bonitos,billf ishesMiscellaneous pelagicfishesSharks, rays,chimaerasCrustaceans
Molluscs
Caribbean Sea - LME 12
Marine fishes not identified: 19%
0
50,000
100,000
150,000
200,000
250,000
300,000
350,000
1990
1991
1992
1993
1994
1995
1996
1997
1998
1999
mt
Freshw ater anddiadromous fishesFlounders, halibuts,solesCods, hakes,haddocksMiscellaneouscoastal fishesMiscellaneousdemersal fishesHerrings, sardines,anchoviesTunas, bonitos,billf ishesMiscellaneouspelagic fishesSharks, rays,chimaerasCrustaceans
Molluscs
Brazil Current - LME 15
Marine fishes not identified: 28%
0
200,000
400,000
600,000
800,000
1,000,000
1,200,000
1990
1991
1992
1993
1994
1995
1996
1997
1998
1999
mt
Freshw ater anddiadromous f ishesFlounders, halibuts,solesCods, hakes,haddocksMiscellaneouscoastal fishesMiscellaneousdemersal fishesHerrings, sardines,anchoviesTunas, bonitos,billf ishesMiscellaneouspelagic fishesSharks, rays,chimaerasCrustaceans
Molluscs
Mediterranean Sea - LME 25
Marine fishes not identified: 10%
0
300,000
600,000
900,000
1,200,000
1,500,000
1,800,000
1990
1991
1992
1993
1994
1995
1996
1997
1998
1999
mt
Freshw ater anddiadromous fishesFlounders, halibuts,solesCods, hakes,haddocksMiscellaneouscoastal fishesMiscellaneousdemersal fishesHerrings, sardines,anchoviesTunas, bonitos,billf ishesMiscellaneouspelagic fishesSharks, rays,chimaerasCrustaceans
Molluscs
Indonesian Seas - LME 37
Marine fishes not identified: 15%
Figure 20. Cluster 7: capture trends of LMEs 12-15-25-37
0
500,000
1,000,000
1,500,000
2,000,000
2,500,000
1990
1991
1992
1993
1994
1995
1996
1997
1998
1999
mt
Freshw ater anddiadromous fishesFlounders, halibuts,solesCods, hakes,haddocksMiscellaneouscoastal f ishesMiscellaneousdemersal f ishesHerrings, sardines,anchoviesTunas, bonitos,billf ishesMiscellaneouspelagic fishesSharks, rays,chimaerasCrustaceans
Molluscs
Patagonian Shelf - LME 14
Marine fishes not identified: 1.2%
Figure 21. Cluster 8: capture trends of LME 14
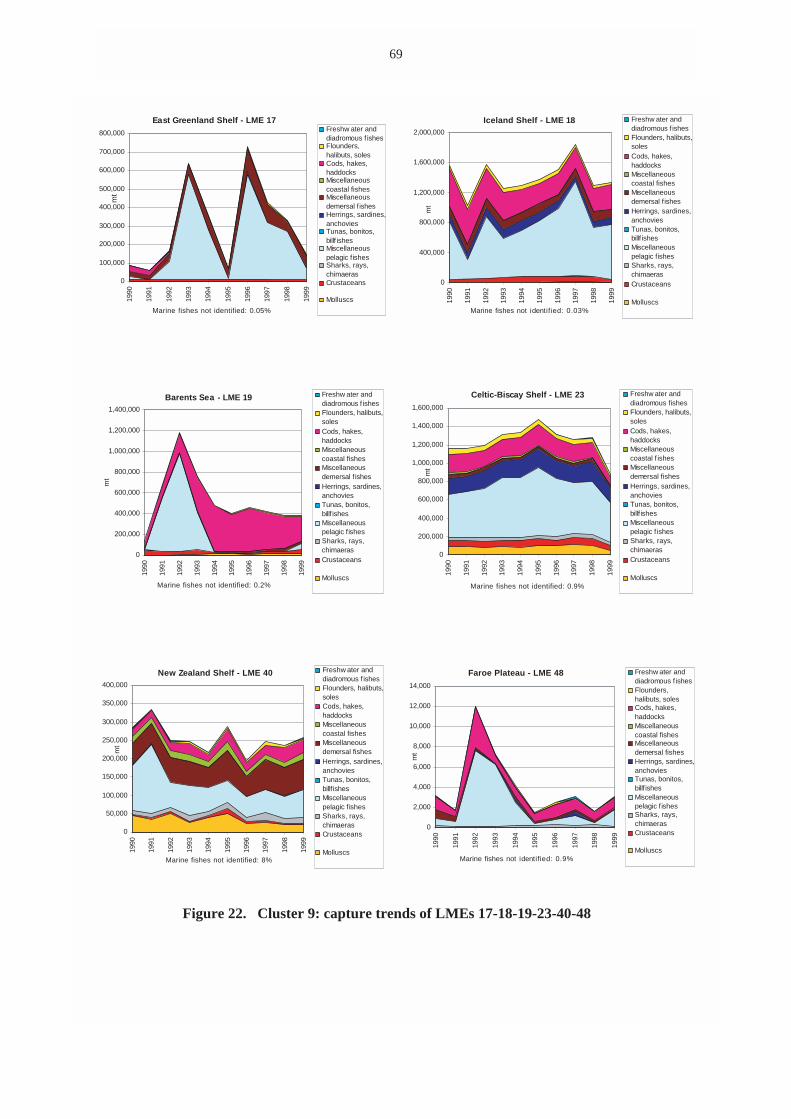
69
0
100,000
200,000
300,000
400,000
500,000
600,000
700,000
800,00019
90
1991
1992
1993
1994
1995
1996
1997
1998
1999
mt
Freshw ater anddiadromous f ishesFlounders,halibuts, solesCods, hakes,haddocksMiscellaneouscoastal fishesMiscellaneousdemersal fishesHerrings, sardines,anchoviesTunas, bonitos,billf ishesMiscellaneouspelagic fishesSharks, rays,chimaerasCrustaceans
Molluscs
East Greenland Shelf - LME 17
Marine fishes not identified: 0.05%
0
400,000
800,000
1,200,000
1,600,000
2,000,000
1990
1991
1992
1993
1994
1995
1996
1997
1998
1999
mt
Freshw ater anddiadromous f ishesFlounders, halibuts,solesCods, hakes,haddocksMiscellaneouscoastal fishesMiscellaneousdemersal fishesHerrings, sardines,anchoviesTunas, bonitos,billf ishesMiscellaneouspelagic fishesSharks, rays,chimaerasCrustaceans
Molluscs
Iceland Shelf - LME 18
Marine fishes not identified: 0.03%
0
200,000
400,000
600,000
800,000
1,000,000
1,200,000
1,400,000
1990
1991
1992
1993
1994
1995
1996
1997
1998
1999
mt
Freshw ater anddiadromous f ishesFlounders, halibuts,solesCods, hakes,haddocksMiscellaneouscoastal fishesMiscellaneousdemersal fishesHerrings, sardines,anchoviesTunas, bonitos,billf ishesMiscellaneouspelagic fishesSharks, rays,chimaerasCrustaceans
Molluscs
Barents Sea - LME 19
Marine fishes not identified: 0.2%
0
200,000
400,000
600,000
800,000
1,000,000
1,200,000
1,400,000
1,600,000
1990
1991
1992
1993
1994
1995
1996
1997
1998
1999
mt
Freshw ater anddiadromous fishesFlounders, halibuts,solesCods, hakes,haddocksMiscellaneouscoastal f ishesMiscellaneousdemersal fishesHerrings, sardines,anchoviesTunas, bonitos,billf ishesMiscellaneouspelagic f ishesSharks, rays,chimaerasCrustaceans
Molluscs
Celtic-Biscay Shelf - LME 23
Marine fishes not identified: 0.9%
0
50,000
100,000
150,000
200,000
250,000
300,000
350,000
400,000
1990
1991
1992
1993
1994
1995
1996
1997
1998
1999
mt
Freshw ater anddiadromous f ishesFlounders, halibuts,solesCods, hakes,haddocksMiscellaneouscoastal fishesMiscellaneousdemersal fishesHerrings, sardines,anchoviesTunas, bonitos,billf ishesMiscellaneouspelagic fishesSharks, rays,chimaerasCrustaceans
Molluscs
New Zealand Shelf - LME 40
Marine fishes not identified: 8%
0
2,000
4,000
6,000
8,000
10,000
12,000
14,000
1990
1991
1992
1993
1994
1995
1996
1997
1998
1999
mt
Freshw ater anddiadromous f ishesFlounders,halibuts, solesCods, hakes,haddocksMiscellaneouscoastal fishesMiscellaneousdemersal fishesHerrings, sardines,anchoviesTunas, bonitos,billf ishesMiscellaneouspelagic fishesSharks, rays,chimaerasCrustaceans
Molluscs
Faroe Plateau - LME 48
Marine fishes not identified: 0.9%
Figure 22. Cluster 9: capture trends of LMEs 17-18-19-23-40-48
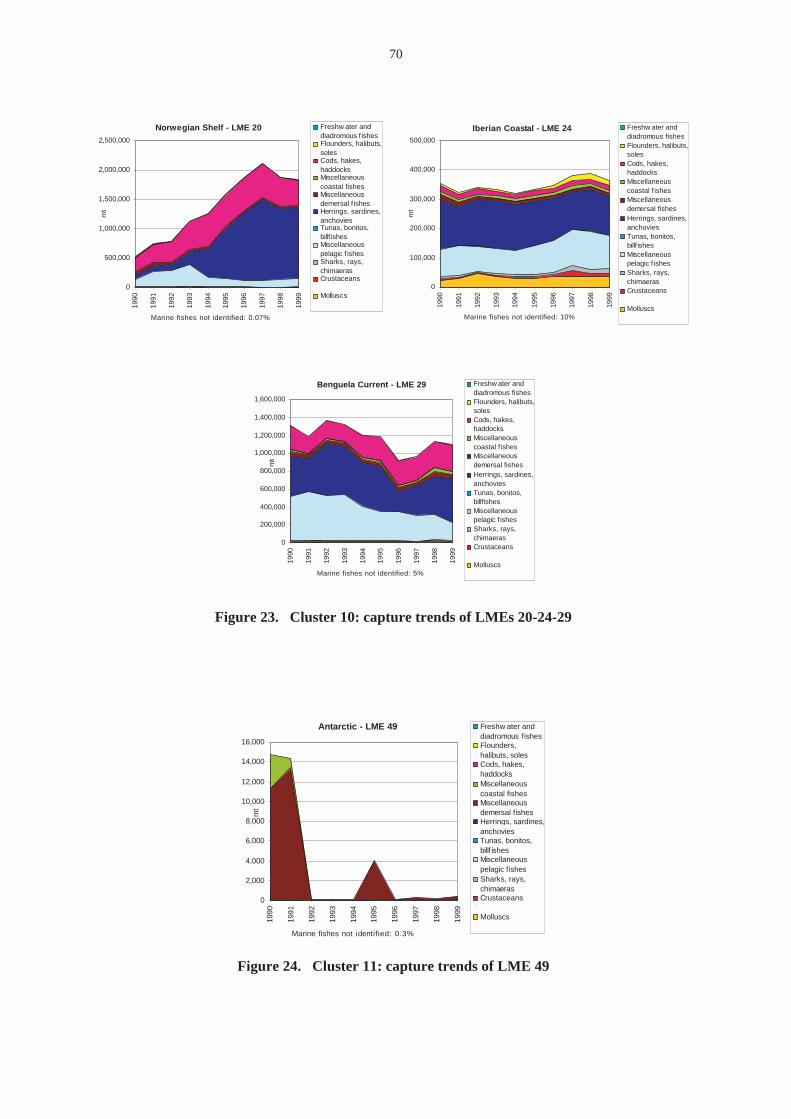
70
0
500,000
1,000,000
1,500,000
2,000,000
2,500,00019
90
1991
1992
1993
1994
1995
1996
1997
1998
1999
mt
Freshw ater anddiadromous f ishesFlounders, halibuts,solesCods, hakes,haddocksMiscellaneouscoastal fishesMiscellaneousdemersal f ishesHerrings, sardines,anchoviesTunas, bonitos,billf ishesMiscellaneouspelagic f ishesSharks, rays,chimaerasCrustaceans
Molluscs
Norwegian Shelf - LME 20
Marine fishes not identified: 0.07%
0
100,000
200,000
300,000
400,000
500,000
1990
1991
1992
1993
1994
1995
1996
1997
1998
1999
mt
Freshw ater anddiadromous fishesFlounders, halibuts,solesCods, hakes,haddocksMiscellaneouscoastal f ishesMiscellaneousdemersal fishesHerrings, sardines,anchoviesTunas, bonitos,billf ishesMiscellaneouspelagic f ishesSharks, rays,chimaerasCrustaceans
Molluscs
Iberian Coastal - LME 24
Marine fishes not identified: 10%
0
200,000
400,000
600,000
800,000
1,000,000
1,200,000
1,400,000
1,600,000
1990
1991
1992
1993
1994
1995
1996
1997
1998
1999
mt
Freshw ater anddiadromous fishesFlounders, halibuts,solesCods, hakes,haddocksMiscellaneouscoastal f ishesMiscellaneousdemersal fishesHerrings, sardines,anchoviesTunas, bonitos,billf ishesMiscellaneouspelagic f ishesSharks, rays,chimaerasCrustaceans
Molluscs
Benguela Current - LME 29
Marine fishes not identified: 5%
Figure 23. Cluster 10: capture trends of LMEs 20-24-29
0
2,000
4,000
6,000
8,000
10,000
12,000
14,000
16,000
1990
1991
1992
1993
1994
1995
1996
1997
1998
1999
mt
Freshw ater anddiadromous fishesFlounders,halibuts, solesCods, hakes,haddocksMiscellaneouscoastal fishesMiscellaneousdemersal f ishesHerrings, sardines,anchoviesTunas, bonitos,billf ishesMiscellaneouspelagic fishesSharks, rays,chimaerasCrustaceans
Molluscs
Antarctic - LME 49
Marine fishes not identified: 0.3%
Figure 24. Cluster 11: capture trends of LME 49

���������%���! ���������&�� !����'��(�(������'�����#'���)����*�
71
Species items reported in the FAO capture fisheries production database have been classified as oceanic or
living on the continental shelf. Catch trends of oceanic species, further subdivided into epipelagic and deep-
water species, have been analysed over a 50-year period (1950–99), while statistics for shelf species have
been re-assigned to large marine ecosystems (LMEs) for a shorter period (1990–99) and used to investigate
catch patterns among the various LMEs. Oceanic fisheries constitute, both in terms of number of species items
and in quantities of recent catches, about
10 percent of global marine catches. Catches of epipelagic species (mostly tunas) and of deep-water species
(mostly Gadiformes) have been continuously increasing and reached 8.6 million tonnes in 1999. Oceanic
catches by distant water fleets (DWFs), mostly targeting tunas, have been decreasing in recent years although
their share of total DWF catches has increased due to the concurrent drop of non-oceanic DWF catches.
Trends of oceanic catches and the contribution of DWFs are examined for all FAO marine fishing areas that
show different patterns, mainly depending upon whether they are temperate or tropical areas. Eleven clusters
of LMEs have been identified on the basis of similarities in their catch composition classified into eleven
species groupings. For each cluster, the distinguishing catch pattern and recent trends by species groupings in
each LME are discussed, and considered in relation to information on primary productivity and the abiotic
characteristics of the LME.
9 7 8 9 2 5 1 0 4 8 9 3 1
TC/M/Y4449E/1/1.03/2600
ISBN 92-5-104893-2 ISSN 0429-9345
Related Documents