Statistics Canada – Catalogue no. 85-002-XPE, Vol. 24, no. 1 Trends in Drug Offences and the Role of Alcohol and Drugs in Crime by Norm Desjardins and Tina Hotton Highlights • After a period of decline throughout the 1980’s and early 1990’s, the rate of police-reported drug offences increased by 42% between 1992 and 2002. Much of this increase can be attributed to a rise in offences for the possession of cannabis. • The rate of trafficking offences increased over the period 1977 to 1992, but has since declined 13%. • According to police-reported statistics, rates of importation and production offences are relatively low, but have more than doubled since the early 1990’s. • According to police-reported statistics, cannabis offences have risen 81% between 1992 and 2002, driven largely by possession offences, which have almost doubled over the past decade. In 2002, three in four drug- related incidents involved cannabis offences, most of which were for simple possession. • Rates per 100,000 population for drug-related violations in 2002 were highest for individuals between the ages of 18 and 24 in 2002 (860) followed by 12 – 17 year-olds (645). • The highest rates of drug offences among the provinces in 2002 were reported in British Columbia, Saskatchewan and New Brunswick. Among Census Metropolitan Areas (CMAs), rates were highest in Thunder Bay, Vancouver and Victoria. • In 2001/02, for the eight provinces and one territory providing drug case data to the Adult Criminal Court Survey, drug offences represented 9% of all adult criminal court cases of which 5% were for possession and 4% were for trafficking. Drug-related cases accounted for 7% of cases processed in youth courts (5% for possession; 2% for trafficking). • Estimates from the 1999 General Social Survey suggest that in half of physical (51%) and sexual (48%) assaults, the victim believed that the incident was related to the perpetrator’s use of alcohol or drugs. • Between 1992 and 2002, 684 (11%) homicide incidents in Canada were reported to be drug related. Of these, 176 (26%) were gang-related. • Of the 684 drug-related homicide incidents in Canada between 1992 and 2002, 19% occurred in Vancouver, 18 % in Montréal and 12% in Toronto. Fully half of all homicide incidents in Canada involving heroin (52%) and more than one-fifth (22%) of cocaine-related homicides took place in Vancouver.

Welcome message from author
This document is posted to help you gain knowledge. Please leave a comment to let me know what you think about it! Share it to your friends and learn new things together.
Transcript
Statistics Canada – Catalogue no. 85-002-XPE, Vol. 24, no. 1
Trends in Drug Offences and the Role of Alcohol and Drugs inCrime
by Norm Desjardins and Tina Hotton
Highlights
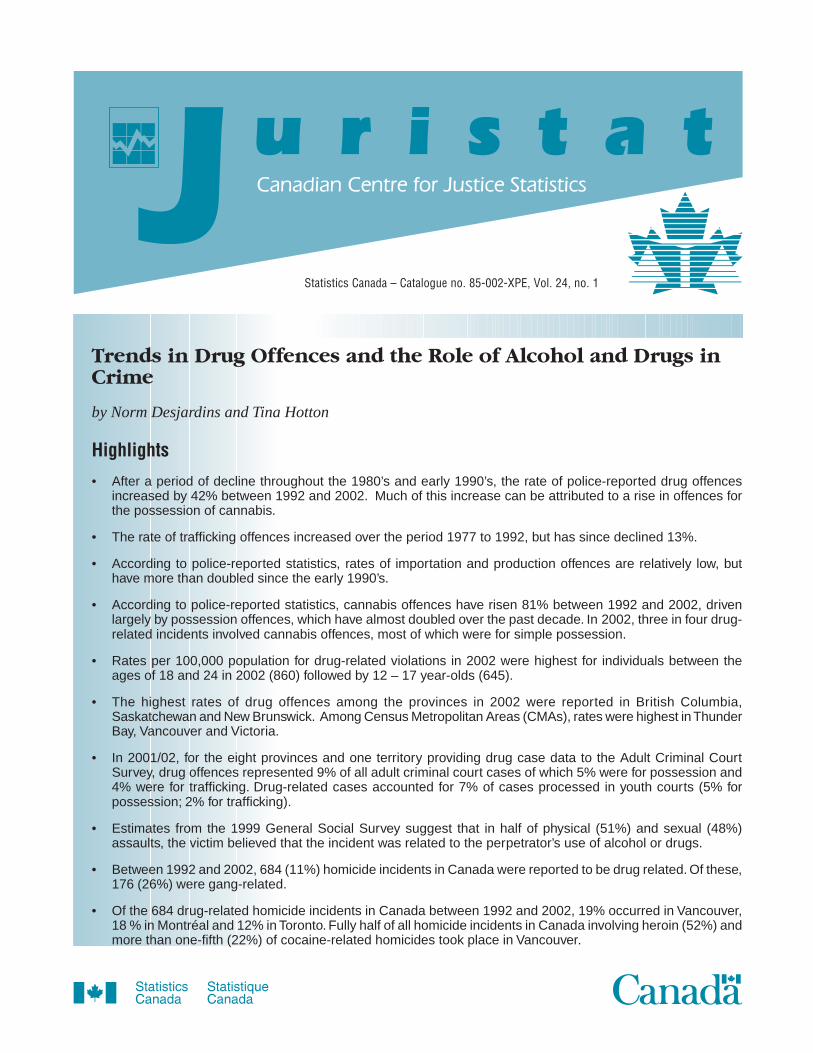
• After a period of decline throughout the 1980’s and early 1990’s, the rate of police-reported drug offencesincreased by 42% between 1992 and 2002. Much of this increase can be attributed to a rise in offences forthe possession of cannabis.
• The rate of trafficking offences increased over the period 1977 to 1992, but has since declined 13%.
• According to police-reported statistics, rates of importation and production offences are relatively low, buthave more than doubled since the early 1990’s.
• According to police-reported statistics, cannabis offences have risen 81% between 1992 and 2002, drivenlargely by possession offences, which have almost doubled over the past decade. In 2002, three in four drug-related incidents involved cannabis offences, most of which were for simple possession.
• Rates per 100,000 population for drug-related violations in 2002 were highest for individuals between theages of 18 and 24 in 2002 (860) followed by 12 – 17 year-olds (645).
• The highest rates of drug offences among the provinces in 2002 were reported in British Columbia,Saskatchewan and New Brunswick. Among Census Metropolitan Areas (CMAs), rates were highest in ThunderBay, Vancouver and Victoria.
• In 2001/02, for the eight provinces and one territory providing drug case data to the Adult Criminal CourtSurvey, drug offences represented 9% of all adult criminal court cases of which 5% were for possession and4% were for trafficking. Drug-related cases accounted for 7% of cases processed in youth courts (5% forpossession; 2% for trafficking).
• Estimates from the 1999 General Social Survey suggest that in half of physical (51%) and sexual (48%)assaults, the victim believed that the incident was related to the perpetrator’s use of alcohol or drugs.
• Between 1992 and 2002, 684 (11%) homicide incidents in Canada were reported to be drug related. Of these,176 (26%) were gang-related.
• Of the 684 drug-related homicide incidents in Canada between 1992 and 2002, 19% occurred in Vancouver,18 % in Montréal and 12% in Toronto. Fully half of all homicide incidents in Canada involving heroin (52%) andmore than one-fifth (22%) of cocaine-related homicides took place in Vancouver.
2 Statistics Canada – Catalogue no. 85-002, Vol. 24, no.1
Ordering and subscription information
All prices exclude sales tax
This product, Catalogue no. 85-002-XPE,is published as a standard printedpublication at a price of CDN $11.00 perissue and CDN $100.00 for a one-yearsubscription.
ISSN 0715-271X
The following additional shipping chargesapply for delivery outside Canada:
Single Annualissue subscription
United States CDN $ 6.00 CDN $ 78.00Other countries CDN $ 10.00 CDN $ 130.00
This product is also available in electronicformat on the Statistics Canada Internet siteas Catalogue no. 85-002-XIE at a price ofCDN $9.00 per issue and CDN $75.00 for aone-year subscription. To obtain singleissues or to subscribe, visit our Web site atwww.statcan.ca, and select Products andServices.
ISSN 1209-6393
February 2004
Published by authority of the Ministerresponsible for Statistics Canada.
© Minister of Industry, 2004
All rights reserved. No part of thispublication may be reproduced, stored in aretrieval system or transmitted in any formor by any means, electronic, mechanical,photocopying, recording or otherwisewithout prior written permission fromLicence Services, Marketing Division,Statistics Canada, Ottawa, Ontario, CanadaK1A 0T6.
Note of appreciation
Canada owes the success of its statisticalsystem to a long-standing partnershipbetween Statistics Canada, the citizensof Canada, its businesses and governments.Accurate and timely statistical informationcould not be produced without theircontinued cooperation and goodwill.
Standards of service to the public
Statistics Canada is committed to serving itsclients in a prompt, reliable and courteousmanner and in the official language of theirchoice. To this end, the agency hasdeveloped standards of service which itsemployees observe in serving its clients.To obtain a copy of these service standards,please contact your nearest StatisticsCanada Regional Reference Centre.
The paper used in this publication meetsthe minimum requirements of Americannational Standard for Information Sciences– Permanence of Paper for Printed LibraryMaterials, ANSI Z39.48 – 1984. ∞
IntroductionIllicit drug use, and excessive use of alcohol and licit1 drugs, creates a burden forCanadian society and its social welfare systems. The negative impact of drug andalcohol abuse on both criminal justice and health care systems has been highlightedin reports from Parliament (House of Common 2002), the Auditor General (2001),the Canadian Centre for Substance Abuse (Single, Robson, Xie, and Rehm 1996)and the Centre for Addiction and Mental Health (Single, Truong, Adlaf, and Ialomiteanu1999). Enumerating the opportunity costs of lost productivity, misdirected personalfinances and lost human potential serve only to portray a more serious picture of thesituation (Auditor General 2001).
Canada’s laws governing drug use are currently in a state of transition. A number ofrecent court rulings have raised questions about the constitutionality of current lawsregarding possession of small amounts of marihuana (see Box 9). While changesare being considered to federal legislation, the medicinal properties of marihuana totreat adverse symptoms related to AIDS, Hepatitis C, and other blood-borne diseaseshave been recognized and some Canadians are currently allowed to possess orcultivate marihuana for medical purposes.2,3,4,5 In addition, the city of Vancouveropened Canada’s first supervised injection site in September, 2003 to address theneeds of the city’s heroin and cocaine addicts. The facility operates with the approvalof Health Canada (see Box 2) (Health Canada 2003a).
While generally declining in recent years, impaired driving remains a common andserious alcohol-related, and often drug-related, crime. The downward trend whichbegan in 1981 may be attributable to a number of factors, including changing attitudeswith respect to impaired driving and legislation which supports these attitudes(including increased fines), enforcement practices used by the police, anddemographic shifts in the population (Janhevich, Gannon and Morisset 2003).Monitoring drug-related impairment however is difficult because of a lack of adequateand non-invasive roadside testing methods available for police use (see Box 6)(House of Commons 2002).
1. Over-the-counter and prescription drugs.2. On July 30, 2001, Health Canada implemented the Marihuana Medical Access Regulations, which define
the circumstances and the manner in which access to marihuana for medical purposes will be permitted.3. As of September 5, 2003, 642 persons are allowed to possess marihuana for medical purposes (558
hold an Authorization to Possess dried marihuana under the Marihuana Medical Access Regulations(MMAR); 84 hold an Exemption for possession under Section 56 of the Controlled Drugs and SubstancesAct (CDSA). Five hundred persons are allowed to cultivate/produce marihuana for medical purposes(Health Canada 2003c).
4. The Community Research Initiative of Toronto is testing the effect of marihuana on the appetites of AIDSpatients. A group at McGill University in Montreal is testing the effects of marihuana on neuropathic pain.Health Canada provides funding but not the marihuana. Until such time as a licit, domestic supply isestablished, Health Canada will secure a supply of research-grade marihuana for clinical trials beingconducted in Canada. Both the U.S. National Institute of Drug Abuse and a private company in the U.K.,GW Pharmaceuticals, Ltd., are sources of drug material for upcoming clinical trials. (Health Canada 2003c).
5. Ottawa signed a $5.7-million, four-year contract in 2000 with Saskatoon-based Prairie Plant Systems to growmarihuana for the government. The marihuana is being grown in a former mine in Flin Flon, Manitoba.
Box 1Drugs, Alcohol and Crime: A Complex Relationship
Drug and alcohol use have a complex association with crime. For example, while many adolescents begintheir experience with drugs before committing illegal activities, a smaller portion begin using drugs onlyafter becoming involved in non-drug criminal activity. In either case the criminal activity is often used tofund their substance abuse (Brunelle, Brochu and Cousineau 2000).
A recent study on the nature of the links between the usage and abuse of alcohol and drugs and thecommission of crime looked at the associations among crime types and the use of alcohol and drugs alongwith the share of crimes attributable to alcohol and drugs (Pernanen, Cousineau, Brochu and Sun 2002).The study found that alcohol-dependent federal inmates were much more likely to have committed aviolent crime than were drug-dependent inmates, while drug–dependent inmates were more likely to havecommitted a gainful crime (theft, break and enter, etc.). Approximately 46% of a sample of federal inmateswho were convicted of theft, 41% convicted of robbery and 36% convicted of breaking and entering reportedcommitting the crime to support their alcohol or drug habit. The same study estimates that approximately38% of newly admitted federal male inmates and almost half of provincial inmates (48% of males; 49% offemales) were dependent on either or both substances.
Statistics Canada – Catalogue no. 85-002, Vol. 24, no. 1 3
Box 2Supervised Drug Injection Sites
Injection drug use involves a wide variety of adverse health and socialconsequences which have negative impacts on individuals, families and theeconomy. Major causes of drug-related death are suicide, overdose and AIDScontracted from sharing needles — all of which are strongly associated withinjection drug use (Health Canada 2004). These deaths and relatedhospitalizations result in the bulk of the costs to the health care system aswell as lost productivity costs attributable to illicit drugs (Health Canada 2001),particularly in Vancouver, where the number of drug overdose deaths hasrisen markedly in recent years (Poulin, Stein, and Butt 2000).
In September 2003, the Vancouver Coastal Health Authority opened the firstsupervised injection site in Canada in the downtown eastside of Vancouver.This site was approved by Health Canada as a 3-year pilot research projectusing an exemption under Section 56 of the Controlled Drugs and SubstancesAct (CDSA). The exception allows individuals to take their own injection drugs,such as cocaine or heroin, into the site for their own use without fear of arrest(Vancouver Coastal Health 2003). The site provides a clean, hygienicenvironment and medical supervision with the goal of reducing drug overdosesamong Vancouver drug users.
This initiative forms part of the research for Canada’s National Drug Strategyinto the root causes of substance abuse, prevention, and harm reduction.The goal of the project is to assess whether the establishment of a supervisedinjection site will reduce the harm associated with illicit drug use, improve thehealth of drug users, increase appropriate use of health and social servicesby drug users and reduce the health, social, legal and incarceration costsassociated with drug use (Health Canada 2003a). Similar sites are found inother countries such as the Netherlands, Switzerland, Germany and Australia(House of Commons 2002).
This Juristat describes changes in drug offences and impaireddriving in Canada, and provides a broad examination of therelationships between drug and alcohol use, and crime. Trendsin drug offences reported by police will be examined, as wellas recent conviction and sentencing data for adult and youthcourt cases relating to drug possession and trafficking. It willalso summarize offence trends in impaired driving. Finally, thereport looks at the role of drug and/or alcohol consumptionduring the commission of spousal assault and other violentoffences.
6. It is important to note that changes in the rate of drug offences reported bypolice do not necessarily mirror changes in the number of drug users inCanada, nor are they an accurate measure of the number of individualsinvolved in the trafficking, import/export or production of drugs. The numberof recorded drug crimes is sensitive to police resources available forenforcement and detection, as well as local police priorities.
7. These 7,815 additional incidents were estimated using the Incident –Based(UCR2) Survey which gathers detailed characteristics about incidents,victims and offenders that are not available from the aggregate UCR survey.In 2002, the UCR2 Research database, a subset of the UCR2 database,included 94 police agencies in 9 provinces. These data represent 56% ofthe national volume of reported actual Criminal Code incidents.
8. Some examples include LSD, ecstasy, amphetamines, barbiturates oranabolic steroids.
9. An arresting officer may report up to 4 separate violations when recordingthe details of an incident.
10. About 3 in 10 (29%) incidents involving a drug offence reported to theUCR2 survey involved non-drug violations.
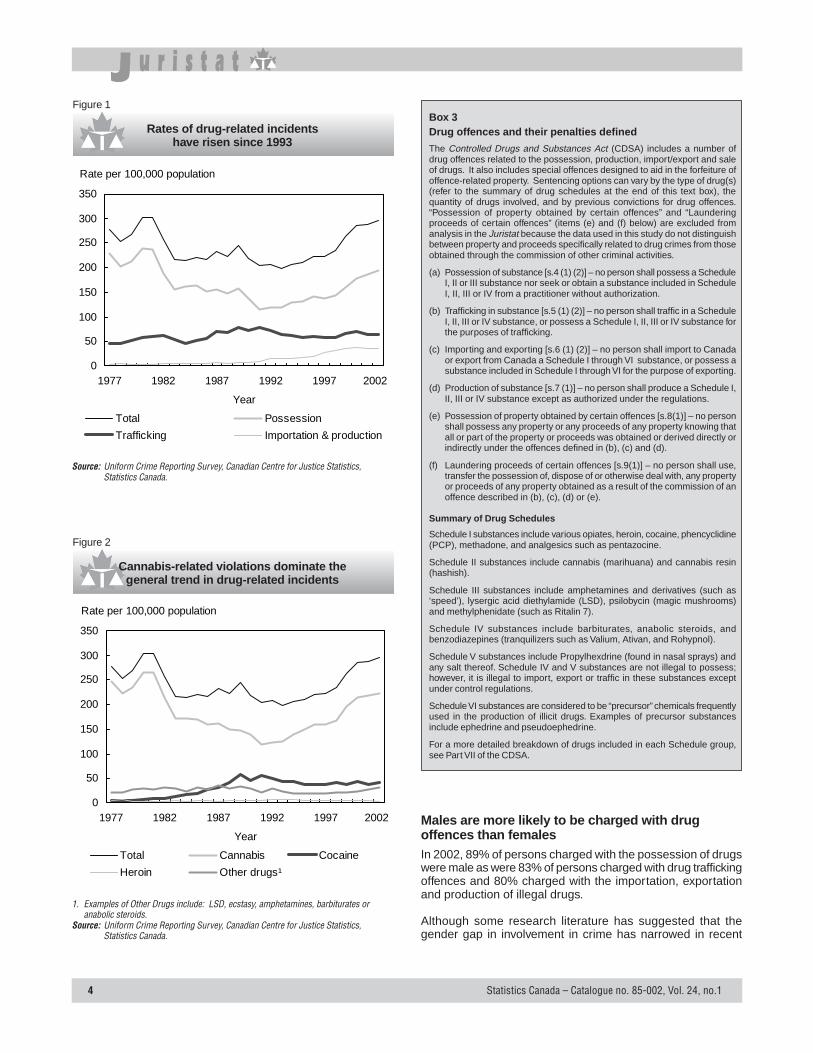
Recent increase in the number of drug offencesreported by policeAfter a period of decline in the 1980’s and early 1990’s, therate of police-reported drug offences increased by 42%between 1992 and 2002 (similar to the peak rate for both 1980and 1981) (Figure 1) (Table 1). Most of this increase can beattributed to a recent rise in the cannabis possession rate,which nearly doubled (96%) since 1992 (Figure 2) (Table 2).Other drugs8 also showed a small increase (4%) over this timeperiod, while cocaine and heroin both decreased (12% and28% respectively).
The rate of trafficking offences increased over the period 1977to 1992, but has since declined 13%. The cocaine offence ratehas declined (28%) since 1992, as has heroin (61%) and otherdrugs (42%). According to police-reported statistics, only therate of cannabis trafficking incidents has increased (21%) sincethe early 1990’s.
Police-reported rates of importation and production offencesare relatively low, but have more than doubled since the early1990’s (Table 1). This rise in importation/production offencerates has been largely a result of the cannabis incident ratewhich increased 115% between 1992 and 2002. Other rateshave fluctuated since 1992, but while small in size, have showna relatively substantial increase. The rate of cocaine importationand production offences continues to be low, ranging from lessthan 1 to 2 incidents per 100,000 population. The rate for theimportation/production of heroin has been small for many years,with a fluctuating trend, often less than 1 per 100,000.
Property loss and administration of justiceviolations are most commonly associated withdrug-related incidentsIn 2002, the UCR2 Research database (which can recordmultiple violations for individual incidents9) included a total of66,351 violations among all incidents involving a drug offence10
for that year, including 53,953 (81%) drug violations. The mostcommon of the remaining (non-drug) violations (19%) includedtheft or other property loss (7%), administration of justice (6%),weapons (2%), assault or the threat of bodily harm (2%), andproperty damage and public order (1%). Other crimes, includinghomicide, sexual assault, prostitution and liquor violationsaccounted for only 1% of all non-drug related violations amongdrug-related incidents.
Trends in Drug OffencesDrug offences reported in this Juristat include drug possession,drug trafficking, as well as the importation, exportation andproduction of drugs (see Box 3).6
In 2002, 92,590 drug incidents (incidents where the mostserious offence (MSO) was drug-related) were reported bypolice in Canada (Table 1). The most common offence wasthe possession of illegal drugs (61,166), followed by drugtrafficking (19,970) and the importation/exportation orproduction of drugs (11,454). In addition to the 92,590 incidentswhere drugs were the most serious offence, there were anestimated 7,815 additional incidents involving a drug violationas a lesser offence.7
Cannabis offences accounted for 76% of all drug-relatedincidents in 2002, followed by cocaine (13%), and heroin (1%).The remaining 10% of offences related to “other” types of drugs,which include LSD, ecstasy, and barbiturates, among others(Table 2).
4 Statistics Canada – Catalogue no. 85-002, Vol. 24, no.1
Rates of drug-related incidentshave risen since 1993
Figure 1
Source: Uniform Crime Reporting Survey, Canadian Centre for Justice Statistics,Statistics Canada.
0
50
100
150
200
250
300
350
1977 1982 1987 1992 1997 2002
Total Possession
Trafficking Importation & production
Rate per 100,000 population
Year
Cannabis-related violations dominate thegeneral trend in drug-related incidents
Figure 2
1. Examples of Other Drugs include: LSD, ecstasy, amphetamines, barbiturates oranabolic steroids.
Source: Uniform Crime Reporting Survey, Canadian Centre for Justice Statistics,Statistics Canada.
0
50
100
150
200
250
300
350
1977 1982 1987 1992 1997 2002
Total Cannabis Cocaine
Heroin Other drugs¹
Rate per 100,000 population
Year
Box 3Drug offences and their penalties defined
The Controlled Drugs and Substances Act (CDSA) includes a number ofdrug offences related to the possession, production, import/export and saleof drugs. It also includes special offences designed to aid in the forfeiture ofoffence-related property. Sentencing options can vary by the type of drug(s)(refer to the summary of drug schedules at the end of this text box), thequantity of drugs involved, and by previous convictions for drug offences.“Possession of property obtained by certain offences” and “Launderingproceeds of certain offences” (items (e) and (f) below) are excluded fromanalysis in the Juristat because the data used in this study do not distinguishbetween property and proceeds specifically related to drug crimes from thoseobtained through the commission of other criminal activities.
(a) Possession of substance [s.4 (1) (2)] – no person shall possess a ScheduleI, II or III substance nor seek or obtain a substance included in ScheduleI, II, III or IV from a practitioner without authorization.
(b) Trafficking in substance [s.5 (1) (2)] – no person shall traffic in a ScheduleI, II, III or IV substance, or possess a Schedule I, II, III or IV substance forthe purposes of trafficking.
(c) Importing and exporting [s.6 (1) (2)] – no person shall import to Canadaor export from Canada a Schedule I through VI substance, or possess asubstance included in Schedule I through VI for the purpose of exporting.
(d) Production of substance [s.7 (1)] – no person shall produce a Schedule I,II, III or IV substance except as authorized under the regulations.
(e) Possession of property obtained by certain offences [s.8(1)] – no personshall possess any property or any proceeds of any property knowing thatall or part of the property or proceeds was obtained or derived directly orindirectly under the offences defined in (b), (c) and (d).
(f) Laundering proceeds of certain offences [s.9(1)] – no person shall use,transfer the possession of, dispose of or otherwise deal with, any propertyor proceeds of any property obtained as a result of the commission of anoffence described in (b), (c), (d) or (e).
Summary of Drug Schedules
Schedule I substances include various opiates, heroin, cocaine, phencyclidine(PCP), methadone, and analgesics such as pentazocine.
Schedule II substances include cannabis (marihuana) and cannabis resin(hashish).
Schedule III substances include amphetamines and derivatives (such as‘speed’), lysergic acid diethylamide (LSD), psilobycin (magic mushrooms)and methylphenidate (such as Ritalin 7).
Schedule IV substances include barbiturates, anabolic steroids, andbenzodiazepines (tranquilizers such as Valium, Ativan, and Rohypnol).
Schedule V substances include Propylhexdrine (found in nasal sprays) andany salt thereof. Schedule IV and V substances are not illegal to possess;however, it is illegal to import, export or traffic in these substances exceptunder control regulations.
Schedule VI substances are considered to be “precursor” chemicals frequentlyused in the production of illicit drugs. Examples of precursor substancesinclude ephedrine and pseudoephedrine.
For a more detailed breakdown of drugs included in each Schedule group,see Part VII of the CDSA.
Males are more likely to be charged with drugoffences than femalesIn 2002, 89% of persons charged with the possession of drugswere male as were 83% of persons charged with drug traffickingoffences and 80% charged with the importation, exportationand production of illegal drugs.
Although some research literature has suggested that thegender gap in involvement in crime has narrowed in recent
Statistics Canada – Catalogue no. 85-002, Vol. 24, no. 1 5
169
343
544
351
232
241
242
242
270
266
0 100 200 300 400 500 600 700
Newfoundland & Labrador
Manitoba
Ontario
Alberta
Prince Edward Island
Nova Scotia
Quebec
New Brunswick
Saskatchewan
British Columbia
Rate per 100,000 population
Canada 295
years (Stevenson, Tufts, Hendrick, and Kowalski 1998), thisdoes not appear to be true for drug crime in Canada. Theproportion of female drug offenders has not substantiallyincreased over the past 25 years.
Young adults and adolescents have highest ratesfor drug-related offencesRecent research has found that self-reported drug use amongyouth has increased over the past decade (Adlaf and Paglia2001; Poulin, VanTil and Wilbur 1999). UCR2 survey data showsthat rates per 100,000 for drug-related violations in 2002 werehighest for individuals between the ages of 18 and 24 in 2002(860)11 followed by 12 – 17 year-olds (645) (Table 3). Therates for older individuals declined with age.
According to the UCR2 survey, the cannabis possessionrate was 502 per 100,000 for 18 – 24 year-olds and 478 forthose aged 12 -17. Cannabis trafficking was also commonamong younger age groups. Those in the 18 - 24 year old and12 - 17 year—old age groups had the highest rates for cannabistrafficking (121 and 101 respectively). Cocaine violations weremost common among 18 – 24 year-olds (possession (58);trafficking (91)) as well as the 25 -35 year-old group (possession(38); trafficking (49)).
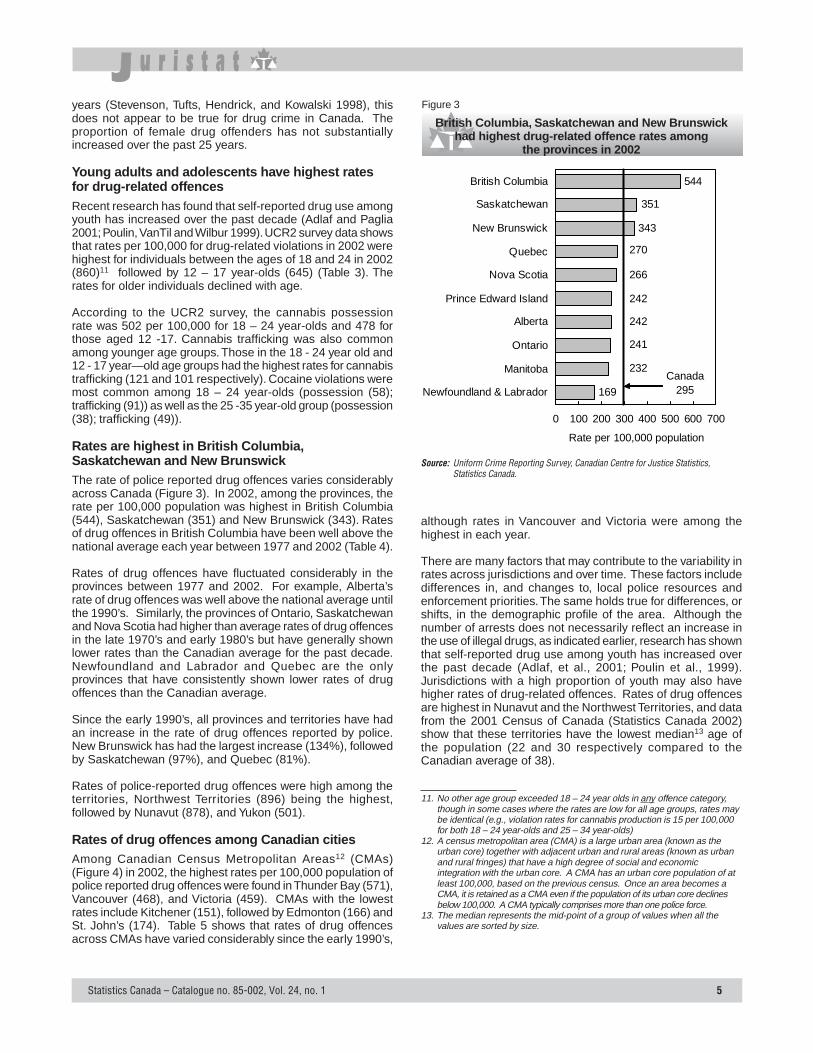
Rates are highest in British Columbia,Saskatchewan and New BrunswickThe rate of police reported drug offences varies considerablyacross Canada (Figure 3). In 2002, among the provinces, therate per 100,000 population was highest in British Columbia(544), Saskatchewan (351) and New Brunswick (343). Ratesof drug offences in British Columbia have been well above thenational average each year between 1977 and 2002 (Table 4).
Rates of drug offences have fluctuated considerably in theprovinces between 1977 and 2002. For example, Alberta’srate of drug offences was well above the national average untilthe 1990’s. Similarly, the provinces of Ontario, Saskatchewanand Nova Scotia had higher than average rates of drug offencesin the late 1970’s and early 1980’s but have generally shownlower rates than the Canadian average for the past decade.Newfoundland and Labrador and Quebec are the onlyprovinces that have consistently shown lower rates of drugoffences than the Canadian average.
Since the early 1990’s, all provinces and territories have hadan increase in the rate of drug offences reported by police.New Brunswick has had the largest increase (134%), followedby Saskatchewan (97%), and Quebec (81%).
Rates of police-reported drug offences were high among theterritories, Northwest Territories (896) being the highest,followed by Nunavut (878), and Yukon (501).
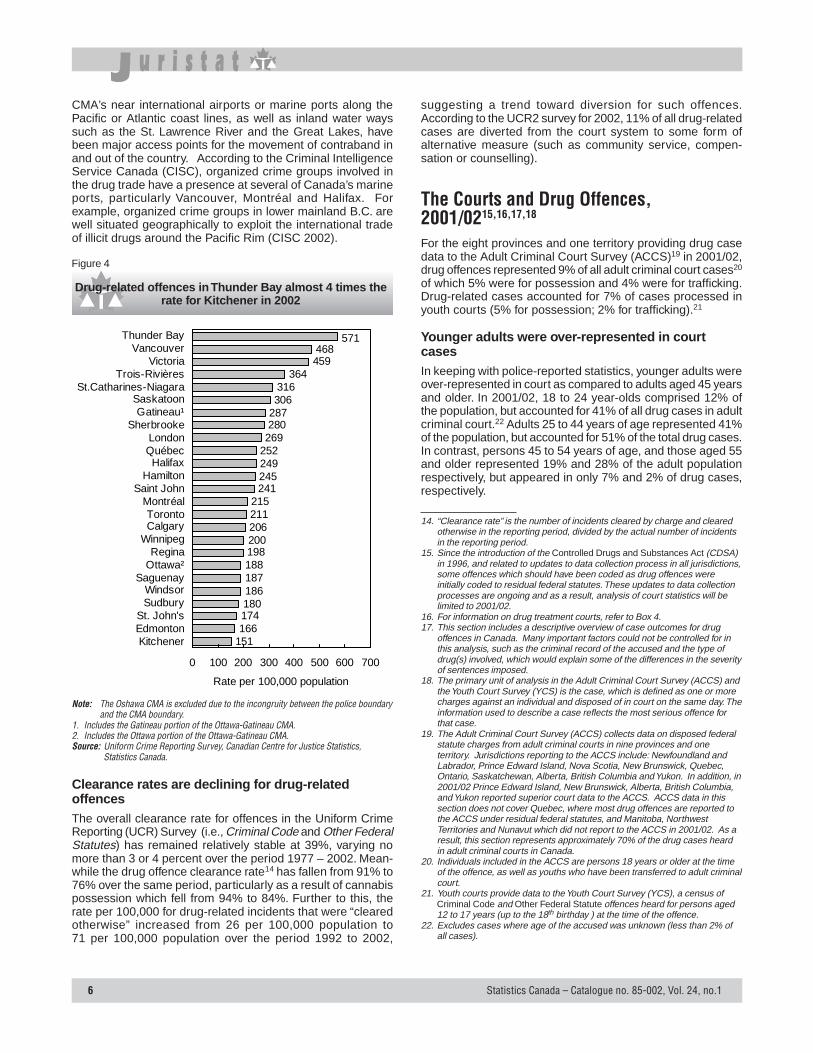
Rates of drug offences among Canadian citiesAmong Canadian Census Metropolitan Areas12 (CMAs)(Figure 4) in 2002, the highest rates per 100,000 population ofpolice reported drug offences were found in Thunder Bay (571),Vancouver (468), and Victoria (459). CMAs with the lowestrates include Kitchener (151), followed by Edmonton (166) andSt. John’s (174). Table 5 shows that rates of drug offencesacross CMAs have varied considerably since the early 1990’s,
British Columbia, Saskatchewan and New Brunswickhad highest drug-related offence rates among
the provinces in 2002
Figure 3
Source: Uniform Crime Reporting Survey, Canadian Centre for Justice Statistics,Statistics Canada.
although rates in Vancouver and Victoria were among thehighest in each year.
There are many factors that may contribute to the variability inrates across jurisdictions and over time. These factors includedifferences in, and changes to, local police resources andenforcement priorities. The same holds true for differences, orshifts, in the demographic profile of the area. Although thenumber of arrests does not necessarily reflect an increase inthe use of illegal drugs, as indicated earlier, research has shownthat self-reported drug use among youth has increased overthe past decade (Adlaf, et al., 2001; Poulin et al., 1999).Jurisdictions with a high proportion of youth may also havehigher rates of drug-related offences. Rates of drug offencesare highest in Nunavut and the Northwest Territories, and datafrom the 2001 Census of Canada (Statistics Canada 2002)show that these territories have the lowest median13 age ofthe population (22 and 30 respectively compared to theCanadian average of 38).
11. No other age group exceeded 18 – 24 year olds in any offence category,though in some cases where the rates are low for all age groups, rates maybe identical (e.g., violation rates for cannabis production is 15 per 100,000for both 18 – 24 year-olds and 25 – 34 year-olds)
12. A census metropolitan area (CMA) is a large urban area (known as theurban core) together with adjacent urban and rural areas (known as urbanand rural fringes) that have a high degree of social and economicintegration with the urban core. A CMA has an urban core population of atleast 100,000, based on the previous census. Once an area becomes aCMA, it is retained as a CMA even if the population of its urban core declinesbelow 100,000. A CMA typically comprises more than one police force.
13. The median represents the mid-point of a group of values when all thevalues are sorted by size.
6 Statistics Canada – Catalogue no. 85-002, Vol. 24, no.1
CMA’s near international airports or marine ports along thePacific or Atlantic coast lines, as well as inland water wayssuch as the St. Lawrence River and the Great Lakes, havebeen major access points for the movement of contraband inand out of the country. According to the Criminal IntelligenceService Canada (CISC), organized crime groups involved inthe drug trade have a presence at several of Canada’s marineports, particularly Vancouver, Montréal and Halifax. Forexample, organized crime groups in lower mainland B.C. arewell situated geographically to exploit the international tradeof illicit drugs around the Pacific Rim (CISC 2002).
Drug-related offences in Thunder Bay almost 4 times therate for Kitchener in 2002
Figure 4
Note: The Oshawa CMA is excluded due to the incongruity between the police boundaryand the CMA boundary.
1. Includes the Gatineau portion of the Ottawa-Gatineau CMA.2. Includes the Ottawa portion of the Ottawa-Gatineau CMA.Source: Uniform Crime Reporting Survey, Canadian Centre for Justice Statistics,
Statistics Canada.
Clearance rates are declining for drug-relatedoffencesThe overall clearance rate for offences in the Uniform CrimeReporting (UCR) Survey (i.e., Criminal Code and Other FederalStatutes) has remained relatively stable at 39%, varying nomore than 3 or 4 percent over the period 1977 – 2002. Mean-while the drug offence clearance rate14 has fallen from 91% to76% over the same period, particularly as a result of cannabispossession which fell from 94% to 84%. Further to this, therate per 100,000 for drug-related incidents that were “clearedotherwise” increased from 26 per 100,000 population to71 per 100,000 population over the period 1992 to 2002,
suggesting a trend toward diversion for such offences.According to the UCR2 survey for 2002, 11% of all drug-relatedcases are diverted from the court system to some form ofalternative measure (such as community service, compen-sation or counselling).
The Courts and Drug Offences,2001/0215,16,17,18
For the eight provinces and one territory providing drug casedata to the Adult Criminal Court Survey (ACCS)19 in 2001/02,drug offences represented 9% of all adult criminal court cases20
of which 5% were for possession and 4% were for trafficking.Drug-related cases accounted for 7% of cases processed inyouth courts (5% for possession; 2% for trafficking).21
Younger adults were over-represented in courtcasesIn keeping with police-reported statistics, younger adults wereover-represented in court as compared to adults aged 45 yearsand older. In 2001/02, 18 to 24 year-olds comprised 12% ofthe population, but accounted for 41% of all drug cases in adultcriminal court.22 Adults 25 to 44 years of age represented 41%of the population, but accounted for 51% of the total drug cases.In contrast, persons 45 to 54 years of age, and those aged 55and older represented 19% and 28% of the adult populationrespectively, but appeared in only 7% and 2% of drug cases,respectively.
14. “Clearance rate” is the number of incidents cleared by charge and clearedotherwise in the reporting period, divided by the actual number of incidentsin the reporting period.
15. Since the introduction of the Controlled Drugs and Substances Act (CDSA)in 1996, and related to updates to data collection process in all jurisdictions,some offences which should have been coded as drug offences wereinitially coded to residual federal statutes. These updates to data collectionprocesses are ongoing and as a result, analysis of court statistics will belimited to 2001/02.
16. For information on drug treatment courts, refer to Box 4.17. This section includes a descriptive overview of case outcomes for drug
offences in Canada. Many important factors could not be controlled for inthis analysis, such as the criminal record of the accused and the type ofdrug(s) involved, which would explain some of the differences in the severityof sentences imposed.
18. The primary unit of analysis in the Adult Criminal Court Survey (ACCS) andthe Youth Court Survey (YCS) is the case, which is defined as one or morecharges against an individual and disposed of in court on the same day. Theinformation used to describe a case reflects the most serious offence forthat case.
19. The Adult Criminal Court Survey (ACCS) collects data on disposed federalstatute charges from adult criminal courts in nine provinces and oneterritory. Jurisdictions reporting to the ACCS include: Newfoundland andLabrador, Prince Edward Island, Nova Scotia, New Brunswick, Quebec,Ontario, Saskatchewan, Alberta, British Columbia and Yukon. In addition, in2001/02 Prince Edward Island, New Brunswick, Alberta, British Columbia,and Yukon reported superior court data to the ACCS. ACCS data in thissection does not cover Quebec, where most drug offences are reported tothe ACCS under residual federal statutes, and Manitoba, NorthwestTerritories and Nunavut which did not report to the ACCS in 2001/02. As aresult, this section represents approximately 70% of the drug cases heardin adult criminal courts in Canada.
20. Individuals included in the ACCS are persons 18 years or older at the timeof the offence, as well as youths who have been transferred to adult criminalcourt.
21. Youth courts provide data to the Youth Court Survey (YCS), a census ofCriminal Code and Other Federal Statute offences heard for persons aged12 to 17 years (up to the 18th birthday ) at the time of the offence.
22. Excludes cases where age of the accused was unknown (less than 2% ofall cases).
151
198
206211215
241245249252269280287306316
364459468
571
200
166174180186
188187
0 100 200 300 400 500 600 700
KitchenerEdmontonSt. John's
SudburyWindsor
SaguenayOttawa²Regina
WinnipegCalgaryToronto
MontréalSaint John
HamiltonHalifax
QuébecLondon
SherbrookeGatineau¹
SaskatoonSt.Catharines-Niagara
Trois-RivièresVictoria
VancouverThunder Bay
Rate per 100,000 population
Statistics Canada – Catalogue no. 85-002, Vol. 24, no. 1 7
26%
18%
6%1%
49%
30%33%
25%
10%
3%
0
10
20
30
40
50
60
18 to 24 25 to 34 35 to 44 45 to 54 55 plus
Drug possession Drug trafficking
Age
Percent of total cases
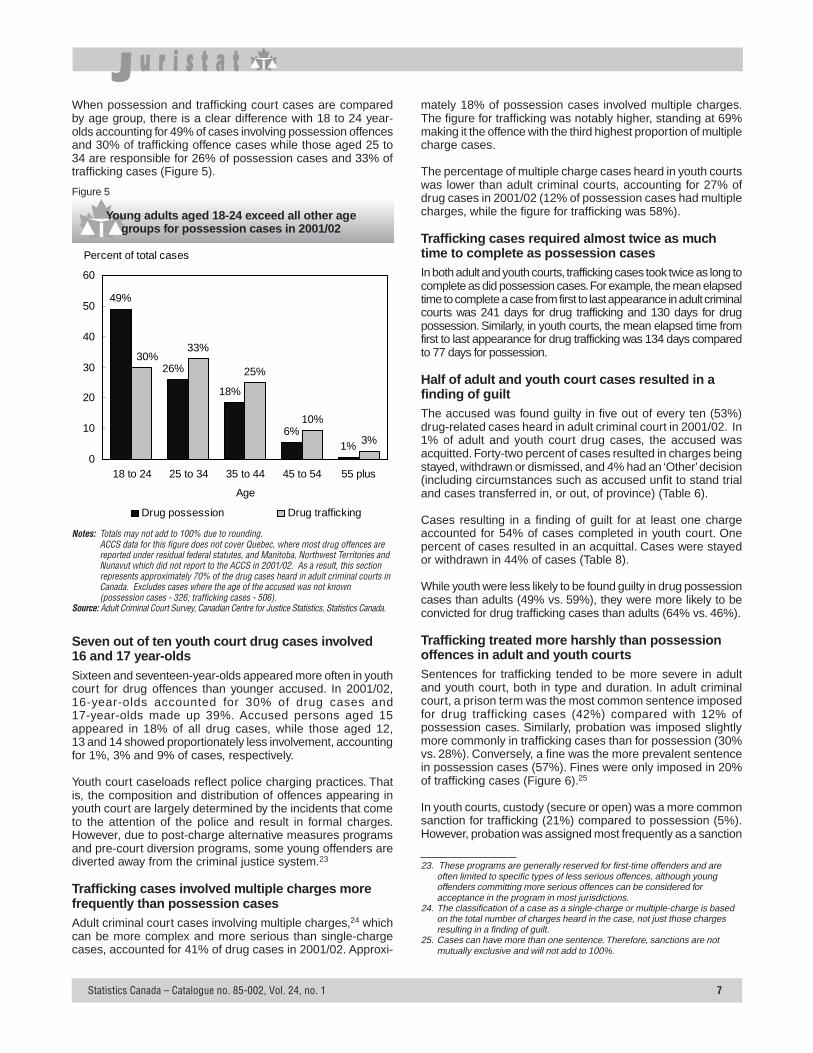
When possession and trafficking court cases are comparedby age group, there is a clear difference with 18 to 24 year-olds accounting for 49% of cases involving possession offencesand 30% of trafficking offence cases while those aged 25 to34 are responsible for 26% of possession cases and 33% oftrafficking cases (Figure 5).
Young adults aged 18-24 exceed all other agegroups for possession cases in 2001/02
Figure 5
Notes: Totals may not add to 100% due to rounding.ACCS data for this figure does not cover Quebec, where most drug offences arereported under residual federal statutes, and Manitoba, Northwest Territories andNunavut which did not report to the ACCS in 2001/02. As a result, this sectionrepresents approximately 70% of the drug cases heard in adult criminal courts inCanada. Excludes cases where the age of the accused was not known(possession cases - 326; trafficking cases - 506).
Source: Adult Criminal Court Survey, Canadian Centre for Justice Statistics, Statistics Canada.
23. These programs are generally reserved for first-time offenders and areoften limited to specific types of less serious offences, although youngoffenders committing more serious offences can be considered foracceptance in the program in most jurisdictions.
24. The classification of a case as a single-charge or multiple-charge is basedon the total number of charges heard in the case, not just those chargesresulting in a finding of guilt.
25. Cases can have more than one sentence. Therefore, sanctions are notmutually exclusive and will not add to 100%.
Seven out of ten youth court drug cases involved16 and 17 year-oldsSixteen and seventeen-year-olds appeared more often in youthcourt for drug offences than younger accused. In 2001/02,16-year-olds accounted for 30% of drug cases and17-year-olds made up 39%. Accused persons aged 15appeared in 18% of all drug cases, while those aged 12,13 and 14 showed proportionately less involvement, accountingfor 1%, 3% and 9% of cases, respectively.
Youth court caseloads reflect police charging practices. Thatis, the composition and distribution of offences appearing inyouth court are largely determined by the incidents that cometo the attention of the police and result in formal charges.However, due to post-charge alternative measures programsand pre-court diversion programs, some young offenders arediverted away from the criminal justice system.23
Trafficking cases involved multiple charges morefrequently than possession casesAdult criminal court cases involving multiple charges,24 whichcan be more complex and more serious than single-chargecases, accounted for 41% of drug cases in 2001/02. Approxi-
mately 18% of possession cases involved multiple charges.The figure for trafficking was notably higher, standing at 69%making it the offence with the third highest proportion of multiplecharge cases.
The percentage of multiple charge cases heard in youth courtswas lower than adult criminal courts, accounting for 27% ofdrug cases in 2001/02 (12% of possession cases had multiplecharges, while the figure for trafficking was 58%).
Trafficking cases required almost twice as muchtime to complete as possession casesIn both adult and youth courts, trafficking cases took twice as long tocomplete as did possession cases. For example, the mean elapsedtime to complete a case from first to last appearance in adult criminalcourts was 241 days for drug trafficking and 130 days for drugpossession. Similarly, in youth courts, the mean elapsed time fromfirst to last appearance for drug trafficking was 134 days comparedto 77 days for possession.
Half of adult and youth court cases resulted in afinding of guiltThe accused was found guilty in five out of every ten (53%)drug-related cases heard in adult criminal court in 2001/02. In1% of adult and youth court drug cases, the accused wasacquitted. Forty-two percent of cases resulted in charges beingstayed, withdrawn or dismissed, and 4% had an ‘Other’ decision(including circumstances such as accused unfit to stand trialand cases transferred in, or out, of province) (Table 6).
Cases resulting in a finding of guilt for at least one chargeaccounted for 54% of cases completed in youth court. Onepercent of cases resulted in an acquittal. Cases were stayedor withdrawn in 44% of cases (Table 8).
While youth were less likely to be found guilty in drug possessioncases than adults (49% vs. 59%), they were more likely to beconvicted for drug trafficking cases than adults (64% vs. 46%).
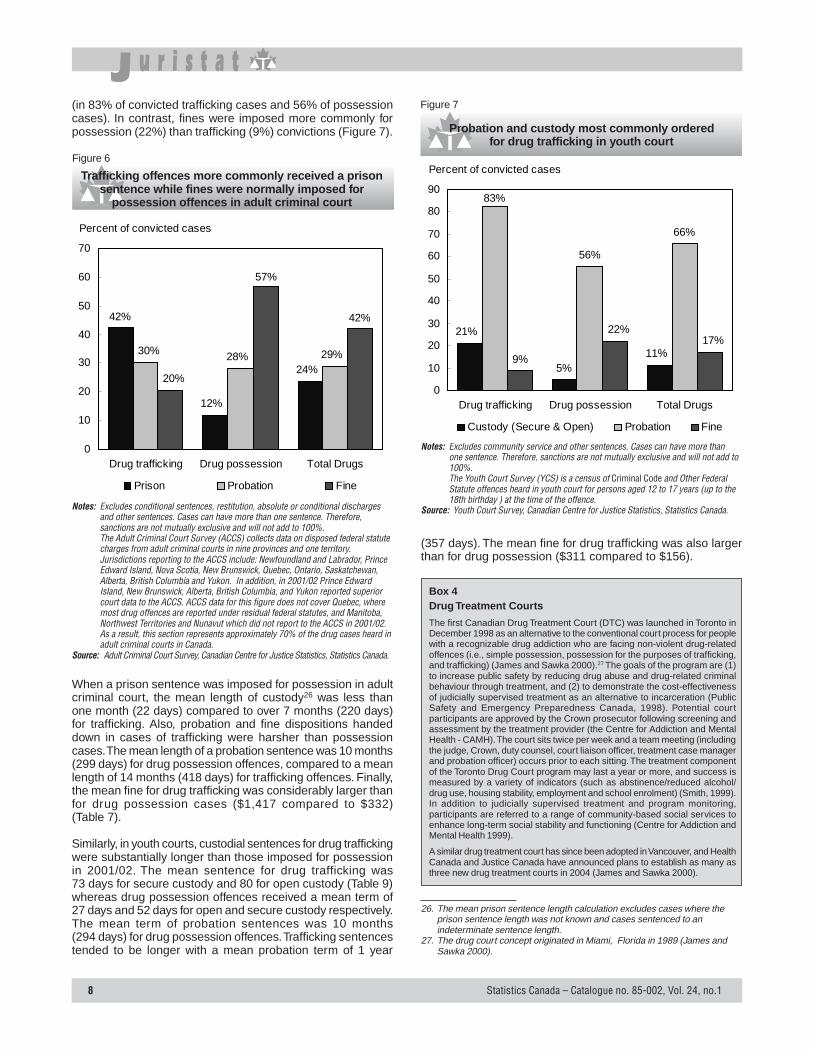
Trafficking treated more harshly than possessionoffences in adult and youth courtsSentences for trafficking tended to be more severe in adultand youth court, both in type and duration. In adult criminalcourt, a prison term was the most common sentence imposedfor drug trafficking cases (42%) compared with 12% ofpossession cases. Similarly, probation was imposed slightlymore commonly in trafficking cases than for possession (30%vs. 28%). Conversely, a fine was the more prevalent sentencein possession cases (57%). Fines were only imposed in 20%of trafficking cases (Figure 6).25
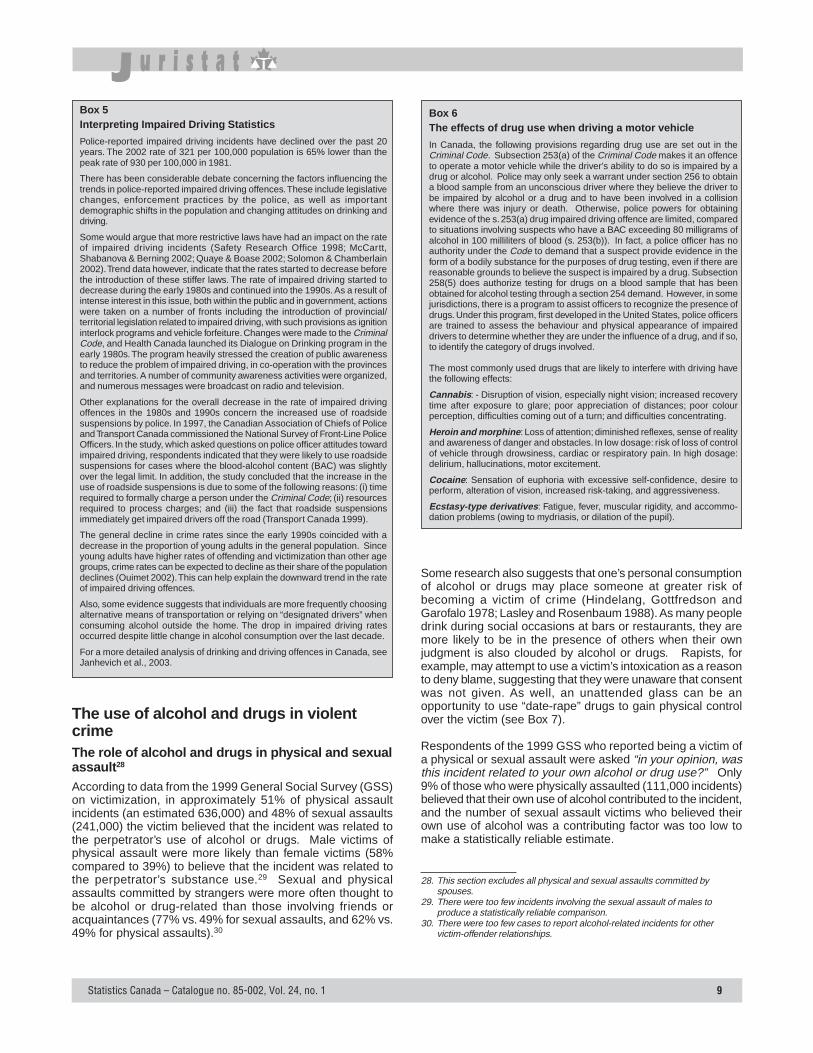
In youth courts, custody (secure or open) was a more commonsanction for trafficking (21%) compared to possession (5%).However, probation was assigned most frequently as a sanction
8 Statistics Canada – Catalogue no. 85-002, Vol. 24, no.1
(in 83% of convicted trafficking cases and 56% of possessioncases). In contrast, fines were imposed more commonly forpossession (22%) than trafficking (9%) convictions (Figure 7).
Trafficking offences more commonly received a prisonsentence while fines were normally imposed for
possession offences in adult criminal court
Figure 6
Notes: Excludes conditional sentences, restitution, absolute or conditional dischargesand other sentences. Cases can have more than one sentence. Therefore,sanctions are not mutually exclusive and will not add to 100%.The Adult Criminal Court Survey (ACCS) collects data on disposed federal statutecharges from adult criminal courts in nine provinces and one territory.Jurisdictions reporting to the ACCS include: Newfoundland and Labrador, PrinceEdward Island, Nova Scotia, New Brunswick, Quebec, Ontario, Saskatchewan,Alberta, British Columbia and Yukon. In addition, in 2001/02 Prince EdwardIsland, New Brunswick, Alberta, British Columbia, and Yukon reported superiorcourt data to the ACCS. ACCS data for this figure does not cover Quebec, wheremost drug offences are reported under residual federal statutes, and Manitoba,Northwest Territories and Nunavut which did not report to the ACCS in 2001/02.As a result, this section represents approximately 70% of the drug cases heard inadult criminal courts in Canada.
Source: Adult Criminal Court Survey, Canadian Centre for Justice Statistics, Statistics Canada.
24%
12%
42%
29%28%30%
42%
20%
57%
0
10
20
30
40
50
60
70
Drug trafficking Drug possession Total Drugs
Prison Probation Fine
Percent of convicted cases
Probation and custody most commonly orderedfor drug trafficking in youth court
Figure 7
Notes: Excludes community service and other sentences. Cases can have more thanone sentence. Therefore, sanctions are not mutually exclusive and will not add to100%.The Youth Court Survey (YCS) is a census of Criminal Code and Other FederalStatute offences heard in youth court for persons aged 12 to 17 years (up to the18th birthday ) at the time of the offence.
Source: Youth Court Survey, Canadian Centre for Justice Statistics, Statistics Canada.
11%5%
21%
66%
56%
83%
17%22%
9%
0
10
20
30
40
50
60
70
80
90
Drug trafficking Drug possession Total Drugs
Custody (Secure & Open) Probation Fine
Percent of convicted cases
When a prison sentence was imposed for possession in adultcriminal court, the mean length of custody26 was less thanone month (22 days) compared to over 7 months (220 days)for trafficking. Also, probation and fine dispositions handeddown in cases of trafficking were harsher than possessioncases. The mean length of a probation sentence was 10 months(299 days) for drug possession offences, compared to a meanlength of 14 months (418 days) for trafficking offences. Finally,the mean fine for drug trafficking was considerably larger thanfor drug possession cases ($1,417 compared to $332)(Table 7).
Similarly, in youth courts, custodial sentences for drug traffickingwere substantially longer than those imposed for possessionin 2001/02. The mean sentence for drug trafficking was73 days for secure custody and 80 for open custody (Table 9)whereas drug possession offences received a mean term of27 days and 52 days for open and secure custody respectively.The mean term of probation sentences was 10 months(294 days) for drug possession offences. Trafficking sentencestended to be longer with a mean probation term of 1 year
(357 days). The mean fine for drug trafficking was also largerthan for drug possession ($311 compared to $156).
26. The mean prison sentence length calculation excludes cases where theprison sentence length was not known and cases sentenced to anindeterminate sentence length.
27. The drug court concept originated in Miami, Florida in 1989 (James andSawka 2000).
Box 4Drug Treatment Courts
The first Canadian Drug Treatment Court (DTC) was launched in Toronto inDecember 1998 as an alternative to the conventional court process for peoplewith a recognizable drug addiction who are facing non-violent drug-relatedoffences (i.e., simple possession, possession for the purposes of trafficking,and trafficking) (James and Sawka 2000).27 The goals of the program are (1)to increase public safety by reducing drug abuse and drug-related criminalbehaviour through treatment, and (2) to demonstrate the cost-effectivenessof judicially supervised treatment as an alternative to incarceration (PublicSafety and Emergency Preparedness Canada, 1998). Potential courtparticipants are approved by the Crown prosecutor following screening andassessment by the treatment provider (the Centre for Addiction and MentalHealth - CAMH). The court sits twice per week and a team meeting (includingthe judge, Crown, duty counsel, court liaison officer, treatment case managerand probation officer) occurs prior to each sitting. The treatment componentof the Toronto Drug Court program may last a year or more, and success ismeasured by a variety of indicators (such as abstinence/reduced alcohol/drug use, housing stability, employment and school enrolment) (Smith, 1999).In addition to judicially supervised treatment and program monitoring,participants are referred to a range of community-based social services toenhance long-term social stability and functioning (Centre for Addiction andMental Health 1999).
A similar drug treatment court has since been adopted in Vancouver, and HealthCanada and Justice Canada have announced plans to establish as many asthree new drug treatment courts in 2004 (James and Sawka 2000).
Statistics Canada – Catalogue no. 85-002, Vol. 24, no. 1 9
Box 6The effects of drug use when driving a motor vehicle
In Canada, the following provisions regarding drug use are set out in theCriminal Code. Subsection 253(a) of the Criminal Code makes it an offenceto operate a motor vehicle while the driver’s ability to do so is impaired by adrug or alcohol. Police may only seek a warrant under section 256 to obtaina blood sample from an unconscious driver where they believe the driver tobe impaired by alcohol or a drug and to have been involved in a collisionwhere there was injury or death. Otherwise, police powers for obtainingevidence of the s. 253(a) drug impaired driving offence are limited, comparedto situations involving suspects who have a BAC exceeding 80 milligrams ofalcohol in 100 milliliters of blood (s. 253(b)). In fact, a police officer has noauthority under the Code to demand that a suspect provide evidence in theform of a bodily substance for the purposes of drug testing, even if there arereasonable grounds to believe the suspect is impaired by a drug. Subsection258(5) does authorize testing for drugs on a blood sample that has beenobtained for alcohol testing through a section 254 demand. However, in somejurisdictions, there is a program to assist officers to recognize the presence ofdrugs. Under this program, first developed in the United States, police officersare trained to assess the behaviour and physical appearance of impaireddrivers to determine whether they are under the influence of a drug, and if so,to identify the category of drugs involved.
The most commonly used drugs that are likely to interfere with driving havethe following effects:
Cannabis: - Disruption of vision, especially night vision; increased recoverytime after exposure to glare; poor appreciation of distances; poor colourperception, difficulties coming out of a turn; and difficulties concentrating.
Heroin and morphine: Loss of attention; diminished reflexes, sense of realityand awareness of danger and obstacles. In low dosage: risk of loss of controlof vehicle through drowsiness, cardiac or respiratory pain. In high dosage:delirium, hallucinations, motor excitement.
Cocaine: Sensation of euphoria with excessive self-confidence, desire toperform, alteration of vision, increased risk-taking, and aggressiveness.
Ecstasy-type derivatives: Fatigue, fever, muscular rigidity, and accommo-dation problems (owing to mydriasis, or dilation of the pupil).
Box 5Interpreting Impaired Driving Statistics
Police-reported impaired driving incidents have declined over the past 20years. The 2002 rate of 321 per 100,000 population is 65% lower than thepeak rate of 930 per 100,000 in 1981.
There has been considerable debate concerning the factors influencing thetrends in police-reported impaired driving offences. These include legislativechanges, enforcement practices by the police, as well as importantdemographic shifts in the population and changing attitudes on drinking anddriving.
Some would argue that more restrictive laws have had an impact on the rateof impaired driving incidents (Safety Research Office 1998; McCartt,Shabanova & Berning 2002; Quaye & Boase 2002; Solomon & Chamberlain2002). Trend data however, indicate that the rates started to decrease beforethe introduction of these stiffer laws. The rate of impaired driving started todecrease during the early 1980s and continued into the 1990s. As a result ofintense interest in this issue, both within the public and in government, actionswere taken on a number of fronts including the introduction of provincial/territorial legislation related to impaired driving, with such provisions as ignitioninterlock programs and vehicle forfeiture. Changes were made to the CriminalCode, and Health Canada launched its Dialogue on Drinking program in theearly 1980s. The program heavily stressed the creation of public awarenessto reduce the problem of impaired driving, in co-operation with the provincesand territories. A number of community awareness activities were organized,and numerous messages were broadcast on radio and television.
Other explanations for the overall decrease in the rate of impaired drivingoffences in the 1980s and 1990s concern the increased use of roadsidesuspensions by police. In 1997, the Canadian Association of Chiefs of Policeand Transport Canada commissioned the National Survey of Front-Line PoliceOfficers. In the study, which asked questions on police officer attitudes towardimpaired driving, respondents indicated that they were likely to use roadsidesuspensions for cases where the blood-alcohol content (BAC) was slightlyover the legal limit. In addition, the study concluded that the increase in theuse of roadside suspensions is due to some of the following reasons: (i) timerequired to formally charge a person under the Criminal Code; (ii) resourcesrequired to process charges; and (iii) the fact that roadside suspensionsimmediately get impaired drivers off the road (Transport Canada 1999).
The general decline in crime rates since the early 1990s coincided with adecrease in the proportion of young adults in the general population. Sinceyoung adults have higher rates of offending and victimization than other agegroups, crime rates can be expected to decline as their share of the populationdeclines (Ouimet 2002). This can help explain the downward trend in the rateof impaired driving offences.
Also, some evidence suggests that individuals are more frequently choosingalternative means of transportation or relying on “designated drivers” whenconsuming alcohol outside the home. The drop in impaired driving ratesoccurred despite little change in alcohol consumption over the last decade.
For a more detailed analysis of drinking and driving offences in Canada, seeJanhevich et al., 2003.
The use of alcohol and drugs in violentcrimeThe role of alcohol and drugs in physical and sexualassault28
According to data from the 1999 General Social Survey (GSS)on victimization, in approximately 51% of physical assaultincidents (an estimated 636,000) and 48% of sexual assaults(241,000) the victim believed that the incident was related tothe perpetrator’s use of alcohol or drugs. Male victims ofphysical assault were more likely than female victims (58%compared to 39%) to believe that the incident was related tothe perpetrator’s substance use.29 Sexual and physicalassaults committed by strangers were more often thought tobe alcohol or drug-related than those involving friends oracquaintances (77% vs. 49% for sexual assaults, and 62% vs.49% for physical assaults).30
28. This section excludes all physical and sexual assaults committed byspouses.
29. There were too few incidents involving the sexual assault of males toproduce a statistically reliable comparison.
30. There were too few cases to report alcohol-related incidents for othervictim-offender relationships.
Some research also suggests that one’s personal consumptionof alcohol or drugs may place someone at greater risk ofbecoming a victim of crime (Hindelang, Gottfredson andGarofalo 1978; Lasley and Rosenbaum 1988). As many peopledrink during social occasions at bars or restaurants, they aremore likely to be in the presence of others when their ownjudgment is also clouded by alcohol or drugs. Rapists, forexample, may attempt to use a victim’s intoxication as a reasonto deny blame, suggesting that they were unaware that consentwas not given. As well, an unattended glass can be anopportunity to use “date-rape” drugs to gain physical controlover the victim (see Box 7).
Respondents of the 1999 GSS who reported being a victim ofa physical or sexual assault were asked “in your opinion, wasthis incident related to your own alcohol or drug use?” Only9% of those who were physically assaulted (111,000 incidents)believed that their own use of alcohol contributed to the incident,and the number of sexual assault victims who believed theirown use of alcohol was a contributing factor was too low tomake a statistically reliable estimate.
10 Statistics Canada – Catalogue no. 85-002, Vol. 24, no.1
Box 7
Date rape drugs
Certain types of “date-rape” drugs allow sexual offenders to gain physicalcontrol over their victims and often leave victims with little knowledge of whathappened to them. However, it is difficult to estimate the prevalence of drug-facilitated sexual offences since data collection currently does not offer ameans of measuring the number of incidents.
Victimization surveys have consistently shown that only a small percentageof sexual offence victims report these incidents to the police (Kong et al.,2003). In drug-facilitated sexual offences, particular factors may contribute tolow and delayed reporting rates: victims may be left unconscious after theevent and have no memory of the assault or the perpetrator even thoughphysical evidence suggests they were sexually assaulted.
One common date-rape drug is Rohypnol (flunitrazepam), which belongs tothe benzodiazepine family, and is available in a quickly dissolving pill formwith effects 10 times stronger than that of Valium. It is legally manufactured inMexico and is widely available by prescription in many countries around theworld, but is not legal in Canada or the United States. GHB (gamma hydroxybutrate), is another powerful date rape drug that is illegally manufactured,available in the form of a liquid, and acts like a depressant on the centralnervous system (Fitzgerald and Riley 2000).
These drugs are inexpensive and extremely difficult to detect since they aretasteless, odourless, and colourless. Twelve to 24 hours after ingestion, theybecome untraceable through urine or blood tests. These drugs are oftenadministered in an unsuspecting victim’s beverage. Both drugs may begin totake effect within 10 to 30 minutes after ingestion and can last as long as 8 to12 hours. They mentally and physically incapacitate an individual in a varietyof ways and often mimic the effects of large quantities of alcohol consumption.Some of the effects of rohypnol and GHB include; sudden intoxication,drowsiness, unconsciousness, loss of inhibitions, respiratory failure, vomiting,seizures, extreme difficulty speaking and moving, dizziness, amnesia, coma,and even death (Fitzgerald and Riley 2000).
31. Although some have argued that using drugs such as amphetamines,cocaine, LSD and PCP in large quantities may cause some to experienceaggressive outbursts, recent research suggests that this is more likely theresults of pre-existing mental health conditions (Roth 1994; Pernanen et al.2002).
32. “Heavy drinking” is defined as drinking 5 or more beverages on a singleoccasion at least once in the past month.
33. Excludes “don’t know” and “not stated” responses.34. There were too few cases of male spousal assault victims that required
medical attention to break down by their partners’ use of alcohol.
The role of alcohol in spousal violenceResearch has shown that rates of domestic violence are higherfor men with alcohol problems than those who do not abusealcohol (Johnson 1996; Kantor and Straus 1990; Tolman andBennett 1990).31 According to data from the 1999 GSS, womenand men whose current spouses were considered “heavydrinkers”32 were almost three times as likely to be victims ofspousal abuse (8%) than those whose partner drankmoderately or not at all (3%). Further, among those whoexperienced violence by current or previous spouses,approximately 44% of women and 26% of men indicated thattheir partners were usually drinking at the time the assault(s)took place (Table 10).33
Women who reported that their partners were usually drinkingat the time of the assault(s) were more likely than nondrinkers(53% compared to 36%) to have serious violence used againstthem (being beaten, choked, threatened with a gun or knife, orsexually assaulted). They were also more likely to report beinginjured (49% compared to 35%), requiring medical attentionfor their injuries (18% compared to 13%), attending a hospitalto treat their injuries (14% compared to 8%), and fearing theirlife may be in danger as a result of the violence (48% comparedto 31%).
Similar differences were found among men assaulted by theirintimate partners. Men whose partners were usually con-suming alcohol at the time of the assault(s) were more likelythan those whose partners were non-drinkers to report serious
violence was used against them (27% compared to 12%), twotimes more likely to report physical injuries (22% compared to11%), four times more likely to report that fearing that their lifemay be in danger (17% compared to 4%), and were more thantwice as likely to report having to take time off daily activitiesas a result of the violence (19% compared to 7%).34
Heavy drinking is best understood as a contributor to spousalviolence but it cannot be said that alcohol or drug use is acause of violent behaviour. Heavy drinking may aggravatecontinuing marital conflict, by creating arguments about moneyspent on drinking, the time spent out drinking with peers, orthe frequency of coming home intoxicated, which mayculminate in violence (Johnson 2001 citing Dobash and Dobash1979; 1984). Other studies suggest that both substance abuseand violence reflect other problems, such as childhood victimi-zation or other family pathology and that drinking occasionsmay be seen as a “time out” where they feel they can denyculpability for their actions (Kantor and Straus 1990). Further,although alcohol use may not be a direct cause of violence,the deterioration of judgment that accompanies excessivealcohol use may contribute to more serious violence than wouldoccur on non-drinking occasions as it may impair theperpetrator’s ability to interpret the signals of their spouse andrespond appropriately to stressful situations.
Violence in the drug tradeCohen and Swift (1993) argue that the strongest link betweendrugs and violent crime comes from violence associated withthe illegal drug market. The trafficking of illicit drugs is a keysource of profit for the majority of organized crime groups inCanada (see Box 8) (Sauvé 1999; CISC 2002). Violence canbe used as part of the illegal drug trade to eliminate competition,to punish informants, resolve disputes over debt collection orquality of product, or to protect the shipment of drugs. Unfortu-nately, this kind of systemic violence is very difficult to quantify.People who are involved in the illegal drug trade rarely reporttheir victimization for fear of retribution or arrest.
Given the link between violence and the drug market, policerespondents are asked as part of the annual Homicide Survey,to identify whether there is “evidence of drug trafficking orsettling of drug related accounts” and if so, to specify the mostserious type of drug involved.
Between 1992 and 2002, 684 (11%) homicide incidents inCanada were reported to be drug related. Cocaine was thedrug most commonly involved (60%), followed by cannabis(20%). Heroin, other drugs and homicide incidents where therewas evidence of unspecified drugs made up the remaining20%. Of the 684 drug-related homicide incidents, 176 (26%)were also gang-related.
Statistics Canada – Catalogue no. 85-002, Vol. 24, no. 1 11
The proportion of homicide incidents that are drug-related hasremained somewhat stable between 1992 (9%) and 2002(11%), fluctuating between a low of 9% (in 1992 and 1993)and a high of 15% (in 2000). There has been an increase overthe same period (from 16% to 21%) in gang-related incidentsin which drugs were involved. During this period, such gang-related incidents fluctuated between a low of 13% (in 1995)and a high of 43% (in 2000).
British Columbia (29%), Quebec (29%) and Ontario (24%)recorded the largest proportion of drug-related homicideincidents among the provinces and territories since the early1990’s. Heroin (58%) and cocaine (33%) involvement werehighest in British Columbia (Table 11).
Of the 684 drug-related homicide incidents in Canada between1992 and 2002, 19% occurred in Vancouver, 18 % in Montréaland 12% in Toronto. Fully half of all homicides involving heroin(52%) and more than one-fifth of cocaine-related homicidestook place in Vancouver. “Other” drug-related incidents weremost common in Regina (15%). Drug offences accounted formore than a quarter (26%) of homicide incidents outside ofCensus Metropolitan Areas (CMAs).
In 1997, a new category entitled, “settling of accounts”, wasadded to the list of possible motives for drug-related incidents.For the period 1997 to 2002, settling of accounts, ranked firstat 51% among motives for drug-related homicide. This categorycounted well ahead of all other motives including financial gain/protection of assets (15%), argument/quarrel (14%) or unknownmotive (8%). Other categories including revenge, jealousy,frustration, personal protection, hate crime or fear of apprehen-sion made up the remaining 12%.
In approximately 4 in 10 drug-related incidents (42%), noaccused could be identified. In situations where an accusedcould be identified, 58% were recorded as a criminalrelationship followed by casual acquaintances (15%), strangers(10%) and close friends (6%). The remaining 11% of incidentsincluded a variety of other family or non-family connections, orcircumstances where the relationship was unknown.
MethodologyUniform Crime Reporting SurveyThe Uniform Crime Reporting (UCR) Survey was developedby Statistics Canada with the co-operation and assistance ofthe Canadian Association of Chiefs of Police. The survey, whichbecame operational in 1962, collects crime and traffic statisticsreported by all police agencies in Canada. UCR survey datareflect reported crime that has been substantiated throughpolice investigation.
The UCR Survey counts only the most serious offencecommitted in each criminal incident, which consequentlyunderestimates the total number of drug-related incidents. Forexample, if an incident includes both an act of violence and adrug offence only the act of violence is counted.
Incident Based UCR2 Survey - In 1988, the UCR survey wasredeveloped to expand the information collected. The new
Box 8
Marihuana Grow Operations (MGOs)
Annual production of marihuana in Canada is currently estimated at800 tonnes and the number of plants seized in Canada annually has exceededone million for the past four years (RCMP 2003). In this environment,Marihuana Grow Operations - sites used for the cultivation and production ofmarihuana, have increased substantially (cultivation grew six-fold from 1993to 2001). MGOs have spread across the country from British Columbia to thePrairies, Ontario, Quebec and Atlantic Canada. British Columbia, Ontarioand Quebec, in particular, accounted for 88% of incidents reported in 2000(National Coordinating Committee Working Group on Marihuana GrowOperations (NCCWG) 2003).
While MGOs can involve indoor (residential or commercial) or outdoor (farmersfields or remote locations) cultivation, indoor operations are of particularconcern when set up in residential areas. Violent crime has always been anintegral part of the production, trafficking and distribution of illegal drugs(murders, assaults, turf wars, home invasions, intimidation, drug rip-offs,burglaries, etc.). Residential MGOs are also safety hazards (electrical by-passes create fire and electrocution dangers), health hazards (they encouragethe growth of toxic moulds), create economic losses for the community (hydroand insurance costs are shared by rate-payers), and result in more crime inthe area. Finally, they contribute to the depreciation of property and homes(NCCWG on MGOs 2003).
Links to organized crime are suggested by the sheer complexity of setting upa grow operation (acquisition and development of property, security anddistribution networks). It is estimated that between 65% and 98% of cannabisproduction is related to organized crime in Canada (Consulting and AuditCanada 2002). Outlaw Motorcycle Gangs and Asian Organized Crime groupsare responsible for most MGO’s, and operate primarily in B.C., Ontario andQuebec. To date these links have been difficult to establish in the courts asoften the people caught are merely the caretakers of the crop (NCCWG onMGOs 2003).
Cross-border traffic is significant. About 50-60% of the Canadian crop maybe destined for the U.S. market. However a far greater amount of marihuanais shipped to the U.S. from Mexico (NCCWG on MGOs 2003).
Incident Based (UCR2) survey, is a micro data survey thatallows detailed examinations of accused and victimcharacteristics, as well as characteristics of the incident itself.Information in this Juristat on specific ages of accused personsis based on the results of this survey. In 2002, there were123 police agencies in 9 provinces reporting to the UCR2. Asubset of the UCR2 database, the UCR2 Research database,was used for the current Juristat. Data from this non-representative sample accounted for 56% of the nationalvolume of crime. The UCR2 Research database includes94 police agencies in 9 provinces. The incidents contained inthe 2002 Research database were distributed as follows: 39%from Ontario, 30% from Quebec, 12% from Alberta, 5% fromBritish Columbia, 5% from Manitoba, 5% from Saskatchewan,2% from Nova Scotia, 1% from New Brunswick, and 1% fromNewfoundland & Labrador.
Homicide SurveyThe Homicide Survey began collecting detailed data providedby police on homicide incidents, victims and accused personsin 1961. Whenever a homicide (murder, manslaughter orinfanticide) becomes known to the police, the investigatingpolice department completes a survey questionnaire which isthen forwarded to the Canadian Centre for Justice Statistics.Homicides are counted in the year in which they become knownto police, which may not be the year in which they actuallyoccurred.
12 Statistics Canada – Catalogue no. 85-002, Vol. 24, no.1
Box 9
Key Developments in the National Drug Strategy and RelatedDrug Legislation: A Chronology
November 1987 - Fourteen federal departments joined efforts under theleadership of Health Canada to launch Canada’s Drug Strategy. The objectivesof the strategy were to raise awareness and educate the public about theproblems associated with substance abuse, to enhance the availability andaccessibility of treatment and rehabilitation, to energize enforcement andcontrol, coordinate national efforts, and cooperate with internationalorganizations to promote a balanced approach to the global drug problem.
May 1997 - The Controlled Drugs and Substances Act (CDSA) was adoptedin Parliament to replace both the Narcotics Control Act (NCA) and Parts IIIand IV of the Food and Drugs Act (FDA). In addition to consolidating illicitdrug legislation into one Act, the CDSA included four major changes: (1)Addition of the offence “Production of a controlled substance”; (2) Expandedthe scope of offences to include substances having chemical structure similarto the current list of controlled substances; (3) Decreased some of the previousmaximum sentences but increased others – for example, the maximum penaltyfor trafficking cannabis and possession of cannabis for the purpose oftrafficking was reduced from life imprisonment to imprisonment of five yearsminus one day, but only if 3kg or less was involved; (4) Incorporated somechanges triggered by decisions under the Charter of Rights and Freedoms –for example, the minimum sentence under the NCA for importing and exportingnarcotics was seven years. The Supreme Court ruled that such a high minimumsentence of imprisonment was in violation of the Charter.
July 2000 - In R.v.Parker, [2000], (C.O.A. file No. C28732), the Court of Appealfor Ontario upheld the 1997 decision that a legislative prohibition on thepossession of marihuana without an exception for medical use violated TerryParker’s right to choose helpful treatment to alleviate the effects of his epilepsy.The court declared the prohibition of marihuana possession in the CDSA ofno force and unconstitutional. The court ruled that if Parliament did not clarifythe law within 12 months, the law should be struck down.
July 2001 – In response to R.v.Parker [2000] and in recognition of the needfor a more defined process than the one currently used under s.56 of theCDSA, Parliament enacted the Medical Marihuana Access Regulations(MMAR). The MMAR sets up a regulatory framework to allow patients withcertain severe illness access to marihuana while it is being researched as apossible symptom-relieving treatment. The regulations do not, however,amend CDSA provisions criminalizing the possession, trafficking andproduction of cannabis.
January 2003 - In R.v.J.P., [2003], (Windsor 02-Y11520), Ontario JusticeDouglas Phillips threw out a marihuana charge against a 16-year-old afterhis lawyer argued in court that, because of the Parker decision, there iseffectively no law prohibiting the possession of 30 grams or less of marihuana.
The argument was made that even with the enactment of the MMAR, whichallows the possession of marihuana under certain circumstances, parliamentat no time re-enacted section 4 of the CDSA as it relates to marihuana. Sincethis ruling, judges in Prince Edward Island, Nova Scotia and British Columbiahave followed suit and ruled in favour of persons charged with the possessionof small amounts of cannabis.
May 2003 - The Minister of Health, and the Minister of Justice and AttorneyGeneral of Canada announced the renewal of Canada’s Drug Strategy. Whilefocusing on prevention, education and treatment, the revised Strategy createsand supports an enforcement response to those who use or are involved inproduction and trafficking of illegal drugs. A biennial conference will bring allpartners together for full discussions on the Strategy’s directions and a reportwill be prepared for Parliament and Canadians every two years on theStrategy’s direction and progress.
May 2003 - Bill C-38, Act to Amend the Contraventions Act and ControlledDrugs and Substances Act, was introduced into the House of Commons May27, 2003. The Bill proposes the decriminalization of possessing small quantitiesof marihuana, held for personal use, and introduces fines. However, criminalconvictions will continue to be sought in cases where there are aggravatingcircumstances surrounding the possession. The proposed legislation alsostrengthens penalties against traffickers and producers, and directs furtherresources to tackling increased production. Under Bill C-38, possession andcultivation in marihuana remain illegal in Canada, fulfilling Canada’s obligationsunder United Nations drug conventions.
June 2003 - Health Canada approved in principle the Vancouver CoastalHealth Authority’s application for an exemption under Section 56 of theControlled Drugs and Substances Act (CDSA) to launch a supervised injectionsite pilot research project.
September 2003 - The first supervised drug injection site officially opened inVancouver, British Columbia (see Box 2).
October 2003 – R. v. P.(J). (C.O.A. file no. C40043). The Ontario Court ofAppeal dismissed the federal government’s appeal under the Y.O.A. of JusticePhillips decision in R.v.J.P. (January, 2003). The court confirmed that theoffence of possession of marihuana in section 4 of the CDSA was of no forcewhen the youth was charged, as there was no constitutionally valid medicalexemption to the prohibition of marihuana.
October 2003 – Parker v. R.; Hitzig et al. v. R.; Paquette and Turmel v. R.(C.O.A. file nos. C39532, C39738, C39740). The Ontario Court of Appealstruck down provisions of the MMAR relating to the second specialistrequirement to obtain an authorization to possess marihuana (ATP), andrestrictions on cultivation by a designate (DPL) which drives ATP holders toan often unsafe black market to obtain their marihuana. As only sections ofthe MMAR were found to be constitutionally defective, the marihuanaprohibition contained in section 4 of the CDSA was found to be constitutionallyvalid, and of full force and effect.
General Social Survey on VictimizationThe General Social Survey (GSS) is an annual survey thatmonitors changes in Canadian society and provides informationon specific policy issues of current or emerging interest. Eachyear, the GSS has a particular focus. In 1988, 1993 and 1999,the focus of the GSS was on crime and victimization.
In 1999, approximately 26,000 Canadians aged 15 years andolder residing in households were interviewed by telephoneabout their experiences of victimization. As with previouscycles, the response rate was quite high – 81.3%. Responseswere weighted to represent the approximately 24.3 million non-institutionalized persons 15 years of age and older in theCanadian population. Given this sample size, an estimate of aproportion of the population, expressed as a percentage, isexpected to be within approximately 0.8% of the true proportion19 times out of 20. Estimates for sub-samples of the populationwill have wider confidence intervals.
Adult Criminal Court SurveyThe Adult Criminal Court Survey (ACCS) provides statisticalinformation on the processing of cases through provincial/territorial adult criminal court systems. Coverage in 2001/02stood at 90% of all adult criminal court cases. One provinceand two territories (Manitoba, the Northwest Territories andNunavut) are not included in the survey at this time.
There is slight under-coverage (i.e., less than 5%) of completedcases in British Columbia for 2001/02. Also, information fromQuebec’s 140 municipal courts (which account for approxi-mately 20% of federal statute charges in that province) is notyet collected. With the exception of Prince Edward Island, NewBrunswick, Alberta, British Columbia and the Yukon, no dataare provided from superior courts.
The absence of data from all but five superior court jurisdictionsmay result in a slight underestimation of the severity of
Statistics Canada – Catalogue no. 85-002, Vol. 24, no. 1 13
sentences imposed across Canada. The reason for this isthat some of the most serious cases, which are likely to resultin the most severe sanctions, are processed in superior courts.
In Quebec, most drug offences are recorded under residualfederal statutes, resulting in an undercount of drug possessionand drug trafficking cases and an over-count of residual federalstatute cases. Those jurisdictions reporting on adult criminalcourt drug cases represent an estimated 70% of the nationalcaseload.
Youth Court SurveyThe Youth Court Survey (YCS) is a census of Criminal Codeand Other federal statute offences heard in youth court forpersons aged 12 to 17 years (up to the 18th birthday) at thetime of the offence.
Alternative Measures (AM) programs are generally reservedfor first-time offenders and are often limited to specific types ofless serious offences, although young offenders committingmore serious offences can be considered for acceptance inthe program in most jurisdictions. Alternative measures casesare excluded from the Youth Court Survey data either in thejurisdiction or at the CCJS, if they are identified. Nevertheless,differences in procedures and eligibility requirements of theseprograms influence the volume and characteristics of casesheard in youth courts.
ReferencesAdlaf E.M. and A. Paglia. 2001. Ontario Student Drug UseSurvey: 1977-2001. Toronto, Centre for Addiction and MentalHealth.
Auditor General. 2001. Illicit Drugs: The Federal Government’sRole. In 2001 Report of the Auditor General of Canada, 11:5,8.Ottawa: Office of the Auditor General of Canada.
Brunelle, N., S. Brochu, and M.-M. Cousineau. 2000. Drug-Crime Relation Among Drug Consuming Juvenile Delinquents:A Tripartite Model and More. Contemporary Drug Problems,27 (4) : 835-866.
Centre for Addiction and Mental Health (CAMH). 1999.Canada’s only drug treatment court celebrates successful firstyear. Available at http://www.camh.net/press_releases/drug_court_261199.html; accessed September 24, 2003.
Cohen, L. and S. Swift. 1993. A public health approach to theviolence epidemic in the United States. Environment andUrbanization, 5(2): 50-66.
Consulting and Audit Canada. 2002. Development of Data onOrganized Crime: Final Report. Ottawa: Public Works andGovernment Services Canada.
Criminal Intelligence Service Canada (CISC). 2002. 2002Annual Report on Organized Crime in Canada. CatalogueNo. JS61-8/2002. Ottawa.
Dobash, R.E., and R.P. Dobash. 1979. Violence Against Wives.New York: Free Press.
Dobash, R.P. and R.E. Dobash. 1984. The nature andantecedents of violent events. British Journal of Criminology.24, 269-288.
Fitzgerald, N. and K.J. Riley. 2000. Drug-Facilitated Rape:Looking for the Missing Pieces. Journal. Washington: NationalInstitute of Justice.
Health Canada. 2004. Reducing the Harm Associated withInjection Drug Use in Canada. Ottawa: Health Canada.Available at http://www.hc-sc.gc.ca/hecs-sesc/cds/publications/injection_drug/toc.htm; accessed January 20, 2004.
Health Canada. 2003a. Health Canada approves Vancouversupervised injection site pilot research project. News Release2003-50. Available at http://www.hc-sc.gc.ca/english/media/releases/2003/2003_50.htm; accessed June 24, 2003.
Health Canada. 2003b. “Canadian Drug Strategy Renewal”,Speaking Notes for The Honourable A. Anne McLellan, Ministerof Health. May 27, 2003. Ottawa. Available at http://www.hc-sc.gc.ca/english/media/speeches/27amay2003mine.html;accessed September 24, 2003.
Health Canada. 2003c. Update on Health Canada’s initiativeson marihuana for medical and research purposes. NewsRelease 1999-117. Available at http://www.hc-sc.gc.ca/english/media/releases/1999/99_117e.htm; accessed September 24,2003.
Hindelang, M.J., M.R. Gottfredson and J. Garofalo. 1978.Victims of Personal Crime: An Empirical Foundation for aTheory of Personal Victimization. Cambridge, Mass.: Ballinger.
House of Commons. 2002. Policy for The New Millennium:Working Together to Redefine Canada’s Drug Strategy. Reportof the Special Committee on the Non-Medical Use Of Drugs.Ottawa: 37th Parliament.
James, D. and E. Sawka. 2000. Drug Treatment Courts:Substance Abuse Intervention Within the Justice System.Canadian Centre on Substance Abuse National Working Groupon Addictions Policy. Ottawa: Canadian Centre for SubstanceAbuse.
Janhevich, D. , M. Gannon and N. Morisset. 2003. ImpairedDriving and Other Traffic Offences. Juristat, Catalogueno. 85-002-XIE. Vol. 23 No. 9. Canadian Centre for JusticeStatistics. Ottawa : Minister of Industry.
Johnson, H. 1996. Dangerous Domains: Violence AgainstWomen in Canada. Toronto, Canada: Nelson.
Johnson, H. 2001. Contrasting View of the Role of Alcohol inCases of Wife Assault. Journal of Interpersonal Violence, 16(1),54-72.
Kantor, G.K., and M. Straus. 1990. The “drunken bum” theoryof wife beating. In M. Straus and R. Gelles (Eds.), Physicalviolence in American families: Risk factors and adaptations toviolence in 8,145 families (pp.203-224). New Brunswick, NJ:Transaction Books.
14 Statistics Canada – Catalogue no. 85-002, Vol. 24, no.1
Kong, R., H. Johnson, S. Beattie, and A. Cardillo. 2003. SexualOffences in Canada. Juristat, Catalogue no. 85-002-XPE.Vol. 23 No. 9. Canadian Centre for Justice Statistics. Ottawa :Minister of Industry.
Lasley, J.R. and J.L. Rosenbaum. 1988. Routine Activities andMultiple Personal Victimization. Sociology and SocialResearch, 73(1), 47-50.
McCartt, A.T., I.V. Shabanova and A. Berning. 2002. Effects ofEnhanced Sanctions for Higher BACs. In D. Mayhew &C. Dussault (Eds.), Proceedings of the 16th InternationalConference on Alcohol, Drugs, and Traffic Safety, T-2002.Montreal, Canada.
National Coordinating Committee Working Group on Mari-huana Grow Operations. 2003. Report and Recommendationsto Federal / Provincial / Territorial Ministers Responsible forJustice. Draft May 2003. Ottawa: Department of Public Safetyand Emergency Preparedness, Victoria: Attorney GeneralBritish Columbia.
Ouimet, M. 2002. Explaining the American and Canadian crimedrop in the 1990s. Canadian Journal of Criminology.”44 (1): 33-50.
Pernanen, K., M. Cousineau, S. Brochu and F. Sun. 2002.Proportions of Crimes Associated with Alcohol and Other Drugsin Canada. Ottawa: Canadian Centre on Substance Abuse.French: Pernanen, K., Cousineau, M., Brochu, S. and Sun, F.(2002). Proportions des crimes associés à l’alcool et aux autresdrogues au Canada. Ottawa: Centre canadien de lutte contrel’alcoolisme et les toxicomanies.
Poulin, C., J. Stein, and J. Butt. 2000. Surveillance of DrugOverdose Deaths Using Medical Examiner. Chronic Diseasesin Canada. Vol. 19, No. 4, 2000. Ottawa: Health Canada.Available at http://www.hc-sc.gc.ca/pphb-dgspsp/publicat/cdic-mcc/19-4/f_e.html; accessed September 24, 2003.
Poulin, C., L. Van Til, and B. Wilbur. 1999. Alcohol and otherdrug use among adolescent students in Atlantic Provinces.Canadian Journal of Public Health, 90:27-29.
Quaye, K. and P. Boase. 2002. Canada’s Strategy to ReduceImpaired Driving: Experience to Date and Future Aspirations.In D. Mayhew & C. Dussault (Eds.). Proceedings of the 16thInternational Conference on Alcohol, Drugs, and Traffic Safety,T-2002. Montreal, Canada.
Roth, J.A. 1994. Psychoactive Substances and Violence.Rockville: National Institute of Justice – Research in Brief.Washington: U.S. Department of Justice.
Royal Canadian Mounted Police, Drug Enforcement Branch(2003). Available at http://www.rcmp-grc.gc.ca/drugenf/drugs_e.htm#Supply; accessed September 16, 2003.
Safety Research Office 1998. Break the Law Pay the Price.Toronto: Ministry of Transportation.
Sauvé, J. 1999. Organized Crime Activity in Canada, 1998:Results of a “Pilot” Survey of 16 Police Services. Catalogue
No. 85-548-XIE Canadian Centre for Justice Statistics. Ottawa:Minister of Industry.
Single, E., J. Rehm, L. Robson, and M. Truong. 2000. Therelative risks and aetiologic fractions of different causes ofdisease and death attributable to alcohol, tobacco and illicitdrug use in Canada, Canadian Medical Association Journal,162: 1669-1675.
Single, E., L. Robson, J. Rehm and X. Xi. 1999. Morbidity andmortality attributable to substance abuse in Canada. AmericanJournal of Public Health, 89, 385-390.
Single, E., L. Robson, X. Xie and J. Rehm. 1996. The Costs ofSubstance Abuse in Canada. Ottawa: Canadian Centre onSubstance Abuse. Available at http://www.ccsa.ca/docs/costhigh.htm; accessed September 18, 2003.
Single, E., M. Truong, E. Adlaf and A. Ialomiteanu. 1999.Canadian Profile: Alcohol, Tobacco and Other Drugs, 1999.Toronto, Centre for Addiction and Mental Health (CAMH) andthe Canadian Centre for Substance Abuse (CCSA).
Smith, C. 1999. Drug court diverts offenders to treatment.Journal of Addiction and Mental Health, 2(1): 12.
Department of Public Safety and Emergency Preparedness(1998), Government of Canada to award more than $1.5 millionunder the National Strategy on Community Safety and CrimePrevention to combat drug-related crimes, Ottawa: Ministry ofthe Department of Public Safety and Emergency Preparedness.Available at http://www.sgc.gc.ca/publications/news/19981209_e.asp; accessed July 21, 2003.
Solomon, R. and E. Chamberlain. 2002. The potential Legaland Policy Implications of Lowering the “Criminal Code” Limitin Canada. In D. Mayhew & C. Dussault (Eds.) Proceedings ofthe 16th International Conference on Alcohol, Drugs, and TrafficSafety, T-2002. Montreal, Canada.
Statistics Canada. 2002. 2001 Census Analysis Series - Profileof the Canadian Population by Age and Sex: Canadian ages.Catalogue No. 96F0030XIE2001002. Ottawa : Minister ofIndustry.
Stevenson, K., J. Tufts, D. Hendrick, and M. Kowalski. S.Besserer, (ed.). 1998. A Profile of Youth Justice in Canada.Catalogue No. 85-544-XIE. Canadian Centre for JusticeStatistics. Ottawa: Minister of Industry.
Tolman, R. and L. Bennett. 1990. A review of quantitativeresearch on men who batter. Journal of Interpersonal Violence,5: 87-118.
Transport Canada. 1999. Smashed – The magazine on drinkingand driving. Ottawa, Ontario: Transport Canada.
Vancouver Coastal Health. 2003. Vancouver Coastal HealthUnveils North America’s First Supervised Injection SiteResearch Project. News Release 2003. Vancouver, B.C.Available at http://www.vch.ca/newslinks/news_links.cfm;accessed September 20, 2003.
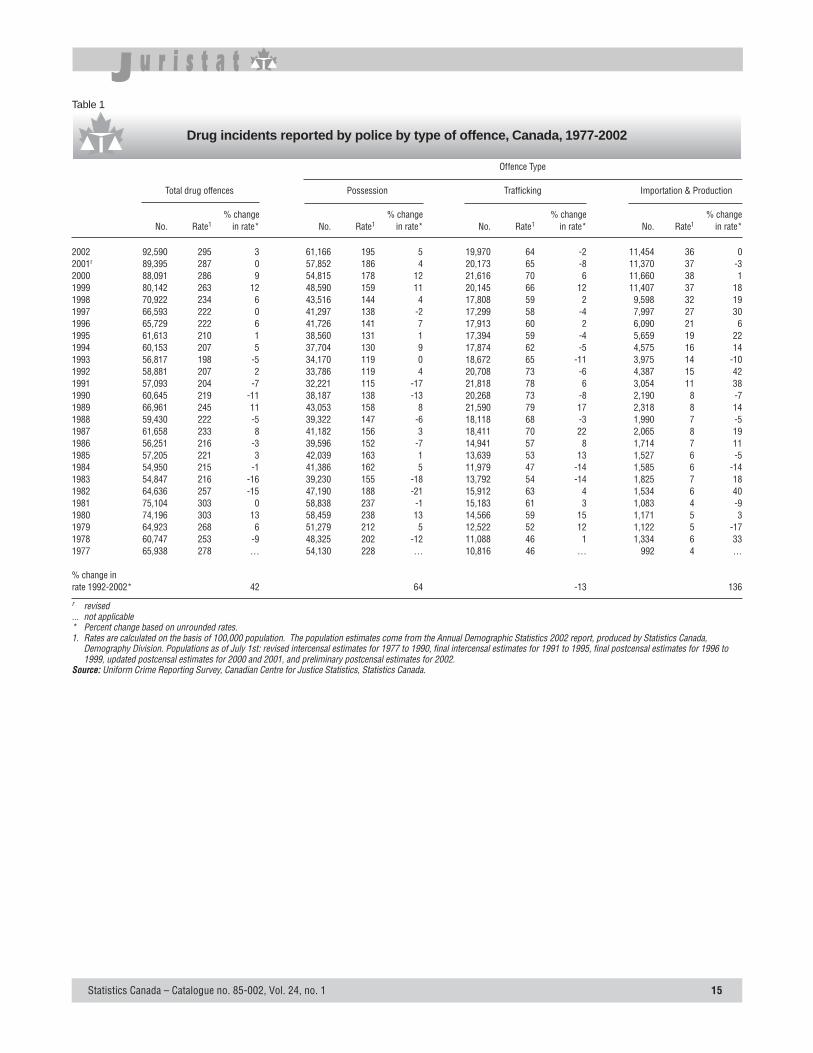
Statistics Canada – Catalogue no. 85-002, Vol. 24, no. 1 15
Table 1
Drug incidents reported by police by type of offence, Canada, 1977-2002
Offence Type
Total drug offences Possession Trafficking Importation & Production
% change % change % change % changeNo. Rate1 in rate* No. Rate1 in rate* No. Rate1 in rate* No. Rate1 in rate*
2002 92,590 295 3 61,166 195 5 19,970 64 -2 11,454 36 02001r 89,395 287 0 57,852 186 4 20,173 65 -8 11,370 37 -32000 88,091 286 9 54,815 178 12 21,616 70 6 11,660 38 11999 80,142 263 12 48,590 159 11 20,145 66 12 11,407 37 181998 70,922 234 6 43,516 144 4 17,808 59 2 9,598 32 191997 66,593 222 0 41,297 138 -2 17,299 58 -4 7,997 27 301996 65,729 222 6 41,726 141 7 17,913 60 2 6,090 21 61995 61,613 210 1 38,560 131 1 17,394 59 -4 5,659 19 221994 60,153 207 5 37,704 130 9 17,874 62 -5 4,575 16 141993 56,817 198 -5 34,170 119 0 18,672 65 -11 3,975 14 -101992 58,881 207 2 33,786 119 4 20,708 73 -6 4,387 15 421991 57,093 204 -7 32,221 115 -17 21,818 78 6 3,054 11 381990 60,645 219 -11 38,187 138 -13 20,268 73 -8 2,190 8 -71989 66,961 245 11 43,053 158 8 21,590 79 17 2,318 8 141988 59,430 222 -5 39,322 147 -6 18,118 68 -3 1,990 7 -51987 61,658 233 8 41,182 156 3 18,411 70 22 2,065 8 191986 56,251 216 -3 39,596 152 -7 14,941 57 8 1,714 7 111985 57,205 221 3 42,039 163 1 13,639 53 13 1,527 6 -51984 54,950 215 -1 41,386 162 5 11,979 47 -14 1,585 6 -141983 54,847 216 -16 39,230 155 -18 13,792 54 -14 1,825 7 181982 64,636 257 -15 47,190 188 -21 15,912 63 4 1,534 6 401981 75,104 303 0 58,838 237 -1 15,183 61 3 1,083 4 -91980 74,196 303 13 58,459 238 13 14,566 59 15 1,171 5 31979 64,923 268 6 51,279 212 5 12,522 52 12 1,122 5 -171978 60,747 253 -9 48,325 202 -12 11,088 46 1 1,334 6 331977 65,938 278 … 54,130 228 … 10,816 46 … 992 4 …
% change inrate 1992-2002* 42 64 -13 136
r revised... not applicable* Percent change based on unrounded rates.1. Rates are calculated on the basis of 100,000 population. The population estimates come from the Annual Demographic Statistics 2002 report, produced by Statistics Canada,
Demography Division. Populations as of July 1st: revised intercensal estimates for 1977 to 1990, final intercensal estimates for 1991 to 1995, final postcensal estimates for 1996 to1999, updated postcensal estimates for 2000 and 2001, and preliminary postcensal estimates for 2002.
Source: Uniform Crime Reporting Survey, Canadian Centre for Justice Statistics, Statistics Canada.
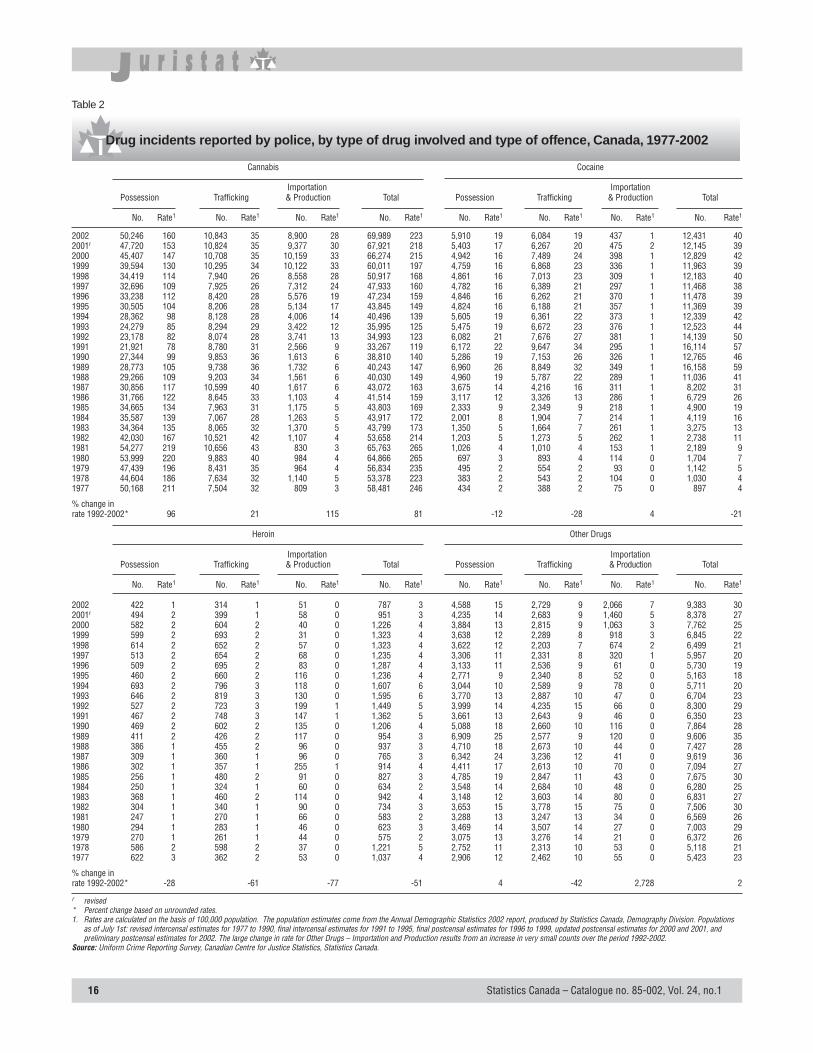
16 Statistics Canada – Catalogue no. 85-002, Vol. 24, no.1
Table 2
Drug incidents reported by police, by type of drug involved and type of offence, Canada, 1977-2002
Cannabis Cocaine
Importation ImportationPossession Trafficking & Production Total Possession Trafficking & Production Total
No. Rate1 No. Rate1 No. Rate1 No. Rate1 No. Rate1 No. Rate1 No. Rate1 No. Rate1
2002 50,246 160 10,843 35 8,900 28 69,989 223 5,910 19 6,084 19 437 1 12,431 402001r 47,720 153 10,824 35 9,377 30 67,921 218 5,403 17 6,267 20 475 2 12,145 392000 45,407 147 10,708 35 10,159 33 66,274 215 4,942 16 7,489 24 398 1 12,829 421999 39,594 130 10,295 34 10,122 33 60,011 197 4,759 16 6,868 23 336 1 11,963 391998 34,419 114 7,940 26 8,558 28 50,917 168 4,861 16 7,013 23 309 1 12,183 401997 32,696 109 7,925 26 7,312 24 47,933 160 4,782 16 6,389 21 297 1 11,468 381996 33,238 112 8,420 28 5,576 19 47,234 159 4,846 16 6,262 21 370 1 11,478 391995 30,505 104 8,206 28 5,134 17 43,845 149 4,824 16 6,188 21 357 1 11,369 391994 28,362 98 8,128 28 4,006 14 40,496 139 5,605 19 6,361 22 373 1 12,339 421993 24,279 85 8,294 29 3,422 12 35,995 125 5,475 19 6,672 23 376 1 12,523 441992 23,178 82 8,074 28 3,741 13 34,993 123 6,082 21 7,676 27 381 1 14,139 501991 21,921 78 8,780 31 2,566 9 33,267 119 6,172 22 9,647 34 295 1 16,114 571990 27,344 99 9,853 36 1,613 6 38,810 140 5,286 19 7,153 26 326 1 12,765 461989 28,773 105 9,738 36 1,732 6 40,243 147 6,960 26 8,849 32 349 1 16,158 591988 29,266 109 9,203 34 1,561 6 40,030 149 4,960 19 5,787 22 289 1 11,036 411987 30,856 117 10,599 40 1,617 6 43,072 163 3,675 14 4,216 16 311 1 8,202 311986 31,766 122 8,645 33 1,103 4 41,514 159 3,117 12 3,326 13 286 1 6,729 261985 34,665 134 7,963 31 1,175 5 43,803 169 2,333 9 2,349 9 218 1 4,900 191984 35,587 139 7,067 28 1,263 5 43,917 172 2,001 8 1,904 7 214 1 4,119 161983 34,364 135 8,065 32 1,370 5 43,799 173 1,350 5 1,664 7 261 1 3,275 131982 42,030 167 10,521 42 1,107 4 53,658 214 1,203 5 1,273 5 262 1 2,738 111981 54,277 219 10,656 43 830 3 65,763 265 1,026 4 1,010 4 153 1 2,189 91980 53,999 220 9,883 40 984 4 64,866 265 697 3 893 4 114 0 1,704 71979 47,439 196 8,431 35 964 4 56,834 235 495 2 554 2 93 0 1,142 51978 44,604 186 7,634 32 1,140 5 53,378 223 383 2 543 2 104 0 1,030 41977 50,168 211 7,504 32 809 3 58,481 246 434 2 388 2 75 0 897 4
% change inrate 1992-2002* 96 21 115 81 -12 -28 4 -21
Heroin Other Drugs
Importation ImportationPossession Trafficking & Production Total Possession Trafficking & Production Total
No. Rate1 No. Rate1 No. Rate1 No. Rate1 No. Rate1 No. Rate1 No. Rate1 No. Rate1
2002 422 1 314 1 51 0 787 3 4,588 15 2,729 9 2,066 7 9,383 302001r 494 2 399 1 58 0 951 3 4,235 14 2,683 9 1,460 5 8,378 272000 582 2 604 2 40 0 1,226 4 3,884 13 2,815 9 1,063 3 7,762 251999 599 2 693 2 31 0 1,323 4 3,638 12 2,289 8 918 3 6,845 221998 614 2 652 2 57 0 1,323 4 3,622 12 2,203 7 674 2 6,499 211997 513 2 654 2 68 0 1,235 4 3,306 11 2,331 8 320 1 5,957 201996 509 2 695 2 83 0 1,287 4 3,133 11 2,536 9 61 0 5,730 191995 460 2 660 2 116 0 1,236 4 2,771 9 2,340 8 52 0 5,163 181994 693 2 796 3 118 0 1,607 6 3,044 10 2,589 9 78 0 5,711 201993 646 2 819 3 130 0 1,595 6 3,770 13 2,887 10 47 0 6,704 231992 527 2 723 3 199 1 1,449 5 3,999 14 4,235 15 66 0 8,300 291991 467 2 748 3 147 1 1,362 5 3,661 13 2,643 9 46 0 6,350 231990 469 2 602 2 135 0 1,206 4 5,088 18 2,660 10 116 0 7,864 281989 411 2 426 2 117 0 954 3 6,909 25 2,577 9 120 0 9,606 351988 386 1 455 2 96 0 937 3 4,710 18 2,673 10 44 0 7,427 281987 309 1 360 1 96 0 765 3 6,342 24 3,236 12 41 0 9,619 361986 302 1 357 1 255 1 914 4 4,411 17 2,613 10 70 0 7,094 271985 256 1 480 2 91 0 827 3 4,785 19 2,847 11 43 0 7,675 301984 250 1 324 1 60 0 634 2 3,548 14 2,684 10 48 0 6,280 251983 368 1 460 2 114 0 942 4 3,148 12 3,603 14 80 0 6,831 271982 304 1 340 1 90 0 734 3 3,653 15 3,778 15 75 0 7,506 301981 247 1 270 1 66 0 583 2 3,288 13 3,247 13 34 0 6,569 261980 294 1 283 1 46 0 623 3 3,469 14 3,507 14 27 0 7,003 291979 270 1 261 1 44 0 575 2 3,075 13 3,276 14 21 0 6,372 261978 586 2 598 2 37 0 1,221 5 2,752 11 2,313 10 53 0 5,118 211977 622 3 362 2 53 0 1,037 4 2,906 12 2,462 10 55 0 5,423 23
% change inrate 1992-2002* -28 -61 -77 -51 4 -42 2,728 2
r revised* Percent change based on unrounded rates.1. Rates are calculated on the basis of 100,000 population. The population estimates come from the Annual Demographic Statistics 2002 report, produced by Statistics Canada, Demography Division. Populations
as of July 1st: revised intercensal estimates for 1977 to 1990, final intercensal estimates for 1991 to 1995, final postcensal estimates for 1996 to 1999, updated postcensal estimates for 2000 and 2001, andpreliminary postcensal estimates for 2002. The large change in rate for Other Drugs – Importation and Production results from an increase in very small counts over the period 1992-2002.
Source: Uniform Crime Reporting Survey, Canadian Centre for Justice Statistics, Statistics Canada.
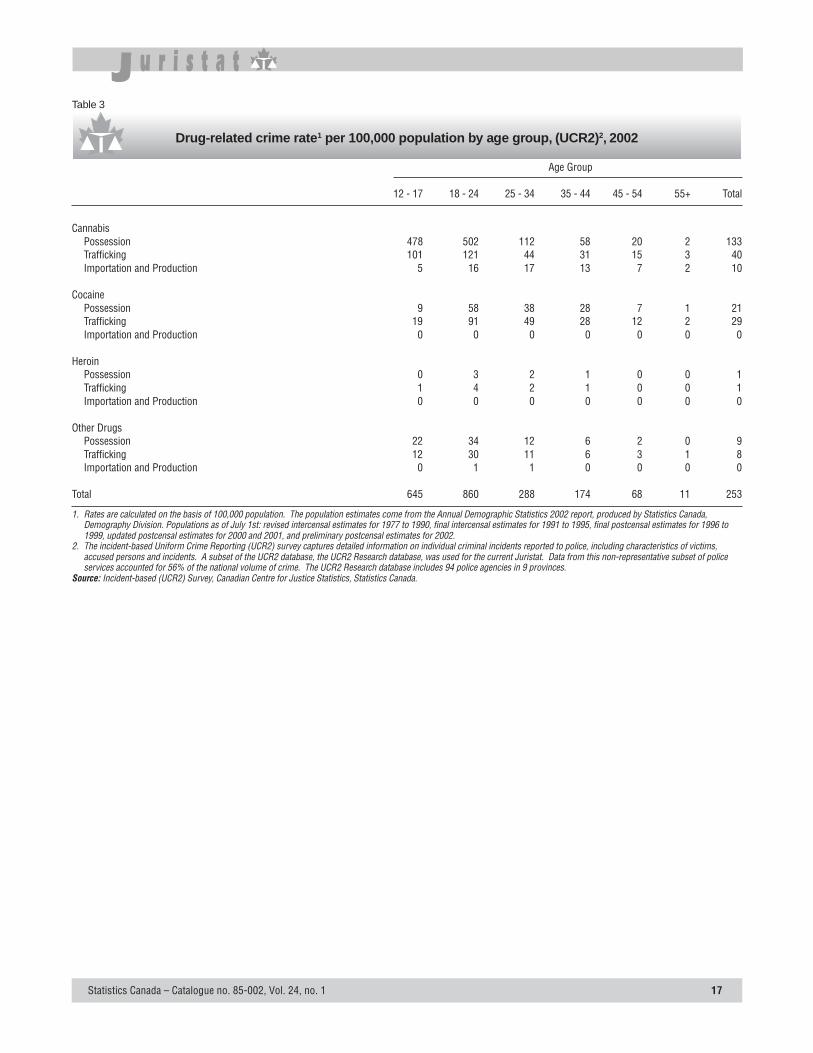
Statistics Canada – Catalogue no. 85-002, Vol. 24, no. 1 17
Table 3
Drug-related crime rate1 per 100,000 population by age group, (UCR2)2, 2002
Age Group
12 - 17 18 - 24 25 - 34 35 - 44 45 - 54 55+ Total
CannabisPossession 478 502 112 58 20 2 133Trafficking 101 121 44 31 15 3 40Importation and Production 5 16 17 13 7 2 10
CocainePossession 9 58 38 28 7 1 21Trafficking 19 91 49 28 12 2 29Importation and Production 0 0 0 0 0 0 0
HeroinPossession 0 3 2 1 0 0 1Trafficking 1 4 2 1 0 0 1Importation and Production 0 0 0 0 0 0 0
Other DrugsPossession 22 34 12 6 2 0 9Trafficking 12 30 11 6 3 1 8Importation and Production 0 1 1 0 0 0 0
Total 645 860 288 174 68 11 253
1. Rates are calculated on the basis of 100,000 population. The population estimates come from the Annual Demographic Statistics 2002 report, produced by Statistics Canada,Demography Division. Populations as of July 1st: revised intercensal estimates for 1977 to 1990, final intercensal estimates for 1991 to 1995, final postcensal estimates for 1996 to1999, updated postcensal estimates for 2000 and 2001, and preliminary postcensal estimates for 2002.
2. The incident-based Uniform Crime Reporting (UCR2) survey captures detailed information on individual criminal incidents reported to police, including characteristics of victims,accused persons and incidents. A subset of the UCR2 database, the UCR2 Research database, was used for the current Juristat. Data from this non-representative subset of policeservices accounted for 56% of the national volume of crime. The UCR2 Research database includes 94 police agencies in 9 provinces.
Source: Incident-based (UCR2) Survey, Canadian Centre for Justice Statistics, Statistics Canada.
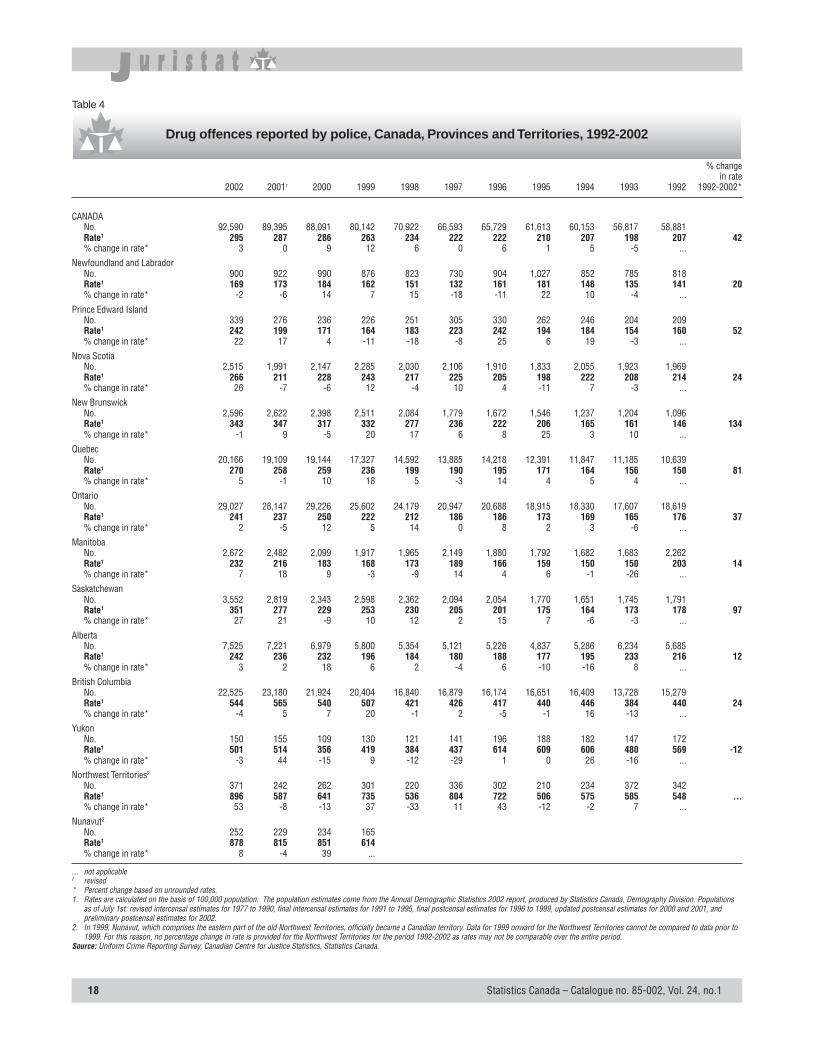
18 Statistics Canada – Catalogue no. 85-002, Vol. 24, no.1
Table 4
Drug offences reported by police, Canada, Provinces and Territories, 1992-2002
% changein rate
2002 2001r 2000 1999 1998 1997 1996 1995 1994 1993 1992 1992-2002*
CANADANo. 92,590 89,395 88,091 80,142 70,922 66,593 65,729 61,613 60,153 56,817 58,881Rate1 295 287 286 263 234 222 222 210 207 198 207 42% change in rate* 3 0 9 12 6 0 6 1 5 -5 ...
Newfoundland and LabradorNo. 900 922 990 876 823 730 904 1,027 852 785 818Rate1 169 173 184 162 151 132 161 181 148 135 141 20% change in rate* -2 -6 14 7 15 -18 -11 22 10 -4 ...
Prince Edward IslandNo. 339 276 236 226 251 305 330 262 246 204 209Rate1 242 199 171 164 183 223 242 194 184 154 160 52% change in rate* 22 17 4 -11 -18 -8 25 6 19 -3 ...
Nova ScotiaNo. 2,515 1,991 2,147 2,285 2,030 2,106 1,910 1,833 2,055 1,923 1,969Rate1 266 211 228 243 217 225 205 198 222 208 214 24% change in rate* 26 -7 -6 12 -4 10 4 -11 7 -3 ...
New BrunswickNo. 2,596 2,622 2,398 2,511 2,084 1,779 1,672 1,546 1,237 1,204 1,096Rate1 343 347 317 332 277 236 222 206 165 161 146 134% change in rate* -1 9 -5 20 17 6 8 25 3 10 ...
QuebecNo. 20,166 19,109 19,144 17,327 14,592 13,885 14,218 12,391 11,847 11,185 10,639Rate1 270 258 259 236 199 190 195 171 164 156 150 81% change in rate* 5 -1 10 18 5 -3 14 4 5 4 ...
OntarioNo. 29,027 28,147 29,226 25,602 24,179 20,947 20,688 18,915 18,330 17,607 18,619Rate1 241 237 250 222 212 186 186 173 169 165 176 37% change in rate* 2 -5 12 5 14 0 8 2 3 -6 ...
ManitobaNo. 2,672 2,482 2,099 1,917 1,965 2,149 1,880 1,792 1,682 1,683 2,262Rate1 232 216 183 168 173 189 166 159 150 150 203 14% change in rate* 7 18 9 -3 -9 14 4 6 -1 -26 ...
SaskatchewanNo. 3,552 2,819 2,343 2,598 2,362 2,094 2,054 1,770 1,651 1,745 1,791Rate1 351 277 229 253 230 205 201 175 164 173 178 97% change in rate* 27 21 -9 10 12 2 15 7 -6 -3 ...
AlbertaNo. 7,525 7,221 6,979 5,800 5,354 5,121 5,226 4,837 5,286 6,234 5,685Rate1 242 236 232 196 184 180 188 177 195 233 216 12% change in rate* 3 2 18 6 2 -4 6 -10 -16 8 ...
British ColumbiaNo. 22,525 23,180 21,924 20,404 16,840 16,879 16,174 16,651 16,409 13,728 15,279Rate1 544 565 540 507 421 426 417 440 446 384 440 24% change in rate* -4 5 7 20 -1 2 -5 -1 16 -13 ...
YukonNo. 150 155 109 130 121 141 196 188 182 147 172Rate1 501 514 356 419 384 437 614 609 606 480 569 -12% change in rate* -3 44 -15 9 -12 -29 1 0 26 -16 ...
Northwest Territories2
No. 371 242 262 301 220 336 302 210 234 372 342Rate1 896 587 641 735 536 804 722 506 575 585 548 ...% change in rate* 53 -8 -13 37 -33 11 43 -12 -2 7 ...
Nunavut2
No. 252 229 234 165Rate1 878 815 851 614% change in rate* 8 -4 39 ...
... not applicabler revised* Percent change based on unrounded rates.1. Rates are calculated on the basis of 100,000 population. The population estimates come from the Annual Demographic Statistics 2002 report, produced by Statistics Canada, Demography Division. Populations
as of July 1st: revised intercensal estimates for 1977 to 1990, final intercensal estimates for 1991 to 1995, final postcensal estimates for 1996 to 1999, updated postcensal estimates for 2000 and 2001, andpreliminary postcensal estimates for 2002.
2. In 1999, Nunavut, which comprises the eastern part of the old Northwest Territories, officially became a Canadian territory. Data for 1999 onward for the Northwest Territories cannot be compared to data prior to1999. For this reason, no percentage change in rate is provided for the Northwest Territories for the period 1992-2002 as rates may not be comparable over the entire period.
Source: Uniform Crime Reporting Survey, Canadian Centre for Justice Statistics, Statistics Canada.
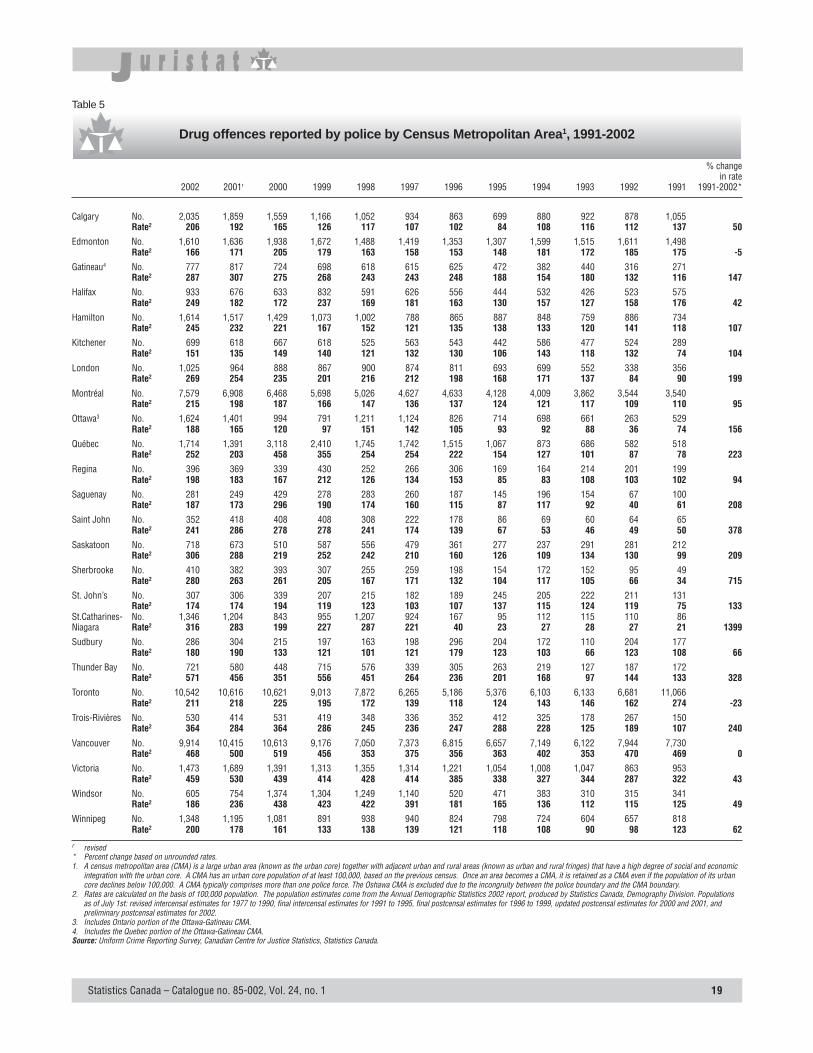
Statistics Canada – Catalogue no. 85-002, Vol. 24, no. 1 19
Table 5
Drug offences reported by police by Census Metropolitan Area1, 1991-2002
% changein rate
2002 2001r 2000 1999 1998 1997 1996 1995 1994 1993 1992 1991 1991-2002*
Calgary No. 2,035 1,859 1,559 1,166 1,052 934 863 699 880 922 878 1,055Rate2 206 192 165 126 117 107 102 84 108 116 112 137 50
Edmonton No. 1,610 1,636 1,938 1,672 1,488 1,419 1,353 1,307 1,599 1,515 1,611 1,498Rate2 166 171 205 179 163 158 153 148 181 172 185 175 -5
Gatineau4 No. 777 817 724 698 618 615 625 472 382 440 316 271Rate2 287 307 275 268 243 243 248 188 154 180 132 116 147
Halifax No. 933 676 633 832 591 626 556 444 532 426 523 575Rate2 249 182 172 237 169 181 163 130 157 127 158 176 42
Hamilton No. 1,614 1,517 1,429 1,073 1,002 788 865 887 848 759 886 734Rate2 245 232 221 167 152 121 135 138 133 120 141 118 107
Kitchener No. 699 618 667 618 525 563 543 442 586 477 524 289Rate2 151 135 149 140 121 132 130 106 143 118 132 74 104
London No. 1,025 964 888 867 900 874 811 693 699 552 338 356Rate2 269 254 235 201 216 212 198 168 171 137 84 90 199
Montréal No. 7,579 6,908 6,468 5,698 5,026 4,627 4,633 4,128 4,009 3,862 3,544 3,540Rate2 215 198 187 166 147 136 137 124 121 117 109 110 95
Ottawa3 No. 1,624 1,401 994 791 1,211 1,124 826 714 698 661 263 529Rate2 188 165 120 97 151 142 105 93 92 88 36 74 156
Québec No. 1,714 1,391 3,118 2,410 1,745 1,742 1,515 1,067 873 686 582 518Rate2 252 203 458 355 254 254 222 154 127 101 87 78 223
Regina No. 396 369 339 430 252 266 306 169 164 214 201 199Rate2 198 183 167 212 126 134 153 85 83 108 103 102 94
Saguenay No. 281 249 429 278 283 260 187 145 196 154 67 100Rate2 187 173 296 190 174 160 115 87 117 92 40 61 208
Saint John No. 352 418 408 408 308 222 178 86 69 60 64 65Rate2 241 286 278 278 241 174 139 67 53 46 49 50 378
Saskatoon No. 718 673 510 587 556 479 361 277 237 291 281 212Rate2 306 288 219 252 242 210 160 126 109 134 130 99 209
Sherbrooke No. 410 382 393 307 255 259 198 154 172 152 95 49Rate2 280 263 261 205 167 171 132 104 117 105 66 34 715
St. John’s No. 307 306 339 207 215 182 189 245 205 222 211 131Rate2 174 174 194 119 123 103 107 137 115 124 119 75 133
St.Catharines- No. 1,346 1,204 843 955 1,207 924 167 95 112 115 110 86Niagara Rate2 316 283 199 227 287 221 40 23 27 28 27 21 1399
Sudbury No. 286 304 215 197 163 198 296 204 172 110 204 177Rate2 180 190 133 121 101 121 179 123 103 66 123 108 66
Thunder Bay No. 721 580 448 715 576 339 305 263 219 127 187 172Rate2 571 456 351 556 451 264 236 201 168 97 144 133 328
Toronto No. 10,542 10,616 10,621 9,013 7,872 6,265 5,186 5,376 6,103 6,133 6,681 11,066Rate2 211 218 225 195 172 139 118 124 143 146 162 274 -23
Trois-Rivières No. 530 414 531 419 348 336 352 412 325 178 267 150Rate2 364 284 364 286 245 236 247 288 228 125 189 107 240
Vancouver No. 9,914 10,415 10,613 9,176 7,050 7,373 6,815 6,657 7,149 6,122 7,944 7,730Rate2 468 500 519 456 353 375 356 363 402 353 470 469 0
Victoria No. 1,473 1,689 1,391 1,313 1,355 1,314 1,221 1,054 1,008 1,047 863 953Rate2 459 530 439 414 428 414 385 338 327 344 287 322 43
Windsor No. 605 754 1,374 1,304 1,249 1,140 520 471 383 310 315 341Rate2 186 236 438 423 422 391 181 165 136 112 115 125 49
Winnipeg No. 1,348 1,195 1,081 891 938 940 824 798 724 604 657 818Rate2 200 178 161 133 138 139 121 118 108 90 98 123 62
r revised* Percent change based on unrounded rates.1. A census metropolitan area (CMA) is a large urban area (known as the urban core) together with adjacent urban and rural areas (known as urban and rural fringes) that have a high degree of social and economic
integration with the urban core. A CMA has an urban core population of at least 100,000, based on the previous census. Once an area becomes a CMA, it is retained as a CMA even if the population of its urbancore declines below 100,000. A CMA typically comprises more than one police force. The Oshawa CMA is excluded due to the incongruity between the police boundary and the CMA boundary.
2. Rates are calculated on the basis of 100,000 population. The population estimates come from the Annual Demographic Statistics 2002 report, produced by Statistics Canada, Demography Division. Populationsas of July 1st: revised intercensal estimates for 1977 to 1990, final intercensal estimates for 1991 to 1995, final postcensal estimates for 1996 to 1999, updated postcensal estimates for 2000 and 2001, andpreliminary postcensal estimates for 2002.
3. Includes Ontario portion of the Ottawa-Gatineau CMA.4. Includes the Quebec portion of the Ottawa-Gatineau CMA.Source: Uniform Crime Reporting Survey, Canadian Centre for Justice Statistics, Statistics Canada.
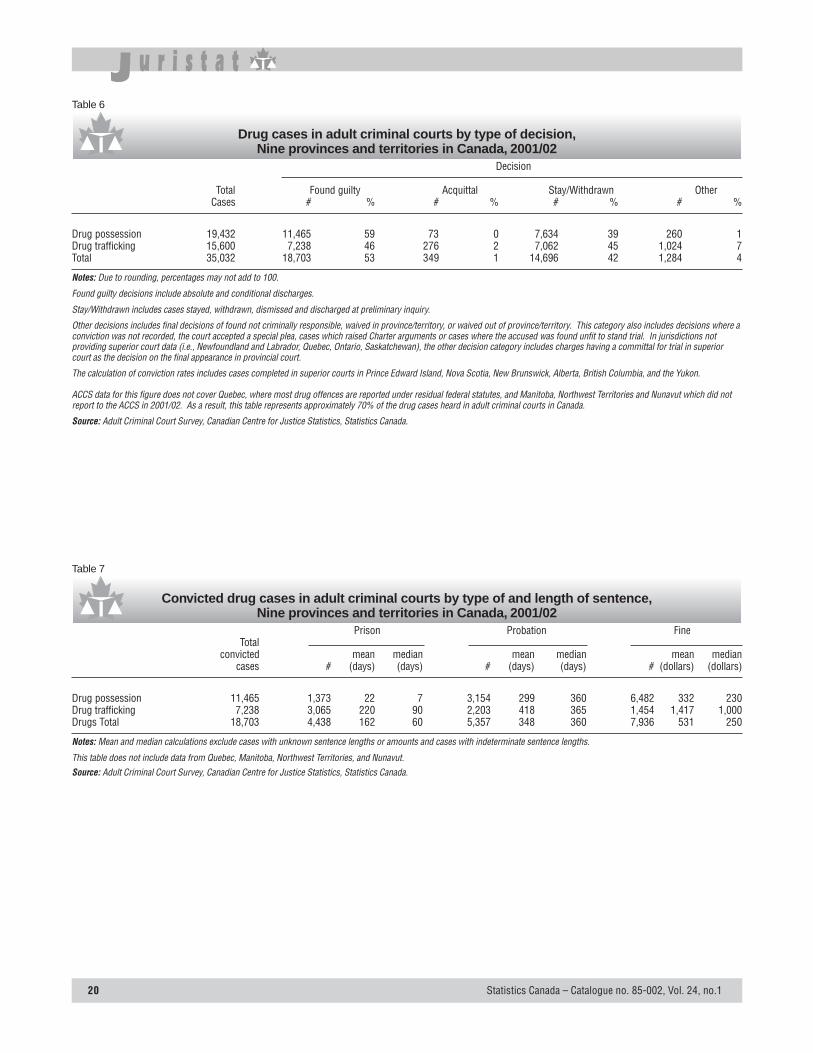
20 Statistics Canada – Catalogue no. 85-002, Vol. 24, no.1
Table 6
Drug cases in adult criminal courts by type of decision,Nine provinces and territories in Canada, 2001/02
Decision
Total Found guilty Acquittal Stay/Withdrawn OtherCases # % # % # % # %
Drug possession 19,432 11,465 59 73 0 7,634 39 260 1Drug trafficking 15,600 7,238 46 276 2 7,062 45 1,024 7Total 35,032 18,703 53 349 1 14,696 42 1,284 4
Notes: Due to rounding, percentages may not add to 100.
Found guilty decisions include absolute and conditional discharges.
Stay/Withdrawn includes cases stayed, withdrawn, dismissed and discharged at preliminary inquiry.
Other decisions includes final decisions of found not criminally responsible, waived in province/territory, or waived out of province/territory. This category also includes decisions where aconviction was not recorded, the court accepted a special plea, cases which raised Charter arguments or cases where the accused was found unfit to stand trial. In jurisdictions notproviding superior court data (i.e., Newfoundland and Labrador, Quebec, Ontario, Saskatchewan), the other decision category includes charges having a committal for trial in superiorcourt as the decision on the final appearance in provincial court.
The calculation of conviction rates includes cases completed in superior courts in Prince Edward Island, Nova Scotia, New Brunswick, Alberta, British Columbia, and the Yukon.
ACCS data for this figure does not cover Quebec, where most drug offences are reported under residual federal statutes, and Manitoba, Northwest Territories and Nunavut which did notreport to the ACCS in 2001/02. As a result, this table represents approximately 70% of the drug cases heard in adult criminal courts in Canada.
Source: Adult Criminal Court Survey, Canadian Centre for Justice Statistics, Statistics Canada.
Table 7
Convicted drug cases in adult criminal courts by type of and length of sentence,Nine provinces and territories in Canada, 2001/02
Prison Probation FineTotal
convicted mean median mean median mean mediancases # (days) (days) # (days) (days) # (dollars) (dollars)
Drug possession 11,465 1,373 22 7 3,154 299 360 6,482 332 230Drug trafficking 7,238 3,065 220 90 2,203 418 365 1,454 1,417 1,000Drugs Total 18,703 4,438 162 60 5,357 348 360 7,936 531 250
Notes: Mean and median calculations exclude cases with unknown sentence lengths or amounts and cases with indeterminate sentence lengths.
This table does not include data from Quebec, Manitoba, Northwest Territories, and Nunavut.Source: Adult Criminal Court Survey, Canadian Centre for Justice Statistics, Statistics Canada.
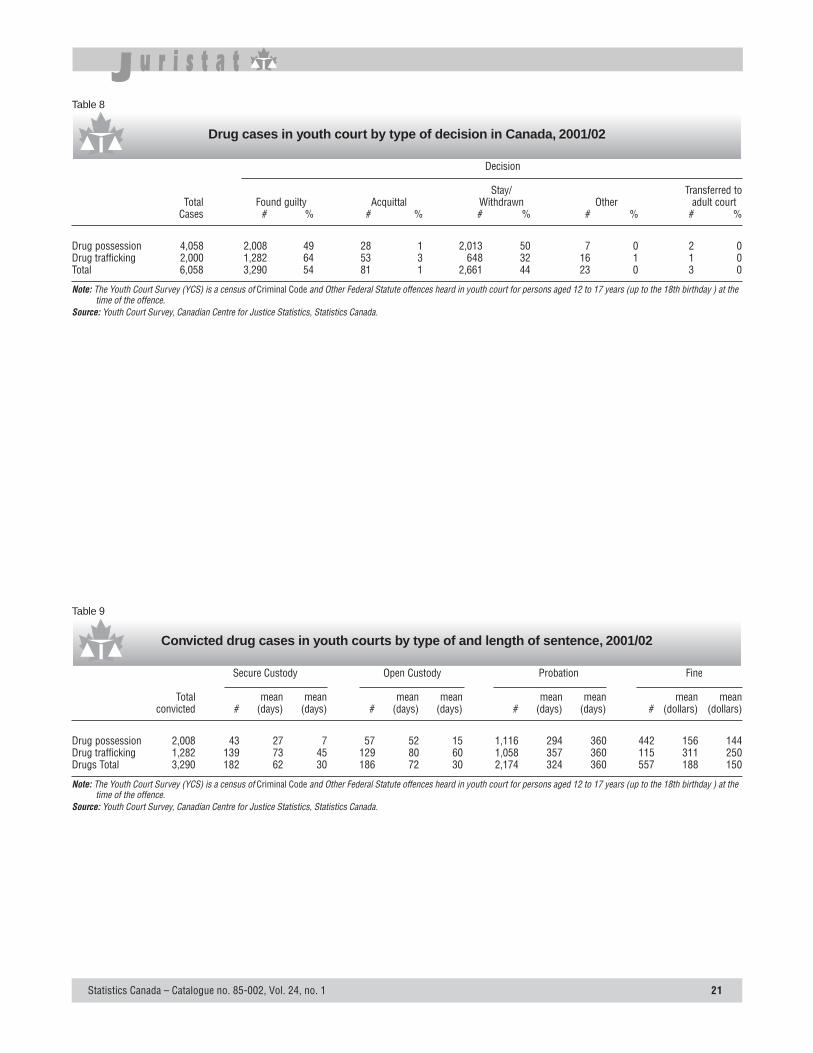
Statistics Canada – Catalogue no. 85-002, Vol. 24, no. 1 21
Table 8
Drug cases in youth court by type of decision in Canada, 2001/02
Decision
Stay/ Transferred toTotal Found guilty Acquittal Withdrawn Other adult court
Cases # % # % # % # % # %
Drug possession 4,058 2,008 49 28 1 2,013 50 7 0 2 0Drug trafficking 2,000 1,282 64 53 3 648 32 16 1 1 0Total 6,058 3,290 54 81 1 2,661 44 23 0 3 0
Note: The Youth Court Survey (YCS) is a census of Criminal Code and Other Federal Statute offences heard in youth court for persons aged 12 to 17 years (up to the 18th birthday ) at thetime of the offence.
Source: Youth Court Survey, Canadian Centre for Justice Statistics, Statistics Canada.
Table 9
Convicted drug cases in youth courts by type of and length of sentence, 2001/02
Secure Custody Open Custody Probation Fine
Total mean mean mean mean mean mean mean meanconvicted # (days) (days) # (days) (days) # (days) (days) # (dollars) (dollars)
Drug possession 2,008 43 27 7 57 52 15 1,116 294 360 442 156 144Drug trafficking 1,282 139 73 45 129 80 60 1,058 357 360 115 311 250Drugs Total 3,290 182 62 30 186 72 30 2,174 324 360 557 188 150
Note: The Youth Court Survey (YCS) is a census of Criminal Code and Other Federal Statute offences heard in youth court for persons aged 12 to 17 years (up to the 18th birthday ) at thetime of the offence.
Source: Youth Court Survey, Canadian Centre for Justice Statistics, Statistics Canada.
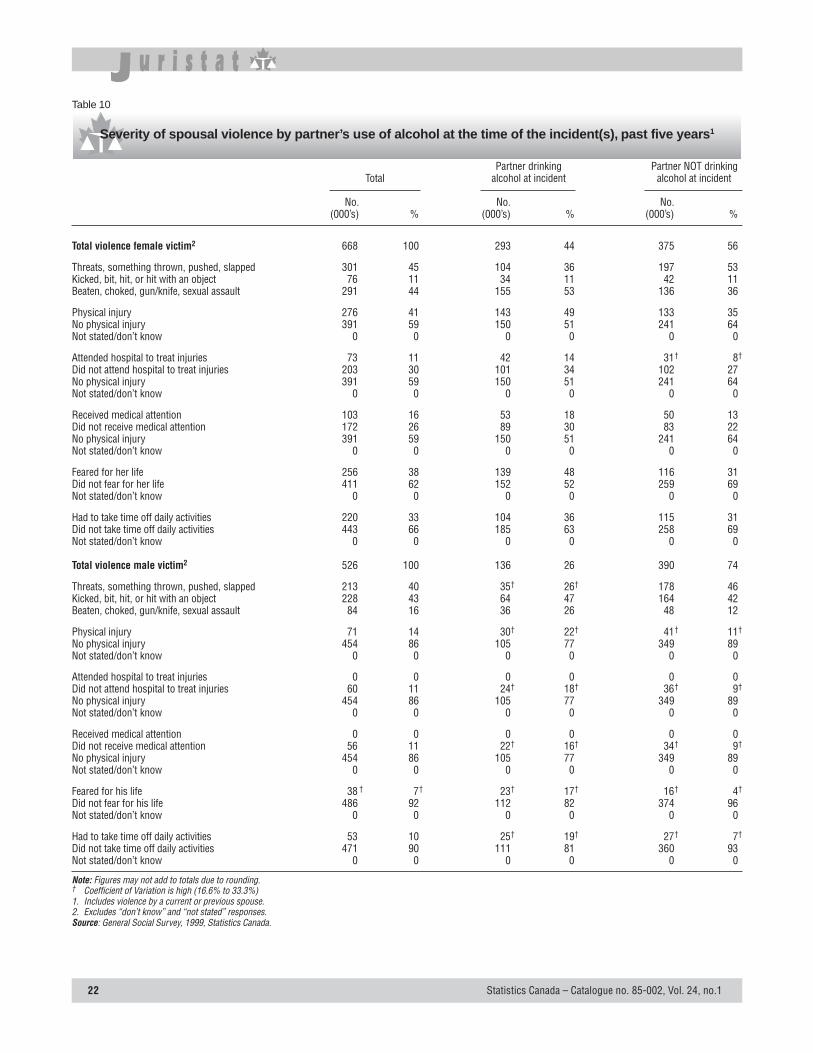
22 Statistics Canada – Catalogue no. 85-002, Vol. 24, no.1
Table 10
Severity of spousal violence by partner’s use of alcohol at the time of the incident(s), past five years1
Partner drinking Partner NOT drinkingTotal alcohol at incident alcohol at incident
No. No. No.(000’s) % (000’s) % (000’s) %
Total violence female victim2 668 100 293 44 375 56
Threats, something thrown, pushed, slapped 301 45 104 36 197 53Kicked, bit, hit, or hit with an object 76 11 34 11 42 11Beaten, choked, gun/knife, sexual assault 291 44 155 53 136 36
Physical injury 276 41 143 49 133 35No physical injury 391 59 150 51 241 64Not stated/don’t know 0 0 0 0 0 0
Attended hospital to treat injuries 73 11 42 14 31† 8†
Did not attend hospital to treat injuries 203 30 101 34 102 27No physical injury 391 59 150 51 241 64Not stated/don’t know 0 0 0 0 0 0
Received medical attention 103 16 53 18 50 13Did not receive medical attention 172 26 89 30 83 22No physical injury 391 59 150 51 241 64Not stated/don’t know 0 0 0 0 0 0
Feared for her life 256 38 139 48 116 31Did not fear for her life 411 62 152 52 259 69Not stated/don’t know 0 0 0 0 0 0
Had to take time off daily activities 220 33 104 36 115 31Did not take time off daily activities 443 66 185 63 258 69Not stated/don’t know 0 0 0 0 0 0
Total violence male victim2 526 100 136 26 390 74
Threats, something thrown, pushed, slapped 213 40 35† 26† 178 46Kicked, bit, hit, or hit with an object 228 43 64 47 164 42Beaten, choked, gun/knife, sexual assault 84 16 36 26 48 12
Physical injury 71 14 30† 22† 41† 11†
No physical injury 454 86 105 77 349 89Not stated/don’t know 0 0 0 0 0 0
Attended hospital to treat injuries 0 0 0 0 0 0Did not attend hospital to treat injuries 60 11 24† 18† 36† 9†
No physical injury 454 86 105 77 349 89Not stated/don’t know 0 0 0 0 0 0
Received medical attention 0 0 0 0 0 0Did not receive medical attention 56 11 22† 16† 34† 9†
No physical injury 454 86 105 77 349 89Not stated/don’t know 0 0 0 0 0 0
Feared for his life 38 † 7† 23† 17† 16† 4†
Did not fear for his life 486 92 112 82 374 96Not stated/don’t know 0 0 0 0 0 0
Had to take time off daily activities 53 10 25† 19† 27† 7†
Did not take time off daily activities 471 90 111 81 360 93Not stated/don’t know 0 0 0 0 0 0
Note: Figures may not add to totals due to rounding.† Coefficient of Variation is high (16.6% to 33.3%)1. Includes violence by a current or previous spouse.2. Excludes “don’t know” and “not stated” responses.Source: General Social Survey, 1999, Statistics Canada.
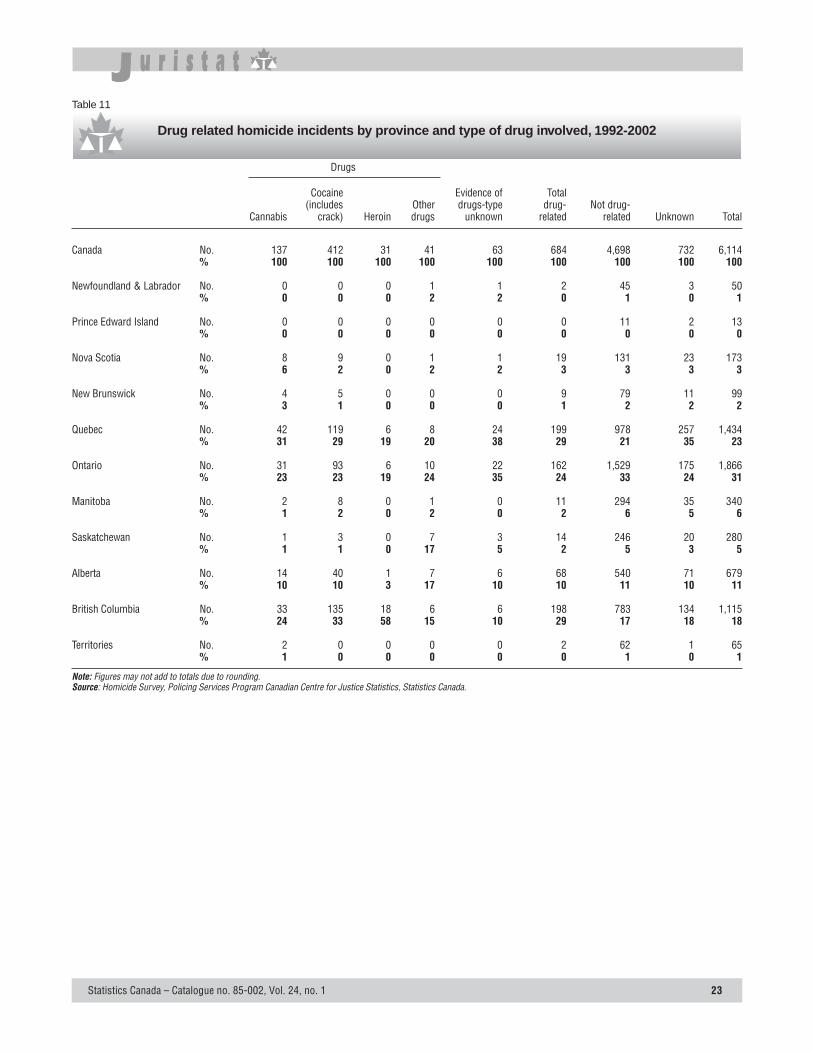
Statistics Canada – Catalogue no. 85-002, Vol. 24, no. 1 23
Table 11
Drug related homicide incidents by province and type of drug involved, 1992-2002
Drugs
Cocaine Evidence of Total(includes Other drugs-type drug- Not drug-
Cannabis crack) Heroin drugs unknown related related Unknown Total
Canada No. 137 412 31 41 63 684 4,698 732 6,114% 100 100 100 100 100 100 100 100 100
Newfoundland & Labrador No. 0 0 0 1 1 2 45 3 50% 0 0 0 2 2 0 1 0 1
Prince Edward Island No. 0 0 0 0 0 0 11 2 13% 0 0 0 0 0 0 0 0 0
Nova Scotia No. 8 9 0 1 1 19 131 23 173% 6 2 0 2 2 3 3 3 3
New Brunswick No. 4 5 0 0 0 9 79 11 99% 3 1 0 0 0 1 2 2 2
Quebec No. 42 119 6 8 24 199 978 257 1,434% 31 29 19 20 38 29 21 35 23
Ontario No. 31 93 6 10 22 162 1,529 175 1,866% 23 23 19 24 35 24 33 24 31
Manitoba No. 2 8 0 1 0 11 294 35 340% 1 2 0 2 0 2 6 5 6
Saskatchewan No. 1 3 0 7 3 14 246 20 280% 1 1 0 17 5 2 5 3 5
Alberta No. 14 40 1 7 6 68 540 71 679% 10 10 3 17 10 10 11 10 11
British Columbia No. 33 135 18 6 6 198 783 134 1,115% 24 33 58 15 10 29 17 18 18
Territories No. 2 0 0 0 0 2 62 1 65% 1 0 0 0 0 0 1 0 1
Note: Figures may not add to totals due to rounding.Source: Homicide Survey, Policing Services Program Canadian Centre for Justice Statistics, Statistics Canada.
24 Statistics Canada – Catalogue no. 85-002, Vol. 24, no.1
Canadian Centre for Justice StatisticsFor further information, please contact the Canadian Centre for Justice Statistics, 19th floor, R.H. Coats Building, Ottawa, OntarioK1A 0T6 at (613) 951-9023 or call toll-free 1 800 387-2231. To order a publication, you may telephone (613) 951-7277 or fax (613)951-1584 or visit the Internet: [email protected]. You may also call 1 800 267-6677 (Canada and United States) toll-free. If youorder by telephone, written confirmation is not required.
Recent Juristat releases
Catalogue no. 85-002-XPE
2001Vol. 21, no. 9 Homicide in Canada – 2000
Vol. 21, no. 10 Sentencing in Adult Criminal Courts, 1999/00
Vol. 21, no. 11 Crime Comparisons between Canada and the United States
Vol. 21, no. 12 Youth Custody and Community Services in Canada, 1999/00
2002Vol. 22, no. 1 Case Processing in Criminal Courts, 1999/00
Vol. 22, no. 2 Adult Criminal Court Statistics, 2000/01
Vol. 22, no. 3 Youth Court Statistics, 2000/01
Vol. 22, no. 4 Criminal Victimization: An International Perspective
Vol. 22, no. 5 National Trends in Intimate Partner Homicides, 1974-2000
Vol. 22, no. 6 Crime Statistics in Canada, 2001
Vol. 22, no. 7 Homicide in Canada, 2001
Vol. 22, no. 8 Youth Custody and Community Services in Canada, 2000/01
Vol. 22, no. 9 Pilot Analysis of Recidivism Among Convicted Youth and Young Adults - 1999/00
Vol. 22, no. 10 Adult Correctional Services in Canada 2000/01
Vol. 22, no. 11 Justice Spending in Canada, 2000/01
2003Vol. 23, no. 1 Motor Vehicle Theft in Canada – 2001
Vol. 23, no. 2 Adult Criminal Court Statistics, 2001/2002
Vol. 23, no. 3 Youth Court Statistics, 2001/02
Vol. 23, no. 4 Canada’s Shelters for Abused Women, 2001/02
Vol. 23, no. 5 Crime Statistics in Canada, 2002
Vol. 23, no. 6 Sexual Offences in Canada
Vol. 23, no. 7 Custodial Remand in Canada, 1986/87 to 2000/01
Vol. 23, no. 8 Homicide in Canada, 2002
Vol. 23, no. 9 Impaired driving and other traffic offences - 2002
Vol. 23 no. 10 Adult criminal court statistics, 2002/03
Vol. 23 no. 11 Adult correctional services in Canada, 2001/02
Related Documents