TRENDS IN CORPORATE PROFITABILITY AND CAPITAL COSTS Daniel M. Holland and Stewart C. Myers Sloan School of Management Massachusetts Institute of Technology WP #999-78 May, 1978 e 4

Welcome message from author
This document is posted to help you gain knowledge. Please leave a comment to let me know what you think about it! Share it to your friends and learn new things together.
Transcript

TRENDS IN CORPORATE PROFITABILITY AND CAPITAL COSTS
Daniel M. Holland and Stewart C. Myers
Sloan School of ManagementMassachusetts Institute of Technology
WP #999-78 May, 1978
e
4

TRINDS IN CORPORATE PROFITABILITY AND CAPITAL COSTS-
Daniel M. Holland and Stewart C. MyersSloan School of Management, M.I.T.
I. OBJECTIVES AND lAJOR CONCLUSIONS
One striking aspect of the U.S. economy's performance during
the last decade is the decline in the rate of return on corporate capital.
The potential significance of this "fact" is clear but its actual signifi-
cance is not. The decline may or may not indicate a basic structural shift
in the U.S. economy. It may reflect a serious weakness, a natural and
benign result of market forces, or something in between. Which interpreta-
tion is correct depends on several considerations, particularly the follow-
ing.
1. Whether the decline i serious depends on the level from which it
starts. If the mid-1960s was a period of unusually high profita-
bility, then the subsequent decline may merely be a return to normal
levels.
2. The trend's importance depends on whether the cost of capital has
declined proportionally. If it has, then the falling rate of return
need not, in itself, be cause for concern.
We have attempted to clarify the issues posed by declining cor-
porate profitability over the last decade, to evaluate the evidence for
longer-term trends in profitability, and to provide addition;ll evidence aIbout
causes and consequences. Our essay is organized around two simple questions.
-2-
1. Now have U.S. non-financial corporations (NFCs) fared?
2. How have rates of return on real capital held by NFCs behaved
relative to capital costs?
We answer the first question by determining how well investors in
NFCs have done. That is, we argue that the best measures of the
performance of the NFC sector are based on changes in the capital market's
aggregate valuation of the securities issued by the firms inthat sector.
We answer the second question by examining rates of return on the capital stock
of NFCs. In most cases we have looked as far back in time as the available
data permit -- usually to 1929 -- but most of our analysis is directed towards
the postwar period from 1946 through 1967
Our main conclusions are the following:
1. Non-financial corporations have fared poorly since the mid-1960s.
That fact is evident from the most casual examination of stock market
data, and it stands up to careful examination. On the other hand, NFC
performance in the postwar period ending in 1965 was excellent.
2. When the market value of NFC securities is measured relative to the net
reproduction cost of real capital held by NFCs the mid-1960s is revealed
as an unusually favorable period. 'However, today's market values are not
unusually low compared to values prevailing in, say, the 1950s. Instead
of asking why today's performance is poor, we might better ask why per-
formance in the early and mid-1960s was so good.
3. Rates of return on real capital show the same pattern as market values:
exceptional performance in the mid-1960s followed by a decline to levels
more typical of the early postwar period.
Il

- 3-
4. Real costs of capital seem to have been stable since about 1956.
Since then, fluctuations in the market value of non-financial corpora-
tions have been much more closely related to changes in operating
profitability than to changes in apitalization rates.
The implications of our findings are discussed in the concluding section
of this essay. We also note several areas in which further research
would be fruitful.
-
-4-
II. THE PERFORMANCE OF NON-FINANCIAL CORPORATIONS
Introduction
We are concerned with the profitability of non-financial cor-
porations in the aggregate. Although NFCs by no means account for the
entire private sector, they are the major part of it. More than half
of Gross Domestic Product (GDP) originates in the NFC sector. NFCs account
for more than 90 percent of corporate GDP and more than 60 percent of
total business GDP. The net replacement cost of assets held by NFCs now
exceeds $1.3 trillion. Thus, the past performance and current health of
this sector is a matter of interest and concern.
It is a widely accepted fact (a fact that we reconfirm in Section III)
that NFC profitability has fallen sharply since 1965. Is this evidence
of relatively poor performance conclusive and unambiguous? Not entirely so.
There are a number of difficulties.
1. The rate of return on capital can be computed in countless ways.
Some indicate a more serious decline than others. The National Income
Accounts provide several different estimates of depreciation, for
example. Each implies a different measure of income, a different value
for net capital stock, and a different rate of return.
2. What is to be included in capital stock? Most estimates for NFC
aggregate include only the net replacement cost of inventory and physical
capital (buildings, machinery: and equipment). Land is usually excluded;
its true value is extremely difficult to measure in any case. So is net
working capital.
3. What about intangible assets? These include, for example, the extra value

- 5-
of a going concern over a random collection of physical assets,
and the value of cumulative expenditures on research, marketing,
and employee training. The extra costs incurred in a period of learning-
by-doing are a relevant asset that is almost never shown on corporate
balance sheets. Firms acquire valuable investment opportunities by
virtue of past activities. / Monopoly power is an asset from the
investor's viewpoint.
The problems implicit in these questions have absorbed many man-
years of study. Despite this work, problems remain: rates of return cal-
culated from accounting data will never be entirely free of errors of defini-
tion and measurement. Of course these statistics are indispensable for many
purposes. But they are not ideally suited for determining how business firms
fared over the last decade or some longer period.
There is a simple alternative. The value of the firm is not
determined by the cumulative funds invested in it, or by the net replace-
ment cost of its stock of real capital, but by the stream of earnings investors expect
it to generate. The value of this stream at any time can be ob-
served directly by summing the market value of all of the firm's outstanding
securities. That is the true value of all the firm's assets. The
income realized in any particular period can be found by adding the cash
payments received by investors to the change in the market value of the
firm's securities over the period, computed net of any new issues of securi-
ties. The rate of return earned by investors in that firm is found by dividing
income by start-of-period market value.
In short, we propose to answer the question, "How well have non-
financial corporations performed?" by using capital market data.
There may be some resistance to the idea of using stock
and bond values to answer so fundamental a question. Many regard the stock
market as irrational, and therefore an untrustworthy source of information
about real phenomena. We believe such suspicions are unfounded.
Some make the elementary logical error of confusing volatility
with irrationality. There is no necessary connection. The stock market
is a major locus for risk-bearing. In our view the stock market's vola-
tility accurately reflects the high degree of uncertainty actually existing
in the economy. In fact, we distrust accounting estimates of firm values
precisely because they are so stable.
Some doubts may stem from conceit, in the form of an individual's
belief that he or she has a more accurate assessment of value than
capital markets can provide. Often this belief is based on hindsight. The be-
lief is suspect anyway, because so few professional investors -- who are pre-
sumably the most knowledgeable -- have been able to outperform the market
consistently.-
Some doubts may reflect the inability to explain the day-to-day or
week-to-week movements of the stock market. Yet it is intellectual arrogance
to assume that something that cannot be explained is irrational or meaningless.
In any case, we are concerned not with short-term market fluctuations, but
with market behavior over a period of many years.
There is good evidence that capital markets are efficient, in the
4/ That issense of responding promptly and accurately to new information.- That is
the main reason why we use capital market data with confidence.
ill
- 7-
Rates of Return to Investors in Non-Financial Corporations
Consider a portfolio containing all the debt and equity securities
issued by NFCs. That portfolio's aggregate market value,
MV, is the market's estimate of the present value of the stream of future
earnings5/ which investors expect NCs to generate.
An investment in this portfolio would have generated income in the form of
cash interest and dividend payments and also in the form of capital gains and losses.
Thus we can calculate the rate of return earned by the portfolio in year t by estt-
mating total income for year t and dividing by MVt, the portfolio's market value
at the start of the year. Let this rate of return be Rt.6/
t'' Note that Rt is not the rate of return earned by NFC stockholders.We are concerned with the performance of the entire NFC sector, not with the
return received by holders of a claim on part of that sector's earnings.7/Stock-
holders may have gained at the expense of bondholders, or vice versa, but that
is not relevant here.-/ It is also important that our profitability measure
be unaffected by shifts in capital structure over time.
Of course, not all NFC securities are publicly traded. Even for securi-
ties that are, price data are not always conveniently available.
(This is the case for most corporate bonds, for example.) Therefore it was nec-
essary to work out a procedure for estimating MVt- and Rt. Of course alterna-
tive procedures are possible, but we believe any careful estimates will show
the same patterns across time.
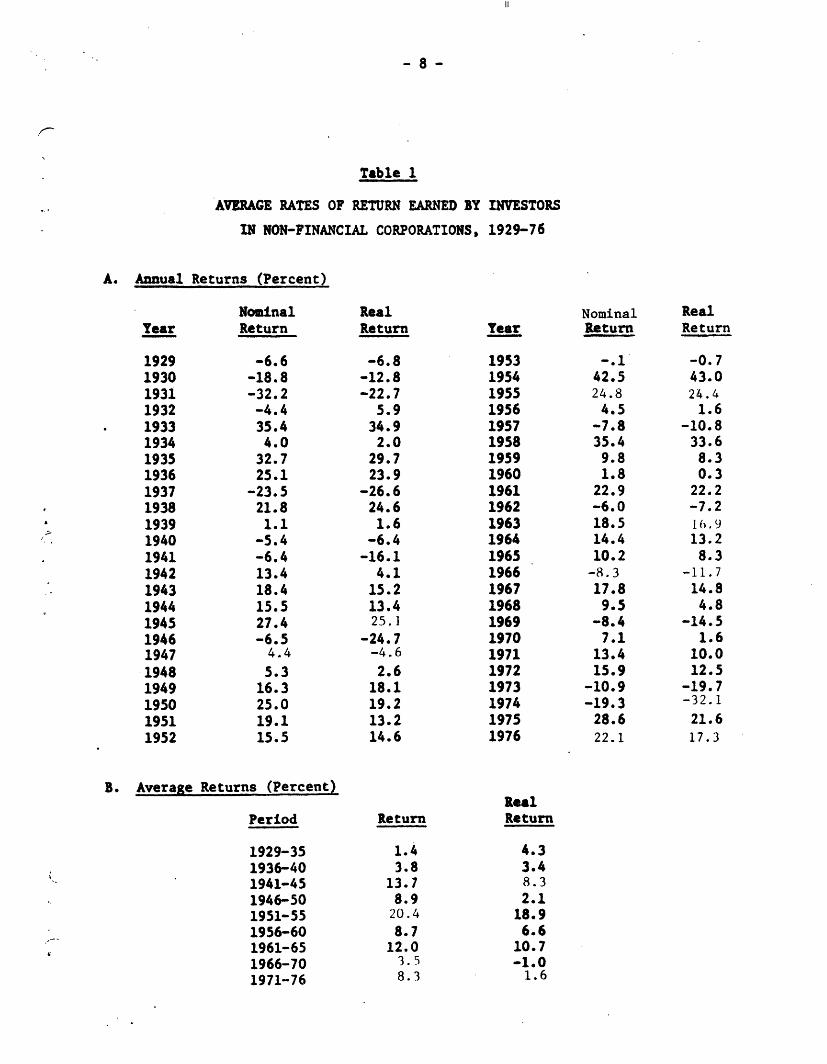
Table 1 shows real and nominal Rt s for various one- and five-year in-
tervals between 1929 and 1976. The Rt s are extremely volatile when measured
annually, as Panel A shows. However, hindsight reveals a pattern.-0/ Investors
-8-
Table 1
AVERAGE RATES OF RETURN EARNED BY INVESTORS
IN NON-FINANCIAL CORPORATIONS, 1929-76
A. Annual Returns (Percent)
Year
192919301931193219331934193519361937193819391940194119421943194419451946194719481949195019511952
NominalReturn
-6.6-18.8-32.2
-4.435.44.0
32.725.1
-23.521.81.1
-5.4-6.413.418.415.527.4-6.5
4.4
5.316.325.019.115.5
RealReturn
-6.8-12.8-22.7
5.934.92.0
29.723.9
-26.624.6
1.6-6.4
-16.14.1
15.213.425.1
-24.7-4.6
2.618.119.213.214.6
B. Average Returns (Percent)
Period
1929-351936-401941-451946-501951-551956-60
,I 1961-651966-701971-76
Return
1.43.8
13.78.920.48.7
12.03. 58.3
Year
195319541955195619571958195919601961196219631964196519661967196819691970197119721973197419751976
RealReturn
4.33.48.32.1
18.96.6
10.7-1.0
1.6
NominalReturn
-. 142.524.84.5-7.835.4
9.81.8
22.9-6.018.514.410.2
-8.317.89.5
-8.47.1
13.415.9
-10.9-19.328.622.1
RealReturn
-0.743.024.41.6
-10.833.68.30.3
22.2-7.216.913.2
8.3-11.714.84.8
-14.51.6
10.012.5
-19.7-32.1
21.617.3
III
I
9-
Table 1 (continued)
Sources
1. Annual returns are weighted averages of rates of return on debt andequity held from the beginning to the end of the year.
The equity rate of return is the annual rate of return, includingboth dividends and capital gains, on the Standard and Poor's CompositeIndex, as reported in R. Ibbotsen and R. Sinquefield, [14],Exhibit A-1, pp. 72-73.
The debt return is the rate of return on a portfolio of long-termcorporate bonds constructed by Ibbotsen and Sinquefield. The returnsare reported by Ibbotsen and Sinquefield -in theirUnfortunately the maturity of this portfolio probably overstates theaverage maturity of NFC debt. Consequently, the mean and volatilityof our estimate of R (D) are overstatements of the true mean and vola-tility. Ibbotsen and Sinquefield found that both mean return and vola-tility have increased with bond maturity. See Exhibit A-3, pp. 76-77.
The portfolio weights are the proportional contributions of debt andequity to the total estimated market value of all nonfinancial cor-porations. See Appendix Table Al.
2. Real returns are found by subtracting percentage changes in the con-suier price index, as reported by Ibbotsen and Sinquefield,Exhibit A-5, pp. 80-81.
3. The returns in Panel B are simple averages of the returns in Panel A.Note that the period 1929-35 actually contains seven years, and thatthe period 1971-76 contains six years.

10 -
in NFC securities fared very well indeed after World War II and up to about
1965, but poorly after that. The contrast between the first and second halves
of the 1960s is dramatic, particularly when real rates of return are examined.
The poor performance of the late 1960s continues in the first half of the 197Us.
Panel B of Table 1 shows that non-financial corporations have earned,
on average, a negative real rate of return from 1966 to 1970. Also, note that
real rates of return were worse in 1973-74 than in 1930-31.
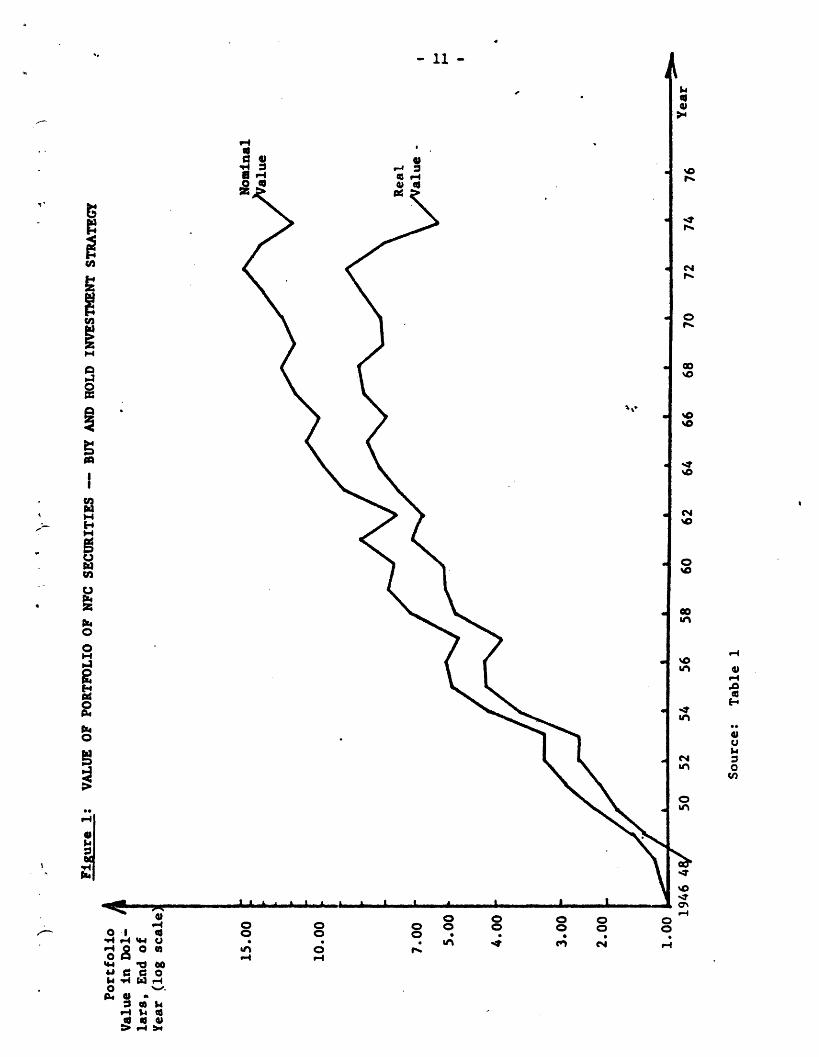
Figure 1 displays the returns in a different way. Suppose that at
the start of 1947 you had invested $1.00 in the portfolio of all bonds and
stocks issued by NFCs That is, you started by owning a very small fraction
of the portfolio of all NFC securities, which in aggregate was worth MV1947.
You then followed a buy-and-hold strategy, reinvesting all dividends and in-
terest. The rate of growth in that investment's value indicates how well or
poorly NFCs have fared.
Of course Figure 1 tells the same story as Table 1, but it is
told in a way that may be easier to appreciate. Both nominal and real values
increased rapidly, with few interruptions, up to about 1965. After that
there was slower and more erratic growth in the portfolio's nominal value.
Its real value has grown hardly at all since 1965.
Aggregate Market Value of NFC Securities
Most of the volatility of the rates of return reflect capital gains
or losses: that is, changes in MVt, the aggregate market value of NFC securi-
ties. We are also concerned with the level of MVt . Of course we expect MVt to
increase over time as corporations grow. Therefore we express MVt relative to CSt,
- 11 -
p.'
C4,
ad
V
Ww
N.J
IH
OasA 1'4
hi1-
9
NrAIPt0
0
94H04
IRpa
*40
0Q
0 a --
o v.
ob 1,I- 4,
0 , 1 0 1
00
00
00tOTO
0CD
UVI % W
o O0 0
A; ee
S¾'
00
kUV
u'V%
04
P-i
.0
H
4U
0cu
0tn
'hO
0'p-I
-4
k,
I
i,
t!
Ii
wl.

IIl
- 12 -
the net replacement cost of NFC depreciable capital and inventory, expressed
11/in current dollars.- This adjusts for that part of the movement in MVt
caused by inflation and expansion in the scale of NFC operations.
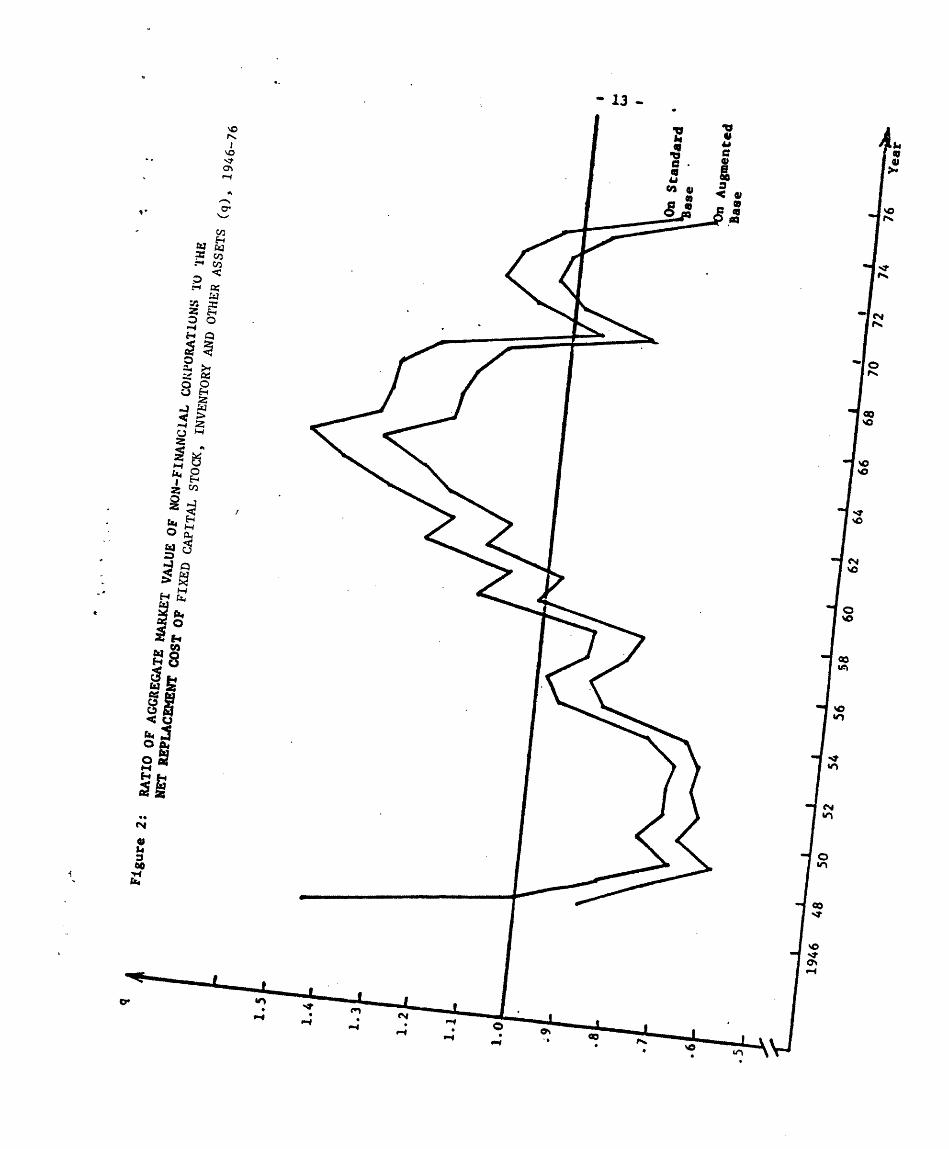
The ratio of market value to net replacement cost of plant, equipment
and inventory is usually referred to as "Tobin's q."2l/ This ratio is plotted
in Figure 2 for 1946-76.
A value of q 1.0 means that the market value of the earnings stream
generated by NFC assets is exactly equal to the net replacement cost of those
assets. This is the value for q we expect to observe if the economy is in long-
run equilibrium, if the definition of CSt includes all income-producing assets,
and if HVt and CSt are measured without error. Recognizing these ifs, we
should not read too much significance into the absolute value of q. It is
nevertheless odd to find q so far below 1.0 in the early postwar period. If
the estimates are anywhere near correct, it was far cheaper for firms to add
capacity by purchasing other firms, than by buying fresh plant, equipment and
inventory. In 1953, for example, it was possible to purchase an "average
firm" for only 70 percent of the net replacement cost of its assets.
The year 1965was the turning point for q. Since then it has followed
an erratic downward course to its current value below 1.0. Note, however,
that q remains above the levels characteristic of the early postwar period.
In fact, the high rates of return earned by investors in NFC securities over
the 1946-55 period can be largely attributed to the recovery-of q to more
reasonable" levels.
The bottom line in Figure 2 shows q computed on an "augmented" capital
base. The augmented base includes not only inventory and real capital but also
estimates of the other assets held by NFCs, such as land, (cash and accounts rcceivable,
- 13
i C
.

- 14 -
etc. The estimation and significance of the augmented base are discussed in Section III
and in the Appendix. At this point we merely note that the choice of the base
used in calculating q does not affect its pattern over time.
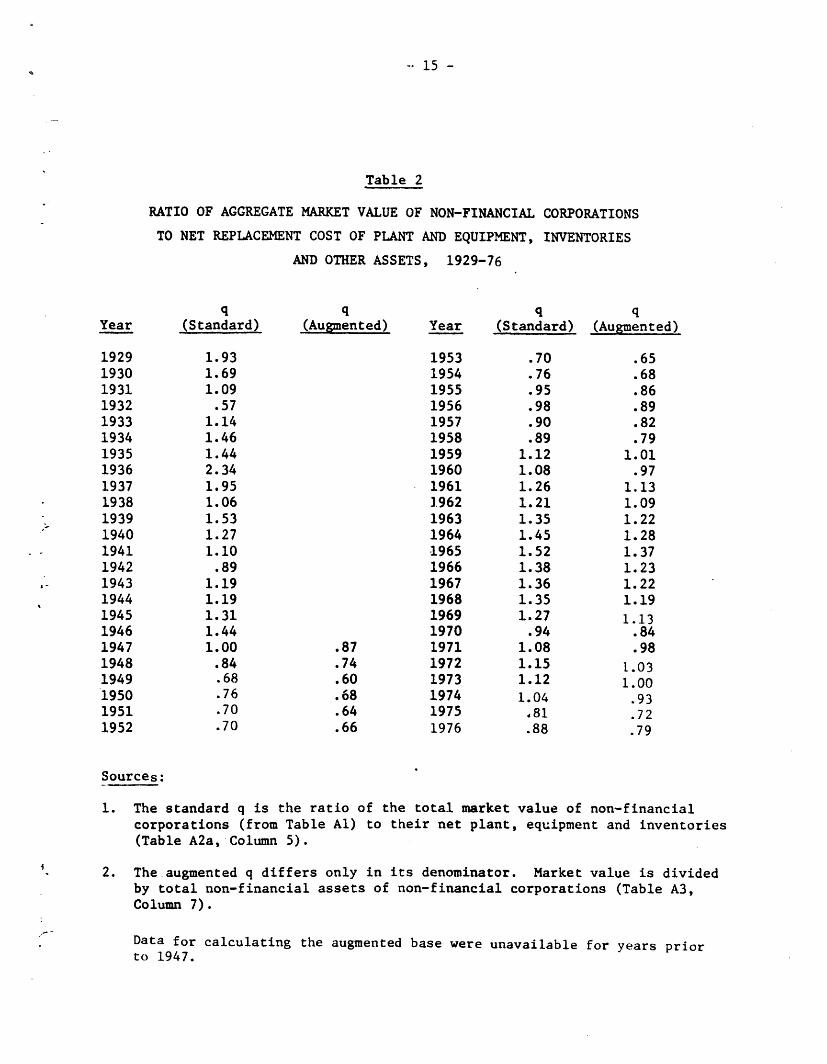
Numerical values for the standard and augmented q are given in Table
2 for 1929-76. There is one major surprise in the prewar data. q was higher
in 1936 than it has been at any time since! Its average level from 1934-39
compares favorably with the best years of the 1960s. The immediate reason is
the actual shrinkage of the net replacement cost of capital stock in the 1930s,
(see Appendix Table A2a) combined with the recovery in market value beginning
in 1934 (see Table Al). We have not identified a deeper reason. But the appar-
ent magnitude of q warns against the characterization of all of the 1930s as
a bleak time for all U.S. corporations.
Interpreting q
Despite its interest and usefulness, q is easy to misinterpret. Of
course, there are problems of aggregation: the q for all NFCs hides substan-
tial interindustry and interfirm variation. There are also difficult problems
of measurement and definition.
Consider, for example, the following statement from the 1977 Economic
13/Report of the President:-
If ... assets are valued in the market significantlyabove their replacement cost, corporations will be encour-aged to invest in new equipment and thereby create capitalgains for the owners of their securities.
Properly interpreted this statement is correct, but it is nevertheless ambiguous
if taken literally.
-- 15 -
Table 2
RATIO OF AGGREGATE MARKET VALUE OF NON-FINANCIAL CORPORATIONS
TO NET REPLACEMENT COST OF PLANT AND EQUIPMENT, INVENTORIES
AND OTHER ASSETS, 1929-76
q(Standard)
1.931.691.09.57
1.141.461.442.341.951.061.531.271.10.89
1.191.191.311.441.00.84.68.76.70.70
q(Augmented)
.87
.74
.60
.68
.64
.66
q qYear (Standard) (Augmented)
1953195419551956195719581959196019611.96219631964196519661967196819691970197119721973197419751976
.70
.76
.95
.98
.90
.891.121.081.261.211.351.451.521.381.361.351.27.94
1.081.151.121.04,81.88
.65
.68
.86
.89
.82
.791.01.97
1.131.091.221.281.371.231.221.19
1.13.84.98
1.031.00.93.72.79
1. The standard q is the ratio of the total market value of non-financialcorporations (from Table Al) to their net plant, equipment and inventories(Table A2a, Column 5).
2. The augmented q differs only in its denominator. Market value is dividedby total non-financial assets of non-financial corporations (Table A3,Column 7).
Data for calculating the augmented base were unavailable for years priorto 1947.
Year
192919301931193219331934193519361937193819391940194119421943194419451946194719481949195019511952
Sources:
4-

- 16 -
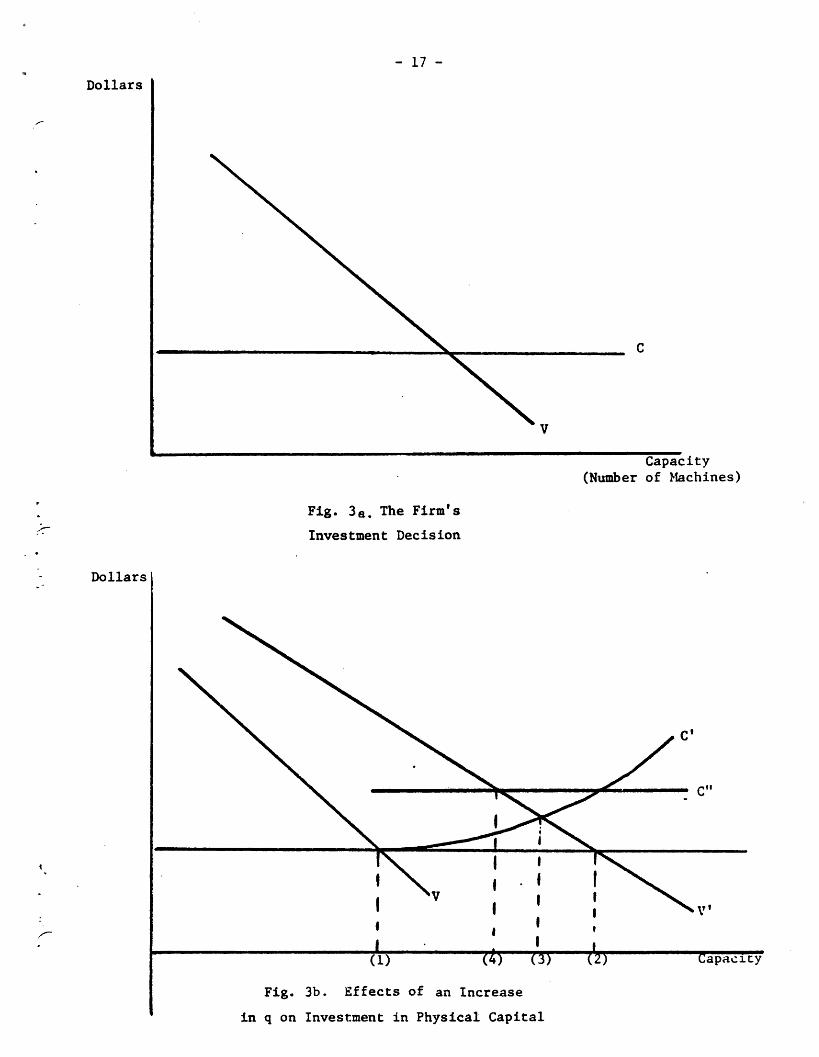
Consider how the level of an individual firm's q affects the firm's
rate of investment. Figure 3a portrays the investment decision: the firm
invests to increase capacity until V, the present value of forecasted net
cash flows generated by an additional machine, declines to C, the cost per
machine. Since all but the last machine have positive net present values,
(V - C > 0), the firm's q exceeds one. But the net present value of the
marginal machine is zero. That is, the marginal q equals exactly 1.0. The
quotation cited could be misinterpreted as a prediction that firms will con-
tinue investing so long as the average q (which is what we observe) is
greater than one.
It is true that both the average and the marginal q equal one in a long-
run equilibrium. If all industries are competitive, and if the denominator
of q correctly measures the value of all assets, including intangible ones,
then any opportunities to make investments having positive net present values
must last only for the short-run. In this sense it is true to say that a q greater than
one for some firms implies profitable investment opportunities for others.
On the other hand, an entrenched, profit-maximizing monopolist would
have a continuing supply of positive net present value investments, and therefore
would have a q greater than one even in long-run equilibrium. But not every
firm witn a nign measured q is a monopolist: intangible assets, such as value cre-
ated by expenditures on research and development, are reflected in the numera-
tor but not the denominator of q. The observed q for such firms is overstated.1 /
The quotation we cited would be unambiguously correct if it referred
not to the level of q, but to a rise in that level. An increase in q should
predict an increase in the rate of investment. Consider a firm starting at the
Ill
- 17 -
C
v
Capacity(Number of Machines)
Fig. 3a. The Firm's
Investment Decision
C'
C"
I I
i III
I
aLL J VL LI LLLV t.ULU&&L. LL& L &LLY0L%..J LLYL .AL
VI
Dollars
Dollars
l

- 18 -
optimal capacity level as determined by V = C. In Figure 3b, the investment
opportunity schedule shifts up to V', thus increasing q. Investment increases
in response, lifting capacity to a new equilibrium above the initial level 1
The actual adjustment might occur in a number of ways. If C, the cost
per machine, is constant,the firm moves directly to 2 , perhaps with a delay.
It is perhaps more realistic to assume that the firm faces an uward-sloning cost
curve C' in the short run, with the steepness of the curve depending on the
speed of adjustment. Still another possibility is that producers of machines
will, at least in the short run, capture some of the excess profits created by
the upward shift in V. This gives a cost curve C" and the equilibrium position
4 .
But we can say the following regardless of the adjustment mechanism:
because q reflects the expected profitability of corporate investment relative
to the opportunity cost of capital, an increase in q should signal increased
corporate investment.l5/
We have assumed in all of this that the denominator would always
be determined by the initial cost level C. The adjustment costs in C' would
not be picked up in capital stock as measured in the National Income Accounts,
although one could argue that they should be. For example, if firms face
adjustment costs, then the true secondhand value of all machines at the time
of Figure 3b is not C, but C' at capacity level 3. Nor would the National
Income Accounts pick up a short run increase in costs to C". The denominator
as we measure it has to be thought of as a long run net replacement cost, given
current prices and technology. It probably does not adequately reflect year-to-
year changes in the marginal cost of adding new capacity.
IlI

- 19 -
Conclusions
The first 20 postwar years were a generally favorable period for
NFCs. Investors in NFC securities earned average rates of return on
market value that seem, in hindsight, to be unusually generous. In 1946
the aggregate market value of NFC stocks and bonds was roughly
1 1/2 times net replacement cost of NFC inventory and capital stock. But
for the next 12 years the aggregate market value of NFC securities was below
the net replacement cost of physical assets held by NFCs. A sharp relative
rise in market value started in 1959. By 1965, aggregate market value was
50 percent larger than a greatly expanded base of inventory and real assets.
There was a dramatic reversal of fortune in the next decade. Real
rates of return to investors were low and often negative. Aggregate market
value fell to a level below the inventory and real asset base.
Of course we do not know why all this happened. Values
observed in capital markets show us only the end result of a complicated
process. Insights into earlier stages of the process must come from other
measures of profitability.
- 20 -
III. RATES OF RETURN ON CAPITAL STOCK
In this section we examine NFC profitability
from a different point of view. In Section II we
derived estimates of income and value from capital market data. The esti-
mates in this section are based on annual measures of asset value and
operating income developed by the Bureau of Economic Analysis of the De-
partment of Commerce as part of the National Income and Product Accounts (NIPA).
In effect we are moving from capital market measures of return to measures
closer to the book or accounting Pmeasures utilized by business firms.
The capital market measures are sufficient to tell us how well
NFCs have fared, but they give no clue to the reasons for good or bad per-
formance. For example, we have no way of inferring from market value data
whether the period of unusually high market values in the mid-1960 was
due to high operating profits, to low capitalization rates for NFC securi-
ties, or to a combination of both. The interpretation of capital
market data requires information from other sources.
Many measures of rate of return can be derived from NIPA data.
The one we emphasize most is the rate of return on capital stock (ROC), de-
fined as the ratio of NFC operating income, i.e., profits plus interest, to
the net replacement cost of NFC depreciable capital stock and inventories.
Our estimates are based on newly revised series prepared by the Bureau of
Economic Analysis.16/
Following other investigators, we interpret ROC as the real rate
of return on NFC capital stock. Of course, such an interpretation rests on
a number of assumptions, some of which are not strictly true. Firms must
III
1 -
invest in other assets besides inventories and plant and equipment, for
example. (Later in this section we examine ROC computed on an
"augmented" investment base.) Also, operating income equals real income
only if there are no real holding gains on capital stock and inventories: that
is,: only if the reproduction costs of capital stock and inventories rise
at exactly the same rate as prices generally. (Again, later in this section,
we adjust ROC for holding gains or losses.)
Nevertheless, operating income is an important indicator of cor-
porate performance and a decent first approximation of real operating income.
Moreover, our conclusions are insensitive to the exact definition of income
or ROC.
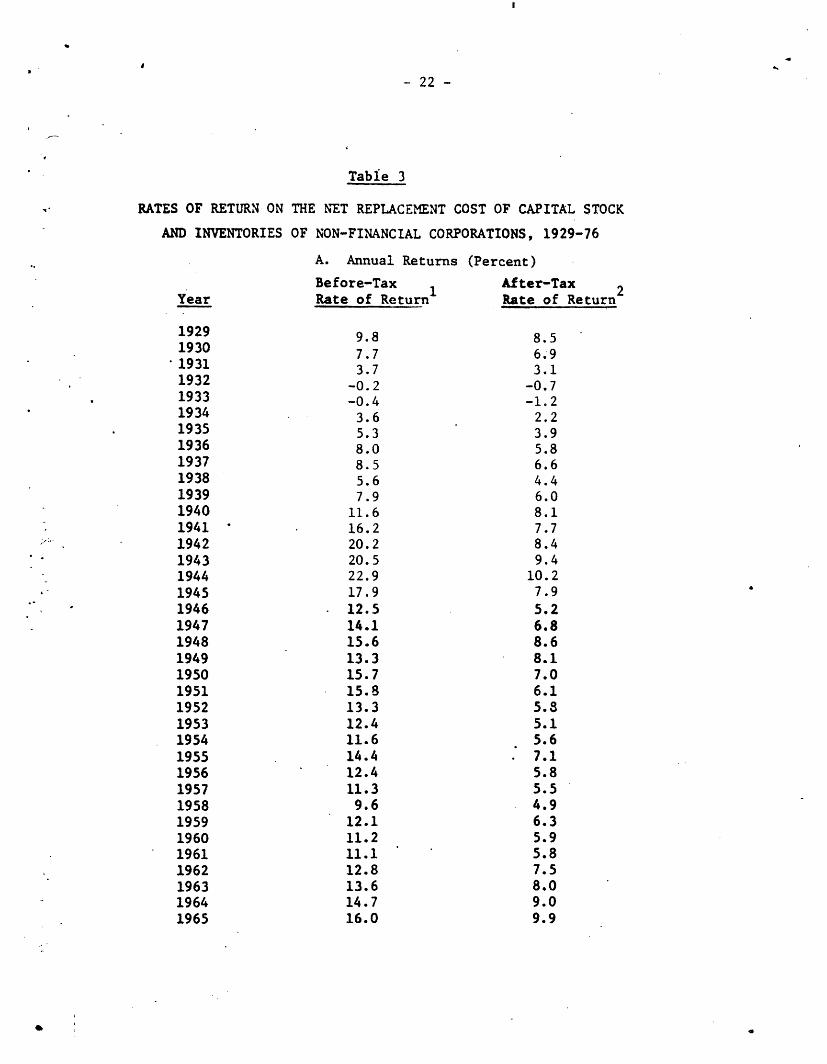
Before-Tax Rates of Return
The first column of Table 3 presents before-tax ROCs for the NFC
sector for the period 1929-76. Annual data are in Part A and five-year
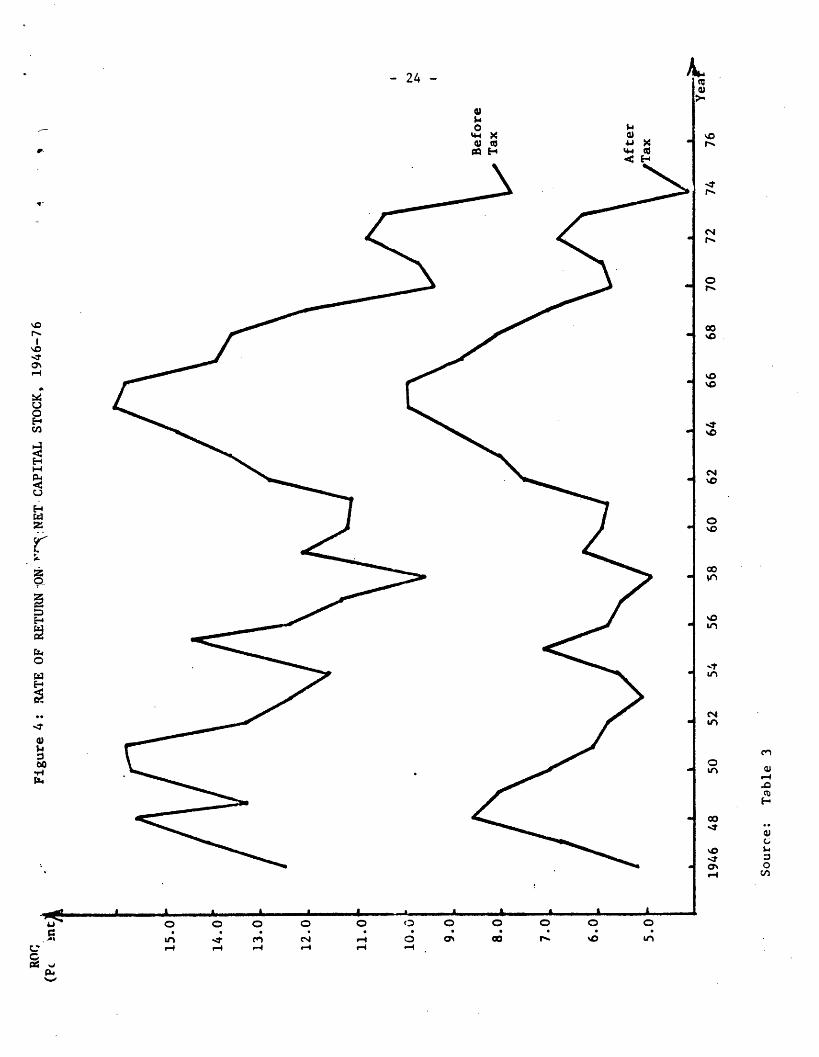
averages in Part B. ROCs for the postwar period are plotted in Figure 4.
Three distinct periods call be noted in the postwar results. From
1946 through 1960, the before-tax R()C tended to decline, but with sharp year-
to-year fluctuations. It averaged 13.0 percent. There was an upward burst
of profitability in the first half of the 1960s and a decline in the second
half. The average for the period 1961-70 was 13.3 percent. Finally for the
short period 1971-76, ROC averaged .4 percent, noticeably lower than the
other two periods.
The same pattern over timer is evident in the five-year averages in
Part B. We have a cyclical series in which most recent years run well below the
- 22 -
Table 3
RATES OF RETURN ON THE NET REPLACEMENT COST OF CAPITAL STOCK
AND INVENTORIES OF NON-FINANCIAL CORPORATIONS, 1929-76
A. Annual Returns (Percent)
Before-Tax After-TaxYear Rate of Return Rate of Return
1929 9.8 8.51930 7.7 6.91931*1931 3.7 3.1
-0.2 -0.71933 -0.4 -1.21934 3.6 2.21935 5.3 3.91936 8.0 5.81937 8.5 6.61938 5.6 4.41939 7.9 6.01940 11.6 8.11941 ' 16.2 7.71942 20.2 8.41943 20.5 9.41944 22.9 10.21945 17.9 7.91946 12.5 5.21947 14.1 6.81948 15.6 8.61949 13.3 8.11950 15.7 7.01951 15.8 6.11952 13.3 5.81953 12.4 5.11954 11.6 5.61955 14.4 . 7.11956 12.4 5.81957 11.3 5.51958 9.6 4.91959 12.1 6.31960 11.2 5.91961 11.1 5.81962 12.8 7.51963 13.6 8.01964 14.7 9.01965 16.0 9.9
- 23 -
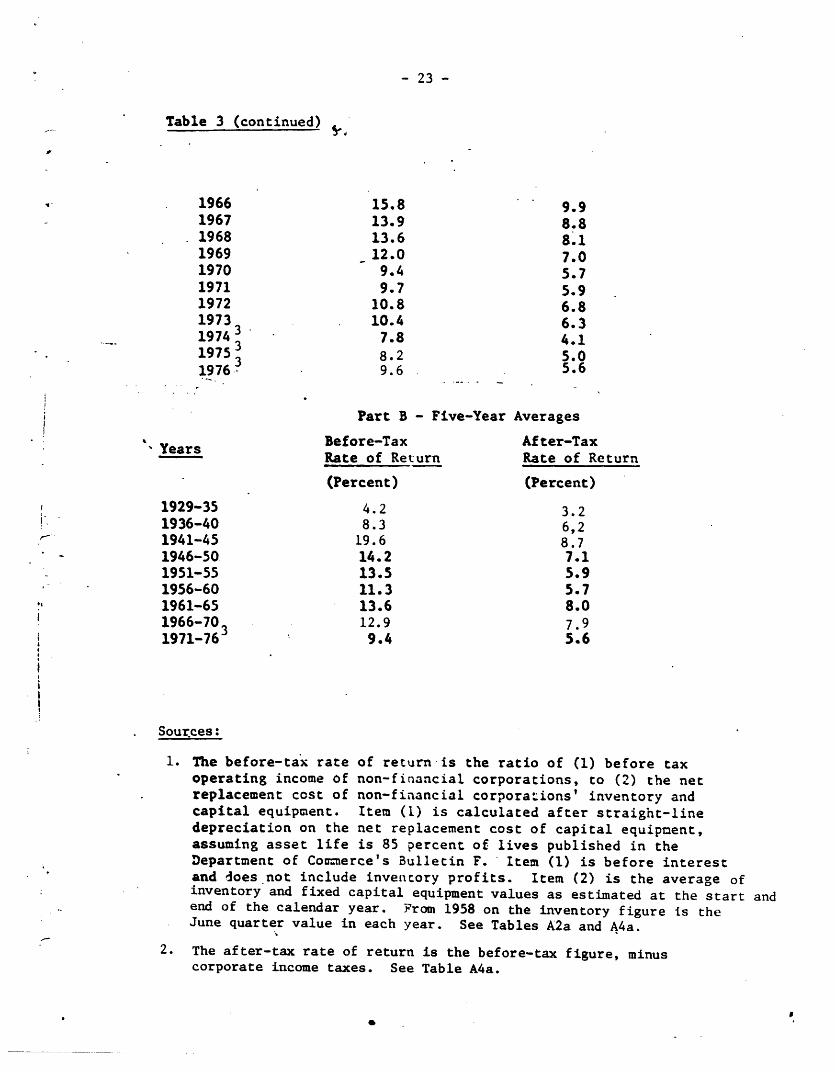
Table 3 (continued).-
15.813.913.612.09.49.7
10.810.47.88.29.6
9.98.88.17.05.75.96.86.34.15.05.6
Part B - Five-Year Averages
Before-TaxRate of Return
(Percent)
4.28.3
19.614.213.511.313.612.99.4
After-TaxRate of Return
(Percent)
3.26,28.77.15.95.78.07.95.6
Sources:
1. The before-tax rate of return is the ratio of (1) before taxoperating income of non-financial corporations, to (2) the netreplacement cost of non-financial corporations' inventory andcapital equipment. Item (1) is calculated after straight-linedepreciation on the net replacement cost of capital equipment,assuming asset life is 85 percent of lives published in theDepartment of Co=merce's Bulletin F. Item (1) is before interestand does not include inventory profits. Item (2) is the average ofinventory and fixed capital equipment values as estimated at the start andend of the calendar year. From 1958 on the inventory figure is theJune quarter value in each year. See Tables A2a and A4a.
2. The after-tax rate of return is the before-tax figure, minuscorporate income taxes. See Table A4a.
a
19661967
. 19681969197019711972197319743197531976
' Years
1929-351936-401941-451946-501951-551956-601961-651966-701971-763
m
ii
II
i

- 23a -
3. NIPA estimates are usually revised several times. New figuresfor 1974-76 were published after this study was completed.(Survey of Current Business, July, 1977). But as the followingcomparison shows, the changes do not affect our conclusions.
Year After-Tax ROC (Percent)
July, 1977This Study Revision
1974 4.1 4.11975 5.0 5.41976 5.6 5.8
Average for1971-1976 5.6
- 24 -
05$4044X
g E
w" X44
l
0 0 0 0 0 'D
A -; C; 0;C-4 r-4 -4 r-
0 0 0 0 0
1-
Co
0co%C
"D%O
(%4
'I\0
Un
cn
U, a
aO .0
mco
ON 0
_ __
I
a

- 25 -
average of the rest of the postwar period.
Was the decline from the eak of the mid-1960s so sharp as to carry
the before-tax ROC to a new low level? It appears so. But this result cannot
be vigorously defended. It is based on a short run of years, and may be a
transitory or cyclical phenomenon. Later in this section we make a more careful
attempt to extract the trend, if there is any, from the before-tax ROCs.
After-Tax Rates of Return
Figure 4 and Table 3 also present after-tax ROCs. The after-tax
ROC differs from its before-tax counterpart only in that corporate income taxes
are subtracted from operating income.
It is after-tax income that counts in the determination of security
prices. The after-tax ROC is the "book" counterpart to R, the market rate of return
on all NFC securities.
The after-tax ROC is perhaps more pertinent than its before-tax coun-
terpart as evidence in the current debate on profitability. It measures the
actual reward to suppliers of capital, or, as some view it, the amount available
to finance new investment. Has the after-tax ROC tended to decline?
The three episodes observed for the before-tax ROC also characterize
the after-tax figure. There were wide fluctuations around a ean of 6.3 percent
from 1946-1960, then a sharp rise and fall in the 1960's, averaging 8.0 percent.
The average was only 5.6 percent for the period 1971-76,17
The low after-tax ROCs for the most recent half dozen veyrq are
not unique, however. The five-year averages for each half of the 1950s ran at
equally low levels (see part B of Table 3).
- 26 -
The most unusual aspect of Table 3 and Figure 4 are the high rates of
return over most of the 1960s.
The historical record, then,does not appear to support the view that
recent after-tax ROCs have been unprecedentedly low. In this respect there
seems to be a difference between before- and after-tax ROC. The difference is
pointed up by the five-year averages in Table 3. We have already noted the essen-
tial similarity in level of the after-tax ROCs averaged for the 1950s and for
the most recent years. The before-tax ROC, however, was considerably higher in
the 1950s than in the 1970s.
Later in the paper we undertake a more careful analysis of trends in
the before- and after-tax ROCs.
NFC Income Taxes
The narrowing spread between before-and-after tax ROC's since the
end of the War is due to a downward drift in effective corporate tax rates.
Although legislated rates of the Federal Corporation income tax (by far the
largest component of NFC income tax liability) were substantially the same
from 1951 through 1976 (see the first column of Table 4) and
state corporation income tax rates moved up over these years, the effective
tax rate on NFC operating income has tended to decline (column 2 of Table 4).
Effective rates started to move down in the early 1960s, and the decline
has tended to persist, although not without interruption.
Some of the decline in effective rates is due to purposeful government
- 27 -
Table 4
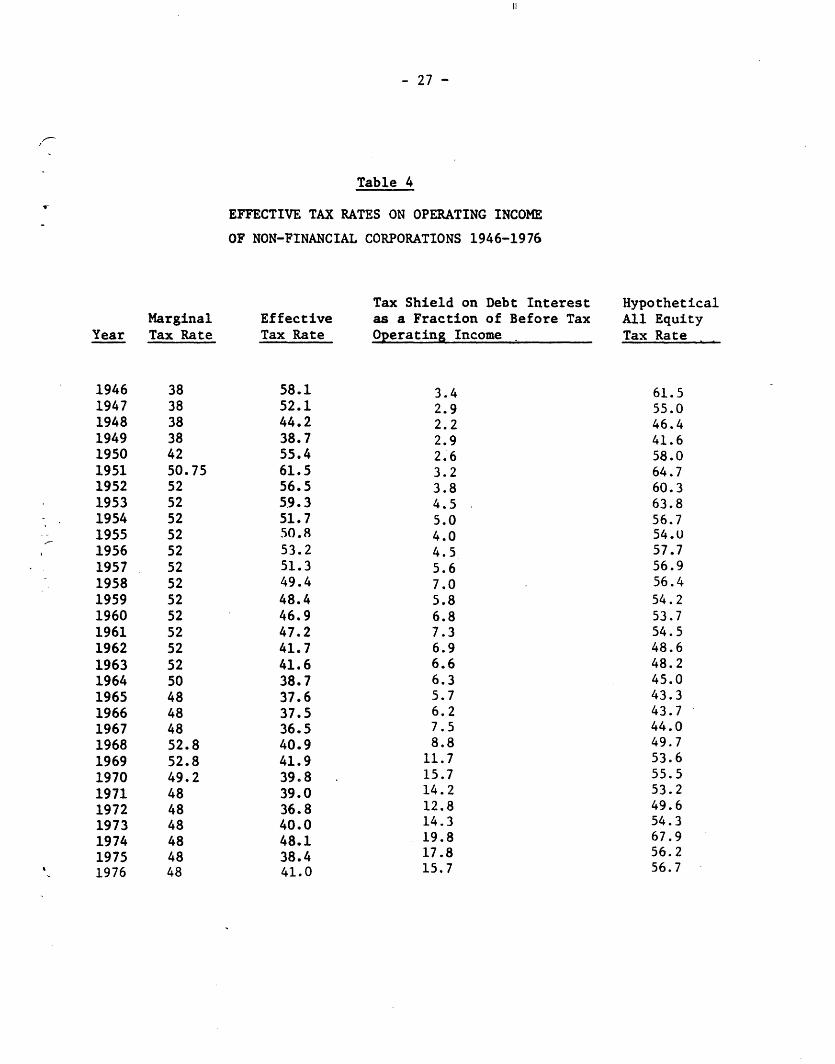
EFFECTIVE TAX RATES ON OPERATING INCOME
OF NON-FINANCIAL CORPORATIONS 1946-1976
MarginalYear Tax Rate
EffectiveTax Rate
Tax Shield on Debt Interestas a Fraction of Before TaxOperating Income
HypotheticalAll EquityTax Rate
1946194719481949195019511952195319541955195619571958195919601961196219631964196519661967196819691970197119721973197419751976
383838384250.755252525252525252525252525048484852.852.849.2484848484848
58.152.144.238.755.461.556.559.351.750.853.251.349.448.446.947.241.741.638.737.637.536.540.941.939.839.036.840.048.138.441.0
3.42.92.22.92.63.23.84.55.04.04.55.67.05.86.87.36.96.66.35.76.27.58.8
11.715.714.212.814.319.817.815.7
61.555.046.441.658.064.760.363.856.754.057.756.956.454.253.754.548.648.245.043.343.744.049.753.655.553.249.654.367.956.256.7
V_

- 27a -
Table 4 (continued)
Sources: Table 3 and Survey of Current Business, various issues.Marginal tax rates taken from Pechman [24], p. 259.
Note: In computing the Tax Shield we multiplied the sum of NetInterest (column 3 of Table A4a) and imputed interestreceived by Nonfinancial Corporate Business (line 39 ofTable 8.2 in the National Income and Product Accounts ofthe United States, 1929-74, Statistical Tables and theSurvey of Current Business, July, 1977) by the marginalrate of corporate income tax. Adding back imputedinterest received gave us the total of net monetaryinterest which is the relevant total for the size of thedebt shield: We are grateful to Eugene Fama and NicholasGonedes for this clarification. However, the net interestcomponent of operating income as it appears in the numeratorof our ROC calculation is properly the net interest entryin Table A4a.
Our estimate tends to overstate the debt shield and itseffect in moderating effective rates of corporate tax tothe extent that rates lower than the marginal rate ofcorporate tax would have applied had interest beentaxable.

- 28 -
policies, for example. the introduction of accelerated depreciation, the tendency
to shorten depreciable lives for tax purposes, and permitting LIFO inventory
accounting for tax purposes, and the investment tax credit. But the major part
of the decline of effective rates in recent years reflects NFC financing policy
and rising nominal interest rates.
The third column of Table 4 shows the growing importance of the interest
tax shield, and the role it plays in maintaining the after-tax profitability
of corporations. We are now at the point where the deductibility of
interest charges from taxable income reduces the effective tax rate on
operating income by 15 to 20 percentage points!
The final column of Table 4 suggests what the effective rate of
corporate tax would have been in the absence of the tax shield provided by
the NFC debt, but with everything else unchanged. There is no discernable
downward drift in this hypothetical all-equity tax rate. This suggests
that the tax incentives introduced over the postwar period served
generally to keep the corporate income tax levied on nominal income
from becoming in increasing
- 29 -
burden on real operating income, while the growing importance of the debt
shield acted to lower the effective rate on real operating income. Only
for the stretch of years from 1962 through 1966,when the debt interest shield
was a constant fraction of real operating income and the effective rate
fell, can it be concluded that the tax incentives were sufficiently
powerful to outweigh the upward pressure on effective rates
created by taxation of nominal capital gains on
inventory and plant and equipment. Herein lies one strand of the explantion
for the rise of profitability in the early 1960s. Price
stability over this period kept nominal holding gains low, thus permitting
the tax incentives to show up in lower effective rates of tax on real income.
Although the effective tax rate has drifted downward
in the postwar period, that trend is only part of the story. Bursts of
inflation have sent corporate income tax liabilities up and after-tax
profitability down . The results for 1974
are particularly dramatic. Hankin has found a significant negative
correlation in the post-war period between the after-tax ROC and the rate of
inflation, after adjustment for a time trend and the rate of change in GNP.
There was a strong positive link between inflation and the effective tax
rate, but no significant association between inflation and before-tax
ROC. 1

- 30 -
Alternative Measures
Although we believe the estimates of ROC presented above will be
widely accepted as reasonable and pertinent measures of profitability, many
other measures are possible. Even with the same underlying data base,
alternative assumptions about depreciation patterns and service lives
give different estimates of ROC. Also, different or expanded data
bases could be employed. A definitive case cannot be made in favor of the
particular coverage and assumptions on which Table 3 is based. Therefore
we examined a number of additional ROC estimates to check that the
patterns we have found persist under alternative definitions.
Different depreciation patterns and service lives. In deriving
Table 3 we used the standard NIPA estimates of capital stock and deprecia-
tion in current dollars. These estimates assume straight-line depreciation
and service lives equal to 85 percent of those given in the Internal Revenue
Service's Bulletin F.
The NIPA data base can be used to develop a number of alterna-
tive estimates. From this set we have chosen three. One assumes a different
time pattern of depreciation -- double-declining balance. For another,
different service lives are postulated -- 100 percent of Bulletin F up to
1940, a gradual decline to 75 percent from 1940 to 1960, and continuing
at 75 percent from 1960 on. And for the third, "historical" values and costs
are used.
These changes in underlying assumptions result in very different
levels for operating income and capital stock. For example, for mid-year 1970,
- 31 -
the current net value of NFC plant and equipment is S540 billion
under the standard NIPA assumption; with double-declining balance depre-
ciation it is $446 billion. Likewise in that year, the numerator in the after-tax
ROC calculation -- after-tax profit plus interest -- is $41.3 billion in the
"standard" case, and $36.6 billion with double declining balance deprecia-
tion. These dramatic differences do not carry through to the ROC, however.
First, the denominator of the ROC calculation includes inventories as well
as depreciable capital. Inventory is the same under all alternatives, so
the denominators do not differ as much as the depreciable asset estimates tktcl
alone. Second, differences in both numerator and denominator are in the
same direction and tend to offset. The ROCs as calculated, therefore,
differ only slightly -- 5.7 percent for the standard case vs. 5.8 percent
with double-declining balance depreciation. ROCs both before and after
tax under the standard case and two alternative sets of assumptions
appear in the first three columns of Table 5.19/
Clearly, the general pattern of ROC behavior over time for the
standard case also characterizes the series for double declining balance
depreciation and changing depreciable lives. Double declining balance gives
ROCs slightly higher than "standard," changing depreciable lives slightly
lower. But all three have the same general configuration over time.
Among them these three encompass the range of all reasonable
possibilities. The standard case comes out in about the middle.
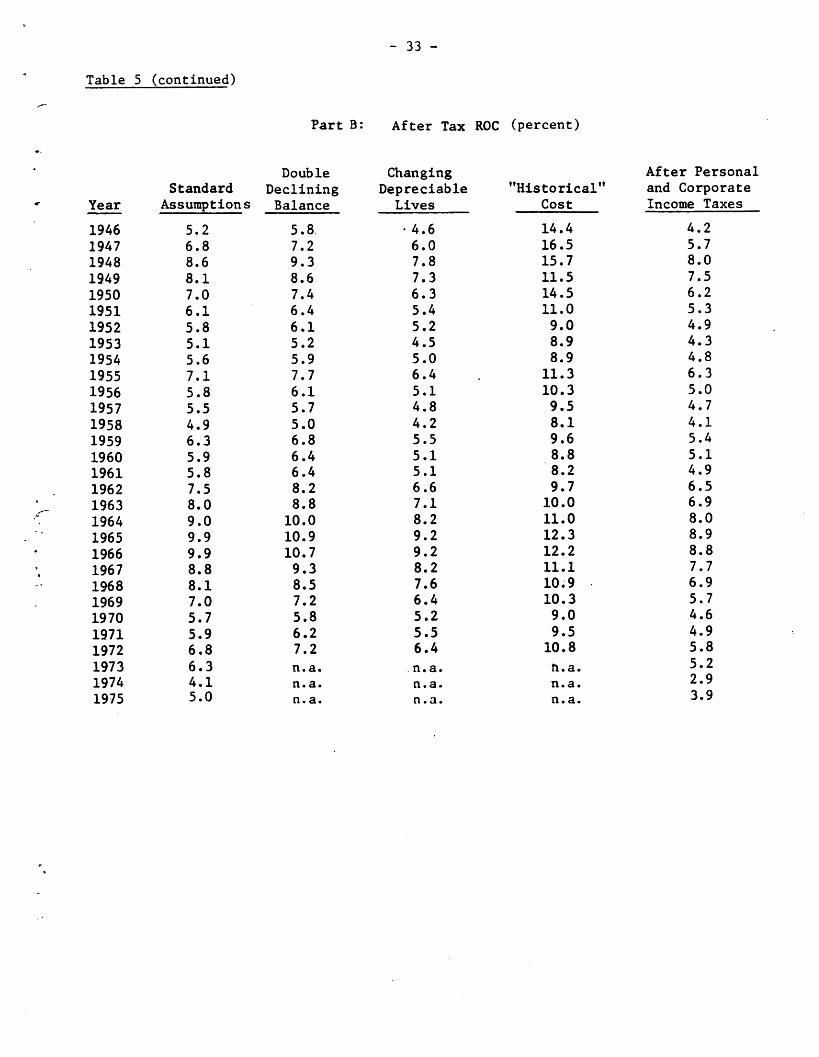
Historical Cost Accounting. The ROC measures given in the
fourth column of Table 5 are intended to approximate NFC profitability as

- 32 -
Table 5
ALTERNATIVE ESTIMATES OF RATES OF RETURNON NET INVESTMENT IN PLANT, EQUIPMENT, AND
INVENTORIES OF NON-FINANCIAL CORPORATIONS, 1946-72
Part A: Before-Tax ROC (percent)
ChangingStandard Double-Declining Depreciable "Historical"
Year Assumptions Balance Lives Cost
1946 12.5 14.2 11.1 23.5
1947 14.1 15.7 12.6 26.1
1948 15.6 17.2 14.1 24.7
1949 13.3 14.5 11.9 18.1
1950 15.7 17.3 14.1 25.5
1951 15.8 17.4 14.3 23.2
1952 13.3 14.6 12.0 18.4
1953 12.4 13.7 11.3 18.0
1954 11.6 12.8 10.6 16.2
1955 14.4 16.1 13.2 20.1
1956 12.4 13.7 11.3 18.4
1957 11.3 12.3 10.2 16.5
1958 9.6 10.5 8.6 13.8
1959 12.1 13.5 11.0 19.3
1960 11.2 12.5 10.2 14.9
1961 11.1 12.5 10.1 14.2
1962 12.8 14.4 11.7 15.7
1963 13.6 15.4 12.7 15.2
1964 14.7 16.5 13.8 16.8
1965 16.0 17.8 15.1 18.8
1966 15.8 17.5 15.1 18.7
1967 13.9 15.1 13.3 16.7
1968 13.6 14.9 13.2 17.2
1969 12.0 13.0 11.5 16.0
1970 9.4 10.1 9.0 13.4
1971 9.7 10.6 9.4 14.0
1972 10.8 11.8 10.5 15.5
111
- 33 -
Table 5 (continued)
Part B: After Tax ROC (percent)
Year
194619471948194919501951195219531954195519561957195819591960196119621963196419651966196719681969197019711972197319741975
DoubleStandard Declining
Assumptions Balance
5.26.88.68.17.06.15.85.15.67.15.85.54.96.35.95.87.58.09.09.99.98.88.17.05.75.96.86.34.15.0
5.87.29.38.67.46.46.15.25.97.76.15.75.06.86.46.48.28.8
10.010.910.79.38.57.25.86.27.2n.a.n. a.n.a.
ChangingDepreciable
Lives
.4.66.07.87.36.35.45.24.55.06.45.14.84.25.55.15.16.67.18.29.29.28.27.66.45.25.56.4n.a.n.a.n.a.
"Historical"Cost
14.416.515.711.514.511.09.08.98.911.310.39.58.19.68.88.29.7
10.011.012.312.211.110.910.39.09.510.8
fn.a.
n.a.n.a.
After Personaland CorporateIncome Taxes
4.25.78.07.56.25.34.94.34.86.35.04.74.15.45.14.96.56.98.08.98.87.76.95.74.64.95.85.22.93.9
- 34 -
Table 5 (continued)
Sources:
Part A
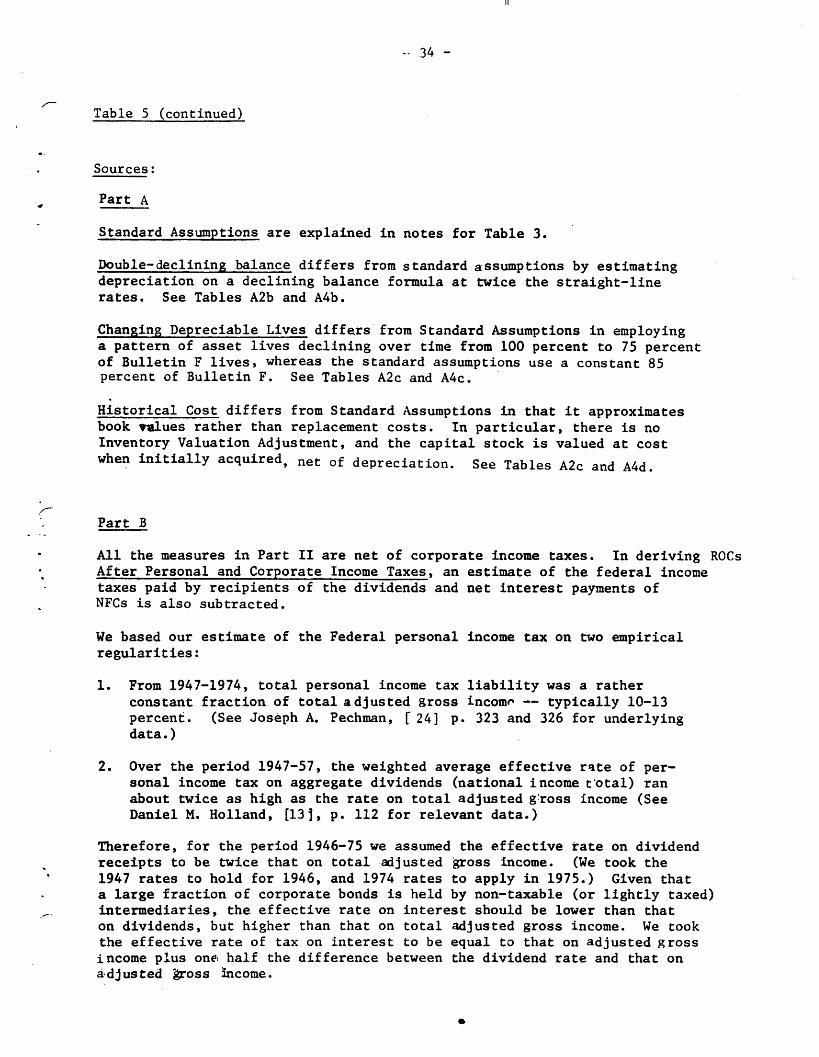
Standard Assumptions are explained in notes for Table 3.
Double-declining balance differs from standard assumptions by estimatingdepreciation on a declining balance formula at twice the straight-linerates. See Tables A2b and A4b.
Changing Depreciable Lives differs from Standard Assumptions in employinga pattern of asset lives declining over time from 100 percent to 75 percentof Bulletin F lives, whereas the standard assumptions use a constant 85percent of Bulletin F. See Tables A2c and A4c.
Historical Cost differs from Standard Assumptions in that it approximatesbook values rather than replacement costs. In particular, there is noInventory Valuation Adjustment, and the capital stock is valued at costwhen initially acquired, net of depreciation. See Tables A2c and A4d.
Part B
All the measures in Part II are net of corporate income taxes. In deriving ROCsAfter Personal and Corporate Income Taxes, an estimate of the federal incometaxes paid by recipients of the dividends and net interest payments ofNFCs is also subtracted.
We based our estimate of the Federal personal income tax on two empiricalregularities:
1. From 1947-1974, total personal income tax liability was a ratherconstant fraction of total adjusted gross income -- typically 10-13percent. (See Joseph A. Pechman, [ 24] p. 323 and 326 for underlyingdata.)
2. Over the period 1947-57, the weighted average effective rate of per-sonal income tax on aggregate dividends (national income total) ranabout twice as high as the rate on total adjusted gross income (SeeDaniel M. Holland, [131, p. 112 for relevant data.)
Therefore, for the period 1946-75 we assumed the effective rate on dividendreceipts to be twice that on total adjusted gross income. (We took the1947 rates to hold for 1946, and 1974 rates to apply in 1975.) Given thata large fraction of corporate bonds is held by non-taxable (or lightly taxed)intermediaries, the effective rate on interest should be lower than thaton dividends, but higher than that on total adjusted gross income. We tookthe effective rate of tax on interest to be equal to that on adjusted grossincome plus one, half the difference between the dividend rate and that onadjusted ross income.
- 35 -
Table 5 (continued)
Further personal income tax could be paid in a later year on the real-ized capital gains due to the earnings retained in a given year. Ourestimates take no account of this, but. the distortion is likely to be quitesmall. A good fraction of corporate earnings "belong" to non-taxableowners, and most of potentially taxable capital gains do not appear to betaxed. See Bailey [2], p. 38.

- 36 -
it would be measured under currently accepted accounting conventions. This
historical cost series includes inventory profits in income, measures de-
preciation on an historical cost basis, and uses the book value (that is,
the historical cost of acquisition) of the capital stock. The
numerator of the historical cost ROC calculation is overstated because inventory
profits are included and depreciation is understated. The denominator is
understated because the historical acquisition cost of capital stock is
below the current cost of replacement. Thus the historical cost ROC over-
states real profitability.
The historical cost ROC is not a reasonable measure of real
return. Nor can anything of substance be inferred from its behavior over
time. But it is interesting nevertheless, because it shows the rough magni-
20'tude of error in measuring NFC profitability from corporate accounts.-'
Note, too, that the historical cost ROC comes closest to the figures often
casually cited as normal rates of return on corporate investment--about 20
percent before tax and 10 percent after tax.
Effects of Personal Income Taxes. All the ROCs reported in PartB
of Table 5 are defined after corporate income taxes. For the last column we have
also subtracted an estimate of the personal income tax due from recipients of
the net interest and dividends paid by NFCs. The estimating procedure,
explained in the Notes to Table 5, simply approximates the additional tax.
For our purposes it suffices, however. Although the after-tax ROC in the last
column is, of course, lower, the pattern over time is similar to the pattern
21/shown by other ROC measures.-
Augmented Capital Stock. The ROC estimates presented thus far
compare NFC operating income to the net reproduction cost of plant, equipment
- 37 -
and inventory. But business firms also hold stocks of cash and accounts
receivable, and invest in land and various other assets. We estimated the
aggregate value of these other items from the Treasury Department's Statistics
22/of Income.- Table 6 shows ROCs computed on this augmented base. These
ROCs are uniformly lower than those presented in Table 3, because the capital
base is increased. The ratio of the augmented to the standard base has no clear
trend, however, so the pattern over time of the ROCs in Table 6 is about the
same as in Table 3.23/ The 1977 Economic Report of the President provides
24/an augmented base estimated from a different source.-2 For the period 1960-75,
the after-tax ROC computed on our base runs about 10 percent lower than on this
alternative base, but the pattern over time is the same.
Holding Gains on Capital Stock and Inventory. As we have pointed
out, our measures of ROC include only operating income. That is, they exclude
real holding gains, if any, on NFC capital stock and inventories. This
is an accurate assumption if the net reproduction cost of capital stock and
25/inventories increases at exactly the same rate as prices generally.5/
Of course holding gains and losses are automatically included in
rates of return measured from capital market data. But they are more difficult
to extract from the National Income and Product Accounts (NIPA).
An approximation can be made if the NIPA figures for net replacement
costs of capital stock and inventories are assumed to be reliable estimates
of these assets' actual market values. Our procedure was as follows.
1. Net replacement cost of NFC capital stock is given both
in current and constant dollars. The difference between
the rate of increase of these two series is the rate of
increase in the nominal value of a typical collection
of the capital goods held by NFC's. That rate of increase
was converted to real terms. (See Appendix Table A6.)
2. The Department of Commerce publishes an inventory valuation

- 38 -
Table 6
RATES OF RETURN ON AUGMENTED BASE FOR
NON-FINANCIAL CORPORATIONS, 1947-75
Before-TaxRate of Return
After-TaxRate of Return
194719481949195019511952195319541955195619571958195919601961196219631964196519661967196819691970197119721973197419751976
12.313.711.613.814.112.311.510.513.011.310.28.610.910.110.011.512.313.014.414.112.412.110.78.58.89.69.37.07.38.5
5.97.77.16.15.45.34.75.16.45.35.04.35.65.45.36.77.28.08.98.87.97.26.25.15.45.45.63.64.55.0
Sources:
Calculated as in Table 3, except that the capital stock is defined asincluding all non-financial assets. The denominator was taken from
Table A4, Column 7, rather than from Table A2.
Year
III
I

- 39 -
adjustment (IVA) for NFCs. The IVA is an estimate of
nominal holding gains on NFC inventories. We calculated
annual estimates of the nominal holding gain that would
be just sufficient to offset inflation. That figure
is then subtracted from the corresponding year's IVA to
obtain an estimated real holding gain (see Appendix Table
A7).
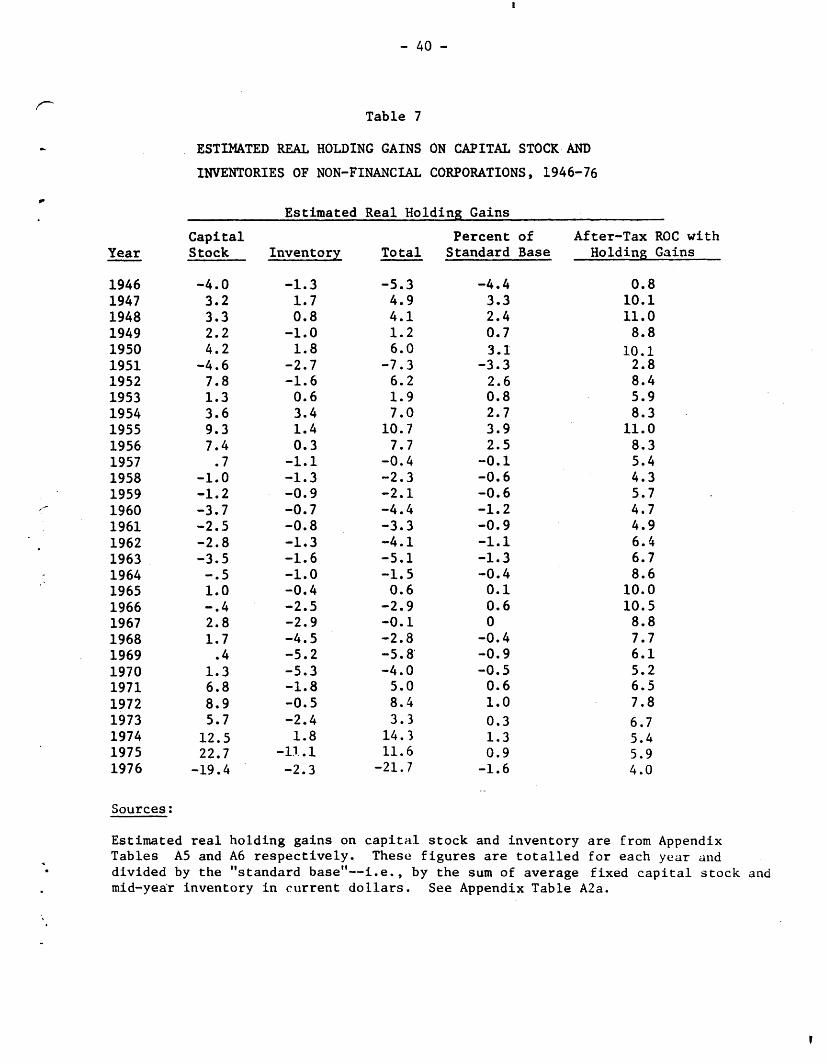
The results are displayed in Table 7. Although the average
holding gain for the entire 1946-76 period was quite small (only 0.3
percent), there were substantial gains and losses in particular periods.
ROCs with and without holding gains are compared in Figure 4.
Including holding gains increases the volatility of the ROCs, expecially
in the 1940s and 1950s. The volatility of the rates of return actually
realized by investors was still greater however--compare Tables 1 and 7.
The decline in NFC profitability since the mid-1960s is less severe
but still apparent when real holding gains are included in ROC. It becomes
much more difficult to make sense of the 1946-65 period. We are not con-
vinced that year-to-year fluctuations in real holding gains measured from
26/the NIPA have much significance for the issues considered in this essay.26
Summary. Our findings do not depend on a particular definition
of income or capital stock. A picture substantially the same as that provided
by our "standard" ROC measure emerges from a number of alternative measures
as well. In discussing and interpreting our findings, therefore, we can
- 40 -
Table 7
ESTIMATED REAL HOLDING GAINS ON CAPITAL STOCK AND
INVENTORIES OF NON-FINANCIAL CORPORATIONS, 1946-76
Estimated Real Holding Gains
Capital Percent of After-Tax ROC withYear Stock Inventory Total Standard Base Holding Gains
1946 -4.0 -1.3 -5.3 -4.4 0.81947 3.2 1.7 4.9 3.3 10.11948 3.3 0.8 4.1 2.4 11.01949 2.2 -1.0 1.2 0.7 8.81950 4.2 1.8 6.0 3.1 10.11951 -4.6 -2.7 -7.3 -3.3 2.81952 7.8 -1.6 6.2 2.6 8.41953 1.3 0.6 1.9 0.8 5.91954 3.6 3.4 7.0 2.7 8.31955 9.3 1.4 10.7 3.9 11.01956 7.4 0.3 7.7 2.5 8.31957 .7 -1.1 -0.4 -0.1 5.41958 -1.0 -1.3 -2.3 -0.6 4.31959 -1.2 -0.9 -2.1 -0.6 5.71960 -3.7 -0.7 -4.4 -1.2 4.71961 -2.5 -0.8 -3.3 -0.9 4.91962 -2.8 -1.3 -4.1 -1.1 6.41963 -3.5 -1.6 -5.1 -1.3 6.71964 -. 5 -1.0 -1.5 -0.4 8.61965 1.0 -0.4 0.6 0.1 10.01966 -.4 -2.5 -2.9 0.6 10.51967 2.8 -2.9 -0.1 0 8.81968 1.7 -4.5 -2.8 -0.4 7.71969 .4 -5.2 -5.8 -0.9 6.11970 1.3 -5.3 -4.0 -0.5 5.21971 6.8 -1.8 5.0 0.6 6.5
1972 8.9 -0.5 8.4 1.0 7.8
1973 5.7 -2.4 3.3 0.3 6.71974 12.5 1.8 14.3 1.3 5.41975 22.7 -11.1 11.6 0.9 5.91976 -19.4 -2.3 -21.7 -1.6 4.0
Sources:
Estimated real holding gains on capital stock and inventory are from AppendixTables A5 and A6 respectively. These figures are totalled for each year anddivided by the "standard base"--i.e., by the sum of average fixed capital stock andmid-year inventory in current dollars. See Appendix Table A2a.
I
- 41 -
concentrate on the standard case.
Couparilln Alternative Profitability Measures
In Table 8 we list means and standard deviations for the ROC series developed
in our study, and for R, the real rate of return earned by investors in
NFCs. Comments on these alternative measures follow.
1. The standard' after-tax ROC was 6.3 percent for
1929-' . It was virtually the same (6.7 percent) for the 30 years since
the end of World War II. (See lines 1 and 2 in Table 8.)
2. Similarly, R, the real return earned by investors, averaged
substantially the same for the post-war years as for the longer time period.
(Lines 11 and 12.)
3. Morover, both measures of return are
of the same order of magnitude (Lines 1, 2, 4, 11, 12 and 13). It is comforting,
but not surprising, to end up with this result. In the long run a congruence
between the average returns on corporate securities and on corporate capital investment
is to be expected. In shorter periods the two returns can be
widely divergent, as the different standard deviations suggest.
4. The most appropriate series for comparison with R is the
after-tax ROC for the Augmented Base (Lines 5 and 13). The important point
is that the two series have averages of the same order of magnitude.

- 42 -
TABLE 8
Mean Values and Standard Deviations
For Selected Rates of Return Series
(percent per year)
1. ROC(AT):
2. ROC(AT):
3. ROC(AT):
4. ROC(AT):
5. ROC(AT):
6. ROC(AT):
?7. ROC(AT):
8. ROC(AT):
9. ROC(AT):
10. ROC(AT):
Standard Case,,1929-1976
Standard Case, 1946-1976
After Corporate and Personal Taxes,1946-1975
Standard Case, 1947-197h
Augmented Base, 1947-1974
Standard Case, 1946-1972
Double-Declining Balance, 1946-1972
Changing Depreciable Lives,1946-1972
"Historical Cost," 1946-1972
Standard Case with Holding Gains,1946-1976
Mean(Kxent)
6.34
6.68
Standard Deviationof Series(Percent per year)
2.33
1.50
5.77
6.73
6.00
6.90
7.36
1.51
1.50
1.33
1.46
1.66
6.22
10.85
6.99
1.40
2.24
2.48
11. Real Return Earned by Investors in NFC's,1929-1976
12. Real Return Earned by Investors in NFC's,1946-1976
13. Real Return Earned by Investors in NFC's,1947-1976
14. ROC(BT): Standard Case, 1929-1976
15. ROC(BT): Standard Case, 1946-1976
5.94 17.26
6.38 16.97
a8
7.36
11.54
12.41
15.92
4.76
2.30

- 43 -
5. The normal after-tax ROC appears to be between 6 and 7 percent--
the range encompassed by all relevant measures (Lines 6, 7,
8 and 10).
6. It is particularly interesting to find virtually identical re-
sults for the standard base ROC whether or not real holding gains on corporate
assets are included in earnings (Lines 2 and 10). Over the Post-War period
these capital gains and losses have just about cancelled out. The ROC
defined to include holding gains is, of course, a more volatile measure;
the series has a larger standard deviation than the standard ROCs.
7. Prevailing accounting conventions provide seriously
misleading evidence on real corporate profitability. The
"historical cost" results averaged more than 4 percentage points higher
than the correct results, i.e., they gave a rate of return that is 0 percent
too high (Lines 6 and 9).
8. Over the past 30 years, the before-tax ROC averaged 12.4 percent.
The difference between before and after-tax ROCs (Lines 15 and 2 of Table 8)
reflects the effective corporate tax rate. On average, government received
46 percent of NFC operating income in corporate income taxes.
However, the effective corporate tax rate has tended to decline in
the period 1946-1976.
9. Additional taxes were levied on NC operating income upon
its distribution to individual claimants. Taking account of the personal
income tax as well as the corporate income tax reduces the ROC by about one per-
centage point (Line 3), and indicates that government has taken
the lion's share of operating income over the post-war period, 54 percent.
- 44 -
Searching for Trends
With respect to ROCs our study and several others follow the
lines laid down in an earlier study by Nordhau who concluded that
the ROC in the postwar period (1948-70) showed "a definite downtrend from
1948 to the middle 1950s a dramatic recovery from the late 1950s to
the mid-1960s and a deterioration to a plateau by 1970." 27
He interpreted this behavior as a postwar downtrend in
corporate profitability, reflecting a steady decline in the opportunity
cost of capital. 28/
This is not so clear to us. First, it is easier to see a
declining trend if one starts with 1948, as did Nordhaus, rather than
with 1946 which is our first postwar year. In 1948 ROC was at a
cyclical peak well above the ROCs for 1946 and 1947. Second the
NIPA revisions, prepared after Nordhaus's study, reduce the ROC estimates
for the period 1948-62, and increase them for the years after 1964. 29/
Finally, there may be different trends for before- and after-tax ROCs.
Inspection of Figure 4 leads us to doubt a secular downtrend in
the postwar period for the after-tax ROC, and to suspect a declining trend
for the before-tax ROC. But it would be difficult to see a downward drift
(or lack thereof), if it existed, given the volatility and cyclicity
of the ROC time series.
I

- 45 -
Therefore we have undertaken more elaborate statistical tests
30/based on recent work by Hankin.3
Lines 1 through 3 of Table 9 report the results of successively
regressing the after-tax ROC on time, then on time and annual percentage
changes in GNP, and finally on time, annual percentage changes in GNP, and
the inflation rate.31/ The change in GNP variable corrects for business
cycle effec-ts, and the rate of price change variable adjusts for inflation,
correcting mainly for the impact of inflation on effective corporation
income tax rates.
The first equation of Table 9 is the equivalent of a simple
time trend. As a function of time alone, the after-tax ROC trended down-.-
ward. But the coefficient is not significant. In the second equation,
the ROC is related to time and the state of economic activity. The
latter emerges as a significant explanatory factor, and time becomes
less important. The third equation adds the rate of inflation.
Inflation, too, turns out to be an
important and significant determinant. 'The more rapid the rate of inflation,
other things equal, the lower the after-tax ROC. Inflation exercises its
effect primarily through the effective tax rate.
Note that in the third equation the time coefficient is positive.
,
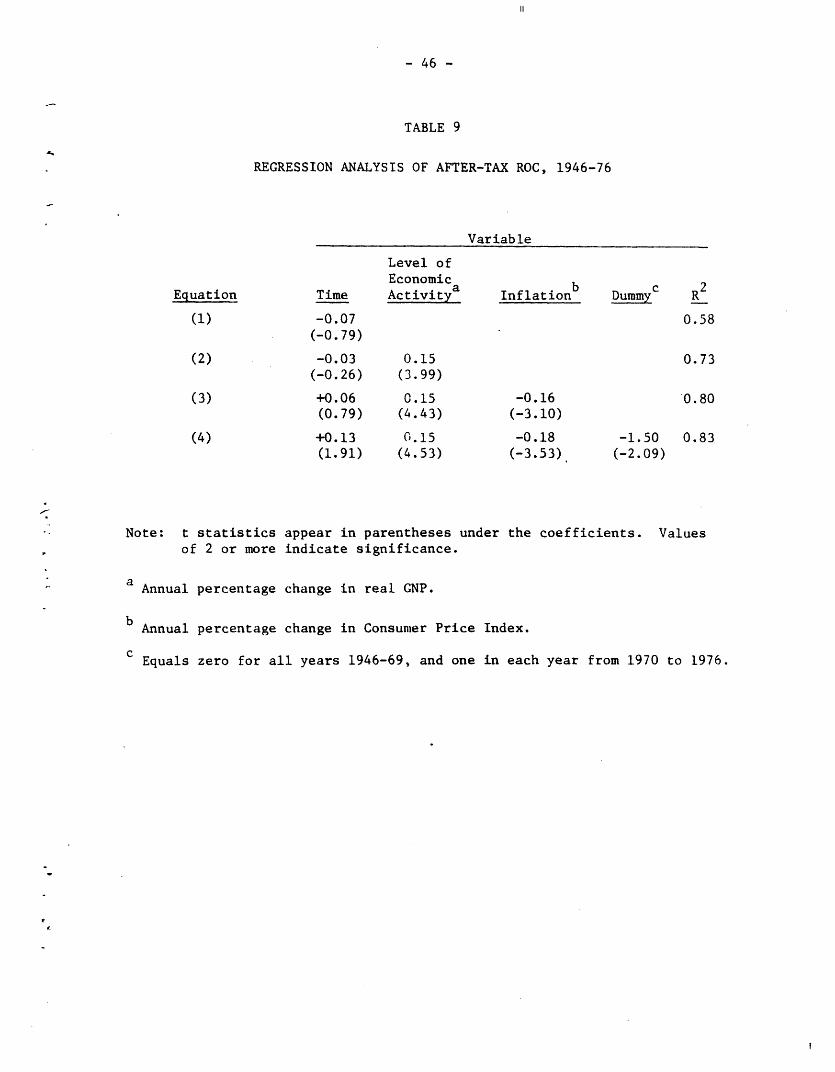
- 46 -
TABLE 9
REGRESSION ANALYSIS OF AFTER-TAX ROC, 1946-76
Variable
Level ofEconomicActivitya
0.15(3.99)
0.15(4.43)
0.15(4.53)
Inflationb Dummyc R2
0.58
0.73
-0.16(-3.10)
-0.18(-3.53)
-1.50(-2.09)
0.80
0.83
Note: t statistics appear in parentheses under the coefficients. Valuesof 2 or more indicate significance.
a Annual percentage change in real GNP.
b Annual percentage change in Consumer Price Index.
Equals zero for all years 1946-69, and one in each year from 1970 to 1976.
Equation
(1)
(2)
(3)
(4)
Time
-0.07(-0.79)
-0.03(-0.26)
+0.06(0.79)
+0.13(1.91)
III
- 47 -
Adjusting for the state of economic activity and the rate of inflation, the
postwar trend of after-tax ROC is slightly but insignificantly upward.
The trend is still more strongly positive in the fourth equation, in which
a dummy variable picks up the low ROCs experienced in the 1970s.
We conclude that the after tax ROC shows neither a downward nor an
upward trend. Variations around its central tendency can be explained, in
large part, by changes in the level of economic activity and in the rate
32/of inflation.3
Perhaps we should search not for long-term trends but also for
sudden shifts in profitability. The economy of the 1970s may be fundamentally
different than before. The poor profitability record of the last half
dozen years is not fully explained by a slack economy and brisk inflation.
The dummy variable for 1970-76 indicates that average ROC during this period
was 1.5 percentage points lower than before, even after adjustment for infla-
tion and the rate of growth of GNP. The coefficient of the dummy variable
is statistically significant.
There has been a downward shift in profitability, but our fourth
equation does not prove it is permanent. We could have fitted dummy variables
to other subperiods--the mid-1960s, for example--and no doubt we could have
obtained significant coefficients, particularly as the periods of abnormally
high or low profitability can be picked by hindsight. None of these
previous episodes was a permanent shift.
Our equations explaining ROC are effective but crude. Profitability
responds to more than just inflation and the growth of GNP. Evidently
these omitted variables have been unfavorable in the 1970s. We have
no way of knowing whether they will continue unfavorable, but we are

- 48 -
inclined towards the longer view, and towards guessing that economists in
1987 will regard the first half of the 1970s as an unfortunate but transient
.3/
period.3
A similar exercise for the before-tax ROC is summarized in Table 10.
With respect to time alone, the trend seems downward and borders on signi-
ficance. However after adjusting for the other factors the influence of
time alone is less strongly negative and is insignificant. In contrast with
the ROC(AT), inflation is neither an important nor a significant determinant
of the ROC(BT). Hence our conclusion is that inflation exercises its
effect through an increase in corporate income tax liability.
With respect to declining trends in the before-tax ROC, we choose
the option open to Scottish juries: "not proven."34 /

-49 -
TABLE 10
REGRESSION ANALYSIS OF BEFORE-TAX ROC, 1946-76
Variable
Time
-0.19(-2.21)
-0.11(-1.26)
-0.14(-1.20)
-0.04(-0.53)
Level ofEconomicActivitya
0.32(8.07)
0.32(8. 35)
0.32(8.37)
Inflationb
0.07(1.31)
0.04(0.70)
Dummvc
-2.09(-2.52)
R2
0.62
0.88
0.91
Note: t statistics appear in parentheses under the coefficients. Valuesof two or more indicate significance.
a Annual percent change in real GNP.
b Annual percent change in Consumer Price Index.
c Equals zero for all years 1946-69, and one in each year from 1970 to 1976.
L.
Equation
(1)
(2)
(3)
(4)

III
- 50 -
IV. THE LINK BETWEEN REAL AND FINANCIAL MARKETS
Introduction
We have now examined both physical asset and financial asset
measures of NFC performance -- ROC and R, respectively. To a great extent they
tell the same story. But further insights depend on a linking up of the physi-
cal and financial sectors. The most important specific issue is how real rates
of return on corporate investment have behaved relative to capital costs.
It is difficult to measure the opportunity cost of capital
directly, because it is defined in terms of expected returns on debt and equity
securities. There is no simple way to infer expectations from historical
returns.
But estimates of q can provide useful insights into whether the rate
of return on corporate capital has declined relative to the cost of capital,
which we denote as p. If, for example, we observe that q has declined, then
we can infer that ROC has declined relative to p.-3/ Moreover, we can
say this with reasonable confidence, since MV and CS, the determinants of q,
are liable to less serious measurement errors than ROC or p.
We cannot use q to derive specific estimates of the rates of
return or the cost of capital for any particular year. But the approach
should permit us to identify changes in the spread between present and
anticipated future profitability, on the one hand, and capital costs on the
other. We believe this is the more relevant comparison. For example, it
bears directly on the concern that the falling rate of return reduces the
incentive to invest.3 7 /

- 51 -
To sunmarize, changes in q over time for the NFC sector should
provide a clear measure of how present and anticipated rates of return on
real capital have behaved relative to the cost of capital.
The Behavior of q and ROC over Time
The time series of qt for non-financial corporations is presented
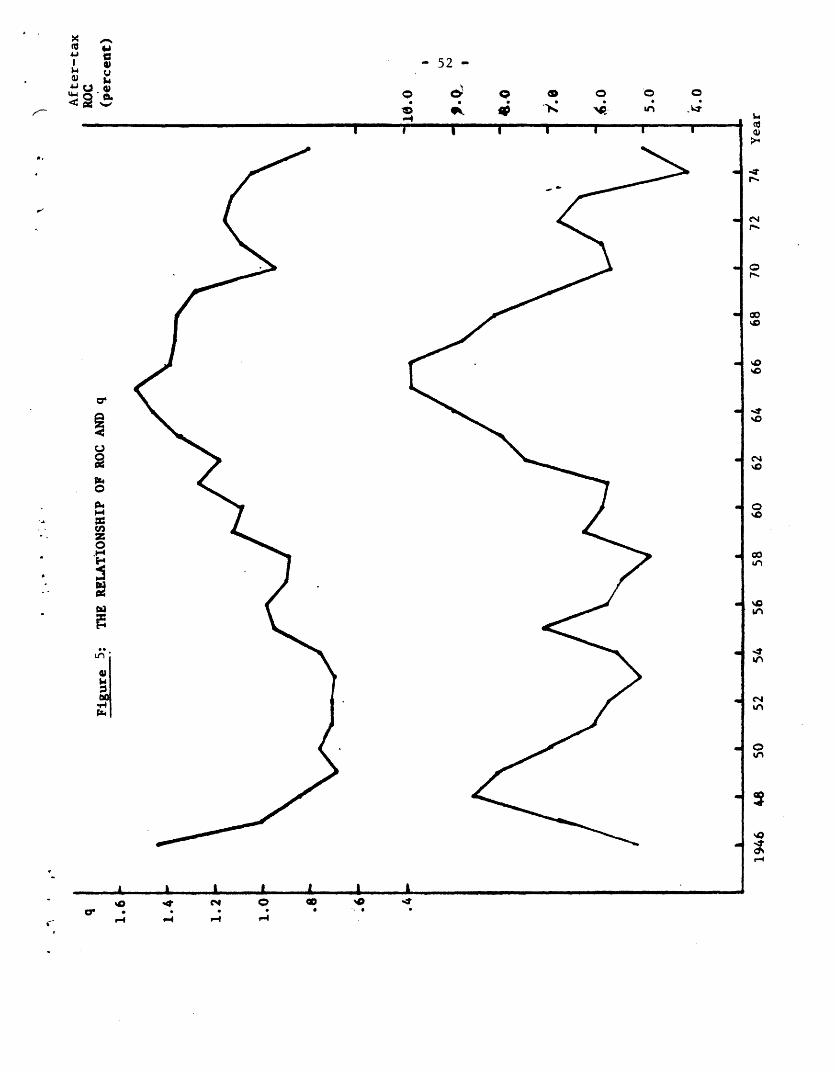
and discussed in Section II of this paper. It is replotted in Figure 5.38/
We see again that the early and mid-1950's were an unfavorable period rela-
tive to the mid-1960's.
Now, declining profitability does not depress stock and bond market
values if capital costs decline proportionally. q depends not on ROC alone,
but on the ratio of ROC to p. Therefore we interpret the last decade's down-
trend in q as reflecting a decline in the rate of return earned by NFC's
relative to the NFC opportunity cost of capital.
It is difficult to separate the effects of ROC and p on q, because we
lack a reliable estimate of p. We can obtain a simple, rough measure, however.
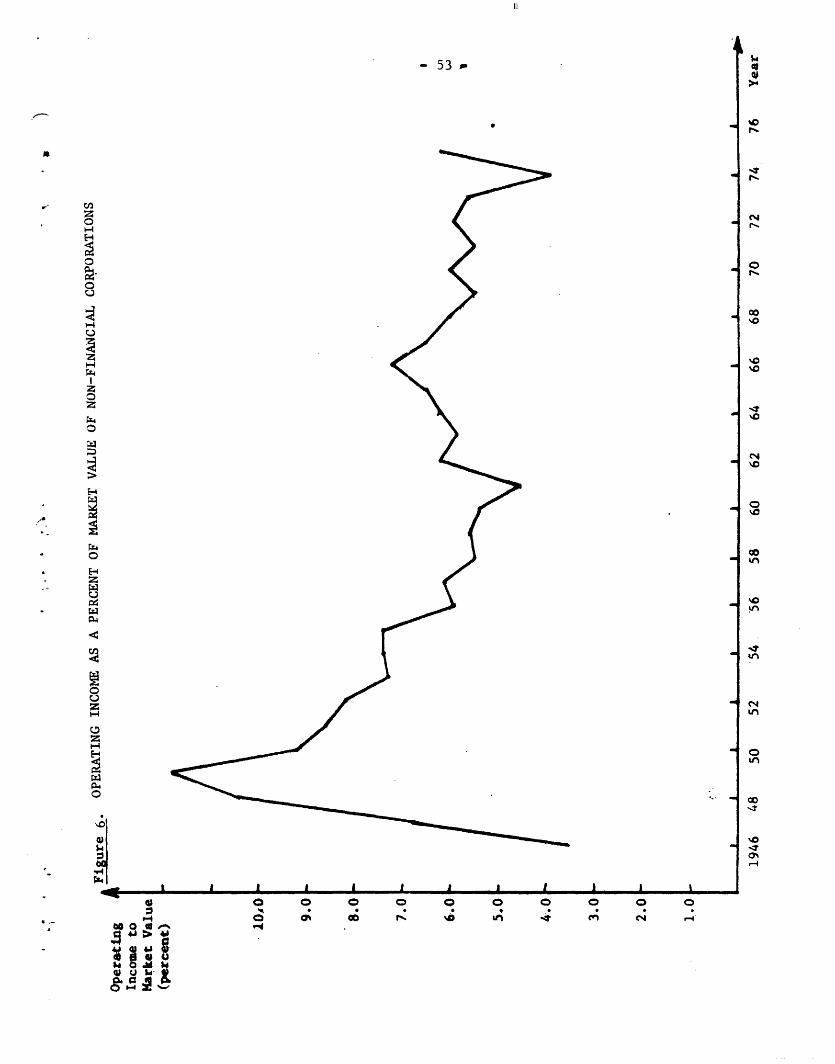
Figure 6 shows the ratio of NFC operating income to market value for the period
1946-76. (It is also presented as a percentage in Table 9). This ratio can be thought
of as a generalized earnings-price ratio where "price" equals MV and "earnings" equals
real operating income.39 / There is no evident trend in this ratio since the mid-1950s,
and its volatility since then has been much less than in the first postwar decade.
If we can take the ratio as a rough estimate of p, we must conclude that
p declined steadily from its postwar peak in the late 1940 s. But since 1956 it
has fluctuated in a range from five to seven percent,-./ which matches the

- 51a -
Table 9
Ratio of Operating Income to Market Valueof Non-Financial Corporations, 1946-76
Market Valueof NFCs(Mid-year)
170.0141.6143.4124.3148.6154.3167.5175.0196.8263.1293.2297.0304.0397.0394.2468.9466.5541.4610.5688.2685.9743.5804.9837.0683.5850.3975.61068.51178.71021.91213.1
Ratio ofOperating Incometo Market Value (.)
3.67.010.412.09.28.68.27.37.47.46.06.15.55.65.54.66.25.96.26.57.26.56.05.56.05.55.95.63.96.26.4
Source: Appendix Tables Al and A4a.
YearOperatingIncome
1946194719481949195019511952195319541955195619571958195919601961196219631964196519661967196819691970197119721973197419751976
6.29.9
14.914.713.613.313.712.714.619.617.718.116.622.121.721.828.832.038.045.049.148.248.646.241.346.757.659.546.063.677.6
-
x 1X _
a +I v
¢2 U
- a6-:4 -S
- 52 -
0 C& Q a91 d
o o od0 V;U ,
I I I I I I I I
AI I I
%a e C 4a 0
4 1-4 I-s1-4v -14 ...0
A.
0
PAu0C)
ad. O.. I-
acz0-- :
Da
do
IC.
CN
fr-.
0rl
C14
\D%O0
%C
Go&n~0
c4U,
0kn
I
_ 1 �1 1_ _I
_ __ __ __ __
Ell
- 53 -
0
0,-4
z
0F4
0zC.)
zHz0
;Z
I I I I I I I I I I
_ o 0 0 0 0 0 O 0 O 0
:~ ,A. 0 . .. ...
all ;C
I
>4to
>4
0
co
O
_4NaD
'.0
'.0
'.00%,--
III
I
�
I
·.:
- 54 -
average after-tax ROC's over the postwar period and over the past 20 years
(see Table 8). Thus it appears that NFCs have been earning roughly enough,
on average, to cover their costs of capital.
Of course ROC has been well above and well below its average levels in
the last 20 years. Our data strongly suggest that it is these fluctuations
that account for the fluctuations in q over the last 20 years. As Figure 8
shows, the year-to-year movements in q and ROC correspond fairly well after
1958. There is no evident relationship before then.
We conclude, therefore, that the decline in corporate real profita-
bility (ROC) over the last decade has not been matched by a corresponding
41/decline in the real opportunity cost of capital.
The Absolute Value of q
As Figure 5 shows, q has averaged somewhat less than 1.0
over the last few years. One is tempted
to conclude that NFCs are not earning enough to cover the opportunity cost
of capital (ROC - p). But any such conclusion must be cautiously held. For
one thing the Standard Base does not include some assets. Although changes
in q are, we believe, a reliable signal of changes in ROC relative to p,
the absolute value of q is a less trustworthy statistic.
Nevertheless, it is difficult to see how the "true" value of q could
be much in excess of 1.0. If q is computed on the augmented capital base, for
example, then its 1976 value becomes 0.79 rather than 0.88. Even the augmented
base may be an underestimate of the replacement cost of all corporate assets.
We know, for example, that the augmented base includes only the book value of
land, not its current value. It is true that q would be higher if accelerated
- 55
f-
rather than straight-line depreciation had been used in estimating the net
replacement cost of plant and equipment. But the combined use of accelerated
depreciation and the augmented base would not generate a value for q much in
excess of 1.0.
Where are the intangible assets, the growth opportunities, and the
monopoly rents? Apparently, in the last few years they have counted for very little
when NFCs are examined in aggregate. We found this surprising. Financial
economists are accustomed to pointing cut the assets that accountants do not
recognize -- going-concern value, the fruits of past research and development,
product repuation, and so on. They have comie to think of growth firms as an
important part of our economy. They believe that some firms have monopoly
power. In each case they can cite firms as examples to back up their beliefs.
Yet these firms are evidently atypical. Judging from q, there is little evi-
dence that intangible assets, growth opportunities, and monopoly rents have
a significant impact on the current value of NFCs . although one or more of
these effects must have been important in the mid-1960s, and also in earlier
periods, e.g. 1934-39.
Ill

- 56 -
V. CONCLUSION
There is no question that NFCs have fared poorly since the mid-
1960s. The fact is obvious from the low real rates of return realized by
investors in NFCs. The poor performance is confirmed by declining operat-
ing profitability over the same period.
Whether the most recent data are viewed optimistically or pessi-
mistically depends on which past period is taken as normal. The evidence
is that in the mid-1960s the real profitability of NFCs was much higher, relative
to the opportunity cost of capital, than it is now. On the other hand, NFCs
are better off now than in the mid-1950s. Operating profitability (ROC)
is about the same now as then, but the cost of capital is lower. (If
there is a capital "shortage," it has as yet had no observable effect on the
cost of capital.)
Over long periods -- 1946-76, or 1929-76 -- we have found no trend
in the after-tax rate of return on corporate assets.
In the last few years the aggregate market value of NFCs was at
most equal to the net replacement cost of all NFC assets. There was no evi-
dence that capital markets in recent years perceived NFCs as having, in
aggregate, substantial intangible assets or growth opportunities. The evi-
dence we have presented gives no basis for concluding that current or antici-
pated ROCs on NFC assets exceed the current opportunity cost of capital.
It seems reasonable to say that the real cost of capital for NFCs
has been about 6 to 7 percent since the late 1950s. The average long run real
profitability of NFCs has also been 6 tQ 7 percent. In the period from 1929 up
to the late 1950s, the annual cost of capital was a volatile series. Since
then fluctuations in market value have been more closely related to variations
in profitability than to shifts in the cost of capital.

- 57 -
Prospects for Further Research
Our research strategy in this paper has been to present and discuss
various measures of profitability and capital costs for U.S. non-financial
corporations in the aggregate. Many of our measures are rough; consequently
we have restricted ourselves to broad questions. We are inclined to be
skeptical of trends or sudden permanent shifts in corporate profitability,
but we may have been forced to this position by the inadequacies of our
measures, our limited understanding of the determinants of corporate profit-
ability over time, and the lack of a formal model explaining aggregate market
value in terms of operating income aid other real variables.
Consequently we have a full agenda for further research. We plan to
(1) disaggregate, (2) improve our measures and (3) formalize the analysis
undertaken in this paper.
Disaggregation. The label "non-financial corporations" covers a
variety of dissimilar firms. Useful information is lost in aggregation:
understanding the parts is interesting i itself, and also helpful in under-
standing the whole.
It should be possible to develop measures of market values, returns to
investors, operating profitability and cost of capital for the manufacturing
and non-manufacturing sectors separately. This will require additional assump-
tions and approximations, but we believe seful estimates can be obtained.42 /
There are severe difficulties in repeating our analysis for industry
sub-groups within manufacturing. However, in our judgement, the analytical
43/pay-off justifies the attempt.-
Improved Measures. We need a more accurate representation of the value
of and returns on a portfolio of all NFC securities.
III
- 58 -
1. The bond yields and holding period returns used in our study
are for long term bonds only. Although this is a reasonable
approximation, substitutes should be developed which relate more
closely to the actual maturity structure of corporate debt.
2. Present estimates of equity values and returns depend on
returns and yields of the Standard and Poors Composite Index.
There may be serious errors here, because the index is based only
on the largest firms. We should construct a value-weighted index
based on a stratified sample of traded securities of nonfinancial
corporations.
Such improvements would allow pursuit of finer comparisons. For example,
it will be interesting to see whether the unusually high q's observed for
the 1930s are true values or measurement errors. If they are the former,
we may have something important to say about the macroeconomic history of
that period.
We should also be able to trace changes in the business risk of U.S.
NFCs over a 50-year period. This cannot be done solely from stock market
data because market debt-equity ratios are continually shifting, and because
lenders absorb some business risk. Shifts in business risk may help to
explain shifts in the cost of capital.
In this connection too, we should improve our estimatesof the augmented
base, paying particular attention to land and long-term leases.
Formalization. Aside from the section on "Searching for Trends," there
is no formal statistical analysis in this paper. In particular we have not
attempted to specify or test a model linking real and financial variables.
There is a simple valuation model implicit in our conclusion that the
real cost of capital has been stable at about 6 percent for the last 20 years.

- 59 -
We assumed market value equals current operating income capitalized at the
cost of capital. If this is true, then the cost of capital equals current
operating income divided by market value.44/ We did not test this model.
When we do we will be forced to make changes and extensions, for example:
1. We should in principle use expected future operating income.
Investors do not naively project current performance into the
indefinite future. That means we must develop a proxy for ex-
pected profitability.
2. We used the standard definition of operating income. Would
other definitions work better? The valuation model provides a
basis for testing which carnings series comes closest to true
economic income as perceived by investors. We think that we can
show that the standard definition, which is based on replacement
cost accounting,is more closely related to actual market values than
income based on historical cost accounts, even though the replace-
ment cost data were not directly available to investors over the
period we studied.
3. What about growth opportunities? Our measure of the cost of
capital is essentially an earnings price ratio, a measure well
known to be inadequate for growth firms. We should be able to
develop a proxy for growth opportunities based on q.
III
FOOTNOTES
1. This report incorporates the research supported by the Massachusetts
Institute of Technology's Project on International Business, the Ford
Foundation and the Committee for Economic Development. We are grateful
to the sponsors for their support and to Fischer Black, Jack Ciccolo, John
Gorman, Everett Hagen, Robert Merton, and Allen Sinai for their help in
acquiring necessary data and working out methodological issues. We thank
Eugene Fama and Nicholas Gonede3 for a careful review of our methodology
and data, which we found very helpful. We are especially indebted to
Sudipto Bhattacharya, Robert Jarrow and Richard Weiss, our research
assistants on this project, and to Roger Hankin for permitting us to draw
on his research on the link between corporate profitability and inflation
[ll]. The authors take full responsibility for errors, however.
2. The stock market's current valuation of growth firms like Hewlett-
Packard or Digital Equipment Corporation can only be explained by the
present value of profitable future investment opportunities. Current
earnings are insufficient to account for these firms' values, even if
capitalized at high-grade bond yields.
3. See, for example, Jensen's study of mutual fund performance [13] and
other evidence summarized by Fma 81].
4. For evidence, see Lorie and Hamilton [18], Fama's review article [8],
and the articles collected in Itorie and Brealey [12].
5. Earnings in this context are measured after taxes but before interest,
since our portfolio contains debt as well as equity securities. Strictly
speaking, we should subtract te present value of future investment
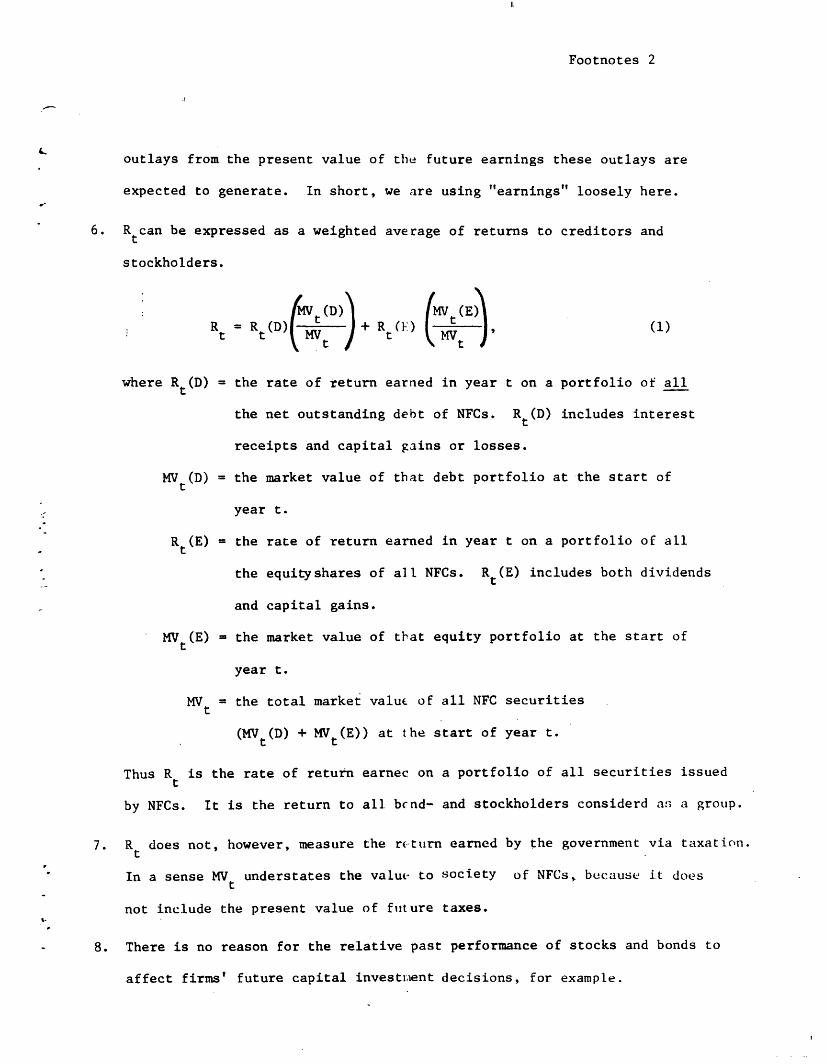
Footnotes 2
outlays from the present value of the future earnings these outlays are
expected to generate. In short, we are using "earnings" loosely here.
6. Rtcan be expressed as a weighted average of returns to creditors and
stockholders.
/R(D) ( MN (E)Rt Rt(D) t t (1)
t t
where Rt(D) = the rate of return earned in year t on a portfolio of all
the net outstanding debt of NFCs. Rt(D) includes interest
receipts and capital gains or losses.
MVt(D) = the market value of that debt portfolio at the start of
year t.
Rt(E) = the rate of return earned in year t on a portfolio of all
the equityshares of all NFCs. Rt(E) includes both dividends
and capital gains.
MVt(E) the market value of that equity portfolio at the start of
year t.
MV = the total market value of all NFC securities
(MVt(D) + MVt(E)) at the start of year t.
Thus Rt is the rate of return earnec on a portfolio of all securities issued
by NFCs. It is the return to all. bcnd- and stockholders considerd as, a group.
7. Rt does not, however, measure the rturn earned by the government via taxation.
In a sense MV understates the value to society of NFCs, because it doest
not include the present value of future taxes.
8. There is no reason for the relative past performance of stocks and bonds to
affect firms' future capital invest;ment decisions, for example.
IlI
1.
Footnotes 3
9. Our procedures for estimating MVt follow those developed by John Ciccolo
in [5]. We are grateful for his assistance.
10. We are not implying that there are meaningful trends or cycles in
the rates of return shown in Table 1. It is not possible to predict
future Rt's from the historicat figures shown. No investor standing
at any point in the 1947-75 period could have used the Rt's observed
up to the point to predict future Rt's. It is only hindsight that
allows us to interpret the history of rates of return.
11. CSt, the denominator of qt, is an average of starting and ending values
of NFC capital stock and inventories. Thus CS1 9 5 0 is a simple average
of figures for the end of 1-949 and the end of 1950. MVt is estimated
as of mid-year -- the end of te second quarter of year t. This conven-
tion facilitates comparison to the rate of return measures presented
in Section III below. Unfortunately, it also makes it difficult to
match year-by-year fluctuations in IV/CS and R, since R is based on marlet
values computed at the end of calendar years. We do not attach much
significance to any single year's value of MV/CS or R, however.
12. James Tobin has emphasized the importance of this ratio and employed
it in theoretical and empirical work. See, for example, [271 and [29].
Footnotes 4
See also the 1977 Economic Report of the President [7], pp. 28-29.
13. 17], p. 28.
14. Slippery issues are encountered as soon as one tries to specify exactly
what assets should in principle go into the demoninator of q. There is
no reason for excluding assets ust because they are intangible. But,
as Fischer Black has pointed out to us, all of MVt can in principle be
traced to some tangible or intangible asset. If so, the true value of
q equals 1.0 by definition.
But we would exclude one type of intangible asset from the denominator,
namely the ability to earn rates of return in excess of the opportunity
cost of capital on investments undertaken by the firm. In other words,
we would not capitalize rents or quasi-rents and include them in the
denominator. We concede the difficulty of distinguishing intangible
assets purchased by the firm from capitalized rents, but still maintain
that q is a useful index of corporate profitability relative to the
opportunity cost of capital.
15. This statement is strictly true only in a partial equilbrium analysis.
16. We are indebted to John A. Gorman, Assistant to the Associate Director
for National Income Accounts, for supplying revised data prior to
their publication in the Survey of Current Business.
17. Remember that the ROCs shown in Table 3 are intended as measures of
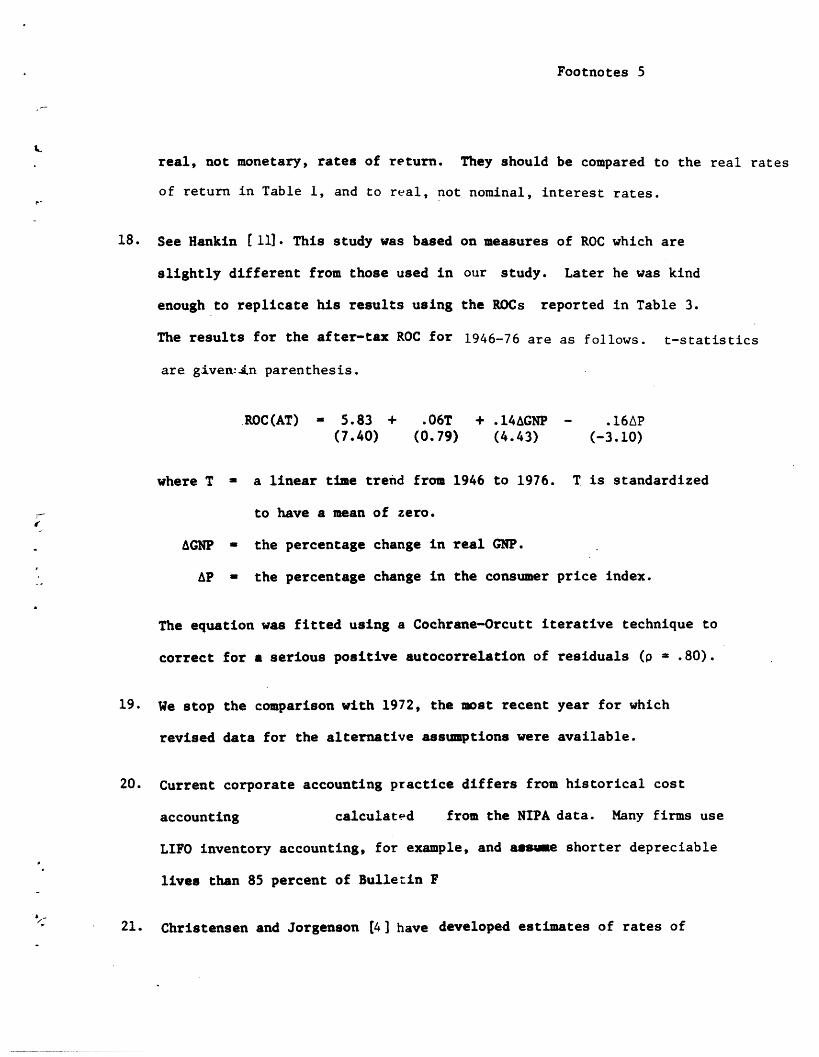
Footnotes 5
real, not monetary, rates of return. They should be compared to the real rates
of return in Table 1, and to real, not nominal, interest rates.
18. See Hankin [11]. This study was based on measures of ROC which are
slightly different from those used in our study. Later he was kind
enough to replicate his results using the ROCs reported in Table 3.
The results for the after-tax ROC for 1946-76 are as follows. t-statistics
are given:in parenthesis.
ROC(AT) - 5.83 + .06T + .14AGNP - .16AP
(7.40) (0.79) (4.43) (-3.10)
where T - a linear time trend from 1946 to 1976. T is standardized
to have a mean of zero.
AGNP - the percentage change in real GNP.
AP - the percentage change in the consumer price index.
The equation was fitted using a Cochrane-Orcutt iterative technique to
correct for a serious positive autocorrelation of residuals (p .80).
19. We stop the comparison with 1972, the most recent year for which
revised data for the alternative assumptions were available.
20. Current corporate accounting practice differs from historical cost
accounting calculated from the NIPA data. Many firms use
LIFO inventory accounting, for example, and assme shorter depreciable
lives than 85 percent of Bulletin F
21. Christensen and Jorgenson [4] have developed estimates of rates of

Footnotes 6
4- return for the entire corporate sector (not just NFC's) after all
taxes, including property taxes and personal income taxes on corporate
income.
22. The specific items were cash, accounts receivable, land, intangibles,
and other assets. Accounts payable and other non-interest bearing
liabilities were subtracted. "Investments" were not added, because most
items in this category are interest-bearing marketable securities, and
operating income is measured before net interest paid. That is, the
interest income earned on these assets is subtracted from interest paid
on NFC debt.Because the interest income on investments is not included
in the numerator of the ROC calculation, it is inappropriate to include
the value of these investments in the denominator.
23. Averages for after-tax ROC for the three periods we have distinguished
are as follows (figures in percent):
Table 3 Table 6
1946-60 6.3 1947-60 5.71961-70 8.0 1961-70 7.11971-75 5.6 1971-75 4.9
24. See [71, p. 29 and p. 69.
25. Let CSt and INVt be the net replacement cost of a firm's capital stock
and inventory, respectively, at the end of period t. Then the total
nominal income realized in period t includes operating income, net of
depreciation calculated on CSt 1, plus the holding gains realized on
capital stock and inventories. Thus
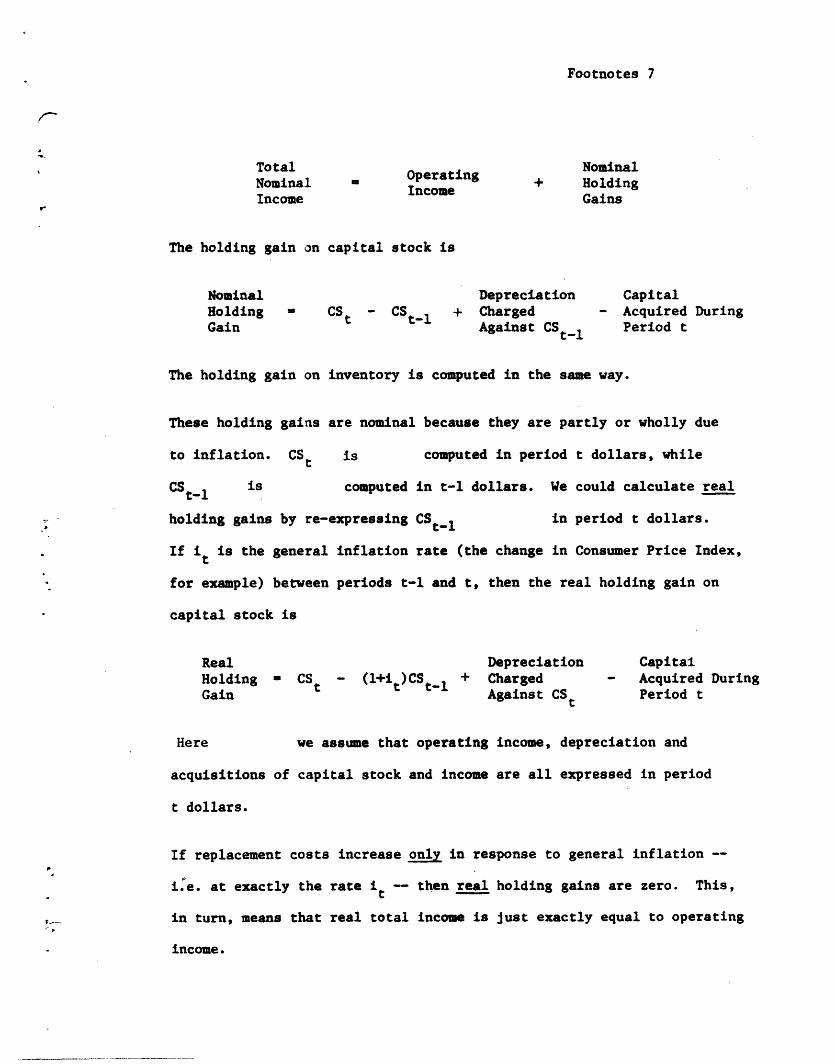
Footnotes 7
Total NominalNominal - Oper + HoldingIncome Gains
The holding gain on capital stock is
Nominal Depreciation CapitalHolding CSt - CS 1 + Charged - Acquired DuringGain ti Against CS t_ 1 Period t
The holding gain on inventory is computed in the same way.
These holding gains are nominal because they are partly or wholly due
to inflation. CSt is computed in period t dollars, while
CSt 1 is computed in t-l dollars. We could calculate real
holding gains by re-expressing CSt_1 in period t dollars.
If it is the general inflation rate (the change in Consumer Price Index,
for example) between periods t-l and t, then the real holding gain on
capital stock is
Real Depreciation CapitalHolding - CSt - (l+it)CSt_1 + Charged - Acquired DuringGain Against CSt Period t
Here we assume that operating income, depreciation and
acquisitions of capital stock and income are all expressed in period
t dollars.
If replacement costs increase only in response to general inflation --
i.e. at exactly the rate it -- then real holding gains are zero. This,
in turn, means that real total income is just exactly equal to operating
income.
Footnotes 8
(There is no need to distinguish between real and nominal operating
income. Operating income is expressed in period t dollars, which are
the units of measurement for both real and nominal total income.)
26. The holding gains have no evident relationship to q or to the real rates
of return earned by investors.
27. [23], PP- 180-181.
28. [23], pp. 205-208.
29. The revisions increase ROC in only one year -- 1956. It is unaffected
in 1955 and 1957. It is reduced in all other years between 1948 and 1962.
For the ROC(AT) the reduction is 0.7 percentage points for 1948, and about
0.2 percentage points for most years before 1962.
30. Hankin [11] worked with ROC data from an earlier version of this study.
Our tests essentially replicate his model, except for slight changes in and
additions to the ROC figures.
31. The Cochrane-Orcutt iterative technique was used to Adjust for
auto-correlation.
32. Our conclusion rests on a larger statistical inquiry than the one reproduced
in Table 9. We tried other variables--percentage utilization of capacity
and lagged inflation--as substitutes for and in combination with the
two in Table 9 and ended up with the same general result.
33. We end up echoing Feldstein's and Summer's arguments, and refer the
reader to [9], pp. 217-24 for a more extensive discussion. Their analysis
and statistical tests were helpful in our work.
III
Footnotes 9
34. For a more rigorous verdict denying a declining trend see Feldstein
and Summers [9 ].
35. We believe Nordhaus is the only investigator who has attempted to measure
and compare trends in the rate of return and the cost of capital. But
his cost of capital measure is flawed by (1) the use of book, rather
than market values, for debt and equity in his weighted average cost of
capital measure; (2) an inappropriate adjustment for the tax shield
provided by interest; (3) using a risk-free rate to measure the expected
rate of return on corporate bonds; and (4) using the earnings-price ratio
for the expected market rate of return on equity. (See [8], esp.
p. 199.) Assumption (4), or some equally simple rule of thumb, is
perhaps unavoidable when dealing with aggregate data. But the first
three assumptions can be improved upon.
36. Modern financial theory shows that the market value of a firm (MV)
equals the capitalized value of the long-run average earnings from
assets now in place (Y/p), plus the present value of growth opportunities
(PVGO).
MV - + PVGO . (2)
The capitalization rate p is the equilbrium expected rate of return
established in capital markets for this firm and others of equivalent
risk.
Earnings are equal to the return on capital times real capital (CS).
Thus Y - ROC(CS), and
MV - CS(ROC) +PVGO (3).

Footnotes 10
PVGO is the present value of future opportunities to invest at rates of
return in excess of the cost of capital. Growth is worth nothing if
expected ROC on future investment Just equals p. If ROC - p now and for
the future, the market value of the firm just equals the value of its
real capital.
Thus q, the ratio of NV to RC, depends on the ratio of ROC to p:
MV _ ROC PVCOq = -- = --- , (4)
CS P CS
where PVGO is a function of ROC/p and the rate of expansion of real
capital stock.
Now, by identifying changes in q with changes in ROC/p, we are actually
assuming a constant expected long-term rate of expansion in real
capital stock. It is conceivable that q could vary due to changes in
the expected rate of investment, even with ROC and p constant. But
we consider this unlikely, for two reasons. First, if ROC and p are
constant, there is no obvious mechanism to account for changes in the
real investment rate. If the real rate of investment increases as
ROC/p increases,then that merely strengthens the relationship between
q and ROC/p. Second, Figures 7 and 8 below show that recent fluctua-
tions in MV can be largely accounted for by changes in ROC.
37. We do not claim that this approach is without its own difficulties.
For example, there are problems in defining and measuring real capital,
and in estimating market values. These problems are likely to be partic-
III

Footnotes 11
ularly severe in cross-sectional comparisons. There is little meaning
in comparing the q's of the drug and steel industries, for example, since
so much of the drug industry's assets do not show on balance sheets.
(Comparisons of the industries' ROCs would be just as suspect -- perhaps
more so.) At best: one could make rough adjustments such as capitalizing
and amortizing advertising and outlays on research and development. On
the other hand, biases in estimating CS or MV are not likely to be
volatile over time. Thus a change in q can be clearly interpreted even
though the absolute value of the ratio cannot.
38. Values of q and ROC presented in Figure 8 are calculated from the standard,
rather than the augmented, estimates of capital stock.
39. The ratio of operating earnings to MV is as close as we can get to
a direct estimate of the real cost of capital p. In principle we should
estimate
/ Mt(p)\ /MV (E) Pt ' Pt(D) MV + Pt(E) MV ) (
Eq. (5) corresponds to Eq. (1) (fn. 6), except that the p's are expected. rates
of return -- e.g., t E(Rt). Now, if the total expected dollar return
to debt and equity is just equal to Yt, i.e.,
PtMVt ' Pt(D)NVt(D) + pt(E)MVt(E) = Yt' (6)
then Pt - Yt/MVt, which is the ratio plotted in Figure 7. Unfortunately,
Eq. (6) makes a number of implicit assumptions. For example, it holds
only if growth opportunities are absent (PVGO - ) and if Y equalst
Footnotes 12
investors' expectations of average future earnings generated by assets
held at t.
8 40. An exception is 1974. Over the period 1956-76, P averaged 5.85 percent with a
standard deviation of 0.69; from 1946-55, the average value was 8.11 percent, with a
standard deviation of 2.24.
4i. Remember that we have estimated in real terms. The current perception
of high capital costs is based on nominal rates.
42. From the NIPA data we could estimate the before-tax ROC 1947 to date, for all
manufacturing companies (corporations, proprietorships, and partnerships).
The denominator is directly available. For the numerator, the excess of
NIPA replacement cost depreciation over tax return depreciation would have
to be estimated. With some further work we could also derive an estimate
of the after-tax ROC for manufacturing.
'3. Further disaggregation--for example, a two-digit SIC breakdown for manufac-
turing (20 industries)--would be substantially more difficult. Profits are
available, for corporations only, to this degree of industry detail. But
these figures are computed on a company basis of industrial classification.
The IVA, net interest, and excess of replacement cost depreciation over tax
return depreciation, if available, would be on an establishment basis. So a
bridge between company and establishment data would have to be built. Moreover,
capital stock figures presently are available only for aggregate manufacturing,
and would have to be apportioned among industries on the basis of Statistics
of Income totals, or some other source.
Despite the difficulties we think that usable estimates may be possible. Given
·- the enriched analysis they would permit, a serious attempt at a two-digit
industry breakdown for manufacturing is warranted.
III

Footnotes 13
44. If MVt = Yt/Pt, then t = Yt/MVt. Here t is the cost of capital, MVt
market value, and Y is current operating income.
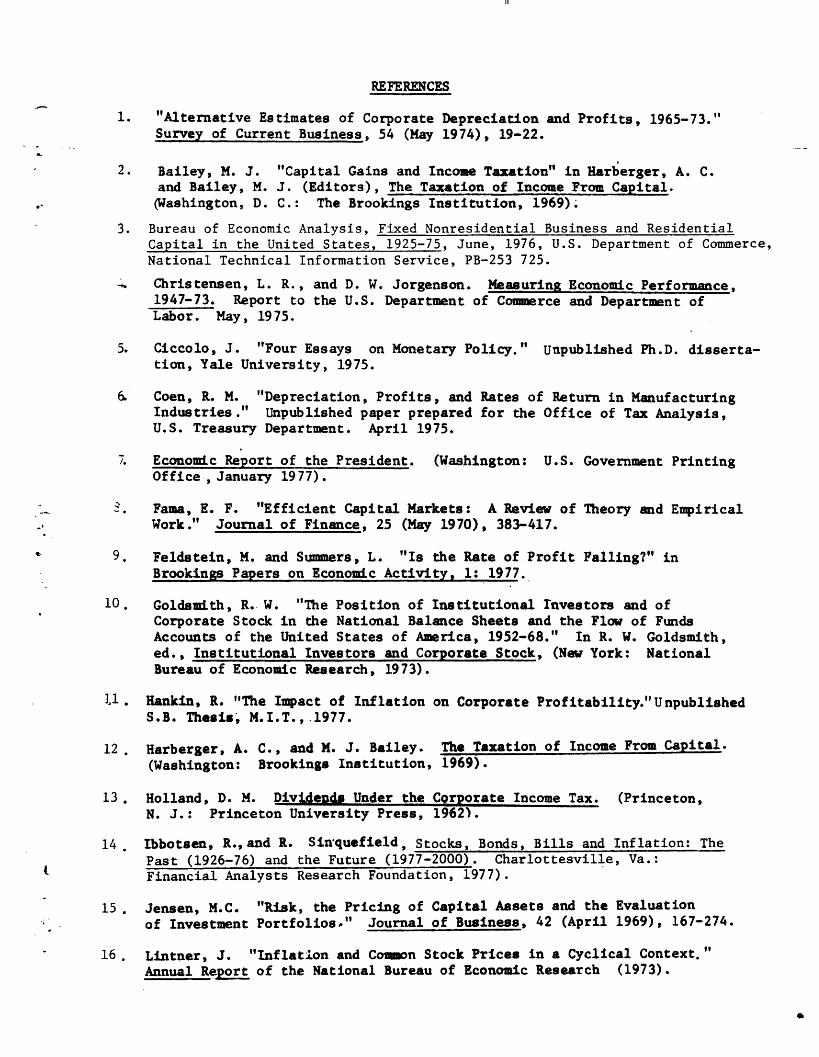
REFERENCES
1. "Alternative Estimates of Corporate Depreciation and Profits, 1965-73."Survey of Current Business, 54 (May 1974), 19-22.
2. Bailey, M. J. "Capital Gains and Income Taxation" in Harberger, A. C.and Bailey, M. J. (Editors), The Taxation of Income From Capital.(Washington, D. C.: The Brookings Institution, 1969);
3. Bureau of Economic Analysis, Fixed Nonresidential Business and ResidentialCapital in the United States, 1925-75, June, 1976, U.S. Department of Commerce,National Technical Information Service, PB-253 725.
Christensen, L. R., and D. W. Jorgenson. Measuring Economic Performance,1947-73. Report to the U.S. Department of Commerce and Department ofLabor. May, 1975.
5. Ciccolo, J. "Four Essays on Monetary Policy." Unpublished Ph.D. disserta-tion, Yale University, 1975.
6 Coen, R. M. "Depreciation, Profits, and Rates of Return in ManufacturingIndustries." Unpublished paper prepared for the Office of Tax Analysis,U.S. Treasury Department. April 1975.
. Economic Report of the President. (Washington: U.S. Government PrintingOffice , January 1977).
__ . Fame, E. F. "Efficient Capital Markets: A Review of Theory and EmpiricalWork." Journal of Finance, 25 (May 1970), 383-417.
9. Feldstein, M. and Summers, L. "Is the Rate of Profit Falling?" inBrookings Papers on Economic Activity, 1: 1977.
10. Goldsmith, R. W. "The Position of Institutional Investors and ofCorporate Stock in the National Balance Sheets and the Flow of FundsAccounts of the United States of America, 1952-68." In R. W. Goldsmith,ed., Institutional Investors and Corporate Stock, (New York: NationalBureau of Economic Research, 1973).
.1. Hankin, R. "The Impact of Inflation on Corporate Profitability."UnpublishedS.B. Thesis, M.I.T.,.1977.
12. Harberger, A. C., and . J. Bailey. The Taxation of Income From Capital.(Washington: Brookings Institution, 1969).
13. Holland, D. M. Dividends Under the Corporate Income Tax. (Princeton,N. J.: Princeton University Press, 1962).
14. Ibbotsen, R.,and R. Sinquefield, Stocks, Bonds, Bills and Inflation: The
Past (1926-76) and the Future (1977-2000). Charlottesville, Va.:t Financial Analysts Research Foundation, 1977).
15. Jensen, M.C. "Risk, the Pricing of Capital Assets and the Evaluationof Investment Portfolios." Journal of Business, 42 (April 1969), 167-274.
16. Lintner, J. "Inflation and Comson Stock Prices in a Cyclical Context."Annual Report of the National Bureau of Economic Research (1973).
III
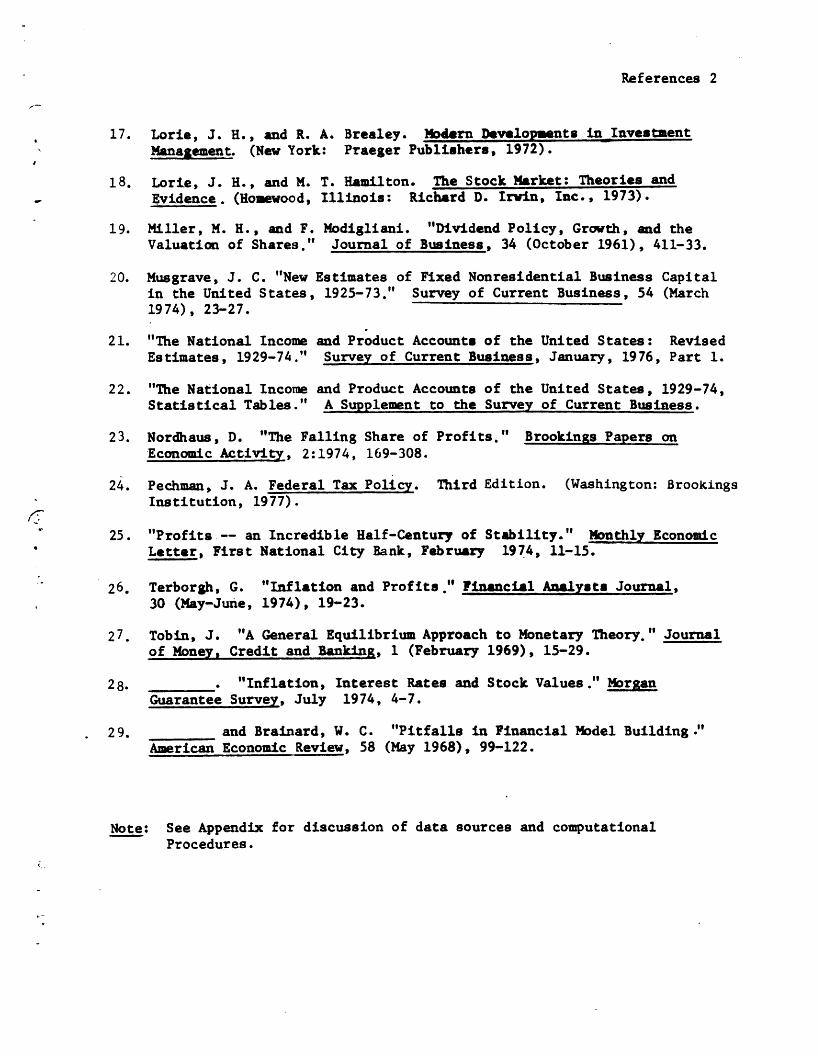
References 2
17. Lorie, J. H., and R. A. Brealey. Modern Developments in InvestmentManagement. (New York: Praeger Publishers, 1972).
18. Lorie, J. H., and M. T. Hamilton. The Stock Market: Theories andEvidence. (Homewood, Illinois: Richard D. Irvin, Inc., 1973).
19. Miller, M. H., and F. Modigliani. "Dividend Policy, Growth, and theValuation of Shares." Journal of Business, 34 (October 1961), 411-33.
20. Musgrave, J. C. "New Estimates of Fixed Nonresidential Business Capitalin the United States, 1925-73." Survey of Current Business, 54 (March1974), 23-27.
21. "The National Income and Product Accounts of the United States: RevisedEstimates, 1929-74." Survey of Current Business, January, 1976, Part 1.
22. "The National Income and Product Accounts of the United States, 1929-74,Statistical Tables." A Supplement to the Survey of Current Business.
23. Nordhaus, D. "The Falling Share of Profits." Brookings Papers onEconomic Activity, 2:1974, 169-308.
24. Pechman, J. A. Federal Tax Policy. Third Edition. (Washington: BrookingsInstitution, 1977).
25. "Profits -- an Incredible Half-Century of Stability." Monthly EconomicLetter, First National City Bank, February 1974, 11-15.
26. Terborgh, G. "Inflation and Profits." Financial Analysts Journal,30 (Hay-June, 1974), 19-23.
27. Tobin, J. "A General Equilibrium Approach to Monetary Theory." Journalof Money, Credit and Banking, 1 (February 1969), 15-29.
28. . "Inflation, Interest Rates and Stock Values." MorganGuarantee Survey, July 1974, 4-7.
29. and Brainard, W. C. "Pitfalls in Financial Model Building."American Economic Review, 58 (May 1968), 99-122.
Note: See Appendix for discussion of data sources and computationalProcedures.

III
Statistical Appendix
In this Appendix we tabulate the estimates prepared for our study.
Notes that explain the derivation of the estimates follow each table.
Items listed in the footnotes to the Appendix tables are cited in
full in our list of References. If the indicated source does not appear
in the list of References, it is a standard source of statistical infor-
mation which requires no further identification.
.
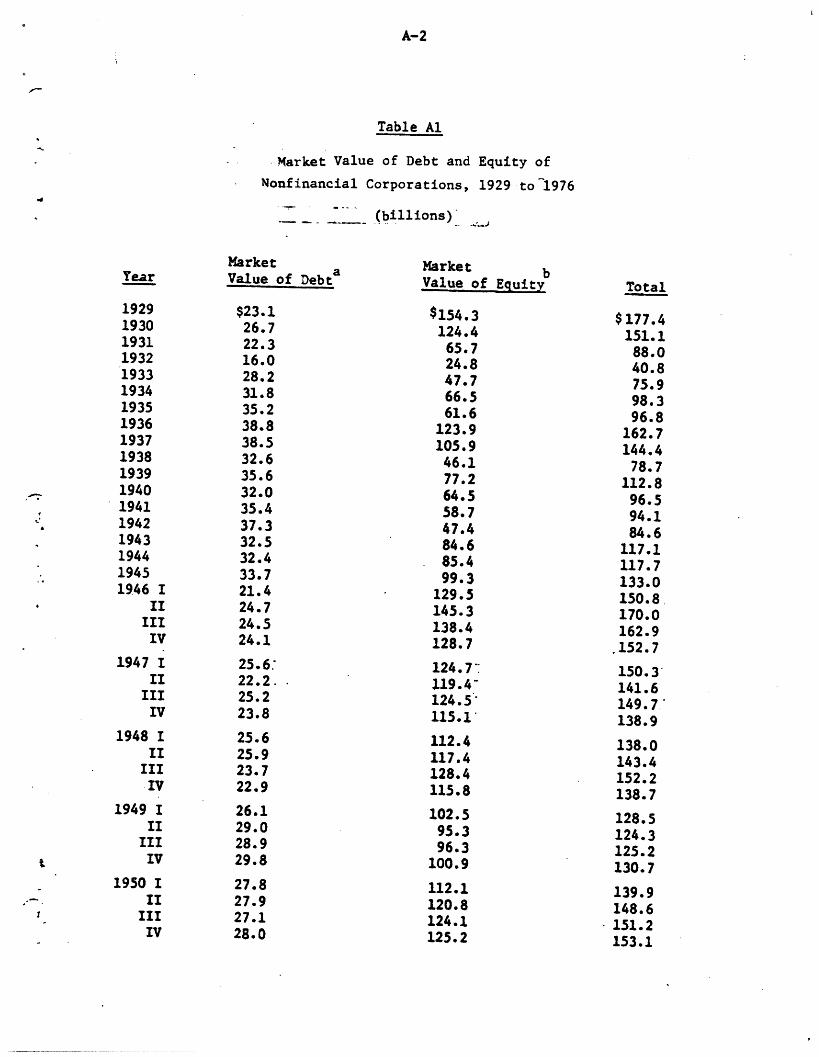
A-2
Table Al
-.Market Value of Debt and Equity ofNonfinancial Corporations, 1929 to 1976
(billions)
Market MarketYear Value of Debta Value of Equity Total
1929 $23.1 $154.3 $177.41930 26.7 124.4 151.11931 22.3 65.7 88.01932 16.0 24.8 40.81933 28.2 47.7 75.91934 31.8 66.5 98.31935 35.2 61.6 96.81936 38.8 123.9 162.71937 38.5 105.9 144.41938 32.6 46.1 78.71939 35.6 77.2 112.81940 32.0 64.5 96.51941 35.4 58.7 94.11942 37.3 47.4 84.61943 32.5 84.6 117.11944 32.4 85.4 117.71945 33.7 99.3 133.01946 I 21.4 129.5 150.8II 24.7 145.3 170.0III 24.5 138.4 162.9IV 24.1 128.7 .152.71947 I 25.6. 124.7: 150.3II 22.2. 119.4- 141.6III 25.2 124.5' 149.7IV 23.8 115.1 138.91948 I 25.6 112.4 138.0II 25.9 117.4 143.4III 23.7 128.4 152.2IV 22.9 115.8 138.71949 I 26.1 102.5 128.5II 29.0 95.3 124.3III 28.9 96.3 125.2IV 29.8 100.9 130.71950 I 27.8 112.1 139.9II 27.9 120.8 148.6III 27.1 124.1 151.2IV 28.0 125.2 153.1
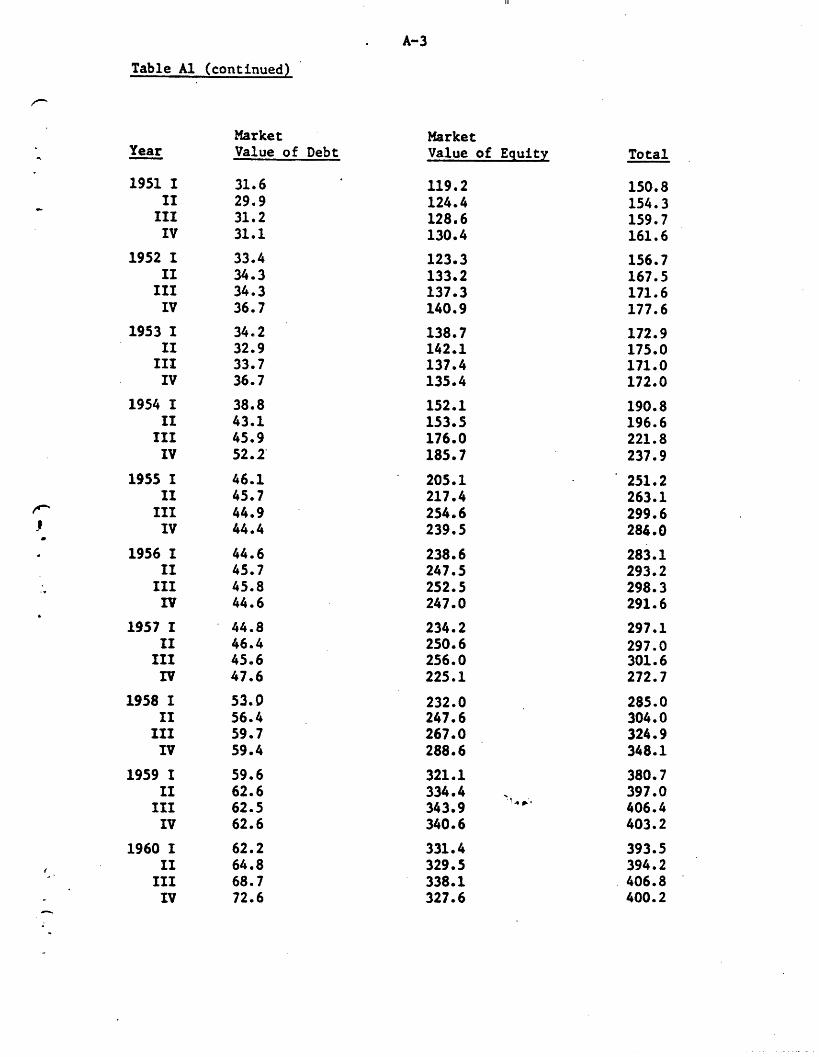
Table A1 (continued)
MarketValue of Debt
31.629.931.231.1
33.434.334.336.7
34.232.933.736.7
38.843.145.952.2
46.145.744.944,4
44.645.745.844.6
44.846.445.647,6
53.056.459.759.4
59.662.662.562.6
62.264.868.772.6
MarketValue of Equity
119.2124.4128.6130.4
123.3133.2137.3140.9
138.7142.1137.4135.4
152.1153.5176.0185.7
205.1217.4254.6239.5
238.6247.5252.5247.0
234.2250.6256.0225.1
232.0247.6267.0288.6
321.1334.4343.9340.6
331.4329.5338.1327.6
Year
1951 IIIIIIIV
1952 IIIIIIIV
1953 III
IIIIV
1954 IIIIIIIV
1955 IIIIIIIV
1956 IIIIIIIV
1957 IIIIIIIV
1958 III
IIIIV
1959 IIIIIIIV
1960 IIIIIIIV
Total
150.8154.3159.7161.6
156.7167.5171.6177.6
172.9175.0171.0172.0
190.8196.6221.8237.9
251.2263.1299.6284.0
283.1293.2298.3291.6
297.1297.0301.6272.7
285.0304.0324.9348.1
380.7397.0406.4403.2
393.5394.2406.8400.2
III
A-3
f

A-5
Table Al (continued)
MarketValue of Debt
208.7205.6203.5217.6
219.9223.8235.0257.8
273.5289.3298.7325.8
338.0340.3332.3324.1
317.7323.1332.4332.4
330.4355.6379.4408.3
MarketValue of Eauitv
640.6644.7661.3605.0
735.4751.8767.6800.0
823.1779.3787.8738.9
727.0838.4674.8531.2
627.7698.8683.1690.8
760.1857.5889.2862.9
Total
849.3850.3864.8822.6
955.3975.61002.61057.8
1096.61068.51086.51064.7
1065.01178.71007.1
855.3
945.41021.91015.51023.2
1090.51213.101268.61271.2
a. Market value of debt. Net interest paid by NFCswas capitalized at Moody's Baa corporate bond rate. After 1945, netinterest was available by quarter. Data for 1929 to 1972 are from United StatesDepartment of Commerce, Bureau of Economic Analysis, The National Incomeand Product Accounts of the United States, 1929-74, Statistical Tables 20]; Datafor 1973 to1976, from current issues of Survey o Current Business.
Yields were taken from Moody's Industrial Manual. Yields used to cani-talize quarterly net interest are simple averages of yields quoted foreach month in the quarter. For 1929 to 1945, the yield quoted for June was used.
b. Market value of equity. Net dividend payments by NFCswere capitalized at the dividend yield of the Standard and Poor'sComposite Index.
Annual and quarterly dividend payments are available from source cited innote a for net interest.
The dividend yield used was an arithmetic average of monthly indexesreported for April, May and June, taken from Standard and Poor's TradeStatistics.
.4 Year
1971 IIIIIIIV
1972 1IIIIIV
1973 IIIIIIIV
1974 1IIIIlIV
1975 IIIIIIIV
1976 IIIIIIIV
.... d
�---I-�-- I�--

A-6
Table A2a
..et Capital Stock of
Nonfinancial Corporations, 1929 to 1976
Standard Base-- Straight-Line Depreciation,
Service Lives 85 percent of Bulletin F
(billions of current dollars)
1. NetResidentialCapitala
3.03.13.02.52.22.32.32.32.52.72.72.72.93.13.33.43.63.84.34.85.05.25.55.75.85.85.96.16.36.67.27.88.5
2. Net Non-residentialCapitalb
$64.564.961.855.349.648.247.947.249.451.950.550.363.459.863.864.264.770.585.4106.0128.0125.0141. 7157.3167.3177.0185.4202.8226.2243.8251.2258.8265.9
3. AverageNet FixedCapitalStockc
$67.866.461.354.851.250.449.950.753.353.953.154.759.665.067.468.071.382.0
100.118.2129.41.40.215 5.0168.1178.0187.1200.1220.7241.5254.4262.5270.5
4.Inventoryd
$24.023.019.816.615.716.817.518.920.720.520.422.025.930.131.331.230.636.446.352.652.555.665.571.573.073.075.783.488.386.990.595.6
Year
192819291930193119321933193419351936193719381939194019411942194319441945194619471948194919501951195219531954195519561957195819591960
5. NetCapitalStocke
$91.889.481.171.466.967.167.369.674.074.473.576.785.595.198.799.2
101.9118.4146.6170.8181.9195.8220.6239.6251.0260.1275.8304.1329.8341.3353.0366.1
II
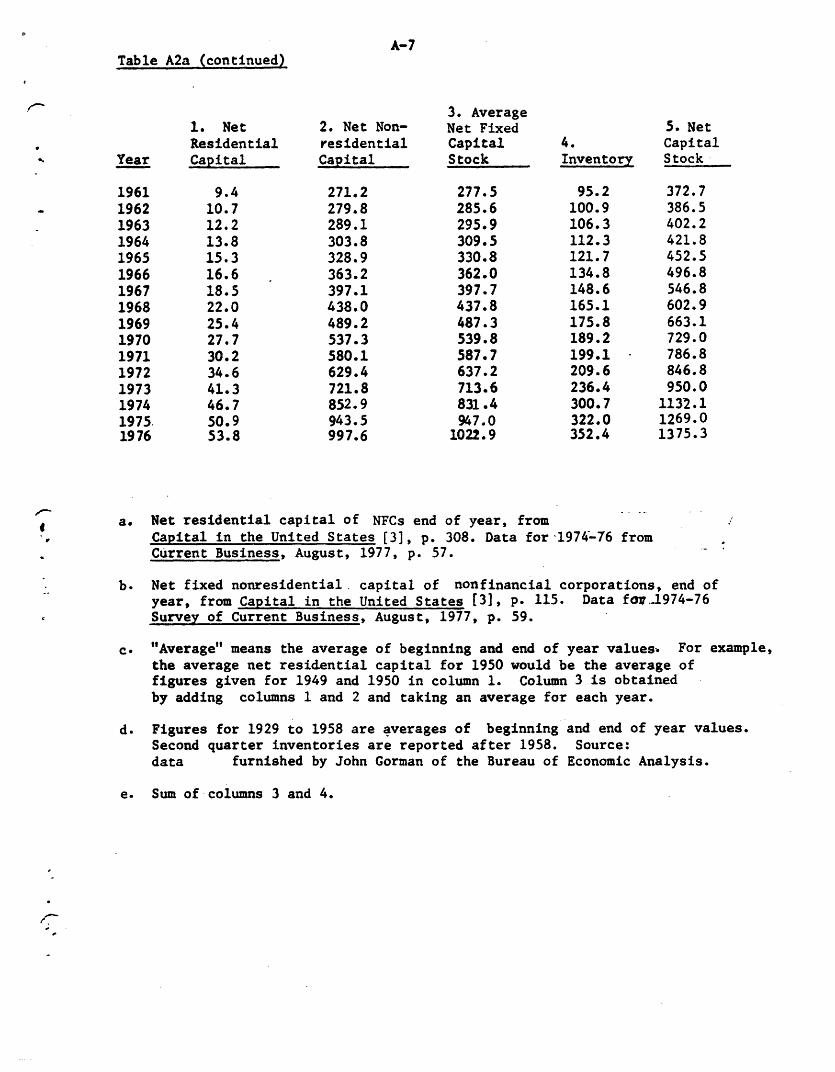
Table A2a (continued)
1. NetResidentialCapital
9.410.712.213.815.316.618.522.025.427.730.234.641.346.750.953.8
2. Net Non-residentialCapital
271.2279.8289.1303.8328.9363.2397.1438.0489.2537.3580.1629.4721.8852.9943.5997.6
3. AverageNet FixedCapitalStock
277.5285.6295.9309.5330.8362.0397.7437.8487.3539.8587.7637.2713.6831.4947.0
1022.9
4.Inventory
95.2100.9106.3112.3121.7134.8148.6165.1175.8189.2199.1209.6236.4300.7322.0352.4
a. Net residential capital of NFCs end of year, fromCapital in the United States [3], p. 308. Data for-1974-76 fromCurrent Business, August, 1977, p. 57.
b. Net fixed nonresidential capital of nonfinancial corporations, end ofyear, from Capital in the United States [3], p. 115. Data fov.974-76Survey of Current Business, August, 1977, p. 59.
c. "Average" means the average of beginning and end of year values. For example,the average net residential capital for 1950 would be the average offigures given for 1949 and 1950 in column 1. Column 3 is obtainedby adding columns 1 and 2 and taking an average for each year.
d. Figures for 1929 to 1958 are averages of beginning and end of year values.Second quarter inventories are reported after 1958. Source:data furnished by John Gorman of the Bureau of Economic Analysis.
e. Sum of columns 3 and 4.
-
A-7
Year
196119621963196419651966196719681969197019711972197319741975.1976
5. NetCapitalStock
372.7386.5402.2421.8452.5496.8546.8602.9663.1729.0786.8846.8950.0
1132.11269.01375.3
I

A-8
Table A2b
Net Capital Stock of
Nonfinancial Corporations, 1946 to 1972
Double-Decliniig-Balance Depreciation,
Service Lives 85 percent of Bulletin. F
.. (billios of current dollars)
1. NetResidentialCapital
$3.84.34.85.05.25.55.75.85.85.96.16.36.67.27.88.59.4
10.712.213.815.315.618.522.025.427.730.234.6
2. Net Non-residentialCapital
$56.368.786.198.4
104.3115.4128.2136.3144.4151.1165.3184.7199.1204.1209.7215.3219.4226.5234.2246.6268.3297.5325.2358.5400.1438.2471.7511.4
3. AverageNet FixedCapitalStock
$66.682.097.2106.5115.2127.4138.0146.2153.6164.2181.2198.4208.5214.4220.7226.3233.0241.8253.4272.0298.9328.9362.1403.0445.7483.9524.0
4.Inventory
$36.446.352.652.555.665.571.573.073.075.783.488.386.990.595.695.2
100.9106.3112.3121.7134.8148.6161.5175.8189.2199.1209.6
Definitions and computational procedures are identical with those used in Table A2a,except for the shift to double-declining balance depreciation for net nonresit¢entalcapital. Column 2 is from Capital in the United States. [3, p. 308.
,O"
Year
1945194619471948194919501951195219531954195519561957195819591960196119621963196419651966196719681969197019711972
5. NetCapitalStock
$103.0128.3149.8159.0170.8192.9209.5219.2226.6239.9264.6286.7295.4304.9316.3321.5333.9348.1365.7393.7433.7477.5523.6578.8634.9683.0733.6
Notes
II
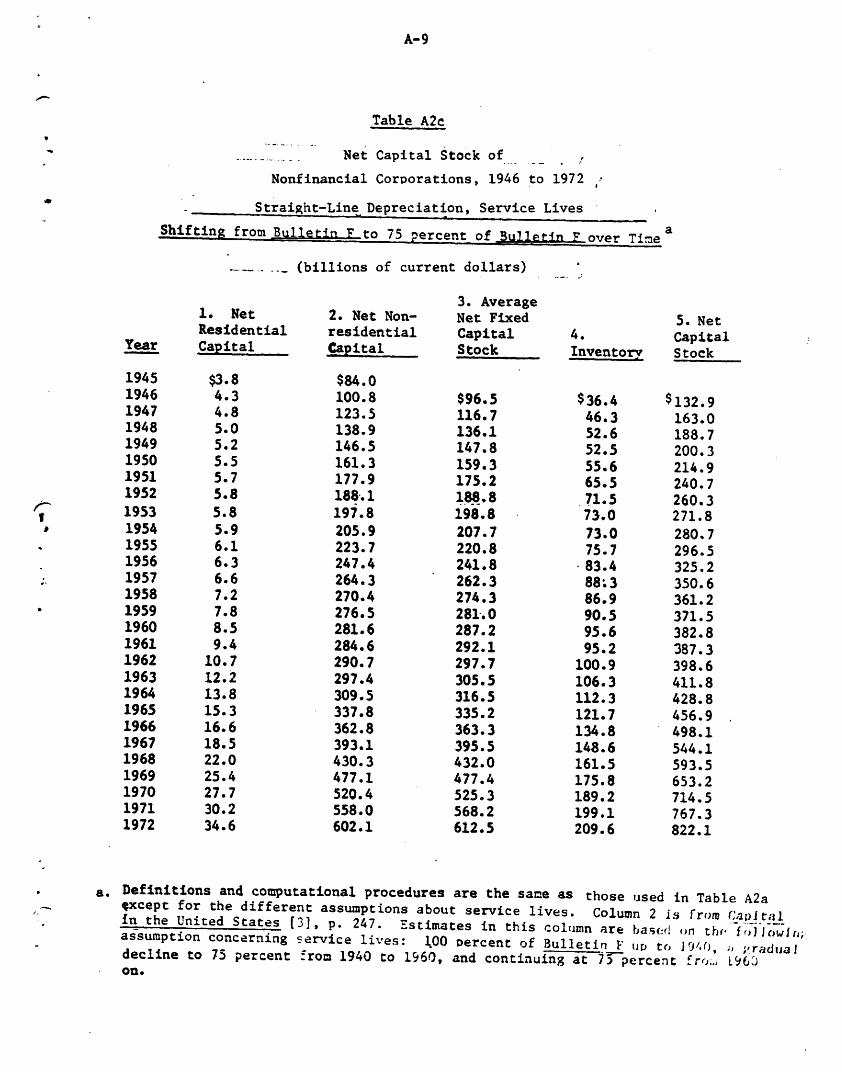
A-9
Table A2cU
Net Capital Stock of
Nonfinancial Corporations, 1946 to 1972
Straight-Line Depreciation, Service Lives
Shifting from Bulletin F to 75 percent of Bulletin F over Timea
....... (billions of current dollars)
1. NetResidentialCapital
$3.84.34.85.05.25.55.75.85.85.96.16.36.67.27.88.59.4
10.712.213.815.316.618.522.025.427.730.234.6
2. Net Non-residentialCapital
$84.0100.8123.5138.9146.5161.3177.9188.1197.8205.9223.7247.4264.3270.4276.5281.6284.6290.7297.4309.5337.8362.8393.1430.3477.1520.4558.0602.1
3. AverageNet FixedCapitalStock
$96.5116.7136.1147.8159.3175.2188.8198.8207.7220.8241.8262.3274.3281.0287.2292.1297.7305.5316.5335.2363.3395.5432.0477.4525.3568.2612.5
a. Definitions and computational procedures are the same as those used in Table A2aexcept for the different assumptions about service lives. Column 2 is from Capitllin the United States 3], p. 247. Estimates in this column are based ,n thr filowin;assumption concerning service lives: 100 Dercent of Bulletin F tip tro 190,, ;, ;radualdecline to 75 percent from 1940 to 1960, and continuing at 7percent fro;. L96'on.
Year
ID
1945194619471948194919501951195219531954195519561957195819591960196119621963196419651966196719681969197019711972
4.Inventory
$36.446.352.652.555.665.571.573.073.075.783.488;386.990.595.695.2
100.9106.3112.3121.7134.8148.6161.5175.8189.2199.1209.6
5. NetCapitalStock
$132.9163.0188.7200.3214.9240.7260.3271.8280.7296.5325.2350.6361.2371.5382.8387.3398.6411.8428.8456.9498.1544.1593.5653.2714.5767.3822.1
--- - . II
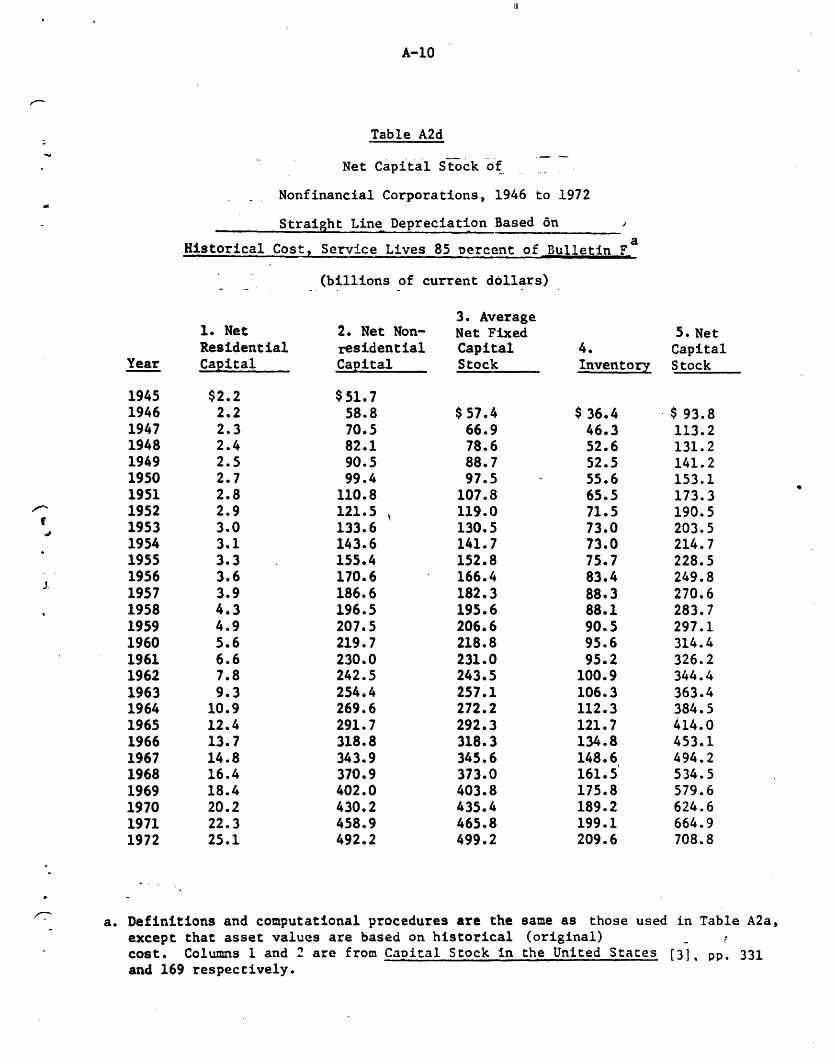
III
A-10
Table A2d
Net Capital Stock of
Nonfinancial Corporations, 1946 to 1972
Straight Line Depreciation Based n
Historical Cost, Service Lives 85 percent of Bulletin Fa
(billions of current dollars)
1. NetResidentialCapital
$2.22.22.32.42.52.72.82.93.03.13.33.63.94.34.95.66.67.89.3
10.912.413.714.816.418.420.222.325.1
2. Net Non-residentialCapital
$51.758.870.582.190.599.4
110.8121.5133.6143.6155.4170.6186.6196.5207.5219.7230.0242.5254.4269.6291.7318.8343.9370.9402.0430.2458.9492.2
3. AverageNet FixedCapitalStock
$ 57.466.978.688.797.5
107.8119.0130.5141.7152.8166.4182.3195.6206.6218.8231.0243.5257.1272.2292.3318.3345.6373.0403.8435.4465.8499.2
4.Inventory
$ 36.446.352.652.555.665.571.573.073.075.783.488.388.190.595.695.2
100.9106.3112.3121.7134.8148.6161.5175.8189.2199.1209.6
a. Definitions and computational procedures are the same as those used in Table A2a,except that asset values are based on historical (original) _cost. Columns 1 and 2 are from Caoital Stock in the United States [3], pp. 331and 169 respectively.
Year
I-,r.3
..
1945194619471948194919501951195219531954195519561957195819591960196119621963196419651966196719681969197019711972
5. NetCapitalStock
$ 93.8113.2131.2141.2153.1173.3190.5203.5214.7228.5249.8270.6283.7297.1314.4326.2344.4363.4384.5414.0453.1494.2534.5579.6624.6664.9708.8

A-11
Table A3
' Derivation of Augmented Net Capital Base
of Nonfinancial Corporations, 1946 to 1976
(billions of current dollars)
-4
1.Standard
Year Base a 2. Cashbc
4. Other3. NetAccounts b CurrentReceivable Assets
Land andIntangiblee
6. Addi-tion toStandardBase b
7.
AugmentedBace
$146.6170.8181.9195.8220.6239.6251.0260.1275.8304.1329.8342.5353.0366.1372.7386.5402.2421.8452.5496.8546.3597.8661.6729.0786.8846.8950.0
1132.11269.01375.3ColumnsColumns
$23.4 $31.0 -443.5 $12.1 $22.323.2 35.3 -46.7 12.8 23.823.4 33.5 -41.9 10.5 25.125.5 45.5 -59.2 14.3 25.826.7 48.2 -65.0 12.9 24.429.2 58.0 -90.0 14.7 17.327.5 52.0 -66.0 13.5 19.529.3 55.1 -69.0 14.4 28.430.2 65.0 -80.0 16 30.530.0 70.5 -86.0 17 31.430.1 73.0 -82.0 17.7 34.232.1 79.7 -87.0 19 41.231.1 85.0 -100.0 21.5 40.732.0 87.0 -104.0 24 38.334.0 96.0 -112.0 25 41.035.0 101.0 -121.0 26.5 42.336.3 109.0 -133.0 29.8 \ 41.837.7 125.0 -144.0 31 55.939.7 150.9 -161.0 56 50.641.0 154.0 -176.0 39 6 LT44.8 166.0 -189.0 50 64.947.5 186.0 -220.0 75 80.248.1 219.0 -256.0 69 82.350.6 227.0 -273.0 78 81.454.8 240.0 -292.0 80 82.7
101.4113.8135.5151.9
164.61, 6 and 7 are averages of beginning-and-end-of-year values.2, 3, 4 and 5 are end of year values.
$168.9194.62C7.0221.6245.0256.9270.5288.5306.3335.5364.0383.7393.7404.4413.7428.7444.0477.7503.1558.6611.2678.0743.9810.4869.5948.2
1063.71267.61420.9
1539.9
a. The standard base is taken from Table A2a.
B. Estimates of NFCs nonfinancial assets other than capitalstock and inventory are taken from Statistics of Income, CorDoration Income TaxReturns, 1947-71. Figures after 1971 were estimated as follows. Average ratios ofcash, accounts receivable, and other net current assets to the standard base werecomputed for 1966 to 1971. These ratios were multiplied by the standard base to obtainestimates for 1972, 1973, 1974, 1975, and 1976.
194719481949195019511952195319541955195619571958
. 19591960196119621963196419651966196719681969.1970197119721973197419751976Note:
-

A-12
Table A3 (continued)
c. Definitions for cash and accounts receivable are those used in Statisticsof Income.
d. "Other net current assets" is defined as: "Assets not allocated to aspecific current account in the return form balance sheet, and assetsspecifically reported as short-term by the corporation, as well asmarketable securities other than Government obligations..." (Statisticsof Income, 1968, Corporation Income Tax Returns, p. 166.)
e. Statistics of Income does not give figures for land and intangibles forNFCs directly. The -figures for financial corporations were subtractedfrom the total of all corporations to derive an estimate of the NFC total.
f. Column 6 was obtained by adding columns 2, 3, 4, and 5, averagingbeginning-and-end-of-year values. Column 7 is the sum of columns 1and 6.
4.

A-13
Table A4a
Operating Income of Nonfinancial Corporations, 1929 to 1976, Standard Case
Straight-line Depreciation,
Service Lives 85 Percent of Bulletin F
(billions of current dollars)
1.
AdjustedProfitsBefore Taxab
$7.65.31.2
-1.9-2.00.62.04.04.72.74.37.5
12.812.922.021.717.214.119.925.823.029.633.430.329.928.638.236.135.030.139.737.4
2.NetInterestb
$1.41.61.81.7.1.71.61.61.61.61.51.51.41.31.31.11.01.00.70.80.91.00.91.11.21.31.61.61.72.22.73.13.5
3. OperatingIncomeBefore Tax -(1) + ( 2 )b
$9.06.93.0
-0.2-0.32.23.65.66.34.25.88.9
14.119.223.122.718.214.820.726.724.030.534.531.531.230.239.837.837.232.842.840.9
4. Corpor-ationIncomeTaxesb
$1.20.70.50.30.50.70.91.31.40.91.42.77.5
11.213.812.610.2
8.610.811.8
9.316.921.217.818.5L5.620.220.119.116,220.719.2
5.Operating IncomeAfter Tax =(3) - (4 )b
$7.86.22.5
-0.5-0.81.52.74.34.93.34.46.26.68.09.3
10.18.06.29.9
14.914.713.613.313.712.714.619.617.718.116.622.121.7
Year
19291930193119321933193419351936193719381939194019411942194319441945194619471948194919501951195219531954195519561957195819591960
���o�ll��-
r
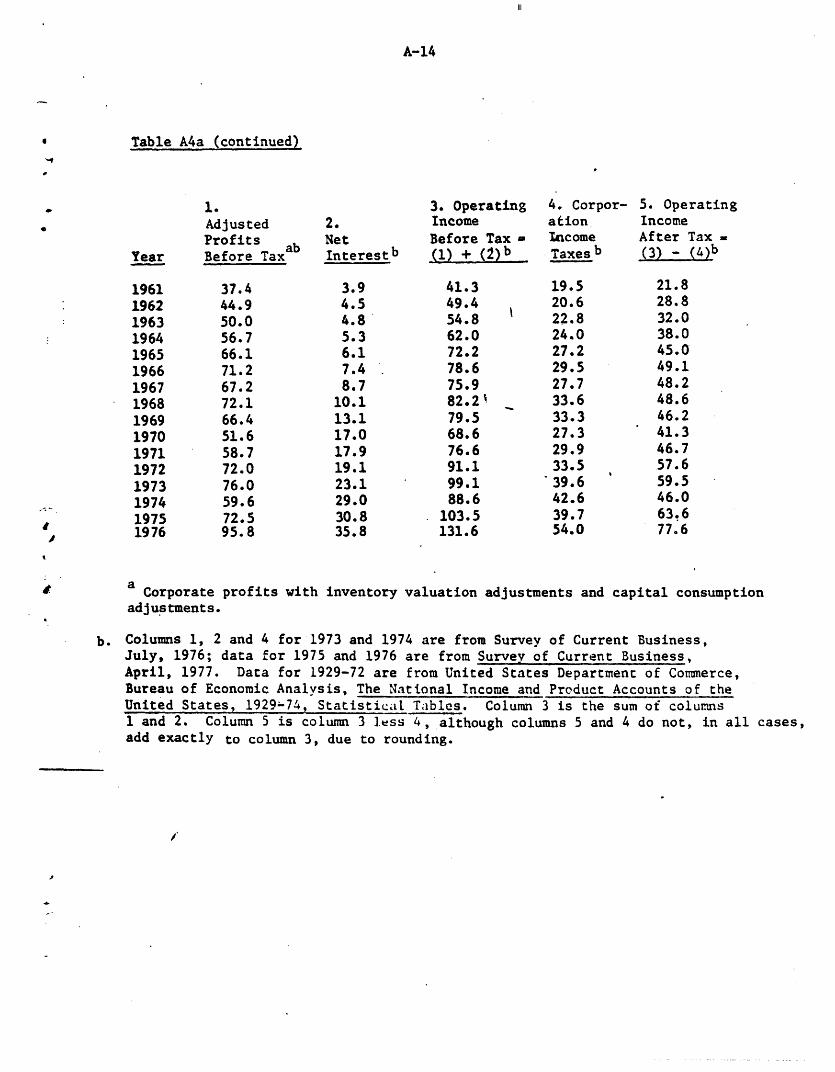
Table A4a (continued)
1.AdjustedProfitsBefore Taxab
2.NetInterestb
3. OperatingIncomeBefore Tax a(1) + (2)b
4. Corpor-ationIncomeTaxesb
5. OperatingIncomeAfter Tax =(3) - (4)b
1961196219631964196519661967196819691970197119721973197419751976J0
37.444.950.056.766.171.267.272.166.451.658.772.076.059.672.595.8
3.94.54.85.36.17.48.7
10.113.117.017.919.123.129.030.835.8
41.349.454.862.072.278.675.982.2'79.568.676.691.199.188.6
103.5131.6
19.520.622.824.027.229.527.733.633.327.329.933.5
-39.642.639.754.0
21.828.832.038.045.049.148.248.646.241.346.757.659.546.063.677.6
Corporate profits with inventory valuation adjustments and capital consumptionadjustments.
b. Columns 1, 2 and 4 for 1973 and 1974 are from Survey of Current Business,July, 1976; data for 1975 and 1976 are from Survey of Current Business,April, 1977. Data for 1929-72 are from United States Department of Commerce,Bureau of Economic Analysis, The National Income and Product Accounts of theUnited States, 1929-74, Statistical Tables. Column 3 is the sum of columns1 and 2. Column 5 is column 3 ].ess 4, although columns 5 and 4 do not, in all cases,add exactly to column 3, due to rounding.
A-14
e
Year
I
111

A-15
Table A4b
Operating Income of Nonfinancial Corporations, 1946 to 1972
Double Declining Balance Depreciation,
Service Lives 85 Percent of Bulletin F
(billions of current dollars)
1.
AdjustedProfitsBefore Taxab
$13.919.324.922.028.632.429.328.727.437.134.633.228.438.236.136.243.648.755.164.068.363.668.161.946.954.267.5
2.NetInterest
$0.70.80.91.00.91.11.21.31.61.61.72.22.73.13.53.94.54.85.36.17.48.7
10.113.117.017.919.1
31. OperatingIncomeBefore Tax -(1) + (2)
$14.620.125.823.029.533.530.530.029.038.736.335.431.141.339.640.148.153.560.470.175.772.378.275.063.972.186.6
4. Corpor-ationIncome
cTaxAS
$8.610.811.89.3
16.921.2
-17.818.515.620.220.119.116.220.719.219.520.622.824.027.229.527.733.633.327.329.933.5
5.Operating IncomeAfter Tax
(3) - (4)
$6.09.314.013.712.612.312.711.513.418.516.216.314.920.620.420.627.530.736.442.946.244.644.641.736.642.253.1
a. Corporate profits with inventory valuation adjustment and capital consumptionadjustments.
b. Data for column 1 are from Survey of Current Business, March 1976, p. 56, line 14.
c. See notes for Table A4a for columns 2 and 4.
Year
194619471948194919501951195219531954195519561957195819591960196119621963196419651966196719681969197019711972
W_1��� __�___�� _1_1�_�__

A-16
Table A4c
Operating Income of Nonfinancial Corporations, 1946 to 1972
Straight Line Deporeciation, Service
Lives Shifting from 100 to 75 Percent of Bulletin F
.(billions of current dollars)
%
1.
AdjustedProfitsBefore Tax
$14.019.825.722.929.533.230.129.528.137.535.133.628.537.935.435.242.347.453.963.167.863.768.462.347.254.267.3
3. Operating2. IncomeNet Before Tax ab aInterest (1) + (2)
$0.7 $14.70.8 20.60.9 26.61.0 23.90.9 30.41.1 34.31.2 31.31.3 30.81.6 29.71.6 39.11.7 36.82.2 35.82.7 31.23.1 41.03.5 38.93.9 39.14.5 46.84.8 52.25.3 59.26.1 69.27.4 75.28.7 71.4
10.1 78.513.1 75.417.0 64.217.9 72.119.1 86.4
4. Corpor- 5.ation Operating IncomeIncome After Tax =TaxesC (3) - (4)
$8.610.811.89.3
16.921.217.818.515.620.220.119.116.220.719.219.520.622.824.027.229.527.733.633.327.329 933.5
$6.19.8
14.814.613.513.113.512.314.118.916.716.715.020.319.719.626.229.435.242.045.744.944.742.136.942.252.9
a. Corporate profits with inventory valuation adjustment and capital consumptionadjustments.
b. Data for column 1 are from Survey of Current Business, March, 1076, p. 56, line 14.
C. See notes for Table A4a for columns 2 and 4.
4.
Year
194619471948194919501951195219531954195519561957195819591960196119621963196419651966196719681969197019711972Notes
111
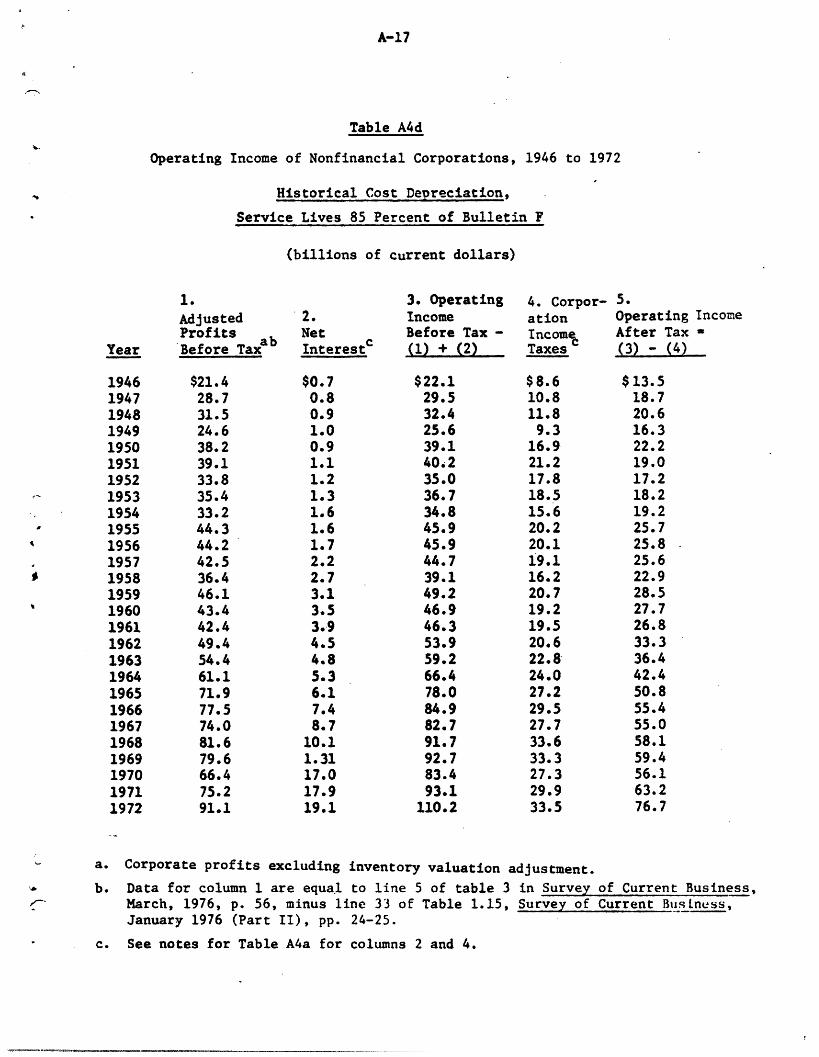
A-17
Table A4d
Operating Income of Nonfinancial Corporations, 1946 to 1972
Historical Cost Depreciation,
Service Lives 85 Percent of Bulletin F
(billions of current dollars)
1.
AdjustedProfits
Year Before Tax
194619471948194919501951195219531954195519561957195819591960196119621963196419651966196719681969197019711972
$21.428.731.524.638.239.133.835.433.244.344.242.536.446.143.442.449.454.461.171.977.574.081.679.666.475.291.1
2.NetInterestc
$0.70.80.91.00.91.11.21.31.61.61.72.22.73.13.53.94.54.85.36.17.48.7
10.11.3117.017.919.1
3. OperatingIncomeBefore Tax -(1) + (2)
$22.129.532.425.639.140.235.036.734.845.945.944.739.149.246.946.353.959.266.478.084.982.791.792.783.493.1
110.2
4. Corpor-ationIncomeTaxes
$8.610.811.8
9.316.921.217.818.515.620.220.119.116.220.719.219.520.622.824.027.229.527.733.633.327.329.933.5
5.Operating IncomeAfter Tax -(3) - (4)
$13.518.720.616.322.219.017.218.219.225.725.825.622.928.527.726.833.336.442.450.855.455.058.159.456.163.276.7
a. Corporate profits excluding inventory valuation adjustment.
I'& b. Data for column 1 are equal to line 5 of table 3 in Survey of Current Business,If-, March, 1976, p. 56, minus line 33 of Table 1.15, Survey of Current Business,
January 1976 (Part II), pp. 24-25.
c. See notes for Table A4a for columns 2 and 4.
��_�
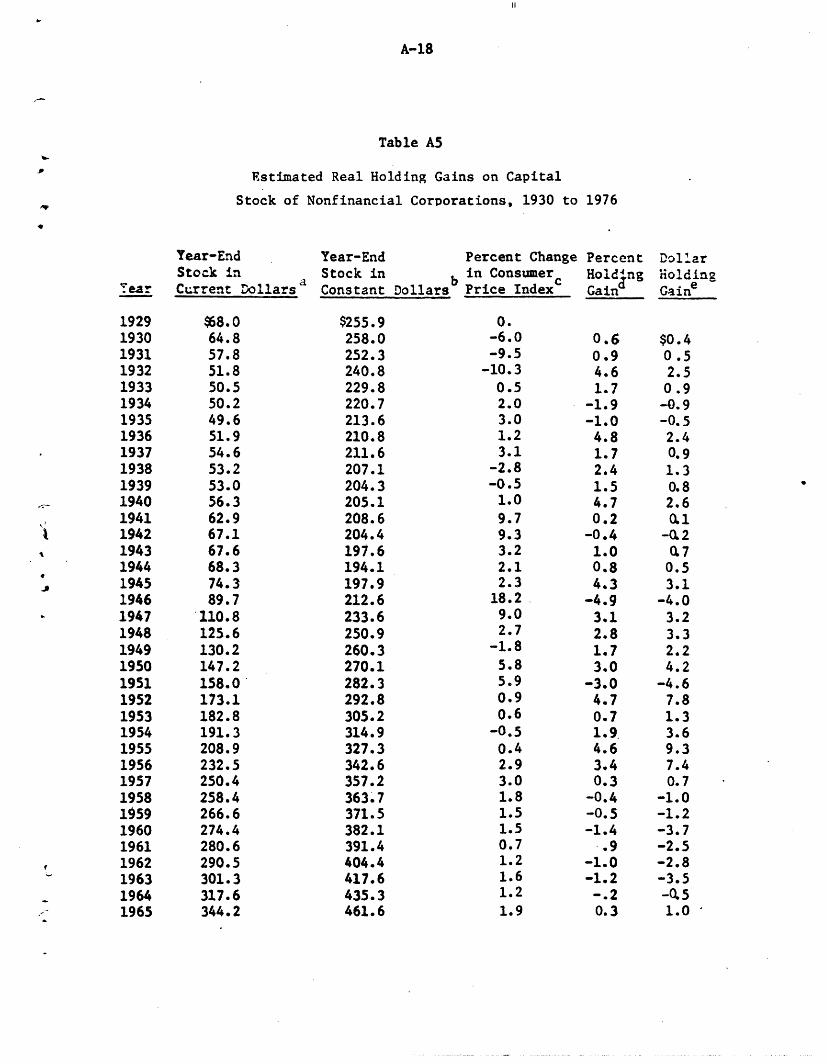
A-18
Table A5
Estimated Real Holding Gains on Capital
Stock of Nonfinancial Corporations, 1930 to 1976
Year-EndStock in
Year Current Dollars "
1929193019311932193319341935193619371938193919401941194219431944194519461947194819491950195119521953195419551956195719581959196019611962196319641965
$8.064.857.851.850.550.249.651.954.653.253.056.362.967.167.668.374.389.7
110.8125.6130.2147.2158.0173.1182.8191.3208.9232.5250.4258.4266.6274.4280.6290.5301.3317.6344.2
Year-End Percent Change PercentStock in in Consumer HoldIngConstant Dollars Price Index Gain
$255.9258.0252.3240.8229.8220.7213.6210.8211.6207.1204.3205.1208.6204.4197.6194.1197.9212.6233.6250.9260.3270.1282.3292.8305.2314.9327.3342.6357.2363.7371.5382.1391.4404.4417.6435.3461.6
0.-6.0-9.5
-10.30.52.03.01.23.1-2.8-0.5
1.09.79.33.22.12.3
18.29.02.7-1.85.85.90.90.6
-0.50.42.93.01.81.51.50.71.21.61.21.9
0.60.94.61.7-1.9-1.04.81.72.41.54.70.2-0.41.00.84.3-4.93.12.81.73.0-3.04.70.71.9.4.63.40.3-0.4-0.5-1.4
.9-1.0-1.2-.20.3
jm
DollarHoldingGaine
$0.40 .52.5
0.9-0.9-0.52.40.91.30.82.60.1
-0.20.70.53.1-4.03.23.32.24.2-4.67.81.33.69.37.40.7
-1.0-1.2-3.7-2.5-2.8-3.5-0.51.0
III

A-19
Table A5 (continued
Year-EndStock in
Year Current Dollars
19661967196819691970197119721973197419751976
379.8415.6460.0514.6565.0610.3664.0763.1899.6994.4
1051.4
Year-EndStock inConstant
493.2520.1547.4576.7599.0618.7642.1673.1701.1711.9723.0
Percent Changein Consumer
Dollars Price Index
3.43.04.76;15.53.43.48.812.27.04.8
a. Current dollar stock is the sum of columns 1 and 2, Table A2a.
b Constant dollar stock includes both residential and nonresidentialcapital. Data from Capital in the United States [3], p. 61 and 285. Data for
1974 to 1976 form Survey of Current Business, August, 1977, p. 57.
c. Change in consumer price idex. Taken from Ibbotsen and Sinquefield[14], Table A-5, pp. 80-81.
, Percent Holding Gain. Computed as follows. Let:
gCUR
gCON
*CPI
- annual rate of increase of the current dollar stock,
- annual rate of increase of the constant dollar stock,
- annual rate of increase of the consmer price index.
gp - annual rate of increase in the underlying price indexfor capital stock.
8p is actually a weighted average of several indexes. There is no wayto observe it directly. However, it can be inferred from gCUR and gCoN'since (1 + $CUlt)
1+ - (1 + gHO)
gP is the nominal capital gain realized by owners of capital stock. Thereal capital gain is found by dividing 1 + gp by 1 + gCPI and subtractingone.
a
Real Capital Gains ata Proportion of Start-of-Year Capital Stock
(1 + )
(1 + CpI)
(1 + gCUR)
(1 + gCO (1 + gCPI)
PercentHoldingGain
-.1
.7
.4
.1
.21.21.4.81.52.4-1.9
DollarHoldingGain
-.4- 2.8
1.7.41.36.88.95.7
12.522.7_19.4
1
- 1.
I-~- ---

A-20
Table A5 - Sources (continued)
e. Dollar holding gain is the product of the fourth column (Percent holdinggain) and the average net fixed capital stock in current dollars, as givenin Table A2a.
#,
II]
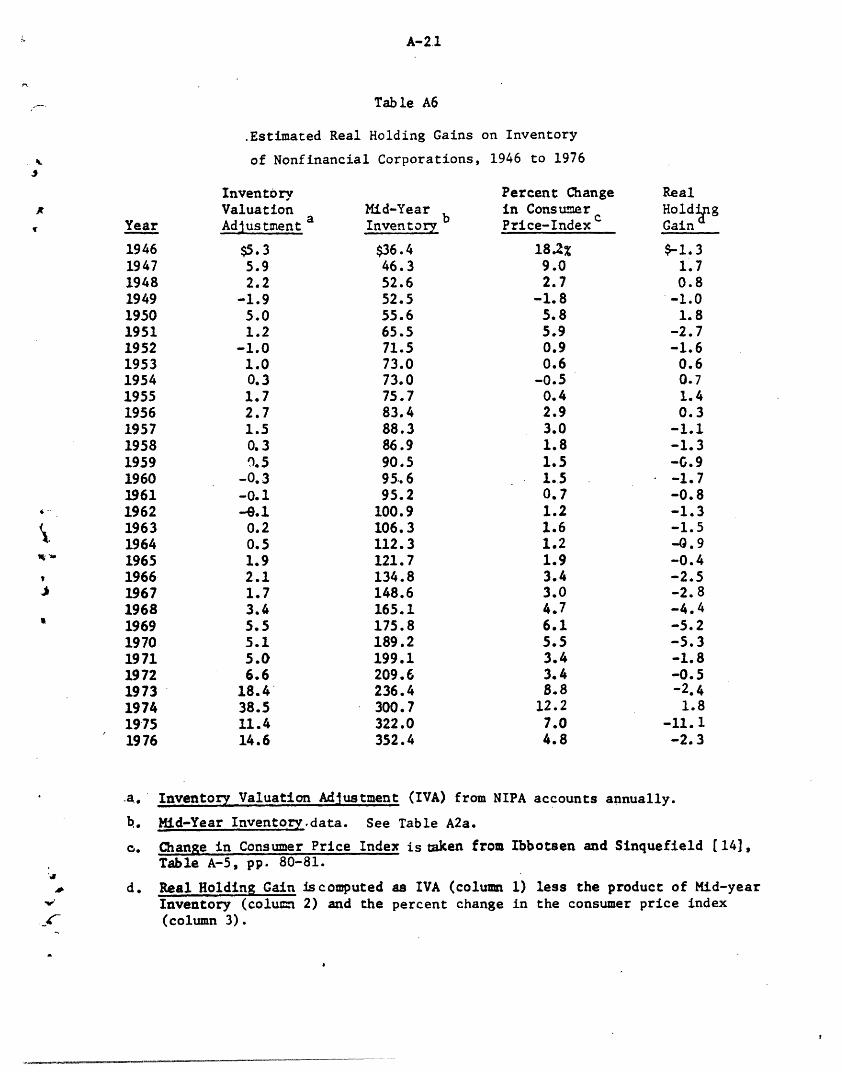
A-21
Table A6
.Estimated Real Holding Gains on Inventory
of Nonfinancial Corporations, 1946 to 1976
InventoryValuationAdJustment a
$5.35.92.2
-1.95.01.2
-1.01.00.31.72.71.50.30.5
-0.3-0.1-0.10.20.51.92.11.73.45.55.15.06.6
18.438.511.414.6
Mid-YearInventory b
$36.446.352.652.555.665.571.573.073.075.783.488.386.990.595..695.2
100.9106.3112.3121.7134.8148.6165.1175.8189.2199.1209.6236.4300.7322.0352.4
Percent Changein ConsumerPrice-Index c
18.2%9.02.7
-1.85.85.90.90.6
-0.50.42.93.01.81.5.1.50.71.21.61.21.93.43.04.76.15.53.43.48.8
12.27.04.8
.a, Inventory Valuation Adjustment (IVA) from NIPA accounts annually.
b. Mid-Year Inventory.data. See Table A2a.
o. Change in Consumer Price Index is taken from Ibbotsen and Sinquefield [14],Table A-5, pp. 80-81.
A. d. Real Holding Gain iscomputed as IVA (column 1) less the product of Mid-yearlv' Inventory (column 2) and the percent change in the consumer price indexJ_~ (column 3).
A
It Year
1946194719481949195019511952195319541955195619571958195919601961196219631964196519661967196819691970197119721973197419'751976
4-
S
RealHoldingGain
$1.31.70.8
-1.01.8
-2.7-1.6
0.60.71.40.3
-1.1-1.3-G.9-1.7-0.8-1.3-1.5-0.9-0.4-2.5-2. 8-4.4-5.2-5.3-1.8-0.5-2.4
1.8-11. 1-2.3
_ _I_1____·_1 �__�U___�___II�/_P�_____11_1-
Related Documents