1 Trends and spatial shifts in lightning fires and smoke concentrations 1 in response to 21 st century climate over the forests of the Western 2 United States 3 Yang Li 1 , Loretta J. Mickley 1 , Pengfei Liu 1 , and Jed O. Kaplan 2 4 1 John A. Paulson School of Engineering and Applied Sciences, Harvard University, Cambridge, 5 MA, USA 6 2 Department of Earth Sciences, The University of Hong Kong, Hong Kong, China 7 Correspondence to: Yang Li ([email protected]) 8 9 Abstract. Almost US$ 3bn per year is appropriated for wildfire management on public land in the 10 United States. Recent studies have suggested that ongoing climate change will lead to warmer and 11 drier conditions in the Western United States with a consequent increase in the number and size of 12 wildfires, yet large uncertainty exists in these projections. To assess the influence of future changes 13 in climate and land cover on lightning-caused wildfires in National Forests and Parks of the 14 Western United States and the consequences of these fires on air quality, we link a dynamic 15 vegetation model that includes a process-based representation of fire (LPJ-LMfire) to a global 16 chemical transport model (GEOS-Chem). Under a scenario of moderate future climate change 17 (RCP4.5), increasing lightning-caused wildfire enhances the burden of smoke fine particulate 18 matter (PM), with mass concentration increases of ~53% by the late-21 st century during the fire 19 season. In a high-emissions scenario (RCP8.5), smoke PM concentrations double by 2100. RCP8.5 20 also shows large, northward shifts in dry matter burned, leading to enhanced lightning-caused fire 21 activity especially over forests in the northern states. 22 https://doi.org/10.5194/acp-2020-80 Preprint. Discussion started: 20 February 2020 c Author(s) 2020. CC BY 4.0 License.

Welcome message from author
This document is posted to help you gain knowledge. Please leave a comment to let me know what you think about it! Share it to your friends and learn new things together.
Transcript

1
Trends and spatial shifts in lightning fires and smoke concentrations 1
in response to 21st century climate over the forests of the Western 2
United States 3
Yang Li1, Loretta J. Mickley1, Pengfei Liu1, and Jed O. Kaplan2 4
1John A. Paulson School of Engineering and Applied Sciences, Harvard University, Cambridge, 5
MA, USA 6
2Department of Earth Sciences, The University of Hong Kong, Hong Kong, China 7
Correspondence to: Yang Li ([email protected]) 8
9
Abstract. Almost US$ 3bn per year is appropriated for wildfire management on public land in the 10
United States. Recent studies have suggested that ongoing climate change will lead to warmer and 11
drier conditions in the Western United States with a consequent increase in the number and size of 12
wildfires, yet large uncertainty exists in these projections. To assess the influence of future changes 13
in climate and land cover on lightning-caused wildfires in National Forests and Parks of the 14
Western United States and the consequences of these fires on air quality, we link a dynamic 15
vegetation model that includes a process-based representation of fire (LPJ-LMfire) to a global 16
chemical transport model (GEOS-Chem). Under a scenario of moderate future climate change 17
(RCP4.5), increasing lightning-caused wildfire enhances the burden of smoke fine particulate 18
matter (PM), with mass concentration increases of ~53% by the late-21st century during the fire 19
season. In a high-emissions scenario (RCP8.5), smoke PM concentrations double by 2100. RCP8.5 20
also shows large, northward shifts in dry matter burned, leading to enhanced lightning-caused fire 21
activity especially over forests in the northern states. 22
https://doi.org/10.5194/acp-2020-80Preprint. Discussion started: 20 February 2020c© Author(s) 2020. CC BY 4.0 License.

2
1 Introduction 23
Both the incidence and duration of large wildfires in the forests of the western United States 24
have increased since the mid-1980s (Westerling et al., 2006; Abatzoglou and Williams, 2016), 25
affecting surface levels of particulate matter (Val Martin et al., 2006), with consequences for 26
human health (Liu et al., 2017) and visibility (Spracklen et al., 2009; Ford et al., 2018). Wildfire 27
activity is influenced by a combination of different factors, including fuel load, fire suppression 28
practices, land use, land cover change, and meteorology (Pechony and Shindell, 2010). Over the 29
forests of the Western United States (WUS), lightning-caused wildfires account for the majority 30
of burned area (Abatzoglou et al., 2016) and have driven most of the recent increase in large 31
wildfires, with human ignition contributing less than 12% to this trend (Westerling, 2016). Studies 32
suggest that a warming climate could enhance wildfires in the WUS (Yue et al., 2013; Abatzoglou 33
and Williams, 2016), but quantifying future wildfire activity is challenging, given uncertainties in 34
land cover trends and in the relationships between fire and weather. Not all studies have accounted 35
for changing land cover or have distinguished the effects of lightning fire ignitions from human-36
started fires. In this study, we project lightning-caused fire emissions over the National Parks and 37
Forests of the WUS in the mid- and late- 21st century, using a dynamic global vegetation model 38
combined with a chemical transport model. Our goal is to understand how trends in both land cover 39
and meteorology may affect natural fire activity and smoke air quality over the 21st century. 40
Consistent with projections of increasing wildfire in the WUS, recent studies have also 41
predicted enhancement of fire-generated PM under a warmer and drier climate in this region (Yue 42
et al., 2013; Yue et al., 2014; Spracklen et al., 2009; Ford et al., 2018; Westerling et al., 2006). 43
Some of these studies relied on statistical models that relate meteorological variables to fire metrics 44
such as area burned; these models can then be applied to projections from climate models (Yue et 45
https://doi.org/10.5194/acp-2020-80Preprint. Discussion started: 20 February 2020c© Author(s) 2020. CC BY 4.0 License.

3
al., 2013; Yue et al., 2014; Spracklen et al., 2009; Archibald et al., 2009; Wotton et al., 2003; 46
Westerling and Bryant, 2008). However, these statistical methods do not account for changes in 47
vegetation due to climate, increasing atmospheric CO2 concentrations, or land use. A further 48
weakness of these studies is that they do not consider whether enhanced fire activity in the future 49
atmosphere may ultimately deplete the supply of woody fuels (Yue et al., 2013; Yue et al., 2014). 50
Other studies have coupled global vegetation models to climate models to better represent such 51
fire-vegetation-climate interactions (Chaste et al., 2018). These coupled models integrate 52
vegetation dynamics, land-atmosphere exchanges, and other key physical processes, allowing 53
consideration of many factors driving fire activity and smoke pollution on regional scales (Ford et 54
al., 2018). Building on this research, we use an integrated vegetation-climate model system with 55
these aims: (1) to clarify how changing meteorology and vegetation together drive future lightning-56
caused wildfire activity and (2) to provide predictions of smoke pollution at finer spatial resolution 57
than previously. Our approach accounts for the impact of future climate and lightning fires on fuel 58
structure, and these fine-scale predictions are of greater utility to environmental managers and 59
especially the health impacts community. 60
Lightning is the predominant cause of wildfire ignition in most mountainous and forest 61
regions of the WUS during months that have high fire frequency (Abatzoglou et al., 2016; Balch 62
et al., 2017). In remote and mountainous terrain, anthropogenic ignitions are infrequent and >90% 63
of total area burned is caused by lightning-started fires (Abatzoglou et al., 2016). Here we study 64
lightning-caused fires over the National Parks and Forests of the WUS in the mid- and late- 21st 65
century under two future climate change scenarios defined by Representative Concentration 66
Pathways (RCPs). RCP4.5 represents a moderate pathway with gradual reduction in greenhouse 67
gas (GHG) emissions after 2050, while RCP8.5 assumes continued increases in GHGs throughout 68
https://doi.org/10.5194/acp-2020-80Preprint. Discussion started: 20 February 2020c© Author(s) 2020. CC BY 4.0 License.

4
the 21st century. We use the Lund-Potsdam-Jena-Lausanne-Mainz (LPJ-LMfire) Dynamic Global 69
Vegetation Model (Pfeiffer et al., 2013) to simulate dynamic fire-vegetation interactions under 70
future climate. LPJ-LMfire, which has been used previously to investigate historical fire activity 71
(e.g., Chaste et al., 2018), is applied here to estimate natural fire emissions under future climate 72
simulated by the Goddard Institute for Space Studies (GISS) Model E climate model. 73
July, August, and September (JAS) are the months of greatest fire activity in WUS forests 74
(Park et al., 2003) and the focus of our study. We limit the spatial extent of our analyses to the 75
National Parks and Forests of the WUS, here defined as 31°N – 49°N, 100°W – 125°W. For 76
RCP4.5, the GISS model predicts a statistically significant increase in surface temperature of 1.4 77
K averaged over the entire region by 2050 during JAS; for RCP8.5, the mean JAS temperature 78
increase is 3.7 K by 2100. In both future climate scenarios, significant precipitation decreases of 79
~20% by 2100 are simulated. Several studies have predicted future increases in lightning due to 80
climate change (e.g., Price and Rind, 1994a, ). However, the relationship between lightning flash 81
rate and meteorology is poorly constrained in models and depends largely on physical parameters 82
such as cold cloud thickness, cloud top height, or convective available potential energy. In our 83
study, we use the convective mass flux from the GISS model to calculate lightning density in terms 84
of flashes km-2 day-1. Unlike surface temperature and precipitation, we find that average lightning 85
density over the West does not change significantly during the 21st century, as described in Fig. 86
S1. 87
LPJ-LMfire simulates wildfire emissions of black carbon (BC) and organic carbon (OC) 88
particles, which are then passed to the global atmospheric chemistry-transport model GEOS-Chem, 89
to simulate the transport and distribution of wildfire smoke across the West. For each RCP, LPJ-90
LMfire simulates vegetation dynamics and fire continuously for the period 2006-2100, with 91
https://doi.org/10.5194/acp-2020-80Preprint. Discussion started: 20 February 2020c© Author(s) 2020. CC BY 4.0 License.

5
monthly resolution. For reasons of computational demand, we were limited to conducting two 92
time-slice simulations with GEOS-Chem focused around 2010 and 2100, with each time slice 93
covering 5 continuous years. For further details, see Methods section below. 94
95
2 Methods 96
We quantify the effects of changing climate on area burned and fire emissions caused by 97
lightning over the National Forests in the WUS using the LPJ-LMfire model (Pfeiffer et al., 2013), 98
driven by meteorological fields from the GISS-E2-R climate model (Nazarenko et al., 2015). 99
Natural wildfire emissions of dry matter burned calculated by LPJ-LMfire are then passed to 100
GEOS-Chem, a 3-D chemical transport model, to simulate the transport of wildfire smoke across 101
the WUS. 102
2.1 LPJ-LMfire 103
The LPJ-LMfire dynamic vegetation model is driven by gridded climate, soil, land use 104
fields, and atmospheric CO2 concentrations, and simulates vegetation structure, biogeochemical 105
cycling, and wildfire (Pfeiffer et al., 2013; Sitch et al., 2003). Wildfires are simulated based on 106
processes including explicit calculation of lightning ignitions, the representation of multi-day 107
burning and coalescence of fires, and the calculation of rates of spread in different vegetation types 108
(Pfeiffer et al., 2013). The climate anomaly fields from the GISS-E2-R climate model used to 109
prepare a future scenario for LPJ-LMfire are monthly mean surface temperature, diurnal 110
temperature range (i.e., the difference between monthly mean daily maximum and daily minimum 111
temperatures), total monthly precipitation, number of days in the month with precipitation greater 112
than 0.1 mm, monthly mean total cloud cover fraction, and monthly mean surface wind speed. 113
This version of the GISS model was configured for Phase 5 of the Coupled Model Intercomparison 114
https://doi.org/10.5194/acp-2020-80Preprint. Discussion started: 20 February 2020c© Author(s) 2020. CC BY 4.0 License.

6
Project (CMIP5) (Nazarenko et al., 2015). Lightning strike density for application in LPJ-LMfire 115
is calculated using the GISS convective mass flux following the empirical parameterization of 116
Magi, 2015. We run LPJ-LMfire on a 0.5°×0.5° global grid, though for this study only results over 117
the National Parks and Forests of the WUS are analyzed. 118
The GISS-E2-R meteorology used here covers the period 1801-2100 at a resolution of 2° 119
latitude x 2.5° longitude. The start year of the two climate scenarios, RCP4.5 and RCP8.5, is 2006. 120
The two RCPs capture a range of possible climate trajectories over the 21st century, with radiative 121
forcings at 2100 relative to pre-industrial values of +4.5 W m-2 for RCP4.5 and +8.5 W m-2 for 122
RCP8.5. From 2011 to 2015, the greenhouse gas concentrations of the two scenarios are nearly 123
identical. To downscale the GISS meteorological fields to finer resolution for LPJ-LMfire, we first 124
calculate the 2010-2100 monthly anomalies relative to the average over the 1961-1990 period, and 125
then add the resulting timeseries to a high-resolution observationally based climatology at 0.5° 126
latitude × 0.5° longitude spatial resolution. The climatology was prepared using the datasets 127
including WorldClim 2.1, Climate WNA, CRU CL 2.0, Wisconsin HIRS Cloud Climatology, and 128
LIS/OTD, as described in Pfeiffer et al., 2013. The LPJ-LMfire simulations used here cover the 129
period 2006-2100 at a monthly timestep. Future land use scenarios applied follow those in CMIP5, 130
in which the extent of crop and pasture cover in the WUS increases by 30% in future climates 131
(Brovkin et al., 2013; Kumar et al., 2013). 132
Passive fire suppression results from landscape fragmentation caused by land use (e.g., for 133
crop and grazing land, roads, and urban areas), and this influence on fire activity is included in the 134
LPJ-LMfire simulations (Pfeiffer et al., 2013). The model does not, however, consider the active 135
fire suppression practiced throughout much of the WUS. We therefore limit our study to wildfire 136
activity on the National Park and Forest lands of the WUS that are dominated by lightning fires 137
https://doi.org/10.5194/acp-2020-80Preprint. Discussion started: 20 February 2020c© Author(s) 2020. CC BY 4.0 License.

7
and where land use for agriculture and urban areas is minimal. To focus only on National Park and 138
Forest lands, we apply a 0.5° × 0.5°raster across the WUS that identifies the fraction of each grid 139
cell that belongs to a National Forest or National Park, and we consider only these areas in our 140
analysis. 141
2.2 Fire emissions 142
Fuel biomass in LPJ-LMfire is discretized by plant functional type (PFT) into specific live 143
biomass and litter categories, and across four size classes for dead fuels. The model simulates 144
monthly values of total dry matter burned for nine PFTs as in Pfeiffer et al., 2013. To pass LPJ-145
LMfire biomass burning emissions to GEOS-Chem, we first reclassify these nine PFTs into the 146
six land cover types considered by GEOS-Chem. See Table 2 for a summary of the reclassification 147
scheme. Tropical broadleaf evergreen, tropical broadleaf raingreen, and C4 grasses are not 148
simulated by LPJ-LMfire in the National Parks and Forests of the WUS. Emission factors based 149
on the six land cover types in GEOS-Chem are then applied to dry matter burned from LPJ-LMfire, 150
resulting in monthly BC and OC emissions over National Forests. These factors are from Akagi et 151
al., 2011. As lightning-started wildfires are dominant over the WUS forests, an evaluation of fire 152
emissions over National Park and Forest lands from the LPJ-LMfire model against the Global Fire 153
Emissions Database (GFED4s) inventory (Giglio et al., 2013) is included in the Supplement (Fig. 154
S2). 155
2.3 GEOS-Chem 156
We use the GEOS-Chem chemical transport model (version 12.0.1; 157
http://acmg.seas.harvard.edu/geos/). For three time slices including the present day, mid- and late- 158
21st century, we compare the five-year averaged (i.e., 2011-2015, 2051-2055, 2096-2100) living 159
biomass and lightning fire emissions from the continuous LPJ-LM simulations with ten-year 160
https://doi.org/10.5194/acp-2020-80Preprint. Discussion started: 20 February 2020c© Author(s) 2020. CC BY 4.0 License.

8
averages (i.e., 2006-2015, 2046-2055, 2091-2100). We find differences of less than 20% caused 161
by extending the length of the time slices. We therefore perform two five-year time slice 162
simulations for each RCP, covering the present day (2011-2015) and the late-21st century (2096-163
2100). For each time slice, we first carry out a global simulation at 4° latitude x 5° longitude spatial 164
resolution, and then downscale to 0.5° × 0.625° over the WUS via grid nesting over the North 165
America domain. For computational efficiency, we use the aerosol-only version of GEOS-Chem, 166
with monthly mean oxidants archived from a full-chemistry simulation, as described in Park et al., 167
2004. The GEOS-Chem simulations are driven with present-day MERRA-2 reanalysis 168
meteorology from NASA/GMAO (Gelaro et al., 2017) to isolate the effect of changing wildfires 169
on U.S. air quality. The simulations include emissions of all primary PM and the gas-phase 170
precursors to secondary particles, with non-fire particle sources comprising fossil fuel combustion 171
from transportation, industry, and power plants from the 2011 EPA NEI inventory. In the future 172
time slices, non-fire emissions remain fixed at present-day levels. 173
Our study focuses on carbonaceous PM (smoke PM; BC+OC), which are the main 174
components in wildfire smoke (Chow et al., 2011). For the present day, we apply 5-year (2011-175
2015) averaged GFED4s emissions to those regions that fall outside National Forests and 176
temporally changing LPJ-LMfire emissions from the two RCPs within the Forests (Figs. S3-S4). 177
Implementing the combined emissions allow us to further validate the simulated results in this 178
study using observations. For the future time slices, we assume that fires outside the National 179
Forests remain at present-day levels, and we again combine the 2011-2015 GFED4s fire emissions 180
with the temporally changing, future LPJ-LMfire emissions over the National Forests. 181
182
183
https://doi.org/10.5194/acp-2020-80Preprint. Discussion started: 20 February 2020c© Author(s) 2020. CC BY 4.0 License.

9
3 Results 184
3.1 Spatial shifts in fire activity 185
Under both RCPs, 21st century climate change and increasing atmospheric CO2 186
concentrations lead to shifts in the distribution of total living biomass and dry matter burned. Fig. 187
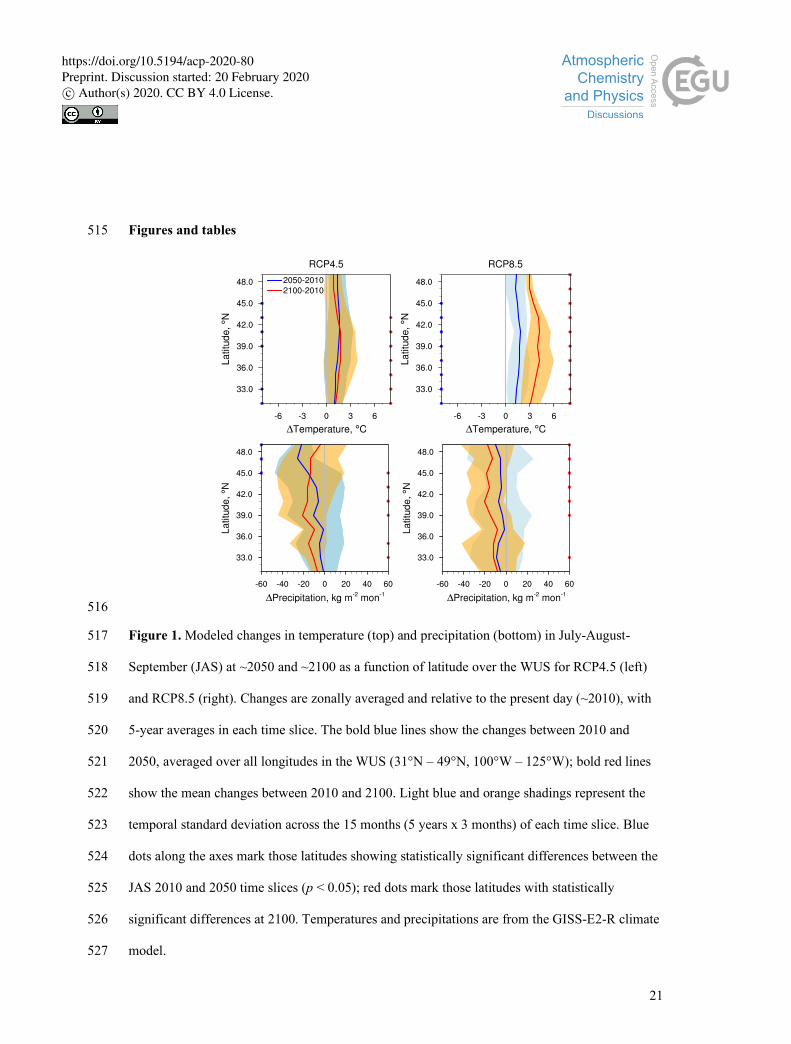
1 shows the changes in monthly mean temperature and precipitation averaged zonally over grid 188
cells at each 1°latitude of the West, relative to the present day, defined as ~2010. Peak temperature 189
enhancements in JAS occur between 36°-42° N for ~2050 and ~2100 in both RCPs, with a 190
maximum enhancement of 4 °C for RCP4.5 and 6 °C for RCP8.5 in 2100. Significant decreases 191
in JAS precipitation occur between 33°-45° N under RCP4.5 and at latitudes north of 39° N under 192
RCP8.5 for ~2100. The maximum decrease in monthly precipitation over the West is ~40 kg m-2 193
(~60%) in JAS under both RCPs. These warmer and drier conditions favor fire activity under future 194
climate. 195
Fires and smoke production are dependent on fuel load, and throughout the 21st century, 196
total living biomass in the WUS is primarily concentrated in northern forests (Fig. 2). For RCP4.5, 197
living biomass exhibits significant enhancements in U.S. National Parks and Forests at latitudes 198
north of 43° N in the 2050 time slice and north of 45° N in the 2100 time slice. North of 46° N, 199
the change in living biomass at 2100 (~0.4 kg C m-2) is double that at 2050 (~0.2 kg C m-2). At 200
latitudes south of 40°N, living biomass in RCP4.5 is generally invariant over the 21st century. In 201
RCP8.5, living biomass also increases significantly near the Canadian border – e.g., as much as 202
~0.2 kg C m-2 for the 2050 time slice and ~0.4 kg C m-2 for the 2100 time slice, relative to the 203
present day. In contrast, at latitudes between 42°-47° N in RCP8.5, total living biomass decreases 204
by as much as -0.6 kg C m-2 for ~2100. For both RCPs, these mid-century and late-century changes 205
in total living biomass are significant (p < 0.05) across nearly all latitudes. In RCP4.5, the spatial 206
https://doi.org/10.5194/acp-2020-80Preprint. Discussion started: 20 February 2020c© Author(s) 2020. CC BY 4.0 License.

10
shifts of total living biomass are relatively weak from 2050 to 2100, consistent with the moderate 207
climate scenario with gradual reduction in greenhouse gas emissions after 2050. However, under 208
the continued-emissions climate scenario RCP8.5, total living biomass in these forests first 209
increases by 2050 and then decreases by ~10% by 2100, indicating a strongly disturbed vegetation 210
system due to climate change. Despite this decrease, living biomass in this scenario is still 211
abundant in the West in 2100, especially over the northern forests (not shown), suggesting that 212
future climate change will not limit fuel load. Table 1 summarizes these results. 213
LPJ-LMfire simulates boreal needleleaf evergreen and boreal and temperate summergreen 214
(broadleaf) trees as the dominant plant functional types (PFTs) in the National Parks and Forests 215
of the WUS; these PFTs together account for ~90% of the total biomass in our study domain. 216
Changes over the 21st century (Fig. 2) reflect the changes in the growth and distribution of these 217
PFTs, with increases in living biomass in the north and decreases in the south in both RCP 218
scenarios (Fig. S5). In the 2100 time slice, vegetation shifts further north than in the 2050 time 219
slice. The reasons for this shift can be traced to the climate regimes favored by different vegetation 220
types, with temperate and boreal trees showing moderate to strong inclination in their growth along 221
the north-south temperature gradient (Aitken et al., 2008). For example, the temperate broadleaf 222
summergreen PFT favors regions with moderate mean annual temperatures and distinct warm and 223
cool seasons (Jarvis and Leverenz, 1983), while boreal needleleaf evergreen generally occurs in 224
colder climate regimes (Aerts, 1995). With rising temperatures, the living biomass of temperate 225
summergreen trees increases in most states in the WUS, with maximum enhancement of +1.0 kg 226
C m-2 in western Washington, northern Montana, and Idaho by 2100 in RCP8.5 relative to 2010. 227
Decreases in this vegetation type for this scenario occur in the south, as much as -0.5 kg C m-2 in 228
New Mexico. In contrast, boreal trees increase in only a few regions in the far north, with a 229
https://doi.org/10.5194/acp-2020-80Preprint. Discussion started: 20 February 2020c© Author(s) 2020. CC BY 4.0 License.

11
substantial contraction in their abundance over much of the West, as much as -4.0 kg C m-2 for 230
boreal needleleaf evergreen by 2100 in RCP8.5 over the northern forests. 231
Simulated area burned from lightning-ignited fires in the National Parks and Forests of the 232
WUS increases by ~30% by ~2050, and by ~50% by ~2100 for both RCPs (not shown), 233
comparable to the predicted 78% increase in lightning-caused area burned in the U.S. under a 234
doubled CO2 climate by Price and Rind, 1994b. That study, however, projected an increase in 235
lightning flashes and did not consider changing land cover. The changes we calculate at 2050 are 236
also within the range of previous studies using statistical methods for this region (e.g., 54% in 237
Spracklen et al., 2009 and 10-50% in Yue et al., 2013). Fig. 2 further shows that dry matter burned, 238
a function of both area burned and fuel load, increases relative to the present at most latitudes at 239
both 2050 and 2100 and in both RCPs. Year-to-year variations in dry matter burned are greater 240
than those in living biomass due to variations in the meteorological conditions driving fire 241
occurrence. Previous studies have found that interannual variability in wildfire activity is strongly 242
associated with regional surface temperature (Westerling et al., 2006; Yue et al., 2013). We show 243
here that although total living biomass mostly decreases at latitudes ~45° N by ~2100 under 244
RCP8.5, the peak enhancements in dry matter burned also occur at these latitudes, indicating that 245
the modeled changes in fire activity are driven by changes in meteorological conditions that favor 246
fire, as well as by shifts towards more pyrophilic landscapes such as open woodlands and savannas. 247
As with biomass, lighting-caused fires also shift northward over the 21st century, especially in 248
RCP8.5. In this scenario, dry matter burned increases by as much as 35 g m-2 mon-1 across 40°-249
48°N at ~2100 compared to the present day. By 2100, the fire-season total dry matter burned over 250
the forests in the West increases by 24.58 Tg/JAS (111%) under RCP4.5 and by 50.00 Tg/JAS 251
(161%) in RCP8.5 (Table 1). 252
https://doi.org/10.5194/acp-2020-80Preprint. Discussion started: 20 February 2020c© Author(s) 2020. CC BY 4.0 License.

12
The spatial distributions of changes in total living biomass and dry matter burned are shown 253
in Fig. 3. Under RCP4.5, moderate decreases in total living biomass (by as much as -2.5 kg C m-2) 254
and increases in dry matter burned by 2100 (up to ~70 g m-2 mon-1) are concentrated in central 255
Idaho, Wyoming, and Colorado. Large declines in total living biomass and enhancements in dry 256
matter burned occur in the forests of Idaho and Montana by 2100 under RCP8.5, with a hotspot of 257
-5.0 kg C m-2 in biomass and +100 g m-2 mon-1 in dry matter burned in Yellowstone National Park. 258
Similar trends in total living biomass and dry matter burned are also predicted for the Sierra 259
Nevada (SN) region in California (Fig. S6). As shown in Table 1, predicted changes in dry matter 260
burned over the SN forests by 2050 are 17-44%, comparable to the calculated future increases of 261
30-50% by Yue et al., 2014. We find significant increases in dry matter burned of 81% by 2100 262
under RCP8.5 in this region. Our results suggest that even as future climate change diminishes 263
vegetation biomass in some regions of the WUS, sufficient fuel still exists to allow increases in 264
fire activity and dry matter burned. 265
3.2 Smoke PM 266
Given the large uncertainty in secondary aerosol formation within smoke plumes (Ortega 267
et al., 2013), we assume that smoke PM mainly consists of primary BC and OC. We calculate 268
emissions of fire-specific BC and OC by combining the estimates of the dry matter burned with 269
emissions factors from Akagi et al., 2011, which are dependent on land cover type. Application of 270
these emissions to GEOS-Chem allows us to simulate the transport and distribution of smoke PM 271
across the WUS. 272
With increasing lightning fire activity in most of the National Park and Forest areas of the 273
WUS over the 21st century (Fig. 3), smoke PM shows modest enhancement for RCP4.5, but more 274
substantial increases for RCP8.5 (Fig. 4). Smoke PM enhancements in RCP4.5 occur primarily 275
https://doi.org/10.5194/acp-2020-80Preprint. Discussion started: 20 February 2020c© Author(s) 2020. CC BY 4.0 License.

13
over the forests along the state boundaries of Idaho, Montana, and Wyoming, with large increases 276
by as much as ~10 µg m-3 in Yellowstone National Park. Scattered increases in smoke PM in 277
RCP4.5 are also predicted over the forests in northern Colorado, northern California, western 278
Oregon, and central Arizona. In RCP8.5, smoke PM enhancements are widespread over the 279
northern states of the WUS by 2100, with significant increases in regions east of the Rocky 280
Mountains. Increased fire activity and large smoke PM enhancements are seen by 2100 in RCP8.5, 281
including large areas of the Flathead, Nez Perce, Clearwater, Arapaho, and Roosevelt National 282
Forests. Particularly large increases – as much as ~40 µg m-3– occur in Yellowstone National Park. 283
The increases in fire in these forests significantly influences air quality over the entire area of 284
Idaho, Montana, Wyoming, and Colorado, with effects extending eastward to Nebraska and the 285
Dakotas. Increased smoke PM is also predicted over the Sierra Nevada in both RCPs. In RCP4.5, 286
average smoke PM over the entire WUS increases by 53% compared to present (Table 1). For 287
RCP8.5, smoke PM more than doubles (109% increase) at ~2100. 288
289
4 Discussion 290
We apply a coupled modeling approach to investigate the impact of changes in climate and 291
vegetation on future lightning-caused wildfires and smoke pollution across the WUS in the 21st 292
century. For RCP4.5, the late-21st century lightning-caused wildfire-specific smoke PM in the 293
West increases ~53% relative to present. Comparable fire activity between 2050 and 2100 reflect 294
the effectiveness of the emission reduction strategies after 2050 under RCP4.5, as temperature 295
changes across the West are relatively flat from 2050 to 2100, with a nearly constant area-averaged 296
mean annual temperature of ~19.2°C. In RCP8.5, mean annual temperatures continue increasing 297
over the second half of the 21st century across the West, nearly 2.1°C from 2050, and wildfire-298
https://doi.org/10.5194/acp-2020-80Preprint. Discussion started: 20 February 2020c© Author(s) 2020. CC BY 4.0 License.

14
specific PM concentrations double by 2100. 299
In table S1 we compare predictions in this study with previous fire estimates under future 300
climate. A difference between these studies and ours is that we consider only changes in fire 301
activity over the National Parks and Forests while others examine changes over the whole WUS. 302
However, we find that in the GFED4s inventory, present-day fire emissions outside these federally 303
managed areas contribute less than 1% of DM burned. Also, the fact that lightning is the dominant 304
driver of wildfire activity over the WUS forests (Balch et al., 2017) allows a reasonable 305
comparison of the estimates in this study with those in previous studies that include both lightning 306
and human-started fires over the West. 307
Table S1 shows that fire activity in the U.S. is predicted to increase in all studies cited. 308
However, the projected changes in fire metrics such as area burned or in emissions or 309
concentrations of smoke vary greatly across studies, from ~10-300% relative to present-day values. 310
These discrepancies arise from differences in the methodologies, fire assumptions, and future 311
scenarios applied. The ~80% increases in smoke emissions that we project by 2050 is generally 312
lower than estimates in previous statistical studies (e.g., 150-170% in Yue et al., 2013 or 100% in 313
Spracklen et al., 2009), but comparable to the predicted 78% increase in lightning-caused area 314
burned in the U.S. under a doubled CO2 climate by Price and Rind, 1994b, which did not account 315
for vegetation changes due to climate change or changing CO2. In contrast, the ~80% increase in 316
smoke emissions in this study at ~2050 are substantially higher than the ~40% increases predicted 317
by Ford et al., 2018 over the West, though the magnitudes of emission changes in the two studies 318
are similar. As in our study, Ford et al., 2018 relied on a land cover model, but they also attempted 319
to account for the influence of future changes in meteorology and population on the suppression 320
and ignition of fires. Ford et al., 2018 predicted scattered emission increases of 40-45% over the 321
https://doi.org/10.5194/acp-2020-80Preprint. Discussion started: 20 February 2020c© Author(s) 2020. CC BY 4.0 License.

15
West and a large increase of 85-220% over the Southeast due to increasing population and the role 322
of human ignition. However, human activities have diverse impacts on wildfires, and those impacts 323
are a function of land management policy, economics, and other social trends, making it 324
challenging to predict how trends in human ignitions, fuel treatment, and fire suppression will 325
evolve in the future (Fusco et al., 2016). In our study, we confine our focus to fires in National 326
Parks and Forests in the West, where human activities such as landscape fragmentation through 327
land use are less important. We further find that the patterns of increasing fire emissions by 2100 328
in our study – i.e., over the forests in northern Idaho, western Montana, and over the U.S. Pacific 329
Northwest – are similar to those predicted by other studies, including Rogers et al., 2011 and Ford 330
et al., 2018. Our study also predicts significantly elevated smoke PM in Utah, Wyoming, and 331
Colorado in the late-21st century under RCP8.5 and in regions east of the Rocky Mountains because 332
of the prevailing westerly winds. 333
The following limitations apply to our study. The vegetation model simulations of biomass 334
and fire are driven by meteorology from just one climate model, GISS-E2-R. Over the WUS, this 335
model simulates future temperature changes at the low end of projections by the CMIP5 ensemble, 336
making our predictions of future fire conservative (Sheffield et al., 2013; Ahlström et al., 2012; 337
Rupp et al., 2013). Anthropogenic ignitions are not considered in this study, but fire behavior and 338
therefore burned area are primarily governed by meteorology and fuel structure, both of which are 339
simulated by LPJ-LMfire. The fire simulations are performed on a 0.5°×0.5° grid, which cannot 340
capture some the fine-grain structure of the complex topography and sharp ecotones present in our 341
study area (e.g., Shafer et al., 2015). Our study also does not consider the effects of future climate 342
change on the transport or lifetime of smoke PM. Previous work, however, has shown that such 343
effects on smoke PM are likely to be small relative to the effect of changing wildfire activity 344
https://doi.org/10.5194/acp-2020-80Preprint. Discussion started: 20 February 2020c© Author(s) 2020. CC BY 4.0 License.

16
(Spracklen et al., 2009). 345
Within these limitations, our results highlight the vulnerability of the WUS to lightning-346
caused wildfire in a changing climate. Even though a changing climate decreases the living 347
biomass in some regions, we find that ample vegetation exists to fuel increases in fire activity and 348
smoke. Especially strong enhancements in smoke PM occur in the Northern Rockies in the late-349
21st century under both the moderate and strong future emissions scenarios, suggesting that climate 350
change will have a large, detrimental impact on air quality, visibility, and human health in a region 351
valued for its National Forests and Parks. Our study thus provides a resource for environmental 352
managers to better prepare for air quality challenges under a future climate change regime. 353
354
355
356
Data availability 357
Data related to this paper may be requested from the authors. 358
359
Author contributions 360
Y.L. conceived and designed the study, performed the GEOS-Chem simulations, analyzed the data, 361
and wrote the manuscript, with contributions from all coauthors. J.O.K. performed the LPJ-LMfire 362
simulations. 363
364
Competing interests 365
The authors declare that they have no competing interest. 366
367
https://doi.org/10.5194/acp-2020-80Preprint. Discussion started: 20 February 2020c© Author(s) 2020. CC BY 4.0 License.

17
Acknowledgments 368
This research was developed under Assistance Agreements 83587501 and 83587201 awarded by 369
the U.S. Environmental Protection Agency (EPA). It has not been formally reviewed by the EPA. 370
The views expressed in this document are solely those of the authors and do not necessarily reflect 371
those of the EPA. We thank all of the data providers of the datasets used in this study. PM data 372
was provided by the Interagency Monitoring of Protected Visual Environments (IMPROVE; 373
available online at http://vista.cira.colostate.edu/improve). IMPROVE is a collaborative 374
association of state, tribal, and federal agencies, and international partners. U.S. Environmental 375
Protection Agency is the primary funding source, with contracting and research support from the 376
National Park Service. JOK is grateful for access to computing resources provided by the School 377
of Geography and the Environment, University of Oxford. The Air Quality Group at the University 378
of California, Davis is the central analytical laboratory, with ion analysis provided by the Research 379
Triangle Institute, and carbon analysis provided by the Desert Research Institute. We acknowledge 380
the World Climate Research Programme’s Working Group on Coupled Modelling, which is 381
responsible for CMIP, and we thank the group of NASA Goddard Institute for Space Studies for 382
producing and making available their GISS-E2-R climate model output. For CMIP the U.S. 383
Department of Energy’s Program for Climate Model Diagnosis and Intercomparison provides 384
coordinating support and led development of software infrastructure in partnership with the Global 385
Organization for Earth System Science Portals. The GISS-E2-R dataset were downloaded from 386
https://cmip.llnl.gov/cmip5/. We thank the Land-use Harmonization team for producing the 387
harmonized set of land-use scenarios and making available the dataset online at 388
http://tntcat.iiasa.ac.at/RcpDb/. We also thank X. Yue for providing the raster of southern 389
California. 390
https://doi.org/10.5194/acp-2020-80Preprint. Discussion started: 20 February 2020c© Author(s) 2020. CC BY 4.0 License.

18
References 391
Abatzoglou, J. T., Kolden, C. A., Balch, J. K., and Bradley, B. A.: Controls on interannual 392 variability in lightning-caused fire activity in the western US, Environmental Research 393 Letters, 11, 045005, 2016. 394
Abatzoglou, J. T., and Williams, A. P.: Impact of anthropogenic climate change on wildfire 395 across western US forests, Proceedings of the National Academy of Sciences, 113, 11770-396 11775, 2016. 397
Aerts, R.: The advantages of being evergreen, Trends in ecology & evolution, 10, 402-407, 1995. 398 Ahlström, A., Schurgers, G., Arneth, A., and Smith, B.: Robustness and uncertainty in terrestrial 399
ecosystem carbon response to CMIP5 climate change projections, Environmental Research 400 Letters, 7, 044008, 2012. 401
Aitken, S. N., Yeaman, S., Holliday, J. A., Wang, T., and Curtis-McLane, S.: Adaptation, 402 migration or extirpation: climate change outcomes for tree populations, Evolutionary 403 applications, 1, 95-111, 2008. 404
Akagi, S., Yokelson, R. J., Wiedinmyer, C., Alvarado, M., Reid, J., Karl, T., Crounse, J., and 405 Wennberg, P.: Emission factors for open and domestic biomass burning for use in 406 atmospheric models, Atmospheric Chemistry and Physics, 11, 4039-4072, 2011. 407
Archibald, S., Roy, D. P., van Wilgen, B. W., and Scholes, R. J.: What limits fire? An 408 examination of drivers of burnt area in Southern Africa, Global Change Biology, 15, 613-630, 409 2009. 410
Balch, J. K., Bradley, B. A., Abatzoglou, J. T., Nagy, R. C., Fusco, E. J., and Mahood, A. L.: 411 Human-started wildfires expand the fire niche across the United States, Proceedings of the 412 National Academy of Sciences, 114, 2946-2951, 2017. 413
Brovkin, V., Boysen, L., Arora, V., Boisier, J., Cadule, P., Chini, L., Claussen, M., 414 Friedlingstein, P., Gayler, V., and Van Den Hurk, B.: Effect of anthropogenic land-use and 415 land-cover changes on climate and land carbon storage in CMIP5 projections for the twenty-416 first century, Journal of Climate, 26, 6859-6881, 2013. 417
Chaste, E., Girardin, M. P., Kaplan, J. O., Portier, J., Bergeron, Y., and Hély, C.: The 418 pyrogeography of eastern boreal Canada from 1901 to 2012 simulated with the LPJ-LMfire 419 model, Biogeosciences, 15, 1273-1292, 10.5194/bg-15-1273-2018, 2018. 420
Chow, J. C., Watson, J. G., Lowenthal, D. H., Chen, L.-W. A., and Motallebi, N.: PM2. 5 source 421 profiles for black and organic carbon emission inventories, Atmospheric Environment, 45, 422 5407-5414, 2011. 423
Ford, B., Val Martin, M., Zelasky, S., Fischer, E., Anenberg, S., Heald, C., and Pierce, J.: Future 424 fire impacts on smoke concentrations, visibility, and health in the contiguous United States, 425 GeoHealth, 2, 229-247, 2018. 426
Fusco, E. J., Abatzoglou, J. T., Balch, J. K., Finn, J. T., and Bradley, B. A.: Quantifying the 427 human influence on fire ignition across the western USA, Ecological applications, 26, 2390-428 2401, 2016. 429
Gelaro, R., McCarty, W., Suárez, M. J., Todling, R., Molod, A., Takacs, L., Randles, C. A., 430 Darmenov, A., Bosilovich, M. G., and Reichle, R.: The modern-era retrospective analysis for 431 research and applications, version 2 (MERRA-2), Journal of Climate, 30, 5419-5454, 2017. 432
Giglio, L., Randerson, J. T., and van der Werf, G. R.: Analysis of daily, monthly, and annual 433 burned area using the fourth-generation global fire emissions database (GFED4), Journal of 434 Geophysical Research: Biogeosciences, 118, 317-328, 2013. 435
https://doi.org/10.5194/acp-2020-80Preprint. Discussion started: 20 February 2020c© Author(s) 2020. CC BY 4.0 License.
19
Jarvis, P., and Leverenz, J.: Productivity of temperate, deciduous and evergreen forests, in: 436 Physiological plant ecology IV, Springer, 233-280, 1983. 437
Kumar, S., Dirmeyer, P. A., Merwade, V., DelSole, T., Adams, J. M., and Niyogi, D.: Land 438 use/cover change impacts in CMIP5 climate simulations: A new methodology and 21st 439 century challenges, Journal of Geophysical Research: Atmospheres, 118, 6337-6353, 2013. 440
Liu, J. C., Wilson, A., Mickley, L. J., Dominici, F., Ebisu, K., Wang, Y., Sulprizio, M. P., Peng, 441 R. D., Yue, X., and Son, J.-Y.: Wildfire-specific Fine Particulate Matter and Risk of Hospital 442 Admissions in Urban and Rural Counties, Epidemiology (Cambridge, Mass.), 28, 77-85, 443 2017. 444
Magi, B. I.: Global Lightning Parameterization from CMIP5 Climate Model Output, Journal of 445 Atmospheric and Oceanic Technology, 32, 434-452, 10.1175/jtech-d-13-00261.1, 2015. 446
Nadelhoffer, K. J., Emmett, B. A., Gundersen, P., Kjønaas, O. J., Koopmans, C. J., Schleppi, P., 447 Tietema, A., and Wright, R. F.: Nitrogen deposition makes a minor contribution to carbon 448 sequestration in temperate forests, Nature, 398, 145, 1999. 449
Nazarenko, L., Schmidt, G., Miller, R., Tausnev, N., Kelley, M., Ruedy, R., Russell, G., Aleinov, 450 I., Bauer, M., and Bauer, S.: Future climate change under RCP emission scenarios with GISS 451 ModelE2, Journal of Advances in Modeling Earth Systems, 7, 244-267, 2015. 452
Ortega, A., Day, D., Cubison, M., Brune, W., Bon, D., De Gouw, J., and Jimenez, J.: Secondary 453 organic aerosol formation and primary organic aerosol oxidation from biomass-burning 454 smoke in a flow reactor during FLAME-3, Atmospheric Chemistry and Physics, 13, 11551-455 11571, 2013. 456
Park, R. J., Jacob, D. J., Chin, M., and Martin, R. V.: Sources of carbonaceous aerosols over the 457 United States and implications for natural visibility, Journal of Geophysical Research: 458 Atmospheres, 108, 2003. 459
Park, R. J., Jacob, D. J., Field, B. D., Yantosca, R. M., and Chin, M.: Natural and transboundary 460 pollution influences on sulfate-nitrate-ammonium aerosols in the United States: Implications 461 for policy, Journal of Geophysical Research: Atmospheres, 109, 2004. 462
Pechony, O., and Shindell, D. T.: Driving forces of global wildfires over the past millennium and 463 the forthcoming century, Proceedings of the National Academy of Sciences, 107, 19167-464 19170, 2010. 465
Pfeiffer, M., Spessa, A., and Kaplan, J. O.: A model for global biomass burning in preindustrial 466 time: LPJ-LMfire (v1. 0), Geoscientific Model Development, 6, 643-685, 2013. 467
Price, C., and Rind, D.: Possible implications of global climate change on global lightning 468 distributions and frequencies, Journal of Geophysical Research: Atmospheres, 99, 10823-469 10831, 1994a. 470
Price, C., and Rind, D.: The impact of a 2× CO2 climate on lightning-caused fires, Journal of 471 Climate, 7, 1484-1494, 1994b. 472
Rogers, B. M., Neilson, R. P., Drapek, R., Lenihan, J. M., Wells, J. R., Bachelet, D., and Law, B. 473 E.: Impacts of climate change on fire regimes and carbon stocks of the US Pacific Northwest, 474 Journal of Geophysical Research: Biogeosciences, 116, 2011. 475
Rupp, D. E., Abatzoglou, J. T., Hegewisch, K. C., and Mote, P. W.: Evaluation of CMIP5 20th 476 century climate simulations for the Pacific Northwest USA, Journal of Geophysical Research: 477 Atmospheres, 118, 10,884-810,906, 2013. 478
Shafer, S. L., Bartlein, P. J., Gray, E. M., and Pelltier, R. T.: Projected Future Vegetation 479 Changes for the Northwest United States and Southwest Canada at a Fine Spatial Resolution 480
https://doi.org/10.5194/acp-2020-80Preprint. Discussion started: 20 February 2020c© Author(s) 2020. CC BY 4.0 License.

20
Using a Dynamic Global Vegetation Model, PLoS One, 10, e0138759, 481 10.1371/journal.pone.0138759, 2015. 482
Sheffield, J., Barrett, A. P., Colle, B., Nelun Fernando, D., Fu, R., Geil, K. L., Hu, Q., Kinter, J., 483 Kumar, S., and Langenbrunner, B.: North American climate in CMIP5 experiments. Part I: 484 Evaluation of historical simulations of continental and regional climatology, Journal of 485 Climate, 26, 9209-9245, 2013. 486
Sitch, S., Smith, B., Prentice, I. C., Arneth, A., Bondeau, A., Cramer, W., Kaplan, J. O., Levis, 487 S., Lucht, W., Sykes, M. T., Thonicke, K., and Venevsky, S.: Evaluation of ecosystem 488 dynamics, plant geography and terrestrial carbon cycling in the LPJ dynamic global 489 vegetation model, Global Change Biology, 9, 161-185, 10.1046/j.1365-2486.2003.00569.x, 490 2003. 491
Spracklen, D. V., Mickley, L. J., Logan, J. A., Hudman, R. C., Yevich, R., Flannigan, M. D., and 492 Westerling, A. L.: Impacts of climate change from 2000 to 2050 on wildfire activity and 493 carbonaceous aerosol concentrations in the western United States, Journal of Geophysical 494 Research: Atmospheres, 114, 2009. 495
Val Martin, M., Honrath, R., Owen, R. C., Pfister, G., Fialho, P., and Barata, F.: Significant 496 enhancements of nitrogen oxides, black carbon, and ozone in the North Atlantic lower free 497 troposphere resulting from North American boreal wildfires, Journal of Geophysical 498 Research: Atmospheres, 111, 2006. 499
Westerling, A., and Bryant, B.: Climate change and wildfire in California, Climatic Change, 87, 500 231-249, 2008. 501
Westerling, A. L., Hidalgo, H. G., Cayan, D. R., and Swetnam, T. W.: Warming and earlier 502 spring increase western US forest wildfire activity, science, 313, 940-943, 2006. 503
Westerling, A. L.: Increasing western US forest wildfire activity: sensitivity to changes in the 504 timing of spring, Philosophical Transactions of the Royal Society B: Biological Sciences, 371, 505 20150178, 2016. 506
Wotton, B., Martell, D., and Logan, K.: Climate change and people-caused forest fire occurrence 507 in Ontario, Climatic Change, 60, 275-295, 2003. 508
Yue, X., Mickley, L. J., Logan, J. A., and Kaplan, J. O.: Ensemble projections of wildfire activity 509 and carbonaceous aerosol concentrations over the western United States in the mid-21st 510 century, Atmospheric Environment, 77, 767-780, 2013. 511
Yue, X., Mickley, L. J., and Logan, J. A.: Projection of wildfire activity in southern California in 512 the mid-twenty-first century, Climate dynamics, 43, 1973-1991, 2014. 513
514
https://doi.org/10.5194/acp-2020-80Preprint. Discussion started: 20 February 2020c© Author(s) 2020. CC BY 4.0 License.
21
Figures and tables 515
516
Figure 1. Modeled changes in temperature (top) and precipitation (bottom) in July-August-517
September (JAS) at ~2050 and ~2100 as a function of latitude over the WUS for RCP4.5 (left) 518
and RCP8.5 (right). Changes are zonally averaged and relative to the present day (~2010), with 519
5-year averages in each time slice. The bold blue lines show the changes between 2010 and 520
2050, averaged over all longitudes in the WUS (31°N – 49°N, 100°W – 125°W); bold red lines 521
show the mean changes between 2010 and 2100. Light blue and orange shadings represent the 522
temporal standard deviation across the 15 months (5 years x 3 months) of each time slice. Blue 523
dots along the axes mark those latitudes showing statistically significant differences between the 524
JAS 2010 and 2050 time slices (p < 0.05); red dots mark those latitudes with statistically 525
significant differences at 2100. Temperatures and precipitations are from the GISS-E2-R climate 526
model. 527
https://doi.org/10.5194/acp-2020-80Preprint. Discussion started: 20 February 2020c© Author(s) 2020. CC BY 4.0 License.

22
528
529
Figure 2. The top panel shows total living biomass at ~2010, ~2050 and ~2100 as a function of 530
latitude over the WUS for RCP4.5 (left) and RCP8.5 (right), with 5-year averages in each time 531
slice. The lower four panels are as in Figure 1, but for changes in total living biomass (middle) and 532
lightning-caused dry matter burned (DM; bottom) as a function of latitude over the WUS. Results 533
of living biomass and DM are from LPJ-LMfire. As in Figure 1, dots along the axes mark those 534
latitudes showing statistically significant differences. 535
536
https://doi.org/10.5194/acp-2020-80Preprint. Discussion started: 20 February 2020c© Author(s) 2020. CC BY 4.0 License.

23
537
Figure 3. Simulated changes in yearly mean total living biomass and monthly mean DM averaged 538
over the fire season in the National Forests across the WUS for the RCP4.5 and RCP8.5 scenarios. 539
The top row shows changes between the present day and 2050, and the bottom row shows changes 540
between the present day and 2100. Results are from LPJ-LMfire, with five years representing each 541
time period. The fire season is July, August, and September. 542
RCP4.5 RCP8.5
ΔTotal living biomass
2050-2010
2100-2010
kg m-2 mon-1
RCP4.5 RCP8.5
ΔDM
kg C m-2
https://doi.org/10.5194/acp-2020-80Preprint. Discussion started: 20 February 2020c© Author(s) 2020. CC BY 4.0 License.

24
543
544
Figure 4. Simulated changes in fire-season smoke PM (BC+OC) at ~2100 relative to the present 545
day for RCP4.5 and RCP8.5. Results are from GEOS-Chem at a spatial resolution 0.5° x 0.625°, 546
averaged over July, August, and September. Each time period is represented by a 5-year time slice. 547
548
RCP4.5 RCP8.5
2100-2010
https://doi.org/10.5194/acp-2020-80Preprint. Discussion started: 20 February 2020c© Author(s) 2020. CC BY 4.0 License.

25
549
Tabl
e 1.
Tot
al li
ving
bio
mas
s and
dry
mat
ter b
urne
d (D
M) o
ver N
atio
nal F
ores
ts a
nd P
arks
in th
e W
US
and
smok
e PM
(BC
+OC
) co
ncen
tratio
ns a
vera
ged
acro
ss th
e en
tire
Wes
t. A
lso sh
own
is D
M su
mm
ed o
ver N
atio
nal F
ores
ts in
the
Sier
ra N
evad
a (S
N).
Val
ues f
or
the
pres
ent d
ay (~
2010
) are
show
n in
the
top
row
; cha
nges
in ~
2050
and
~21
00 re
lativ
e to
the
pres
ent d
ay a
re sh
own
in b
otto
m tw
o ro
ws.
Stat
istic
ally
sign
ifica
nt c
hang
es a
re in
bol
dfac
e.
Tim
e sli
ces
Livi
ng b
iom
assb ,
Tg/y
r D
Mb ,
Tg/J
AS
DM
in S
Nb ,
Tg/J
AS
BC+O
Cc , 𝜇 g
m-3
R
CP4
.5
RC
P8.5
R
CP4
.5
RC
P8.5
R
CP4
.5
RC
P8.5
R
CP4
.5
RC
P8.5
2010
a 30
74.8
±33.
7 30
36.9
±55.
5 22
.16±
4.16
30
.96±
7.15
1.
27±1
.08
1.24
±0.4
8 2.
11±0
.48
2.55
±0.8
1
2050
-201
0a 13
8.2±
46.0
12
6.2±
80.2
18
.0±1
6.1
26.7
±14.
8 0.
22±1
.42
0.54
±1.5
0 --
--
2100
-201
0a 11
9.6±
34.4
-2
70.7
±76.
1 24
.6±1
3.2
50.0
±18.
0 0.
91±2
.10
1.00
±0.8
6 1.
11±1
.02
2.78
±1.7
3
a Ea
ch ti
me
slic
e re
pres
ents
5 y
ears
; b V
alue
s are
fire
-sea
son
sum
mat
ions
ove
r Nat
iona
l Par
ks a
nd F
ores
ts;
c BC
+OC
con
cent
ratio
ns a
re fi
re-s
easo
n av
erag
es o
ver t
he W
est;
Stat
istic
al si
gnifi
canc
e is
not
cal
cula
ted
for l
ivin
g bi
omas
s.
https://doi.org/10.5194/acp-2020-80Preprint. Discussion started: 20 February 2020c© Author(s) 2020. CC BY 4.0 License.

26
Table 2. Reclassification of LPJ-LMfire PFTs. 550
551
LPJ-LMfire (9 pfts) GEOS-Chem (6 pfts) Tropical broadleaf evergreen Tropical forest Tropical broadleaf raingreen Tropical forest Temperate needleleaf evergreen Temperate forest Temperate broadleaf evergreen Temperate forest Temperate broadleaf summergreen Temperate forest Boreal needleleaf evergreen Boreal forest Boreal summergreen Boreal forest C3 grass Crop, pasture
C4 grass 50% -> savanna, grassland, shrubland; 50% -> crop, pasture
https://doi.org/10.5194/acp-2020-80Preprint. Discussion started: 20 February 2020c© Author(s) 2020. CC BY 4.0 License.
Related Documents