Annual Trends and Outlook Report 20 11 Trends and Spatial Patterns in Agricultural Productivity in Africa, 1961–2010 Samuel Benin Alejandro Nin Pratt Stanley Wood Zhe Guo

Trends and Spatial Patterns in Agricultural Productivity in Africa, 1961–2010
Mar 26, 2016
Benin, S., Nin Pratt, A., Wood, S. and Guo, Z. 2011. Trends and Spatial Patterns in Agricultural Productivity in Africa, 1961–2010. ReSAKSS-Africa Wide Annual Trends and Outlook Report 2011. International Food Policy Research Institute.
Welcome message from author
This document is posted to help you gain knowledge. Please leave a comment to let me know what you think about it! Share it to your friends and learn new things together.
Transcript
AnnualTrends
and OutlookReport
2011
Trends and Spatial Patterns in Agricultural Productivity in Africa, 1961–2010
Samuel Benin
Alejandro Nin Pratt
Stanley Wood
Zhe Guo

About ReSAKSS | www.resakss.orgThe Regional Strategic Analysis and Knowledge Support System (ReSAKSS) is an Africa-wide network of regional nodes supporting implementation of the Comprehensive Africa Agriculture Development Programme (CAADP). ReSAKSS offers high-quality analyses and knowledge products to improve policymaking, track progress, document success, and derive lessons for the implementation of the CAADP agenda and other agricultural and rural development policies and programs in Africa.
ReSAKSS is facilitated by the International Food Policy Research Institute (IFPRI) in partnership with the Africa-based CGIAR centers, the NEPAD Planning and Coordinating Agency (NPCA), the African Union Commission (AUC), and the Regional Economic Communities (RECs). The Africa-based CGIAR centers and the RECs include: International Institute of Tropical Agriculture (IITA) and the Economic Community of West African States (ECOWAS) for ReSAKSS–WA; the International Livestock Research Institute (ILRI) and the Common Market for Eastern and Southern Africa (COMESA) for ReSAKSS–ECA; and the International Water Management Institute (IWMI) and the Southern African Development Community (SADC) for ReSAKSS–SA.
ReSAKSS has been established with funding from the United States Agency for International Development (USAID), the UK Department for International Development (DFID), the Swedish International Development Cooperation Agency (SIDA), and the Bill and Melinda Gates Foundation.
AuthorsSamuel Benin, Alejandro Nin Pratt, Stanley Wood, and Zhe Guo
DOI: http://dx.doi.org/10.2499/9780896298019
ISBN number: 978-0-89629-801-9
CitationBenin, S., Nin Pratt, A., Wood, S. and Guo, Z. 2011. Trends and Spatial Patterns in Agricultural Productivity in Africa, 1961–2010. ReSAKSS Annual Trends and Outlook Report 2011. International Food Policy Research Institute (IFPRI).
CopyrightExcept where otherwise noted, this work is licensed under a Creative Commons Attribution 3.0 License (http://creativecommons.org/licenses/by/3.0).
Cover design: Shirong Gao/IFPRI
The authors are researchers at the International Food Policy Research Institute (IFPRI), Washington, DC, USA. Samuel Benin is a research fellow and coordinator of the regional strategic analysis and knowledge support system for Africa in the Development Strategy and Governance Division. Alejandro Nin Pratt is a research fellow in the Development Strategy and Governance Division. Stanley Wood is a senior research fellow in the Environment and Production Technology Division. Zhe Guo is a geographic information system coordinator in the Environment and Production Technology Division.
Trends and Spatial Patterns in Agricultural Productivity
in Africa, 1961–2010
AnnualTrends
and OutlookReport
2011

2011 ReSAKSS Annual Trends and Outlook Report iii
ContentsAbbreviAtions viii
foreword x
Acknowledgements xii
executive summAry xiii
Major findings and recommendations xiii
introduction 1
meAsures of AgriculturAl Productivity And dAtA sources 3
Partial Factor Productivity (PFP) 3
Total Factor Productivity (TFP) 4
Data Sources and Methodology 4
trends And sPAtiAl PAtterns in lAnd And lAbor Productivity 11
Annual Trends in Land and Labor Productivity 11Africa and geographic sub-regions 11
Economic groups 14
Selected countries 17
Spatial Patterns in Land and Labor Productivity 20Land productivity in crop production 20
Labor productivity in crop production 22
Summary of Findings 23
Annex: Additional Tables 24
iv resakss.org
trends in totAl fActor Productivity (tfP) 27
Trends in TFP at the Aggregate Levels 27TFP growth decomposition 31
Trends in TFP at the Country Level 33
Summary of Findings 37
conclusions And imPlicAtions: rAising And mAintAining HigH AgriculturAl Productivity in AfricA 39
Overall Policy Implications 52
references 53
Annexes: core cAAdP m&e indicAtors 57
Technical Notes to Annex Tables 57
Annex A: Enabling Environment 59
Annex B: CAADP Implementation Processes 67
Annex C: Agricultural Financing 70
Annex D: Agricultural Output, Productivity and Growth 74
Annex E: Agricultural Trade 81
Annex F: Poverty and Hunger 86
Contents Continued
2011 ReSAKSS Annual Trends and Outlook Report v
List of FiguresF1.1 Budget allocation under CAADP Investment plans for selected countries 2
F2.1 Agriculture value added by country (% of Africa total), 2003–2010 annual average 7
F2.2 Annual average agriculture GDP growth rate (2003–2009) 8
F2.3 Farming systems in Africa 9
F3.1 Scatter plots of land and labor productivity by geographic region (1980-2010) 12
F3.2 Scatter plots of land and labor productivity by economic classification (1980–2010) 15
F3.3 Scatter plots of land and labor productivity by regional economic community (1980–2010) 16
F3.4 Scatter plots of land and labor productivity by largest or fastest-growing agricultural economies in Africa (1980–2010) 17
F3.5 Land and labor productivity for the largest or fastest-growing agricultural economies in Africa (average 2000–2010) 18
F3.6 Growth rate in land and labor productivity for the largest or fastest-growing agricultural economies in Africa (annual average 2000–2010) 19
F3.7 Land and labor productivity of crop production in Africa (average 2005–2007) 21
F4.1 Total factor productivity, efficiency, and technical change by geographic location (1961–2005: 1961=1) 30
F4.2 Total factor productivity, efficiency, and technical change by economic classification (1961–2005: 1961=1) 31
F4.3 Total factor productivity, efficiency, and technical change by regional economic community (1961–2005: 1961=1) 32
F4.4 Total factor productivity growth decomposition by group (%, annual average 1985–2005) 33
F4.5 Total factor productivity, efficiency, and technical change for selected (1961–2005: 1961=1) 34
F4.6 Total factor productivity growth decomposition at country level (%, annual average 1985–2005) 35
F4.7 Total factor productivity growth decomposition at country level (%, annual average 2000–2005) 36
F5.1 Land, labor, and total factor productivity growth in Africa (%, annual average 1980–2005) 40
F5.2 Share of public agriculture expenditure in total public expenditure (annual average %) 42
F5.3 Share of public agricultural R&D expenditure in agricultural GDP (%), 2008 43
F5.4 Public agricultural R&D expenditure by cost category in selected countries (annual average, 2001–2008) 44
F5.5 Total benefits of maize R&D in the SADC region by country of origin of technology (spill-outs) and beneficiary countries (spill-ins) 46
F5.6 Total benefits from technology spillovers among SADC countries by commodity, 2009–15 47
F5.7 Agroecological zones and farming systems in Africa 49
F5.8 Climate change impacts on land productivity in Africa by agroecological zone (% change in USD/ha) 50
vi resakss.org
List of Tables
T2.1 Countries by geographic region and country’s share in region’s total agriculture value added 4
T2.2 Countries by economic development classification and country’s share in group’s total agriculture value added 5
T2.3 Countries by Regional Economic Community (REC) and country’s share in REC’s total agriculture value added 6
T3.1 Land and labor productivity, annual average level and growth rates (1980–2010) 13
T3.2 Value ($) of crop production per ha of cropland (average 2005–2007) 20
T3.3 Value ($) of crop production per agricultural worker (average 2005–2007) 22
T3A.1 Distribution of value of crop production by farming system ($ millions), 2005–2007 24
T3A.2 Distribution of cropland area by farming system (1000 hectares), 2005 25
T3A.3 Distribution of rural population headcount by farming system (number), 2005 25
T4.1 Total factor productivity, efficiency, and technical change (annual average level, 1961–2005: 1961=1) 28
T4.2 Percentage change in total factor productivity, efficiency, and technical change (annual average %, 1961–2005) 29
T5.1 Annual average growth rates in public agricultural R&D expenditure (2005 constant prices) and number of researchers (full-time equivalents) in SSA 41
TA.1 Total ODA per capita, gross disbursements (2009 USD) 59
TA.2 Share of Agricultural Official Development Assistance in total ODA 60
TA.3 Share of emergency food aid in total ODA (%) 61
TA.4 GDP growth (annual %) 62
TA.5 GDP per capita (constant 2000 USD) 63
TA.6 Annual Inflation (GDP deflator) (%) 64
TA.7 General government gross debt as share of GDP (%) 65
TA.8 General government revenue as a share of GDP (%) 66
TB.1 Progress in CAADP roundTprocess at end of March 2012 67
TC.1 Public agriculture expenditure, annual growth rate (%) 70
TC.2 Share of public agriculture expenditure in total public expenditure (%) 71
2011 ReSAKSS Annual Trends and Outlook Report vii
TC.3 Public agriculture expenditure as percent of agriculture GDP and GDP (%) 72
TD.1 Agriculture, value added as share of GDP (%) 74
TD.2 Land and labor productivity 75
TD.3 Cereal yields (kilograms per ha) 77
TD.4 Agriculture Production Index (API) (net base 2004-2006) 78
TD.5 Total fertilizer use (kilograms per ha) 79
TD.6 Agriculture, value added growth rate (%) 80
TE.1 Ratio of the value of total agricultural exports to total agricultural imports 81
TE.2 Per capita agricultural trade (USD) 82
TE.3 Agricultural trade as a share in merchandise trade (%) 84
TF.1 Headcount poverty rate (% of population below international poverty line, $1.25/Day) 86
TF.2 Headcount poverty rate (% of population below national poverty line) 87
TF.3 Prevalence of child malnutrition (% of children under five years of age) 88
TF.4 Prevalence of adult undernourishment (% of population) 89
TF.5 Mortality rate, children under five years of age (Per 1000) 90
TF.6 Global Hunger Index 91
viii resakss.org
AEZ Agricultural Ecological Zone
AgGDP Agriculture GDP
ASARECA Association for Strengthening Agricultural Research in Eastern and Central Africa
ASWAp Agriculture Sector Wide Approach
ATOR Annual Trends and Outlook Report
AUC African Union Commission
AU/NEPAD African Union/ New Partnership for Africa’s Development
CAADP Comprehensive Africa Agriculture Development Programme
CEN-SAD Community of Sahel-Saharan States
CGIAR Consultative Group on International Agricultural Research
COMESA Common Market for Eastern and Southern Africa
CORAF/WECARD West and Central African Council for Agricultural Research and Development
DFID Department for International Development
DRC Democratic Republic of Congo
DSIP Development Strategy Investment Plan
EAAPP Eastern Africa Agricultural Productivity Program
EAC East African Community
ECA Eastern and Central Africa
ECCAS Economic Community of Central African States
ECOWAS Economic Community of West African States
EU European Union
FAO Food and Agriculture Organization
FAOStat Food and Agriculture Organization database
GDP Gross Domestic Product
GIS Geographic Information System
GRUMP The Global Rural and Urban Mapping Project
IFPRI International Food Policy Research Institute
IGAD Intergovernmental Authority for Development
IITA International Institute of Tropical Agriculture
ILO International Labor Organization
ILRI International Livestock Research Institute
IMF International Monetary Fund
IWMI International Water Management Institute
M&E Monitoring and Evaluation
MDG Millennium Development Goal
MTIP Medium Term Investment Plan
NAIP National Agricultural Investment Plan
NARI National Agricultural Research Institute
NEPAD New Partnership for Africa’s Development
NGO Non-governmental organization
ODA Official Development Assistance
Abbreviations
2011 ReSAKSS Annual Trends and Outlook Report ix
OECD Organization for Economic Co-operation and Development
PFP Partial Factor Productivity
PPP Public Private Partnership
PSTA Strategic Plan for Agriculture Transformation
R&D Research and Development
REC Regional Economic Community
ReSAKSS Regional Strategic Analysis and Knowledge Support System
SA Southern Africa
SADC Southern African Development Community
SAKSS Strategic Analysis and Knowledge Support System
SIDA Swedish International Development Cooperation Agency
SPAM Spatial Production Allocation Model
SSA Sub-Saharan Africa
TFP Total Factor Productivity
UMA Union du Maghreb Arabe
UN United Nations
USAID United States Agency for International Development
WDI World Development Index
WA Western Africa
WAAPP Western Africa Agricultural Productivity Program
x resakss.org
Foreword
With this fourth issue of the Annual Trends and Outlook Report
(ATOR), the Regional Strategic Analysis and Knowledge
Support System (ReSAKSS) adopts a new approach of
featuring a focus theme pertinent to the Comprehensive Africa Agriculture
Development Programme (CAADP) implementation agenda. Agricultural
productivity is featured in the 2011 ATOR as the report presents its
measures, trends, and spatial patterns. The assessment is timely in light of
Africa’s recent growth recovery, which still needs to be better documented
and its underlying factors better understood. Identifying and highlighting
options for accelerating and sustaining agricultural productivity growth in
Africa, as the report does, is crucial at this juncture.
Previous ATORs have been centered on assessing trends and progress on
key CAADP spending and growth targets, the first millennium development
goal and the implementation agenda itself. This information remains
relevant to monitoring and evaluating the CAADP agenda. In its new
format, the report presents the information in annexes to the main text.
Raising agricultural productivity is central to accelerating broad-based
economic growth, reducing poverty, and improving food security in Africa.
Nevertheless, doing so in a sustainable manner has eluded many African
countries. The report finds that agricultural productivity growth has been
rapid in among African countries since the mid-1980s. This is a welcome
change. The report also shows that the recent strong growth has merely
allowed countries to catch up to levels of the 1960s, illustrating the depth of
the decline in the preceding decades. Moreover, the growth has been driven
largely by efficiency gains and less by technical change. Sustaining the
current recovery and broadening growth will require countries to continue
to pursue conducive policies and to increase investments in agricultural
research and development (R&D) to further promote technical change in
the sector. Despite encouraging progress, a majority of African countries
have not yet achieved the 2003 Maputo Declaration target of allocating
10 percent of the national budget to agriculture. More needs to be done
by countries to provide increased funding for better-performing science
and technology systems that would allow African agriculture to meet the
challenges of tomorrow and raise its competitiveness in global, regional,
and national markets.
In addition to raising the level and effectiveness of agricultural
investments, as countries seek to raise and maintain high agricultural
productivity, the 2011 ATOR recommends policies that address diversity
2011 ReSAKSS Annual Trends and Outlook Report xi
across farmers and locations, as well as the potential impact of climate
change. And given that many African countries are small, have limited
capacities and resources, and share similar agroecologies and farming
systems, the report also recommends the adoption of regional agricultural
R&D strategies to facilitate economies of scale and technology spillovers
across countries.
Finally, as agricultural productivity is invariably linked to agricultural
investments, it is fitting that the featured theme in the 2012 ATOR is public
agricultural expenditure and investment.
Ousmane BadianeDirector for AfricaIFPRI
Tumusiime Rhoda PeaceCommissioner for Rural Economy and AgricultureAfrican Union
xii resakss.org
AcknowledgementsSeveral people have contributed toward producing this report. These include Greg Traxler and Ousmane Badiane during conceptualization of the agricultural productivity study jointly undertaken by ReSAKSS and the HarvestChoice program of IFPRI. Melanie Bacou, Angga Pradesha, Ulrike Wood-Sichra, Linden McBride, and Heather Wyllie provided data and analytical support. We would also like to thank Xinshen Diao and participants of the conference on Increasing Agricultural Productivity & Enhancing Food Security in Africa: New Challenges and Opportunities (November 1–3, 2011, Addis Ababa) for their feedback on a presentation of this study.

2011 ReSAKSS Annual Trends and Outlook Report xiii
Executive Summary
The Comprehensive Africa Agriculture Development Programme
(CAADP) provides an agriculture-led integrated framework of
development priorities aimed at reducing poverty and increasing
food security by achieving an average of 6 percent agricultural growth
rate every year. Initial economic modeling results to support CAADP
planning indicate that, while it is possible for many African countries
to reach this target, it will require substantial additional growth across
different agricultural sub-sectors and commodities, as well as substantial
investments to stimulate the necessary acceleration in growth. In many
cases, the agricultural investments required are in excess of the 10 percent
of total expenditures commitment agreed on under the Maputo declaration.
This is necessary because of the moderate and slowly growing agricultural
productivity across the continent. As countries enter the operational stage
of CAADP investment program design and execution, mostly starting in
2011, a fundamental policy research question is how to raise and maintain
high agricultural productivity across different parts of the continent,
particularly technical change, given the limits to factor substitution. This
2011 annual trends and outlook report (ATOR) addresses the gap by
analyzing the inter-temporal trends and spatial patterns in partial and total
factor productivity, to help identify options for raising and sustaining high
agricultural productivity across different parts of the continent.
Major findings and recommendationsAgricultural productivity in Africa has been increasing since the mid-1980s, but this represents catching up with the levels achieved in the early 1960s.While there is substantial spatial variation in agricultural productivity
across the continent, agricultural productivity growth in many parts of
Africa has been rapid since the mid-1980s. However, this result has been
merely to restore the levels achieved in the early 1960s, suggesting that
there has been very little technical change. Sustaining the recent rapid
growth in productivity will require policy improvements and significant
investments in agricultural Research and Development (R&D), as well
as complementary investments in areas such as irrigation, market
infrastructure, and institutions that accelerate the expansion of Africa’s
technical frontier.
Agricultural investments and R&D infrastructure and capacities in Africa have eroded, as a result of poor to moderate performance in the largest agricultural economies in the continent.Agricultural research infrastructure and capacities in Africa exhibit
trends similar to agricultural productivity: they have eroded through
years of neglect, primarily from lack of public funding for agricultural
xiv resakss.org
R&D, and have only recently picked up (Beintema and Stads 2006, 2011).
The New Partnership for Africa’s Development (NEPAD) established
a national agricultural R&D investment target of at least 1 percent of
agricultural GDP, but most countries have spent far less than this target.
In 2008 for example, the average level of agricultural R&D investment
for a majority of countries was 0.6 percent. This is reflected in the low
performance of the continent in meeting the Maputo Declaration
target for agricultural financing by governments, of 10 percent of total
national expenditures. Only a handful of countries have surpassed this
target. The largest ten agricultural economies in Africa (Nigeria, Egypt,
Morocco, Algeria, Sudan, Kenya, South Africa, Ethiopia, Tanzania, and
Cote d’Ivoire)—accounting for about 73 percent of the total of Africa’s
agriculture value added—have performed poorly, resulting in the low
performance for Africa as a whole.
Large incremental agriculture expenditures and investments are required to raise and maintain a high level of agricultural productivity and growth in Africa.To increase agricultural productivity by 50 percent by 2030 (for example),
public agricultural investment should increase by 167–250 percent
(representing about 6–8 percent of agricultural GDP) by 2030. This is
in addition to recurrent spending, which presently constitutes the bulk
of public spending on the sector. In light of the current low levels of
public agriculture expenditures, and the high shares allocated to salaries
and other low productive or short-term productive items, this level of
agricultural investment translates into total amounts in excess of the 10
percent of total expenditures commitment agreed to under the Maputo
declaration.
Different types of agricultural investments and policies are not growth neutral; the critical investments will be those that deliver location-specific technologies and those that account for diversity of farmers.Because different policies and types of investments are not growth
neutral, it is important to find the right focus for different contexts,
including proper sequencing. And because of the heterogeneity of the
production environment, including different constraints faced by different
farmers in different places, such investments and policy interventions
need to deliver location-specific technologies that are tailored to the
relevant agroecological characteristics and production systems, while also
accounting for the considerable diversity of opportunities and constraints
faced by farmers. Case studies of actual agricultural productivity
investment projects suggest that successful interventions have been very
few, short-lived, and thinly scattered across the continent, with very little
impact in the aggregate. Most of the successful interventions in Africa
only last for the project duration (3 to 5 years) and cease functioning
almost immediately when the external or initial funding ends. There is
a need for more commitments and actions by governments and other
national stakeholders to ensure that good interventions are sustained.
Because many countries are small and have limited capacities, regional agricultural strategies, with complementary policies and extension systems to maximize the spillovers of technologies, will be helpful. Many countries in Africa have small economies and limited capacities and
resources for developing effective agricultural R&D systems. Therefore,
focusing on regional agricultural R&D strategies can help fill these gaps
2011 ReSAKSS Annual Trends and Outlook Report xv
and facilitate scale economies. A regional strategy, such as the African
centers of excellence initiatives,1 must overcome many institutional and
administrative barriers to management and coordination across national
boundaries. Because any cross-country collaboration will be affected by
each country’s R&D system and specific program needs, as well as its
desire to maintain a bargaining position for domestic resources, it will be
critical to find ways to minimize these transaction costs. To be successful,
such interventions require complementary polices and agricultural
extension systems that maximize the spillovers of the technologies
generated, to reach other areas of the continent.
The potential impact of climate change should be taken into account in the design and implementation of policies and strategies for raising and maintaining high agricultural productivity.There is strong evidence that climate change or global warming due
to accumulating greenhouse gases could impose serious costs to
agricultural growth in Africa, and that the changes are likely to have
very different effects on people in different locations; in general, the
projected warming is likely to increase livestock income while reducing
crop income. Extrapolating from the findings of Seo et al. (2008) shows
that climate change may have a zero net effect on total agricultural
income of households engaging in both crop and livestock production.
The most vulnerable to climate change are likely to be those engaging
solely or mostly in crop production, as well as those in the Cereal-Root
Crop Mixed, Dryland Mixed, AgroPastoral, and Pastoral farming systems
(which characterize most of the savannah agroecological zones (AEZs));
farmers standing to gain—even from severe climate change—are those
engaging solely or mostly in livestock, as well as those in the forest-
based and tree crop farming systems (which characterize most of the
sub-humid or humid forest AEZs). Therefore, the strategies for raising
and maintaining high agricultural productivity should also be based
on impact assessments of climate change to identify the most attractive
adaptation options, with location-specific implementation approaches.
For most countries in Africa, especially those with large rural
populations, there is no more pressing development objective than raising
the level and rate of growth of agricultural productivity. Moreover, as we
have seen, almost all of the observed growth in agricultural productivity
over the past several decades is explained by improvement in efficiency
of factor use, rather than by technical change. The core of a sustainable
development strategy for Africa must be to make full use of its regional
and sub-regional alliances in order to promote and disseminate well-
designed and appropriately targeted technological innovations in
agriculture.
1 For example, the Eastern Africa Agricultural Productivity Program (EAAPP, implemented by ASARECA) and the West Africa Agricultural Productivity Program (WAAPP, implemented by CORAF/WECARD) are subregional centers of excellence for particular crops and commodities—maize and wheat in Ethiopia, dairy in Kenya, cassava in Uganda, roots and tubers in Ghana, and rice in Mali and Tanzania, to mention a few. See http://waapp.org.gh/ and http://www.eaapp.org/ for details.


2011 ReSAKSS Annual Trends and Outlook Report 1
Introduction
The Comprehensive Africa Agriculture Development Programme
(CAADP) provides an agriculture-led integrated framework of
development priorities aimed at reducing poverty and increasing
food security by achieving an average of 6 percent annual agricultural growth
rate. Initial economic modeling results to support CAADP planning indicate
that, while it is possible for many African countries to reach this target, it
will require substantial additional growth across different agricultural sub-
sectors and commodities, as well as substantial investments to stimulate the
necessary acceleration in growth. In many cases, the agricultural investments
required are in excess of the 10 percent of total expenditures commitment
agreed under the Maputo declaration (see for example Diao et al. 2012).
This is necessary because of the moderate and slowly growing agricultural
productivity across the continent. The evidence further suggests that the
current growth in productivity has been driven mostly by reallocation
of productive factors (that is, efficiency gains) rather than technological
advancement (technical change) (see for example Nin Pratt and Yu 2008).
As countries enter the operational stage of CAADP investment program
design and execution, mostly starting in 2011,2 a fundamental policy research
question has been to examine how to raise and maintain high agricultural
productivity across different parts of the continent—particularly focusing
on technical change, given the limits to factor substitution. Different
countries have in the past adopted different agricultural strategies to achieve
their development objectives. While varying climate and natural resource
endowments (and varying agricultural potential) have a large influence
on these strategies, there are also clear differences in national investment
and development approaches, as Figure 1.1 shows for selected countries.
For example, Kenya’s National Agricultural Investment Plan (NAIP) favors
irrigation and commercialization, while Malawi’s favors irrigation, maize,
and farm input (particularly fertilizer) support. The NAIPs of Rwanda and
Uganda, on the other hand, tend to be more cautious by adopting an even
spread, though slightly favoring natural resource management in Rwanda and
farm support in Uganda (through the national extension program).
Looking at these different investment and development approaches,
several follow-on questions emerge. The most critical one is to identify which
strategies work best, in a cost-effective manner, under various conditions.
The overall goal of this report is to present spatial patterns and trends in
agricultural productivity and to summarize research findings on options
for raising and maintaining high agricultural productivity, to promote more
2 As of the end of July, 2012, 30 countries—Benin, Burkina Faso, Burundi, Cape Verde, Central African Republic, Cote d'Ivoire, The Democratic Republic of Congo, Djibouti, Ethiopia, The Gambia, Ghana, Guinea, Guinea Bissau, Kenya, Liberia, Malawi, Mali, Mauritania, Mozambique, Niger, Nigeria, Rwanda, Senegal, Seychelles, Sierra Leone, Swaziland, Tanzania, Togo, Uganda, Zambia—had signed their compacts with the main stakeholder groups. Twenty-three of them have developed detailed Country Investment Plans (or National Agricultural and Food Security Investment Plans) and conducted costing and financing needs of proposed investments, and several of the plans are being implemented.

2 resakss.org
effective design and implementation of agricultural policies and strategies
in Africa. First, we address some fundamental and conceptual issues in
the definition and measurement of agricultural productivity. We then
analyze inter-temporal trends and spatial patterns in partial and total factor
productivity; the spatial analysis helps to identify some of the factors that
influence agricultural productivity. We conclude with a discussion of options
for raising and sustaining high agricultural productivity across different parts
of the continent.
As in the 2010 report, we include
annexes on the data and trends on the general
CAADP monitoring and evaluation (M&E)
indicators, organized around the CAADP
principles and targets: allocation of 10 percent
of budget expenditures to the agricultural
sector; 6 percent agricultural growth rate; and
achieving the first millennium development
goal (MDG1) of slashing the 1992 levels of
poverty and hunger by one-half by 2015.
These annexes include tables for: the continent
of Africa; five geographic regions of the
African Union (central, eastern, northern,
southern, and western); four economic
groups, based on production potential, non-
agricultural alternative sources of growth,
and income level; and the eight Regional
Economic Communities (RECs) (see Benin
et al. 2010a). These tables and the original
annual country-level data can be viewed at the
ReSAKSS website (www.resakss.org).
0%
10%
20%
30%
40%
50%
60%
70%
80%
90%
100%
Kenya MTIP Malawi ASWAp Rwanda PSTA II Uganda DSIP
Cross Cutting (Eg. M&E,Capacity Building)
Natural resource management/sustainability
Pests & disease control
Aquaculture & apiculture, and other ag productivity
Livestock & dairy
Distaster risk management,food security, and nutrition
Research & technology development
Irrigation
Rural commercialization, infrastructure, and market development
Crops production/productivity
Fertilizer and other farm support
Source: Benin et al. 2010a.Notes: MTIP is Medium Term Investment Plan; ASWAp is Agriculture Sector Wide Approach; PSTA is Strategic Plan for Agricultural Transformation; DSIP is Development Strategy Investment Plan
FiguRE 1.1—BuDgET AlloCATion unDER CAADP invESTmEnT PlAnS FoR SElECTED CounTRiES
2011 ReSAKSS Annual Trends and Outlook Report 3
Because improvements in agricultural productivity are important
for broader development objectives such as poverty reduction
and food security, it is essential to use the appropriate indicator
and measure of agricultural productivity—partial factor or total factor
productivity. Conceptually, productivity is simply a measure of output
to input. However, because it embodies many different components,
changes in productivity can catalyze a wide range of direct and indirect
effects on the pathways to achieving different development objectives. For
example, output per worker or labor productivity, as a partial measure
of productivity, may be a better measure to identify linkages to non-
agricultural growth, since it encapsulates the additional ways through
which farm households earn income (Mellor 1999). Regarding the total
measure of productivity, Fan et al. (2000) for example find that investments
in roads, agricultural research and development, and education had the
largest impact on raising total factor productivity, in turn substantially
reducing poverty via reduced prices and increased wages, albeit at the cost
of increased landlessness.
Partial Factor Productivity (PFP)Partial factor productivity (PFP) is a ratio of output to a specific subset of
the total input factors. Usually PFP is limited to one input factor, described
as single factor productivity. Two commonly used measures of PFP are land
productivity (defined as the ratio of output to total harvested area) and
labor productivity (the ratio of output to total number of hours worked).
Obviously, these two PFP measures differ from one another in the variables
they measure and the variables they exclude. Basically, PFP measures make
it possible to focus on a given variable (for instance, land or labor) to assess
how that variable is influencing or contributing to the level of output. In
support of the argument for using labor productivity, Byerlee et al. (2009)
show that countries with the highest agricultural growth per worker
experienced the greatest rate of rural poverty reduction. Other measures
of partial productivity have also been found to be significant determinants
of poverty: see for example Datt and Ravallion (1998) for the relationship
between the squared poverty gap and output per unit of land in India,
reflecting the scarcity of land. However, the policy implications of changes
in partial productivity measures are not clear, due to uncertainty about
their determinants, including changes in use of other factors or inputs or
changes in output mix. Furthermore, changes in output and in productivity
may not have similar impacts, and in some cases may move in different
directions with differing consequences for poverty (Schneider and Gugerty
2011); productivity gains may not actually result in poverty reduction
(Thirtle et al. 2001).
Measures of Agricultural Productivity and Data Sources

4 resakss.org
Total Factor Productivity (TFP)Total factor productivity (TFP) addresses some of the shortcomings of
using partial productivity measures. TFP, conceptually also a measure of
output to input, is the ratio of an index of agricultural output to an index of
agricultural inputs. Because TFP is a ratio of output to all factors and inputs
used in producing the output, the variables measured in PFP are by definition
components of TFP. Thus, PFP measures can be used to approximate TFP
to the extent that the excluded variables are trivial in the production of
the output—an empirical issue. Use of TFP is favored in the analysis of
productivity because long-run agricultural growth depends on TFP and its
two constituents: efficiency, arising from reallocation of inputs; and technical
change or technological advancement, arising from changes that are not
due to change in the amount of inputs. Basically, technical change is used
to describe a change in the amount of output produced with unchanged
levels of inputs. While such a change is typically technological and may
derive from investment in agricultural R&D, human capital, infrastructure,
and institutional development, it might also be
organizational or due to a change in a constraint
(such as a regulation), or due to an external factor
such as climate change (see for example Hayami
2001). There are various challenges in measuring
TFP however, particularly in allocating inputs across
sub-sectors and, in developing countries, obtaining
(market) prices to use in aggregating outputs and
inputs.
Data Sources and MethodologyThe data used to measure the different PFP
and TFP indicators are drawn from two main
sources: the United Nation’s Food and Agriculture
Organization database (FAOStat, FAO 2012); and
the World Bank World Development Indicators
(WDI, World Bank 2012). For the PFP measures
we focus on land and labor productivity, measured
at the national level by the ratio of total value of
agricultural output to (respectively) total harvested
TABlE 2.1: CounTRiES By gEogRAPhiC REgion AnD CounTRy’S ShARE in REgion’S ToTAl AgRiCulTuRE vAluE ADDED
central Africa eastern Africa northern Africa southern Africa western Africa
Burundi (3.6) Comoros (0.5) Algeria (17.7) Angola (12.9) Benin (3.1)
Cameroon (38.5) Djibouti (0.1) Egypt (50.9) Botswana (1.5) Burkina Faso (3.1)
Central African Rep. (7.8) Eritrea (0.5) Libya (2.7) Lesotho (0.7) Cape Verde (0.2)
Chad (6.7) Ethiopia (22.1) Mauritania (0.7) Malawi (7.0) Cote d’Ivoire (3.7)
Congo, Dem. Rep. (33.3) Kenya (17.7) Morocco (21.5) Mozambique (15.2) Gambia, The (0.4)
Congo, Rep. (2.8) Madagascar (4.8) Tunisia (6.5) Namibia (4.4) Ghana (6.9)
Equatorial Guinea (2.3) Mauritius (1.1) South Africa (43.8) Guinea (3.1)
Gabon (5.0) Rwanda (4.0) Swaziland (1.6) Guinea Bissau (0.4)
Sao Tome & Principe (–) Seychelles (0.1) Zambia (6.9) Liberia (0.9)
Somalia (–) Zimbabwe (6.1) Mali (3.7)
Sudan (23.6) Niger (2.4)
Tanzania (17.1) Nigeria (62.3)
Uganda (8.5) Senegal (2.4)
Sierra Leone (1.9)
Togo (1.6)
Source: Authors’ calculation based on AU 2011 and World Bank 2012.Notes: Figure in parenthesis is country’s percentage share in the region’s total agriculture value added (2003–2010 annual average). Sudan includes South Sudan because the data are not disaggregated for the two countries. Those highlighted are the largest (Nigeria, Egypt, Morocco, Algeria, Sudan, Kenya, South Africa, Ethiopia and Tanzania) and the fastest-growing (Angola, Guinea, Nigeria, Ethiopia, Rwanda, and Mozambique) agricultural economies in Africa.
2011 ReSAKSS Annual Trends and Outlook Report 5
area and total number of hours worked.
Performance over time (1980–2010) is analyzed
by plotting the logarithm of labor productivity
on the y-axis against the logarithm of land
productivity on the x-axis. The results are
presented at an aggregate level for the entire
continent (Africa) and for the five geographic
regions of the African Union (central, eastern,
northern, southern, and western). (See
Table 2.1 for the distribution of countries by
region.) The results are also presented using
other aggregations or groupings of countries,
based on the concept that different countries,
depending on their resource endowments
and stage of development, are on different
trajectories to achieving their development
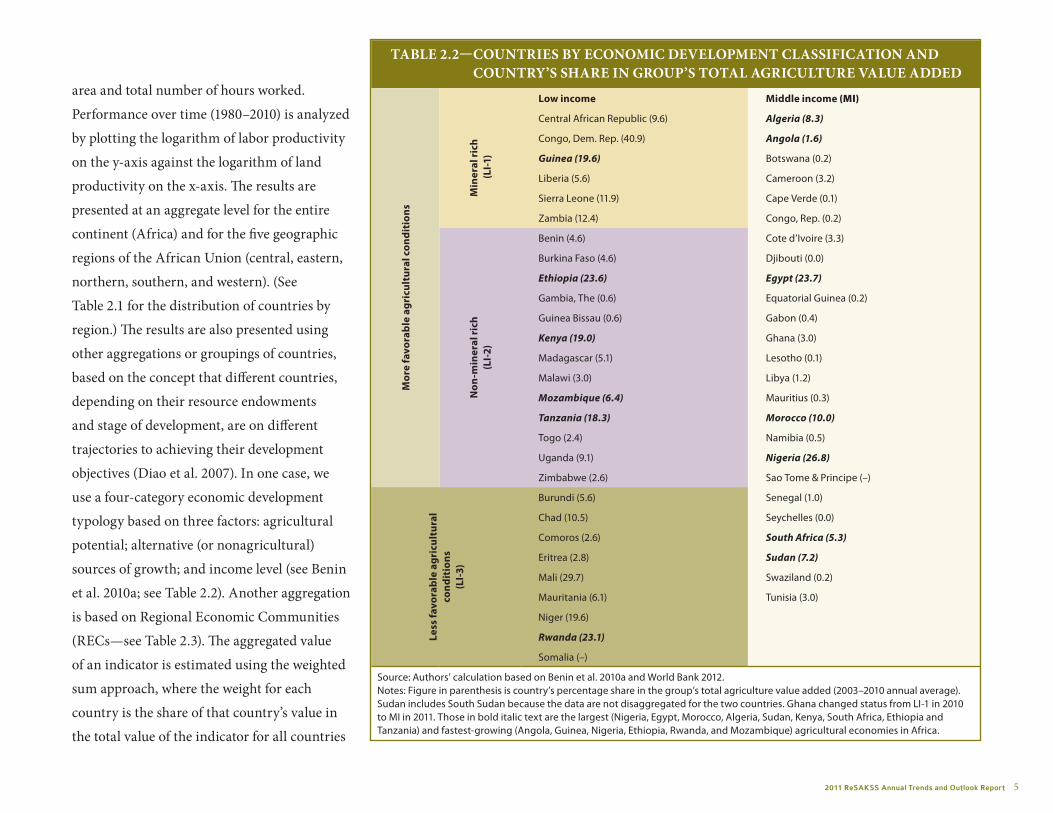
objectives (Diao et al. 2007). In one case, we
use a four-category economic development
typology based on three factors: agricultural
potential; alternative (or nonagricultural)
sources of growth; and income level (see Benin
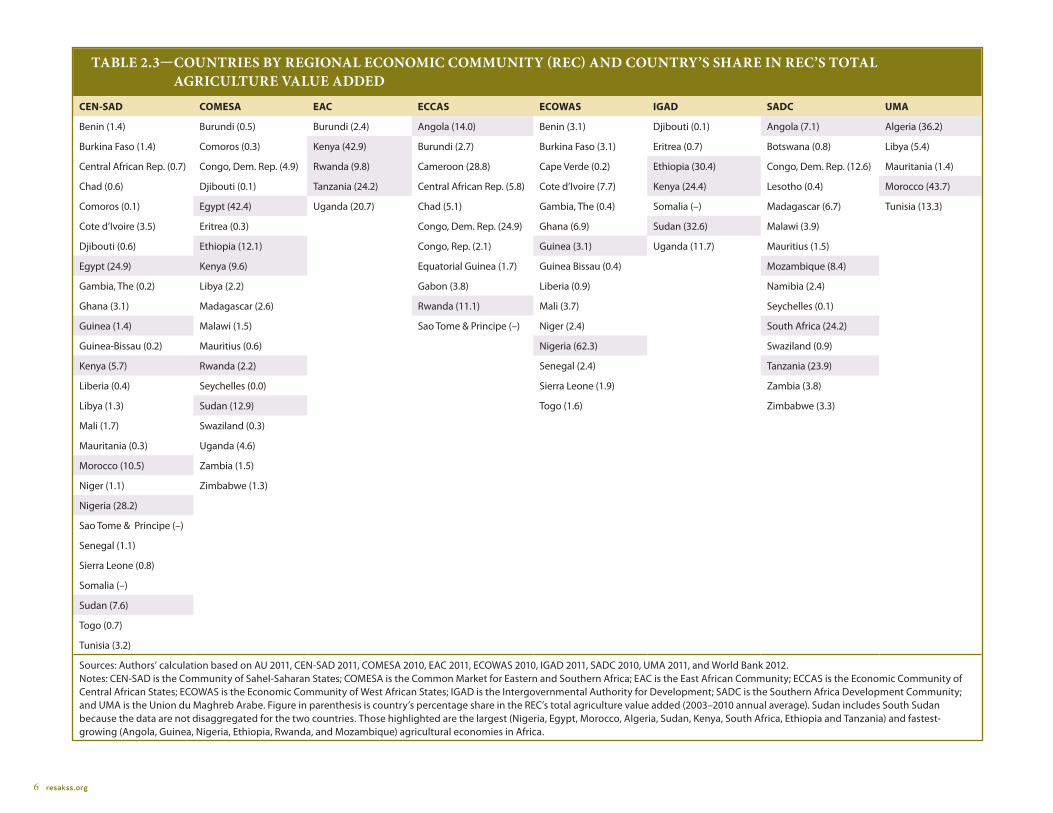
et al. 2010a; see Table 2.2). Another aggregation
is based on Regional Economic Communities
(RECs—see Table 2.3). The aggregated value
of an indicator is estimated using the weighted
sum approach, where the weight for each
country is the share of that country’s value in
the total value of the indicator for all countries
TABlE 2.2—CounTRiES By EConomiC DEvEloPmEnT ClASSiFiCATion AnD CounTRy’S ShARE in gRouP’S ToTAl AgRiCulTuRE vAluE ADDED
low income middle income (MI)
mor
e fa
vora
ble
agri
cult
ural
con
diti
ons
min
eral
rich
(li-1
)
Central African Republic (9.6) Algeria (8.3)
Congo, Dem. Rep. (40.9) Angola (1.6)
Guinea (19.6) Botswana (0.2)
Liberia (5.6) Cameroon (3.2)
Sierra Leone (11.9) Cape Verde (0.1)
Zambia (12.4) Congo, Rep. (0.2)
non
-min
eral
rich
(li-2
)
Benin (4.6) Cote d’Ivoire (3.3)
Burkina Faso (4.6) Djibouti (0.0)
Ethiopia (23.6) Egypt (23.7)
Gambia, The (0.6) Equatorial Guinea (0.2)
Guinea Bissau (0.6) Gabon (0.4)
Kenya (19.0) Ghana (3.0)
Madagascar (5.1) Lesotho (0.1)
Malawi (3.0) Libya (1.2)
Mozambique (6.4) Mauritius (0.3)
Tanzania (18.3) Morocco (10.0)
Togo (2.4) Namibia (0.5)
Uganda (9.1) Nigeria (26.8)
Zimbabwe (2.6) Sao Tome & Principe (–)
less
favo
rabl
e ag
ricu
ltur
al
cond
itio
ns(l
i-3)
Burundi (5.6) Senegal (1.0)
Chad (10.5) Seychelles (0.0)
Comoros (2.6) South Africa (5.3)
Eritrea (2.8) Sudan (7.2)
Mali (29.7) Swaziland (0.2)
Mauritania (6.1) Tunisia (3.0)
Niger (19.6)
Rwanda (23.1)
Somalia (–)
Source: Authors’ calculation based on Benin et al. 2010a and World Bank 2012.Notes: Figure in parenthesis is country’s percentage share in the group’s total agriculture value added (2003–2010 annual average). Sudan includes South Sudan because the data are not disaggregated for the two countries. Ghana changed status from LI-1 in 2010 to MI in 2011. Those in bold italic text are the largest (Nigeria, Egypt, Morocco, Algeria, Sudan, Kenya, South Africa, Ethiopia and Tanzania) and fastest-growing (Angola, Guinea, Nigeria, Ethiopia, Rwanda, and Mozambique) agricultural economies in Africa.
6 resakss.org
TABlE 2.3—CounTRiES By REgionAl EConomiC CommuniTy (REC) AnD CounTRy’S ShARE in REC’S ToTAl AgRiCulTuRE vAluE ADDED
cen-sAd comesA eAc eccAs ecowAs igAd sAdc umA
Benin (1.4) Burundi (0.5) Burundi (2.4) Angola (14.0) Benin (3.1) Djibouti (0.1) Angola (7.1) Algeria (36.2)
Burkina Faso (1.4) Comoros (0.3) Kenya (42.9) Burundi (2.7) Burkina Faso (3.1) Eritrea (0.7) Botswana (0.8) Libya (5.4)
Central African Rep. (0.7) Congo, Dem. Rep. (4.9) Rwanda (9.8) Cameroon (28.8) Cape Verde (0.2) Ethiopia (30.4) Congo, Dem. Rep. (12.6) Mauritania (1.4)
Chad (0.6) Djibouti (0.1) Tanzania (24.2) Central African Rep. (5.8) Cote d’Ivoire (7.7) Kenya (24.4) Lesotho (0.4) Morocco (43.7)
Comoros (0.1) Egypt (42.4) Uganda (20.7) Chad (5.1) Gambia, The (0.4) Somalia (–) Madagascar (6.7) Tunisia (13.3)
Cote d’Ivoire (3.5) Eritrea (0.3) Congo, Dem. Rep. (24.9) Ghana (6.9) Sudan (32.6) Malawi (3.9)
Djibouti (0.6) Ethiopia (12.1) Congo, Rep. (2.1) Guinea (3.1) Uganda (11.7) Mauritius (1.5)
Egypt (24.9) Kenya (9.6) Equatorial Guinea (1.7) Guinea Bissau (0.4) Mozambique (8.4)
Gambia, The (0.2) Libya (2.2) Gabon (3.8) Liberia (0.9) Namibia (2.4)
Ghana (3.1) Madagascar (2.6) Rwanda (11.1) Mali (3.7) Seychelles (0.1)
Guinea (1.4) Malawi (1.5) Sao Tome & Principe (–) Niger (2.4) South Africa (24.2)
Guinea-Bissau (0.2) Mauritius (0.6) Nigeria (62.3) Swaziland (0.9)
Kenya (5.7) Rwanda (2.2) Senegal (2.4) Tanzania (23.9)
Liberia (0.4) Seychelles (0.0) Sierra Leone (1.9) Zambia (3.8)
Libya (1.3) Sudan (12.9) Togo (1.6) Zimbabwe (3.3)
Mali (1.7) Swaziland (0.3)
Mauritania (0.3) Uganda (4.6)
Morocco (10.5) Zambia (1.5)
Niger (1.1) Zimbabwe (1.3)
Nigeria (28.2)
Sao Tome & Principe (–)
Senegal (1.1)
Sierra Leone (0.8)
Somalia (–)
Sudan (7.6)
Togo (0.7)
Tunisia (3.2)
Sources: Authors’ calculation based on AU 2011, CEN-SAD 2011, COMESA 2010, EAC 2011, ECOWAS 2010, IGAD 2011, SADC 2010, UMA 2011, and World Bank 2012.Notes: CEN-SAD is the Community of Sahel-Saharan States; COMESA is the Common Market for Eastern and Southern Africa; EAC is the East African Community; ECCAS is the Economic Community of Central African States; ECOWAS is the Economic Community of West African States; IGAD is the Intergovernmental Authority for Development; SADC is the Southern Africa Development Community; and UMA is the Union du Maghreb Arabe. Figure in parenthesis is country’s percentage share in the REC’s total agriculture value added (2003–2010 annual average). Sudan includes South Sudan because the data are not disaggregated for the two countries. Those highlighted are the largest (Nigeria, Egypt, Morocco, Algeria, Sudan, Kenya, South Africa, Ethiopia and Tanzania) and fastest-growing (Angola, Guinea, Nigeria, Ethiopia, Rwanda, and Mozambique) agricultural economies in Africa.

2011 ReSAKSS Annual Trends and Outlook Report 7
0 5 10 15 20 25
Mayote Sao Tome and Principe
Somalia South Sudan
Seychelles Djibouti
Cape Verde Lesotho
Eritrea Comoros
Guinea-Bissau Equatorial Guinea
Gambia, The Botswana Swaziland
Congo, Rep. of Burundi
Mauritania Mauritius
Gabon Liberia
Namibia Sierra Leone
Togo Central African Republic
Malawi Chad
Zambia Angola
Senegal Rwanda
Niger Guinea
Burkina Faso Benin
Zimbabwe Madagascar
Mozambique Mali
Libya Uganda
Congo, Dem. Rep. Tunisia Ghana
Cameroon Côte d'Ivoire
Tanzania Ethiopia
South Africa Kenya Sudan
Algeria Morocco
Egypt Nigeria
Source: Authors’ compilation based on World Bank 2012.Notes: Sudan includes South Sudan because the data are not disaggregated for the two countries.
FiguRE 2.1—AgRiCulTuRE vAluE ADDED By CounTRy (% of Africa total), 2003–2010 AnnuAl AvERAgE
in the region or group. To get a
sense of how individual countries
are performing with respect to
these indicators, we also present
trends for selected countries, those
with the largest or fastest-growing
agricultural economies. The largest
agricultural economies are defined
by their share in Africa’s total
agriculture value added: Nigeria,
Egypt, Morocco, Algeria, Sudan,
Kenya, South Africa, Ethiopia
and Tanzania (see Figure 2.1).
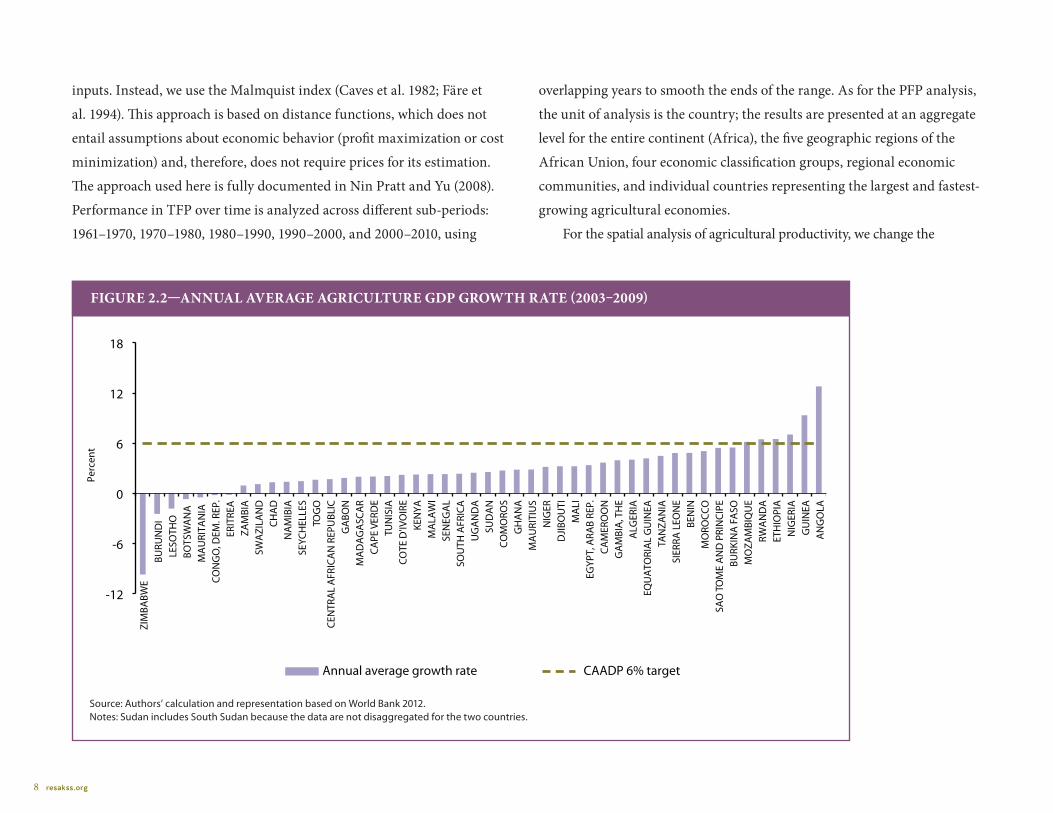
The fastest-growing agricultural
economies are those surpassing
the CAADP agricultural growth
rate target of 6 percent annually,
on average, since 2003: Angola,
Guinea, Nigeria, Ethiopia, Rwanda,
and Mozambique (see Figure 2.2).
For the TFP measure, a
commonly used approach is the
growth accounting approach,
using the Törnqvist-Theil
index. The main challenge in
developing country analysis is
obtaining (market) prices to
use in aggregating outputs and
8 resakss.org
inputs. Instead, we use the Malmquist index (Caves et al. 1982; Färe et
al. 1994). This approach is based on distance functions, which does not
entail assumptions about economic behavior (profit maximization or cost
minimization) and, therefore, does not require prices for its estimation.
The approach used here is fully documented in Nin Pratt and Yu (2008).
Performance in TFP over time is analyzed across different sub-periods:
1961–1970, 1970–1980, 1980–1990, 1990–2000, and 2000–2010, using
overlapping years to smooth the ends of the range. As for the PFP analysis,
the unit of analysis is the country; the results are presented at an aggregate
level for the entire continent (Africa), the five geographic regions of the
African Union, four economic classification groups, regional economic
communities, and individual countries representing the largest and fastest-
growing agricultural economies.
For the spatial analysis of agricultural productivity, we change the
Perc
ent
-12
-6
0
6
12
18
ZIM
BABW
E BU
RUN
DI
LESO
THO
BO
TSW
AN
A
MA
URI
TAN
IA
CON
GO
, DEM
. REP
. ER
ITRE
A
ZAM
BIA
SW
AZI
LAN
D
CHA
D
NA
MIB
IA
SEYC
HEL
LES
TOG
O
CEN
TRA
L A
FRIC
AN
REP
UBL
IC
GA
BON
M
AD
AG
ASC
AR
CAPE
VER
DE
TUN
ISIA
CO
TE D
'IVO
IRE
KEN
YA
MA
LAW
I SE
NEG
AL
SOU
TH A
FRIC
A
UG
AN
DA
SU
DA
N
COM
ORO
S G
HA
NA
M
AU
RITI
US
NIG
ER
DJI
BOU
TI
MA
LI
EGYP
T, A
RAB
REP.
CA
MER
OO
N
GA
MBI
A, T
HE
ALG
ERIA
EQ
UA
TORI
AL
GU
INEA
TA
NZA
NIA
SI
ERRA
LEO
NE
BEN
IN
MO
ROCC
O
SAO
TOM
E A
ND
PRI
NCI
PE
BURK
INA
FA
SO
MO
ZAM
BIQ
UE
RWA
ND
A
ETH
IOPI
A
NIG
ERIA
G
UIN
EA
AN
GO
LA
Annual average growth rate CAADP 6% target
Source: Authors’ calculation and representation based on World Bank 2012.Notes: Sudan includes South Sudan because the data are not disaggregated for the two countries.
FiguRE 2.2—AnnuAl AvERAgE AgRiCulTuRE gDP gRowTh RATE (2003–2009)
2011 ReSAKSS Annual Trends and Outlook Report 9
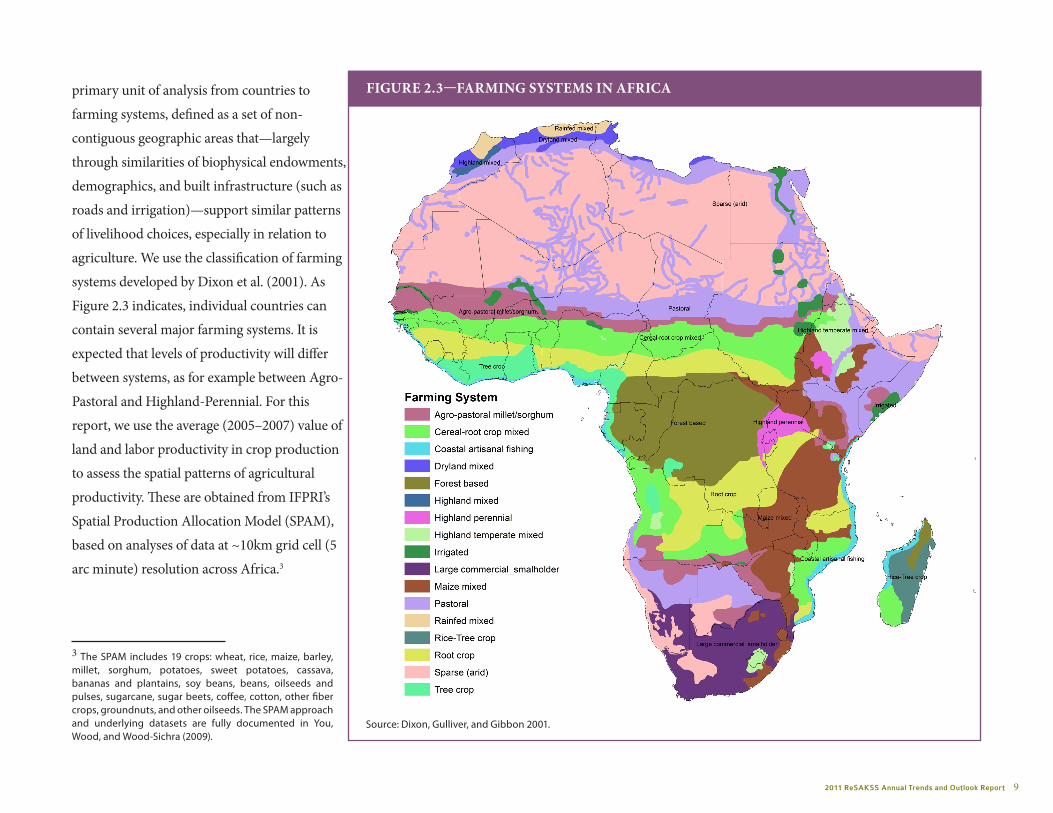
primary unit of analysis from countries to
farming systems, defined as a set of non-
contiguous geographic areas that—largely
through similarities of biophysical endowments,
demographics, and built infrastructure (such as
roads and irrigation)—support similar patterns
of livelihood choices, especially in relation to
agriculture. We use the classification of farming
systems developed by Dixon et al. (2001). As
Figure 2.3 indicates, individual countries can
contain several major farming systems. It is
expected that levels of productivity will differ
between systems, as for example between Agro-
Pastoral and Highland-Perennial. For this
report, we use the average (2005–2007) value of
land and labor productivity in crop production
to assess the spatial patterns of agricultural
productivity. These are obtained from IFPRI’s
Spatial Production Allocation Model (SPAM),
based on analyses of data at ~10km grid cell (5
arc minute) resolution across Africa.3
3 The SPAM includes 19 crops: wheat, rice, maize, barley, millet, sorghum, potatoes, sweet potatoes, cassava, bananas and plantains, soy beans, beans, oilseeds and pulses, sugarcane, sugar beets, coffee, cotton, other fiber crops, groundnuts, and other oilseeds. The SPAM approach and underlying datasets are fully documented in You, Wood, and Wood-Sichra (2009).
FiguRE 2.3—FARming SySTEmS in AFRiCA
Source: Dixon, Gulliver, and Gibbon 2001.

2011 ReSAKSS Annual Trends and Outlook Report 11
Annual Trends in Land and Labor Productivity
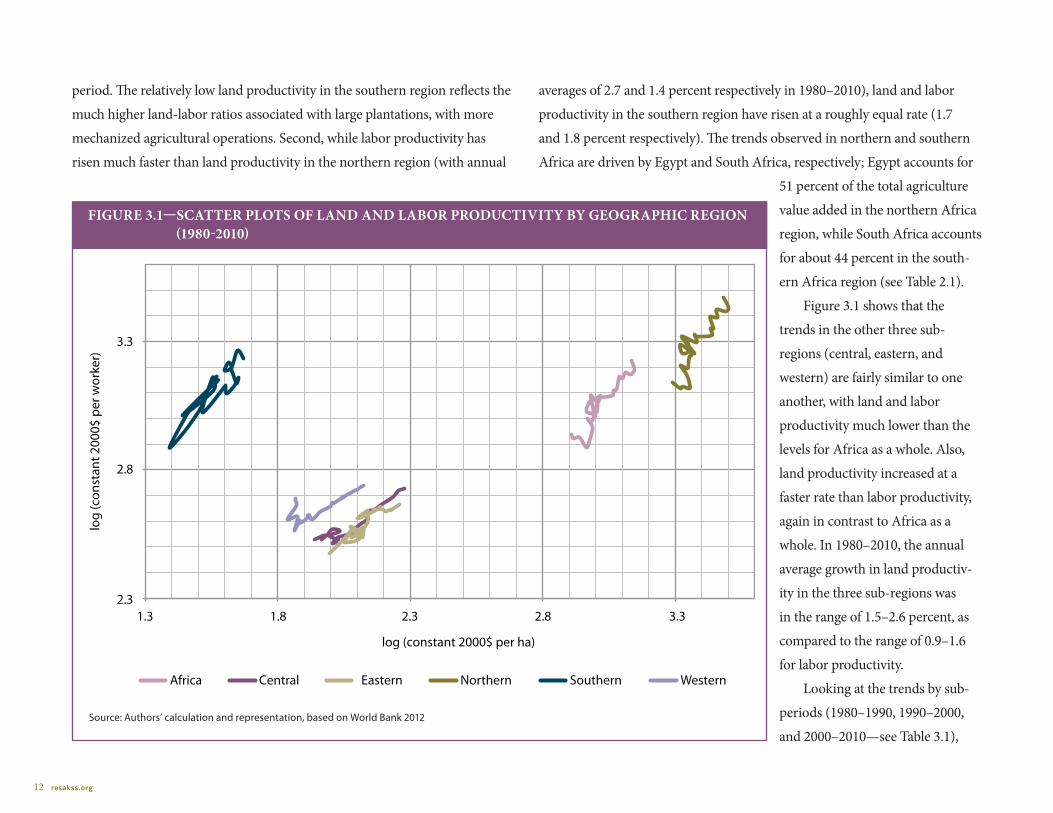
Annual trends in land and labor productivity are detailed in
Figures 3.1–3.3 and Table 3.1 for the aggregations and for
selected countries. The graphics are quite revealing and offer a
quick overview of the comparative trends. There are three aspects to the
graphics: the position of a plot in the quadrant space, the slope of the plot
(judged from a fitted line relative to an imaginary 45-degree line from the
origin), and the length of the plot. The position shows the magnitude that
is increasing in both land and labor productivity, going from the origin
in a north-easterly direction. For a particular plot, the slope reflects the
relative growth rates of labor and land productivity: a slope steeper than the
45-degree line reflects a higher labor productivity growth rate relative to
land productivity growth rate (with labor productivity shown on the y-axis);
conversely, for a plot flatter than the 45-degree line, land productivity
growth rate is higher relative to labor productivity growth rate. (This can
be extended to compare different plots. For any two plots, the steeper one
has a higher labor-land productivity growth rate ratio, irrespective of the
position of the plots in the quadrant.) The length reflects the magnitude of
the combined growth rates, with a longer plot depicting a larger combined
growth rate and a shorter plot depicting a smaller combined growth rate,
again irrespective of the position of the plot in the quadrant.
Africa and geographic sub-regionsFigures 3.1–3.3 and Table 3.1 show that the trends in land and labor produc-
tivity are highly variable in different dimensions across different parts of the
continent. For Africa as a whole, labor productivity increased on average by
2.3 percent per year in 1980–2010, compared to 1.6 percent increase per year
for land productivity, starting from 1980 levels of $996 per worker and $929
per hectare (ha). This trend suggests higher rates of investment in human
capital than in agricultural land. A similar trend is observed in the northern
African region, which experienced an annual average rate of growth of 2.7
percent in labor productivity and 1.4 percent in land productivity.
Northern and southern Africa have the highest annual average labor
productivities, at $1969 per worker in northern Africa and $1324 per worker
in southern Africa, compared to only $396 in central Africa, $390 in eastern
Africa, and $457 in western Africa. Comparing the northern and southern
Africa regions shows some significant differences, however. First, land
productivity is much higher in northern Africa: $2428 per ha on average in
1980–2010, compared to only $37 per ha in southern Africa over the same
Trends and Spatial Patterns in Land and Labor Productivity
12 resakss.org
period. The relatively low land productivity in the southern region reflects the
much higher land-labor ratios associated with large plantations, with more
mechanized agricultural operations. Second, while labor productivity has
risen much faster than land productivity in the northern region (with annual
averages of 2.7 and 1.4 percent respectively in 1980–2010), land and labor
productivity in the southern region have risen at a roughly equal rate (1.7
and 1.8 percent respectively). The trends observed in northern and southern
Africa are driven by Egypt and South Africa, respectively; Egypt accounts for
51 percent of the total agriculture
value added in the northern Africa
region, while South Africa accounts
for about 44 percent in the south-
ern Africa region (see Table 2.1).
Figure 3.1 shows that the
trends in the other three sub-
regions (central, eastern, and
western) are fairly similar to one
another, with land and labor
productivity much lower than the
levels for Africa as a whole. Also,
land productivity increased at a
faster rate than labor productivity,
again in contrast to Africa as a
whole. In 1980–2010, the annual
average growth in land productiv-
ity in the three sub-regions was
in the range of 1.5–2.6 percent, as
compared to the range of 0.9–1.6
for labor productivity.
Looking at the trends by sub-
periods (1980–1990, 1990–2000,
and 2000–2010—see Table 3.1),
FiguRE 3.1—SCATTER PloTS oF lAnD AnD lABoR PRoDuCTiviTy By gEogRAPhiC REgion (1980-2010)
Source: Authors’ calculation and representation, based on World Bank 2012
2.3
2.8
3.3
1.3 1.8 2.3 2.8 3.3
log
(con
stan
t 200
0$ p
er w
orke
r)
log (constant 2000$ per ha)
Africa Central Eastern Northern Southern Western
2011 ReSAKSS Annual Trends and Outlook Report 13
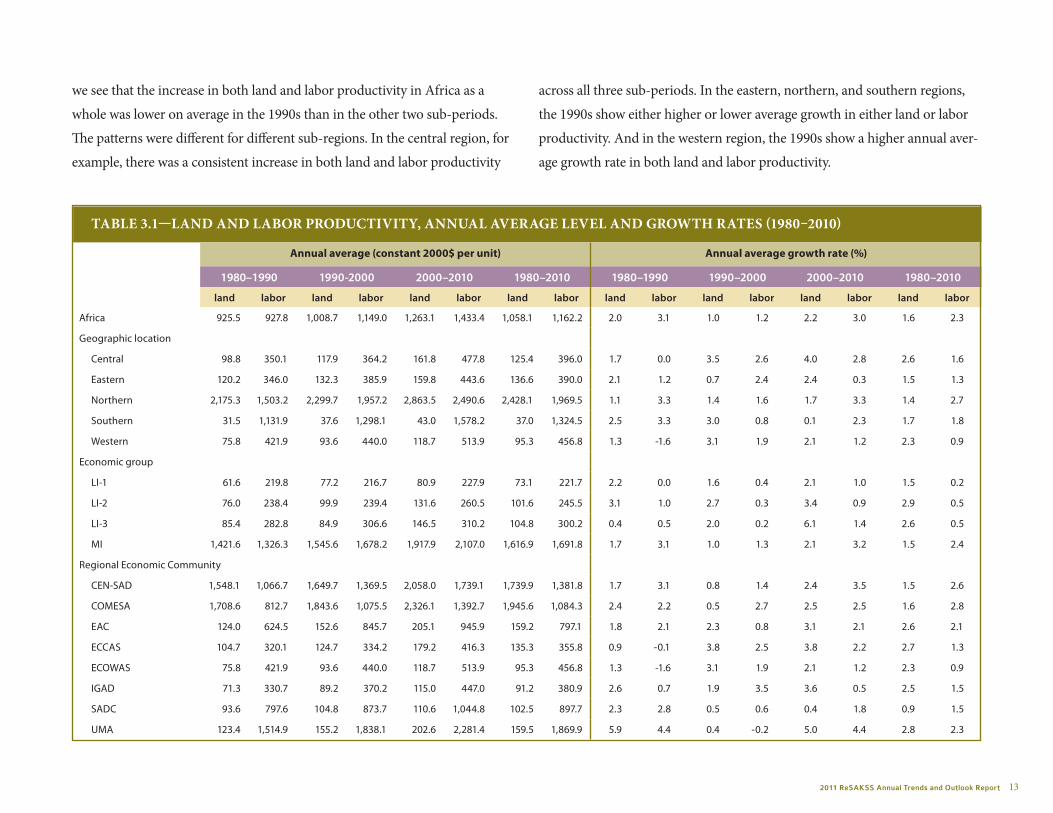
TABlE 3.1—lAnD AnD lABoR PRoDuCTiviTy, AnnuAl AvERAgE lEvEl AnD gRowTh RATES (1980–2010)
Annual average (constant 2000$ per unit) Annual average growth rate (%)
1980–1990 1990-2000 2000–2010 1980–2010 1980–1990 1990–2000 2000–2010 1980–2010
land labor land labor land labor land labor land labor land labor land labor land labor
Africa 925.5 927.8 1,008.7 1,149.0 1,263.1 1,433.4 1,058.1 1,162.2 2.0 3.1 1.0 1.2 2.2 3.0 1.6 2.3
Geographic location
Central 98.8 350.1 117.9 364.2 161.8 477.8 125.4 396.0 1.7 0.0 3.5 2.6 4.0 2.8 2.6 1.6
Eastern 120.2 346.0 132.3 385.9 159.8 443.6 136.6 390.0 2.1 1.2 0.7 2.4 2.4 0.3 1.5 1.3
Northern 2,175.3 1,503.2 2,299.7 1,957.2 2,863.5 2,490.6 2,428.1 1,969.5 1.1 3.3 1.4 1.6 1.7 3.3 1.4 2.7
Southern 31.5 1,131.9 37.6 1,298.1 43.0 1,578.2 37.0 1,324.5 2.5 3.3 3.0 0.8 0.1 2.3 1.7 1.8
Western 75.8 421.9 93.6 440.0 118.7 513.9 95.3 456.8 1.3 -1.6 3.1 1.9 2.1 1.2 2.3 0.9
Economic group
LI-1 61.6 219.8 77.2 216.7 80.9 227.9 73.1 221.7 2.2 0.0 1.6 0.4 2.1 1.0 1.5 0.2
LI-2 76.0 238.4 99.9 239.4 131.6 260.5 101.6 245.5 3.1 1.0 2.7 0.3 3.4 0.9 2.9 0.5
LI-3 85.4 282.8 84.9 306.6 146.5 310.2 104.8 300.2 0.4 0.5 2.0 0.2 6.1 1.4 2.6 0.5
MI 1,421.6 1,326.3 1,545.6 1,678.2 1,917.9 2,107.0 1,616.9 1,691.8 1.7 3.1 1.0 1.3 2.1 3.2 1.5 2.4
Regional Economic Community
CEN-SAD 1,548.1 1,066.7 1,649.7 1,369.5 2,058.0 1,739.1 1,739.9 1,381.8 1.7 3.1 0.8 1.4 2.4 3.5 1.5 2.6
COMESA 1,708.6 812.7 1,843.6 1,075.5 2,326.1 1,392.7 1,945.6 1,084.3 2.4 2.2 0.5 2.7 2.5 2.5 1.6 2.8
EAC 124.0 624.5 152.6 845.7 205.1 945.9 159.2 797.1 1.8 2.1 2.3 0.8 3.1 2.1 2.6 2.1
ECCAS 104.7 320.1 124.7 334.2 179.2 416.3 135.3 355.8 0.9 -0.1 3.8 2.5 3.8 2.2 2.7 1.3
ECOWAS 75.8 421.9 93.6 440.0 118.7 513.9 95.3 456.8 1.3 -1.6 3.1 1.9 2.1 1.2 2.3 0.9
IGAD 71.3 330.7 89.2 370.2 115.0 447.0 91.2 380.9 2.6 0.7 1.9 3.5 3.6 0.5 2.5 1.5
SADC 93.6 797.6 104.8 873.7 110.6 1,044.8 102.5 897.7 2.3 2.8 0.5 0.6 0.4 1.8 0.9 1.5
UMA 123.4 1,514.9 155.2 1,838.1 202.6 2,281.4 159.5 1,869.9 5.9 4.4 0.4 -0.2 5.0 4.4 2.8 2.3
we see that the increase in both land and labor productivity in Africa as a
whole was lower on average in the 1990s than in the other two sub-periods.
The patterns were different for different sub-regions. In the central region, for
example, there was a consistent increase in both land and labor productivity
across all three sub-periods. In the eastern, northern, and southern regions,
the 1990s show either higher or lower average growth in either land or labor
productivity. And in the western region, the 1990s show a higher annual aver-
age growth rate in both land and labor productivity.

14 resakss.org
Economic groups
The trends in land and labor productivity analyzed by the other
aggregations (that is, by economic classification or regional economic
communities) are presented in Figures 3.2 and 3.3. Looking at the trends
by economic classification (Figure 3.2), the middle-income (MI) category
clearly outperformed the others in both measures of productivity. In the
MI countries, average labor productivity has increased faster than land
productivity, whereas the opposite is observed in the other categories of
countries. Performance of the MI group as whole is heavily influenced by
the performance of Egypt and Nigeria, which account for about 24 and 27
percent respectively of the group’s total agriculture value added (see Table
2.2). However, while Egypt’s performance drives up the group’s average
performance in levels of productivity, Nigeria’s lower performance drags
down the average (see Table 3.1). The other three categories of countries are
TABlE 3.1—lAnD AnD lABoR PRoDuCTiviTy, AnnuAl AvERAgE lEvEl AnD gRowTh RATES (1980–2010) —Continued
Annual average (constant 2000$ per unit) Annual average growth rate (%)
1980–1990 1990-2000 2000–2010 1980–2010 1980–1990 1990–2000 2000–2010 1980–2010
land labor land labor land labor land labor land labor land labor land labor land labor
Selected countries
Largest agricultural economies
Algeria 70.0 1,572.1 104.6 1,773.0 150.7 2,067.5 107.6 1,802.5 4.8 2.6 3.2 0.0 4.1 2.9 4.1 1.5
Egypt 3,972.1 1,486.7 4,217.6 2,050.4 5,201.5 2,669.0 4,435.2 2,050.0 2.0 2.3 0.7 3.0 2.3 2.7 1.4 3.0
Ethiopia 83.1 157.8 113.0 167.4 148.7 176.7 114.1 167.3 3.4 1.1 2.6 -0.4 5.2 3.9 3.1 0.7
Kenya 100.9 399.9 120.6 346.4 156.4 352.7 124.9 366.7 2.7 -0.2 2.1 -1.3 2.0 0.1 2.3 -0.6
Morocco 156.4 1,439.1 183.1 1,678.5 239.6 2,269.7 192.5 1,790.9 6.2 6.2 -0.6 -0.9 6.1 6.5 2.5 2.6
Nigeria 384.9 n.a. 347.0 n.a. 297.6 n.a. 344.4 n.a. -1.2 n.a. -0.8 n.a. -1.5 n.a. -1.3 n.a.
South Africa 33.5 1,955.1 36.2 2,288.8 41.9 3,080.3 36.9 2,417.8 2.7 2.9 0.7 1.8 1.6 3.7 1.3 2.4
Sudan 22.8 507.9 29.5 643.5 41.7 845.2 31.1 661.1 0.5 0.9 6.6 5.3 2.0 1.4 3.1 2.6
Tanzania 56.9 202.9 79.6 222.0 113.1 261.5 82.3 227.8 3.7 1.6 3.2 0.6 4.0 2.1 3.6 1.3
At least 6% agGDP growth rate per year in 2003–10
Angola 11.1 212.3 8.0 118.5 17.6 195.7 12.2 176.0 2.3 -0.6 -1.4 -4.0 13.8 10.9 2.2 -0.4
Ethiopia 83.1 157.8 113.0 167.4 148.7 176.7 114.1 167.3 3.4 1.1 2.6 -0.4 5.2 3.9 3.1 0.7
Guinea 22.7 142.2 35.1 162.8 68.6 266.0 41.7 189.4 5.6 3.0 4.8 1.5 6.0 5.0 5.7 3.1
Mozambique 14.4 103.6 16.0 123.2 26.7 165.2 19.0 129.7 -3.5 4.8 5.0 1.8 7.9 6.0 3.1 2.7
Nigeria 384.9 n.a. 347.0 n.a. 297.6 n.a. 344.4 n.a. -1.2 n.a. -0.8 n.a. -1.5 n.a. -1.3 n.a.
Rwanda 274.6 198.2 300.0 194.9 480.0 217.4 349.1 204.1 -0.3 -2.5 4.0 1.3 4.5 0.4 2.7 0.3
Source: Authors’ calculation and representation, based on World Bank 2012.

2011 ReSAKSS Annual Trends and Outlook Report 15
low income, more favorable
agriculture, and mineral
rich (LI-1); low income,
more favorable agriculture,
and non-mineral rich (LI-
2); and low income and less
favorable agriculture (LI-3).
For these groups, we see
very little increase in labor
productivity (with annual
average growth rate of only
0.2–0.5 percent for 1980–
2010), and a more rapid
increase in land productivity
(annual average growth
rate of 1.5–2.9 percent for
the same period). Average
performance in the LI-1
group was the lowest, with
an annual average land
and labor productivity of
only $73 per ha and $222
per worker in 1980-2010;
the annual average rate of
growth was just 1.5 and 0.2
percent for land and labor
productivity respectively.
Note that the LI-1 group
FiguRE 3.2—SCATTER PloTS oF lAnD AnD lABoR PRoDuCTiviTy By EConomiC ClASSiFiCATion (1980–2010)
Source: Authors’ calculation and representation, based on World Bank 2012.
LI-1 LI-2 LI-3 MI
2.1
2.3
2.5
2.7
2.9
3.1
3.3
1.7 1.9 2.1 2.3 2.5 2.7 2.9 3.1 3.3
log
(con
stan
t 200
0$ p
er w
orke
r)
log (constant 2000$ per ha)
16 resakss.org
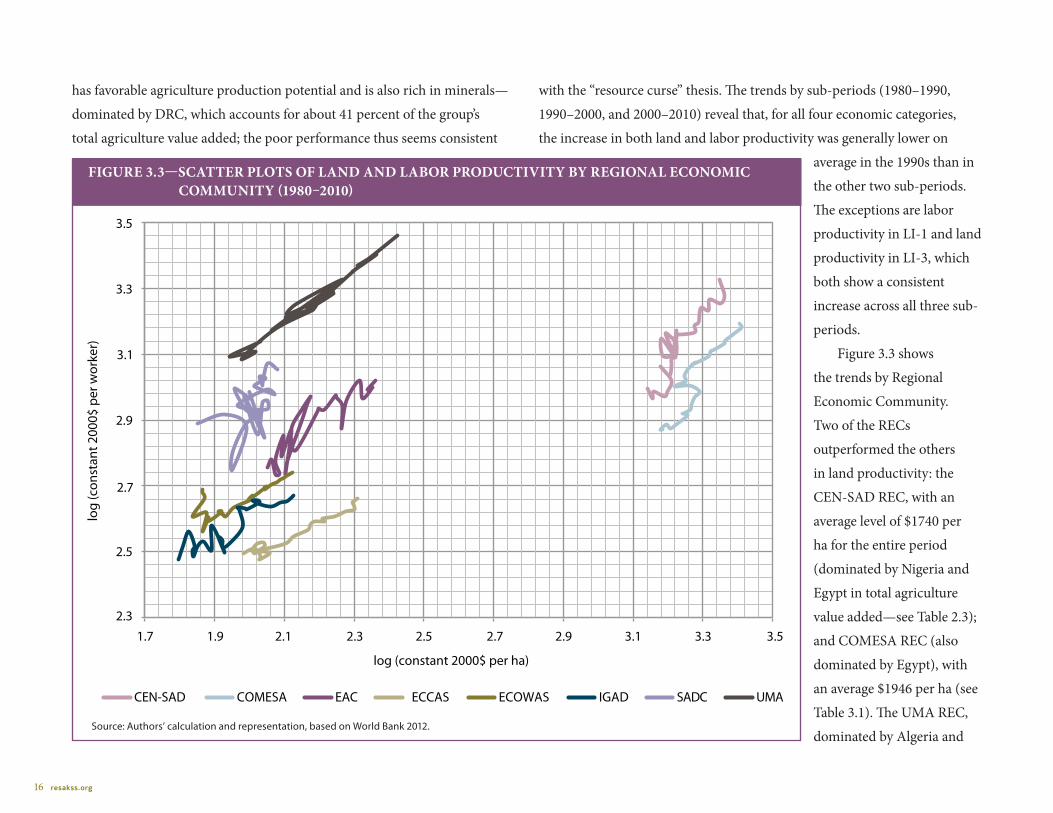
has favorable agriculture production potential and is also rich in minerals—
dominated by DRC, which accounts for about 41 percent of the group’s
total agriculture value added; the poor performance thus seems consistent
with the “resource curse” thesis. The trends by sub-periods (1980–1990,
1990–2000, and 2000–2010) reveal that, for all four economic categories,
the increase in both land and labor productivity was generally lower on
average in the 1990s than in
the other two sub-periods.
The exceptions are labor
productivity in LI-1 and land
productivity in LI-3, which
both show a consistent
increase across all three sub-
periods.
Figure 3.3 shows
the trends by Regional
Economic Community.
Two of the RECs
outperformed the others
in land productivity: the
CEN-SAD REC, with an
average level of $1740 per
ha for the entire period
(dominated by Nigeria and
Egypt in total agriculture
value added—see Table 2.3);
and COMESA REC (also
dominated by Egypt), with
an average $1946 per ha (see
Table 3.1). The UMA REC,
dominated by Algeria and
1.7 1.9 2.1 2.3 2.5 2.7 2.9 3.1 3.3 3.5
CEN-SAD COMESA EAC ECCAS ECOWAS IGAD SADC
2.3
2.5
2.7
2.9
3.1
3.3
3.5
log
(con
stan
t 200
0$ p
er w
orke
r)
log (constant 2000$ per ha)
UMA
FiguRE 3.3—SCATTER PloTS oF lAnD AnD lABoR PRoDuCTiviTy By REgionAl EConomiC CommuniTy (1980–2010)
Source: Authors’ calculation and representation, based on World Bank 2012.

2011 ReSAKSS Annual Trends and Outlook Report 17
Morocco, outperformed the other
RECs in labor productivity, with an
average of $1870 per worker. The
lower-performing RECs in both
land and labor productivity are
ECOWAS, IGAD, and ECCAS, with
average land and labor productivity
values in the range of $91–135 per
ha and $381–457 per worker. Land
productivity increased relatively
faster in these three RECs, with an
average annual rate in the range
of 2.3–2.7 percent, compared to
an average annual rate of growth
in labor productivity in the range
of only 0.9–1.5 percent (see Table
3.1). The EAC and SADC RECs
experienced the most variability
in land and labor productivity, as
reflected in the tortuous shape of
their plots (Figure 3.3).
Selected countriesTurning now to the selected
countries representing the largest
or fastest-growing agricultural
economies in Africa, we see that
Egypt is ahead of the pack in both
FiguRE 3.4—SCATTER PloTS oF lAnD AnD lABoR PRoDuCTiviTy By lARgEST oR FASTEST-gRowing AgRiCulTuRAl EConomiES in AFRiCA (1980–2010)
Source: Authors’ calculation and representation, based on World Bank 2012.Notes: Largest agricultural economies are the top nine countries in terms of percentage share in Africa’s total agriculture value added (see Figure 2.1); the fastest-growing agricultural economies are those surpassing the CAADP agricultural growth rate target of 6 percent (see Figure 2.2). Nigeria is missing because there were no data on labor productivity.
Algeria Angola Egypt Ethiopia Guinea Kenya
Morocco
log (constant 2000$ per ha)
Mozambique
1.6
2.1
2.6
3.1
3.6
0.6 1.1 1.6 2.1 2.6 3.1 3.6
log
(con
stan
t 200
0$ p
er w
orke
r)
Rwanda South Africa Sudan Tanzania
18 resakss.org
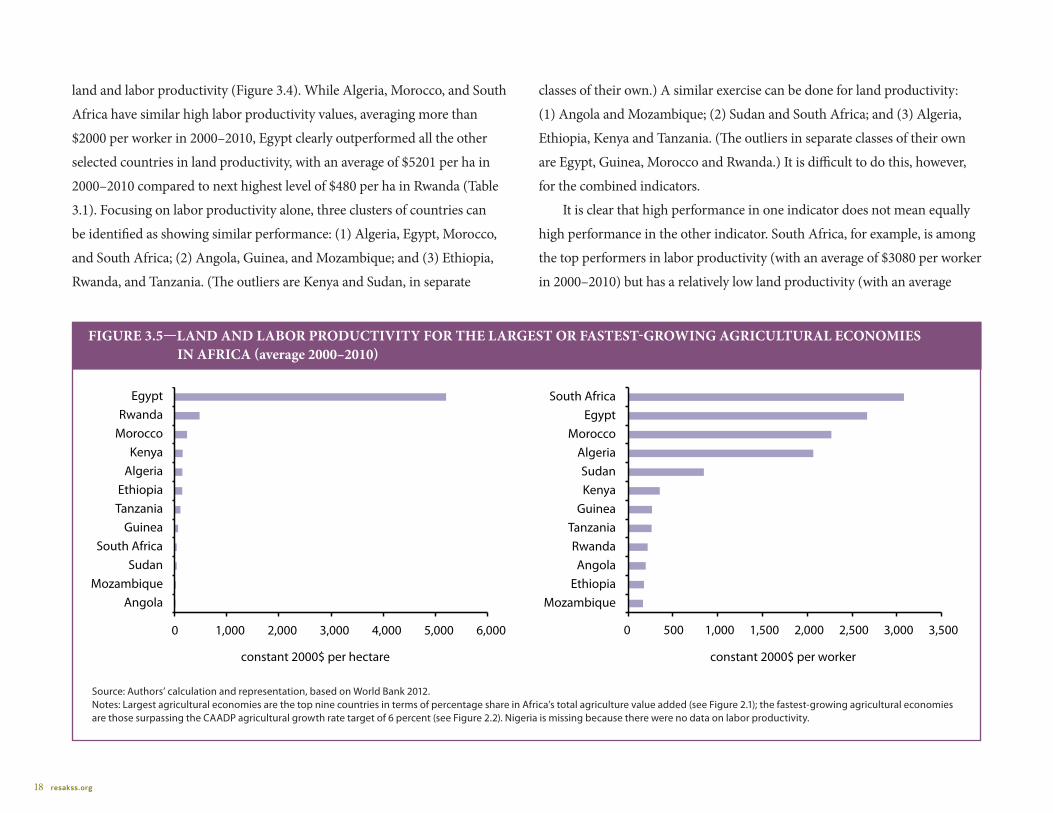
land and labor productivity (Figure 3.4). While Algeria, Morocco, and South
Africa have similar high labor productivity values, averaging more than
$2000 per worker in 2000–2010, Egypt clearly outperformed all the other
selected countries in land productivity, with an average of $5201 per ha in
2000–2010 compared to next highest level of $480 per ha in Rwanda (Table
3.1). Focusing on labor productivity alone, three clusters of countries can
be identified as showing similar performance: (1) Algeria, Egypt, Morocco,
and South Africa; (2) Angola, Guinea, and Mozambique; and (3) Ethiopia,
Rwanda, and Tanzania. (The outliers are Kenya and Sudan, in separate
classes of their own.) A similar exercise can be done for land productivity:
(1) Angola and Mozambique; (2) Sudan and South Africa; and (3) Algeria,
Ethiopia, Kenya and Tanzania. (The outliers in separate classes of their own
are Egypt, Guinea, Morocco and Rwanda.) It is difficult to do this, however,
for the combined indicators.
It is clear that high performance in one indicator does not mean equally
high performance in the other indicator. South Africa, for example, is among
the top performers in labor productivity (with an average of $3080 per worker
in 2000–2010) but has a relatively low land productivity (with an average
FiguRE 3.5—lAnD AnD lABoR PRoDuCTiviTy FoR ThE lARgEST oR FASTEST-gRowing AgRiCulTuRAl EConomiES in AFRiCA (average 2000–2010)
Source: Authors’ calculation and representation, based on World Bank 2012.Notes: Largest agricultural economies are the top nine countries in terms of percentage share in Africa’s total agriculture value added (see Figure 2.1); the fastest-growing agricultural economies are those surpassing the CAADP agricultural growth rate target of 6 percent (see Figure 2.2). Nigeria is missing because there were no data on labor productivity.
0 1,000 2,000 3,000 4,000 5,000 6,000
Angola Mozambique
Sudan South Africa
Guinea Tanzania Ethiopia
Algeria Kenya
Morocco Rwanda
Egypt
constant 2000$ per hectare
0 500 1,000 1,500 2,000 2,500 3,000 3,500
Mozambique Ethiopia
Angola Rwanda
Tanzania Guinea
Kenya Sudan
Algeria Morocco
Egypt South Africa
constant 2000$ per worker

2011 ReSAKSS Annual Trends and Outlook Report 19
of only $42 per ha in the same period). Figure 3.5 shows countries’ relative
rankings in the two indicators, using the average annual levels in 2000–2010
for illustration. Only Morocco has the same ranking in both measures, as
third highest performer.
Looking at change in productivity over the entire period (1980–2010),
Guinea is the top performer, with an annual average growth rate of 5.7
percent in land productivity and 3.1 percent in labor
productivity, although it started from very low levels of $7
per ha and $120 per worker in 1980. This is reflected by
the longest plot for Guinea (Figure 3.4). The next highest
performers in terms of change in productivity over the entire
period are Algeria and Morocco, which had high initial levels,
and Mozambique and Sudan, which had lower initial levels.
Angola is the only country that experienced a sharp reverse
in growth: there was a substantial decline in both land and
labor productivity in the 1980s and 1990s, due mostly to the
war, followed by recovery in the 2000s. Productivity went
down from its already low starting point of $9 per ha and
$212 per worker in 1980 to $5 per ha and $70 per worker in
1993, and then bounced back, with an average annual growth
rate of 13.8 and 10.9 percent in land and labor productivity in
the 2000s, reaching $31 per ha and $313 per worker in 2010.
Kenya shows the lowest performance in labor productivity
growth, with a declining trend, followed by Ethiopia and
Rwanda, as reflected in the relatively flat plots in Figure 3.4.
Analyzed by sub-periods (1980–1990, 1990–2000, and
2000–2010), the trends show that the growth in both land
and labor productivity was generally lower on average in
the 1990s than in the other two sub-periods, with many countries actually
experiencing decline for that decade (see Table 3.1). The 2000s saw strong
positive growth in both land and labor productivity in many countries,
headed by Angola followed by Mozambique, Morocco, and Ethiopia; these
four countries experienced roughly equal average annual growth rates in land
and labor productivity (Figure 3.6).
FiguRE 3.6—gRowTh RATE in lAnD AnD lABoR PRoDuCTiviTy FoR ThE lARgEST oR FASTEST-gRowing AgRiCulTuRAl EConomiES in AFRiCA (annual average 2000–2010)
Source: Authors’ calculation and representation, based on World Bank 2012.Notes: Largest agricultural economies are the top nine countries in terms of percentage share in Africa’s total agriculture value added (see Figure 2.1); the fastest-growing agricultural economies are those surpassing the CAADP agricultural growth rate target of 6 percent (see Figure 2.2). Nigeria is missing because there were no data on labor productivity.
0 5 10 15 20 25
Kenya
Sudan
Egypt
Rwanda
South Africa
Tanzania
Algeria
Ethiopia
Guinea
Morocco
Mozambique
Angola
change in constant 2000$ per hectare (%)
change in constant 2000$ per worker (%)

20 resakss.org
Spatial Patterns in Land and Labor ProductivityThe analysis of trends does not indicate the factors underlying the observed
differences across regions and countries. The following spatial analysis
helps to fill this gap, using farming systems as the primary spatial unit of
observation (see Figure 2.3). Due to data constraints, we use the 2005–
2007 average value of land and labor productivity in crop production,
corresponding to the four geographic regions of central, eastern, southern,
and western Africa. Detailed results are presented in Figure 3.7 and
Tables 3.2 and 3.3.
Land productivity in crop production, 2005–2007The results in Table 3.2 show that there is some consistency in the overall
regional land productivity levels, with a progression from eastern and central
Africa (average $555 per ha), through southern Africa ($604 per ha), to
western Africa ($671 per ha).
Western Africa shows a progressive increase in land productivity, from
the semi-arid Agro-Pastoral (millet/sorghum) systems of the Sahel ($337
per ha), through the higher rainfall Cereal-Root Crop system ($613 per ha)
and Root Crop system ($1070 per ha), to the sub-humid and humid Coastal-
Artisanal Fishing system ($1125 per ha). In the humid Tree Crop system, land
productivity is assessed at $1108 per ha. The higher productivity in the more
humid systems reflects higher-value cash crops, especially cocoa and rice,
and probably higher levels of market accessibility. While the pastoral systems
produce only about $240 per ha in crop production, these areas are, by
definition, primarily livestock oriented. The progression of land productivity
values in western Africa represents an almost five-fold range, from $240 per
ha in the semi-arid marginal croplands that fringe the Sahel to $1125 per
ha in the most humid coastal areas, showing a striking pattern of alignment
between the gradients of rainfall and productivity. Furthermore, based on a
separate analysis of the spatial patterns of rainfall variability, it is likely that
the higher returns to land in more humid zones are also more stable from
year to year. In the semi-arid pastoral systems, in contrast, crop production
is not only less suited but also more erratic from year to year. A surprising
TABlE 3.2—vAluE ($) oF CRoP PRoDuCTion PER hA oF CRoPlAnD (average 2005–2007)
farming systemeastern and
central Africasouthern
Africawestern
Africa total
Agro-Pastoral millet/sorghum 289 465 337 340
Cereal-Root Crop Mixed 372 437 613 572
Coastal-Artisanal Fishing 688 357 1,125 870
Forest Based 523 1,315 839 575
Highland Perennial 822 n.a. n.a. 822
Highland Temperate Mixed 530 368 1,103 547
Irrigated 268 439 440 344
Large Commercial Smallholder n.a. 850 n.a. 850
Maize Mixed 592 563 721 582
Pastoral 418 660 240 326
Rice-Tree Crop 853 n.a. n.a. 853
Root Crop 658 544 1,070 945
Sparse (Arid) 246 545 735 278
Tree Crop 710 1,064 1,108 1,093
Not Labeled1 625 778 949 878
Average 555 604 671 624
Source: Authors’ calculations based on: HarvestChoice/IFPRI SPAM Crop Distribution (You, Wood, and Wood-Sichra 2009); farming systems (Dixon, Gulliver, and Gibbon 2001); FAO crop prices (FAOSTAT 2012); and cropland distribution (Ramankutty et al. 2008). See Tables 3A.1 and 3A.2 for details.Notes: n.a. means not applicable. Other systems not shown are: Dryland Mixed, Highland Mixed, and Rainfed Mixed, which occur in northern Africa. 1 “Not labeled” comprises grid cells that do not have an assigned farming system, because of differences in the delineation of water and land interface (such as coastlines, lake areas) between data layers
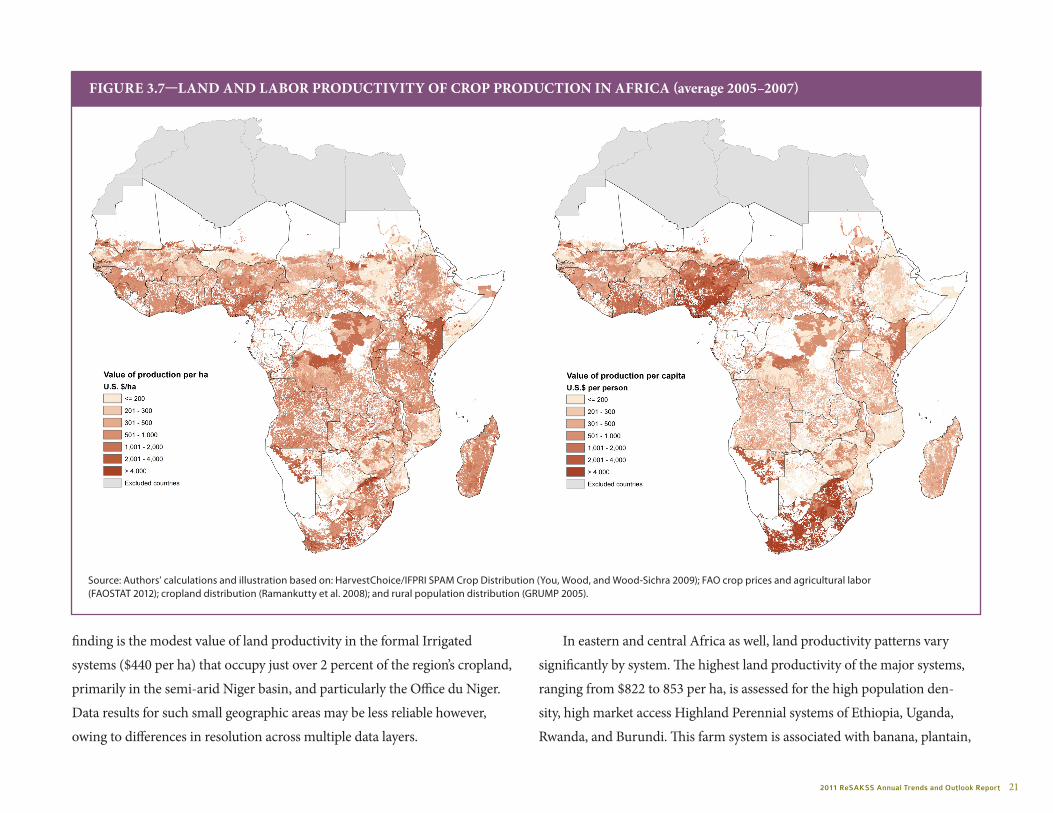
2011 ReSAKSS Annual Trends and Outlook Report 21
finding is the modest value of land productivity in the formal Irrigated
systems ($440 per ha) that occupy just over 2 percent of the region’s cropland,
primarily in the semi-arid Niger basin, and particularly the Office du Niger.
Data results for such small geographic areas may be less reliable however,
owing to differences in resolution across multiple data layers.
In eastern and central Africa as well, land productivity patterns vary
significantly by system. The highest land productivity of the major systems,
ranging from $822 to 853 per ha, is assessed for the high population den-
sity, high market access Highland Perennial systems of Ethiopia, Uganda,
Rwanda, and Burundi. This farm system is associated with banana, plantain,
FiguRE 3.7—lAnD AnD lABoR PRoDuCTiviTy oF CRoP PRoDuCTion in AFRiCA (average 2005–2007)
Source: Authors’ calculations and illustration based on: HarvestChoice/IFPRI SPAM Crop Distribution (You, Wood, and Wood-Sichra 2009); FAO crop prices and agricultural labor (FAOSTAT 2012); cropland distribution (Ramankutty et al. 2008); and rural population distribution (GRUMP 2005).
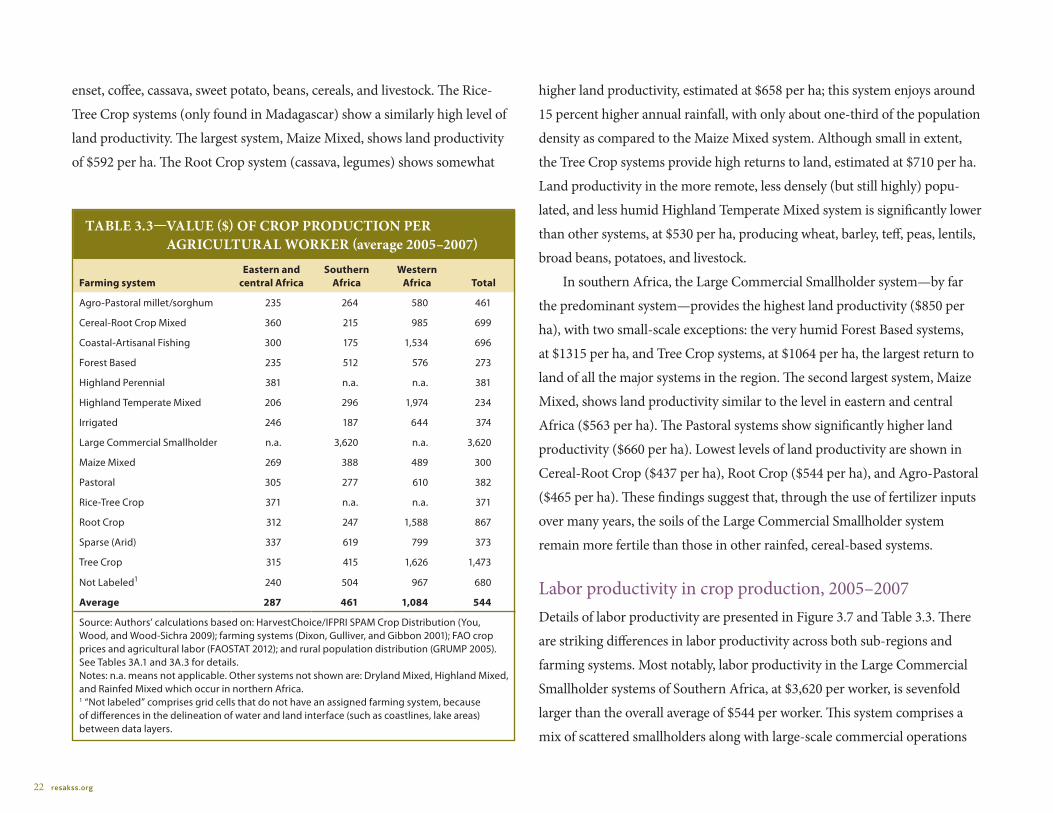
22 resakss.org
enset, coffee, cassava, sweet potato, beans, cereals, and livestock. The Rice-
Tree Crop systems (only found in Madagascar) show a similarly high level of
land productivity. The largest system, Maize Mixed, shows land productivity
of $592 per ha. The Root Crop system (cassava, legumes) shows somewhat
higher land productivity, estimated at $658 per ha; this system enjoys around
15 percent higher annual rainfall, with only about one-third of the population
density as compared to the Maize Mixed system. Although small in extent,
the Tree Crop systems provide high returns to land, estimated at $710 per ha.
Land productivity in the more remote, less densely (but still highly) popu-
lated, and less humid Highland Temperate Mixed system is significantly lower
than other systems, at $530 per ha, producing wheat, barley, teff, peas, lentils,
broad beans, potatoes, and livestock.
In southern Africa, the Large Commercial Smallholder system—by far
the predominant system—provides the highest land productivity ($850 per
ha), with two small-scale exceptions: the very humid Forest Based systems,
at $1315 per ha, and Tree Crop systems, at $1064 per ha, the largest return to
land of all the major systems in the region. The second largest system, Maize
Mixed, shows land productivity similar to the level in eastern and central
Africa ($563 per ha). The Pastoral systems show significantly higher land
productivity ($660 per ha). Lowest levels of land productivity are shown in
Cereal-Root Crop ($437 per ha), Root Crop ($544 per ha), and Agro-Pastoral
($465 per ha). These findings suggest that, through the use of fertilizer inputs
over many years, the soils of the Large Commercial Smallholder system
remain more fertile than those in other rainfed, cereal-based systems.
Labor productivity in crop production, 2005–2007Details of labor productivity are presented in Figure 3.7 and Table 3.3. There
are striking differences in labor productivity across both sub-regions and
farming systems. Most notably, labor productivity in the Large Commercial
Smallholder systems of Southern Africa, at $3,620 per worker, is sevenfold
larger than the overall average of $544 per worker. This system comprises a
mix of scattered smallholders along with large-scale commercial operations
TABlE 3.3—vAluE ($) oF CRoP PRoDuCTion PER AgRiCulTuRAl woRKER (average 2005–2007)
farming systemeastern and
central Africasouthern
Africawestern
Africa total
Agro-Pastoral millet/sorghum 235 264 580 461
Cereal-Root Crop Mixed 360 215 985 699
Coastal-Artisanal Fishing 300 175 1,534 696
Forest Based 235 512 576 273
Highland Perennial 381 n.a. n.a. 381
Highland Temperate Mixed 206 296 1,974 234
Irrigated 246 187 644 374
Large Commercial Smallholder n.a. 3,620 n.a. 3,620
Maize Mixed 269 388 489 300
Pastoral 305 277 610 382
Rice-Tree Crop 371 n.a. n.a. 371
Root Crop 312 247 1,588 867
Sparse (Arid) 337 619 799 373
Tree Crop 315 415 1,626 1,473
Not Labeled1 240 504 967 680
Average 287 461 1,084 544
Source: Authors’ calculations based on: HarvestChoice/IFPRI SPAM Crop Distribution (You, Wood, and Wood-Sichra 2009); farming systems (Dixon, Gulliver, and Gibbon 2001); FAO crop prices and agricultural labor (FAOSTAT 2012); and rural population distribution (GRUMP 2005). See Tables 3A.1 and 3A.3 for details.Notes: n.a. means not applicable. Other systems not shown are: Dryland Mixed, Highland Mixed, and Rainfed Mixed which occur in northern Africa.1 “Not labeled” comprises grid cells that do not have an assigned farming system, because of differences in the delineation of water and land interface (such as coastlines, lake areas) between data layers.
2011 ReSAKSS Annual Trends and Outlook Report 23
that are generally highly mechanized. All the other systems with high levels
of labor productivity are found in western Africa, led by the Root Crop
and Tree Crop systems, representing about 40 percent of western Africa’s
cropland. The Tree Crop systems in the sub-region yield an estimated $1626
per worker, producing many high-value cash crops (such as cocoa, coffee,
oil palm, rubber, and yams), including perennials that require less intensive
labor inputs than annual crops. Root Crop systems ($1588 per worker) are
characterized by crops with high yields and, in the case of yams, high value.
By contrast, labor productivity in eastern and central Africa is remarkably
uniform and low, ranging from $235 to $380 per worker. The Highland
Perennial and Rice-Tree Crop systems show the highest productivity, at $381
and $371 per worker respectively. Comparing the major cereal-based farming
systems, western Africa shows two- to three-fold higher labor productivity
than eastern and central Africa. (Note that the relative productivities
among systems in the eastern and central regions are fairly consistent
with expectations.) There are two possible explanations for this systematic
difference. First, western Africa shows a wider prevalence of informal
irrigation within rainfed systems (for example, inland valley production
practices); these systems, while not classified as part of the Irrigated farming
systems, boost yields and in many cases produce rice, a higher-value cereal.
(Note that, consistent with this hypothesis, land productivity is also high
for these two cereal-based systems.) Second, there may be a structural bias
to our estimates, reflecting the systematically lower share of the population
identified as “economically active in agriculture” in western Africa, since the
primary proxy used for number of agricultural workers is the International
Labor Organization (ILO) national estimate of “economically active in
agriculture” (spatially downscaled according to the distribution of rural
population).
Summary of FindingsWe find that the trends in land and labor productivity are highly variable
in different dimensions across different parts of the continent. High
performance in one indicator does not necessarily mean equally high
performance in the other indicator. Looking at the annual trends over the
entire 1980–2010 period, we find that labor productivity has risen much
faster than land productivity in Africa as a whole. This holds particularly for
the northern Africa region, the middle income country group, and the CEN-
SAD REC, reflecting Egypt’s performance and inclusion in these groupings.
In many of the other groups, however, we find the opposite: land productivity
has risen much faster than labor productivity. The exceptions are the southern
Africa region and Morocco, where land and labor productivity have risen at
about the same rate, on average. Looking at the trends by sub-periods (1980–
1990, 1990–2000, and 2000–2010), we find a slower rate of increase in both
land and labor productivity in the 1990s than in the other two sub-periods.
The 2000s saw strong positive growth in both land and labor productivity,
reflecting a recovery from the downturn in the 1990s, with the UMA REC
and Angola clearly in the forefront of the agricultural recovery.
The geographic context conditions both the baselines and the likely
trajectory of productivity growth, and thus plays a significant role in
accounting for the differences in land and labor productivity across different
parts of the continent—characterized by diverse farming systems based
on shared characteristics of biophysical endowment, demographics, and
infrastructure. Setting aside the findings for the least important farming
systems, the results of the spatial analysis show 2005–07 average land
productivity values for crop production ranging from a low of $240-$290
per ha for the Agro-Pastoral (millet/sorghum) systems in eastern Africa
and the Pastoral systems in western Africa to a high of $1125 per ha
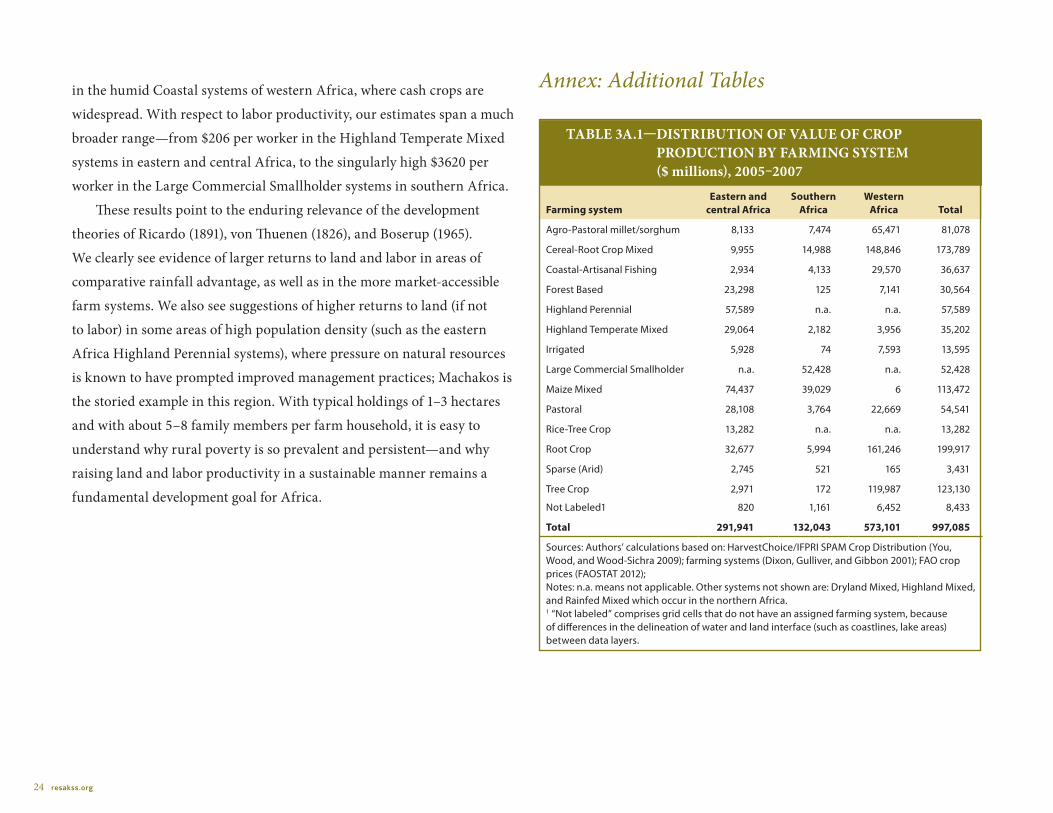
24 resakss.org
in the humid Coastal systems of western Africa, where cash crops are
widespread. With respect to labor productivity, our estimates span a much
broader range—from $206 per worker in the Highland Temperate Mixed
systems in eastern and central Africa, to the singularly high $3620 per
worker in the Large Commercial Smallholder systems in southern Africa.
These results point to the enduring relevance of the development
theories of Ricardo (1891), von Thuenen (1826), and Boserup (1965).
We clearly see evidence of larger returns to land and labor in areas of
comparative rainfall advantage, as well as in the more market-accessible
farm systems. We also see suggestions of higher returns to land (if not
to labor) in some areas of high population density (such as the eastern
Africa Highland Perennial systems), where pressure on natural resources
is known to have prompted improved management practices; Machakos is
the storied example in this region. With typical holdings of 1–3 hectares
and with about 5–8 family members per farm household, it is easy to
understand why rural poverty is so prevalent and persistent—and why
raising land and labor productivity in a sustainable manner remains a
fundamental development goal for Africa.
Annex: Additional Tables
TABlE 3A.1—DiSTRiBuTion oF vAluE oF CRoP PRoDuCTion By FARming SySTEm ($ millions), 2005–2007
farming systemeastern and
central Africasouthern
Africawestern
Africa total
Agro-Pastoral millet/sorghum 8,133 7,474 65,471 81,078
Cereal-Root Crop Mixed 9,955 14,988 148,846 173,789
Coastal-Artisanal Fishing 2,934 4,133 29,570 36,637
Forest Based 23,298 125 7,141 30,564
Highland Perennial 57,589 n.a. n.a. 57,589
Highland Temperate Mixed 29,064 2,182 3,956 35,202
Irrigated 5,928 74 7,593 13,595
Large Commercial Smallholder n.a. 52,428 n.a. 52,428
Maize Mixed 74,437 39,029 6 113,472
Pastoral 28,108 3,764 22,669 54,541
Rice-Tree Crop 13,282 n.a. n.a. 13,282
Root Crop 32,677 5,994 161,246 199,917
Sparse (Arid) 2,745 521 165 3,431
Tree Crop 2,971 172 119,987 123,130
Not Labeled1 820 1,161 6,452 8,433
total 291,941 132,043 573,101 997,085
Sources: Authors’ calculations based on: HarvestChoice/IFPRI SPAM Crop Distribution (You, Wood, and Wood-Sichra 2009); farming systems (Dixon, Gulliver, and Gibbon 2001); FAO crop prices (FAOSTAT 2012);Notes: n.a. means not applicable. Other systems not shown are: Dryland Mixed, Highland Mixed, and Rainfed Mixed which occur in the northern Africa.1 “Not labeled” comprises grid cells that do not have an assigned farming system, because of differences in the delineation of water and land interface (such as coastlines, lake areas) between data layers.
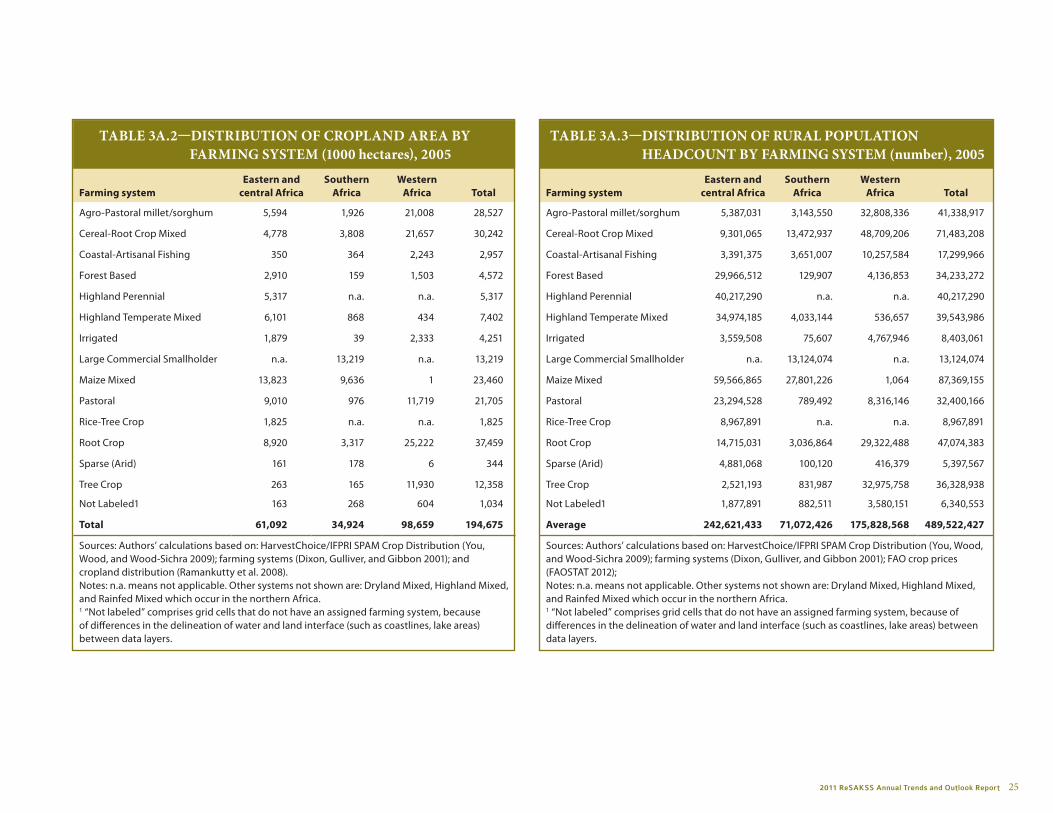
2011 ReSAKSS Annual Trends and Outlook Report 25
TABlE 3A.2—DiSTRiBuTion oF CRoPlAnD AREA By FARming SySTEm (1000 hectares), 2005
farming systemeastern and
central Africasouthern
Africawestern
Africa total
Agro-Pastoral millet/sorghum 5,594 1,926 21,008 28,527
Cereal-Root Crop Mixed 4,778 3,808 21,657 30,242
Coastal-Artisanal Fishing 350 364 2,243 2,957
Forest Based 2,910 159 1,503 4,572
Highland Perennial 5,317 n.a. n.a. 5,317
Highland Temperate Mixed 6,101 868 434 7,402
Irrigated 1,879 39 2,333 4,251
Large Commercial Smallholder n.a. 13,219 n.a. 13,219
Maize Mixed 13,823 9,636 1 23,460
Pastoral 9,010 976 11,719 21,705
Rice-Tree Crop 1,825 n.a. n.a. 1,825
Root Crop 8,920 3,317 25,222 37,459
Sparse (Arid) 161 178 6 344
Tree Crop 263 165 11,930 12,358
Not Labeled1 163 268 604 1,034
total 61,092 34,924 98,659 194,675
Sources: Authors’ calculations based on: HarvestChoice/IFPRI SPAM Crop Distribution (You, Wood, and Wood-Sichra 2009); farming systems (Dixon, Gulliver, and Gibbon 2001); and cropland distribution (Ramankutty et al. 2008).Notes: n.a. means not applicable. Other systems not shown are: Dryland Mixed, Highland Mixed, and Rainfed Mixed which occur in the northern Africa.1 “Not labeled” comprises grid cells that do not have an assigned farming system, because of differences in the delineation of water and land interface (such as coastlines, lake areas) between data layers.
TABlE 3A.3—DiSTRiBuTion oF RuRAl PoPulATion hEADCounT By FARming SySTEm (number), 2005
farming systemeastern and
central Africasouthern
Africawestern
Africa total
Agro-Pastoral millet/sorghum 5,387,031 3,143,550 32,808,336 41,338,917
Cereal-Root Crop Mixed 9,301,065 13,472,937 48,709,206 71,483,208
Coastal-Artisanal Fishing 3,391,375 3,651,007 10,257,584 17,299,966
Forest Based 29,966,512 129,907 4,136,853 34,233,272
Highland Perennial 40,217,290 n.a. n.a. 40,217,290
Highland Temperate Mixed 34,974,185 4,033,144 536,657 39,543,986
Irrigated 3,559,508 75,607 4,767,946 8,403,061
Large Commercial Smallholder n.a. 13,124,074 n.a. 13,124,074
Maize Mixed 59,566,865 27,801,226 1,064 87,369,155
Pastoral 23,294,528 789,492 8,316,146 32,400,166
Rice-Tree Crop 8,967,891 n.a. n.a. 8,967,891
Root Crop 14,715,031 3,036,864 29,322,488 47,074,383
Sparse (Arid) 4,881,068 100,120 416,379 5,397,567
Tree Crop 2,521,193 831,987 32,975,758 36,328,938
Not Labeled1 1,877,891 882,511 3,580,151 6,340,553
Average 242,621,433 71,072,426 175,828,568 489,522,427
Sources: Authors’ calculations based on: HarvestChoice/IFPRI SPAM Crop Distribution (You, Wood, and Wood-Sichra 2009); farming systems (Dixon, Gulliver, and Gibbon 2001); FAO crop prices (FAOSTAT 2012);Notes: n.a. means not applicable. Other systems not shown are: Dryland Mixed, Highland Mixed, and Rainfed Mixed which occur in the northern Africa.1 “Not labeled” comprises grid cells that do not have an assigned farming system, because of differences in the delineation of water and land interface (such as coastlines, lake areas) between data layers.

2011 ReSAKSS Annual Trends and Outlook Report 27
Trends in Total Factor Productivity (TFP)
By accounting for all factors and inputs used in production,
total factor productivity (TFP) can better capture the overall
performance of agricultural production. Moreover, it can
be decomposed into efficiency, changes reflecting the reallocation of
productive factors, and technical change, changes in the amount of output
produced with unchanged levels of inputs. Because of data constraints, the
analysis and results are based on 29 countries in four geographic regions—
central, eastern, southern, and western Africa.4 These countries include
six of the nine largest agricultural economies and five of the six fastest-
growing agricultural economies in Africa identified in this study.5 The
results are shown in Tables 4.1 and 4.2 and Figures 4.1–4.3 and 4.5 for the
different aggregations and selected countries. Table 4.1 shows the average
annual levels of TFP and its decomposed parts (indexed at 1961=1) for the
period 1961–2005 and for five sub-periods (1961–1970, 1970–1980, 1980–
1990, 1990–2000, and 2000–2005). Table 4.2 shows the average annual
percentage growth rates, in the same format. Because the annual averages,
although useful from the quantitative perspective, can hide significant
variations across time, Figures 4.1–4.3 and 4.5 give a bird’s-eye view of
such variations.
Trends in TFP at the Aggregate LevelsTaking all the 29 countries together (which we use to represent Africa as a
whole), the results show that the annual average growth rate in TFP over
the entire period of 1961–2005 was -0.28 percent (Table 4.1), declining
from a value of 1.00 in 1961–1970 to 0.94 in 2000–2005 (Table 4.2). This
means that on average, agricultural TFP was 6 percentage points lower in
2000–2005 than the level in 1961–1970. From Figure 4.1, we can see that
there was a slight overall improvement in the 1960s, followed by a rapid
deterioration that stretches from the late 1960s to the mid-1980s. TFP
declined by 4.36 percent on average per year in 1970–1980 (see Table 4.2).
TFP started to recover after the mid-1980s and continuing through 2005,
the last year for which data were available. During this recovery period,
4 The countries include Angola, Benin, Burkina Faso, Cameroon, Chad, Cote d’Ivoire, Ethiopia, Gabon, Gambia, Ghana, Guinea, Guinea Bissau, Kenya, Lesotho, Madagascar, Malawi, Mali, Mauritania, Mozambique, Nigeria, Senegal, Sierra Leone, South Africa, Sudan, Swaziland, Tanzania, Togo, Zambia, and Zimbabwe.5 The nine largest agricultural economies include Nigeria, Egypt, Morocco, Algeria, Sudan, Kenya, South Africa, Ethiopia, and Tanzania. The six fastest-growing agricultural economies include Angola, Guinea, Nigeria, Ethiopia, Rwanda, and Mozambique.
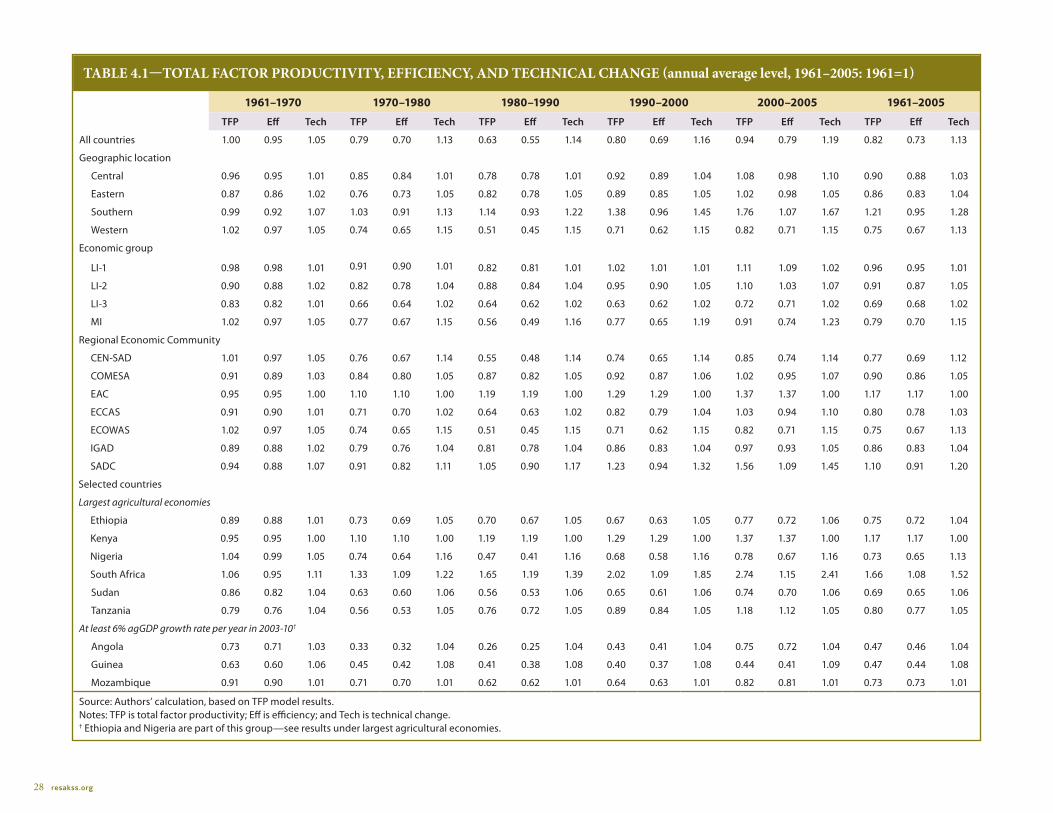
28 resakss.org
TABlE 4.1—ToTAl FACToR PRoDuCTiviTy, EFFiCiEnCy, AnD TEChniCAl ChAngE (annual average level, 1961–2005: 1961=1)
1961–1970 1970–1980 1980–1990 1990–2000 2000–2005 1961–2005
TFP Eff Tech TFP Eff Tech TFP Eff Tech TFP Eff Tech TFP Eff Tech TFP Eff Tech
All countries 1.00 0.95 1.05 0.79 0.70 1.13 0.63 0.55 1.14 0.80 0.69 1.16 0.94 0.79 1.19 0.82 0.73 1.13
Geographic location
Central 0.96 0.95 1.01 0.85 0.84 1.01 0.78 0.78 1.01 0.92 0.89 1.04 1.08 0.98 1.10 0.90 0.88 1.03
Eastern 0.87 0.86 1.02 0.76 0.73 1.05 0.82 0.78 1.05 0.89 0.85 1.05 1.02 0.98 1.05 0.86 0.83 1.04
Southern 0.99 0.92 1.07 1.03 0.91 1.13 1.14 0.93 1.22 1.38 0.96 1.45 1.76 1.07 1.67 1.21 0.95 1.28
Western 1.02 0.97 1.05 0.74 0.65 1.15 0.51 0.45 1.15 0.71 0.62 1.15 0.82 0.71 1.15 0.75 0.67 1.13
Economic group
LI-1 0.98 0.98 1.01 0.91 0.90 1.01 0.82 0.81 1.01 1.02 1.01 1.01 1.11 1.09 1.02 0.96 0.95 1.01
LI-2 0.90 0.88 1.02 0.82 0.78 1.04 0.88 0.84 1.04 0.95 0.90 1.05 1.10 1.03 1.07 0.91 0.87 1.05
LI-3 0.83 0.82 1.01 0.66 0.64 1.02 0.64 0.62 1.02 0.63 0.62 1.02 0.72 0.71 1.02 0.69 0.68 1.02
MI 1.02 0.97 1.05 0.77 0.67 1.15 0.56 0.49 1.16 0.77 0.65 1.19 0.91 0.74 1.23 0.79 0.70 1.15
Regional Economic Community
CEN-SAD 1.01 0.97 1.05 0.76 0.67 1.14 0.55 0.48 1.14 0.74 0.65 1.14 0.85 0.74 1.14 0.77 0.69 1.12
COMESA 0.91 0.89 1.03 0.84 0.80 1.05 0.87 0.82 1.05 0.92 0.87 1.06 1.02 0.95 1.07 0.90 0.86 1.05
EAC 0.95 0.95 1.00 1.10 1.10 1.00 1.19 1.19 1.00 1.29 1.29 1.00 1.37 1.37 1.00 1.17 1.17 1.00
ECCAS 0.91 0.90 1.01 0.71 0.70 1.02 0.64 0.63 1.02 0.82 0.79 1.04 1.03 0.94 1.10 0.80 0.78 1.03
ECOWAS 1.02 0.97 1.05 0.74 0.65 1.15 0.51 0.45 1.15 0.71 0.62 1.15 0.82 0.71 1.15 0.75 0.67 1.13
IGAD 0.89 0.88 1.02 0.79 0.76 1.04 0.81 0.78 1.04 0.86 0.83 1.04 0.97 0.93 1.05 0.86 0.83 1.04
SADC 0.94 0.88 1.07 0.91 0.82 1.11 1.05 0.90 1.17 1.23 0.94 1.32 1.56 1.09 1.45 1.10 0.91 1.20
Selected countries
Largest agricultural economies
Ethiopia 0.89 0.88 1.01 0.73 0.69 1.05 0.70 0.67 1.05 0.67 0.63 1.05 0.77 0.72 1.06 0.75 0.72 1.04
Kenya 0.95 0.95 1.00 1.10 1.10 1.00 1.19 1.19 1.00 1.29 1.29 1.00 1.37 1.37 1.00 1.17 1.17 1.00
Nigeria 1.04 0.99 1.05 0.74 0.64 1.16 0.47 0.41 1.16 0.68 0.58 1.16 0.78 0.67 1.16 0.73 0.65 1.13
South Africa 1.06 0.95 1.11 1.33 1.09 1.22 1.65 1.19 1.39 2.02 1.09 1.85 2.74 1.15 2.41 1.66 1.08 1.52
Sudan 0.86 0.82 1.04 0.63 0.60 1.06 0.56 0.53 1.06 0.65 0.61 1.06 0.74 0.70 1.06 0.69 0.65 1.06
Tanzania 0.79 0.76 1.04 0.56 0.53 1.05 0.76 0.72 1.05 0.89 0.84 1.05 1.18 1.12 1.05 0.80 0.77 1.05
At least 6% agGDP growth rate per year in 2003-10†
Angola 0.73 0.71 1.03 0.33 0.32 1.04 0.26 0.25 1.04 0.43 0.41 1.04 0.75 0.72 1.04 0.47 0.46 1.04
Guinea 0.63 0.60 1.06 0.45 0.42 1.08 0.41 0.38 1.08 0.40 0.37 1.08 0.44 0.41 1.09 0.47 0.44 1.08
Mozambique 0.91 0.90 1.01 0.71 0.70 1.01 0.62 0.62 1.01 0.64 0.63 1.01 0.82 0.81 1.01 0.73 0.73 1.01
Source: Authors’ calculation, based on TFP model results.Notes: TFP is total factor productivity; Eff is efficiency; and Tech is technical change. † Ethiopia and Nigeria are part of this group—see results under largest agricultural economies.

2011 ReSAKSS Annual Trends and Outlook Report 29
TABlE 4.2—PERCEnTAgE ChAngE in ToTAl FACToR PRoDuCTiviTy, EFFiCiEnCy, AnD TEChniCAl ChAngE (annual average %, 1961–2005)
1961–1970 1970–1980 1980–1990 1990–2000 2000–2005 1961–2005
TFP Eff Tech TFP Eff Tech TFP Eff Tech TFP Eff Tech TFP Eff Tech TFP Eff Tech
All countries -0.01 -1.02 1.02 -4.36 -4.40 0.04 0.58 0.48 0.11 2.59 2.37 0.25 2.20 1.70 0.52 -0.28 -0.59 0.32
Geographic location
Central -1.67 -1.75 0.08 -1.28 -1.28 0.00 0.29 0.29 0.00 2.34 1.65 0.69 3.02 2.91 0.10 0.20 0.02 0.18
Eastern -3.49 -3.88 0.42 1.41 1.41 0.00 0.42 0.42 0.00 1.28 1.27 0.01 2.45 2.38 0.07 0.40 0.34 0.06
Southern -0.28 -1.48 1.23 0.54 0.13 0.42 1.94 1.02 0.94 3.71 2.24 1.54 1.79 -1.53 3.46 1.39 0.27 1.15
Western 0.62 -0.51 1.13 -6.61 -6.62 0.00 0.51 0.51 0.00 2.94 2.89 0.05 2.06 1.98 0.08 -0.70 -0.93 0.23
Economic group
LI-1 -1.18 -1.25 0.09 -0.42 -0.42 0.00 2.00 2.00 0.00 0.77 0.74 0.04 3.68 3.40 0.27 0.29 0.27 0.02
LI-2 -2.59 -2.97 0.39 0.65 0.65 0.00 0.99 0.95 0.04 1.27 1.10 0.17 2.29 2.06 0.24 0.48 0.38 0.10
LI-3 -3.41 -3.65 0.25 0.17 0.14 0.03 -0.74 -0.74 0.00 0.74 0.74 0.00 4.87 4.76 0.10 -0.45 -0.48 0.03
MI 0.47 -0.67 1.15 -5.62 -5.68 0.05 0.48 0.35 0.14 3.16 2.91 0.30 1.97 1.34 0.68 -0.44 -0.81 0.39
Regional Economic Community
CEN-SAD 0.36 -0.71 1.07 -5.62 -5.62 0.00 0.45 0.45 0.00 2.71 2.67 0.04 1.95 1.88 0.07 -0.58 -0.79 0.21
COMESA -2.44 -2.93 0.52 1.19 1.19 0.00 0.04 0.00 0.04 1.42 1.34 0.10 0.96 0.79 0.17 0.25 0.15 0.10
EAC -0.69 -0.69 0.00 3.15 3.15 0.00 1.12 1.12 0.00 0.27 0.27 0.00 0.20 0.15 0.05 0.95 0.95 0.00
ECCAS -3.23 -3.35 0.13 -2.31 -2.31 0.00 0.58 0.58 0.00 3.37 2.79 0.59 2.85 2.77 0.09 0.17 0.02 0.15
ECOWAS 0.62 -0.51 1.13 -6.61 -6.62 0.00 0.51 0.51 0.00 2.94 2.89 0.05 2.06 1.98 0.08 -0.70 -0.93 0.23
IGAD -2.67 -3.07 0.43 1.06 1.06 0.00 -0.30 -0.30 0.00 1.43 1.42 0.01 1.61 1.52 0.09 0.18 0.12 0.07
SADC -1.86 -2.84 1.02 1.03 0.73 0.30 2.10 1.47 0.66 2.68 1.76 1.02 2.84 0.73 2.24 1.25 0.49 0.80
Selected countries
Largest agricultural economies
Ethiopia -2.65 -2.98 0.33 -0.97 -0.97 0.00 -1.51 -1.51 0.00 0.87 0.83 0.04 2.09 1.83 0.26 -0.54 -0.67 0.13
Kenya -0.69 -0.69 0.00 3.15 3.15 0.00 1.12 1.12 0.00 0.27 0.27 0.00 0.20 0.15 0.05 0.95 0.95 0.00
Nigeria 0.97 -0.22 1.20 -7.47 -7.47 0.00 0.26 0.26 0.00 3.09 3.09 0.00 1.88 1.88 0.00 -0.92 -1.15 0.23
South Africa 1.82 -0.04 1.86 2.91 2.07 0.83 2.08 0.46 1.61 3.74 1.26 2.44 2.78 -3.60 6.63 2.39 0.39 2.00
Sudan -4.43 -5.12 0.73 0.03 0.03 0.00 -1.27 -1.27 0.00 3.12 3.12 0.00 2.20 2.20 0.00 -0.41 -0.45 0.05
Tanzania -7.60 -7.93 0.36 2.28 2.28 0.00 3.07 3.07 0.00 1.13 1.13 0.00 5.82 5.82 0.00 1.16 1.14 0.02
At least 6% agGDP growth rate per year in 2003-10†
Angola -9.89 -10.18 0.33 -5.73 -5.73 0.00 0.19 0.19 0.00 8.72 8.72 0.00 2.46 2.46 0.00 -0.30 -0.32 0.02
Guinea -7.30 -7.85 0.60 -1.16 -1.16 0.00 -1.73 -1.73 0.00 0.42 0.33 0.09 1.50 1.49 0.01 -1.05 -1.10 0.05
Mozambique -1.68 -1.75 0.06 -3.98 -3.98 0.00 -0.36 -0.36 0.00 4.63 4.63 0.00 7.78 7.78 0.00 -0.55 -0.55 0.00
Source: Authors’ calculation, based on TFP model results.Notes: TFP is total factor productivity; Eff is efficiency; and Tech is technical change. † Ethiopia and Nigeria are part of this group—see results under largest agricultural economies.
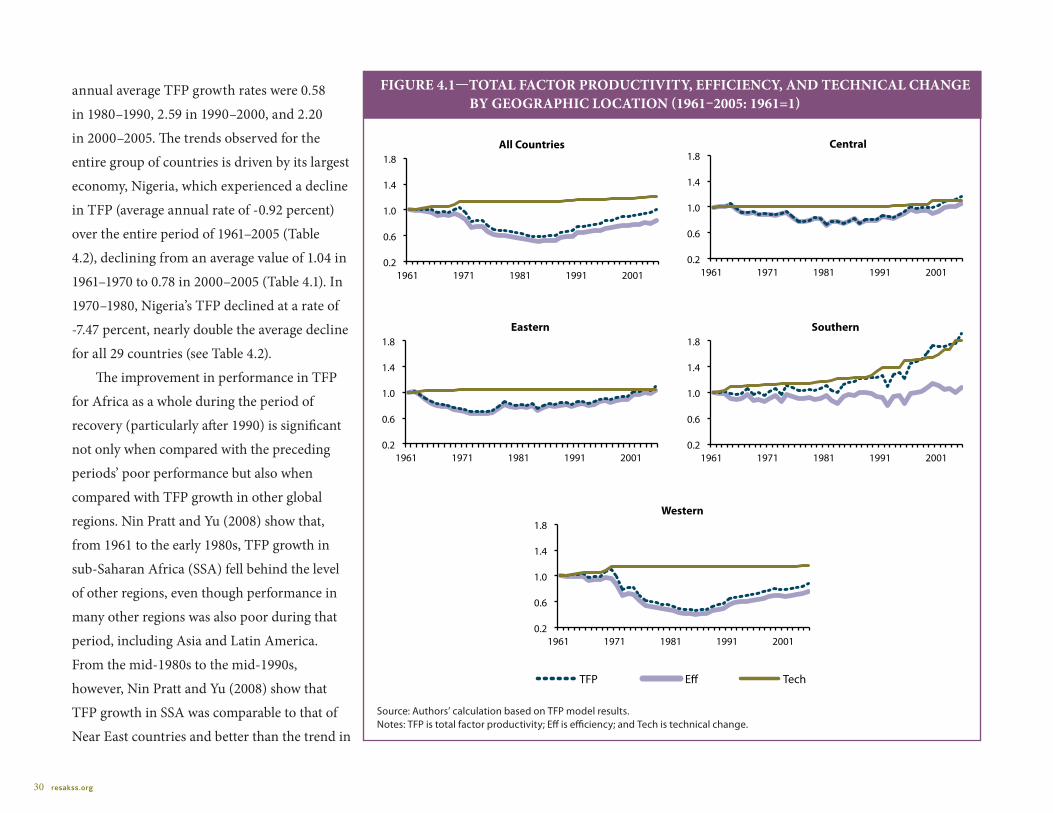
30 resakss.org
annual average TFP growth rates were 0.58
in 1980–1990, 2.59 in 1990–2000, and 2.20
in 2000–2005. The trends observed for the
entire group of countries is driven by its largest
economy, Nigeria, which experienced a decline
in TFP (average annual rate of -0.92 percent)
over the entire period of 1961–2005 (Table
4.2), declining from an average value of 1.04 in
1961–1970 to 0.78 in 2000–2005 (Table 4.1). In
1970–1980, Nigeria’s TFP declined at a rate of
-7.47 percent, nearly double the average decline
for all 29 countries (see Table 4.2).
The improvement in performance in TFP
for Africa as a whole during the period of
recovery (particularly after 1990) is significant
not only when compared with the preceding
periods’ poor performance but also when
compared with TFP growth in other global
regions. Nin Pratt and Yu (2008) show that,
from 1961 to the early 1980s, TFP growth in
sub-Saharan Africa (SSA) fell behind the level
of other regions, even though performance in
many other regions was also poor during that
period, including Asia and Latin America.
From the mid-1980s to the mid-1990s,
however, Nin Pratt and Yu (2008) show that
TFP growth in SSA was comparable to that of
Near East countries and better than the trend in
Source: Authors’ calculation based on TFP model results.Notes: TFP is total factor productivity; Eff is efficiency; and Tech is technical change.
FiguRE 4.1—ToTAl FACToR PRoDuCTiviTy, EFFiCiEnCy, AnD TEChniCAl ChAngE By gEogRAPhiC loCATion (1961–2005: 1961=1)
1961 1971 1981 1991 2001
TFP E� Tech
0.2
0.6
1.0
1.4
1.8 Southern
1961 1971 1981 1991 2001
TFP E� Tech
0.2
0.6
1.0
1.4
1.8 All Countries
1961 1971 1981 1991 2001
TFP E� Tech
0.2
0.6
1.0
1.4
1.8 Eastern
1961 1971 1981 1991 2001
TFP E� Tech
0.2
0.6
1.0
1.4
1.8 Southern
1961 1971 1981 1991 2001
TFP E� Tech
0.2
0.6
1.0
1.4
1.8 Western
1961 1971 1981 1991 2001
TFP E� Tech
0.2
0.6
1.0
1.4
1.8 Central
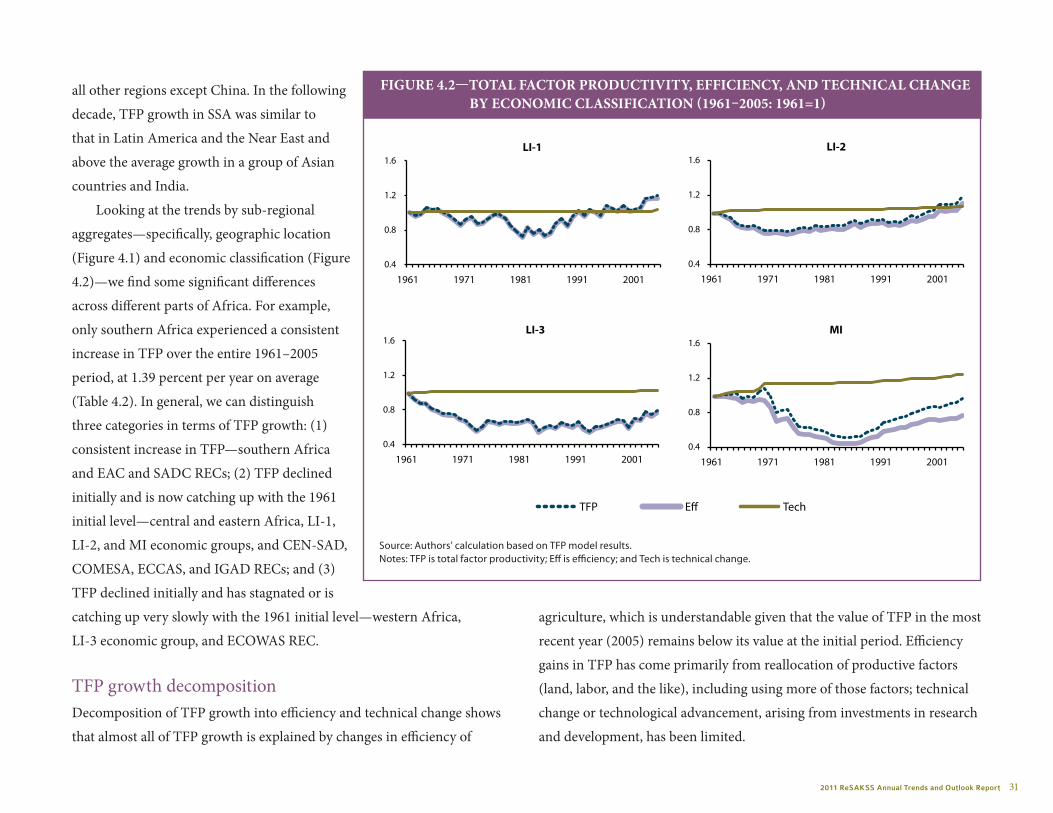
2011 ReSAKSS Annual Trends and Outlook Report 31
all other regions except China. In the following
decade, TFP growth in SSA was similar to
that in Latin America and the Near East and
above the average growth in a group of Asian
countries and India.
Looking at the trends by sub-regional
aggregates—specifically, geographic location
(Figure 4.1) and economic classification (Figure
4.2)—we find some significant differences
across different parts of Africa. For example,
only southern Africa experienced a consistent
increase in TFP over the entire 1961–2005
period, at 1.39 percent per year on average
(Table 4.2). In general, we can distinguish
three categories in terms of TFP growth: (1)
consistent increase in TFP—southern Africa
and EAC and SADC RECs; (2) TFP declined
initially and is now catching up with the 1961
initial level—central and eastern Africa, LI-1,
LI-2, and MI economic groups, and CEN-SAD,
COMESA, ECCAS, and IGAD RECs; and (3)
TFP declined initially and has stagnated or is
catching up very slowly with the 1961 initial level—western Africa,
LI-3 economic group, and ECOWAS REC.
TFP growth decompositionDecomposition of TFP growth into efficiency and technical change shows
that almost all of TFP growth is explained by changes in efficiency of
agriculture, which is understandable given that the value of TFP in the most
recent year (2005) remains below its value at the initial period. Efficiency
gains in TFP has come primarily from reallocation of productive factors
(land, labor, and the like), including using more of those factors; technical
change or technological advancement, arising from investments in research
and development, has been limited.
Source: Authors’ calculation based on TFP model results.Notes: TFP is total factor productivity; Eff is efficiency; and Tech is technical change.
FiguRE 4.2—ToTAl FACToR PRoDuCTiviTy, EFFiCiEnCy, AnD TEChniCAl ChAngE By EConomiC ClASSiFiCATion (1961–2005: 1961=1)
1961 1971 1981 1991 2001
TFP E� Tech
0.2
0.6
1.0
1.4
1.8 Southern
1961 1971 1981 1991 2001
TFP E� Tech
0.4
0.8
1.2
1.6 LI-1
1961 1971 1981 1991 2001
TFP E� Tech
0.4
0.8
1.2
1.6 LI-3
1961 1971 1981 1991 2001
TFP E� Tech
0.4
0.8
1.2
1.6 MI
1961 1971 1981 1991 2001
TFP E� Tech
0.4
0.8
1.2
1.6 LI-2

32 resakss.org
FiguRE 4.3—ToTAl FACToR PRoDuCTiviTy, EFFiCiEnCy, AnD TEChniCAl ChAngE By REgionAl EConomiC CommuniTy (1961–2005: 1961=1)
1961 1971 1981 1991 2001
TFP E� Tech
0.3
0.6
0.9
1.2
1.5
1.8
CEN-SAD
1961 1971 1981 1991 2001
TFP E� Tech
0.3
0.6
0.9
1.2
1.5
1.8
EAC
1961 1971 1981 1991 2001
TFP E� Tech
0.3
0.6
0.9
1.2
1.5
1.8
ECCAS
1961 1971 1981 1991 2001
TFP E� Tech
0.3
0.6
0.9
1.2
1.5
1.8
ECOWAS
Source: Authors’ calculation based on TFP model results.Notes: TFP is total factor productivity; Eff is efficiency; and Tech is technical change.
1961 1971 1981 1991 2001
TFP E� Tech
0.2
0.6
1.0
1.4
1.8 Southern
1961 1971 1981 1991 2001
TFP E� Tech
0.3
0.6
0.9
1.2
1.5
1.8
IGAD
1961 1971 1981 1991 2001
TFP E� Tech
0.3
0.6
0.9
1.2
1.5
1.8
SADC
1961 1971 1981 1991 2001
TFP E� Tech
0.3
0.6
0.9
1.2
1.5
1.8
COMESA
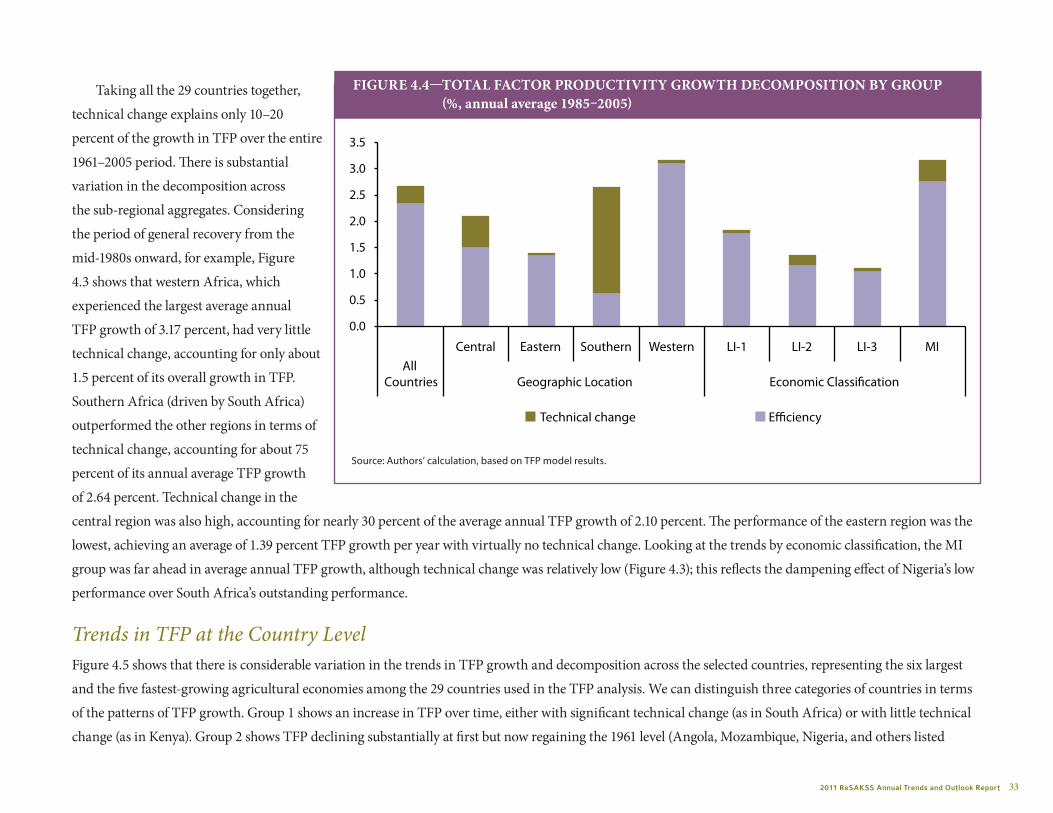
2011 ReSAKSS Annual Trends and Outlook Report 33
Taking all the 29 countries together,
technical change explains only 10–20
percent of the growth in TFP over the entire
1961–2005 period. There is substantial
variation in the decomposition across
the sub-regional aggregates. Considering
the period of general recovery from the
mid-1980s onward, for example, Figure
4.3 shows that western Africa, which
experienced the largest average annual
TFP growth of 3.17 percent, had very little
technical change, accounting for only about
1.5 percent of its overall growth in TFP.
Southern Africa (driven by South Africa)
outperformed the other regions in terms of
technical change, accounting for about 75
percent of its annual average TFP growth
of 2.64 percent. Technical change in the
central region was also high, accounting for nearly 30 percent of the average annual TFP growth of 2.10 percent. The performance of the eastern region was the
lowest, achieving an average of 1.39 percent TFP growth per year with virtually no technical change. Looking at the trends by economic classification, the MI
group was far ahead in average annual TFP growth, although technical change was relatively low (Figure 4.3); this reflects the dampening effect of Nigeria’s low
performance over South Africa’s outstanding performance.
Trends in TFP at the Country LevelFigure 4.5 shows that there is considerable variation in the trends in TFP growth and decomposition across the selected countries, representing the six largest
and the five fastest-growing agricultural economies among the 29 countries used in the TFP analysis. We can distinguish three categories of countries in terms
of the patterns of TFP growth. Group 1 shows an increase in TFP over time, either with significant technical change (as in South Africa) or with little technical
change (as in Kenya). Group 2 shows TFP declining substantially at first but now regaining the 1961 level (Angola, Mozambique, Nigeria, and others listed
0.0
0.5
1.0
1.5
2.0
2.5
3.0
3.5
Central Eastern Southern Western LI-1 LI-2 LI-3 MI All
Countries Geographic Location Economic Classi cation
Technical change E�ciency
Source: Authors’ calculation, based on TFP model results.
FiguRE 4.4—ToTAl FACToR PRoDuCTiviTy gRowTh DEComPoSiTion By gRouP (%, annual average 1985–2005)
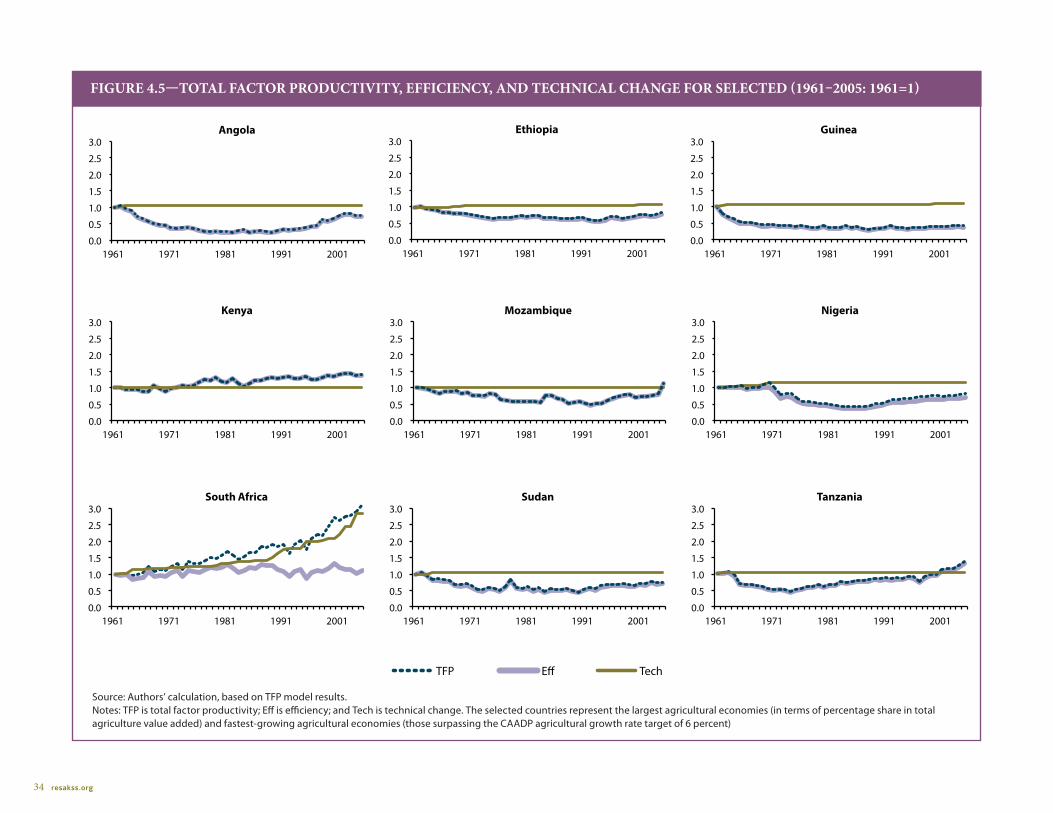
34 resakss.org
0.0
0.5
1.0
1.5
2.0
2.5
3.0
1961 1971 1981 1991 2001
TFP E� Tech
Sudan
FiguRE 4.5—ToTAl FACToR PRoDuCTiviTy, EFFiCiEnCy, AnD TEChniCAl ChAngE FoR SElECTED (1961–2005: 1961=1)
0.0
0.5
1.0
1.5
2.0
2.5
3.0
1961 1971 1981 1991 2001
Angola
TFP E� Tech
0.0
0.5
1.0
1.5
2.0
2.5
3.0
1961 1971 1981 1991 2001
TFP E� Tech
Guinea
0.0
0.5
1.0
1.5
2.0
2.5
3.0
1961 1971 1981 1991 2001
TFP E� Tech
Kenya
0.0
0.5
1.0
1.5
2.0
2.5
3.0
1961 1971 1981 1991 2001
TFP E� Tech
Mozambique
Source: Authors’ calculation, based on TFP model results.Notes: TFP is total factor productivity; Eff is efficiency; and Tech is technical change. The selected countries represent the largest agricultural economies (in terms of percentage share in total agriculture value added) and fastest-growing agricultural economies (those surpassing the CAADP agricultural growth rate target of 6 percent)
1961 1971 1981 1991 2001
TFP E� Tech
0.2
0.6
1.0
1.4
1.8 Southern
0.0
0.5
1.0
1.5
2.0
2.5
3.0
1961 1971 1981 1991 2001
TFP E� Tech
Nigeria
0.0
0.5
1.0
1.5
2.0
2.5
3.0
1961 1971 1981 1991 2001
TFP E� Tech
Ethiopia
0.0
0.5
1.0
1.5
2.0
2.5
3.0
1961 1971 1981 1991 2001
TFP E� Tech
South Africa
0.0
0.5
1.0
1.5
2.0
2.5
3.0
1961 1971 1981 1991 2001
TFP E� Tech
Tanzania
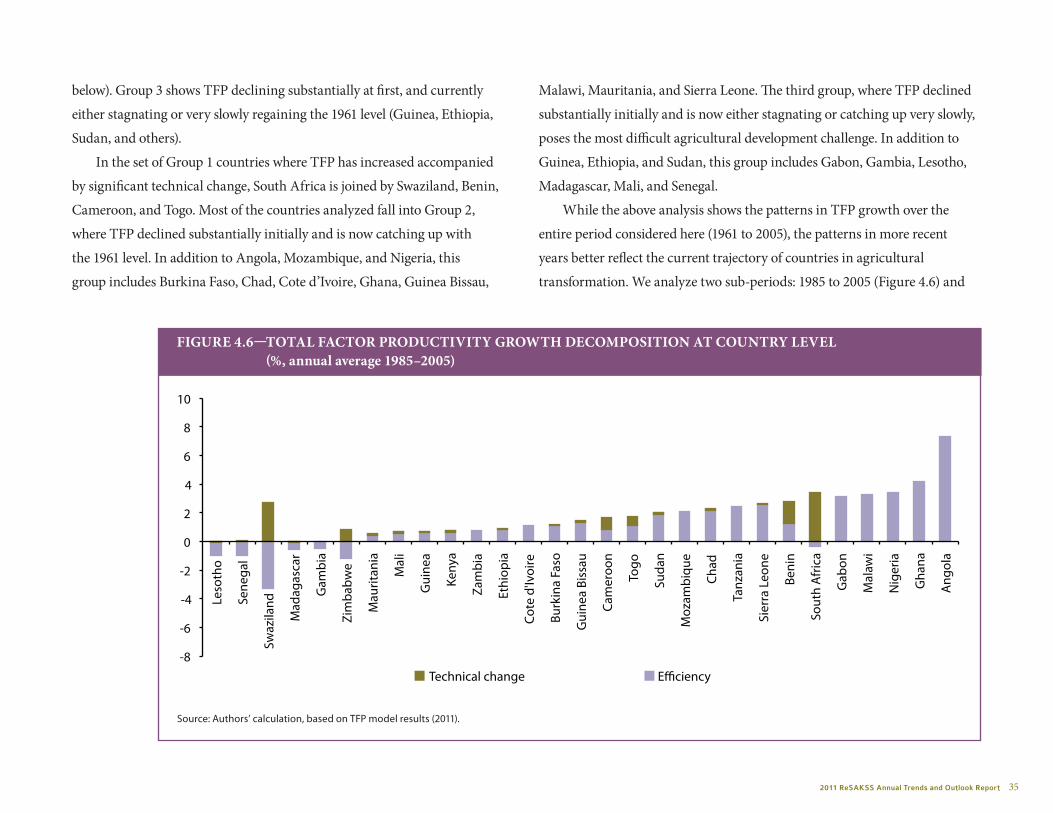
2011 ReSAKSS Annual Trends and Outlook Report 35
below). Group 3 shows TFP declining substantially at first, and currently
either stagnating or very slowly regaining the 1961 level (Guinea, Ethiopia,
Sudan, and others).
In the set of Group 1 countries where TFP has increased accompanied
by significant technical change, South Africa is joined by Swaziland, Benin,
Cameroon, and Togo. Most of the countries analyzed fall into Group 2,
where TFP declined substantially initially and is now catching up with
the 1961 level. In addition to Angola, Mozambique, and Nigeria, this
group includes Burkina Faso, Chad, Cote d’Ivoire, Ghana, Guinea Bissau,
Malawi, Mauritania, and Sierra Leone. The third group, where TFP declined
substantially initially and is now either stagnating or catching up very slowly,
poses the most difficult agricultural development challenge. In addition to
Guinea, Ethiopia, and Sudan, this group includes Gabon, Gambia, Lesotho,
Madagascar, Mali, and Senegal.
While the above analysis shows the patterns in TFP growth over the
entire period considered here (1961 to 2005), the patterns in more recent
years better reflect the current trajectory of countries in agricultural
transformation. We analyze two sub-periods: 1985 to 2005 (Figure 4.6) and
-8
-6
-4
-2
0
2
4
6
8
10
Leso
tho
Sene
gal
Swaz
iland
Mad
agas
car
Gam
bia
Zim
babw
e
Mau
ritan
ia
Mal
i
Gui
nea
Keny
a
Zam
bia
Ethi
opia
Cote
d'Iv
oire
Burk
ina
Faso
Gui
nea
Biss
au
Cam
eroo
n
Togo
Suda
n
Moz
ambi
que
Chad
Tanz
ania
Sier
ra L
eone
Beni
n
Sout
h A
fric
a
Gab
on
Mal
awi
Nig
eria
Gha
na
Ang
ola
Technical change E�ciency
Source: Authors’ calculation, based on TFP model results (2011).
FiguRE 4.6—ToTAl FACToR PRoDuCTiviTy gRowTh DEComPoSiTion AT CounTRy lEvEl (%, annual average 1985–2005)
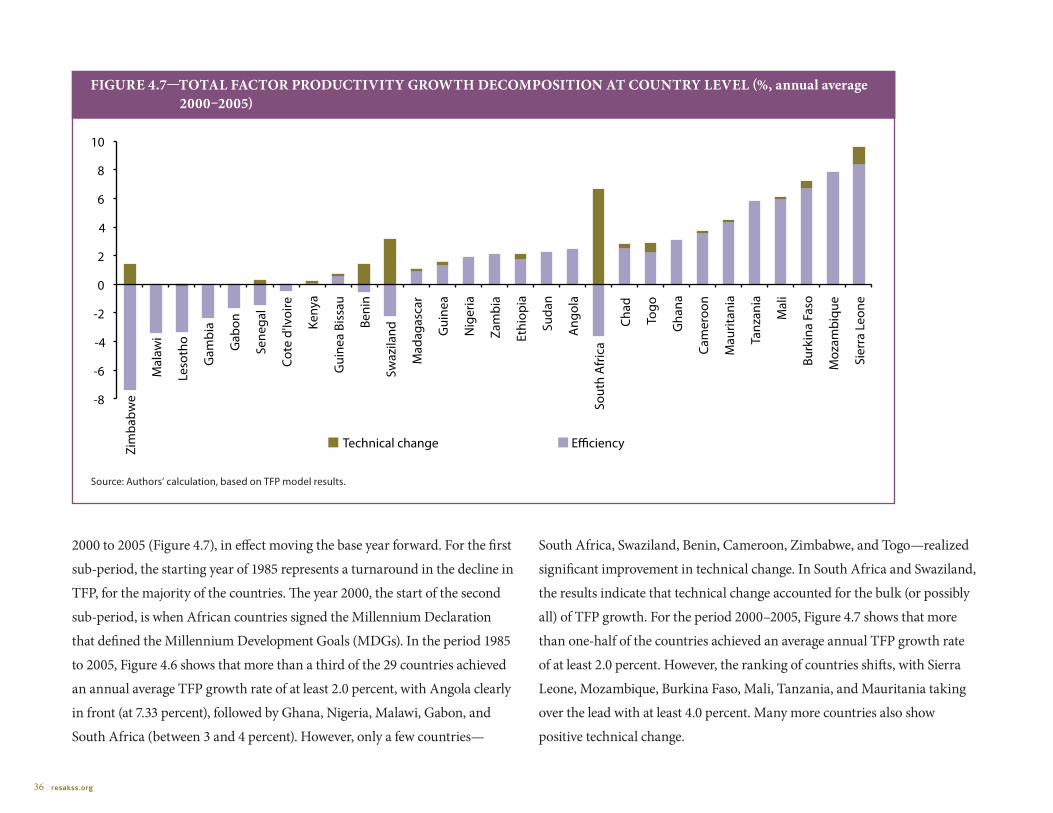
36 resakss.org
2000 to 2005 (Figure 4.7), in effect moving the base year forward. For the first
sub-period, the starting year of 1985 represents a turnaround in the decline in
TFP, for the majority of the countries. The year 2000, the start of the second
sub-period, is when African countries signed the Millennium Declaration
that defined the Millennium Development Goals (MDGs). In the period 1985
to 2005, Figure 4.6 shows that more than a third of the 29 countries achieved
an annual average TFP growth rate of at least 2.0 percent, with Angola clearly
in front (at 7.33 percent), followed by Ghana, Nigeria, Malawi, Gabon, and
South Africa (between 3 and 4 percent). However, only a few countries—
South Africa, Swaziland, Benin, Cameroon, Zimbabwe, and Togo—realized
significant improvement in technical change. In South Africa and Swaziland,
the results indicate that technical change accounted for the bulk (or possibly
all) of TFP growth. For the period 2000–2005, Figure 4.7 shows that more
than one-half of the countries achieved an average annual TFP growth rate
of at least 2.0 percent. However, the ranking of countries shifts, with Sierra
Leone, Mozambique, Burkina Faso, Mali, Tanzania, and Mauritania taking
over the lead with at least 4.0 percent. Many more countries also show
positive technical change.
Technical change E�ciency
-8
-6
-4
-2
0
2
4
6
8
10 Zi
mba
bwe
Mal
awi
Leso
tho
Gam
bia
Gab
on
Sene
gal
Cote
d'Iv
oire
Keny
a
Gui
nea
Biss
au
Beni
n
Swaz
iland
Mad
agas
car
Gui
nea
Nig
eria
Zam
bia
Ethi
opia
Suda
n
Ang
ola
Sout
h A
fric
a
Chad
Togo
Gha
na
Cam
eroo
n
Mau
ritan
ia
Tanz
ania
Mal
i
Burk
ina
Faso
Moz
ambi
que
Sier
ra L
eone
Source: Authors’ calculation, based on TFP model results.
FiguRE 4.7—ToTAl FACToR PRoDuCTiviTy gRowTh DEComPoSiTion AT CounTRy lEvEl (%, annual average 2000–2005)
2011 ReSAKSS Annual Trends and Outlook Report 37
Summary of FindingsMany parts of the continent showed a slight improvement in TFP growth in
the early 1960s, followed by a rapid deterioration that stretched from the mid-
1960s to the mid-1980s, and then a rapid recovery and improved performance
extending through 2005 (the last year for which data are available). This
pattern suggests a mere catching up with the efficiency levels achieved in
the early 1960s, as almost all of the observed TFP growth is explained by
improvement in efficiency of factor use rather than by technical change.
While Nigeria dominates the trends at the Africa-wide level because of its
sheer size, observed TFP growth trends vary across different sub-regions
and countries. In a handful of countries, including South Africa, Swaziland,
Benin, Cameroon, and Togo, we observe an overall increase in TFP over
time, with significant technical change. There are also a few countries where
TFP declined substantially initially and has since stagnated at low levels or
is turning around at a very slow rate. These countries, particularly Gabon,
Gambia, Lesotho, and Senegal, pose the most difficult challenge for raising
and maintaining high agricultural productivity, because TFP has continued
to decline even in the period 2000–2005, when most other countries seem to
be recovering.

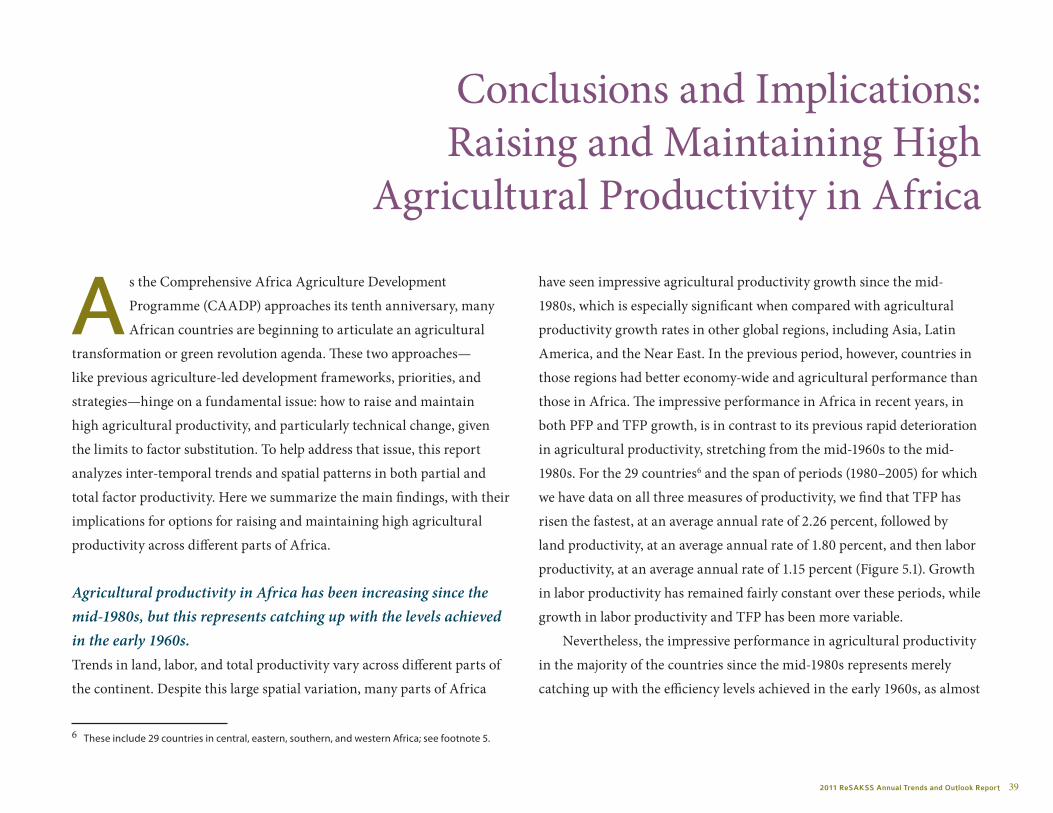
2011 ReSAKSS Annual Trends and Outlook Report 39
Conclusions and Implications: Raising and Maintaining High
Agricultural Productivity in Africa
As the Comprehensive Africa Agriculture Development
Programme (CAADP) approaches its tenth anniversary, many
African countries are beginning to articulate an agricultural
transformation or green revolution agenda. These two approaches—
like previous agriculture-led development frameworks, priorities, and
strategies—hinge on a fundamental issue: how to raise and maintain
high agricultural productivity, and particularly technical change, given
the limits to factor substitution. To help address that issue, this report
analyzes inter-temporal trends and spatial patterns in both partial and
total factor productivity. Here we summarize the main findings, with their
implications for options for raising and maintaining high agricultural
productivity across different parts of Africa.
Agricultural productivity in Africa has been increasing since the mid-1980s, but this represents catching up with the levels achieved in the early 1960s.Trends in land, labor, and total productivity vary across different parts of
the continent. Despite this large spatial variation, many parts of Africa
have seen impressive agricultural productivity growth since the mid-
1980s, which is especially significant when compared with agricultural
productivity growth rates in other global regions, including Asia, Latin
America, and the Near East. In the previous period, however, countries in
those regions had better economy-wide and agricultural performance than
those in Africa. The impressive performance in Africa in recent years, in
both PFP and TFP growth, is in contrast to its previous rapid deterioration
in agricultural productivity, stretching from the mid-1960s to the mid-
1980s. For the 29 countries6 and the span of periods (1980–2005) for which
we have data on all three measures of productivity, we find that TFP has
risen the fastest, at an average annual rate of 2.26 percent, followed by
land productivity, at an average annual rate of 1.80 percent, and then labor
productivity, at an average annual rate of 1.15 percent (Figure 5.1). Growth
in labor productivity has remained fairly constant over these periods, while
growth in labor productivity and TFP has been more variable.
Nevertheless, the impressive performance in agricultural productivity
in the majority of the countries since the mid-1980s represents merely
catching up with the efficiency levels achieved in the early 1960s, as almost
6 These include 29 countries in central, eastern, southern, and western Africa; see footnote 5.

40 resakss.org
all of the observed TFP growth is explained by improvement in efficiency
of factor use rather than by technical change. Only in a handful of
countries, including South Africa, Swaziland, Benin, Cameroon, and Togo,
was there an overall increase in TFP over time, accompanied by significant
technical change. With the majority of the population living in rural
areas and depending on agriculture for their livelihoods, and with typical
household landholdings of only 1–3 hectares and household sizes of 5–8
family members, it is easy to understand why rural poverty is so prevalent
and persistent—and why raising productivity in a sustainable manner
remains a fundamental development goal for Africa.
Focusing on labor productivity, for example, sustaining the recent
rate of agricultural growth faces the challenge of population growth and
slowdown in land availability; in many countries, recent labor productivity
gains have depended on their ability to incorporate more land into
agricultural production. More rapid increases in labor productivity are
essential to compensate for growth in rural population and to improve
rural income and food and nutrition security—and this will require
accelerating the expansion of Africa’s technical frontier through a
combination of policy improvements and significant investments in
agricultural R&D, together with complementary investments in areas
such as irrigation, market infrastructure,
and institutions (Mogues and Benin
2012; Diao et al. 2012; Diao, Headey, and
Johnson 2008; von Braun et al. 2008).
Agricultural investments and R&D infrastructure and capacities Africa-wide have eroded, driven by poor to moderate performance of the largest agricultural economies in the continent.Raising productivity requires not only
appropriate technologies, but also
sound policies to encourage farmers
to adopt them and improve farming
practices. However, agricultural research
infrastructure and capacities in Africa
have been eroded through years of
neglect, primarily because of lack of
Land TFP
0.0
0.5
1.0
1.5
2.0
2.5
3.0
1980-1990 1990-2000 2000-2005 1980-2005
Labor
Source: Authors’ calculation, based on World Bank 2012 and TFP model results.
FiguRE 5.1—lAnD, lABoR, AnD ToTAl FACToR PRoDuCTiviTy gRowTh in AFRiCA (%, annual average 1980–2005)

2011 ReSAKSS Annual Trends and Outlook Report 41
public funding for agricultural R&D (Beintema and Stads
2006, 2011). Table 5.1 shows that both growth in spending
on agricultural R&D and number of researchers have slowed
over time and only recently picked up, consistent with the
trends in agricultural productivity growth summarized
above. Thus, there is a desperate need to strengthen
agricultural R&D systems in Africa, while ensuring that
they become more cost-effective. Considering agricultural
spending and investments in general, the 2003 Maputo
Declaration set a target for agricultural financing by governments at 10
percent of total national expenditures. For Africa as a whole, the sector’s
percentage of total expenditures has barely surpassed 6 percent on average
per year since 1995 (see Figure 5.2 and annex Table C.2)—well below the
CAADP target of 10 percent.
At the national level, while several countries have increased the share
of total spending allocated to the agriculture sector, when we compare
performance in the pre-CAADP (1995–2003) and post-CAADP (2003–
2010) periods, only a handful of countries stand out as having achieved the
target (Figure 5.2). These countries are Burkina Faso, Ethiopia, Mali, Niger,
and Senegal. With the exception of Ethiopia, none of countries representing
the largest ten agricultural economies in Africa have achieved this target.
(The largest agricultural economies are Nigeria, Egypt, Morocco, Algeria,
Sudan, Kenya, South Africa, Ethiopia, Tanzania, and Cote d’Ivoire—see
Figure 2.1.)7 Most of these top ten countries spent less than 5 percent of their
total expenditure budgets on agriculture, resulting in the low performance
seen for Africa as a whole.
An important follow-on question is: How much of the total
agricultural expenditure is allocated to agricultural R&D? Here, too,
NEPAD has set a national agricultural R&D investment target of at least
1 percent of agricultural GDP. Most countries have spent far less than
this level. In 2008, for example, the amount spent on agricultural R&D
as a percentage of agricultural GDP is estimated at about 0.6 percent,
with only 8 countries (out of 31 countries studied) meeting the 1 percent
target (see Figure 5.3). With the exception of Kenya and South Africa, the
big agricultural economies in SSA covered in this study (Nigeria, Sudan,
Ethiopia, Tanzania and Cote d’Ivoire) spent less than 0.5 percent. The
other high performers in spending on agricultural R&D (as a percentage
of agricultural GDP) are Botswana, Burundi, Mauritania, Mauritius,
Namibia, and Uganda (Figure 5.3). Together, however, these countries
account for only 3.2 percent of Africa’s total agricultural GDP, so their
high performance has little impact on the performance for Africa or SSA
as a whole. It cannot be overemphasized that there is desperate need to
significantly increase African investments in agriculture, and particularly
in agricultural R&D.
TABlE 5.1—AnnuAl AvERAgE gRowTh RATES in PuBliC AgRiCulTuRAl R&D ExPEnDiTuRE (2005 constant prices) AnD numBER oF RESEARChERS (full-time equivalents) in SSA
years expenditure researchers
1971-1981 1.7 5.4
1981-1991 0.6 3.8
1991-2001 1.0 1.3
2001-2008 2.4 2.8
Source: Beintema and Stads 2011.
7 These ten countries together account for about 73 percent of the total of Africa’s agriculture value added. Sudan includes South Sudan because the data are not disaggregated by two countries.
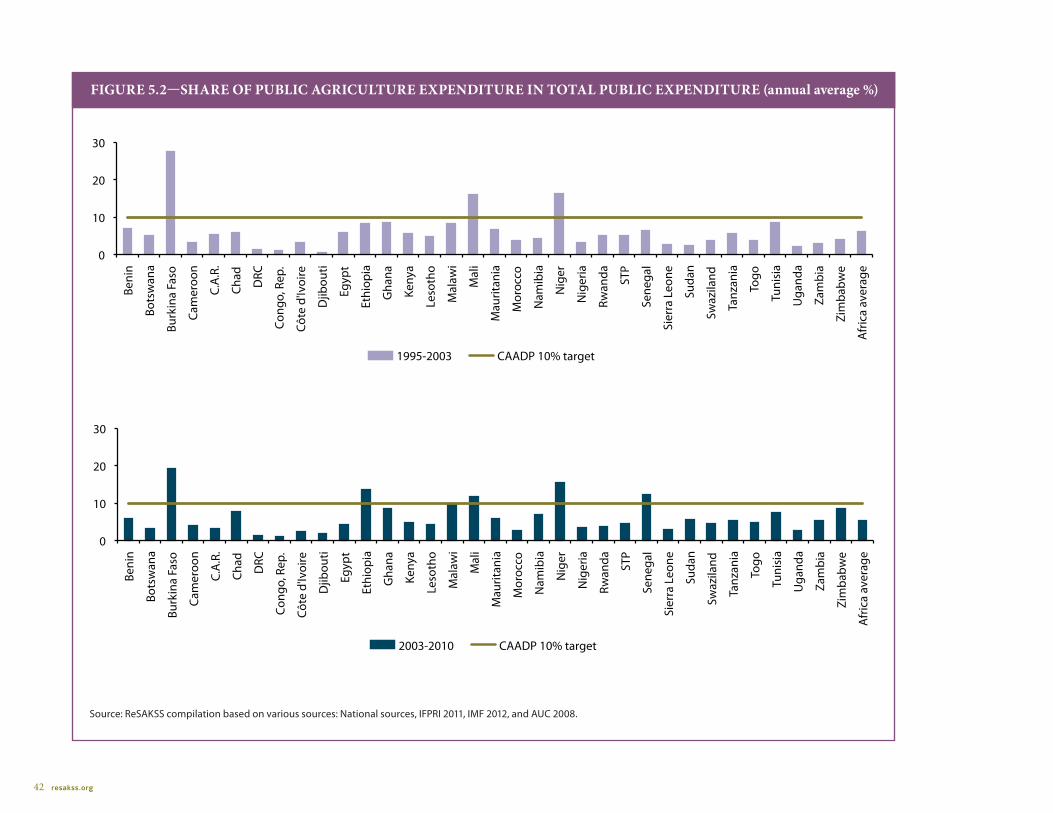
42 resakss.org
0
10
20
30
Beni
n
Bots
wan
a
Burk
ina
Faso
Cam
eroo
n
C.A
.R.
Chad
DRC
Cong
o, R
ep.
Côte
d'Iv
oire
Djib
outi
Egyp
t
Ethi
opia
Gha
na
Keny
a
Leso
tho
Mal
awi
Mal
i
Mau
ritan
ia
Mor
occo
Nam
ibia
Nig
er
Nig
eria
Rwan
da
STP
Sene
gal
Sier
ra L
eone
Suda
n
Swaz
iland
Tanz
ania
Togo
Tuni
sia
Uga
nda
Zam
bia
Zim
babw
e
Afr
ica
aver
age
2003-2010 CAADP 10% target
0
10
20
30 Be
nin
Bots
wan
a
Burk
ina
Faso
Cam
eroo
n
C.A
.R.
Chad
DRC
Cong
o, R
ep.
Côte
d'Iv
oire
Djib
outi
Egyp
t
Ethi
opia
Gha
na
Keny
a
Leso
tho
Mal
awi
Mal
i
Mau
ritan
ia
Mor
occo
Nam
ibia
Nig
er
Nig
eria
Rwan
da
STP
Sene
gal
Sier
ra L
eone
Suda
n
Swaz
iland
Tanz
ania
Togo
Tuni
sia
Uga
nda
Zam
bia
Zim
babw
e
Afr
ica
aver
age
1995-2003 CAADP 10% target
Source: ReSAKSS compilation based on various sources: National sources, IFPRI 2011, IMF 2012, and AUC 2008.
FiguRE 5.2—ShARE oF PuBliC AgRiCulTuRE ExPEnDiTuRE in ToTAl PuBliC ExPEnDiTuRE (annual average %)
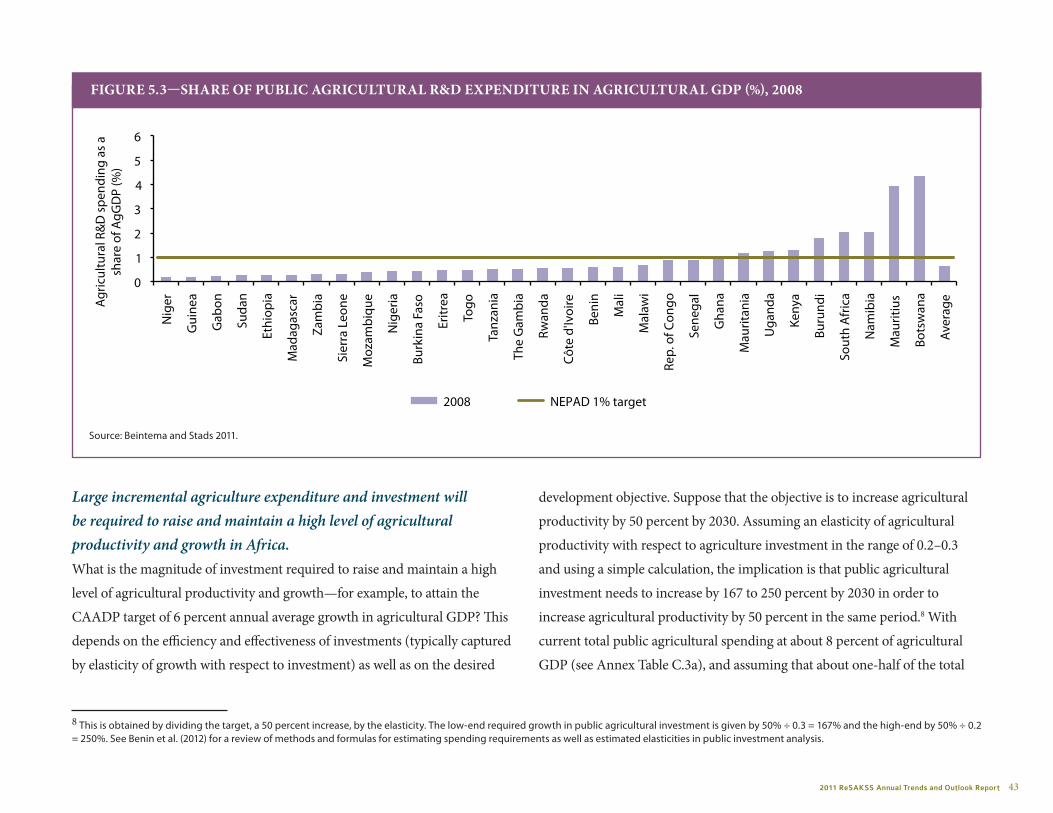
2011 ReSAKSS Annual Trends and Outlook Report 43
Large incremental agriculture expenditure and investment will be required to raise and maintain a high level of agricultural productivity and growth in Africa.What is the magnitude of investment required to raise and maintain a high
level of agricultural productivity and growth—for example, to attain the
CAADP target of 6 percent annual average growth in agricultural GDP? This
depends on the efficiency and effectiveness of investments (typically captured
by elasticity of growth with respect to investment) as well as on the desired
development objective. Suppose that the objective is to increase agricultural
productivity by 50 percent by 2030. Assuming an elasticity of agricultural
productivity with respect to agriculture investment in the range of 0.2–0.3
and using a simple calculation, the implication is that public agricultural
investment needs to increase by 167 to 250 percent by 2030 in order to
increase agricultural productivity by 50 percent in the same period.8 With
current total public agricultural spending at about 8 percent of agricultural
GDP (see Annex Table C.3a), and assuming that about one-half of the total
8 This is obtained by dividing the target, a 50 percent increase, by the elasticity. The low-end required growth in public agricultural investment is given by 50% ÷ 0.3 = 167% and the high-end by 50% ÷ 0.2 = 250%. See Benin et al. (2012) for a review of methods and formulas for estimating spending requirements as well as estimated elasticities in public investment analysis.
2008 NEPAD 1% target
0
1
2
3
4
5
6
Nig
er
Gui
nea
Gab
on
Suda
n
Ethi
opia
Mad
agas
car
Zam
bia
Sier
ra L
eone
Moz
ambi
que
Nig
eria
Burk
ina
Faso
Eritr
ea
Togo
Tanz
ania
The
Gam
bia
Rwan
da
Côte
d'Iv
oire
Beni
n
Mal
i
Mal
awi
Rep.
of C
ongo
Sene
gal
Gha
na
Mau
ritan
ia
Uga
nda
Keny
a
Buru
ndi
Sout
h A
fric
a
Nam
ibia
Mau
ritiu
s
Bots
wan
a
Aver
age Agr
icul
tura
l R&
D s
pend
ing
as a
sh
are
of A
gGD
P (%
)
Source: Beintema and Stads 2011.
FiguRE 5.3—ShARE oF PuBliC AgRiCulTuRAl R&D ExPEnDiTuRE in AgRiCulTuRAl gDP (%), 2008
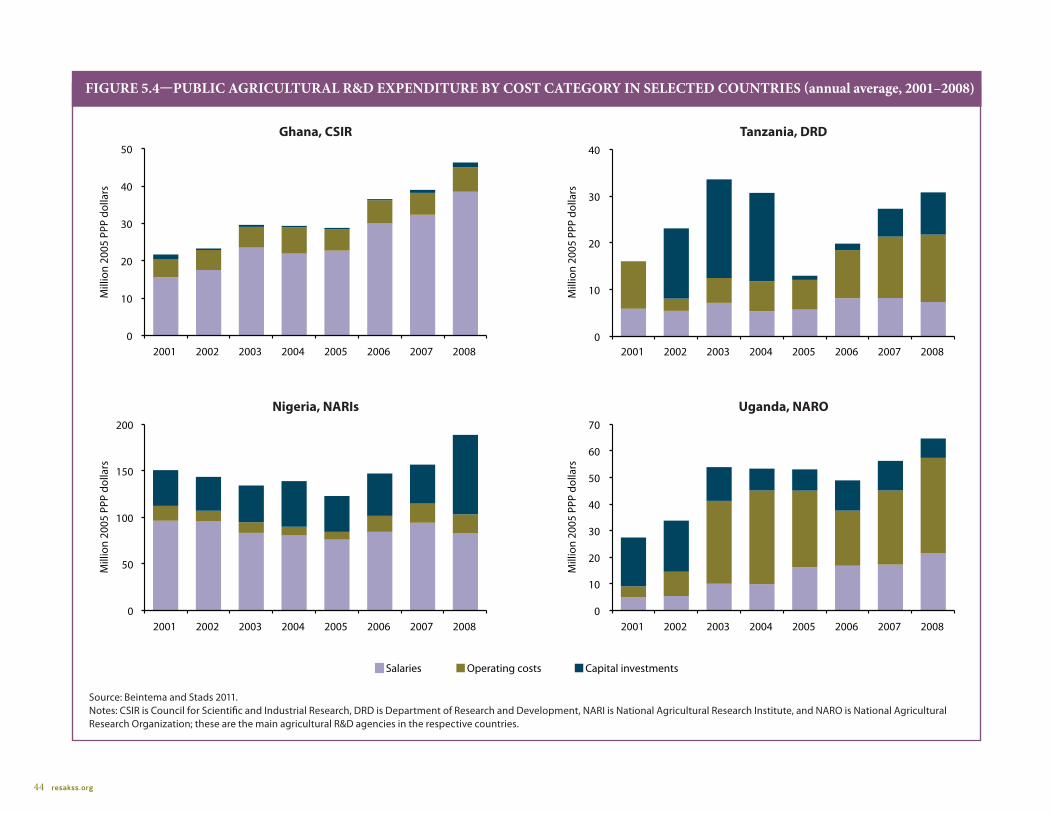
44 resakss.org
0
10
20
30
40
50
2001 2002 2003 2004 2005 2006 2007 2008
Salaries Operating costs Capital investments
Mill
ion
2005
PPP
dol
lars
Ghana, CSIR
Source: Beintema and Stads 2011.Notes: CSIR is Council for Scientific and Industrial Research, DRD is Department of Research and Development, NARI is National Agricultural Research Institute, and NARO is National Agricultural Research Organization; these are the main agricultural R&D agencies in the respective countries.
FiguRE 5.4—PuBliC AgRiCulTuRAl R&D ExPEnDiTuRE By CoST CATEgoRy in SElECTED CounTRiES (annual average, 2001–2008)
2001 2002 2003 2004 2005 2006 2007 2008
Salaries Operating costs Capital investments
Mill
ion
2005
PPP
dol
lars
Tanzania, DRD
0
10
20
30
40
2001 2002 2003 2004 2005 2006 2007 2008
Salaries Operating costs Capital investments
Mill
ion
2005
PPP
dol
lars
Nigeria, NARIs
0
50
100
150
200
2001 2002 2003 2004 2005 2006 2007 2008
Salaries Operating costs Capital investments
Mill
ion
2005
PPP
dol
lars
Uganda, NARO
0
10
20
30
40
50
60
70
0
10
20
30
40
50
2001 2002 2003 2004 2005 2006 2007 2008
Salaries Operating costs Capital investments
Mill
ion
2005
PPP
dol
lars
Ghana, CSIR
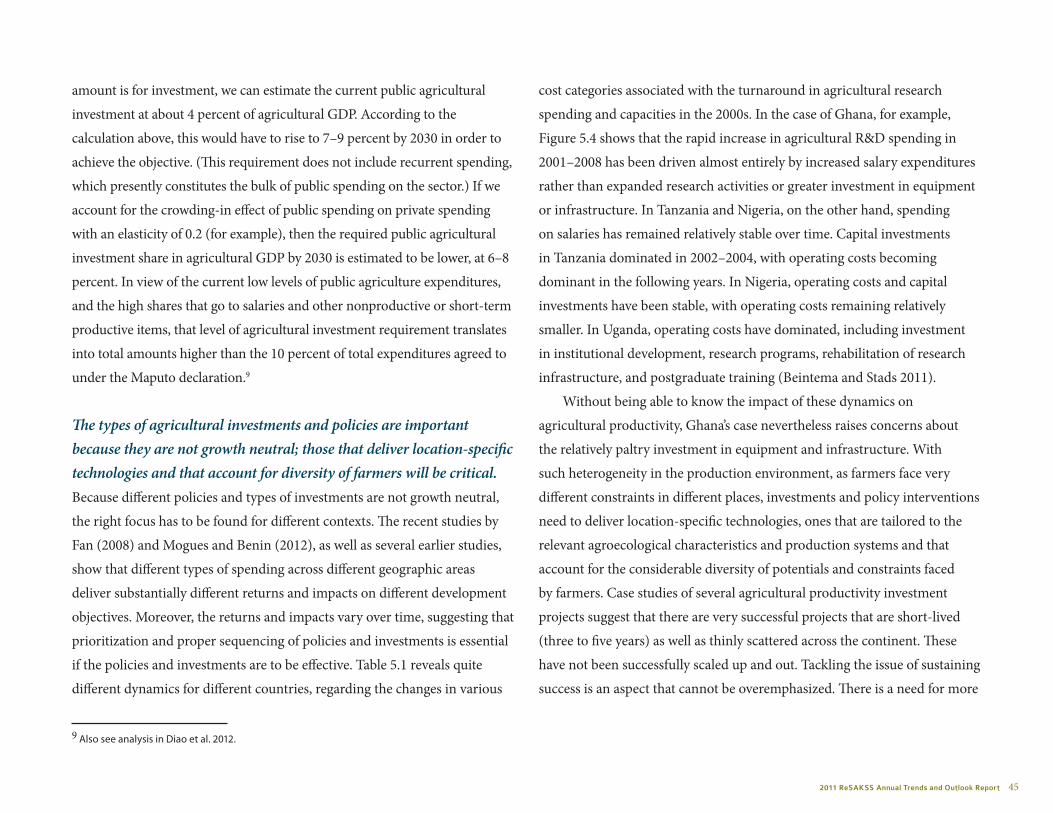
2011 ReSAKSS Annual Trends and Outlook Report 45
amount is for investment, we can estimate the current public agricultural
investment at about 4 percent of agricultural GDP. According to the
calculation above, this would have to rise to 7–9 percent by 2030 in order to
achieve the objective. (This requirement does not include recurrent spending,
which presently constitutes the bulk of public spending on the sector.) If we
account for the crowding-in effect of public spending on private spending
with an elasticity of 0.2 (for example), then the required public agricultural
investment share in agricultural GDP by 2030 is estimated to be lower, at 6–8
percent. In view of the current low levels of public agriculture expenditures,
and the high shares that go to salaries and other nonproductive or short-term
productive items, that level of agricultural investment requirement translates
into total amounts higher than the 10 percent of total expenditures agreed to
under the Maputo declaration.9
The types of agricultural investments and policies are important because they are not growth neutral; those that deliver location-specific technologies and that account for diversity of farmers will be critical.Because different policies and types of investments are not growth neutral,
the right focus has to be found for different contexts. The recent studies by
Fan (2008) and Mogues and Benin (2012), as well as several earlier studies,
show that different types of spending across different geographic areas
deliver substantially different returns and impacts on different development
objectives. Moreover, the returns and impacts vary over time, suggesting that
prioritization and proper sequencing of policies and investments is essential
if the policies and investments are to be effective. Table 5.1 reveals quite
different dynamics for different countries, regarding the changes in various
cost categories associated with the turnaround in agricultural research
spending and capacities in the 2000s. In the case of Ghana, for example,
Figure 5.4 shows that the rapid increase in agricultural R&D spending in
2001–2008 has been driven almost entirely by increased salary expenditures
rather than expanded research activities or greater investment in equipment
or infrastructure. In Tanzania and Nigeria, on the other hand, spending
on salaries has remained relatively stable over time. Capital investments
in Tanzania dominated in 2002–2004, with operating costs becoming
dominant in the following years. In Nigeria, operating costs and capital
investments have been stable, with operating costs remaining relatively
smaller. In Uganda, operating costs have dominated, including investment
in institutional development, research programs, rehabilitation of research
infrastructure, and postgraduate training (Beintema and Stads 2011).
Without being able to know the impact of these dynamics on
agricultural productivity, Ghana’s case nevertheless raises concerns about
the relatively paltry investment in equipment and infrastructure. With
such heterogeneity in the production environment, as farmers face very
different constraints in different places, investments and policy interventions
need to deliver location-specific technologies, ones that are tailored to the
relevant agroecological characteristics and production systems and that
account for the considerable diversity of potentials and constraints faced
by farmers. Case studies of several agricultural productivity investment
projects suggest that there are very successful projects that are short-lived
(three to five years) as well as thinly scattered across the continent. These
have not been successfully scaled up and out. Tackling the issue of sustaining
success is an aspect that cannot be overemphasized. There is a need for more
9 Also see analysis in Diao et al. 2012.
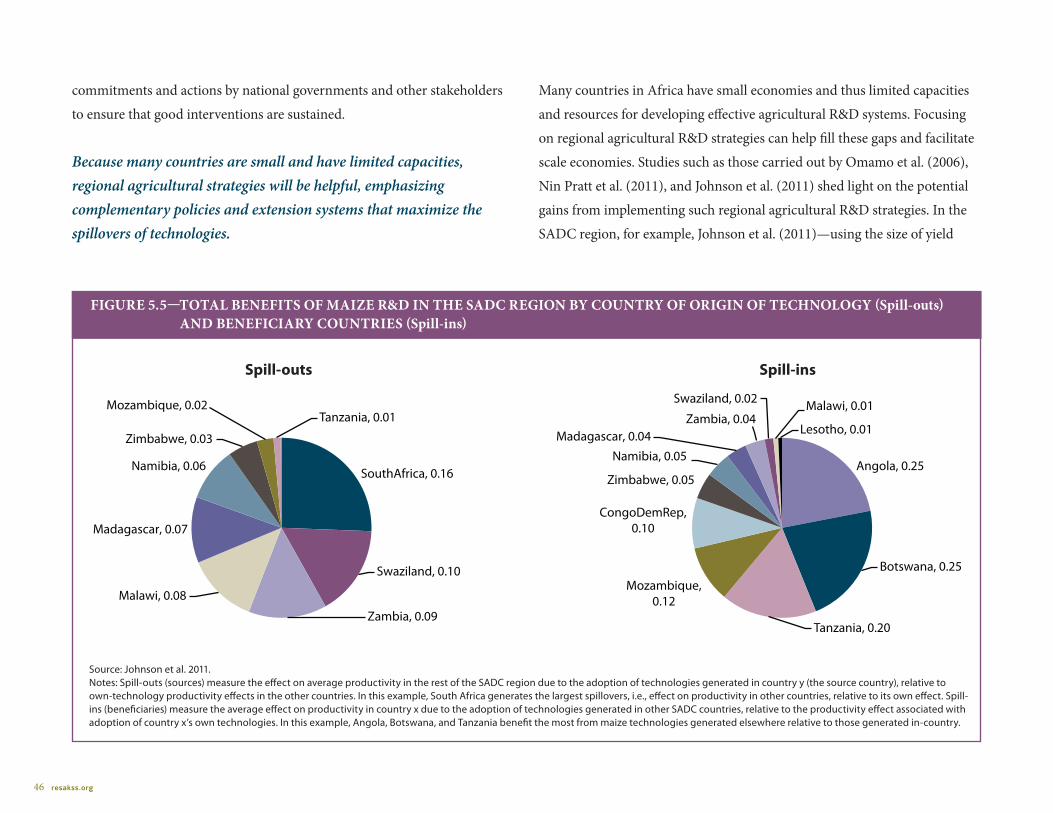
46 resakss.org
commitments and actions by national governments and other stakeholders
to ensure that good interventions are sustained.
Because many countries are small and have limited capacities, regional agricultural strategies will be helpful, emphasizing complementary policies and extension systems that maximize the spillovers of technologies.
Many countries in Africa have small economies and thus limited capacities
and resources for developing effective agricultural R&D systems. Focusing
on regional agricultural R&D strategies can help fill these gaps and facilitate
scale economies. Studies such as those carried out by Omamo et al. (2006),
Nin Pratt et al. (2011), and Johnson et al. (2011) shed light on the potential
gains from implementing such regional agricultural R&D strategies. In the
SADC region, for example, Johnson et al. (2011)—using the size of yield
SouthAfrica, 0.16
Swaziland, 0.10
Zambia, 0.09
Malawi, 0.08
Madagascar, 0.07
Namibia, 0.06
Zimbabwe, 0.03
Mozambique, 0.02 Tanzania, 0.01
Spill-outs
Angola, 0.25
Botswana, 0.25
Tanzania, 0.20
Mozambique, 0.12
CongoDemRep, 0.10
Zimbabwe, 0.05
Namibia, 0.05
Madagascar, 0.04 Zambia, 0.04
Swaziland, 0.02 Malawi, 0.01
Lesotho, 0.01
Spill-ins
Source: Johnson et al. 2011.Notes: Spill-outs (sources) measure the effect on average productivity in the rest of the SADC region due to the adoption of technologies generated in country y (the source country), relative to own-technology productivity effects in the other countries. In this example, South Africa generates the largest spillovers, i.e., effect on productivity in other countries, relative to its own effect. Spill-ins (beneficiaries) measure the average effect on productivity in country x due to the adoption of technologies generated in other SADC countries, relative to the productivity effect associated with adoption of country x’s own technologies. In this example, Angola, Botswana, and Tanzania benefit the most from maize technologies generated elsewhere relative to those generated in-country.
FiguRE 5.5—ToTAl BEnEFiTS oF mAizE R&D in ThE SADC REgion By CounTRy oF oRigin oF TEChnology (Spill-outs) AnD BEnEFiCiARy CounTRiES (Spill-ins)
2011 ReSAKSS Annual Trends and Outlook Report 47
gaps and research capacity between countries to capture the probability of
successful spill-outs and spill-ins of agricultural R&D—show that the returns
to agricultural R&D in the region differ by the country of origin of the
technologies as well as by commodities (see Figures 5.5 and 5.6).
The assumptions of
the study by Johnson et al.
(2011), particularly those
underlying the probabili-
ties of successful spill-outs
and spill-ins of agricultural
R&D, highlight areas of
the policy front that are
important to enhance and
maximize the benefits of
cross-border cooperation
in agricultural R&D. These
ideas—cross-border col-
laboration, and enhance-
ment of regional knowledge
and technology spillover—
are not new. Indeed, they
constitute the fundamen-
tal rationale for regional
economic institutions and
agricultural research orga-
nizations. But they deserve
re-emphasis to ensure that
the core roles and respon-
sibilities of cross-border institutions are persistently reaffirmed and acted
upon. Cross-border institutions are more than platforms for the statement
of national interests; they rather present real opportunities to add value that
national entities otherwise could not, opportunities that could serve to fur-
0
100
200
300
400
500
600
700
800
900
1,000
1,100
1,200
Maize Rice Cattle Cassava Sorghum Beans
Cum
ulat
ive,
US
mill
ion
(200
9 - 2
015)
Angola Congo, DR Lesotho Madagascar Malawi Mozambique Tanzania Zambia Zimbabwe
Source: Johnson et al. 2011.
FiguRE 5.6—ToTAl BEnEFiTS FRom TEChnology SPillovERS Among SADC CounTRiES By CommoDiTy, 2009–15
48 resakss.org
ther enhance and accelerate national productivity growth ambitions.
Of course, a regional strategy must overcome many institutional and
administrative barriers to management and coordination across national
boundaries, which can lead to high transaction costs, especially given dif-
ferent levels of development of national R&D systems and political econo-
mies. Inevitably, any cross-country collaboration will be affected by each
country’s own program needs, as well as the desire to maintain a bargaining
position for domestic resources. Looking for ways to minimize the trans-
action costs will be critical. That is why the African centers of excellence
initiatives are laudable. Notable recent efforts are two large subregional
programs, the Eastern Africa Agricultural Productivity Program (EAAPP,
implemented by ASARECA) and the West Africa Agricultural Productivity
Program (WAAPP, implemented by CORAF/WECARD), developed with
assistance from the World Bank. These two programs are in turn funding
subregional centers of excellence for particular crops and commodities—
maize and wheat in Ethiopia, dairy in Kenya, cassava in Uganda, roots and
tubers in Ghana, and rice in Mali and Tanzania, to mention a few.10 To be
successful, these initiatives will require complementary polices and agri-
cultural extension systems that enhance and maximize the spillovers of the
targeted technologies to different parts of Africa.
Potential impact of climate change should be taken into account in the design and implementation of policies and strategies for raising and maintaining high agricultural productivity.Several studies (for example, Kurukulasuriya et al. 2006, IPCC 2007, Seo
et al. 2008, and Nelson et al. 2010) provide strong evidence that climate
change or global warming due to accumulating greenhouse gases could
impose serious costs for agricultural growth, and that the change is likely
to have very different effects in different locations. Nelson et al. (2010), for
example, show that the negative effect of climate change on crop yields will
increase over time: compared to 2000, the world’s average wheat yield will
decline by 1–9 percent by 2030, 4–12 percent between 2030 and 2050, and
by 14–29 percent between 2050 and 2080, with larger declines in developing
than developed countries. Seo et al. (2008) show that the impacts of climate
change will vary across different agroecological zones (AEZs) in Africa:
farms in the savannah areas are seen most vulnerable to higher temperature
and reduced precipitation, while those in the sub-humid or humid forest
could gain even from a severe climate change.
The findings by Seo et al. (2008) have direct implications for this study,
because the AEZs used by Seo et al. (shown in Figure 5.7a) to delineate the
effects of climate change are closely associated with the farming systems
used in this study (Figure 5.7b). Extrapolating from the detailed findings
of Seo et al., households in the Cereal-Root Crop Mixed, Dryland Mixed,
Agro-Pastoral, and Pastoral farming systems (common to the savannah
AEZs) are likely to be the most vulnerable to climate change (see Figure
5.8). However, because climate warming is likely to increase livestock
income while reducing crop income (Seo et al. 2008; Nelson et al. 2010),
climate change may have a zero net effect on the total agricultural income
of households engaging in both crop and livestock production in these
systems, depending on the relative importance of the two subsectors in
their livelihoods. Those engaging solely or mostly in crop production stand
to lose the most, while those engaging solely or mostly in livestock stand
10 See http://waapp.org.gh/ and http://www.eaapp.org/ for details.
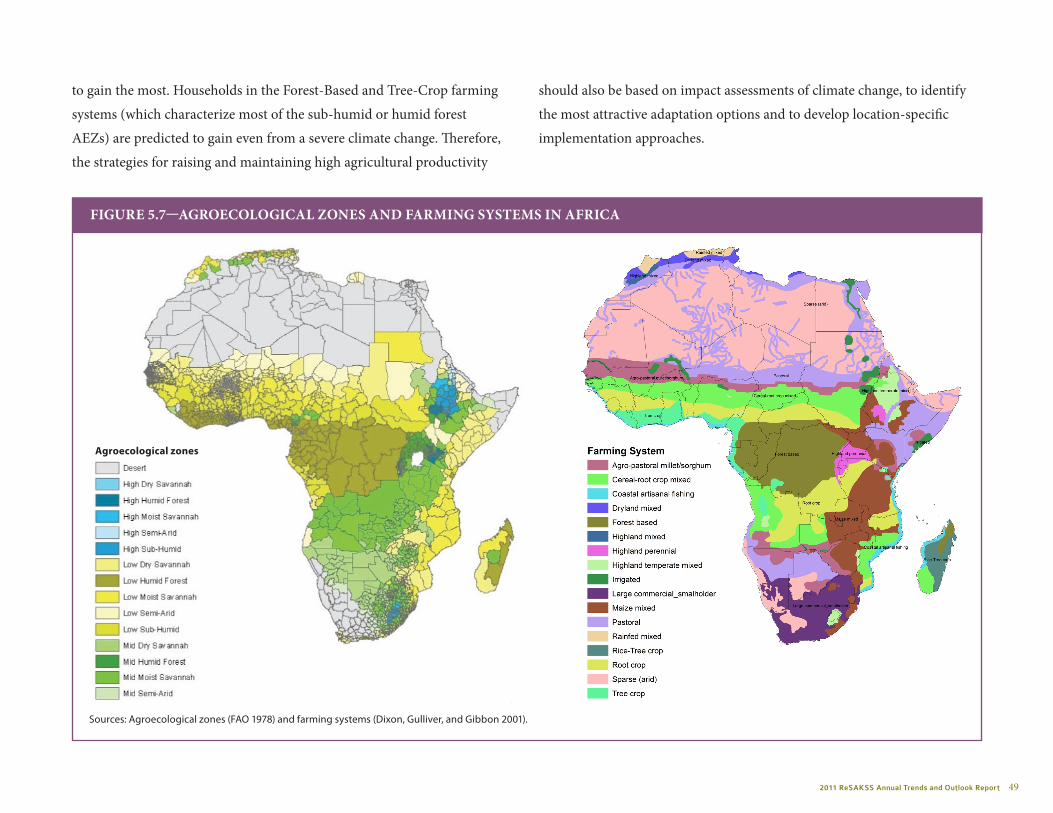
2011 ReSAKSS Annual Trends and Outlook Report 49
to gain the most. Households in the Forest-Based and Tree-Crop farming
systems (which characterize most of the sub-humid or humid forest
AEZs) are predicted to gain even from a severe climate change. Therefore,
the strategies for raising and maintaining high agricultural productivity
should also be based on impact assessments of climate change, to identify
the most attractive adaptation options and to develop location-specific
implementation approaches.
FiguRE 5.7—AgRoECologiCAl zonES AnD FARming SySTEmS in AFRiCA
Sources: Agroecological zones (FAO 1978) and farming systems (Dixon, Gulliver, and Gibbon 2001).
Agroecological zones

50 resakss.org
FiguRE 5.8—ClimATE ChAngE imPACTS on lAnD PRoDuCTiviTy in AFRiCA By AgRoECologiCAl zonE (% change in uSD/ha)
-75 -50 -25 0 25
Africa
Desert
High elevation dry savannah
High elevation humid forest
High elevation moist savannah
High elevation semi-arid
High elevation sub-humid
Lowland dry savannah
Lowland humid forest
Lowland moist savannah
Lowland semi-arid
Lowland subhumid
Mid-elevation dry savannah
Mid-elevation humid forest
Mid-elevation moist savannah
Mid-elevation semi-arid
Mid-elevation sub-humid
(A)
2020 2060 2100
-75 -50 -25 0 25
Africa
Desert
High elevation dry savannah
High elevation humid forest
High elevation moist savannah
High elevation semi-arid
High elevation sub-humid
Lowland dry savannah
Lowland humid forest
Lowland moist savannah
Lowland semi-arid
Lowland subhumid
Mid-elevation dry savannah
Mid-elevation humid forest
Mid-elevation moist savannah
Mid-elevation semi-arid
Mid-elevation sub-humid
(B)
2020 2060 2100
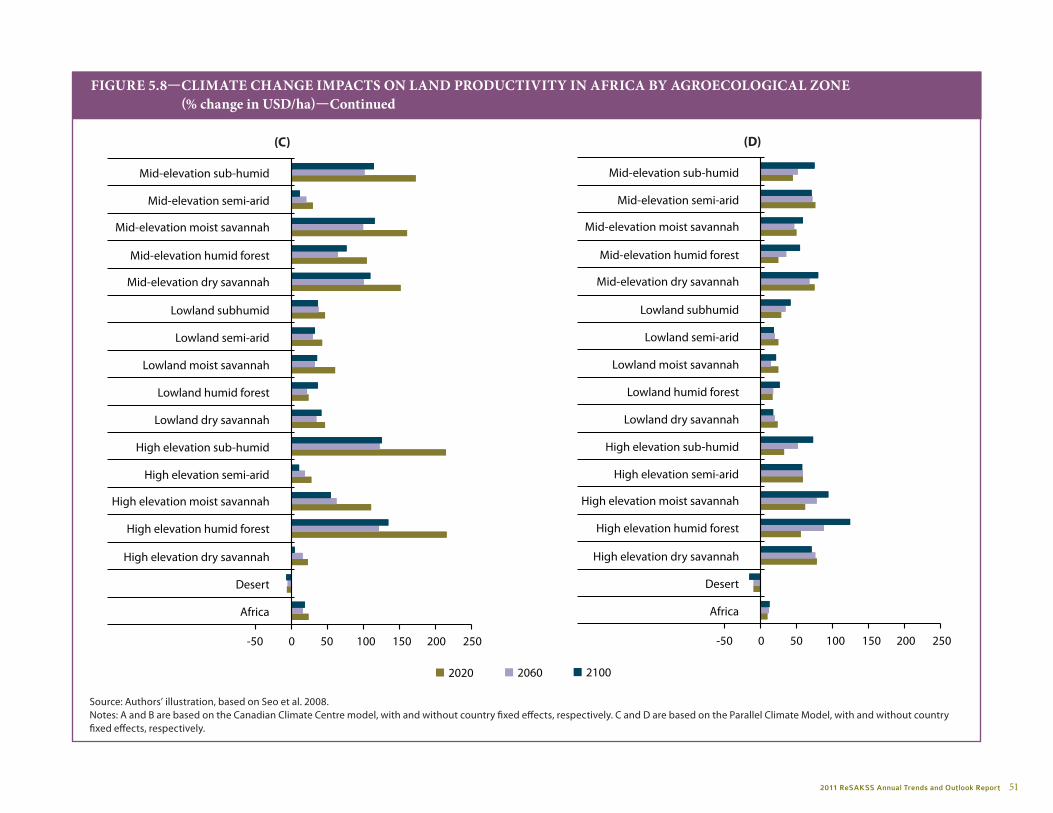
2011 ReSAKSS Annual Trends and Outlook Report 51
FiguRE 5.8—ClimATE ChAngE imPACTS on lAnD PRoDuCTiviTy in AFRiCA By AgRoECologiCAl zonE (% change in uSD/ha) —Continued
150100500 -50
Africa
Desert
High elevation dry savannah
High elevation humid forest
High elevation moist savannah
High elevation semi-arid
High elevation sub-humid
Lowland dry savannah
Lowland humid forest
Lowland moist savannah
Lowland semi-arid
Lowland subhumid
Mid-elevation dry savannah
Mid-elevation humid forest
Mid-elevation moist savannah
Mid-elevation semi-arid
Mid-elevation sub-humid
(C)
250200
2020 2060 2100
Source: Authors’ illustration, based on Seo et al. 2008.Notes: A and B are based on the Canadian Climate Centre model, with and without country fixed effects, respectively. C and D are based on the Parallel Climate Model, with and without country fixed effects, respectively.
2020 2060
150100500 -50
Africa
Desert
High elevation dry savannah
High elevation humid forest
High elevation moist savannah
High elevation semi-arid
High elevation sub-humid
Lowland dry savannah
Lowland humid forest
Lowland moist savannah
Lowland semi-arid
Lowland subhumid
Mid-elevation dry savannah
Mid-elevation humid forest
Mid-elevation moist savannah
Mid-elevation semi-arid
Mid-elevation sub-humid
2100
(D)
250200-75 -50 -25 0 25
Africa
Desert
High elevation dry savannah
High elevation humid forest
High elevation moist savannah
High elevation semi-arid
High elevation sub-humid
Lowland dry savannah
Lowland humid forest
Lowland moist savannah
Lowland semi-arid
Lowland subhumid
Mid-elevation dry savannah
Mid-elevation humid forest
Mid-elevation moist savannah
Mid-elevation semi-arid
Mid-elevation sub-humid
(B)
2020 2060 2100
52 resakss.org
Overall Policy ImplicationsFor most countries in Africa, especially those with large rural populations,
there is no more pressing development objective than raising the level
and rate of growth of agricultural productivity—because the majority of
the population, and especially the poor, live in rural areas and depend
on agriculture for their livelihoods. Moreover, as we have seen, almost all
of the observed growth in agricultural productivity over the past several
decades is explained by improvement in efficiency of factor use, rather than
by technical change.
Accordingly, the core of a sustainable development strategy for Africa
must be to make full use of its regional and sub-regional alliances, in order
to promote and disseminate well-designed and appropriately targeted
technological innovations in agriculture.
2011 ReSAKSS Annual Trends and Outlook Report 53
AU (African Union). 2011. Accessed January. http://www.au.int.
AUC (African Union Commission). 2008. National Compliance with 2003 African Union-Maputo Declaration to Allocate at Least 10% of National Budget to Agriculture Development. Addis Ababa, Ethiopia: Department of Rural Economy and Agriculture.
Beintema, N. M., and G. J. Stads. 2006. Agricultural R&D in Sub-Saharan Africa: An Era of Stagnation. ASTI (Agricultural Science & Technology Indicators) Background Report. Washington, DC: International Food Policy Research Institute (IFPRI).
________. 2011. African Agricultural R&D in the New Millennium: Progress for Some, Challenges for Many. Washington, DC: International Food Policy Research Institute (IFPRI).
Benin, S., A. Kennedy, M. Lambert, and L. McBride. 2010a. Monitoring African Agricultural Development Processes and Performance: A Comparative Analysis. ReSAKSS Annual Trends and Outlook Report 2010. Washington, DC: International Food Policy Research Institute (IFPRI).
Benin, S., M. Johnson, B. Omilola, N. Beintema, H. Bekele, P. Chilonda, K. Davis, et al. 2010b. Monitoring and Evaluation (M&E) System for the Comprehensive Africa Agriculture Development Programme (CAADP). ReSAKSS Working Paper 6. Washington, D.C.: International Food Policy Research Institute (IFPRI).
Boserup, E. 1965. The Conditions of Economic Growth. London: Allen and Unwin.
Byerlee, D., X. Diao, and C. Jackson. 2009. Agriculture, Rural Development, and Pro-Poor Growth: Country Experiences in the Post-Reform Era. DOI: 10.1146/annurev.resource.050708.144239.
CAADP (Comprehensive Africa Agriculture Development Programme). 2012. Countries with Compacts/Investment Plans. Accessed April. www.nepad-caadp.net/pdf/Table%201%20Countries%20with%20Investment%20Plans%20ver15%20(2).pdf
Caves, D. W., L. R. Christensen, and W. E. Diewert. 1982. “The economic theory of index numbers and the measurement of input, output, and productivity.” Econometrica 50: 1393–1414.
CEN-SAD (Community of Sahel-Saharan States). 2011. Accessed March. www.cen-sad.org.
COMESA (Common Market for Eastern and Southern Africa). 2010. Accessed November. www. comesa.int.
Datt, G., and M. Ravallion. 1998. “Farm Productivity and Rural Poverty in India.” Journal of Development Studies 34 (4): 62–85.
Diao. X., D. Headey, and M. Johnson. 2008. “Toward a green revolution in Africa: what would it achieve, and what would it require?” Agricultural Economics 39 (1): 539–550.
Diao, S., J. Thurlow, S. Benin, and S. Fan, eds. 2012. Strategies and Priorities for African Agriculture: Economywide Perspectives from Country Studies. Washington, D.C.: International Food Policy Research Institute (IFPRI).
Diao, X., P. Hazell, D. Resnick, and J. Thurlow. 2007. The Role of Agriculture in Development: Implications for Sub-Saharan Africa. Research Report 153. Washington, D.C.: International Food Policy Research Institute (IFPRI).
References

54 resakss.org
Dixon, J., A. Gulliver, and D. Gibbon. 2001. Farming Systems and Poverty: Improving Farmers’ Livelihoods in a Changing World. Rome and Washington, DC: FAO and World Bank.
EAC (East African Community). 2011. Accessed March. www.eac.int.
ECOWAS (Economic Community of West African States). 2010. Accessed November. www.ecowas.net.
Fan, S., ed. 2008. Public Expenditures, Growth, and Poverty: Lessons from Developing Countries. Baltimore, MD: Johns Hopkins University Press.
Fan, S., P. Hazell, and S. Thorat. 2000. “Government Spending, Agricultural Growth and Poverty in Rural India.” American Journal of Agricultural Economics 82 (4): 1038–1051.
FAO (Food and Agriculture Organization of the United Nations). 1978. Report on Agro-Ecological Zones, Volume 1: Methodology and Results for Africa. Rome.
———. 2012. FAOSTAT On-line Database: Production and Resource Domains. Rome. Accessed March. http://faostat.fao.org/default.aspx?lang=en.
Färe, R., S. Grosskopf, M. Norris, and Z. Zhang. 1994. “Productivity growth, technical progress, and efficiency change in industrialized countries.” American Economic Review 84: 66–83.
GRUMP (Global Rural-urban mapping project). 2005. Global Rural-Urban Mapping Project, Version 1 (GRUMPv1). Palisades, N.Y.: Socioeconomic Data and Applications Center (SEDAC), Columbia University. Available at http://sedac.ciesin.columbia.edu/gpw.
Hayami, Y. 2001. Development Economics: From the Poverty to the Wealth of Nations. Oxford, U.K.: Oxford University Press.
IGAD (Intergovernmental Authority on Development). 2011. Accessed March. http://igad.int.
IMF (International Monetary Fund). 2010. Government Finance Statistics Manual. Accessed December. http://www.imf.org/external/pubs/ft/gfs/manual/index.htm.
———. 2012. Government Finance Statistics. Accessed March. http://www.imf.org.
IPCC (Intergovernmental Panel on Climate Change). 2007. State of the Science. Contribution of Working Group I to the Fourth Assessment Report of the Intergovernmental Panel on Climate Change. Cambridge, U.K.: Cambridge University Press.
Johnson, M., S. Benin, X. Diao, and L. You. 2011. Prioritizing Regional Agricultural R&D Investments in Africa: Incorporating R&D Spillovers and Economywide Effects. Working Paper 15, ASTI/FARA Conference on Agriculture R&D: Investing in Africa’s Future, Accra, Ghana, December 5–7.
Kurukulasuriya, P., R. Mendelsohn, R. Hassan, J. Benhin, M. Diop, H. M. Eid, K. Y. Fosu, et al. 2006. “Will African Agriculture Survive Climate Change?” World Bank Economic Review 20 (3): 367–388.
Mellor, J. 1999. Faster, More Equitable Growth: The Relation Between Growth in Agriculture and Poverty Reduction Agricultural Policy Development Project (Research Report No. 4). Washington, D.C.: United States Agency for International Development. Retrieved from http://www.abtassociates.com/reports/19998977199472.pdf
References continued
2011 ReSAKSS Annual Trends and Outlook Report 55
Mogues, T., and Benin, S., eds. 2012. Public Expenditures for Agricultural and Rural Development in Africa. London: Routledge.
Nelson, G. C., M. W. Rosegrant, A. Palazzo, I. Gray, C. Ingersoll, R. Robertson, S. Tokgoz, et al. 2010. Food Security, Farming, and Climate Change to 2050: Scenarios, Results, Policy Options. Washington, DC: International Food Policy Research Institute (IFPRI).
Nin Pratt, A., M. Johnson, E. Magalhaes, L. You, X. Diao, and J. Chamberlin. 2011. Yield Gaps and Potential Agricultural Growth in West and Central Africa. Washington, DC: International Food Policy Institute (IFPRI).
Nin Pratt, A., and B. Yu. 2008. An Updated Look at the Recovery of Agricultural Productivity in Sub-Saharan Africa. IFPRI Discussion Paper 787. Washington, DC: International Food Policy Institute (IFPRI).
OECD (Organization for Economic Cooperation and Development). 2012. Creditor Reporting System. Accessed March. http://stats.oecd.org/Index.aspx?DataSetCode=CRSNEW.
Omamo, S. W., X. Diao, S. Wood, J. Chamberlain, L. You, S. Benin, U. Wood-Sichra, and A. Tatwangire. 2006. Strategic Priorities for Agricultural Development in Eastern and Central Africa. IFPRI Report 150. Washington, DC: International Food Policy Research Institute (IFPRI).
Ramankutty, N., A. T. Evan, C. Monfreda, and J. A. Foley. 2008. “Farming the Planet: 1. Geographic Distribution of Global Agricultural Lands in the Year 2000.” Global Biogeochemical Cycles 22 (1003): 1-19. Available at http://trane.evsc.virginia.edu/Publications_files/2007GB002952.pdf.
Ricardo, D. 1891. Principles of Political Economy and Taxation. London: G. Bell.
SADC (Southern Africa Development Community). 2010. Accessed November. www.sadc.int.
Schneider, K., and M. K. Gugerty. 2011. “Agricultural Productivity and Poverty Reduction: Linkages and Pathways.” The Evans School Review 1 (1): 56-74.
Seo, S. N., R. Mendelsohn, A. Dinar, R. Hassan, and P. Kurukulasuriya. 2008. A Ricardian Analysis of the Distribution of Climate Change Impacts on Agriculture across Agro-Ecological Zones in Africa. Policy Research Working Paper 4599. Washington, DC: The World Bank.
Thirtle, C., X. Irz, Lin Lin, V. Mckenzie-Hill, and S. Wiggins. 2001. Relationship between changes in agricultural productivity and the incidence of poverty in developing countries. Report No. 7946. London: Department for International Development.
UMA (Union du Maghreb Arabe). 2011. Accessed March. www.maghrebarabe.org/en/.
Von Braun, J., S. Fan, R. Meinzen-Dick, M. W. Rosegrant, and A. Nin Pratt. 2008. International agricultural research for food security, poverty reduction, and the environment: What to expect from scaling up CGIAR investments and “best bet” programs. Washington, DC: International Food Policy Research Institute.
Von Grebmer, K., M. Torero, T. Olofinbiyi, H. Fritschel, D. Wiesmann, Y. Yohannes, L. Schofield, and C. von Oppeln. 2011. 2011 Global Hunger Index: The challenge of hunger: Taming price spikes and excessive food price volatility. Washington: International Food Policy Research Institute.
Von Thuenen, J. 1826. Translated by C. M. Wartenberg. 1966. Isolated State. New York: Pergamon Press.
56 resakss.org
World Bank. 1994. Project Completion Report, Kenya Animal Health Services Project (IDA CREDIT 1758-KE; IFAD LOAN 188-KE; OPEC LOAN 407). Report No. 13836. Washington DC.
———. 2012. World Development Indicators. Accessed January http://data.worldbank.org/indicator.
You, L., S. Wood, and U. Wood-Sichra. 2009. “Generating Plausible Crop Distribution Maps for Sub-Saharan Africa Using a Spatially Disaggregated Data Fusion and Optimization Approach.” Agricultural Systems 99 (2-3): 126-140.
References continued
2011 ReSAKSS Annual Trends and Outlook Report 57
Annexes: Core CAADP M&E Indicators
In the form of a statistical abstract, we present data and trends in the CAADP M&E core indicators (see Benin et al. 2010b). These are organized under enabling environment (which gives the context within which the CAADP process and related policies, investments, and outcomes have been taking place), progress in CAADP implementation process, agricultural spending, agricultural sector performance, and outcomes (MDG1 indicators).
The data are presented at the aggregate level for the entire continent (Africa), Sub-Saharan Africa (SSA), the five geographic regions of the African Union (central, eastern, northern, southern, and western), eight Regional Economic Communities (CEN-SAD, COMESA, EAC, ECCAS, ECOWAS, IGAD, SADC, and UMA),11 and four economic categories that are classified according agricultural production potential, alternative nonagricultural sources of growth, and income level—see 2010 ATOR (Benin at al. 2010a) for details on data sources and methodology. Data for individual countries can be observed at www.resakss.org.
Technical Notes to Annex Tables1. To control for year-to-year fluctuations, point estimates are avoided
in the table. Therefore, the values under the column “2003” are simple averages over the years 2002 to 2004.
2. Annual average level and annual average change for 2003–2010 include data from 2003 up to the most recent year that is measured and available.
3. Annual average level is simple average over the years shown, inclusive of the years shown.
4. Annual average change for all indicators except GDP growth rates (and others with possible negative values) is annual average percent change from the beginning to the end years shown by fitting an exponential growth function to the data points (i.e., “LOGEST” function in excel).
5. Annual average change for GDP growth rates (and other indicators with possible negative values) is annual average percentage point change, which is a simple average of the difference in two consecutive years over the years specified in the range.
6. For indicators in which there are only a few measured data points over the years specified in the range (such as poverty, which is measured once every three to five years or so), a straight-line method was used to obtain missing values for the individual years between any two measured data points. Otherwise, estimated annual average change based on the measured values (see above) is used to obtain missing values either preceding or following the measured data point.
6a. In cases where the missing values could not be interpolated, the data is reported as missing and excluded from the calculations for that time period. Any weights used for these indicators are adjusted to account for the missing data in the series of the indicator.
11 CEN-SAD is the Community of Sahel-Saharan States (CEN-SAD 2011); COMESA is the Common Market for Eastern and Southern Africa (COMESA 2010); EAC is the East African Community (EAC 2011); ECCAS is the Economic Community of Central African States; ECOWAS is the Economic Community of West African States (ECOWAS 2010); IGAD is the Intergovernmental Authority for Development (IGAD 2011); SADC is the Southern Africa Development Community (SADC 2010) and UMA is the Union du Maghreb Arabe (UMA 2011).
58 resakss.org
7. Values for Africa, the regional aggregations (SSA and central, eastern, northern, southern and western), economic aggregations (Less favorable agriculture conditions, More favorable agriculture conditions, Mineral-rich countries, and Middle income countries—see introduction), and Regional Economic Communities (CEN-SAD, COMESA, EAC, ECCAS, ECOWAS, IGAD, SADC, and UMA) are calculated by weighted summation. The weights vary by indicator; if a weight was used, the specific weights used is listed under each table, and weights are based on each country’s
proportion in the total value of the indicator used for the weighing measured at the respective aggregate level. Each country i’s weight in region j (wij) is then multiplied by the country’s data point (xi) and then summed up for the relevant countries in the region to obtain the regional value (yj) according to: yj = Σi wijxi.
8. Sub-Saharan Africa (SSA) excludes the northern Africa region and its constituent countries.

2011 ReSAKSS Annual Trends and Outlook Report 59
Annex A: Enabling Environment
TABlE A.1—ToTAl oDA PER CAPiTA, gRoSS DiSBuRSEmEnTS (2009 uSD)
region/subregion 2003Annual average level
(2003-2010)Annual average percentage
change (2003-2010)
Africa 36.16 49.74 2.13
SSA 38.88 54.44 1.93
Geographic Location
Central 62.56 65.66 -0.83
Eastern 34.04 52.91 4.75
Northern 23.28 26.83 3.38
Southern 47.02 55.79 1.57
Western 30.50 50.97 2.34
Economic classification
Less favorable agriculture 51.57 70.62 2.98
More favorable agriculture 41.93 58.77 4.06
Mineral-rich countries 72.44 73.48 -1.80
Middle-income countries 24.01 37.01 2.69
Regional Economic Community
CEN-SAD 27.74 43.89 4.86
COMESA 37.82 48.81 1.28
EAC 36.82 58.35 7.18
ECCAS 60.52 63.08 -1.75
ECOWAS 30.50 50.97 2.34
IGAD 27.14 45.31 7.51
SADC 53.88 59.17 -1.57
UMA 23.46 32.47 6.62
Source: Authors’ calculation based on World Bank 2012 and OECD 2012.

60 resakss.org
TABlE A.2—ShARE oF AgRiCulTuRAl oFFiCiAl DEvEloPmEnT ASSiSTAnCE in ToTAl oDA
share in total odA share in total sector Allocatable odA
region/subregion 2003Annual average level
(2003-2010)
Annual average percentage change
(2003-2010) 2003Annual average level
(2003-2010)
Annual average percentage change
(2003-2010)
Africa 2.98 3.73 10.48 5.81 6.75 4.23
SSA 2.98 3.77 11.11 6.03 7.17 4.58
Geographic Location
Central 1.52 1.89 11.54 4.46 5.40 3.87
Eastern 3.60 4.33 8.42 6.28 7.55 3.47
Northern 2.95 3.41 4.40 4.48 4.27 0.14
Southern 2.44 3.77 10.67 4.30 5.98 5.43
Western 4.21 4.52 11.26 7.67 8.16 4.90
Economic classification
Less favorable agriculture 4.81 5.54 6.96 8.58 9.98 3.39
More favorable agriculture 3.88 5.10 7.47 6.42 8.28 4.04
Mineral-rich countries 1.10 1.82 16.03 3.59 4.65 6.01
Middle-income countries 2.72 2.92 11.82 4.95 4.94 4.83
Regional Economic Community
CEN-SAD 3.75 3.94 8.46 6.54 6.87 3.89
COMESA 2.54 3.56 12.15 5.39 6.82 4.31
EAC 3.45 4.68 7.81 5.27 7.09 4.23
ECCAS 1.45 2.22 17.87 4.20 5.63 8.10
ECOWAS 4.21 4.52 11.26 7.67 8.16 4.90
IGAD 3.31 3.91 8.55 5.91 7.04 3.59
SADC 2.22 3.50 12.03 5.00 6.44 3.98
UMA 3.58 3.52 1.37 5.28 4.23 -2.75
Source: Authors’ calculation based on OECD 2012.Notes: Both agriculture ODA and total sector allocatable ODA are based on gross disbursements, for which data are available starting from 2003. Total sector allocatable ODA is total ODA minus total unallocatable ODA, which includes commodity aid and general program assistance, debt programs, humanitarian aid, administrative costs, funds to NGOs, refugee programs, and other unallocatable aid.
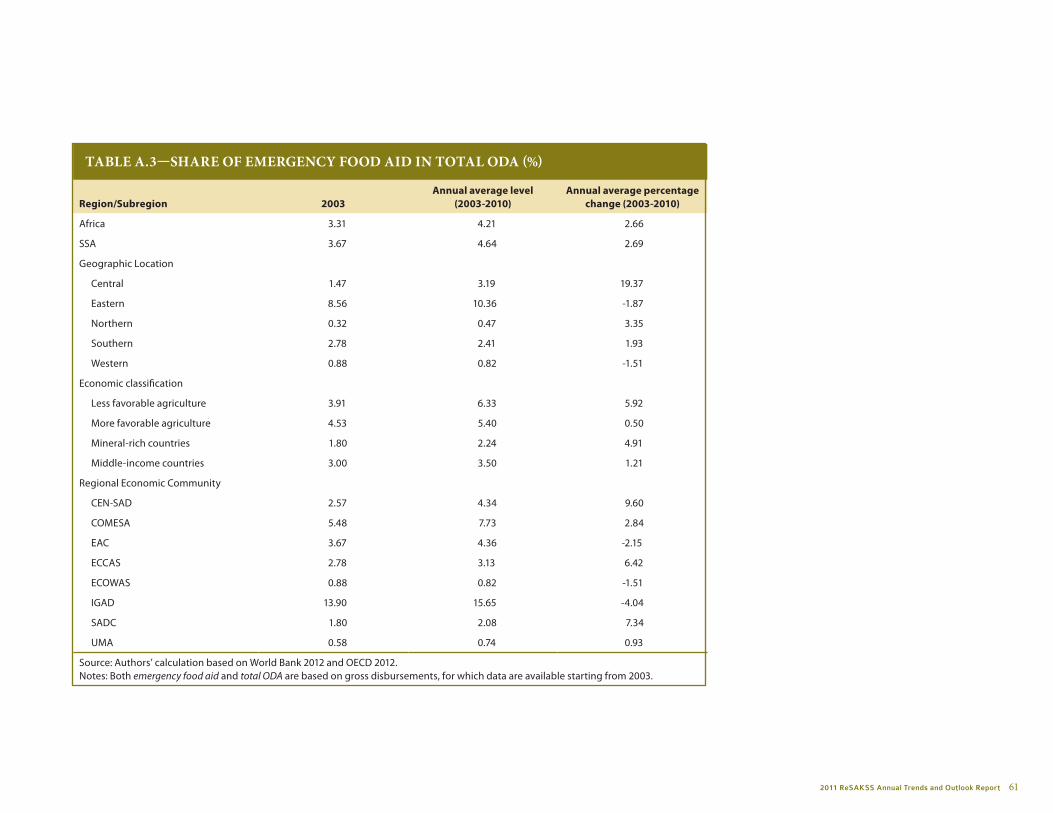
2011 ReSAKSS Annual Trends and Outlook Report 61
TABlE A.3—ShARE oF EmERgEnCy FooD AiD in ToTAl oDA (%)
region/subregion 2003Annual average level
(2003-2010)Annual average percentage
change (2003-2010)
Africa 3.31 4.21 2.66
SSA 3.67 4.64 2.69
Geographic Location
Central 1.47 3.19 19.37
Eastern 8.56 10.36 -1.87
Northern 0.32 0.47 3.35
Southern 2.78 2.41 1.93
Western 0.88 0.82 -1.51
Economic classification
Less favorable agriculture 3.91 6.33 5.92
More favorable agriculture 4.53 5.40 0.50
Mineral-rich countries 1.80 2.24 4.91
Middle-income countries 3.00 3.50 1.21
Regional Economic Community
CEN-SAD 2.57 4.34 9.60
COMESA 5.48 7.73 2.84
EAC 3.67 4.36 -2.15
ECCAS 2.78 3.13 6.42
ECOWAS 0.88 0.82 -1.51
IGAD 13.90 15.65 -4.04
SADC 1.80 2.08 7.34
UMA 0.58 0.74 0.93
Source: Authors’ calculation based on World Bank 2012 and OECD 2012.Notes: Both emergency food aid and total ODA are based on gross disbursements, for which data are available starting from 2003.

62 resakss.org
TABlE A.4—gDP gRowTh (annual %)
region/subregion
Annual average level
(1990-1995)
Annual average percentage point
change (1990-1995)
Annual average level
(1995-2003)
Annual average percentage point
change (1995-2003) 2003
Annual average level
(2003-2010)
Annual average percentage point
change (2003-2010)
Africa 1.92 0.17 3.86 0.22 4.61 5.14 -0.07
SSA 1.37 0.49 3.72 0.07 4.76 5.24 0.06
Geographic Location
Central -1.77 1.21 3.65 0.22 6.41 5.08 -0.04
Eastern 2.79 0.57 4.74 -0.15 4.75 6.47 0.21
Northern 2.74 -0.32 4.04 0.44 4.40 4.99 -0.25
Southern 0.85 0.60 3.28 -0.08 3.98 4.33 0.09
Western 2.73 -0.17 3.89 0.48 5.72 6.06 -0.11
Economic classification
Less favorable agriculture 1.18 1.76 5.30 -0.18 6.92 5.56 -0.03
More favorable agriculture 2.68 0.07 3.99 -0.24 3.77 5.93 0.55
Mineral-rich countries -3.50 0.95 2.03 0.41 4.55 4.82 0.28
Middle-income countries 2.03 0.11 3.86 0.28 4.66 5.04 -0.15
Regional Economic Community
CEN-SAD 3.19 -0.35 4.07 0.42 4.58 5.56 -0.14
COMESA 3.00 0.15 3.99 0.01 3.57 5.58 0.09
EAC 3.58 -0.14 4.50 -0.05 4.49 5.30 -0.01
ECCAS -1.99 1.60 4.75 -0.17 7.26 7.34 -0.06
ECOWAS 2.73 -0.17 3.89 0.48 5.72 6.06 -0.11
IGAD 3.01 0.89 4.62 -0.28 4.49 6.71 0.33
SADC 0.71 0.55 3.28 -0.01 4.13 4.53 0.08
UMA 2.10 -0.40 3.79 0.84 5.17 4.73 -0.61
Source: Authors’ calculation based on World Bank 2012.Notes: Data includes GDP data imputed via growth rates derived from the log estimate of the five years following or preceding the missing values. See Technical Notes for other calculation details.
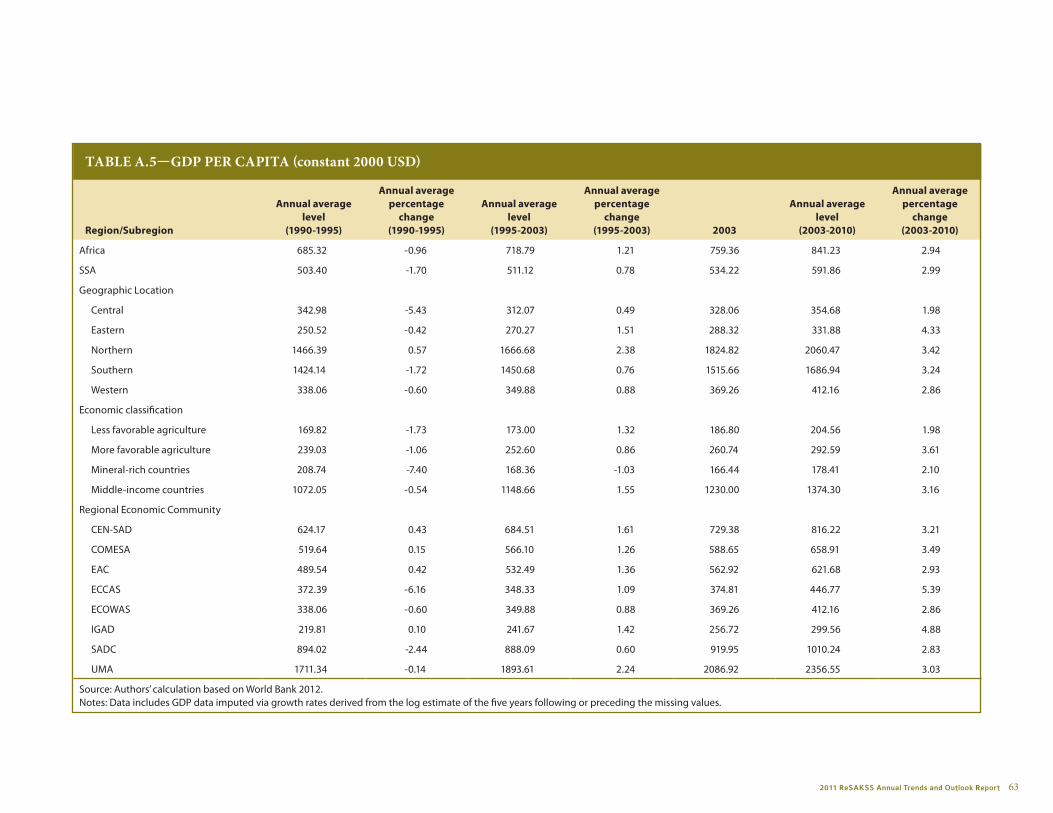
2011 ReSAKSS Annual Trends and Outlook Report 63
TABlE A.5—gDP PER CAPiTA (constant 2000 uSD)
region/subregion
Annual average level
(1990-1995)
Annual average percentage
change (1990-1995)
Annual average level
(1995-2003)
Annual average percentage
change (1995-2003) 2003
Annual average level
(2003-2010)
Annual average percentage
change (2003-2010)
Africa 685.32 -0.96 718.79 1.21 759.36 841.23 2.94
SSA 503.40 -1.70 511.12 0.78 534.22 591.86 2.99
Geographic Location
Central 342.98 -5.43 312.07 0.49 328.06 354.68 1.98
Eastern 250.52 -0.42 270.27 1.51 288.32 331.88 4.33
Northern 1466.39 0.57 1666.68 2.38 1824.82 2060.47 3.42
Southern 1424.14 -1.72 1450.68 0.76 1515.66 1686.94 3.24
Western 338.06 -0.60 349.88 0.88 369.26 412.16 2.86
Economic classification
Less favorable agriculture 169.82 -1.73 173.00 1.32 186.80 204.56 1.98
More favorable agriculture 239.03 -1.06 252.60 0.86 260.74 292.59 3.61
Mineral-rich countries 208.74 -7.40 168.36 -1.03 166.44 178.41 2.10
Middle-income countries 1072.05 -0.54 1148.66 1.55 1230.00 1374.30 3.16
Regional Economic Community
CEN-SAD 624.17 0.43 684.51 1.61 729.38 816.22 3.21
COMESA 519.64 0.15 566.10 1.26 588.65 658.91 3.49
EAC 489.54 0.42 532.49 1.36 562.92 621.68 2.93
ECCAS 372.39 -6.16 348.33 1.09 374.81 446.77 5.39
ECOWAS 338.06 -0.60 349.88 0.88 369.26 412.16 2.86
IGAD 219.81 0.10 241.67 1.42 256.72 299.56 4.88
SADC 894.02 -2.44 888.09 0.60 919.95 1010.24 2.83
UMA 1711.34 -0.14 1893.61 2.24 2086.92 2356.55 3.03
Source: Authors’ calculation based on World Bank 2012.Notes: Data includes GDP data imputed via growth rates derived from the log estimate of the five years following or preceding the missing values.

64 resakss.org
TABlE A.6—AnnuAl inFlATion (gDP deflator) (%)
region/subregion
Annual average level
(1990-1995)
Annual average percentage
change (1990-1995)
Annual average level
(1995-2003)
Annual average percentage
change (1995-2003) 2003
Annual average level
(2003-2010)
Annual average percentage
change (2003-2010)
Africa 55.68 17.46 26.42 -19.74 10.37 8.79 -1.11
SSA 83.15 25.95 39.44 -21.01 11.59 9.11 -5.08
Geographic Location
Central 459.19 14.28 59.33 -13.06 4.90 7.47 1.63
Eastern 33.21 2.05 12.47 -3.07 7.65 9.49 -0.13
Northern 15.71 -0.59 7.95 -1.13 8.67 8.36 0.51
Southern 57.47 16.50 56.18 -10.97 12.58 8.82 -0.11
Western 29.45 6.28 17.40 -3.69 14.86 9.92 -0.32
Economic classification
Less favorable agriculture 10.17 2.04 6.51 -1.06 6.90 7.38 -0.14
More favorable agriculture 17.18 1.22 9.28 -1.50 6.67 8.34 -0.08
Mineral-rich countries 878.87 25.42 133.33 -24.90 13.95 15.76 0.68
Middle-income countries 33.36 6.73 25.98 -5.16 10.79 8.70 0.23
Regional Economic Community
CEN-SAD 19.89 1.78 10.71 -1.96 10.60 8.71 0.27
COMESA 95.09 1.64 17.24 -3.19 11.54 10.63 0.40
EAC 11.93 -0.41 6.75 -0.54 4.24 5.65 -0.05
ECCAS 533.59 90.11 259.50 -56.35 26.29 13.59 -1.53
ECOWAS 29.45 6.28 17.40 -3.69 14.86 9.92 -0.32
IGAD 40.15 1.99 12.80 -3.46 7.55 10.20 -0.02
SADC 122.96 16.57 58.38 -11.62 12.17 8.94 -0.08
UMA 17.06 -0.08 9.53 -1.49 9.66 7.35 0.52
Source: Authors’ calculation based on World Bank 2012.Notes: Data includes GDP data imputed via growth rates derived from the log estimate of the five years following or preceding the missing values.
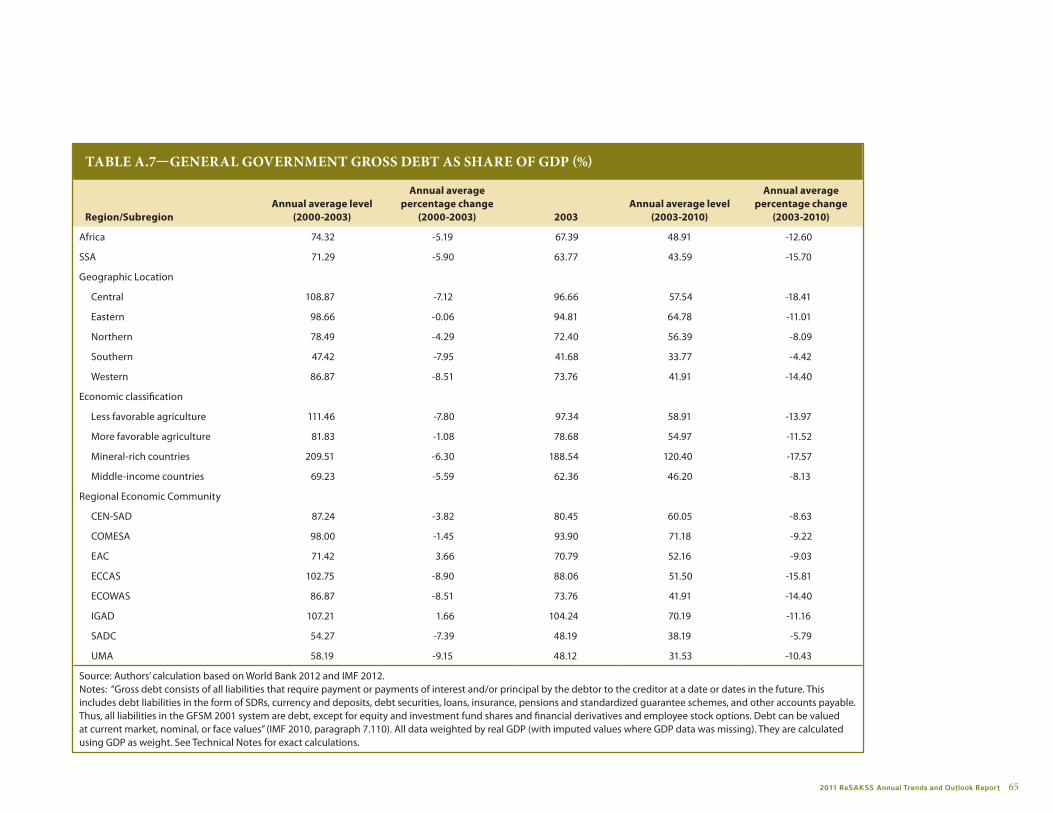
2011 ReSAKSS Annual Trends and Outlook Report 65
TABlE A.7—gEnERAl govERnmEnT gRoSS DEBT AS ShARE oF gDP (%)
region/subregionAnnual average level
(2000-2003)
Annual average percentage change
(2000-2003) 2003Annual average level
(2003-2010)
Annual average percentage change
(2003-2010)
Africa 74.32 -5.19 67.39 48.91 -12.60
SSA 71.29 -5.90 63.77 43.59 -15.70
Geographic Location
Central 108.87 -7.12 96.66 57.54 -18.41
Eastern 98.66 -0.06 94.81 64.78 -11.01
Northern 78.49 -4.29 72.40 56.39 -8.09
Southern 47.42 -7.95 41.68 33.77 -4.42
Western 86.87 -8.51 73.76 41.91 -14.40
Economic classification
Less favorable agriculture 111.46 -7.80 97.34 58.91 -13.97
More favorable agriculture 81.83 -1.08 78.68 54.97 -11.52
Mineral-rich countries 209.51 -6.30 188.54 120.40 -17.57
Middle-income countries 69.23 -5.59 62.36 46.20 -8.13
Regional Economic Community
CEN-SAD 87.24 -3.82 80.45 60.05 -8.63
COMESA 98.00 -1.45 93.90 71.18 -9.22
EAC 71.42 3.66 70.79 52.16 -9.03
ECCAS 102.75 -8.90 88.06 51.50 -15.81
ECOWAS 86.87 -8.51 73.76 41.91 -14.40
IGAD 107.21 1.66 104.24 70.19 -11.16
SADC 54.27 -7.39 48.19 38.19 -5.79
UMA 58.19 -9.15 48.12 31.53 -10.43
Source: Authors’ calculation based on World Bank 2012 and IMF 2012.Notes: “Gross debt consists of all liabilities that require payment or payments of interest and/or principal by the debtor to the creditor at a date or dates in the future. This includes debt liabilities in the form of SDRs, currency and deposits, debt securities, loans, insurance, pensions and standardized guarantee schemes, and other accounts payable. Thus, all liabilities in the GFSM 2001 system are debt, except for equity and investment fund shares and financial derivatives and employee stock options. Debt can be valued at current market, nominal, or face values” (IMF 2010, paragraph 7.110). All data weighted by real GDP (with imputed values where GDP data was missing). They are calculated using GDP as weight. See Technical Notes for exact calculations.
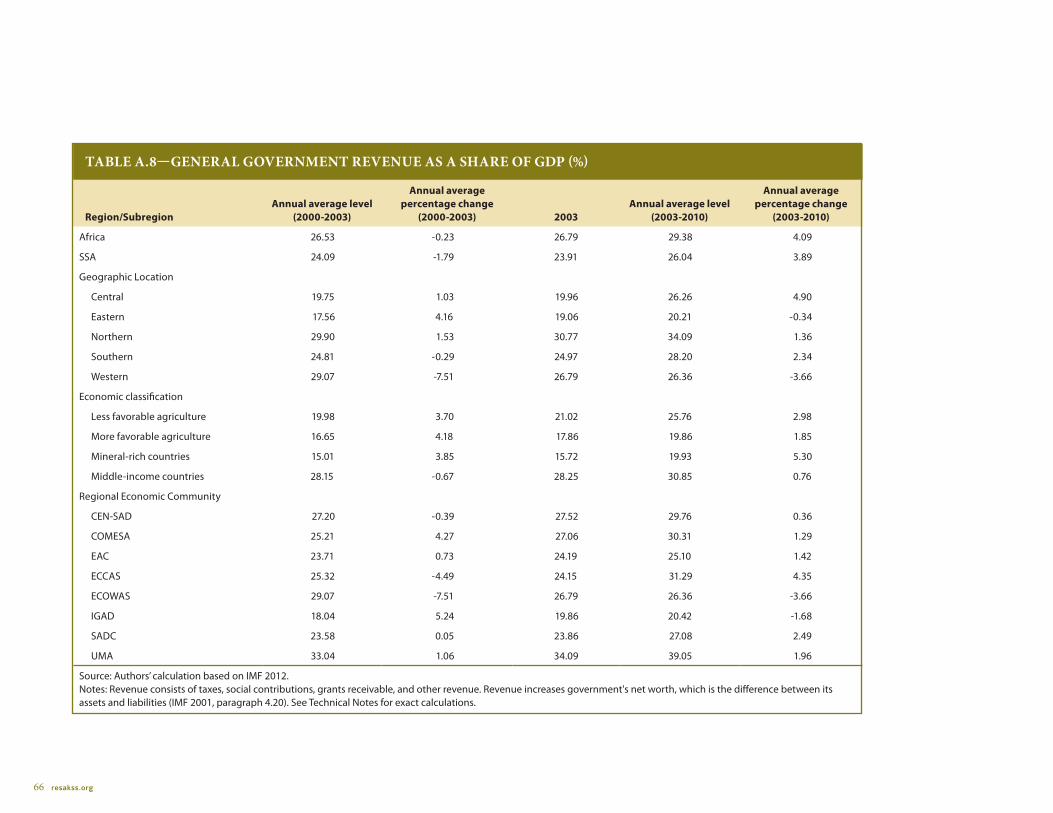
66 resakss.org
TABlE A.8—gEnERAl govERnmEnT REvEnuE AS A ShARE oF gDP (%)
region/subregionAnnual average level
(2000-2003)
Annual average percentage change
(2000-2003) 2003Annual average level
(2003-2010)
Annual average percentage change
(2003-2010)
Africa 26.53 -0.23 26.79 29.38 4.09
SSA 24.09 -1.79 23.91 26.04 3.89
Geographic Location
Central 19.75 1.03 19.96 26.26 4.90
Eastern 17.56 4.16 19.06 20.21 -0.34
Northern 29.90 1.53 30.77 34.09 1.36
Southern 24.81 -0.29 24.97 28.20 2.34
Western 29.07 -7.51 26.79 26.36 -3.66
Economic classification
Less favorable agriculture 19.98 3.70 21.02 25.76 2.98
More favorable agriculture 16.65 4.18 17.86 19.86 1.85
Mineral-rich countries 15.01 3.85 15.72 19.93 5.30
Middle-income countries 28.15 -0.67 28.25 30.85 0.76
Regional Economic Community
CEN-SAD 27.20 -0.39 27.52 29.76 0.36
COMESA 25.21 4.27 27.06 30.31 1.29
EAC 23.71 0.73 24.19 25.10 1.42
ECCAS 25.32 -4.49 24.15 31.29 4.35
ECOWAS 29.07 -7.51 26.79 26.36 -3.66
IGAD 18.04 5.24 19.86 20.42 -1.68
SADC 23.58 0.05 23.86 27.08 2.49
UMA 33.04 1.06 34.09 39.05 1.96
Source: Authors’ calculation based on IMF 2012.Notes: Revenue consists of taxes, social contributions, grants receivable, and other revenue. Revenue increases government's net worth, which is the difference between its assets and liabilities (IMF 2001, paragraph 4.20). See Technical Notes for exact calculations.
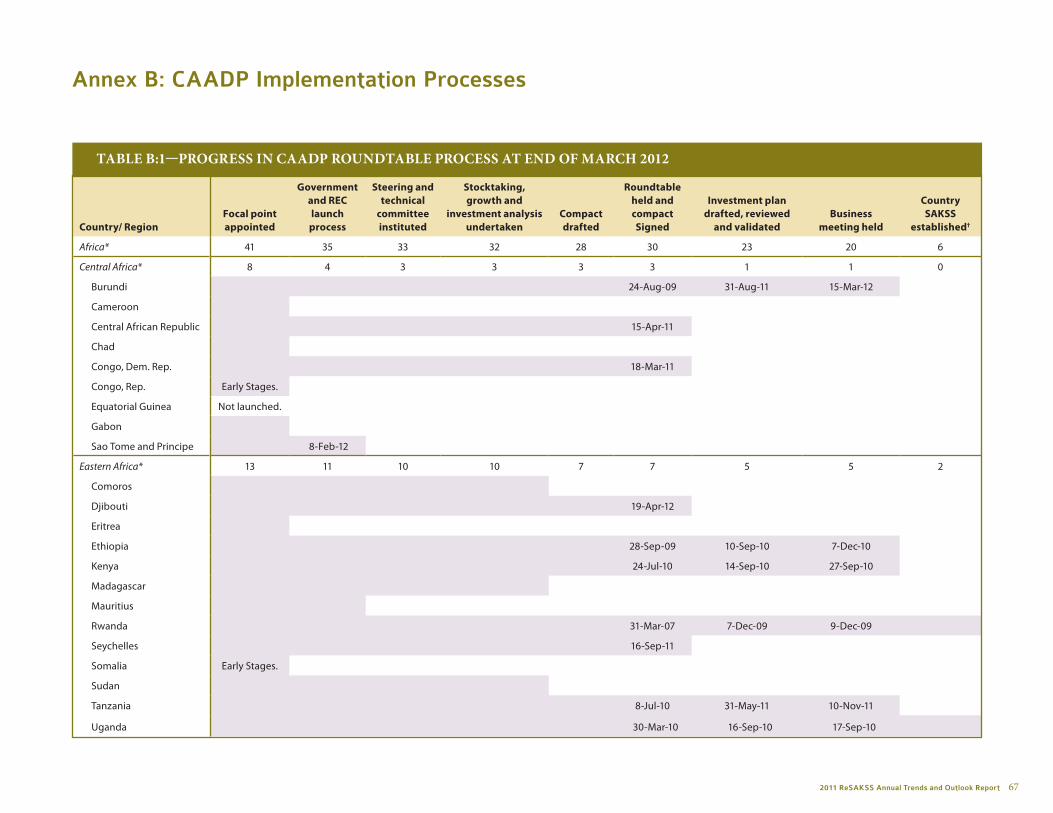
2011 ReSAKSS Annual Trends and Outlook Report 67
Annex B: CAADP Implementation Processes
country/ regionfocal point appointed
government and rec launch
process
steering and technical
committee instituted
stocktaking, growth and
investment analysis undertaken
compact drafted
roundtable held and compact signed
investment plan drafted, reviewed
and validatedbusiness
meeting held
country sAkss
established†
Africa* 41 35 33 32 28 30 23 20 6
Central Africa* 8 4 3 3 3 3 1 1 0
Burundi 24-Aug-09 31-Aug-11 15-Mar-12
Cameroon
Central African Republic 15-Apr-11
Chad
Congo, Dem. Rep. 18-Mar-11
Congo, Rep. Early Stages.
Equatorial Guinea Not launched.
Gabon
Sao Tome and Principe 8-Feb-12
Eastern Africa* 13 11 10 10 7 7 5 5 2
Comoros
Djibouti 19-Apr-12
Eritrea
Ethiopia 28-Sep-09 10-Sep-10 7-Dec-10
Kenya 24-Jul-10 14-Sep-10 27-Sep-10
Madagascar
Mauritius
Rwanda 31-Mar-07 7-Dec-09 9-Dec-09
Seychelles 16-Sep-11
Somalia Early Stages.
Sudan
Tanzania 8-Jul-10 31-May-11 10-Nov-11
Uganda 30-Mar-10 16-Sep-10 17-Sep-10
TABlE B:1—PRogRESS in CAADP RounDTABlE PRoCESS AT EnD oF mARCh 2012
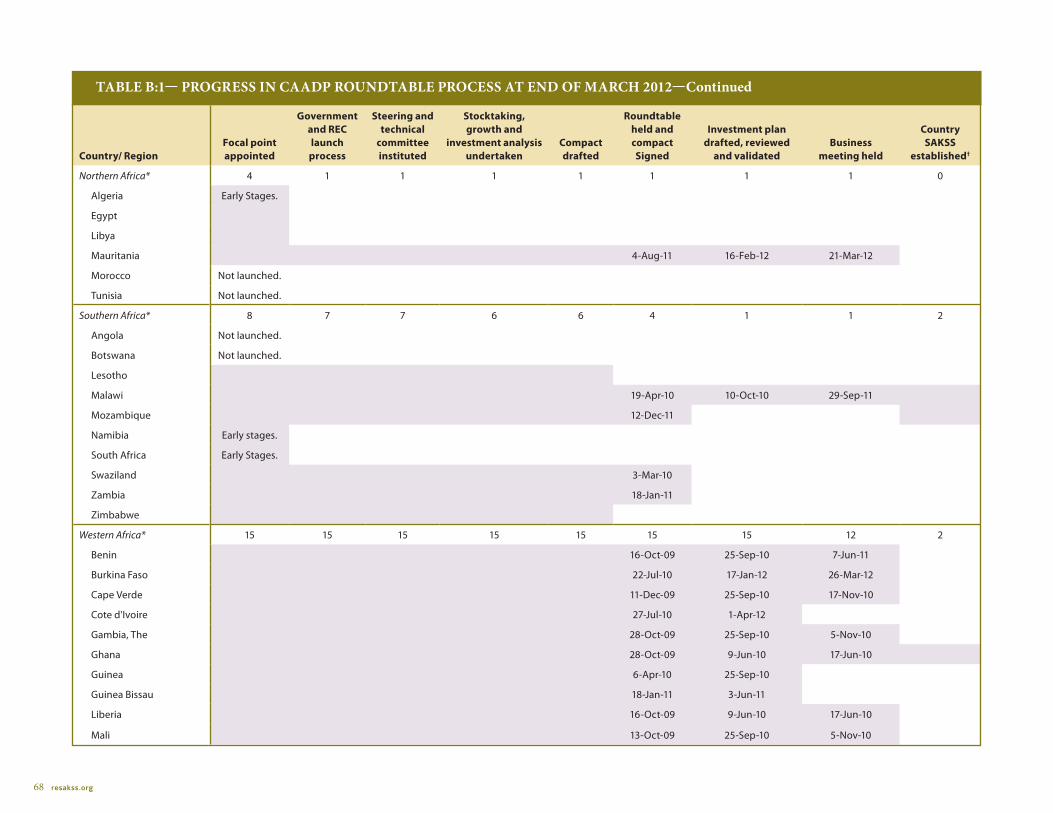
68 resakss.org
country/ regionfocal point appointed
government and rec launch
process
steering and technical
committee instituted
stocktaking, growth and
investment analysis undertaken
compact drafted
roundtable held and compact signed
investment plan drafted, reviewed
and validatedbusiness
meeting held
country sAkss
established†
Northern Africa* 4 1 1 1 1 1 1 1 0
Algeria Early Stages.
Egypt
Libya
Mauritania 4-Aug-11 16-Feb-12 21-Mar-12
Morocco Not launched.
Tunisia Not launched.
Southern Africa* 8 7 7 6 6 4 1 1 2
Angola Not launched.
Botswana Not launched.
Lesotho
Malawi 19-Apr-10 10-Oct-10 29-Sep-11
Mozambique 12-Dec-11
Namibia Early stages.
South Africa Early Stages.
Swaziland 3-Mar-10
Zambia 18-Jan-11
Zimbabwe
Western Africa* 15 15 15 15 15 15 15 12 2
Benin 16-Oct-09 25-Sep-10 7-Jun-11
Burkina Faso 22-Jul-10 17-Jan-12 26-Mar-12
Cape Verde 11-Dec-09 25-Sep-10 17-Nov-10
Cote d'Ivoire 27-Jul-10 1-Apr-12
Gambia, The 28-Oct-09 25-Sep-10 5-Nov-10
Ghana 28-Oct-09 9-Jun-10 17-Jun-10
Guinea 6-Apr-10 25-Sep-10
Guinea Bissau 18-Jan-11 3-Jun-11
Liberia 16-Oct-09 9-Jun-10 17-Jun-10
Mali 13-Oct-09 25-Sep-10 5-Nov-10
TABlE B:1— PRogRESS in CAADP RounDTABlE PRoCESS AT EnD oF mARCh 2012 —Continued
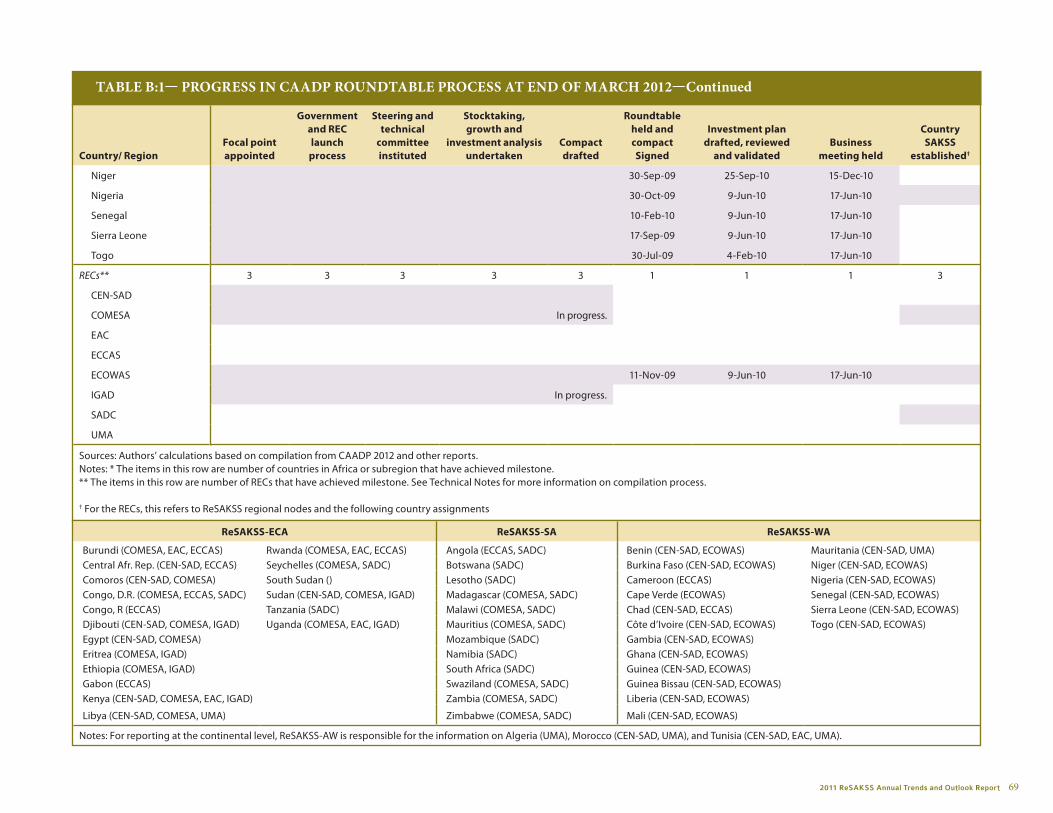
2011 ReSAKSS Annual Trends and Outlook Report 69
country/ regionfocal point appointed
government and rec launch
process
steering and technical
committee instituted
stocktaking, growth and
investment analysis undertaken
compact drafted
roundtable held and compact signed
investment plan drafted, reviewed
and validatedbusiness
meeting held
country sAkss
established†
Niger 30-Sep-09 25-Sep-10 15-Dec-10
Nigeria 30-Oct-09 9-Jun-10 17-Jun-10
Senegal 10-Feb-10 9-Jun-10 17-Jun-10
Sierra Leone 17-Sep-09 9-Jun-10 17-Jun-10
Togo 30-Jul-09 4-Feb-10 17-Jun-10
RECs** 3 3 3 3 3 1 1 1 3
CEN-SAD
COMESA In progress.
EAC
ECCAS
ECOWAS 11-Nov-09 9-Jun-10 17-Jun-10
IGAD In progress.
SADC
UMA
Sources: Authors’ calculations based on compilation from CAADP 2012 and other reports.Notes: * The items in this row are number of countries in Africa or subregion that have achieved milestone. ** The items in this row are number of RECs that have achieved milestone. See Technical Notes for more information on compilation process.
† For the RECs, this refers to ReSAKSS regional nodes and the following country assignments
TABlE B:1— PRogRESS in CAADP RounDTABlE PRoCESS AT EnD oF mARCh 2012—Continued
resAkss-ecA resAkss-sA resAkss-wA
Burundi (COMESA, EAC, ECCAS) Rwanda (COMESA, EAC, ECCAS) Angola (ECCAS, SADC) Benin (CEN-SAD, ECOWAS) Mauritania (CEN-SAD, UMA)Central Afr. Rep. (CEN-SAD, ECCAS) Seychelles (COMESA, SADC) Botswana (SADC) Burkina Faso (CEN-SAD, ECOWAS) Niger (CEN-SAD, ECOWAS)Comoros (CEN-SAD, COMESA) South Sudan () Lesotho (SADC) Cameroon (ECCAS) Nigeria (CEN-SAD, ECOWAS)Congo, D.R. (COMESA, ECCAS, SADC) Sudan (CEN-SAD, COMESA, IGAD) Madagascar (COMESA, SADC) Cape Verde (ECOWAS) Senegal (CEN-SAD, ECOWAS)Congo, R (ECCAS) Tanzania (SADC) Malawi (COMESA, SADC) Chad (CEN-SAD, ECCAS) Sierra Leone (CEN-SAD, ECOWAS)Djibouti (CEN-SAD, COMESA, IGAD) Uganda (COMESA, EAC, IGAD) Mauritius (COMESA, SADC) Côte d’Ivoire (CEN-SAD, ECOWAS) Togo (CEN-SAD, ECOWAS)Egypt (CEN-SAD, COMESA) Mozambique (SADC) Gambia (CEN-SAD, ECOWAS)Eritrea (COMESA, IGAD) Namibia (SADC) Ghana (CEN-SAD, ECOWAS)Ethiopia (COMESA, IGAD) South Africa (SADC) Guinea (CEN-SAD, ECOWAS)Gabon (ECCAS) Swaziland (COMESA, SADC) Guinea Bissau (CEN-SAD, ECOWAS)Kenya (CEN-SAD, COMESA, EAC, IGAD) Zambia (COMESA, SADC) Liberia (CEN-SAD, ECOWAS)
Libya (CEN-SAD, COMESA, UMA) Zimbabwe (COMESA, SADC) Mali (CEN-SAD, ECOWAS)
Notes: For reporting at the continental level, ReSAKSS-AW is responsible for the information on Algeria (UMA), Morocco (CEN-SAD, UMA), and Tunisia (CEN-SAD, EAC, UMA).
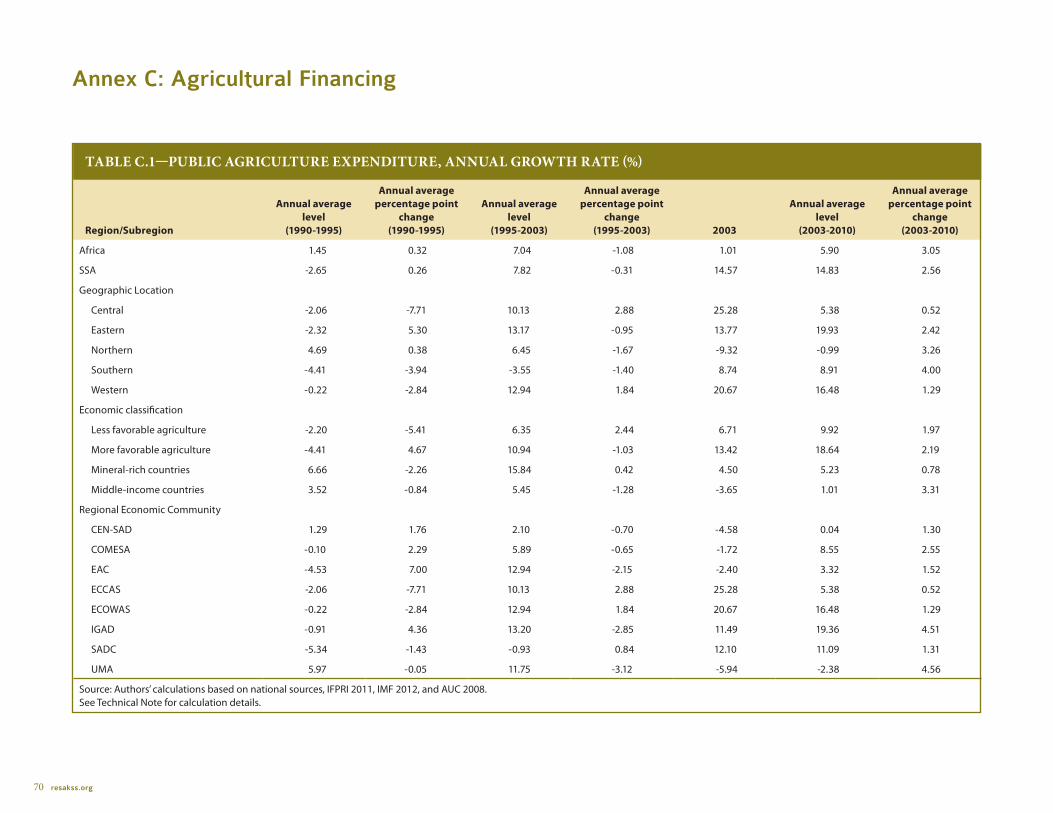
70 resakss.org
Annex C: Agricultural Financing
TABlE C.1—PuBliC AgRiCulTuRE ExPEnDiTuRE, AnnuAl gRowTh RATE (%)
region/subregion
Annual average level
(1990-1995)
Annual average percentage point
change (1990-1995)
Annual average level
(1995-2003)
Annual average percentage point
change (1995-2003) 2003
Annual average level
(2003-2010)
Annual average percentage point
change (2003-2010)
Africa 1.45 0.32 7.04 -1.08 1.01 5.90 3.05
SSA -2.65 0.26 7.82 -0.31 14.57 14.83 2.56
Geographic Location
Central -2.06 -7.71 10.13 2.88 25.28 5.38 0.52
Eastern -2.32 5.30 13.17 -0.95 13.77 19.93 2.42
Northern 4.69 0.38 6.45 -1.67 -9.32 -0.99 3.26
Southern -4.41 -3.94 -3.55 -1.40 8.74 8.91 4.00
Western -0.22 -2.84 12.94 1.84 20.67 16.48 1.29
Economic classification
Less favorable agriculture -2.20 -5.41 6.35 2.44 6.71 9.92 1.97
More favorable agriculture -4.41 4.67 10.94 -1.03 13.42 18.64 2.19
Mineral-rich countries 6.66 -2.26 15.84 0.42 4.50 5.23 0.78
Middle-income countries 3.52 -0.84 5.45 -1.28 -3.65 1.01 3.31
Regional Economic Community
CEN-SAD 1.29 1.76 2.10 -0.70 -4.58 0.04 1.30
COMESA -0.10 2.29 5.89 -0.65 -1.72 8.55 2.55
EAC -4.53 7.00 12.94 -2.15 -2.40 3.32 1.52
ECCAS -2.06 -7.71 10.13 2.88 25.28 5.38 0.52
ECOWAS -0.22 -2.84 12.94 1.84 20.67 16.48 1.29
IGAD -0.91 4.36 13.20 -2.85 11.49 19.36 4.51
SADC -5.34 -1.43 -0.93 0.84 12.10 11.09 1.31
UMA 5.97 -0.05 11.75 -3.12 -5.94 -2.38 4.56
Source: Authors’ calculations based on national sources, IFPRI 2011, IMF 2012, and AUC 2008.See Technical Note for calculation details.
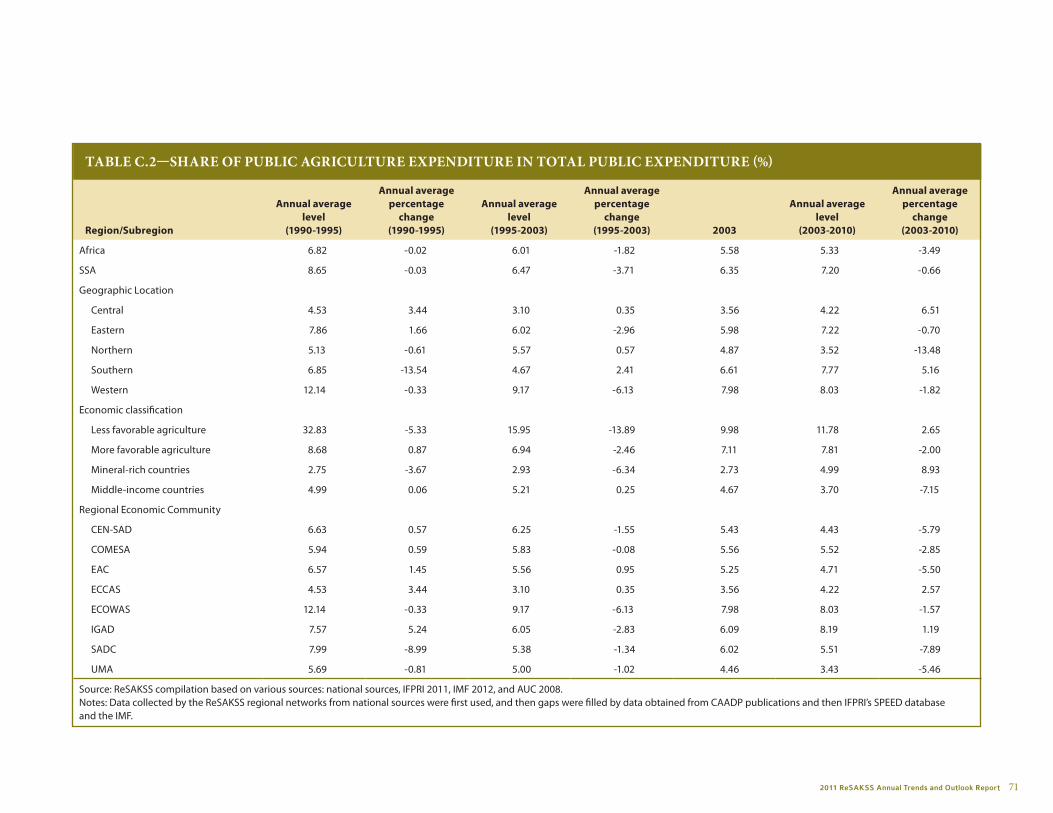
2011 ReSAKSS Annual Trends and Outlook Report 71
TABlE C.2—ShARE oF PuBliC AgRiCulTuRE ExPEnDiTuRE in ToTAl PuBliC ExPEnDiTuRE (%)
region/subregion
Annual average level
(1990-1995)
Annual average percentage
change (1990-1995)
Annual average level
(1995-2003)
Annual average percentage
change (1995-2003) 2003
Annual average level
(2003-2010)
Annual average percentage
change (2003-2010)
Africa 6.82 -0.02 6.01 -1.82 5.58 5.33 -3.49
SSA 8.65 -0.03 6.47 -3.71 6.35 7.20 -0.66
Geographic Location
Central 4.53 3.44 3.10 0.35 3.56 4.22 6.51
Eastern 7.86 1.66 6.02 -2.96 5.98 7.22 -0.70
Northern 5.13 -0.61 5.57 0.57 4.87 3.52 -13.48
Southern 6.85 -13.54 4.67 2.41 6.61 7.77 5.16
Western 12.14 -0.33 9.17 -6.13 7.98 8.03 -1.82
Economic classification
Less favorable agriculture 32.83 -5.33 15.95 -13.89 9.98 11.78 2.65
More favorable agriculture 8.68 0.87 6.94 -2.46 7.11 7.81 -2.00
Mineral-rich countries 2.75 -3.67 2.93 -6.34 2.73 4.99 8.93
Middle-income countries 4.99 0.06 5.21 0.25 4.67 3.70 -7.15
Regional Economic Community
CEN-SAD 6.63 0.57 6.25 -1.55 5.43 4.43 -5.79
COMESA 5.94 0.59 5.83 -0.08 5.56 5.52 -2.85
EAC 6.57 1.45 5.56 0.95 5.25 4.71 -5.50
ECCAS 4.53 3.44 3.10 0.35 3.56 4.22 2.57
ECOWAS 12.14 -0.33 9.17 -6.13 7.98 8.03 -1.57
IGAD 7.57 5.24 6.05 -2.83 6.09 8.19 1.19
SADC 7.99 -8.99 5.38 -1.34 6.02 5.51 -7.89
UMA 5.69 -0.81 5.00 -1.02 4.46 3.43 -5.46
Source: ReSAKSS compilation based on various sources: national sources, IFPRI 2011, IMF 2012, and AUC 2008.Notes: Data collected by the ReSAKSS regional networks from national sources were first used, and then gaps were filled by data obtained from CAADP publications and then IFPRI’s SPEED database and the IMF.
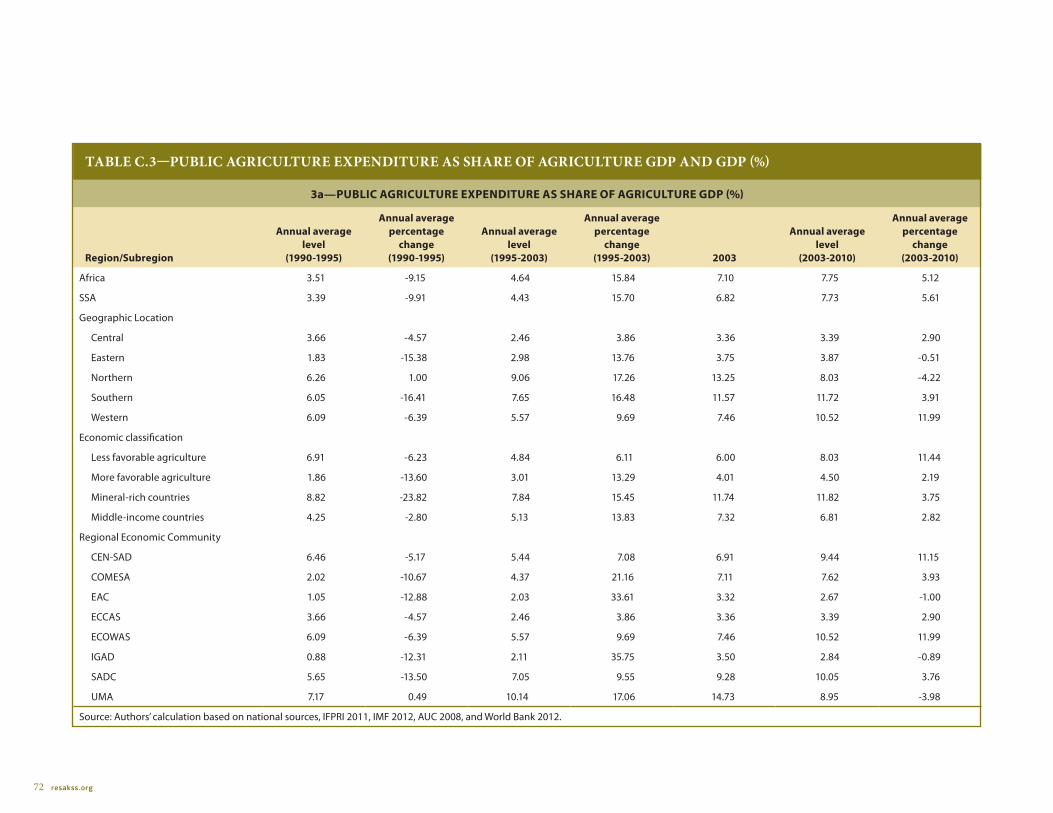
72 resakss.org
TABlE C.3—PuBliC AgRiCulTuRE ExPEnDiTuRE AS ShARE oF AgRiCulTuRE gDP AnD gDP (%)
3a—Public Agriculture exPenditure As sHAre of Agriculture gdP (%)
region/subregion
Annual average level
(1990-1995)
Annual average percentage
change (1990-1995)
Annual average level
(1995-2003)
Annual average percentage
change (1995-2003) 2003
Annual average level
(2003-2010)
Annual average percentage
change (2003-2010)
Africa 3.51 -9.15 4.64 15.84 7.10 7.75 5.12
SSA 3.39 -9.91 4.43 15.70 6.82 7.73 5.61
Geographic Location
Central 3.66 -4.57 2.46 3.86 3.36 3.39 2.90
Eastern 1.83 -15.38 2.98 13.76 3.75 3.87 -0.51
Northern 6.26 1.00 9.06 17.26 13.25 8.03 -4.22
Southern 6.05 -16.41 7.65 16.48 11.57 11.72 3.91
Western 6.09 -6.39 5.57 9.69 7.46 10.52 11.99
Economic classification
Less favorable agriculture 6.91 -6.23 4.84 6.11 6.00 8.03 11.44
More favorable agriculture 1.86 -13.60 3.01 13.29 4.01 4.50 2.19
Mineral-rich countries 8.82 -23.82 7.84 15.45 11.74 11.82 3.75
Middle-income countries 4.25 -2.80 5.13 13.83 7.32 6.81 2.82
Regional Economic Community
CEN-SAD 6.46 -5.17 5.44 7.08 6.91 9.44 11.15
COMESA 2.02 -10.67 4.37 21.16 7.11 7.62 3.93
EAC 1.05 -12.88 2.03 33.61 3.32 2.67 -1.00
ECCAS 3.66 -4.57 2.46 3.86 3.36 3.39 2.90
ECOWAS 6.09 -6.39 5.57 9.69 7.46 10.52 11.99
IGAD 0.88 -12.31 2.11 35.75 3.50 2.84 -0.89
SADC 5.65 -13.50 7.05 9.55 9.28 10.05 3.76
UMA 7.17 0.49 10.14 17.06 14.73 8.95 -3.98
Source: Authors’ calculation based on national sources, IFPRI 2011, IMF 2012, AUC 2008, and World Bank 2012.

2011 ReSAKSS Annual Trends and Outlook Report 73
TABlE C.3—PuBliC AgRiCulTuRE ExPEnDiTuRE AS ShARE oF AgRiCulTuRE gDP AnD gDP (%)—Continued
3b—Public Agriculture exPenditure As sHAre of gdP (%)
region/subregion
Annual average level
(1990-1995)
Annual average percentage
change (1990-1995)
Annual average level
(1995-2003)
Annual average percentage
change (1995-2003) 2003
Annual average level
(2003-2010)
Annual average percentage
change (2003-2010)
Africa 0.52 -7.77 0.62 12.96 0.88 0.90 2.79
SSA 0.50 -8.32 0.60 12.74 0.85 0.91 3.24
Geographic Location
Central 0.50 -7.29 0.29 -0.35 0.32 0.24 -5.02
Eastern 0.55 -15.40 0.61 5.41 0.61 0.61 -1.85
Northern 0.73 -2.20 0.97 16.00 1.38 0.75 -6.23
Southern 0.79 -6.33 1.50 20.80 2.37 2.27 1.23
Western 0.46 -8.05 0.38 7.40 0.47 0.54 5.60
Economic classification
Less favorable agriculture 1.94 -4.70 1.26 2.88 1.35 1.56 7.03
More favorable agriculture 0.51 -12.62 0.62 6.25 0.68 0.74 1.02
Mineral-rich countries 0.25 17.77 0.94 26.56 1.66 1.62 1.10
Middle-income countries 0.33 -7.79 0.32 11.02 0.41 0.29 -3.25
Regional Economic Community
CEN-SAD 0.50 -6.02 0.39 4.92 0.45 0.50 4.81
COMESA 0.74 -12.85 1.15 15.17 1.63 1.65 1.46
EAC 0.49 -13.20 0.59 23.24 0.81 0.62 -3.16
ECCAS 0.48 -7.21 0.27 -0.85 0.29 0.21 -6.55
ECOWAS 0.46 -8.05 0.38 7.40 0.47 0.54 5.60
IGAD 0.43 -13.25 0.63 25.03 0.88 0.70 -2.22
SADC 0.77 -13.69 1.06 10.79 1.42 1.50 1.98
UMA 0.80 -2.59 1.05 15.84 1.48 0.80 -6.01
Source: Authors’ calculation based on national sources, IFPRI 2011, IMF 2012, AUC 2008, and World Bank 2012.
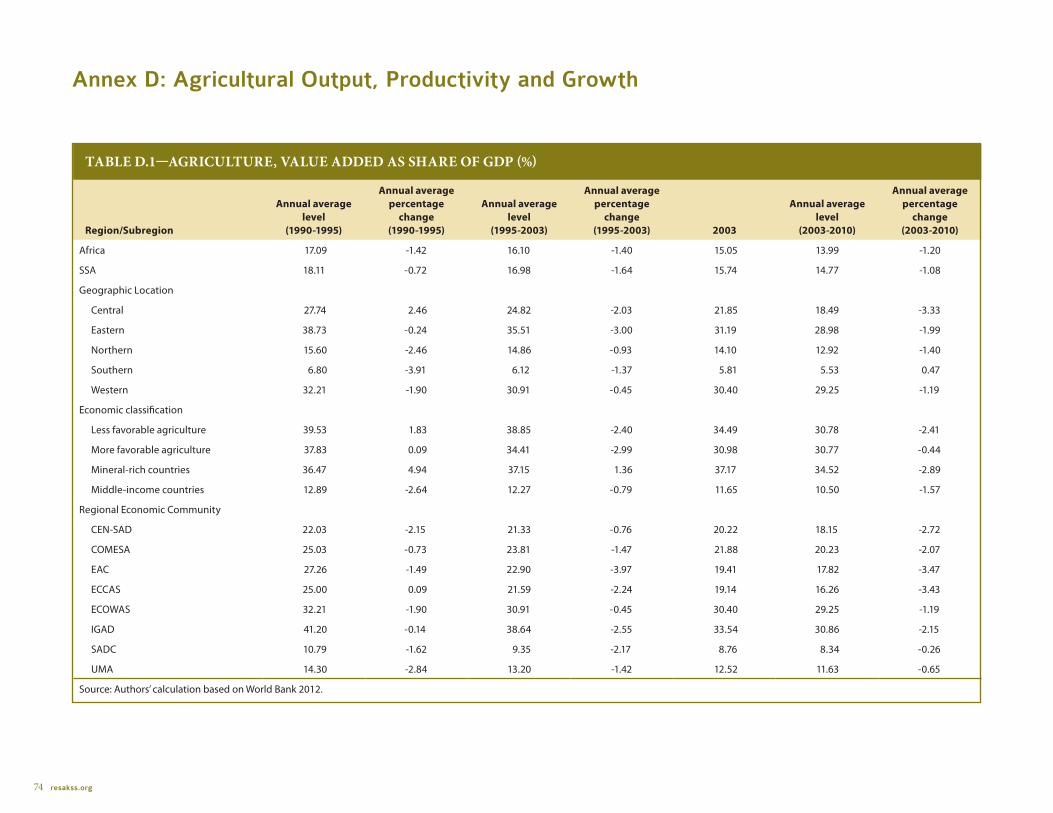
74 resakss.org
Annex D: Agricultural Output, Productivity and Growth
TABlE D.1—AgRiCulTuRE, vAluE ADDED AS ShARE oF gDP (%)
region/subregion
Annual average level
(1990-1995)
Annual average percentage
change (1990-1995)
Annual average level
(1995-2003)
Annual average percentage
change (1995-2003) 2003
Annual average level
(2003-2010)
Annual average percentage
change (2003-2010)
Africa 17.09 -1.42 16.10 -1.40 15.05 13.99 -1.20
SSA 18.11 -0.72 16.98 -1.64 15.74 14.77 -1.08
Geographic Location
Central 27.74 2.46 24.82 -2.03 21.85 18.49 -3.33
Eastern 38.73 -0.24 35.51 -3.00 31.19 28.98 -1.99
Northern 15.60 -2.46 14.86 -0.93 14.10 12.92 -1.40
Southern 6.80 -3.91 6.12 -1.37 5.81 5.53 0.47
Western 32.21 -1.90 30.91 -0.45 30.40 29.25 -1.19
Economic classification
Less favorable agriculture 39.53 1.83 38.85 -2.40 34.49 30.78 -2.41
More favorable agriculture 37.83 0.09 34.41 -2.99 30.98 30.77 -0.44
Mineral-rich countries 36.47 4.94 37.15 1.36 37.17 34.52 -2.89
Middle-income countries 12.89 -2.64 12.27 -0.79 11.65 10.50 -1.57
Regional Economic Community
CEN-SAD 22.03 -2.15 21.33 -0.76 20.22 18.15 -2.72
COMESA 25.03 -0.73 23.81 -1.47 21.88 20.23 -2.07
EAC 27.26 -1.49 22.90 -3.97 19.41 17.82 -3.47
ECCAS 25.00 0.09 21.59 -2.24 19.14 16.26 -3.43
ECOWAS 32.21 -1.90 30.91 -0.45 30.40 29.25 -1.19
IGAD 41.20 -0.14 38.64 -2.55 33.54 30.86 -2.15
SADC 10.79 -1.62 9.35 -2.17 8.76 8.34 -0.26
UMA 14.30 -2.84 13.20 -1.42 12.52 11.63 -0.65
Source: Authors’ calculation based on World Bank 2012.
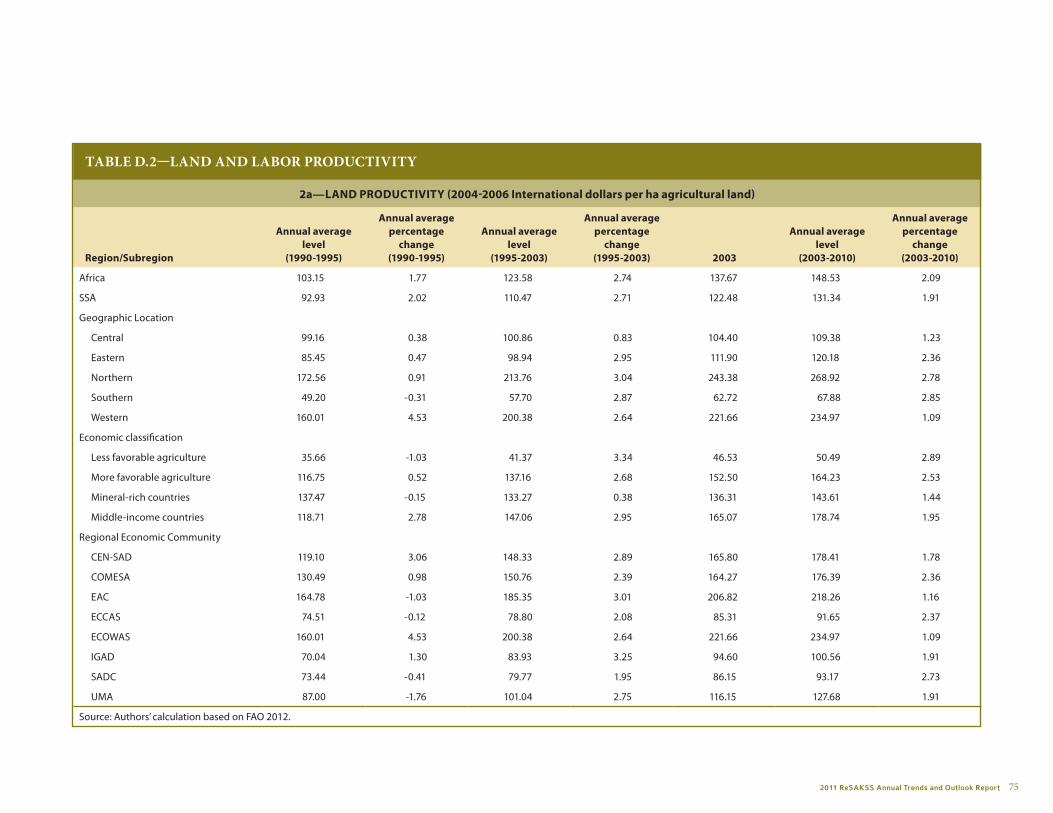
2011 ReSAKSS Annual Trends and Outlook Report 75
TABlE D.2—lAnD AnD lABoR PRoDuCTiviTy
2a—lAnd Productivity (2004-2006 international dollars per ha agricultural land)
region/subregion
Annual average level
(1990-1995)
Annual average percentage
change (1990-1995)
Annual average level
(1995-2003)
Annual average percentage
change (1995-2003) 2003
Annual average level
(2003-2010)
Annual average percentage
change (2003-2010)
Africa 103.15 1.77 123.58 2.74 137.67 148.53 2.09
SSA 92.93 2.02 110.47 2.71 122.48 131.34 1.91
Geographic Location
Central 99.16 0.38 100.86 0.83 104.40 109.38 1.23
Eastern 85.45 0.47 98.94 2.95 111.90 120.18 2.36
Northern 172.56 0.91 213.76 3.04 243.38 268.92 2.78
Southern 49.20 -0.31 57.70 2.87 62.72 67.88 2.85
Western 160.01 4.53 200.38 2.64 221.66 234.97 1.09
Economic classification
Less favorable agriculture 35.66 -1.03 41.37 3.34 46.53 50.49 2.89
More favorable agriculture 116.75 0.52 137.16 2.68 152.50 164.23 2.53
Mineral-rich countries 137.47 -0.15 133.27 0.38 136.31 143.61 1.44
Middle-income countries 118.71 2.78 147.06 2.95 165.07 178.74 1.95
Regional Economic Community
CEN-SAD 119.10 3.06 148.33 2.89 165.80 178.41 1.78
COMESA 130.49 0.98 150.76 2.39 164.27 176.39 2.36
EAC 164.78 -1.03 185.35 3.01 206.82 218.26 1.16
ECCAS 74.51 -0.12 78.80 2.08 85.31 91.65 2.37
ECOWAS 160.01 4.53 200.38 2.64 221.66 234.97 1.09
IGAD 70.04 1.30 83.93 3.25 94.60 100.56 1.91
SADC 73.44 -0.41 79.77 1.95 86.15 93.17 2.73
UMA 87.00 -1.76 101.04 2.75 116.15 127.68 1.91
Source: Authors’ calculation based on FAO 2012.

76 resakss.org
TABlE D.2— lAnD AnD lABoR PRoDuCTiviTy—Continued
2b—lAbor Productivity (2004-2006 international dollars per agricultural worker)
region/subregion
Annual average level
(1990-1995)
Annual average percentage
change (1990-1995)
Annual average level
(1995-2003)
Annual average percentage
change (1995-2003) 2003
Annual average level
(2003-2010)
Annual average percentage
change (2003-2010)
Africa 735.15 0.24 791.64 1.14 830.77 856.85 0.50
SSA 630.85 0.39 670.73 1.04 698.73 714.68 0.22
Geographic Location
Central 498.49 -1.63 457.96 -0.56 445.84 445.62 -0.27
Eastern 430.71 -1.19 433.57 0.71 451.55 455.79 0.18
Northern 1856.62 0.48 2207.81 2.41 2456.06 2689.48 2.62
Southern 740.52 -2.29 776.06 1.37 798.88 826.37 1.30
Western 971.59 3.55 1144.34 1.91 1235.12 1288.74 0.24
Economic classification
Less favorable agriculture 503.27 -1.05 525.59 0.66 534.21 544.25 0.72
More favorable agriculture 367.27 -1.86 375.84 0.93 390.72 397.80 0.63
Mineral-rich countries 430.94 -2.53 373.91 -0.81 364.99 367.77 -0.13
Middle-income countries 1426.95 2.12 1678.53 2.22 1840.29 1961.07 1.31
Regional Economic Community
CEN-SAD 1020.16 1.95 1177.51 1.83 1267.10 1326.66 0.73
COMESA 569.84 -0.30 592.16 0.64 603.38 614.54 0.53
EAC 589.91 -2.77 567.49 0.55 581.71 576.51 -0.90
ECCAS 457.50 -1.57 428.65 -0.05 427.39 433.38 0.51
ECOWAS 971.59 3.55 1144.34 1.91 1235.12 1288.74 0.24
IGAD 435.48 -0.49 449.44 0.85 465.13 466.54 -0.14
SADC 569.13 -2.72 549.07 0.47 557.52 568.25 0.78
UMA 1780.57 -3.29 1892.41 1.91 2120.82 2304.52 1.73
Source: Authors’ calculation based on FAO 2012.
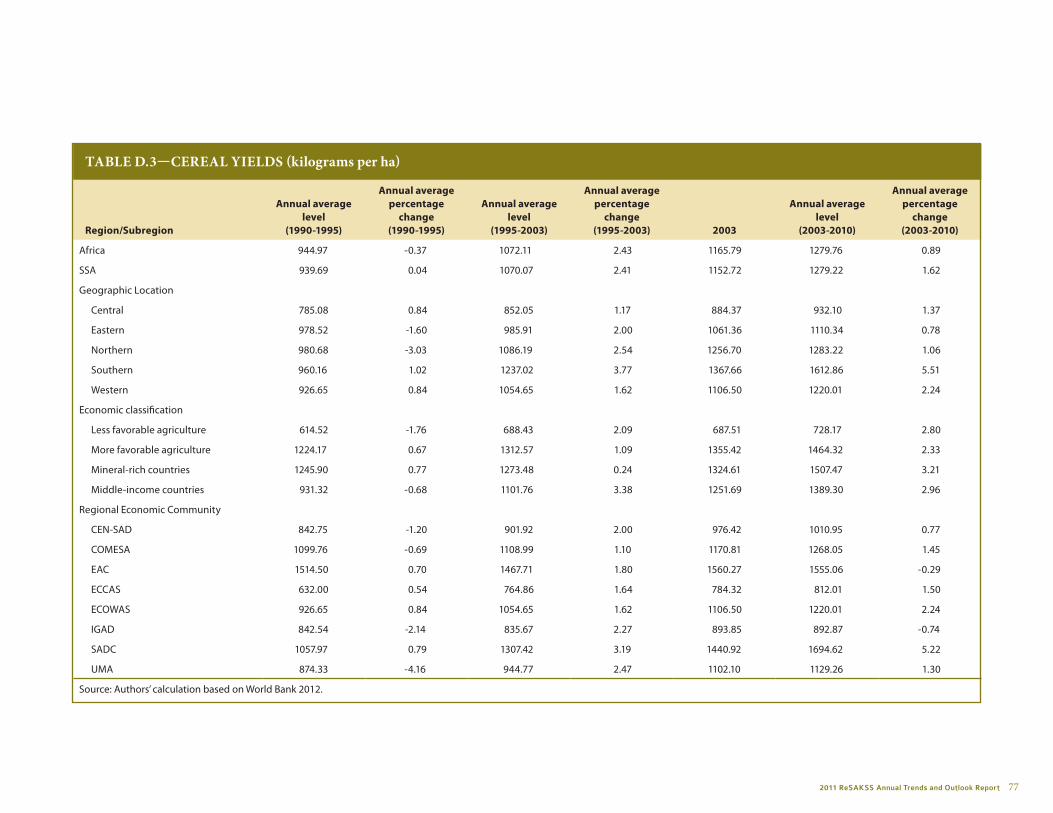
2011 ReSAKSS Annual Trends and Outlook Report 77
TABlE D.3—CEREAl yiElDS (kilograms per ha)
region/subregion
Annual average level
(1990-1995)
Annual average percentage
change (1990-1995)
Annual average level
(1995-2003)
Annual average percentage
change (1995-2003) 2003
Annual average level
(2003-2010)
Annual average percentage
change (2003-2010)
Africa 944.97 -0.37 1072.11 2.43 1165.79 1279.76 0.89
SSA 939.69 0.04 1070.07 2.41 1152.72 1279.22 1.62
Geographic Location
Central 785.08 0.84 852.05 1.17 884.37 932.10 1.37
Eastern 978.52 -1.60 985.91 2.00 1061.36 1110.34 0.78
Northern 980.68 -3.03 1086.19 2.54 1256.70 1283.22 1.06
Southern 960.16 1.02 1237.02 3.77 1367.66 1612.86 5.51
Western 926.65 0.84 1054.65 1.62 1106.50 1220.01 2.24
Economic classification
Less favorable agriculture 614.52 -1.76 688.43 2.09 687.51 728.17 2.80
More favorable agriculture 1224.17 0.67 1312.57 1.09 1355.42 1464.32 2.33
Mineral-rich countries 1245.90 0.77 1273.48 0.24 1324.61 1507.47 3.21
Middle-income countries 931.32 -0.68 1101.76 3.38 1251.69 1389.30 2.96
Regional Economic Community
CEN-SAD 842.75 -1.20 901.92 2.00 976.42 1010.95 0.77
COMESA 1099.76 -0.69 1108.99 1.10 1170.81 1268.05 1.45
EAC 1514.50 0.70 1467.71 1.80 1560.27 1555.06 -0.29
ECCAS 632.00 0.54 764.86 1.64 784.32 812.01 1.50
ECOWAS 926.65 0.84 1054.65 1.62 1106.50 1220.01 2.24
IGAD 842.54 -2.14 835.67 2.27 893.85 892.87 -0.74
SADC 1057.97 0.79 1307.42 3.19 1440.92 1694.62 5.22
UMA 874.33 -4.16 944.77 2.47 1102.10 1129.26 1.30
Source: Authors’ calculation based on World Bank 2012.
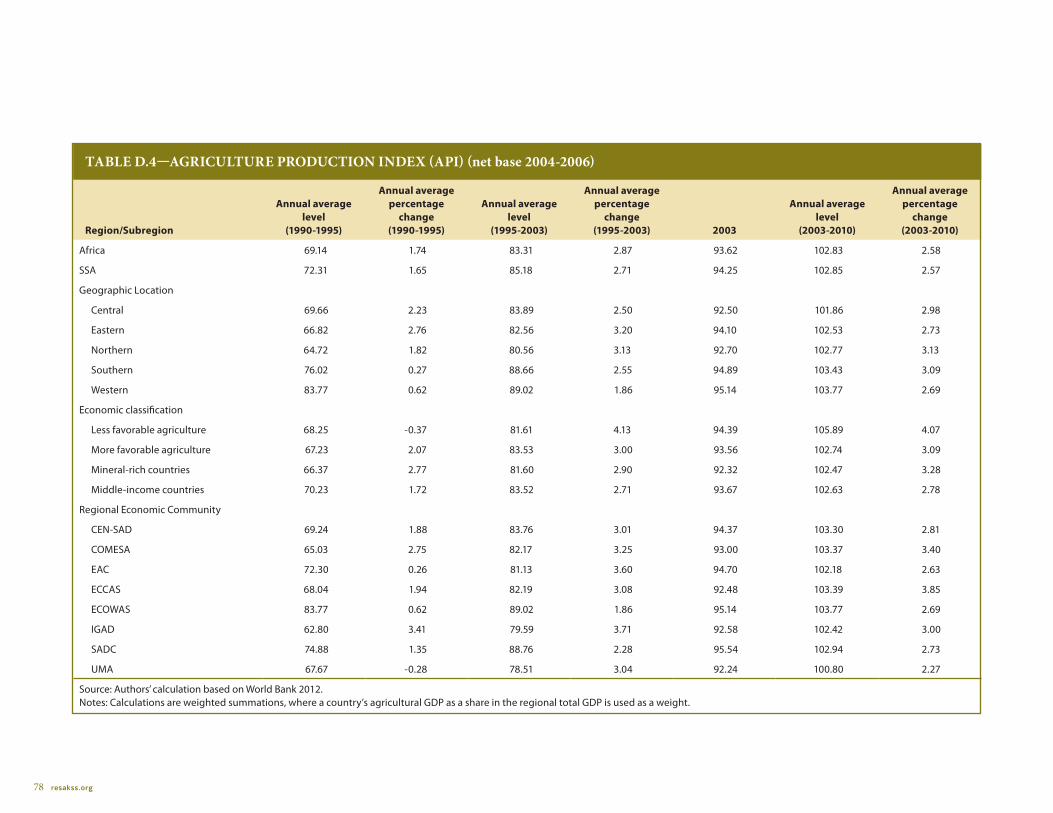
78 resakss.org
TABlE D.4—AgRiCulTuRE PRoDuCTion inDEx (APi) (net base 2004-2006)
region/subregion
Annual average level
(1990-1995)
Annual average percentage
change (1990-1995)
Annual average level
(1995-2003)
Annual average percentage
change (1995-2003) 2003
Annual average level
(2003-2010)
Annual average percentage
change (2003-2010)
Africa 69.14 1.74 83.31 2.87 93.62 102.83 2.58
SSA 72.31 1.65 85.18 2.71 94.25 102.85 2.57
Geographic Location
Central 69.66 2.23 83.89 2.50 92.50 101.86 2.98
Eastern 66.82 2.76 82.56 3.20 94.10 102.53 2.73
Northern 64.72 1.82 80.56 3.13 92.70 102.77 3.13
Southern 76.02 0.27 88.66 2.55 94.89 103.43 3.09
Western 83.77 0.62 89.02 1.86 95.14 103.77 2.69
Economic classification
Less favorable agriculture 68.25 -0.37 81.61 4.13 94.39 105.89 4.07
More favorable agriculture 67.23 2.07 83.53 3.00 93.56 102.74 3.09
Mineral-rich countries 66.37 2.77 81.60 2.90 92.32 102.47 3.28
Middle-income countries 70.23 1.72 83.52 2.71 93.67 102.63 2.78
Regional Economic Community
CEN-SAD 69.24 1.88 83.76 3.01 94.37 103.30 2.81
COMESA 65.03 2.75 82.17 3.25 93.00 103.37 3.40
EAC 72.30 0.26 81.13 3.60 94.70 102.18 2.63
ECCAS 68.04 1.94 82.19 3.08 92.48 103.39 3.85
ECOWAS 83.77 0.62 89.02 1.86 95.14 103.77 2.69
IGAD 62.80 3.41 79.59 3.71 92.58 102.42 3.00
SADC 74.88 1.35 88.76 2.28 95.54 102.94 2.73
UMA 67.67 -0.28 78.51 3.04 92.24 100.80 2.27
Source: Authors’ calculation based on World Bank 2012.Notes: Calculations are weighted summations, where a country’s agricultural GDP as a share in the regional total GDP is used as a weight.
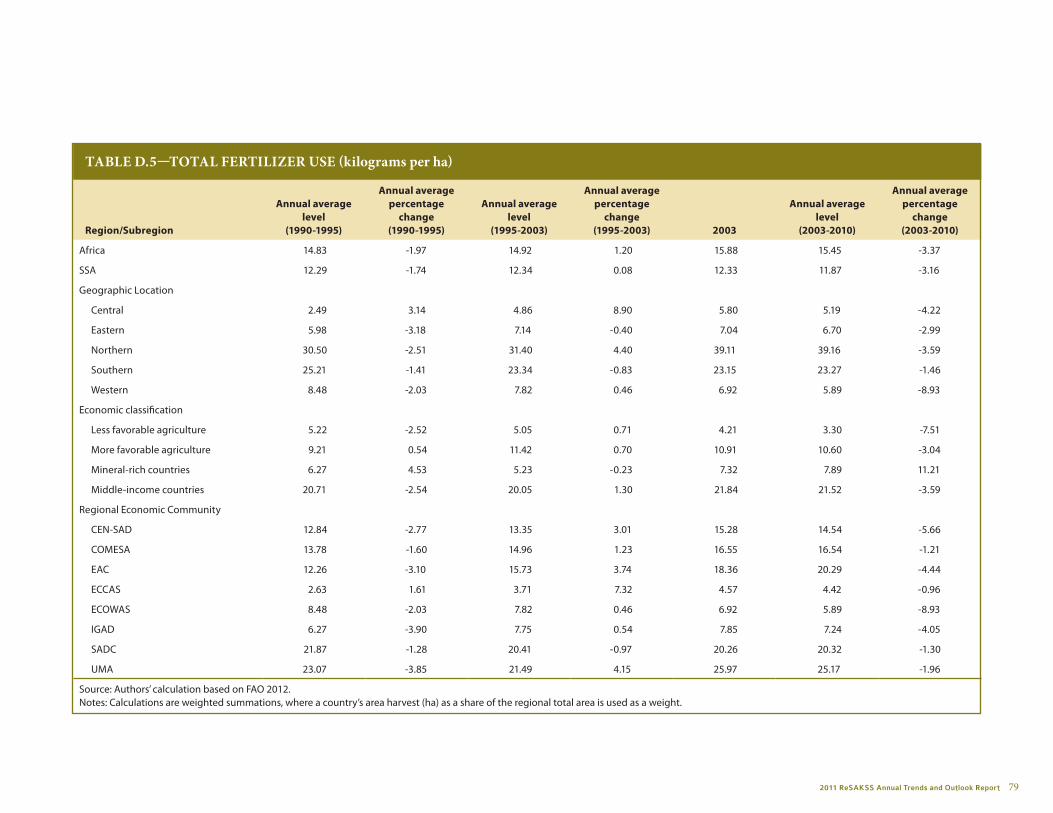
2011 ReSAKSS Annual Trends and Outlook Report 79
TABlE D.5—ToTAl FERTilizER uSE (kilograms per ha)
region/subregion
Annual average level
(1990-1995)
Annual average percentage
change (1990-1995)
Annual average level
(1995-2003)
Annual average percentage
change (1995-2003) 2003
Annual average level
(2003-2010)
Annual average percentage
change (2003-2010)
Africa 14.83 -1.97 14.92 1.20 15.88 15.45 -3.37
SSA 12.29 -1.74 12.34 0.08 12.33 11.87 -3.16
Geographic Location
Central 2.49 3.14 4.86 8.90 5.80 5.19 -4.22
Eastern 5.98 -3.18 7.14 -0.40 7.04 6.70 -2.99
Northern 30.50 -2.51 31.40 4.40 39.11 39.16 -3.59
Southern 25.21 -1.41 23.34 -0.83 23.15 23.27 -1.46
Western 8.48 -2.03 7.82 0.46 6.92 5.89 -8.93
Economic classification
Less favorable agriculture 5.22 -2.52 5.05 0.71 4.21 3.30 -7.51
More favorable agriculture 9.21 0.54 11.42 0.70 10.91 10.60 -3.04
Mineral-rich countries 6.27 4.53 5.23 -0.23 7.32 7.89 11.21
Middle-income countries 20.71 -2.54 20.05 1.30 21.84 21.52 -3.59
Regional Economic Community
CEN-SAD 12.84 -2.77 13.35 3.01 15.28 14.54 -5.66
COMESA 13.78 -1.60 14.96 1.23 16.55 16.54 -1.21
EAC 12.26 -3.10 15.73 3.74 18.36 20.29 -4.44
ECCAS 2.63 1.61 3.71 7.32 4.57 4.42 -0.96
ECOWAS 8.48 -2.03 7.82 0.46 6.92 5.89 -8.93
IGAD 6.27 -3.90 7.75 0.54 7.85 7.24 -4.05
SADC 21.87 -1.28 20.41 -0.97 20.26 20.32 -1.30
UMA 23.07 -3.85 21.49 4.15 25.97 25.17 -1.96
Source: Authors’ calculation based on FAO 2012. Notes: Calculations are weighted summations, where a country’s area harvest (ha) as a share of the regional total area is used as a weight.
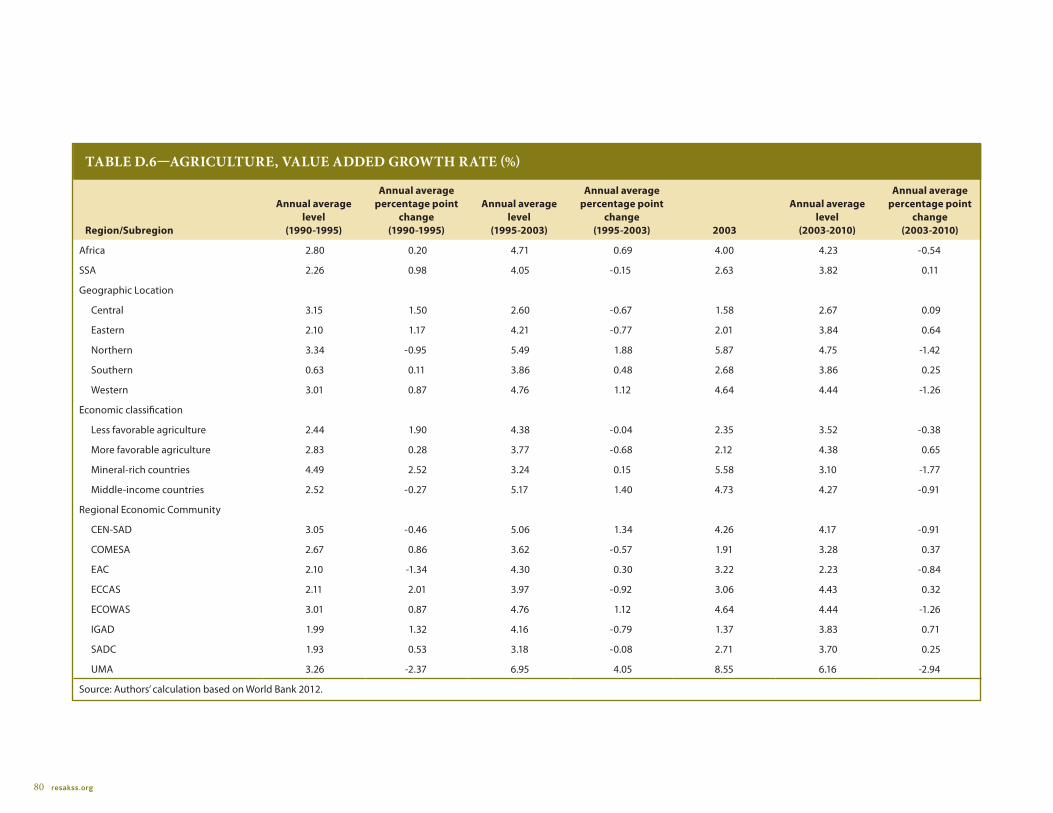
80 resakss.org
TABlE D.6—AgRiCulTuRE, vAluE ADDED gRowTh RATE (%)
region/subregion
Annual average level
(1990-1995)
Annual average percentage point
change (1990-1995)
Annual average level
(1995-2003)
Annual average percentage point
change (1995-2003) 2003
Annual average level
(2003-2010)
Annual average percentage point
change (2003-2010)
Africa 2.80 0.20 4.71 0.69 4.00 4.23 -0.54
SSA 2.26 0.98 4.05 -0.15 2.63 3.82 0.11
Geographic Location
Central 3.15 1.50 2.60 -0.67 1.58 2.67 0.09
Eastern 2.10 1.17 4.21 -0.77 2.01 3.84 0.64
Northern 3.34 -0.95 5.49 1.88 5.87 4.75 -1.42
Southern 0.63 0.11 3.86 0.48 2.68 3.86 0.25
Western 3.01 0.87 4.76 1.12 4.64 4.44 -1.26
Economic classification
Less favorable agriculture 2.44 1.90 4.38 -0.04 2.35 3.52 -0.38
More favorable agriculture 2.83 0.28 3.77 -0.68 2.12 4.38 0.65
Mineral-rich countries 4.49 2.52 3.24 0.15 5.58 3.10 -1.77
Middle-income countries 2.52 -0.27 5.17 1.40 4.73 4.27 -0.91
Regional Economic Community
CEN-SAD 3.05 -0.46 5.06 1.34 4.26 4.17 -0.91
COMESA 2.67 0.86 3.62 -0.57 1.91 3.28 0.37
EAC 2.10 -1.34 4.30 0.30 3.22 2.23 -0.84
ECCAS 2.11 2.01 3.97 -0.92 3.06 4.43 0.32
ECOWAS 3.01 0.87 4.76 1.12 4.64 4.44 -1.26
IGAD 1.99 1.32 4.16 -0.79 1.37 3.83 0.71
SADC 1.93 0.53 3.18 -0.08 2.71 3.70 0.25
UMA 3.26 -2.37 6.95 4.05 8.55 6.16 -2.94
Source: Authors’ calculation based on World Bank 2012.
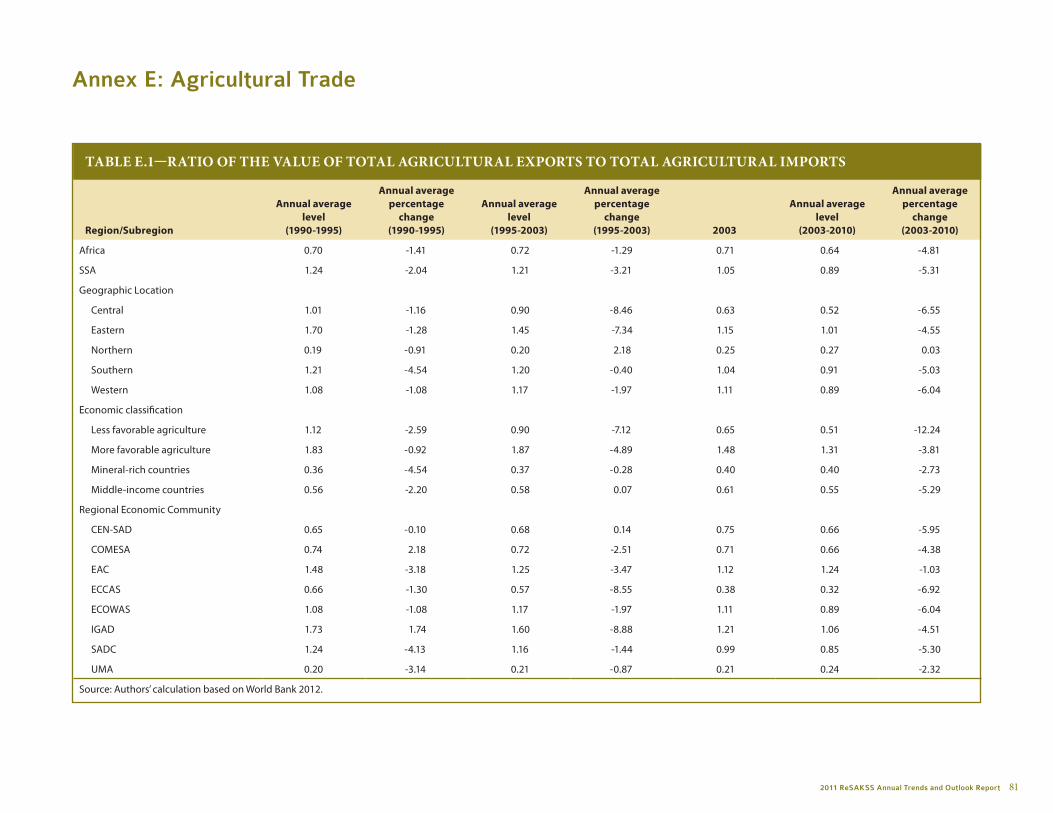
2011 ReSAKSS Annual Trends and Outlook Report 81
Annex E: Agricultural Trade
TABlE E.1—RATio oF ThE vAluE oF ToTAl AgRiCulTuRAl ExPoRTS To ToTAl AgRiCulTuRAl imPoRTS
region/subregion
Annual average level
(1990-1995)
Annual average percentage
change (1990-1995)
Annual average level
(1995-2003)
Annual average percentage
change (1995-2003) 2003
Annual average level
(2003-2010)
Annual average percentage
change (2003-2010)
Africa 0.70 -1.41 0.72 -1.29 0.71 0.64 -4.81
SSA 1.24 -2.04 1.21 -3.21 1.05 0.89 -5.31
Geographic Location
Central 1.01 -1.16 0.90 -8.46 0.63 0.52 -6.55
Eastern 1.70 -1.28 1.45 -7.34 1.15 1.01 -4.55
Northern 0.19 -0.91 0.20 2.18 0.25 0.27 0.03
Southern 1.21 -4.54 1.20 -0.40 1.04 0.91 -5.03
Western 1.08 -1.08 1.17 -1.97 1.11 0.89 -6.04
Economic classification
Less favorable agriculture 1.12 -2.59 0.90 -7.12 0.65 0.51 -12.24
More favorable agriculture 1.83 -0.92 1.87 -4.89 1.48 1.31 -3.81
Mineral-rich countries 0.36 -4.54 0.37 -0.28 0.40 0.40 -2.73
Middle-income countries 0.56 -2.20 0.58 0.07 0.61 0.55 -5.29
Regional Economic Community
CEN-SAD 0.65 -0.10 0.68 0.14 0.75 0.66 -5.95
COMESA 0.74 2.18 0.72 -2.51 0.71 0.66 -4.38
EAC 1.48 -3.18 1.25 -3.47 1.12 1.24 -1.03
ECCAS 0.66 -1.30 0.57 -8.55 0.38 0.32 -6.92
ECOWAS 1.08 -1.08 1.17 -1.97 1.11 0.89 -6.04
IGAD 1.73 1.74 1.60 -8.88 1.21 1.06 -4.51
SADC 1.24 -4.13 1.16 -1.44 0.99 0.85 -5.30
UMA 0.20 -3.14 0.21 -0.87 0.21 0.24 -2.32
Source: Authors’ calculation based on World Bank 2012.
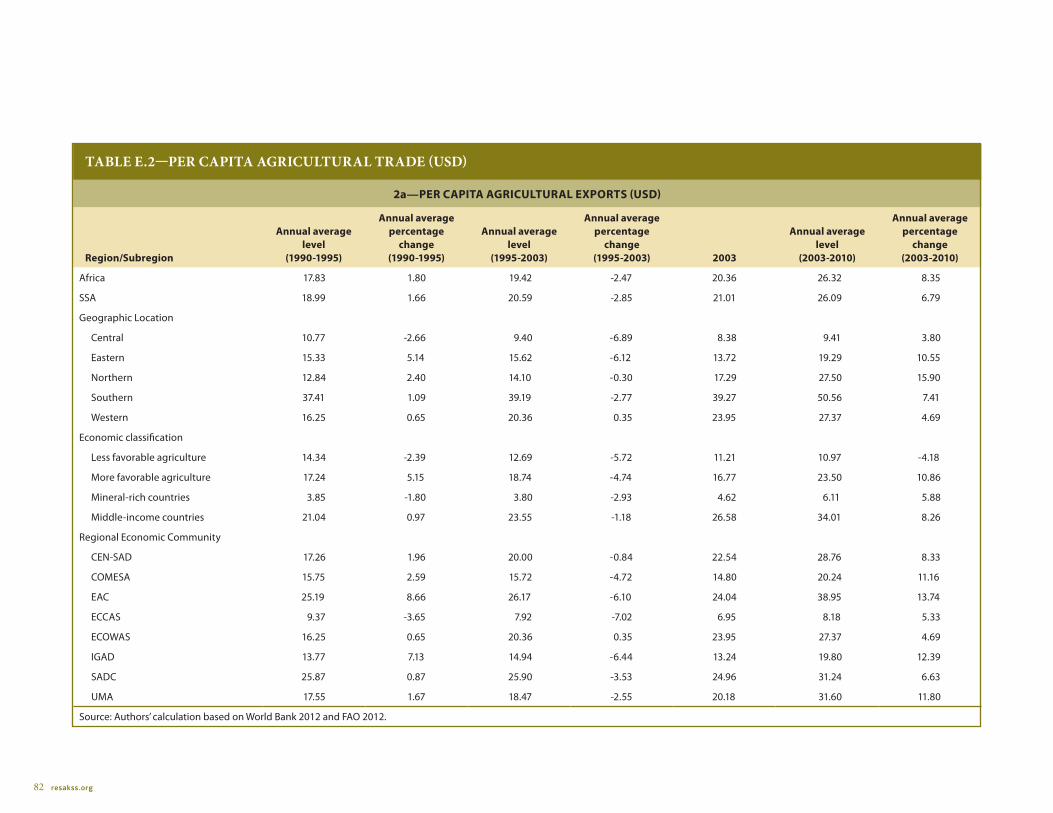
82 resakss.org
TABlE E.2—PER CAPiTA AgRiCulTuRAl TRADE (uSD)
2a—Per cAPitA AgriculturAl exPorts (usd)
region/subregion
Annual average level
(1990-1995)
Annual average percentage
change (1990-1995)
Annual average level
(1995-2003)
Annual average percentage
change (1995-2003) 2003
Annual average level
(2003-2010)
Annual average percentage
change (2003-2010)
Africa 17.83 1.80 19.42 -2.47 20.36 26.32 8.35
SSA 18.99 1.66 20.59 -2.85 21.01 26.09 6.79
Geographic Location
Central 10.77 -2.66 9.40 -6.89 8.38 9.41 3.80
Eastern 15.33 5.14 15.62 -6.12 13.72 19.29 10.55
Northern 12.84 2.40 14.10 -0.30 17.29 27.50 15.90
Southern 37.41 1.09 39.19 -2.77 39.27 50.56 7.41
Western 16.25 0.65 20.36 0.35 23.95 27.37 4.69
Economic classification
Less favorable agriculture 14.34 -2.39 12.69 -5.72 11.21 10.97 -4.18
More favorable agriculture 17.24 5.15 18.74 -4.74 16.77 23.50 10.86
Mineral-rich countries 3.85 -1.80 3.80 -2.93 4.62 6.11 5.88
Middle-income countries 21.04 0.97 23.55 -1.18 26.58 34.01 8.26
Regional Economic Community
CEN-SAD 17.26 1.96 20.00 -0.84 22.54 28.76 8.33
COMESA 15.75 2.59 15.72 -4.72 14.80 20.24 11.16
EAC 25.19 8.66 26.17 -6.10 24.04 38.95 13.74
ECCAS 9.37 -3.65 7.92 -7.02 6.95 8.18 5.33
ECOWAS 16.25 0.65 20.36 0.35 23.95 27.37 4.69
IGAD 13.77 7.13 14.94 -6.44 13.24 19.80 12.39
SADC 25.87 0.87 25.90 -3.53 24.96 31.24 6.63
UMA 17.55 1.67 18.47 -2.55 20.18 31.60 11.80
Source: Authors’ calculation based on World Bank 2012 and FAO 2012.

2011 ReSAKSS Annual Trends and Outlook Report 83
TABlE E.2— PER CAPiTA AgRiCulTuRAl TRADE (uSD)—Continued
2b—Per cAPitA AgriculturAl imPorts (usd)
region/subregion
Annual average level
(1990-1995)
Annual average percentage
change (1990-1995)
Annual average level
(1995-2003)
Annual average percentage
change (1995-2003) 2003
Annual average level
(2003-2010)
Annual average percentage
change (2003-2010)
Africa 25.40 3.26 26.78 -1.20 28.69 42.48 13.83
SSA 15.48 3.78 16.97 0.38 20.01 30.22 12.78
Geographic Location
Central 10.58 -1.52 10.61 1.72 13.42 18.64 11.07
Eastern 9.08 6.50 10.84 1.31 11.99 19.75 15.81
Northern 68.05 3.35 71.37 -2.42 69.78 102.37 15.87
Southern 31.87 5.91 32.76 -2.37 37.91 57.26 13.11
Western 15.11 1.75 17.42 2.36 21.54 31.93 11.42
Economic classification
Less favorable agriculture 12.85 0.20 14.35 1.50 17.04 22.63 9.18
More favorable agriculture 9.60 6.12 10.03 0.15 11.33 18.40 15.26
Mineral-rich countries 10.83 2.87 10.42 -2.66 11.33 15.57 8.85
Middle-income countries 37.94 3.24 40.61 -1.25 43.30 64.26 14.31
Regional Economic Community
CEN-SAD 26.52 2.06 29.26 -0.98 29.97 45.34 15.17
COMESA 21.21 0.40 21.85 -2.28 20.71 31.77 16.25
EAC 17.53 12.24 20.90 -2.73 21.25 31.83 14.92
ECCAS 14.14 -2.37 13.98 1.68 18.20 26.44 13.16
ECOWAS 15.11 1.75 17.42 2.36 21.54 31.93 11.42
IGAD 8.06 5.29 9.49 2.68 11.03 19.25 17.71
SADC 21.33 5.22 22.35 -2.13 25.32 37.77 12.60
UMA 86.94 4.97 88.52 -1.69 93.84 135.53 14.46
Source: Authors’ calculation based on World Bank 2012 and FAO 2012.
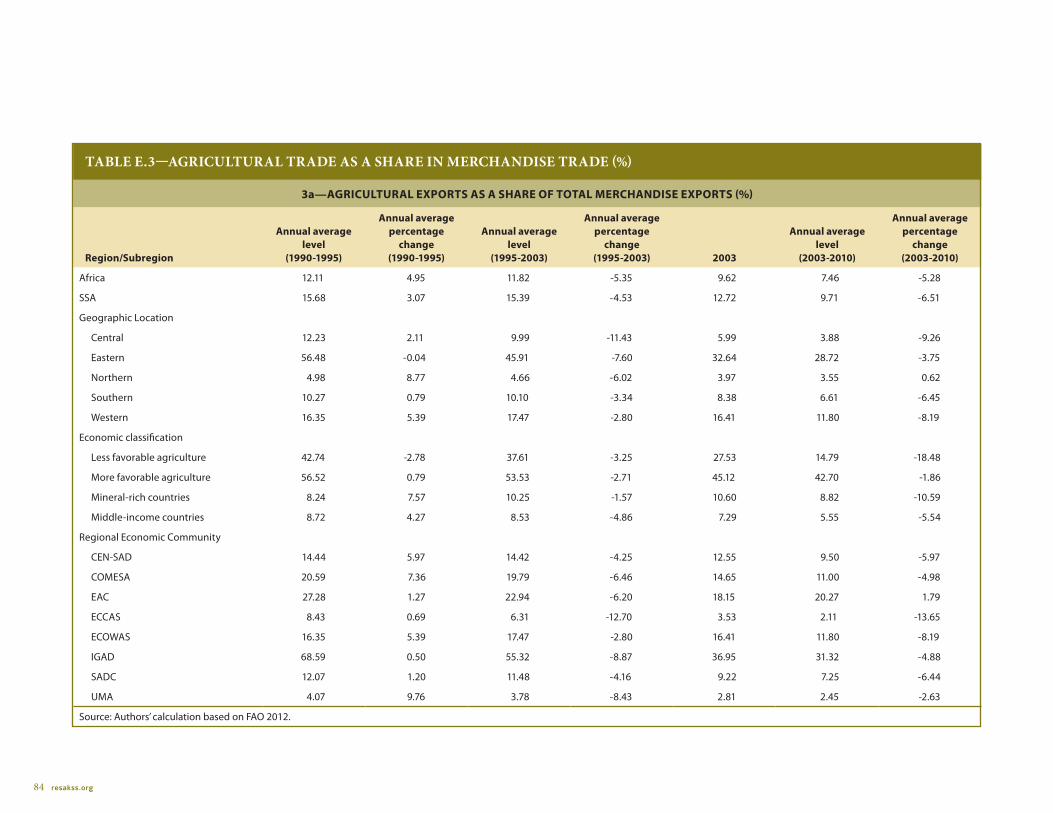
84 resakss.org
TABlE E.3—AgRiCulTuRAl TRADE AS A ShARE in mERChAnDiSE TRADE (%)
3a—AgriculturAl exPorts As A sHAre of totAl mercHAndise exPorts (%)
region/subregion
Annual average level
(1990-1995)
Annual average percentage
change (1990-1995)
Annual average level
(1995-2003)
Annual average percentage
change (1995-2003) 2003
Annual average level
(2003-2010)
Annual average percentage
change (2003-2010)
Africa 12.11 4.95 11.82 -5.35 9.62 7.46 -5.28
SSA 15.68 3.07 15.39 -4.53 12.72 9.71 -6.51
Geographic Location
Central 12.23 2.11 9.99 -11.43 5.99 3.88 -9.26
Eastern 56.48 -0.04 45.91 -7.60 32.64 28.72 -3.75
Northern 4.98 8.77 4.66 -6.02 3.97 3.55 0.62
Southern 10.27 0.79 10.10 -3.34 8.38 6.61 -6.45
Western 16.35 5.39 17.47 -2.80 16.41 11.80 -8.19
Economic classification
Less favorable agriculture 42.74 -2.78 37.61 -3.25 27.53 14.79 -18.48
More favorable agriculture 56.52 0.79 53.53 -2.71 45.12 42.70 -1.86
Mineral-rich countries 8.24 7.57 10.25 -1.57 10.60 8.82 -10.59
Middle-income countries 8.72 4.27 8.53 -4.86 7.29 5.55 -5.54
Regional Economic Community
CEN-SAD 14.44 5.97 14.42 -4.25 12.55 9.50 -5.97
COMESA 20.59 7.36 19.79 -6.46 14.65 11.00 -4.98
EAC 27.28 1.27 22.94 -6.20 18.15 20.27 1.79
ECCAS 8.43 0.69 6.31 -12.70 3.53 2.11 -13.65
ECOWAS 16.35 5.39 17.47 -2.80 16.41 11.80 -8.19
IGAD 68.59 0.50 55.32 -8.87 36.95 31.32 -4.88
SADC 12.07 1.20 11.48 -4.16 9.22 7.25 -6.44
UMA 4.07 9.76 3.78 -8.43 2.81 2.45 -2.63
Source: Authors’ calculation based on FAO 2012.
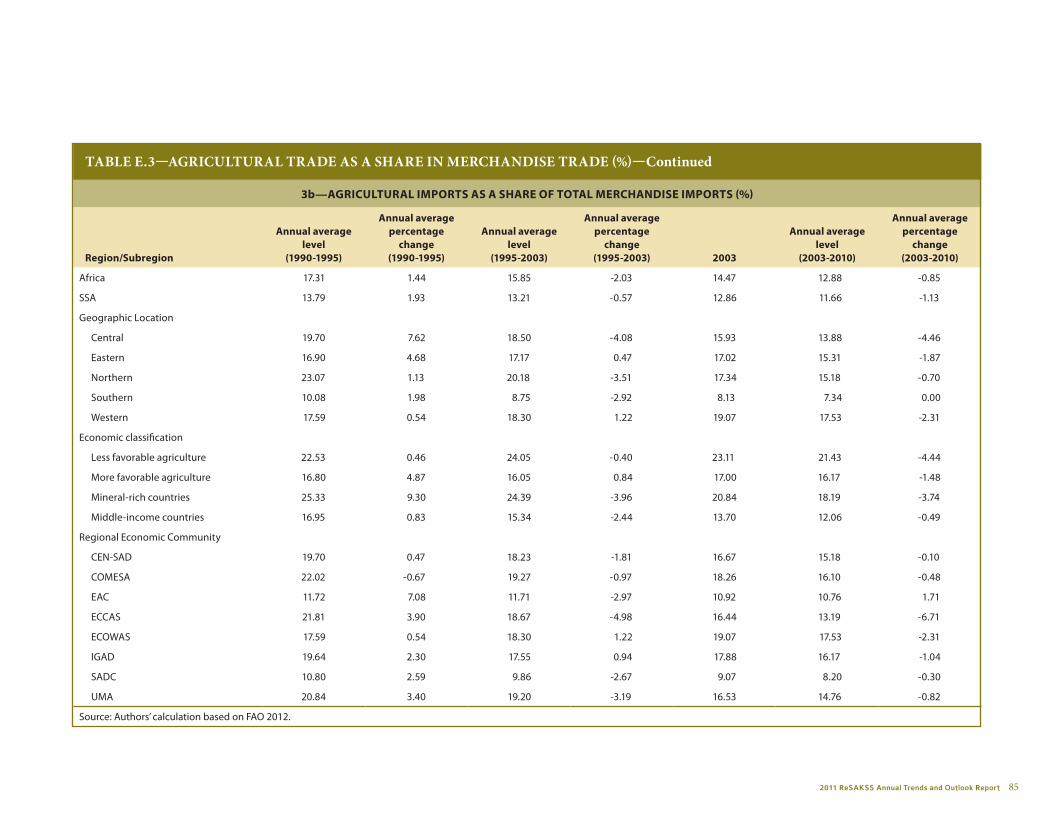
2011 ReSAKSS Annual Trends and Outlook Report 85
TABlE E.3—AgRiCulTuRAl TRADE AS A ShARE in mERChAnDiSE TRADE (%)—Continued
3b—AgriculturAl imPorts As A sHAre of totAl mercHAndise imPorts (%)
region/subregion
Annual average level
(1990-1995)
Annual average percentage
change (1990-1995)
Annual average level
(1995-2003)
Annual average percentage
change (1995-2003) 2003
Annual average level
(2003-2010)
Annual average percentage
change (2003-2010)
Africa 17.31 1.44 15.85 -2.03 14.47 12.88 -0.85
SSA 13.79 1.93 13.21 -0.57 12.86 11.66 -1.13
Geographic Location
Central 19.70 7.62 18.50 -4.08 15.93 13.88 -4.46
Eastern 16.90 4.68 17.17 0.47 17.02 15.31 -1.87
Northern 23.07 1.13 20.18 -3.51 17.34 15.18 -0.70
Southern 10.08 1.98 8.75 -2.92 8.13 7.34 0.00
Western 17.59 0.54 18.30 1.22 19.07 17.53 -2.31
Economic classification
Less favorable agriculture 22.53 0.46 24.05 -0.40 23.11 21.43 -4.44
More favorable agriculture 16.80 4.87 16.05 0.84 17.00 16.17 -1.48
Mineral-rich countries 25.33 9.30 24.39 -3.96 20.84 18.19 -3.74
Middle-income countries 16.95 0.83 15.34 -2.44 13.70 12.06 -0.49
Regional Economic Community
CEN-SAD 19.70 0.47 18.23 -1.81 16.67 15.18 -0.10
COMESA 22.02 -0.67 19.27 -0.97 18.26 16.10 -0.48
EAC 11.72 7.08 11.71 -2.97 10.92 10.76 1.71
ECCAS 21.81 3.90 18.67 -4.98 16.44 13.19 -6.71
ECOWAS 17.59 0.54 18.30 1.22 19.07 17.53 -2.31
IGAD 19.64 2.30 17.55 0.94 17.88 16.17 -1.04
SADC 10.80 2.59 9.86 -2.67 9.07 8.20 -0.30
UMA 20.84 3.40 19.20 -3.19 16.53 14.76 -0.82
Source: Authors’ calculation based on FAO 2012.
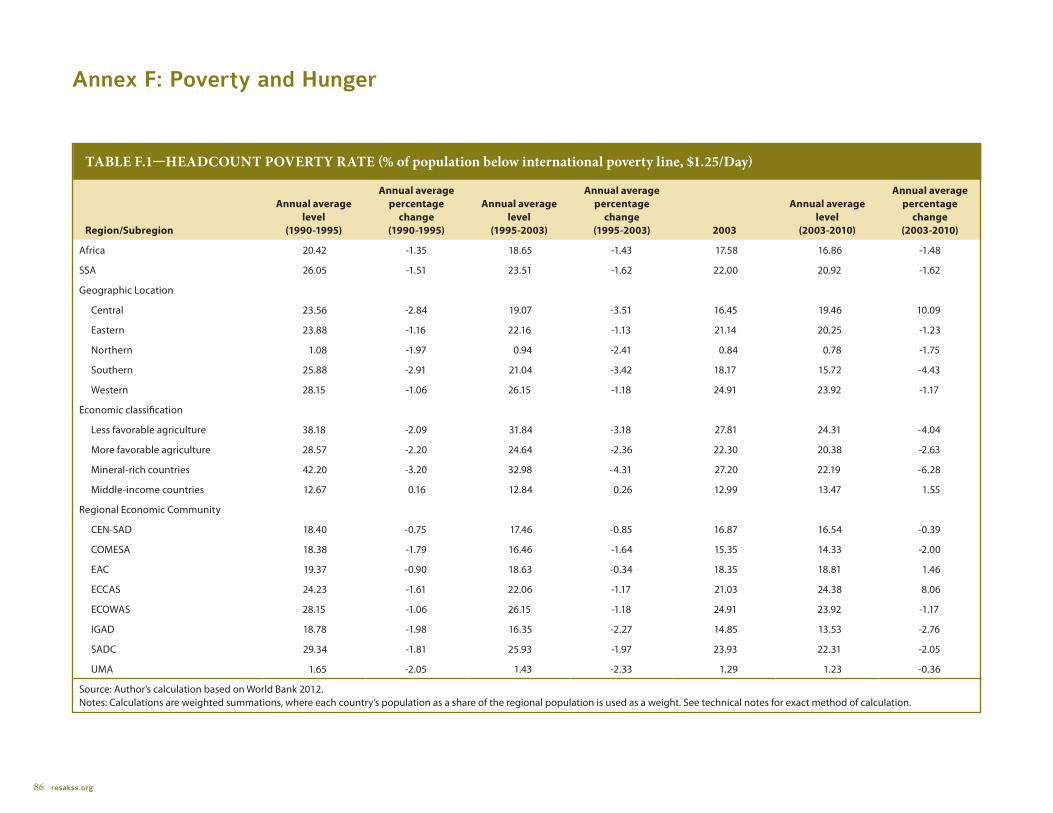
86 resakss.org
Annex F: Poverty and Hunger
TABlE F.1—hEADCounT PovERTy RATE (% of population below international poverty line, $1.25/Day)
region/subregion
Annual average level
(1990-1995)
Annual average percentage
change (1990-1995)
Annual average level
(1995-2003)
Annual average percentage
change (1995-2003) 2003
Annual average level
(2003-2010)
Annual average percentage
change (2003-2010)
Africa 20.42 -1.35 18.65 -1.43 17.58 16.86 -1.48
SSA 26.05 -1.51 23.51 -1.62 22.00 20.92 -1.62
Geographic Location
Central 23.56 -2.84 19.07 -3.51 16.45 19.46 10.09
Eastern 23.88 -1.16 22.16 -1.13 21.14 20.25 -1.23
Northern 1.08 -1.97 0.94 -2.41 0.84 0.78 -1.75
Southern 25.88 -2.91 21.04 -3.42 18.17 15.72 -4.43
Western 28.15 -1.06 26.15 -1.18 24.91 23.92 -1.17
Economic classification
Less favorable agriculture 38.18 -2.09 31.84 -3.18 27.81 24.31 -4.04
More favorable agriculture 28.57 -2.20 24.64 -2.36 22.30 20.38 -2.63
Mineral-rich countries 42.20 -3.20 32.98 -4.31 27.20 22.19 -6.28
Middle-income countries 12.67 0.16 12.84 0.26 12.99 13.47 1.55
Regional Economic Community
CEN-SAD 18.40 -0.75 17.46 -0.85 16.87 16.54 -0.39
COMESA 18.38 -1.79 16.46 -1.64 15.35 14.33 -2.00
EAC 19.37 -0.90 18.63 -0.34 18.35 18.81 1.46
ECCAS 24.23 -1.61 22.06 -1.17 21.03 24.38 8.06
ECOWAS 28.15 -1.06 26.15 -1.18 24.91 23.92 -1.17
IGAD 18.78 -1.98 16.35 -2.27 14.85 13.53 -2.76
SADC 29.34 -1.81 25.93 -1.97 23.93 22.31 -2.05
UMA 1.65 -2.05 1.43 -2.33 1.29 1.23 -0.36
Source: Author’s calculation based on World Bank 2012.Notes: Calculations are weighted summations, where each country’s population as a share of the regional population is used as a weight. See technical notes for exact method of calculation.
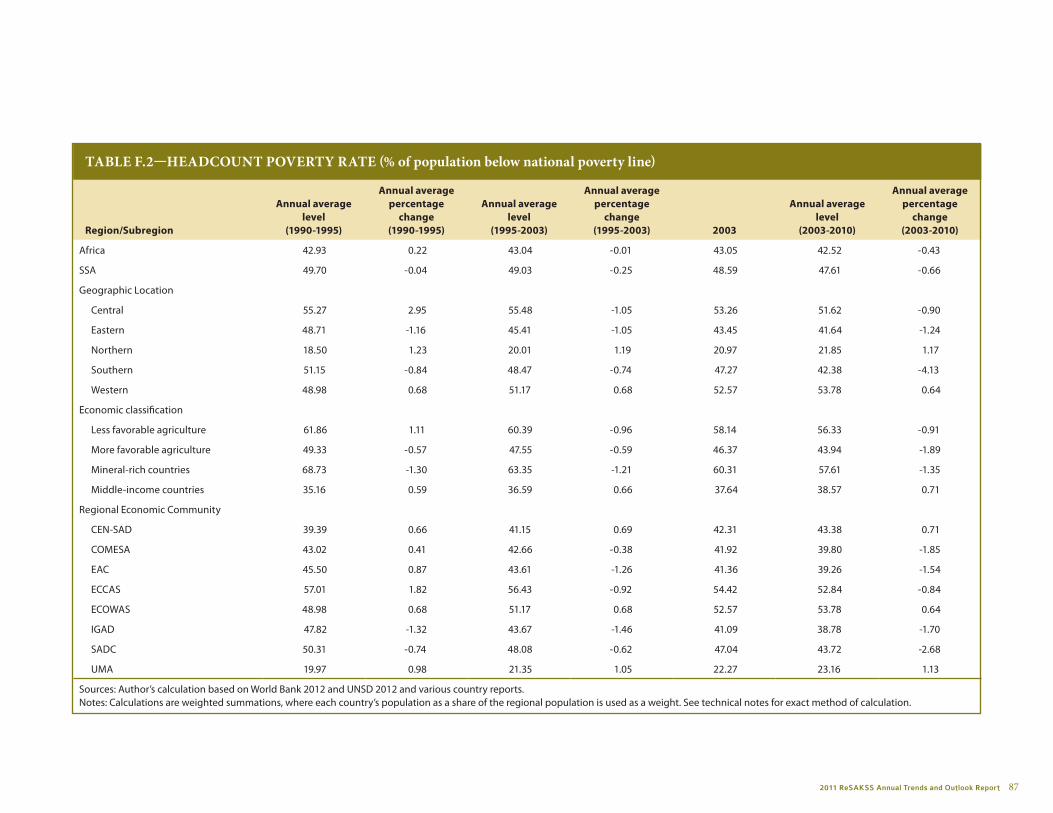
2011 ReSAKSS Annual Trends and Outlook Report 87
TABlE F.2—hEADCounT PovERTy RATE (% of population below national poverty line)
region/subregion
Annual average level
(1990-1995)
Annual average percentage
change (1990-1995)
Annual average level
(1995-2003)
Annual average percentage
change (1995-2003) 2003
Annual average level
(2003-2010)
Annual average percentage
change (2003-2010)
Africa 42.93 0.22 43.04 -0.01 43.05 42.52 -0.43
SSA 49.70 -0.04 49.03 -0.25 48.59 47.61 -0.66
Geographic Location
Central 55.27 2.95 55.48 -1.05 53.26 51.62 -0.90
Eastern 48.71 -1.16 45.41 -1.05 43.45 41.64 -1.24
Northern 18.50 1.23 20.01 1.19 20.97 21.85 1.17
Southern 51.15 -0.84 48.47 -0.74 47.27 42.38 -4.13
Western 48.98 0.68 51.17 0.68 52.57 53.78 0.64
Economic classification
Less favorable agriculture 61.86 1.11 60.39 -0.96 58.14 56.33 -0.91
More favorable agriculture 49.33 -0.57 47.55 -0.59 46.37 43.94 -1.89
Mineral-rich countries 68.73 -1.30 63.35 -1.21 60.31 57.61 -1.35
Middle-income countries 35.16 0.59 36.59 0.66 37.64 38.57 0.71
Regional Economic Community
CEN-SAD 39.39 0.66 41.15 0.69 42.31 43.38 0.71
COMESA 43.02 0.41 42.66 -0.38 41.92 39.80 -1.85
EAC 45.50 0.87 43.61 -1.26 41.36 39.26 -1.54
ECCAS 57.01 1.82 56.43 -0.92 54.42 52.84 -0.84
ECOWAS 48.98 0.68 51.17 0.68 52.57 53.78 0.64
IGAD 47.82 -1.32 43.67 -1.46 41.09 38.78 -1.70
SADC 50.31 -0.74 48.08 -0.62 47.04 43.72 -2.68
UMA 19.97 0.98 21.35 1.05 22.27 23.16 1.13
Sources: Author’s calculation based on World Bank 2012 and UNSD 2012 and various country reports. Notes: Calculations are weighted summations, where each country’s population as a share of the regional population is used as a weight. See technical notes for exact method of calculation.

88 resakss.org
TABlE F.3—PREvAlEnCE oF ChilD mAlnuTRiTion (% of children under five years of age)
region/subregion
Annual average level
(1990-1995)
Annual average percentage
change (1990-1995)
Annual average level
(1995-2003)
Annual average percentage
change (1995-2003) 2003
Annual average level
(2003-2010)
Annual average percentage
change (2003-2010)
Africa 24.68 -1.66 22.06 -1.75 20.53 19.27 -1.84
SSA 20.66 -0.88 19.48 -0.90 18.79 18.21 -0.93
Geographic Location
Central 17.74 -1.56 15.93 -1.70 14.85 13.91 -1.93
Eastern 19.59 -0.86 18.33 -1.09 17.53 16.82 -1.20
Northern 41.65 -2.97 33.56 -3.63 28.64 24.31 -5.01
Southern 18.55 -1.52 16.81 -1.50 15.80 14.91 -1.70
Western 23.99 -0.40 23.47 -0.30 23.19 23.05 -0.02
Economic classification
Less favorable agriculture 19.85 2.15 22.05 1.46 23.37 24.51 1.33
More favorable agriculture 19.29 -1.16 17.87 -1.18 17.03 16.36 -1.02
Mineral-rich countries 18.40 -2.20 15.98 -2.20 14.54 13.24 -2.75
Middle-income countries 29.16 -1.97 25.47 -2.15 23.29 21.45 -2.41
Regional Economic Community
CEN-SAD 29.39 -1.21 27.20 -1.16 25.97 25.00 -1.01
COMESA 26.98 -2.11 23.27 -2.36 21.08 19.24 -2.69
EAC 18.68 1.93 20.61 1.37 21.75 22.76 1.28
ECCAS 18.51 -0.75 17.36 -1.02 16.67 16.04 -1.11
ECOWAS 23.99 -0.40 23.47 -0.30 23.19 23.05 -0.02
IGAD 22.49 -0.97 21.01 -1.10 20.08 19.27 -1.18
SADC 16.83 -2.14 14.52 -2.38 13.12 11.85 -3.05
UMA 31.63 -3.23 24.84 -4.16 20.66 16.98 -6.09
Source: Authors’ calculations based on World Bank 2012, UNSD 2012, and FAO 2012.Notes: Child malnutrition prevalence includes children whose weight-for- age is below 2 standard deviations. Calculations are weighted summations, where each country’s population as a share of the regional population is used as a weight. See technical notes for exact method of calculation.
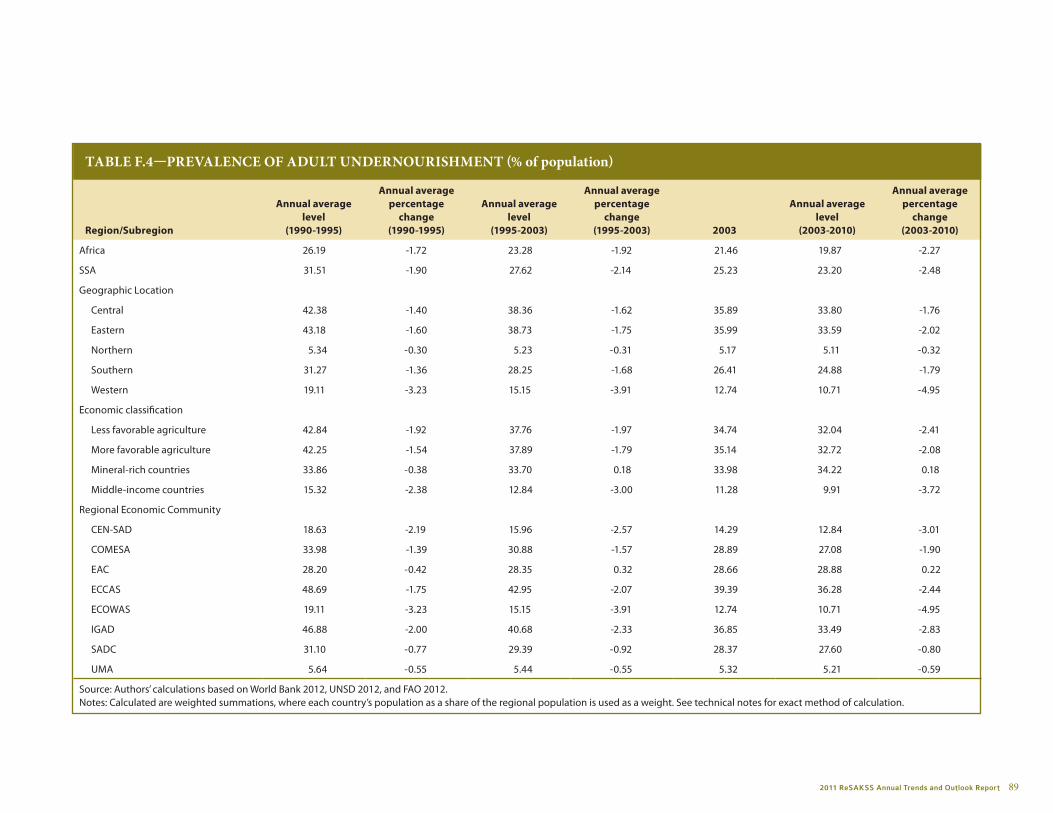
2011 ReSAKSS Annual Trends and Outlook Report 89
TABlE F.4—PREvAlEnCE oF ADulT unDERnouRiShmEnT (% of population)
region/subregion
Annual average level
(1990-1995)
Annual average percentage
change (1990-1995)
Annual average level
(1995-2003)
Annual average percentage
change (1995-2003) 2003
Annual average level
(2003-2010)
Annual average percentage
change (2003-2010)
Africa 26.19 -1.72 23.28 -1.92 21.46 19.87 -2.27
SSA 31.51 -1.90 27.62 -2.14 25.23 23.20 -2.48
Geographic Location
Central 42.38 -1.40 38.36 -1.62 35.89 33.80 -1.76
Eastern 43.18 -1.60 38.73 -1.75 35.99 33.59 -2.02
Northern 5.34 -0.30 5.23 -0.31 5.17 5.11 -0.32
Southern 31.27 -1.36 28.25 -1.68 26.41 24.88 -1.79
Western 19.11 -3.23 15.15 -3.91 12.74 10.71 -4.95
Economic classification
Less favorable agriculture 42.84 -1.92 37.76 -1.97 34.74 32.04 -2.41
More favorable agriculture 42.25 -1.54 37.89 -1.79 35.14 32.72 -2.08
Mineral-rich countries 33.86 -0.38 33.70 0.18 33.98 34.22 0.18
Middle-income countries 15.32 -2.38 12.84 -3.00 11.28 9.91 -3.72
Regional Economic Community
CEN-SAD 18.63 -2.19 15.96 -2.57 14.29 12.84 -3.01
COMESA 33.98 -1.39 30.88 -1.57 28.89 27.08 -1.90
EAC 28.20 -0.42 28.35 0.32 28.66 28.88 0.22
ECCAS 48.69 -1.75 42.95 -2.07 39.39 36.28 -2.44
ECOWAS 19.11 -3.23 15.15 -3.91 12.74 10.71 -4.95
IGAD 46.88 -2.00 40.68 -2.33 36.85 33.49 -2.83
SADC 31.10 -0.77 29.39 -0.92 28.37 27.60 -0.80
UMA 5.64 -0.55 5.44 -0.55 5.32 5.21 -0.59
Source: Authors’ calculations based on World Bank 2012, UNSD 2012, and FAO 2012.Notes: Calculated are weighted summations, where each country’s population as a share of the regional population is used as a weight. See technical notes for exact method of calculation.

90 resakss.org
TABlE F.5—moRTAliTy RATE, ChilDREn unDER FivE yEARS oF AgE (Per 1000)
region/subregion
Annual average level
(1990-1995)
Annual average percentage
change (1990-1995)
Annual average level
(1995-2003)
Annual average percentage
change (1995-2003) 2003
Annual average level
(2003-2010)
Annual average percentage
change (2003-2010)
Africa 149.26 -1.00 134.64 -2.01 123.53 113.08 -2.55
SSA 167.13 -0.65 152.93 -1.88 140.97 129.20 -2.51
Geographic Location
Central 171.71 0.11 170.62 -0.27 168.57 163.99 -1.00
Eastern 150.44 -0.72 132.96 -2.70 118.21 106.03 -3.15
Northern 72.51 -5.20 51.32 -5.29 41.00 34.44 -4.98
Southern 131.60 -0.49 128.45 -0.63 123.47 110.21 -3.84
Western 199.28 -0.92 177.76 -2.29 161.25 147.54 -2.55
Economic classification
Less favorable agriculture 211.22 0.06 188.30 -2.44 170.31 156.76 -2.36
More favorable agriculture 160.32 -1.14 141.72 -2.65 126.14 112.63 -3.34
Mineral-rich countries 191.54 -0.48 181.52 -0.97 174.76 166.27 -1.68
Middle-income countries 127.84 -1.28 115.02 -1.90 105.95 96.83 -2.68
Regional Economic Community
CEN-SAD 151.93 -1.26 134.74 -2.26 122.48 112.75 -2.36
COMESA 138.69 -1.15 122.99 -2.30 111.57 101.84 -2.70
EAC 133.82 1.46 124.79 -2.58 110.94 98.78 -3.36
ECCAS 181.69 0.59 175.89 -0.92 169.37 161.83 -1.46
ECOWAS 199.28 -0.92 177.76 -2.29 161.25 147.54 -2.55
IGAD 148.69 -1.21 133.33 -2.17 121.37 111.57 -2.41
SADC 146.55 -0.42 139.56 -1.16 132.18 120.36 -3.09
UMA 65.73 -3.84 51.66 -3.60 44.49 39.51 -3.39
Source: Authors’ calculation based on World Bank 2012.

2011 ReSAKSS Annual Trends and Outlook Report 91
TABlE F.6—gloBAl hungER inDEx
region/subregion 1990 2011
Africa 22.21 20.01
SSA 25.36 20.57
Geographic Location
Central 25.53 32.68
Eastern 29.54 22.69
Northern 7.73 6.57
Southern 20.84 15.78
Western 23.85 16.15
Economic classification
Less favorable agriculture 31.72 25.28
More favorable agriculture 28.92 21.74
Mineral-rich countries 24.70 33.06
Middle-income countries 17.08 14.29
Regional Economic Community
CEN-SAD 20.32 16.65
COMESA 24.12 26.00
EAC 22.24 19.91
ECCAS 27.93 30.70
ECOWAS 23.85 16.15
IGAD 31.73 23.36
SADC 22.04 22.65
UMA 7.64 6.57
Source: Author’s calculated based upon Von Grebmer et al. 2011.Notes: Calculations are weighted summations, where each country’s population as a share of the regional population is used as a weight. Blank cells indicate missing values.


Regional Strategic Analysis and Knowledge Support System international Food Policy Research institute
2033 K Street, NWWashington, DC 20006-1002 USA
Tel.: + 1 202.862.5600Fax: +1 202.467.4439
Email: [email protected]
978-0-89629-801-9
Related Documents