Trend following algorithms in automated derivatives market trading Simon Fong ⇑ , Yain-Whar Si, Jackie Tai Department of Computer and Information Science, University of Macau, Macau article info Keywords: Trend following Automated trading system Futures contracts Mechanical trading abstract Trend following (TF) is trading philosophy by which buying/selling decisions are made solely according to the observed market trend. For many years, many manifestations of TF such as a software program called Turtle Trader, for example, emerged in the industry. Surprisingly little has been studied in academic research about its algorithms and applications. Unlike financial forecasting, TF does not predict any mar- ket movement; instead it identifies a trend at early time of the day, and trades automatically afterwards by a pre-defined strategy regardless of the moving market directions during run time. Trend following trading has been popular among speculators. However it remains as a trading method where human judgment is applied in setting the rules (aka the strategy) manually. Subsequently the TF strategy is exe- cuted in pure objective operational manner. Finding the correct strategy at the beginning is crucial in TF. This usually involves human intervention in first identifying a trend, and configuring when to place an order and close it out, when certain conditions are met. In this paper, we evaluated and compared a col- lection of TF algorithms that can be programmed in a computer system for automated trading. In partic- ular, a new version of TF called trend recalling model is presented. It works by partially matching the current market trend with one of the proven successful patterns from the past. Our experiments based on real stock market data show that this method has an edge over the other trend following methods in profitability. The results show that TF however is still limited by market fluctuation (volatility), and the ability to identify trend signal. Ó 2012 Elsevier Ltd. All rights reserved. 1. Introduction Trend following (TF) (Fong & Tai, 2009) is a reactive trading method in response to the real-time market situation; it does nei- ther price forecasting nor predicting any market movement. Once a trend is identified, it activates the trading rules and adheres rigidly to the rules until the next prominent trend is identified. Trend fol- lowing does not guarantee profit every time, but nonetheless in a long term period it may probably profit by obtaining more gains than loses. The nature of TF makes it as an ideal ingredient in implementing a decision-making component in automated trading software where human intervention is not required in automatic buying and selling. Automated trading here is referred to an ‘auto-pilot’ mode by which the software system decides when to buy or sell a stock (in a form of option, future contract, warrant, etc.) from the derivative market. Though the philosophy of trend following is simple – identify a current market trend and trade strictly according to the pre-defined rules (sometimes known as strategies), how the rules or strategies should be formulated has become an important research problem that deserves attention from researchers. Rules such as when to buy and sell or when to open and close a position, as signaled from the market trend have a direct impact into the profitability of automated market trading. TF algorithms in this context are termed as automated trading methods that are guided by the current market trend (signals from the trend) and specified by the rules (reactions to the trend). For an example of a most basic TF algorithm, buying and selling are cued by the conditions when the market trend which is represented by its moving average rises over an up-threshold, and falls below a down-threshold respectively. The values of the thresholds are pre- defined as a part of the trading rules. To the best of the authors’ knowledge, surprisingly, TF algo- rithms have not been investigated in the computer science com- munity. In contrast a lot of research papers on stock market forecast and prediction by soft computing can be found in litera- ture. Fig. 1 classifies clearly that trading algorithms can be pow- ered by two different domains of techniques, namely Predictive and Reactive. Predictive types of forecasting and trading in a stock market have a long history in academic research, which generally covers non-linear prediction by artificial neural works, decision trees and other regression models. These tools usually aim at pre- dicting the future market movement ahead by analyzing over the historical data. TF algorithms however, belong to the latter cate- gory, which conduct trading decision solely by reacting to the cur- rent market trend. There are several variants of TF algorithms, depending on how the rules and the predefined thresholds are 0957-4174/$ - see front matter Ó 2012 Elsevier Ltd. All rights reserved. http://dx.doi.org/10.1016/j.eswa.2012.03.048 ⇑ Corresponding author. Tel.: +853 83974460; fax: +853 2883 8314. E-mail address: [email protected] (S. Fong). Expert Systems with Applications 39 (2012) 11378–11390 Contents lists available at SciVerse ScienceDirect Expert Systems with Applications journal homepage: www.elsevier.com/locate/eswa

Welcome message from author
This document is posted to help you gain knowledge. Please leave a comment to let me know what you think about it! Share it to your friends and learn new things together.
Transcript
Expert Systems with Applications 39 (2012) 11378–11390
Contents lists available at SciVerse ScienceDirect
Expert Systems with Applications
journal homepage: www.elsevier .com/locate /eswa
Trend following algorithms in automated derivatives market trading
Simon Fong ⇑, Yain-Whar Si, Jackie TaiDepartment of Computer and Information Science, University of Macau, Macau
a r t i c l e i n f o a b s t r a c t
Keywords:Trend followingAutomated trading systemFutures contractsMechanical trading
0957-4174/$ - see front matter � 2012 Elsevier Ltd. Ahttp://dx.doi.org/10.1016/j.eswa.2012.03.048
⇑ Corresponding author. Tel.: +853 83974460; fax:E-mail address: [email protected] (S. Fong).
Trend following (TF) is trading philosophy by which buying/selling decisions are made solely according tothe observed market trend. For many years, many manifestations of TF such as a software program calledTurtle Trader, for example, emerged in the industry. Surprisingly little has been studied in academicresearch about its algorithms and applications. Unlike financial forecasting, TF does not predict any mar-ket movement; instead it identifies a trend at early time of the day, and trades automatically afterwardsby a pre-defined strategy regardless of the moving market directions during run time. Trend followingtrading has been popular among speculators. However it remains as a trading method where humanjudgment is applied in setting the rules (aka the strategy) manually. Subsequently the TF strategy is exe-cuted in pure objective operational manner. Finding the correct strategy at the beginning is crucial in TF.This usually involves human intervention in first identifying a trend, and configuring when to place anorder and close it out, when certain conditions are met. In this paper, we evaluated and compared a col-lection of TF algorithms that can be programmed in a computer system for automated trading. In partic-ular, a new version of TF called trend recalling model is presented. It works by partially matching thecurrent market trend with one of the proven successful patterns from the past. Our experiments basedon real stock market data show that this method has an edge over the other trend following methodsin profitability. The results show that TF however is still limited by market fluctuation (volatility), andthe ability to identify trend signal.
� 2012 Elsevier Ltd. All rights reserved.
1. Introduction
Trend following (TF) (Fong & Tai, 2009) is a reactive tradingmethod in response to the real-time market situation; it does nei-ther price forecasting nor predicting any market movement. Once atrend is identified, it activates the trading rules and adheres rigidlyto the rules until the next prominent trend is identified. Trend fol-lowing does not guarantee profit every time, but nonetheless in along term period it may probably profit by obtaining more gainsthan loses. The nature of TF makes it as an ideal ingredient inimplementing a decision-making component in automated tradingsoftware where human intervention is not required in automaticbuying and selling. Automated trading here is referred to an‘auto-pilot’ mode by which the software system decides when tobuy or sell a stock (in a form of option, future contract, warrant,etc.) from the derivative market. Though the philosophy of trendfollowing is simple – identify a current market trend and tradestrictly according to the pre-defined rules (sometimes known asstrategies), how the rules or strategies should be formulated hasbecome an important research problem that deserves attentionfrom researchers. Rules such as when to buy and sell or when to
ll rights reserved.
+853 2883 8314.
open and close a position, as signaled from the market trend havea direct impact into the profitability of automated market trading.TF algorithms in this context are termed as automated tradingmethods that are guided by the current market trend (signals fromthe trend) and specified by the rules (reactions to the trend). For anexample of a most basic TF algorithm, buying and selling are cuedby the conditions when the market trend which is represented byits moving average rises over an up-threshold, and falls below adown-threshold respectively. The values of the thresholds are pre-defined as a part of the trading rules.
To the best of the authors’ knowledge, surprisingly, TF algo-rithms have not been investigated in the computer science com-munity. In contrast a lot of research papers on stock marketforecast and prediction by soft computing can be found in litera-ture. Fig. 1 classifies clearly that trading algorithms can be pow-ered by two different domains of techniques, namely Predictiveand Reactive. Predictive types of forecasting and trading in a stockmarket have a long history in academic research, which generallycovers non-linear prediction by artificial neural works, decisiontrees and other regression models. These tools usually aim at pre-dicting the future market movement ahead by analyzing over thehistorical data. TF algorithms however, belong to the latter cate-gory, which conduct trading decision solely by reacting to the cur-rent market trend. There are several variants of TF algorithms,depending on how the rules and the predefined thresholds are
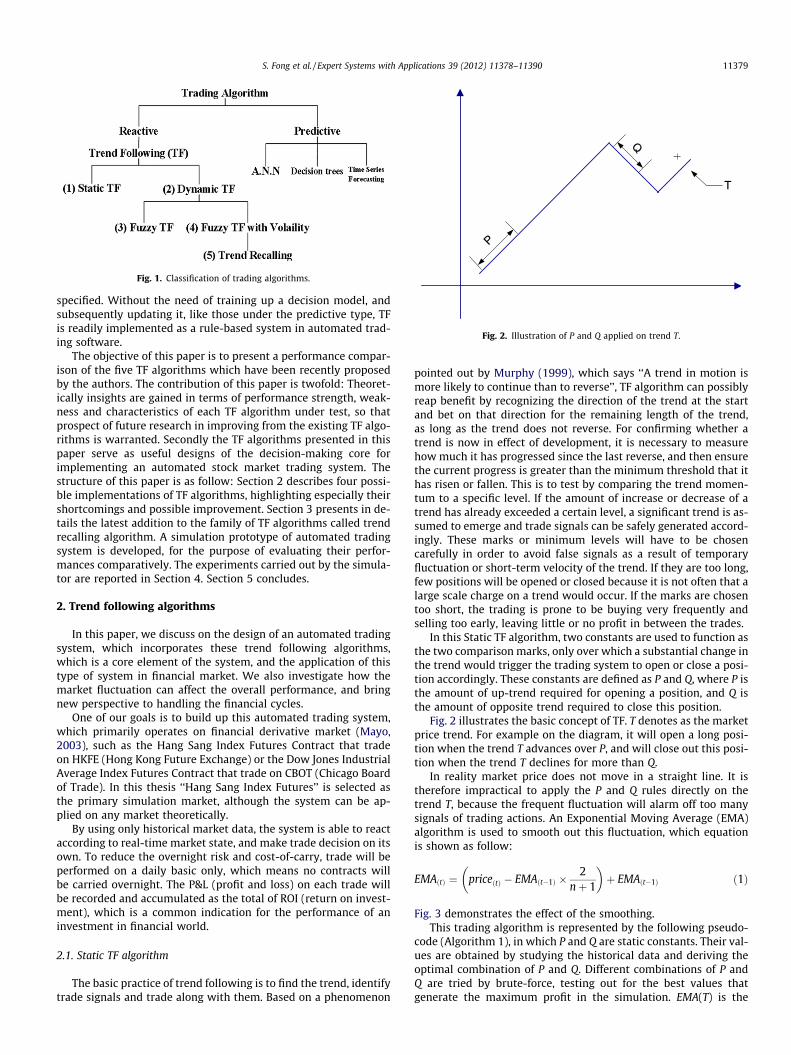
Fig. 1. Classification of trading algorithms.
P
Q
T
Fig. 2. Illustration of P and Q applied on trend T.
S. Fong et al. / Expert Systems with Applications 39 (2012) 11378–11390 11379
specified. Without the need of training up a decision model, andsubsequently updating it, like those under the predictive type, TFis readily implemented as a rule-based system in automated trad-ing software.
The objective of this paper is to present a performance compar-ison of the five TF algorithms which have been recently proposedby the authors. The contribution of this paper is twofold: Theoret-ically insights are gained in terms of performance strength, weak-ness and characteristics of each TF algorithm under test, so thatprospect of future research in improving from the existing TF algo-rithms is warranted. Secondly the TF algorithms presented in thispaper serve as useful designs of the decision-making core forimplementing an automated stock market trading system. Thestructure of this paper is as follow: Section 2 describes four possi-ble implementations of TF algorithms, highlighting especially theirshortcomings and possible improvement. Section 3 presents in de-tails the latest addition to the family of TF algorithms called trendrecalling algorithm. A simulation prototype of automated tradingsystem is developed, for the purpose of evaluating their perfor-mances comparatively. The experiments carried out by the simula-tor are reported in Section 4. Section 5 concludes.
2. Trend following algorithms
In this paper, we discuss on the design of an automated tradingsystem, which incorporates these trend following algorithms,which is a core element of the system, and the application of thistype of system in financial market. We also investigate how themarket fluctuation can affect the overall performance, and bringnew perspective to handling the financial cycles.
One of our goals is to build up this automated trading system,which primarily operates on financial derivative market (Mayo,2003), such as the Hang Sang Index Futures Contract that tradeon HKFE (Hong Kong Future Exchange) or the Dow Jones IndustrialAverage Index Futures Contract that trade on CBOT (Chicago Boardof Trade). In this thesis ‘‘Hang Sang Index Futures’’ is selected asthe primary simulation market, although the system can be ap-plied on any market theoretically.
By using only historical market data, the system is able to reactaccording to real-time market state, and make trade decision on itsown. To reduce the overnight risk and cost-of-carry, trade will beperformed on a daily basic only, which means no contracts willbe carried overnight. The P&L (profit and loss) on each trade willbe recorded and accumulated as the total of ROI (return on invest-ment), which is a common indication for the performance of aninvestment in financial world.
2.1. Static TF algorithm
The basic practice of trend following is to find the trend, identifytrade signals and trade along with them. Based on a phenomenon
pointed out by Murphy (1999), which says ‘‘A trend in motion ismore likely to continue than to reverse’’, TF algorithm can possiblyreap benefit by recognizing the direction of the trend at the startand bet on that direction for the remaining length of the trend,as long as the trend does not reverse. For confirming whether atrend is now in effect of development, it is necessary to measurehow much it has progressed since the last reverse, and then ensurethe current progress is greater than the minimum threshold that ithas risen or fallen. This is to test by comparing the trend momen-tum to a specific level. If the amount of increase or decrease of atrend has already exceeded a certain level, a significant trend is as-sumed to emerge and trade signals can be safely generated accord-ingly. These marks or minimum levels will have to be chosencarefully in order to avoid false signals as a result of temporaryfluctuation or short-term velocity of the trend. If they are too long,few positions will be opened or closed because it is not often that alarge scale charge on a trend would occur. If the marks are chosentoo short, the trading is prone to be buying very frequently andselling too early, leaving little or no profit in between the trades.
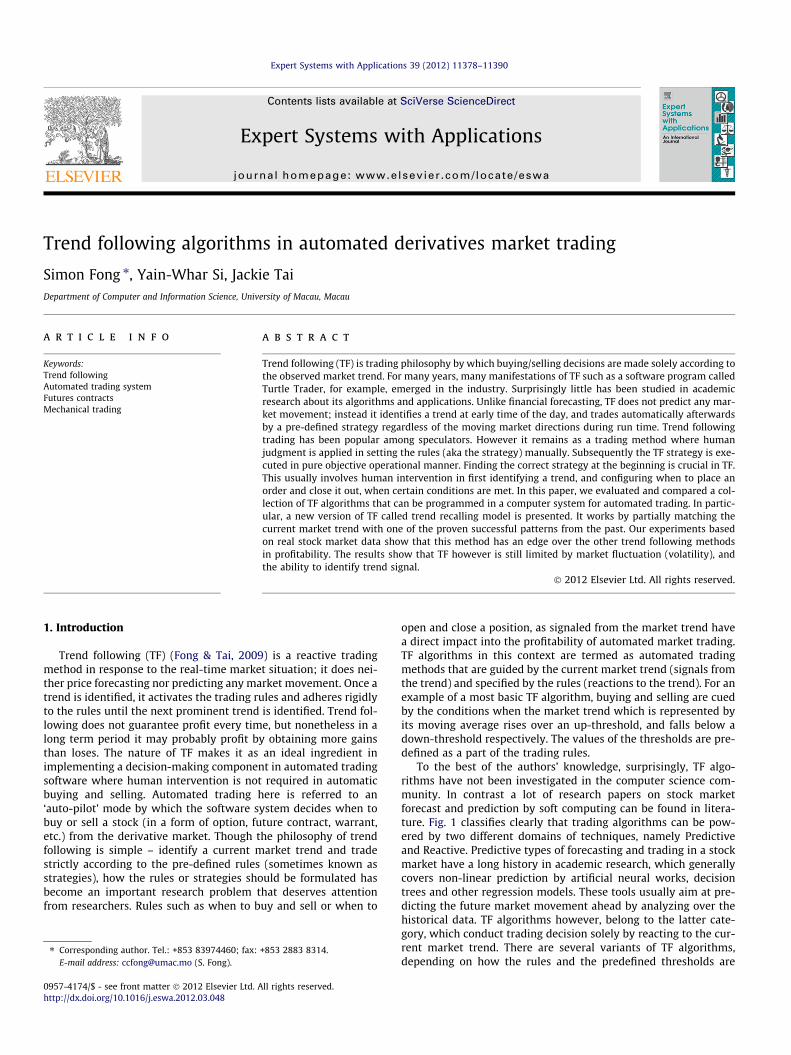
In this Static TF algorithm, two constants are used to function asthe two comparison marks, only over which a substantial change inthe trend would trigger the trading system to open or close a posi-tion accordingly. These constants are defined as P and Q, where P isthe amount of up-trend required for opening a position, and Q isthe amount of opposite trend required to close this position.
Fig. 2 illustrates the basic concept of TF. T denotes as the marketprice trend. For example on the diagram, it will open a long posi-tion when the trend T advances over P, and will close out this posi-tion when the trend T declines for more than Q.
In reality market price does not move in a straight line. It istherefore impractical to apply the P and Q rules directly on thetrend T, because the frequent fluctuation will alarm off too manysignals of trading actions. An Exponential Moving Average (EMA)algorithm is used to smooth out this fluctuation, which equationis shown as follow:
EMAðtÞ ¼ priceðtÞ � EMAðt�1Þ �2
nþ 1
� �þ EMAðt�1Þ ð1Þ
Fig. 3 demonstrates the effect of the smoothing.This trading algorithm is represented by the following pseudo-
code (Algorithm 1), in which P and Q are static constants. Their val-ues are obtained by studying the historical data and deriving theoptimal combination of P and Q. Different combinations of P andQ are tried by brute-force, testing out for the best values thatgenerate the maximum profit in the simulation. EMA(T) is the
P
Q
T
EMA(T)
Fig. 3. P and Q applied on smoothed trend EMA(T).
11380 S. Fong et al. / Expert Systems with Applications 39 (2012) 11378–11390
Exponential Moving Average of the real time market price trend,and EMAð:TÞ is the reversion (opposite direction) of the trendcounting from the highest(or lowest) point of this trend.
Algorithm 1. Pseudo-codes of the Static TF algorithm.
Repeat until end of marketCompute EMA(T)If no position opened
If EMA(T) >= PIf trend is going up
Open a long positionElse if trend is going down
Open a short positionElse if any position is opened
If EMAð:TÞ >= QClose position
If end of marketClose all opened position
Fig. 4. Example of relat
The basic premise is that the most profit is gained when a tradeis synchronized to an enduring trend. The rules of this algorithmare statically formulated as the trade parameters remain un-changed once they have been defined throughout the whole trad-ing process. The experimental results from simulation with StaticTF algorithm are detailed in Section 4.
2.2. Dynamic TF algorithm
In this dynamic TF algorithm, P and Q are variables instead ofstatic constants, and their values change adaptively to the currentmarket trends. Based upon this initial concept of trading algorithm,dynamic TF algorithm is introduced with incorporation of technicalanalysis concept. Technical analysis makes trade decision throughtechnical indicators such as RSI (relative strength index), STC (sto-chastic oscillator), and EMA and these indicators are changingdynamically according to the market situation. By adopting oneor more of these indicators and by studying how they react tothe market, rules can be formed that are able to inherit this dy-namic nature. By following these rules during trade session, we up-date the trade parameters P and Q with the latest dynamic valuesattribute.
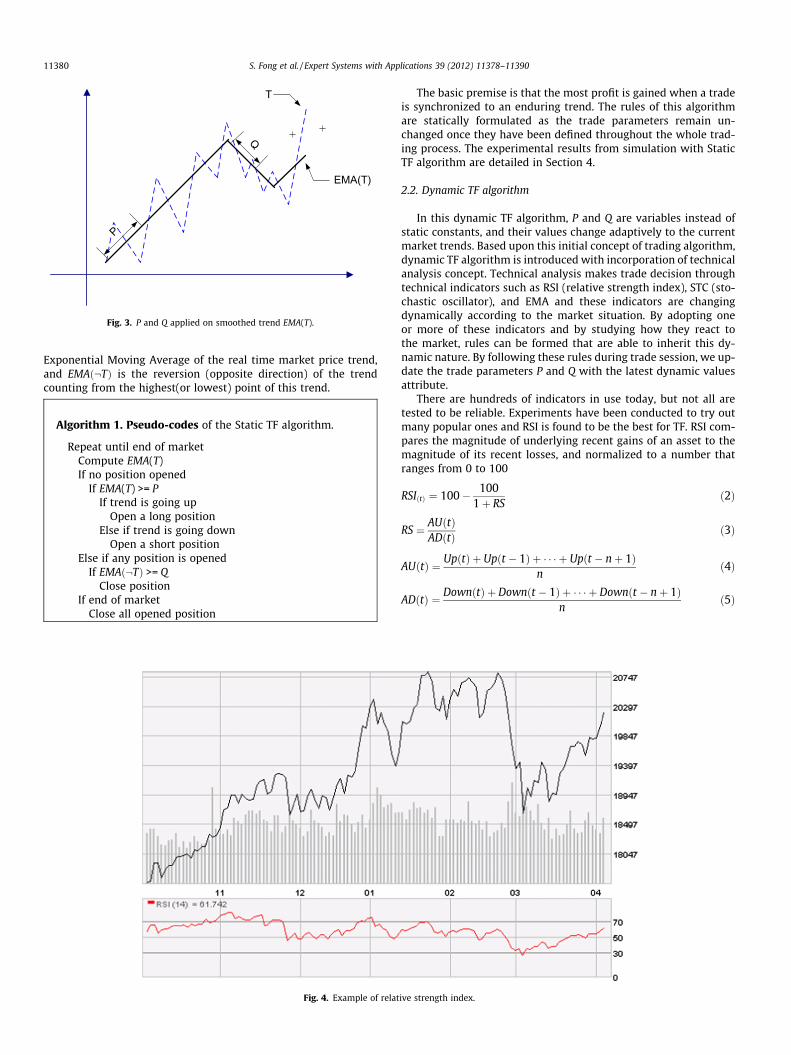
There are hundreds of indicators in use today, but not all aretested to be reliable. Experiments have been conducted to try outmany popular ones and RSI is found to be the best for TF. RSI com-pares the magnitude of underlying recent gains of an asset to themagnitude of its recent losses, and normalized to a number thatranges from 0 to 100
RSIðtÞ ¼ 100� 1001þ RS
ð2Þ
RS ¼ AUðtÞADðtÞ ð3Þ
AUðtÞ ¼ UpðtÞ þ Upðt � 1Þ þ � � � þ Upðt � nþ 1Þn
ð4Þ
ADðtÞ ¼ DownðtÞ þ Downðt � 1Þ þ � � � þ Downðt � nþ 1Þn
ð5Þ
ive strength index.
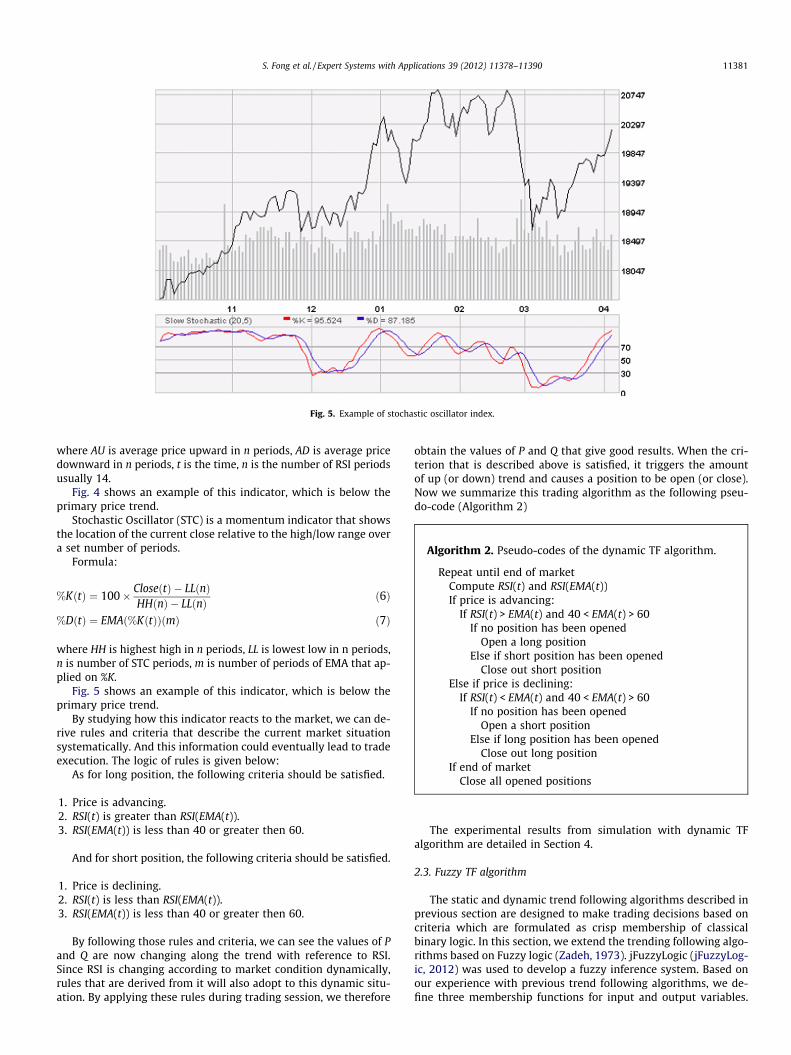
Fig. 5. Example of stochastic oscillator index.
S. Fong et al. / Expert Systems with Applications 39 (2012) 11378–11390 11381
where AU is average price upward in n periods, AD is average pricedownward in n periods, t is the time, n is the number of RSI periodsusually 14.
Fig. 4 shows an example of this indicator, which is below theprimary price trend.
Stochastic Oscillator (STC) is a momentum indicator that showsthe location of the current close relative to the high/low range overa set number of periods.
Formula:
%KðtÞ ¼ 100� CloseðtÞ � LLðnÞHHðnÞ � LLðnÞ ð6Þ
%DðtÞ ¼ EMAð%KðtÞÞðmÞ ð7Þ
where HH is highest high in n periods, LL is lowest low in n periods,n is number of STC periods, m is number of periods of EMA that ap-plied on %K.
Fig. 5 shows an example of this indicator, which is below theprimary price trend.
By studying how this indicator reacts to the market, we can de-rive rules and criteria that describe the current market situationsystematically. And this information could eventually lead to tradeexecution. The logic of rules is given below:
As for long position, the following criteria should be satisfied.
1. Price is advancing.2. RSI(t) is greater than RSI(EMA(t)).3. RSI(EMA(t)) is less than 40 or greater then 60.
And for short position, the following criteria should be satisfied.
1. Price is declining.2. RSI(t) is less than RSI(EMA(t)).3. RSI(EMA(t)) is less than 40 or greater then 60.
By following those rules and criteria, we can see the values of Pand Q are now changing along the trend with reference to RSI.Since RSI is changing according to market condition dynamically,rules that are derived from it will also adopt to this dynamic situ-ation. By applying these rules during trading session, we therefore
obtain the values of P and Q that give good results. When the cri-terion that is described above is satisfied, it triggers the amountof up (or down) trend and causes a position to be open (or close).Now we summarize this trading algorithm as the following pseu-do-code (Algorithm 2)
Algorithm 2. Pseudo-codes of the dynamic TF algorithm.
Repeat until end of marketCompute RSI(t) and RSI(EMA(t))If price is advancing:
If RSI(t) > EMA(t) and 40 < EMA(t) > 60If no position has been opened
Open a long positionElse if short position has been opened
Close out short positionElse if price is declining:
If RSI(t) < EMA(t) and 40 < EMA(t) > 60If no position has been opened
Open a short positionElse if long position has been opened
Close out long positionIf end of market
Close all opened positions
The experimental results from simulation with dynamic TFalgorithm are detailed in Section 4.
2.3. Fuzzy TF algorithm
The static and dynamic trend following algorithms described inprevious section are designed to make trading decisions based oncriteria which are formulated as crisp membership of classicalbinary logic. In this section, we extend the trending following algo-rithms based on Fuzzy logic (Zadeh, 1973). jFuzzyLogic (jFuzzyLog-ic, 2012) was used to develop a fuzzy inference system. Based onour experience with previous trend following algorithms, we de-fine three membership functions for input and output variables.
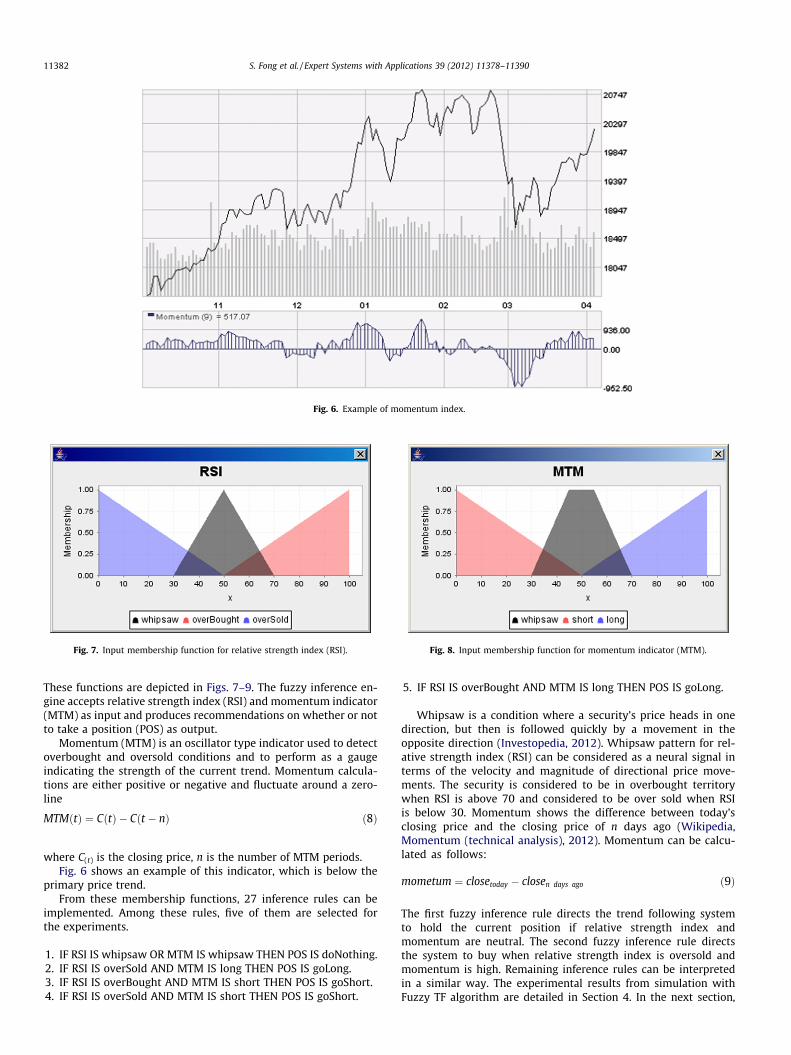
Fig. 7. Input membership function for relative strength index (RSI).
Fig. 6. Example of momentum index.
Fig. 8. Input membership function for momentum indicator (MTM).
11382 S. Fong et al. / Expert Systems with Applications 39 (2012) 11378–11390
These functions are depicted in Figs. 7–9. The fuzzy inference en-gine accepts relative strength index (RSI) and momentum indicator(MTM) as input and produces recommendations on whether or notto take a position (POS) as output.
Momentum (MTM) is an oscillator type indicator used to detectoverbought and oversold conditions and to perform as a gaugeindicating the strength of the current trend. Momentum calcula-tions are either positive or negative and fluctuate around a zero-line
MTMðtÞ ¼ CðtÞ � Cðt � nÞ ð8Þ
where C(t) is the closing price, n is the number of MTM periods.Fig. 6 shows an example of this indicator, which is below the
primary price trend.From these membership functions, 27 inference rules can be
implemented. Among these rules, five of them are selected forthe experiments.
1. IF RSI IS whipsaw OR MTM IS whipsaw THEN POS IS doNothing.2. IF RSI IS overSold AND MTM IS long THEN POS IS goLong.3. IF RSI IS overBought AND MTM IS short THEN POS IS goShort.4. IF RSI IS overSold AND MTM IS short THEN POS IS goShort.
5. IF RSI IS overBought AND MTM IS long THEN POS IS goLong.
Whipsaw is a condition where a security’s price heads in onedirection, but then is followed quickly by a movement in theopposite direction (Investopedia, 2012). Whipsaw pattern for rel-ative strength index (RSI) can be considered as a neural signal interms of the velocity and magnitude of directional price move-ments. The security is considered to be in overbought territorywhen RSI is above 70 and considered to be over sold when RSIis below 30. Momentum shows the difference between today’sclosing price and the closing price of n days ago (Wikipedia,Momentum (technical analysis), 2012). Momentum can be calcu-lated as follows:
mometum ¼ closetoday � closen days ago ð9Þ
The first fuzzy inference rule directs the trend following systemto hold the current position if relative strength index andmomentum are neutral. The second fuzzy inference rule directsthe system to buy when relative strength index is oversold andmomentum is high. Remaining inference rules can be interpretedin a similar way. The experimental results from simulation withFuzzy TF algorithm are detailed in Section 4. In the next section,
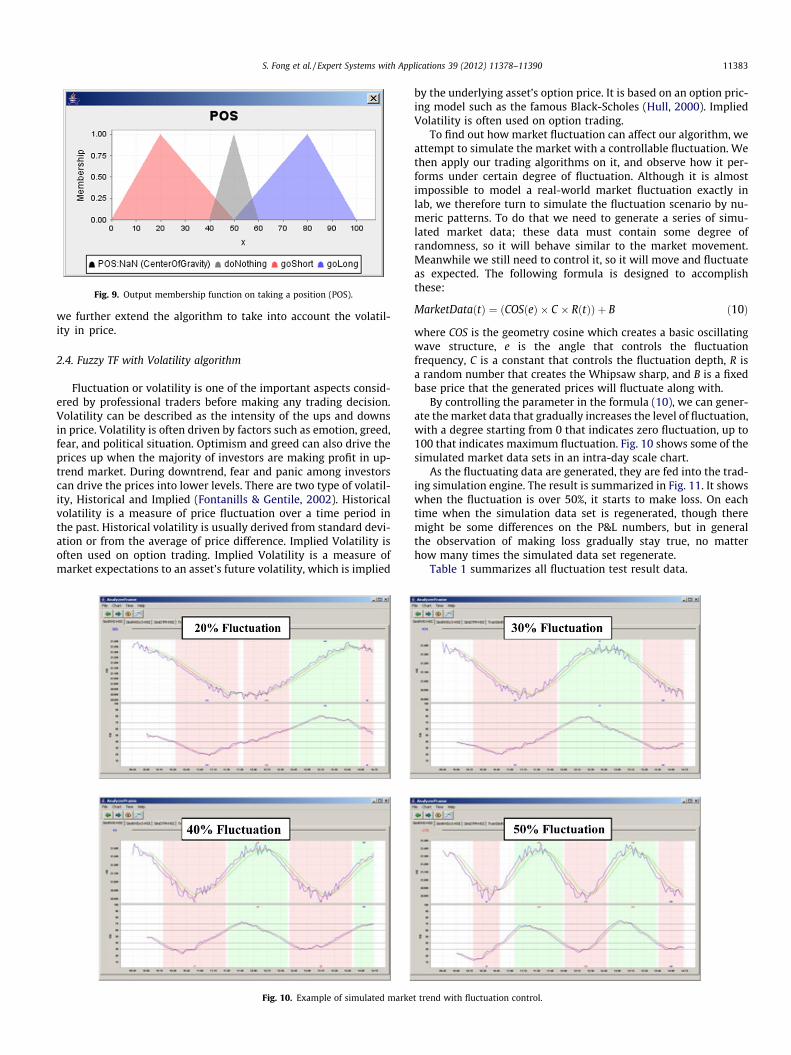
Fig. 9. Output membership function on taking a position (POS).
S. Fong et al. / Expert Systems with Applications 39 (2012) 11378–11390 11383
we further extend the algorithm to take into account the volatil-ity in price.
2.4. Fuzzy TF with Volatility algorithm
Fluctuation or volatility is one of the important aspects consid-ered by professional traders before making any trading decision.Volatility can be described as the intensity of the ups and downsin price. Volatility is often driven by factors such as emotion, greed,fear, and political situation. Optimism and greed can also drive theprices up when the majority of investors are making profit in up-trend market. During downtrend, fear and panic among investorscan drive the prices into lower levels. There are two type of volatil-ity, Historical and Implied (Fontanills & Gentile, 2002). Historicalvolatility is a measure of price fluctuation over a time period inthe past. Historical volatility is usually derived from standard devi-ation or from the average of price difference. Implied Volatility isoften used on option trading. Implied Volatility is a measure ofmarket expectations to an asset’s future volatility, which is implied
Fig. 10. Example of simulated marke
by the underlying asset’s option price. It is based on an option pric-ing model such as the famous Black-Scholes (Hull, 2000). ImpliedVolatility is often used on option trading.
To find out how market fluctuation can affect our algorithm, weattempt to simulate the market with a controllable fluctuation. Wethen apply our trading algorithms on it, and observe how it per-forms under certain degree of fluctuation. Although it is almostimpossible to model a real-world market fluctuation exactly inlab, we therefore turn to simulate the fluctuation scenario by nu-meric patterns. To do that we need to generate a series of simu-lated market data; these data must contain some degree ofrandomness, so it will behave similar to the market movement.Meanwhile we still need to control it, so it will move and fluctuateas expected. The following formula is designed to accomplishthese:
MarketDataðtÞ ¼ ðCOSðeÞ � C � RðtÞÞ þ B ð10Þ
where COS is the geometry cosine which creates a basic oscillatingwave structure, e is the angle that controls the fluctuationfrequency, C is a constant that controls the fluctuation depth, R isa random number that creates the Whipsaw sharp, and B is a fixedbase price that the generated prices will fluctuate along with.
By controlling the parameter in the formula (10), we can gener-ate the market data that gradually increases the level of fluctuation,with a degree starting from 0 that indicates zero fluctuation, up to100 that indicates maximum fluctuation. Fig. 10 shows some of thesimulated market data sets in an intra-day scale chart.
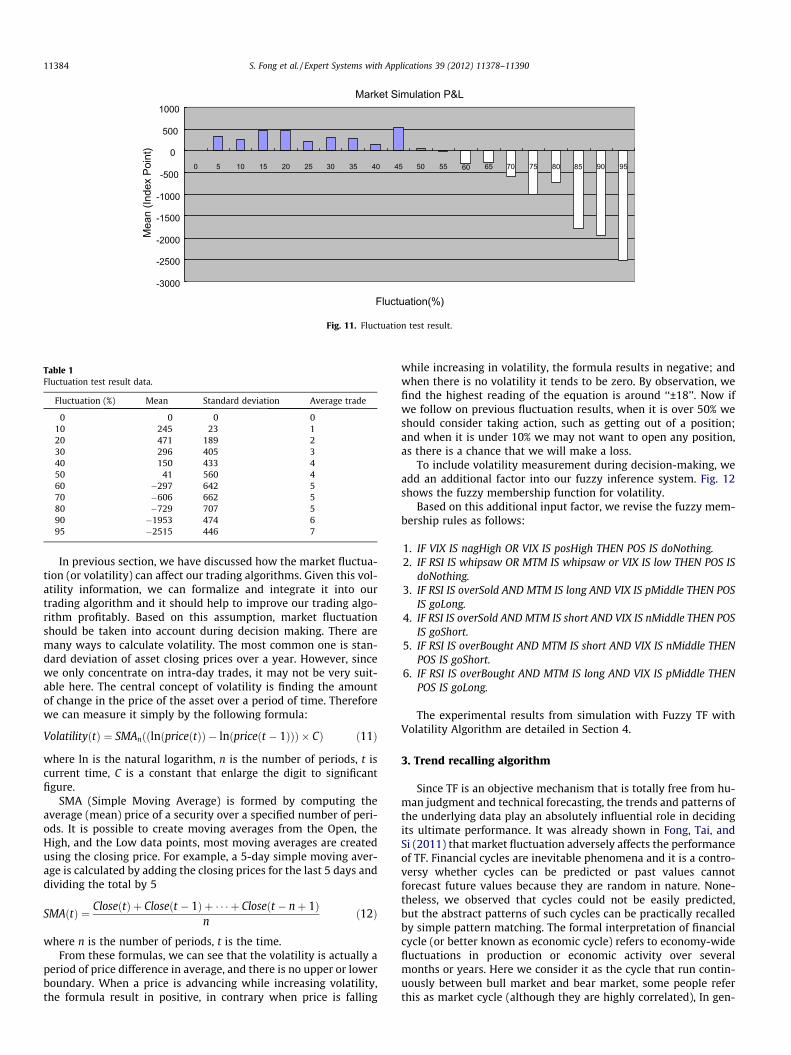
As the fluctuating data are generated, they are fed into the trad-ing simulation engine. The result is summarized in Fig. 11. It showswhen the fluctuation is over 50%, it starts to make loss. On eachtime when the simulation data set is regenerated, though theremight be some differences on the P&L numbers, but in generalthe observation of making loss gradually stay true, no matterhow many times the simulated data set regenerate.
Table 1 summarizes all fluctuation test result data.
t trend with fluctuation control.
Market Simulation P&L
-3000
-2500
-2000
-1500
-1000
-500
0
500
1000
0 5 10 15 20 25 30 35 40 45 50 55 60 65 70 75 80 85 90 95
Fluctuation(%)
Mea
n (In
dex
Poin
t)
Fig. 11. Fluctuation test result.
Table 1Fluctuation test result data.
Fluctuation (%) Mean Standard deviation Average trade
0 0 0 010 245 23 120 471 189 230 296 405 340 150 433 450 41 560 460 �297 642 570 �606 662 580 �729 707 590 �1953 474 695 �2515 446 7
11384 S. Fong et al. / Expert Systems with Applications 39 (2012) 11378–11390
In previous section, we have discussed how the market fluctua-tion (or volatility) can affect our trading algorithms. Given this vol-atility information, we can formalize and integrate it into ourtrading algorithm and it should help to improve our trading algo-rithm profitably. Based on this assumption, market fluctuationshould be taken into account during decision making. There aremany ways to calculate volatility. The most common one is stan-dard deviation of asset closing prices over a year. However, sincewe only concentrate on intra-day trades, it may not be very suit-able here. The central concept of volatility is finding the amountof change in the price of the asset over a period of time. Thereforewe can measure it simply by the following formula:
VolatilityðtÞ ¼ SMAnððlnðpriceðtÞÞ � lnðpriceðt � 1ÞÞÞ � CÞ ð11Þ
where ln is the natural logarithm, n is the number of periods, t iscurrent time, C is a constant that enlarge the digit to significantfigure.
SMA (Simple Moving Average) is formed by computing theaverage (mean) price of a security over a specified number of peri-ods. It is possible to create moving averages from the Open, theHigh, and the Low data points, most moving averages are createdusing the closing price. For example, a 5-day simple moving aver-age is calculated by adding the closing prices for the last 5 days anddividing the total by 5
SMAðtÞ ¼ CloseðtÞ þ Closeðt � 1Þ þ � � � þ Closeðt � nþ 1Þn
ð12Þ
where n is the number of periods, t is the time.From these formulas, we can see that the volatility is actually a
period of price difference in average, and there is no upper or lowerboundary. When a price is advancing while increasing volatility,the formula result in positive, in contrary when price is falling
while increasing in volatility, the formula results in negative; andwhen there is no volatility it tends to be zero. By observation, wefind the highest reading of the equation is around ‘‘±18’’. Now ifwe follow on previous fluctuation results, when it is over 50% weshould consider taking action, such as getting out of a position;and when it is under 10% we may not want to open any position,as there is a chance that we will make a loss.
To include volatility measurement during decision-making, weadd an additional factor into our fuzzy inference system. Fig. 12shows the fuzzy membership function for volatility.
Based on this additional input factor, we revise the fuzzy mem-bership rules as follows:
1. IF VIX IS nagHigh OR VIX IS posHigh THEN POS IS doNothing.2. IF RSI IS whipsaw OR MTM IS whipsaw or VIX IS low THEN POS IS
doNothing.3. IF RSI IS overSold AND MTM IS long AND VIX IS pMiddle THEN POS
IS goLong.4. IF RSI IS overSold AND MTM IS short AND VIX IS nMiddle THEN POS
IS goShort.5. IF RSI IS overBought AND MTM IS short AND VIX IS nMiddle THEN
POS IS goShort.6. IF RSI IS overBought AND MTM IS long AND VIX IS pMiddle THEN
POS IS goLong.
The experimental results from simulation with Fuzzy TF withVolatility Algorithm are detailed in Section 4.
3. Trend recalling algorithm
Since TF is an objective mechanism that is totally free from hu-man judgment and technical forecasting, the trends and patterns ofthe underlying data play an absolutely influential role in decidingits ultimate performance. It was already shown in Fong, Tai, andSi (2011) that market fluctuation adversely affects the performanceof TF. Financial cycles are inevitable phenomena and it is a contro-versy whether cycles can be predicted or past values cannotforecast future values because they are random in nature. None-theless, we observed that cycles could not be easily predicted,but the abstract patterns of such cycles can be practically recalledby simple pattern matching. The formal interpretation of financialcycle (or better known as economic cycle) refers to economy-widefluctuations in production or economic activity over severalmonths or years. Here we consider it as the cycle that run contin-uously between bull market and bear market, some people referthis as market cycle (although they are highly correlated), In gen-
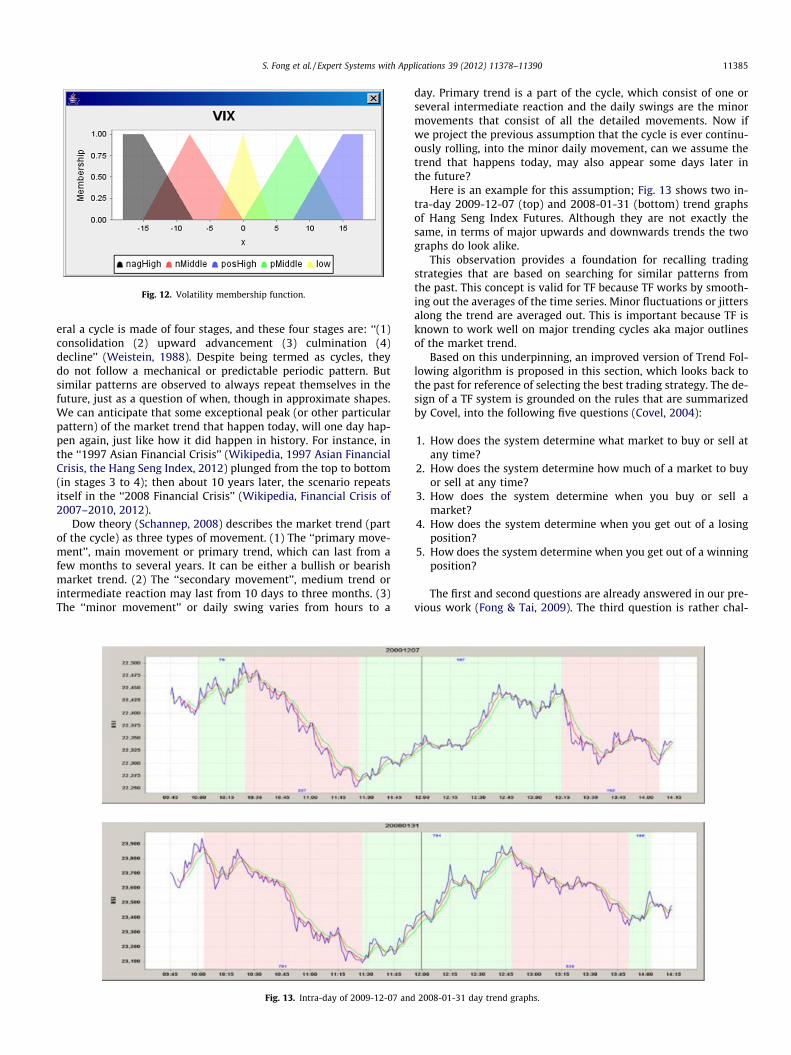
Fig. 12. Volatility membership function.
S. Fong et al. / Expert Systems with Applications 39 (2012) 11378–11390 11385
eral a cycle is made of four stages, and these four stages are: ‘‘(1)consolidation (2) upward advancement (3) culmination (4)decline’’ (Weistein, 1988). Despite being termed as cycles, theydo not follow a mechanical or predictable periodic pattern. Butsimilar patterns are observed to always repeat themselves in thefuture, just as a question of when, though in approximate shapes.We can anticipate that some exceptional peak (or other particularpattern) of the market trend that happen today, will one day hap-pen again, just like how it did happen in history. For instance, inthe ‘‘1997 Asian Financial Crisis’’ (Wikipedia, 1997 Asian FinancialCrisis, the Hang Seng Index, 2012) plunged from the top to bottom(in stages 3 to 4); then about 10 years later, the scenario repeatsitself in the ‘‘2008 Financial Crisis’’ (Wikipedia, Financial Crisis of2007–2010, 2012).
Dow theory (Schannep, 2008) describes the market trend (partof the cycle) as three types of movement. (1) The ‘‘primary move-ment’’, main movement or primary trend, which can last from afew months to several years. It can be either a bullish or bearishmarket trend. (2) The ‘‘secondary movement’’, medium trend orintermediate reaction may last from 10 days to three months. (3)The ‘‘minor movement’’ or daily swing varies from hours to a
Fig. 13. Intra-day of 2009-12-07 and
day. Primary trend is a part of the cycle, which consist of one orseveral intermediate reaction and the daily swings are the minormovements that consist of all the detailed movements. Now ifwe project the previous assumption that the cycle is ever continu-ously rolling, into the minor daily movement, can we assume thetrend that happens today, may also appear some days later inthe future?
Here is an example for this assumption; Fig. 13 shows two in-tra-day 2009-12-07 (top) and 2008-01-31 (bottom) trend graphsof Hang Seng Index Futures. Although they are not exactly thesame, in terms of major upwards and downwards trends the twographs do look alike.
This observation provides a foundation for recalling tradingstrategies that are based on searching for similar patterns fromthe past. This concept is valid for TF because TF works by smooth-ing out the averages of the time series. Minor fluctuations or jittersalong the trend are averaged out. This is important because TF isknown to work well on major trending cycles aka major outlinesof the market trend.
Based on this underpinning, an improved version of Trend Fol-lowing algorithm is proposed in this section, which looks back tothe past for reference of selecting the best trading strategy. The de-sign of a TF system is grounded on the rules that are summarizedby Covel, into the following five questions (Covel, 2004):
1. How does the system determine what market to buy or sell atany time?
2. How does the system determine how much of a market to buyor sell at any time?
3. How does the system determine when you buy or sell amarket?
4. How does the system determine when you get out of a losingposition?
5. How does the system determine when you get out of a winningposition?
The first and second questions are already answered in our pre-vious work (Fong & Tai, 2009). The third question is rather chal-
2008-01-31 day trend graphs.
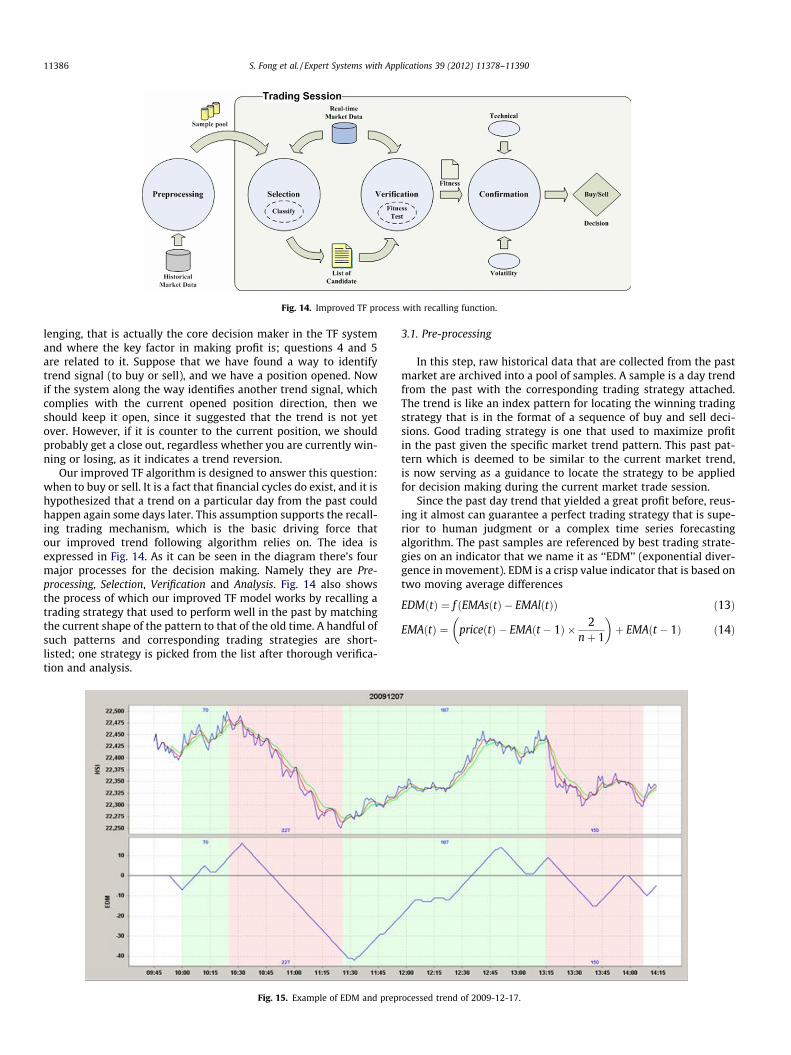
Fig. 14. Improved TF process with recalling function.
11386 S. Fong et al. / Expert Systems with Applications 39 (2012) 11378–11390
lenging, that is actually the core decision maker in the TF systemand where the key factor in making profit is; questions 4 and 5are related to it. Suppose that we have found a way to identifytrend signal (to buy or sell), and we have a position opened. Nowif the system along the way identifies another trend signal, whichcomplies with the current opened position direction, then weshould keep it open, since it suggested that the trend is not yetover. However, if it is counter to the current position, we shouldprobably get a close out, regardless whether you are currently win-ning or losing, as it indicates a trend reversion.
Our improved TF algorithm is designed to answer this question:when to buy or sell. It is a fact that financial cycles do exist, and it ishypothesized that a trend on a particular day from the past couldhappen again some days later. This assumption supports the recall-ing trading mechanism, which is the basic driving force thatour improved trend following algorithm relies on. The idea isexpressed in Fig. 14. As it can be seen in the diagram there’s fourmajor processes for the decision making. Namely they are Pre-processing, Selection, Verification and Analysis. Fig. 14 also showsthe process of which our improved TF model works by recalling atrading strategy that used to perform well in the past by matchingthe current shape of the pattern to that of the old time. A handful ofsuch patterns and corresponding trading strategies are short-listed; one strategy is picked from the list after thorough verifica-tion and analysis.
Fig. 15. Example of EDM and prep
3.1. Pre-processing
In this step, raw historical data that are collected from the pastmarket are archived into a pool of samples. A sample is a day trendfrom the past with the corresponding trading strategy attached.The trend is like an index pattern for locating the winning tradingstrategy that is in the format of a sequence of buy and sell deci-sions. Good trading strategy is one that used to maximize profitin the past given the specific market trend pattern. This past pat-tern which is deemed to be similar to the current market trend,is now serving as a guidance to locate the strategy to be appliedfor decision making during the current market trade session.
Since the past day trend that yielded a great profit before, reus-ing it almost can guarantee a perfect trading strategy that is supe-rior to human judgment or a complex time series forecastingalgorithm. The past samples are referenced by best trading strate-gies on an indicator that we name it as ‘‘EDM’’ (exponential diver-gence in movement). EDM is a crisp value indicator that is based ontwo moving average differences
EDMðtÞ ¼ f ðEMAsðtÞ � EMAlðtÞÞ ð13Þ
EMAðtÞ ¼ priceðtÞ � EMAðt � 1Þ � 2nþ 1
� �þ EMAðt � 1Þ ð14Þ
rocessed trend of 2009-12-17.
S. Fong et al. / Expert Systems with Applications 39 (2012) 11378–11390 11387
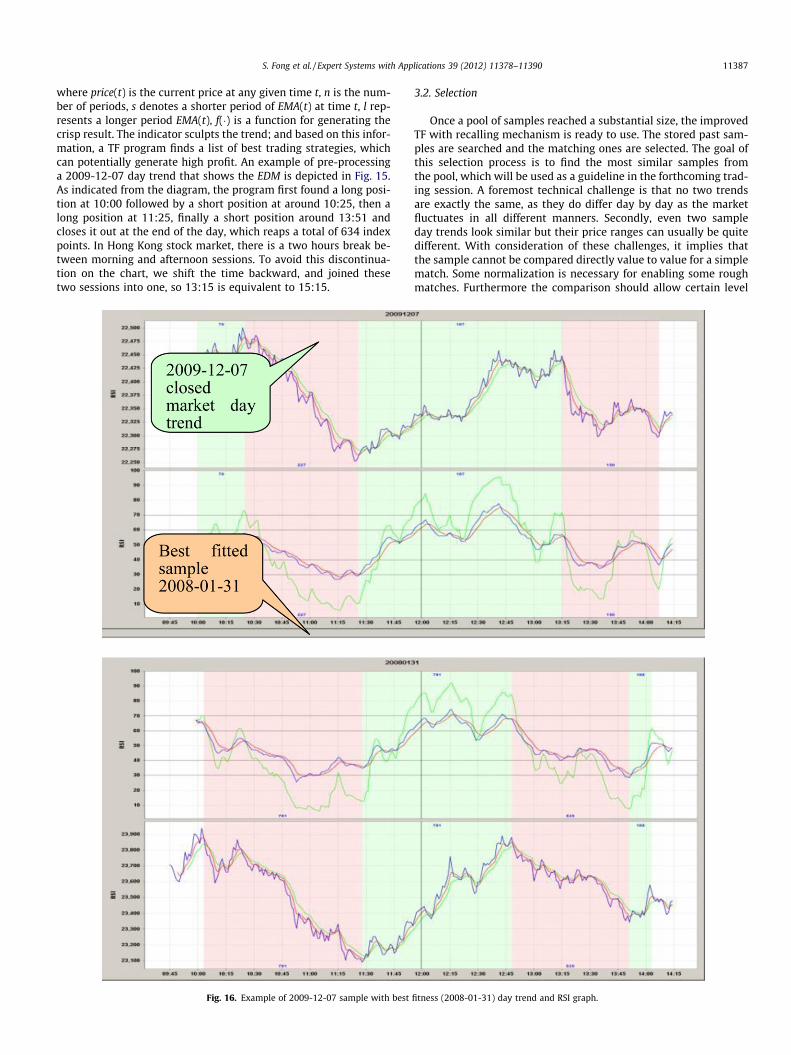
where price(t) is the current price at any given time t, n is the num-ber of periods, s denotes a shorter period of EMA(t) at time t, l rep-resents a longer period EMA(t), f(�) is a function for generating thecrisp result. The indicator sculpts the trend; and based on this infor-mation, a TF program finds a list of best trading strategies, whichcan potentially generate high profit. An example of pre-processinga 2009-12-07 day trend that shows the EDM is depicted in Fig. 15.As indicated from the diagram, the program first found a long posi-tion at 10:00 followed by a short position at around 10:25, then along position at 11:25, finally a short position around 13:51 andcloses it out at the end of the day, which reaps a total of 634 indexpoints. In Hong Kong stock market, there is a two hours break be-tween morning and afternoon sessions. To avoid this discontinua-tion on the chart, we shift the time backward, and joined thesetwo sessions into one, so 13:15 is equivalent to 15:15.
Fig. 16. Example of 2009-12-07 sample with best
3.2. Selection
Once a pool of samples reached a substantial size, the improvedTF with recalling mechanism is ready to use. The stored past sam-ples are searched and the matching ones are selected. The goal ofthis selection process is to find the most similar samples fromthe pool, which will be used as a guideline in the forthcoming trad-ing session. A foremost technical challenge is that no two trendsare exactly the same, as they do differ day by day as the marketfluctuates in all different manners. Secondly, even two sampleday trends look similar but their price ranges can usually be quitedifferent. With consideration of these challenges, it implies thatthe sample cannot be compared directly value to value for a simplematch. Some normalization is necessary for enabling some roughmatches. Furthermore the comparison should allow certain level
fitness (2008-01-31) day trend and RSI graph.
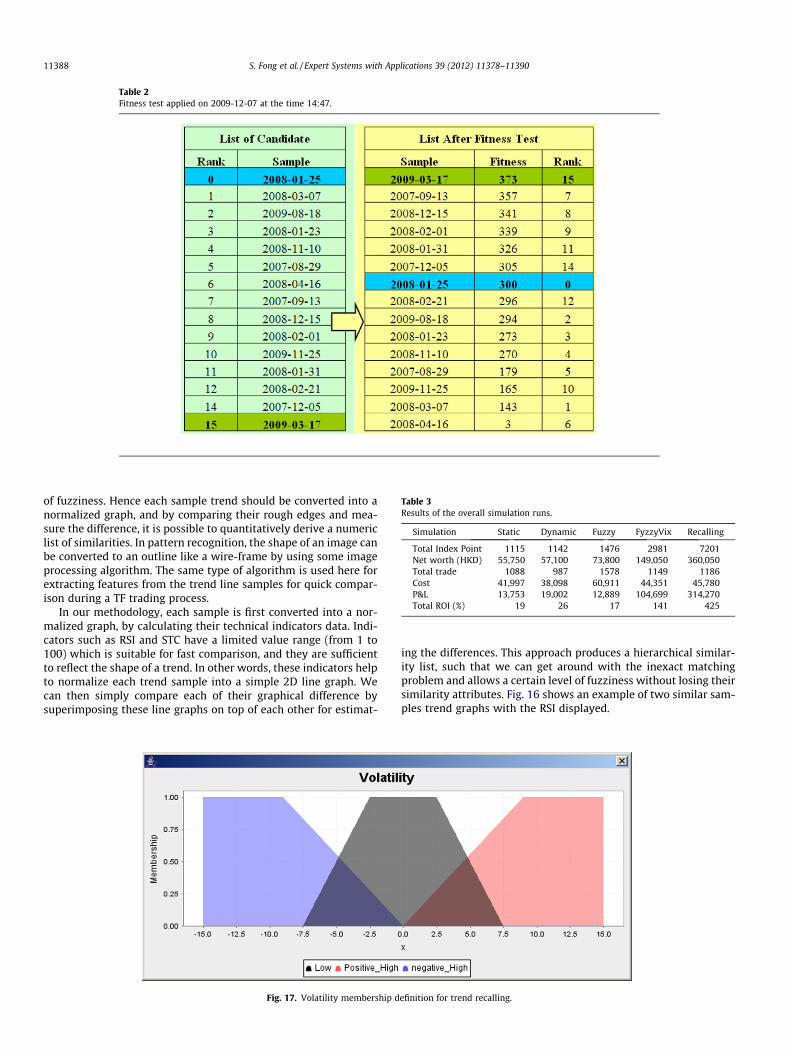
Table 2Fitness test applied on 2009-12-07 at the time 14:47.
Table 3Results of the overall simulation runs.
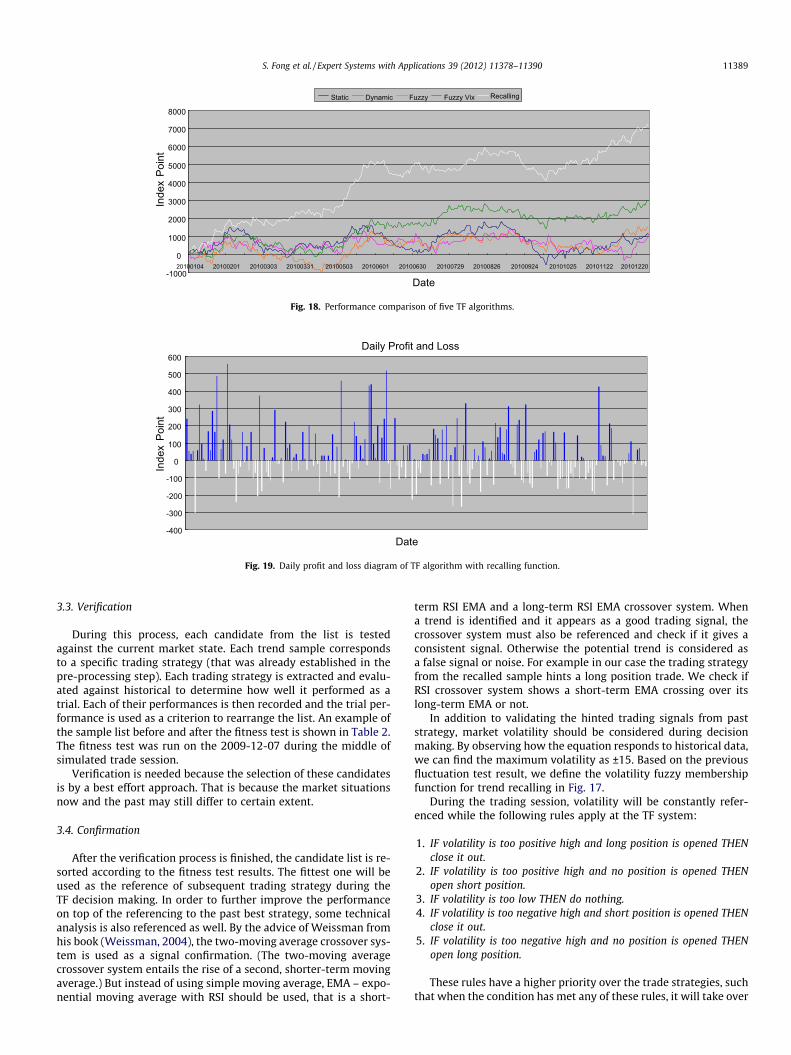
Simulation Static Dynamic Fuzzy FyzzyVix Recalling
Total Index Point 1115 1142 1476 2981 7201Net worth (HKD) 55,750 57,100 73,800 149,050 360,050Total trade 1088 987 1578 1149 1186Cost 41,997 38,098 60,911 44,351 45,780P&L 13,753 19,002 12,889 104,699 314,270Total ROI (%) 19 26 17 141 425
11388 S. Fong et al. / Expert Systems with Applications 39 (2012) 11378–11390
of fuzziness. Hence each sample trend should be converted into anormalized graph, and by comparing their rough edges and mea-sure the difference, it is possible to quantitatively derive a numericlist of similarities. In pattern recognition, the shape of an image canbe converted to an outline like a wire-frame by using some imageprocessing algorithm. The same type of algorithm is used here forextracting features from the trend line samples for quick compar-ison during a TF trading process.
In our methodology, each sample is first converted into a nor-malized graph, by calculating their technical indicators data. Indi-cators such as RSI and STC have a limited value range (from 1 to100) which is suitable for fast comparison, and they are sufficientto reflect the shape of a trend. In other words, these indicators helpto normalize each trend sample into a simple 2D line graph. Wecan then simply compare each of their graphical difference bysuperimposing these line graphs on top of each other for estimat-
Fig. 17. Volatility membership d
ing the differences. This approach produces a hierarchical similar-ity list, such that we can get around with the inexact matchingproblem and allows a certain level of fuzziness without losing theirsimilarity attributes. Fig. 16 shows an example of two similar sam-ples trend graphs with the RSI displayed.
efinition for trend recalling.
-1000
0
1000
2000
3000
4000
5000
6000
7000
8000
20100104 20100201 20100303 20100331 20100503 20100601 20100630 20100729 20100826 20100924 20101025 20101122 20101220
Date
Inde
xPo
int
Static Dynamic Fuzzy Fuzzy Vix Recalling
Fig. 18. Performance comparison of five TF algorithms.
Daily Profit and Loss
-400
-300
-200
-100
0
100
200
300
400
500
600
Date
Inde
xPo
int
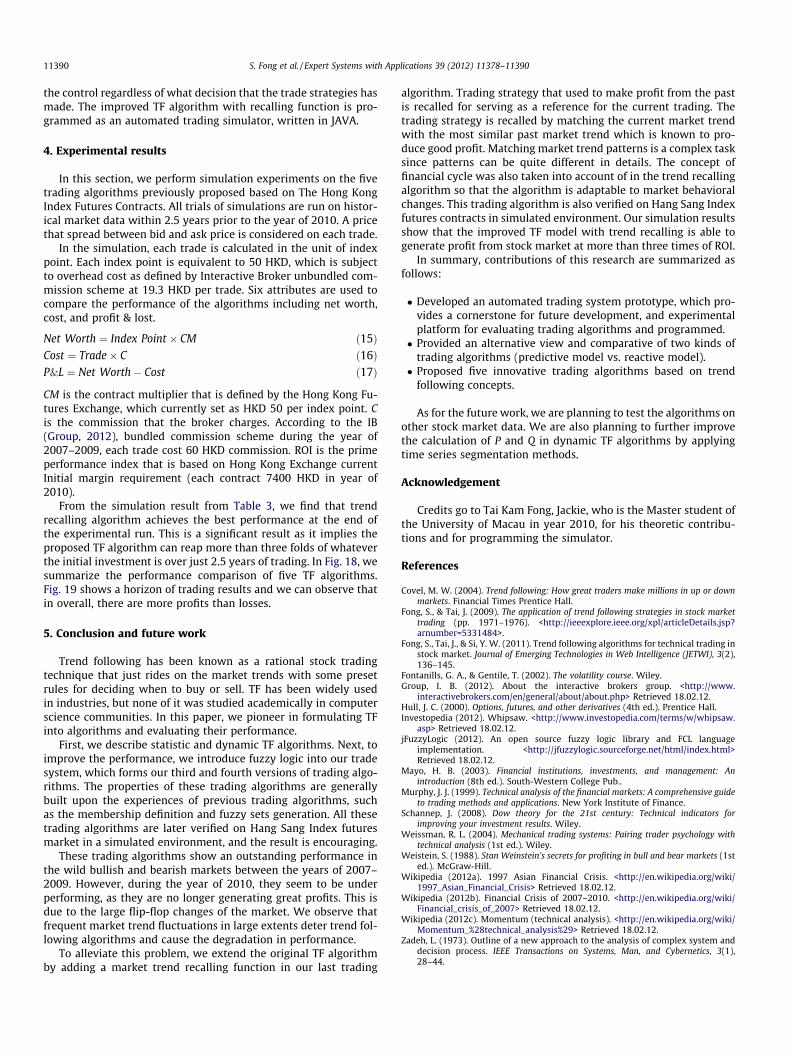
Fig. 19. Daily profit and loss diagram of TF algorithm with recalling function.
S. Fong et al. / Expert Systems with Applications 39 (2012) 11378–11390 11389
3.3. Verification
During this process, each candidate from the list is testedagainst the current market state. Each trend sample correspondsto a specific trading strategy (that was already established in thepre-processing step). Each trading strategy is extracted and evalu-ated against historical to determine how well it performed as atrial. Each of their performances is then recorded and the trial per-formance is used as a criterion to rearrange the list. An example ofthe sample list before and after the fitness test is shown in Table 2.The fitness test was run on the 2009-12-07 during the middle ofsimulated trade session.
Verification is needed because the selection of these candidatesis by a best effort approach. That is because the market situationsnow and the past may still differ to certain extent.
3.4. Confirmation
After the verification process is finished, the candidate list is re-sorted according to the fitness test results. The fittest one will beused as the reference of subsequent trading strategy during theTF decision making. In order to further improve the performanceon top of the referencing to the past best strategy, some technicalanalysis is also referenced as well. By the advice of Weissman fromhis book (Weissman, 2004), the two-moving average crossover sys-tem is used as a signal confirmation. (The two-moving averagecrossover system entails the rise of a second, shorter-term movingaverage.) But instead of using simple moving average, EMA – expo-nential moving average with RSI should be used, that is a short-
term RSI EMA and a long-term RSI EMA crossover system. Whena trend is identified and it appears as a good trading signal, thecrossover system must also be referenced and check if it gives aconsistent signal. Otherwise the potential trend is considered asa false signal or noise. For example in our case the trading strategyfrom the recalled sample hints a long position trade. We check ifRSI crossover system shows a short-term EMA crossing over itslong-term EMA or not.
In addition to validating the hinted trading signals from paststrategy, market volatility should be considered during decisionmaking. By observing how the equation responds to historical data,we can find the maximum volatility as ±15. Based on the previousfluctuation test result, we define the volatility fuzzy membershipfunction for trend recalling in Fig. 17.
During the trading session, volatility will be constantly refer-enced while the following rules apply at the TF system:
1. IF volatility is too positive high and long position is opened THENclose it out.
2. IF volatility is too positive high and no position is opened THENopen short position.
3. IF volatility is too low THEN do nothing.4. IF volatility is too negative high and short position is opened THEN
close it out.5. IF volatility is too negative high and no position is opened THEN
open long position.
These rules have a higher priority over the trade strategies, suchthat when the condition has met any of these rules, it will take over
11390 S. Fong et al. / Expert Systems with Applications 39 (2012) 11378–11390
the control regardless of what decision that the trade strategies hasmade. The improved TF algorithm with recalling function is pro-grammed as an automated trading simulator, written in JAVA.
4. Experimental results
In this section, we perform simulation experiments on the fivetrading algorithms previously proposed based on The Hong KongIndex Futures Contracts. All trials of simulations are run on histor-ical market data within 2.5 years prior to the year of 2010. A pricethat spread between bid and ask price is considered on each trade.
In the simulation, each trade is calculated in the unit of indexpoint. Each index point is equivalent to 50 HKD, which is subjectto overhead cost as defined by Interactive Broker unbundled com-mission scheme at 19.3 HKD per trade. Six attributes are used tocompare the performance of the algorithms including net worth,cost, and profit & lost.
Net Worth ¼ Index Point � CM ð15ÞCost ¼ Trade� C ð16ÞP&L ¼ Net Worth� Cost ð17Þ
CM is the contract multiplier that is defined by the Hong Kong Fu-tures Exchange, which currently set as HKD 50 per index point. Cis the commission that the broker charges. According to the IB(Group, 2012), bundled commission scheme during the year of2007–2009, each trade cost 60 HKD commission. ROI is the primeperformance index that is based on Hong Kong Exchange currentInitial margin requirement (each contract 7400 HKD in year of2010).
From the simulation result from Table 3, we find that trendrecalling algorithm achieves the best performance at the end ofthe experimental run. This is a significant result as it implies theproposed TF algorithm can reap more than three folds of whateverthe initial investment is over just 2.5 years of trading. In Fig. 18, wesummarize the performance comparison of five TF algorithms.Fig. 19 shows a horizon of trading results and we can observe thatin overall, there are more profits than losses.
5. Conclusion and future work
Trend following has been known as a rational stock tradingtechnique that just rides on the market trends with some presetrules for deciding when to buy or sell. TF has been widely usedin industries, but none of it was studied academically in computerscience communities. In this paper, we pioneer in formulating TFinto algorithms and evaluating their performance.
First, we describe statistic and dynamic TF algorithms. Next, toimprove the performance, we introduce fuzzy logic into our tradesystem, which forms our third and fourth versions of trading algo-rithms. The properties of these trading algorithms are generallybuilt upon the experiences of previous trading algorithms, suchas the membership definition and fuzzy sets generation. All thesetrading algorithms are later verified on Hang Sang Index futuresmarket in a simulated environment, and the result is encouraging.
These trading algorithms show an outstanding performance inthe wild bullish and bearish markets between the years of 2007–2009. However, during the year of 2010, they seem to be underperforming, as they are no longer generating great profits. This isdue to the large flip-flop changes of the market. We observe thatfrequent market trend fluctuations in large extents deter trend fol-lowing algorithms and cause the degradation in performance.
To alleviate this problem, we extend the original TF algorithmby adding a market trend recalling function in our last trading
algorithm. Trading strategy that used to make profit from the pastis recalled for serving as a reference for the current trading. Thetrading strategy is recalled by matching the current market trendwith the most similar past market trend which is known to pro-duce good profit. Matching market trend patterns is a complex tasksince patterns can be quite different in details. The concept offinancial cycle was also taken into account of in the trend recallingalgorithm so that the algorithm is adaptable to market behavioralchanges. This trading algorithm is also verified on Hang Sang Indexfutures contracts in simulated environment. Our simulation resultsshow that the improved TF model with trend recalling is able togenerate profit from stock market at more than three times of ROI.
In summary, contributions of this research are summarized asfollows:
� Developed an automated trading system prototype, which pro-vides a cornerstone for future development, and experimentalplatform for evaluating trading algorithms and programmed.� Provided an alternative view and comparative of two kinds of
trading algorithms (predictive model vs. reactive model).� Proposed five innovative trading algorithms based on trend
following concepts.
As for the future work, we are planning to test the algorithms onother stock market data. We are also planning to further improvethe calculation of P and Q in dynamic TF algorithms by applyingtime series segmentation methods.
Acknowledgement
Credits go to Tai Kam Fong, Jackie, who is the Master student ofthe University of Macau in year 2010, for his theoretic contribu-tions and for programming the simulator.
References
Covel, M. W. (2004). Trend following: How great traders make millions in up or downmarkets. Financial Times Prentice Hall.
Fong, S., & Tai, J. (2009). The application of trend following strategies in stock markettrading (pp. 1971–1976). <http://ieeexplore.ieee.org/xpl/articleDetails.jsp?arnumber=5331484>.
Fong, S., Tai, J., & Si, Y. W. (2011). Trend following algorithms for technical trading instock market. Journal of Emerging Technologies in Web Intelligence (JETWI), 3(2),136–145.
Fontanills, G. A., & Gentile, T. (2002). The volatility course. Wiley.Group, I. B. (2012). About the interactive brokers group. <http://www.
interactivebrokers.com/en/general/about/about.php> Retrieved 18.02.12.Hull, J. C. (2000). Options, futures, and other derivatives (4th ed.). Prentice Hall.Investopedia (2012). Whipsaw. <http://www.investopedia.com/terms/w/whipsaw.
asp> Retrieved 18.02.12.jFuzzyLogic (2012). An open source fuzzy logic library and FCL language
implementation. <http://jfuzzylogic.sourceforge.net/html/index.html>Retrieved 18.02.12.
Mayo, H. B. (2003). Financial institutions, investments, and management: Anintroduction (8th ed.). South-Western College Pub..
Murphy, J. J. (1999). Technical analysis of the financial markets: A comprehensive guideto trading methods and applications. New York Institute of Finance.
Schannep, J. (2008). Dow theory for the 21st century: Technical indicators forimproving your investment results. Wiley.
Weissman, R. L. (2004). Mechanical trading systems: Pairing trader psychology withtechnical analysis (1st ed.). Wiley.
Weistein, S. (1988). Stan Weinstein’s secrets for profiting in bull and bear markets (1sted.). McGraw-Hill.
Wikipedia (2012a). 1997 Asian Financial Crisis. <http://en.wikipedia.org/wiki/1997_Asian_Financial_Crisis> Retrieved 18.02.12.
Wikipedia (2012b). Financial Crisis of 2007–2010. <http://en.wikipedia.org/wiki/Financial_crisis_of_2007> Retrieved 18.02.12.
Wikipedia (2012c). Momentum (technical analysis). <http://en.wikipedia.org/wiki/Momentum_%28technical_analysis%29> Retrieved 18.02.12.
Zadeh, L. (1973). Outline of a new approach to the analysis of complex system anddecision process. IEEE Transactions on Systems, Man, and Cybernetics, 3(1),28–44.
Related Documents