$415,643 $379,322 Third Quarter 2016 Third Quarter 2015 Condo Market Report TREB Member Inquiries: (416) 443-8158 Media/Public Inquiries: (416) 443-8152 Condo Sales and Average Price Up in Q3 2016 TORONTO, October 24, 2016 – Toronto Real Estate Board President Larry Cerqua announced that condominium apartment sales reported through TREB’s MLS® System in the third quarter of 2016 were up by 22.1 per cent on a year-over-year basis to 8,014. Over the same period, new listings for condominium apartments were down by 13.3 per cent. “While the low-rise market has been top-of-mind in the supply discussion, it is very important to note that supply pressures have also been experienced in the condominium apartment market segment over the past year. The completion of new units was down substantially during the first three quarters of 2016 compared to the same period in 2015. This arguably played a role in the decline in new condominium apartment listings on TREB’s MLS® System,” said Mr. Cerqua. The average price of a condominium apartment in the Q3 2016 was $415,643 – up 9.6 per cent compared to Q3 2015. The MLS® Home Price Index (HPI) apartment benchmark price was up by a similar amount on an annual basis throughout the third quarter. “The annual rate of condominium apartment price growth has accelerated over the past year as the supply of units available for sale became more constrained while demand remained strong. With this said, however, annual rates of price growth remain well-below those for low-rise home types. Condo apartments continue to be an affordable entry point into home ownership for first-time buyers,” said Jason Mercer, TREB’s Director of Market Analysis. TREB MLS® Average Condo Apartment Price Economic Indicators Condominium Apartment Market Summary Sources and Notes: i - Statistics Canada, Quarter-over-quarter growth, annualized ii - Statistics Canada, Year-over-year growth for the most recently reported month iii - Bank of Canada, Rate from most recent Bank of Canada announcement iv - Bank of Canada, rates for most recently completed month 8,014 6,564 Third Quarter 2016 Third Quarter 2015 Real GDP Growth Q2 2016 -1.6% Toronto Employment Growth September 2016 -0.2% Toronto Unemployment Rate September 2016 7.1% Inflation (Yr./Yr. CPI Growth) September 2016 1.3% Bank of Canada Overnight Rate September 2016 -- 0.50% Prime Rate September 2016 -- 2.70% 2016 2015 Sales Average Price Sales Average Price Total TREB Halton Region Peel Region City of Toronto York Region Durham Region Other Areas 8,014 $415,643 6,564 $379,322 247 $437,482 210 $378,881 1,127 $316,199 926 $275,987 5,619 $440,096 4,632 $406,094 882 $396,964 655 $361,334 123 $323,148 131 $266,111 16 $236,216 10 $217,500 Third Quarter 2016 Third Quarter 2016 Total TREB MLS® Condo Apartment Rentals Year-Over-Year Summary 1,6 1,6 1,6 2016 2015 % Chg. Sales New Listings Active Listings Average Price Average DOM 8,014 6,564 22.1% 10,963 12,646 -13.3% 3,965 6,659 -40.5% $415,643 $379,322 9.6% 25 32 -21.9% Active listings refer to last month of quarter. i Mortgage Rates September 2016 3.14% 3.39% 4.64% 1 Year 3 Year 5 Year -- -- 1,6

Welcome message from author
This document is posted to help you gain knowledge. Please leave a comment to let me know what you think about it! Share it to your friends and learn new things together.
Transcript

$415,643
$379,322
Third Quarter 2016 Third Quarter 2015
Condo Market Report TREB Member Inquiries:
(416) 443-8158Media/Public Inquiries:
(416) 443-8152
Condo Sales and Average Price Up in Q3 2016TORONTO, October 24, 2016 – Toronto Real Estate Board President LarryCerqua announced that condominium apartment sales reported throughTREB’s MLS® System in the third quarter of 2016 were up by 22.1 per centon a year-over-year basis to 8,014. Over the same period, new listings forcondominium apartments were down by 13.3 per cent.
“While the low-rise market has been top-of-mind in the supply discussion, itis very important to note that supply pressures have also been experiencedin the condominium apartment market segment over the past year. Thecompletion of new units was down substantially during the first threequarters of 2016 compared to the same period in 2015. This arguablyplayed a role in the decline in new condominium apartment listings onTREB’s MLS® System,” said Mr. Cerqua.
The average price of a condominium apartment in the Q3 2016 was$415,643 – up 9.6 per cent compared to Q3 2015. The MLS® Home PriceIndex (HPI) apartment benchmark price was up by a similar amount on anannual basis throughout the third quarter.
“The annual rate of condominium apartment price growth has acceleratedover the past year as the supply of units available for sale became moreconstrained while demand remained strong. With this said, however, annualrates of price growth remain well-below those for low-rise home types.Condo apartments continue to be an affordable entry point into homeownership for first-time buyers,” said Jason Mercer, TREB’s Director ofMarket Analysis.
TREB MLS® AverageCondo Apartment Price
Economic Indicators
Condominium Apartment Market SummarySources and Notes:
i - Statistics Canada, Quarter-over-quartergrowth, annualized
ii - Statistics Canada, Year-over-yeargrowth for the most recently reportedmonth
iii - Bank of Canada, Rate from mostrecent Bank of Canada announcement
iv - Bank of Canada, rates for mostrecently completed month
8,0146,564
Third Quarter 2016 Third Quarter 2015
Real GDP GrowthQ2 2016 -1.6%
Toronto Employment GrowthSeptember 2016 -0.2%
Toronto Unemployment RateSeptember 2016 7.1%
Inflation (Yr./Yr. CPI Growth)September 2016 1.3%
Bank of Canada OvernightRateSeptember 2016 -- 0.50%
Prime RateSeptember 2016 -- 2.70%
2016 2015Sales Average Price Sales Average Price
Total TREB
Halton Region
Peel Region
City of Toronto
York Region
Durham Region
Other Areas
8,014 $415,643 6,564 $379,322
247 $437,482 210 $378,881
1,127 $316,199 926 $275,987
5,619 $440,096 4,632 $406,094
882 $396,964 655 $361,334
123 $323,148 131 $266,111
16 $236,216 10 $217,500
Third Quarter 2016
Third Quarter 2016Total TREB MLS®
Condo Apartment Rentals
Year-Over-Year Summary
1,6
1,6
1,6
2016 2015 % Chg.SalesNew ListingsActive ListingsAverage PriceAverage DOM
8,014 6,564 22.1%10,963 12,646 -13.3%3,965 6,659 -40.5%
$415,643 $379,322 9.6%25 32 -21.9%
Active listings refer to last month of quarter.i
Mortgage Rates September 20161 Year3 Year5 Year
3.14%3.39%4.64%
1 Year3 Year5 Year
----
1,6
Toronto Real Estate Board
Condo Market Report, Third Quarter 2016
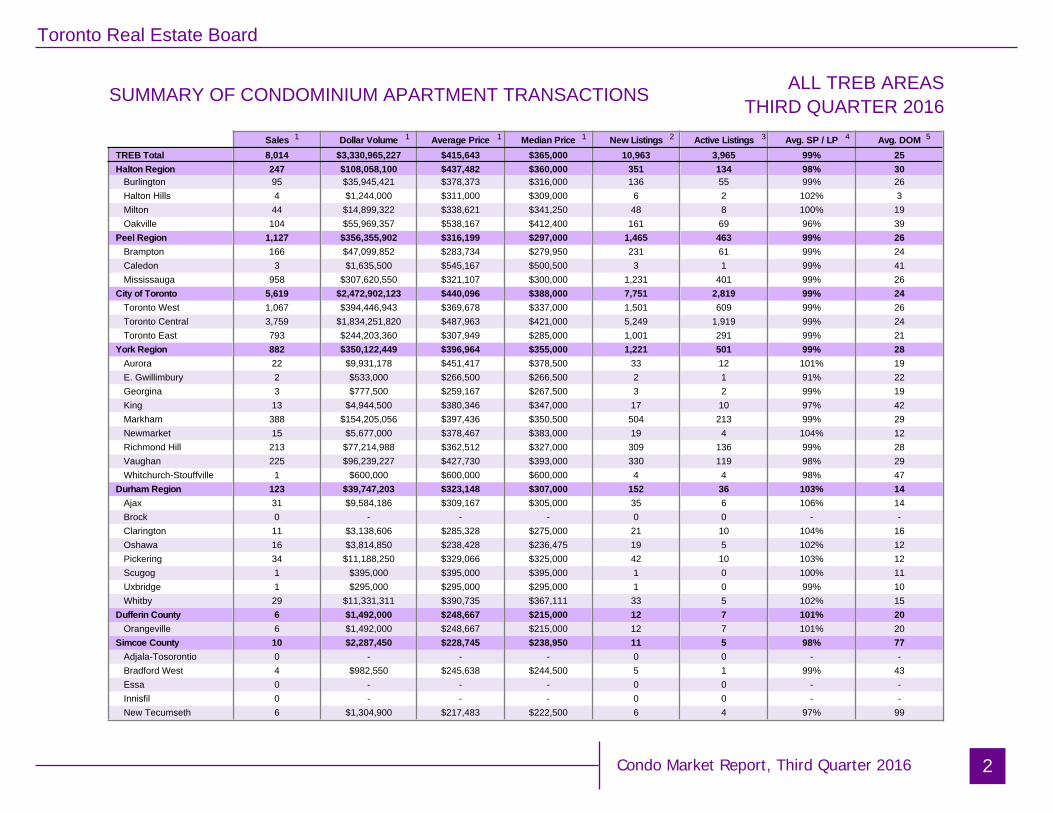
SUMMARY OF CONDOMINIUM APARTMENT TRANSACTIONS THIRD QUARTER 2016ALL TREB AREAS
2
Sales Dollar Volume Average Price Median Price New Listings Active Listings Avg. SP / LP Avg. DOMTREB TotalHalton Region
BurlingtonHalton HillsMiltonOakville
Peel RegionBramptonCaledonMississauga
City of TorontoToronto WestToronto CentralToronto East
York RegionAuroraE. GwillimburyGeorginaKingMarkhamNewmarketRichmond HillVaughanWhitchurch-Stouffville
Durham RegionAjaxBrockClaringtonOshawaPickeringScugogUxbridgeWhitby
Dufferin CountyOrangeville
Simcoe CountyAdjala-TosorontioBradford WestGwillimburyEssaInnisfilNew Tecumseth
8,014 $3,330,965,227 $415,643 $365,000 10,963 3,965 99% 25247 $108,058,100 $437,482 $360,000 351 134 98% 3095 $35,945,421 $378,373 $316,000 136 55 99% 264 $1,244,000 $311,000 $309,000 6 2 102% 344 $14,899,322 $338,621 $341,250 48 8 100% 19
104 $55,969,357 $538,167 $412,400 161 69 96% 391,127 $356,355,902 $316,199 $297,000 1,465 463 99% 26166 $47,099,852 $283,734 $279,950 231 61 99% 243 $1,635,500 $545,167 $500,500 3 1 99% 41
958 $307,620,550 $321,107 $300,000 1,231 401 99% 265,619 $2,472,902,123 $440,096 $388,000 7,751 2,819 99% 241,067 $394,446,943 $369,678 $337,000 1,501 609 99% 263,759 $1,834,251,820 $487,963 $421,000 5,249 1,919 99% 24793 $244,203,360 $307,949 $285,000 1,001 291 99% 21882 $350,122,449 $396,964 $355,000 1,221 501 99% 2822 $9,931,178 $451,417 $378,500 33 12 101% 192 $533,000 $266,500 $266,500 2 1 91% 223 $777,500 $259,167 $267,500 3 2 99% 1913 $4,944,500 $380,346 $347,000 17 10 97% 42
388 $154,205,056 $397,436 $350,500 504 213 99% 2915 $5,677,000 $378,467 $383,000 19 4 104% 12
213 $77,214,988 $362,512 $327,000 309 136 99% 28225 $96,239,227 $427,730 $393,000 330 119 98% 291 $600,000 $600,000 $600,000 4 4 98% 47
123 $39,747,203 $323,148 $307,000 152 36 103% 1431 $9,584,186 $309,167 $305,000 35 6 106% 140 - - - 0 0 - -11 $3,138,606 $285,328 $275,000 21 10 104% 1616 $3,814,850 $238,428 $236,475 19 5 102% 1234 $11,188,250 $329,066 $325,000 42 10 103% 121 $395,000 $395,000 $395,000 1 0 100% 111 $295,000 $295,000 $295,000 1 0 99% 1029 $11,331,311 $390,735 $367,111 33 5 102% 156 $1,492,000 $248,667 $215,000 12 7 101% 206 $1,492,000 $248,667 $215,000 12 7 101% 2010 $2,287,450 $228,745 $238,950 11 5 98% 770 - - - 0 0 - -4 $982,550 $245,638 $244,500 5 1 99% 430 - - - 0 0 - -0 - - - 0 0 - -6 $1,304,900 $217,483 $222,500 6 4 97% 99
1 1 1 1 2 3 4 5
Toronto Real Estate Board
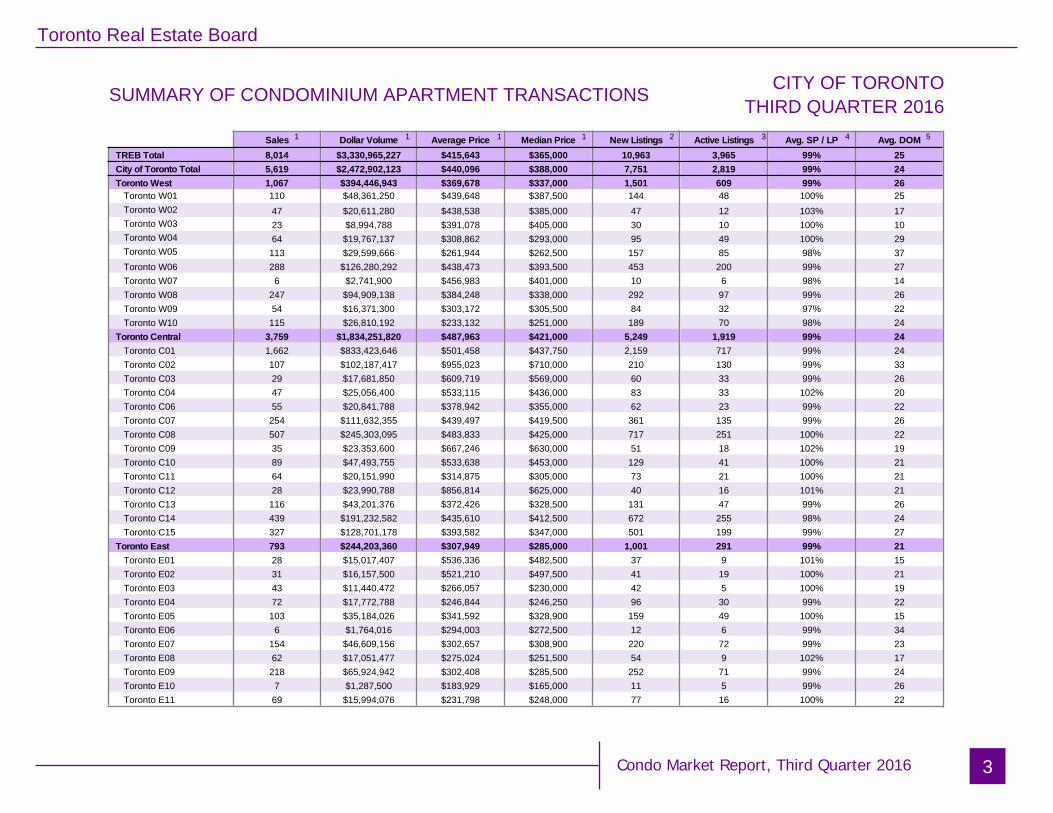
SUMMARY OF CONDOMINIUM APARTMENT TRANSACTIONS THIRD QUARTER 2016CITY OF TORONTO
3
Sales Dollar Volume Average Price Median Price New Listings Active Listings Avg. SP / LP Avg. DOMTREB TotalCity of Toronto TotalToronto West
Toronto W01Toronto W02Toronto W03Toronto W04Toronto W05Toronto W06Toronto W07Toronto W08Toronto W09Toronto W10
Toronto CentralToronto C01Toronto C02Toronto C03Toronto C04Toronto C06Toronto C07Toronto C08Toronto C09Toronto C10Toronto C11Toronto C12Toronto C13Toronto C14Toronto C15
Toronto EastToronto E01Toronto E02Toronto E03Toronto E04Toronto E05Toronto E06Toronto E07Toronto E08Toronto E09Toronto E10Toronto E11
8,014 $3,330,965,227 $415,643 $365,000 10,963 3,965 99% 255,619 $2,472,902,123 $440,096 $388,000 7,751 2,819 99% 241,067 $394,446,943 $369,678 $337,000 1,501 609 99% 26110 $48,361,250 $439,648 $387,500 144 48 100% 2547 $20,611,280 $438,538 $385,000 47 12 103% 1723 $8,994,788 $391,078 $405,000 30 10 100% 1064 $19,767,137 $308,862 $293,000 95 49 100% 29
113 $29,599,666 $261,944 $262,500 157 85 98% 37288 $126,280,292 $438,473 $393,500 453 200 99% 276 $2,741,900 $456,983 $401,000 10 6 98% 14
247 $94,909,138 $384,248 $338,000 292 97 99% 2654 $16,371,300 $303,172 $305,500 84 32 97% 22
115 $26,810,192 $233,132 $251,000 189 70 98% 243,759 $1,834,251,820 $487,963 $421,000 5,249 1,919 99% 241,662 $833,423,646 $501,458 $437,750 2,159 717 99% 24107 $102,187,417 $955,023 $710,000 210 130 99% 3329 $17,681,850 $609,719 $569,000 60 33 99% 2647 $25,056,400 $533,115 $436,000 83 33 102% 2055 $20,841,788 $378,942 $355,000 62 23 99% 22
254 $111,632,355 $439,497 $419,500 361 135 99% 26507 $245,303,095 $483,833 $425,000 717 251 100% 2235 $23,353,600 $667,246 $630,000 51 18 102% 1989 $47,493,755 $533,638 $453,000 129 41 100% 2164 $20,151,990 $314,875 $305,000 73 21 100% 2128 $23,990,788 $856,814 $625,000 40 16 101% 21
116 $43,201,376 $372,426 $328,500 131 47 99% 26439 $191,232,582 $435,610 $412,500 672 255 98% 24327 $128,701,178 $393,582 $347,000 501 199 99% 27793 $244,203,360 $307,949 $285,000 1,001 291 99% 2128 $15,017,407 $536,336 $482,500 37 9 101% 1531 $16,157,500 $521,210 $497,500 41 19 100% 2143 $11,440,472 $266,057 $230,000 42 5 100% 1972 $17,772,788 $246,844 $246,250 96 30 99% 22
103 $35,184,026 $341,592 $328,900 159 49 100% 156 $1,764,016 $294,003 $272,500 12 6 99% 34
154 $46,609,156 $302,657 $308,900 220 72 99% 2362 $17,051,477 $275,024 $251,500 54 9 102% 17
218 $65,924,942 $302,408 $285,500 252 71 99% 247 $1,287,500 $183,929 $165,000 11 5 99% 2669 $15,994,076 $231,798 $248,000 77 16 100% 22
Condo Market Report, Third Quarter 2016
1 1 1 1 2 3 4 5
Toronto Real Estate Board
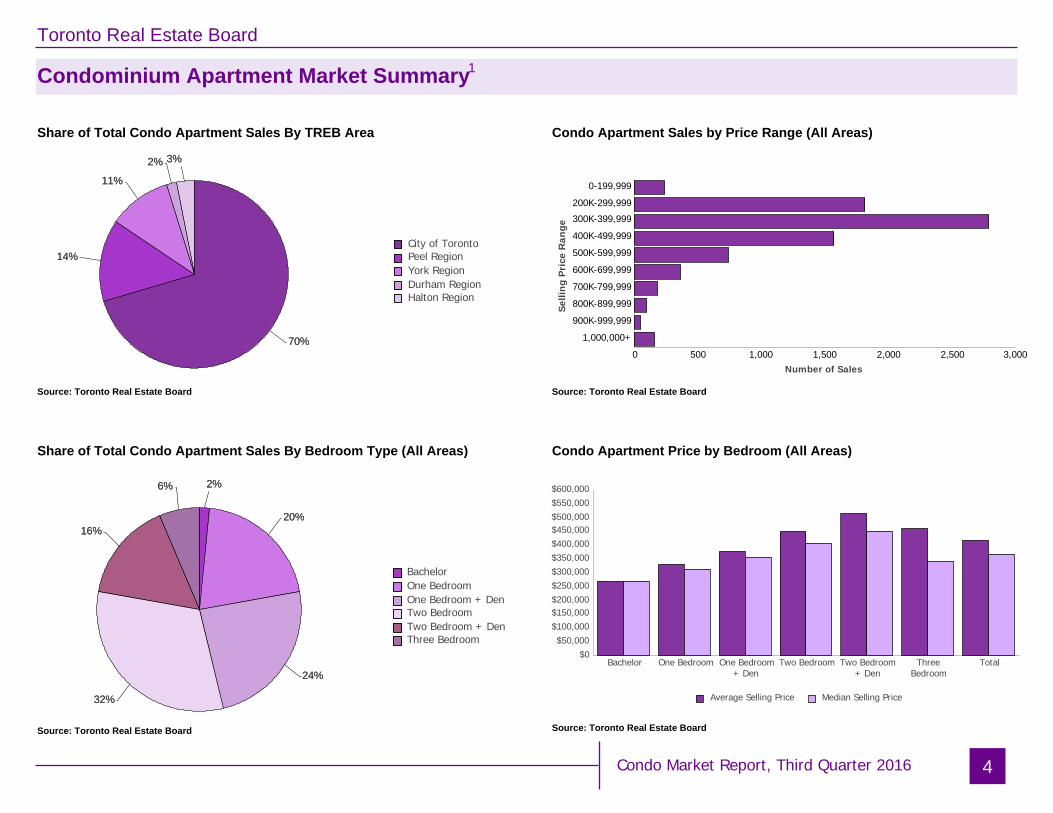
Condominium Apartment Market Summary
4
Condo Apartment Sales by Price Range (All Areas)
Source: Toronto Real Estate Board
Source: Toronto Real Estate Board
Condo Apartment Price by Bedroom (All Areas)
70%
14%
11%2% 3%
70%
14%
11%2% 3%
City of TorontoPeel RegionYork RegionDurham RegionHalton Region
2%
20%
24%
32%
16%
6% 2%
20%
24%
32%
16%
6%
BachelorOne BedroomOne Bedroom + DenTwo BedroomTwo Bedroom + DenThree Bedroom
0 500 1,000 1,500 2,000 2,500 3,000
0-199,999200K-299,999300K-399,999400K-499,999500K-599,999600K-699,999700K-799,999800K-899,999900K-999,999
1,000,000+
Selli
ng P
rice
Ran
ge
Number of Sales
$0$50,000
$100,000$150,000$200,000$250,000$300,000$350,000$400,000$450,000$500,000$550,000$600,000
Bachelor One Bedroom One Bedroom+ Den
Two Bedroom Two Bedroom+ Den
ThreeBedroom
Total
Average Selling Price Median Selling Price
Source: Toronto Real Estate Board
Source: Toronto Real Estate Board
Share of Total Condo Apartment Sales By TREB Area
Share of Total Condo Apartment Sales By Bedroom Type (All Areas)
Condo Market Report, Third Quarter 2016
1

Toronto Real Estate Board
Sub-Market Breakdown: Downtown Core
5
Condo Apartment Sales by Price Range (Downtown Core)
Source: Toronto Real Estate Board
Condo Apartment Price by Bedroom Type (Downtown Core)
Source: Toronto Real Estate Board
Source: Toronto Real Estate Board
Condo Apartment Sales By Bedroom Type (Downtown Core)
0 200 400 600 800
0-199,999
200K-299,999
300K-399,999
400K-499,999
500K-599,999
600K-699,999
700K-799,999
800K-899,999
900K-999,999
1,000,000+
Selli
ng P
rice
Ran
ge
Number of Sales
$0$100,000$200,000$300,000$400,000$500,000$600,000$700,000$800,000$900,000
$1,000,000$1,100,000$1,200,000
BachelorOne Bedroom
One Bedroom + DenTwo Bedroom
Two Bedroom + DenThree Bedroom
Total
Average Selling Price Median Selling Price0 100 200 300 400 500 600 700 800
97
641
695
480
219
36
Bachelor
One Bedroom
One Bedroom + Den
Two Bedroom
Two Bedroom + Den
Three Bedroom
Condo Market Report, Third Quarter 2016
1
Toronto Real Estate Board
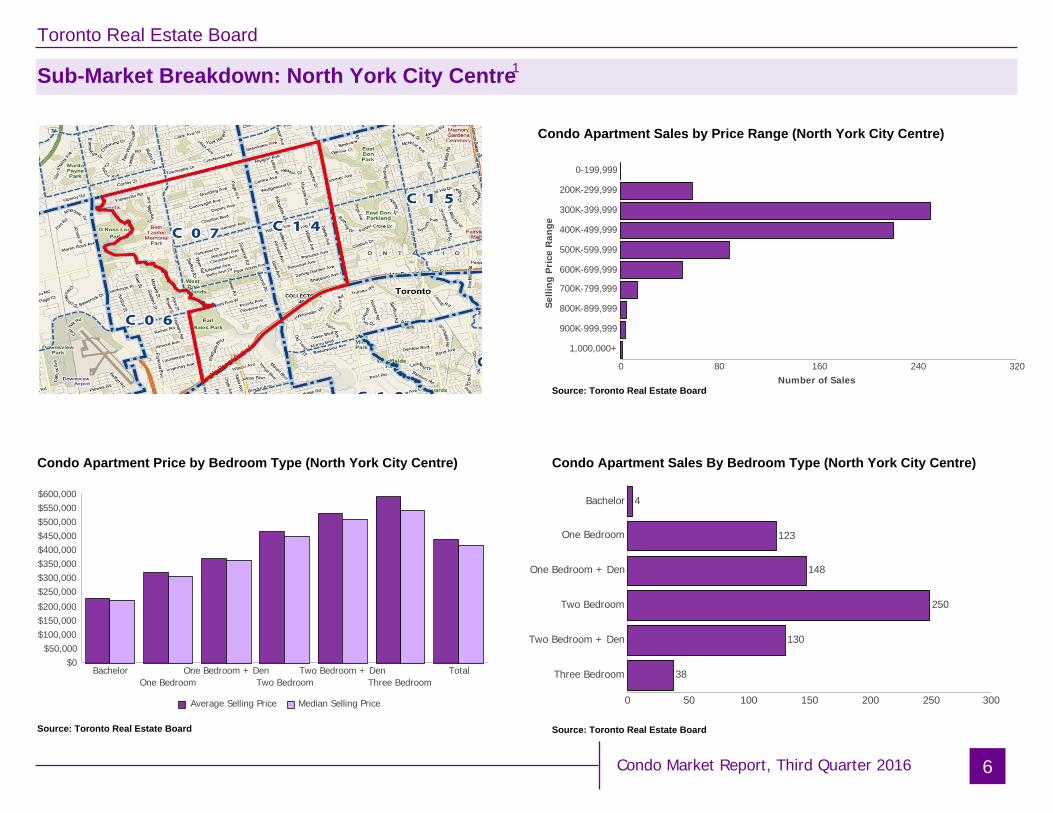
Sub-Market Breakdown: North York City Centre
6
Condo Apartment Sales by Price Range (North York City Centre)
Source: Toronto Real Estate Board
Condo Apartment Price by Bedroom Type (North York City Centre)
Source: Toronto Real Estate Board
Source: Toronto Real Estate Board
Condo Apartment Sales By Bedroom Type (North York City Centre)
0 50 100 150 200 250 300
4
123
148
250
130
38
Bachelor
One Bedroom
One Bedroom + Den
Two Bedroom
Two Bedroom + Den
Three Bedroom$0
$50,000$100,000$150,000$200,000$250,000$300,000$350,000$400,000$450,000$500,000$550,000$600,000
BachelorOne Bedroom
One Bedroom + DenTwo Bedroom
Two Bedroom + DenThree Bedroom
Total
Average Selling Price Median Selling Price
Condo Market Report, Third Quarter 2016
0 80 160 240 320
0-199,999
200K-299,999
300K-399,999
400K-499,999
500K-599,999
600K-699,999
700K-799,999
800K-899,999
900K-999,999
1,000,000+
Selli
ng P
rice
Ran
ge
Number of Sales
1
Toronto Real Estate Board
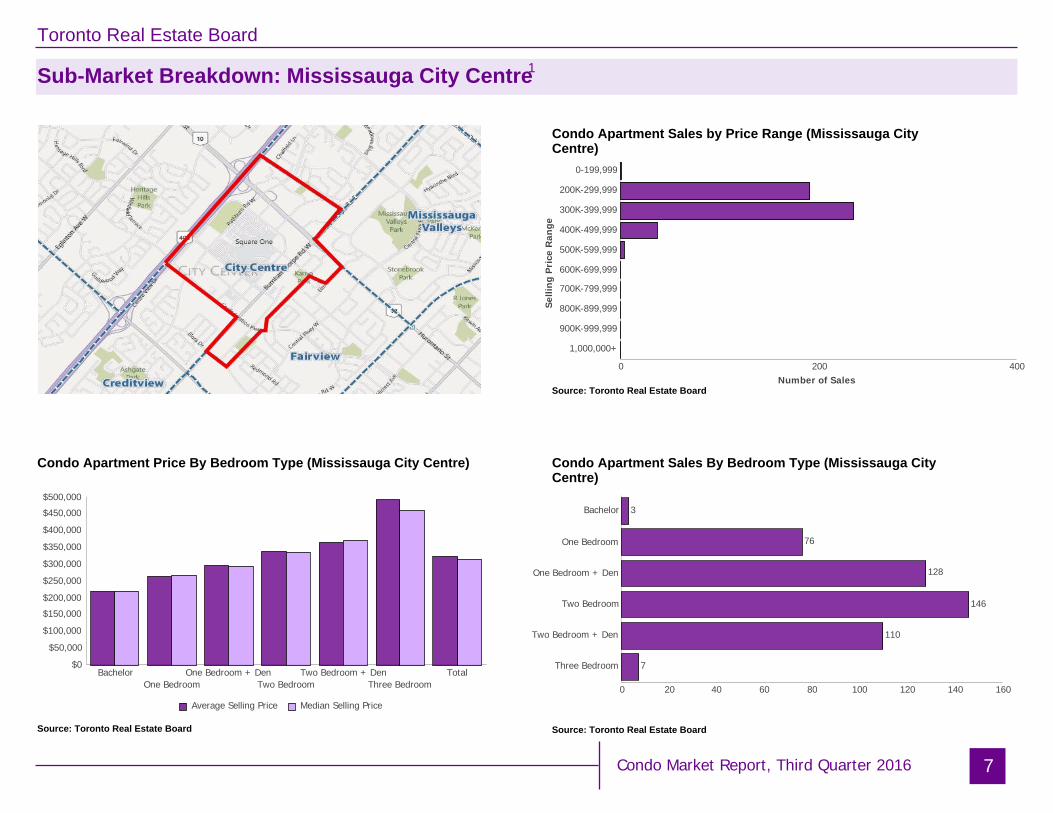
Sub-Market Breakdown: Mississauga City Centre
7
Condo Apartment Sales by Price Range (Mississauga CityCentre)
Source: Toronto Real Estate Board
Condo Apartment Price By Bedroom Type (Mississauga City Centre)
Source: Toronto Real Estate Board
Source: Toronto Real Estate Board
Condo Apartment Sales By Bedroom Type (Mississauga CityCentre)
0 20 40 60 80 100 120 140 160
3
76
128
146
110
7
Bachelor
One Bedroom
One Bedroom + Den
Two Bedroom
Two Bedroom + Den
Three Bedroom$0
$50,000
$100,000
$150,000$200,000
$250,000
$300,000
$350,000
$400,000
$450,000$500,000
BachelorOne Bedroom
One Bedroom + DenTwo Bedroom
Two Bedroom + DenThree Bedroom
Total
Average Selling Price Median Selling Price
Condo Market Report, Third Quarter 2016
0 200 400
0-199,999
200K-299,999
300K-399,999
400K-499,999
500K-599,999
600K-699,999
700K-799,999
800K-899,999
900K-999,999
1,000,000+
Selli
ng P
rice
Ran
ge
Number of Sales
1

Toronto Real Estate Board
Rental Market Summary
8
Tighter Rental Market Conditions in Q3 2016
Source: Toronto Real Estate Board
Number of Units Rented
Source: Toronto Real Estate Board
Average One-Bedroom Rents
Number of Units Listed
Source: Toronto Real Estate Board
The number of lease agreements signed for condominium apartments listedon TREB’s MLS® System was down by 4.8 per cent on a year-over-year basisto 9,164 in the third quarter of 2016 compared to 9,629 a year earlier. Overthe same period, the number of condominium apartments listed for rent wasdown by a greater annual rate of 17.3 per cent.
The dip in the supply of available rental units can be attributed, at least inpart, to fewer condominium project completions during the first three quartersof 2016 compared to last year.
Average one-bedroom and two-bedroom condominium apartment rents wereup substantially in the third quarter compared to 2015. The average one-bedroom rent was up by 7.2 per cent to $1,777. The average two-bedroomrent was up by 7.9 per cent to $2,419.
$0
$400
$800
$1,200
$1,600
$2,000
Total TREB Downtown Core North York City Centre Mississauga City Centre
20162015
Q3 2016 vs. Q3 2015
Q3 2016 vs. Q3 2015 Q3 2016 vs. Q3 2015
0
5001,000
1,5002,000
2,500
3,0003,500
4,0004,500
5,000
5,5006,000
Downtown Core North York City Centre Mississauga City Centre
20162015
0
500
1,000
1,500
2,000
2,500
3,000
3,500
4,000
4,500
Downtown Core North York City Centre Mississauga City Centre
20162015
Condo Market Report, Third Quarter 2016
Toronto Real Estate Board
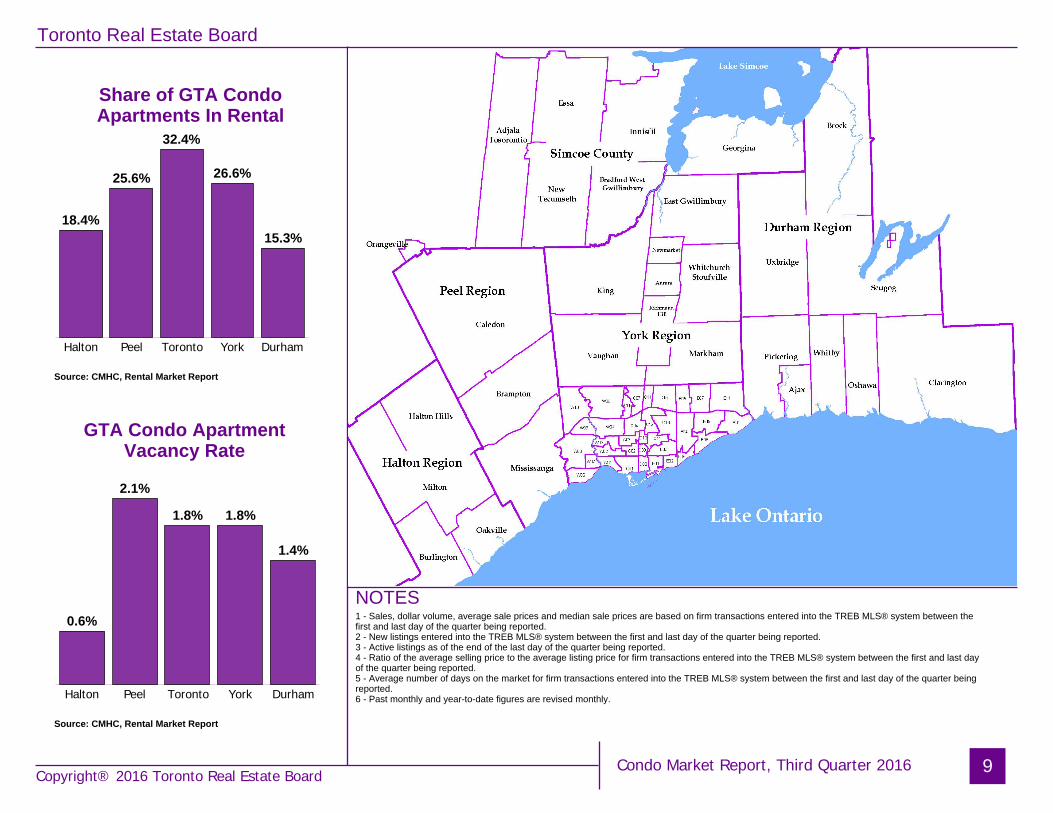
Share of GTA CondoApartments In Rental
NOTES1 - Sales, dollar volume, average sale prices and median sale prices are based on firm transactions entered into the TREB MLS® system between thefirst and last day of the quarter being reported.2 - New listings entered into the TREB MLS® system between the first and last day of the quarter being reported.3 - Active listings as of the end of the last day of the quarter being reported.4 - Ratio of the average selling price to the average listing price for firm transactions entered into the TREB MLS® system between the first and last dayof the quarter being reported.5 - Average number of days on the market for firm transactions entered into the TREB MLS® system between the first and last day of the quarter beingreported.6 - Past monthly and year-to-date figures are revised monthly.
9
Source: CMHC, Rental Market Report
Source: CMHC, Rental Market Report
18.4%
25.6%
32.4%
26.6%
15.3%
Halton Peel Toronto York Durham
0.6%
2.1%
1.8% 1.8%
1.4%
Halton Peel Toronto York Durham
GTA Condo ApartmentVacancy Rate
Condo Market Report, Third Quarter 2016 Copyright® 2016 Toronto Real Estate Board
Related Documents