
Welcome message from author
This document is posted to help you gain knowledge. Please leave a comment to let me know what you think about it! Share it to your friends and learn new things together.
Transcript


Treatment of Leachates from Urban Sanitary Landfills through
Integration of Biological and Photo-Chemical Oxidation Processes
combining Natural and Artificial Radiation
Thesis submitted in partial fulfilment of the requirements for the degree of
Doctor of Philosophy in Environmental Engineering, at the Faculty of
Engineering, University of Porto
Tânia Filomena Castro Valente Silva
Supervisor: Doutor Vítor Jorge Pais Vilar
Co-Supervisor: Doutor Rui Alfredo da Rocha Boaventura
LSRE-Laboratory of Separation and Reaction Engineering - Associate Laboratory LSRE-LCM
Department of Chemical Engineering
Faculty of Engineering
University of Porto
December, 2015


Acknowledgments
After four years of this doctoral program, it would not be entirely fair do not express my sincere thanks
to all of those who, directly or indirectly, have contributed to the concretization of this work.
First of all, I would like to deeply acknowledge to my supervisors, Dr. Vítor Vilar and Dr. Rui
Boaventura, the opportunity given me to perform this thesis under their guidance, as well as their
assiduous and enriching presence in the discussion and resolution of the difficulties encountered,
especially on troubled moments that have emerged during the work, and their constructive criticism that
have became precious, acknowledging that without their help and valuable knowledge it would not have
been possible to meet all the objectives.
A mention must be made to the following institutions that supported this work: the Foundation for
Science and Technology (FCT) for the doctoral grant (SFRH/BD/73510/2010); the Associated
Laboratory of Separation and Reaction Engineering (LSRE) and Catalysis Materials (LCM), Faculty of
Engineering of the University of Porto (FEUP). The project PEst-C/EQB/LA0020/2013, financed by
FCT and FEDER through COMPETE, and by QREN, ON2 (North Portugal Regional Operational
Programme) and FEDER through project NORTE-07-0124-FEDER- 0000008.
I am very grateful to EFACEC Engineering and Systems, S.A, mainly to Eng. Amélia Fonseca and Eng.
Isabel Saraiva, for the financial and technical support, providing me the infrastructures and required
conditions, without which this research would not have been possible.
I gratefully acknowledge to all workers of the sanitary landfill where this research was conducted, who
have always received me willingly and let me use their facilities to develop my work. Especially, I would
like to acknowledge to Dr. Andreia Costa and Sr. Nuno Barbosa, who became good friends, for sharing
their workspace and their knowledge with me, for always help me when I needed and for making my
days more pleasant.
I also am very thankful for the collaborative work developed with: Dr. Elisabete Silva and Dr. Ana
Cunha-Queda, from the School of Technology of the Polytechnic Institute of Viseu (ESTGV) and
Faculty of Agricultural Sciences (ISA) of the Technical University of Lisbon (UTL); Dr. Augusta Sousa,
Dr. Carlos Gonçalves and Dr. Fátima Alpendurada from the Water Institute of the Northern Region
(IAREN); and Dr. Joana Bondoso, Dr. Rita Lopes and Dr. Olga Nunes from Laboratory from Process
Engineering, Environment, Biotechnology and Energy (LEPABE).

A special thanks for those who somehow helped me, contributing for the accomplishment of my work:
Petrick Soares, Rui Gomes, Diego Manenti, Bruno Souza, Carmen Rodrigues, Eloísa Vieira and Juan
Soller.
I would like to thank to all my colleagues at LSRE for the partnership and good work environment, over
the last few years. Thanks to those who shared with me many refreshing morning coffees, peculiar
lunches and lab routines: André Fonseca, André Monteiro, Petrick Soares, João Pereira, Ariana Pintor,
Livia Xerez, Filipe Lopes, Joana Pereira, Francisca Moreira, Tatiana Pozdniakova, Catarina Ferreira,
Fabiola Hackbarth and Caio Rodrigues-Silva.
A particular thanks to my friends Diana Machado, Raquel Rocha and Sofia Lima for the great moments
of conviviality, for supporting me along the trodden way and mostly for their genuine friendship over
the past few years.
To my family, especially my parents and my brother, I express my frank acknowledgment, for all the
help and strength that always instilled in me throughout my personal and academic life.
Finally, to my husband, Bruno, I would like to express my sincere gratitude for his love, friendship and
support in all times, for have given me strength in the most difficult moments and for the encouragement
along this journey.
To all my genuine thanks!

With love to my parents, brother and husband

Abstract
vii
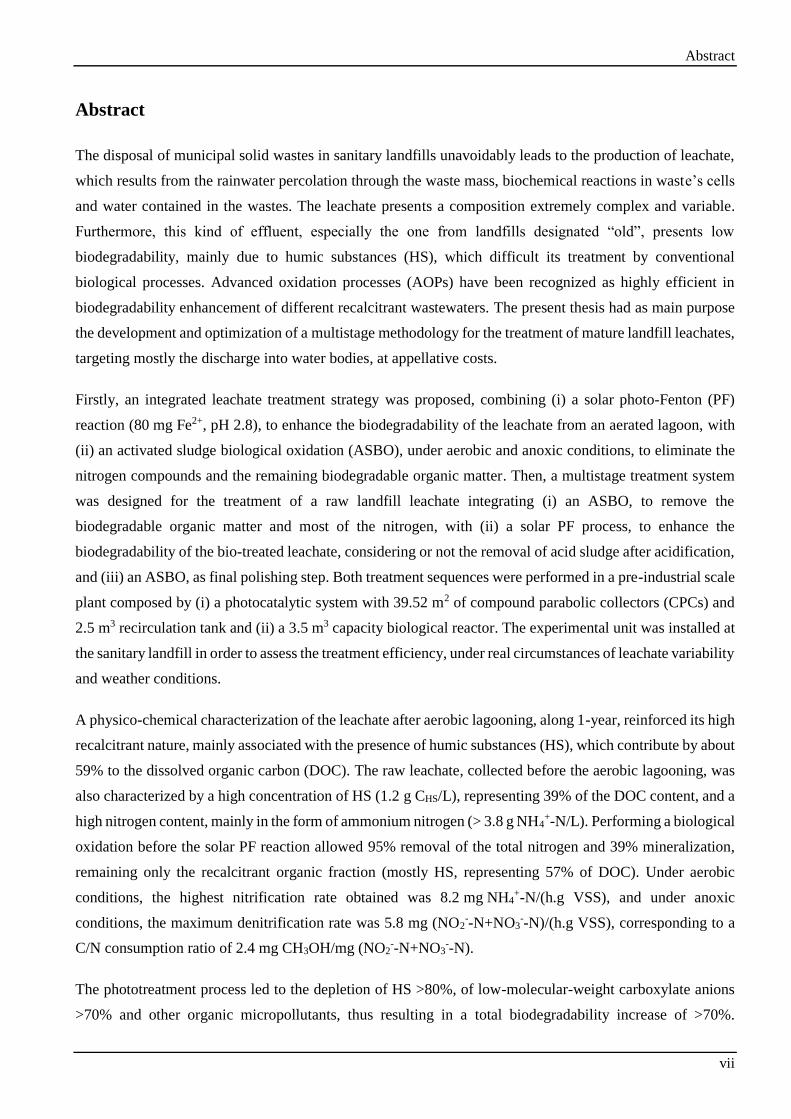
Abstract
The disposal of municipal solid wastes in sanitary landfills unavoidably leads to the production of leachate,
which results from the rainwater percolation through the waste mass, biochemical reactions in waste’s cells
and water contained in the wastes. The leachate presents a composition extremely complex and variable.
Furthermore, this kind of effluent, especially the one from landfills designated “old”, presents low
biodegradability, mainly due to humic substances (HS), which difficult its treatment by conventional
biological processes. Advanced oxidation processes (AOPs) have been recognized as highly efficient in
biodegradability enhancement of different recalcitrant wastewaters. The present thesis had as main purpose
the development and optimization of a multistage methodology for the treatment of mature landfill leachates,
targeting mostly the discharge into water bodies, at appellative costs.
Firstly, an integrated leachate treatment strategy was proposed, combining (i) a solar photo-Fenton (PF)
reaction (80 mg Fe2+, pH 2.8), to enhance the biodegradability of the leachate from an aerated lagoon, with
(ii) an activated sludge biological oxidation (ASBO), under aerobic and anoxic conditions, to eliminate the
nitrogen compounds and the remaining biodegradable organic matter. Then, a multistage treatment system
was designed for the treatment of a raw landfill leachate integrating (i) an ASBO, to remove the
biodegradable organic matter and most of the nitrogen, with (ii) a solar PF process, to enhance the
biodegradability of the bio-treated leachate, considering or not the removal of acid sludge after acidification,
and (iii) an ASBO, as final polishing step. Both treatment sequences were performed in a pre-industrial scale
plant composed by (i) a photocatalytic system with 39.52 m2 of compound parabolic collectors (CPCs) and
2.5 m3 recirculation tank and (ii) a 3.5 m3 capacity biological reactor. The experimental unit was installed at
the sanitary landfill in order to assess the treatment efficiency, under real circumstances of leachate variability
and weather conditions.
A physico-chemical characterization of the leachate after aerobic lagooning, along 1-year, reinforced its high
recalcitrant nature, mainly associated with the presence of humic substances (HS), which contribute by about
59% to the dissolved organic carbon (DOC). The raw leachate, collected before the aerobic lagooning, was
also characterized by a high concentration of HS (1.2 g CHS/L), representing 39% of the DOC content, and a
high nitrogen content, mainly in the form of ammonium nitrogen (> 3.8 g NH4+-N/L). Performing a biological
oxidation before the solar PF reaction allowed 95% removal of the total nitrogen and 39% mineralization,
remaining only the recalcitrant organic fraction (mostly HS, representing 57% of DOC). Under aerobic
conditions, the highest nitrification rate obtained was 8.2 mg NH4+-N/(h.g VSS), and under anoxic
conditions, the maximum denitrification rate was 5.8 mg (NO2--N+NO3
--N)/(h.g VSS), corresponding to a
C/N consumption ratio of 2.4 mg CH3OH/mg (NO2--N+NO3
--N).
The phototreatment process led to the depletion of HS >80%, of low-molecular-weight carboxylate anions
>70% and other organic micropollutants, thus resulting in a total biodegradability increase of >70%.

Abstract
viii
However, it was observed that the photo-reaction efficiency was strongly affected by the (i) weather
conditions, mainly due to low irradiances and temperatures in the winter season, associated to the effects of
the Fenton thermal reaction and molar fraction of ferric species, (ii) presence of humic acids, related to the
dark-brown colour intrinsic to leachates, (iii) high amount of total suspended solids (TSS), resulting from
the precipitation of some organic compounds with ferric ions, after acidification and during reaction, and (iv)
high amounts of sulphate ions provided by the sulphuric acid addition to perform the initial acidification for
the PF reaction. The non-elimination of the produced acid sludge decreases the PF reaction efficiency
(~30%), due to the low light transmission caused by the high amount of TSS that compete with H2O2 and
iron species as photons absorbers. Besides, higher amounts of H2O2 and energy were required for the
degradation of additional particulate organic matter. The low temperatures observed during the winter
likewise affected the biological process after the chemical oxidation step.
The combined use of PF and ASBO processes allowed to obtain a final treated leachate in compliance with
legal discharge limits regarding water bodies, imposed by Portuguese Legislation, with the exception of
sulphate ions. However, even at optimal conditions, a scale-up of the PF system (considering the
consumption of 180 mM of H2O2 and 30 kJUV/L of accumulated UV energy), for the treatment of 100 m3 per
day of a sanitary landfill leachate previously treated in a biological system, revealed the need of 6056 m2 of
CPCs or 39 UV lamps (with 4kW and 20,000-h of lifetime each) to achieve a COD of 150 mg O2/L by a
subsequent ASBO. Combining natural and artificial radiation, it would be need 3862 m2 of CPCs and 30 UV
lamps. Total PF costs were calculated based on the project’s contingencies, engineering and setup, spare
parts, personnel, maintenance, electricity and chemicals supplies. Thus, the total unitary costs at the optimal
conditions were (i) 11.0 €/m3 using only CPCs, (ii) 11.7 €/m3 resorting just to UV lamps, and (iii) 10.9 €/m3
combining CPCs and UV lamps. The cost of the H2O2 reactant represents more than 30% of the total yearly
cost.
Considering all drawbacks and the high treatment costs associated to the PF reaction, the implementation of
a preliminary biological nitrification followed by a physico-chemical process seemed to be the best option
to reduce the amount of sulphates and photons absorbers species, respectively, during photo-oxidation. So,
it was decided to adapt the pre-industrial plant to work according to this new methodology. However, in the
meantime, complementary tests, at lab-scale, were performed, in order to assess the effect of (i) the main PF
reaction variables on the treatment of a leachate collected at the end of a leachate treatment plant (LTP),
which includes aerated lagooning followed by aerated activated sludge and a final coagulation-flocculation
step, and (ii) the main nitrification and denitrification variables on the nitrogen's biological removal via
nitrite, from mature leachates.
The best PF reaction rate was obtained for: pH = 2.8 (acidification agent: H2SO4); T = 30 ºC;
[Fe2+] = 60 mg/L and UV irradiance = 44 WUV/m2, achieving 72% mineralization after 25 kJUV/L of
accumulated UV energy and 149 mM of H2O2 consumed. The denitrification process, which was mediated

Abstract
ix
by bacteria from the genus Hyphomicrobium, showed to be sensitive to variations in the pH, temperature and
phosphate concentration. While, the nitrification reaction, which was mediated by bacteria from the family
Nitrosomonadaceae, did not suffer significant change when DO content was changed, but showed itself
susceptible to pH and temperature variations.
Finally, it was adopted an integrated leachate treatment strategy, involving (i) ASBO, under aerobic
conditions, to remove leachate’s alkalinity and the biodegradable organic carbon fraction (ii) a
coagulation/sedimentation step (240 mg Fe3+/L, at pH 4.2, 14-hours settling), to promote humic acids
precipitation and reduce the amount of TSS, and (iii) photo-oxidation through PF reaction (60 mg Fe2+, at
pH 2.8), combining solar and artificial radiation (given the reduced solar energy in winter time), to promote
the recalcitrant molecules degradation and consequent biodegradability enhancement, until the point (DOC
≈ 250 mg/L) wherein a downstream biological treatment would allow to meet the discharge limit into water
bodies (COD < 150 mg O2/L).
The results demonstrate that the ASBO applied to a leachate after aerobic lagooning, with high organic and
nitrogen content and low biodegradability, was capable to oxidise between 62 and 99% of the ammonium
nitrogen, consuming only its own alkalinity, which means alkalinity reductions between 70 and 100%. The
coagulation/sedimentation stage led to the humic acids precipitation, promoting a marked change in leachate
colour, from dark-brown to yellowish-brown (related to fulvic acids), accompanied by reductions up to 66%
on DOC and 92% on TSS, obtaining an amount of acid sludge of about 300 mL/L. These pre-treatments led
to an effluent in agreement with the sulphate discharge limit (2 g/L) into water bodies.
From the PF trials, it was concluded that the best option would be combining natural sunlight with artificial
radiation (~1.3 kW/m3), thus optimizing the indirect costs. According to Zahn-Wellens test, a leachate after
coagulation (419 mg DOC/L) would have to be photo-oxidized until a DOC lesser than 300 mg/L, consuming
about 100 mM of H2O2 and 7.4 kJ/L of accumulated UV energy, in order to achieve an effluent than can be
biologically treated in compliance with the COD discharge limit into water bodies. The biological process
subsequent to the photocatalytic system would promote a 59% mineralization, being the final COD of
approximately 115 mg O2/L.
The scale-up of a PF facility with a capacity to treat 100 m3 of leachate/day showed the need to implement
1500 m2 of CPCs or 38 UV-Vis lamps (4kW, 20,000-h of lifetime, working 6 daily hours), targeting a COD
< 150 mg O2/L. Combining solar and artificial radiation, it would be need 957 m2 of CPCs and 30 lamps
(considering the month of lesser and higher irradiance, respectively). The cost of the PF step decreased by
about 50% when compared to the initial approach: 5.7 €/m3, resorting just to CPCs; 5.8 €/m3, using only UV-
Vis Lamps; and 5.7 €/m3, combining CPCs and lamps. The cost with H2O2 corresponds to about 44% of the
total yearly cost.

Resumo
xi
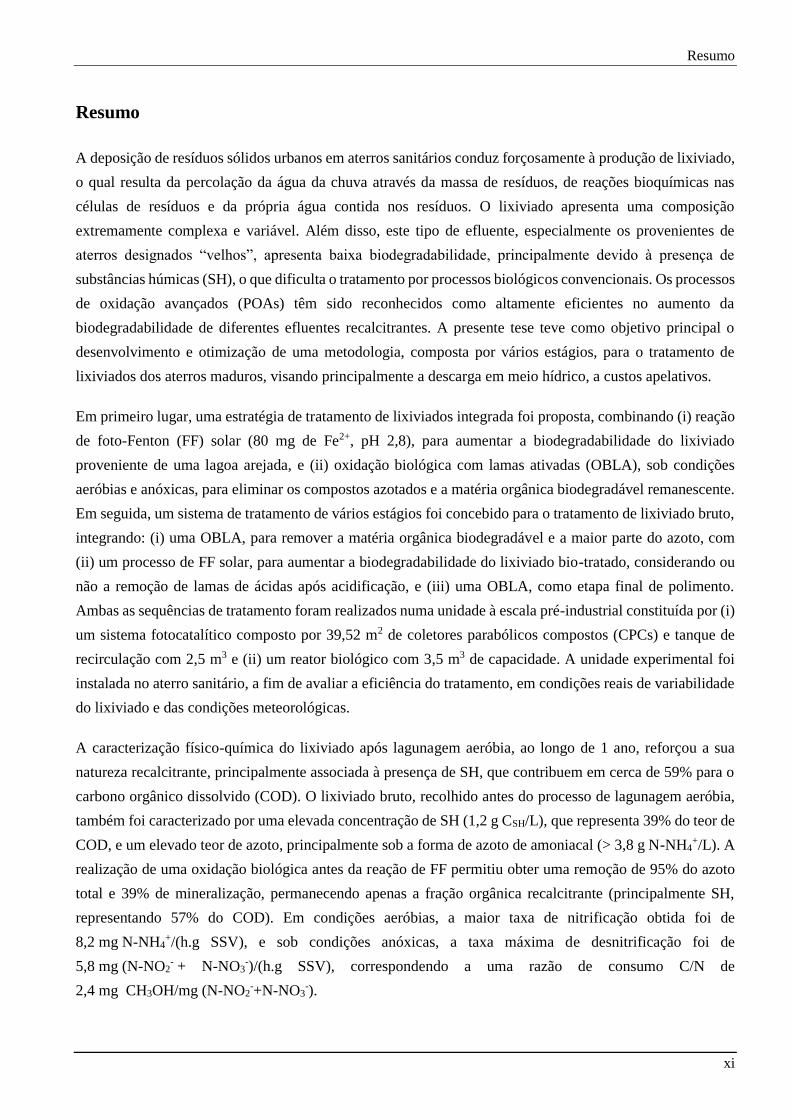
Resumo
A deposição de resíduos sólidos urbanos em aterros sanitários conduz forçosamente à produção de lixiviado,
o qual resulta da percolação da água da chuva através da massa de resíduos, de reações bioquímicas nas
células de resíduos e da própria água contida nos resíduos. O lixiviado apresenta uma composição
extremamente complexa e variável. Além disso, este tipo de efluente, especialmente os provenientes de
aterros designados “velhos”, apresenta baixa biodegradabilidade, principalmente devido à presença de
substâncias húmicas (SH), o que dificulta o tratamento por processos biológicos convencionais. Os processos
de oxidação avançados (POAs) têm sido reconhecidos como altamente eficientes no aumento da
biodegradabilidade de diferentes efluentes recalcitrantes. A presente tese teve como objetivo principal o
desenvolvimento e otimização de uma metodologia, composta por vários estágios, para o tratamento de
lixiviados dos aterros maduros, visando principalmente a descarga em meio hídrico, a custos apelativos.
Em primeiro lugar, uma estratégia de tratamento de lixiviados integrada foi proposta, combinando (i) reação
de foto-Fenton (FF) solar (80 mg de Fe2+, pH 2,8), para aumentar a biodegradabilidade do lixiviado
proveniente de uma lagoa arejada, e (ii) oxidação biológica com lamas ativadas (OBLA), sob condições
aeróbias e anóxicas, para eliminar os compostos azotados e a matéria orgânica biodegradável remanescente.
Em seguida, um sistema de tratamento de vários estágios foi concebido para o tratamento de lixiviado bruto,
integrando: (i) uma OBLA, para remover a matéria orgânica biodegradável e a maior parte do azoto, com
(ii) um processo de FF solar, para aumentar a biodegradabilidade do lixiviado bio-tratado, considerando ou
não a remoção de lamas de ácidas após acidificação, e (iii) uma OBLA, como etapa final de polimento.
Ambas as sequências de tratamento foram realizados numa unidade à escala pré-industrial constituída por (i)
um sistema fotocatalítico composto por 39,52 m2 de coletores parabólicos compostos (CPCs) e tanque de
recirculação com 2,5 m3 e (ii) um reator biológico com 3,5 m3 de capacidade. A unidade experimental foi
instalada no aterro sanitário, a fim de avaliar a eficiência do tratamento, em condições reais de variabilidade
do lixiviado e das condições meteorológicas.
A caracterização físico-química do lixiviado após lagunagem aeróbia, ao longo de 1 ano, reforçou a sua
natureza recalcitrante, principalmente associada à presença de SH, que contribuem em cerca de 59% para o
carbono orgânico dissolvido (COD). O lixiviado bruto, recolhido antes do processo de lagunagem aeróbia,
também foi caracterizado por uma elevada concentração de SH (1,2 g CSH/L), que representa 39% do teor de
COD, e um elevado teor de azoto, principalmente sob a forma de azoto de amoniacal (> 3,8 g N-NH4+/L). A
realização de uma oxidação biológica antes da reação de FF permitiu obter uma remoção de 95% do azoto
total e 39% de mineralização, permanecendo apenas a fração orgânica recalcitrante (principalmente SH,
representando 57% do COD). Em condições aeróbias, a maior taxa de nitrificação obtida foi de
8,2 mg N-NH4+/(h.g SSV), e sob condições anóxicas, a taxa máxima de desnitrificação foi de
5,8 mg (N-NO2- + N-NO3
-)/(h.g SSV), correspondendo a uma razão de consumo C/N de
2,4 mg CH3OH/mg (N-NO2-+N-NO3
-).

Resumo
xii
O processo de fototratamento conduziu à depleção de SH (>80%), de carboxilatos de baixo peso molecular
(>70%) e outros micro-poluentes, resultando assim num aumento total de biodegradabilidade maior do que
70%. Contudo, a eficácia da foto-reação foi claramente afetada (i) pelas condições meteorológicas,
principalmente devido aos baixos níveis de irradiância e temperaturas no inverno, associados aos efeitos da
reação térmica de Fenton e da fração molar das espécies férricas, (ii) pela presença de ácidos húmicos,
relacionada com a cor castanho-escuro intrínseca dos lixiviados, (iii) pela quantidade elevada de sólidos
suspensos totais (SST), resultantes da precipitação de alguns compostos orgânicos com iões férricos, após
acidificação e durante a reação, e (iv) pelas quantidades elevadas de iões de sulfato providos pela adição de
ácido sulfúrico para realizar a acidificação inicial da reação de FF. O facto de não eliminar as lamas ácidas
produzidas contribui para a diminuição da eficiência da reação de FF (~30%), devido à baixa
transmissibilidade da luz provocada pela elevada quantidade de SST, que competem com o H2O2 e as
espécies de ferro como absorvedores de fotões. Além disso, foram necessárias quantidades mais elevadas de
H2O2 e de energia para a degradação da matéria orgânica particulada adicional. As baixas temperaturas
observadas durante o inverno afetaram de igual modo o processo biológico após a etapa de oxidação química.
O uso combinado dos processos de FF e de OBLA permitiu obter um lixiviado tratado em conformidade
com os limites de descarga legais em meio hídrico, impostos pela legislação portuguesa, com a exceção do
iões sulfato. Todavia, mesmo em condições ideais, o scale-up do sistema FF (considerando-se o consumo de
180 mM de H2O2 e 30 kJUV/L de energia UV acumulado), para o tratamento de 100 m3 por dia de um lixiviado
de aterro sanitário tratado previamente num sistema biológico, revelou a necessidade de 6056 m2 de CPCs
ou 39 lâmpadas UV (com 4 kW e 20.000 h de tempo de vida, cada uma) para atingir uma CQO de
150 mg O2/L numa OBLA subsequente. Combinando radiação natural e artificial, seriam necessários
3862 m2 de CPCs e 30 lâmpadas UV. Os custos totais da etapa de FF foram calculados considerando
contingências de projeto, engenharia e montagem, peças de reposição, pessoal, manutenção, energia elétrica
e produtos químicos. Assim, o custo total unitário, em condições ótimas, foram: (i) 11,0 €/m3, utilizando
apenas CPCs, (ii) 11,7 €/m3, recorrendo apenas a lâmpadas UV, e (iii) 10,9 €/m3, combinando CPCs e
lâmpadas UV. O custo do H2O2 representa mais de 30% do custo total anual.
Considerando todas as desvantagens e os elevados custos de tratamento associados à reação de FF, a
aplicação de uma nitrificação preliminar, seguido por um processo físico-químico pareceu ser a melhor opção
para reduzir a quantidade de sulfatos e de espécies absorvedores de fotões, respetivamente, durante a
foto-oxidação. Assim, decidiu-se adaptar a unidade pré-industrial para trabalhar de acordo com esta nova
metodologia. No entanto, nesse meio tempo, testes complementares, à escala laboratorial, foram realizados,
de forma a avaliar o efeito (i) das principais variáveis da reação de FF no tratamento de lixiviados recolhidos
no final de uma estação de tratamento de lixiviados (ETL), que inclui lagunagem aeróbia, seguido por lamas
ativadas, em regime aeróbico, e uma etapa final de coagulação-floculação, e (ii) as principais variáveis de
nitrificação e desnitrificação, na remoção biológica do azoto de lixiviados maduros, via nitrito.
A melhor velocidade da reação de FF foi obtida nas seguintes condições: pH = 2,8 (agente de acidificação:
H2SO4); T = 30 ºC; [Fe2+] = 60 mg/L e irradiância UV = 44 WUV/m2, alcançando uma mineralização de 72%,
Resumo
xiii
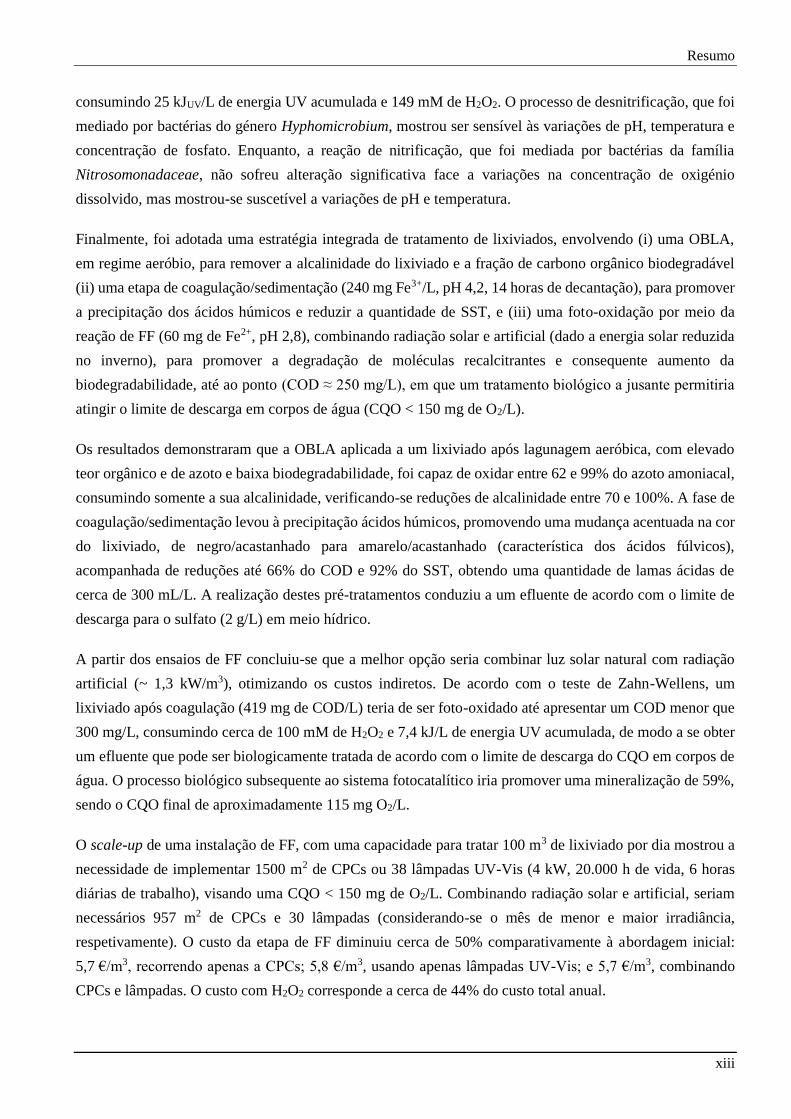
consumindo 25 kJUV/L de energia UV acumulada e 149 mM de H2O2. O processo de desnitrificação, que foi
mediado por bactérias do género Hyphomicrobium, mostrou ser sensível às variações de pH, temperatura e
concentração de fosfato. Enquanto, a reação de nitrificação, que foi mediada por bactérias da família
Nitrosomonadaceae, não sofreu alteração significativa face a variações na concentração de oxigénio
dissolvido, mas mostrou-se suscetível a variações de pH e temperatura.
Finalmente, foi adotada uma estratégia integrada de tratamento de lixiviados, envolvendo (i) uma OBLA,
em regime aeróbio, para remover a alcalinidade do lixiviado e a fração de carbono orgânico biodegradável
(ii) uma etapa de coagulação/sedimentação (240 mg Fe3+/L, pH 4,2, 14 horas de decantação), para promover
a precipitação dos ácidos húmicos e reduzir a quantidade de SST, e (iii) uma foto-oxidação por meio da
reação de FF (60 mg de Fe2+, pH 2,8), combinando radiação solar e artificial (dado a energia solar reduzida
no inverno), para promover a degradação de moléculas recalcitrantes e consequente aumento da
biodegradabilidade, até ao ponto (COD ≈ 250 mg/L), em que um tratamento biológico a jusante permitiria
atingir o limite de descarga em corpos de água (CQO < 150 mg de O2/L).
Os resultados demonstraram que a OBLA aplicada a um lixiviado após lagunagem aeróbica, com elevado
teor orgânico e de azoto e baixa biodegradabilidade, foi capaz de oxidar entre 62 e 99% do azoto amoniacal,
consumindo somente a sua alcalinidade, verificando-se reduções de alcalinidade entre 70 e 100%. A fase de
coagulação/sedimentação levou à precipitação ácidos húmicos, promovendo uma mudança acentuada na cor
do lixiviado, de negro/acastanhado para amarelo/acastanhado (característica dos ácidos fúlvicos),
acompanhada de reduções até 66% do COD e 92% do SST, obtendo uma quantidade de lamas ácidas de
cerca de 300 mL/L. A realização destes pré-tratamentos conduziu a um efluente de acordo com o limite de
descarga para o sulfato (2 g/L) em meio hídrico.
A partir dos ensaios de FF concluiu-se que a melhor opção seria combinar luz solar natural com radiação
artificial (~ 1,3 kW/m3), otimizando os custos indiretos. De acordo com o teste de Zahn-Wellens, um
lixiviado após coagulação (419 mg de COD/L) teria de ser foto-oxidado até apresentar um COD menor que
300 mg/L, consumindo cerca de 100 mM de H2O2 e 7,4 kJ/L de energia UV acumulada, de modo a se obter
um efluente que pode ser biologicamente tratada de acordo com o limite de descarga do CQO em corpos de
água. O processo biológico subsequente ao sistema fotocatalítico iria promover uma mineralização de 59%,
sendo o CQO final de aproximadamente 115 mg O2/L.
O scale-up de uma instalação de FF, com uma capacidade para tratar 100 m3 de lixiviado por dia mostrou a
necessidade de implementar 1500 m2 de CPCs ou 38 lâmpadas UV-Vis (4 kW, 20.000 h de vida, 6 horas
diárias de trabalho), visando uma CQO < 150 mg de O2/L. Combinando radiação solar e artificial, seriam
necessários 957 m2 de CPCs e 30 lâmpadas (considerando-se o mês de menor e maior irradiância,
respetivamente). O custo da etapa de FF diminuiu cerca de 50% comparativamente à abordagem inicial:
5,7 €/m3, recorrendo apenas a CPCs; 5,8 €/m3, usando apenas lâmpadas UV-Vis; e 5,7 €/m3, combinando
CPCs e lâmpadas. O custo com H2O2 corresponde a cerca de 44% do custo total anual.


Table of Contents
xv
Table of Contents
Page
1 Introduction .................................................................................................................................. .……... ... 1
1.1 Production and disposal of solid waste .................................................................................................. 3
1.2 Production, composition and characterization of landfill leachates ....................................................... 8
1.3 Leachate treatment systems .................................................................................................................. 14
1.3.1 Leachate channelling ................................................................................................................ 19
1.3.2 Biological degradation .............................................................................................................. 19
1.3.3 Physical and chemical processes............................................................................................... 21
1.3.4 Membrane filtration .................................................................................................................. 24
1.3.5 Leachate treatment systems in Portugal .................................................................................... 26
1.4 Advanced oxidation processes ............................................................................................................. 28
1.5 Aim of the work and thesis outline....................................................................................................... 36
1.6 References ............................................................................................................................................ 40
2 Materials and methods ............................................................................................................................. . 49
2.1 Chemicals ............................................................................................................................................. 51
2.2 Experimental setups ............................................................................................................................. 54
2.2.1 Solar pre-industrial scale plant .................................................................................................. 54
2.2.2 Lab-scale photoreactor .............................................................................................................. 59
2.2.3 Lab-scale biological reactor ...................................................................................................... 61
2.2.4 Solar/UV pre-industrial scale plant ........................................................................................... 63
2.3 Experimental procedure ....................................................................................................................... 69
2.3.1 Solar pre-industrial scale experiments ...................................................................................... 69
2.3.2 Lab-scale photo-Fenton experiments ........................................................................................ 72
2.3.3 Lab-scale biological experiments.............................................................................................. 73
2.3.4 Solar/UV pre-industrial scale experiments ............................................................................... 74
2.4 Analytical methods ............................................................................................................................... 76
2.5 Biodegradability assays ........................................................................................................................ 79
2.6 Target and non-target screening of persistent organic micropollutants ................................................ 80
2.7 16S rRNA gene barcode 454-pyrosequencing ..................................................................................... 81
2.7.1 DNA extraction and 454-pyrosequencing analysis ................................................................... 81
2.7.2 Post run analysis ....................................................................................................................... 81
2.8 References ............................................................................................................................................ 83
3 Integration of solar photo-Fenton and biological oxidation processes for leachate treatment at
pre-industrial scale .................................................................................................................................. . . 85
3.1 Introduction .......................................................................................................................................... 87
3.2 Experimental methodology .................................................................................................................. 90
3.3 Results and discussion .......................................................................................................................... 91
3.3.1 Leachate characterization .......................................................................................................... 91
3.3.2 Solar photo-Fenton process ....................................................................................................... 94
Table of Contents
xvi
3.3.3 Evaluation of combined photo-Fenton and biological treatment ............................................ 105
3.4 Conclusions ........................................................................................................................................ 111
3.5 References .......................................................................................................................................... 112
4 Integration of solar photo-Fenton and biological oxidation processes for leachate treatment at
pre-industrial scale - Biodegradability enhancement assessment ....................................................... 117
4.1 Introduction ........................................................................................................................................ 119
4.2 Experimental methodology ................................................................................................................. 120
4.3 Results and discussion ........................................................................................................................ 121
4.3.1 Leachate characterization ........................................................................................................ 121
4.3.2 Biodegradability enhancement during solar photo-Fenton reaction ....................................... 123
4.3.3 Integrated systems: solar photo-Fenton pre-oxidation/biological nitrification and
denitrification .......................................................................................................................... 131
4.4 Conclusions ........................................................................................................................................ 135
4.5 References .......................................................................................................................................... 136
5 Integration of biological nitrification-denitrification, solar photo-Fenton and biological oxidation
processes for raw leachate treatment, at pre-industrial scale .............................................................. 139
5.1 Introduction ........................................................................................................................................ 141
5.2 Experimental methodology ................................................................................................................. 142
5.3 Results and discussion ........................................................................................................................ 143
5.3.1 Leachate characterization ........................................................................................................ 143
5.3.2 1st Biological oxidation ........................................................................................................... 143
5.3.3 Solar photo-Fenton Oxidation ................................................................................................. 149
5.3.4 2nd Biological oxidation .......................................................................................................... 154
5.3.5 Organic trace contaminants identification and evolution profile ............................................ 155
5.4 Conclusions ........................................................................................................................................ 164
5.5 References .......................................................................................................................................... 165
6 Scale-up and economic analysis of the photo-Fenton system for landfill leachate treatment ........... 169
6.1 Introduction ........................................................................................................................................ 171
6.2 Experimental methodology ................................................................................................................. 175
6.3 Results and discussion ........................................................................................................................ 176
6.3.1 Bio-treated leachate characterization ...................................................................................... 176
6.3.2 Performance of the biological and photo-Fenton oxidation processes .................................... 176
6.3.3 Evaluation of the yearly solar irradiation and CPCs area requirements .................................. 177
6.3.4 Solar UV photons versus electric UV photons ........................................................................ 181
6.3.5 Assessment of CPCs area and UV lamps requirements according to monthly variations of
solar radiation... ....................................................................................................................... 186
6.3.6 Reagents costs ......................................................................................................................... 187
6.3.7 Total cost: comparison of the leachate phototreatment using CPCs and/or UV lamps ........... 190
6.4 Conclusions ........................................................................................................................................ 198
6.5 References .......................................................................................................................................... 199

Table of Contents
xvii
7 Evaluation of solar photo-Fenton reaction parameters on the treatment of landfill leachate after
biological and physico-chemical oxidation, at lab-scale ........................................................................ 203
7.1 Introduction ........................................................................................................................................ 205
7.2 Experimental methodology ................................................................................................................ 206
7.3 Results and discussion ........................................................................................................................ 207
7.3.1 Leachate characterization ........................................................................................................ 207
7.3.2 Solar photo-Fenton reaction: Influence of iron concentration ................................................ 208
7.3.3 Solar photo-Fenton reaction: Influence of solution pH........................................................... 209
7.3.4 Solar photo-Fenton reaction: Influence of temperature .......................................................... 216
7.3.5 Solar photo-Fenton reaction: Influence of acid type ............................................................... 220
7.3.6 Solar photo-Fenton reaction: Influence of irradiance ............................................................. 224
7.4 Conclusions ........................................................................................................................................ 227
7.5 References .......................................................................................................................................... 228
8 Nitrification and denitrification kinetic parameters of a mature sanitary landfill leachate ............. 231
8.1 Introduction ........................................................................................................................................ 233
8.2 Experimental methodology ................................................................................................................ 235
8.3 Results and discussion ........................................................................................................................ 237
8.3.1 Nitrification ............................................................................................................................. 237
8.3.2 Denitrification ......................................................................................................................... 243
8.3.3 Characterization of the bacterial communities ........................................................................ 246
8.4 Conclusions ........................................................................................................................................ 252
8.5 References .......................................................................................................................................... 253
9 Depuration of mature sanitary landfill leachate using biological nitrification followed by
coagulation and photo-Fenton reaction, combining solar and artificial radiation, at pre-industrial
scale ............................................................................................................................................................ 257
9.1 Introduction ........................................................................................................................................ 259
9.2 Experimental methodology ................................................................................................................ 261
9.3 Results and discussion ........................................................................................................................ 263
9.3.1 Evaluation of the biological oxidation efficiency ................................................................... 263
9.3.2 Evaluation of the coagulation/sedimentation efficiency ......................................................... 270
9.3.3 Evaluation of the photo-Fenton reaction efficiency ................................................................ 279
9.3.4 Biodegradability assessment ................................................................................................... 290
9.3.5 Economic analysis .................................................................................................................. 296
9.3.6 European patent and semi-industrial scale plant ..................................................................... 305
9.4 Conclusions ........................................................................................................................................ 307
9.5 References .......................................................................................................................................... 310
10 Final Remarks ........................................................................................................................................... 313
10.1 Conclusions ........................................................................................................................................ 315
10.1.1 Integration of solar photo-Fenton reaction with biological oxidation..................................... 315
10.1.2 Integration of biological oxidation with coagulation and solar/UV photo-Fenton process .... 318
10.2 Suggestions for future work ............................................................................................................... 322

List of Figures
xix
List of Figures
Page
Figure 1.1. Evolution of the global solid waste production (adapted from Hoornweg et al. [1]). ........................ 3
Figure 1.2. Evolution of the municipal solid waste (MSW) production in the European Union (*-
Netherlands, Romania, Belgium, Greece, Portugal, Austria, Hungary, Bulgaria and Sweden; **- Denmark,
Czech Republic, Ireland, Finland, Croatia (data from 2004), Slovakia, Lithuania, Slovenia, Latvia, Estonia,
Cyprus, Luxemburg and Malta) (source: Eurostat [3]). ........................................................................................ 4
Figure 1.3. Development of the municipal solid waste (MSW) treatment in the European Union (source:
Eurostat [3]). .......................................................................................................................................................... 5
Figure 1.4. Evolution of the Municipal solid waste (MSW) produced according to type of treatment method
in Portugal (source: Eurostat [3]). ........................................................................................................................ 6
Figure 1.5. Portuguese systems of urban waste management [9]. ........................................................................ 7
Figure 1.6. Water cycle in a sanitary landfill (adapted from Renou et al. [14]). .................................................. 9
Figure 1.7. COD balance of the biodegradable organic matter during the anaerobic solid waste degradation
(adapted from Renou et al. [14]). ........................................................................................................................ 10
Figure 1.8. Average annual values of global radiation (kWh/m2) [102]. ........................................................... 30
Figure 2.1. Solar pre-industrial unit combining photocatalytic and biological oxidation systems. .................... 54
Figure 2.2. Flow diagram of the solar pre-industrial unit. .................................................................................. 55
Figure 2.3. Lab-scale photoreactor plant (a): solar radiation simulator (b), CPC (c) and flow diagram (d). ..... 59
Figure 2.7. Lab-scale biological reactor and respective schematic representation. ............................................ 61
Figure 2.4. Solar/UV pre-industrial unit combining biological and chemical oxidation systems. ..................... 63
Figure 2.5. Flow diagram of the solar/UV pre-industrial unit. ........................................................................... 64
Figure 2.6. UV-Vis lamp spectrum. ................................................................................................................... 67
Figure 3.1. Evolution of the leachate’s characteristics after lagooning, during 2010-2011, in terms of DOC,
COD and BOD5 (a) and nitrogen (b). .................................................................................................................. 93
Figure 3.2. Speciation diagram of iron (III) species (80 mg Fe/L) as a function of pH, at 25ºC and at an ionic
strength of 0.5 M, in the presence of: (a) 2 g/L sulphate and 4 g/L chloride (b) 12 g/L sulphate and 3 g/L
chloride; (c) 12 g/L sulphate, 3 g/L chloride and 50 mg/L oxalic acid and (d) 12 g/L sulphate, 3 g/L chloride
and 200 mg/L oxalic acid (all the equilibrium constants [41-45] were corrected for an ionic strength of 0.5
M with Davies and Debye-Hüchel equations). .................................................................................................... 98
Figure 3.3. DOC (,), H2O2 consumption (,) and TDI concentration (,) evolution as a function of
the accumulated UV energy per liter of leachate during the photo-Fenton process (pH = 2.8; [Fe2+] = 80
mg/L). Solid symbols: Experiment 5; Open symbols: Experiment 6. ................................................................. 99

List of Figures
xx
Figure 3.4. Effect of the suspended solids recirculation on the photo-Fenton reaction. (,) - DOC, (,)
- H2O2 consumed; (,) - TDI; (,) – temperature. Solid symbols: Experiment 22 (without stirring);
Open symbols: Experiment 23 (with stirring). .................................................................................................. 100
Figure 3.5. Effect of leachate temperature on the photo-Fenton reaction. (,) - DOC, (,) - H2O2
consumed; (,) - TDI; (,) – temperature. Solid symbols: Experiment 5 (Tm = 37ºC); Open symbols:
Experiment 21 (Tm = 21ºC). .............................................................................................................................. 103
Figure 3.6. Evaluation of the possible iron sludge recycling in the photo-Fenton process. ............................. 104
Figure 3.7. Biodegradability of photo-treated leachate: (a) DOC and COD; (b) nitrogen. .............................. 106
Figure 3.8. Leachate mineralization by the combined system: photo-Fenton (DOC, H2O2 consumed and QUV
in function of the illumination time); biological nitrification/denitrification (DOC and nitrogen species as
function of time). (a) Experiment 20; (b) Experiment 21. - DOC; - H2O2 consumed; - QUV; - Total
Nitrogen; - Ammonium (NH4+-N); - Nitrate (NO3
--N); - Nitrite (NO2--N); - Dissolved Oxygen. ... 109
Figure 3.9. DOC concentration and DOC removal percentage obtained for the photo-Fenton and biological
processes, experiments 18 to 25. - Initial DOC (leachate after lagooning); - DOC after the Photo-
Fenton reaction; - DOC after the biological oxidation process. ................................................................... 110
Figure 4.1. DOC (), COD (), AOS (), and COS () evolution as a function of the hydrogen peroxide
consumption during the photo-Fenton process: (a) with (Exp. A) and (b) without (Exp. B) sludge removal. .. 123
Figure 4.2. Zahn-Wellens test for samples taken during the photo-Fenton process, (a) with (Exp. A) and (b)
without (Exp. B) sludge removal: reference (); initial (); after acidification and iron sulphate addition
(); 50 (), 100 (), 150 (), 200 (,), 250 (,), 300 () and 350 () mM of H2O2 consumed. ..... 124
Figure 4.3. Evaluation of DOC and COD during the Zahn-Wellens test at day 0 and day 28: (a) with (Exp.
A) (b) and without (Exp. B) sludge removal after acidification. ....................................................................... 125
Figure 4.4. Evaluation of DOC at acidic ( ) or neutralized ( ) conditions and low-molecular-weight
carboxylate anions (LMCA)/DOC ratio () as a function of hydrogen peroxide consumption during
photo-Fenton process: (a) with (Exp. A) and (b) without (Exp. B) sludge removal after acidification. ........... 126
Figure 4.5. DOC (), absorbance at 254 nm (), polyphenols () and dissolved iron concentration ()
evolution as a function of hydrogen peroxide consumption during the photo-Fenton process (pH = 2.8;
[Fe2+] = 80 mg/L): with (Exp. A) (a) and without (Exp. B) (b) sludge removal after acidification. ................. 130
Figure 4.6. Evaluation of the photo-Fenton reaction. (,) - DOC; (,) - H2O2 consumed; (,)
Dissolved Iron; (,) – Temperature; (,) – Average irradiation. Solid symbols: Exp. C (without sludge
removal); Open symbols: Exp. D (without sludge removal). ............................................................................ 132
Figure 4.7. Leachate mineralization by the combined system: photo-Fenton (DOC and H2O2 consumed in
function of the illumination time); biological nitrification/denitrification (DOC and nitrogen species as
function of time). (a) Exp. B (without sludge removal); (b) Exp. C (without sludge removal). - DOC;
- H2O2 consumption; - Total Nitrogen; - Ammonium (NH4+-N); - Nitrate (NO3
--N); - Nitrite
(NO2--N). ........................................................................................................................................................... 134
Figure 5.1. Biological nitrification/denitrification of the raw leachate. - DOC; - Total Dissolved
Nitrogen; - Ammonium (NH4+-N); - Nitrate (NO3
--N); - Nitrite (NO2--N); - Temperature (T);
- pH; - Dissolved Oxygen (DO). ................................................................................................................... 145

List of Figures
xxi
Figure 5.2. DOC (,), H2O2 consumption (,), total dissolved iron (TDI) concentration (,),
temperature (T - ,) and average radiation intensity (I -,) evolution as a function of the accumulated
UV energy per liter of leachate during the photo-Fenton process (pH = 2.8; [Fe2+] = 80 mg/L), with (open
symbols) and without (solid symbols) sludge removal. .................................................................................... 150
Figure 5.3. Biological/photo-Fenton/Biological treatment sequence of the raw leachate. - DOC; - Total
Dissolved Nitrogen; - Ammonium (NH4+-N); - Nitrate (NO3
--N); - Nitrite (NO2--N). ....................... 151
Figure 5.4. Zahn-Wellens test for samples collected before and after the 1st biological treatment and after
acidification (cross symbols), and for some samples taken during the photo-Fenton process without (solid
symbols) and with (open symbols) sludge removal after acidification: - Raw Leachate; - LBT1; -
LAA; - S1; - S2; - S3; - S’1; - S’2; - S’3; - S’4; - Reference. .............................................. 152
Figure 5.5. Evaluation of DOC and COD during the Zahn-Wellens test at day 0 and day 28; percentage of
biodegradation (Dt) during Zahn-Wellens test at day 8 and day 28; low-molecular-weight carboxylate anions
(LMCA) and LMCA/DOC ratio, during combined system 1st biological treatment (BT1)/photo-Fenton
reaction (PFR), without (a) and with (b) sludge removal after acidification (Acid.). ....................................... 153
Figure 5.6. Non-target screening analysis of leachate samples, collected at different treatment points, by the
four methods described in Chapter 2 (section 2.6): (a) VOCs; (b) PAHs, PCBs and phthalates; (c) pesticides;
(d) phenols. Identification of contaminants removed and formed during different treatment stages
(correspondence between the compound and the respective peak number is displayed in the Table 5.4) (RL
– Raw Leachate; LBT1 – Leachate after 1st biological treatment; LPFN - Leachate after Photo-Fenton
reaction and neutralization; LBT2 – Leachate after 2nd biological treatment (final effluent)). ......................... 158
Figure 6.1. Average global UV irradiance ( - Im), insolation ( - tm) and ‘cloud factor’ ( - fc) for global
UV irradiance during the years 2010 and 2011 nearby Porto, Portugal. ........................................................... 179
Figure 6.2. Illustrative scheme of the CPCs’ configuration to a local with 41º of latitude. ............................. 180
Figure 6.3. Costs of UV photons collected using CPCs and UV photons generated with electric lamps
(electricity costs of (a) 0.15 €/kWh and (b) 0.10 €/kWh) (Based on Gálvez and Rodríguez [18] and
information obtained in a market study)............................................................................................................ 185
Figure 6.4. Assessment of CPCs area (bars) and number of lamps (lines) required for each month of the
year, considering different operating conditions. .............................................................................................. 187
Figure 6.5. Yearly total cost of reagents for the optimal conditions, with and without methanol contribution,
considering target COD values of 150 and 1000 mg O2/L. ............................................................................... 189
Figure 6.6. Total cost for the sanitary landfill leachate’s treatment using different set-ups. ............................ 196
Figure 7.1. Evaluation of the DOC (closed symbols), H2O2 consumed (crossed symbols) and TDI
concentration (open symbols) during the photo-Fenton reaction for different iron concentrations. Operational
conditions: pH = 2.8 (H2SO4), T = 20ºC, I = 40 WUV/m2; (, , ) – [Fe] = 20 mg/L; (, , ) – [Fe] =
40 mg/L; (, , ) – [Fe] = 60 mg/L; (, , ) – [Fe] = 80 mg/L; (,, ); – [Fe] = 100 mg/L. .......... 208
Figure 7.2. Evaluation of the DOC (closed symbols), H2O2 consumed (open symbols), pH (H2SO4) (semi-
filled symbols) and TDI concentration (crossed symbols) during photo-Fenton reaction for different pH
values. Operational conditions: [Fe] = 60 mg/L, T = 20ºC, I = 40 WUV/m2; ( ,, , ) – pH = 2.0; (,
, , ) – pH = 2.4; (, , , ) – pH = 2.8; (, , , ) – pH = 3.2; (, , , ) – pH = 3.6.
........................................................................................................................................................................... 211
List of Figures
xxii
Figure 7.3. Theoretical Fe3+ speciation diagrams as a function of solution pH in the conditions of the
experiments performed at different pH values: (a) 2.0; (b) 2.4; (c) 2.8; (d) 3.2; and (e) 3.6. Comparison of
the theorical molar fraction of FeOH2+ as a function of pH in the conditions of the experiments performed at
different pH values (f): 2.0 ( ); 2.4 ( ); 2.8 ( ); 3.2 ( ); and 3.6 ( ). ..................................................... 213
Figure 7.4. Representation of the pseudo-first-order kinetic constant for DOC degradation as a function of
the theoretical FeOH2+ concentration, for the tests performed at different values of pH (a) and temperature
(b). ..................................................................................................................................................................... 216
Figure 7.5. Evaluation of the DOC (closed symbols), H2O2 consumed (open symbols), temperature (semi-
filled symbols) and TDI concentration (crossed symbols) during the photo-Fenton reaction for different
temperature values. Operational conditions: pH = 2.8 (H2SO4); [Fe] = 60 mg/L, I = 40 WUV/m2; ( ,, ,
) – T = 10ºC; (, , , ) – T = 20ºC; (, , , ) – T = 30ºC; (, , , ) – T = 40ºC; (, ,
, ) – T = 50ºC. ............................................................................................................................................. 217
Figure 7.6. Theoretical Fe3+ speciation diagrams as a function of solution pH in the conditions of the
experiments performed at different temperature values: (a) 10ºC; (b) 20ºC; (c) 30ºC; (d) 40ºC; and (e) 50ºC.
Comparison of the theorical molar fraction of FeOH2+ as a function of pH in the conditions of the
experiments performed at different temperature values (f): 10ºC ( ); 20ºC ( ); 30ºC ( ); 40ºC ( ); and
50ºC ( ). .......................................................................................................................................................... 219
Figure 7.7. Evaluation of the DOC (closed symbols), H2O2 consumed (open symbols) and TDI concentration
(crossed symbols) during the photo-Fenton reaction for different acid types. Operational conditions: pH =
2.8; T = 30ºC; [Fe] = 60 mg/L, I = 40 WUV/m2; ( ,, ) – H2SO4; (, , ) – HCl; (, , ) – H2SO4
+ HCl. ................................................................................................................................................................ 222
Figure 7.8. Theoretical Fe3+ speciation diagrams as a function of solution pH in the conditions of the
experiments performed with different acid types: (a) H2SO4; (b) HCl; (c) H2SO4 + HCl. Comparison of the
theorical molar fraction of FeOH2+ as a function of pH in the conditions of the experiments performed with
different acid types (d): H2SO4 ( ); HCl ( ) and H2SO4 + HCl ( ). ............................................................. 223
Figure 7.9. Evaluation of the DOC (closed symbols), H2O2 consumed (open symbols) and TDI concentration
(crossed symbols) during the photo-Fenton reaction for different values of solar irradiance. Operational
conditions: pH = 2.8 (H2SO4); T = 30ºC; [Fe] = 60 mg/L; ( ,, ) – I = 22 WUV/m2; (, , ) –
I = 44 WUV/m2; (, , ) – I = 68 WUV/m2. ................................................................................................... 225
Figure 8.1. Evolution of total dissolved nitrogen ( ), total ammonia nitrogen ( - NH4+-N + NH3-N), free
ammonia ( - NH3-N), total nitrite-nitrogen ( - NO2--N), alkalinity (), pH ( ) and dissolved oxygen
( ) during a nitrification test (pH not controlled, OD = 0.5-1.0, T = 25 ºC, VSS = 2.76 g/L). ...................... 239
Figure 8.2. Representation of the (.1) TAN removed/VSS ratio, and the (.2) NO2--N produced/VSS ratio, as
a function of time, and the (.3) alkalinity removed, as a function of TNN removed, along all nitrification
tests, for different (a) temperature values (15 ºC, ; 20 ºC, ; 25 ºC, and 30 ºC, ), (b) DO intervals (0.5-
1.0 mg/L, ; 1.0-2.0 mg/L, and 2.0-4.0 mg/L, ) and (c) pH intervals (6.5-7.5, ; 7.5-8.5, and not
controlled, ). .................................................................................................................................................... 241
Figure 8.3. Evolution of the pH profile along the test carried out in the pH interval of 6.5-7.5, between the
8 and 12 hours. ................................................................................................................................................... 242
Figure 8.4. Representation of the (.1) NO2--N reduced/VSS ratio, as a function of time, and the (.2) methanol
consumed and (.3) alkalinity removed, as a function of NO2--N reduced, along all denitrification tests,

List of Figures
xxiii
regarding (a) different pH intervals (6.5-7.0, ; 7.0-7.5, ; 7.5-8.0, ; 8.0-8.5, and 8.5-9.5, ), (b) different
temperatures (20 ºC, ; 25 ºC, and 30 ºC, ) and (c) the addition ( ) or not ( ) of phosphate ions. ........ 245
Figure 8.5. PCoA biplot depicting the dissimilarities between the bacterial communities from each
biological sludge sample, based on the unweighted UniFrac distances. ........................................................... 247
Figure 8.6. Relative abundance of the members affiliated to the different phyla present in each biological
sludge sample. Phyla with abundance ranging from 0.1-1% include Acidobacteria, Chloroflexi,
Gemmatimonadetes, GNO2, SAR406, Spirochaetes, Synergistetes, Thermotogae, TM7, Verrucomicrobia
and WPS-2. Phyla with abundance < 0.1% include OD1, OP9, OP11, SR1, WS6, WYO. .............................. 248
Figure 9.1. Variation of the alkalinity ( ) and ammonium nitrogen content ( ) at the end of the biological
treatment. ........................................................................................................................................................... 266
Figure 9.2. Amount of ammonium nitrogen eliminated ( ), time required for the nitrification reaction
( ), maximum contents of free ammonia ( ) and free nitrous acid ( ), and average values of
temperature (), dissolved oxygen () and pH (), for each biological test. ................................................ 267
Figure 9.3. Evolution of total suspended solids (TSS), volatile suspended solids (VSS), 30-min settled
sludge volume (SSV30-min) and sludge volumetric index (SVI), in the biological reactor, along the
experimental period. .......................................................................................................................................... 268
Figure 9.4. Evolution of the supernatant colour for coagulant doses from 0 to 600 mg Fe3+/L. ...................... 272
Figure 9.5. Dissolved organic carbon (DOC), 30-min settled sludge volume (SS) and total suspended solids
(TSS) in the supernatant, as a function of coagulant concentration (pH 4.2). ................................................... 272
Figure 9.6. Extraction of humic substances from landfill leachate. (a) XAD-8 resin column after passing the
leachate previously nitrified and acidified. (b) Eluate samples collected at different times. ............................ 273
Figure 9.7. Comparison between the test performed in the pre-industrial scale plant using 240 mg Fe3+/L
(b), with the tests performed in the jar-test using 240 (a) and 360 (c) mg Fe3+/L. ............................................ 273
Figure 9.8. Variation of the initial values of alkalinity ( ) and NH4+-N ( ), final pH ( ) and sulphate
increment ( ), during the coagulation step.................................................................................................... 277
Figure 9.9. Evolution of DOC ( ) and COD ( ) removal along the experimental period, and values
of DOC ( ) and COD ( ) at the end of the coagulation step. ............................................................ 277
Figure 9.10. Evaluation of DOC (closed symbols), H2O2 consumed (open symbols) and TDI concentration
(cross symbols), during photo-Fenton reaction (pH = 2.8, [Fe] = 60 mg/L), for the experiments performed
with solar radiation, with (1 – , , ; 2 – , , ) and without (5’ – , , ) pre-treatment (aerobic
biological oxidation and coagulation). .............................................................................................................. 281
Figure 9.11. Progression of H2O2 ( ) and NaOH ( ) consumption, and initial values of NO2--N (
) and pH ( ), at the beginning of photo-Fenton reactions, using solar (S) and/or artificial (A) radiation
(R), along the experiments. ............................................................................................................................... 282
Figure 9.12. Distribution diagram of the molar fractions of nitrous acid ( ) and nitrite ion ( ), as a
function of pH (T = 25 ºC). ............................................................................................................................... 283
Figure 9.13. Evaluation of DOC (closed symbols), H2O2 consumed (open symbols) and TDI concentration
(cross symbols), during the photo-Fenton treatment (pH = 2.8, [Fe] = 60 mg/L) of the bio-coagulated treated
leachate using solar radiation, 4 UV-Vis lamps and 4 UV-Vis lamps (without coagulation; pH = 3.0). .......... 284

List of Figures
xxiv
Figure 9.14. Evaluation of DOC (closed symbols), H2O2 consumed (open symbols), TDI concentration
(cross symbols) and pH (semi-filled symbols) during the photo-Fenton treatment (pH = 2.8, [Fe] = 60 mg/L)
of the bio-coagulated treated leachate using 4 UV-Vis lamps and combining solar radiation with 4 UV-Vis
lamps after coagulation with 240 mg Fe3+/L and 120 mg Fe3+/L. ..................................................................... 286
Figure 9.15. Evaluation of DOC (closed symbols), H2O2 consumed (open symbols) and TDI concentration
(cross symbols), during the photo-Fenton treatment (pH = 2.8, [Fe] = 60 mg/L) of the bio-coagulated treated
leachate, using 4 lamps of 1000 W (9 – , , ), 2 lamps of 1200 W (12 – , , ) and 2 lamps of 850 W
(13 – , , ). .................................................................................................................................................... 288
Figure 9.16. Evolution of DOC removal in the biological, coagulation/sedimentation and photo-oxidation
processes, as well as the initial and final DOC of each stage. ........................................................................... 289
Figure 9.17. Evolution of DOC and nitrogen content (NH4+-N - , NO2
--N - and NO3--N - ) along
all stages of the multi-treatment process, as a function of time, for the experiment in the best conditions. ..... 290
Figure 9.18. Evaluation of DOC ( ), H2O2 consumed ( ), TDI concentration ( ), TSS content ( ), QUV
( ), pH ( ) and temperature ( ), as a function of accumulated UV energy and H2O2 consumed during the
photo-oxidation of the bio-coag-treated leachate. ............................................................................................. 291
Figure 9.19. Progress of the DOC (), COD (), AOS (), COS () and Abs254 (), as a function of
the H2O2 consumed, along experiment 15. ........................................................................................................ 293
Figure 9.20. Evolution of low-molecular-weight carboxylate anions (LMCA) concentration and
LMCA/DOC ratio, along experiment 15. .......................................................................................................... 293
Figure 9.21. Zahn-Wellens test results for samples collected along experiment 15: Reference ( ); BR15.0
( ); CT15F ( ); 29 ( ), 59 ( ), 76 ( ), 83 ( ), 106 ( ) and 127 ( ) mM of H2O2 consumed. ................ 294
Figure 9.22. Evaluation of DOC and COD at day 0 and 28 of the Zahn-Wellens test and percentage of
biodegradability at day 28. ................................................................................................................................ 295
Figure 9.23. Annual cost of the reagents employed in each treatment step. ..................................................... 298
Figure 9.24. Estimative of the CPCs unitary cost as a function of their area, through a power regression used
for the calculation of the total expense with CPCs, targeting a COD of 1000 (a) and 150 (b) mg O2/L. .......... 301
Figure 9.25. Representation of the total unitary cost of the treatment using artificial light, as a function of
the lamps operating time in order to obtain a COD lesser than 150 and 1000 mg O2/L. .................................. 302
Figure 9.26. Comparison between the total cost of the leachate phototreatment obtained in this chapter and
in Chapter 6 (*), considering different process setups, aiming a COD of 150 and 1000 mg O2/L.................... 305
Figure 9.27. Semi-industrial plant for the treatment of 20 m3/day of leachate, developed under the project
Advanced LFT. .................................................................................................................................................. 306
List of Tables
xxv
List of Tables
Page
Table 1.1. Leachate classification according to the landfill age (adapted from: Renou et al. [14], Foo and
Hameed [22] and Li et al. [23]). .......................................................................................................................... 12
Table 1.2. Emission limit values (ELV) for the discharge of wastewaters (Decree-Law no. 236/98). .............. 13
Table 1.3. Overview of the main leachate treatment processes (adapted from Abbas et al. [25], O’Leary and
Tchobanoglous [19] and Renou et al. [14]). ........................................................................................................ 15
Table 1.4. Performance of different biological processes on the landfill leachate treatment. ............................ 20
Table 1.5. Performance of different physical and chemical processes on landfill leachate treatment................ 22
Table 1.6. Performance of the different membrane filtration processes on the landfill leachate treatment. ...... 25
Table 1.7. Leachate treatment plants (LTP) installed at the Portuguese sanitary landfills and final destination
of the treated leachate [63]. ................................................................................................................................. 27
Table 1.8. Oxidation potential of different species. ............................................................................................ 29
Table 1.9. Typical AOPs [14, 26]. ...................................................................................................................... 29
Table 1.10. Performance of the different AOPs on the landfill leachate treatment. ........................................... 31
Table 1.11. Main photo-Fenton reaction parameters and their respective effect (updated from Pereira [119]).
............................................................................................................................................................................. 34
Table 2.1. Chemicals description. ....................................................................................................................... 51
Table 2.2. Description of the solar pre-industrial unit constituents. ................................................................... 56
Table 2.3. Description of solar/UV pre-industrial unit constituents. .................................................................. 65
Table 2.4. Physico-chemical parameters and their analytical methods .............................................................. 76
Table 3.1. Characterization of the sanitary landfill leachate after aerobic lagooning throughout 1-year. .......... 92
Table 3.2. Characterization of the landfill leachate before photo-Fenton process.............................................. 95
Table 3.3. Characterization of the landfill leachate before photo-Fenton process.............................................. 96
Table 3.4. Characteristics of the photo-treated leachate after neutralization. ................................................... 105
Table 3.5. Characteristics of the photo-bio-treated leachate. ............................................................................ 107
Table 3.6. Operating conditions in the biological reactor. ................................................................................ 108
Table 4.1. Characterization of the sanitary landfill leachate after aerobic lagooning throughout 1-year. ........ 122
Table 4.2. Process variables as performance indicators. .................................................................................. 128
Table 5.1. Physico-chemical characterization of the landfill leachate at different treatment phases. .............. 144

List of Tables
xxvi
Table 5.2. Process variables as performance indicators. ................................................................................... 147
Table 5.3. Contaminants’ concentrations (μg/L) along the leachate treatment process. ................................... 156
Table 5.4. Contaminants identified in the different leachate samples collected along the treatment process, after
target and non-screening analyses by the four methods described in Chapter 2 (section 2.6): structural
characterization, fitting probability and removal efficiency during the different treatment stages (RL-Raw Leachate;
LBT1-Leachate after 1st biological treatment; LPFN-Leachate after Photo-Fenton reaction and neutralization;
LBT2-Leachate after 2nd biological treatment (final effluent)). ............................................................................... 159
Table 6.1. Total expenditure with different treatment strategies using AOPs. ................................................. 172
Table 6.2. Characteristics of the bio-treated leachate used in the photo-Fenton reactions. .............................. 175
Table 6.3. Operation data for the treatment of 100 m3/day of sanitary landfill leachate. ................................. 178
Table 6.4. Estimative of the unitary cost of the CPCs according to their area. ................................................ 181
Table 6.5. Estimative of costs to capture of 1.1×1030, 1.8×1030, 2.4×1030 and 3.9×1030 solar UV photons at
different conditions of solar irradiation (FCR = 12%, 20 years). ...................................................................... 182
Table 6.6. Estimative of costs associated to the generation of electric UV photons (lamps with 4 kW, 20,000
hours of total operation and 8760 hours of yearly operation (tLO)), comparing electricity cost of 0.10 and 0.15
€/kWh (FCR=12%, 20 years). ........................................................................................................................... 183
Table 6.7. Cost associated to reagents consumption, considering different operability conditions. ................. 188
Table 6.8. Yearly cost associated to sanitary landfill leachate treatment using CPC technology considering
different operating conditions. ........................................................................................................................... 191
Table 6.9. Yearly cost associated to sanitary landfill leachate treatment with resource to UV lamps (4 kW,
20000 hours of total operation and 8760 hours of yearly operation) considering different operating
conditions........................................................................................................................................................... 192
Table 6.10. Yearly cost associated to sanitary landfill leachate treatment combining CPCs technology with
UV lamps (4 kW, 20,000 hours of total operation and 8,760 hours of yearly operation) considering different
operating conditions. ......................................................................................................................................... 193
Table 7.1. Characterization of sanitary landfill leachate samples, at the outlet of the LTP (after
coagulation/flocculation), used for the experiments with sulphuric and hydrochloric acids. ............................ 206
Table 7.2. Operational conditions used in the photo-Fenton experiments. ....................................................... 207
Table 7.3. Variables and kinetic parameters of the photo-Fenton process for all experiments. ....................... 210
Table 7.4. Concentration of iron, chloride and sulphate added in the photo-Fenton reaction, and theoretical
molar fraction of Fe3+ species, associated to pH value in different experiments. .............................................. 214
Table 8.1. Operating conditions adopted in the nitrification and denitrification tests. ..................................... 236
Table 8.2. Physico-chemical characterization of the leachate used in the nitrification and denitrification tests.
........................................................................................................................................................................... 237
Table 8.3. Operating conditions and kinetic parameters of the nitrification process for all experiments. ........ 238
Table 8.4. Operating conditions and kinetic parameters of the denitrification process for all experiments. .... 244

List of Tables
xxvii
Table 8.5. Diversity indices of the bacterial communities of the nitrification (N) and denitrification (D)
reactors, at the initial (I), middle (M) and final (F) treatment stages. ............................................................... 247
Table 8.6. Relative abundance (> 1%) of the families belonging to the bacterial phyla with an abundance
higher than 1% in nitrification or/and denitrification reactors. ......................................................................... 250
Table 9.1. Description of the tests performed. .................................................................................................. 262
Table 9.2. Physico-chemical characterization of the landfill leachate before and after biological treatment. . 264
Table 9.3. Physico-chemical characterization of the landfill leachate before and after
coagulation/sedimentation process. ................................................................................................................... 275
Table 9.4. Main characteristics of the leachate after the photo-oxidation process. .......................................... 280
Table 9.5. Operation data for the treatment of 100 m3 per day of sanitary landfill leachate. ........................... 297
Table 9.6. Cost associated to reagents consumption on each treatment step. ................................................... 298
Table 9.7. Yearly cost associated to the leachate phototreatment using CPCs technology and/or UV-Vis
lamps (4 kW, 20,000 hours of useful lifetime), considering the operability conditions of the test 15, in order
to obtain a COD below 150 and 1000 mg O2/L. ............................................................................................... 300
Table 9.8. CPCs area and number of UV lamps required for all months of the year, targeting a final COD
value of 150 or 1000 mg O2/L. .......................................................................................................................... 303


Notation
xxix
Notation
Latin letters
ACPC Total collectors area needed for the treatment of 100 m3 of bio-treated leachate per day (m2)
Aland Land area required for the CPCs implementation (m2)
Ar Illuminated collector surface area (m2)
BOD5 Biochemical oxygen demand (mg O2/L)
c speed of light (3.0×10⁸ m/s)
CA DOC of the sample measured 3-h after starting the Zahn-Wellens test (mg/L)
CB DOC of the blank measured at the sampling time t during the Zahn-Wellens test (mg/L)
CBA DOC of the blank measured 3-h after starting the Zahn-Wellens test (mg/L)
CL Cost of 1-lamp (€)
CLR Annual cost associated to the labor needed to the UV lamp replacement (€)
CLR,1L Costs with the labor to replace 1-lamp (€)
COD Chemical oxygen demand (mg O2/L)
CPC Compound parabolic collector
CR Annual cost associated to the UV lamp replacement (€)
Ct DOC of the sample measured at the sampling time t during the Zahn-Wellens test (mg/L)
DIC Dissolved inorganic carbon (mg/L)
DO Dissolved Oxygen (mg/L)
DOC Dissolved organic carbon (mg/L)
DOCf Final dissolved organic carbon concentration (mg C/L)
DOCi Initial dissolved organic carbon concentration (mg C/L)
Dt Percentage of biodegradation (%)
ECPC Energy captured by the CPCs (kJ)
EL Lamp electricity consumption (kJ)
Em Monthly accumulated UV energy (kJ/m2)
Eph Energy of 1-photon (J)
Ey Yearly accumulated UV energy (kJ/m2)
FCR Fixed charge rate (12%, considering 20-year plant depreciation)
Fem Average dissolved iron concentration during photo-Fenton experiment (mg/L)
h Planck constant (6.63×10⁻³⁴ J×s)
HS Humic substances (mg CHS/L)
Im Yearly average global UV radiation power (W/m2)

Notation
xxx
IUV Average UV irradiance power during photo-Fenton experiment (W/m2)
LMCA Low molecular-weight carboxylate anions (mg/L)
LTC Lamp total cost (€)
ND Total dissolved nitrogen (mg/L)
NL Number of UV lamps
Nps Number of photons emitted up to wavelength of 387 nm per unit of time and potency according
to the standard ASTM solar spectrum (5.8×10²¹ photons/W/h)
NT Total nitrogen (mg/L)
Nuv Number of photons emitted up to wavelength of 387 nm
OC Operating cost (€)
ORP Oxidation-reduction potential (mV)
PETC Principal equipment total cost (€)
pHm Average pH value during photo-Fenton experiment
PL Lamp power (W)
PT Total phosphorus (mg/L)
Qd Daily flow (m3/day)
QUV Accumulated UV energy received on any surface in the same position with regard to the sun
(kJ/L)
QUV,L Accumulated UV energy emitted by the UV-Vis lamps and received by the leachate existing
inside the photoreactor (kJ/L)
QUV,T Total accumulated UV energy (QUV + QUV,L), when solar and artificial radiation are
simultaneously used (kJ/L).
SSV30-min 30-min settled sludge volume (mL/L)
t Sampling time (h)
T Temperature (ºC)
TCR Total capital required (€)
TDC Total direct cost (€)
TDI Total dissolved iron (mg/L)
Tfm Mass treatment factor (g/h/ m2)
Tfv Volumetric treatment factor (L/h/ m2)
tins Total yearly hours of insolation (h)
tLL Lamp life time (h)
tLO Yearly lamp operation time (h)
Tm Average temperature during photo-Fenton experiment (ºC)
tn Time corresponding to n-water sample (s)
Notation
xxxi
TOC Total organic carbon (mg/L)
tPF Phototreatment time (h)
TSS Total suspended solids (mg/L)
TYC Total yearly cost (€)
UC Unitary cost (€/m3)
nGUV , Average solar ultraviolet radiation measured during Δt (W/m2)
Vm Monthly volume of leachate generated from the sanitary landfill (m3)
VSS Volaitile suspended solids (mg/L)
Vt Total reactor volume (L)
Vy Yearly volume of leachate generated from the sanitary landfill (m3)
Δm Amount of organic substances removed during phototreatment (g)
Δt Time interval between the collection of two samples, during photo-Fenton reaction (tn –tn-1) (s)
Greek letters
Lamp efficiency
Wavelength (nm)
Density (kg/L)
Photonic flux (photons/s)


1 Introduction
This first chapter presents an overview of the problematics associated with the production and
remediation of mature leachates from urban sanitary landfills, as well as current and potential
decontamination methods. Biological nitrification-denitrification, coagulation and photo-Fenton
oxidation processes used for leachate treatment are herein described and complemented with a
briefly survey of the current literature. The objectives and the thesis outline are also provided, at
the end of the chapter.


Chapter 1
3
1.1 Production and disposal of solid waste
Since that humankind settled in communities, and mostly over the last decades, the increasing production
of municipal solid wastes is an unavoidable consequence of the technological and scientific development
together with the high consumption standards by society. The waste production has been proportional
to urban population growth, cities' development and increasing of the consumption levels. Currently,
solid waste management is one of the most important environmental challenges and represents one of
the greatest costs to the municipality budgets. At the beginning of twenty century, about 87% of the
world’s population lived in rural communities, being the urban citizens solely 220 million. They
generated about 300 thousand tonnes of solid waste per day, as could be seen in Figure 1.1. At the end
of the century, the urban population increased to 2.9 billion (49% of global population), who produced
more than 3 million tonnes of rubbish per day. It is expected that by 2025, the amount of generated solid
waste will be the double, and by 2100, the waste production will exceed 11 million tonnes per day
(considering a global population of 9.5 billion and 80% urbanization). At present, the member countries
of the Organisation for Economic Co-operation and Development (OECD) are the main producers of
solid waste, with a slight tendency to grow up to 2050 and to decrease after that, achieving 2 million
tonnes per day, in 2100. On the other hand, the countries from Sub-Saharan Africa and South Asia show
the propensity to continuous increasing of the waste volume until 2100, reaching up to approximately
3.2 and 2 million tonnes per day, respectively [1].
Figure 1.1. Evolution of the global solid waste production (adapted from Hoornweg et al. [1]).
1900 1920 1940 1960 1980 2000 2020 2040 2060 2080 21000
2
4
6
8
10
12
0
2
4
6
8
10
12Europe and central Asia
Middle East and North Africa
Sub-Saharan Africa
South Asia
Latin America and the Caribbean
East Asia and Pacific
High-income and OECD countries
Wast
e gen
erati
on
(mil
lion
s of
ton
nes
per
day)
Projected gobal waste generation
Wast
e gen
erati
on
(mil
lion
s of
ton
nes
per
day)
Year
Past global waste generation

Chapter 1
4
During the past few years, in the European Union (EU), 1.1 thousand million tonnes of solid waste are
produced every year [2], from which approximately 250 million tonnes are related to municipal solid
wastes (MSW), corresponding to an annual average of 509 kilograms per capita (see Figure 1.2).
According to Eurostat data [3], the member countries of EU that generate more MSW per capita and
year are Cyprus, Luxembourg, Ireland and Denmark (> 650 kilograms), while Romania, Latvia, Poland,
Czech Republic and Slovakia generate less than 350 kilograms. The problematics of waste elimination
is international in scope, with many countries suffering from similar problems. For decades, the response
of the majority of Governments and waste sector operators passed by burning or burying the waste [4].
Numerous efforts have been developed, at the community level, to apply the waste hierarchy aiming at
the waste prevention and management imposed by the Waste Framework Directive 2008/98/EC, of the
European Parliament and of the Council [5]. Thus, the EU Member States have been encouraged to,
firstly, reduce and reuse the waste, then promote recycling and recovery, under appropriate conditions,
and, only as a last resource, to resort to safe enclosure. Despite being the last option in the management
hierarchy, a significant amount of municipal waste continues to have as the final destination the
landfilling (see Figure 1.3).
Figure 1.2. Evolution of the municipal solid waste (MSW) production in the European Union (*- Netherlands,
Romania, Belgium, Greece, Portugal, Austria, Hungary, Bulgaria and Sweden; **- Denmark, Czech Republic,
Ireland, Finland, Croatia (data from 2004), Slovakia, Lithuania, Slovenia, Latvia, Estonia, Cyprus, Luxemburg
and Malta) (source: Eurostat [3]).
0
50
100
150
200
250
300
350
400
450
500
550
0
30000
60000
90000
120000
150000
180000
210000
240000
270000
300000
Sp
ecif
ic M
SW
pro
du
ctio
n
(kil
og
ram
s p
er c
ap
ita
)
To
tal
MS
W p
rod
uct
ion
(th
ou
san
d t
on
nes
)
Germany United Kingdom France Italy Spain Poland
Countries with MSW production of 4000-10000 thousand tonnes*
Countries with MSW production <4000 thousand tonnes**

Chapter 1
5
Figure 1.3. Development of the municipal solid waste (MSW) treatment in the European Union
(source: Eurostat [3]).
Considering the last 18 years, Portugal achieved its peak of waste production between 2008 and 2010,
being generated, on average, 5,475 thousand tonnes of MSW per year, the equivalent to 518 kilograms
per habitant (see Figure 1.4). After that, the waste generation profile shows a decreasing tendency, being
registered in 2013 a total yearly production of 4598 thousand tonnes of MSW, corresponding to 440
kilograms per capita (~1.2 kilograms per day), which was 8.5% lesser than the value corresponding to
all EU member countries (see Figure 1.2). This performance shows that the Portuguese population has
been made aware of the problematics associated with the high production of wastes and their disposal.
Until the end of the 90s, the municipal waste management, in Portugal, consisted in the deposition of
the waste into open-air dumps (76%) and “controlled” dumps (14%), thus causing the pollution of the
air, soil, surface water and groundwater, resulting in risks to the population health [6]. In 1997, the
Strategic Plan for Municipal Solid Waste (PERSU, in Portuguese: Plano Estratégico para os Resíduos
Sólidos Urbanos) was approved, being reissued later in 1999, which had as main objective to structure
the strategies for the municipal waste management regarding the period 1997-2006 [7]. This document
was based on strategic principles of the European Union for the sector with the application of a hierarchy
of principles by placing firstly prevention, followed by recycling and, as solution of end line, the safe
enclosure [8].
0%
10%
20%
30%
40%
50%
60%
70%
80%
90%
100%
0%
10%
20%
30%
40%
50%
60%
70%
80%
90%
100%
MS
W T
rea
tmen
t
MS
W T
rea
tmen
t
Year
Composting and digestion
Material recycling
Incineration
Landfill
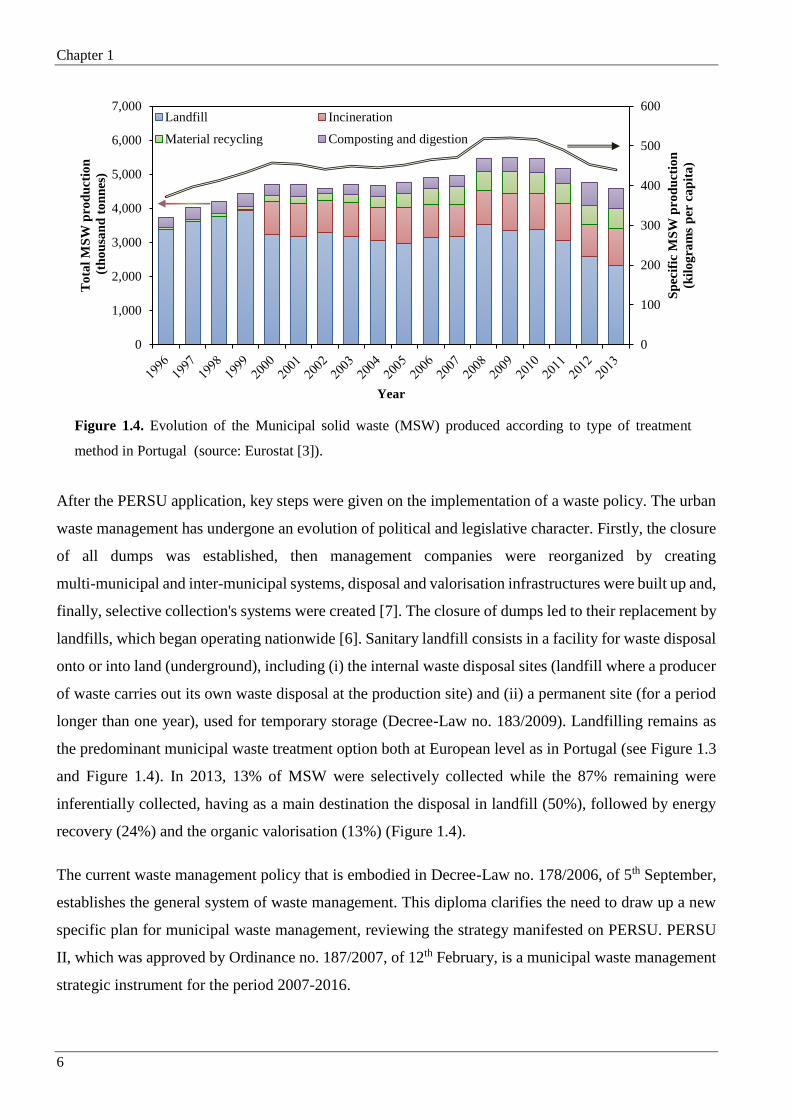
Chapter 1
6
Figure 1.4. Evolution of the Municipal solid waste (MSW) produced according to type of treatment
method in Portugal (source: Eurostat [3]).
After the PERSU application, key steps were given on the implementation of a waste policy. The urban
waste management has undergone an evolution of political and legislative character. Firstly, the closure
of all dumps was established, then management companies were reorganized by creating
multi-municipal and inter-municipal systems, disposal and valorisation infrastructures were built up and,
finally, selective collection's systems were created [7]. The closure of dumps led to their replacement by
landfills, which began operating nationwide [6]. Sanitary landfill consists in a facility for waste disposal
onto or into land (underground), including (i) the internal waste disposal sites (landfill where a producer
of waste carries out its own waste disposal at the production site) and (ii) a permanent site (for a period
longer than one year), used for temporary storage (Decree-Law no. 183/2009). Landfilling remains as
the predominant municipal waste treatment option both at European level as in Portugal (see Figure 1.3
and Figure 1.4). In 2013, 13% of MSW were selectively collected while the 87% remaining were
inferentially collected, having as a main destination the disposal in landfill (50%), followed by energy
recovery (24%) and the organic valorisation (13%) (Figure 1.4).
The current waste management policy that is embodied in Decree-Law no. 178/2006, of 5th September,
establishes the general system of waste management. This diploma clarifies the need to draw up a new
specific plan for municipal waste management, reviewing the strategy manifested on PERSU. PERSU
II, which was approved by Ordinance no. 187/2007, of 12th February, is a municipal waste management
strategic instrument for the period 2007-2016.
0
100
200
300
400
500
600
0
1,000
2,000
3,000
4,000
5,000
6,000
7,000
Sp
ecif
ic M
SW
pro
du
ctio
n
(kil
og
ram
s p
er c
ap
ita
)
To
tal
MS
W p
rod
uct
ion
(th
ou
san
d t
on
nes
)
Year
Landfill Incineration
Material recycling Composting and digestion

Chapter 1
7
The municipal waste management activity is a concept that comprises the activities of deposition,
collection, transport, storage, sorting, recovery and disposal of waste from households, as well as other
waste which, because of its nature or composition, presents similar features to waste from households
[9]. In Portugal, the System of Urban Waste Management (SGRU, in Portuguese: Sistema de Gestão de
Resíduos Urbanos) presents a structure composed of human resources, logistics, equipment and
infrastructures, whose purpose is to implement the activities associated with the management of the
municipal wastes. As can be seen in Figure 1.5, at the beginning of 2011 there were 23 SGRU
geographically spread all over continental territory, of which 12 are Multimunicipal and 11
Intermunicipal. The Multimunicipal systems (by assignment or grant) are identified with capital letters
and the systems represented in lowercase are Intermunicipal systems (isolated municipalities or in
combination) [9].
1 – VALORMINHO
2 – RESULIMA
3 – BRAVAL
4 – RESINOERTE
5 – Lipor
6 – Valsousa (Ambisousa)
7 – SULDOURO
8 – Resíduos do Nordeste
9 – VALORLIS
10 – ERSUC
11 – AMR do Planalto Beirão (Ecobeirão)
12 – RESIESTRELA
13 – VALNOR
14 – VALORSUL
15 – Ecolezíria
16 – Resitejo
17 – Amtres (Tratolixo)
18 – AMARSUL
19 – Amde (Gesamb)
20 – Amagra (Ambital)
21 – Amcal
22 – Amalga (Resialentejo)
23 – ALGAR
Figure 1.5. Portuguese systems of urban waste management [9].
Chapter 1
8
The current SGRUs combine integrated solutions of recovery, treatment and technical confinement, thus
minimizing the deposition of waste in landfills. However, the MSW disposal in landfill is, presently, a
fundamental practice in an integrated system of waste management, either as end of line solution to
refuse produced in other treatment processes (e.g. composting, incineration, anaerobic digestion of the
organic fraction of the municipal waste), either as single treatment option [6, 10].
Sanitary landfills are infrastructures designed to protect the public health and the environment from the
negative impacts associated with waste disposal. The landfill is one of the most used municipal waste
management methods due to the maturity of the technology and the economic benefits [11].
Nevertheless, despite the technological development, this type of waste disposal is associated with
various environmental impacts, most notably the impacts related to the production of leachate due to
possible pollution of soil, groundwater and surface water. The leachates result from the water contained
in the waste, the physicochemical and biological decomposition of waste and, especially, the percolation
of rainwater through the mass of waste, accompanied by extraction of dissolved materials and/or in
suspension [12, 13]. A landfill can be considered a biochemical reactor in which the inputs are waste,
rainwater and energy, and the outputs are biogas and leachate, resulting from the degradation of the
waste mass and from the precipitation [12].
The Decree-Law no. 183/2009 establishes the specific technical characteristics for each landfill class: i)
landfill for inert waste; ii) landfill for non-hazardous waste; and iii) landfill for hazardous waste.
Landfills, according to the respective class, namely the MSW landfills, which are integrated in the class
of "landfill for non-hazardous waste", must fulfil the technical requirements of Annex I of the Decree-
Law no. 183/2009. One of the requirements, related to the control of emissions and protection of the soil
and the water, demands that the collected leachates must have a treatment and a final destination
adequate, in accordance with the applicable legislation, being one of the biggest challenges to face in
the management of these infrastructures, assuming itself as one of the most important pollution control
processes.
1.2 Production, composition and characterization of landfill leachates
The leachate production results from the percolation of rainwater through the waste mass, biochemical
processes in the waste cells, the water retained by the waste and water released as a result of the same
decomposition reactions [6, 14].

Chapter 1
9
The amount of leachate (L) produced over a given period of time can be estimated by conducting a water
balance (Eq. (1.1)), taken into account the water streams entering and leaving the landfilling system
(Figure 1.6), namely: accumulated precipitation (P) (in mm), surface water influx (Rint) (in mm),
groundwater influx (I) (in mm), average evapotranspiration (EV) (mm), and surface run-off (Rext) (in
mm) [6, 14].
extint REVIRPL (1.1)
Figure 1.6. Water cycle in a sanitary landfill (adapted from Renou et al. [14]).
One of the factors having a huge influence on leachate production is the weather because it affects the
precipitation and evaporation. The production of leachate also depends on the waste nature, especially
its water content and compaction degree. The leachate production is generally higher when the waste is
less compacted, since compaction decreases the infiltration rates [14, 15]. The maximum leachate
production usually occurs at the end of winter and throughout the spring. An expeditious way to estimate
the theoretical value of the amount of leachate is to assume that, in the absence or insufficiency of
information, the value is about 30% of the average annual rainfall [6].
Leachate quality is also affected by the decomposition degree of the organic waste disposed in the
landfill. After disposal, the biodegradable waste is initially decomposed by biological aerobic processes,
of relatively short duration, and then by longer anaerobic processes [8, 16]. Depending on the
decomposition stage, i.e. if the organic waste underwent partial or total biological anaerobic degradation,
the leachates can present a variety of intermediate products along with other soluble recalcitrant
materials [15].
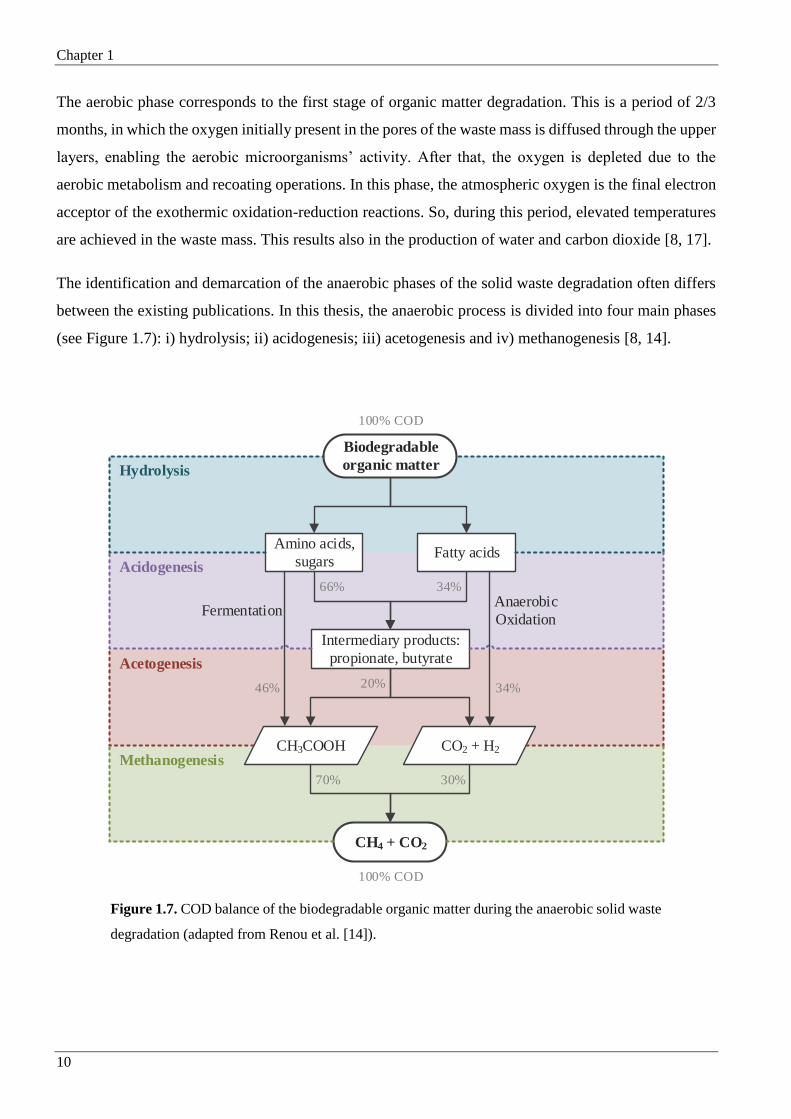
Chapter 1
10
The aerobic phase corresponds to the first stage of organic matter degradation. This is a period of 2/3
months, in which the oxygen initially present in the pores of the waste mass is diffused through the upper
layers, enabling the aerobic microorganisms’ activity. After that, the oxygen is depleted due to the
aerobic metabolism and recoating operations. In this phase, the atmospheric oxygen is the final electron
acceptor of the exothermic oxidation-reduction reactions. So, during this period, elevated temperatures
are achieved in the waste mass. This results also in the production of water and carbon dioxide [8, 17].
The identification and demarcation of the anaerobic phases of the solid waste degradation often differs
between the existing publications. In this thesis, the anaerobic process is divided into four main phases
(see Figure 1.7): i) hydrolysis; ii) acidogenesis; iii) acetogenesis and iv) methanogenesis [8, 14].
Figure 1.7. COD balance of the biodegradable organic matter during the anaerobic solid waste
degradation (adapted from Renou et al. [14]).
Biodegradable
organic matter
Amino acids,
sugarsFatty acids
Intermediary products:
propionate, butyrate
CH3COOH CO2 + H2
CH4 + CO2
Hydrolysis
Acidogenesis
Acetogenesis
Methanogenesis
FermentationAnaerobic
Oxidation
100% COD
100% COD
34%66%
20%46% 34%
30%70%

Chapter 1
11
The hydrolysis step consists in the conversion of organic polymers (proteins, carbohydrates and lipids)
into soluble products through the action of extracellular enzymes. These enzymes are secreted by
fermentative bacteria. The resulting products are organic monomers, including amino acids, sugars and
long-chain organic acids. The factors that affect the degree and the rate of the hydrolysis are:
temperature; residence time; composition of the substrate; particle size; pH of the medium; concentration
of ammonium; and concentration of hydrolysis products [8, 18, 19].
During the acidogenesis or fermentation stage, the products resulting from hydrolysis are transported to
the interior of fermentative bacteria cells, occurring their transformation to intermediate products
(volatile fatty acids (VFA), alcohols, etc.), carbon dioxide and hydrogen. The VFA formed constitute
the most important intermediates in the anaerobic digestion process, encompassing various lower-
molecular-weight carboxylic acids, e.g. acetic and propionic acids (CH3COOH, C2H5COOH), formed
in greater quantities [8, 18, 19].
In the acetogenesis step occurs the transformation of the products resulting from acidogenesis in acetic
acid (CH3COOH), carbon dioxide (CO2) and hydrogen (H2) by acetogenic bacteria. The pH of the
leachate goes down to 5 or lower values due to the presence of organic acids and high concentrations of
CO2 in the landfill. The biochemical oxygen demand (BOD5), chemical oxygen demand (COD) and
conductivity of the leachate significantly increase during this phase due to the presence of organic acids
in the leachate. Due to the low pH of the leachate, inorganic compounds, mainly heavy metals, are
solubilized. Many essential nutrients are also removed from the leached at this stage [8, 19].
The methanogenesis is the final stage and is the one that controls the anaerobic digestion process, being
directly responsible by the production of methane (CH4). The conversion of the H2 and CH3COOH into
CH4 and CO2 is performed by methanogenic bacteria, increasing the leachate's pH to values close to the
neutrality (about 6.8 to 8). While pH value increases, the values of BOD5, COD and conductivity
decrease. At higher pH values, few are the inorganic constituents that remain in solution, as result the
concentration of heavy metals in the leachate is reduced [8, 19, 20].
After the biodegradable organic material has been converted into CH4 and CO2, during the previous
phase, the maturation phase occurs. The mixture continues to migrate through the waste mass and the
biodegradable material previously unavailable is converted. The gas generation rate considerably
decreases, since the majority of nutrients were already removed during the previous stages and the
remaining substrates in the landfill are slowly biodegradable. During the maturation phase, the leachate
contains a high content of humic and fulvic acids (HA and FA), which are hardly degraded by biological
processes [19].

Chapter 1
12
The leachate composition varies according to the age of the landfill, climatic conditions, soil properties
and type of waste, and it can be characterized in terms of dissolved organic matter (including recalcitrant
compounds), inorganic macrocomponents, heavy metals and xenobiotic organic compounds [11, 14,
21]. Despite the composition of the leachate significantly changes along time, three types of leachate
were defined according to the age of the landfill: young, intermediate and old. The relationship between
the landfill's age and the leachate's characteristics is shown in Table 1.1.
Table 1.1. Leachate classification according to the landfill age (adapted from: Renou et al. [14], Foo
and Hameed [22] and Li et al. [23]).
Leachate Young Intermediate Old
Age (years) <5 5-10 >10
pH <6.5 6.5-7.5 >7.5
COD (mg/L) >10 000 4 000 – 10 000 <4 000
BOD5/COD 0.5 – 1.0 0.1 – 0.5 <0.1
Biodegradability Important Medium Low
Organic Compounds 80% of VFAa 5-30% of VFAa + HAb and FAc HAb and FAb
Ammonia Nitrogen (mg N/L) < 400 - > 400
Heavy metals (mg/L) Low-Medium Low Low
aVolatile fatty acids; bHumic acids; cFulvic acids.
The leachates from new landfills (<5 years) are characteristic of the acid phase of waste decomposition.
They present a high BOD5/COD ratio, being indicative of their high biodegradability, high
concentrations of COD (30,000-60,000 mg/L) and BOD5 (4000-13,000 mg/L), moderate levels of
ammonia nitrogen and alkalinity and a low pH value. The highest fraction of the organic matter is related
to low molecular weight compounds such as volatile fatty acids (VFA) resulting from the anaerobic
fermentation [11, 14, 21, 23].
When the age of the landfill increases, there is a decrease in the concentration of organic compounds as
result from the anaerobic decomposition. So, more stabilized leachates are produced, which are
characterized by reduced COD values, high pH (7.5 to 8.5) and low BOD5/COD ratio, due to the
releasing of recalcitrant organic molecules from the waste [14, 20, 23]. Most organic compounds present
in the stabilized leachate have a high molecular weight, such as humic substances [11, 21, 24]. At this
phase, so called methanogenic, the concentration of some inorganic macrocomponents in the leachate
(such as calcium, magnesium, iron and manganese) is low due to high pH (which decreases the solubility
enhancing the reactions of precipitation and sorption) and to low content of dissolved organic matter
(which could originate complexes with the cations) [20].
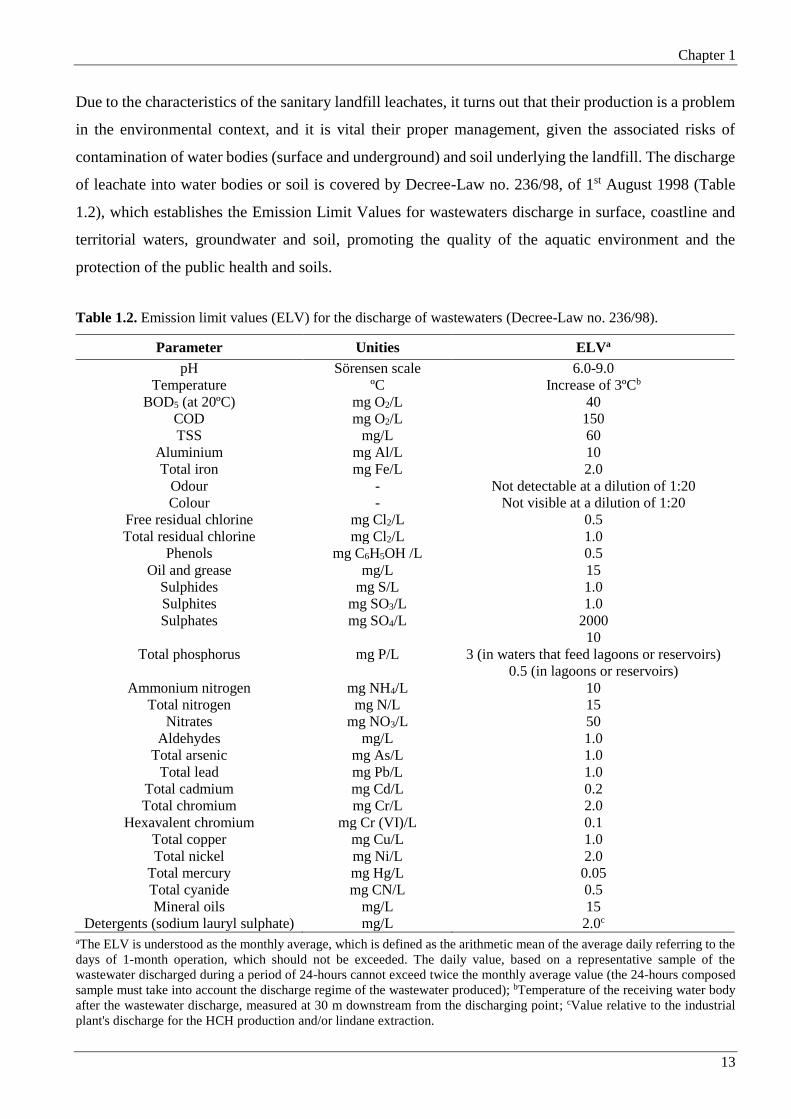
Chapter 1
13
Due to the characteristics of the sanitary landfill leachates, it turns out that their production is a problem
in the environmental context, and it is vital their proper management, given the associated risks of
contamination of water bodies (surface and underground) and soil underlying the landfill. The discharge
of leachate into water bodies or soil is covered by Decree-Law no. 236/98, of 1st August 1998 (Table
1.2), which establishes the Emission Limit Values for wastewaters discharge in surface, coastline and
territorial waters, groundwater and soil, promoting the quality of the aquatic environment and the
protection of the public health and soils.
Table 1.2. Emission limit values (ELV) for the discharge of wastewaters (Decree-Law no. 236/98).
Parameter Unities ELVa
pH Sörensen scale 6.0-9.0
Temperature ºC Increase of 3ºCb
BOD5 (at 20ºC) mg O2/L 40
COD mg O2/L 150
TSS mg/L 60
Aluminium mg Al/L 10
Total iron mg Fe/L 2.0
Odour - Not detectable at a dilution of 1:20
Colour - Not visible at a dilution of 1:20
Free residual chlorine
Total residual chlorine
mg Cl2/L
mg Cl2/L
0.5
1.0
Phenols mg C6H5OH /L 0.5
Oil and grease mg/L 15
Sulphides mg S/L 1.0
Sulphites mg SO3/L 1.0
Sulphates mg SO4/L 2000
Total phosphorus mg P/L
10
3 (in waters that feed lagoons or reservoirs)
0.5 (in lagoons or reservoirs)
Ammonium nitrogen mg NH4/L 10
Total nitrogen mg N/L 15
Nitrates mg NO3/L 50
Aldehydes mg/L 1.0
Total arsenic mg As/L 1.0
Total lead mg Pb/L 1.0
Total cadmium mg Cd/L 0.2
Total chromium mg Cr/L 2.0
Hexavalent chromium mg Cr (VI)/L 0.1
Total copper mg Cu/L 1.0
Total nickel mg Ni/L 2.0
Total mercury mg Hg/L 0.05
Total cyanide mg CN/L 0.5
Mineral oils mg/L 15
Detergents (sodium lauryl sulphate) mg/L 2.0c aThe ELV is understood as the monthly average, which is defined as the arithmetic mean of the average daily referring to the
days of 1-month operation, which should not be exceeded. The daily value, based on a representative sample of the
wastewater discharged during a period of 24-hours cannot exceed twice the monthly average value (the 24-hours composed
sample must take into account the discharge regime of the wastewater produced); bTemperature of the receiving water body
after the wastewater discharge, measured at 30 m downstream from the discharging point; cValue relative to the industrial
plant's discharge for the HCH production and/or lindane extraction.

Chapter 1
14
1.3 Leachate treatment systems
Due to the large variability of leachates, both in quantity and quality, influenced by factors such as the
waste mass composition deposited, rainwater and type of management and operation of the landfill, the
definition of a treatment line able to be effective in all situations is not easy. The leachate treatment
systems are often similar to traditional treatment methods used for urban wastewater, including
biological (aerobic and anaerobic) and physical-chemical processes, although the processing is much
more challenging. Several authors have presented reviews on different approaches used for the landfill
leachate treatment [14, 15, 19, 25, 26]. From these works it is possible to divide the leachate treatment
systems into four different groups (see Table 1.3):
i) leachate channelling (combined treatment with domestic sewage and recycling back through
the landfill);
ii) biological degradation (aerobic and anaerobic processes);
iii) chemical and physical methods (flotation, coagulation/flocculation, chemical precipitation,
adsorption, ammonium stripping, chemical oxidation and ion exchange);
iv) membrane filtration (microfiltration, ultrafiltration, nanofiltration and reverse osmosis).
Regardless the technology chosen to treat the leachate, it is usual to have a stabilization lagoon upstream,
in order to promote the regularization and homogenization of the flowrate resulting from situations of
irregular or intense rainfall [10, 27]. Pure oxygen or air must be injected in these lagoons to avoid
uncomfortable odors, due to the anaerobic biochemical processes, and to foment the nitrification
reactions. A good management of the stabilization lagoons is of extreme importance, in order to prevent
the contamination of the waterways and soil.

Chapter 1
15
Table 1.3. Overview of the main leachate treatment processes (adapted from Abbas et al. [25], O’Leary and Tchobanoglous [19] and Renou et al. [14]).
Treatment Process Effectiveness
Main application Benefits Drawbacks YLa ILb OLc
Lea
cha
te C
ha
nn
elli
ng
Combined treatment with
domestic sewage Good Fair Poor General treatment
Easy maintenance and low operating
costs.
No need for nutrients addition, since the
leachate contains nitrogen and the
sewage contains phosphorous.
Reduction of the treatment efficiency and
increase of the effluent load, due to the
presence of recalcitrant compounds and
heavy metals in the leachate.
Recycling Good Fair Poor
Improvement of
leachate quality and
stabilization
One of the least expensive.
Improvement of leachate quality.
Less time required for stabilization.
High recirculation rates can affect the
waste anaerobic degradation, e.g.
methanogenesis inhibition.
Very high volumes of recirculated
leachate can lead to saturation, ponding
and acidic conditions.
Bio
log
ica
l B
iod
egra
da
tio
n
Aerated lagoonse Good Fair Poor
Biodegradable organic
matter removal and
ammonium nitrification
Low operation and maintenance costs.
Anoxic zones inside the lagoon promote
nitrogen removal via nitrite/nitrate
denitrification.
Need for large areas.
Not completely satisfactory for strict
requirements.
Strong temperature-dependence.
Activated Sludged,e Good Fair Poor
Biodegradable organic
matter removal and
ammonium nitrification
Effective for the removal of
biodegradable organic carbon, nutrients
and ammonium.
Excess of sludge production.
Inadequate sludge settleability.
Need for longer aeration times.
High energy requirements.
Need for secondary settlement.
Possible need for antifoam.
Microbial inhibition due to high
ammonium-nitrogen load.
Strong temperature-dependence.
Sequencing Batch
Reactord,e (SBR) Good Fair Poor
Biodegradable organic
matter removal and
ammonium nitrification
Alternating the operating regime
between aerobic and anoxic, total
nitrogen can also be removed by
nitrification and denitrification reactions.
Great flexibility considering the high
degree of leachate variability.
Similar to activated sludge but without
secondary settlement.
Applicable to relatively low flow rates.

Chapter 1
16
Table 1.3. Overview of the main leachate treatment processes (adapted from Abbas et al. [25], O’Leary and Tchobanoglous [19] and Renou et al. [14]).
Treatment Process Effectiveness
Main application Benefits Drawbacks YLa ILb OLc
Bio
log
ica
l B
iod
egra
da
tio
n Moving bed biofilm and
trickling filtersd,f Good Fair Poor
Biodegradable organic
matter removal and
ammonium nitrification
Neither losses of active biomass nor
long sedimentation periods.
Nitrification is less affected by low
temperatures and by inhibition due to
high ammonium content than in the
suspended-growth biomass processes.
Need for operation at high dissolved
oxygen content to maintain high
nitrification rates [28].
High capital costs [26].
Trickling filter is not volume-effective
and nuisance odour may prevail [29, 30].
Anaerobic systemsg Good Fair Poor
Biodegradable organic
matter removal and
nitrite/nitrate
denitrification
Conservation of energy and production
of very few sludge.
Possibility for using the biogas produced
for external purposes.
Low doses of phosphorus required for
bacterial growth [26].
Low reaction rates.
Heavy metals can hamper digestion [26].
Ammonia toxicity and high residual
ammonia concentration [26].
Susceptible to changes in pH and
temperature [26].
Nitrification/denitrification Good Fair Poor Nitrogen removal
Nitrification/denitrification process can be accompanied by carbon removal and can
occur in the biological systems reported above, alternating between the presence and
absence of oxygen, respectively.
Ch
emic
al
an
d P
hy
sica
l M
eth
od
s
Flotation - - - Suspended matter
removal
Low capital investment and operating
costs [31].
High efficiency of separation [31].
Also effective on BOD5, COD and
turbidity removal [32].
Robust against influent variations [32].
Need for lesser implementation areas
than normal clarifiers [32].
Easy installation and set-up [32].
Reduced applicability when used as a
single process.
For better results the flotation processes
must be used together with coagulation,
in order to facilitate the destabilization
of colloidal particles [31].
Coagulation/flocculation Poor Fair Fair Suspended matter and
heavy metals removal
The simplest physical-chemical
technique for leachate treatment [33].
Effective pre-treatment process when
used prior to biological treatment or
reverse osmosis [33].
Efficient polishing treatment for the
removal/reduction of recalcitrant organic
matter [33].
High sludge production and need for
adequate disposal.
Possible increase of the concentrations
of iron or aluminium in the liquid phase.
Not suitable for full treatment [33].
Inefficiency on nitrogen removal [33].
Low removal efficiency on high strength
leachate [33]

Chapter 1
17
Table 1.3. Overview of the main leachate treatment processes (adapted from Abbas et al. [25], O’Leary and Tchobanoglous [19] and Renou et al. [14]).
Treatment Process Effectiveness
Main application Benefits Drawbacks YLa ILb OLc
Ch
emic
al
an
d P
hy
sica
l M
eth
od
s
Chemical precipitation Poor Fair Poor Ammonium and metals
removal
Extensively employed as leachate pre-
treatment due to its simplicity, capability
and low-cost equipment [33].
Also efficient on refractory compounds.
Sludge production requires the disposed
as hazardous waste.
Relatively expensive chemicals [33].
Adsorption Poor Fair Good Organic matter removal
Proven technology.
Better COD reduction than the chemical
methods.
More effective leachate treatment when
used together with biological oxidation
or as a stage of an integrated chemical-
physical-biological process.
Variable costs depending on leachate.
Need for frequent regeneration of
columns or an equivalently high
consumption of powdered activated
carbon.
Ammonium stripping Poor Fair Fair Ammonium removal
High removal efficiency.
Lower operating costs than for reverse
osmosis and nanofiltration [33].
May require other equipment for air
pollution control, since ammonia gas is
released to the atmosphere.
High pH value is required.
Scaling of alkalinity, when lime is used
for rise pH in the stripping tower.
pH adjustment prior to discharge.
Chemical oxidation Poor Fair Fair Organic matter removal
Greatly suitable for non-biodegradable
compounds removal.
Capable to reach complete
mineralization.
Biodegradability enhancement of
recalcitrant organic pollutants.
Works better on diluted waste streams.
The use of chlorine can lead to the
formation of chlorinated compounds.
High demand of electrical energy
resulting in rather high treatment costs.
For complete mineralization, high
oxidant doses would be required.
Some intermediate products can increase
the leachate toxicity.
Ion exchange Good Good Good Dissolved inorganic
compounds removal
Effective removal of traces of metal
impurities, meeting stricter discharge
standards.
Useful only as a relaying treatment after
biological processes.
High treatment cost.
Previous suspended solids removal is
required.

Chapter 1
18
Table 1.3. Overview of the main leachate treatment processes (adapted from Abbas et al. [25], O’Leary and Tchobanoglous [19] and Renou et al. [14]).
Treatment Process Effectiveness
Main application Benefits Drawbacks YLa ILb OLc
Mem
bra
ne
Fil
tra
tio
n
Microfiltration Poor - - Suspended matter
removal
Efficient as pre-treatment for the other
membrane processes or along with
chemical treatments.
Useful only as a relaying treatment.
Ultrafiltration Poor - -
Removal of bacteria
and high molecular
weight organic
compounds
Proficient on suspended matter removal
either by direct filtration or together with
biological treatment, by replacing the
sedimentation unit.
Effective as a pre-treatment for reverse
osmosis process.
Costly and membranes are subject to
fouling.
Strongly dependent of the kind of
material constituting the membrane.
Nanofiltration Good Good Good
Removal of organic,
inorganic and microbial
contaminants
Versatile technology capable to meet
multiple water quality objectives.
Combined with physical methods allows
to obtain a satisfactory organic matter
removal
Costly and need for lower pressure than
reverse osmosis.
Membrane fouling.
Reverse osmosis Good Good Good
Removal of organic and
inorganic matter,
suspended and
dissolved
More efficient than conventional
methods and the other membrane
filtration processes.
Expensive process.
Membrane fouling.
Extensive pre-treatment is required.
Problem with the concentrates disposal.
aYoug leachate; bIntermediate leachate; cOld leachate; dUnder aerobic conditions; eSuspended-growth biomass process; fAttached-growth biomass process; g Comprises all
suspended-growth and attached-growth biomass processes, which are quite similar to those ones used under aerobic conditions.

Chapter 1
19
1.3.1 Leachate channelling
The co-treatment of landfill leachate with domestic sewage is a very attractive approach, both at
technical and economic level, throughout the conception and exploration of the sanitary landfill, since
there is no need for the full treatment facility construction, reducing the associated expenses. Besides
the good cooperation between the different involved entities, for the implementation of this process it is
necessary to take into account if: i) exists a wastewater treatment plant (WWTP) in the vicinity of the
landfill, or a sewerage system that forwards the leachate to the WWTP; ii) the WWTP has capability to
qualitatively and quantitatively assimilate the leachate flow-rates; iii) the treatment methodology applied
in the WWTP is compatible with the leachate’s characteristics. However, this alternative has been
questioned due to the presence of recalcitrant organic matter and heavy metals, since the treatment
efficiency may be reduced and the effluent concentration can be increased [14, 15]. In fact, a study
performed by Ferraz et al. [34] disclosed that the co-treatment of domestic wastewater with 5% (v/v)
leachate (pre-treated by air stripping) led to the reduction of hardly biodegradable organic matter as a
result of dilution and not of biodegradation.
Recycling leachate back through the landfill was largely used in the past due to its low cost and fast
leachate’s stabilization [14], being possible to produce an effluent with low organic load in a relatively
short period of time. Nevertheless, the recirculation does not constitutes a complete solution for leachate
treatment, but instead could be used as a complement, since (i) the precipitation can exceed the
evaporation (increasing the volume to recirculate and thus exceeding the absorption capacity by the
system) and (ii) the recalcitrant organic compounds as well as some inorganic ones cannot be removed
[8, 14]. So, this technique should only be used with the purpose of promoting the waste biodegradation
process in the landfill.
1.3.2 Biological degradation
Due to its simplicity, reliability, high cost-effectiveness and to the high nitrogen content (mostly as
ammonium) inherent in this type of effluent, the biological process is almost always applied in leachate
treatment plants (LTPs) [14, 35]. Up to date, the nitrification reaction followed by a denitrification step,
mediated by microorganisms with aerobic and anoxic metabolisms, respectively, is the biological
process most used for nitrogen removal from wastewaters [36]. However, regarding the organic
contaminants, biological treatment only has a good performance in young leachates, where the organic
matter content is mainly biodegradable (Table 1.4).
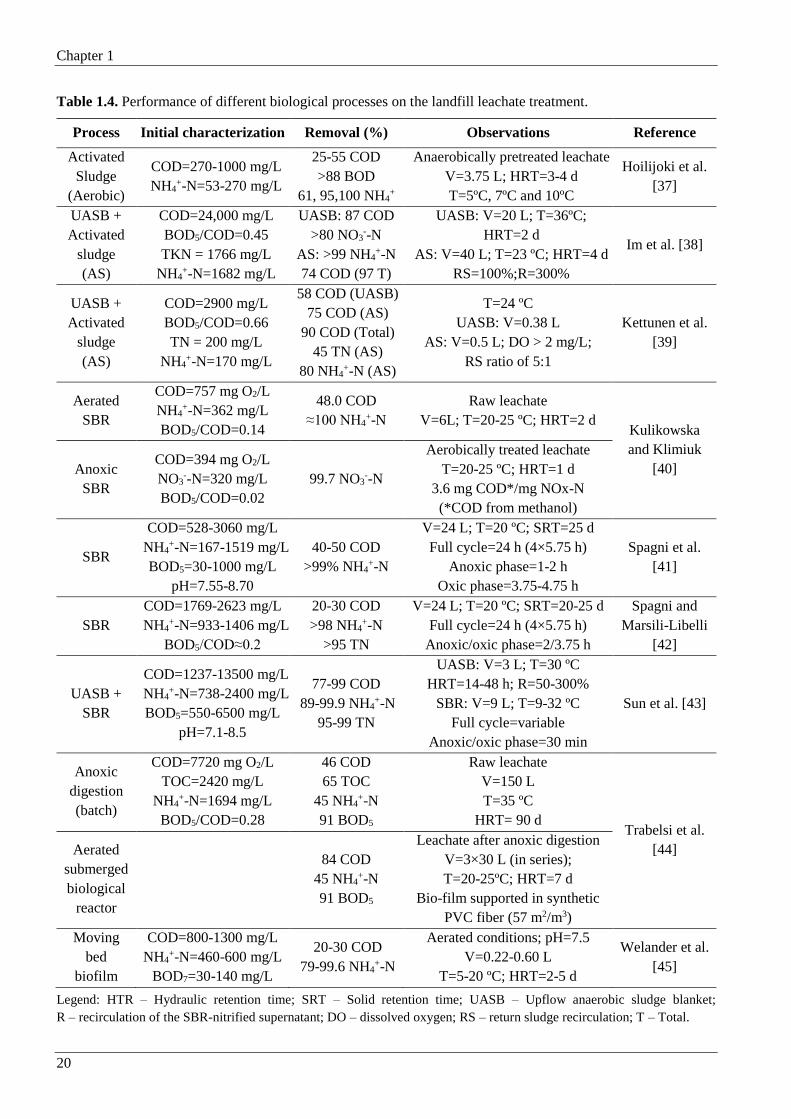
Chapter 1
20
Table 1.4. Performance of different biological processes on the landfill leachate treatment.
Process Initial characterization Removal (%) Observations Reference
Activated
Sludge
(Aerobic)
COD=270-1000 mg/L
NH4+-N=53-270 mg/L
25-55 COD
>88 BOD
61, 95,100 NH4+
Anaerobically pretreated leachate
V=3.75 L; HRT=3-4 d
T=5ºC, 7ºC and 10ºC
Hoilijoki et al.
[37]
UASB +
Activated
sludge
(AS)
COD=24,000 mg/L
BOD5/COD=0.45
TKN = 1766 mg/L
NH4+-N=1682 mg/L
UASB: 87 COD
>80 NO3--N
AS: >99 NH4+-N
74 COD (97 T)
UASB: V=20 L; T=36ºC;
HRT=2 d
AS: V=40 L; T=23 ºC; HRT=4 d
RS=100%;R=300%
Im et al. [38]
UASB +
Activated
sludge
(AS)
COD=2900 mg/L
BOD5/COD=0.66
TN = 200 mg/L
NH4+-N=170 mg/L
58 COD (UASB)
75 COD (AS)
90 COD (Total)
45 TN (AS)
80 NH4+-N (AS)
T=24 ºC
UASB: V=0.38 L
AS: V=0.5 L; DO > 2 mg/L;
RS ratio of 5:1
Kettunen et al.
[39]
Aerated
SBR
COD=757 mg O2/L
NH4+-N=362 mg/L
BOD5/COD=0.14
48.0 COD
≈100 NH4+-N
Raw leachate
V=6L; T=20-25 ºC; HRT=2 d Kulikowska
and Klimiuk
[40] Anoxic
SBR
COD=394 mg O2/L
NO3--N=320 mg/L
BOD5/COD=0.02
99.7 NO3--N
Aerobically treated leachate
T=20-25 ºC; HRT=1 d
3.6 mg COD*/mg NOx-N
(*COD from methanol)
SBR
COD=528-3060 mg/L
NH4+-N=167-1519 mg/L
BOD5=30-1000 mg/L
pH=7.55-8.70
40-50 COD
>99% NH4+-N
V=24 L; T=20 ºC; SRT=25 d
Full cycle=24 h (4×5.75 h)
Anoxic phase=1-2 h
Oxic phase=3.75-4.75 h
Spagni et al.
[41]
SBR
COD=1769-2623 mg/L
NH4+-N=933-1406 mg/L
BOD5/COD≈0.2
20-30 COD
>98 NH4+-N
>95 TN
V=24 L; T=20 ºC; SRT=20-25 d
Full cycle=24 h (4×5.75 h)
Anoxic/oxic phase=2/3.75 h
Spagni and
Marsili-Libelli
[42]
UASB +
SBR
COD=1237-13500 mg/L
NH4+-N=738-2400 mg/L
BOD5=550-6500 mg/L
pH=7.1-8.5
77-99 COD
89-99.9 NH4+-N
95-99 TN
UASB: V=3 L; T=30 ºC
HRT=14-48 h; R=50-300%
SBR: V=9 L; T=9-32 ºC
Full cycle=variable
Anoxic/oxic phase=30 min
Sun et al. [43]
Anoxic
digestion
(batch)
COD=7720 mg O2/L
TOC=2420 mg/L
NH4+-N=1694 mg/L
BOD5/COD=0.28
46 COD
65 TOC
45 NH4+-N
91 BOD5
Raw leachate
V=150 L
T=35 ºC
HRT= 90 d Trabelsi et al.
[44] Aerated
submerged
biological
reactor
84 COD
45 NH4+-N
91 BOD5
Leachate after anoxic digestion
V=3×30 L (in series);
T=20-25ºC; HRT=7 d
Bio-film supported in synthetic
PVC fiber (57 m2/m3)
Moving
bed
biofilm
COD=800-1300 mg/L
NH4+-N=460-600 mg/L
BOD7=30-140 mg/L
20-30 COD
79-99.6 NH4+-N
Aerated conditions; pH=7.5
V=0.22-0.60 L
T=5-20 ºC; HRT=2-5 d
Welander et al.
[45]
Legend: HTR – Hydraulic retention time; SRT – Solid retention time; UASB – Upflow anaerobic sludge blanket;
R – recirculation of the SBR-nitrified supernatant; DO – dissolved oxygen; RS – return sludge recirculation; T – Total.

Chapter 1
21
Table 1.4 summarizes different types of biological processes applied to sanitary landfill leachates
treatment, including removal percentages of nitrogen and organic compounds. Among them, there is a
work presented by Im et al. [38], where a biological system composed by an upflow anaerobic biofilm
reactor (20 L, 36 ºC), an aerobic activated sludge reactor (40 L, 23 ºC) and a clarifier (5 L), is proposed
as a feasible process to treat organic and nitrogen compounds in an immature leachate (COD=24 g/L,
BOD5/COD=0.45, NH4+-N=1682 mg/L). Applying a return sludge flow ratio of 100% (from the clarifier
to the aerobic reactor), a recirculation flow ratio of 300% (from the aerobic to the anaerobic reactor) and
hydraulic retention times of 2 and 4 days in the anaerobic and aerobic reactors, respectively, they were
able to denitrify more than 80% of the nitrate, without external carbon source addition, and nitrify more
than 99% of the ammonium nitrogen, in the anaerobic and aerobic reactors, respectively. Relatively to
the organic matter balance, in the anaerobic reactor, 87% of COD was removed to the denitrification
and methanogenesis reactions, and in the aerobic reactor, 74% of COD was mineralized, totalizing a
97% COD depletion. Spagni and Marsili-Libelli [42] reported a study on the treatment of a leachate
generated in old landfills (COD=1769-2623 mg/L, BOD5/COD≈0.2, NH4+-N=933-1406 mg/L) by a
sequencing batch reactor, in order to remove the nitrogen load. Nitrification and nitrogen removal (with
external carbon source addition) were frequently greater than 98% and 95%, respectively, whereas COD
reduction was around 20-30%.
1.3.3 Physical and chemical processes
When the leachate's BOD5/COD ratio becomes too low, prevailing the refractory organic matter, and
the biological technologies can no longer remove the organic content, physical and chemical processes
can be a suitable treatment approach [15, 46]. This treatment is usually used to reduce suspended solids,
colloidal particles, colour, floating material and toxic compounds. In contrast to biological processes,
physical and chemical technologies cannot be applied as an individual treatment, instead they can
effectively be used as a pre-treatment or a polishing step, in combination with other treatment processes,
as well as to treat a specific contaminant, such as ammonia [14, 16]. Particularly, the most prominent
treatments are flotation [31, 32], coagulation/flocculation [47-49], chemical precipitation [50, 51],
adsorption by activated carbon [22, 52], ammonia stripping [46, 50] and chemical oxidation [53-56].
Table 1.5 lists some research studies performed in the scope of landfill leachate treatment via physical
and chemical technologies.

Chapter 1
22
Table 1.5. Performance of different physical and chemical processes on landfill leachate treatment.
Process Initial characterization Removal (%) Observations Reference
Flotation
COD=2667 mg/L
Colour=4059 PtCo
Turbidity=248 FAU
NH3-N=1760 mg/L
pH=8.0
36 COD
33 Colour
32 Turbidity
Only DAF
Q=6 L/min; P=400 kPa;
IT=2 min; RT=10 min Palaniandy et
al. [32] 79 COD
70 Colour
42 Turbidity
DAF + Coagulation
(2.3 g/L alum; pH=7)
Q=4L/min; P=600 kPa; IT=4 min;
RT=20 min
Flotation
+
Coagulation
COD=2610 mg/L
Colour=4000 PtCo
Turbidity=259 FAU
NH3-N=1975 mg/L
pH=8.1
75 COD
93 Colour
50 Turbidity
41 NH3-N
DAF: Q=6 L/min; P=600 kPa;
IT=101 s; RT=20 min
Coagulation: 599 mg/L FeCl3;
pH=4.76
Adlan et al.
[31]
Coagulation/
Flocculation
COD=4100 mg/L
BOD5/COD=0.05
Turbidity=1800 NTU
NH4+-N=1040 mg/L
pH=8.2
55 COD
94 Turbidity
Ferric chloride: 0.035 mol Fe3+/L
pH=5.1 Amokrane et
al. [47] 42 COD
87 Turbidity
Alum: 0.035 mol Al3+/L
pH=5.6
Coagulation/
Flocculation
COD=5350 mg/L
BOD5/COD=0.20
pH=7.9
45 COD
75 COD
66 COD
Lime: 7g/L Ca(OH)2; pH=12
Ferric chloride:1.5 g Fe3+/L
Alum: 0.7 g Al3+/L; pH = 10 Tatsi et al.
[48] COD=70,900 mg/L
BOD5/COD=0.38
pH=6.2
30 COD
25 COD
38 COD
Lime: 7g/L Ca(OH)2; pH=12
Ferric chloride:0.5 g Fe3+/L
Alum: 1.5 g Al3+/L
Coagulation/
Flocculation
COD=5050 mg/L
BOD5/COD=0.17
pH=8
72 COD
38 Colour FeCl3: 7 mM Fe; pH=5.2
Ntampou et al.
[49] 62 COD
38 Colour PACl-18: 11 mM Al; pH=5.7
Chemical
precipitation
COD=4024 mg/L
NH4+-N=2240 mg/L
pH=7.7
50 COD
85 NH4+-N
Struvite (MAP) precipitation
Mg:NH4:PO4=1:1:1; pH=9.2
(MgCl2.6H2O+NaH2PO4.2H2O) Ozturk et al.
[50] Ammonia
Stripping
COD=5730 mg/L
NH4+-N=1025 mg/L
pH=7.9
25 COD
85 NH4+-N
pH=12; 17 h of aeration time
Chemical
precipitation
COD=4295 mg/L
BOD5/COD=0.49
NH4+-N=1750 mg/L
9 COD
82 NH4+-N
Struvite precipitation
Mg:N:P=3:1:1; pH=5.3-8.4
(MgO+H3PO4)
Huang et al.
[51]
Adsorption
by activated
carbon
COD=879-940 mg/L
BOD5/COD=0.004
pH=7.5
~91 COD
dark colour-
-colourless
Pre-treated leachate (0.8 L/h)
Granular carbon (1031 m2/g)
Stainless steel column
(1.25m×60mm; 16 kg of carbon)
Pirbazari et al.
[52]
Ammonia
Stripping
COD=190-920 mg/L
NH4+-N=74-220 mg/L
pH=7.9
4-21 COD
89, 64 NH4+-N
pH=11; 24 h of aeration time
T=20,6 ºC
Marttinen et
al. [46]
Legend: DAF – Dissolved air flotation; IT – Injection time; RT – Retention time; Alum - aluminium sulphate,
Al2(SO4)3.18H2O; PACl-18 - poly-aluminium chloride; MAP - Magnesium ammonium phosphate, MgNH4PO4.6H2O.
Chapter 1
23
Flotation has been widely used for the removal of colloids, ions, macromolecules, microorganisms and
fibres from wastewaters, but there are few studies reporting this application on the leachate remediation
[14]. Combining flotation with coagulation, it is possible to achieve COD removals higher than 75%
[31, 32]. This technique is a good option when the available land area does not allow the construction
of settling tanks [57].
Coagulation/flocculation has been effectively employed for leachate treatment from mature landfills, as
could be seen in Table 1.5. The affinity for old leachates is due to the fact that these are mainly
constituted by humic and fulvic acids. Actually, Yoon et al. [58], using an ultrafiltration system for the
organic compounds fractionation, showed that along the coagulation process of a leachate from an
aerated lagoon, the organics with MW > 500 Da were removed more easily (59 – 73%) than the organics
with a MW < 500 Da (18%). Coagulation is extensively used as pre-treatment of biological processes
and reverse osmosis (avoiding the membrane fouling) or as polishing step to remove bio-refractory
compounds [14].
Usually, chemical precipitation and ammonia stripping are used when the leachate presents a high
ammonium content, due to its efficiency, process simplicity and cheap equipment [16]. However, a high
chemicals dosage and additional air pollution control are required for chemical precipitation and
ammonia stripping, respectively. These technologies allow obtaining ammonium abatements greater
than 80% (Table 1.5). Even though, adsorption leads to better results than chemical methods. However,
the regular need to regenerate or replace the adsorbent means high associated costs, which often makes
this option unfeasible [15, 57].
Chemical oxidation has been subject of many studies about wastewater treatment containing non-
biodegradable organic matter, including landfill leachates. The main focus of interest from various
authors [53-56] is Advanced Oxidation Processes (AOPs), which have been positively applied in the
treatment of stabilized leachates. AOPs are able to oxidize organic substances with the perspective of
full mineralization or biodegradability's enhancement until obtaining a range of values that allows the
coupling with a subsequent biological treatment. AOPs will be subject to further description in the next
sub-chapter.
The combination of biological processes with physical-chemical technologies minimizes the drawbacks
of each individual treatment, optimizing the effectiveness of the overall process. Furthermore, the UK
Environment Agency presented in 2007 a guidance for the treatment of landfill leachates [57], which
indicated that the Best Available Technology for leachates treatment relied on the adoption of a
multistage treatment process, possibly involving the use of primary, secondary, and tertiary processes,
adjusted to the type of leachate, including the different technologies aforementioned.
Chapter 1
24
1.3.4 Membrane filtration
Membrane separation processes involve the use of synthetic membranes, porous or semipermeable, to
separate small solid particles, molecules or even dissolved ionic compounds from water. The separation
process is based on a hydraulic pressure gradient, where a certain pressure is applied to the more
concentrated solution, compelling the water to flow from the higher concentration to the lower
concentration through the membrane. The liquid that passes through the semipermeable membrane is
designed as permeate and the liquid containing the retained compounds is designed as concentrate. The
main membrane processes used on leachate treatment are (i) microfiltration (MF), (ii) ultrafiltration
(UF), (iii) nanofiltration (NF) and (iv) reverse osmosis (RO). Basically, the difference between each
method is the membrane pore size and the driving force intensity [14, 26, 59]. Table 1.6 presents some
applications of membrane filtration processes for leachate treatment.
Concerning membrane separation technologies, NF and RO seem to be the best choices (see Table 1.6).
MF and UF do not allow an effective removal of the organic matter (<50%), so they could be used prior
to NF and RO processes, in order to prevent membrane fouling, which is one of the main disadvantages
of the membrane filtration (see Table 1.3). Membrane fouling can also be avoided by using a coagulation
process as pre-treatment. Commonly, RO is preceded by biodegradation, lime precipitation or hybrid
systems combining biological and chemical oxidation treatment [26, 52, 60].
During the late 90s, in Germany, the Netherlands, Belgium, France, Portugal and Spain, a lot of reverse
osmosis (RO) leachate treatment systems were designed with an aerated lagoon upstream from a 2-stages
RO plant. This configuration presented as advantage the aerated lagoon, which significantly reduced the
nitrogen and organic matter load. Although the production of a high quality effluent (permeate) was a
significant advantage of the RO process, the non-biodegradable components of the leachate, such as
chloride, residual COD and heavy metals, were present in the concentrate, which could be 10%-25% of
the leachate’s volume [57].
Additionally, all chemicals required for the effective operation of an RO plant, such as citric acid,
membrane cleaner and anti-scaling detergents (up to 0.3% per cubic meter of treated leachate) were also
present in the concentrate. The final destinationl of the concentrate is a key factor to be addressed, and
normally the concentrate is returned to the landfill or disposed of off-site. The return of concentrate to
the landfill leads to an increase of COD and NH4+-N concentration in the leachate, as well as an increase
in electrical conductivity [57].

Chapter 1
25
Table 1.6. Performance of the different membrane filtration processes on the landfill leachate treatment.
Process Initial characterization Removal (%) Observations Reference
MF
COD=2300 mg/L
BOD5/COD=0.30
pH=7.25
25-35 COD
Polypropylene tubular membrane
v=4.1-4.3 m/s; cut-off:0.2μm;
T=20ºC; surface area (a) =0.11 m2
Piatkiewicz et
al. [61] UF
(after MF)
COD=1700 mg/L
BOD5/COD=0.29 5-10 COD
Polysulphone tubular membrane
v=4.1-4.3 m/s; cut-off:50-80 kDa;
T=20ºC; a=0.15 m2
RO
(after UF)
COD=1820 mg/L
BOD5/COD=0.30 -
Spiral wound
v=4.1-4.3 m/s; T=20ºC
NF
COD=550 mg/L
NH4+-N=220 mg/L
56 COD
27 NH4+-N
Polymer membrane Desal 5 DL
v=3 m/s; cut-off:200-300 Da;
P=6-8 bar; T=25ºC; a=45 cm2
Marttinen et
al. [46]
COD=600 mg/L
NH4+-N=74 mg/L
66 COD
50 NH4+-N
COD=200 mg/L
NH4+-N<1 mg/L
83 COD
- NH4+-N
UF COD=1660 mg/L 49 COD
Polysulfone
v=2.5 m/s; cut-off:300 kDa;
P=0.3 MPa; T=25ºC; a=0.025 m2 Bohdziewicz
et al. [60] RO
(after UF) COD=846 mg/L 93 COD
Cellulose acetate (SS)
v=1.5 m/s; P=2.76 MPa; T=25ºC;
a=0.0155 m2
NF COD=500 mg/L
BOD5/COD=0.01 74/80 COD
Polyacrilonitrile/Polypropylene
v=3 m/s; cut-off:450 Da;
P=2 MPa; T=25ºC; a=490 cm2
Trebouet et al.
[62]
RO COD=1749 mg/L 96-98 Spiral wound
v=1.5 m/s; P=20-53 bar; T=28ºC
Bohdziewicz
et al. [60]
In general, there is no technology that, acting alone, is able to treat effluents with such recalcitrant
organic fraction and as high organic and inorganic load as in the leachate. The best solution is based on
combined systems being able to achieve a cost/effective treatment technology. The treatment strategy is
going to be dependent on the leachate quality and on the water discharge standards imposed by the local
authorities.
Chapter 1
26
1.3.5 Leachate treatment systems in Portugal
In Portugal, the main treatment systems used in the leachate treatment plants (LTP) are: i) activated
sludge biological oxidation (ASBO) followed by physico-chemical treatment (in 25% of cases); and ii)
ASBO or aerated lagoons, followed by reverse osmosis membranes (32% of cases). The most basic
treatments consist in aerated or stabilization lagoons and represent 15% of the LTP. There are two cases
(6%) wherein the polishing treatment, downstream from the biological treatment, consists in
macrophytes beds. Table 1.7 presents the leachate treatment systems used in Portuguese LTP and the
respective leachate final destination.
According to municipal waste management entities, in 19% of the 42 existing landfills the produced
leachate is directly discharged into sewerage systems for full treatment in wastewater treatment plants.
In other cases, the leachate is sent to the landfill's LTP, (i) either for pre-treatment, followed by final
treatment at the municipal WWTP, situation that occurs in 47% of cases, (ii) or for complete treatment,
followed by discharge into water bodies. According to data supplied by the same entities, in 2006, about
one thousand millions of cubic meters of leachate were sent to LTP. An analysis aiming at evaluating
the LTP's operation allowed to conclude that, in about 80% of existing landfills, the leachate treatment
efficiencies obtained were lower than the initially predicted [63].
Results obtained from a study carried out by the IRAR demonstrated, in fact, an elevated inconstancy,
both on the quality and on the quantity of the leachates fed to the evaluated LTP. It was also found that
the removal efficiencies of BOD5 and COD were lesser than expected, which does not allow the
fulfilment of the emission limit values imposed by the legislation. This is due to the poor effluent
biodegradability, whereby the resort to biochemical processes is not enough. In this study, reverse
osmosis was the treatment technology that displayed the best results, especially when it was proceeded
by biological processes [63]. In terms of cost-effectiveness, the best option is the use of biological
technologies. However this kind of treatment is only fully suitable to young leachates, as these are quite
biodegradable. For old leachates, it proved to be inefficient due to the presence of recalcitrant
compounds, thus being required the use of an additional process at downstream [64].
Currently, in Portugal, the existing landfills are mostly recent and generate significant amounts of
leachate. Given the current problematics of the leachate management, which is largely related to the lack
of efficiency of the operating systems, and a society when environmental issues are increasingly
pressing, the optimization of these treatment systems is essential to prevent the pollution of water bodies
and soils.
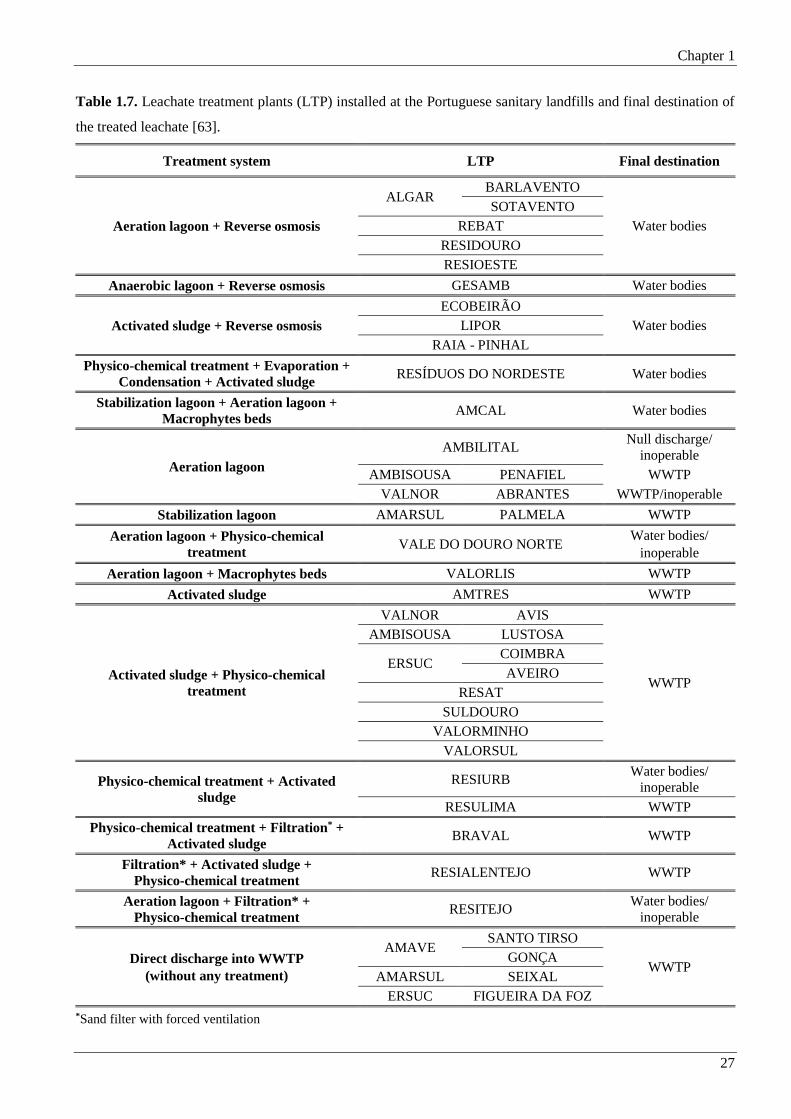
Chapter 1
27
Table 1.7. Leachate treatment plants (LTP) installed at the Portuguese sanitary landfills and final destination of
the treated leachate [63].
Treatment system LTP Final destination
Aeration lagoon + Reverse osmosis
ALGAR BARLAVENTO
Water bodies
SOTAVENTO
REBAT
RESIDOURO
RESIOESTE
Anaerobic lagoon + Reverse osmosis GESAMB Water bodies
Activated sludge + Reverse osmosis
ECOBEIRÃO
Water bodies LIPOR
RAIA - PINHAL
Physico-chemical treatment + Evaporation +
Condensation + Activated sludge RESÍDUOS DO NORDESTE Water bodies
Stabilization lagoon + Aeration lagoon +
Macrophytes beds AMCAL Water bodies
Aeration lagoon
AMBILITAL Null discharge/
inoperable
AMBISOUSA PENAFIEL WWTP
VALNOR ABRANTES WWTP/inoperable
Stabilization lagoon AMARSUL PALMELA WWTP
Aeration lagoon + Physico-chemical
treatment VALE DO DOURO NORTE
Water bodies/
inoperable
Aeration lagoon + Macrophytes beds VALORLIS WWTP
Activated sludge AMTRES WWTP
Activated sludge + Physico-chemical
treatment
VALNOR AVIS
WWTP
AMBISOUSA LUSTOSA
ERSUC COIMBRA
AVEIRO
RESAT
SULDOURO
VALORMINHO
VALORSUL
Physico-chemical treatment + Activated
sludge
RESIURB Water bodies/
inoperable
RESULIMA WWTP
Physico-chemical treatment + Filtration* +
Activated sludge BRAVAL WWTP
Filtration* + Activated sludge +
Physico-chemical treatment RESIALENTEJO WWTP
Aeration lagoon + Filtration* +
Physico-chemical treatment RESITEJO
Water bodies/
inoperable
Direct discharge into WWTP
(without any treatment)
AMAVE SANTO TIRSO
WWTP GONÇA
AMARSUL SEIXAL
ERSUC FIGUEIRA DA FOZ
*Sand filter with forced ventilation

Chapter 1
28
1.4 Advanced oxidation processes
The elimination of persistent organic compounds (low biodegradability) is one of the most significant
problems in the treatment of industrial wastewater and effluents from farms and household (containing
pesticides, herbicides, fertilizers, detergents, etc.). The search for effective ways to remove these
compounds is of general interest in order to comply with the discharge regulations and fundamentally
enable the reuse of water.
The conventional wastewater treatments, based on various mechanical, biological, physical and
chemical processes, presents limitations in their applicability, efficiency and costs. For instance,
processes such as adsorption on activated carbon or air stripping, only allow the separation of
contaminants, leading to their concentration in a solid matrix or their transference into the gas phase,
respectively. Therefore, they are not an environmentally sustainable long-term solution. The incineration
is capable of converting toxic compounds into carbon dioxide, water and inorganic acids, but a defective
operation can cause the emission of not destroyed constituents and organic products of incomplete
combustion, turning this waste disposal method a source of controversy.
Among the chemical oxidation technologies, the advanced oxidation processes (AOPs) have been
recognized as highly efficient on treatment and biodegradability enhancement of different recalcitrant
effluents, including textile [65-67], cork [68, 69], winery [70-73], pharmaceutical [74-76], paper mill
[77] and wastewater from WWTP [78], olive mill wastewaters [79], pesticide-containing wastewaters
[80, 81], leachates from sanitary landfills [11, 54, 82-89] and many others as report by Oller et al. [90].
AOPs have also shown effective results on the disinfection of drinking water contaminated with humic
acids and microorganisms, such as E. coli [91], E. faecalis [92] and cyanobacteria [93].
The efficiency of these systems is based on the production of strong oxidizing species, e.g. hydroxyl
radical (HO•), which can oxidize most of the organic molecules until complete mineralization. The
hydroxyl radical has an oxidizing potential (+ 2.8 V) higher than other traditional oxidants (ozone,
hydrogen peroxide, chlorine dioxide and chlorine), as can be seen in Table 1.8. Hydroxyl radicals are
non-selective, so they are able to react with virtually all classes of organic and inorganic compounds,
leading, as mentioned above, to their total mineralization or the formation of more biodegradable
intermediates. This methodology can be applicable to a wide variety of natural matrices and the
decontamination occurs by degradation of pollutants and not by a simple phase transfer [94].

Chapter 1
29
Table 1.8. Oxidation potential of different species.
Oxidant agent Eº (V)
Fluorine 3.03a, c, 3.06b
Hydroxyl radical 2.80a, b, c
Sulfate radical 2.60
Singlet Oxygen 2.42a, b, c
Ozone 2.07a, 2.08b
Hydrogen peroxide 1.77a, 1.78b
Perhydroxyl radical 1.70c
Permanganate 1.67a
Chlorine dioxide 1.50a, 1.27b, 1.57c
Hypochlorite 1.49b
Chlorine 1.36a, b, c
Molecular oxygen 1,23b
Bromine 1.09a, c
Iodine 0.54a, 0.59c
aAl-Momani [95]; bTchobanoglous et al. [96]; cGernjak et al. [97].
Hydroxyl radical can be generated by different AOPs, which can be divided into photochemical
processes, if in the presence of radiation, and non-photochemical processes, if no radiation is required
[26], as described in Table 1.9. The mechanisms and characteristics of these processes have been
described in detail in other studies regarding general and particular aspects of each method or
combination thereof [53, 98-101].
Table 1.9. Typical AOPs [14, 26].
Non-photochemical Photochemical
Ozonation (O3) at high pH (>8.5) O3/UV
O3/H2O2 H2O2/UV
Ozone/catalyst O3/H2O2/UV
Fenton (H2O2/Fe2+) Photo-Fenton
Electro-Fenton Electro-Photo-Fenton
TiO2/UV
TiO2/H2O2/UV
Photolysis

Chapter 1
30
One of the biggest problems of the AOPs is the high cost associated with the reagents (e.g. H2O2) and
energy consumption (UV radiation production). The reagents consumption can be reduced by using
catalysts. With regard to energy consumption, this aspect can be overcome using solar radiation, with
the advantages inherent in the use of a renewable energy source, clean and free of charge. Portugal is
one of the European countries with greater availability of solar radiation (see Figure 1.8), both in terms
of hours of sunshine, and in terms of annual global solar radiation. In Portugal, the annual average
number of hours of sunshine varies between 2200 and 3000, while, for example, in Germany, ranges
from 1200 to 1700 hours. At a time where sustainable development and, in particular, the use of
renewable resources, focuses the attention of so many people, it is important to explore better this wealth.
Figure 1.8. Average annual values of global radiation (kWh/m2) [102].
Several works can be found in the literature using AOPs for landfill leachate treatment. Table 1.10
summarizes the main remarks of some of these works and compare the diverse employed technologies.

Chapter 1
31
Table 1.10. Performance of the different AOPs on the landfill leachate treatment.
Process Initial characterization Removal (%) Observations Reference
O3 COD=1010 mg/L
Colour=2300 units
57-81 COD
78-89 Colour
Air flow rate = 4 L/min
O3=1.5-2 g/h; t=240 min
Ntampou et
al. [49]
O3 COD=5230 mg/L
BOD5/COD=0.1
pH=8.7
27 COD
BOD5/COD=0.1
Air flow rate = 200 mL/min
O3=80 g/m3; t=60 min Tizaoui et al.
[56] O3/H2O2
48 COD
BOD5/COD=0.7 H2O2=2 g/L
O3/UV TOC = 430 mg/L 51-40 TOC Air flow rate = 540-200 L/h
O3=100 g/m3; t=250 min; P=300 W
Wenzel et al.
[103] O3/H2O2/UV 57 TOC
Air flow rate = 540 L/h
O3=100 g/m3; t=250 min
P=200-400W; H2O2=1 mL/min
H2O2/UV 42 TOC Air flow rate = 540 L/h
t=250 min; H2O2=1 mL/min
H2O2/UV
COD=3270-4575 mg/L
DOC=954-1220 mg/L
BOD5/COD=0.04-0.07
23 DOC Solar Radiation
Q= 500 kJ/L; H2O2=1350 mM
Rocha et al.
[55]
Fe2+/H2O2/UV 86 DOC pH=2.6-2.9; Q= 110 kJ/L;
Fe2+=60 mg/L; H2O2=306 mM
TiO2/UV 26 DOC TiO2=200 mg/L; Q=1019 kJ/L
pH=5
TiO2/
H2O2/UV 79 DOC
TiO2=200 mg/L; Q= 111 kJ/L
pH=4; H2O2=267 mM
TiO2/UV
COD=1260-1673 mg/L
TOC=269-428 mg/L
BOD5=27-111 mg/L
80 COD
90 TOC
TiO2=3000 mg/L; pH=4;
I=21 W/cm2; t=12 h
Cho et al.
[104]
Fe/H2O2 COD=2072 mg/L
TOC=769 mg/L
BOD5/COD=0.17
70 COD
~68 DOC
pH=2.5; T=25 ºC; Fe2+=50 mM;
H2O2=75 mM; t=60 min Hermosilla
et al. [11] Fe/H2O2/UV
pH=2.5; T=25 ºC;
V=4 L; t≈240 min; P=400 W;
Fe2+=1.6 mM; H2O2=75 mM
Fe2+/H2O2 COD=3420 mg/L
DOC=1045 mg/L
BOD5/COD=0.07
24 DOC pH=2.8; T=17-35 ºC; t=11 days;
Fe2+=20 mg/L; H2O2=54 mM Vilar et al.
[105] Fe2+/H2O2/UV 86 DOC
Solar Radiation: Q= 206 kJ/L
pH=2.8; T=15-43 ºC;
Fe2+=20 mg/L; H2O2=366 mM
UV/H2O2
COD=2350 mg/L
BOD5/COD=0.39
-52 COD I=1.4 W/cm2; H2O2=2000 mg/L;
pH=3; t=20 min
Altin [106]
EC ~20 COD Current=2.0 A; pH=3; t=20 min
EF ~70 COD H2O2=2000 mg/L; pH=3;
Current=2.0 A; t=20 min
PEF ~80 COD I=1.4 W/cm2; H2O2=2000 mg/L;
pH=3; Current=2.0 A; t=20 min
EC – electro-coagulation; EF – electro-Fenton; PEF – photo-electro-Fenton.

Chapter 1
32
Considering all the AOPs, the photo-Fenton reaction seems to be the more adequate to the treatment of
landfill leachate (Table 1.10). Specially, the solar-driven photo-Fenton process has been reported as the
best option in terms of integrated environmental and economic point of view, taken into account its
life-cycle greenhouse gas emission and life-cycle cost [107]. Results reported by Vilar et al. [105] and
Rocha et al. [55] also showed that the solar photo-Fenton process can be selected as the best option for
the pre-oxidation of mature leachates, after preliminary biological lagooning, promoting
biodegradability's enhancement [88, 108, 109], which makes possible the combination with a further
biological oxidation system.
In 1894, H.J.H. Fenton discovered that using a primary oxidant, such as hydrogen peroxide (H2O2),
together with iron salts, as catalyst, many organic molecules could be oxidised. However, the application
of Fenton's reagent as oxidation process for destruction of toxic organic compounds only began in 1960
[110, 111]. Two mechanisms were proposed to describe Fenton's reaction, the first one formulates a
radical chain reaction (Haber-Weiss mechanism) and the second one an ionic mechanism (Kremer-Stein
mechanism) [97]. In the mechanism generally accepted for Fenton reaction (Haber-Weiss mechanism),
in acidic aqueous solutions, the Fe2+ is oxidised to Fe3+ by H2O2, leading to the formation of HO• radicals
(Eq. (1.2)) [112, 113].
Commonly, it is accepted, that in the absence of light, the origin of HO• radical is represented by the
free radicals mechanism proposed by the Eqs. (1.2), (1.3), (1.4) and (1.6) [114]. The Fenton reaction is
described by Eqs. (1.2) to (1.9), which represent the reactions of the Fe2+, Fe3+ and H2O2, in the absence
of other ions and organic substances. In this conditions, the HO• radical formed can oxidize Fe2+,
according to Eq. (1.5) [97, 113]. The Eqs. (1.2), (1.3) and (1.6) establish a chain reaction, leading to
continuous generation of HO• radicals and, as such, the continuous degradation of the organic
contaminants [110].
3
22
2 OHOHFeOHFe k = 70 M-1s-1 (1.2)
2
2
22
3 HHOFeOHFe k = 1-2×10⁻² M-1s-1 (1.3)
OHHOOHOH 2
2
22 k = 3.3×10⁷ M-1s-1 (1.4)
- 3 2 HOFeOHeF k = 3.2×10⁸ M-1s-1 (1.5)
2
2
2
3 HOFeHOFe k < 2.0×10³ M-1s-1 (1.6)
22
3
2
2 OHFeHHOFe k = 1,2×10⁶ M-1s-1 (1.7)
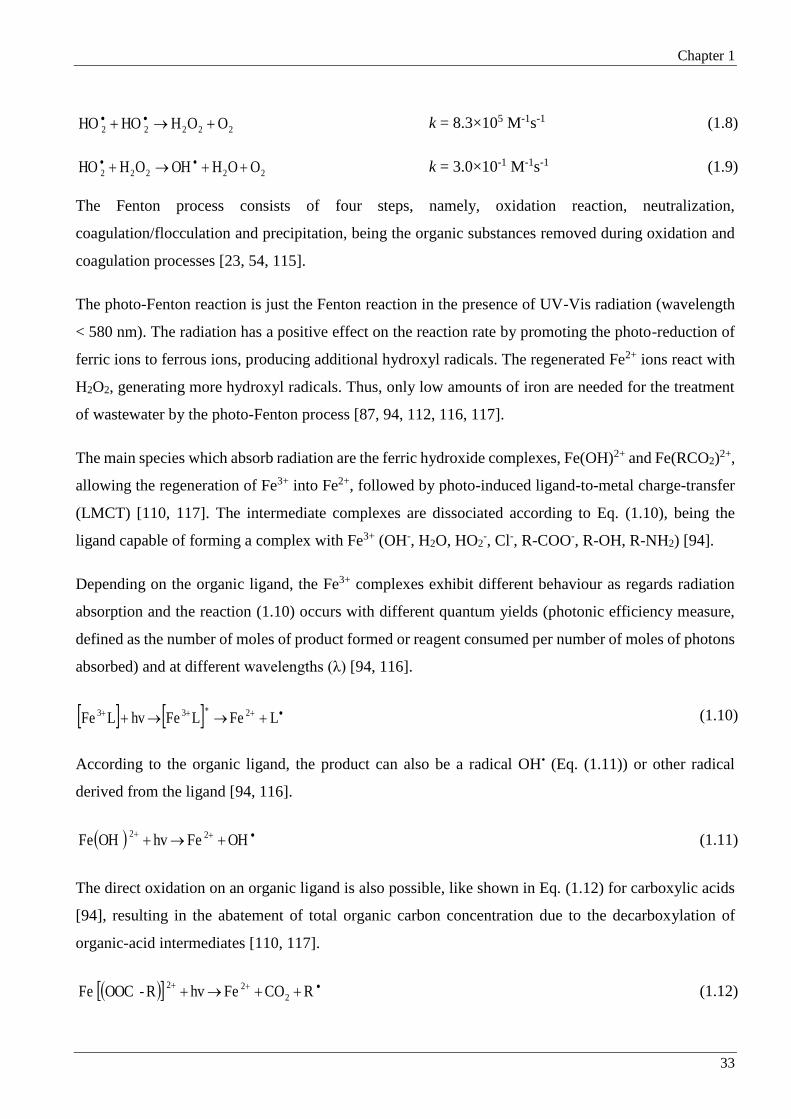
Chapter 1
33
222
2
2 OOHHOHO k = 8.3×10⁵ M-1s-1 (1.8)
22
22
2 OOHOHOHHO k = 3.0×10⁻¹ M-1s-1 (1.9)
The Fenton process consists of four steps, namely, oxidation reaction, neutralization,
coagulation/flocculation and precipitation, being the organic substances removed during oxidation and
coagulation processes [23, 54, 115].
The photo-Fenton reaction is just the Fenton reaction in the presence of UV-Vis radiation (wavelength
< 580 nm). The radiation has a positive effect on the reaction rate by promoting the photo-reduction of
ferric ions to ferrous ions, producing additional hydroxyl radicals. The regenerated Fe2+ ions react with
H2O2, generating more hydroxyl radicals. Thus, only low amounts of iron are needed for the treatment
of wastewater by the photo-Fenton process [87, 94, 112, 116, 117].
The main species which absorb radiation are the ferric hydroxide complexes, Fe(OH)2+ and Fe(RCO2)2+,
allowing the regeneration of Fe3+ into Fe2+, followed by photo-induced ligand-to-metal charge-transfer
(LMCT) [110, 117]. The intermediate complexes are dissociated according to Eq. (1.10), being the
ligand capable of forming a complex with Fe3+ (OH-, H2O, HO2-, Cl-, R-COO-, R-OH, R-NH2) [94].
Depending on the organic ligand, the Fe3+ complexes exhibit different behaviour as regards radiation
absorption and the reaction (1.10) occurs with different quantum yields (photonic efficiency measure,
defined as the number of moles of product formed or reagent consumed per number of moles of photons
absorbed) and at different wavelengths (λ) [94, 116].
2 3 3 LFeLFevhLFe (1.10)
According to the organic ligand, the product can also be a radical OH• (Eq. (1.11)) or other radical
derived from the ligand [94, 116].
2 2
OHFehv OH Fe (1.11)
The direct oxidation on an organic ligand is also possible, like shown in Eq. (1.12) for carboxylic acids
[94], resulting in the abatement of total organic carbon concentration due to the decarboxylation of
organic-acid intermediates [110, 117].
2
2 2 RCOFehvR- OOC Fe (1.12)

Chapter 1
34
The organic radical (R•) reacts instantly with O2 to produce a peroxyl radical that subsequently initiates
an oxidation reaction (Eq. (1.13)) [11, 118].
Product RO OR
22
(1.13)
The main parameters affecting the efficiency of the photo-Fenton reaction are pH, initial concentrations
of Fe2+ and H2O2, temperature and irradiance. Table 1.11 only shows a brief description of the influence
of theses parameters on the photo-Fenton reaction. Further evaluation on this subject will be held in
Chapter 7.
Table 1.11. Main photo-Fenton reaction parameters and their respective effect (updated from Pereira [119]).
Parameter Influence or effect on reaction rates
pH
Controls the distribution of dissolved ferrous and ferric iron hydroxide species, which
have different molar absorption coefficients. Optimal pH ~ 2.8 avoids precipitation and
maximizes quantum yields.
Iron
concentration
Increasing iron concentration increases reaction rates. Relation is not proportional and
levels off due to attenuation of incident radiation. Optimization needs to consider reactor
geometry and inner filter effects.
H2O2
Optimum H2O2 concentration must be found. Lower concentrations lead to a rate
reduction of Fenton reaction, while higher ones lead to an unfavourable competition for
HO• radicals.
Temperature Increasing temperature customarily increases reaction rates, up to the point where
hydrogen peroxide is inefficiently consumed and ferric ions precipitates.
Irradiance
Useful radiation absorption over the UV/Vis spectrum, especially in the presence of
carboxylate anions. Excess radiation favours parallel occurrence of thermal reactions.
Optimization of optical pathlength greatly reduces the amount of necessary photons.
Substrate
concentration and
characteristics
Higher concentrations require longer treatment times and are prone to cause inner filter
effects. Released inorganic ions can interfere with the degradation process (e.g.:
precipitation of iron by phosphate).
The applicability of this technology in the treatment of leachate does not presuppose the complete
mineralization of the contaminants using hydroxyl radicals, but instead, it assumes the oxidation of
recalcitrant compounds by photochemical processes, until achieving a biodegradability level compatible
with a conventional biological oxidation system.

Chapter 1
35
Bae et al. [120] published a work dealing with the treatment of mature landfill leachates by an integrated
treatment system compose by (i) an anaerobic filter (AF) (35 ºC); followed by a 2-stage activated sludge
(AS) (25ºC) reactor with recirculation to AF, (ii) a Fenton process (pH 3.5) and (iii) a post-AS reactor
(25 ºC). The overall system was able to completely remove 1400-1800 mg/L of ammonium nitrogen,
leaving 200 mg/L of nitrate nitrogen. Also, 4000-7000 mg/L of COD in the raw leachate was reduced
to 150-200 mg/L.
Vilar et al. [88] proposed the combination of a solar photo-Fenton (60 mg Fe2+/L) process with a
biological nitrification-denitrification system for the decontamination of a stabilized landfill leachate,
collected after aerobic lagooning, using photocatalytic (4.16 m2 of Compound parabolic Collectors –
CPCs) and biological (immobilized biomass reactor) systems. They achieved a COD lesser than 250
mg/L and a complete removal of nitrogen compounds from the photo-pre-treated leachate via biological
nitrification-denitrification, after previous neutralization/sedimentation of iron sludge.
Cassano et al. [82] compared several combined/integrated biological AOPs setups for the treatment of a
medium-age landfill leachate. Setups included a sequencing batch biofilter granular reactor (SBBGR),
with or without ozone (O3) enhancement, followed or not by solar photo-Fenton (SphF) polishing step.
All treatment strategies demonstrated to be technically suitable to achieve the target COD values of 160
and 500 mg/L (disposal into water bodies and sewers, respectively) and the toxicity goals. However, for
the target COD of 160 mg/L, the combination of SBBGR with SphF was economically more convenient.
De Torres-Socías et al. [121] suggested a combined treatment line for a particular landfill leachate,
containing a high organic load (40 g/L as COD and 15 g/L as DOC), consisting of a preliminary
physico-chemical stage followed by a solar photo-Fenton process and a final conventional bio-treatment.
The results revealed that this multistage treatment was effective on the reduction of the recalcitrant
organic content after the conditioning step (17% DOC removal), requiring then a solar photo-treatment
(1 mmol Fe2+/L) time of 11 hours to generate, after 27% mineralization, a non-toxic and biodegradable
effluent.
The combination of photochemical and biological processes reduces the treatment time and the total
cost, since the required solar collectors area can be significantly reduced. The most suitable conditions
for the biological treatment are obtained when the phototreatment time is only enough to get a high
efficiency in the biological treatment. Longer times of phototreatment only will oxidise biologically
degradable substances, without any benefit.

Chapter 1
36
1.5 Aim of the work and thesis outline
In the last decades the production of waste increased significantly due to excessive population growth
and to the changing of their consumption habits. Landfilling is the most used final waste disposal method
around the world. However, one of the environmental problems associated with the disposal of
municipal waste in landfills is the generation of leachate, which is a wastewater characterized by high
concentrations of organic and inorganic contaminants, including humic substances, ammonium nitrogen,
heavy metals, xenobiotic compounds that need to be removed due to their toxicity and consequent
impacts on the environment. Besides that, the leachates also present high variability in their quantity and
quality, along the year, which makes the definition of an efficient treatment line for all situations very
difficult.
Due to their cost-effectiveness, biological treatments are usually used to remove biodegradable organic
compounds. These are effective in the treatment of leachate from young landfills but are ineffective in
the treatment of stabilized leachate due to the presence of recalcitrant compounds, mainly humic
substances. Its recalcitrant nature leads to the need for alternative technologies implementation to
efficiently remove the organic load present in these effluents. AOPs are able to degrade a wide range of
compounds from stabilized landfill leachates. Despite their high effectiveness, they become quite
expensive if applied alone. Having in mind that the leachate presents high contents of nitrogen and
recalcitrant organic matter and aiming at a significant reduction on the leachate treatment cost, the best
strategy, for leachate remediation, seems to be the integration of biological and chemical oxidation
processes.
The main objective of this thesis was to develop and optimize a multistage methodology for the treatment
of mature landfill leachates, targeting mostly the discharge into water bodies, at comfortable costs.
Regardless the multistage treatment system used, the treatment strategy always involved an activated
sludge biological oxidation (ASBO) and a photo-Fenton (PF) reaction. Later, it was also incorporated a
coagulation/sedimentation stage. All processes were tested at lab and pre-industrial scale units equipped
with (i) a biological reactor prepared to work under aerobic and anoxic conditions, and (ii) a photoreactor
equipped with compound parabolic collectors (CPCs) and/or UV-Vis lamps. In order to accomplish the
main purpose, several partial objectives were addressed:
i) Leachate characterization along all stages;
ii) Assessment of the efficiency of each treatment stage, namely:
a. Biological reactor, under aerobic and anoxic conditions, and its dependence on the main
nitrification and denitrification variables for nitrogen removal;

Chapter 1
37
b. Photo-Fenton reactor, considering the effect of the main reaction variables and the use of natural
sunlight and/or artificial radiation;
c. Coagulation/sedimentation process, for different ferric ion concentration and pH values;
iii) Evaluation of the efficiency of the combined treatments, concerning the leachate characteristics’
variability, availability of solar radiation throughout the year, biodegradability enhancement during
the photo-oxidation processes, iron reutilization in consecutive oxidation processes and different
values of pH and settling times during coagulation;
iv) Economic analysis of the phototreatment step, based on different tests conducted under different
treatment strategies.
The present thesis is structured in 10 chapters:
Chapter 1 corresponds to the present introductory section, wherein the main questions associated with
the production and remediation of mature leachates from urban sanitary landfills are identified, as well
as current and potential decontamination methods, complemented with a briefly survey of current
literature.
Chapter 2 presents a description of all chemical reagents and experimental setups used, as well as the
experimental procedures and analytical methods employed.
In the Chapter 3, a strategy for the treatment of leachates from sanitary landfills after lagooning
pretreatment, combining solar PF oxidation process with an ASBO, at a near industrial plant, is
proposed. An extensive physico-chemical characterization of the leachate after lagooning was performed
over 1-year. The efficiency of the combined treatment is evaluated taking into account the leachate
characteristics’ variability, availability of solar radiation throughout the year, and different process
variables, such as the amount of hydrogen peroxide necessary to reach the required COD target value,
biodegradability enhancement during the photo-oxidation process, iron reutilization in consecutive
oxidation processes, removal of the acidic sludge resulting from the acidification process and leachate
temperature/average solar power. The elimination of the remaining organic carbon fraction and nitrogen
compounds after the pre-oxidation step is also assessed in an ASBO, under aerobic and anoxic
conditions, considering the composition variability of the photo-treated leachate. Nitrification and
denitrification reaction rates were also evaluated.
In the Chapter 4, the efficiency and performance of the (i) PF reaction, concerning sludge removal after
acidification and the optimum phototreatment time to reach a biodegradable wastewater that can be
further oxidized in a biological reactor and, (ii) ASBO process, calculating the nitrification and

Chapter 1
38
denitrification reaction rates, alkalinity balance and methanol necessary as external carbon source, is
evaluated using the plant presented in Chapter 3. Leachate biodegradability enhancement by means of a
solar-driven PF process was quantified by direct biodegradability tests, as Zahn-Wellens method, and
indirect measurements as the average oxidation state (AOS), low-molecular-weight carboxylic acids
content (fast biodegradable character) and humic substances (recalcitrant character) concentration.
In Chapter 5 a multistage treatment system, at pre-industrial scale, is proposed for the treatment of a
mature raw landfill leachate, including: (i) an ASBO, under aerobic and anoxic conditions; (ii) a solar
PF process to enhance the bio-treated leachate biodegradability, with and without sludge removal after
acidification; and (iii) a final polishing step, with further ASBO. The efficiency of the overall treatment
process, as well as the efficiency of each treatment stage was assessed.
Chapter 6 presents the scale-up and cost analysis of a PF process, using solar and/or artificial radiation,
for the treatment of 100 m3 per day of a sanitary landfill leachate previously oxidized in a biological
system, taking into account the CPCs (compound parabolic collectors) area and land requirements for
their installation and/or the number of UV lamps (with 4 kW and 20,000-h of lifetime each), considering
(i) the average global UV irradiance and insolation, in the specific location of the sanitary landfill, and
(ii) the amount of UV energy and H2O2 necessary for the PF reaction, in order to achieve target COD
values of 1000 and 150 mg O2/L, regarding the Portuguese regulations for discharges into sewerage
systems and water bodies, respectively.
In the Chapter 7, it is reported the effect of the main PF reaction variables on the treatment of a sanitary
landfill leachate collected at the outlet of a leachate treatment plant, which includes aerated lagooning
followed by aerated activated sludge and a final coagulation-flocculation step. The PF experiments were
performed in a lab-scale CPC photoreactor using artificial solar radiation and the photocatalytic reaction
rate was determined while varying the total dissolved iron concentration, solution pH, operating
temperature, type of acid used for acidification and UV irradiance. The role of ferric hydroxides, ferric
sulphate and ferric chloride species, by taking advantage of ferric speciation diagrams, in the efficiency
of the PF reaction when applied to leachate oxidation, is also assessed.
Chapter 8 discloses the effect of the main nitrification and denitrification variables on the nitrogen's
biological removal via nitrite, from mature leachates, collected after aerobic lagooning, using a 1-L
lab-scale batch reactor, equipped with a pH, temperature and dissolved oxygen (DO) control system, in
order to determine the reaction kinetic constants at unchanging conditions. The nitrification reaction rate
was evaluated while varying the operating temperature, DO concentration interval and solution pH. The
denitrification kinetic constants and the methanol consumption were calculated for different values of
Chapter 1
39
pH, temperature and amount of added phosphate, using the previously nitrified effluent. The
characterization of the biological communities was also performed, by a 454-pyrosequencing analysis
of the 16S rRNA gene.
In the Chapter 9 a new methodology for the treatment of landfill leachates, after aerobic lagooning, is
studied, at a scale close to industrial, involving an aerobic biological pre-oxidation by activated sludge,
a coagulation/sedimentation step and a photo-oxidation process (PF reaction), combining solar and
artificial radiation. The efficiency of the overall treatment process, as well as the efficiency of each
treatment stage was assessed. The scale-up and economic assessment of a PF process is also presented,
assuming the treatment of 100 m3/day of a leachate previously oxidized in a biological and coagulation
system, in order to achieve COD values below 1000 and 150 mg O2/L, according to the Portuguese
regulations for discharges into sewerage systems and water bodies, respectively.
Finally, Chapter 10 is dedicated to the final remarks, where the most relevant results and conclusions
are reported and some suggestions for future work are proposed.

Chapter 1
40
1.6 References
[1] D. Hoornweg, P. Bhada-Tata, C. Kennedy, Environment: Waste production must peak this century, Nature,
502 (2013) 615-617.
[2] IRAR, Gestão e tratamento de lixiviados produzidos em aterros sanitários de resíduos urbanos”, Instituto
Regulador de Águas e Resíduos, Relatório IRAR nº3, 2008, pp. 3-43.
[3] EUROSTAT (2015), Available at
http://appsso.eurostat.ec.europa.eu/nui/show.do?dataset=env_wasmun&lang=en on 1st July 2015.
[4] A.D. Read, P. Phillips, G. Robinson, Landfill as a future waste management option in England: the view of
landfill operators, Resources, conservation and recycling, 20 (1997) 183-205.
[5] EC (2008), Directive 2008/98/EC of the European Parliament and of the Council of 19 November 2008 on
waste and repealing certain directives (Waste framework directive), Official Journal of the European Union,
Available at http://eur-lex.europa.eu/legal-content/EN/TXT/PDF/?uri=CELEX:32008L0098&from=EN
on 18th July 2015.
[6] G. Martinho, F. Santana, J. Santos, A. Brandão, I. Santos, Gestão e tratamento de lixiviados produzidos em
aterros sanitários de resíduos urbanos (Management and treatment of leachate from municipal solid waste
sanitary landfills), in, DCEA/FCT/UNL. Relatório IRAR, 2008.
[7] ERSAR, Relatório Anual do Sector de Águas e Resíduos em Portugal, in, Entidade Reguladora dos Serviços
de Águas e Resíduos, 2010.
[8] M.A.T. Russo, Avaliação dos processos de transformação de resíduos sólidos urbanos em aterro sanitário, in:
Civil Engineering, Universidade do Minho, Braga, Portugal, 2006.
[9] APA, Resíduos Urbanos em 2010, in, Agência Portuguesa do Ambiente, 2011.
[10] J.Q. Levy, A.J. Cabeças, Resíduos sólidos urbanos – princípios e processos, AEPSA, Lisboa, 2006.
[11] D. Hermosilla, M. Cortijo, C.P. Huang, Optimizing the treatment of landfill leachate by conventional Fenton
and photo-Fenton processes, Science of the Total Environment, 407 (2009) 3473-3481.
[12] G. Tchobanoglous, H. Theisen, S. Vigil, Integrated solid waste management: engineering principles and
management issues, McGraw-Hill, New York, 1993.
[13] S.R. Qasin, W. Chiang, Sanitary landfill leachate – generation control and treatment, Technomic Publishing
Company, Inc. Lancaster, USA, 1994.
[14] S. Renou, J. Givaudan, S. Poulain, F. Dirassouyan, P. Moulin, Landfill leachate treatment: Review and
opportunity, Journal of Hazardous materials, 150 (2008) 468-493.
[15] J. Lema, R. Mendez, R. Blazquez, Characteristics of landfill leachates and alternatives for their treatment: a
review, Water, Air, and Soil Pollution, 40 (1988) 223-250.
[16] T.A. Kurniawan, W.-h. Lo, G.Y. Chan, Physico-chemical treatments for removal of recalcitrant contaminants
from landfill leachate, Journal of Hazardous materials, 129 (2006) 80-100.
[17] P. Kjeldsen, M.A. Barlaz, A.P. Rooker, A. Baun, A. Ledin, T.H. Christensen, Present and Long-Term
Composition of MSW Landfill Leachate: A Review, Critical Reviews in Environmental Science and
Technology, 32 (2002) 297-336.

Chapter 1
41
[18] M.T.L. Santos, Contribuição para o estudo da digestão anaeróbia de resíduos orgânicos, Dissertação de
Doutoramento, Faculdade de Ciências e Tecnologia, Universidade Nova de Lisboa, 2010.
[19] P.R. O’Leary, G. Tchobanoglous, Landfilling, in: G. Tchobanoglous, F. Kreith (Eds.) Handbook of Solid
Waste Management, McGraw-Hill, 2002.
[20] T.H. Christensen, P. Kjeldsen, P.L. Bjerg, D.L. Jensen, J.B. Christensen, A. Baun, H.-J. Albrechtsen, G.
Heron, Biogeochemistry of landfill leachate plumes, Applied Geochemistry, 16 (2001) 659-718.
[21] O. Primo, M.J. Rivero, I. Ortiz, Photo-Fenton process as an efficient alternative to the treatment of landfill
leachates, Journal of Hazardous materials, 153 (2008) 834-842.
[22] K.Y. Foo, B.H. Hameed, An overview of landfill leachate treatment via activated carbon adsorption process,
Journal of Hazardous materials, 171 (2009) 54-60.
[23] W. Li, Q. Zhou, T. Hua, Removal of organic matter from landfill leachate by advanced oxidation processes:
a review, International Journal of Chemical Engineering, 2010 (2010) 1-10.
[24] J.L. De Morais, P.P. Zamora, Use of advanced oxidation processes to improve the biodegradability of mature
landfill leachates, Journal of Hazardous materials, 123 (2005) 181-186.
[25] A.A. Abbas, G. Jingsong, L.Z. Ping, P.Y. Ya, W.S. Al-Rekabi, Review on Landfill Leachate Treatments,
Journal of Applied Sciences Research, 5 (2009) 534-545.
[26] J. Wiszniowski, D. Robert, J. Surmacz-Gorska, K. Miksch, J. Weber, Landfill leachate treatment methods:
A review, Environmental Chemistry Letters, 4 (2006) 51-61.
[27] S.R. Qasim, W. Chiang, Sanitary landfill leachate: generation, control and treatment, CRC Press, 1994.
[28] M.X. Loukidou, A.I. Zouboulis, Comparison of two biological treatment processes using attached-growth
biomass for sanitary landfill leachate treatment, Environmental Pollution, 111 (2001) 273-281.
[29] B. Rusten, B. Eikebrokk, Y. Ulgenes, E. Lygren, Design and operations of the Kaldnes moving bed biofilm
reactors, Aquacultural engineering, 34 (2006) 322-331.
[30] E. Engineering (2015), Trickling Filter – Classification and Mechanism, Engineering Articles, Available at
http://www.engineeringarticles.org/civil/environmental/trickling-filter-classification-and-mechanism/ on
15th August 2015.
[31] M.N. Adlan, P. Palaniandy, H.A. Aziz, Optimization of coagulation and dissolved air flotation (DAF)
treatment of semi-aerobic landfill leachate using response surface methodology (RSM), Desalination, 277
(2011) 74-82.
[32] P. Palaniandy, M.N. Adlan, H.A. Aziz, M.F. Murshed, Application of dissolved air flotation (DAF) in semi-
aerobic leachate treatment, Chemical Engineering Journal, 157 (2010) 316-322.
[33] S.Q. Aziz, H.A. Aziz, M.J.K. Bashir, A. Mojiri, Municipal Landfill Leachate Tretament Techniques: An
Overview, in: H.A. Aziz, A. Mojiri (Eds.) Wastewater Engineering: Advanced Wastewater Treatment
Systems, 2014.
[34] F.M. Ferraz, J. Povinelli, E. Pozzi, E.M. Vieira, J.C. Trofino, Co-treatment of landfill leachate and domestic
wastewater using a submerged aerobic biofilter, Journal of Environmental Management, 141 (2014) 9-15.

Chapter 1
42
[35] U.E. Agency, Guidance for the Treatment of Landfill Leachate, Integrated Pollution Prevention and Control
(IPPC), in, Sector Guidance Note IPPC S5.03, 2007.
[36] G. Ruiz, D. Jeison, O. Rubilar, G. Ciudad, R. Chamy, Nitrification–denitrification via nitrite accumulation
for nitrogen removal from wastewaters, Bioresource Technology, 97 (2006) 330-335.
[37] T.H. Hoilijoki, R.H. Kettunen, J.A. Rintala, Nitrification of anaerobically pretreated municipal landfill
leachate at low temperature, Water Research, 34 (2000) 1435-1446.
[38] J.-h. Im, H.-j. Woo, M.-w. Choi, K.-b. Han, C.-w. Kim, Simultaneous organic and nitrogen removal from
municipal landfill leachate using an anaerobic-aerobic system, Water Research, 35 (2001) 2403-2410.
[39] R.H. Kettunen, T.H. Hoilijoki, J.A. Rintala, Anaerobic and sequential anaerobic-aerobic treatments of
municipal landfill leachate at low temperatures, Bioresource Technology, 58 (1996) 31-40.
[40] D. Kulikowska, E. Klimiuk, Removal of organics and nitrogen from municipal landfill leachate in two-stage
SBR reactors, Polish Journal of Environmental Studies, 13 (2004) 389-396.
[41] A. Spagni, M.C. Lavagnolo, C. Scarpa, P. Vendrame, A. Rizzo, L. Luccarini, Nitrogen removal optimization
in a sequencing batch reactor treating sanitary landfill leachate, Journal of Environmental Science and
Health Part A, 42 (2007) 757-765.
[42] A. Spagni, S. Marsili-Libelli, Nitrogen removal via nitrite in a sequencing batch reactor treating sanitary
landfill leachate, Bioresource Technology, 100 (2009) 609-614.
[43] H. Sun, Y. Peng, X. Shi, Advanced treatment of landfill leachate using anaerobic–aerobic process: Organic
removal by simultaneous denitritation and methanogenesis and nitrogen removal via nitrite, Bioresource
Technology, 177 (2015) 337-345.
[44] I. Trabelsi, I. Sellami, T. Dhifallah, K. Medhioub, L. Bousselmi, A. Ghrabi, Coupling of anoxic and aerobic
biological treatment of landfill leachate, Desalination, 246 (2009) 506-513.
[45] U. Welander, T. Henrysson, T. Welander, Nitrification of landfill leachate using suspended-carrier biofilm
technology, Water Research, 31 (1997) 2351-2355.
[46] S.K. Marttinen, R.H. Kettunen, K.M. Sormunen, R.M. Soimasuo, J.A. Rintala, Screening of physical–
chemical methods for removal of organic material, nitrogen and toxicity from low strength landfill
leachates, Chemosphere, 46 (2002) 851-858.
[47] A. Amokrane, C. Comel, J. Veron, Landfill leachates pretreatment by coagulation-flocculation, Water
Research, 31 (1997) 2775-2782.
[48] A.A. Tatsi, A.I. Zouboulis, K.A. Matis, P. Samaras, Coagulation–flocculation pretreatment of sanitary
landfill leachates, Chemosphere, 53 (2003) 737-744.
[49] X. Ntampou, A.I. Zouboulis, P. Samaras, Appropriate combination of physico-chemical methods
(coagulation/flocculation and ozonation) for the efficient treatment of landfill leachates, Chemosphere, 62
(2006) 722-730.
[50] I. Ozturk, M. Altinbas, I. Koyuncu, O. Arikan, C. Gomec-Yangin, Advanced physico-chemical treatment
experiences on young municipal landfill leachates, Waste Management, 23 (2003) 441-446.
Chapter 1
43
[51] H. Huang, D. Xiao, Q. Zhang, L. Ding, Removal of ammonia from landfill leachate by struvite precipitation
with the use of low-cost phosphate and magnesium sources, Journal of Environmental Management, 145
(2014) 191-198.
[52] M. Pirbazari, V. Ravindran, B.N. Badriyha, S.-H. Kim, Hybrid membrane filtration process for leachate
treatment, Water Research, 30 (1996) 2691-2706.
[53] T.A. Kurniawan, W.-h. Lo, G.Y.S. Chan, Radicals-catalyzed oxidation reactions for degradation of
recalcitrant compounds from landfill leachate, Chemical Engineering Journal, 125 (2006) 35-57.
[54] M. Umar, H.A. Aziz, M.S. Yusoff, Trends in the use of Fenton, electro-Fenton and photo-Fenton for the
treatment of landfill leachate, Waste Management, 30 (2010) 2113-2121.
[55] E.M.R. Rocha, V.J.P. Vilar, A. Fonseca, I. Saraiva, R.A.R. Boaventura, Landfill leachate treatment by solar-
driven AOPs, Solar Energy, 85 (2011) 46-56.
[56] C. Tizaoui, L. Bouselmi, L. Mansouri, A. Ghrabi, Landfill leachate treatment with ozone and ozone/hydrogen
peroxide systems, Journal of Hazardous materials, 140 (2007) 316-324.
[57] U.E. Agency, Guidance for the Treatment of Landfill Leachate, Sector Guidance Note IPPC S5.03, in:
I.P.P.a.C. (IPPC) (Ed.), 2007.
[58] J. Yoon, S. Cho, Y. Cho, S. Kim, The characteristics of coagulation of fenton reaction in the removal of
landfill leachate organics, Water Science and Technology, 38 (1998) 209-214.
[59] Metcalf, Eddy, Wastewater Engineering Treatment and Reuse, 4th ed., Metcalf & Eddy, 2005.
[60] J. Bohdziewicz, M. Bodzek, J. Górska, Application of pressure-driven membrane techniques to biological
treatment of landfill leachate, Process Biochemistry, 36 (2001) 641-646.
[61] W. Piatkiewicz, E. Biemacka, T. Suchecka, A polish study: treating landfill leachate with membranes,
Filtration & separation, 38 (2001) 22-23.
[62] D. Trebouet, J.P. Schlumpf, P. Jaouen, F. Quemeneur, Stabilized landfill leachate treatment by combined
physicochemical-nanofiltration processes, Water Research, 35 (2001) 2935-2942.
[63] IRAR, Gestão e tratamento de lixiviados produzidos em aterros sanitários de resíduos urbanos, Relatório
IRAR nº 03/2008, Lisboa, 2008.
[64] E.S.K. Chian, F.B. DeWalle, Sanitary landfill leachate and their treatment, Journal of the Environmental
Engineering Division 2(1976) 411-431.
[65] P. Hörsch, A. Speck, F.H. Frimmel, Combined advanced oxidation and biodegradation of industrial effluents
from the production of stilbene-based fluorescent whitening agents, Water Research, 37 (2003) 2748-2756.
[66] V.J.P. Vilar, L.X. Pinho, A.M.A. Pintor, R.A.R. Boaventura, Treatment of textile wastewaters by solar-driven
advanced oxidation processes, Solar Energy, 85 (2011) 1927-1934.
[67] P.A. Soares, T.F.C.V. Silva, D.R. Manenti, S.M.A.G.U. Souza, R.A.R. Boaventura, V.J.P. Vilar, Insights
into real cotton-textile dyeing wastewater treatment using solar advanced oxidation processes,
Environmental Science and Pollution Research, 21 (2014) 932-945.
[68] V.J.P. Vilar, M.I. Maldonado, I. Oller, S. Malato, R.A.R. Boaventura, Solar treatment of cork boiling and
bleaching wastewaters in a pilot plant, Water Research, 43 (2009) 4050-4062.

Chapter 1
44
[69] A.M.A. Pintor, V.J.P. Vilar, R.A.R. Boaventura, Decontamination of cork wastewaters by solar-photo-
Fenton process using cork bleaching wastewater as H2O2 source, Solar Energy, 85 (2011) 579-587.
[70] F.J. Benitez, J.B.d. Heredia, F.J. Real, J.L. Acero, Purification kinetics of winery wastes by ozonation,
anaerobic digestion and ozonation plus anaerobic digestion, Journal of Environmental Science and Health,
A34 (1999) 2023-2041.
[71] J.B. de Heredia, J. Torregrosa, J. Dominguez, E. Partido, Degradation of wine distillery wastewaters by the
combination of aerobic biological treatment with chemical oxidation by Fenton's reagent, Sustainable
Viticulture and Winery Wastes Management, 51 (2005) 167-174.
[72] R. Mosteo, J. Sarasa, M.P. Ormad, J. Ovelleiro, Sequential solar photo-Fenton-biological system for the
treatment of winery wastewaters, Journal of Agricultural and Food Chemistry, 56 (2008) 7333-7338.
[73] B.S. Souza, F.C. Moreira, M.W. Dezotti, V.J. Vilar, R.A. Boaventura, Application of biological oxidation
and solar driven advanced oxidation processes to remediation of winery wastewater, Catalysis Today, 209
(2013) 201-208.
[74] C. Sirtori, A. Zapata, I. Oller, W. Gernjak, A. Agüera, S. Malato, Decontamination industrial pharmaceutical
wastewater by combining solar photo-Fenton and biological treatment, Water Research, 43 (2009) 661-668.
[75] J.H. Pereira, M.T. Borges, O. González, S. Esplugas, V.J.P. Vilar, R.A.R. Boaventura, Photocatalytic
degradation of oxytetracycline using TiO2 under natural and simulated solar radiation, Chemosphere,
submitted (2011).
[76] J.H.O.S. Pereira, A.C. Reis, V. Homem, J.A. Silva, A. Alves, M.T. Borges, R.A.R. Boaventura, V.J.P. Vilar,
O.C. Nunes, Solar photocatalytic oxidation of recalcitrant natural metabolic by-products of amoxicillin
biodegradation, Water Research, 65 (2014) 307-320.
[77] A.M. Amat, A. Arques, F. Lopez, M.A. Miranda, Solar photo-catalysis to remove paper mill wastewater
pollutants, Solar Energy, 79 (2005) 393-401.
[78] V.J.P. Vilar, A.I.E. Gomes, R.A.R. Boaventura, Solar Detoxification of a Recalcitrant Colour Real Effluent
from a Wastewater Treatment Plant, Photochemical & Photobiological Sciences, 8 (2009) 691-698.
[79] J. Beltrán-Heredia, J. Torregrosa, J. García, J. Domínguez, J. Tierno, Degradation of olive mill wastewater
by the combination of Fenton's reagent and ozonation processes with an aerobic biological treatment, Water
Science & Technology, 44 (2001) 103-108.
[80] A. Zapata, S. Malato, J.A. Sánchez-Pérez, I. Oller, M.I. Maldonado, Scale-up strategy for a combined solar
photo-Fenton/biological system for remediation of pesticide-contaminated water, Catalysis Today, 151
(2010) 100-106.
[81] V.J.P. Vilar, F.C. Moreira, A.C.C. Ferreira, M.A. Sousa, C. Gonçalves, M.F. Alpendurada, R.A.R.
Boaventura, Biodegradability enhancement of a pesticide-containing bio-treated wastewater using a solar
photo-Fenton treatment step followed by a biological oxidation process, Water Research, 46 (2012) 4599-
4613.

Chapter 1
45
[82] D. Cassano, A. Zapata, G. Brunetti, G. Del Moro, C. Di Iaconi, I. Oller, S. Malato, G. Mascolo, Comparison
of several combined/integrated biological-AOPs setups for the treatment of municipal landfill leachate:
Minimization of operating costs and effluent toxicity, Chemical Engineering Journal, 172 (2011) 250-257.
[83] S. Cortez, P. Teixeira, R. Oliveira, M. Mota, Evaluation of Fenton and ozone-based advanced oxidation
processes as mature landfill leachate pre-treatments, Journal of Environmental Management, 92 (2011) 749-
755.
[84] P.-J. He, Z. Zheng, H. Zhang, L.-M. Shao, Q.-Y. Tang, PAEs and BPA removal in landfill leachate with
Fenton process and its relationship with leachate DOM composition, Science of the Total Environment, 407
(2009) 4928-4933.
[85] J.J. Wu, C.-C. Wu, H.-W. Ma, C.-C. Chang, Treatment of landfill leachate by ozone-based advanced
oxidation processes, Chemosphere, 54 (2004) 997-1003.
[86] J. Blanco-Galvez, P. Fernández-Ibáñez, S. Malato-Rodríguez, Solar Photocatalytic Detoxification and
Desinfection of Water: Recent Overview, Journal of Solar Energy Engineering, 129 (2007) 4-15.
[87] S. Malato, J. Blanco, D.C. Alarcon, M.I. Maldonado, P. Fernandez-Ibanez, W. Gernjak, Photocatalytic
decontamination and disinfection of water with solar collectors, Catalysis Today, 122 (2007) 137-149.
[88] V.J.P. Vilar, E.M.R. Rocha, F.S. Mota, A. Fonseca, I. Saraiva, R.A.R. Boaventura, Treatment of a sanitary
landfill leachate using combined solar photo-Fenton and biological immobilized biomass reactor at a pilot
scale, Water Research, 45 (2011) 2647-2658.
[89] M. Vedrenne, R. Vasquez-Medrano, D. Prato-Garcia, B.A. Frontana-Uribe, J.G. Ibanez, Characterization
and detoxification of a mature landfill leachate using a combined coagulation–flocculation/photo Fenton
treatment, Journal of Hazardous materials, 205–206 (2012) 208-215.
[90] I. Oller, S. Malato, J. Sánchez-Pérez, Combination of advanced oxidation processes and biological treatments
for wastewater decontamination—a review, Science of the Total Environment, 409 (2011) 4141-4166.
[91] A.I. Gomes, J.C. Santos, V.J.P. Vilar, R.A.R. Boaventura, Inactivation of Bacteria E. coli and
photodegradation of humic acids using natural sunlight, Applied Catalysis B: Environmental, 88 (2009)
283-291.
[92] A.I. Gomes, V.J.P. Vilar, R.A.R. Boaventura, Inactivation Kinetics of E. coli and E. faecalis in Distilled and
Natural Waters by Solar Photocatalysis, in: 5th European Meeting on Solar Chemistry and Photocatalysis:
Environmental Applications (SPEA 5), Sicilia - 4-8 October, 2008.
[93] L. Pinho, X., J. Azevedo, V. Vasconcelos, M., V. Vilar, J. P., R.A.R. Boaventura, Decomposition of
Microcystis aeruginosa and Microcystin-LR by TiO2 Oxidation Using Artificial UV Light or Natural
Sunlight, Journal of Advanced Oxidation Technologies, 15 (2012) 98-106.
[94] S. Malato, P. Fernández-Ibáñez, M.I. Maldonado, J. Blanco, W. Gernjak, Decontamination and disinfection
of water by solar photocatalysis: Recent overview and trends, Catalysis Today, 147 (2009) 1-59.
[95] F. Al-Momani, Combination of photo-oxidation processes with biological treatment, Universitat de
Barcelona, 2003.
Chapter 1
46
[96] G. Tchobanoglous, F.L. Burton, H.D. Stensel, Wastewater engineering: treatment and reuse. Metcalf & Eddy,
Inc., McGraw-Hill, New York, (2003).
[97] W. Gernjak, M.I. Maldonadob, M. Fuerhacker, S. Malato, Solar photo-Fenton treatment of EU priority
substances: Process parameters and control strategies, Editorial CIEMAT, 2006.
[98] J.M. Poyatos, M. Muñio, M. Almecija, J. Torres, E. Hontoria, F. Osorio, Advanced oxidation processes for
wastewater treatment: state of the art, Water, Air, and Soil Pollution, 205 (2010) 187-204.
[99] S. Malato, J. Blanco, A. Vidal, D. Alarcón, M.I. Maldonado, J. Cáceres, W. Gernjak, Applied studies in solar
photocatalytic detoxification: an overview, Solar Energy, 75 (2003) 329-336.
[100] J.J. Pignatello, E. Oliveros, A. MacKay, Advanced oxidation processes for organic contaminant destruction
based on the fenton reaction and related chemistry, Critical Reviews in Environmental Science and
Technology, 36 (2006) 1-84.
[101] R. Andreozzi, V. Caprio, A. Insola, R. Marotta, Advanced oxidation processes (AOP) for water purification
and recovery, Catalysis Today, 53 (1999) 51-59.
[102] Meteonorm (2011), Available at http://meteonorm.com/download/maps/ on 1st April 2012.
[103] A. Wenzel, A. Gahr, R. Niessner, TOC-removal and degradation of pollutants in leachate using a thin-film
photoreactor, Water Research, 33 (1999) 937-946.
[104] S.P. Cho, S.C. Hong, S.-I. Hong, Photocatalytic degradation of the landfill leachate containing refractory
matters and nitrogen compounds, Applied Catalysis B: Environmental, 39 (2002) 125-133.
[105] V.J.P. Vilar, J.M.S. Moreira, A. Fonseca, I. Saraiva, R.A.R. Boaventura, Application of Fenton and Solar
Photo-Fenton Processes to the Treatment of a Sanitary Landfill Leachate in a Pilot Plant with CPCs, Journal
of Advanced Oxidation Technologies, 15 (2012) 107-116.
[106] A. Altin, An alternative type of photoelectro-Fenton process for the treatment of landfill leachate, Separation
and Purification Technology, 61 (2008) 391-397.
[107] I. Muñoz, S. Malato, A. Rodríguez, X. Doménech, Integration of Environmental and Economic Performance
of Processes. Case Study on Advanced Oxidation Processes for Wastewater Treatment, Journal of
Advanced Oxidation Technologies, 11 (2008) 270-275.
[108] V.J.P. Vilar, S.M.S. Capelo, T.F.C.V. Silva, R.A.R. Boaventura, Solar photo-Fenton as a pre-oxidation step
for biological treatment of landfill leachate in a pilot plant with CPCs, Catalysis Today, 161 (2011) 228-
234.
[109] J.L. de Morais, P.P. Zamora, Use of advanced oxidation processes to improve the biodegradability of mature
landfill leachates, Journal of Hazardous materials, 123 (2005) 181-186.
[110] G. Sagawe, A. Lehnard, M. Lübber, D. Bahnemann, The insulated solar Fenton hybrid process: fundamental
investigations, Helvetica Chimica Acta, 84 (2001) 3742-3759.
[111] H. Zhang, H.J. Choi, C.-P. Huang, Optimization of Fenton process for the treatment of landfill leachate,
Journal of Hazardous materials, 125 (2005) 166-174.

Chapter 1
47
[112] F. Torrades, J. García-Montaño, J. Antonio García-Hortal, X. Domènech, J. Peral, Decolorization and
mineralization of commercial reactive dyes under solar light assisted photo-Fenton conditions, Solar
Energy, 77 (2004) 573-581.
[113] R.F.P. Nogueira, A.G.Trovó, M.R.A. Silva, R.D. Villa, C. Oliveira, Fundamentos e apliações ambientais
dos processos Fenton e foto-Fenton, Quimica Nova, 30 (2007) 400-408.
[114] J.J. Pignatello, D. Liu, P. Huston, Evidence for an additional oxidant in the photoassisted Fenton reaction,
Environmental Science & Technology, 33 (1999) 1832-1839.
[115] Y. Deng, Physical and oxidative removal of organics during Fenton treatment of mature municipal landfill
leachate, Journal of Hazardous materials, 146 (2007) 334-340.
[116] W. Gernjak, M. Fuerhacker, P. Fernandez-Ibanez, J. Blanco, S. Malato, Solar photo-Fenton treatment-
Process parameters and process control, Applied Catalysis B: Environmental, 64 (2006) 121-130.
[117] M. Rodríguez, S. Malato, C. Pulgarin, S. Contreras, D. Curcó, J. Giménez, S. Esplugas, Optimizing the
solar photo-Fenton process in the treatment of contaminated water. Determination of intrinsic kinetic
constants for scale-up, Solar Energy, 79 (2005) 360-368.
[118] S.M. Kim, A. Vogelpohl, Degradation of Organic Pollutants by the Photo‐Fenton‐Process, Chemical
engineering & technology, 21 (1998) 187-191.
[119] J.H.O.S. Pereira, Solar Photocatalytic Degradation of Antibiotics: Chemical, Ecotoxicological and
Biodegradability Assessment, in: Department of Chemical Engineering, University of Porto, Faculty of
Engineering, 2014.
[120] B. Bae, E. Jung, Y. Kim, H. Shin, Treatment of landfill leachate using activated sludge process and electron-
beam radiation, Water Research, 33 (1999) 2669-2673.
[121] E. De Torres-Socías, L. Prieto-Rodríguez, A. Zapata, I. Fernández-Calderero, I. Oller, S. Malato, Detailed
treatment line for a specific landfill leachate remediation. Brief economic assessment, Chemical
Engineering Journal, 261 (2015) 60-66.


2 Materials and methods
This chapter presents a detailed description of all chemical reagents and experimental setups used
throughout this thesis, as well as of the experimental procedures implemented to meet the proposed
objectives. A brief description of the employed analytical methods is also given.
The experimental work was mostly developed in a Municipal Solid Waste Sanitary Landfill located in
northern Portugal, and also in the Laboratory of Separation and Reaction Engineering (LSRE), at the
Department of Chemical Engineering (DEQ), Faculty of Engineering University of Porto (FEUP).


Chapter 2
51
2.1 Chemicals
Photo-Fenton experiments were performed using hydrogen peroxide, iron (II) sulphate heptahydrate
(FeSO4.7H2O), as iron source, and sulphuric acid, hydrochloric acid and sodium hydroxide for pH
adjustments.
Coagulation tests were accomplished by employing ferric chloride and sulphuric acid.
In the activated sludge biological reactor, sodium hydroxide and sulphuric acid were also used for pH
control, and methanol was added as an external carbon source in the denitrification stage.
Ultrapure and pure water were produced by a Millipore system (Direct-Q model) and a reverse osmosis
system (Panice®), respectively.
Table 2.1 shows a brief description of all reagents employed in the different reactions and analytical
methods. All the chemicals used in the analytical methods were analytical grade.
Table 2.1. Chemicals description.
Reagent MFa %
w/w
ρb
(kg/L)
MWc
(g/mol) Supplier Purpose
Ferrous sulphate
heptahydrate FeSO4.7H2O - - 278.05
Quimitécnica
Photo-Fenton
tests at
pre-industrial
scale (PIS)
Hydrochloric acid HCl 33 1.16 36.46
Hydrogen peroxide H2O2 25; 50d 1.10 34.02
Sodium hydroxide NaOH 30 1.33 40.00
Sulphuric acid H2SO4 98 1.84 98.08
Sodium hydroxide NaOH 30 1.33 40.00
Quimitécnica Biological
treatment at PIS Methanol CH3OH - 0.79 32.04
Sulphuric acid H2SO4 98 1.84 98.08
Ferric chloride FeCl3 40 1.44 162.20 Quimitécnica
Coagulation
process at PIS Sulphuric acid H2SO4 98 1.84 98.08
Ferrous sulphate
heptahydrate FeSO4.7H2O - - 278.05 Panreac
Photo-Fenton
tests at
lab-scale
Hydrochloric acid HCl 37 1.16 36.46 Merck
Hydrogen peroxide H2O2 50d 1.10 34.02 Quimitécnica
Sodium hydroxide NaOH - - 40.00 Merck
Sulphuric acid H2SO4 96 1.84 98.08 Pronalab
Ammonium
monovanadate NH4VO3 - - 116.97 Merck Hydrogen
peroxide analysis Sulphuric acid H2SO4 96 1.84 98.08 Pronalab
1,10-phenanthroline
1-hydrate C12H8N2.H2O - - 198.23 Panreac
Iron analysis Acetic acid CH3COOH 100 1.05 60.05 Fisher
Ammonium acetate NH4C2H3O2 - - 77.08 Fisher
L-ascorbic acid C6H8O6 - - 176.12 Acrós

Chapter 2
52
Table 2.1. Chemicals description.
Reagent MFa %
w/w
ρb
(kg/L)
MWc
(g/mol) Supplier Purpose
Caffeic Acid (SSe) C9H8O4 - - 180.16 Merck
Polyphenols
analysis
Folin-Ciocalteu’s
Reagent DC - - 1.23 - Panreac
Sodium carbonate Na2CO3 - - 105.99 Merck
Potassium hydrogen
phthalate (TDC SSe) C8H5KO4 - - 204.22
ISAZA
Standard
solutions (SS) for
TC-TOC-TN
analyser
calibration
Hydrogen carbonate
(TIC SSe) HCO3
- - - 61.02
Sodium carbonate
(TIC SSe) Na2CO3 - - 105.99
Potassium nitrate
(TDN SSe) KNO3 - - 101.10
Chloride, nitrate and
sulphate SSe
NaCl
NaNO3
Na2SO4
1000f 1.00
58.44
84.99
142.04
Merck
SS for anions
calibration in
ionic
chromatography
and respective
eluent
Fluoride, phosphate and
bromide SSe
NaF
KH2PO4
NaBr
1000g 1.00
41.99
136.09
102.89
Nitrite SSe NaNO2 999h 1.00 68.98
Sodium hydroxide NaOH 1.000i 1.04 40.00
Acetate SSe C2H4O2
1000k
1.00 60.05
Fluka
SS for low
molecular weight
carboxylate
anions calibration
in ionic
chromatography
and respective
eluent
Citrate SSe C6H8O7 1.00 192.12
Formate SSe CH2O2 1.00 46.13
Malonate SSe C3H4O4 1.00 104.06
Oxalate SSe C2H2O4 1.00 90.03
Phthalate SSe C8H6O4 1.00 166.13
Propionate SSe C3H6O2 1.00 74.08
L(-)-malic acid
(maleate SSe) C4H6O5 - - 134.09 Acrós
Pyruvic acid
(pyruvate SSe) C3H4O3 98 1.27 88.06 Aldrich
Valeric acid
(valerate SSe) C5H10O2 ≥99 0.94 102.13
Potassium hydroxide
(eluent generator
cartridge)
KOH 22.4 1.21 56.11 Dionex
Ammonium SSe NH4Cl
1000j
1.00 53.49
Merck
SS for cations
calibration in
ionic
chromatography
and respective
eluent
Calcium SSe CaCl2 1.00 110.98
Magnesium SSe MgCl2.6H2O 1.00 203.31
Potassium SSe KCl 1.00 74.55
Sodium SSe NaCl 1.00 58.44
Lithium SSe LiCl - - 42.39
Methanesulfonic acid CH3SO3H ≥99 1.48 96.11
Potassium dichromate K2Cr2O7 - - 294.19 Merck
Chemical oxygen
demand analysis
Potassium hydrogen
phthalate (COD SSe) C8H5KO4 - - 204.22 Merck
Silver sulphate Ag2SO4 - - 311.80 Merck
Sulphuric acid H2SO4 96 1.84 98.08 Pronalab

Chapter 2
53
Table 2.1. Chemicals description.
Reagent MFa %
w/w
ρb
(kg/L)
MWc
(g/mol) Supplier Purpose
Ammonium chloride NH4Cl - - 53.49 VWR
Mineral medium
for Zahn-Wellens
and BOD5 tests
Calcium chloride
dihydrate CaCl2.2H2O - - 147.02 VWR
Dipotassium hydrogen
phosphate K2HPO4 - - 174.20 Merck
Disodium hydrogen
phosphate dihydrate Na2HPO4.2H2O - - 178.00 Merck
Iron (III) chloride
hexahydrate FeCl3.6H2O - - 270.30 Chem-lab
Magnesium sulphate
heptahydrate MgSO4.7H2O - - 246.47 Panreac
Potassium dihydrogen
phosphate KH2PO4 - - 136.09 VWR
Alpha-D-glucose C6H12O6 - - 180.16 Fisher Zahn-Wellens
N-Allylthiourea C4H8N2S - - 116,19 Merk BOD5
Sodium hydroxide pellets NaOH - - 40.00 Merck
Ammonium molybdate (NH4)6Mo7O24⋅
4H2O - -
1235.8
6 Merck
Total phosphorus
analysis
Ammonium
monovanadate NH4VO3 - - 116.97 Merck
Ammonium persulphate (NH4)2S2O8 - - 228.20 Sigma
Hydrochloric acid HCl 37 1.16 36.46 Fisher
Phenolphthalein indicator C20H14O4 0.5l 0.92 318.32 Sigma
Potassium dihydrogen
orthophosphate (PT SSe) KH2PO4 - - 136.09 VWR
Sodium hydroxide NaOH - - 40.00 Merck
Sulphuric acid H2SO4 96 1.84 98.08 Pronalab
Acetonitrile CH3CN - 0.79 41.05 Merck
Humic substances
analysis
Hydrochloric acid HCl 37 1.16 36.46 Fisher
Diethyl ether (CH3CH2)2O - 0.71 74.12 Sigma-
Aldrich
Supelite DAX-8 - - - - Supelco
Methanol CH3OH - 0.79 32.04 Basic
Sodium hydroxide NaOH - - 40.00 Merck
aMolecular formula; bDensity; cMolecular weight; dConcentration in weight/volume percentage; eStandard solution;
fConcentration of Cl-, NO3- and SO4
2-, expressed in mg/L; gConcentration of F-, PO43- and Br-, expressed in mg/L; hNO2
-
concentration, expressed in mg/L; iConcentration expressed in mol/L; jConcentration of NH4+, Ca2+, Mg2+, K+ and Na+,
expressed in mg/L; kConcentration of acetate, citrate, formate, malonate, oxalate, phthalate and propionate, expressed in
mg/L; lPercentage in ethanol:water (1:1).

Chapter 2
54
2.2 Experimental setups
The various sets of experiments carried out during this thesis were performed in different experimental
facilities, which are described below.
2.2.1 Solar pre-industrial scale plant
The first set of combined experiments described in the Chapters 3, 4, 5 and 6 was carried out in a mobile
unit at pre-industrial scale, installed at a sanitary landfill (Figure 2.1), constructed for the treatment
in-situ of 1-2 m3 of leachate (operation in batch mode). This facility is composed by a solar
photocatalytic pre-oxidation system and a biological oxidation system. The schematic diagram of the
entire plant is shown in Figure 2.2.
Figure 2.1. Solar pre-industrial unit combining photocatalytic and biological oxidation systems.

Chapter 2
55
Fig
ure
2.2
. F
low
dia
gra
m o
f th
e so
lar
pre
-indust
rial
un
it.
LE
AC
HA
TE
AF
TE
R
LA
GO
ON
ING
CP
Cs
(39.5
2 m
2)
H2O
2H
Cl/
H2S
O4
Na
OH
CH
3O
H
N2N
3
N1
V1
V2
V3
CTCT
MP
MH
MS
1M
S2
EV
1
V8
CTC
TM
PM
O
V9
V7
V1
0
EV
2
EV
3
V6
DP
1D
P2
DP
3D
P4
DP
5
EV
4
AC
V1
1
V4
V5
SL
UD
GE
CL
AR
IFIE
D
LE
AC
HA
TE
(CL
)
PU
RG
E
BIO
TR
EA
TE
D
EF
FL
UE
NT
SA
MP
LIN
G
PO
INT
S
AC
– A
IR C
OM
PR
ES
SO
R
BT
– B
IOL
OG
ICA
L R
EA
CT
OR
CT
– C
LA
RIF
ICA
TIO
N T
AN
K
DP
1 –
H2O
2 D
OS
ING
PU
MP
DP
2 –
H2S
O4/H
Cl
DO
SIN
G P
UM
P
DP
3 –
NaO
H D
OS
ING
PU
MP
(R
T)
DP
4 –
NaO
H D
OS
ING
PU
MP
(B
T)
DP
5 –
CH
3O
H D
OS
ING
PU
MP
RT
BR
CT
CT R
EV
1 –
EL
EC
TR
OV
AL
VE
(R
T)
EV
2 –
EL
EC
TR
OV
AL
VE
(C
PC
s)
EV
3 –
EL
EC
TR
OV
AL
VE
(B
T)
EV
4 –
EL
EC
TR
OV
AL
VE
(B
T)
FM
1, F
M2 –
FL
OW
ME
TE
R
MS
1 –
ME
CH
AN
ICA
L S
TIR
RE
R (
RT
)
MS
2 –
ME
CH
AN
ICA
L S
TIR
RE
R (
BT
)
MH
– H
2O
2 M
ET
ER
AN
D C
ON
TR
OL
LE
R
MO
– D
ISS
OL
VE
D O
XY
GE
N M
ET
ER
AN
D C
ON
TR
OL
LE
R
MP
– p
H M
ET
ER
AN
D C
ON
TR
OL
LE
R
P1, P
2, P
3, P
4 –
PU
RG
E
R –
RA
DIO
ME
TE
R
N1 –
RE
FE
RE
NC
E F
LU
ID L
EV
EL
RO
D
N2 –
MIN
IMU
M F
LU
ID L
EV
EL
RO
D
N3 –
MA
XIM
UM
FL
UID
LE
VE
L R
OD
RT
– R
EC
IRC
UL
AT
ION
TA
NK
RP
– R
EC
IRC
UL
AT
ION
PU
MP
V1 –
FE
ED
LE
AC
HA
TE
VA
LV
E F
RO
M A
ER
AT
ED
LA
GO
ON
V2 –
SL
UD
GE
DIS
CH
AR
GE
VA
LV
E
V3 –
CL
AR
IFIE
D L
EA
CH
AT
E V
AL
VE
(C
L)
V4, V
5 –
FE
ED
ING
VA
LV
ES
(C
PC
s)
V6 –
DIS
CH
AR
GE
VA
LV
E O
F R
P
V7 –
BIO
TR
EA
TE
D E
FF
LU
EN
T D
ISC
HA
RG
E V
AL
VE
(B
R)
V8, V
9 –
SA
MP
LIN
G P
OIN
TS
VA
LV
ES
(B
R)
V10 –
BIO
TR
EA
TE
D E
FF
LU
EN
T V
AL
VE
V11 –
SL
UD
GE
SA
MP
LE
PO
INT
VA
LV
E O
F R
P A
ND
BR
FM
1
FM
2
P1
P3
P2
P4
RP

Chapter 2
56
Table 2.2 shows the characteristics of the components present in the experimental facility previously
described.
Table 2.2. Description of the solar pre-industrial unit constituents.
Element Acronym Brand Model Characteristics
Air
compressor AC Maquinaria Disber S.L. CD-2/24L
P = 8 bar
V = 24 L
Q = 198 L/min
Biological
reactor BR Colberge DPC3500
PE-HD cylindrical flat-bottom
tank
D = 1.6 m
H = 2.0 m
V = 3.5 m3
Dosing
pumps
DP1
Colberge MP643-552 Qmax = 13 L/h DP2
DP3
DP5
DP4 Milton Roy CEGA5M1T3 Qmax = 5 L/h
Electrovalves
EV1
Ebro Armaturen EB4DM Pmax = 8 bar EV2
EV3
EV4
H2O2 meter
and controller MH Grundfos Alldos Conex DIA-1 WP7 sensor
Mechanical
Stirrers
MS1 Colberge VLS 5550 76 rpm
MS2
Oxygen
dissolved
meter and
controller
MO Colberge Aqs- *S* Oxygen electrode Pg 13.5
(ord. no. 21100)
pH meter and
controller MP Colberge Aqs- *S*
Sensorex sensor, model
S653/S653W
Radiometer R Kipp & Zonen CUV4
λ = 299 - 384nm
I = 0 to 100 W/m²
Sensitivity = 1 mV.m²/W
Response time < 1s
Recirculation
pump RP Pan World NH-250PS Qmáx = 65 L/min
Recirculation
tank RT Colberge TFC2500Z
PE-HD cylindrical conic tank
ϕ = 1.6 m
H = 2.0 m
V = 2.5 m3
Chapter 2
57
2.2.1.1 Solar CPC reactor
The photo-Fenton experiments were performed in a pre-industrial CPC-based plant under natural
sunlight, constituted by 2 separate parallel rows of 10 and 9 CPC modules (10 tubes/module, 2.08
m2/module) connected by polypropylene junctions, with a total collector surface of 39.52 m2, mounted
on a fixed platform tilted 41º (local latitude), oriented South. The CPC tubes are made of borosilicate
glass (Schott-Duran type 3.3, Germany, cut-off at 280 nm, internal diameter 46.4 mm, length 1500 mm
and thickness 1.8 mm) connected by polypropylene junctions. Each of the CPC rows is connected to a
cylindrical conic recirculation tank.
The leachate, previously decanted in a clarification tank (CT), was pumped from the recirculation tank
(RT) to the CPCs using a centrifugal pump (RP) at a maximum flow rate of 65 L/min, regulated by two
flowmeters (FM1 and FM2). The plant can be operated in two ways: (i) using the two CPC modules
(illuminated volume of 482 L) or (ii) using just one module of 10 (illuminated volume of 254 L) or 9
CPCs (illuminated volume of 228 L). The RT is equipped with a mechanical stirrer (MS1), a pH sensor
and controller (MP), a H2O2 sensor and controller (MH) and three dosing pumps for H2O2 (DP1),
H2SO4/HCl (DP2), and NaOH (DP3) addition.
The photoreactor is an autonomous system, controlled by an abstract computer (Magelis, Schneider
Electric), constituted by three electrovalves (EV1, EV2 and EV3), three level rods (N1, N2 and N3) and
three valves (V4, V5 and V6).
The intensity of solar UV radiation was measured by a global UV radiometer (R) mounted on the CPC
modules at the same angle, which provided data in terms of incident WUV/m2. Equation (2.1) allows to
calculate the amount of accumulated UV energy (QUV,n, kJ/L) received on any surface in the same
position with regard to the Sun, per unit of water volume inside the reactor, in the time interval Δt [1]:
1nnn
t
rn,Gn1n,UVn,UV ttt;
V1000
AUVtQQ
(2.1)
Where:
tn - time corresponding to the n-water sample (s)
Vt - total reactor volume (L)
Ar - illuminated collector surface area (m2)
nGUV , - average ultraviolet radiation (W/m2) measured during the period Δtn (s).

Chapter 2
58
2.2.1.2 Biological oxidation system
The biological oxidation system is composed by a cylindrical flat-bottom tank (BR), equipped with a
mechanical stirrer (MS2), a pH control unit (MP) for pH adjustment using either H2SO4 or NaOH dosing
metering pumps (DP2 and DP4, respectively), a dissolved oxygen sensor and controller (MO), and a
methanol dosing pump (DP5). A blower (AC) was used to supply air in order to maintain the selected
range of dissolved oxygen concentration in the tank using a ceramic diffuser at the bottom of the BR.
The biological reactor is an autonomous system, controlled by an abstract computer (Magelis, Schneider
Electric), constituted by one electrovalve (EV4) and four discharge valves (V7, V8, V9 and V10).

Chapter 2
59
2.2.2 Lab-scale photoreactor
The effect of the main photo-Fenton (PF) reaction variables on the treatment of the sanitary landfill
leachate collected at the outlet of a leachate treatment plant (LTP), presented in the Chapter 7, was
assessed in a lab-scale CPC photoreactor equipped with a sunlight simulator. Figure 2.3 presents
different views and a schematic representation of the lab-scale photoreactor.
(a)
(b)
(c)
(d)
Figure 2.3. Lab-scale photoreactor plant (a): solar radiation simulator (b), CPC (c) and flow diagram (d).

Chapter 2
60
The photocatalytic system includes: i) a solar radiation simulator (ATLAS, model SUNTEST XLS+)
with 1100 cm2 of exposition area, a 1700 Watt air-cooled xenon arc lamp, a daylight filter and quartz
filter with IR coating; ii) a compound parabolic collector (CPC) with 0.023 m2 of illuminated area
constituted by anodized aluminium reflectors and a borosilicate tube (Schott-Duran type 3.3, Germany,
cut-off at 280 nm, internal diameter 46.4 mm, length 160 mm and thickness 1.8 mm); iii) a glass vessel
(1 L capacity) with a cooling jacket coupled to a refrigerated thermostatic bath (Lab. Companion, model
RW-0525G) to ensure a constant temperature during the experiment; iv) a magnetic stirrer (Velp
Scientifica, model ARE) for complete homogenization of the solution inside the glass vessel; v) a
peristaltic pump (Ismatec, model Ecoline VC-380 II, with a flow rate of 0.63L/min) to promote water
recirculation between the CPC and the glass vessel; vi) pH and temperature meter (VWR symphony -
SB90M5). All systems are connected by Teflon tubing. The intensity of the UV radiation was measured
by a broadband UV radiometer (Kipp & Zonen B.V., model CUV5) placed inside the sunlight simulator
at the same level as the photoreactor centre. The radiometer was plugged into a handheld display unit
(Kipp & Zonen B.V., model Meteon) to record the incident irradiance (W/m2).

Chapter 2
61
2.2.3 Lab-scale biological reactor
The effect of the main nitrification and denitrification reaction variables on nitrogen species removal
from leachate samples, presented in the Chapter 8, was evaluated in a Respirometer (BM-Advanced,
Surcis) equipped with a pH, temperature and dissolved oxygen control system, simulating a lab-scale
batch bioreactor. Figure 2.4 shows the view and schematic representation of the respirometer.
Figure 2.4. Lab-scale biological reactor and respective schematic representation.

Chapter 2
62
The respirometric system is composed by: (i) a glass reaction vessel with an approximate useful volume
of 1.2 L; (ii) a stirring system composed by a stirrer motor, stirring paddles, partition plate, one-sense
membrane device, air diffuser and aspiration and returning tubing, (iii) a peristaltic pump for the mixed
liquor recirculation from the aspiration tube to the return tube (tygon tubing with internal diameter of
4.8 mm); (iv) a set of pH and DO sensors located inside the reaction vessel and an internal Peltier device
for heating and cooling, keeping the solution temperature in the desired values; (v) sensor controller,
where the measurements of pH, OD and temperature can be seen and the calibration of pH and DO
sensors are made; (vi) a set of connectors, where the dissolved oxygen and pH sensors and the stirring
motor are linked, and from which the air is supplied to the reaction vessel through the air diffuser; (vii)
pumping and injection system for pH control, which includes acid and base dosing pumps; (viii) a front
panel, which indicates if the equipment and the agitation, pumping and aeration systems are switched
on; and (ix) an acquisition data system by means of a specific BM software.
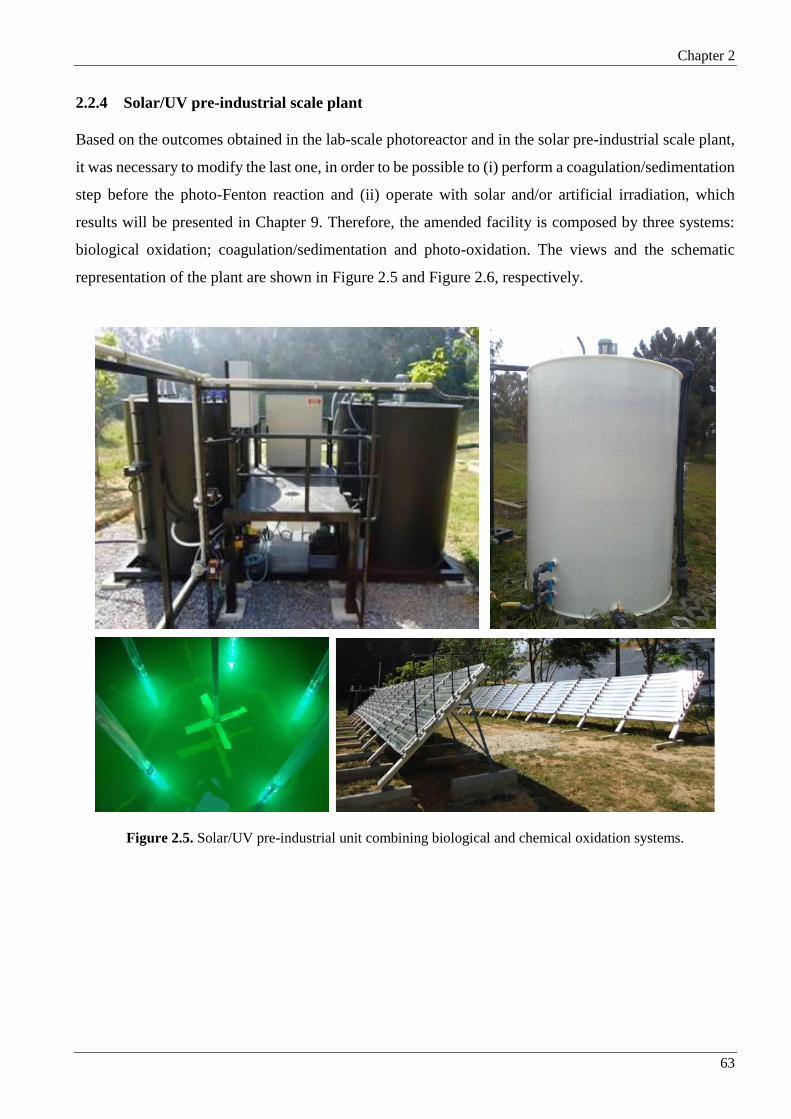
Chapter 2
63
2.2.4 Solar/UV pre-industrial scale plant
Based on the outcomes obtained in the lab-scale photoreactor and in the solar pre-industrial scale plant,
it was necessary to modify the last one, in order to be possible to (i) perform a coagulation/sedimentation
step before the photo-Fenton reaction and (ii) operate with solar and/or artificial irradiation, which
results will be presented in Chapter 9. Therefore, the amended facility is composed by three systems:
biological oxidation; coagulation/sedimentation and photo-oxidation. The views and the schematic
representation of the plant are shown in Figure 2.5 and Figure 2.6, respectively.
Figure 2.5. Solar/UV pre-industrial unit combining biological and chemical oxidation systems.

Chapter 2
64
Fig
ure
2.6
. F
low
dia
gra
m o
f th
e so
lar/
UV
pre
-indust
rial
unit
.

Chapter 2
65
Table 2.3 shows the characteristics of the components present in the experimental facility previously
described.
Table 2.3. Description of solar/UV pre-industrial unit constituents.
Element Acronym Brand Model Characteristics
Air
compressor AC Maquinaria Disber S.L. CD-2/24L
P = 8 bar
V = 24 L
Q = 198 L/min
Biological
reactor BR Colberge DPC3500
PE-HD cylindrical flat-bottom tank
D = 1.6 m
H = 2.0 m
V = 3.5 m3
Coagulation
tank CT Colbergue DPC3000
PE-HD cylindrical flat-bottom tank
D = 1.47 m
H = 2.0 m
V = 3.0 m3
Dosing
pumps
DP1
Colberge MP643-552 Qmax = 13 L/h DP2
DP3
DP4
DP5 Milton Roy CEGA5M1T3 Qmax = 5 L/h
DP6 Colberge MP643-552 Qmax = 14.9 L/h
Electrovalves
EV1
Ebro Armaturen EB4DM Pmax = 8 bar EV2
EV3
EV4
H2O2 meter
and controller MH Grundfos Alldos Conex DIA-1 WP7 sensor
UV lamps
L1
Uv-technik
UV-Lamp
UVH 4019/28
F-1
Doping: Iron
Rated power = 0.85/1.0/1.2 kW
L = 405 mm
UV-C, UV-B, UV-A and Vis light
Sealing temperature = 350 ºC
Useful lifetime: 750 – 1250 h
Quartz sleeves: Dext. = 45 mm;
Thickness = 2 mm;
ΔT = 700 – 900 ºC
L2
L3
L4
Mechanical
stirrers
MS1
Colberge VLS 5550
76 rpm
MS2 104 rpm
MS3 76 rpm
Dissolved
oxygen meter
and controller
MO Colberge Aqs- *S* Oxygen electrode Pg 13.5
(ord. no. 21100)
pH meter and
controller MP Colberge Aqs- *S*
Sensorex sensor, model
S653/S653W
Chapter 2
66
Table 2.3. Description of solar/UV pre-industrial unit constituents.
Element Acronym Brand Model Characteristics
Radiometer R Kipp & Zonen CUV4
λ = 299 - 384nm
I = 0 to 100 W/m²
Sensitivity = 1 mV.m²/W
Response time < 1s
Recirculation
pump RP Pan World NH-250PS Qmax = 65 L/min
Recirculation
tank RT Colberge TFC2500Z
PE-HD cylindrical conic tank
ϕ = 1.6 m
H = 2.0 m
V = 2.5 m3
Transfilling
pump TP Pan World NH-50PX-X Qmax = 24 L/min
2.2.4.1 Biological oxidation system
The biological oxidation system is composed by a cylindrical flat-bottom tank (BR), equipped with a
mechanical stirrer (MS1), a pH control unit (MP) for pH adjustment using either H2SO4 or NaOH dosing
metering pumps (DP3 and DP5, respectively), a dissolved oxygen sensor and controller (MO), and a
methanol dosing pump (DP6). A blower (AC) was used to supply air in order to maintain the selected
range of dissolved oxygen concentration inside the tank, using a ceramic diffuser at bottom of the BR.
The biological reactor is an autonomous system controlled by an abstract computer (Magelis, Schneider
Electric), constituted by one electrovalve (EV4) and nine discharge valves (V3 - V11).
2.2.4.2 Coagulation/sedimentation system
The coagulation/sedimentation system is constituted by a cylindrical flat-bottom tank (CT), a
mechanical stirrer (MS2), a pH control unit (MP) for pH adjustment using a H2SO4 dosing pump (DP2).
The clarified leachate is transferred to the photoreactor by means of a transfilling pump (TP), opening
the valve (V16) downstream of the pump and one of the three valves (V13, V14 and V15) arranged at
different heights of the CT, taking into account the acid sludge volume.
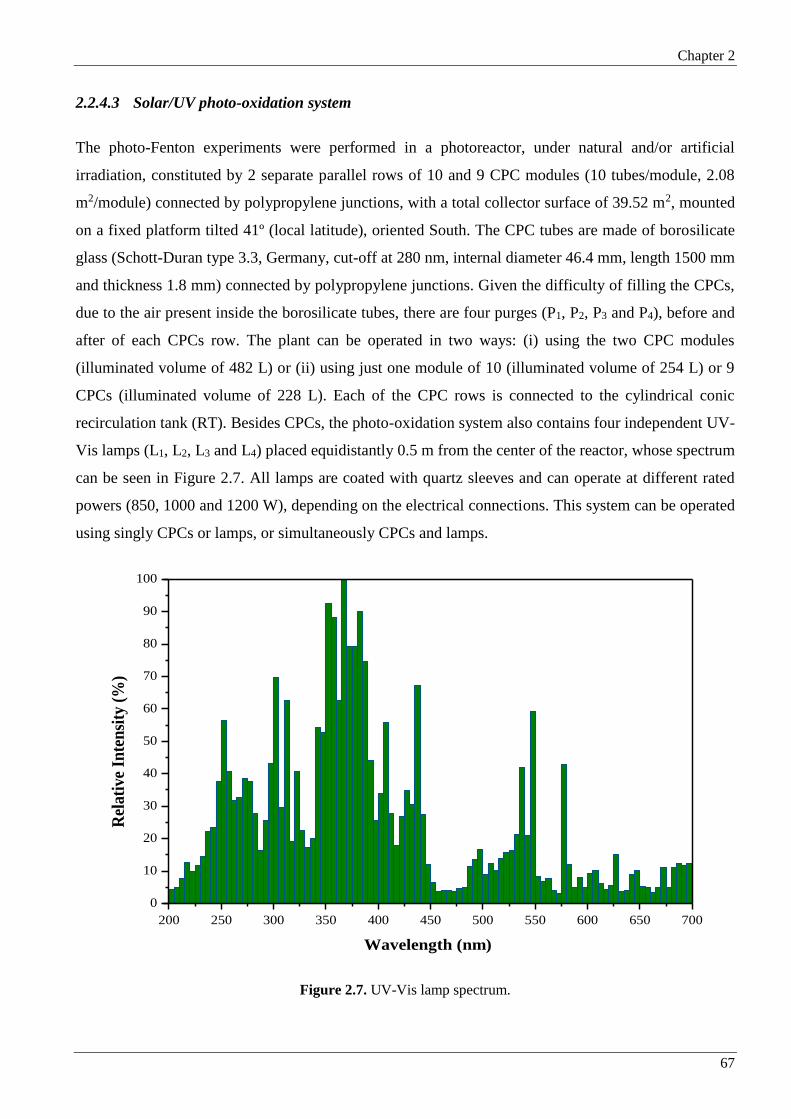
Chapter 2
67
2.2.4.3 Solar/UV photo-oxidation system
The photo-Fenton experiments were performed in a photoreactor, under natural and/or artificial
irradiation, constituted by 2 separate parallel rows of 10 and 9 CPC modules (10 tubes/module, 2.08
m2/module) connected by polypropylene junctions, with a total collector surface of 39.52 m2, mounted
on a fixed platform tilted 41º (local latitude), oriented South. The CPC tubes are made of borosilicate
glass (Schott-Duran type 3.3, Germany, cut-off at 280 nm, internal diameter 46.4 mm, length 1500 mm
and thickness 1.8 mm) connected by polypropylene junctions. Given the difficulty of filling the CPCs,
due to the air present inside the borosilicate tubes, there are four purges (P1, P2, P3 and P4), before and
after of each CPCs row. The plant can be operated in two ways: (i) using the two CPC modules
(illuminated volume of 482 L) or (ii) using just one module of 10 (illuminated volume of 254 L) or 9
CPCs (illuminated volume of 228 L). Each of the CPC rows is connected to the cylindrical conic
recirculation tank (RT). Besides CPCs, the photo-oxidation system also contains four independent UV-
Vis lamps (L1, L2, L3 and L4) placed equidistantly 0.5 m from the center of the reactor, whose spectrum
can be seen in Figure 2.7. All lamps are coated with quartz sleeves and can operate at different rated
powers (850, 1000 and 1200 W), depending on the electrical connections. This system can be operated
using singly CPCs or lamps, or simultaneously CPCs and lamps.
Figure 2.7. UV-Vis lamp spectrum.
200 250 300 350 400 450 500 550 600 650 700
0
10
20
30
40
50
60
70
80
90
100
Rel
ati
ve
Inte
nsi
ty (
%)
Wavelength (nm)
Chapter 2
68
The clarified leachate fed to the RT can be: (i) pumped through CPCs by means of a centrifugal pump
(RP), at a maximum flow rate of 65 L/min, regulated by two globe valves (V19 and V20) connected to
two flowmeters (FM1 and FM2), in case where the CPCs are used, individually or simultaneously with
the lamps; or (ii) only recirculated to the RT, using the same pump, in the case where the lamps are
exclusively used. This recirculation process is performed in order to enhance the turbulence inside the
RT, maximizing the absorption of light by the iron species and for the correct on-line H2O2 concentration
measurement and control.
The RT is equipped with a mechanical stirrer with double helix (MS3), in order to increase the turbulence
inside the reactor, a pH sensor and controller (MP), a H2O2 sensor and controller (MH) and three dosing
pumps for H2O2 (DP1), H2SO4 (DP2) and NaOH (DP4) addition. The photoreactor is an autonomous
system, controlled by an abstract computer (Magelis, Schneider Electric), constituted by three
electrovalves (EV1, EV2 and EV3), three level rods (LR1, LR2 and LR3) and three valves (V16, V18 and
V24).
The intensity of solar UV radiation was measured by a global UV radiometer (R) mounted on the CPC
modules at the same angle, which provided data in terms of incident WUV/m2. Equation (2.1), presented
in the sub-section 2.2.1.1, allows to obtain the amount of accumulated UV energy (QUV,n, kJ/L), when
the CPCs are used. The amount of accumulated UV energy (QUV,L,n, kJ/L) emitted by the UV-Vis lamps
and received by the leachate existing inside the photoreactor, is given by Equation (2.2). When solar and
artificial radiation are simultaneously used, the amount of accumulated UV energy (QUV,T,n, kJ/L) is
calculated as the sum of Equations (2.1) and (2.2), according to Equation (2.3).
1nnn
t
nLL1n,L,UVn,L,UV ttt;
V
tPNQQ
(2.2)
1nnnrn,G
LL
t
n1n,T,UVn,T,UV ttt;
1000
AUVPN
V
tQQ
(2.3)
Where:
tn - time corresponding to the n-water sample (s)
Vt - total reactor volume (L)
NL- number of UV-Vis lamps
η – useful ultraviolet radiation fraction
PL – rated power (kW) of the UV-Vis lamp used during the period Δtn (s).

Chapter 2
69
2.3 Experimental procedure
The specific procedures used to carry out the various sets of experiments in the different facilities are
described below.
2.3.1 Solar pre-industrial scale experiments
The first set of experiments carried out at the solar pre-industrial scale unit, which results are presented
in the Chapters 3, 4 and 5, was based on an integrated leachate treatment strategy composed by a solar
photo-Fenton reaction and an activated sludge process, under aerobic and anoxic conditions. In the
Chapters 3 and 4 this was the sequence of treatment adopted (see subsection 2.3.1.1), while in the
Chapter 5, a biological process was also added before the photo-oxidation step (see subsection 2.3.1.2).
In the next subsections, the experimental procedure of each step is described.
2.3.1.1 Photo-treatment/Biological treatment
a) Photo-treatment
The clarification tank was filled by gravity with 2 m3 of leachate from the aerobic lagoon by opening
valve 1 (valves 2 and 3 closed). After a 3-h sedimentation period, the clarified leachate flowed by gravity
to the recirculation tank (RT) (valve 3 and electrovalve 1 open) and the sludge, if necessary, was
removed by opening valve 2. The volume of leachate (1.3–1.4 m3) was controlled by three level rods
(minimum, maximum and reference). A first control sample was taken for leachate characterization after
15 min of mechanical stirring.
The pH value was adjusted to 3.0 through the addition of sulphuric and/or hydrochloric acids under
mechanical stirring and another sample was taken after pH stabilization. Then, iron sulphate salt
(80 mg Fe2+/L) and H2O2 (500 mg/L) were manually and automatically added, respectively, leading to
a final pH of 2.8. The dissolved iron content initially present in the leachate was not taken into account.
Afterwards, electrovalve 2 was open, the leachate was pumped into the CPCs and the photo-Fenton
reaction started.
Hydrogen peroxide concentration was controlled online between 100 and 500 mg/L, through the addition
of commercial H2O2 solution (50% (w/v)). Samples were collected at pre-defined times to evaluate the
degradation process. pH was not controlled during the photo-Fenton reaction. Reaction was stopped
automatically when the consumption of H2O2 or amount of UV radiation (integrated by the UV
radiometer) reached the set point. At that moment, the pump was turned off and the photo-treated
leachate returned to the recirculation tank by gravity.

Chapter 2
70
For biodegradability tests, presented in the Chapter 4, two photo-Fenton experiments were performed
maintaining all parameters, with exception of H2O2 dose. In one of those experiments, after the
acidification procedure, sludge was completely removed, and only supernatant leachate was used. In
these experiments, a small amount of H2O2 was added to the photoreactor, and after H2O2 total
consumption, a sample was taken for bioassays and a new dose of H2O2 was added. This procedure of
“addition-total consumption-sample collection-addition” is important since it prevents any reaction in
dark conditions after sample collection during storage, and possible interferences in bioassays.
Considering this procedure, experimental data must be expressed in terms of H2O2 consumption and not
accumulated UV energy per litre of leachate.
Finally, the photo-treated leachate was neutralized with NaOH to a pH ca. 7, under mechanical stirring,
leading to iron precipitation and followed by a 3-h sedimentation period for iron sludge settling.
b) Biological treatment
The biological reactor was initially colonized by activated sludge, collected in a conventional municipal
WWTP, and small amounts of raw leachate were further added during 1-month in order to allow the
biomass to adapt to such complex wastewater.
Afterwards, the clarified photo-treated-neutralized leachate (1 m3) was pumped into the biological
reactor. The biological reactor was operated under aerobic and anoxic conditions, to promote not only
nitrogen removal by nitrification and denitrification reactions, but also to remove the biodegradable
organic carbon fraction. Furthermore, taking into account the low carbon/nitrogen ratio of the
photo-treated leachate, methanol was used as an external carbon source to achieve complete
denitrification. pH was controlled between 6.5 and 8.5 during nitrification and denitrification reactions.
Along the nitrification process, oxygen concentration was maintained between 0.5 and 2 mg O2/L. For
the denitrification reaction, the air blower was turned off (the mechanical stirrer remained on, to avoid
sludge settling) and the dissolved oxygen concentration was kept below the detection limit (<0.05 mg
O2/L). After complete nitrogen removal, and further clarification (2–4 hours) of the wastewater, the
photo-bio-treated leachate was discharged.
2.3.1.2 Biological treatment/photo-treatment/biological treatment
a) 1st Biological treatment
The biological reactor was initially colonized using activated sludge from a conventional municipal
wastewater treatment plant (WWTP), and small amounts of raw leachate were added during one month,
Chapter 2
71
in order to adapt the biomass to the high-strength wastewater. After this preliminary adaption period,
the clarified raw leachate (2.5 m3) was pumped into the biological reactor containing the biomass. The
biological reactor was operated under aerobic and anoxic conditions, to promote nitrogen removal by
nitrification and denitrification reactions, respectively, and the complete oxidation of the biodegradable
organic carbon fraction. Furthermore, and taking into account the low carbon/nitrogen ratio of the raw
leachate, methanol was used as an external carbon source to promote complete denitrification. pH was
controlled in the range between 7.5 and 9.0 along nitrification and denitrification reactions. During
nitrification, oxygen concentration was maintained above 0.5 mg O2/L. Over denitrification reactions,
the air blower was turned off (mechanical stirrer remained turned on, in order to avoid sludge settling)
and dissolved oxygen concentration was always below the detection limit (<0.05 mg O2/L).
b) Solar photo-treatment
After the 1st biological treatment and further wastewater clarification, the bio-treated leachate was
pumped into the recirculation tank of the photocatalytic system to proceed with the photo-Fenton
oxidation. A first control sample was taken after 15 min of mechanical stirring for bio-treated leachate
characterization.
The pH value was adjusted to 3.0 through the addition of sulphuric acid, under mechanical stirring, and
another sample was taken after pH stabilization. In order to evaluate the influence of sludge removal on
the photo-Fenton reaction, the acidified bio-treated leachate was divided in two parts: half the volume
was transferred to another tank, followed by sludge settling, and the supernatant was transferred back
again to the recirculation tank, to perform the photo-oxidation reaction. In the experiments with and
without sludge removal after acidification, 0.9 and 0.8 m3 of acidified bio-treated leachate was used,
respectively.
Then, iron sulphate salt (80 mg Fe2+/L) and a first dose of H2O2 (500 mg/L) was added manually and
automatically to the wastewater, respectively, achieving a final pH value of 2.8. The presence of
dissolved iron in the leachate (7.9 mg/L) was not taken into account. Then, the acidified-bio-treated
leachate was pumped through the CPCs (10 CPCs modules; 20.8 m2) and the photo-Fenton reaction
started.
Hydrogen peroxide was controlled online between 100 and 500 mg/L, through the addition of
commercial H2O2 (50% (w/v)) solution. Samples were taken at pre-defined times to evaluate the
degradation process. Reactions stopped automatically when the consumption of H2O2 or the amount of

Chapter 2
72
UV radiation (integrated by the UV radiometer) reached the set point. At this moment, the pump was
turned off and the bio-photo-treated leachate returned to the recirculation tank by gravity.
Finally, the bio-photo-treated leachate was neutralized with NaOH to a pH around 7, under mechanical
stirring, leading to iron precipitation, followed by an iron sludge settling period of 3 hours.
c) 2nd Biological treatment
The clarified neutralized photo-bio-treated leachate (0.6 m3) was pumped into the biological reactor
containing the settled biomass. The biological reactor was operated under the same conditions than the
first one. After oxidation of the biodegradable organic carbon content, and further clarification of the
wastewater, the bio-photo-bio-treated leachate was discharged.
2.3.2 Lab-scale photo-Fenton experiments
In order to assess the effect of the main photo-Fenton reaction parameters on leachate treatment, which
results are presented in Chapter 7, the recirculation glass vessel of the lab-scale prototype (Figure 2.3)
was filled with 1 L of pre-treated (biological oxidation and physico-chemical process) leachate,
homogenized (magnetic stirrer) and recirculated to the CPC unit during ca. 30 minutes in the darkness.
Then, a first sample was taken. Meanwhile, the temperature set-point of the refrigerated thermostatic
bath was adjusted to keep the leachate in the intended temperature (10, 20, 30, 40 or 50ºC). The
SUNTEST was switched on (keeping the photoreactor covered with an aluminium sheet) and the
irradiance was set at 250, 500 and 750 W/m2, which is equivalent to 22, 44 and 68 WUV/m2, measured
in the wavelength range 280 - 400 nm. Then, the leachate was acidified with H2SO4, HCl or H2SO4+HCl
until the desired pH (2.0, 2.4, 2.8, 3.2 and 3.6) and ferrous sulphate was added to achieve the
concentrations of 20, 40, 60, 80 and 100 mg/L, taking into account the initial dissolved iron content.
After about 10 min, a second sample was analysed for total dissolved iron (TDI) concentration control.
Finally, the CPC was uncovered and the first dose of H2O2 was added to start the photo-Fenton reaction.
Additional samples were taken at pre-defined times in order to follow the degradation process. The
concentration of H2O2 was maintained in excess, between 100 and 500 mg/L during the entire reaction,
by adding the amounts required to compensate the consumed ones, as indicated by the analyses
performed throughout the experiments.
The iron (III) speciation diagrams, presented in the Chapter 7, were obtained from the chemical
equilibrium modelling system MINEQL+ [2], taking into account (i) the formation of Fe(OH)3 (s) and
(ii) the equilibrium constants of the iron-water, iron-sulphate and iron-chloride complexes, as well as
(iii) the respective reaction enthalpies.

Chapter 2
73
2.3.3 Lab-scale biological experiments
As previously mentioned, the effect of the main biological treatment variables on the leachate's
nitrification and denitrification, presented in the Chapter 8, was assessed in a respirometer (Figure 2.4),
working as a lab-scale bioreactor.
2.3.3.1 Nitrification kinetics
Initially, the reactor vessel was filled with about 880 mL of sanitary landfill leachate, collected from an
LTP aerobic lagoon, previously acidified with sulphuric acid up to the required initial pH (8.5 or 7.5),
when it was necessary to vary the pH range. Then, the reaction vessel was placed in the respirometer
container and the stirring motor was switched on. After that, the operating temperature (15, 20, 25 and
30ºC) and the pH (6.5-7.5, 7.5-8.5 and not controlled) and dissolved oxygen (0.5-1.0, 1.0-2.0 and 2.0-
4.0 mg/L) intervals were selected as required, being continuously controlled by the respirometer
software. These parameters were constantly measured and recorded online every 60 seconds. Then, the
stirring, the aeration and the peristaltic pump were turned on, in order to initiate the system stabilization.
Once the temperature was stabilized, centrifuged biomass (20-35 mL) previously adapted both to the
aerobic operating regime and to the landfill leachate, was added to the reaction vessel and the first control
sample was taken after ca. 1 min. Other samples were collected roughly every hour, during about 14-16
hours, in order to evaluate the nitrification reaction by analysing the dissolved inorganic carbon,
ammonium nitrogen, volatile suspended solids and nitrite and nitrate ions content.
2.3.3.2 Denitrification kinetics
Firstly, the reactor vessel was filled with sanitary landfill leachate (900-975 mL), previously nitrified
and, when necessary, acidified with sulphuric acid up to the required initial pH (6.5, 7.0, 7.5, 8.0 and
9.0). Then, the reaction vessel was placed in the respirometer container and the stirring motor was
switched on. After that, the operating temperature (20, 25 and 30ºC) and the pH interval (6.5-7.0, 7.0-7.5,
7.5-8.0, 8.0-8.5 and 8.5-9.0) were selected and controlled throughout the experiment by the respirometer
software. These parameters were constantly measured and recorded online every 60 seconds. Then, the
stirring and the peristaltic pump were turned on, keeping the aeration off, in order to initiate the system
stabilization. Once the temperature was stabilized, centrifuged biomass (25, 50 and 100 mL), previously
adapted both to the anoxic operating regime as to the nitrified landfill leachate, was added to the reactor
and the first control sample was taken after ca. 1 min. Immediately after the collection of the first sample,
methanol was added to start the reaction. Other samples were collected roughly every 2-3 hours (being
the collection suspended overnight), during about 12-30 hours, in order to evaluate the denitrification
Chapter 2
74
reaction by analysing the dissolved inorganic and organic carbon, volatile suspended solids and nitrite
and nitrate ions concentration.
Regarding the denitrification evaluation, it was also performed one experiment with phosphate ions
addition (ca. 30 mg PO43--P/L). In this test, the biomass was prepared according to Zahn-Wellens test
methodology (as described in the sub-chapter 2.4) and 1.2 mL of the phosphate buffer, also used in the
Zahn-Wellens test, was added.
2.3.4 Solar/UV pre-industrial scale experiments
The set of experiments carried out at the solar/UV pre-industrial scale facility, which results are
presented in the Chapter 9, was based on an integrated leachate treatment strategy composed by aerobic
biological oxidation, coagulation/sedimentation process and photo-Fenton reaction driven by solar
and/or artificial radiation. In the following subsections, the experimental procedure of each stage is
described.
2.3.4.1 Biological treatment
The biological reactor (BR) was initially fed with the mixed liquor from the biological reactor of the
LTP, located at the sanitary landfill in question, since the activated sludge was already properly adapted
to the recalcitrant compounds inherent to this kind of wastewater. The succeeding batches (2.0-2.5 m3)
were performed with clarified leachate from the secondary settling tank existing at the LTP. The BR
from the experimental unit was prepared to operate in aerobic and anoxic conditions. However, during
this experimental cycle, the BR was kept to work in aerobic regime in order to remove the alkalinity (via
nitrification reaction) and the remaining biodegradable organic matter. After leachate feeding, the
mechanical stirring was switched on and a sample was taken for initial leachate characterization.
During the nitrification reaction, the pH was not controlled (decreasing along the reaction) and the BR
was continuously aerated, trying to keep the DO content between 0.5 and 1.0 mg O2/L. However, due to
operational limitations, the air supply was not enough for microbial consumption needs, not allowing to
maintain the average DO content higher than 0.5 mg O2/L. The reaction was stopped when the values
of alkalinity and/or ammonium nitrogen were close to zero. After that, the biological sludge was settled
for 2-4 hours.
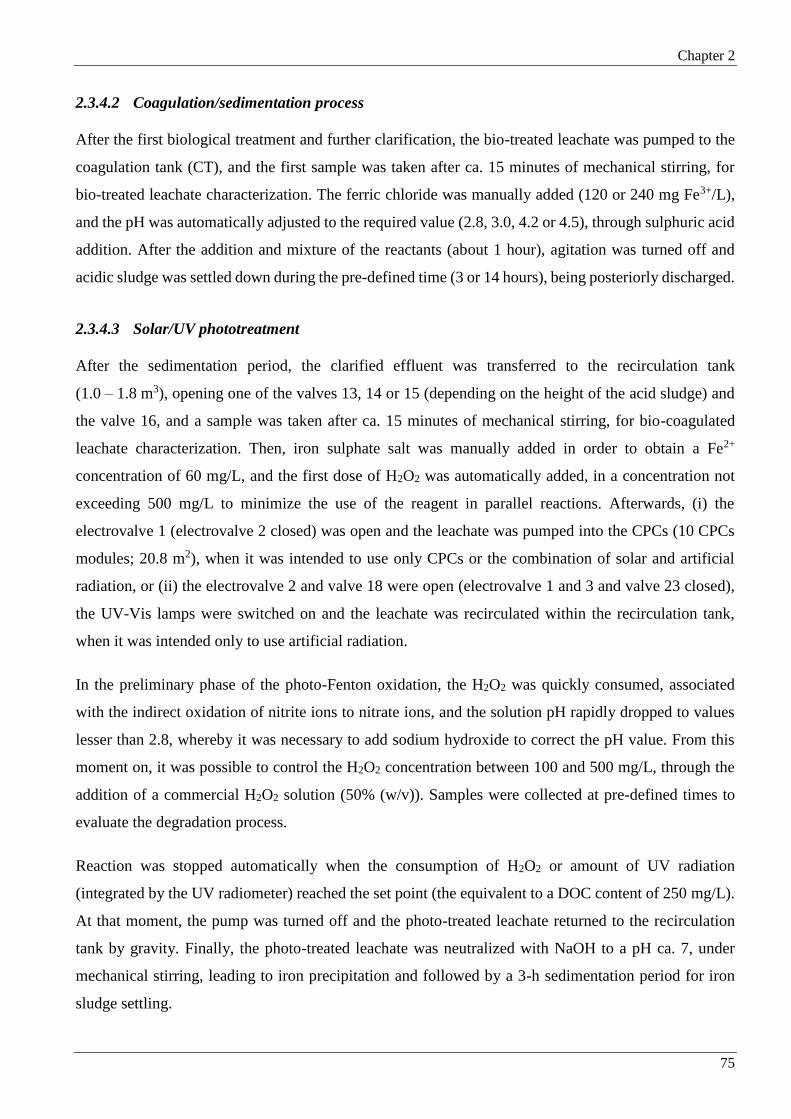
Chapter 2
75
2.3.4.2 Coagulation/sedimentation process
After the first biological treatment and further clarification, the bio-treated leachate was pumped to the
coagulation tank (CT), and the first sample was taken after ca. 15 minutes of mechanical stirring, for
bio-treated leachate characterization. The ferric chloride was manually added (120 or 240 mg Fe3+/L),
and the pH was automatically adjusted to the required value (2.8, 3.0, 4.2 or 4.5), through sulphuric acid
addition. After the addition and mixture of the reactants (about 1 hour), agitation was turned off and
acidic sludge was settled down during the pre-defined time (3 or 14 hours), being posteriorly discharged.
2.3.4.3 Solar/UV phototreatment
After the sedimentation period, the clarified effluent was transferred to the recirculation tank
(1.0 – 1.8 m3), opening one of the valves 13, 14 or 15 (depending on the height of the acid sludge) and
the valve 16, and a sample was taken after ca. 15 minutes of mechanical stirring, for bio-coagulated
leachate characterization. Then, iron sulphate salt was manually added in order to obtain a Fe2+
concentration of 60 mg/L, and the first dose of H2O2 was automatically added, in a concentration not
exceeding 500 mg/L to minimize the use of the reagent in parallel reactions. Afterwards, (i) the
electrovalve 1 (electrovalve 2 closed) was open and the leachate was pumped into the CPCs (10 CPCs
modules; 20.8 m2), when it was intended to use only CPCs or the combination of solar and artificial
radiation, or (ii) the electrovalve 2 and valve 18 were open (electrovalve 1 and 3 and valve 23 closed),
the UV-Vis lamps were switched on and the leachate was recirculated within the recirculation tank,
when it was intended only to use artificial radiation.
In the preliminary phase of the photo-Fenton oxidation, the H2O2 was quickly consumed, associated
with the indirect oxidation of nitrite ions to nitrate ions, and the solution pH rapidly dropped to values
lesser than 2.8, whereby it was necessary to add sodium hydroxide to correct the pH value. From this
moment on, it was possible to control the H2O2 concentration between 100 and 500 mg/L, through the
addition of a commercial H2O2 solution (50% (w/v)). Samples were collected at pre-defined times to
evaluate the degradation process.
Reaction was stopped automatically when the consumption of H2O2 or amount of UV radiation
(integrated by the UV radiometer) reached the set point (the equivalent to a DOC content of 250 mg/L).
At that moment, the pump was turned off and the photo-treated leachate returned to the recirculation
tank by gravity. Finally, the photo-treated leachate was neutralized with NaOH to a pH ca. 7, under
mechanical stirring, leading to iron precipitation and followed by a 3-h sedimentation period for iron
sludge settling.
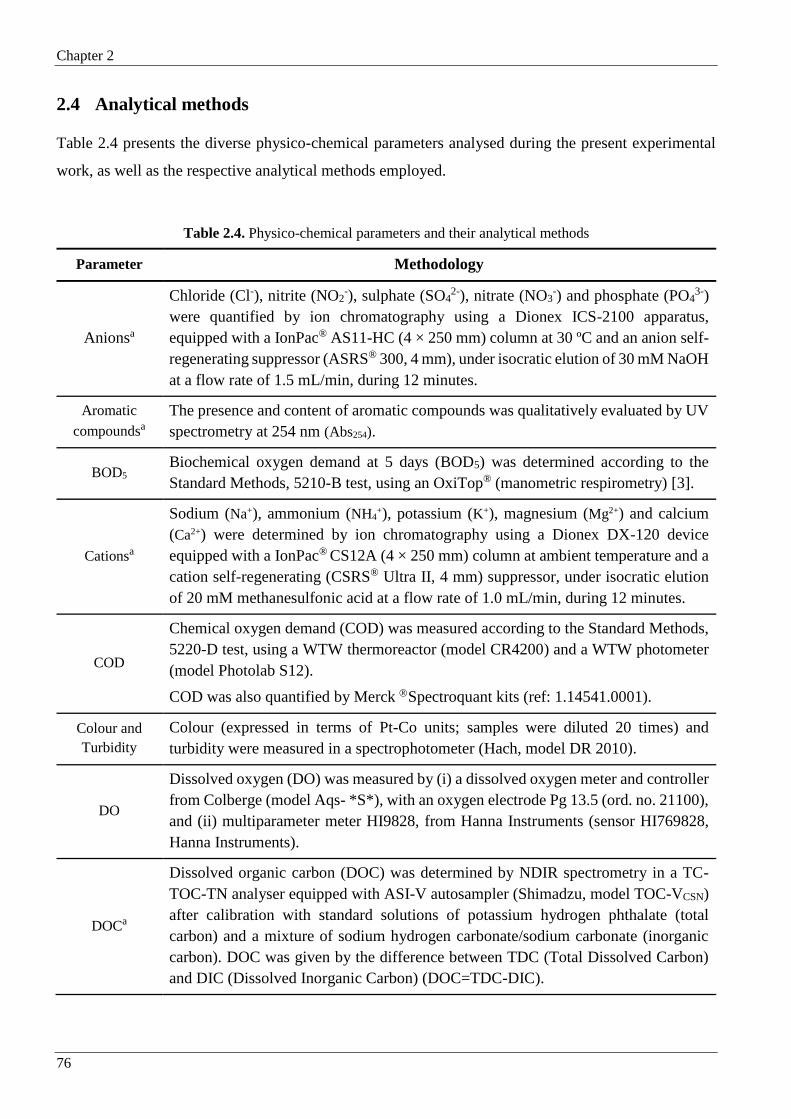
Chapter 2
76
2.4 Analytical methods
Table 2.4 presents the diverse physico-chemical parameters analysed during the present experimental
work, as well as the respective analytical methods employed.
Table 2.4. Physico-chemical parameters and their analytical methods
Parameter Methodology
Anionsa
Chloride (Cl-), nitrite (NO2-), sulphate (SO4
2-), nitrate (NO3-) and phosphate (PO4
3-)
were quantified by ion chromatography using a Dionex ICS-2100 apparatus,
equipped with a IonPac® AS11-HC (4 × 250 mm) column at 30 ºC and an anion self-
regenerating suppressor (ASRS® 300, 4 mm), under isocratic elution of 30 mM NaOH
at a flow rate of 1.5 mL/min, during 12 minutes.
Aromatic
compoundsa
The presence and content of aromatic compounds was qualitatively evaluated by UV
spectrometry at 254 nm (Abs254).
BOD5 Biochemical oxygen demand at 5 days (BOD5) was determined according to the
Standard Methods, 5210-B test, using an OxiTop® (manometric respirometry) [3].
Cationsa
Sodium (Na+), ammonium (NH4+), potassium (K+), magnesium (Mg2+) and calcium
(Ca2+) were determined by ion chromatography using a Dionex DX-120 device
equipped with a IonPac® CS12A (4 × 250 mm) column at ambient temperature and a
cation self-regenerating (CSRS® Ultra II, 4 mm) suppressor, under isocratic elution
of 20 mM methanesulfonic acid at a flow rate of 1.0 mL/min, during 12 minutes.
COD
Chemical oxygen demand (COD) was measured according to the Standard Methods,
5220-D test, using a WTW thermoreactor (model CR4200) and a WTW photometer
(model Photolab S12).
COD was also quantified by Merck Spectroquant kits (ref: 1.14541.0001).
Colour and
Turbidity
Colour (expressed in terms of Pt-Co units; samples were diluted 20 times) and
turbidity were measured in a spectrophotometer (Hach, model DR 2010).
DO
Dissolved oxygen (DO) was measured by (i) a dissolved oxygen meter and controller
from Colberge (model Aqs- *S*), with an oxygen electrode Pg 13.5 (ord. no. 21100),
and (ii) multiparameter meter HI9828, from Hanna Instruments (sensor HI769828,
Hanna Instruments).
DOCa
Dissolved organic carbon (DOC) was determined by NDIR spectrometry in a TC-
TOC-TN analyser equipped with ASI-V autosampler (Shimadzu, model TOC-VCSN)
after calibration with standard solutions of potassium hydrogen phthalate (total
carbon) and a mixture of sodium hydrogen carbonate/sodium carbonate (inorganic
carbon). DOC was given by the difference between TDC (Total Dissolved Carbon)
and DIC (Dissolved Inorganic Carbon) (DOC=TDC-DIC).
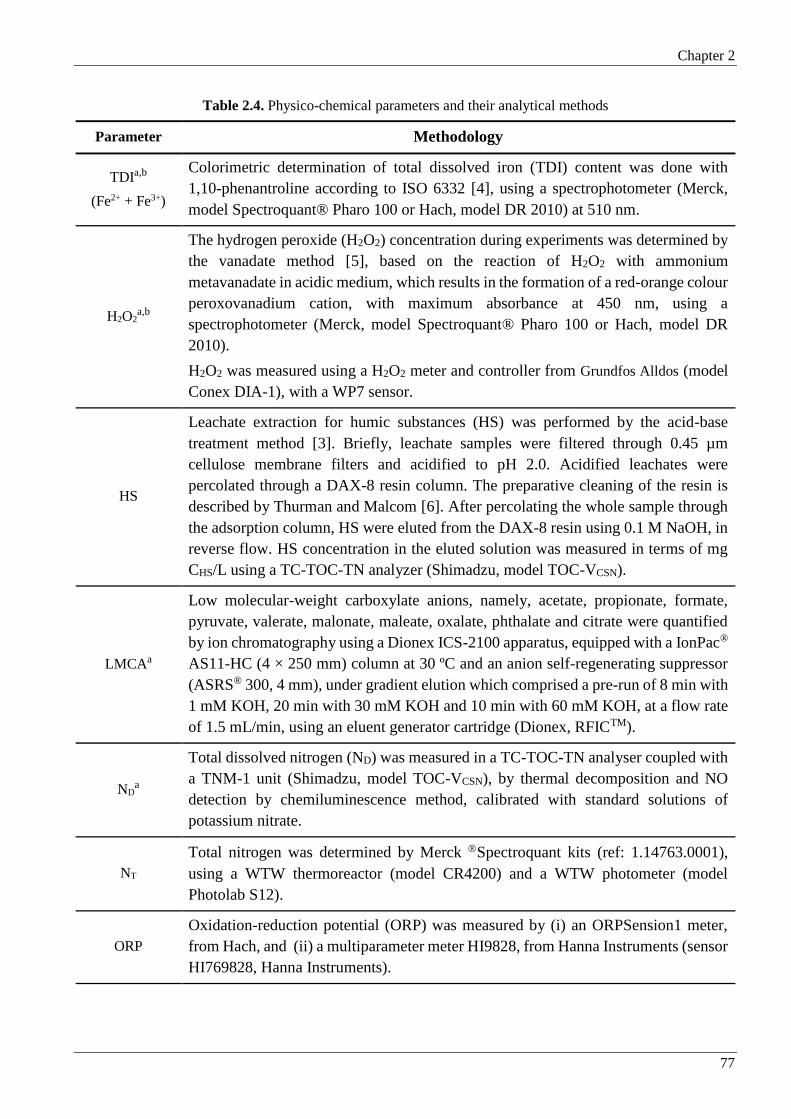
Chapter 2
77
Table 2.4. Physico-chemical parameters and their analytical methods
Parameter Methodology
TDIa,b
(Fe2+ + Fe3+)
Colorimetric determination of total dissolved iron (TDI) content was done with
1,10-phenantroline according to ISO 6332 [4], using a spectrophotometer (Merck,
model Spectroquant® Pharo 100 or Hach, model DR 2010) at 510 nm.
H2O2a,b
The hydrogen peroxide (H2O2) concentration during experiments was determined by
the vanadate method [5], based on the reaction of H2O2 with ammonium
metavanadate in acidic medium, which results in the formation of a red-orange colour
peroxovanadium cation, with maximum absorbance at 450 nm, using a
spectrophotometer (Merck, model Spectroquant® Pharo 100 or Hach, model DR
2010).
H2O2 was measured using a H2O2 meter and controller from Grundfos Alldos (model
Conex DIA-1), with a WP7 sensor.
HS
Leachate extraction for humic substances (HS) was performed by the acid-base
treatment method [3]. Briefly, leachate samples were filtered through 0.45 µm
cellulose membrane filters and acidified to pH 2.0. Acidified leachates were
percolated through a DAX-8 resin column. The preparative cleaning of the resin is
described by Thurman and Malcom [6]. After percolating the whole sample through
the adsorption column, HS were eluted from the DAX-8 resin using 0.1 M NaOH, in
reverse flow. HS concentration in the eluted solution was measured in terms of mg
CHS/L using a TC-TOC-TN analyzer (Shimadzu, model TOC-VCSN).
LMCAa
Low molecular-weight carboxylate anions, namely, acetate, propionate, formate,
pyruvate, valerate, malonate, maleate, oxalate, phthalate and citrate were quantified
by ion chromatography using a Dionex ICS-2100 apparatus, equipped with a IonPac®
AS11-HC (4 × 250 mm) column at 30 ºC and an anion self-regenerating suppressor
(ASRS® 300, 4 mm), under gradient elution which comprised a pre-run of 8 min with
1 mM KOH, 20 min with 30 mM KOH and 10 min with 60 mM KOH, at a flow rate
of 1.5 mL/min, using an eluent generator cartridge (Dionex, RFICTM).
NDa
Total dissolved nitrogen (ND) was measured in a TC-TOC-TN analyser coupled with
a TNM-1 unit (Shimadzu, model TOC-VCSN), by thermal decomposition and NO
detection by chemiluminescence method, calibrated with standard solutions of
potassium nitrate.
NT
Total nitrogen was determined by Merck Spectroquant kits (ref: 1.14763.0001),
using a WTW thermoreactor (model CR4200) and a WTW photometer (model
Photolab S12).
ORP
Oxidation-reduction potential (ORP) was measured by (i) an ORPSension1 meter,
from Hach, and (ii) a multiparameter meter HI9828, from Hanna Instruments (sensor
HI769828, Hanna Instruments).

Chapter 2
78
Table 2.4. Physico-chemical parameters and their analytical methods
Parameter Methodology
pH
pH was measured by (i) a pH meter and controller from Colberge (model Aqs- *S*),
with a Sensorex sensor (model S653/S653W), (ii) a multiparameter meter HI9828,
from Hanna Instruments (sensor HI769828, Hanna Instruments), and (iii) a pH meter
VWR symphony - SB90M5.
Polyphenolsa,b
Total polyphenols were quantified by spectrometry (Merck, model Spectroquant®
Pharo 100 or Hach, model DR 2010) at 765 nm, using the reagent Folin-Ciocalteau
[7], and expressed as mg/L of caffeic acid.
PT
Total phosphorus (PT) was measured, in samples pre-treated by persulphate digestion
method, according to the Standard Methods, 4500-P C test, using a WTW
thermoreactor (model CR4200) and a WTW photometer (model Photolab S12).
SSV30-min 30-min settled sludge volume (SSV30-min) was measured according to Standard
Methods [3], 2710-C test.
T
Temperature (T) was measured by (i) an ORPSension1 meter, from Hach, (ii) a
multiparameter meter HI9828, from Hanna Instruments (sensor HI769828, Hanna
Instruments), and (iii) a pH meter VWR symphony - SB90M5.
TSS Total suspended solids (TSS) was measured by gravimetry, drying the solid residue
at 105 °C, according to Standard Methods [3], 2540-D test.
VSS Volatile suspended solids (VSS) was determined by gravimetry, after suspended
solids oxidation at 550 °C, according to Standard Methods [3], 2540-E test.
aAll samples were filtrated through 0.45 m Nylon membrane filters before analysis; bDue to the leachate’s
absorption at the selected wavelengths, a blank/control sample (diluted as for the colorimetric analyses) was
always prepared, and the absorbance measured at the same wavelength for correction.
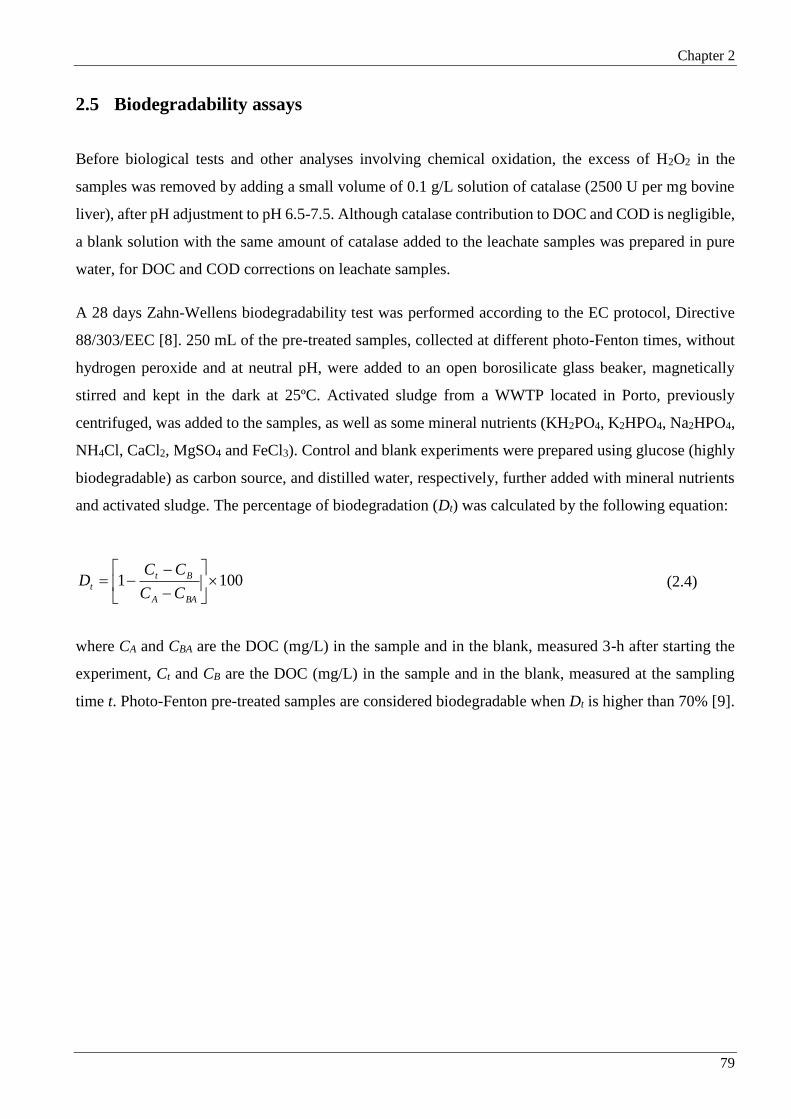
Chapter 2
79
2.5 Biodegradability assays
Before biological tests and other analyses involving chemical oxidation, the excess of H2O2 in the
samples was removed by adding a small volume of 0.1 g/L solution of catalase (2500 U per mg bovine
liver), after pH adjustment to pH 6.5-7.5. Although catalase contribution to DOC and COD is negligible,
a blank solution with the same amount of catalase added to the leachate samples was prepared in pure
water, for DOC and COD corrections on leachate samples.
A 28 days Zahn-Wellens biodegradability test was performed according to the EC protocol, Directive
88/303/EEC [8]. 250 mL of the pre-treated samples, collected at different photo-Fenton times, without
hydrogen peroxide and at neutral pH, were added to an open borosilicate glass beaker, magnetically
stirred and kept in the dark at 25ºC. Activated sludge from a WWTP located in Porto, previously
centrifuged, was added to the samples, as well as some mineral nutrients (KH2PO4, K2HPO4, Na2HPO4,
NH4Cl, CaCl2, MgSO4 and FeCl3). Control and blank experiments were prepared using glucose (highly
biodegradable) as carbon source, and distilled water, respectively, further added with mineral nutrients
and activated sludge. The percentage of biodegradation (Dt) was calculated by the following equation:
1001
BAA
Bt
tCC
CCD (2.4)
where CA and CBA are the DOC (mg/L) in the sample and in the blank, measured 3-h after starting the
experiment, Ct and CB are the DOC (mg/L) in the sample and in the blank, measured at the sampling
time t. Photo-Fenton pre-treated samples are considered biodegradable when Dt is higher than 70% [9].

Chapter 2
80
2.6 Target and non-target screening of persistent organic micropollutants
Leachate samples screening analyses for volatile organic compounds (VOCs), pesticides, phenols,
phthalates, polycyclic aromatic hydrocarbons (PAHs) and polychlorinated biphenyls (PCBs) were
performed by solid-phase microextraction, followed by gas chromatography coupled to mass
spectrometry (SPME-GC-MS).
Leachate samples collected at different treatment stages (Chapter 5) were first extracted using a
polydimethylsiloxane/divinylbenzene (PDMS-DVB) fibre (60 mm), supplied by Supelco (Bellefonte,
PA, USA) for the analysis of semivolatile pollutants, while for the analysis of VOCs a Carboxen/PDMS
75 mm fibre was used. Samples collected at an earlier treatment stage, i.e., prior to the phototreatment
step, were first diluted (1:10) in some cases, owing to their dark-brown colour and intense turbidity. For
subsequent analyses, 10 mL samples were used for COVs extraction (headspace), 18 mL for pesticides,
phthalates, PAHs and PCBs (fibre immersion), and 18 mL acidified with sulfuric acid to pH 2 for phenols
extraction (fibre immersion). In immersion mode, extractions were conducted over 60 min, at 60 ºC and
under constant stirring at 250 rpm. Two different GC-MS systems were employed for the overall
characterization: (i) for pesticides, phenols, phthalates, PAHs and PCBs, a Varian CP 3800 (Walnut
Creek, CA, USA) gas chromatograph was used, equipped with a fused-silica capillary column coated
with 5% diphenylmethylsiloxane (DPMS), VF-5 MS (30m × 0.25 mm I.D., 0.25 μm film thickness),
coupled to a 4000 ion trap mass spectrometer, from Varian Instruments (Walnut Creek, CA, USA); (ii)
for VOCs, analyses were carried out in a Varian 3400 CX (Walnut Creek, CA, USA) gas chromatograph,
equipped with a BR-624 capillary column (30m × 0.25 mm I.D., 1.4 μm film thickness), coupled to a
Saturn 2000 ion trap mass spectrometer, from Varian Instruments (Sunnyvale, CA, USA). Mass
spectrometers were operated in full-scan mode, in the range between 35 and 420 m/z.
Further details on the analytical methods herein employed for target quantitative analysis of the different
organic micropollutants can be found in Gonçalves and Alpendurada [10], Beceiro-González et al. [11]
and Guimarães et al. [12]. For non-target screening analyses, spectra of unidentified chromatographic
peaks, not present in the respective blank/negative control chromatogram, were compared against
reference spectra included in the US National Institute of Standards and Technology (NIST) database,
after background subtraction.

Chapter 2
81
2.7 16S rRNA gene barcode 454-pyrosequencing
2.7.1 DNA extraction and 454-pyrosequencing analysis
To characterize the bacterial communities present in the activated sludge under nitrification (N) and
denitrification (D) treatments (Chapter 8), a barcode pyrosequencing approach was used. Genomic DNA
was extracted from activated sludge samples at three different time points of each treatment (initial (I),
middle (M) and final (F)). For each sample, two DNA extractions were performed using the Power
SoilTM DNA Isolation Kit (MO BIO) as described elsewhere [13], and collecting the two extracts in a
single tube. DNA was further purified (Bacteria genomicPrep Mini Spin Kit, Amersham Biosciences,
NJ). The DNA concentration in the final extracts [Qubit® Fluorometer (Invitrogen) with QuantiTTM
dsDNA HS assay kit] was c. 60 μg/mL. DNA extracts were used as template for the amplification by
PCR of the hypervariable V3–V4 region of the 16S rRNA gene using the primers V3F
(5′-ACTCCTACGGGAGGCAG-3′) and V4R (5′-TACNVRRGTHTCTAATYC-3′) [14]. The PCR
amplifications were performed in duplicate for each DNA extract as described elsewhere [15]. Briefly,
the PCR mixtures (25 μL) contained 0.2 mM dNTPs (Bioron, Ludwigshafen am Rhein, Germany),
0.2 μM of each primer, 5% DMSO (Roche Diagnostics GmbH, Mannheim, Germany), 1 × Advantage
2 Polymerase Mix (Clontech, Mountain View, CA), 1 × Advantage 2 PCR Buffer and 1–3 μL of target
DNA (corresponding to 20 ng), and cycling conditions consisted of a first denaturation step at 94 °C for
4 min, followed by 20 cycles at 94 °C (30 s), 44 °C (45 s) and 68 °C (60 s) and a final 2 min extension
at 68 °C. The amplicons were quantified by fluorimetry with PicoGreen dsDNA quantitation kit
(Invitrogen, Life Technologies, Carlsbad, CA,) and pooled at equimolar concentrations. Pyrosequencing
libraries were obtained using the 454 Genome Sequencer FLX platform according to standard 454
protocols (Roche 454 Life Sciences, Branford, CT) at Biocant (Cantanhede, Portugal). The raw reads
have been deposited into the NCBI short-reads archive database (accession numbers:
SAMN03647091 – DI; SAMN03647092 – DM; SAMN03647093 – DF; SAMN03647094 – NI;
SAMN03647095 – NM and SAMN03647096 – NF).
2.7.2 Post run analysis
QIIME pipeline was used to process and analyse the 16S rRNA gene data generated from
pyrosequencing [16]. Briefly, sequences shorter than 300 bp and with quality scores lower than 25 were
eliminated. Moreover, single sequences (singlet) were removed from each sample data. Sequences
(> 300 bp) were assigned to samples by the 8-bp barcodes, grouped into operational taxonomic units
(OTUs) using UCLUST [17] with a phylotype threshold of ≥ 97% sequence similarity and were
Chapter 2
82
taxonomically assigned using QIIME defaults. The sequences comprising each OTU were aligned using
PYNAST [18] and were classified using Ribosomal Database Project (RDP) classifier [19]. At the 97%
identity level, the final OTU table consisted of 20 209 sequences. A phylogenetic tree containing the
aligned sequences was produced using FASTTREE [20].
The number of sequences for all the six analysed samples was rarefied (2400 sequences per sample
[16]), using the QIIME pipeline, and alpha and beta diversity metrics were determined. Alpha diversity
was assessed calculating the richness estimator (Chao 1 [21]) and the diversity indices (Simpson [22],
Shannon [23] and PD [24]). Beta diversity patterns of rarefied samples were assessed using the UniFrac
metric [25].

Chapter 2
83
2.8 References
[1] S. Malato, J. Blanco, A. Vidal, C. Richter, Photocatalysis with solar energy at a pilot-plant scale: an overview,
Applied Catalysis B: Environmental, 37 (2002) 1-15.
[2] W.D. Schecher, D.C. McAvoy, MINEQL+. A Chemical Equilibrium Modeling System, Version 4.6 for
Windows, Environmental Research Software, Hallowell, ME, 2007.
[3] L.S. Clesceri, A.E. Greenberg, A.D. Eaton, Standard Methods for Examination of Water & Wastewater, 21st
ed. ed., American Public Health Association (APHA), American Water Works Association (AWWA) &
Water Environment Federation (WEF), 2005.
[4] ISO 6332:1988, Water quality - Determination of iron - Spectrometric method using 1,10-phenanthroline, in,
1988.
[5] R.F.P. Nogueira, M.C. Oliveira, W.C. Paterlini, Simple and fast spectrophotometric determination of H2O2 in
photo-Fenton reactions using metavanadate, Talanta, 66 (2005) 86-91.
[6] E.M. Thurman, R.L. Malcom, Preparative Isolation of Aquatic Humic Substances, Environ. Sci. Technol., 15
(1981) 463-466.
[7] O. Folin, V. Ciocalteau, On tyrosine and tryptophane determinations in proteíns, Journal of Biological
Chemistry, 73 (1927) 627-650.
[8] EPA, U.S. Environmental Protection Agency, Prevention Pesticides and Toxic Substances (7101). Fates;
Transport and Transformation Test Guidelines OPPTS 835.3200 Zahn-wellens/EMPA Test, in, EPA 712-C-
96-084, Washington, DC, 1996.
[9] EMPA, OCDE guideline for testing of chemicals, Adopted by the Council on 17th July 1992, Zahn-
wellens/EMPA test, in, Swiss Federal Laboratories for Materials testing and Research, 1992.
[10] C. Gonçalves, M.F. Alpendurada, Solid-phase micro-extraction-gas chromatography-(tandem) mass
spectrometry as a tool for pesticide residue analysis in water samples at high sensitivity and selectivity with
confirmation capabilities, Journal of Chromatography A, 1026 (2004) 239-250.
[11] E. Beceiro-González, E. Concha-Graña, A. Guimaraes, C. Gonçalves, S. Muniategui-Lorenzo, M.F.
Alpendurada, Optimisation and validation of a solid-phase microextraction method for simultaneous
determination of different types of pesticides in water by gas chromatography–mass spectrometry, Journal
of Chromatography A, 1141 (2007) 165-173.
[12] A.D. Guimarães, J.J. Carvalho, C. Gonçalves, M.D.F. Alpendurada, Simultaneous analysis of 23 priority
volatile compounds in water by solid-phase microextraction-gas chromatography-mass spectrometry and
estimation of the method's uncertainty, International Journal of Environmental Analytical Chemistry, 88
(2008) 151-164.
[13] A.R. Lopes, C. Faria, Á. Prieto-Fernández, C. Trasar-Cepeda, C.M. Manaia, O.C. Nunes, Comparative study
of the microbial diversity of bulk paddy soil of two rice fields subjected to organic and conventional farming,
Soil Biology and Biochemistry, 43 (2011) 115-125.
[14] Y. Wang, P.-Y. Qian, Conservative fragments in bacterial 16S rRNA genes and primer design for 16S
ribosomal DNA amplicons in metagenomic studies, PloS one, 4 (2009) e7401.
Chapter 2
84
[15] A.R. Lopes, C.M. Manaia, O.C. Nunes, Bacterial community variations in an alfalfa-rice rotation system
revealed by 16S rRNA gene 454-pyrosequencing, FEMS microbiology ecology, 87 (2014) 650-663.
[16] J.G. Caporaso, J. Kuczynski, J. Stombaugh, K. Bittinger, F.D. Bushman, E.K. Costello, N. Fierer, A.G. Pena,
J.K. Goodrich, J.I. Gordon, QIIME allows analysis of high-throughput community sequencing data, Nature
methods, 7 (2010) 335-336.
[17] R.C. Edgar, Search and clustering orders of magnitude faster than BLAST, Bioinformatics, 26 (2010) 2460-
2461.
[18] T.Z. DeSantis, P. Hugenholtz, N. Larsen, M. Rojas, E.L. Brodie, K. Keller, T. Huber, D. Dalevi, P. Hu, G.L.
Andersen, Greengenes, a chimera-checked 16S rRNA gene database and workbench compatible with ARB,
Applied and environmental microbiology, 72 (2006) 5069-5072.
[19] Q. Wang, G.M. Garrity, J.M. Tiedje, J.R. Cole, Naive Bayesian classifier for rapid assignment of rRNA
sequences into the new bacterial taxonomy, Applied and environmental microbiology, 73 (2007) 5261-5267.
[20] M.N. Price, P.S. Dehal, A.P. Arkin, FastTree: computing large minimum evolution trees with profiles instead
of a distance matrix, Molecular biology and evolution, 26 (2009) 1641-1650.
[21] A. Chao, Nonparametric estimation of the number of classes in a population, Scandinavian Journal of
statistics, (1984) 265-270.
[22] E.H. Simpson, Measurement of diversity, Nature, (1949).
[23] C.E. Shannon, W. Weaver, The mathematical theory of communication, University of Illinois Press, Urbana,
IL, 1963.
[24] D.P. Faith, Conservation evaluation and phylogenetic diversity, Biological conservation, 61 (1992) 1-10.
[25] C. Lozupone, R. Knight, UniFrac: a new phylogenetic method for comparing microbial communities,
Applied and environmental microbiology, 71 (2005) 8228-8235.

3 Integration of solar photo-Fenton and biological
oxidation processes for leachate treatment at
pre-industrial scale
A strategy for the treatment of leachates from sanitary landfills after lagooning pretreatment is
proposed in this chapter. The most recalcitrant organic compounds were eliminated by a solar
photo-Fenton oxidation process, leading to a biodegradability enhancement of the leachate and
promoting its subsequent oxidation in an activated sludge biological reactor. The integrated
leachate treatment process was conducted in a pre-industrial plant, incorporating a photocatalytic
system with 39.52 m2 of compound parabolic collectors (CPCs) and a 3.5 m3 capacity activated
sludge biological reactor, operated under aerated and anoxic conditions. An extensive physico-
chemical characterization of the leachate after lagooning was performed during one year, from
June 2010 to May 2011, showing its high recalcitrant character mainly associated with the presence
of humic substances.
The efficiency of the combined treatment was evaluated concerning the leachate characteristics’
variability after lagooning, availability of solar radiation throughout the year, and different
operational process variables, such as the amount of hydrogen peroxide necessary to reach the
required COD target value, biodegradability enhancement during the photo-oxidation process, iron
reutilization in consecutive oxidation processes, removal of the acidic sludge resulting from the
acidification process and leachate temperature/average solar power. The elimination of the
remaining organic carbon fraction and nitrogen compounds after the pre-oxidation step was also
assessed in an activated sludge biological reactor, under aerobic and anoxic conditions,
considering the composition variability of the photo-treated leachate. Nitrification and
denitrification reaction rates were also evaluated.
This chapter is based on the research article “Silva, T.F.C.V., Silva, M.E.F., Cunha-Queda, A.C.,
Fonseca, A., Saraiva, I., Boaventura, R.A.R, Vilar, V.J.P, Sanitary landfill leachate treatment using
combined solar photo Fenton and biological oxidation processes at pre-industrial scale, Chemical
Engineering Journal, 228 (2013) 850-866, DOI: 10.1016/j.cej.2013.05.060”.


Chapter 3
87
3.1 Introduction
Sanitary landfill leachates treatment constitutes nowadays one of the major challenges for the scientific
community, mainly due to the variability of leachates composition and quantity [1, 2], reinforced by the
presence of a complex mixture of recalcitrant organic contaminants. These may include humic and fulvic
acids [3], phthalic esters [4, 5] pesticides [6], and many other emerging organic pollutants, in
concentration as low as nanograms (ng) or micrograms (μg) per liter (perfluorinated compounds-PFCs,
pharmaceuticals and personal care products, polyaromatic hydrocarbons-PAHs) [7], inorganic
compounds (chloride, sulphate, bicarbonate and carbonate, sulphide species, alkali and alkaline earth
metals, iron and manganese) [8], nitrogen compounds in high concentration [9-11] and heavy metals [8,
12].
Renou et al. [11] and Abbas et al. [13] presented reviews on different approaches used for landfill
leachates treatment, divided in five different groups: i) leachate channeling (combined treatment with
domestic sewage; recycling back through the landfill); ii) biodegradation (aerobic and anaerobic
biological processes); iii) chemical and physical methods (flotation, coagulation/flocculation, chemical
precipitation, adsorption, ammonium stripping, chemical oxidation and ion exchange); iv) membrane
filtration (microfiltration, ultrafiltration, nanofiltration and reverse osmosis); v) combination of the
different processes reported above. The UK Environment Agency presented in 2007 a guidance for the
treatment of landfill leachates [14], which indicated that the Best Available Technologies for leachates
treatment relied on the adoption of a multistage treatment process, possibly involving the use of primary,
secondary, and tertiary processes, adjusted to the type of leachate, including the different technologies
aforementioned.
During the late 90s, in Germany, the Netherlands, Belgium, France, Portugal and Spain, a lot of reverse
osmosis (RO) leachate treatment systems were designed with an aerated lagoon in front of a 2-stages
RO plant [14]. This configuration presented as advantage the aerated lagoon, which significantly reduced
NH4+-N load, BOD5 and COD due to its biologic activity. Although the production of a high quality
effluent (permeate) was a significant advantage of the RO process, considering the removal of
non-biodegradable components of the leachate, such as chloride, residual COD and heavy metals, all
these contaminants were present in the concentrate, which could be 10%-25% of the leachate’s volume
[14]. In addition, all chemicals required for the effective operation of an RO plant, such as citric acid,
membrane cleaner and anti-scaling detergents (up to 0.3% per cubic meter of treated leachate) were also
present in the concentrate [14]. Disposal of concentrate is a key factor to be addressed, and normally the
concentrate is returned to the landfill or disposed of off-site. The return of concentrate to the landfill
coincides with an increase of COD and NH4+-N concentration in the leachate, as well as an increase in
electrical conductivity [14].

Chapter 3
88
Advanced oxidation processes (AOPs) constitute nowadays a promising technique for the removal of
recalcitrant pollutants from landfill leachates, turning them into simpler and easily biodegradable
compounds through the generation of powerful reactive chemical species, such as hydroxyl radicals
(•OH) [15-20]. Hence, a subsequent biological oxidation step could allow getting in compliance with the
discharge limits. Considering the high costs associated with energy and chemicals consumption, research
has focused on the development of systems using renewable solar energy as UV photon source to
promote the oxidation process [21-24].
Although AOPs constitute a promising technology for the treatment of recalcitrant wastewaters, few
demonstration or industrial applications are available: (i) in 1993 a solar TiO2 photocatalytic plant, with
158 m2 of parabolic-trough concentrators collectors (PTCs) was installed at Lawrence Livermore
National Laboratory for the treatment of groundwater contaminated with trichloroethylene (TCE) [25];
(ii) in 1998, 12 double-skin sheet photoreactors (DSSRs) with a total irradiated area of 27.6 m2 and total
volume of 1 m3 were installed at Volkswagen AG factory (Wolfsburg, Germany) for the treatment of
biologically pre-treated wastewaters [26-28]; (iii) in 2004 two Thin Film Fixed Bed Reactors (TFFBR),
with a width of 2.5 m and a length of 10 m, corresponding to a total illuminated area of 50 m2, oriented
to the South and tilted 20º, were installed at a Tunisian textile industry (Menzel Temime) for the
treatment of a biologically pre-treated textile wastewater and further combined with two bioreactors
(SBR-Sequential Batch Reactors) with 15 m3 capacity each one, used for the pre-treatment of the textile
effluent [29]; (iv) in 2004 a 150 m2 plant of compound parabolic collectors (CPCs) and total operation
volume of 2.5 m3 was installed at Albaida (Almeria, Spain) for the treatment of wastewaters
contaminated with pesticides, and in 2010 the combination with a biological system based on two 1.23
m3 immobilized biomass reactors was optimized [30]; (v) in 2007 a 100 m2 unit of CPCs for the pre-
oxidation of a saline industrial wastewater containing 600 mg/L of a recalcitrant pharmaceutical
compound, -methylphenylglycine, was installed at a pharmaceutical company, DSM DIRETIL, which
was able to remove 50% of the initial dissolved organic carbon (DOC), being the remaining 45%
removed in an aerobic biological treatment system [31].
Considering the application of AOPs to leachates treatment, few full-scale treatment plants have been
reported in the literature, mainly using ozonation combined with biological processes. Between 1991
and 2002, 35 different plants combining biological processes and ozonation [32] were operated for the
treatment of leachates, at a flow rate varying from 10,000 to 150,000 m3/year, and COD levels between
2000-4000 mg/L. The Singhofen landfill leachate treatment plant (Germany) treated 29,200 m3/year,
combining a biological treatment step, consisting on a denitrification reactor followed by 3 nitrification
reactors, a sedimentation tank and a sand filter, with an ozonation/UV stage and a final biological

Chapter 3
89
treatment step [32], producing a final effluent with 200 mg COD/L and 50 mg NH4+-N/L. The facility
in Asbach (Germany) used the BIOQUINT system since 1998 and treated up to 26,000 m3/year, using
a raw leachate basin (1000 m3) followed by a biological treatment stage, with a nitrification fixed-bed
biofilter (45 m3), and two denitrification fixed-bed biofilters (2 × 10 m3) and an ozonation system (4 kg
O3/hour), achieving a final effluent with 200 mg COD/L, < 50 mg NH4+-N/L, < 2 NO2
--N/L and < 70
mg Ntotal/L. The landfill leachate treatment plant in Friedrichshafen (Germany) was based on an
improved version of the BIOQUINT system, where the biological treatment stage consisted on
nitrification and denitrification activated sludge reactors with 100 and 25 m3 capacity, respectively,
followed by an ozonation (1.5 kg O3/h)/biological recycle step, leading to 82% and 98% removal of
COD and nitrogen, respectively [33]. Leachates from a sanitary landfill in Bord-Matin, near
Saint-Etienne (France), containing 1750 mg COD/L and 850 mg NH4+-N/L, have been treated since
1972 by a combination of biological nitrification and denitrification processes, followed by chemical
precipitation with lime in a lamellar settling tank and a final ozonation step [33].
The present work aims at developing a new strategy for the treatment of landfill leachates, after
lagooning, using a solar photo-Fenton oxidation process to degrade the most recalcitrant organic
compounds, leading to a biodegradability enhancement of the leachate, which may then be further
oxidized in an activated sludge biological reactor. The elimination of the remaining nitrogen compounds
fraction was also evaluated in the activated sludge biological reactor, under aerated and anoxic
conditions, first promoting the aerobic nitrification of ammonia to nitrite/nitrate and then the anoxic
denitrification of nitrate/nitrite to nitrogen gas, using methanol as external carbon source. The efficiency
of the treatment strategy was evaluated in a pre-industrial plant, combining a photocatalytic reactor with
39.52 m2 of compound parabolic collectors (CPCs) with an activated sludge reactor with 3.5 m3 capacity,
during 1-year. The efficiency of the treatment strategy was evaluated to understand the influence of the
leachate composition, weather conditions and operational variables of the process (hydrogen peroxide
dose necessary to reach the required COD target value, biodegradability enhancement during the photo-
oxidation process, re-utilization of iron sludge in the photo-Fenton reaction, elimination of sludge
resulting from the acidification process and influence of temperature/average solar power during the
reaction). Finally, the first results using a plant close to industrial scale and real leachate samples, under
real operational conditions, are herein presented, supporting this system efficiency, sustainable practical
application and commercialization.

Chapter 3
90
3.2 Experimental methodology
During the trial period concerning this chapter, 29 leachate samples were collected at a municipal solid
waste (MSW) sanitary landfill nearby Porto. Table 3.1 presents the main physico-chemical
characteristics of the leachate over 1-year. Each parameter was analysed in duplicate, for each sample.
From January to May, only one sample was analysed per month.
All the chemicals used in this work, the detailed description of the experimental unit and respective
procedures, as well as the employed analytical methods can be consulted in Chapter 2.
The photo-Fenton reaction efficiency was evaluated in the pre-industrial scale plant during 1-year, in
order to better understand the influence of the leachate composition, specific solar radiation conditions
and different operational variables of the photo-Fenton process, such as: (i) hydrogen peroxide
dose/leachate composition variability (experiments 4–7, 12 and 18); (ii) reutilization of iron sludge
(experiments 8–11 and 13–17); (iii) sludge removal resulting from the acidification process (experiments
22–24); (iv) average solar UV irradiation/temperature (experiments 5 and 21); (v) type of acid used for
acidification/variability of the leachate’s alkalinity (experiments 5, 6, 8, 24 and 25) and (vi)
biodegradability enhancement (experiments 19–25).
The biological treatment efficiency was evaluated in the pre-industrial scale plant using a 3.5 m3 reactor,
in order to assess the influence of the photo-treated leachate composition, in terms of organic carbon
concentration and type (according to the photo-oxidation time) and inorganic species concentration and
type, such as nitrogen, sulphate and chloride (experiments 18–25). Nitrification and denitrification
reaction rates were also evaluated in experiments 20–25.

Chapter 3
91
3.3 Results and discussion
3.3.1 Leachate characterization
Table 3.1 presents an extensive characterization of leachate samples, after aerobic lagooning, collected
at a sanitary landfill located in North Portugal, since June 2010 to May 2011. After the lagooning
process, the leachate composition presented a high variability during the year, attributed to: (i) the raw
leachate (fed to the lagoon) variability; (ii) the lagoon treatment efficiency, associated with the low liquid
oxygen doses used to reduce costs; (iii) the leachate’s temperature, which influenced greatly the
nitrification and denitrification reactions, leading to a high variability in terms of nitrogen species
content and alkalinity.
The leachate presented an intense dark-brown colour associated with its high concentration in humic
substances (>1000 mg CHS/L), which corresponded to an average of 59% of the dissolved organic carbon
(DOC = 993–1707 mg C/L; COD = 2320–5416 mg O2/L), a high nitrogen load (208-2989 mg N/L) and
a low BOD5/COD ratio (0.04–0.01), reflecting a low biodegradability (Figure 3.1a). An exception was
spotted in December, with a moderate biodegradability rate (BOD5/COD = 0.20–0.37), indicating that
the lagoon was not working well during that month. Between June and November 2010, the aerated
lagoon was working properly and almost all nitrogen compounds and biodegradable organic carbon were
completely eliminated (Figure 3.1b). The lower pH values and higher nitrate contents during the summer
period (July, August and September) could be explained by the higher doses of injected liquid oxygen,
in order to reduce the intense odour associated with high temperatures, consequently leading to an
increase in the nitrification reaction rate (and lower values of inorganic carbon associated with alkalinity
consumption during nitrification), and simultaneously slower denitrification kinetics (Figure 3.1b).
From December 2010 until March 2011, the aerated lagoon presented a lesser nitrogen and organic
matter removal efficiency, which was related to the low temperatures observed during that period
(11.7 – 16.6ºC), leading to the inhibition of nitrification, and consequent accumulation of ammonium
nitrogen, as already reported by Ilies and Mavinic [34]. Between April and May 2011, nitrification was
affected by the low dissolved oxygen concentration observed, which favoured the partial oxidation of a
small fraction of ammonia to nitrites, instead of nitrates (as reported by Ruiz et al. [35]) leading
simultaneously to the decrease on the organic carbon removal efficiency.

Chapter 3
92
Table 3.1. Characterization of the sanitary landfill leachate after aerobic lagooning throughout 1-year.
Month June July August September October November December January February March April May Annual
pH 7.8
(7.8-7.9) 7.2
(6.7-7.8) 6.9
(6.5-7.5) 7.5
(7.2-7.7) 7.6
(7.6-7.6) 7.7
(7.6-7.8) 7.6
(7.4-7.8) 7.8 7.9 7.4 8.1 7.7
7.5
(6.5-8.1)
T
(ºC) 24.8
(23.6-25.9) 25.8
(23.1-28.3) 27.0
(25.3-28.2) 23.6
(22.8-24.8) 20.5
(20.1-20.9) 15.8
(13.9-19.4) 13.5
(13.0-14.0) 16.6 11.7 12.9 26.0 23.8
21.8
(11.7-28.3)
TSS
(mg/L) -
269
(145-435) 302
(121-424) 258
(125-375) 459
(394-523) 766
(405-1085) 453
(375-530) 187 136 52 112 90
329
(52-1085)
TIC
(mg C/L) 1548
(1389-1548) 579
(284-1157) 416
(200-885) 1117
(900-1319) 1049
(1026-1071) 1287
(1186-1486) 2262
(2164-2359) 2796 2497 2307 2303 2202
1280
(200-2796)
DOC
(mg C/L) 1178
(1118-1238) 1123
(1086-1138) 1145
(993-1266) 1187
(1169-1402) 1104
(995-1213) 1149
(1000-1382) 1320
(1313-1326) 1356 1253 1406 1707 1654
1238
(993-1707)
COD
(mg O2/L) -
3606
(3525-3775) 3307
(2945-3668) 3266
(2320-5416) 3177
(3170-3184) 3895
(3196-4588) 4173
(4147-4199) 3618 3428 4235 4211 4045
3621
(2320-5416)
BOD5
(mg O2/L) - - 205
285
(150-420) 208
(195-220) 288
(180-450) 1200
(850-1550) 340 300 340 170 255
373
(150-1150)
BOD5/COD - - 0.06 0.09
(0.06-0.14) 0.07
(0.06-0.07) 0.07
(0.05-0.10) 0.29
(0.20-0.37) 0.09 0.09 0.08 0.04 0.06
0.10
(0.04-0.37)
Polyphenols
(mg caffeic acid/L) 172
(165-179) 144
(134-164) 149
(132-161) 148
(140-156) 155
(151-158) 169
(136-213) 229
(226-232) 157 165 172 190 193
162
(132-232)
TDI
(mg (Fe2++Fe3+)/L) 16.7
(15.6-17.7) 8.5
(5.9-14.2) 9.1
(1.8-19.9) 16.6
(7.6-29.4) 10.2
(9.0-11.5) 15.7
(9.6-21.7) 19.4
(18.9-19.9) 12.8 10.6 12.0 12.2 11.1
12.9
(1.8-29.4)
Sulphate
(mg SO42-/L)
195
(167-224) 292
(246-338) 368
(228-597) 327
(275-395) 249
(248-249) 226
(202-239) 138
(132-144) 100 119 128 90 90
248
(90-597)
Chloride
(mg Cl-/L) 3393
(3347-3439) 3365
(3078-3601) 3666
(3513-3767) 4023
(3565-4691) 3374
(3263-3484) 3385
(3173-3601) 3102
(3065-3139) 2834 2867 2888 3148 3082
3440
(2834-4691)
Total Nitrogen
(mg N/L) 1291
(841-1742) 896
(323-1224) 1383
(1240-1544) 951
(712-1165) 277
(234-320) 405
(208-724) 1747
(1456-2038) 2390 2989 2678 2917 2905
1303
(208-2989)
Ammonium
(mg NH4+-N/L)
- 24
(1-90) 81
(19-216) 237
(65-344) 27
(8-46) 166
(36-383) 1436
(1173-1699) 2131 2812 1970 1691 1926
591
(1-2812)
Nitrate
(mg NO3--N/L)
3
(0-6) 698
(9-1126) 1211
(988-1297) 405
(217-691) 52
(21-83) 3
(1-8)
<1
<1 <1 <1 <1 <1 <1
374
(1-1297)
Nitrite
(mg NO2--N/L)
- 2
(1-5) 133
(1-263) 60
(1-273) 4
(1-9)
<1
<1 79
(74-84) 85 101 529 361 462
91
(1-529)
Total Phosphorous
(mg P/L) -
16.6
(2.6-40.0) 10.9
(7.0-13.4) 26.3
(15.9-44.2) 11.7
18.7
(8.7-30.6) 14.3
(14.0-14.5) 17.5 19.9 26.2 30.6 23.8
19.1
(2.6-44.2)
Values in bold and in parenthesis refer to medium and minimum-maximum values, respectively, obtained during experimental period.

Chapter 3
93
June Ju
ly
Aug
ust
Septem
ber
Octob
er
Nov
embe
r
Dec
embe
r
Janu
ary
Febr
uary
Mar
chApr
ilM
ay
0
500
1000
1500
2000
2500
3000
3500
4000
4500
CO
D,
DO
C,
BO
D5 (
mg/L
) COD DOC BOD
5
(a)
June Ju
ly
Aug
ust
Septem
ber
Octob
er
Nov
embe
r
Dec
embe
r
Janu
ary
Febr
uary
Mar
chApr
ilM
ay
0
500
1000
1500
2000
2500
3000
3500
Nit
rogen
con
ten
t (m
g N
/L)
ND NO
2
--N NO
3
--N NH
4
+-N
(b)
Figure 3.1. Evolution of the leachate’s characteristics after lagooning, during 2010-2011, in terms of DOC,
COD and BOD5 (a) and nitrogen (b).

Chapter 3
94
3.3.2 Solar photo-Fenton process
3.3.2.1 Kinetics
Between July 2010 and January 2011, 25 experiments were performed, combining solar photo-Fenton
with a biological oxidation system for the treatment of leachates after lagooning (Table 3.2). The
photo-Fenton reaction was conducted at pH 2.8 and with 80 mg Fe2+/L. This pH value was selected for
the photo-Fenton reaction to avoid iron precipitation [36]. Previous results [37] showed that the optimum
iron concentration for similar leachate and using CPC photoreactors with an internal diameter of 46.4
mm in the presence of high concentrations on sulphates and chlorides, is 80 mg/L (not considering the
presence of dissolved iron in the leachate). Thus, the average dissolved iron concentration during the
photo-Fenton reaction ranged between 30 and 50 mg (Fe2+ + Fe3+)/L. An initial 500 mg/L H2O2 dose
was added and maintained during the reaction between 100 and 500 mg/L, by the addition of small
amounts of H2O2 as consumed. Bacardit et al. [38] showed that supplying H2O2 in multiple small
amounts, and maintaining its concentration between 50 and 550 mg H2O2/L, improves oxidation reaction
rates and minimizes the consumption of H2O2 per amount of oxidized COD. Prieto-Rodríguez et al. [39]
also reported the same optimal H2O2 concentration range to avoid hydrogen peroxide to be rate-limiting
if applied in too low concentrations, or in high concentrations, it can compete with contaminants for the
generated hydroxyl radicals or to self-decompose into oxygen and water.
Different operational variables of the process were evaluated, such as: the possible reutilization of iron
sludge for the photo-Fenton reaction, the elimination of the sludge resulting from the acidification
process and the influence of temperature/average solar power during the reaction. In order to prevent
sulphate concentrations higher than 2 g/L, which is the discharge limit imposed by the Portuguese
legislation, and considering the absence of discharge limit for the chloride concentration, the
acidification of the leachate was performed with a mixture of HCl and H2SO4, with the exception of
experiments 8–11, 24 and 25, for which only H2SO4 was used. However, H2SO4 is commercially
available in a higher concentration (> 96% < > [H+] ≈ 37 M) than HCl (37% <> [H+] ≈ 12 M), though
at similar price, being necessary a substantially higher amount of HCl to acidify the leachate (increasing
Cl- concentration relatively to SO42-). Table 3.3 shows that different doses of HCl and H2SO4 or only
H2SO4 were necessary to achieve a final pH of 3.0, depending on the leachate’s alkalinity after lagooning
over the year. This was attributed to oxygen deficient conditions and low temperatures in the lagoon,
which affected greatly the nitrification reaction.

Chapter 3
95
Table 3.2. Characterization of the landfill leachate before photo-Fenton process.
Exp.a Data pH T
(ºC)
TSS
(mg/L)
DIC
(mg/L)
CaCO3,ICd
(mg/L)
DOC
(mg/L)
COD
(mg/L)
BOD5
(mg/L)
Polyphenols
(mg caffeic acid/L)
TDI
(mg/L)
SO42-
(mg/L)
Cl-
(mg/L)
ND
(mg/L)
NH4+-N
(mg/L)
NO3--N
(mg/L)
NO2--N
(mg/L)
PT
(mg/L)
4 01-07 7.8 25.6 1435 1157 4821 1086 3600 - 164 14.2 246 3388 323 90 9 1 2.6
5 13-07 7.0 26.4 407 575 2396 1129 3775 - 140 7.9 292 3601 859 1 757 <1 40.0
6 21-07 7.2 23.1 145 461 1921 1128 3525 - 142 7.2 289 3078 988 8 747 5 -
7 26-07 7.2 28.3 145 419 1746 1237 3525 - 138 7.1 296 3189 1086 10 852 <1 -
8 30-07 6.7 25.8 214 284 1183 1136 - - 134 5.9 338 3568 1224 12 1126 <1 7.3
9b 04-08 6.5 27.5 121 200 833 1135 2945 - 132 6.6 340 3665 1377 19 1297 <1 7.0
10b 09-08 6.8 27.1 365 280 1165 989 - - 108 11.7 762 3526 1556 45 1248 188 11.0
11b 11-08 6.7 28.2 598 299 1246 888 - - 115 20.3 1059 3705 1430 44 1248 188 11.3
12 27-08 7.5 25.3 424 885 3687 1266 3668 205 152 8.2 306 3718 1240 216 988 6 11.2
13b 02-09 7.7 23.8 125 967 4029 1176 2680 150 156 8.0 314 4035 1165 255 691 10 15.9
14b 06-09 7.7 23.5 206 1146 4776 1042 2860 160 140 23.8 907 4731 1104 322 550 <1 16.6
15b 10-09 7.7 23.2 619 1253 5222 1127 2095 250 143 27.3 840 4532 1017 277 430 <1 20.9
16b 16-09 7.4 24.8 1300 1319 5497 1198 1986 200 153 35.5 801 4711 881 266 281 11 19.9
17b 24-09 7.2 22.8 1675 900 3750 1200 4280 300 148 25.7 811 5452 784 120 256 195 33.6
18 15-10 7.6 20.9 394 1071 4462 1213 3170 220 151 11.5 249 3263 320 46 21 9 -
19 25-10 7.6 20.1 523 1026 4275 995 3184 195 158 9.0 248 3484 234 8 83 <1 11.7
20 02-11 7.6 19.4 1085 1190 4958 1064 3900 180 136 9.6 239 3601 208 36 8 <1 30.8
21 09-11 7.7 13.9 405 1186 4942 1000 3196 235 159 15.9 236 3380 283 79 <1 <1 8.7
22 23-11 7.8 14.4 808 1486 6191 1382 4588 450 213 21.7 202 3173 724 383 1 <1 16.7
23 14-12 7.4 13.1 375 2164 9016 1313 4947 1550 226 19.9 144 3139 1456 1173 <1 74 14.5
24c 30-12 7.8 14.0 530 2359 9829 1326 4199 850 232 18.9 132 3065 2038 1699 <1 84 14.0
25c 18-01c 7.8 16.6 187 2796 11650 1356 3618 340 157 12.8 100 2834 2390 2131 <1 85 17.5
aExperiment number; bISRS-Iron Sludge Recycle Study; c2011; dAlkalinity values considering that at pH less than 8.0 the inorganic carbon is almost in the form of bicarbonates
[40].
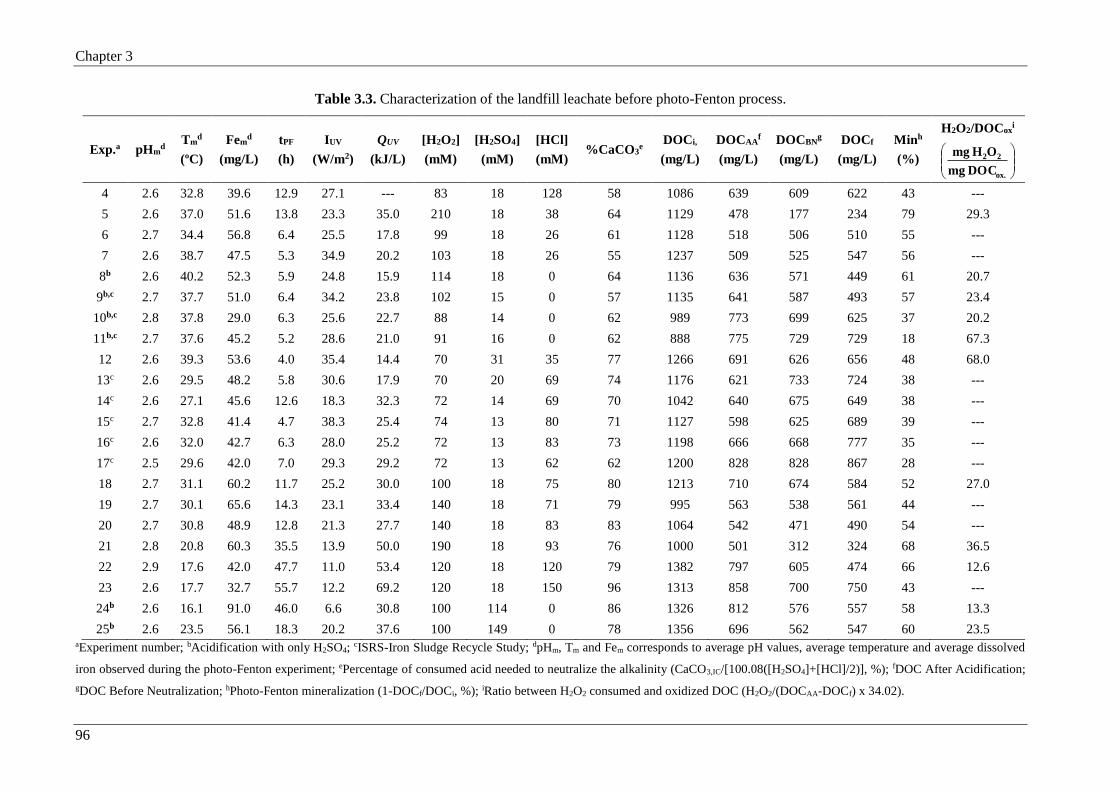
Chapter 3
96
Table 3.3. Characterization of the landfill leachate before photo-Fenton process.
Exp.a pHmd
Tmd
(ºC)
Femd
(mg/L)
tPF
(h)
IUV
(W/m2)
QUV
(kJ/L)
[H2O2]
(mM)
[H2SO4]
(mM)
[HCl]
(mM) %CaCO3
e DOCi,
(mg/L)
DOCAAf
(mg/L)
DOCBNg
(mg/L)
DOCf
(mg/L)
Minh
(%)
H2O2/DOCoxi
ox.
22
DOC mg
OH mg
4 2.6 32.8 39.6 12.9 27.1 --- 83 18 128 58 1086 639 609 622 43 ---
5 2.6 37.0 51.6 13.8 23.3 35.0 210 18 38 64 1129 478 177 234 79 29.3
6 2.7 34.4 56.8 6.4 25.5 17.8 99 18 26 61 1128 518 506 510 55 ---
7 2.6 38.7 47.5 5.3 34.9 20.2 103 18 26 55 1237 509 525 547 56 ---
8b 2.6 40.2 52.3 5.9 24.8 15.9 114 18 0 64 1136 636 571 449 61 20.7
9b,c 2.7 37.7 51.0 6.4 34.2 23.8 102 15 0 57 1135 641 587 493 57 23.4
10b,c 2.8 37.8 29.0 6.3 25.6 22.7 88 14 0 62 989 773 699 625 37 20.2
11b,c 2.7 37.6 45.2 5.2 28.6 21.0 91 16 0 62 888 775 729 729 18 67.3
12 2.6 39.3 53.6 4.0 35.4 14.4 70 31 35 77 1266 691 626 656 48 68.0
13c 2.6 29.5 48.2 5.8 30.6 17.9 70 20 69 74 1176 621 733 724 38 ---
14c 2.6 27.1 45.6 12.6 18.3 32.3 72 14 69 70 1042 640 675 649 38 ---
15c 2.7 32.8 41.4 4.7 38.3 25.4 74 13 80 71 1127 598 625 689 39 ---
16c 2.6 32.0 42.7 6.3 28.0 25.2 72 13 83 73 1198 666 668 777 35 ---
17c 2.5 29.6 42.0 7.0 29.3 29.2 72 13 62 62 1200 828 828 867 28 ---
18 2.7 31.1 60.2 11.7 25.2 30.0 100 18 75 80 1213 710 674 584 52 27.0
19 2.7 30.1 65.6 14.3 23.1 33.4 140 18 71 79 995 563 538 561 44 ---
20 2.7 30.8 48.9 12.8 21.3 27.7 140 18 83 83 1064 542 471 490 54 ---
21 2.8 20.8 60.3 35.5 13.9 50.0 190 18 93 76 1000 501 312 324 68 36.5
22 2.9 17.6 42.0 47.7 11.0 53.4 120 18 120 79 1382 797 605 474 66 12.6
23 2.6 17.7 32.7 55.7 12.2 69.2 120 18 150 96 1313 858 700 750 43 ---
24b 2.6 16.1 91.0 46.0 6.6 30.8 100 114 0 86 1326 812 576 557 58 13.3
25b 2.6 23.5 56.1 18.3 20.2 37.6 100 149 0 78 1356 696 562 547 60 23.5 aExperiment number; bAcidification with only H2SO4;
cISRS-Iron Sludge Recycle Study; dpHm, Tm and Fem corresponds to average pH values, average temperature and average dissolved
iron observed during the photo-Fenton experiment; ePercentage of consumed acid needed to neutralize the alkalinity (CaCO3,IC/[100.08([H2SO4]+[HCl]/2)], %); fDOC After Acidification;
gDOC Before Neutralization; hPhoto-Fenton mineralization (1-DOCf/DOCi, %); iRatio between H2O2 consumed and oxidized DOC (H2O2/(DOCAA-DOCf) x 34.02).

Chapter 3
97
Lower alkalinity values significantly reduce acid consumption during the acidification process (Table
3.2 and Table 3.3). The percentage of consumed acid necessary to neutralize the alkalinity ranged
between 55% and 96% of the total acid consumption. Different studies reported that the optimum pH
for the photo-Fenton reaction is 2.8 not only because it avoids iron precipitation, but also because the
predominant iron species in solution (T = 25 ºC; ionic strength (IS) = 0.5 M) are FeOH2+ (48.0%),
Fe3+ (46.9%) and Fe(OH)2+ (5.0%) [41-45], being FeOH2+ the most photoactive ferric-water complex
[36, 46]. However, considering sulphate and chloride contents after acidification and iron addition, the
iron (III) speciation diagram (Figure 3.2a) shows that at pH 2.8, the predominant iron species in solution
are FeSO4+ (69.6%), Fe(SO4)2
- (23.7%), FeOH2+ (2.6%), Fe3+ (2.6%) and FeCl+ (7%) ([SO4
2-] = 2 g/L;
[Cl-] = 4 g/L; IS = 0.5 M; T = 25 ºC) [41-45], leading to the formation of SO4•-, OH• and Cl• radicals,
respectively, according to Eqs. (2.1)–(3.3) [47]:
4
2
4 SOFehυFeSO (3.1)
OHFehυFeOH 22 (3.2)
ClFehυFeCl 2
2 (3.3)
According to the speciation diagram, FeOH2+ species present the maximum molar fraction (19.5%) at
pH 4.1. Since the oxidant power of hydroxyl radicals is higher than sulphate and chloride radicals, an
increment of the oxidation rate could be achieved by increasing the pH up to 4.1. Nevertheless, according
to ferric ions solubility diagram (data not showed) for pH 4.1 only 0.2 mg Fe3+/L are still soluble. The
removal of the leachate’s alkalinity prior to the photo-Fenton reaction would be a major aspect in order
to reduce the amount of acid necessary and, consequently, the amount of sulphate and chloride ions,
which decrease the reaction rates.
Figure 3.3 shows the solar photo-Fenton results for experiments 5 and 6, using different doses of H2O2.
After acidification in the photo-Fenton process, it could be observed a DOC abatement of 54–58%. In
previous papers, this DOC abatement was either attributed to the formation of foam, which could retain
large amounts of DOC, or to the mineralization of the most oxidized organic compounds [22, 23].
However, these two factors could only be responsible for a small fraction of the DOC abatement, since
the majority was due to the precipitation of humic acids. For the sanitary landfill leachate with an initial
DOC of 1707 mg C/L after lagooning, 59% of the organic carbon content was attributed to humic
substances (1008 mg CHS/L; HS – humic acids + fulvic acids). After acidification, the DOC abatement
was approximately 27% (DOC = 1239 mg C/L), which corresponded to a reduction of the humic
substances of approximately 33% (671 mg CHS/L; HS/DOC = 54%). This indicated that the precipitation
of humic acids (33% of the humic substances), corresponded to approximately 72% of the DOC
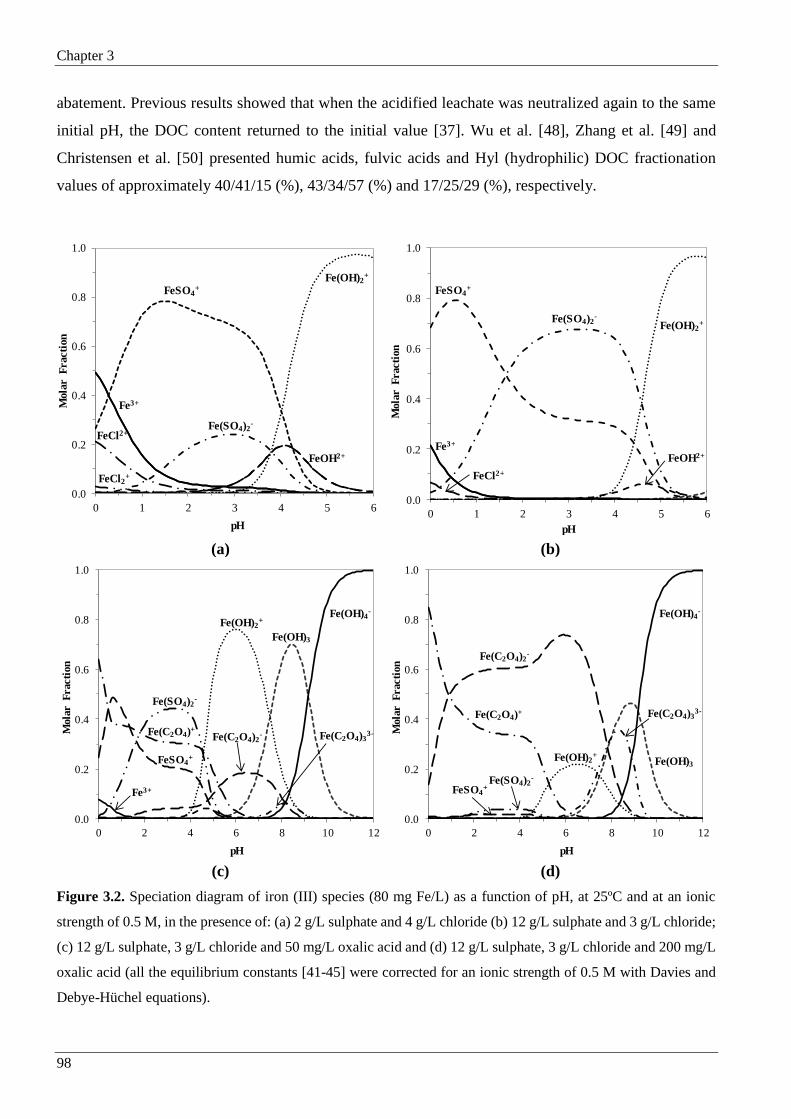
Chapter 3
98
abatement. Previous results showed that when the acidified leachate was neutralized again to the same
initial pH, the DOC content returned to the initial value [37]. Wu et al. [48], Zhang et al. [49] and
Christensen et al. [50] presented humic acids, fulvic acids and Hyl (hydrophilic) DOC fractionation
values of approximately 40/41/15 (%), 43/34/57 (%) and 17/25/29 (%), respectively.
0.0
0.2
0.4
0.6
0.8
1.0
0 1 2 3 4 5 6
Mola
r F
racti
on
pH
FeOH2+
Fe3+
Fe(OH)2+
Fe(SO4)2-
FeSO4+
FeCl2+
FeCl2+
0.0
0.2
0.4
0.6
0.8
1.0
0 1 2 3 4 5 6
Mola
r F
racti
on
pH
FeOH2+Fe3+
Fe(OH)2+Fe(SO4)2
-
FeSO4+
FeCl2+
(a) (b)
0.0
0.2
0.4
0.6
0.8
1.0
0 2 4 6 8 10 12
Mola
r F
racti
on
pH
Fe(OH)3
Fe(OH)4-
Fe(C2O4)33-Fe(C2O4)2
-Fe(C2O4)+
FeSO4+
Fe(SO4)2-
Fe(OH)2+
Fe3+
0.0
0.2
0.4
0.6
0.8
1.0
0 2 4 6 8 10 12
Mola
r F
racti
on
pH
Fe(OH)3
Fe(OH)4-
Fe(C2O4)33-
Fe(C2O4)2-
Fe(C2O4)+
FeSO4+
Fe(SO4)2-
Fe(OH)2+
(c) (d)
Figure 3.2. Speciation diagram of iron (III) species (80 mg Fe/L) as a function of pH, at 25ºC and at an ionic
strength of 0.5 M, in the presence of: (a) 2 g/L sulphate and 4 g/L chloride (b) 12 g/L sulphate and 3 g/L chloride;
(c) 12 g/L sulphate, 3 g/L chloride and 50 mg/L oxalic acid and (d) 12 g/L sulphate, 3 g/L chloride and 200 mg/L
oxalic acid (all the equilibrium constants [41-45] were corrected for an ionic strength of 0.5 M with Davies and
Debye-Hüchel equations).

Chapter 3
99
0 5 10 15 20 25 30 35
0
100
200
300
400
500
1000
1200
QUV
(kJUV
/L)
DO
C (
mg/L
)
RAD-ON
0
50
100
150
200
250
H2O
2 c
on
sum
ed
(m
M)
0
10
20
30
40
50
60
70
80
90
TD
I (m
g/L
)
Figure 3.3. DOC (,), H2O2 consumption (,) and TDI concentration (,) evolution as a
function of the accumulated UV energy per liter of leachate during the photo-Fenton process
(pH = 2.8; [Fe2+] = 80 mg/L). Solid symbols: Experiment 5; Open symbols: Experiment 6.
The acid sludge resulting from the acidification reaction had a concentration of 130 mg CHS per gram of
sludge, corresponding to the production of 2.7 kg of sludge-HS per cubic meter of leachate. However,
the total amount of sludge produced after acidification was greatly dependent on the initial concentration
of TSS. In a previous work [37] it was also concluded that the dissolved organic matter reduction related
to the preliminary acidification stage was not depend on the type of acid used or the temperature, and
lead to a threefold increase of TSS, indicating the significant contribution of the initial leachate TSS for
TSS after acidification.
The photo-Fenton reaction kinetic profile showed an initial induction time of 10–15 kJUV/L (Figure 3.3),
after the acidification step, consuming 80–100 mM of H2O2 (experiments 4–7), due to: (i) the partial
oxidation of more complex organic compounds into simpler ones; (ii) the dissolution of DOC retained
in the foam (the foam disappeared during this initial stage of the photo-Fenton reaction); (iii) the
suspended solids and intense dark-brown colour of the leachate (competitors with H2O2 and iron species
as photon absorbents); and also to (iv) the consumption of hydroxyl and other radicals for the partial
degradation of humic acids and other organic compounds initially precipitated (constituting the
particulate organic matter). After this induction period, the DOC profile followed a pseudo-first-order
reaction kinetic.

Chapter 3
100
3.3.2.2 Influence of sludge removal after acidification
In order to assess the influence of the sludge produced after acidification in the photo-Fenton reaction,
two experiments were carried out, with (experiment 23) and without (experiment 22) mechanical stirring
inside the recirculation tank (in the second case to avoid the recirculation of the settled sludge into the
CPCs, since the recirculation pump was located above the conic part of the tank). Figure 3.4 shows that
for the same total H2O2 consumption (120 mM), at the same average temperature and solar UV power,
the mineralization efficiency was higher for the experiment without mechanical stirring. In the
experiment with mechanical stirring, it could be observed a high increase of DOC in the initial part of
the reaction, related to the dissolution of the organic matter present in the particulate phase. This
dissolution was due to the attack of reactive oxygen species to organic compounds present in the
particulate phase, leading to more soluble organic compounds.
Figure 3.4. Effect of the suspended solids recirculation on the photo-Fenton reaction.
(,) - DOC, (,) - H2O2 consumed; (,) - TDI; (,) – temperature. Solid symbols:
Experiment 22 (without stirring); Open symbols: Experiment 23 (with stirring).
0 10 20 30 40 50 60 700
10
20
30
T (ºC
)
QUV
(kJUV
/L)
600
700
800
900
1300
1400
DO
C (
mg/L
)
RAD-ON
0
20
40
60
80
100
120
140
H2O
2 c
on
sum
ed (
mM
)
0
10
20
30
40
50
TD
I (m
g/L
)

Chapter 3
101
According to these results, it was concluded that the non-elimination of the sludge produced after
acidification, decreased the efficiency of the photo-Fenton reaction. The presence of suspended solids
also decreases light penetration, competing with H2O2 and iron species as photon absorbers, leading to
higher reaction times and energy consumption. Moreover, higher energy and H2O2 doses were necessary
to achieve the same mineralization degree of the organic matter due to the degradation of the particulate
organic matter.
To support these conclusions, in experiment 24, after acidification and a sedimentation period of 24-h,
the supernatant was pumped from the recirculation tank to another one and back again to the first, after
cleaning, and finally, iron and H2O2 were added. Taking into account DOC after acidification (beginning
of the photo-Fenton reaction), 23.4, 13.3 and 23.5 mg H2O2 were consumed per milligram of oxidized
DOC, for experiments 9 (without sludge removal), 24 (with sludge removal) and 25 (without sludge
removal), respectively. The initial TSS concentration in the leachate after lagooning was 121, 530 and
187 mg/L for the same experiments. Considering that after acidification, TSS concentration increases
substantially, it was once again possible to conclude that the presence of particulate organic matter
increases H2O2 and energy consumption.
In experiments 24 and 25, acidification was performed only with sulphuric acid, and due to the leachate
high alkalinity, higher amounts of acid were required (78–86% of added acid was necessary to eliminate
the leachate’s alkalinity), resulting in high sulphate concentrations. The presence of a high sulphate
concentration did not seem to affect the photo-Fenton efficiency (comparing experiments 6 and 7 with
24 and 25), although in this case the iron hydroxide species fraction was insignificant. During the
photo-Fenton reaction, a considerable amount of low-molecular-weight carboxylic acids was formed
(> 60mg C/L, according to the analysed carboxylic acids) (data not shown), such as oxalic, formic,
pyruvic and malonic acids, further supported by pH decrease to values close to 2.4. These carboxylate
anions form stable complexes with ferric ions [51].
Taking into consideration the presence of sulphate (12 g SO42-/L), chloride (3 g Cl-/L) and iron
(80 mg Fe/L), the main ferric iron species are (pH = 2.8; IS = 0.5 M; T = 25 ºC) [41-45]:
Fe(SO4)2- = 66.8% and FeSO4
+ = 32.7% (Figure 3.2b). However, considering an oxalic acid
concentration of 50 mg/L (13.3 mg C/L), the main ferric iron complexes are: Fe(C2O4)2- = 3.9%;
FeC2O4+ = 30.9%; Fe(SO4)2
- = 43.6% and FeSO4+ = 21.3% (Figure 3.2c). On the other hand, for an
oxalic acid concentration of 200 mg/L, corresponding to 53.3 mg C/L, the main ferric iron complexes
are: Fe(C2O4)2- = 60.1%; FeC2O4
+ = 34.5%; Fe(SO4)2- = 3.5% and FeSO4
+ = 1.4% (Figure 3.2d). The
presence of low-molecular-weight carboxylate anions and the formation of ferricarboxylate complexes
could explain the high efficiency of the photo-Fenton reaction, even in the presence of high sulphate and
chloride concentrations.

Chapter 3
102
This aspect can be attributed to five key aspects: (i) have much higher quantum yields than ferric-water
complexes, ferric sulphate and chloride complexes [51, 52]; (ii) can use a higher fraction of the solar
radiation spectrum, up to 580 nm; (iii) are more soluble; (iv) are photodecarboxylated under visible
radiation; (v) provide a quicker pathway for Fe3+ regeneration, thereby accelerating the process [46, 51,
52], according to Eq. (3.4) (taking oxalic acid as example):
2
-2
42
22n-3
n42
III 2COOC1n2Fe2hυOC2Fe (3.4)
3.3.2.3 Influence of temperature/average solar power
Considering that in spring and summer, the insolation and solar radiation power are higher than in
autumn and winter, which is correlated with the leachate temperature, it is important to assess the
photo-Fenton efficiency in both situations. Experiment 5 was performed in July (summer), with an
average solar UV power of approximately 23.3 W/m2 and an average temperature of 37.0 ºC. On the
other hand, experiment 21 was performed in November (autumn), with an average solar UV power of
13.9 W/m2 and average temperature of 20.8 ºC. Figure 3.5 shows that a higher solar radiation power,
associated to higher temperatures, increased the photo-Fenton reaction rate more than three times,
mainly due to two different factors: (i) production of more hydroxyl radicals by Fenton thermal reactions
involved in ferric ion reduction, particularly through the equations (3.5) - (3.7) [46]; and (ii) increasing
of the molar fraction of FeOH2+, which is the most photoactive iron-water complex [53].
HHOFeOHFe 2
2
22
3 (3.5)
HOFeHOFe 2
2
2
3 (3.6)
2
2
2
3 OFeOFe (3.7)
Zhang et al. [54] also reported an increase of Fenton reaction rates with temperature, for a leachate with
an initial COD of 3000 mg/L. The COD removal efficiency increased from 24.8% to 32.6% as
temperature increased from 15 to 36 ºC. This effect was also observed for the photo-Fenton degradation
of a mixture of commercial pesticides, where the treatment efficiency rose until 42 ºC, which could be
explained by a faster reduction of Fe3+ to Fe2+, making Fe2+ available to generate hydroxyl radicals.
However, for higher temperatures, the degradation efficiency decreased significantly, due to iron
precipitation [55], since its solubility is temperature dependent [56]. Pérez-Moya et al. [57] observed the
same behaviour and established a direct relation between of the rise of hydrogen peroxide decomposition
rate and temperature, despite this fact was not observed by Zapata el al. [55].

Chapter 3
103
Figure 3.5. Effect of leachate temperature on the photo-Fenton reaction. (,) -
DOC, (,) - H2O2 consumed; (,) - TDI; (,) – temperature. Solid symbols:
Experiment 5 (Tm = 37ºC); Open symbols: Experiment 21 (Tm = 21ºC).
3.3.2.4 Iron sludge recycling
Two sets of experiments (9–11 and 13–17) were performed to evaluate the possibility of iron sludge
recycling for consecutive photo-oxidation cycles, using different leachate samples. After
phototreatment, the leachate was neutralized to pH 7, leading to iron precipitation in a small extent,
followed by iron sludge settling during 3-h. The supernatant was pumped to the biological reactor and a
new leachate sample was fed to the recirculation tank. In experiment 9, 80 ppm of iron was added, while
in experiment 10 only the iron sludge resulting from experiment 9 was used, and in experiment 11, 57
mg/L of iron was added; the same iron amount that was lost in the last experiment, resulting in a
dissolved iron concentration of 80 mg/L. For experiments 13–17, after each cycle, the amount of iron
lost during the previous treatment was always supplied (65, 50, 50 and 42 mg Fe2+/L, respectively for
experiments 14, 15, 16 and 17), in order to maintain the same dissolved iron concentration.
0 10 20 30 40 500
10
20
30
40
T (
ºC)
QUV
(kJUV
/L)
0
100
200
300
400
500
1000
1200
DO
C (
mg/L
)
RAD-ON
0
20
40
60
80
100
120
140
160
180
200
220
H2O
2 c
on
sum
ed (
mM
)
0
10
20
30
40
50
60
70
80
TD
I (m
g/L
)
2 4 6 8 10

Chapter 3
104
According to Table 3.3, the mineralization efficiency decreased for successive cycles, associated with
the increase of TSS (Figure 3.6), which drastically influenced the photo-Fenton efficiency, as reported
above. Another relevant point related to the fact that even for a pH near 7, iron precipitation was minimal
(Table 3.4). At the end of the photo-Fenton reaction, ferrous ion was the predominant species, since
H2O2 was totally consumed. According to the solubility diagrams of ferric and ferrous ions (data not
shown) and considering the average concentration of total sulphate (2 g/L), total chloride (4 g/L) and
total iron (50 mg/L) species (IS = 0.5 M; T = 25 ºC) [41-45], the precipitation of ferrous and ferric ions
should start at pH 8.5 and 3.2, respectively. For experiments 20, 21 and 22, a higher precipitation
occurred, which could be attributed to the residual H2O2 concentration observed, and the main iron
species were ferric ions, which obviously precipitated at neutral pH.
9 10 11
0
100
200
300
400
500
600
700
TS
S (
mg/L
)
Experiment Number
121
365
598
13 14 15 16 17
0
200
400
600
800
1000
1200
1400
1600
1800T
SS
(m
g/L
)
Experiment Number
125
206
619
1300
1675
Figure 3.6. Evaluation of the possible iron sludge recycling in the photo-Fenton process.
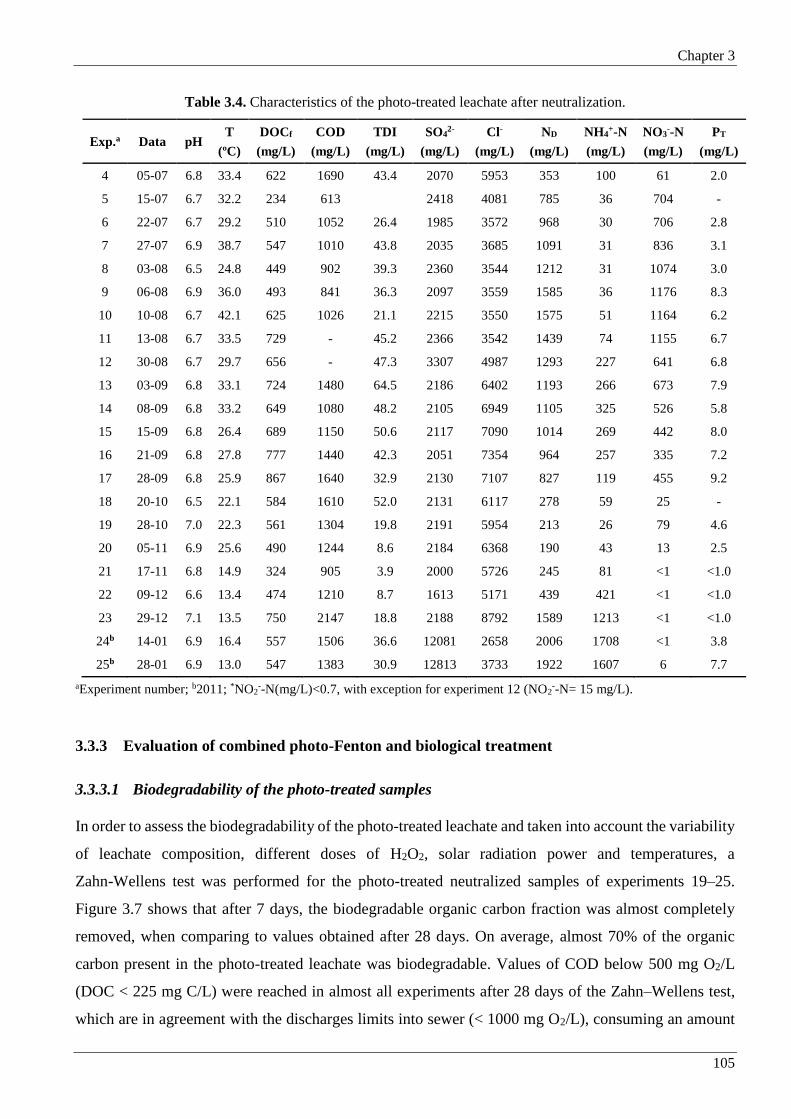
Chapter 3
105
Table 3.4. Characteristics of the photo-treated leachate after neutralization.
Exp.a Data pH T
(ºC)
DOCf
(mg/L)
COD
(mg/L)
TDI
(mg/L)
SO42-
(mg/L)
Cl-
(mg/L)
ND
(mg/L)
NH4+-N
(mg/L)
NO3--N
(mg/L)
PT
(mg/L)
4 05-07 6.8 33.4 622 1690 43.4 2070 5953 353 100 61 2.0
5 15-07 6.7 32.2 234 613 2418 4081 785 36 704 -
6 22-07 6.7 29.2 510 1052 26.4 1985 3572 968 30 706 2.8
7 27-07 6.9 38.7 547 1010 43.8 2035 3685 1091 31 836 3.1
8 03-08 6.5 24.8 449 902 39.3 2360 3544 1212 31 1074 3.0
9 06-08 6.9 36.0 493 841 36.3 2097 3559 1585 36 1176 8.3
10 10-08 6.7 42.1 625 1026 21.1 2215 3550 1575 51 1164 6.2
11 13-08 6.7 33.5 729 - 45.2 2366 3542 1439 74 1155 6.7
12 30-08 6.7 29.7 656 - 47.3 3307 4987 1293 227 641 6.8
13 03-09 6.8 33.1 724 1480 64.5 2186 6402 1193 266 673 7.9
14 08-09 6.8 33.2 649 1080 48.2 2105 6949 1105 325 526 5.8
15 15-09 6.8 26.4 689 1150 50.6 2117 7090 1014 269 442 8.0
16 21-09 6.8 27.8 777 1440 42.3 2051 7354 964 257 335 7.2
17 28-09 6.8 25.9 867 1640 32.9 2130 7107 827 119 455 9.2
18 20-10 6.5 22.1 584 1610 52.0 2131 6117 278 59 25 -
19 28-10 7.0 22.3 561 1304 19.8 2191 5954 213 26 79 4.6
20 05-11 6.9 25.6 490 1244 8.6 2184 6368 190 43 13 2.5
21 17-11 6.8 14.9 324 905 3.9 2000 5726 245 81 <1 <1.0
22 09-12 6.6 13.4 474 1210 8.7 1613 5171 439 421 <1 <1.0
23 29-12 7.1 13.5 750 2147 18.8 2188 8792 1589 1213 <1 <1.0
24b 14-01 6.9 16.4 557 1506 36.6 12081 2658 2006 1708 <1 3.8
25b 28-01 6.9 13.0 547 1383 30.9 12813 3733 1922 1607 6 7.7
aExperiment number; b2011; *NO2--N(mg/L)<0.7, with exception for experiment 12 (NO2
--N= 15 mg/L).
3.3.3 Evaluation of combined photo-Fenton and biological treatment
3.3.3.1 Biodegradability of the photo-treated samples
In order to assess the biodegradability of the photo-treated leachate and taken into account the variability
of leachate composition, different doses of H2O2, solar radiation power and temperatures, a
Zahn-Wellens test was performed for the photo-treated neutralized samples of experiments 19–25.
Figure 3.7 shows that after 7 days, the biodegradable organic carbon fraction was almost completely
removed, when comparing to values obtained after 28 days. On average, almost 70% of the organic
carbon present in the photo-treated leachate was biodegradable. Values of COD below 500 mg O2/L
(DOC < 225 mg C/L) were reached in almost all experiments after 28 days of the Zahn–Wellens test,
which are in agreement with the discharges limits into sewer (< 1000 mg O2/L), consuming an amount
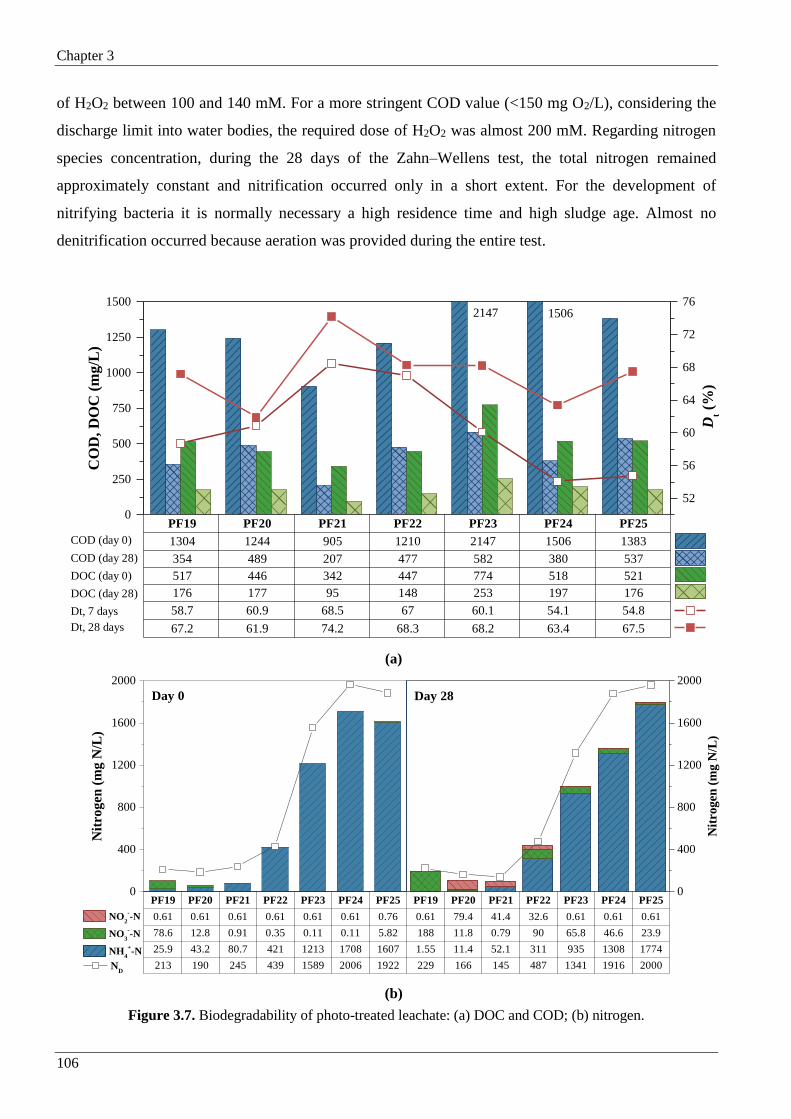
Chapter 3
106
of H2O2 between 100 and 140 mM. For a more stringent COD value (<150 mg O2/L), considering the
discharge limit into water bodies, the required dose of H2O2 was almost 200 mM. Regarding nitrogen
species concentration, during the 28 days of the Zahn–Wellens test, the total nitrogen remained
approximately constant and nitrification occurred only in a short extent. For the development of
nitrifying bacteria it is normally necessary a high residence time and high sludge age. Almost no
denitrification occurred because aeration was provided during the entire test.
0
250
500
750
1000
1250
1500
CO
D, D
OC
(m
g/L
)
52
56
60
64
68
72
761506
Dt (
%)
PF19 PF20 PF21 PF22 PF23 PF24 PF25
1304 1244 905 1210 2147 1506 1383
354 489 207 477 582 380 537
517 446 342 447 774 518 521
176 177 95 148 253 197 176
58.7 60.9 68.5 67 60.1 54.1 54.8
67.2 61.9 74.2 68.3 68.2 63.4 67.5
COD (day 0)
COD (day 28)
DOC (day 0)
DOC (day 28)
Dt, 7 days
Dt, 28 days
2147
(a)
(b)
Figure 3.7. Biodegradability of photo-treated leachate: (a) DOC and COD; (b) nitrogen.
0
400
800
1200
1600
2000
Day 28
Nit
rog
en (
mg
N/L
)
Day 0
0
400
800
1200
1600
2000
Nit
rog
en (
mg
N/L
)
NO2
--N
NO3
--N
NH4
+-N
ND
PF19 PF20 PF21 PF22 PF23 PF24 PF25 PF19 PF20 PF21 PF22 PF23 PF24 PF25
0.61 0.61 0.61 0.61 0.61 0.61 0.76 0.61 79.4 41.4 32.6 0.61 0.61 0.61
78.6 12.8 0.91 0.35 0.11 0.11 5.82 188 11.8 0.79 90 65.8 46.6 23.9
25.9 43.2 80.7 421 1213 1708 1607 1.55 11.4 52.1 311 935 1308 1774
213 190 245 439 1589 2006 1922 229 166 145 487 1341 1916 2000

Chapter 3
107
3.3.3.2 Evaluation of biological nitrification and denitrification
Table 3.5 shows the characteristics of the photo-bio-treated leachate for experiments 18–25. During
these experiments, the biological reactor presented average values of TSS, VSS, VSS/TSS ratio,
SSV30-min, SVI and F/M ratio of 2.6 g/L, 1.5 g/L, 58%, 217 mL/L, 85 mL/g and 0.54 g COD/g VSS/day
(Table 3.6). Typical values for the BOD F/M ratio reported in the literature vary from 0.04 g substrate/g
biomass/day for extended aeration processes to 1.0 g/g/day for high rate processes [58]. Normally, values
of SVI below 100 mL/g show a good settling sludge [58].
Table 3.5. Characteristics of the photo-bio-treated leachate.
Parameter Experiment
ELVa 18 19 20 21 22 23 24 25
Data 28-out 05-nov 22-nov 09-dez 29-dez 14-01b 28-01b 11-03b
pH 7.4 7.8 8.1 7.9 6.5 6.5 6.5 7.9 6-9
T (ºC) 18.2 19.6 12.9 14.5 12 13.3 10 15.7 -
TSS (mg/L) 216 200 400 181 270 293 155 54 60
DIC (mg/L) 49
(109)
50
(43)
71
(80)
53
(32)
3.7
(6.5) 0
39
(41)
19
(32) -
DOC (mg/L) 112
(248)
104
(90)
112
(126)
92
(56)
157
(274)
198
(271)
203
(212)
95.3
(160) -
COD (mg/L) 584
(621)
530
(224)
624
(316)
286
(174)
287
(501)
405
(556)
344
(359)
300
(504) 150
BOD5 (mg/L) 143 55 60 135 21 12 - - 40
TDI (mg/L) 1.2
(3.5)
2.0
(4.9)
2.3
(4.5)
1.9
(2.7)
2.9
(5.7)
3.4
(7.6)
6.4
(15.4)
9.9
(20.1) -
SO42- (mg/L)
911
(2142)
1313
(2103)
1622
(2181)
1704
(1940)
1844
(1779)
1794
(1996)
5427
(11991)
6885
(10939) 2000
Cl- (mg/L) 2494
(5909)
3700
(5907)
4110
(5625)
4615
(5638)
5441
(5845)
5983
(7925)
4481
(2484)
2461
(2180) -
ND (mg/L) 89
(207)
83
(132)
19
(30)
44
(108)
224
(531)
611
(1365)
1032
(1866)
1152
(1640) 15
NH4+-N (mg/L)
6
(15)
<2
(3)
<2
(4)
<2
(4)
86
(240)
438
(1086)
874
(1674)
623
(881) 7.8
NO3--N (mg/L)
68
(60)
74
(81) 6 (2) <1
32
(56)
24
(<1)
8
(<1) <1 11
NO2--N (mg/L) <1 <1 <1 2
25
(<1)
40
(<1)
34
(<1)
169
(6) -
PT (mg/L) 11.6
(-)
5.9
(3.0)
4.9
(2.6)
4.1
(<1)
5.3
(<1)
5.5
(<1)
3.6
(2.9)
1.1
(1.6) 10
Color (Pt-Co units) 35 34 103 55 65 76 62 26 -
Turbidity (NTU) 84 59 370 161 191 254 144 43 -
aELV – Emission Limit Values ; b2011; *values in parenthesis refers to the concentration without the contribution of the last
biological treatment, considering that the remaining organic matter is recalcitrant.

Chapter 3
108
Table 3.6. Operating conditions in the biological reactor.
Experiment Data pH T
(ºC)
TSS
(mg/L)
VSS
(mg/L)
VSS/TSS
(%)
SSV30-mina
(mL/L)
SVIb
(mL/g)
F/M ratioc
(g COD/g
VSS/day)
18 28-10 7.5 17.6 2600 1430 55 180 69 0.64
19 05-11 7.6 17.1 2937 1600 54 180 61 0.47
20 22-11 7.6 15.5 2720 1540 57 190 70 0.46
21 09-12 7.8 11.2 2640 1440 55 190 72 0.36
22 29-12 7.0 10.5 2400 1495 62 235 98 0.46
23 14-
01d 6.5 13.6 2240 1388 62 220 98 0.88
24 28-
01d 6.7 10.7 2275 1420 62 210 92 0.61
25 11-
03d 6.8 13.4 2695 1510 56 330 122 0.52
aSS30 – Settled Sludge Volume after 30 minutes; bSVI – Sludge Volume Index; cF/M – food to microorganism (biomass) ratio.
If denitrification is to be considered after a nitrification process, partial nitrification to nitrite implies
25% less oxygen demand compared to complete nitrification. This shortcut of the nitrate would mean a
reduction in the total carbon source required for denitrification, since carbon is needed for conversion
of nitrate to nitrite, which can yield up to 40% savings in methanol consumption [23]. Alleman [59]
showed that the optimal pH values were between 7.9 and 8.2 for nitrification and between 7.2 and 7.6
for denitrification. Ruiz et al. [35] studied the nitrification of synthetic wastewater with high ammonia
concentration (10 g NH4+-N/L) at a temperature of 30 ºC, and concluded that for pH values lower than
6.45 and higher than 8.95 complete inhibition of nitrification took place. Setting a DO concentration in
the reactor of 0.7 mg/L, it was possible to accumulate more than 65% of the loaded ammonia nitrogen
as nitrite, with a 98% ammonia conversion, representing a reduction of 20% in oxygen consumption.
For DO concentration below than 0.5 mg/L, ammonia was accumulated, and over a DO of 1.7 mg/L,
complete nitrification to nitrate was achieved.
Figure 3.8 summarizes the results obtained for leachate treatment combining chemical (solar
photo-Fenton) and biological processes, for experiments 20 and 21. The global DOC removal efficiency
of the combined system was approximately 90%, corresponding to 54% (140 mM H2O2 consumed) and
68% (190 mM H2O2 consumed) for the chemical oxidation and 34% and 27% for the biological
oxidation, respectively for experiments 20 and 21. Considering experiments 18–25, the average DOC
removal efficiency for the integrated system was 55% and 31%, respectively for the photo and biological
oxidation (Figure 3.9). Figure 3.8 also shows the evolution of the nitrogen species during the biological
treatment, enabling 90% and 56% of total nitrogen removal, respectively for experiments 20 and 21.

Chapter 3
109
Dissolved oxygen concentration and points of methanol addition, as external carbon source, for the
denitrification reaction are also presented in Figure 3.8. In experiment 21, methanol was added with the
only purpose of verifying if the biological sludge was active. It was noted that, in some cases,
nitrification and denitrification processes occurred simultaneous, which was attributed to some problems
in the air compressor, leading to non-aerated zones inside the biological reactor.
0 2 4 6 8 10 12
0
100
200
300
400
500
600
700
800
900
1000
1100
RAD-ON
Biological ReactorPhoto-Fenton
DO
C (
mg
C/L
)
Ilumination Time (hours)
50 100 150 200 250 300 350 400
a
a - addition of methanol
Biological Treatment Time (hours)
a
0
20
40
60
80
100
120
140
H2O
2co
nsu
med
(m
M)
0
20
40
60
80
100
120
140
160
180
200
Nit
rog
en C
on
ten
t (m
g N
/L)
0
5
10
15
20
25
30
QU
V (
kJ
UV/L
)
0
1
2
3
Dis
solv
ed O
xy
gen
(m
g/L
)
(a)
0 5 10 15 20 25 30 35
0
100
200
300
400
500
600
700
800
900
1000
1100
RAD-ON
Biological ReactorPhoto-Fenton
DO
C (
mg
C/L
)
Ilumination Time (hours)
50 100 150 200 250 300 350 400 450
a - addition of methanol
Biological Treatment Time (hours)
aa
0
20
40
60
80
100
120
140
160
180
200
H2O
2co
nsu
med
(m
M)
0
40
80
120
160
200
240
280
Nit
rog
en C
on
ten
t (m
g N
/L)
0
10
20
30
40
50
60
QU
V (
kJ
UV/L
)
0
1
2
3
Dis
solv
ed O
xy
gen
(m
g/L
)
(b)
Figure 3.8. Leachate mineralization by the combined system: photo-Fenton (DOC, H2O2 consumed and QUV in
function of the illumination time); biological nitrification/denitrification (DOC and nitrogen species as function
of time). (a) Experiment 20; (b) Experiment 21. - DOC; - H2O2 consumed; - QUV; - Total Nitrogen;
- Ammonium (NH4+-N); - Nitrate (NO3
--N); - Nitrite (NO2--N); - Dissolved Oxygen.

Chapter 3
110
18 19 20 21 22 23 24 25
0
10
20
30
40
50
60
70
80
90
100
DO
C R
emoval
(%)
Experiment
Photo-Fenton Biological Treatment
0
250
500
750
1000
1250
1500
DO
C (
mg/L
)
Figure 3.9. DOC concentration and DOC removal percentage obtained for the photo-Fenton and biological
processes, experiments 18 to 25. - Initial DOC (leachate after lagooning); - DOC after the Photo-Fenton
reaction; - DOC after the biological oxidation process.
The obtained nitrification rates were 0.06, 0.05, 0.16, 0.14, 0.03 and 0.49 mg NH4+-N per hour and g
VSS (volatile suspended solids), respectively for experiments 20–25. The maximum denitrification rate
was 0.27 mg (NO2--N + NO3
--N) per hour and g VSS with a C/N ratio of 6.4 mg CH3OH per mg
(NO2--N + NO3
--N). The high treatment times needed for the nitrification and denitrification reactions,
taking into consideration the low nitrification and denitrification rates, were associated with the low
temperatures (6.9–15.5 ºC) observed between November 2010 and January 2011. Ilies et al. [34] showed
that nitrification and denitrification processes suffered major inhibitions when temperature decreased
from 20 to 10 ºC. Isaka et al. [60] showed that using nitrifying bacteria entrapped in a gel carrier
increased the nitrification rates at low temperatures (0.71 kg N/m3/day at 10 ºC, DO > 7 mg/L, 7.5 < pH
< 8.0). Cassano et al. [15] further presented several integrated biological processes – AOPs for the
treatment of leachates from a medium-age sanitary landfill, characterized by DOC, COD and NH4+-N
in the ranges 0.9–1.2 g C/L, 2.8–3.6 g O2/L and 1.5–2 g NH4+-N/L, achieving 61%, 54% and 99%
removals, respectively, using a SBBGR (Sequential Batch Biofilter Granular Reactor). High biological
oxidation rates were achieved using a high sludge age (i.e., about 800 days), which led to a biomass
concentration as high as 46 g TSS/L (VSS/TSS: 0.7–0.8).
In the following chapters, other studies about leachates treatment using combined chemical and
biological oxidation processes at pre-industrial scale plant will be presented, regarding the identification
and quantification of recalcitrant organic compounds and degradation by-products, improvement of
nitrification and denitrification biological rates and minimization of operational costs.

Chapter 3
111
3.4 Conclusions
The leachate after lagooning pre-treatment showed a low biodegradability, mainly due to the presence
of a high concentration of humic substances, besides the high nitrogen load, mainly in the form of
ammonium. Considering the characteristics of the leachate after lagooning, a complete leachate
treatment strategy was proposed, combining: (i) a solar photo-Fenton system, as pre-oxidation process,
leading to an enhancement of the leachate’s biodegradability, higher than 70%, according to the
Zahn-Wellens test; with (ii) an activated sludge biological process, under aerobic and anoxic conditions,
allowing to oxidize the remaining biodegradable organic fraction and completely eliminate nitrogen
compounds, through ammonium nitrification into nitrates/nitrites and denitrification to nitrogen gas,
with the addition of an external carbon source. A pre-industrial plant, incorporating a solar photocatalytic
system with 39.52 m2 of CPCs and an activated sludge reactor with 3.5 m3 capacity, was constructed
and installed in a sanitary landfill in order to evaluate the treatment efficiency, under real circumstances
of leachate variability and weather conditions.
The leachate acidification to pH near 3.0 lead to 54–58% DOC abatement, mainly associated with humic
acids precipitation. The non-elimination of the acid sludge produced after acidification, decreased the
photo-Fenton reaction efficiency, which was due to the lower light transmission caused by the higher
amount of suspended solids that competed with H2O2 and iron species as photons absorbers. Therefore,
higher amounts of H2O2 and energy were necessary to degrade also the particulate organic matter. The
reutilization of iron sludge in consecutive oxidation treatments was not viable due to the increase of
suspended solids, leading to lower reaction rates. The leachate photo-oxidation was strongly affected by
weather conditions, mainly due to low leachate temperatures in the winter season, causing low reaction
rates, associated to the effects of the Fenton thermal reaction and molar fraction of ferric species. In
order to achieve COD target values below 500 mg O2/L and 150 mg O2/L (in agreement with the
discharge limit into water bodies) after the final biological oxidation, it was necessary, for the photo-
oxidation, a hydrogen peroxide concentration between 100–140 mM and almost 200 mM, respectively.
The great efficiency of the photo-Fenton reaction, even in the presence of high concentrations of sulphate
and chloride ions, was attributed to the formation of ferricarboxylate complexes.
Biological nitrification and denitrification reactions were strongly affected by the low temperatures
observed during the winter season. The global DOC removal efficiency of the combined system was
approximately 86%, corresponding to 55% for chemical oxidation and 31% for biological oxidation.
Chapter 3
112
3.5 References
[1] D. Kulikowska, E. Klimiuk, The effect of landfill age on municipal leachate composition, Bioresource
Technology, 99 (2008) 5981-5985.
[2] A.A. Tatsi, A.I. Zouboulis, A field investigation of the quantity and quality of leachate from a municipal solid
waste landfill in a Mediterranean climate (Thessaloniki, Greece), Advances in Environmental Research, 6
(2002) 207-219.
[3] H.-j. Fan, H.-Y. Shu, H.-S. Yang, W.-C. Chen, Characteristics of landfill leachates in central Taiwan, Science
of the Total Environment, 361 (2006) 25-37.
[4] S. Jonsson, J. Ejlertsson, B.H. Svensson, Behaviour of mono- and diesters of o-phthalic acid in leachates
released during digestion of municipal solid waste under landfill conditions, Advances in Environmental
Research, 7 (2003) 429-440.
[5] S.K. Marttinen, R.H. Kettunen, J.A. Rintala, Occurrence and removal of organic pollutants in sewages and
landfill leachates, The Science of The Total Environment, 301 (2003) 1-12.
[6] C.B. Öman, C. Junestedt, Chemical characterization of landfill leachates - 400 parameters and compounds,
Waste Management, 28 (2008) 1876-1891.
[7] T. Eggen, M. Moeder, A. Arukwe, Municipal landfill leachates: a significant source for new and emerging
pollutants, Science of the Total Environment, 408 (2010) 5147-5157.
[8] T.H. Christensen, P. Kjeldsen, P.L. Bjerg, D.L. Jensen, J.B. Christensen, A. Baun, H.-J. Albrechtsen, G.
Heron, Biogeochemistry of landfill leachate plumes, Applied Geochemistry, 16 (2001) 659-718.
[9] N. Calace, A. Liberatori, B.M. Petronio, M. Pietroletti, Characteristics of different molecular weight fractions
of organic matter in landfill leachate and their role in soil sorption of heavy metals, Environmental Pollution,
113 (2001) 331-339.
[10] E.S.K. Chian, F.B. DeWalle, Sanitary landfill leachates and their treatment, Journal of the Environmental
Engineering Division, (1976) 411-431.
[11] S. Renou, J.G. Givaudan, S. Poulain, F. Dirassouyan, P. Moulin, Landfill leachate treatment: Review and
opportunity, Journal of Hazardous Materials, 150 (2008) 468-493.
[12] D.L. Jensen, A. Ledin, T.H. Christensen, Speciation of heavy metals in landfill-leachate polluted
groundwater, Water Research, 33 (1999) 2642-2650.
[13] A.A. Abbas, G. Jingsong, L.Z. Ping, P.Y. Ya, W.S. Al-Rekabi, Review on Landfill Leachate Treatments,
American Journal of Applied Sciences, 6 (2009) 672-684.
[14] U.E. Agency, Guidance for the Treatment of Landfill Leachate, Sector Guidance Note IPPC S5.03, in:
I.P.P.a.C. (IPPC) (Ed.), 2007.
[15] D. Cassano, A. Zapata, G. Brunetti, G. Del Moro, C. Di Iaconi, I. Oller, S. Malato, G. Mascolo, Comparison
of several combined/integrated biological-AOPs setups for the treatment of municipal landfill leachate:
Minimization of operating costs and effluent toxicity, Chemical Engineering Journal, 172 (2011) 250-257.

Chapter 3
113
[16] S. Cortez, P. Teixeira, R. Oliveira, M. Mota, Evaluation of Fenton and ozone-based advanced oxidation
processes as mature landfill leachate pre-treatments, Journal of Environmental Management, 92 (2011) 749-
755.
[17] P.-J. He, Z. Zheng, H. Zhang, L.-M. Shao, Q.-Y. Tang, PAEs and BPA removal in landfill leachate with
Fenton process and its relationship with leachate DOM composition, Science of the Total Environment, 407
(2009) 4928-4933.
[18] D. Hermosilla, M. Cortijo, C.P. Huang, Optimizing the treatment of landfill leachate by conventional Fenton
and photo-Fenton processes, Science of the Total Environment, 407 (2009) 3473-3481.
[19] M. Umar, H.A. Aziz, M.S. Yusoff, Trends in the use of Fenton, electro-Fenton and photo-Fenton for the
treatment of landfill leachate, Waste Management, 30 (2010) 2113-2121.
[20] J.J. Wu, C.-C. Wu, H.-W. Ma, C.-C. Chang, Treatment of landfill leachate by ozone-based advanced
oxidation processes, Chemosphere, 54 (2004) 997-1003.
[21] I. Oller, S. Malato, J.A. Sánchez-Pérez, Combination of Advanced Oxidation Processes and biological
treatments for wastewater decontamination—A review, Sci. Total Environ., 409 (2011) 4141-4166.
[22] V.J.P. Vilar, S.M.S. Capelo, T.F.C.V. Silva, R.A.R. Boaventura, Solar photo-Fenton as a pre-oxidation step
for biological treatment of landfill leachate in a pilot plant with CPCs, Catalysis Today, 161 (2011) 228-234.
[23] V.J.P. Vilar, E.M.R. Rocha, F.S. Mota, A. Fonseca, I. Saraiva, R.A.R. Boaventura, Treatment of a sanitary
landfill leachate using combined solar photo-Fenton and biological immobilized biomass reactor at a pilot
scale, Water Research, 45 (2011) 2647-2658.
[24] V.J.P. Vilar, J.M.S. Moreira, A. Fonseca, I. Saraiva, R.A.R. Boaventura, Application of Fenton and Solar
Photo-Fenton Processes to the Treatment of a Sanitary Landfill Leachate in a Pilot Plant with CPCs, Journal
of Advanced Oxidation Technologies, 15 (2012) 107-116.
[25] M.S. Mehos, C.S. Turchi, Field testing solar photocatalytic detoxification on TCE-contaminated
groundwater, Environmental Progress, 12 (1993) 194-199.
[26] R. Dillert, A.E. Cassano, R. Goslich, D. Bahnemann, Large scale studies in solar catalytic wastewater
treatment, Catalysis Today, 54 (1999) 267-282.
[27] R. Dillert, S. Vollmer, M. Schober, J. Theurich, D. Bahnemann, H.J. Arntz, K. Pahlmann, J. Wienefeld, T.
Schmedding, G. Sager, Photocatalytic Treatment of an Industrial Wastewater in the Double-Skin Sheet
Reactor, Chemical Engineering & Technology, 22 (1999) 931-934.
[28] D. Bahnemann, Photocatalytic water treatment: solar energy applications, Solar Energy, 77 (2004) 445-459.
[29] L. Bousselmi, S.-U. Geissen, H. Schroeder, Textile wastewater treatment and reuse by solar catalysis: results
from a pilot plant in Tunisia, Water Science and Technology, 49 (2004) 331-337.
[30] A. Zapata, I. Oller, C. Sirtori, A. Rodríguez, J.A. Sánchez-Pérez, A. López, M. Mezcua, S. Malato,
Decontamination of industrial wastewater containing pesticides by combining large-scale homogeneous
solar photocatalysis and biological treatment, Chemical Engineering Journal, 160 (2010) 447-456.

Chapter 3
114
[31] I. Oller, S. Malato, J.A. Sánchez-Pérez, M.I. Maldonado, W. Gernjak, L.A. Pérez-Estrada, J.A. Muñoz, C.
Ramos, C. Pulgarín, Pre-industrial-scale Combined Solar Photo-Fenton and Immobilized Biomass
Activated-Sludge Biotreatment, Industrial & Engineering Chemistry Research, 46 (2007) 7467-7475.
[32] H. Yung-Tse, S.-G. Joanna, B. Michal, Treatment of Landfill Leachate, in: Hazardous Industrial Waste
Treatment, CRC Press, 2006, pp. 441-494.
[33] C. Gottschalk, J.A. Libra, A. Saupe, Ozonation of Water and Waste Water: A Practical Guide to
Understanding Ozone, Strauss GmbH, Mörlenbach, 2010.
[34] P. Ilies, D.S. Mavinic, The effect of decreased ambient temperature on the biological nitrification and
denitrification of a high ammonia landfill leachate, Water Research, 35 (2001) 2065-2072.
[35] G. Ruiz, D. Jeison, R. Chamy, Nitrification with high nitrite accumulation for the treatment of wastewater
with high ammonia concentration, Water Research, 37 (2003) 1371-1377.
[36] J.J. Pignatello, E. Oliveros, A. MacKay, Advanced oxidation processes for organic contaminant destruction
based on the fenton reaction and related chemistry, Critical Reviews in Environmental Science and
Technology, 36 (2006) 1-84.
[37] V.J.P. Vilar, T.F.C.V. Silva, M.A.N. Santos, A. Fonseca, I. Saraiva, R.A.R. Boaventura, Evaluation of solar
photo-Fenton parameters on the pre-oxidation of leachates from a sanitary landfill, Solar Energy, 86 (2012)
3301-3315.
[38] J. Bacardit, I. Oller, M.I. Maldonado, E. Chamarro, S. Malato, S. Esplugas, Simple Models for the Control
of Photo-Fenton by Monitoring H2O2, Journal of Advanced Oxidation Technologies, 10 (2007) 219-228.
[39] L. Prieto-Rodríguez, I. Oller, A. Zapata, A. Agüera, S. Malato, Hydrogen peroxide automatic dosing based
on dissolved oxygen concentration during solar photo-Fenton, Catalysis Today, 161 (2011) 247-254.
[40] C.N. Sawyer, P.L. McCarty, G.F. Parkin, Chemistry for Environmental Engineering and Science, fifth edition
ed., McGraw-Hill, New York, 2003.
[41] J. De Laat, T.G. Le, Effects of chloride ions on the iron (III)-catalyzed decomposition of hydrogen peroxide
and on the efficiency of the Fenton-like oxidation process, Applied Catalysis B: Environmental, 66 (2006)
137-146.
[42] G.L. Truong, J.D. Laat, B. Legube, Effects of chloride and sulfate on the rate of oxidation of ferrous ion by
H2O2, Water Research, 38 (2004) 2384-2394.
[43] J. Peñuela, J.D. Martínez, M.L. Araujo, F. Brito, G. Lubes, M. Rodríguez, V. Lubes, Speciation of the nickel
(II) complexes with oxalic and malonic acids studied in 1.0 mol dm− 3 NaCl at 25° C, Journal of Coordination
Chemistry, 64 (2011) 2698-2705.
[44] C. Sawyer, P. McCarty, G. Parkin, Chemistry for Environmental Engineering and Science, McGraw-Hill
Education, 2003.
[45] W. Stumm, J.J. Morgan, Aquatic Chemistry: Chemical Equilibria and Rates in Natural Waters, Wiley, 2013.
[46] S. Malato, P. Fernández-Ibáñez, M.I. Maldonado, J. Blanco, W. Gernjak, Decontamination and disinfection
of water by solar photocatalysis: Recent overview and trends, Catalysis Today, 147 (2009) 1-59.

Chapter 3
115
[47] A. Machulek Júnior, F.H. Quina, F. Gozzi, V.O. Silva, J.E.F. Moraes, Fundamental Mechanistic Studies of
the Photo-Fenton Reaction for the Degradation of Organic Pollutants, in: T. Puzyn, A. Mostrag-Szlichtyng
(Eds.) Organic Pollutants, Rijeka: InTech, 2011, pp. 1-22.
[48] Y. Wu, S. Zhou, F. Qin, H. Peng, Y. Lai, Y. Lin, Removal of humic substances from landfill leachate by
Fenton oxidation and coagulation, Process Safety and Environmental Protection, 88 (2010) 276-284.
[49] L. Zhang, A. Li, Y. Lu, L. Yan, S. Zhong, C. Deng, Characterization and removal of dissolved organic matter
(DOM) from landfill leachate rejected by nanofiltration, Waste Management, 29 (2009) 1035-1040.
[50] J.B. Christensen, D.L. Jensen, C. GRØN, Z. Filip, T.H. Christensen, Characterization of the dissolved organic
carbon in landfill leachate-polluted groundwater, Water Research, 32 (1998) 125-135.
[51] M.E. Balmer, B. Sulzberger, Atrazine degradation in irradiated iron/oxalate systems: effects of pH and
oxalate, Environmental Science & Technology, 33 (1999) 2418-2424.
[52] B.C. Faust, R.G. Zepp, Photochemistry of aqueous iron (III)-polycarboxylate complexes: roles in the
chemistry of atmospheric and surface waters, Environmental Science & Technology, 27 (1993) 2517-2522.
[53] F.C. Moreira, R.A.R. Boaventura, E. Brillas, V.J.P. Vilar, Degradation of trimethoprim antibiotic by UVA
photoelectro-Fenton process mediated by Fe(III)–carboxylate complexes, Applied Catalysis B:
Environmental, 162 (2015) 34-44.
[54] H. Zhang, H.J. Choi, C.-P. Huang, Optimization of Fenton process for the treatment of landfill leachate,
Journal of Hazardous Materials, 125 (2005) 166-174.
[55] A. Zapata, T. Velegraki, J. Sánchez-Pérez, D. Mantzavinos, M. Maldonado, S. Malato, Solar photo-Fenton
treatment of pesticides in water: Effect of iron concentration on degradation and assessment of ecotoxicity
and biodegradability, Applied Catalysis B: Environmental, 88 (2009) 448-454.
[56] H. Krýsová, J. Jirkovský, J. Krýsa, G. Mailhot, M. Bolte, Comparative kinetic study of atrazine
photodegradation in aqueous Fe(ClO4)3 solutions and TiO2 suspensions, Applied Catalysis B:
Environmental, 40 (2003) 1-12.
[57] M. Pérez-Moya, M. Graells, L.J. del Valle, E. Centelles, H.D. Mansilla, Fenton and photo-Fenton degradation
of 2-chlorophenol: Multivariate analysis and toxicity monitoring, Catalysis Today, 124 (2007) 163-171.
[58] Metcalf, Eddy, Wastewater Engineering Treatment and Reuse, 4th ed., Metcalf & Eddy, 2005.
[59] J.E. Alleman, Elevated nitrite occurrence in biological wastewater treatment systems, Water Science and
Technology, 17 (1984) 409-419.
[60] K. Isaka, S. Yoshie, T. Sumino, Y. Inamori, S. Tsuneda, Nitrification of landfill leachate using immobilized
nitrifying bacteria at low temperatures, Biochemical Engineering Journal, 37 (2007) 49-55.


4 Integration of solar photo-Fenton and biological
oxidation processes for leachate treatment at
pre-industrial scale - Biodegradability enhancement
assessment
An integrated leachate treatment strategy, combining a solar photo-Fenton reaction to enhance the
biodegradability of the leachate from an aerated lagoon, with an activated sludge process, under
aerobic and anoxic conditions, is proposed to achieve COD target values and nitrogen content
according to legislation. The efficiency and performance of the photo-Fenton reaction, concerning
sludge removal after acidification, defining the optimum phototreatment time to reach a
biodegradable wastewater that can be further oxidized in a biological reactor and, activated sludge
biological process, defining the nitrification and denitrification reaction rates, alkalinity balance
and methanol necessary as external carbon source, were evaluated in an integrated system at pre-
industrial scale. The plant is composed by a photocatalytic system with 39.52 m2 of compound
parabolic collectors (CPCs) and 2 m3 recirculation tank and an activated sludge biological reactor
with 3 m3 capacity.
Leachate biodegradability enhancement by means of a solar driven photo-Fenton process was
evaluated using direct biodegradability tests, as Zahn-Wellens method, and indirect measurements
as the average oxidation state (AOS), low-molecular-weight carboxylic acids content (fast
biodegradable character) and humic substances (recalcitrant character) concentration. Due to the
high variability of leachate composition, UV absorbance on-line measurement was established as
a useful parameter for photo-Fenton reaction control.
This chapter is based on the research article “Silva, T.F.C.V., Fonseca, A., Saraiva, I., Boaventura,
R.A.R, Vilar, V.J.P, Biodegradability enhancement of a leachate after biological lagooning using a
solar driven photo-Fenton reaction, and further combination with an activated sludge biological
process, at pre-industrial scale, Water Research, 47 (2013) 3543-3557,
DOI: 10.1016/j.watres.2013.04.008”.


Chapter 4
119
4.1 Introduction
Sanitary landfill leachates are characterized as a complex mixture of different recalcitrant organic and
inorganic contaminants, such as humic and fulvic acids [1], Polycyclic Aromatic Hydrocarbons (PAHs)
[2, 3], PolyBrominated Biphenyl Ethers (PBDEs) [4, 5], pesticides [6] and heavy metals [7, 8]. The
inability of conventional biological technologies to effectively remove those hazardous substances
claims for new advanced treatment technologies capable to ensure environment resources protection, in
agreement with the objectives proposed by the European Commission to be achieved until 2015 [9].
Advanced oxidation processes have been recognized as highly efficient in biodegradability enhancement
of different recalcitrant wastewaters, including textile [10, 11], cork [12, 13], winery [14-17],
pharmaceutical [18], paper mill [19] and olive mill wastewaters [20], pesticide-containing wastewaters
[21, 22], leachates from sanitary landfills [23, 24] and many others as report by Oller et al. [25]. Malato
et al. [26] proposes a decision scheme for selecting the appropriate treatment train, coupling
AOPs-Biological processes, as a function of wastewaters characteristics, in terms of TOC content,
biodegradability and toxicity. According to the characteristics of leachates resulting from a preliminary
biological lagooning, showing a very low biodegradability and high organic carbon content (≈ 1000 mg
C/L), the best coupling strategy consists in a pre-oxidation step using an AOP, modifying the structure
of the recalcitrant pollutants, transforming them into more simple and easily biodegradable ones,
allowing a subsequent biological oxidation to comply with the discharge limits. The best phototreatment
time, must be enough to achieve a high biological efficiency, decreasing energy and reactants
consumption, and consequently associated costs. The use of renewable solar energy, as UV-Vis photons
source, reduces electric power demand when UV lamps are necessary. Muñoz et al. [27] reported that
solar driven photo-Fenton process, considering all solar driven-AOPs, is the best option in terms of
integrated environmental and economic point of view, taken into account their life-cycle greenhouse gas
emission and life-cycle cost. Previous results also showed that solar photo-Fenton process can be
selected as the best option for the peroxidation of mature leachates, after preliminary biological
lagooning [28, 29], promoting biodegradability enhancement [23, 30], which makes possible to combine
with a further biological oxidation system. Speciation and solubility of iron species are the main critical
points of photo-Fenton reaction. pH values between 2.6 and 3.0 have been chosen as the optimum
conditions, since the predominant iron species in solution is FeOH2+ (48%, pH = 2.8, T = 25 ºC and
0.5 M ionic strength), which is the most photoactive ferric ion-water complex [31], and at the same time,
avoids iron (III) precipitation (< 30 mg Fe/L, considering an ionic strength of 0.5 M, pH = 2.8 and
T = 25 ºC, as disclosed on the previous chapter).

Chapter 4
120
In the Chapter 3, it was shown that after acidification, the DOC abatement was approximately 27%,
which corresponded to a reduction of the humic substances of approximately 33%, indicating that humic
acids precipitation is responsible for approximately 72% of the DOC abatement. Evaluation of organic
carbon content in the soluble and particulate phase is very important, in order to prevent a further
dissolution of those humic acids after neutralization of photo-treated leachate.
Leachates are also characterized by high nitrogen content, mainly in the form of ammonium [32].
Nitrogen removal from photo-treated leachates can be achieved using a sequential biological oxidation
by activated sludge under aerobic/anoxic conditions, as demonstrated on the previous chapter and by a
study carried out by Vilar et al. [23], where the complete removal of ammonium, nitrites and nitrates
was achieved.
The main goal of the present chapter is to describe a complete leachate-suited treatment train, combining
a peroxidation process using a solar photo-Fenton reaction to enhance the biodegradability of the
leachate downstream from an aerated lagoon, with an activated sludge biological process, under aerobic
and anoxic conditions. The target COD values of 500 and 150 mg O2/L (according to the regulation for
discharge into water bodies) and a nitrogen content below 15 mg/L must be achieved. A further objective
is to evaluate the efficiency and performance of the photo-Fenton process, considering the sludge
removal step after acidification, to define the optimum phototreatment time to reach a biodegradable
wastewater that can be further oxidized in a biological reactor and, to obtain the nitrification and
denitrification reaction rates.
4.2 Experimental methodology
All the chemicals used in this work, the detailed description of the experimental unit and respective
procedures, as well as the analytical methods employed can be consulted in the Chapter 2.

Chapter 4
121
4.3 Results and discussion
4.3.1 Leachate characterization
Leachate was collected from a sanitary landfill located in the North Portugal, covering an area of 20.5 ha,
serving a population of 446,378 inhabitants and receives 446,378 tons of municipal solid wastes (MSW)
per year since 1999. The leachate treatment plant (LTP) receives in average 100 m3 of leachate per day,
and includes the following treatment units: a 15,000 m3 aerated lagoon with pure oxygen injection; an
anoxic and an aerobic activated sludge reactors (150 m3); a clarifier (27 m3), a coagulation/flocculation
system and a non-aerated final retention lagoon (3000 m3). The treated leachate is then transported to a
municipal WWTP.
The aerated lagoon promotes a biological oxidation of the leachate, achieving 88%, 57% and 63%
elimination of the biochemical oxygen demand (BOD5), dissolved organic carbon (DOC) and chemical
oxygen demand (COD), respectively, indicating that the biodegradable organic carbon fraction is almost
completely removed in the aerated lagoon [29]. Since the organic matter removal in the anoxic and
aerobic activated sludge biological reactors is almost negligible, the leachate samples used in this study
were collected after biological lagooning, presenting an intense dark-brown colour, associated with a
high organic carbon content (DOC = 1253-1707 mg C/L; COD = 3428–4235 mg O2/L), low
biodegradable organic fraction (BOD5 = 170-340 mg O2/L; BOD5/COD = 0.04-0.09; % Dt, after 28 days
(Zahn-Wellens test) = 10-20%), and high nitrogen load (ND = 2.7-3.0 g N/L), being more that 93%
associated to ammonium nitrogen form (Table 4.1).
Considering the leachate characteristics after biological lagooning, the treatment strategy adopted in this
work, which operates at a scale close to industrial, integrates a pre-oxidation stage consisting in a solar
photo-Fenton process, which enhances the bio-treated leachate biodegradability, mainly through humic
substances degradation and, a final polishing step through an aerobic/anoxic activated sludge biological
oxidation process, to achieve the target COD values of 500 and 150 mg O2/L (according to the regulation
for discharge into water bodies) and nitrogen content below 15 mg/L.

Chapter 4
122
Table 4.1. Characterization of the sanitary landfill leachate after aerobic lagooning throughout 1-year.
Parameter Leachate after lagooning Photo-treated leachate after neutralization Photo-bio treated leachate
Exp. A Exp. B Exp. C Exp. D Exp. A Exp. B Exp. C Exp. D Exp. A Exp. B Exp. C Exp. D ELVb
Date 07-02 18-03 27-04 10-05 11-03 05-04 09-05 03-06 05-04 09-05 03-06 16-16
pH 7.9 7.4 8.1 7.7 7.5 6.7 7.1 6.7 7.1 8.4 8.3 7.6 6-9
T (ºC) 11.7 12.9 26.0 23.8 22.4 23.9 19.9 25.3 18.8 22.1 23.3 24.5 -
TSS (mg/L) 136 52 112 90 - - - - 60 44 1163 360 60
DIC (mg C/L) 2497 2307 2278 2202 8.6 2.4 12.3 10.0 33.9
(23.7) 0
194
(290) 203 -
CaCO3,ICa (g/L) 10.4 9.6 9.6 9.2 0.04 0.01 0.05 0.04
0.14
(0.10) 0
0.81
(1.2) 0.85 -
DOC (mg C/L) 1253 1406 1707 1654 156 195 435 428 63
(44)
30
(10)
170
(254) 179 -
COD (mg O2/L) 3428 4235 4211 4045 228 266 949 1096 210
(146)
94
(32)
667
(998) 346 150
BOD5 (mg O2/L) 300 340 170 255 - - - - 13 14 103 59 40
BOD5/COD 0.09 0.08 0.04 0.06 - - - - 0.06 0.14 0.15 0.17 -
Polyphenols (mg caffeic acid/L) 165 172 190 193 5.8 4.3 13.9 9.9 12.6
(7.4)
8.3
(4.8)
18.2
(21.4) 41.6 -
TDI (mg (Fe2+ + Fe3+)/L) 10.6 12.0 12.2 11.1 1.24 0.21 3.58 1.67 2.8
(0.8)
0.7
(0.1)
14.6
(20.9) 3.1 -
Sulphate (g SO42-/L) 0.1 0.1 0.09 0.09 14.0 12.1 11.7 12.6
12.1
(15.0) 10.8
12.6
(13.0) 6.5 2000
Chloride (g Cl-/L) 2.9 2.9 3.1 3.1 2.5 2.7 2.9 3.3 2.8 3.3
(3.2)
2.8
(2.7) 2.9 -
TDN (g N/L) 2.8 2.7 2.9 2.9 2.6 2.5 2.8 2.8 1.3
(1.6)
32x10-3
(40x10-3)
14x10-3
(22x10-3) 1.6 15x10-3
Ammonium (g N-NH4+/L) 2.2 2.0 1.7 1.9 2.1 2.1 2 1.7
0.5
(0.7) 2x10⁻³ 2x10⁻³ 0.5 7.8x10⁻³
Nitrate (g N-NO3-/L) <1x10⁻³ <1x10⁻³ <1x10⁻³ <1x10⁻³ 0.1 0.5 0.4 0.4 <1x10⁻³ <1x10⁻³ <1x10⁻³ 0.1 11x10-3
Nitrite (g N-NO2-/L) 0.1 0.5 0.4 0.4 <1x10⁻³ 3.4x10⁻³ 4.6x10⁻³ <1x10⁻³
0.3
(3x10⁻³)
33x10-3
(<1x10⁻³)
14x10-3
(4x10⁻³) 0.7 -
PT (mg P/L) 19.9 26.2 30.7 23.8 0.9 0.9 2.3 2.3 1.0 3 4.2
(3.8) 14.6 10
Colour (Pt-Co units) - - - - - - - - 23 19 114 116 -
Turbidity (NTU) - - - - - - - - 46 29 638 298 -
*Values in parenthesis refer to the concentration without the effect of dilution in the biological reactor; aAlkalinity values considering that at pH less than 8.1 the inorganic carbon
is almost in the form of bicarbonates [33]; bELV – Emission Limit Values.
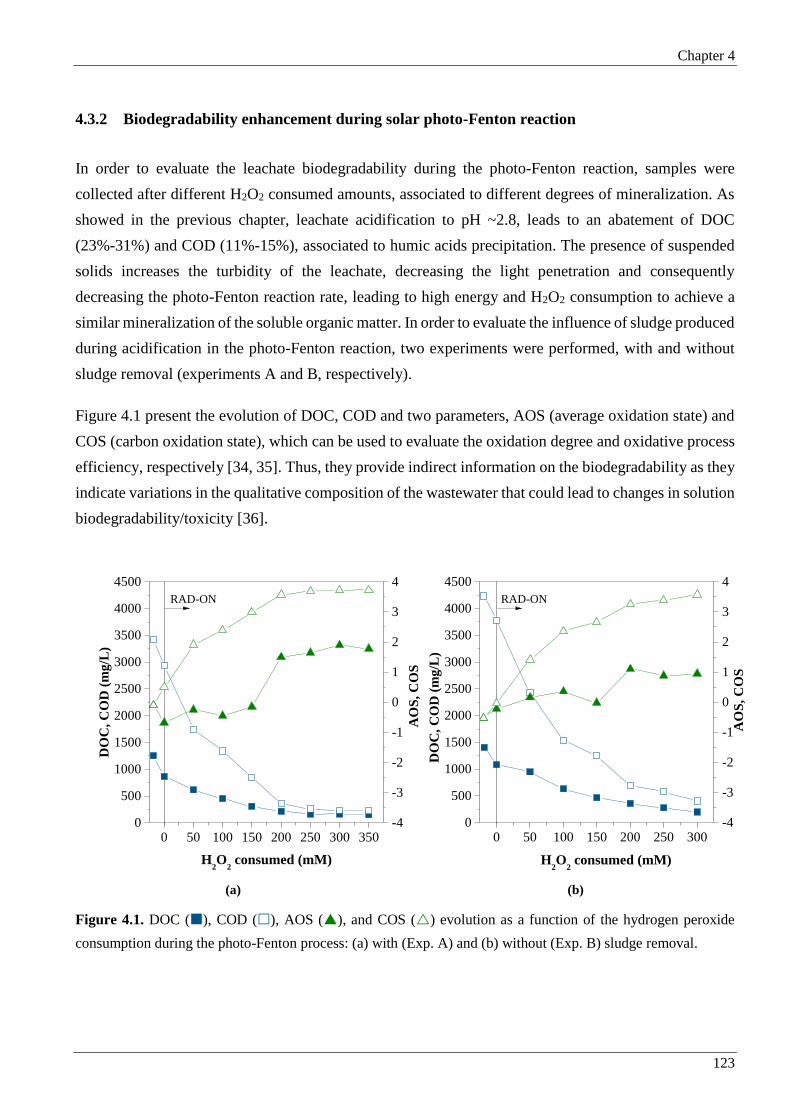
Chapter 4
123
4.3.2 Biodegradability enhancement during solar photo-Fenton reaction
In order to evaluate the leachate biodegradability during the photo-Fenton reaction, samples were
collected after different H2O2 consumed amounts, associated to different degrees of mineralization. As
showed in the previous chapter, leachate acidification to pH ~2.8, leads to an abatement of DOC
(23%-31%) and COD (11%-15%), associated to humic acids precipitation. The presence of suspended
solids increases the turbidity of the leachate, decreasing the light penetration and consequently
decreasing the photo-Fenton reaction rate, leading to high energy and H2O2 consumption to achieve a
similar mineralization of the soluble organic matter. In order to evaluate the influence of sludge produced
during acidification in the photo-Fenton reaction, two experiments were performed, with and without
sludge removal (experiments A and B, respectively).
Figure 4.1 present the evolution of DOC, COD and two parameters, AOS (average oxidation state) and
COS (carbon oxidation state), which can be used to evaluate the oxidation degree and oxidative process
efficiency, respectively [34, 35]. Thus, they provide indirect information on the biodegradability as they
indicate variations in the qualitative composition of the wastewater that could lead to changes in solution
biodegradability/toxicity [36].
0 50 100 150 200 250 300 3500
500
1000
1500
2000
2500
3000
3500
4000
4500
DO
C,
CO
D (
mg
/L)
DO
C,
CO
D (
mg
/L)
H2O
2 consumed (mM)
RAD-ON
0 50 100 150 200 250 3000
500
1000
1500
2000
2500
3000
3500
4000
4500
RAD-ON
Exp. 27 - C/ sólidos
H2O
2 consumed (mM)
Exp. 26 - S/ sólidos
-4
-3
-2
-1
0
1
2
3
4
AO
S,
CO
S
AO
S,
CO
S
-4
-3
-2
-1
0
1
2
3
4
(a) (b)
Figure 4.1. DOC (), COD (), AOS (), and COS () evolution as a function of the hydrogen peroxide
consumption during the photo-Fenton process: (a) with (Exp. A) and (b) without (Exp. B) sludge removal.

Chapter 4
124
For the experiment with sludge removal (Figure 4.1a), COD has a fast decay (90%) until 200 mM H2O2
consumed, showing a strong oxidation of organic matter, which is well correlated with COS increase
from -0.1, indicating the presence of rather reduced organic compounds, to +3.7, which means strong
mineralization and generation of highly oxidized intermediates. AOS starts at -0.1, and has a high
increase between 150 and 200 mM H2O2 doses, and remained almost constant for further doses of H2O2.
The increase of AOS suggests that more oxidized organic intermediates are formed during the treatment
and, after AOS reaches a plateau, the chemistry of the intermediates generated does not vary significantly
[37]. For the experiment without sludge removal (Figure 4.1b), COD starts from a higher value than the
experiment with sludge removal due to leachate variability, and in order to achieve 90% COD decay it
is necessary 250 mM H2O2.
According to Zahn-Wellens test (Figure 4.2 and Figure 4.3), the first two samples (non-treated and after
pH adjustment) present a poor biodegradation level, between 4 and 20%. However, as expected, the
biodegradability of the leachate was enhanced during the photo-Fenton treatment and a value higher
than 70% biodegradation, after only 8 days (or less), was achieved for 200 mM H2O2 (sample 6), which
is in agreement with the information obtained from AOS and COS profiles.
0 4 8 12 16 20 24 28
0
20
40
60
80
100
Time (days)
Dt (
%)
0 4 8 12 16 20 24 28
0
20
40
60
80
100
Time (days)
Dt (
%)
(a) (b)
Figure 4.2. Zahn-Wellens test for samples taken during the photo-Fenton process, (a) with (Exp. A) and (b)
without (Exp. B) sludge removal: reference (); initial (); after acidification and iron sulphate addition (); 50
(), 100 (), 150 (), 200 (,), 250 (,), 300 () and 350 () mM of H2O2 consumed.
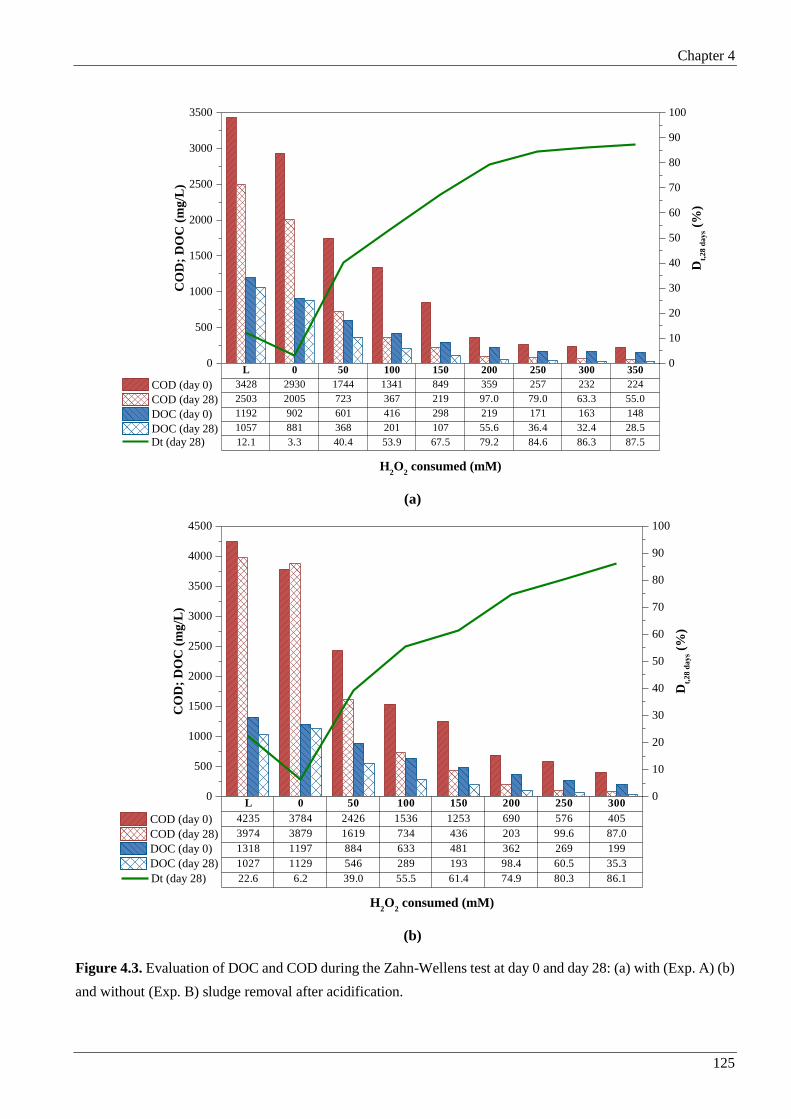
Chapter 4
125
0
500
1000
1500
2000
2500
3000
3500
H2O
2 consumed (mM)
CO
D;
DO
C (
mg
/L)
COD (day 0)
COD (day 28)
DOC (day 0)
DOC (day 28)
L 0 50 100 150 200 250 300 350
COD (day 0) 3428 2930 1744 1341 849 359 257 232 224
COD (day 28) 2503 2005 723 367 219 97 79 63 55
DOC (day 0) 1192 902 601 416 298 219 171 163 148
DOC (day 28) 1057 881 368 201 107 56 36 32 29
Dt, 28 days 12 3 40 54 67 79 85 86 87
0
10
20
30
40
50
60
70
80
90
100
0
500
1000
1500
2000
2500
3000
3500
Dt,
28
da
ys
(%)
DO
C ;
CO
D (
mg
/L)
H2O2 consumed (mM)
L 0 50 100 150 200 250 300 350
3428 2930 1744 1341 849 359 257 232 224
2503 2005 723 367 219 97.0 79.0 63.3 55.0
1192 902 601 416 298 219 171 163 148
1057 881 368 201 107 55.6 36.4 32.4 28.5
12.1 3.3 40.4 53.9 67.5 79.2 84.6 86.3 87.5
0
10
20
30
40
50
60
70
80
90
100
Dt (day 28)
Dt,
28
da
ys (%
)
(a)
0
500
1000
1500
2000
2500
3000
3500
4000
4500
H2O
2 consumed (mM)
CO
D;
DO
C (
mg
/L)
COD (day 0)
COD (day 28)
DOC (day 0)
DOC (day 28)
L 0 50 100 150 200 250 300
4235 3784 2426 1536 1253 690 576 405
3974 3879 1619 734 436 203 99.6 87.0
1318 1197 884 633 481 362 269 199
1027 1129 546 289 193 98.4 60.5 35.3
22.6 6.2 39.0 55.5 61.4 74.9 80.3 86.1
0
10
20
30
40
50
60
70
80
90
100
Dt (day 28)
Dt,
28
da
ys (
%)
(b)
Figure 4.3. Evaluation of DOC and COD during the Zahn-Wellens test at day 0 and day 28: (a) with (Exp. A) (b)
and without (Exp. B) sludge removal after acidification.

Chapter 4
126
Low molecular-weight carboxylate anions concentration also shows the same trend, achieving maximum
values between 50 and 75 mg C/L (formate > oxalate > malonate > acetate > propionate > citrate >
pyruvate > valerate > maleate), corresponding to 10-17% of DOC, for H2O2 doses between 100 and 200
mM H2O2 (Figure 4.3).
0
200
400
600
800
1000
1200
1400
DO
C (
mg/L
)
(a)
L 0 50 100 150 200 250 300 3500
200
400
600
800
1000
1200
1400 (b)
DO
C (
mg/L
)
H2O
2 consumed (mM)
0
2
4
6
8
10
12
LM
CA
/DO
C (
%)
0
2
4
6
8
10
12
14
16
18
LM
CA
/DO
C (
%)
Figure 4.4. Evaluation of DOC at acidic ( ) or neutralized ( ) conditions and low-molecular-weight
carboxylate anions (LMCA)/DOC ratio () as a function of hydrogen peroxide consumption during photo-Fenton
process: (a) with (Exp. A) and (b) without (Exp. B) sludge removal after acidification.

Chapter 4
127
Considering the two different target COD values, namely 150 and 500 mg O2/L, is necessary H2O2 doses
around 180 mM and 90 mM, respectively, with sludge removal, and around 225 mM and 140 mM,
without sludge removal (Figure 4.3), considering a subsequent biological treatment.
For both experiments, the H2O2 consumed/DOC oxidized ratio is very similar, with values of 7.9-8.2
(without and with sludge removal) and 10.0 mg H2O2/mg DOC, respectively for COD targets values of
500 and 150 mg O2/L. COD and DOC values at different H2O2 consumed amounts (different points of
the oxidation process) were determined after neutralization for the experiments with and without sludge
removal, which means that humic acids or other organic compounds initially precipitated due to
acidification, are dissolved again, if not destroyed. DOC values for the second sample, 0 mM H2O2,
which corresponds to the sample after acidification step, presents a DOC after neutralization almost
equal to the initial leachate (COD after neutralization increased 262 mg C/L), considering the experiment
without sludge removal, showing that humic acids or other organic compounds initially precipitated after
acidification are dissolved again if pH is neutralized. For the experiment with sludge removal, COD
value after neutralization had only a small increase (76 mg C/L), probably due to the fact that a small
fraction of sludge was not removed. These results show that a sludge removal step after acidification
can be a good option to eliminate 20-30% of the initial leachate organic content, including high
recalcitrant humic acids. After 50 mM H2O2 consumed, for the experiment without sludge removal,
DOC at acidic conditions and after neutralization has the same value, which suggests that humic acids
or other organic compounds initially precipitated were removed or transformed into other soluble
organic compounds at acidic pH.
The H2O2 consumed/DOC oxidized ratio at the optimum phototreatment time defined in Table 4.1 is an
important parameter to compare the efficiency of H2O2 consumption during the reaction and at the same
time can be used to compare the efficiency between different wastewaters with different initial organic
carbon content. According to the H2O2 consumed/DOC oxidized ratio at the optimum phototreatment
time, it can be concluded that the sludge removal after acidification, does not affect the H2O2
consumption per unit of DOC oxidized. However, the non-elimination of sludge produced after
acidification increases the H2O2 consumption to achieve the biodegradability threshold, associated to
the H2O2 dose necessary to oxidise the particulate organic matter.

Chapter 4
128
Table 4.2. Process variables as performance indicators.
Photo-Fenton (PF) Biological Treatment
Parameter Exp. A Exp. B Exp. C Exp. D Parameter Exp. A Exp. B Exp. C
pHma 2.9 2.9 2.7 2.7 VSS (mg/L) 1758 2220 2035
Tma (ºC) 21.9 23.8 33.5 40.5 TSS (mg/L) 2915 3977 3418
TDIma (mg/L) 66.9 34.6 44.9 54.8 VSS/TSS (%) 60 56 60
tPF (h) - - 29 43 SSV30-minl (mL/L) 405 735 248
IUV (W/m2) 16.9 21.7 28.5 23.6 SVIm (mg/L) 139 185 73
QUV (kJ/L) - - 84 104
[H2O2] cons. (mM) 350 300 200 275 Nitrification
[H2SO4] (mM) 114 131 99 96 pHn,m 6.9 7.4 7.3
%CaCO3b 91 73 97 95 Tn,m 18.2 22.6 26.8
[NaOH] (mM) 43 29 29 25 DOm (mg/L) 1.6 3.7 3.6
DOCi,(mg/L) 1253 1406 1707 1654 tBT,n (h) 356 505 91
DOCAAc (mg/L) 864 1084 1239 1327 kn (mg NH4
+-N/h/g SSV) 0.7±0.1 1.4±0.1 6.9±0.1
DOCBNd (mg/L) 151 199 413 427 [NaOH] (mM)/CaCO3 (g/L) 113/5.6 172/8.6 400/20.0
DOCf (mg/L) 156 195 435 428
Mine (%) 88 86 75 74 Denitrification
Minoptf (%) 64/83 67/80 - - pHd,m 7.84 8.57 8.8
H2O2/DOCoxg (mg H2O2/mg DOCox) 16.9 11.5 8.5 10.4 Td,m 17.2 22.1 26.2
H2O2/DOCox,opth (mg H2O2/mg DOCox) 7.9/10.0 8.2/10.0 - - tBT,d (h) 242 216 167
k1i (L/kJ) - -
0.02±0.02;
0.009±0.004
0.02±0.01;
0.006±0.001
kd (mg (NO3--N + NO2
--N)/h/g SSV) 0.9±0.1 2.0±0.4 2.4±0.4
C/N (mg CH3OH/mg (NO3--N + NO2
--N)) 5.3±0.7 3.0±0.7 3.1±0.8
r0j (mg/kJ)
-
-
23±20;
6±2
28±15;
3.5±0.7
[CH3OH] (mM) 123 239 194
[H2SO4] (mM)/CaCO3 (g/L) 0 0 28/2.8
kH2O2k (mmol/kJ) - -
3±1;
1.9±0.3
4±2;
1.9±0.3
apHm, Tm and Fem correspond to average values of pH, temperature and total dissolved iron observed during the photo-Fenton experiment; bPercentage of consumed acid percentage to
neutralize the alkalinity (CaCO3,IC/(100.08 × [H2SO4]), %); cDOC After Acidification; dDOC Before Neutralization; ePhoto-Fenton mineralization (1-DOCf/DOCi, %); fPhoto-Fenton
mineralization in the optimal point of biodegradability (CODf < 500/150 mg O2/L); gRatio between H2O2 consumed and oxidized DOC (H2O2/(DOCAA-DOCf) × 34.02); hRatio between H2O2
consumed and oxidized DOC in the optimal point of biodegradability (CODf < 500/150 mgO2/L); iPseudo-first-order kinetic constant for DOC degradation (0<QUV<30 kJUV/L;30<QUV<100
kJUV/L); jInitial DOC reaction rate (0<QUV<30 kJUV/L;30<QUV<100 kJUV/L); kH2O2 consumption rate (0<QUV<30 kJUV/L;30<QUV<100 kJUV/L); lSS30 - Settled Sludge Volume after 30 minutes
of decantation; mSVI – Sludge Volume Index.

Chapter 4
129
Different authors [38-40] reported high mineralization values regarding the treatment of leachates using
Fenton and photo-Fenton processes, although a cautiously analysis of the results must be performed,
regarding the evaluation of soluble and particulate organic matter content during the treatment. If
precipitation of humic acids or other organic compounds occurs during the acidification process, and if
the oxidation treatment time is not enough to degrade those complex molecules present in the particulate
phase, after the final effluent neutralization step, those compounds will be redissolved and discharged
in water bodies. During the photo-Fenton reaction those organic compounds in the particulate phase will
be also attacked by the hydroxyl radicals and will be eventually mineralized. However, the energy and
H2O2 consumption will be much higher to achieve the same soluble DOC concentration. Beyond that,
the high amount of solids decreases the transmissibility of the wastewater, decreasing the efficiency of
the photo-Fenton reaction. Sludge elimination can be an interesting option to improve the photo-Fenton
process; however the disposal of an acid sludge can be a big problem. The high content of humic acids
in the sludge can be a valuable resource, since humic acids can be called “the black gold of agriculture”
[41].
Due to high variability of leachate composition, H2O2 or UV dose cannot be used as useful parameters
for economic online measurement for process control, since depends greatly from initial DOC.
Evaluation of UV absorbance at 254 nm, wavelength at which aromatic and unsaturated compounds
present a maximum absorption [42], can be used as a fast and economic method for process control.
Polyphenols concentration and aromatic content given by absorbance at 254 nm after dilution 1:25
(Figure 4.5), shows a similar profile, leading to 88% and 94% reduction after 200 mM of H2O2 consumed
for the experiment with sludge removal and 92% and 94% reduction after 250 mM of H2O2 consumed
for the experiment without sludge removal. For both experiments, absorbance at 254 nm after dilution
1:25 must be lower than 0.3 or 0.08, in order to reach a photo-treated leachate compatible with a
biological oxidation process, achieving a final COD below 500 and 150 mg O2/L, respectively.
Finally, the photo-treated leachate at the optimum phototreatment time is neutralized with NaOH to a
pH around 7 under mechanical stirring (a residual concentration of H2O2 can be useful to convert all
ferrous ions into ferric ions, leading to a higher precipitation extend), before the biological treatment,
leading to iron precipitation, followed by a period of 3 h for iron sludge sedimentation. Although the
concentration of heavy metals was not measured in the leachates samples used in this work, it was
reported in a previous paper [28], for leachate samples collected from the same sanitary landfill in a
different time, the presence of the following concentrations: copper (0.1 mg/L); total chromium
(2.2 mg/L); manganese (0.9 mg/L); arsenic (95.6 mg/L): lead (36.4 mg/L); zinc (1.2 mg/L); cadmium
(0.4 mg/L) and nickel (0.8 mg/L). The neutralization of the photo-treated leachate leading to the
precipitation of Fe(II) and Fe(III) can be also an efficient process for the binding and immobilization of
the heavy metals by adsorption in the ferrous/ferric sludge, as it was reported by different authors [24,
43, 44].
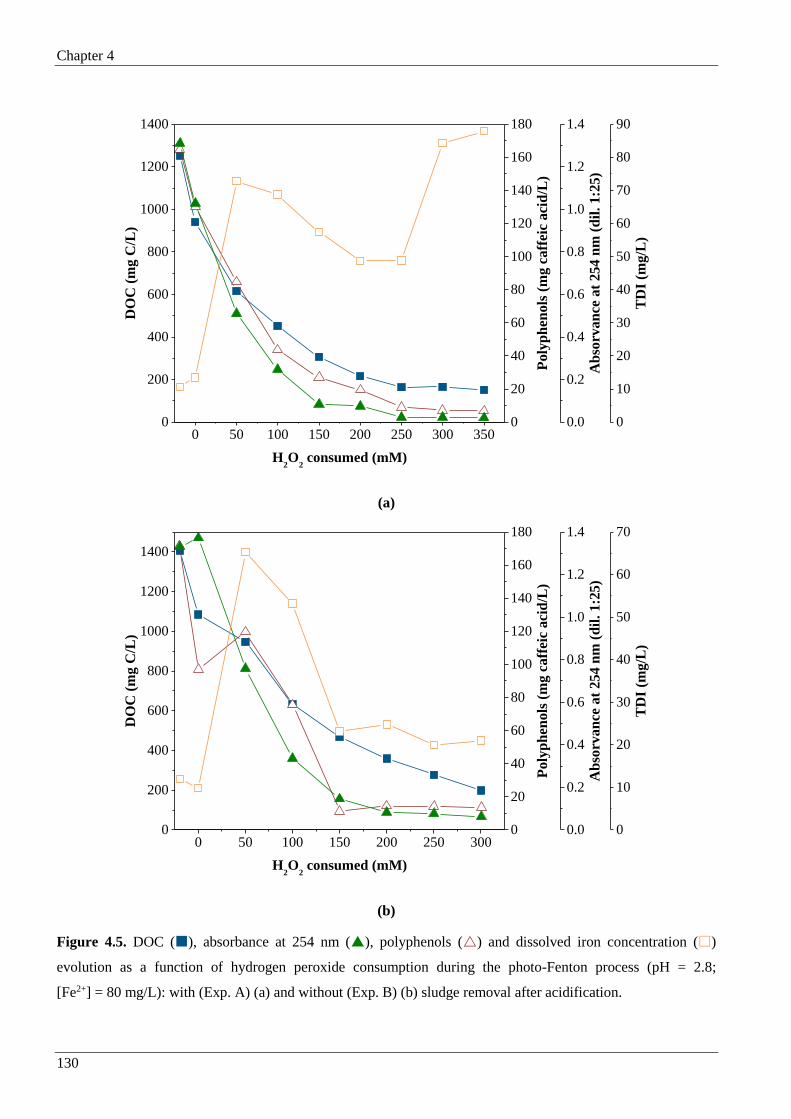
Chapter 4
130
(a)
(b)
Figure 4.5. DOC (), absorbance at 254 nm (), polyphenols () and dissolved iron concentration ()
evolution as a function of hydrogen peroxide consumption during the photo-Fenton process (pH = 2.8;
[Fe2+] = 80 mg/L): with (Exp. A) (a) and without (Exp. B) (b) sludge removal after acidification.
0 50 100 150 200 250 300 3500
200
400
600
800
1000
1200
1400
H2O
2 consumed (mM)
DO
C (
mg C
/L)
0
20
40
60
80
100
120
140
160
180
Poly
ph
enols
(m
g c
aff
eic
aci
d/L
)
0.0
0.2
0.4
0.6
0.8
1.0
1.2
1.4
Ab
sorv
an
ce a
t 254 n
m (
dil
. 1:2
5)
0
10
20
30
40
50
60
70
80
90
TD
I (m
g/L
)
0 50 100 150 200 250 3000
200
400
600
800
1000
1200
1400
H2O
2 consumed (mM)
DO
C (
mg C
/L)
0
20
40
60
80
100
120
140
160
180P
oly
ph
enols
(m
g c
aff
eic
aci
d/L
)
0.0
0.2
0.4
0.6
0.8
1.0
1.2
1.4
Ab
sorv
an
ce a
t 254 n
m (
dil
. 1:2
5)
0
10
20
30
40
50
60
70
TD
I (m
g/L
)

Chapter 4
131
4.3.3 Integrated systems: solar photo-Fenton pre-oxidation/biological nitrification and
denitrification
Two last experiments (C and D) were performed combining the solar photo-Fenton, considering the
optimum H2O2 dose without sludge removal after acidification, and a further biological oxidation
process, with the objective to achieve a final wastewater with a COD content below 500 mg O2/L. Due
to variability of raw leachate composition and preliminary biological lagooning treatment efficiency,
leachate samples used in experiments C and D presented values of DOC 20%-30% higher than those
observed for experiments A and B. According to H2O2/DOC rates, and initial DOC, it was estimated a
dose of 235 mM H2O2, to achieve a final wastewater, after biological treatment, with a COD below 500
mg O2/L. For experiment C it was considered only 200 mM H2O2, in order to know if the biological
oxidation process efficiency could be higher than the results obtained in the Zahn-Wellens test. Both
kinetics shows similar kinetic profiles (Figure 4.6) with an initial fast degradation rate (23 ± 20 mg
C/kJUV; 28 ± 15 mg C/kJUV), and H2O2 consumption rate (3 ± 1 mmol H2O2/kJUV; 4 ± 2 mmol
H2O2/kJUV), until 30 kJ/L, respectively for the experiments C and D. Until the end of the experiments,
reaction and H2O2 consumption rates presents values 4-8 times and 2 times lower that those observed in
the initial part of reaction, respectively for experiments C and D. The higher consumption rate of H2O2
observed in the initial part of experiment D can be attributed to the higher temperature which favours
H2O2 self-decomposition, being necessary more 25-30% of H2O2 to achieve the same mineralization.
For the average pH, chloride and sulphate values observed in experiments C and D (pH = 2.7; 3 g Cl-/L
and 12 g SO42-/L), the predominant iron species in solution are Fe(SO4)2
- (66.4%) and FeSO4+ (33.1%)
(considering equilibrium constants at 25 ºC and ionic strength of 0.5 M [33, 45-47]), leading to the
formation of mainly SO4●-, which presents a lower oxidant power than HO● radicals. High amounts of
sulphuric acid are needed due to the high leachate alkalinity. For example, leachate sample used in
experiment C has an alkalinity of 9.6 g CaCO3/L (considering that at a pH of 8.1, all inorganic carbon
corresponds to bicarbonates [33]), consuming 99 mM H2SO4, which corresponds to 97% of the total
sulphuric acid needed for the acidification process. If during the preliminary biological lagooning,
nitrification is achieved, alkalinity removal can achieve 100% efficiency, decreasing the needs of
sulphuric acid in the preliminary acidification process, decreasing sulphates ions concentration,
increasing the most photoactive ferric iron-water complex concentration, FeOH2+ [31], and consequently
increase of the photo-Fenton reaction rate.

Chapter 4
132
0 10 20 30 40 50 60 70 80 90 1000
10
20
30
40
50
I (W
/m2)
T (
oC
)
QUV
(kJUV
/L)
0400
600
800
1000
1200
1400
1600
1800
DO
C (
mg
/L)
RAD-ON
0
50
100
150
200
250
300
H2O
2 c
on
sum
ed (
mM
)
0
10
20
30
40
50
60
70
80
90
TD
I (m
g/L
)
0
10
20
30
40
Figure 4.6. Evaluation of the photo-Fenton reaction. (,) - DOC; (,) - H2O2 consumed; (,) Dissolved
Iron; (,) – Temperature; (,) – Average irradiation. Solid symbols: Exp. C (without sludge removal); Open
symbols: Exp. D (without sludge removal).
The photo-bio-treated leachate presents COD values lower than 150 mg O2/L for experiments A and B
and lower than 500 mg O2/L for experiment D (Table 4.1). For experiment C, leachate presented a
concentration of humic substances (HS) of 1008 mg CHS/L, representing 59% of the DOC. After
acidification, precipitation of humic acids occurred and the remaining humic substance in solution was
671 mg CHS/L, corresponding to 54% of DOC and meaning that 72% of the DOC abatement is attributed
to humic acids precipitation. The concentration of humic substances in the photo-treated leachate after
neutralization was 126 mg CHS/L, which represents 29% of the remaining DOC, corresponding to a
reduction of 87.5%. The bio-photo-treated leachate, experiment D, presents a DOC value of 179 mg C/L,
and considering that humic substances are not biodegradable, 74% of the remaining DOC is related to
humic substances (Table 4.1).

Chapter 4
133
Figure 4.7 presents the combined system photo-Fenton/biological results for experiments B and C.
Under aerobic conditions, it was accumulated more than 84% of the loaded ammonium nitrogen as
nitrite, with almost complete ammonium conversion, achieving final values of 1.8 g NO2--N/L and
0.2 g NO2--N/L. pH was maintained between 6.8 and 8.0 through NaOH addition. The highest
nitrification rate obtained was 6.9 mg NH4+-N/(h.g VSS) consuming 20.0 g CaCO3 per liter of
photo-treated leachate or 9.9 mg CaCO3 per mg NH4+-N, which is similar to the stoichiometric ratio,
7.14 mg CaCO3 per mg NH4+-N (Eq. (4.1)) (photo-treated leachate alkalinity was negligible).
H2OHNOO
2
3NH 2224
(nitritation, ammonia-oxidising bacteria)
(4.1)
After complete nitrification process, oxygen supply was turned off, methanol was added as external
carbon source for the denitrification process and pH was controlled between 7.6 and 9.0, through the
addition of H2SO4. Maximum denitrification rate of 2.4 mg (NO2--N + NO3
--N)/(h.g VSS) was observed,
with a C/N consumption ratio of 3.1 mg CH3OH/mg (NO2--N + NO3
--N) (6.2 g/7.8 mL of commercial
methanol per liter of leachate). During denitrification it was produced 2.8 g of alkalinity, as CaCO3, per
liter of leachate, according to the acid addition, which is equivalent to 1.4 g CaCO3 per g of (NO2--N +
NO3--N) reduced. According to Equations (4.2) and (4.3), during denitrification is produced 3.57 g (as
CaCO3) of alkalinity per g of NO2--N or NO3
--N reduced, which is 2 times higher than the value obtained.
During denitrification the inorganic carbon concentration increased from 0 to 1.2 g C/L, corresponding
to 6.1 g HCO3-/L or 5.0 g CaCO3/L, equivalent to 2.5 g CaCO3 per g (NO2
--N + NO3--N) reduced. So,
the overall alkalinity produced was 3.9 g CaCO3 per g (NO2--N + NO3
--N) reduced, which is very near
to stoichiometric reaction.
OH7HCO6N3COOHCH5NO6 232233
(nitrate removal process)
(4.2)
OH3HCO6N3COOHCH3NO6 232232
(nitrite removal process)
(4.3)
In the previous chapter, using the same type of photo-treated leachate, it was shown that the maximum
nitrification and denitrification rates were 0.49 mg NH4+-N/(h.g VSS) and
0.27 mg (NO2--N + NO3
--N)/(h.g VSS), which are 14 and 26 times lower than those observed in this
section, respectively. This difference is attributed mainly to the low temperatures (<15.5 ºC) observed
in Chapter 3 (winter season), when compared with an average temperature of 26.8 ºC (spring season)
observed in experiment C.

Chapter 4
134
0 10 20 30 40 50 60 70
0
150
300
450
600
750
900
1050
1200
1350
1500
RAD-ON
DO
C (
mg
C/L
)
Ilumination Time (hours)
100 200 300 400 500 600 700 800 900
Photo-Fenton Biological Oxidation
a
Biological Treatment Time (hours)
a
a - methanol
addition
0
50
100
150
200
250
300
350
H2O
2 c
on
sum
ed (
mM
)
0
250
500
750
1000
1250
1500
1750
2000
2250
2500
2750
To
tal
Dis
solv
ed N
itro
gen
(m
g N
/L)
0
250
500
750
1000
1250
1500
1750
2000
2250
N-N
H4
+ (
mg
/L)
0
50
100
150
200
250
300
350
400
450
500
N-N
O3
- (m
g/L
)
0
100
200
300
400
500
600
700
800
900
N-N
O2
- (m
g/L
)
(a)
0 10 20 30
0
200
400
600
800
1000
1200
1400
1600
1800
RAD-ON
DO
C (
mg
C/L
)
Ilumination Time (hours)
100 200 300 400
Photo-Fenton Biological Oxidation
a
Biological Treatment Time (hours)
a
a - methanol
addition
0
25
50
75
100
125
150
175
200
225
H2O
2 c
on
sum
ed (
mM
)
0
300
600
900
1200
1500
1800
2100
2400
2700
3000
To
tal
Dis
solv
ed N
itro
gen
(m
g N
/L)
0
250
500
750
1000
1250
1500
1750
2000
2250
N-N
H4
+ (
mg
/L)
0
50
100
150
200
250
300
350
400
N-N
O3
- (m
g/L
)
0
200
400
600
800
1000
1200
1400
1600
1800
N-N
O2
- (m
g/L
)
(b)
Figure 4.7. Leachate mineralization by the combined system: photo-Fenton (DOC and H2O2 consumed in
function of the illumination time); biological nitrification/denitrification (DOC and nitrogen species as function
of time). (a) Exp. B (without sludge removal); (b) Exp. C (without sludge removal). - DOC; - H2O2
consumption; - Total Nitrogen; - Ammonium (NH4+-N); - Nitrate (NO3
--N); - Nitrite (NO2--N).
The global efficiency of the combined system for experiment C, in terms of DOC, was approximately
90%, corresponding to 74% (200 mM H2O2 consumed) for the chemical oxidation and 16% for the
biological oxidation, and approximately 100% for total dissolved nitrogen, achieving a final value below
15 mg N/L.

Chapter 4
135
4.4 Conclusions
An integrated treatment strategy for the treatment of leachates after biological lagooning, combining a
pre-oxidation step using a solar photo-Fenton reaction with an activated biological process under anoxic
and aerobic conditions was able to yield a final wastewater in agreement with the discharge limits
imposed by Portuguese Legislation in terms of COD values (<150 mgO2/L) and nitrogen content (<15
mg N/L). The preliminary acidification step of the photo-Fenton reaction leads to the precipitation of
the majority of humic acids and other organic compounds, and is responsible for an abatement of 20-30%
of the soluble DOC. Sludge removal decreases the amount of suspended solids, increasing the
transmissibility of the leachate, decreasing the light absorbing species and consequently rising the photo-
Fenton reaction rate, and decreasing the consumption of H2O2. The major drawback of sludge
elimination step is associated with the disposal of an acid sludge.
The activated sludge biological system operated under aerobic and anoxic conditions, allowed an almost
complete nitrogen removal, for levels below 15 mg N/L. A maximum nitrification rate of
6.9 mg NH4+-N/(h.g VSS) was achieved, consuming 20.0 g CaCO3 per liter of photo-treated leachate or
9.9 mg CaCO3 per mg NH4+-N. The maximum denitrification rate observed was 2.4 mg (NO2
--N +
NO3--N)/(h.g VSS), with a C/N consumption ratio of 3.1 mg CH3OH/mg (NO2
--N + NO3--N).
Chapter 4
136
4.5 References
[1] H.-j. Fan, H.-Y. Shu, H.-S. Yang, W.-C. Chen, Characteristics of landfill leachates in central Taiwan,
Science of the Total Environment, 361 (2006) 25-37.
[2] S. Jonsson, J. Ejlertsson, B.H. Svensson, Behaviour of mono- and diesters of o-phthalic acid in
leachates released during digestion of municipal solid waste under landfill conditions, Advances in
Environmental Research, 7 (2003) 429-440.
[3] S.K. Marttinen, R.H. Kettunen, J.A. Rintala, Occurrence and removal of organic pollutants in
sewages and landfill leachates, The Science of The Total Environment, 301 (2003) 1-12.
[4] M. Osako, Y.-J. Kim, S.-i. Sakai, Leaching of brominated flame retardants in leachate from landfills
in Japan, Chemosphere, 57 (2004) 1571-1579.
[5] Y. Wu, S. Zhou, X. Ye, D. Chen, K. Zheng, F. Qin, Transformation of pollutants in landfill leachate treated
by a combined sequence batch reactor, coagulation, Fenton oxidation and biological aerated filter technology,
Process Safety and Environmental Protection, 89 (2011) 112-120.
[6] C.B. Öman, C. Junestedt, Chemical characterization of landfill leachates – 400 parameters and compounds,
Waste Management, 28 (2008) 1876-1891.
[7] D.L. Jensen, A. Ledin, T.H. Christensen, Speciation of heavy metals in landfill-leachate polluted groundwater,
Water Research, 33 (1999) 2642-2650.
[8] T.H. Christensen, P. Kjeldsen, P.L. Bjerg, D.L. Jensen, J.B. Christensen, A. Baun, H.-J. Albrechtsen, G.
Heron, Biogeochemistry of landfill leachate plumes, Applied Geochemistry, 16 (2001) 659-718.
[9] E. Commission, Decision no 2455/2001/EC of the European parliament and of the council of 20 November
2001, establishing the list of priority substances in the field of water policy and amending directive
2000/60/EC, Official Journal of the European Communities, Decision no 2455/2001/EC (2001) L331/331.
[10] P. Hörsch, A. Speck, F.H. Frimmel, Combined advanced oxidation and biodegradation of industrial effluents
from the production of stilbene-based fluorescent whitening agents, Water Research, 37 (2003) 2748-2756.
[11] V.J.P. Vilar, L.X. Pinho, A.M.A. Pintor, R.A.R. Boaventura, Treatment of textile wastewaters by solar-driven
advanced oxidation processes, Solar Energy, 85 (2011) 1927-1934.
[12] V.J.P. Vilar, M.I. Maldonado, I. Oller, S. Malato, R.A.R. Boaventura, Solar treatment of cork boiling and
bleaching wastewaters in a pilot plant, Water Research, 43 (2009) 4050-4062.
[13] A.M.A. Pintor, V.J.P. Vilar, R.A.R. Boaventura, Decontamination of cork wastewaters by solar-photo-
Fenton process using cork bleaching wastewater as H2O2 source, Solar Energy, 85 (2011) 579-587.
[14] F.J. Benitez, J.B.d. Heredia, F.J. Real, J.L. Acero, Purification kinetics of winery wastes by ozonation,
anaerobic digestion and ozonation plus anaerobic digestion, Journal of Environmental Science and Health,
A34 (1999) 2023-2041.
[15] J.B. de Heredia, J. Torregrosa, J. Dominguez, E. Partido, Degradation of wine distillery wastewaters by the
combination of aerobic biological treatment with chemical oxidation by Fenton's reagent, Sustainable
Viticulture and Winery Wastes Management, 51 (2005) 167-174.
[16] R. Mosteo, J. Sarasa, M.P. Ormad, J. Ovelleiro, Sequential solar photo-Fenton-biological system for the
treatment of winery wastewaters, Journal of Agricultural and Food Chemistry, 56 (2008) 7333-7338.
Chapter 4
137
[17] B.S. Souza, F.C. Moreira, M.W. Dezotti, V.J. Vilar, R.A. Boaventura, Application of biological oxidation
and solar driven advanced oxidation processes to remediation of winery wastewater, Catalysis Today, 209
(2013) 201-208.
[18] C. Sirtori, A. Zapata, I. Oller, W. Gernjak, A. Agüera, S. Malato, Decontamination industrial pharmaceutical
wastewater by combining solar photo-Fenton and biological treatment, Water Research, 43 (2009) 661-668.
[19] A.M. Amat, A. Arques, F. Lopez, M.A. Miranda, Solar photo-catalysis to remove paper mill wastewater
pollutants, Solar Energy, 79 (2005) 393-401.
[20] J. Beltrán-Heredia, J. Torregrosa, J. García, J. Domínguez, J. Tierno, Degradation of olive mill wastewater
by the combination of Fenton's reagent and ozonation processes with an aerobic biological treatment, Water
Science & Technology, 44 (2001) 103-108.
[21] A. Zapata, S. Malato, J.A. Sánchez-Pérez, I. Oller, M.I. Maldonado, Scale-up strategy for a combined solar
photo-Fenton/biological system for remediation of pesticide-contaminated water, Catalysis Today, 151
(2010) 100-106.
[22] V.J.P. Vilar, F.C. Moreira, A.C.C. Ferreira, M.A. Sousa, C. Gonçalves, M.F. Alpendurada, R.A.R.
Boaventura, Biodegradability enhancement of a pesticide-containing bio-treated wastewater using a solar
photo-Fenton treatment step followed by a biological oxidation process, Water Research, 46 (2012) 4599-
4613.
[23] V.J.P. Vilar, E.M.R. Rocha, F.S. Mota, A. Fonseca, I. Saraiva, R.A.R. Boaventura, Treatment of a sanitary
landfill leachate using combined solar photo-Fenton and biological immobilized biomass reactor at a pilot
scale, Water Research, 45 (2011) 2647-2658.
[24] M. Vedrenne, R. Vasquez-Medrano, D. Prato-Garcia, B.A. Frontana-Uribe, J.G. Ibanez, Characterization
and detoxification of a mature landfill leachate using a combined coagulation–flocculation/photo Fenton
treatment, Journal of Hazardous Materials, 205–206 (2012) 208-215.
[25] I. Oller, S. Malato, J. Sánchez-Pérez, Combination of advanced oxidation processes and biological treatments
for wastewater decontamination—a review, Science of the Total Environment, 409 (2011) 4141-4166.
[26] S. Malato, P. Fernández-Ibáñez, M.I. Maldonado, J. Blanco, W. Gernjak, Decontamination and disinfection
of water by solar photocatalysis: Recent overview and trends, Catalysis Today, 147 (2009) 1-59.
[27] I. Muñoz, S. Malato, A. Rodríguez, X. Doménech, Integration of Environmental and Economic Performance
of Processes. Case Study on Advanced Oxidation Processes for Wastewater Treatment, Journal of Advanced
Oxidation Technologies, 11 (2008) 270-275.
[28] E.M.R. Rocha, V.J.P. Vilar, A. Fonseca, I. Saraiva, R.A.R. Boaventura, Landfill leachate treatment by solar-
driven AOPs, Solar Energy, 85 (2011) 46-56.
[29] V.J.P. Vilar, J.M.S. Moreira, A. Fonseca, I. Saraiva, R.A.R. Boaventura, Application of Fenton and Solar
Photo-Fenton Processes to the Treatment of a Sanitary Landfill Leachate in a Pilot Plant with CPCs, Journal
of Advanced Oxidation Technologies, 15 (2012) 107-116.
[30] V.J.P. Vilar, S.M.S. Capelo, T.F.C.V. Silva, R.A.R. Boaventura, Solar photo-Fenton as a pre-oxidation step
for biological treatment of landfill leachate in a pilot plant with CPCs, Catalysis Today, 161 (2011) 228-234.
[31] J.J. Pignatello, E. Oliveros, A. MacKay, Advanced oxidation processes for organic contaminant destruction
based on the fenton reaction and related chemistry, Critical Reviews in Environmental Science and
Technology, 36 (2006) 1-84.
Chapter 4
138
[32] S. Renou, J. Givaudan, S. Poulain, F. Dirassouyan, P. Moulin, Landfill leachate treatment: Review and
opportunity, Journal of Hazardous Materials, 150 (2008) 468-493.
[33] C. Sawyer, P. McCarty, G. Parkin, Chemistry for Environmental Engineering and Science, McGraw-Hill
Education, 2003.
[34] A.M. Amat, A. Arques, F. Galindo, M.A. Miranda, L. Santos-Juanes, R.F. Vercher, R. Vicente, Acridine
yellow as solar photocatalyst for enhancing biodegradability and eliminating ferulic acid as model pollutant,
Applied Catalysis B: Environmental, 73 (2007) 220-226.
[35] A. Arques, A.M. Amat, A. García-Ripoll, R. Vicente, Detoxification and/or increase of the biodegradability
of aqueous solutions of dimethoate by means of solar photocatalysis, Journal of Hazardous Materials, 146
(2007) 447-452.
[36] J. Scott, D. Ollis, Integration of chemical and biological oxidation processes for water treatment: II. Recent
illustrations and experiences, Journal of Advanced Oxidation Technologies, 2 (1997) 374-381.
[37] V. Sarria, S. Parra, N. Adler, P. Peringer, N. Benitez, C. Pulgarin, Recent developments in the coupling of
photoassisted and aerobic biological processes for the treatment of biorecalcitrant compounds, Catalysis
Today, 76 (2002) 301-315.
[38] H. Zhang, H.J. Choi, C.-P. Huang, Optimization of Fenton process for the treatment of landfill leachate,
Journal of Hazardous Materials, 125 (2005) 166-174.
[39] O. Primo, M.J. Rivero, I. Ortiz, Photo-Fenton process as an efficient alternative to the treatment of landfill
leachates, Journal of Hazardous Materials, 153 (2008) 834-842.
[40] Y. Wu, S. Zhou, F. Qin, H. Peng, Y. Lai, Y. Lin, Removal of humic substances from landfill leachate by
Fenton oxidation and coagulation, Process Safety and Environmental Protection, 88 (2010) 276-284.
[41] Humintech (2010), Humic & Fulvic Acids: the Black Gold of Agriculture?, in, New AG International,
Avaiable at http://www.humintech.com/pdf/humicfulvicacids.pdf, on 4th October 2011.
[42] M. Mrkva, Evaluation of Correlations between Absorbance at 254 nm and COD of Rivers Waters, Water
Research, 17 (1983) 231-235.
[43] M. Gabriela Garcia, J. d'Hiriart, J. Giullitti, H. Lin, G. Custo, M.d.V. Hidalgo, M.I. Litter, M.A. Blesa, Solar
light induced removal of arsenic from contaminated groundwater: the interplay of solar energy and chemical
variables, Solar Energy, 77 (2004) 601-613.
[44] C.T. Benatti, A.C.S. da Costa, C.R.G. Tavares, Characterization of solids originating from the Fenton's
process, Journal of Hazardous Materials, 163 (2009) 1246-1253.
[45] G.L. Truong, J.D. Laat, B. Legube, Effects of chloride and sulfate on the rate of oxidation of ferrous ion by
H2O2, Water Research, 38 (2004) 2384-2394.
[46] J. De Laat, T.G. Le, Effects of chloride ions on the iron (III)-catalyzed decomposition of hydrogen peroxide
and on the efficiency of the Fenton-like oxidation process, Applied Catalysis B: Environmental, 66 (2006)
137-146.
[47] J. De Laat, T.G. Le, Kinetics and modeling of the Fe (III)/H2O2 system in the presence of sulfate in acidic
aqueous solutions, Environmental Science & Technology, 39 (2005) 1811-1818.
5 Integration of biological nitrification-denitrification,
solar photo-Fenton and biological oxidation processes
for raw leachate treatment, at pre-industrial scale
A multistage treatment system, at pre- industrial scale, was designed for the treatment of a mature
raw landfill leachate, including: a) an activated sludge biological oxidation (ASBO), under aerobic
and anoxic conditions; b) a solar photo-Fenton process to enhance the bio-treated leachate
biodegradability, with and without sludge removal after acidification; and c) a final polishing step,
with further ASBO.
The raw leachate was characterized by a high concentration of humic substances (HS)
(1211 mg CHS/L), representing 39% of the dissolved organic carbon (DOC) content, and a high
nitrogen content, mainly in the form of ammonium nitrogen (>3.8 g NH4+-N/L).
In the first biological oxidation step, a 95% removal of total nitrogen and a 39% mineralization in
terms of DOC reduction were achieved, remaining only the recalcitrant fraction, mainly attributed
to HS (57% of DOC). Under aerobic conditions, the highest nitrification rate obtained was
8.2 mg NH4+-N/h/g of volatile suspended solids (VSS), and under anoxic conditions, the maximum
denitrification rate obtained was 5.8 mg (NO2--N + NO3
--N)/(h.g VSS), with a C/N consumption
ratio of 2.4 mg CH3OH/mg (NO2--N + NO3
--N).
The precipitation of humic acids (37% of HS) after acidification of the bio-treated leachate
corresponds to 96% of the DOC abatement. The amount of UV energy and H2O2 consumption
during the photo-Fenton reaction was 30% higher in the experiment without sludge removal and,
consequently, the reaction rate was 30% lower. The phototreatment process led to the depletion of
HS >80%, of low-molecular-weight carboxylate anions >70% and other organic micropollutants,
thus resulting in a total biodegradability increase of >70%.
The second biological oxidation allowed to obtain a final treated leachate in compliance with legal
discharge limits regarding water bodies (with the exception of sulphate ions), considering the
experiment without sludge.
Finally, the high efficiency of the overall treatment process was further reinforced by the total
removal percentages attained for the identified organic trace contaminants (>90%).
This chapter is based on the research article “Silva, T.F.C.V., Silva, M.E.F., Cunha-Queda, A.C., Fonseca, A.,
Saraiva, I., Sousa, M.A., Gonçalves, C., Alpendurada, M.F, Boaventura, R.A.R, Vilar, V.J.P, Multistage treatment
system for raw leachate from sanitary landfill combining biological nitrification-denitrification/solar photo-
Fenton/biological processes, at a scale close to industrial - Biodegradability enhancement and evolution profile
of trace pollutants, Water Research, 47 (2013) 6167-6186, DOI: 10.1016/j.watres.2013.07.036”.


Chapter 5
141
5.1 Introduction
Although the disposal of solid wastes in sanitary landfills constitutes nowadays the most common
method of waste management [1, 2], the generation of leachates is inevitable, mainly due to rainwater
percolation through wastes and their decomposition products [3], leading to a complex mixture of
high-strength organic and inorganic contaminants [4-6]. Different recalcitrant contaminants include
personal care products (PCPs), pharmaceuticals, hormones, phthalates, humic and fulvic acids [7], PAHs
[8, 9], PBDEs [10, 11], pesticides [5] and heavy metals [12, 13].
During the last years, publications regarding sanitary landfill leachates treatment rose continuously. The
scientific community research interests have been focused on biological, membrane and advanced
oxidation processes (AOPs) technologies for the treatment of leachates. Leachates are normally
characterized by a high non-biodegradable organic fraction. In order to reach the necessary quality level
of the final effluent fully reducing leachates’ negative impact in the environment, in compliance with
discharge regulations and at an affordable price, the best treatment system can be obtained using a
combination of different technologies, including: i) aerobic and anaerobic biological processes; ii)
chemical and physical methods (flotation, coagulation/flocculation, chemical precipitation, adsorption,
ammonium stripping, chemical oxidation and ion exchange); iii) membrane filtration (microfiltration,
ultrafiltration, nanofiltration and reverse osmosis); iv) AOPs (TiO2/UV, H2O2/UV, Fenton (Fe2+/H2O2),
photo-Fenton (Fe2+/H2O2/UV), electro-Fenton, electro-photo-Fenton, ozone (O3, O3/UV, and O3/H2O2),
etc.) [14-16].
Rocha et al. [17] and Vilar et al. [18] applied different photochemical (H2O2/UV), heterogeneous
(TiO2/UV, TiO2/H2O2/UV) and homogenous (Fe2+/H2O2/UV) photocatalytic processes, including also
the Fenton reaction (Fe2+/H2O2), to the treatment of real leachates, after preliminary lagooning, from the
same sanitary landfill where the pre-industrial plant used in this work was installed. The photo-Fenton
reaction provided degradation rates 20 times higher than the heterogeneous photocatalytic processes.
Different other results reported by Vilar et al. [19-21] showed that the solar photo-Fenton oxidation
process is an effective technology to improve the biodegradability of mature landfill leachates, allowing
to combine AOPs with biological oxidation systems, minimizing chemicals consumption and energy.
Furthermore, in the Chapters 3 and 4, it was presented the first pre-industrial plant for leachates treatment
from sanitary landfills. The treatment strategy consisted on a pre-oxidation of the leachate after
lagooning, enhancing its biodegradability and allowing its further coupling with a biological oxidation
system, under aerobic and anoxic conditions, to achieve complete nitrogen removal by nitrification and
post-denitrification, using methanol as external carbon source. From June 2010 to May 2011, an
Chapter 5
142
extensive physicochemical characterization of the leachate after lagooning showed its high recalcitrant
character, mainly associated with the presence of humic substances (HS), which represented almost 59%
of the organic carbon content. The acidification of the leachate after lagooning to a pH near 2.8 was a
critical point in the photo-Fenton reaction. It was showed that, after acidification, the DOC abatement
was approximately 27%, which corresponded to a reduction of HS of ca. 33%, indicating that the
precipitation of the humic acids corresponded to approximately 72% of the DOC abatement. Different
authors [22-24] reported high mineralization values regarding leachates treatment using Fenton and
photo-Fenton processes, although a cautious result analysis must be performed, considering the
evaluation of soluble and particulate organic matter content during the treatment. If humic acids
precipitation occurs during the acidification process and if the oxidation treatment time is not long
enough to degrade those complex molecules present in the particulate phase, after the final effluent
neutralization step, those compounds may be redissolved and discharged into water resources.
This chapter presents a multistage treatment system for raw leachates from a sanitary landfill, at a
pre-industrial scale, combining: an activated sludge oxidation process under aerobic and anoxic
conditions, promoting nitrification and denitrification reactions in order to achieve a complete removal
of nitrogen compounds and the biodegradable organic carbon fraction; followed by a solar photo-Fenton
oxidation process (degradation of the most recalcitrant compounds and enhancement of the bio-treated
raw leachate biodegradability, without the interference of nitrogen species); and finally an aerobic
biological degradation process, for the complete removal of the remaining biodegradable organic
compounds. Nitrification and denitrification biological reaction rates were evaluated, as well as
alkalinity and methanol consumption, herein used as external carbon source for the denitrification
reaction. The solar photo-oxidation efficiency was evaluated considering the sludge removal after
acidification and the influence of HS and low-molecular-weight carboxylate anions (LMCA)
concentrations in biodegradability enhancement, determined by the Zahn-Wellens test. Finally, some
persistent organic micropollutants were identified and their evolution profiles followed-up along the
multistage bio-photo-bio-treatment process.
5.2 Experimental methodology
All the chemicals used in this work, the detailed description of the experimental unit and respective
procedures, as well as the employed analytical methods can be consulted in the Chapter 2.

Chapter 5
143
5.3 Results and discussion
5.3.1 Leachate characterization
Table 5.1 presents the main characteristics of the raw leachate used in this work. The raw leachate was
collected before the aerated lagoon, installed at the sanitary landfill, and it presents an intense
dark-brown colour associated to the high concentration of humic substances (>1211 mg CHS/L), which
corresponds to 39% and 13% of DOC (2503 mg C/L) and COD (7426 mg O2/L), respectively. It has
also a high nitrogen concentration (4080 mg N/L), mainly in the form of ammonium (95%) and low
values of BOD5/COD (0.18), indicating a low biodegradability fraction. According to leachate
classification proposed by Chian and DeWalle [25], as high pH values (pH > 7.5), COD values between
4000 and 10,000 mg O2/L, BOD5/COD in the range of 0.1-0.3, age higher than 10 years and humic
substances concentration higher than 30% in terms of organic compounds, can be classified between
intermediate and old leachate. In old mature leachates, the dominant organic fraction is refractory
(non-biodegradable), since volatile fat acids are converted to biogas (CH4, CO2) by the methanogenic
microorganisms [25]. According to the leachates characteristics, the treatment strategy adopted in this
work consists in a multistage treatment system with three sequential steps: preliminary biological
treatment by activated sludge under aerobic and anoxic conditions promoting the removal of the
biodegradable organic carbon fraction and nitrogen; a solar photo-Fenton process to oxidize the
recalcitrant organic compounds into more biodegradable ones; being possible to couple with a second
aerated activated sludge process, to achieve complete removal of residual biodegradable organic carbon
and nitrogen.
5.3.2 1st Biological oxidation
Figure 5.1 shows the evolution of dissolved organic carbon and nitrogen content during the 1st biological
oxidation process. Fast biodegradable organic carbon fraction was totally removed after 24 h, achieving
22% mineralization, with a kinetic constant of 19 mg DOC/(h.g VSS). The slow biodegradable organic
fraction was almost totally removed, according to the BOD5 final value achieved, with a kinetic constant
of 1.8 mg DOC/(h.g VSS), leading to a final mineralization of 39%. The remaining organic carbon
fraction can be considered recalcitrant, mainly attributed to humic substances, which represented 57%
of DOC at the end of the 1st biological treatment. The slight decrease in humic substances concentration,
approximately 11%, can be attributed mainly to adsorption in the activated sludge.

Chapter 5
144
Table 5.1. Physico-chemical characterization of the landfill leachate at different treatment phases.
Parameters RLa LBT1a
LAA a LPF a LPFN a LBT2 a
ELVb With
Sludge
Without
Sludge
With
Sludge
Without
Sludge
With
Sludge
Without
Sludge
With
Sludge
Without
Sludge
pH 8.1 8.4 2.9 2.9 3.0 3.1 7.0 7.4 8.0 7.9 6-9
T (ºC) 26.4 25.2 26.5 24.1 32.5 30.2 32.5 23.4 22.6 21.3
TSS (mg/L) 126 900 1500 93 800 358 132 11 126 45 60
VSS (mg/L) 94 690 1320 93 525 160 76 2 82 31
DOC (mg C/L) 2503 1534 1200 1200 518 261 577 248 196 45
TIC (mg C/L) 4119 1903 0 0 0 0 5.9 3.2 176 122 -
Alkalinityc (g CaCO3/L) 17.1 8.0 0 0 0 0 0.025 0.013 0.73 0.51 -
Mineralization in each processd (%) - 39 11 13 - - 27 38 15 8
Accumulated mineralization (%) - 39 50 52 - - 77 90 92 98
COD (mg O2/L) 7426 4864 4041 3720 1243 408 1305 436 467 117 150
BOD5 (mg O2/L) 1325 200 - - - - - - 14 12 40
BOD5/COD 0.18 0.04 - - - - - - 0.03 0.08
Humic substances (mg CHS/L) 977 (1211)e 872 550 550 50 26 92 30 91 30
HS/DOC (%) 39 57 46 46 10 10 16 12 46 67
HS/COD (%) 13 18 12 15 4 6 7 7 20 26
Abs 254 nm (diluted 1:25) - 1.466 1.160 1.030 0.082 0.086 0.111 0.106 - -
TDI (mg (Fe2+ + Fe3+)/L) 4.8 7.9 23.3f 19.7f 30.7 22.9 3.6 0.5 1.1 0.7
Sulfate (mg SO42-/L) 42 6831 - 14522 - 13917 14233 14079 13931 13803 2000
Chloride (mg Cl-/L) 3549 3370 - 3122 - 3136 3209 3171 3192 3060
Total Nitrogen (mg N/L) 4080 210 219 182 227 195 221 194 232 8,80 15
Ammoniacal nitrogen (mg NH4+-N/L) 3864 23 - 34 - 67 64 53 125 <1 8
Nitrate (mg NO3--N/L) <1 <1 - <1 - <1 <1 <1 <1 <1 11
Nitrite (mg NO2--N/L) 139 <1 - <1 - <1 3 <1 2 2
Total Phosphorous (mg P/L) 35 25 - - - - 8 <1 4 <1 10
aRL – Raw Leachate; LBT1 – Leachate after 1st biological treatment; LAA – Leachate after acidification; LPF – Leachate after Photo-Fenton reaction; LPFN - Leachate after Photo-
Fenton reaction and neutralization; LBT2 – Leachate after 2nd biological treatment; bELV – Emission Limit Values; cAlkalinity values considering that at pH less than 8.3 the
inorganic carbon is almost in the form of bicarbonates [26]; dMineralization in each treatment stage relatively to the initial DOC (2503 mg/L); eHumic substances concentration in
the raw leachate was 1211 mg CHS/L. The mixture of the raw leachate with the activated sludge resulted in 977 mg CHS/L; dHigh values due to contamination in reactor.

Chapter 5
145
Figure 5.1. Biological nitrification/denitrification of the raw leachate. - DOC; - Total Dissolved Nitrogen;
- Ammonium (NH4+-N); - Nitrate (NO3
--N); - Nitrite (NO2--N); - Temperature (T); - pH;
- Dissolved Oxygen (DO).
The SVI obtained during 1st biological treatment was 96 mL/g, indicating a good sludge settleability,
normally below 100 mL/g [27]. Regarding the food to microorganism (biomass) ratio (F/M), it was
achieved an acceptable value of 0.08 g substrate/g biomass/day, since typical values for the BOD F/M
ratio reported in literature vary from 0.04 g/g/day, for extended aeration processes, to 1.0 g/g/day, for
high rate processes [27].
Biological nitrogen removal requires a two-step process: aerobic nitrification of ammonia to nitrite
(Eq. (2.1)) and then nitrite is converted to nitrate (Eq. (5.2)); anoxic denitrification of nitrate/nitrite to
nitrogen gas (Eq. (5.3)).
H2OHNOO2
3NH 2224 (nitritation, ammonia-oxidising bacteria) (5.1)
322 NOO2
1NO (nitratation, nitrite-oxidising bacteria) (5.2)
2223 NONNONONO (denitrification, denitrifying bacteria) (5.3)
0
500
1000
1500
2000
2500
3000
3500
4000
4500
5000
Denitrification
DO
C (
mg
C/L
)
Nitrification
0 200 400 600 800 1000 12000
10
20
30
T (ºC
)
Time (hours)
6
7
8
9
pH
0
3
6
9
12
DO
(m
g O
2/L
)
0
50
100
150
200
250
1000
2000
3000
4000
Nit
rog
en C
on
ten
t (m
g N
/L)
a - addition of methanol
a
a
a

Chapter 5
146
Figure 5.1 shows that under aerobic conditions, it was accumulated more than 96% of the loaded
ammonium nitrogen as nitrite, with 98% ammonium conversion, achieving final values of 3 g NO2--N/L
and 60 mg NO2--N/L. pH was maintained between 7.5 and 8.5 through the addition of NaOH, as reported
by Alleman [28] which showed that the optimal pH values are between 7.9 and 8.2 for nitrification.
Nitrification reaction stopped between 287 and 353 hours due to a problem in the base dosing pump,
achieving a pH value of 6.6 and also a problem with the compressor, resulting in very low dissolved
oxygen concentration values (<0.1 mg O2/L). The highest nitrification rate obtained was
8.2 mg NH4+-N/(h.g VSS) (T = 26.9 ºC) consuming 4.5 g CaCO3 per liter (Table 5.2) of raw leachate or
1.2 mg CaCO3 per mg NH4+-N, which is 6 times lower than the stoichiometric ratio, 7.14 mg CaCO3 per
mg NH4+-N, (Eq. (2.1)). Raw leachate presents initially an inorganic carbon concentration of 4119 mg
C/L, which corresponds to 20.9 g HCO3-/L or 17.1 g CaCO3/L, considering that at pH = 8.0, inorganic
carbon is almost in the form of bicarbonates [26]. Until 143 h of nitrification, 2205 mg/L
(11.2 g HCO3-/L or 9.2 g CaCO3/L) of inorganic carbon was consumed, and 1927 mg NH4
+-N/L was
oxidized, leading to an alkalinity consumption of 4.8 mg CaCO3 per mg NH4+-N. At 115 h, pH was 6.6,
inorganic carbon concentration was negligible, and consequently, nitrification stopped.
Spagni and Marsili-Libelli [29] reported nitrification rates between 4.9 and 12.6 mg N/(h.g VSS)
(T = 20 ºC) for a leachate with 1199 mg NH4+-N/L (COD = 2055 mg O2/L), achieving nitrification and
COD removal efficiencies in average of 98% and 20%, respectively. Ruiz et al. [30] showed that setting
DO concentration at 0.7 mg/L, it was possible to accumulate more than 65% of the loaded ammonia
nitrogen as nitrite with 98% ammonia conversion (initial ammonia concentration of 610 NH4+-N/L).
Below 0.5 mg/L of DO, ammonia was accumulated and over a DO of 1.7 mg/L complete nitrification to
nitrate was achieved. In our case, despite DO concentration was in average 3.2 mg/L, the nitration
process (nitrite oxidation to nitrate) was almost negligible. This can be attributed to the high pH values,
possible free ammonia in the reactor, which favoured the ammonia oxidizing bacteria and inhibited the
nitrite-oxidizing organisms, as reported by Canziani et al. [31], Villaverde et al. [32] and Suthersan and
Ganczarcczyk [33].
Complete nitrification requires 2 mol of oxygen per mol of ammonia to be nitrified (Eqs. (2.1) and (5.2)).
If denitrification is to be considered after a nitrification process, partial nitrification to nitrite implies
25% less oxygen demand compared to complete nitrification, and this shortcut of the nitrate would mean
a reduction in the total carbon source required for denitrification, because carbon is needed for
conversion of nitrate to nitrite, which can yield up to 40% savings in methanol consumption (Eqs. (5.4)
and (5.5)).

Chapter 5
147
OH7HCO6N3COOHCH5NO6 232233 (nitrate removal process) (5.4)
OH3HCO6N3COOHCH3NO6 232232 (nitrite removal process) (5.5)
After 25 days, oxygen supply was turned off, methanol was added as external carbon source for the
denitrification process and pH was controlled between 8.0 and 9.0, through the addition of H2SO4. After
a preliminary denitrification lag phase period of 4 days, characterized by a low denitrification rate of
1.3 mg (NO2--N + NO3
--N)/(h.g VSS), attributed to the denitrifying bacteria adaptation to the high nitrite
concentration, maximum denitrification rate of 5.8 mg (NO2--N + NO3
--N)/(h.g VSS) was observed,
with a C/N consumption ratio of 2.4 mg CH3OH/mg (NO2--N + NO3
--N) (7.4 g/9.4 mL of commercial
methanol per liter of leachate).
Table 5.2. Process variables as performance indicators.
1st Biological Treatment Photo-Fenton (PF)
Parameter Parameter With
Sludge
Without
Sludge
VSS (mg/L) 1581 pHm 2.8 2.9
TSS (mg/L) 2257 Tm (ºC) 40.5 35.2
SVI (mg/L) 96 Fem 37.6 33.0
k0-25ha (mg DOC/(h.g VSS)) 19 tPF (h) 25.1 38.0
k25-258hb (mg DOC/(h.g VSS)) 1.8 IUV (W/m2) 26.1 22.6
Nit
rifi
cati
on
pHn,m 7.6 QUV (kJ/L) 54.5 80.4
Tn,m 26.9 [H2SO4] (mM) 104 104
DOm (mg/L) 3.2 [H2O2]cons. (mM) 250 265
tBT,n (h) 600 H2O2/DOCoxf (mg H2O2/mg DOCox) 13.6 9.5
kn (mg NH4+-N/(h.g SSV)) 8.2 k1
c (L/kJ) 0.020±0.006 0.016±0.001
[NaOH] (mM)/CaCO3 (g/L) 90/4.5 r0d (mg/kJ) 20±6 12±1
Den
itri
fica
tio
n
pHd,m 8.4 kH2O2e (mmol/kJ) 4.6±1.1 3.2±0.2
Td,m 26.4 Tfmf (g C/h/m2) 1.72 1.01
tBT,d (h) 430 Tfvg (L/h/m2) 1.18 0.95
kd (mg (NO3--N + NO2
--N)/(h.g SSV)) 5.8
C/N (mg CH3OH/mg (NO3--N + NO2
--N)) 2.4
[CH3OH] (mM) 231
[H2SO4] (mM)/CaCO3 (g/L) 53/5.3
aDOC removal rate between 0 and 25 hours; bDOC removal rate between 25 and 258 hours; cPseudo-first-order kinetic constant for
DOC degradation (QUV>10 kJUV/L); dInitial DOC reaction rate (QUV>10 kJUV/L); eH2O2 consumption rate (QUV>10 kJUV/L); fMass
treatment factor ((DOCi – DOCf) × Vt/(tPF × Ar)); gVolume treatment factor (Vt/(tPF × Ar)).
Between 750 and 850 h, an increase of pH until 9.3 (due to a problem in the dosing pump), resulted in a
complete conversion of ammonia from the ionic form, NH4+, to the molecular form, NH3, and combined
with the release of high amounts of nitrogen gas due to denitrification reaction, lead to NH3 stripping,
and flotation of activated sludge.

Chapter 5
148
During denitrification it was produced 5.3 g of alkalinity, as CaCO3, per liter of leachate, according to
the acid addition, which is equivalent to 1.7 g CaCO3 per g of (NO2--N + NO3
--N) reduced. According
to Eqs. (5.4) and (5.5), during denitrification it is produced 3.57 g (as CaCO3) of alkalinity per g of
NO2--N or NO3
--N reduced, which is 2 times higher than the obtained value. Moreover, during
denitrification the inorganic carbon concentration increased from 0 to 1.9 g C/L, corresponding to
9.7 g HCO3-/L or 8.0 g CaCO3/L, equivalent to 2.6 g CaCO3/g (NO2
--N + NO3--N) reduced. So, the
overall alkalinity produced was 4.3 g CaCO3/g (NO2--N + NO3
--N) reduced, which is very near to
stoichiometric reaction.
Different methanol demands, as external carbon source, for denitrification process of landfill leachates
have been reported: 2.43 g CH3OH/g NO3--N (3.6 g COD/g NO3
--N) [34], 2.8-3.0 g CH3OH/g NO3--N
(4.5-4.1 g COD/g NO3--N) [35], which is more than 1.3 times higher than the stoichiometric mass ratio
between consumed methanol and nitrate (1.90 g CH3OH/g NO3--N). However, when nitrite is the
predominant specie in solution, methanol consumption during denitrification is approximately 40% less
(1.15 g CH3OH/g NO2--N). Comparing with the values obtained in our study, methanol consumption
was more than two times higher when compared with the stoichiometric mass ratio.
Modin et al. [36] studied the denitrification using methane as external carbon source, showing a C/N
ratio of 7.1 g CH4-C/g NO3--N, approximately 13 times higher than the stoichiometric mass ratio,
according to Eq. (5.6) [37].
22243 CO5OH6HO8N4CH5NO8 (5.6)
Considering a continuous biological treatment system, with a flow rate of 100 m3/day, it would be
necessary an anoxic lagoon (560 m3) followed by an aerobic lagoon (500 m3), with a retention time of
5.6 days and 5.0 days, respectively, to achieve complete denitrification of 3.1 kg NO2--N/m3 and
nitrification of 3.9 kg NH4+-N/m3, considering an average VSS of 4 g/L. In order to minimize the
consumption of methanol and alkalinity, the treatment sequence can be anoxic followed by an aerobic
reactor, with recirculation to the anoxic reactor: (i) to take advantage of the biodegradable organic
fraction of the raw leachate, which corresponds to 54% of the organic carbon necessary for
denitrification, being necessary only 3.4 kg CH3OH/m3, (ii) to take advantage of the raw leachate
alkalinity (17.1 kg CaCO3/m3), and the alkalinity produced during denitrification (13.3 kg CaCO3/m
3),
which is sufficient to achieve complete nitrification of 4 kg NH4+-N/m3 (19.2 kg CaCO3/m
3).
Chapter 5
149
5.3.3 Solar photo-Fenton Oxidation
After almost complete removal of nitrogen and biodegradable organic carbon fraction, and further
clarification of the wastewater, the bio-treated leachate was pumped to the recirculation tank of the
photoreactor system, and it was acidified until pH 3.0, through the addition of sulphuric acid
(3.0 L H2SO4/m3). The bio-treated leachate presented 8.0 g alkalinity in terms of CaCO3 (considering
that at pH 8.4, alkalinity is mainly due to bicarbonates), and the amount of sulphuric acid needed to
neutralize alkalinity corresponds to 77% of the total acid used during acidification. However,
considering that in a full scale plant, the alkalinity of raw leachate and that produced during
denitrification, can be used for nitrification, achieving a final bio-treated leachate with a very low
alkalinity, which will reduce substantially the amount of sulphuric acid necessary to perform
acidification, decreasing sulphate ion concentration, resulting in a substantially increase of photo-Fenton
reaction efficiency due to an higher fraction of more photoactive ferric water complexes than ferric
sulphate complexes.
After acidification, it was observed an increase of 67% and 91% in the TSS and VSS, respectively,
correlated with humic acids precipitation, leading to humic substances and DOC concentration
abatement of 37% and 22%, respectively. This indicates that precipitation of the humic acids (37% of
the humic substances), corresponds to approximately 96% of DOC abatement. In Chapter 3, it was
performed an HS analysis to the acid sludge resulted from the acidification step, and results revealed a
concentration of 130 mg CHS per gram of dry sludge, which corresponded to production of 2.7 kg of HS
sludge per cubic meter of leachate. Considering the same concentration of HS in the sludge, 2.5 kg of
HS sludge per cubic meter of leachate were produced according to results observed in this work.
In order to assess the influence of sludge produced after acidification in the photo-Fenton reaction, it
was performed two experiments, with and without sludge removal. The photo-Fenton reactions were
conducted at an initial pH of 2.8, achieved after the addition of iron and the first dose of H2O2
(500 mg/L), and with an initial iron concentration of 80 mg Fe2+/L, reported in a previous work [21], as
the optimum iron concentration for this kind of leachate and photoreactor. This pH value was selected
for the photo-Fenton reaction because it avoids iron precipitation [38]. During the reaction, H2O2 was
supplied in multiple small additions, maintaining the H2O2 concentration between 100 and 500 mg
H2O2/L, which has been reported to improve the oxidation rate, avoiding that hydrogen peroxide can be
rate-limiting if applied in concentrations that are too low and, minimizing the consumption of H2O2 per
amount of COD oxidized, considering that high concentration of hydrogen peroxide can compete with
contaminants for the hydroxyl radicals generated and also self-decompose into oxygen and water [39,
40].

Chapter 5
150
Observing the overall photo-Fenton process (see Table 5.1, Table 5.2 and Figure 5.2), for the experiment
without sludge removal, it was consumed 54.5 kJ/L of accumulated UV energy and 250 mM of H2O2,
corresponding to a mineralization of 52% and a specific consumption of 13.6 mg of H2O2 per mg of
oxidized DOC. While for the experiment with sludge removal it was consumed a little more amount of
accumulated UV energy and H2O2, equivalent to 80.4 kJ/L and 265 mM, respectively. However, the
mineralization value was higher, 79%, and the consumed H2O2 concentration per unit of DOC was
lesser, corresponding to 9.5 mg of H2O2 per mg of oxidized DOC. The mass and volumetric treatment
factors (Tfm and Tfv), defined as the amount of organics substances or volume of contaminated water,
respectively, that the system is able to treat per unit of time and surface of solar collectors [41], were
0.95 g C/h/m2 and 1.01 L/h/m2 for the experiment without acid sludge removal, and 1.18 g C/h/m2 and
1.72 L/h/m2 for the experiment with acid sludge removal.
0 10 20 30 40 50 60 70 8020
30
40
50
60
T (
oC
)
QUV
(kJUV
/L)
0
400
600
800
1000
1200
1400
1600
S'4
S'3
S'2
S'1
S3
S2
DO
C (
mg
C/L
)
S1
RAD-ON
0
50
100
150
200
250
300
H2O
2 c
on
sum
ed (
mM
)
0
10
20
30
40
50
60
70
80
TD
I (m
g/L
)
0
10
20
30
40
I (
W/m
2)
Figure 5.2. DOC (,), H2O2 consumption (,), total dissolved iron (TDI) concentration (,), temperature
(T - ,) and average radiation intensity (I -,) evolution as a function of the accumulated UV energy per
liter of leachate during the photo-Fenton process (pH = 2.8; [Fe2+] = 80 mg/L), with (open symbols) and without
(solid symbols) sludge removal.

Chapter 5
151
Figure 5.2 shows that for the same H2O2 dose (220 mM), at similar average reaction temperature and
average solar UV power, the mineralization efficiency was 80% and 65% for the experiments with and
without sludge removal, considering the dissolved organic carbon. The amount of UV energy and H2O2
consumed is 30% higher for the experiment without sludge removal, and consequently, reaction velocity
is 30% smaller (see Table 5.2). The presence of suspended solids decreases light penetration, competing
as photons absorbers with H2O2 and iron species, being necessary a higher reaction time and
consequently a higher energy consumption, and also will increase energy and H2O2 consumption to
achieve the same mineralization of dissolved organic matter, related to the degradation of particulate
organic matter, as it can be seen by the reduction of more than 50% in TSS and VSS (Table 5.1).
After photo-bio-treated leachate neutralization, consuming 1.0 kg CaCO3 of alkalinity per cubic meter
of leachate, the concentration of humic substances remained approximately constant for experiment
without sludge, and increased approximately 184% for experiment without sludge removal. This
indicates dissolution of humic acids present in the particulate phase, which were not totally destroyed
during the photo-oxidation, and consequently will be discharged to the receiving water bodies, without
treatment, as there are recalcitrant to biological oxidation.
Complete nitrogen removal was not achieved during the first biological treatment, mainly due to organic
nitrogen. During the photo-Fenton oxidation it can be observed the oxidation of the organic nitrogen to
ammonium nitrogen, which increased from 22.5 to 67.3 mg NH4+-N/L (Figure 5.3). However, total
nitrogen remained approximately constant during the phototreatment.
0 2 4 6 8 10 120
200
400
600
800
1000
1200
1400
2000
3000
4000
5000
a - addition of methanol
DO
C (
mg
C/L
)
12.7 12.8 12.9 13.0
Photo-Fenton
Time (hours) x 100
14 15 16 17 18 19 20
2nd
Biological Oxidation1st Biological Oxidation
0
25
50
75
100
125
150
175
200
1000
2000
3000
4000
Nit
rog
en C
on
ten
t (m
g N
/L)
Figure 5.3. Biological/photo-Fenton/Biological treatment sequence of the raw leachate. - DOC; - Total
Dissolved Nitrogen; - Ammonium (NH4+-N); - Nitrate (NO3
--N); - Nitrite (NO2--N).

Chapter 5
152
With the purpose to assess the leachate’s biodegradability variation in the course of the treatment
process, a Zahn-Wellens test was performed on samples collected at different treatment stages, for both
the experiments analysed so far - with and without sludge removal (Figure 5.4 and Figure 5.5). First
samples were collected before and after the 1st biological oxidation process (raw leachate - RL and
LBT1, respectively), as well as after the acidification point (LAA). These samples were coincident for
both experiments. The remaining samples were taken during the photo-Fenton reaction, after certain
doses of H2O2 and UV energy (see Figure 5.5), for the experiments executed without (S1, S2 and S3) and
with (S’1, S’2, S’3 and S’4) removal of the acidic sludge produced during the acidification step.
0 4 8 12 16 20 24 28
0
10
20
30
40
50
60
70
80
90
100
Dt (
%)
Time (days)
0 4 8 12 16 20 24 28
0
10
20
30
40
50
60
70
80
90
100
Time (days)
Without sludge removal
Dt (
%)
With sludge removal
Figure 5.4. Zahn-Wellens test for samples collected before and after the 1st biological treatment and after
acidification (cross symbols), and for some samples taken during the photo-Fenton process without (solid
symbols) and with (open symbols) sludge removal after acidification: - Raw Leachate; - LBT1; - LAA; -
S1; - S2; - S3; - S’1; - S’2; - S’3; - S’4; - Reference.
According to the Zahn-Wellens test, the raw leachate presented a biodegradability percentage of 27%
and 37%, after 8 and 28 days, respectively, which is in agreement with the mineralization results
obtained in the 1st biological treatment, easily (22%) and slowly (39%) biodegradable organic fraction.
Furthermore, COD and DOC values obtained at the end of the 1st biological oxidation were rather close
to those achieved by the Zahn-Wellens test. Regarding samples collected before and after acidification,
these presented a poor biodegradability percentage (17%), contrary to what happened during the
photo-Fenton reaction. Herein, as could be expected [42, 43], it is observed a biodegradability
enhancement; concomitantly with a decrease of HS concentration (95% and 83%, for experiments
without and with sludge, respectively).
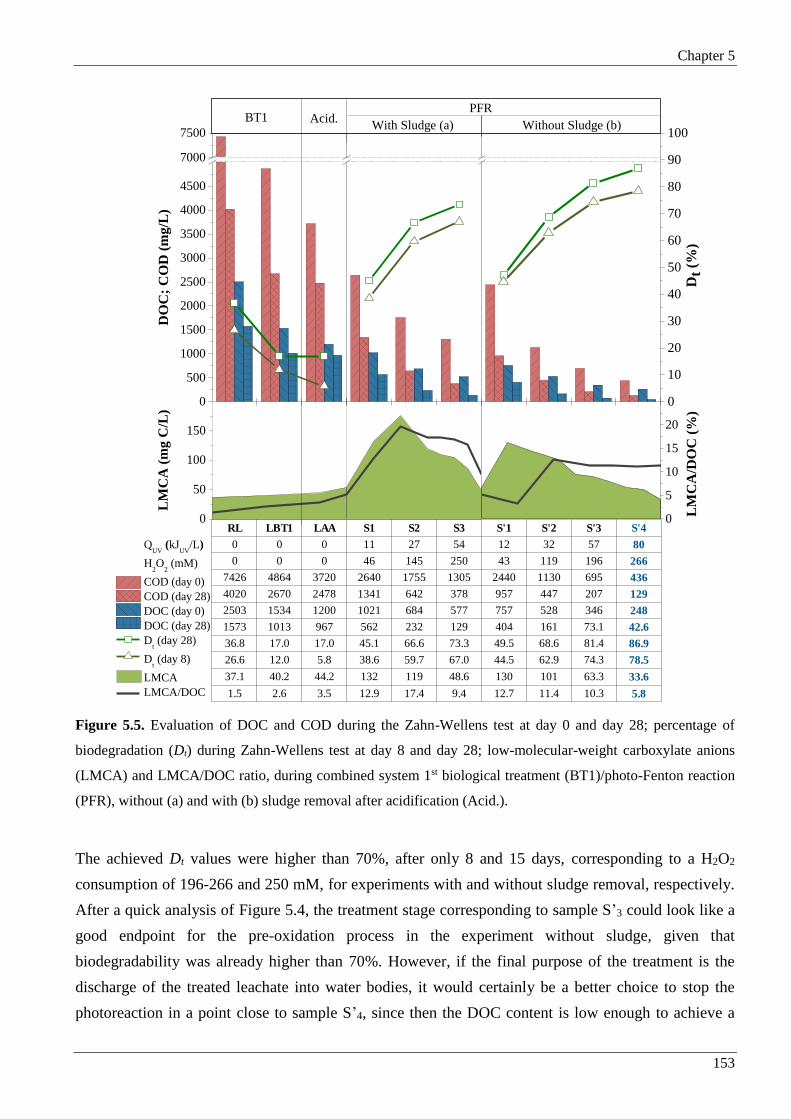
Chapter 5
153
Figure 5.5. Evaluation of DOC and COD during the Zahn-Wellens test at day 0 and day 28; percentage of
biodegradation (Dt) during Zahn-Wellens test at day 8 and day 28; low-molecular-weight carboxylate anions
(LMCA) and LMCA/DOC ratio, during combined system 1st biological treatment (BT1)/photo-Fenton reaction
(PFR), without (a) and with (b) sludge removal after acidification (Acid.).
The achieved Dt values were higher than 70%, after only 8 and 15 days, corresponding to a H2O2
consumption of 196-266 and 250 mM, for experiments with and without sludge removal, respectively.
After a quick analysis of Figure 5.4, the treatment stage corresponding to sample S’3 could look like a
good endpoint for the pre-oxidation process in the experiment without sludge, given that
biodegradability was already higher than 70%. However, if the final purpose of the treatment is the
discharge of the treated leachate into water bodies, it would certainly be a better choice to stop the
photoreaction in a point close to sample S’4, since then the DOC content is low enough to achieve a
Dt
Dt
With Sludge (a) Without Sludge (b)
RL LBT1 LAA S1 S2 S3 S'1 S'2 S'3 S'4
0 0 0 11 27 54 12 32 57 80
0 0 0 46 145 250 43 119 196 266
7426 4864 3720 2640 1755 1305 2440 1130 695 436
4020 2670 2478 1341 642 378 957 447 207 129
2503 1534 1200 1021 684 577 757 528 346 248
1573 1013 967 562 232 129 404 161 73.1 42.6
36.8 17.0 17.0 45.1 66.6 73.3 49.5 68.6 81.4 86.9
26.6 12.0 5.8 38.6 59.7 67.0 44.5 62.9 74.3 78.5
37.1 40.2 44.2 132 119 48.6 130 101 63.3 33.6
1.5 2.6 3.5 12.9 17.4 9.4 12.7 11.4 10.3 5.8
0
500
1000
1500
2000
2500
3000
3500
4000
4500
7000
7500
DO
C;
CO
D (
mg
/L)
QUV
(kJUV
/L)
H2O
2 (mM)
COD (day 0)
COD (day 28)
DOC (day 0)
DOC (day 28)
Dt (day 28)
Dt (day 8)
LMCA
LMCA/DOC
0
10
20
30
40
50
60
70
80
90
100
Dt
(%)
PFRAcid.BT1
0
50
100
150
LM
CA
(m
g C
/L)
0
5
10
15
20
LM
CA
/DO
C (
%)

Chapter 5
154
COD below 150 mg O2/L (see Figure 5.5) after biological oxidation. These results are in agreement with
others obtained in the Chapter 4, where it was demonstrated that for DOC values lower than 300 mg/L
at the end of the phototreatment, it is possible to achieve COD values below 150 mg O2/L (discharge
limit in water bodies) in a subsequent biological treatment.
As aforementioned, Figure 5.5 presents the Zahn-Wellens results, at day 0 and day 28, for some samples
collected in specific treatment points. Furthermore, this figure also displays the concentration evolution
profile of LMCA during the whole photo-Fenton reaction, as well as LMCA/DOC ratio. As predicted,
the concentration of total LMCA showed an initial increase followed by a strong decrease, suggesting
there was first the breakdown of recalcitrant macromolecules into short-chain carboxylic acids, followed
by their degradation [44]. Figure 5.5 shows maximum LMCA concentration values between 175 and
130 mg C/L (formate > oxalate > phthalate > malonate > acetate > pyruvate > valerate > citrate),
corresponding to 13-20% of DOC and a biodegradability percentage higher than 50%, for H2O2 doses
between 43 and 145 mM.
5.3.4 2nd Biological oxidation
The neutralized photo-bio-treated leachate suffered a final biological oxidation, resulting in a complete
elimination of biodegradable organic carbon fraction (82%) and nitrogen content (95%), regarding the
experiment without acid sludge (Figure 5.3). In order to perform the last nitrification it was necessary
again a long period, mainly attributed to the loss of biomass in the first denitrification step, associated
to the foam produced in result of the nitrogen gas release.
Table 5.1 presents the characteristics of the bio-photo-bio-treated leachate resulted from the two
experiments with and without sludge removal. Humic substances concentration didn’t suffer any
modification during the 2nd biological treatment, representing 46% and 67% of the final DOC,
respectively for the experiments without and with sludge removal after acidification. In both
experiments, the biological reactor operated with values of SVI close to 100 mL/g and BOD F/M ratio
equivalent to 0.2 g/g/day, and it was achieved values of COD below 500 mg O2/L (DOC < 196 mg C/L).
However, to obey the more stringent regulations related to effluent discharge into receiving water bodies,
COD < 150 mg O2/L, only the experiment performed with sludge removal after acidification reached
those requirements, with the exception of sulphate, whose concentration greatly exceeded the discharge
limits.
The COD and DOC values obtained after the 2nd biological treatment, for samples S3 and S’4
(experiments without and with acid sludge removal, respectively), are in accordance with the results of
the Zahn-Wellens test (Figure 5.5).

Chapter 5
155
5.3.5 Organic trace contaminants identification and evolution profile
Using the analytical GC-MS methods described in Chapter 2 (section 2.6), an initial target screening
analysis was conducted on the raw leachate, as well as on other samples collected in key points of the
treatment process, in order to identify and assess the evolution profile of potential trace organic
contaminants. Standard solutions were used as reference for the identification and quantification of
several VOCs, pesticides, phenols, phthalates, PAHs and PCBs, commonly present in sanitary landfill
leachates. However, within the 84 target compounds, only 13 were actually identified and quantified,
among which 3 VOCs (benzene, 1,2-dichloroethane and 1,2-dichloropropane), 4 phenols (2-nitrophenol,
2,4-dimethylphenol, 4-chloro-3-methylphenol and p-tert-octylphenol) and 6 PAHs (naphthalene,
fluorene, phenanthrene, fluoranthene, pyrene and dibenzo[a,h]anthracene) (Table 5.3). Therefore, a non-
target screening analysis followed, aiming at the identification of other distinct chromatographic peaks,
obtained through the four analytical methods.
Figure 5.6 presents the GC-MS total ion chromatograms obtained for raw leachate samples (RL),
leachate after the 1st biological treatment (LBT1), leachate after the photo-Fenton reaction and
subsequent neutralization (LPFN) and the final effluent obtained after the 2nd biological treatment
(LBT2). In this way, it was possible to evaluate the individual contribution of each biological treatment
(1st biotreatment: RL-LBT1; 2nd biotreatment: LPFN-LBT2) and photo-Fenton process (phototreatment:
LBT1-LPFN), for the removal and/or formation of each identified contaminant. Table 5.4 displays the
correspondence between each peak identified by spectrum comparison against reference spectra from
NIST library and the respective compound characteristics. Simply by visual inspection, it is easily
inferred the high efficiency of the overall treatment process, comparing the RL and BLBT2
chromatograms (Figure 5.6), as well as by the >90% total removal efficiencies calculated for the
identified contaminants, presented in Table 5.4.
Furthermore, the obtained results showed that many of the identified contaminants were originally
relatively biodegradable, being significantly removed (>80%) after the first biotreatment process.
However, the photo-Fenton reaction also played an important role for the leachate biodegradability
increase (>70%), as stated by the >50% removal of several recalcitrant compounds (Table 5.4). One
exception was spotted for compound corresponding to peak 1, identified as ethanol, 1-methoxy, acetate,
which was produced in large amounts during the phototreatment stage (-975%), probably as a result of
the degradation of other more complex aromatic compounds, as previously reported in literature. The
2nd biotreatment process efficiency was already quite low, which is in agreement with its aforementioned
contribution to the elimination of the residual biodegradable organic carbon fraction.

Chapter 5
156
Table 5.3. Contaminants’ concentrations (μg/L) along the leachate treatment process.
Contaminants RL* LBT1* LAA* LPF* LPFN* LBT2*
Pes
ticid
es
Hexachlorobutadiene <0.01 <0.01 <0.01 <0.01 <0.01 <0.01
Dichlobenil <0.01 <0.01 <0.01 <0.01 <0.01 <0.01
EPTCb <0.01 <0.01 <0.01 <0.01 <0.01 <0.01
Pentachlorobenzene <0.01 <0.01 <0.01 <0.01 <0.01 <0.01
Molinate <0.01 <0.01 <0.01 <0.01 <0.01 <0.01
Trifluralin <0.005 <0.005 <0.005 <0.005 <0.005 <0.005
α-HCHc <0.01 <0.01 <0.01 <0.01 <0.01 <0.01
Hexachlorobenzene <0.01 <0.01 <0.01 <0.01 <0.01 <0.01
β-HCHc <0.01 <0.01 <0.01 <0.01 <0.01 <0.01
γ-HCHc <0.01 <0.01 <0.01 <0.01 <0.01 <0.01
Diazinon <0.01 <0.01 <0.01 <0.01 <0.01 <0.01
Fonofos <0.01 <0.01 <0.01 <0.01 <0.01 <0.01
Chlorothalonil <0.01 <0.01 <0.01 <0.01 <0.01 <0.01
δ-HCHc <0.01 <0.01 <0.01 <0.01 <0.01 <0.01
Alachlor <0.01 <0.01 <0.01 <0.01 <0.01 <0.01
Heptachlor <0.01 <0.01 <0.01 <0.01 <0.01 <0.01
S-Metolachlor <0.01 <0.01 <0.01 <0.01 <0.01 <0.01
Aldrin <0.01 <0.01 <0.01 <0.01 <0.01 <0.01
Dichlofluanid <0.01 <0.01 <0.01 <0.01 <0.01 <0.01
Pendimethalin <0.01 <0.01 <0.01 <0.01 <0.01 <0.01
Quinalphos <0.01 <0.01 <0.01 <0.01 <0.01 <0.01
2,4-DDEd <0.005 <0.005 <0.005 <0.005 <0.005 <0.005
Endosulfan I <0.01 <0.01 <0.01 <0.01 <0.01 <0.01
4,4´-DDEd <0.005 <0.005 <0.005 <0.005 <0.005 <0.005
2,4-DDDe <0.005 <0.005 <0.005 <0.005 <0.005 <0.005
Endrin <0.01 <0.01 <0.01 <0.01 <0.01 <0.01
Endosulfan II <0.01 <0.01 <0.01 <0.01 <0.01 <0.01
4,4´-DDDe <0.005 <0.005 <0.005 <0.005 <0.005 <0.005
2,4-DDTf <0.01 <0.01 <0.01 <0.01 <0.01 <0.01
Endosulfan sulfate <0.01 <0.01 <0.01 <0.01 <0.01 <0.01
4,4´-DDTf <0.01 <0.01 <0.01 <0.01 <0.01 <0.01
o,p-methoxychlor <0.01 <0.01 <0.01 <0.01 <0.01 <0.01
p,p-methoxychlor <0.01 <0.01 <0.01 <0.01 <0.01 <0.01
VO
Cs
Dichloromethane <0.67a <0.67 <0.67 <0.67 <0.67 <0.67
1,2-(E)-Dichloroethylene <0.71 <0.71 <0.71 <0.71 <0.71 <0.71
1,1-Dichloroethane <0.77 <0.77 <0.77 <0.77 <0.77 <0.77
1,2-(Z)-Dichloroethylene <0.77 <0.77 <0.77 <0.77 <0.77 <0.77
Bromochloromethane <0.63 <0.63 <0.63 <0.63 <0.63 <0.63
Chloroform <0.68 <0.68 <0.68 <0.68 <0.68 <0.68
Benzene 3.13 <0.28 <0.28 <0.28 <0.28 <0.28
1,2-Dichloroethane 2.09 <0.33 <0.33 <0.33 <0.33 <0.33
Trichloroethene <0.71 <0.71 <0.71 <0.71 <0.71 <0.71
1,2-Dichloropropane 0.87 <0.77 <0.77 <0.77 <0.77 <0.77
Bromodichloromethane <0.71 <0.71 <0.71 <0.71 <0.71 <0.71
Tetrachloroethene <0.67 <0.67 <0.67 <0.67 <0.67 <0.67
Dibromochloromethane <0.59 <0.59 <0.59 <0.59 <0.59 <0.59
1,2-Dibromomethane <0.59 <0.59 <0.59 <0.59 <0.59 <0.59
Tribromomethane <0.59 <0.59 <0.59 <0.59 <0.59 <0.59

Chapter 5
157
Table 5.3. Contaminants’ concentrations (μg/L) along the leachate treatment process. Contaminants RL* LBT1* LAA* LPF* LPFN* LBT2*
Ph
eno
ls
2-Chlorophenol <0.01 <0.01 <0.01 <0.01 <0.01 <0.01
2-Nitrophenol 3.31 1.15 1.02 0.12 0.11 0.03
2,4-Dimethylphenol 3.21 0.44 0.21 <0.01 <0.01 <0.01
2,4-Dichlorophenol <0.01 <0.01 <0.01 <0.01 <0.01 <0.01
4-cloro-3-methylphenol 71.41 19.67 24.62 0.35 0.18 0.14
2,4,6-Trichlorophenol <0.03 <0.03 <0.03 <0.03 <0.03 <0.03
p-tert-octylphenol 1.51 0.22 0.13 <0.005 <0.005 <0.005
Pentachlorophenol <0.05 <0.05 <0.05 <0.05 <0.05 <0.05
4-Nonylphenol <0.005 <0.005 <0.005 <0.005 <0.005 <0.005
Ph
tala
tes
/
PA
Hs
/
PC
Bs
Naphthalene 0.04 <0.001 <0.001 <0.001 <0.001 <0.001
Dimethyl phtalate <0.1 <0.1 <0.1 <0.1 <0.1 <0.1
2-Bromonaphthalene <0.001 <0.001 <0.001 <0.001 <0.001 <0.001
Diethyl phtalate <0.1 <0.1 <0.1 <0.1 <0.1 <0.1
Fluorene 0.04 <0.001 <0.001 <0.001 <0.001 <0.001
Phenanthrene 0.06 0.005 <0.001 <0.001 <0.001 <0.001
Anthracene <0.001 <0.001 <0.001 <0.001 <0.001 <0.001
PCB 28 <0.001 <0.001 <0.001 <0.001 <0.001 <0.001
PCB 52 <0.001 <0.001 <0.001 <0.001 <0.001 <0.001
Di-n-buthyl phtalate <0.1 <0.1 <0.1 <0.1 <0.1 <0.1
Fluoranthene 0.03 <0.001 <0.001 <0.001 <0.001 <0.001
PCB 101 <0.001 <0.001 <0.001 <0.001 <0.001 <0.001
Pyrene 0.008 <0.001 <0.001 <0.001 <0.001 <0.001
PCB 153 <0.001 <0.001 <0.001 <0.001 <0.001 <0.001
PCB 138 <0.001 <0.001 <0.001 <0.001 <0.001 <0.001
Benz[a]anthracene <0.001 <0.001 <0.001 <0.001 <0.001 <0.001
Chrysene <0.001 <0.001 <0.001 <0.001 <0.001 <0.001
PCB 180 <0.001 <0.001 <0.001 <0.001 <0.001 <0.001
Di-2-ethylhexyl phtalate <0.1 <0.1 <0.1 <0.1 <0.1 <0.1
Di-n-octyl phtalate <0.1 <0.1 <0.1 <0.1 <0.1 <0.1
Benzo[k]fluoranthene <0.001 <0.001 <0.001 <0.001 <0.001 <0.001
Benzo[b]fluoranthene <0.001 <0.001 <0.001 <0.001 <0.001 <0.001
Benzo[a]pyrene <0.001 <0.001 <0.001 <0.001 <0.001 <0.001
Perylene <0.001 <0.001 <0.001 <0.001 <0.001 <0.001
Dibenzo[a,h]anthracene 0.006 <0.001 <0.001 <0.001 <0.001 <0.001
Indeno[1,2,3-cd]pyrene <0.001 <0.001 <0.001 <0.001 <0.001 <0.001
Benzo[ghi]perylene <0.001 <0.001 <0.001 <0.001 <0.001 <0.001
*RL – Raw leachate; LBT1 – Leachate after 1st biological treatment; LAA – Leachate after acidification; LPF – Leachate after
Photo-Fenton reaction; LPFN - Leachate after Photo-Fenton reaction and neutralization; LBT2 – Leachate after 2nd biological
treatment; aConcentration below the respective quantification limit; bEPTC – S-ethyl dipropyl(thiocarbamate); cHCH - Hexachlorocyclohexane; dDDE – Dichlorodiphenyldichloroethylene; eDDD – Dichlorodiphenyldichloroethane; fDDT - Dichlorodiphenyltrichloroethane.

Chapter 5
158
(a) (b)
(c) (d)
Figure 5.6. Non-target screening analysis of leachate samples, collected at different treatment points, by the four
methods described in Chapter 2 (section 2.6): (a) VOCs; (b) PAHs, PCBs and phthalates; (c) pesticides; (d)
phenols. Identification of contaminants removed and formed during different treatment stages (correspondence
between the compound and the respective peak number is displayed in the Table 5.4) (RL – Raw Leachate; LBT1
– Leachate after 1st biological treatment; LPFN - Leachate after Photo-Fenton reaction and neutralization; LBT2
– Leachate after 2nd biological treatment (final effluent)).
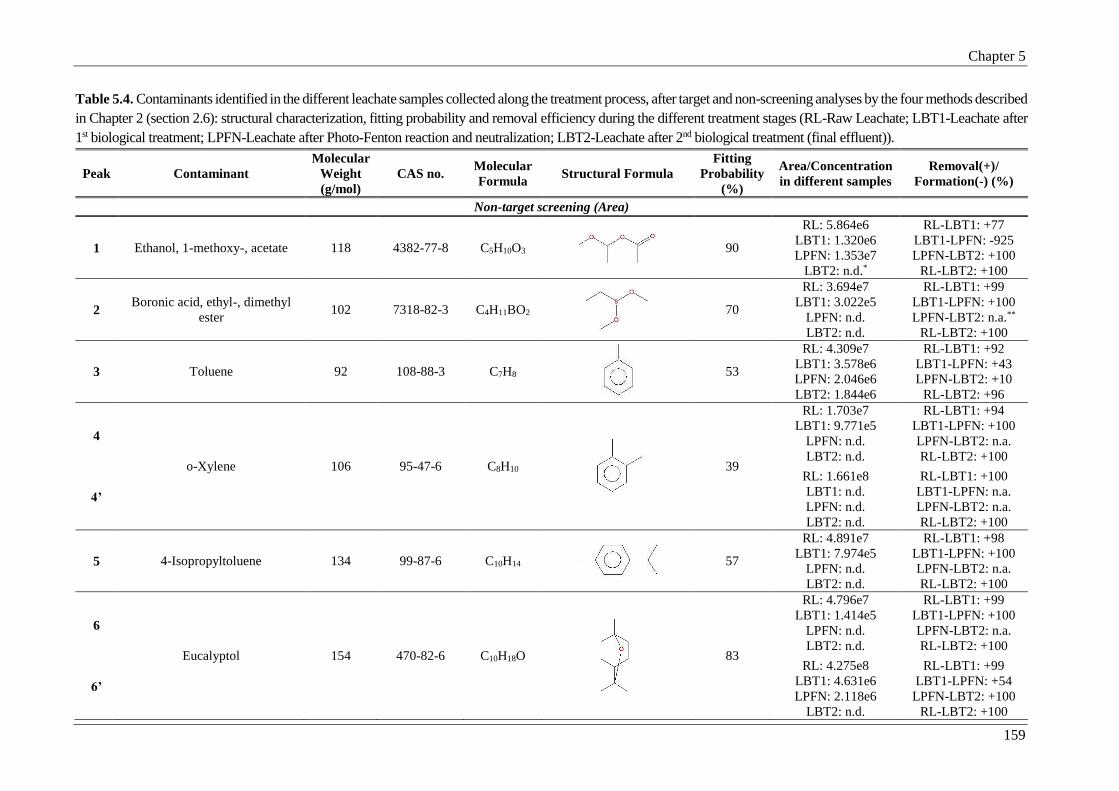
Chapter 5
159
Table 5.4. Contaminants identified in the different leachate samples collected along the treatment process, after target and non-screening analyses by the four methods described
in Chapter 2 (section 2.6): structural characterization, fitting probability and removal efficiency during the different treatment stages (RL-Raw Leachate; LBT1-Leachate after
1st biological treatment; LPFN-Leachate after Photo-Fenton reaction and neutralization; LBT2-Leachate after 2nd biological treatment (final effluent)).
Peak Contaminant
Molecular
Weight
(g/mol)
CAS no. Molecular
Formula Structural Formula
Fitting
Probability
(%)
Area/Concentration
in different samples
Removal(+)/
Formation(-) (%)
Non-target screening (Area)
1 Ethanol, 1-methoxy-, acetate 118 4382-77-8 C5H10O3
90
RL: 5.864e6
LBT1: 1.320e6
LPFN: 1.353e7
LBT2: n.d.*
RL-LBT1: +77
LBT1-LPFN: -925
LPFN-LBT2: +100
RL-LBT2: +100
2 Boronic acid, ethyl-, dimethyl
ester 102 7318-82-3 C4H11BO2
70
RL: 3.694e7
LBT1: 3.022e5
LPFN: n.d.
LBT2: n.d.
RL-LBT1: +99
LBT1-LPFN: +100
LPFN-LBT2: n.a.**
RL-LBT2: +100
3 Toluene 92 108-88-3 C7H8
53
RL: 4.309e7
LBT1: 3.578e6
LPFN: 2.046e6
LBT2: 1.844e6
RL-LBT1: +92
LBT1-LPFN: +43
LPFN-LBT2: +10
RL-LBT2: +96
4
4’
o-Xylene 106 95-47-6 C8H10
39
RL: 1.703e7
LBT1: 9.771e5
LPFN: n.d.
LBT2: n.d.
RL: 1.661e8
LBT1: n.d.
LPFN: n.d.
LBT2: n.d.
RL-LBT1: +94
LBT1-LPFN: +100
LPFN-LBT2: n.a.
RL-LBT2: +100
RL-LBT1: +100
LBT1-LPFN: n.a.
LPFN-LBT2: n.a.
RL-LBT2: +100
5 4-Isopropyltoluene 134 99-87-6 C10H14
57
RL: 4.891e7
LBT1: 7.974e5
LPFN: n.d.
LBT2: n.d.
RL-LBT1: +98
LBT1-LPFN: +100
LPFN-LBT2: n.a.
RL-LBT2: +100
6
6’
Eucalyptol 154 470-82-6 C10H18O
83
RL: 4.796e7
LBT1: 1.414e5
LPFN: n.d.
LBT2: n.d.
RL: 4.275e8
LBT1: 4.631e6
LPFN: 2.118e6
LBT2: n.d.
RL-LBT1: +99
LBT1-LPFN: +100
LPFN-LBT2: n.a.
RL-LBT2: +100
RL-LBT1: +99
LBT1-LPFN: +54
LPFN-LBT2: +100
RL-LBT2: +100

Chapter 5
160
Table 5.4. Contaminants identified in the different leachate samples collected along the treatment process, after target and non-screening analyses by the four methods described
in Chapter 2 (section 2.6): structural characterization, fitting probability and removal efficiency during the different treatment stages (RL-Raw Leachate; LBT1-Leachate after
1st biological treatment; LPFN-Leachate after Photo-Fenton reaction and neutralization; LBT2-Leachate after 2nd biological treatment (final effluent)).
Peak Contaminant
Molecular
Weight
(g/mol)
CAS no. Molecular
Formula Structural Formula
Fitting
Probability
(%)
Area/Concentration
in different samples
Removal(+)/
Formation(-) (%)
7 3-Cyclohexen-1-ol, 4-methyl-1-
(1-methylethyl)- 154 562-74-3 C10H18O
53
RL: 7.781e6
LBT1: 3.323e5
LPFN: 2.546e5
LBT2: 1.877e5
RL-LBT1: +96
LBT1-LPFN: +23
LPFN-LBT2: +26
RL-LBT2: +98
8
8’
Cyclohexanone, 2-methyl-5-(1-
methylethyl)-, trans 154 499-70-7 C10H18O
74
RL: 1.014e7
LBT1: 3.194e5
LPFN: 2.371e5
LBT2: 1.781e5
RL: 4.710e9
LBT1: 1.688e8
LPFN: 4.060e7
LBT2: 1.837e7
RL-LBT1: +97
LBT1-LPFN: +26
LPFN-LBT2: +25
RL-LBT2: +98
RL-LBT1: +96
LBT1-LPFN: +76
LPFN-LBT2: +56
RL-LBT2: +99
9 Disulfide, dimethyl 94 624-92-0 C2H6S2
95
RL: 1.674e6
LBT1: 1.428e7
LPFN: n.d.
LBT2: n.d.
RL-LBT1: -753
LBT1-LPFN: +100
LPFN-LBT2: n.a.
RL-LBT2: +100
10 Ethylbenzene 106 100-41-4 C8H10
69
RL: 4.986e7
LBT1: n.d
LPFN: n.d
LBT2: n.d.
RL-LBT1: +100
LBT1-LPFN: n.a.
LPFN-LBT2: n.a.
RL-LBT2: +100
11 1,3,5-Trimethylbenzene 120 108-67-8 C9H12
62
RL: 1.548e8
LBT1: 3.444e7
LPFN: 1.150e6
LBT2: n.d.
RL-LBT1: +78
LBT1-LPFN: +97
LPFN-LBT2: +100
RL-LBT2: +100
12
12’
Bisphenol A or
Phenol, 4,4'-(1-
methylethylidene)bis-
228 80-05-7 C15H16O2
86
RL: 1.097e9
LBT1: 6.615e7
LPFN: 6.564e6
LBT2: 4.023e6
RL: 1.527e9
LBT1: 1.581e8
LPFN: 2.738e7
LBT2: 2.267e7
RL-LBT1: +94
LBT1-LPFN: +90
LPFN-LBT2: +39
RL-LBT2: +99
RL-LBT1: +90
LBT1-LPFN: +83
LPFN-LBT2: +17
RL-LBT2: +99

Chapter 5
161
Table 5.4. Contaminants identified in the different leachate samples collected along the treatment process, after target and non-screening analyses by the four methods described
in Chapter 2 (section 2.6): structural characterization, fitting probability and removal efficiency during the different treatment stages (RL-Raw Leachate; LBT1-Leachate after
1st biological treatment; LPFN-Leachate after Photo-Fenton reaction and neutralization; LBT2-Leachate after 2nd biological treatment (final effluent)).
Peak Contaminant
Molecular
Weight
(g/mol)
CAS no. Molecular
Formula Structural Formula
Fitting
Probability
(%)
Area/Concentration
in different samples
Removal(+)/
Formation(-) (%)
13
1-Phenanthrene carboxylic acid,
1,2,3,4,4a,9,10,10a-octahydro-
1,4a-dimethyl-7-(1-
methylethyl)-, [1R-(1.alpha.,
4a.beta., 10a.alpha.)]-
300 1740-19-8 C20H28O2
81
RL: 2.715e8
LBT1: n.d.
LPFN: n.d.
LBT2: n.d.
RL-LBT1: +100
LBT1-LPFN: n.a.
LPFN-LBT2: n.a.
RL-LBT2: +100
14
14’
Phenol, 2,6-bis(1,1-
dimethylethyl)-4-nitro- 251 728-40-5 C14H21NO3
72
RL: n.d.
LBT2: 3.373e8
LPFN: n.d.
LBT2: 3.888e7
RL: n.d.
LBT1: 1.282e9
LPFN: n.d.
LBT2: 1.143e8
RL-LBT1: -100
LBT1-LPFN: +100
LPFN-LBT2: -100
RL-LBT2: +100
RL-LBT1: -100
LBT1-LPFN: +100
LPFN-LBT2: -100
RL-LBT2: +100
15 4-Amino-7-diethylamino-
chromen-2-one 232 107995-76-6 C13H16N2O2
73
RL: 6.184e7
LBT1: 2.925e7
LPFN: 1.967e7
LBT2: 4.832e6
RL-LBT1: +53
LBT1-LPFN: +38
LPFN-LBT2: +75
RL-LBT2: +92
16
7,9-Di-tert-butyl-1-
oxaspiro(4,5)deca-6,9-diene-
2,8-dione
276 82304-66-3 C17H24O3
88
RL: n.d.
LBT1: n.d.
LPFN: 7.097e7
LBT2: 3.765e6
RL-LBT1: n.a.
LBT1-LPFN: n.a.
LPFN-LBT2: +95
RL-LBT2: n.a.
17 Benzyl butyl phtalate 312 85-68-7 C19H20O4
79
RL: n.d.
LBT1: n.d.
LPFN: 9.528e6
LBT2: n.d.
RL-LBT1: n.a.
LBT1-LPFN: n.a.
LPFN-LBT2: +100
RL-LBT2: n.a.
18 Acenaphthene 154 83-32-9 C12H10
72
RL: 4.191e9
LBT1: 2.466e8
LPFN: 3.890e7
LBT2: 2.870e7
RL-LBT1: +94
LBT1-LPFN: +84
LPFN-LBT2: +26
RL-LBT2: +99
19
Cyclic
octaatomic
sulfur
256 10544-50-0 S8
97
RL: 1.210e10
LBT1: n.d.
LPFN: n.d.
LBT2: n.d.
RL-LBT1: +100
LBT1-LPFN: n.a.
LPFN-LBT2: n.a.
RL-LBT2: +100

Chapter 5
162
Table 5.4. Contaminants identified in the different leachate samples collected along the treatment process, after target and non-screening analyses by the four methods described
in Chapter 2 (section 2.6): structural characterization, fitting probability and removal efficiency during the different treatment stages (RL-Raw Leachate; LBT1-Leachate after
1st biological treatment; LPFN-Leachate after Photo-Fenton reaction and neutralization; LBT2-Leachate after 2nd biological treatment (final effluent)).
Peak Contaminant
Molecular
Weight
(g/mol)
CAS no. Molecular
Formula Structural Formula
Fitting
Probability
(%)
Area/Concentration
in different samples
Removal(+)/
Formation(-) (%)
20 3,5-di-tert-Butyl-4-
hydroxyphenylpropionic acid 278 20170-32-5 C17H26O3
84
RL: 1.243e10
LBT1: n.d.
LPFN: n.d.
LBT2: n.d.
RL-LBT1: +100
LBT1-LPFN: n.a.
LPFN-LBT2: n.a.
RL-LBT2: +100
Target screening (Concentration in µg/L)
Ph
eno
ls
2-Nitrophenol 139 88-75-5 C6H5NO3
n.a.
RL: 3.31
LBT1: 1.15
LPFN: 0.11
LBT2: 0.03
RL-LBT1: +65
LBT1-LPFN: +90
LPFN-LBT2: +73
RL-LBT2: +99
2,4-Dimethylphenol 122 105-67-9 C8H10O
n.a.
RL: 3.21
LBT1: 0.44
LPFN: n.d.
LBT2: n.d.
RL-LBT1: +86
LBT1-LPFN: +100
LPFN-LBT2: n.a.**
RL-LBT2: +100
4-cloro-3-methylphenol 143 59-50-7 C7H7ClO
n.a.
RL: 71.41
LBT1: 19.67
LPFN: 0.18
LBT2: 0.14
RL-LBT1: +72
LBT1-LPFN: +99
LPFN-LBT2: +22
RL-LBT2: +99
p-tert-octylphenol 206 140-66-9 C14H22O
n.a.
RL: 1.51
LBT1: 0.22
LPFN: n.d.
LBT2: n.d.
RL-LBT1: +85
LBT1-LPFN: +100
LPFN-LBT2: n.a.
RL-LBT2: +100
VO
Cs
Benzene 78 71-43-2 C6H6
n.a.
RL: 3.13
LBT1: n.d.
LPFN: n.d.
LBT2: n.d.
RL-LBT1: +100
LBT1-LPFN: n.a.
LPFN-LBT2: n.a.
RL-LBT2: +100
1,2-Dichloroethane 99 107-06-2 C2H4Cl2
n.a.
RL: 2.09
LBT1: n.d.
LPFN: n.d.
LBT2: n.d.
RL-LBT1: +100
LBT1-LPFN: n.a.
LPFN-LBT2: n.a.
RL-LBT2: +100
1,2-Dichloropropane 113 78-87-5 C3H6Cl2
n.a.
RL: 0.87
LBT1: n.d.
LPFN: n.d.
LBT2: n.d.
RL-LBT1: +100
LBT1-LPFN: n.a.
LPFN-LBT2: n.a.
RL-LBT2: +100

Chapter 5
163
Table 5.4. Contaminants identified in the different leachate samples collected along the treatment process, after target and non-screening analyses by the four methods described
in Chapter 2 (section 2.6): structural characterization, fitting probability and removal efficiency during the different treatment stages (RL-Raw Leachate; LBT1-Leachate after
1st biological treatment; LPFN-Leachate after Photo-Fenton reaction and neutralization; LBT2-Leachate after 2nd biological treatment (final effluent)).
Peak Contaminant
Molecular
Weight
(g/mol)
CAS no. Molecular
Formula Structural Formula
Fitting
Probability
(%)
Area/Concentration
in different samples
Removal(+)/
Formation(-) (%)
PA
Hs
Naphthalene 128 91-20-3 C10H8
n.a.
RL: 0.04
LBT1: n.d.
LPFN: n.d.
LBT2: n.d.
RL-LBT1: +100
LBT1-LPFN: n.a.
LPFN-LBT2: n.a.
RL-LBT2: +100
Fluorene 166 86-73-7 C13H10
n.a.
RL: 0.04
LBT1: n.d.
LPFN: n.d.
LBT2: n.d.
RL-LBT1: +100
LBT1-LPFN: n.a.
LPFN-LBT2: n.a.
RL-LBT2: +100
Phenanthrene 178 85-01-8 C14H10
n.a.
RL: 0.06
LBT1: 0.005
LPFN: n.d.
LBT2: n.d.
RL-LBT1: +92
LBT1-LPFN: +100
LPFN-LBT2: n.a.
RL-LBT2: +100
Fluoranthene 202 206-44-0 C16H10
n.a.
RL: 0.03
LBT1: n.d.
LPFN: n.d.
LBT2: n.d.
RL-LBT1: +100
LBT1-LPFN: n.a.
LPFN-LBT2: n.a.
RL-LBT2: +100
Pyrene 202 129-00-0 C16H10
n.a.
RL: 0.008
LBT1: n.d.
LPFN: n.d.
LBT2: n.d.
RL-LBT1: +100
LBT1-LPFN: n.a.
LPFN-LBT2: n.a.
RL-LBT2: +100
Dibenzo[a,h]anthracene 278 53-70-3 C22H14
n.a.
RL: 0.006
LBT1: n.d.
LPFN: n.d.
LBT2: n.d.
RL-LBT1: +100
LBT1-LPFN: n.a.
LPFN-LBT2: n.a.
RL-LBT2: +100
*n.d. – not detected; **n.a. – not applicable.

Chapter 5
164
5.4 Conclusions
A multistage treatment system consisting in three sequential steps, activated sludge biological
process/chemical oxidation system based on the photo-Fenton reaction/activated sludge biological
process, showed to be a successful approach for the treatment of stabilized raw leachates from sanitary
landfills, concerning the elimination of organic matter and nitrogen compounds.
Raw leachate presents a recalcitrant character, associated mainly to HS and a high ammonium nitrogen
content. Biological treatment with activated sludge, under aerobic and anoxic conditions, achieved 39%
mineralization of the organic carbon and 95% reduction of the nitrogen content. The highest nitrification
rate obtained was 8.2 mg NH4+-N per hour and gram of volatile suspended solids (VSS) (T = 26.9 ºC;
pH = 7.6), consuming 4.5 g CaCO3 per liter of raw leachate or 1.2 mg CaCO3 per mg NH4+-N. The
maximum denitrification rate obtained was 5.8 mg (NO2--N + NO3
--N)/(h.g VSS) (T = 26.4 ºC;
pH = 8.4), with a C/N consumption ratio of 2.4 mg CH3OH per mg (NO2--N + NO3
--N) (7.4 g/9.4 mL
of commercial methanol per liter of leachate), with an overall alkalinity production of 4.3 g CaCO3 per
g (NO2--N + NO3
--N) reduced.
The phototreatment process led to the depletion of HS (>80%), of low-molecular-weight carboxylate
anions (>70%) and other organic micropollutants, thus resulting in a total biodegradability increase to
>70%, being possible to couple it with a further biological treatment, achieving a final wastewater
quality in agreement with discharge limits into receiving water bodies, with the exception of sulphate
ions. Although humic acids and other organic compounds can be easily removed from the leachate by
precipitation at pH~3.0, leading to a high decrease of dissolved organic carbon and consequently
decrease of the phototreatment time and reactants consumption, the elimination of the acid sludge can
be a big concern.

Chapter 5
165
5.5 References
[1] H. Robinson, P. Maris, The treatment of leachates from domestic waste in landfill sites, Journal (Water
Pollution Control Federation), (1985) 30-38.
[2] J. Lema, R. Mendez, R. Blazquez, Characteristics of landfill leachates and alternatives for their treatment: a
review, Water, Air, and Soil Pollution, 40 (1988) 223-250.
[3] S. Renou, J. Givaudan, S. Poulain, F. Dirassouyan, P. Moulin, Landfill leachate treatment: Review and
opportunity, Journal of Hazardous Materials, 150 (2008) 468-493.
[4] A. Baun, A. Ledin, L. Reitzel, P.L. Bjerg, T.H. Christensen, Xenobiotic organic compounds in leachates from
ten Danish MSW landfills—chemical analysis and toxicity tests, Water Research, 38 (2004) 3845-3858.
[5] C.B. Öman, C. Junestedt, Chemical characterization of landfill leachates – 400 parameters and compounds,
Waste Management, 28 (2008) 1876-1891.
[6] L. Zhang, A. Li, Y. Lu, L. Yan, S. Zhong, C. Deng, Characterization and removal of dissolved organic matter
(DOM) from landfill leachate rejected by nanofiltration, Waste Management, 29 (2009) 1035-1040.
[7] H.-j. Fan, H.-Y. Shu, H.-S. Yang, W.-C. Chen, Characteristics of landfill leachates in central Taiwan, Science
of the Total Environment, 361 (2006) 25-37.
[8] S. Jonsson, J. Ejlertsson, B.H. Svensson, Behaviour of mono- and diesters of o-phthalic acid in leachates
released during digestion of municipal solid waste under landfill conditions, Advances in Environmental
Research, 7 (2003) 429-440.
[9] S.K. Marttinen, R.H. Kettunen, J.A. Rintala, Occurrence and removal of organic pollutants in sewages and
landfill leachates, The Science of The Total Environment, 301 (2003) 1-12.
[10] M. Osako, Y.-J. Kim, S.-i. Sakai, Leaching of brominated flame retardants in leachate from landfills in Japan,
Chemosphere, 57 (2004) 1571-1579.
[11] Y. Wu, S. Zhou, X. Ye, D. Chen, K. Zheng, F. Qin, Transformation of pollutants in landfill leachate treated
by a combined sequence batch reactor, coagulation, Fenton oxidation and biological aerated filter technology,
Process Safety and Environmental Protection, 89 (2011) 112-120.
[12] D.L. Jensen, A. Ledin, T.H. Christensen, Speciation of heavy metals in landfill-leachate polluted
groundwater, Water Research, 33 (1999) 2642-2650.
[13] T.H. Christensen, P. Kjeldsen, P.L. Bjerg, D.L. Jensen, J.B. Christensen, A. Baun, H.-J. Albrechtsen, G.
Heron, Biogeochemistry of landfill leachate plumes, Applied Geochemistry, 16 (2001) 659-718.
[14] J. Wiszniowski, D. Robert, J. Surmacz-Gorska, K. Miksch, J. Weber, Landfill leachate treatment methods:
A review, Environmental Chemistry Letters, 4 (2006) 51-61.
[15] A.A. Abbas, G. Jingsong, L.Z. Ping, P.Y. Ya, W.S. Al-Rekabi, Review on LandWll Leachate Treatments,
Journal of Applied Sciences Research, 5 (2009) 534-545.
[16] A.Ž. Gotvajn, T. Tišler, J. Zagorc-Končan, Comparison of different treatment strategies for industrial landfill
leachate, Journal of Hazardous Materials, 162 (2009) 1446-1456.
Chapter 5
166
[17] E.M.R. Rocha, V.J.P. Vilar, A. Fonseca, I. Saraiva, R.A.R. Boaventura, Landfill leachate treatment by solar-
driven AOPs, Solar Energy, 85 (2011) 46-56.
[18] V.J.P. Vilar, J.M.S. Moreira, A. Fonseca, I. Saraiva, R.A.R. Boaventura, Application of Fenton and Solar
Photo-Fenton Processes to the Treatment of a Sanitary Landfill Leachate in a Pilot Plant with CPCs, Journal
of Advanced Oxidation Technologies, 15 (2012) 107-116.
[19] V.J.P. Vilar, S.M.S. Capelo, T.F.C.V. Silva, R.A.R. Boaventura, Solar photo-Fenton as a pre-oxidation step
for biological treatment of landfill leachate in a pilot plant with CPCs, Catalysis Today, 161 (2011) 228-234.
[20] V.J.P. Vilar, E.M.R. Rocha, F.S. Mota, A. Fonseca, I. Saraiva, R.A.R. Boaventura, Treatment of a sanitary
landfill leachate using combined solar photo-Fenton and biological immobilized biomass reactor at a pilot
scale, Water Research, 45 (2011) 2647-2658.
[21] V.J.P. Vilar, T.F.C.V. Silva, M.A.N. Santos, A. Fonseca, I. Saraiva, R.A.R. Boaventura, Evaluation of solar
photo-Fenton parameters on the pre-oxidation of leachates from a sanitary landfill, Solar Energy, 86 (2012)
3301-3315.
[22] H. Zhang, H.J. Choi, C.-P. Huang, Optimization of Fenton process for the treatment of landfill leachate,
Journal of Hazardous Materials, 125 (2005) 166-174.
[23] O. Primo, M.J. Rivero, I. Ortiz, Photo-Fenton process as an efficient alternative to the treatment of landfill
leachates, Journal of Hazardous Materials, 153 (2008) 834-842.
[24] Y. Wu, S. Zhou, F. Qin, H. Peng, Y. Lai, Y. Lin, Removal of humic substances from landfill leachate by
Fenton oxidation and coagulation, Process Safety and Environmental Protection, 88 (2010) 276-284.
[25] E.S.K. Chian, F.B. DeWalle, Sanitary landfill leachate and their treatment, Journal of the Environmental
Engineering Division 2(1976) 411-431.
[26] C. Sawyer, P. McCarty, G. Parkin, Chemistry for Environmental Engineering and Science, McGraw-Hill
Education, 2003.
[27] Metcalf, Eddy, Wastewater Engineering Treatment and Reuse, 4th ed., Metcalf & Eddy, 2005.
[28] J.E. Alleman, Elevated nitrite occurrence in biological wastewater treatment systems, Water Science and
Technology, 17 (1984) 409-419.
[29] A. Spagni, S. Marsili-Libelli, Nitrogen removal via nitrite in a sequencing batch reactor treating sanitary
landfill leachate, Bioresource technology, 100 (2009) 609-614.
[30] G. Ruiz, D. Jeison, R. Chamy, Nitrification with high nitrite accumulation for the treatment of wastewater
with high ammonia concentration, Water Research, 37 (2003) 1371-1377.
[31] R. Canziani, V. Emondi, M. Garavaglia, F. Malpei, E. Pasinetti, G. Buttiglieri, Effect of oxygen concentration
on biological nitrification and microbial kinetics in a cross-flow membrane bioreactor (MBR) and moving-
bed biofilm reactor (MBBR) treating old landfill leachate, Journal of Membrane Science, 286 (2006) 202-
212.
[32] S. Villaverde, M. Fernandez, M. Uruena, F. Fdz-Polanco, Influence of substrate concentration on the growth
and activity of a nitrifying biofilm in a submerged biofilter, Environmental technology, 18 (1997) 921-928.

Chapter 5
167
[33] S. Suthersan, J. Ganczarczyk, Inhibition of nitrite oxidation during nitrification. Some observations, Water
pollution research journal of Canada. Burlington ON, 21 (1986) 257-266.
[34] D. Kulikowska, E. Klimiuk, Removal of organics and nitrogen from municipal landfill leachate in two-stage
SBR reactors, Polish Journal of Environmental Studies, 13 (2004) 389-396.
[35] M. Christensson, E. Lie, T. Welander, A comparison between ethanol and methanol as carbon sources for
denitrification, Water Science and Technology, 30 (1994) 83-90.
[36] O. Modin, K. Fukushi, K. Yamamoto, Denitrification with methane as external carbon source, Water
Research, 41 (2007) 2726-2738.
[37] C.W. Randall, J.L. Barnard, H.D. Stensel, in: W.W. Eckenfelder, J.F. Malina, J.W. Patterson (Eds.) Design
and retrofit of wastewater treatment plants for biological nutrient removal, Technomic Pub. Co., Lancaster,
Pa., 1992.
[38] J.J. Pignatello, E. Oliveros, A. MacKay, Advanced oxidation processes for organic contaminant destruction
based on the fenton reaction and related chemistry, Critical Reviews in Environmental Science and
Technology, 36 (2006) 1-84.
[39] J. Bacardit, I. Oller, M.I. Maldonado, E. Chamarro, S. Malato, S. Esplugas, Simple Models for the Control
of Photo-Fenton by Monitoring H2O2, Journal of Advanced Oxidation Technologies, 10 (2007) 219-228.
[40] L. Prieto-Rodríguez, I. Oller, A. Zapata, A. Agüera, S. Malato, Hydrogen peroxide automatic dosing based
on dissolved oxygen concentration during solar photo-Fenton, Catalysis Today, 161 (2011) 247-254.
[41] J.B. Gálvez, S.M. Rodríguez, Solar Detoxification, United Nations Educational, Scientific and Cultural
Organization, 2003.
[42] C. Pulgarin, M. Invernizzi, S. Parra, V. Sarria, R. Polania, P. Péringer, Strategy for the coupling of
photochemical and biological flow reactors useful in mineralization of biorecalcitrant industrial pollutants,
Catalysis Today, 54 (1999) 341-352.
[43] J. Wiszniowski, D. Robert, J. Surmacz-Gorska, K. Miksch, S. Malato, J.-V. Weber, Solar photocatalytic
degradation of humic acids as a model of organic compounds of landfill leachate in pilot-plant experiments:
influence of inorganic salts, Applied Catalysis B: Environmental, 53 (2004) 127-137.
[44] M.A. Oturan, M. Pimentel, N. Oturan, I. Sirés, Reaction sequence for the mineralization of the short-chain
carboxylic acids usually formed upon cleavage of aromatics during electrochemical Fenton treatment,
Electrochimica Acta, 54 (2008) 173-182.

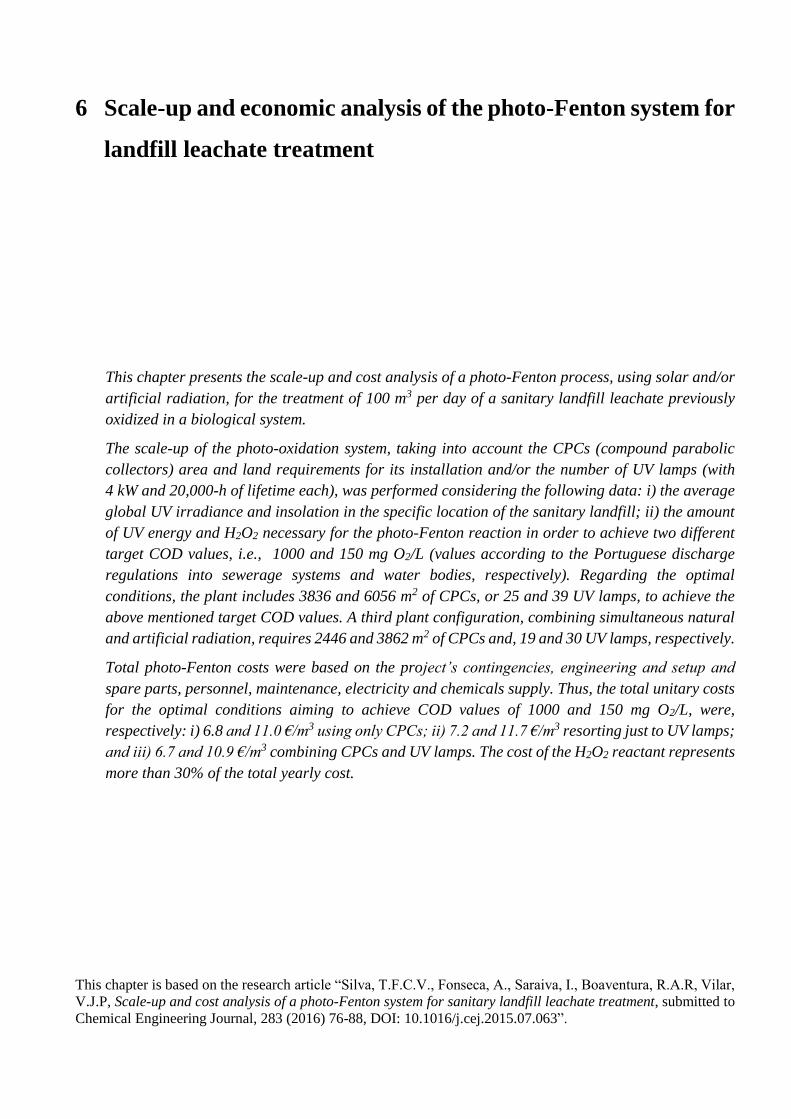
6 Scale-up and economic analysis of the photo-Fenton system for
landfill leachate treatment
This chapter presents the scale-up and cost analysis of a photo-Fenton process, using solar and/or
artificial radiation, for the treatment of 100 m3 per day of a sanitary landfill leachate previously
oxidized in a biological system.
The scale-up of the photo-oxidation system, taking into account the CPCs (compound parabolic
collectors) area and land requirements for its installation and/or the number of UV lamps (with
4 kW and 20,000-h of lifetime each), was performed considering the following data: i) the average
global UV irradiance and insolation in the specific location of the sanitary landfill; ii) the amount
of UV energy and H2O2 necessary for the photo-Fenton reaction in order to achieve two different
target COD values, i.e., 1000 and 150 mg O2/L (values according to the Portuguese discharge
regulations into sewerage systems and water bodies, respectively). Regarding the optimal
conditions, the plant includes 3836 and 6056 m2 of CPCs, or 25 and 39 UV lamps, to achieve the
above mentioned target COD values. A third plant configuration, combining simultaneous natural
and artificial radiation, requires 2446 and 3862 m2 of CPCs and, 19 and 30 UV lamps, respectively.
Total photo-Fenton costs were based on the project’s contingencies, engineering and setup and
spare parts, personnel, maintenance, electricity and chemicals supply. Thus, the total unitary costs
for the optimal conditions aiming to achieve COD values of 1000 and 150 mg O2/L, were,
respectively: i) 6.8 and 11.0 €/m3 using only CPCs; ii) 7.2 and 11.7 €/m3 resorting just to UV lamps;
and iii) 6.7 and 10.9 €/m3 combining CPCs and UV lamps. The cost of the H2O2 reactant represents
more than 30% of the total yearly cost.
This chapter is based on the research article “Silva, T.F.C.V., Fonseca, A., Saraiva, I., Boaventura, R.A.R, Vilar,
V.J.P, Scale-up and cost analysis of a photo-Fenton system for sanitary landfill leachate treatment, submitted to
Chemical Engineering Journal, 283 (2016) 76-88, DOI: 10.1016/j.cej.2015.07.063”.

Chapter 6
171
6.1 Introduction
Mature leachates present a high non-biodegradable organic fraction mainly due to the presence of humic
and fulvic acids. The best treatment strategy to reach the required level of purification to fully reduce
environmental negative impacts and to meet discharge regulations, at comfortable prices, consists in a
multistage treatment process. This strategy may include primary, secondary and tertiary processes, as
those reported in UK Environment Agency guidance [1].
Advanced oxidation processes (AOPs) have been reported to significantly enhance the biodegradability
of mature landfill leachates [2-4] and, therefore, are particularly suitable to be combined with biological
oxidation systems [5-7]. Amongst AOPs, the solar photo-Fenton process has been selected as the best
option for the pre-oxidation of mature leachates [4, 8].
The photo-Fenton reaction consists of the Fenton reaction (H2O2 + Fe2+ → Fe3+ + OH- + OH
) in the
presence of UV-Vis radiation. The radiation has a positive effect on the reaction rate by promoting the
photoreduction of ferric ions to ferrous ions, producing additional hydroxyl radicals. The regenerated
Fe2+ ions react with H2O2, generating more hydroxyl radicals. Thus, low amounts of iron are needed for
the treatment of wastewaters using a photo-Fenton process [9].
In the Chapter 5, the first pre-industrial plant for leachates treatment from a sanitary landfill located in
the North of Portugal, combining: i) an aerobic/anoxic biological system (3.5 m3 capacity); ii) a solar
photo-Fenton oxidation process, using 39.52 m2 of compound parabolic collectors (CPCs), and iii) a
further aerobic biological treatment. This multistage treatment system lead to a final effluent with COD
and total nitrogen concentrations below 150 mg O2/L and 15 mg N/L, respectively, which is in
agreement with the discharge limits into receiving water bodies, imposed by the Portuguese Legislation.
Given the promising results and in order to scale-up the process, a cost analysis must be performed to
assess the economic viability of the process.
Few studies have reported cost analysis for AOPs applied to water/wastewater treatment (see Table 6.1).
Cassano et al. [10] reported the operating costs for the combination of a sequential batch biofilter
granular reactor (SBBGR) and a solar photo-Fenton (SphF) process for the treatment of municipal
landfill leachate (CODi = 2.8-3.6 g/L; DOCi = 0.9-1.2 g/L; N-NH4,i = 1.5-2.0 g/L). The operating costs
were 3.26 €/m3 (2.54€/m3 for SBBGR and 0.72€/m3 for SphF) and 4.13€/m3 (2.54€/m3 for SBBGR and
1.59€/m3 for SphF) for a final COD of 500 and 160 mg O2/L, respectively.

Chapter 6
172
Table 6.1. Total expenditure with different treatment strategies using AOPs.
Effluent Processc Initial characteristics Final characteristics Observations Cost Reference
Landfill leachate
O3
TOC = 545 mg/L
TOC = 223 mg/L - 5184f ATS/m3
Bauer and
Fallmann [11]
O3/UV TOC = 213 mg/L UV radiation = 150 W 4704f ATS/m3
UV/H2O2 TOC = 474 mg/L UV radiation = 150 W 1954f ATS/m3
ALphF TOC = 218 mg/L UV radiation = 2×400 W 864f ATS/m3
SphF TOC = 218 mg/L Flat basin 84f ATS/m3
Water containing acetaminophen
(0.5 mM) SphF (100 m2 of CPCs) DOC ≈ 50 mg/L
DOC ≈ 35 mg/L
One H2O2 addition 0.37 €/m3
Carra et al. [12]
Continuous H2O2 dosage 0.51 €/m3
PI controlled H2O2 dosage 0.40 €/m3
DOC ≈ 10 mg/L
One H2O2 addition 1.33 €/m3
Continuous H2O2 dosage 1.32 €/m3
PI controlled H2O2 dosage 1.15 €/m3
Landfill leachate
SBBGR enhanced by O3 COD = 2.8-3.6 g/L
DOC = 0.9-1.2 g/L
NH4+-N = 1.5-2.0 g/L
Cl- = 3.0-4.0 g/L
SO42- = 1.0-1.5 g/L
COD < 500 mg/L SBBGR final:
COD = 1200 mg/L
DOC = 425 mg/L
NH4+-N = 6 mg/L
NOx-N = 9 mg/L
3.2f €/m3
Cassano et al.
[10]
SBBGR + SphF 3.2f €/m3
SBBGR/O3 + SphF
COD < 160 mg/L
4.8f €/m3
SBBGR + SphF 4.1f €/m3
SBBGR/O3 5.7f €/m3
Fuel-contaminated groundwater (2044
m3/day) with BTEXa Pt-TiO2 BTEX = 2 mg/L BTEX = 5 μg/L Solar radiation US$ 1.4/m3
Crittenden et al.
[13]
Landfill leachate SBBGR enhanced by O3 DOC = 0.9-1.2 g/L
COD = 2.2-3.2 g/L
DOC = 290 mg/L
COD =495 mg/L
Discharge in sewerage
system 4f €/m3
Di Iaconi et al.
[14]
Apple juice wastewater SphF/Ferrioxalate TOC = 678 mg/L TOC = 102 mg/L - 10.9f €/m3 Durán et al.
[15]
Real wastewater resulting from an
integrated gasification combined cycle
power station
ALphF (40 L)
Removal of 4.5 g of TOC
Initial addition of H2O2. 34f €/m3
Durán et al.
[16] ALphF (40 L)
Continuous addition of O2
and H2O2. 10f €/m3
SphF/Ferrioxalate (35 L) - 6f €/m3
Wastewater from chip-board
production (10 m3/day) SphF
CODi = 2000-4000
mg/L
CODf = 60%-100%
of CODi - 9 €/m3
Eduardo da
Hora Machado
et al. [17]
Wastewater contaminated with
pesticides (6,000 m3/year)
TiO2 – persulfate TOC = 100 mg/L TOC = 20 mg/L
CPCs (300 m2) 18 €/m3 Gálvez and
Rodríguez [18] SphF CPCs (200 m2) 9.5 €/m3
Industrial effluent (1000 m3/year)
contaminated with Orange II
(0.2 mM)
SphF - Fe/Nafion/C catalysts
Complete colour removal
CPC fixed 10.4 €/m3 Gumy et al.
[19] SphF CPC homogeneous 7.2 €/m3
SphF - Fe/Nafion/C catalysts Flat fixed 12.5 €/m3

Chapter 6
173
Table 6.1. Total expenditure with different treatment strategies using AOPs.
Effluent Processc Initial characteristics Final characteristics Observations Cost Reference
Wastewater contaminated with
Paracetamol (~1mM) SphF DOC = 100 mg/L
DOC = 20 mg/L CPCs (100 m2; t30W = 2h)
Comp. biodegradability 3.45 €/m3
Jordá et al. [20]
DOC = 65 mg/L
CPCs (100 m2; 34 W/m2; 25
min); biodegradability
sufficiently high for a
downstream BTe
0.74 €/m3
Wastewater from a sewage system,
in Malaysia
Solar detoxification with
TiO2
- - FPCd (1000 L/m2; 40 W/m2) US$ 9.5/m3 Jubran et al.
(2000) - - CPC (600 L/m2; 30 W/m2) US$ 11.1/m3
Domestic effluents with low
concentration of antibiotics
(150 m3/day)
SphF (secondary treatment) Complete antibiotics removal - 0.85 €/m3 Michael et al.
[21]
Tannery industrial effluent SphF + Electrocoagulation COD = 11,878 mg/L COD = 107 mg/L - US$ 66.2f /m3 Módenes et al.
[22]
Textile effluent SphF
COD = 1636 mg/L COD = 33-196 mg/L US$ 6.9f /m3 Módenes et al.
[23] ALphF US$ 18f /m3
Industrial wastewater (2500 m3/year)
containing alpha-methyl-
phenylglycine (500 mg/L)
SphF - - Discontinuous mode 14.1 €/m3 Muñoz et al.
[24] ALphF - - Continuous mode 12.1 €/m3
O3 - - Continuous mode 15.1 €/m3
Industrial ecotoxic wastewater (10
m3/d) contaminated with a mixture of
five commercial pesticides
(OPMDIb)
SphF/MBR
DOC = 500 mg/L DOC = 13 mg/L SphF mineraliz. = 57% 2.51 €/m3
Pérez et al. [25] DOC = 14 mg/L SphF mineraliz. = 40% 2.15 €/m3
DOC = 200 mg/L DOC = 13 mg/L SphF mineraliz. = 33% 1.53 €/m3
DOC = 50 mg/L DOC = 11 mg/L SphF mineraliz. = 20% 1.19 €/m3
Landfill leachate (40 m3/day) Coagulation + SphF DOC = 13 g/L DOC = 8 g/L
DOC removed in
coagulation = 17%
SphF mineraliz. = 27%
43 €/m3 De Torres-
Socías et al. [3]
Wastewater contaminated with
pesticides (200 m3/day)
Solar detoxification with
TiO2 C = 500 μL C = 0.1 μL 400 m2 of CPCs US$ 0.7/ m3 Vidal et al. [26]
aBTEX - benzene, toluene, ethylbenzene and xylene; bOPMDI - Oxamyl, Pyrimethanil, Methomyl, Dimethoate, Imidacloprid; cTreatment processes used: O3 – Ozonation, ALphF – Artificial Light
photo-Fenton, SphF – Solar photo-Fenton, SBBGR - Sequencing batch biofilter granular reactor, Pt-TiO2 – Platinized titanium dioxide, SphF - Fe/Nafion/C catalysts – SphF with supported Fe/Nafion/C
catalysts, MBR – Membrane bioreactor; dFPC – Flat plate collector; eBT – Biological Treatment; fOperating Costs; 1 ATS = 0.07267 €.

Chapter 6
174
Durán et al. [16] presented an operating cost of 6.0 €/m3 for the treatment of a real wastewater by a solar
photo-Fenton process. Jordá et al. [20] reported a treatment cost of 0.74 €/m3 for a
paracetamol-containing wastewater (1 mM; 100 mg DOC/L) using a photo-Fenton system. Pérez et al.
[25] carried out an economic assessment on a solar photo-Fenton/membrane bioreactor (MBR)
combined process, to treat industrial ecotoxic wastewaters (mixture of five commercial pesticides,
ranging from 50-500 mg DOC/L). The authors showed that a 30% total cost reduction could be achieved
by treating higher daily volumes, resulting in competitive costs that vary from 1.1-1.9 €/m3, depending
on the pollution load. Gumy et al. [19] reported a cost of 7.2 €/m3 for the treatment of an industrial
effluent (1000 m3/year) containing Orange II (0.2 mM) using a solar photo-Fenton process. Vidal et al.
[26] reported a treatment capacity of 42 L/h/m2 and a cost of 1 US$/m3 for wastewater containing 500
g/L of selected pesticides, with a maximum discharge level of 0.1 g/L, using a solar TiO2
photocatalytic system based on CPCs technology.
Amongst solar driven-AOPs, solar driven photo-Fenton processes have been considered the best option
considering their life-cycle greenhouse gas emission and life-cycle cost [24]. Bauer and Fallmann [11]
estimated the operational costs of several AOPs for the treatment of a landfill leachate with an initial
TOC of 545 mg/L, such as O3, O3/UV, UV/H2O2, Fe2+/H2O2/UV and solar driven photo-Fenton. The
study led to the conclusion that the photo-Fenton system driven by sunlight was by far the cheapest when
compared with the other tested AOPs. Reagents costs were 18.7 €/kg of removed TOC.
The photo-Fenton process driven by natural light can be considered an environmentally sound
technology as it generates low to zero waste and prevents pollution, according to Chapter 34 of Agenda
21 (resolution from United Nations Conference on Environment and Development (UNCED) held in
Rio de Janeiro, Brazil, in 1992).
This work is about the scale-up and cost analysis of a solar/UV photo-Fenton system for the treatment
of a sanitary leachate, previously oxidised in an aerated lagoon, taking into account two different target
COD values, 1000 and 150 mg O2/L, as required by the Portuguese discharge regulations into sewerage
systems and water bodies, respectively. The area of the CPCs and the number of UV lamps were
calculated according to the monthly variation of solar radiation power. The costs of solar UV photons
or electric UV photons were also calculated and compared. Three different treatment set-ups were
proposed for the photo-Fenton reaction considering the use of i) only natural sunlight through CPCs
technology, ii) only UV lamps and iii) the combination of natural and artificial radiation, according to
the UV radiation needs throughout the year. Finally, the main operation variables affecting the costs of
the proposed treatment line were identified.

Chapter 6
175
6.2 Experimental methodology
The scale-up and the economical assessment were performed only for the photo-Fenton process, based
on results obtained in 3 experiments. Experiment 1 (which corresponds to test carried out with acid
sludge removal presented in Chapter 5) consisted of three treatment steps: i) anoxic/aerobic biological
treatment of the raw leachate; ii) photo-Fenton reaction of the bio-treated leachate; and iii)
anoxic/aerobic biological treatment of the neutralized photo-bio-treated leachate. For experiments 2 and
3 (which correspond to tests 5 and 9, respectively, presented in the Chapter 3), only the photo-Fenton
reaction step was applied to the bio-treated leachate collected after the aerated lagoon of the leachate
treatment plant (LTP), installed at a municipal solid waste (MSW) sanitary landfill nearby Porto. Table
6.2 summarizes the values of the main physico-chemical characteristics of the bio-treated leachate
samples (BTLS) used in the three photo-reaction experiments.
Table 6.2. Characteristics of the bio-treated leachate used in the photo-Fenton reactions.
Parameters Experiment 1a Experiment 2b Experiment 3b
pH 8.4 7.0 6.5
T (ºC) 25.2 26.4 27.5
TSS (mg/L) 900 407 121
Dissolved Inorganic Carbon (mg/L) 1903 575 200
Alkalinityc (g CaCO3/L) 7.94 2.40 0.83
DOC (mg C/L) 1534 1129 1135
COD (mg O2/L) 4864 3775 2945
BOD5 (mg O2/L) 200 - -
BOD5/COD 0.04 - -
Total Dissolved Iron (mg (Fe2+ + Fe3+)/L) 7.9 7.9 6.6
Sulphate (mg SO42-/L) 6831 292 340
Chloride (mg Cl-/L) 3370 3601 3665
Total Dissolved Nitrogen (mg N/L) 210 859 1377
Ammonium Nitrogen (mg NH4+-N/L) 23 1 19
Nitrate (mg NO3--N/L) <1 757 1297
Nitrite (mg NO2--N/L) <1 <1 <1
Total Phosphorous (mg P/L) 25 40 7
aBiological oxidation was performed in the pre-industrial scale plant, located at the sanitary landfill; bBiological
oxidation was performed in the aerated lagoon of the leachate treatment plant, located at the sanitary landfill; cAlkalinity
values considering that at pH less than 8.3, the inorganic carbon was almost in the form of bicarbonates.
All the chemicals used in this work, the detailed description of the experimental unit and respective
procedures, as well as the employed analytical methods can be consulted in the Chapter 2.
Chapter 6
176
6.3 Results and discussion
6.3.1 Bio-treated leachate characterization
The conditions for scale-up and economical assessment of the photo-Fenton process were selected from
31 experiments performed during 1 year (Chapters 3-5). The different characteristics of the bio-treated
samples were taken into account, in terms of nitrogen species, sulphates, DOC and alkalinity. The BTLS
presents a high organic matter content (DOC = 1129-1534 mg C/L; COD = 2945-4864 mg O2/L) and an
intense dark-brown colour, mainly due to the presence of humic substances. A high nitrogen load (859-
1377 mg N/L), with more than 83% in the form of nitrate, can be observed in the BTLS used in
experiments 2 and 3 (see Table 6.2). These results indicate a high efficiency of the nitrification process
in the aerated lagoon of the LTP. The BTLS used in experiment 1 presents low nitrogen content, high
sulphate concentration and a low biodegradable fraction (BOD5 = 200 mg O2/L; BOD5/COD = 0.04).
These characteristics indicate the presence of recalcitrant organic matter, and consequently the need for
the application of AOPs as post or intermediate treatment, depending on the COD target value to be
achieved. The variability of the bio-treated leachate composition in terms of DOC and alkalinity has a
high influence on the photo-Fenton treatment time (i.e. UV energy and H2O2 consumption) and on the
amount of acid required to achieve a pH around 2.6-2.9, respectively.
6.3.2 Performance of the biological and photo-Fenton oxidation processes
Previous to the photo-Fenton reaction, in experiment 1, raw leachate was biologically treated in the
pre-industrial plant, under aerobic/anoxic conditions, achieving almost complete nitrogen removal
(95%) through nitrification/denitrification. The maximum nitrification and denitrification rates obtained
were 8.2 mg NH4+-N/g VSS/h (Tm = 26.9 ºC, pHm = 7.6 and DOm = 3.2 mg/L) and
5.8 mg (NO3--N+NO2
--N)/g VSS/h (Tm = 26.4 ºC and pHm = 8.4), respectively. Throughout nitrification,
about 90 mM of sodium hydroxide (~4.5 g CaCO3/L) was added to compensate for the raw leachate
alkalinity (17.1 g CaCO3/L). During denitrification, methanol was added as external carbon source
(2.4 mg CH3OH/ mg (NO3--N+NO2
--N)), and sulphuric acid (53 mM) was added to compensate the
alkalinity produced during denitrification.
The solar photo-Fenton experiments were performed at optimum operating conditions: i) pH was kept
between 2.6-2.9 (to avoid iron precipitation [27]); ii) initial iron dose was 80 mg Fe2+/L (optimum value
obtained in a previous work [28], for a leachate collected from the same sanitary landfill); and iii) H2O2
concentration was maintained in the range 100-500 mg/L during the entire reaction (to improve the

Chapter 6
177
oxidation reaction rate, minimizing the H2O2 consumption [29]). The photo-Fenton reaction showed a
mineralization efficiency between 57% and 80%, consuming 80-225 mM of H2O2 and 20-67 kJ/L of
accumulated UV energy, and led to DOC values below 500 mg/L in all experiments (Table 6.3).
6.3.3 Evaluation of the yearly solar irradiation and CPCs area requirements
Table 6.3 presents the main process operation variables necessary for scale-up and economical
assessment of a photo-Fenton system for the treatment of bio-treated leachate. The target COD values
considered were 1000 and 150 mg O2/L, according to Portuguese discharge regulations into sewerage
systems and water bodies, respectively. It should be noted that: i) for discharge into water bodies, the
photo-Fenton reaction must be performed until a biodegradable level is reached, able to be further
biologically oxidized, in order to achieve a final COD equal or less than 150 mg O2/L; and ii) for
discharge into sewerage systems, the photo-Fenton reaction must be carried out until achieving a
maximum COD value of 1000 mg O2/L. In the last case, an additional biological oxidation is not needed,
as this step will be implemented in the domestic wastewater treatment plant (WWTP). In addition to
experiments 1, 2 and 3, an ideal situation was defined. In the latter, a leachate with intermediate
characteristics between the BTLS used in the experiments 2 and 3 was considered.
Figure 6.1 shows the average solar radiation power, insolation and cloud factor, according to the specific
location of the sanitary landfill. Maximum values of approximately 20 W/m2 in spring and summer
seasons were recorded. This is in agreement with the lower cloud factor values associated with
atmospheric transparency affected by all the atmospheric components that can absorb or scatter solar
radiation. The total yearly hours of insolation depend on geographic location and were estimated by
Gálvez and Rodríguez [18]. Values between 3500 h near the equator parallel to 2500 h from 40th and
50th parallels were obtained. In the present study, the total yearly hours of insolation and yearly average
global UV radiation power, observed in the sanitary landfill, were 2944 hours and 17 W/m2, respectively.
Accordingly, the total collectors’ area (ACPC) needed for the treatment of 100 m3 of bio-treated leachate
per day (annual average value), considering the two different COD targets and leachate characteristics,
was between 3836-13525 m2.

Chapter 6
178
Table 6.3. Operation data for the treatment of 100 m3/day of sanitary landfill leachate.
Parameter Experiment 1 Experiment 2 Experiment 3 Optimal
1000* 150* 1000* 150* 1000* 1000* 150*
Daily flow – Qd (m3/day) 100 100 100 100 100 100 100
Yearly volume - Vya (m3) 36500 36500 36500 36500 36500 36500 36500
Yearly average global UV irradiation – Imb (W/m2) 17 17 17 17 17 17 17
Total yearly hours of insolation – tinsb (h) 2944 2944 2944 2944 2944 2944 2944
Yearly accumulated UV energy – Eyc (kJUV/m2) 180809 180809 180809 180809 180809 180809 180809
DOCi (mg C/L) 1534 1534 1129 1129 1135 ~1200 ~1200
DOCf (mg C/L) 498 306 400 234 493 ~518 ~252
Min.d (%) 68 80 65 79 57 57 79
Alkalinity (g CaCO3/L) 8.0 8.0 2.4 2.4 0.8 0 0
H2SO4/HCl (mM) 61/0 61/0 44/38 44/38 14 14 14
pHme 2.8 2.9 2.6 2.6 2.7 2.6-2.9 2.6-2.9
Tme (ºC) 33.9 35.2 34.3 37.0 41.1 30-40 30-40
Feme (mg/L) 39.0 33.0 61.9 51.6 60.0 30-60 30-60
H2O2 consumed (mM) 140 225 80 180 80 80 180
tPF (h) 19.1 30.4 7.9 11.9 6.4 6-8 10-12
IUVe (W/m2) 25.0 25.9 25.7 24.8 33.1 25-33 25-33
QUV (kJ/L) 40 67 19 30 20 19 30
ACPCf (m2) 8075 13525 3836 6056 4037 3836 6056
Tfm (g C/h/m2) 1.59 1.13 2.36 1.83 1.97 2.20 1.94
Tfv (L/h/m2) 1.54 0.92 3.23 2.05 3.07 3.22 2.05
Land area required for the implementation of the
CPCs – Aland (m2) 24024 40175 11370 18030 12036 11370 18030
Number of solar photons per unit of time and
potency - Nps (photons/(W.h)) 5.8x10²¹ 5.8x10²¹ 5.8x10²¹ 5.8x10²¹ 5.8x10²¹ 5.8x10²¹ 5.8x10²¹
Number of UV photons required – Nuv (photons) 2.4 x1030 3.9x1030 1.1x1030 1.8x1030 1.2x1030 1.1x1030 1.8x1030
aYearly volume of leachate generated from the sanitary landfill (Vy = 365×Qd); bValues obtained from the integration of the yearly UV radiation data since August of the 2010
until July of the 2011, using 4 W/m2 as the integration limit; cAccumulated UV energy since August of the 2010 until July of the 2011 (Ey = 3.6×Im×tins); dPhoto-Fenton
mineralization (1-DOCf/DOCi, %); epHm, Tm, Fem and IUV corresponds to average pH values, average temperature, average dissolved iron and average UV irradiance power
observed during the photo-Fenton experiments; fCPCs area required (ACPC = 1000×QUV×Vy/Ey); *Targets COD expressed in mg O2/L.

Chapter 6
179
Figure 6.1. Average global UV irradiance ( - Im), insolation ( - tm) and ‘cloud factor’
( - fc) for global UV irradiance during the years 2010 and 2011 nearby Porto, Portugal.
The total collectors’ area (ACPC) was calculated from the Eq. (6.1):
insm
yUV
CPCtI
VQA
(6.1)
were QUV is the accumulated UV energy required for the leachate treatment by the photo-Fenton
reaction, Vy is the yearly volume of leachate generated from the sanitary landfill, Im is the yearly average
global UV radiation power and tins is the total yearly hours of insolation.
Based on the CPC area, Table 6.3 also presents the number of UV photons required, which is calculated
from the Eq. (6.2):
CPCinsmpsuv AtINN (6.2)
where Nuv is the number of photons emitted up to wavelength of 387 nm, Nps is the number of photons
emitted up to wavelength of 387 nm per unit of time and potency according to the standard ASTM solar
spectrum (assuming constant spectral distribution) (5.8×10²¹ photons/W/h) [18], Im is the yearly average
global UV irradiation (W/m2), tins is the total yearly hours of insolation (h) and ACPC is the surface area
of solar collector field (m2).
Jan Feb Mar Apr May Jun Jul Aug Sep Oct Nov Dec0
4
8
12
16
20
24
Month
I m (
W/m
2)
0
2
4
6
8
10
12
14
t m (
hou
rs)
0
20
40
60
80
100
fc (
%)

Chapter 6
180
The maximum mass and volumetric treatment factors (Tfm and Tfv) (Eqs. (6.3) and (6.4)) are defined as
the amount of removed organic substances (Δm = (DOCi – DOCf) × Vy) or volume of contaminated water
(Vy), respectively, which the system is able to treat per unit of time (tins) and area of solar collectors
(ACPC). In order to achieve a final COD of 1000 mg O2/L, Tfm and Tfv values were 2.36 g C/h/m2 and
3.23 L/h/m2. If the goal is to achieve a final COD after biological treatment of 150 mg O2/L, the Tfm and
Tfv values were 1.83 g C/h/m2 and 2.05 L/h/m2.
CPCins
yfi
2
CPCins
fmAt
VDOCDOC
mAht
CgmT
(6.3)
CPCins
y
fvAt
VT
(6.4)
Solar fixed collectors are south oriented (northern hemisphere) in order to capture the maximum amount
of global UV energy, and tilted horizontally to a degree equal to the latitude (Porto city: 41º). The amount
of land required for the implementation of the CPCs was calculated based on the total CPCs area required
(2.04 m2 modules tilted 41º) and on the distance between the CPCs parallel rows, in order to minimize
the shadowing between collectors. For this purpose, the angle of sunlight at noon on 21 December
(lowest maximum sun elevation; 26º) was used as a design parameter to define the CPCs row separation
value at 3.94 m. Each CPC module of 2.04 m2 occupies 5.55 m2 of land, as can be seen in Figure 6.2.
Figure 6.2. Illustrative scheme of the CPCs’ configuration to a local with 41º of latitude.

Chapter 6
181
Navntoft et al. [30] analysed 4 years of solar UV radiation measurements performed on tilted and
horizontal planes located at Plataforma Solar de Almería, Spain. The authors showed that a photoreactor
tilted 37º (local latitude), equator faced, will receive annually about 3-4% more UV energy than the
horizontal plane. However, it was also showed that the best choice is to use different inclinations for
each month (January (58.3º); February (50.3º), March (39.4º), April (27.8º), May (18.7º), June (14.4º),
July (16.2º), August (23.6º), September (34.5º), October (46.1º), November (55.8º) and December
(60.4º)) in order to have normal sun incidence onto the plane of interest, achieving 10% to 12% global
UV gains. This is due to the large diffuse component in the UV range, a product of large Rayleigh
scattering and aerosol absorption.
Considering the high land area required for the CPCs’ implementation, i.e., 11370-40175 m2 equivalent
to 2.3 and 8.0 soccer fields (50 m × 100 m), the costs with electric UV photons production were analysed
together with the costs associated to capturing solar UV photons.
6.3.4 Solar UV photons versus electric UV photons
The comparison between solar and electric UV photons was performed considering only the costs
associated with the photoreactor, given the similarity in the costs related to the rest of system [18]. The
estimative of the unitary cost of the CPCs, according to their area, was given, five years ago, by the
Portuguese Company Ao Sol Energias Renováveis, Lda, which had the CPCs patent (see Table 6.4).
The company no longer exists.
Table 6.4. Estimative of the unitary cost of the CPCs according to their area.
ACPC (m2) Cost (€) ACPC (m2) Cost (€) ACPC (m2) Cost (€)
12 1112 69 330 3448 158
14 974 230 215 4598 154
16 877 345 198 6897 145
23 658 1149 173 11494 129
29 555 2299 164 22989 89
46 412 2874 161 - -
Table 6.5 shows the estimated yearly levelized cost (considering a fixed charge rate (FCR) of 12%,
which is equivalent to 20-year plant depreciation period) to capture different number of solar UV
photons (between the lowest and highest amount of UV photons needed to achieve a final COD of 150
and 1000 mg O2/L), using: (i) different possible yearly average UV global irradiation; (ii) the Eq. (6.1)

Chapter 6
182
to calculate the amount of CPC area required; and (iii) a power regression to express the CPC costs as a
function of CPC area, according to values presented in Table 6.4. The total yearly hours of insolation
depends on geographic location, and were estimated by Gálvez and Rodríguez [18] between 3500 h near
the equator parallel to 2500 h from 40th and 50th parallels. In this study, it was used 2944 h with a yearly
average global UV irradiation of 17 W/m2.
Table 6.5. Estimative of costs to capture of 1.1×1030, 1.8×1030, 2.4×1030 and 3.9×1030 solar UV photons at
different conditions of solar irradiation (FCR = 12%, 20 years).
Solar UV
photons
Ey
(kJUV/m2)
Im
(WUV/m2)
tins
(h)
ACPC
(m2)
Investment
Cost (€)
Yearly Cost
(€/year)
Photon Cost
(€/1x1025 photons)
1.1×1030
504000 40 3500 1355 232866 27944 0.25
441000 35 3500 1548 262673 31521 0.29
378000 30 3500 1806 301857 36223 0.33
270000 25 3000 2529 408893 49067 0.45
191520 20 2660 3565 567061 68047 0.62
180809 17 2944 3776 594704 71364 0.65
135000 15 2500 5057 757243 90869 0.83
90000 10 2500 7586 1058919 127070 1.16
27000 5 1500 25287 2866047 343926 3.13
1.8×1030
504000 40 3500 2217 363100 43572 0.24
441000 35 3500 2533 409577 49149 0.27
378000 30 3500 2956 470675 56481 0.31
270000 25 3000 4138 641449 76974 0.43
191520 20 2660 5834 852135 102256 0.57
180809 17 2944 6179 893674 107241 0.60
135000 15 2500 8276 1137925 136551 0.76
90000 10 2500 12414 1591260 190951 1.06
27000 5 1500 41379 4306871 516825 2.87
2.4×1030
504000 40 3500 2956 470675 56481 0.24
441000 35 3500 3378 530921 63711 0.27
378000 30 3500 3941 616082 73930 0.31
270000 25 3000 5517 813741 97649 0.41
191520 20 2660 7778 1081018 129722 0.54
180809 17 2944 8239 1133714 136046 0.57
135000 15 2500 11034 1443571 173228 0.72
90000 10 2500 16552 2018671 242240 1.01
27000 5 1500 55172 5463692 655643 2.73
3.9×1030
504000 40 3500 4803 725587 87070 0.22
441000 35 3500 5489 810306 97237 0.25
378000 30 3500 6404 920479 110458 0.28
270000 25 3000 8966 1215799 145896 0.37
191520 20 2660 12639 1615135 193816 0.50
180809 17 2944 13388 1693867 203264 0.52
135000 15 2500 17931 2156819 258818 0.66
90000 10 2500 26897 3016069 361928 0.93
27000 5 1500 89655 8163229 979587 2.51

Chapter 6
183
Table 6.6 presents the estimated costs associated to the generation of electric UV photons, which were
predicted considering UV lamps of 4 kW, with dominant emission spectrum at 365 nm, and according
to manufacturer data, an average lamp life time (tLL) of 20,000 hours and average efficiency of
UV-photon production of about 20%, during its lifetime.
Table 6.6. Estimative of costs associated to the generation of electric UV photons (lamps with 4 kW, 20,000
hours of total operation and 8760 hours of yearly operation (tLO)), comparing electricity cost of 0.10 and 0.15
€/kWh (FCR=12%, 20 years).
Number of Electric UV photons Unitary
cost (€)
1.1×1030 1.8×1030 2.4×1030 3.9×1030
Number of lamps 24 39 52 84
Lamp, Ballast and accessories 500 11869 19421 25895 42080
Lamp reactor cost 100 2374 3884 5179 8416
A) Investment cost 600 14242 23306 31074 50496
Yearly electricity cost (0.10€/kWh) 3504 83176 136106 181474 294896
Lamp replacement 219 5198 8507 11342 18431
Labour cost of lamp replacement 3.15 75 122 163 265
B) Operation cost 3726 88449 144735 192980 313592
Yearly cost: A×FCR+B 3798 90158 147532 196709 319652
Cost per 1×1025 UV photons 0.82 0.82 0.82 0.82
Lamp, Ballast and accessories 500 11869 19421 25895 42080
Lamp reactor cost 100 2374 3884 5179 8416
A) Investment cost 600 14242 23306 31074 50496
Yearly electricity cost (0.15€/kWh) 5256 124764 204159 272212 442344
Lamp replacement 219 5198 8507 11342 18431
Labour cost of lamp replacement 3.15 75 122 163 265
B) Operation cost 5478 130037 212788 283717 461040
Yearly cost: A×FCR+B 5550 131746 215585 287446 467100
Cost per 1×1025 UV photons 1.20 1.20 1.20 1.20
The number of lamps (NL) was calculated using Eq. (6.5), considering 8760 hours of operation per year
(tLO), a photonic flux (φ) of 5.29×1024 photons/s and the required photons number (NUV). The photonic
flux was calculated based on the energy of 1-photon (Eph = h×c/λ, [31]) and the UV lamp characteristics,
using Eq. (6.6):
LO
UV
Lt
NN
(6.5)
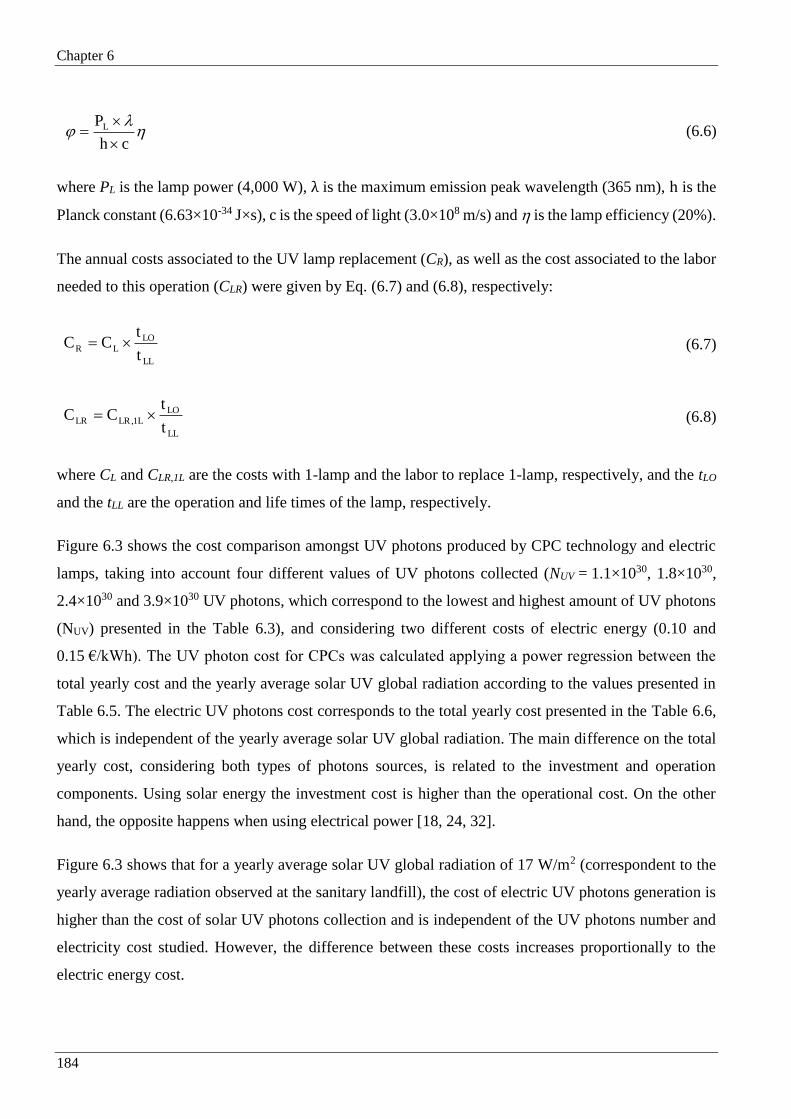
Chapter 6
184
ch
PL
(6.6)
where PL is the lamp power (4,000 W), λ is the maximum emission peak wavelength (365 nm), h is the
Planck constant (6.63×10⁻³⁴ J×s), c is the speed of light (3.0×10⁸ m/s) and is the lamp efficiency (20%).
The annual costs associated to the UV lamp replacement (CR), as well as the cost associated to the labor
needed to this operation (CLR) were given by Eq. (6.7) and (6.8), respectively:
LL
LO
LRt
tCC (6.7)
LL
LO
L1,LRLRt
tCC (6.8)
where CL and CLR,1L are the costs with 1-lamp and the labor to replace 1-lamp, respectively, and the tLO
and the tLL are the operation and life times of the lamp, respectively.
Figure 6.3 shows the cost comparison amongst UV photons produced by CPC technology and electric
lamps, taking into account four different values of UV photons collected (NUV = 1.1×1030, 1.8×1030,
2.4×1030 and 3.9×1030 UV photons, which correspond to the lowest and highest amount of UV photons
(NUV) presented in the Table 6.3), and considering two different costs of electric energy (0.10 and
0.15 €/kWh). The UV photon cost for CPCs was calculated applying a power regression between the
total yearly cost and the yearly average solar UV global radiation according to the values presented in
Table 6.5. The electric UV photons cost corresponds to the total yearly cost presented in the Table 6.6,
which is independent of the yearly average solar UV global radiation. The main difference on the total
yearly cost, considering both types of photons sources, is related to the investment and operation
components. Using solar energy the investment cost is higher than the operational cost. On the other
hand, the opposite happens when using electrical power [18, 24, 32].
Figure 6.3 shows that for a yearly average solar UV global radiation of 17 W/m2 (correspondent to the
yearly average radiation observed at the sanitary landfill), the cost of electric UV photons generation is
higher than the cost of solar UV photons collection and is independent of the UV photons number and
electricity cost studied. However, the difference between these costs increases proportionally to the
electric energy cost.

Chapter 6
185
(a)
(b)
Figure 6.3. Costs of UV photons collected using CPCs and UV photons generated with electric lamps (electricity
costs of (a) 0.15 €/kWh and (b) 0.10 €/kWh) (Based on Gálvez and Rodríguez [18] and information obtained in a
market study).
0 €
100,000 €
200,000 €
300,000 €
400,000 €
500,000 €
600,000 €
700,000 €
800,000 €
900,000 €
5 10 15 20 25 30 35 40
UV
ph
oto
n c
ost
(€
/yea
r)
Yearly average solar UV global radiation (W/m2)
Collection (A)/generation (E) of 1.1E+30 solar UV photons
Collection (B)/generation (F) of 1.8E+30 solar UV photons
Collection (C)/generation (G) of 2.4E+30 solar UV photons
Collection (D)/generation (H) of 3.9E+30 solar UV photons
D
C
B
A
1.1×1030
1.8×1030
2.4×1030
3.9×1030
H
G
F
E
0 €
100,000 €
200,000 €
300,000 €
400,000 €
500,000 €
600,000 €
700,000 €
800,000 €
900,000 €
5 10 15 20 25 30 35 40
UV
ph
oto
n c
ost
(€
/yea
r)
Yearly average solar UV global radiation (W/m2)
Collection (A)/generation (E) of 1.1E+30 solar UV photons
Collection (B)/generation (F) of 1.8E+30 solar UV photons
Collection (C)/generation (G) of 2.4E+30 solar UV photons
Collection (D)/generation (H) of 3.9E+30 solar UV photons
H
G
F
E
1.1×1030
1.8×1030
2.4×1030
3.9×1030
D
C
B
A
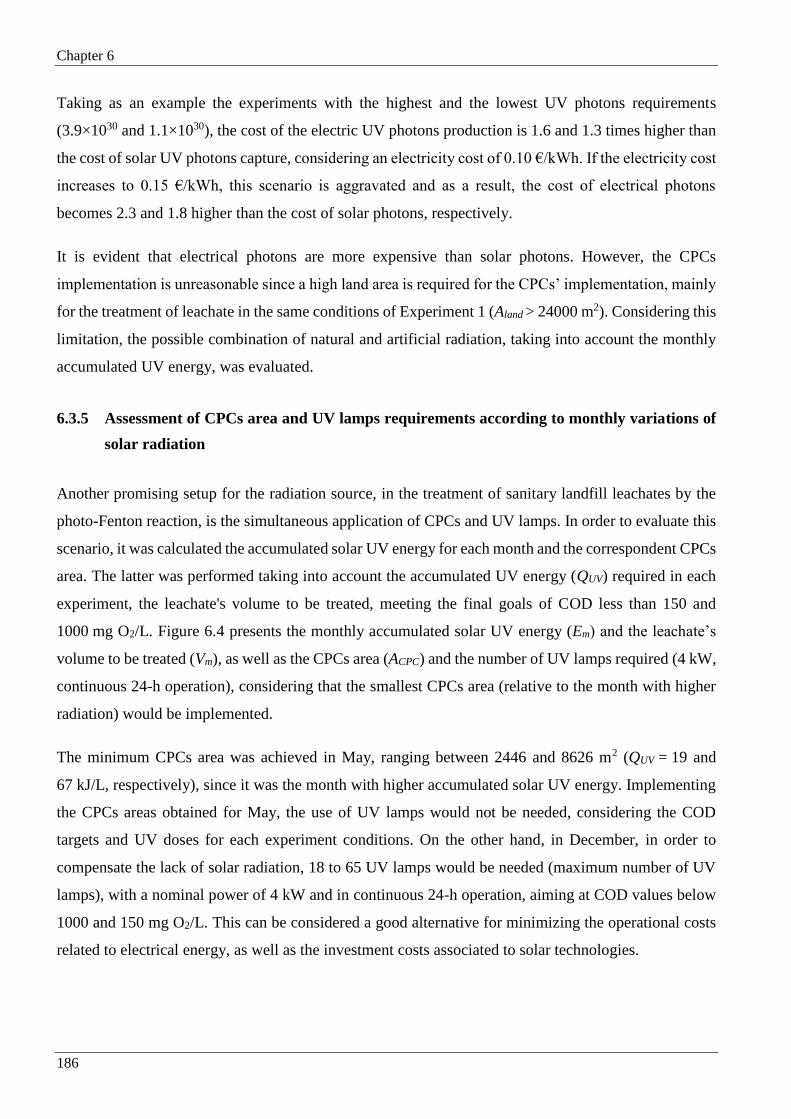
Chapter 6
186
Taking as an example the experiments with the highest and the lowest UV photons requirements
(3.9×1030 and 1.1×1030), the cost of the electric UV photons production is 1.6 and 1.3 times higher than
the cost of solar UV photons capture, considering an electricity cost of 0.10 €/kWh. If the electricity cost
increases to 0.15 €/kWh, this scenario is aggravated and as a result, the cost of electrical photons
becomes 2.3 and 1.8 higher than the cost of solar photons, respectively.
It is evident that electrical photons are more expensive than solar photons. However, the CPCs
implementation is unreasonable since a high land area is required for the CPCs’ implementation, mainly
for the treatment of leachate in the same conditions of Experiment 1 (Aland > 24000 m2). Considering this
limitation, the possible combination of natural and artificial radiation, taking into account the monthly
accumulated UV energy, was evaluated.
6.3.5 Assessment of CPCs area and UV lamps requirements according to monthly variations of
solar radiation
Another promising setup for the radiation source, in the treatment of sanitary landfill leachates by the
photo-Fenton reaction, is the simultaneous application of CPCs and UV lamps. In order to evaluate this
scenario, it was calculated the accumulated solar UV energy for each month and the correspondent CPCs
area. The latter was performed taking into account the accumulated UV energy (QUV) required in each
experiment, the leachate's volume to be treated, meeting the final goals of COD less than 150 and
1000 mg O2/L. Figure 6.4 presents the monthly accumulated solar UV energy (Em) and the leachate’s
volume to be treated (Vm), as well as the CPCs area (ACPC) and the number of UV lamps required (4 kW,
continuous 24-h operation), considering that the smallest CPCs area (relative to the month with higher
radiation) would be implemented.
The minimum CPCs area was achieved in May, ranging between 2446 and 8626 m2 (QUV = 19 and
67 kJ/L, respectively), since it was the month with higher accumulated solar UV energy. Implementing
the CPCs areas obtained for May, the use of UV lamps would not be needed, considering the COD
targets and UV doses for each experiment conditions. On the other hand, in December, in order to
compensate the lack of solar radiation, 18 to 65 UV lamps would be needed (maximum number of UV
lamps), with a nominal power of 4 kW and in continuous 24-h operation, aiming at COD values below
1000 and 150 mg O2/L. This can be considered a good alternative for minimizing the operational costs
related to electrical energy, as well as the investment costs associated to solar technologies.

Chapter 6
187
Figure 6.4. Assessment of CPCs area (bars) and number of lamps (lines) required for each
month of the year, considering different operating conditions.
6.3.6 Reagents costs
The consumption of reagents and the unitary cost associated with experiments 1-3 and operation in
optimal conditions are presented in Table 6.7. As expected, the bio-treated leachate with low alkalinity
and ammonium (which works as buffer) contents, results in 76% reduction of sulphuric acid
requirements for the preliminary acidification step of the photo-Fenton process. Consequently, the
sulphate concentration decreases and the photo-Fenton reaction velocity increases since the predominant
iron species will be FeOH2+, which is the most photoactive ferric-water complex [9, 27].
Jan. Fev. Mar. Abr. Mai. Jun. Jul. Ago. Set. Out. Nov. Dez.
3100 2800 3100 3000 3100 3000 3100 3100 3000 3100 3000 3100
6597 10194 14226 19774 24078 17309 20241 20554 19971 13995 8648 5456
67 31485 18404 14600 10165 8626 11613 10261 10105 10064 14841 23243 38065
40 18797 10987 8717 6069 5150 6933 6126 6033 6009 8860 13876 22725
30 14098 8241 6538 4552 3862 5200 4595 4525 4506 6645 10407 17044
20 9399 5494 4358 3034 2575 3466 3063 3016 3004 4430 6938 11363
19 8929 5219 4140 2883 2446 3293 2910 2866 2854 4209 6591 10794
67 61 40 34 12 0 21 13 12 11 35 51 65
40 36 24 20 7 0 12 8 7 7 21 30 39
30 27 18 15 5 0 9 6 5 5 15 23 29
20 18 12 10 3 0 6 4 3 3 10 15 19
19 17 11 9 3 0 6 3 3 3 10 14 18
0
10
20
30
40
50
60
70
0
5000
10000
15000
20000
25000
30000
35000
40000
Nu
mb
er o
f la
mp
s
AC
PC
(m2)
QU
V(k
JU
V/L
)
Vm (m3)
Em (kJ/m2)
AC
PC
(m2)
No
. o
f L
am
ps

Chapter 6
188
Table 6.7. Cost associated to reagents consumption, considering different operability conditions.
Reagent Total
Total annual
cost (€) H2O2 FeSO4 H2SO4 HCl NaOH
% (w/w) 50b - 98 33 30 - -
kg/L 1.1 - 1.84 1.16 1.33 - -
Reagent cost (€/ton) 390 300 155 115 160 - -
Consumption
(L/m3)
Exp. 1 1000a 9 0.4c 3.3 0 1.9 - -
150a 14.4 0.4c 3.3 0 1.9 - -
Exp. 2 1000a 5 0.4c 1 3.6 1.9 - -
150a 11.3 0.4c 1 3.6 1.9 - -
Exp. 3 1000a 4.8 0.4c 0.8 0 1.6 - -
Optimal 1000a 5 0.4c 0.8 0 1.6 - -
150a 11.3 0.4c 0.8 0 1.6 - -
Unitary cost
(€/m3)
Exp. 1 1000a 3.71 0.12 0.94 0 0.4 5.17 188,995
150a 5.97 0.12 0.94 0 0.4 7.43 271,321
Exp. 2 1000a 2.12 0.12 0.28 0.48 0.4 3.4 124,519
150a 4.78 0.12 0.28 0.48 0.4 6.06 221,370
Exp. 3 1000a 2.12 0.12 0.23 0 0.34 2.81 102,582
Optimal 1000a 2.12 0.12 0.23 0 0.34 2.81 102,582
150a 4.78 0.12 0.23 0 0.34 5.47 199,437
aCOD targets expressed in mg O2/L; bValue expressed in % (w/v); cValues expressed in kg/m3.
For the optimal conditions, the cost with methanol in a biological pre-oxidation step was calculated,
considering that the raw leachate presented 4 g/L of nitrogen and taking into account the methanol
consumption reported in Chapter 5. Figure 6.5 shows that at optimal conditions the cost with H2O2 is
the most representative, considering or not the methanol addition. In the absence of methanol addition,
the cost of H2O2 corresponds to 87 and 76% of the yearly total cost of reagents (199,438 € and 102,583
€), respectively for COD target values of 150 and 1000 mg O2/L. If the methanol addition is taken into
account, the contribution of H2O2 decreases, representing 68 and 49% of the total annual amount spent
on reagents (255,648 € and 158,793 €), respectively for COD target values of 150 or 1000 mg O2/L.
Methanol costs are also important and equal to 22 and 35%, considering the same COD target values.
Cassano et al. [10] obtained an unit cost for H2O2 of 1.24 € per 1 m3 of bio-treated leachate fed to the
photo-Fenton process, which is approximately 4 times less than the amount obtained for the Experiment
2, considering a target COD of 150 mg O2/L. This discrepancy can be associated with the leachate
physico-chemical characteristics at the beginning of photo-Fenton reaction. The leachate used by the
authors presented TSS, DOC and COD concentrations 5.0, 2.6 and 3.2 times lower, respectively.

Chapter 6
189
Figure 6.5. Yearly total cost of reagents for the optimal conditions, with and without
methanol contribution, considering target COD values of 150 and 1000 mg O2/L.
Bauer and Fallmann [11] achieved a total reagents cost of 84 ATS/m3 (6.1 €/m3) for the treatment of a
landfill leachate, considering DOC abatement from 545 to 218 mg/L, using a photo-Fenton process
under artificial and solar radiation. The total reagents cost is only 11.5% higher than the unitary cost
achieved in this work for the optimal conditions, regarding the COD target of 150 mg O2/L
(ΔDOC ≈ 1200-252 mg/L). The main leachate characteristics that influence the photo-Fenton reagents
cost are alkalinity and organic matter content. The optimization of the preliminary biological
pretreatment, considering the minimization of those two variables, allows a considerable reduction on
photo-Fenton reagents cost.
In order to minimize the consumption of methanol and alkalinity, the bio-treatment sequence could be
an anoxic reactor followed by an aerobic reactor with recirculation to the anoxic reactor, taking
advantage of the: i) biodegradable organic carbon fraction of the raw leachate, which corresponds to
54% of the organic carbon necessary for denitrification; and ii) raw leachate alkalinity in addition to the
one produced during denitrification, which would be sufficient to reach complete nitrification.
Moreover, this pretreatment promotes the removal of the biodegradable organic carbon fraction and,
consequently, also contributes for the reduction of accumulated UV energy and H2O2 consumption,
during photo-Fenton reaction.
150 1000 150 1000
H2O2 174,339 € 77,484 € 174,339 € 77,484 €
NaOH 12,428 € 12,428 € 12,428 € 12,428 €
H2SO4 8,310 € 8,310 € 8,310 € 8,310 €
FeSO4 4,361 € 4,361 € 4,361 € 4,361 €
CH3OH 0 € 0 € 56,210 € 56,210 €
ToTal 199,438 € 102,583 € 255,648 € 158,793 €
22%
35%
2% 4%
2%
3%
4% 8%
3%
5%
6% 12%
5%
8%
87%
76%68%
49%
199,438 € 102,583 € 255,648 € 158,793 €
0%
10%
20%
30%
40%
50%
60%
70%
80%
90%
100%
110%
120%
0%
10%
20%
30%
40%
50%
60%
70%
80%
90%
100%
110%
120%
FeSO4
CH3OH
FeSO4
Without Methanol With Methanol
H2O2
H2SO4
COD (mg/L)

Chapter 6
190
6.3.7 Total cost: comparison of the leachate phototreatment using CPCs and/or UV lamps
The overall costs associated with the sanitary landfill leachate treatment by a photo-Fenton process to
achieve a final wastewater with a COD of 150 and 1000 mg O2/L, were determined: i) taking into account
facilities, project’s contingencies, system engineering and assembly, spare parts, personnel, maintenance
material, electric and chemical supplies; and ii) not considering the costs related to the biological
treatments, before or after the photo-Fenton process.
The total yearly cost (TYC) with the leachate phototreatment is based on the initial installation cost and
the operating costs (OC) [18, 33], according to Eq. (6.9):
OCFCRTCRTYC (6.9)
where, TCR is the total capital required for the initial investment with the facility, including piping and
tanks, auxiliary equipment and control and others (direct cost), more contingencies and spare parts
(indirect cost); FCR is the fixed charge rate, estimated in 12% for 20-year plant depreciation. The
product of the TCR by the FCR represents the annual capital cost. The operating costs include the
expenses with consumables (reagents), operation and maintenance, and electricity and lamps
replacement when artificial light is used.
The scale-up and economic assessment of the photocatalytic facility were performed considering: i)
operating conditions of the experiments 1, 2 and 3 and the optimal settings; ii) a leachate derived from
a biological pre-oxidation process; iii) leachate final COD values below 150 or 1000 mg O2/L; iv) three
different setups to take advantage of the UV radiation. The setups consider i) the use of only natural
sunlight, through CPCs technology, for capturing UV photons (Table 6.8); ii) the application of artificial
radiation using solely UV lamps (Table 6.9); iii) the combination of natural and artificial radiation, using
CPCs and UV Lamps, according to the UV radiation energetic needs along the year (Table 6.10).
The usage of CPCs requires a high initial investment with the total capital required comprised between
800,000 € and 2,000,000 €. This amount can be amortized along 20-year, with a 12% FCR,
corresponding to about 39 and 49% of the total yearly cost (see Table 6.8 and Figure 6.6), depending on
the characteristics of the leachate. It is possible to observe, in Table 6.2 and Table 6.8, that the cost of
the photo-Fenton process increases proportionally to pollution load, as reported by Pérez et al. [25].
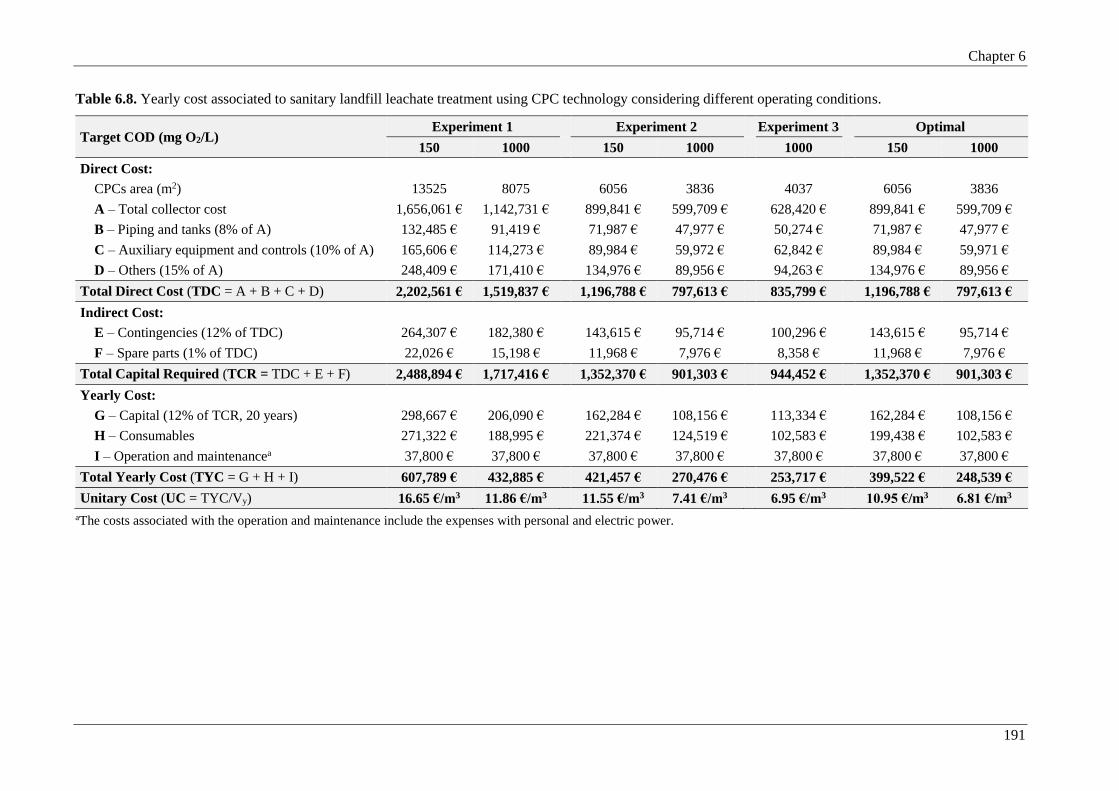
Chapter 6
191
Table 6.8. Yearly cost associated to sanitary landfill leachate treatment using CPC technology considering different operating conditions.
Target COD (mg O2/L) Experiment 1 Experiment 2 Experiment 3 Optimal
150 1000 150 1000 1000 150 1000
Direct Cost:
CPCs area (m2) 13525 8075 6056 3836 4037 6056 3836
A – Total collector cost 1,656,061 € 1,142,731 € 899,841 € 599,709 € 628,420 € 899,841 € 599,709 €
B – Piping and tanks (8% of A) 132,485 € 91,419 € 71,987 € 47,977 € 50,274 € 71,987 € 47,977 €
C – Auxiliary equipment and controls (10% of A) 165,606 € 114,273 € 89,984 € 59,972 € 62,842 € 89,984 € 59,971 €
D – Others (15% of A) 248,409 € 171,410 € 134,976 € 89,956 € 94,263 € 134,976 € 89,956 €
Total Direct Cost (TDC = A + B + C + D) 2,202,561 € 1,519,837 € 1,196,788 € 797,613 € 835,799 € 1,196,788 € 797,613 €
Indirect Cost:
E – Contingencies (12% of TDC) 264,307 € 182,380 € 143,615 € 95,714 € 100,296 € 143,615 € 95,714 €
F – Spare parts (1% of TDC) 22,026 € 15,198 € 11,968 € 7,976 € 8,358 € 11,968 € 7,976 €
Total Capital Required (TCR = TDC + E + F) 2,488,894 € 1,717,416 € 1,352,370 € 901,303 € 944,452 € 1,352,370 € 901,303 €
Yearly Cost:
G – Capital (12% of TCR, 20 years) 298,667 € 206,090 € 162,284 € 108,156 € 113,334 € 162,284 € 108,156 €
H – Consumables 271,322 € 188,995 € 221,374 € 124,519 € 102,583 € 199,438 € 102,583 €
I – Operation and maintenancea 37,800 € 37,800 € 37,800 € 37,800 € 37,800 € 37,800 € 37,800 €
Total Yearly Cost (TYC = G + H + I) 607,789 € 432,885 € 421,457 € 270,476 € 253,717 € 399,522 € 248,539 €
Unitary Cost (UC = TYC/Vy) 16.65 €/m3 11.86 €/m3 11.55 €/m3 7.41 €/m3 6.95 €/m3 10.95 €/m3 6.81 €/m3
aThe costs associated with the operation and maintenance include the expenses with personal and electric power.

Chapter 6
192
Table 6.9. Yearly cost associated to sanitary landfill leachate treatment with resource to UV lamps (4 kW, 20000 hours of total operation and 8760 hours of yearly
operation) considering different operating conditions.
Target COD (mg O2/L) Experiment 1 Experiment 2 Experiment 3 Optimal
150 1000 150 1000 1000 150 1000
Direct Cost:
Cost with lamps:
Number of lamps (NLa) 86 51 39 25 26 39 25
A – Lamp, Ballast and accessories (500NL) 43,000 € 25,500 € 19,500 € 12,500 € 13,000 € 19,500 € 12,500 €
B – Lamp reactor cost (100NL) 8,600 € 5,100 € 3,900 € 2,500 € 2,600 € 3,900 € 2,500 €
Lamp Total Cost (LTC = A + B) 51,600 € 30,600 € 23,400 € 15,000 € 15,600 € 23,400 € 15,000 €
C – Pimping and tanksb 132,485 € 91,419 € 71,987 € 47,977 € 50,274 € 71,987 € 47,977 €
D – Auxiliary equipment and controlb 165,607 € 114,273 € 89,984 € 59,971 € 62,842 € 89,984 € 59,971 €
E – Othersb 248,410 € 171,410 € 134,976 € 89,956 € 94,263 € 134,976 € 89,956 €
Total Direct Cost (TDC = LTC + C + D + E) 598,100 € 407,703 € 320,347 € 212,904 € 222,979 € 320,347 € 212,904 €
Indirect Cost:
F – Contingencies (12% of TDC) 71,772 € 48,924 € 38,442 € 25,548 € 26,757 € 38,442 € 25,548 €
G – Spare parts (1% de TDC) 5,981 € 4,077 € 3,203 € 2,129 € 2,230 € 3,203 € 2,129 €
Total Capital Required (TCR = TDC + F + G) 675,853 € 460,704 € 361,993 € 240,581 € 251,966 € 361,993 € 240,581 €
Yearly cost:
H – Capital (12% of TCR, 20 years) 81,102 € 55,284 € 43,439 € 28,870 € 30,236 € 43,439 € 28,870 €
I – Consumables 271,322 € 188,995 € 221,374 € 124,519 € 102,583 € 199,438 € 102,583 €
J – Operation and maintenance 37,800 € 37,800 € 37,800 € 37,800 € 37,800 € 37,800 € 37,800 €
K – Electricity cost (0.10€/kWh) 301,344 € 178,704 € 136,656 € 87,600 € 91,104 € 136,656 € 87,600 €
L – Lamp replacementa 18,834 € 11,169 € 8,541 € 5,475 € 5,694 € 8,541 € 5,475 €
M – Labour cost with lamp replacementa 271 € 161 € 123 € 79 € 82 € 123 € 79 €
Total Yearly Cost (TYC = H + I + J + K + L + M) 710,673 € 472,114 € 447,933 € 284,343 € 267,499 € 425,997 € 262,406 €
Unitary Cost (UC = TYC/Vy) 19.47 €/m3 12.93 €/m3 12.27 €/m3 7.79 €/m3 7.33 €/m3 11.67 €/m3 7.19 €/m3
aThe number of lamps, as well as the cost with the UV lamps replacement and the cost associated to the labour can be calculated from the Eq.s (6.5)-(6.8). bThe costs associated
with the secondary equipment (rubrics C, D and E) were considered equal to those achieved in the case of using only CPCs (rubrics B, C and D of the Table SM-6, respectively),
since the difference between solar and electric UV photons is only affected by the photocatalytic reactor, being the remaining components fairly similar [18].
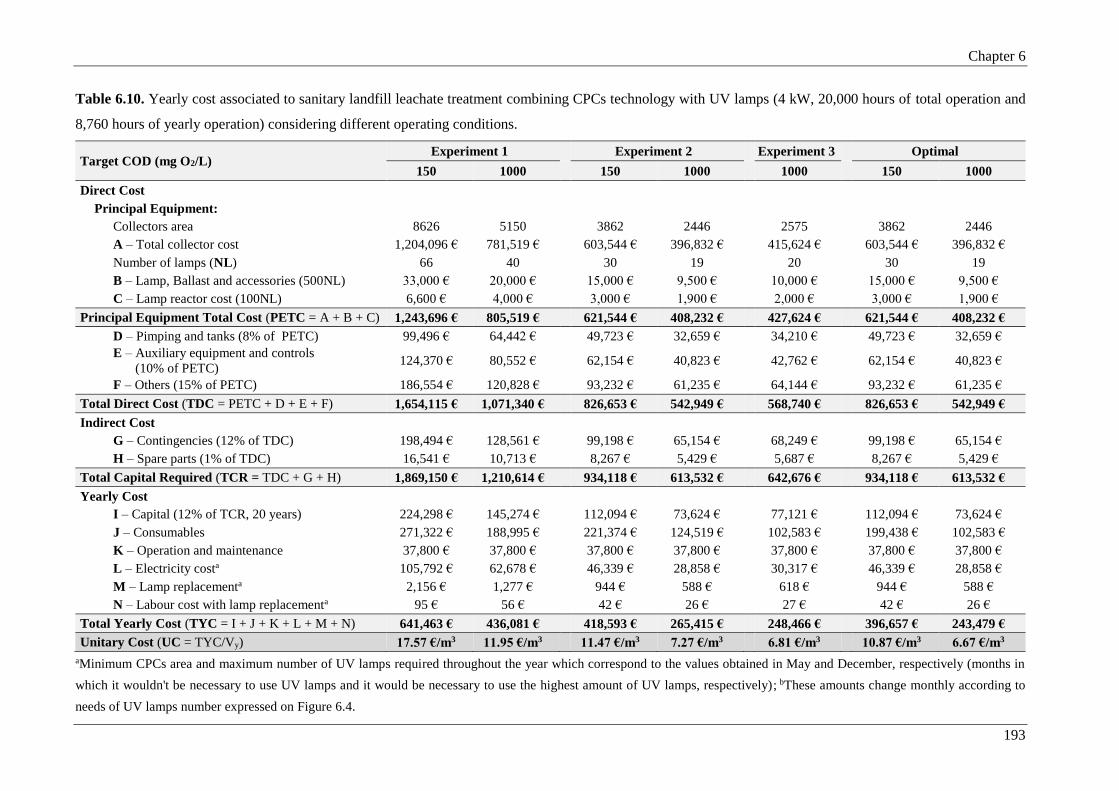
Chapter 6
193
Table 6.10. Yearly cost associated to sanitary landfill leachate treatment combining CPCs technology with UV lamps (4 kW, 20,000 hours of total operation and
8,760 hours of yearly operation) considering different operating conditions.
Target COD (mg O2/L) Experiment 1 Experiment 2 Experiment 3 Optimal
150 1000 150 1000 1000 150 1000
Direct Cost
Principal Equipment:
Collectors area 8626 5150 3862 2446 2575 3862 2446
A – Total collector cost 1,204,096 € 781,519 € 603,544 € 396,832 € 415,624 € 603,544 € 396,832 €
Number of lamps (NL) 66 40 30 19 20 30 19
B – Lamp, Ballast and accessories (500NL) 33,000 € 20,000 € 15,000 € 9,500 € 10,000 € 15,000 € 9,500 €
C – Lamp reactor cost (100NL) 6,600 € 4,000 € 3,000 € 1,900 € 2,000 € 3,000 € 1,900 €
Principal Equipment Total Cost (PETC = A + B + C) 1,243,696 € 805,519 € 621,544 € 408,232 € 427,624 € 621,544 € 408,232 €
D – Pimping and tanks (8% of PETC) 99,496 € 64,442 € 49,723 € 32,659 € 34,210 € 49,723 € 32,659 €
E – Auxiliary equipment and controls
(10% of PETC) 124,370 € 80,552 €
62,154 € 40,823 €
42,762 €
62,154 € 40,823 €
F – Others (15% of PETC) 186,554 € 120,828 € 93,232 € 61,235 € 64,144 € 93,232 € 61,235 €
Total Direct Cost (TDC = PETC + D + E + F) 1,654,115 € 1,071,340 € 826,653 € 542,949 € 568,740 € 826,653 € 542,949 €
Indirect Cost
G – Contingencies (12% of TDC) 198,494 € 128,561 € 99,198 € 65,154 € 68,249 € 99,198 € 65,154 €
H – Spare parts (1% of TDC) 16,541 € 10,713 € 8,267 € 5,429 € 5,687 € 8,267 € 5,429 €
Total Capital Required (TCR = TDC + G + H) 1,869,150 € 1,210,614 € 934,118 € 613,532 € 642,676 € 934,118 € 613,532 €
Yearly Cost
I – Capital (12% of TCR, 20 years) 224,298 € 145,274 € 112,094 € 73,624 € 77,121 € 112,094 € 73,624 €
J – Consumables 271,322 € 188,995 € 221,374 € 124,519 € 102,583 € 199,438 € 102,583 €
K – Operation and maintenance 37,800 € 37,800 € 37,800 € 37,800 € 37,800 € 37,800 € 37,800 €
L – Electricity costa 105,792 € 62,678 € 46,339 € 28,858 € 30,317 € 46,339 € 28,858 €
M – Lamp replacementa 2,156 € 1,277 € 944 € 588 € 618 € 944 € 588 €
N – Labour cost with lamp replacementa 95 € 56 € 42 € 26 € 27 € 42 € 26 €
Total Yearly Cost (TYC = I + J + K + L + M + N) 641,463 € 436,081 € 418,593 € 265,415 € 248,466 € 396,657 € 243,479 €
Unitary Cost (UC = TYC/Vy) 17.57 €/m3 11.95 €/m3 11.47 €/m3 7.27 €/m3 6.81 €/m3 10.87 €/m3 6.67 €/m3
aMinimum CPCs area and maximum number of UV lamps required throughout the year which correspond to the values obtained in May and December, respectively (months in
which it wouldn't be necessary to use UV lamps and it would be necessary to use the highest amount of UV lamps, respectively); bThese amounts change monthly according to
needs of UV lamps number expressed on Figure 6.4.

Chapter 6
194
Comparing the total unitary cost (Table 6.8) with the volumetric treatment factor (Table 6.3), one can
verify that, in general, the unitary cost decreases with the increase of the treatment factor. This means
that, as expected, the increment of the amount of contaminated wastewater to be treated leads to the
reduction of the total unitary cost [25]. The leachate phototreatment has an average cost of 0.021 € per
hour and square meter. Regarding the optimal conditions, it can be seen that in order to achieve a target
COD of 150 mg O2/L instead 1000 mg O2/L, the unitary cost increases from 6.8 until 11.0 €/m3.
Depending on the legislation applied in each municipality, it can be advantageous the discharge into the
aquatic environment or to pay to discharge into the sewerage system.
De Torres-Socías et al. [3] performed a cost analysis for the treatment of 40 m3/day of a landfill leachate,
previously treated by a physico-chemical process, using a solar photo-Fenton process (27%
mineralization, final DOC = 8 g/L). The estimated operating cost was 43€/m3. This value is considerably
higher (about 4 times) than the one obtained in this study (for optimal conditions and
COD < 150 mg O2/L), most likely due to the high organic load, which required a substantially higher
amount of H2O2 (22 g/L) and energy (137 kJ/L) to achieve an effluent with a biodegradability higher
than 70%. However, the cost per unit of DOC removal was only 1.2 times greater (14.3 € per 1 kg of
DOC eliminated when compared to 11.6 € per 1 kg of DOC removed).
Gumy et al. [19] estimated a unitary treatment cost of 7.2 €/m3, considering the treatment of 1000 m3
per year of a wastewater contaminated with 0.2 mM of Orange II (TOC~38 mg/L), using a
solar-photo-Fenton reaction. This treatment cost is very similar (+5%) to the value obtained in the
present study, considering a COD target of 1000 mg O2/L, in the optimal conditions. Gálvez and
Rodríguez [18] presented a study of a solar detoxification plant with 200 m2 of CPCs, for the treatment
of 6000 m3/year of a wastewater containing pesticides, using Fenton’s reagent. The authors obtained an
annual treatment cost of 9.5 €/m3, which is quite close (-13%) to the value calculated in our study,
considering a COD target of 150 mg O2/L, in the optimal conditions. The unitary treatment cost for a
wastewater from a sewage system, in Malaysia, using a solar detoxification process with TiO2 and CPCs
technology was reported by Jubran et al. [34]. They achieved a value of US$ 42 per 1000 gallons
(≈8.3 €/m3). Even though a different photocatalytic process was used, the cost obtained is in the range
of the values presented in this work, for the same UV photons capture system.
The use of UV lamps was considered with approximately 20,000 hours of lifetime, in a continuous
operation during 24 hours per day and 365 days per year (8760 hours), and with a nominal power of
4 kW, corresponding to a photonic flux of 5.29×1024 photons/s. As expected, the expense with the
leachate treatment is greater when using UV lamps rather than the situation in which CPCs are
exclusively used. When only UV lamps are used an increment on the costs is verified and is associated

Chapter 6
195
to electric power and the costs with reagents remain the same, when compared with CPCs technology,
as reported by García-Montaño et al. [35]. The drastic increase of electric power cost represents between
27%, for optimal settings, and 42%, for experiment 1, of the total yearly cost. In return, the contribution
of amortization capital is very low, corresponding to less than 12% of the annual cost (see Table 6.9 and
Figure 6.6). The unitary cost with electric power (2.4-8.3 €/m3) is by far lower than the cost obtained by
Bauer and Fallmann [11] (56.7 €/m3), considering the treatment of 8 L of leachate with a UV lamp of
400 W.
Table 6.9 shows that for the different treatment conditions, the total unitary cost decreases from 19.5 to
7.3 €/m3, being in optimal conditions equal to 11.7 and 7.2 €/m3, regarding targets COD of 150 and
1000 mg O2/L, respectively. The total cost in order to achieve a COD of 150 mg O2/L was very close to
the amount estimated by Muñoz et al. [24] (12.1 €/m3), considering the treatment of 2500 m3 per year
of an industrial wastewater containing 500 mg/L of alpha-methyl-phenylglycine.
The use of CPCs and UV lamps reduce the yearly capital cost in more than 20% and the annual expenses
related to electric power and lamps replacement in 60%, when compared to the application of only CPCs
or UV lamps, respectively. The costs with consumables, operation and maintenance remain the same
(see Table 6.10 and Figure 6.6).
Di Iaconi et al. [14] presented an operating cost of 4 €/m3 for a medium-age landfill leachate treatment,
using a sequencing batch biofilter granular reactor enhanced by ozonation, with the purpose of disposal
into sewerage system. The cost obtained is only 15% lower than the value obtained in this work using
the optimal conditions, to reach a COD below 1000 mg O2/L (4.7 €/m3). The total unitary cost obtained
for this configuration varies between 17.6 and 6.8 €/m3, regarding experiments 1, 2 and 3, being in the
best conditions equal to 10.9 and 6.7 €/m3, for COD values of 150 and 1000 mg O2/L, respectively.
In Portugal, the Regulatory Institute for Water and Wastes (IRAR, in Portuguese: Instituto Regulador
de Águas e Resíduos) [36] identified 341 waste dumps, 8 closed sanitary landfills and 34 open sanitary
landfills. In 2006, the leachate of 19% of the 42 reported landfills was discharged directly in a WWTP
for full treatment. For the other cases (4 closed landfills and 30 open landfills), the leachate was
discharged into one of the 32 existing LTPs (Leachate Treatment Plants), either for: i) pre-treatment and
subsequent final treatment in a WWTP (47% of the situations); or ii) for full treatment and disposal into
water bodies (64%). IRAR showed that for about 80% of existing landfills, the leachate treatment
efficiency doesn't fulfil the requisites originally defined in the projects. Furthermore, it was verified that,
in general, in order to achieve a higher treatment efficiency for stabilized leachates, it is necessary the
usage of membrane separation units, where the total cost can range between 3.9 and 10.8 €/m3. One of

Chapter 6
196
the sanitary landfills uses an evaporation/condensation system over membrane units for the leachate
treatment, resulting in a final wastewater with high quality but at much superior costs (25 €/m3). Given
the current Portuguese situation, it can be said that the treatment strategies proposed in this work are
promising and economically viable.
Figure 6.6 also compares the total unitary cost for each treatment configuration (CPCs; UV lamps and
CPCs + UV lamps) aiming to achieve COD values below 150 and 1000 mg O2/L. For all situations, the
total costs based on experiment 1 greatly exceed the costs based on experiments 2 and 3, mostly due to
the initial concentration of sulphate and alkalinity (which implies the addition of higher amounts of
sulphuric acid). This negatively affects the photo-Fenton reaction rates and increases the energetic needs,
requiring a higher CPCs area and more UV lamps.
Figure 6.6. Total cost for the sanitary landfill leachate’s treatment using different set-ups.
0
80000
160000
240000
320000
400000
480000
560000
640000
720000
0
80000
160000
240000
320000
400000
480000
560000
640000
720000
To
tal
Yea
rly
Co
st (
€)
To
tal
Yea
rly
Co
st (
€)
Capital Cost
Operating Cost
Exp. 1 Exp. 2 Exp. 3 Optimal
CPCs
UV Lamps
CPCs+UV Lamps
Capital Cost
Operating Cost
150 1000 150 1000 1000 150 1000
16.7 11.9 11.5 7.4 7.0 10.9 6.8
19.5 12.9 12.3 7.8 7.3 11.7 7.2
17.6 11.9 11.5 7.3 6.8 10.9 6.7
150 1000 150 1000 1000 150 1000
298,667 206,090 162,284 108,156 113,334 162,284 108,156
309,122 226,795 259,174 162,319 140,383 237,238 140,383
81,102 55,284 43,439 28,870 30,236 43,439 28,870
629,571 416,829 404,494 255,473 237,263 382,558 233,537
224,298 145,274 112,094 73,624 77,121 112,094 73,624
417,165 290,807 306,499 191,791 171,345 284,563 169,854 Capital Cost
Operating Cost
0
4
8
12
16
20
0
4
8
12
16
20
To
tal
Un
ita
ry
Co
st (
€/m
3)
To
tal
Un
ita
ry
Co
st (
€/m
3)
CPCs
UV Lamps
CPCs+UV Lamps
Chapter 6
197
For all scenarios, the expense associated with H2O2 consumption represents, in average, 30 and 39% of
the total yearly cost, respectively for final COD values of 1000 or 150 mg O2/L. The in-situ
electro-generation of H2O2 [37, 38] can be a good approach to decrease H2O2 costs.
The use of only CPCs or the combination of CPCs and UV lamps can be considered the best
configurations. However, according to UV radiation distribution along the year nearby Porto, in
December, even for the best conditions, 10794 m2 of CPCs would be needed, which corresponds to a
land area of 43173 m2, the equivalent to 8.6 soccer fields. Thus, the usage of CPCs should be disregarded,
since the best choice is the integration of CPCs and UV lamps, taking into account the monthly energetic
needs. It should also be noted that: i) the costs with UV lamps were calculated estimating 4 kW power
and 20000 h lifetime; and ii) the efficiency of UV lamps for the treatment of effluents with low
transmissibility, such as leachates, using a photo-Fenton is not well known.
According to the Guidance for the Treatment of Landfill Leachate [1], the treatment of 400 m3 leachate
per day with an initial COD of 6000 mg O2/L, using a sequencing batch reactor (SBR) with further
disposal into a sewer, has a total cost of 4.12 £/m3 (4.8 €/m3): i) a capital expenditure of 1,000,000 £,
corresponding to a yearly unitary cost of 0.83 £/m3 (0.97 €/m3) considering a FCR of 12%; ii) an
operational expenditure (plant operation, maintenance, and reagents or transport) of 0.80 £/m3 (0.94
€/m3); and iii) a discharge cost, including sewer connections of 2.50 £/m3 (2.92 €/m3).
In the present study, associating the costs related to SBR and disposal into sewer with the costs obtained
in the optimal conditions, to achieve COD values lower than 1000 and 150 mg O2/L, the complete
treatment of the leachate would have a total unitary cost of about 11.5 and 14.7 €/m3, respectively. To
reach a COD value of 1000 mgO2/L, the treatment sequence would be: i) biological oxidation in a SBR
(1.9 €/m3); ii) photo-Fenton reaction, using as UV photons source the combination of CPCs and UV
lamps (6.7 €/m3); and iii) disposal into sewerage system (2.9 €/m3). If the goal is to achieve a COD value
of 150 mg O2/L, the treatment sequence would be: i) biological oxidation (1.9 €/m3); ii) photo-Fenton
reaction using the combination of CPCs and UV lamps as UV photons source (10.9 €/m3); iii) biological
oxidation (1.9 €/m3); and iv) disposal into water bodies (no costs associated). It should be noted that the
costs regarding the discharge into sewerage systems can vary according to the legislation applied in each
municipality.
According to an example given in the “Guidance for the Treatment of Landfill Leachate” [1], when
leachate is transported to a WWTP, without any previous treatment, the estimated cost was 17.50 £/m3
(20.45 €/m3) [1]. This greatly exceeds the values presented in this work considering the treatment
strategy adopted.
Chapter 6
198
As a final remark, proper operation of the biological pre-treatment is a key point to minimize the leachate
phototreatment costs.
6.4 Conclusions
The scale-up of a photo-Fenton plant for the treatment of biologically oxidised landfill leachate was
successfully designed considering the combined use of solar light, through CPCs technology, and
artificial radiation (UV lamps), according to UV radiation energetic needs for the photo-oxidation step
along the year.
Appropriate operation of the preliminary biological oxidation, leading to a leachate with low alkalinity
and organic matter content, substantially reduces the costs associated with the photo-oxidation system.
Although the collection of solar photons through CPCs technology presents a higher investment cost,
the generation of electrical photons showed to be more costly mainly due to higher operation costs.
The cost analysis for leachate treatment using a photo-Fenton system led to a total unitary cost, aiming
to achieve COD values of 1000 and 150 mg O2/L, respectively of: 6.8 and 11.0 €/m3, using only CPCs;
7.2 and 11.7 €/m3, resorting just to UV lamps; and 6.7 and 10.9 €/m3, combining CPCs and UV lamps.
For all scenarios, the H2O2 costs represent between 30 to 39% of the total yearly cost.
The maximum mass and volumetric treatment factors (Tfm and Tfv) obtained were 1.83 g C/h/m2 and
2.04 L/h/m2 to achieve a final COD after biological treatment of 150 mg O2/L, considering a total of
2944 hours of insolation and a yearly average solar UV radiation of 17 W/m2 (data collected at the
location of the sanitary landfill).

Chapter 6
199
6.5 References
[1] U.E. Agency, Guidance for the Treatment of Landfill Leachate, Sector Guidance Note IPPC S5.03, in:
I.P.P.a.C. (IPPC) (Ed.), 2007.
[2] R. Chemlal, N. Abdi, N. Drouiche, H. Lounici, A. Pauss, N. Mameri, Rehabilitation of Oued Smar landfill
into a recreation park: Treatment of the contaminated waters, Ecological Engineering, 51 (2013) 244-248.
[3] E. De Torres-Socías, L. Prieto-Rodríguez, A. Zapata, I. Fernández-Calderero, I. Oller, S. Malato, Detailed
treatment line for a specific landfill leachate remediation. Brief economic assessment, Chemical Engineering
Journal, 261 (2015) 60-66.
[4] E.M.R. Rocha, V.J.P. Vilar, A. Fonseca, I. Saraiva, R.A.R. Boaventura, Landfill leachate treatment by solar-
driven AOPs, Solar Energy, 85 (2011) 46-56.
[5] R. Chemlal, L. Azzouz, R. Kernani, N. Abdi, H. Lounici, H. Grib, N. Mameri, N. Drouiche, Combination of
advanced oxidation and biological processes for the landfill leachate treatment, Ecological Engineering, 73
(2014) 281-289.
[6] V.J.P. Vilar, E.M.R. Rocha, F.S. Mota, A. Fonseca, I. Saraiva, R.A.R. Boaventura, Treatment of a sanitary
landfill leachate using combined solar photo-Fenton and biological immobilized biomass reactor at a pilot
scale, Water Research, 45 (2011) 2647-2658.
[7] Y. Wu, S. Zhou, X. Ye, D. Chen, K. Zheng, F. Qin, Transformation of pollutants in landfill leachate treated
by a combined sequence batch reactor, coagulation, Fenton oxidation and biological aerated filter technology,
Process Safety and Environmental Protection, 89 (2011) 112-120.
[8] V.J.P. Vilar, J.M.S. Moreira, A. Fonseca, I. Saraiva, R.A.R. Boaventura, Application of Fenton and Solar
Photo-Fenton Processes to the Treatment of a Sanitary Landfill Leachate in a Pilot Plant with CPCs, Journal
of Advanced Oxidation Technologies, 15 (2012) 107-116.
[9] S. Malato, P. Fernández-Ibáñez, M.I. Maldonado, J. Blanco, W. Gernjak, Decontamination and disinfection
of water by solar photocatalysis: Recent overview and trends, Catalysis Today, 147 (2009) 1-59.
[10] D. Cassano, A. Zapata, G. Brunetti, G. Del Moro, C. Di Iaconi, I. Oller, S. Malato, G. Mascolo, Comparison
of several combined/integrated biological-AOPs setups for the treatment of municipal landfill leachate:
Minimization of operating costs and effluent toxicity, Chemical Engineering Journal, 172 (2011) 250-257.
[11] R. Bauer, H. Fallmann, The photo-Fenton oxidation—a cheap and efficient wastewater treatment method,
Research on Chemical Intermediates, 23 (1997) 341-354.
[12] I. Carra, E. Ortega-Gómez, L. Santos-Juanes, J.L. Casas López, J.A. Sánchez Pérez, Cost analysis of different
hydrogen peroxide supply strategies in the solar photo-Fenton process, Chemical Engineering Journal, 224
(2013) 75-81.
[13] J.C. Crittenden, R.P.S. Suri, D.L. Perram, D.W. Hand, Decontamination of water using adsorption and
photocatalysis, Water Research, 31 (1997) 411-418.
[14] C. Di Iaconi, M. De Sanctis, S. Rossetti, A. Mancini, Bio-chemical treatment of medium-age sanitary landfill
leachates in a high synergy system, Process Biochemistry, 46 (2011) 2322-2329.

Chapter 6
200
[15] A. Durán, J.M. Monteagudo, A. Carnicer, I. San Martín, P. Serna, Solar photodegradation of synthetic apple
juice wastewater: Process optimization and operational cost study, Solar Energy Materials and Solar Cells,
107 (2012) 307-315.
[16] A. Durán, J.M. Monteagudo, I. San Martín, Photocatalytic treatment of an industrial effluent using artificial
and solar UV radiation: An operational cost study on a pilot plant scale, Journal of Environmental
Management, 98 (2012) 1-4.
[17] A. Eduardo da Hora Machado, T. Padovani Xavier, D. Rodrigues de Souza, J. Antonio de Miranda, E.
Thomas Fleury Mendonça Duarte, R. Ruggiero, L. de Oliveira, C. Sattler, Solar photo-Fenton treatment of
chip board production waste water, Solar Energy 77 (2004) 583-589.
[18] J.B. Gálvez, S.M. Rodríguez, Solar Detoxification, United Nations Educational, Scientific and Cultural
Organization, 2003.
[19] D. Gumy, P. Fernández-Ibáñez, S. Malato, C. Pulgarin, O. Enea, J. Kiwi, Supported Fe/C and Fe/Nafion/C
catalysts for the photo-Fenton degradation of Orange II under solar irradiation, Catalysis Today, 101 (2005)
375-382.
[20] L.S.-J. Jordá, M.M.B. Martín, E.O. Gómez, A.C. Reina, I.M.R. Sánchez, J.L.C. López, J.A.S. Pérez,
Economic evaluation of the photo-Fenton process. Mineralization level and reaction time: The keys for
increasing plant efficiency, Journal of Hazardous materials, 186 (2011) 1924-1929.
[21] I. Michael, E. Hapeshi, C. Michael, A.R. Varela, S. Kyriakou, C.M. Manaia, D. Fatta-Kassinos, Solar photo-
Fenton process on the abatement of antibiotics at a pilot scale: Degradation kinetics, ecotoxicity and
phytotoxicity assessment and removal of antibiotic resistant enterococci, Water Research, 46 (2012) 5621-
5634.
[22] A.N. Módenes, F.R. Espinoza-Quiñones, F.H. Borba, D.R. Manenti, Performance evaluation of an integrated
photo-Fenton – Electrocoagulation process applied to pollutant removal from tannery effluent in batch
system, Chemical Engineering Journal, 197 (2012) 1-9.
[23] A.N. Módenes, F.R. Espinoza-Quiñones, D.R. Manenti, F.H. Borba, S.M. Palácio, A. Colombo, Performance
evaluation of a photo-Fenton process applied to pollutant removal from textile effluents in a batch system,
Journal of Environmental Management, 104 (2012) 1-8.
[24] I. Muñoz, S. Malato, A. Rodríguez, X. Doménech, Integration of environmental and economic performance
of processes. Case study on advanced oxidation processes for wastewater treatment. , Journal of Advanced
Oxidation Technologies, 11 (2008) 270-275.
[25] J.A.S. Pérez, I.M.R. Sánchez, I. Carra, A.C. Reina, J.L.C. López, S. Malato, Economic evaluation of a
combined photo-Fenton/MBR process using pesticides as model pollutant. Factors affecting costs, Journal of
Hazardous materials, (2012).
[26] A. Vidal, A.I. Díaz, A. El Hraiki, M. Romero, I. Muguruza, F. Senhaji, J. González, Solar photocatalysis for
detoxification and disinfection of contaminated water: pilot plant studies, Catalysis Today, 54 (1999) 283-
290.

Chapter 6
201
[27] J.J. Pignatello, E. Oliveros, A. MacKay, Advanced oxidation processes for organic contaminant destruction
based on the fenton reaction and related chemistry, Critical Reviews in Environmental Science and
Technology, 36 (2006) 1-84.
[28] V.J.P. Vilar, T.F.C.V. Silva, M.A.N. Santos, A. Fonseca, I. Saraiva, R.A.R. Boaventura, Evaluation of solar
photo-Fenton parameters on the pre-oxidation of leachates from a sanitary landfill, Solar Energy, 86 (2012)
3301-3315.
[29] J. Bacardit, I. Oller, M.I. Maldonado, E. Chamarro, S. Malato, S. Esplugas, Simple Models for the Control
of Photo-Fenton by Monitoring H2O2, Journal of Advanced Oxidation Technologies, 10 (2007) 219-228.
[30] L.C. Navntoft, P. Fernandez-Ibañez, F. Garreta, UV solar radiation on a tilted and horizontal plane: Analysis
and comparison of 4 years of measurements, Solar Energy, 86 (2012) 307-318.
[31] J.G. Webster, The Measurement, Instrumentation, and Sensors: Handbook, Springer Verlag, 1999.
[32] J.R. Bolton, K.G. Bircher, W. Tumas, C.A. Tolman, Figures-of-merit for the technical development and
application of advanced oxidation technologies for both electric-and solar-driven systems (IUPAC Technical
Report), Pure and Applied Chemistry, 73 (2001) 627-637.
[33] G. Matthur, D. Goswami, C. Jotshi, A simulation program for predicting solar detoxification costs, in:
Energy Conversion Engineering Conference, 1996. IECEC 96., Proceedings of the 31st Intersociety, IEEE,
1996, pp. 1703-1708.
[34] B.A. Jubran, A.F. Ismail, T. Pervez, Prediction of the performance of a solar water detoxification system
under Malaysian climatic conditions, Energy Conversion and Management, 41 (2000) 1-12.
[35] J. García-Montaño, N. Ruiz, I. Muñoz, X. Domènech, J.A. García-Hortal, F. Torrades, J. Peral,
Environmental assessment of different photo-Fenton approaches for commercial reactive dye removal,
Journal of Hazardous Materials, 138 (2006) 218-225.
[36] IRAR, Gestão e tratamento de lixiviados produzidos em aterros sanitários de resíduos urbanos, Relatório
IRAR nº 03/2008, Lisboa, 2008.
[37] K.V. Plakas, A.J. Karabelas, S.D. Sklari, V.T. Zaspalis, Toward the development of a novel electro-Fenton
system for eliminating toxic organic substances from Water. Part 1. In situ generation of hydrogen peroxide,
Industrial & Engineering Chemistry Research, 52 (2013) 13948-13956.
[38] E. Brillas, I. Sirés, M.A. Oturan, Electro-Fenton process and related electrochemical technologies based on
Fenton’s reaction chemistry, Chemical Reviews, 109 (2009) 6570-6631.


7 Evaluation of solar photo-Fenton reaction parameters on the
treatment of landfill leachate after biological and
physico-chemical oxidation, at lab-scale
In the present chapter it is evaluated the effect of the main photo-Fenton (PF) reaction variables on
the treatment of a sanitary landfill leachate collected at the outlet of a leachate treatment plant,
which includes aerated lagooning followed by aerated activated sludge and a final
coagulation-flocculation step.
The PF experiments were performed in a lab-scale compound parabolic collector (CPC)
photoreactor using artificial solar radiation. The photocatalytic reaction rate was determined while
varying the total dissolved iron concentration (20 – 100 mg Fe2+/L), solution pH (2.0 - 3.6),
operating temperature (10 - 50ºC), type of acid used for acidification (H2SO4, HCl and
H2SO4+HCl) and UV irradiance (22 – 68 W/m2).
This work also tries to elucidate the role of ferric hydroxides, ferric sulphate and ferric chloride
species, by taking advantage of ferric speciation diagrams, in the efficiency of the PF reaction when
applied to leachate oxidation. The molar fraction of the most photoactive ferric species, FeOH2+,
was linearly correlated with the PF pseudo-first order kinetic constants obtained at different
solution pH and temperature values. Ferric ion speciation diagrams also showed that the presence
of high amounts of chloride ions negatively affected the PF reaction, due to the decrease of ferric
ions solubility and scavenging of hydroxyl radicals for chlorine radical formation. The increment
of the PF reaction rates with temperature was mainly associated with the increase of the molar
fraction of FeOH2+.
The optimal parameters for the photo-Fenton reaction were: pH = 2.8 (acidification agent: H2SO4);
T = 30ºC; [Fe2+] = 60 mg/L and UV irradiance = 44 WUV/m2, achieving 72% mineralization after
25 kJUV/L of accumulated UV energy and 149 mM of H2O2 consumed.
This chapter is based on the research article “Silva, T.F.C.V., Ferreira, R., Soares, P.A., Manenti, D.R.,
Fonseca, A., Saraiva, I., Boaventura, R.A.R, Vilar, V.J.P, Insights into solar photo-Fenton reaction
parameters in the oxidation of a sanitary landfill leachate at lab-scale, Journal of Environmental
Management, 164 (2015) 32-40, DOI: 10.1016/j.jenvman.2015.08.030 ”.


Chapter 7
205
7.1 Introduction
Leachate treatment plant (LTP) design constitutes nowadays a challenge for environmental engineers,
mainly due to the recalcitrant character of leachates with high organic (e.g. humic and fulvic acids) and
inorganic contaminants concentration (e.g. ammonium nitrogen, heavy metals) [1, 2]. Normally,
resulting in a complex LTP to achieve a final wastewater with quality enough to be discharged into
receiving water bodies, at comfortable costs, without the generation of further wastes. LTP normally
combines different processes, as: (i) conventional combined treatment with domestic sewage or
recycling back the treated effluent to the landfill; (ii) aerobic and anaerobic biological processes; (iii)
chemical and physical methods (flotation, coagulation/flocculation, adsorption, chemical precipitation,
chemical oxidation, ammonium stripping and ion exchange); (iv) membrane filtration (microfiltration,
ultrafiltration, nanofiltration and reverse osmosis); (v) advanced oxidation processes - AOPs (TiO2/UV,
H2O2/UV, Fenton (Fe2+/H2O2)/photo-Fenton (Fe2+/H2O2/UV)/electro-Fenton/electro-photo-Fenton,
ozone (O3, O3/UV, and O3/H2O2), etc.) [3-10].
The photo-Fenton reaction has been proposed as a good option for biodegradability enhancement of old
recalcitrant leachates from sanitary landfills [7, 11-15], being possible to couple it with a further
biological process to achieve the discharge limits. In the Chapters 3-5, the first results at pre-industrial
plant scale for the treatment of leachates after lagooning, by combining a solar photo-Fenton oxidation
process using 39.52 m2 of compound parabolic collectors (CPCs) and an aerobic/anoxic biological
system (3.5 m3 capacity), were presented. According to the results obtained, two of the main observed
drawbacks were related to: (i) the inner filter effect consisting in the absorption of photons by other
absorbing species, mainly humic acids, associated with the dark-brown colour intrinsic to leachates; and
(ii) the high amount of suspended solids generated during the acidification step required by the
photo-Fenton reaction, due to the precipitation of some organic compounds with ferric ions. The high
amount of suspended solids decreases the light penetration, competes with H2O2 and iron species as
photons absorbers, and leads to a high consumption of H2O2 during the phototreatment due to the
oxidation of particulate organic matter. Considering these aspects, a preliminary physico-chemical
process can be a good option to significantly reduce the organic load (through the sludge production)
and the light absorption species, boosting the phototreatment efficiency.
This study mainly focuses on the optimization of sanitary landfill leachate treatment, collected at the
outlet of a LTP, which includes biological oxidation and physic-chemical processes, by a photo-Fenton
reaction mediated by artificial solar radiation, taking into account the (i) total dissolved iron (TDI)
concentration, (ii) solution pH, (iii) operating temperature (T), (iv) type of acid used in the acidification,
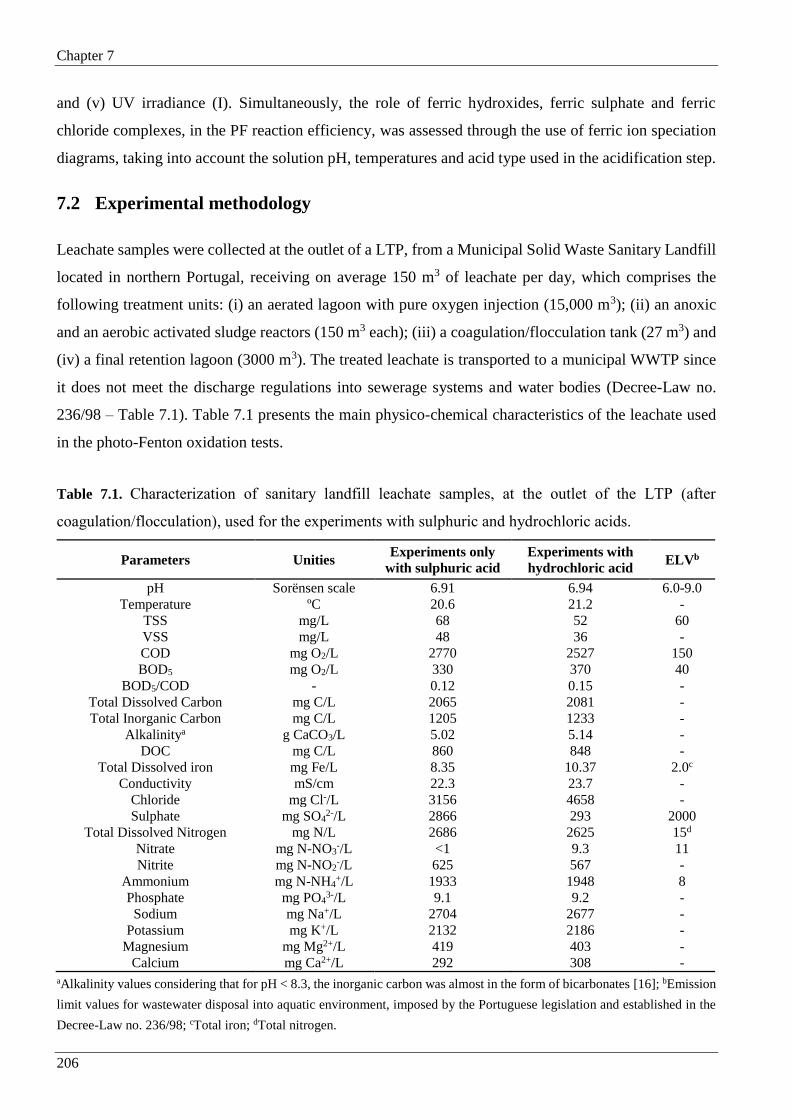
Chapter 7
206
and (v) UV irradiance (I). Simultaneously, the role of ferric hydroxides, ferric sulphate and ferric
chloride complexes, in the PF reaction efficiency, was assessed through the use of ferric ion speciation
diagrams, taking into account the solution pH, temperatures and acid type used in the acidification step.
7.2 Experimental methodology
Leachate samples were collected at the outlet of a LTP, from a Municipal Solid Waste Sanitary Landfill
located in northern Portugal, receiving on average 150 m3 of leachate per day, which comprises the
following treatment units: (i) an aerated lagoon with pure oxygen injection (15,000 m3); (ii) an anoxic
and an aerobic activated sludge reactors (150 m3 each); (iii) a coagulation/flocculation tank (27 m3) and
(iv) a final retention lagoon (3000 m3). The treated leachate is transported to a municipal WWTP since
it does not meet the discharge regulations into sewerage systems and water bodies (Decree-Law no.
236/98 – Table 7.1). Table 7.1 presents the main physico-chemical characteristics of the leachate used
in the photo-Fenton oxidation tests.
Table 7.1. Characterization of sanitary landfill leachate samples, at the outlet of the LTP (after
coagulation/flocculation), used for the experiments with sulphuric and hydrochloric acids.
Parameters Unities Experiments only
with sulphuric acid
Experiments with
hydrochloric acid ELVb
pH Sorënsen scale 6.91 6.94 6.0-9.0
Temperature ºC 20.6 21.2 -
TSS mg/L 68 52 60
VSS mg/L 48 36 -
COD mg O2/L 2770 2527 150
BOD5 mg O2/L 330 370 40
BOD5/COD - 0.12 0.15 -
Total Dissolved Carbon mg C/L 2065 2081 -
Total Inorganic Carbon mg C/L 1205 1233 -
Alkalinitya g CaCO3/L 5.02 5.14 -
DOC mg C/L 860 848 -
Total Dissolved iron mg Fe/L 8.35 10.37 2.0c
Conductivity mS/cm 22.3 23.7 -
Chloride mg Cl-/L 3156 4658 -
Sulphate mg SO42-/L 2866 293 2000
Total Dissolved Nitrogen mg N/L 2686 2625 15d
Nitrate mg N-NO3-/L <1 9.3 11
Nitrite mg N-NO2-/L 625 567 -
Ammonium mg N-NH4+/L 1933 1948 8
Phosphate mg PO43-/L 9.1 9.2 -
Sodium mg Na+/L 2704 2677 -
Potassium mg K+/L 2132 2186 -
Magnesium mg Mg2+/L 419 403 -
Calcium mg Ca2+/L 292 308 -
aAlkalinity values considering that for pH < 8.3, the inorganic carbon was almost in the form of bicarbonates [16]; bEmission
limit values for wastewater disposal into aquatic environment, imposed by the Portuguese legislation and established in the
Decree-Law no. 236/98; cTotal iron; dTotal nitrogen.
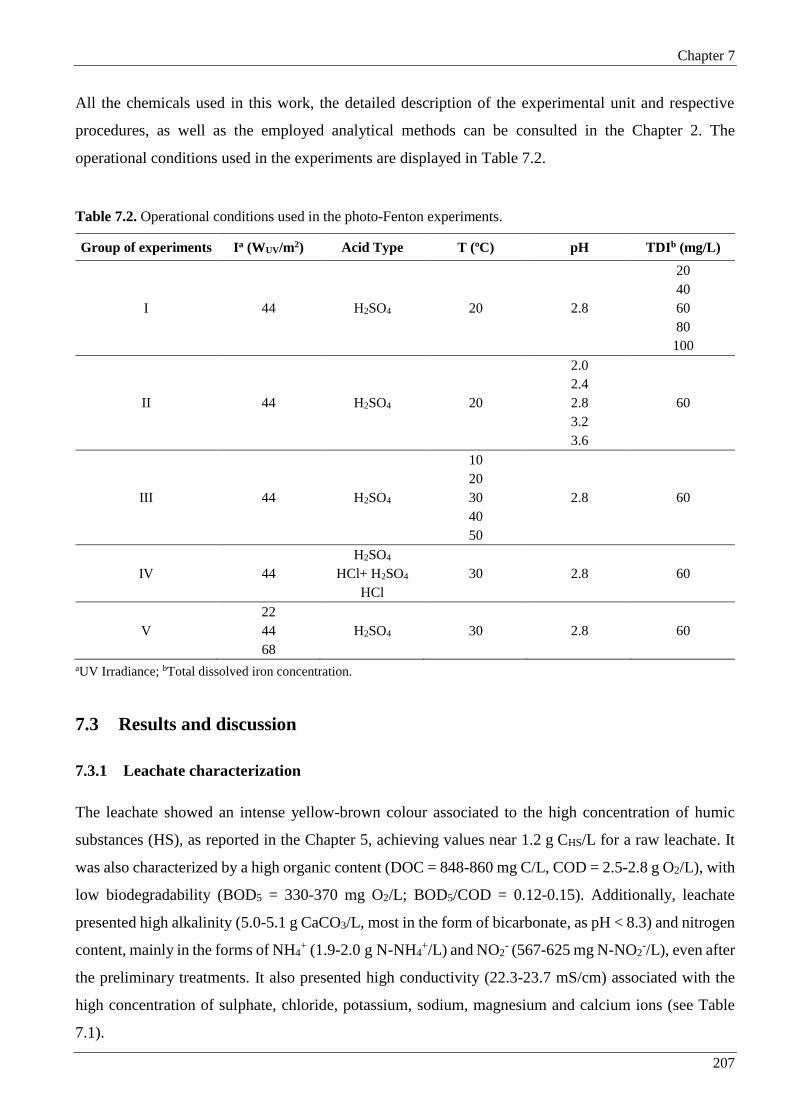
Chapter 7
207
All the chemicals used in this work, the detailed description of the experimental unit and respective
procedures, as well as the employed analytical methods can be consulted in the Chapter 2. The
operational conditions used in the experiments are displayed in Table 7.2.
Table 7.2. Operational conditions used in the photo-Fenton experiments.
Group of experiments Ia (WUV/m2) Acid Type T (ºC) pH TDIb (mg/L)
I
H2SO4 20 2.8
20
40
44 60
80
100
2.0
2.4
II 44 H2SO4 20 2.8 60
3.2
3.6
10
20
III 44 H2SO4 30 2.8 60
40
50
IV 44
H2SO4
30 2.8 60 HCl+ H2SO4
HCl
22
V 44 H2SO4 30 2.8 60
68
aUV Irradiance; bTotal dissolved iron concentration.
7.3 Results and discussion
7.3.1 Leachate characterization
The leachate showed an intense yellow-brown colour associated to the high concentration of humic
substances (HS), as reported in the Chapter 5, achieving values near 1.2 g CHS/L for a raw leachate. It
was also characterized by a high organic content (DOC = 848-860 mg C/L, COD = 2.5-2.8 g O2/L), with
low biodegradability (BOD5 = 330-370 mg O2/L; BOD5/COD = 0.12-0.15). Additionally, leachate
presented high alkalinity (5.0-5.1 g CaCO3/L, most in the form of bicarbonate, as pH < 8.3) and nitrogen
content, mainly in the forms of NH4+ (1.9-2.0 g N-NH4
+/L) and NO2- (567-625 mg N-NO2
-/L), even after
the preliminary treatments. It also presented high conductivity (22.3-23.7 mS/cm) associated with the
high concentration of sulphate, chloride, potassium, sodium, magnesium and calcium ions (see Table
7.1).
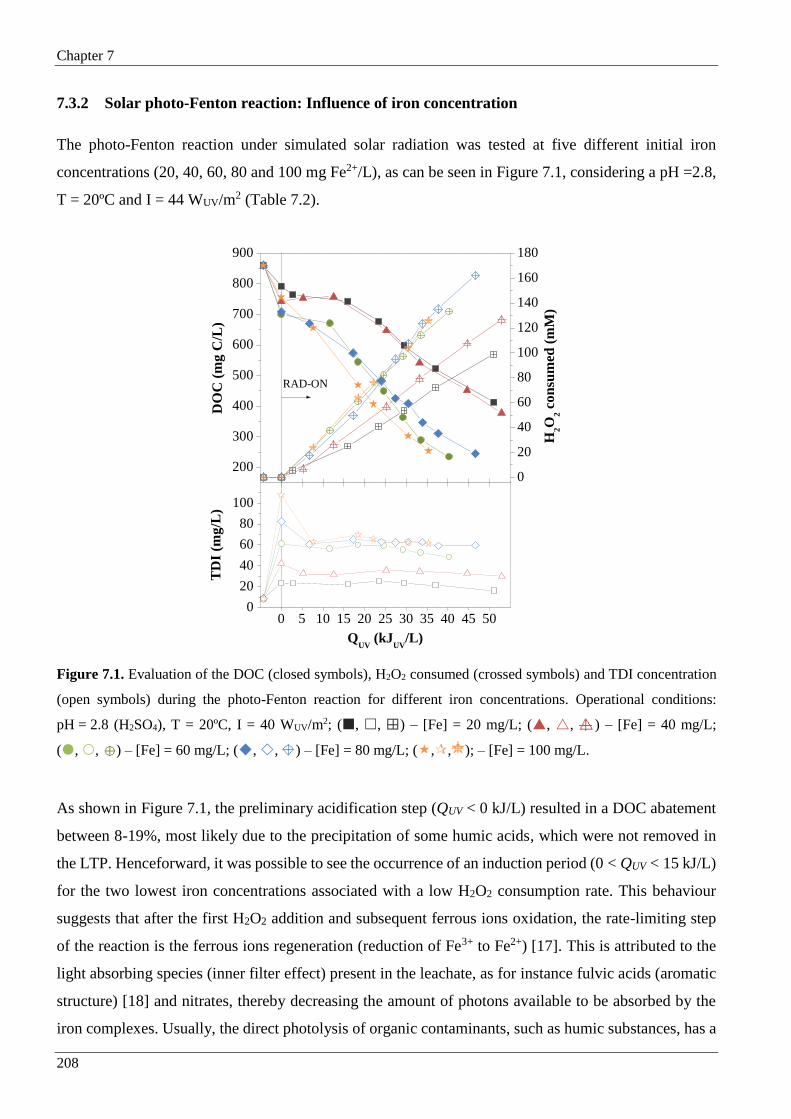
Chapter 7
208
7.3.2 Solar photo-Fenton reaction: Influence of iron concentration
The photo-Fenton reaction under simulated solar radiation was tested at five different initial iron
concentrations (20, 40, 60, 80 and 100 mg Fe2+/L), as can be seen in Figure 7.1, considering a pH =2.8,
T = 20ºC and I = 44 WUV/m2 (Table 7.2).
Figure 7.1. Evaluation of the DOC (closed symbols), H2O2 consumed (crossed symbols) and TDI concentration
(open symbols) during the photo-Fenton reaction for different iron concentrations. Operational conditions:
pH = 2.8 (H2SO4), T = 20ºC, I = 40 WUV/m2; (, , ) – [Fe] = 20 mg/L; (, , ) – [Fe] = 40 mg/L;
(, , ) – [Fe] = 60 mg/L; (, , ) – [Fe] = 80 mg/L; (,, ); – [Fe] = 100 mg/L.
As shown in Figure 7.1, the preliminary acidification step (QUV < 0 kJ/L) resulted in a DOC abatement
between 8-19%, most likely due to the precipitation of some humic acids, which were not removed in
the LTP. Henceforward, it was possible to see the occurrence of an induction period (0 < QUV < 15 kJ/L)
for the two lowest iron concentrations associated with a low H2O2 consumption rate. This behaviour
suggests that after the first H2O2 addition and subsequent ferrous ions oxidation, the rate-limiting step
of the reaction is the ferrous ions regeneration (reduction of Fe3+ to Fe2+) [17]. This is attributed to the
light absorbing species (inner filter effect) present in the leachate, as for instance fulvic acids (aromatic
structure) [18] and nitrates, thereby decreasing the amount of photons available to be absorbed by the
iron complexes. Usually, the direct photolysis of organic contaminants, such as humic substances, has a
0 5 10 15 20 25 30 35 40 45 500
20
40
60
80
100
TD
I (m
g/L
)
QUV
(kJUV
/L)
200
300
400
500
600
700
800
900
DO
C (
mg
C/L
)
RAD-ON
0
20
40
60
80
100
120
140
160
180
H2O
2 c
on
sum
ed (
mM
)
Chapter 7
209
low quantum yield, leading to a loss of the absorbed photons. From Figure 7.1, it was also possible to
observe that the higher the iron concentration, the lower the induction period, being almost null for the
three highest iron contents tested. This means that a high catalyst concentration is required to compete
efficiently for the photons with the other light absorbing species.
According to the induction time, reaction rate and H2O2 consumption rate (Table 7.3), there is no
significant difference among the experiments carried out with the three highest iron concentrations. This
is in agreement with the average TDI in solution (55-65 mg/L) for those trials. During the experiments,
principally for the two highest iron concentrations, a decrease in the pH was observed. This is related to
the formation of low-molecular-weight carboxylic acids resulting from the humic substances
degradation, which have a high content of carboxylic groups (9 meq of carboxylic acids per gram of
carbon) [19]. Consequently, the presence of ferricarboxylates complexes in the solution can enhance the
reaction rate, due to its ability of make use of photons at higher wavelengths, overcoming the inner filter
effects. Considering that a lower iron concentration reduces the operating costs, the catalyst
concentration of 60 mg Fe2+/L was selected as the optimum TDI concentration for further studies.
7.3.3 Solar photo-Fenton reaction: Influence of solution pH
The solution pH plays an important role in the efficiency of the photo-Fenton reaction, since it greatly
influences the molar fraction of the iron-water complexes (e.g. FeOH2+, Fe(OH)2+, etc.), iron-organic
complexes (e.g. oxalic, formic, etc.) and iron-inorganic complexes (e.g. chlorides, sulphates, etc.).
Therefore, the influence of solution pH on the leachate photo-treatment was also assessed in the range
2.0 - 3.6 (Table 7.2). Figure 7.2 and Table 7.3 show that the best results are obtained at pH 2.8. This is
in agreement with Pignatello et al. [20], who indicated that this pH avoids Fe3+ precipitation, and the
predominant iron-water species in solution is FeOH2+, which is the most photoactive ferric ion-water
complex and can absorb light until 410 nm. In our case, although the optimum pH value is the same, the
explanation does not fully apply due to the presence of large amounts of sulphate and chloride ions in
the leachate. Preliminary acidification constitutes the major drawback of the photo-Fenton process, since
it increases the costs associated with reactants consumption (acid for acidification and base for
neutralization) and increases the salts content (e.g. SO42-, Cl-, Na+, Ca2+). Furthermore, the presence of
Cl- and SO42- can result in a strong negative effect in the photo-Fenton reaction through the formation
of complexes with iron, leading to the formation of less reactive radicals, Cl•, Cl2•- and SO4
•-, and
possible formation of carcinogenic chlorinated organic intermediates [21].

Chapter 7
210
Table 7.3. Variables and kinetic parameters of the photo-Fenton process for all experiments.
Changed
parameter
t
(h)
QUV
(kJ/L)
Tma
(ºC) pHm
a TDIm
a
(mg/L)
H2O2
(mM)
DOCFb
(mg/L)
Red.DOCc
(%)
Kinetic parameters
COD degradation H2O2 consumption QUVh
(kJ/L) kd (L/kJ) r0e (mg/kJ) R2,f kH
g (mmol/kJ) R2,f
TDI=20 mg/L 13.8 51.1 21.4 2.74 21.9 99 413 52.0 0.017 ± 0.001 13 ± 1 0.997 2.1 ± 0.1 0.999 > 16.0
TDI=40 mg/L 14.3 53.0 20.6 2.76 32.8 127 377 56.2 0.017 ± 0.002 13 ± 2 0.991 2.5 ± 0.1 0.999 > 12.6
TDI=60 mg/L 10.9 40.3 20.3 2.86 55.3 133 235 72.7 0.038 ± 0.004 25 ± 3 0.991 3.3 ± 0.1 0.996 > 11.7
TDI=80 mg/L 12.6 46.6 20.2 2.78 62.0 162 244 71.6 0.030 ± 0.002 20 ± 1 0.994 3.9 ± 0.4 0.990 > 17.2
TDI=100 mg/L 9.6 35.4 20.1 2.74 64.5 126 254 70.5 0.034 ± 0.002 23 ± 1 0.998 3.6 ± 0.2 0.998 > 7.7
pH=2.0 8.0 29.6 20.2 2.00 53.7 27 725 15.7 - - - 0.94 ± 0.05 0.998 > 0
pH=2.4 9.3 34.2 20.0 2.42 60.4 78 448 47.9 0.019 ± 0.002 13 ± 1 0.995 2.4 ± 0.3 0.993 > 11.1
pH=2.8 10.9 40.3 20.3 2.86 55.3 133 235 72.7 0.038 ± 0.004 25 ± 3 0.991 3.3 ± 0.1 0.996 > 11.7
pH=3.2 11.0 40.6 20.4 3.19 35.6 111 434 49.5 0.031 ± 0.005 20 ± 3 0.993 3.6 ± 0.6 0.994 > 15.5
pH=3.6 7.8 28.9 20.5 3.60 34.9 44 609 29.2 0.005 ± 0.001 3.5 ± 0.8 0.990 1.5 ± 0.1 0.998 > 10.8
T=10ºC 12.8 47.5 10.1 2.81 30.2 81 378 56.0 0.023 ± 0.003 13 ± 2 0.991 2.6 ± 0.2 0.998 > 29.0
T=20ºC 10.9 40.3 20.3 2.86 55.3 133 235 72.7 0.038 ± 0.004 25 ± 3 0.991 3.3 ± 0.1 0.996 > 11.7
T=30ºC 6.8 25.1 30.1 2.80 55.0 149 237 72.4 0.058 ± 0.006 35 ± 4 0.995 7.2 ± 0.2 0.998 > 8.5
T=40ºC 4.6 17.0 39.5 2.81 58.3 196 193 77.6 0.09 ± 0.02 48 ± 5 0.998 13 ± 3 0.991 > 5.9
T=50ºC 5.3 19.4 50.1 2.81 40.3 216 195 77.3 0.071 ± 0.005 44 ± 3 0.996 12 ± 1 0.990 > 3.0
H2SO4 6.8 25.1 30.1 2.80 55.0 149 237 72.4 0.058 ± 0.006 35 ± 4 0.995 7.2 ± 0.2 0.998 > 8.5
HCl 8.0 29.6 30.8 2.83 28.3 99 417 50.5 0.025 ± 0.003 15 ± 2 0.991 3.4 ± 0.2 0.998 > 15.5
H2SO4+HCl 8.5 31.2 30.6 2.83 30.3 95 398 52.7 0.025 ± 0.002 16 ± 1 0.995 4.0 ± 0.2 0.997 > 11.7
I=22W/m2 11.3 20.8 30.2 2.81 37.6 146 332 61.4 0.049 ± 0.005 31 ± 3 0.990 9.7 ± 0.5 0.997 5.5 - 18.9
I=44W/m2 6.8 25.1 30.1 2.80 55.0 149 237 72.4 0.058 ± 0.006 35 ± 4 0.995 7.2 ± 0.2 0.998 > 8.5
I=68W/m2 7.0 40.0 31.8 2.81 31.2 121 275 68.0 0.027 ± 0.002 16 ± 1 0.995 3.5 ± 0.2 0.993 > 5.7
aAverage values of temperature, pH and total dissolved iron observed during the photo-Fenton experiments; bFinal DOC; cDOC Total reduction (1-DOCF/DOCI, %); dPseudo-first-order kinetic constant
for DOC degradation; eInitial DOC reaction rate; fCoefficient of determination; gH2O2 consumption rate; hValue or interval of energy from which the kinetic parameters were calculated.

Chapter 7
211
Figure 7.2. Evaluation of the DOC (closed symbols), H2O2 consumed (open symbols), pH (H2SO4) (semi-filled
symbols) and TDI concentration (crossed symbols) during photo-Fenton reaction for different pH values.
Operational conditions: [Fe] = 60 mg/L, T = 20ºC, I = 40 WUV/m2; ( ,, , ) – pH = 2.0; (, , , ) –
pH = 2.4; (, , , ) – pH = 2.8; (, , , ) – pH = 3.2; (, , , ) – pH = 3.6.
Taking into account the importance of the type of iron complexes formed during the photo-Fenton
reaction, theoretical speciation diagrams of iron (III) including Fe(OH)3(s) formation were performed
(see Figure 7.3 and Table 7.4), considering the experimental conditions of each assay. It should be noted
that only iron-water, iron-sulphate and iron-chloride complexes were considered since sulphate and
chloride were the main anions found and/or added to the leachate. So, it is necessary to bear in mind that
the information provided by the speciation diagrams must be used carefully and cannot be taken for
granted, since this type of effluent presents a myriad of compounds and its degradation can originate
much more, which can also affect the type of iron complex formed. As regards sulphates and chlorides
content after acidification and iron addition, the ferric ion speciation diagram (Figure 7.3 and Table 7.4)
shows that at pH 2.8, where the best results were achieved, the predominant iron species in solution are
FeSO4+ (59.4%), Fe(SO4)2
- (29.5%), Fe3+ (4.4%), Fe(OH)2+ (2.9%), FeOH2+ (2.4%) and FeCl2+ (1.3%),
leading to the simultaneous formation of SO4•-, HO• and Cl• radicals, according to Eqs. (7.1) to (7.3)
[22]:
200
300
400
500
600
700
800
900
DO
C (
mg
C/L
)
0
25
50
75
100
125
150
175
RAD-ON
H2O
2 c
on
sum
ed
(m
M)
0 10 20 30 40
2.0
2.4
2.8
3.2
3.6
7
pH
QUV
(kJUV
/L)
0 10 20 30 400
10
20
30
40
50
60
70
TD
I (m
g/L
)
QUV
(kJUV
/L)
RAD-ON

Chapter 7
212
4
2
4 SOFehvFeSO (7.1)
HOFehvFeOH 22 (7.2)
ClFehvFeCl 22 (7.3)
Nevertheless, the sulphate radical is mostly produced under acidic conditions by the scavenging of the
hydroxyl radical by the hydrogensulphate ions (Eq. (7.4)), since the FeSO4+ species has a very low
photolysis quantum yield [23].
(7.4)
Depending on the operating conditions, the sulphate radical can oxidise some reactive oxygen species,
including the H2O2 (Eq. (7.5)-(7.9)) and can consume ferrous ions (Eq. (7.10)) [23]. Beyond that, even
being a strong oxidant, compared to HO• [24, 25], this species is slightly less reactive and more selective,
affecting the organic compounds oxidation rates [26, 27].
(7.5)
(7.6)
(7.7)
(7.8)
(7.9)
(7.10)
Furthermore, in acidic medium, the concentration of H+ rises, which also can have negative effects on
the leachate mineralization (see Figure 7.2), since it can (i) react with H2O2 (Eq. (7.11)), yielding the
peroxonium ion (H3O2+), therefore decreasing substantially its reactivity with Fe2+ ions, and (ii) work as
a scavenger of the HO• (Eq. (7.12)) [28-31].
(7.11)
(7.12)
OHSOHOHSO 244 115 sM105.3k
HOSOHOHSO
2
42412 s106.6k
HOSOHOSO
2
44117 sM104.1k
2
2
4224 HOHSOOHSO 117 sM102.1k
2
2
424 OHSOHOSO 119 sM105.3k
2
8244 OSSOSO 118 sM107.2k
2
4
3
4
2 SOFeSOFe 118 sM100.3k
2322 OHHOH
OHeHHO 2
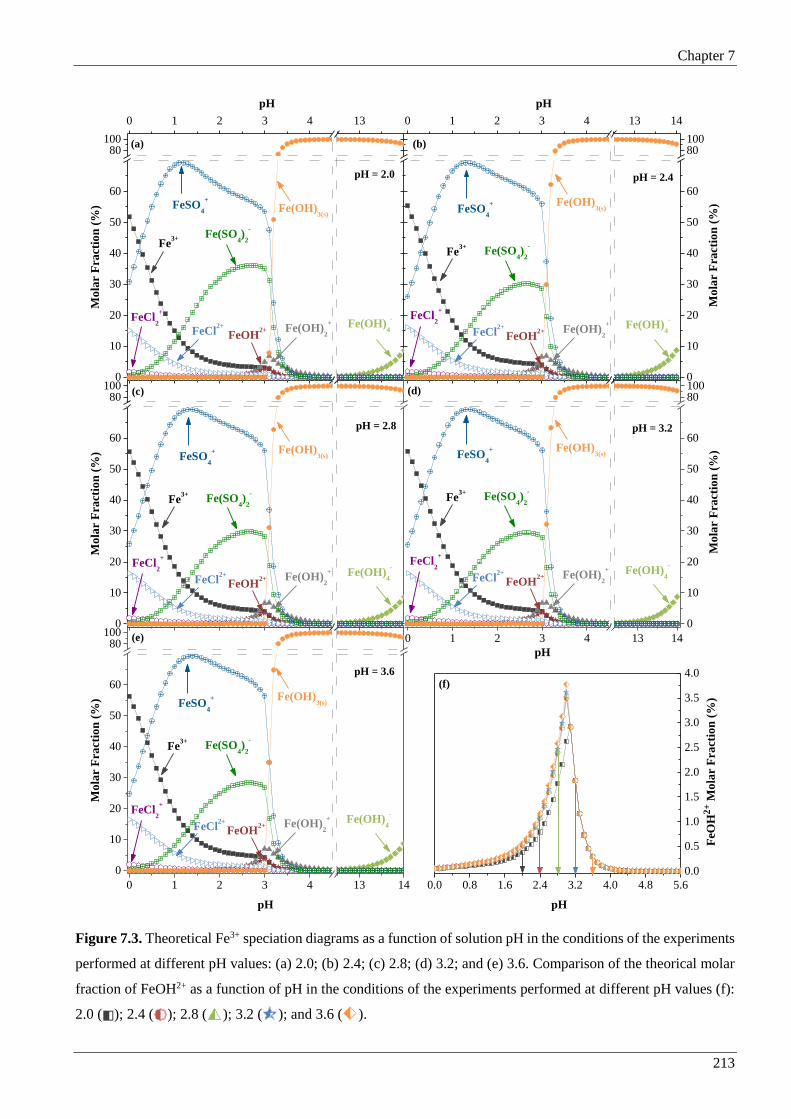
Chapter 7
213
Figure 7.3. Theoretical Fe3+ speciation diagrams as a function of solution pH in the conditions of the experiments
performed at different pH values: (a) 2.0; (b) 2.4; (c) 2.8; (d) 3.2; and (e) 3.6. Comparison of the theorical molar
fraction of FeOH2+ as a function of pH in the conditions of the experiments performed at different pH values (f):
2.0 ( ); 2.4 ( ); 2.8 ( ); 3.2 ( ); and 3.6 ( ).
0 1 2 3 4 13
0
10
20
30
40
50
60
80100
0 1 2 3 4 13 14
0
10
20
30
40
50
60
80100
0
10
20
30
40
50
60
80100
0 1 2 3 4 13 14
0
10
20
30
40
50
60
80100
0 1 2 3 4 13 14
0
10
20
30
40
50
60
80100
0.0 0.8 1.6 2.4 3.2 4.0 4.8 5.6
0.0
0.5
1.0
1.5
2.0
2.5
3.0
3.5
4.0
Fe(OH)3(s)
Fe(SO4)
2
-
FeSO4
+
FeCl2+
FeCl2
+
Fe(OH)4
-
Fe(OH)2
+
Fe3+
FeOH2+
pHM
ola
r F
ract
ion
(%
)
pH = 2.0
pH
(b)(a)
Mo
lar
Fra
ctio
n (
%)
pH = 2.4
Fe(OH)3(s)
Fe(SO4)
2
-
FeSO4
+
FeCl2+
FeCl2
+
Fe(OH)4
-
Fe(OH)2
+
Fe3+
FeOH2+
(d)(c)
pH = 2.8
Mo
lar
Fra
ctio
n (
%)
Fe(OH)3(s)
Fe(SO4)
2
-
FeSO4
+
FeCl2+
FeCl2
+
Fe(OH)4
-
Fe(OH)2
+
Fe3+
FeOH2+
Fe(OH)3(s)
Fe(SO4)
2
-
FeSO4
+
FeCl2+
FeCl2
+
Fe(OH)4
-
Fe(OH)2
+
Fe3+
FeOH2+
Fe(OH)3(s)
Fe(SO4)
2
-
FeSO4
+
FeCl2+
FeCl2
+
Fe(OH)4
-
Fe(OH)2
+
Fe3+
FeOH2+
Mo
lar
Fra
ctio
n (
%)
pH = 3.2
pH
(f)
(e)
pH = 3.6
Mo
lar
Fra
ctio
n (
%)
pH pH
FeO
H2+ M
ola
r F
ract
ion
(%
)

Chapter 7
214
Table 7.4. Concentration of iron, chloride and sulphate added in the photo-Fenton reaction, and theoretical molar fraction of Fe3+ species, associated to pH value
in different experiments.
Experiment pH Concentration (mM) Molar fraction (%)
Fe Cl- SO42- Fe3+ FeOH2+ Fe(OH)2
+ FeCl2+ FeCl2+ FeSO4
+ Fe(SO4)2- Fe(OH)3 (s)
pH=2.0 2.0 1.07 89 121 4.38 0.38 0.07 0.15 1.28 61.77 31.96 0.00
pH=2.4 2.4 1.07 89 95 4.82 1.06 0.50 0.17 1.42 62.50 29.52 0.00
pH=2.8 2.8 1.07 89 93 4.36 2.42 2.85 0.15 1.28 59.36 29.54 0.00
pH=3.2 3.2 1.07 89 92 1.31 1.83 5.44 0.05 0.39 18.33 9.32 63.31
pH=3.6 3.6 1.07 89 88 0.08 0.29 2.18 0.00 0.02 1.14 0.56 95.72
T=10ºC 2.8 1.07 89 93 5.56 1.74 3.82 0.21 1.22 56.38 31.04 0.00
T=20ºC 2.8 1.07 89 93 4.36 2.42 2.85 0.15 1.28 59.36 29.54 0.00
T=30ºC 2.8 1.07 89 93 3.56 3.38 2.22 0.12 1.37 61.99 27.30 0.00
T=40ºC 2.8 1.07 89 93 2.95 4.60 1.75 0.09 1.47 64.02 25.05 0.00
T=50ºC 2.8 1.07 89 93 1.53 3.78 0.85 0.04 0.95 40.32 14.03 38.45
H2SO4 2.8 1.07 89 93 3.56 3.38 2.22 0.12 1.37 61.99 27.30 0.00
HCl 2.8 1.07 229 4.12 7.56 7.49 5.06 1.79 7.92 6.46 0.13 63.31
H2SO4+HCl 2.8 1.07 201 20.8 7.72 7.56 5.07 1.38 7.01 32.33 3.24 35.42

Chapter 7
215
So, high amounts of sulphate and hydrogen ions, as well as low amounts of FeOH2+ species greatly
affect the photo-Fenton reaction efficiency.
If the PF reaction is conducted at pH values higher that 3.0, iron begins to precipitate as Fe(OH)3(s)
(Figure 7.3), decreasing the mineralization rates. This is in agreement with the iron profile for each
experiment presented in Figure 7.2, leading to an average dissolved iron concentration of ca. 35 mg/L,
for the experiments at pH 3.2 and 3.6. Nevertheless, taking into account the ferric ions speciation
diagram, at pH 3.6 all iron is the form of Fe(OH)3(s), which is not in agreement with the experimental
results. This can be explained by the presence of synthetic and natural complexing agents in the leachate
samples (e.g. ethylenediaminetetraacetic acid (EDTA) and humic substances) [32-34], as also other
organic species generated during the oxidation process (e.g. citric, oxalic and others carboxylic acids),
that could form soluble ferric iron complexes (Fe3+L), being possible to work at higher pH values [17,
35-37]. Some iron organic complexes can be photolysed (Eq. (7.13)) using higher light wavelengths,
leading eventually to higher reaction rates through absorption of more solar photons (e.g. Fe(III)-oxalate
complexes is efficient up to 500 nm with a quantum yield between 1.0 and 1.2) [20].
(7.13)
Additionally, the precipitation of iron (III) hydroxides occurs slowly [38, 39], a fact that may explain
the inconsistency between the speciation diagram and the TDI concentration at the beginning of
experiment at pH 3.6.
Linking the information obtained by the speciation diagrams (Table 7.4 and Figure 7.3) with the reaction
kinetic data (Table 7.3 and Figure 7.2), an interesting relationship was observed. For a pH interval among
2.4 and 3.6, the photo-Fenton apparent reaction constant is directly proportional to the theoretical amount
of FeOH2+ species (the most photoactive complex), obtained from the speciation diagrams, considering
the working pH, as can be seen in the Figure 7.4a. This suggests that the photo-Fenton reaction efficiency
is mostly affected by the concentration of FeOH2+ in solution, since this species is an additional source
of hydroxyl radicals.
According to the speciation diagrams (Figure 7.3), maintaining chloride concentration constant (89 mM)
and increasing sulphate concentration from 88 to 95 mM (Table 7.4), FeOH2+ species present a
maximum molar fraction at about pH 3.0, corresponding to an average molar concentration of
3.9×10⁻² mM. Thus, an increment in the reaction rate could have been achieved by increasing the pH up
to 3.0, yielding a pseudo-first-order kinetic constant of 0.058 L/kJ, according to the linear regression
presented in the Figure 7.4a.
LFeLFehvLFe 233
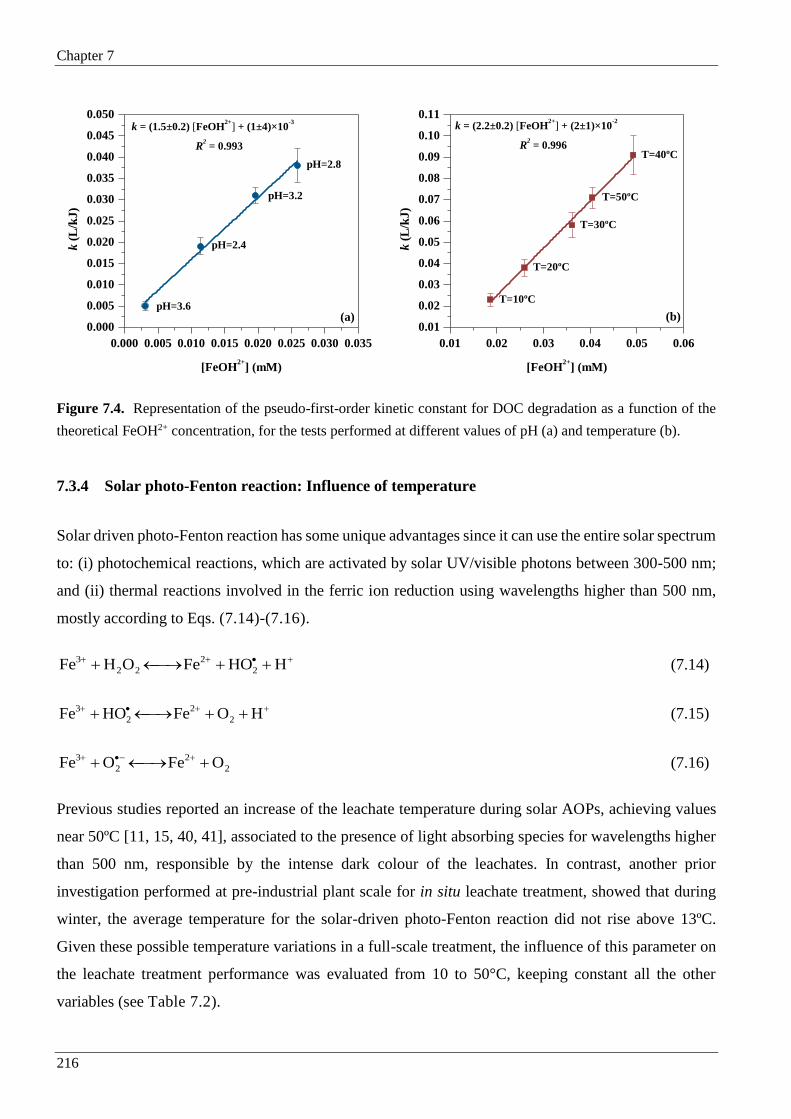
Chapter 7
216
Figure 7.4. Representation of the pseudo-first-order kinetic constant for DOC degradation as a function of the
theoretical FeOH2+ concentration, for the tests performed at different values of pH (a) and temperature (b).
7.3.4 Solar photo-Fenton reaction: Influence of temperature
Solar driven photo-Fenton reaction has some unique advantages since it can use the entire solar spectrum
to: (i) photochemical reactions, which are activated by solar UV/visible photons between 300-500 nm;
and (ii) thermal reactions involved in the ferric ion reduction using wavelengths higher than 500 nm,
mostly according to Eqs. (7.14)-(7.16).
(7.14)
(7.15)
(7.16)
Previous studies reported an increase of the leachate temperature during solar AOPs, achieving values
near 50ºC [11, 15, 40, 41], associated to the presence of light absorbing species for wavelengths higher
than 500 nm, responsible by the intense dark colour of the leachates. In contrast, another prior
investigation performed at pre-industrial plant scale for in situ leachate treatment, showed that during
winter, the average temperature for the solar-driven photo-Fenton reaction did not rise above 13ºC.
Given these possible temperature variations in a full-scale treatment, the influence of this parameter on
the leachate treatment performance was evaluated from 10 to 50°C, keeping constant all the other
variables (see Table 7.2).
0.000 0.005 0.010 0.015 0.020 0.025 0.030 0.035
0.000
0.005
0.010
0.015
0.020
0.025
0.030
0.035
0.040
0.045
0.050
(a)
R2 = 0.993
pH=2.8
pH=2.4
pH=3.2
k (
L/k
J)
[FeOH2+
] (mM)
pH=3.6
k = (1.5±0.2) [FeOH2+
] + (1±4)×10-3
0.01 0.02 0.03 0.04 0.05 0.06
0.01
0.02
0.03
0.04
0.05
0.06
0.07
0.08
0.09
0.10
0.11
(b)
T=50ºC
R2 = 0.996
T=40ºC
T=20ºC
T=30ºC
k (
L/k
J)
[FeOH2+
] (mM)
T=10ºC
k = (2.2±0.2) [FeOH2+
] + (2±1)×10-2
HHOFeOHFe 2
2
22
3
HOFeHOFe 2
2
2
3
2
2
2
3 OFeOFe

Chapter 7
217
Figure 7.5 shows that low temperatures lead to higher induction periods, indicating that the thermal
reactions involved in the reduction of the ferric ion are more important than the photoreduction of ferric
ions during this preliminary reaction period. Figure 7.5 and Table 7.3 also disclose that the increase of
leachate temperature had a positive effect on the reaction rate, increasing 4 times by raising the
temperature from 10ºC to 40ºC. The increase of the reaction rate can be attributed to two different
factors: (i) production of more hydroxyl radicals resulting from a higher ferric ion reduction rates
through thermal reactions (Eqs. (7.14)-(7.16)) [39]; and (ii) increment of the molar fraction of FeOH2+,
which is the most photoactive iron-water complex [42].
Figure 7.5. Evaluation of the DOC (closed symbols), H2O2 consumed (open symbols), temperature (semi-filled
symbols) and TDI concentration (crossed symbols) during the photo-Fenton reaction for different temperature
values. Operational conditions: pH = 2.8 (H2SO4); [Fe] = 60 mg/L, I = 40 WUV/m2; ( ,, , ) – T = 10ºC;
(, , , ) – T = 20ºC; (, , , ) – T = 30ºC; (, , , ) – T = 40ºC; (, , , ) – T = 50ºC.
Regarding the temperature interval studied (10 - 50ºC), it can be assessed from Figure 7.4b that the
reaction rate (Table 7.3) is also linearly dependent on the theoretical FeOH2+ concentration, calculated
from the iron (III) speciation diagrams (Table 7.4 and Figure 7.6), considering the experimental
conditions used for each test.
200
300
400
500
600
700
800
900
DO
C (
mg
C/L
)
0
40
80
120
160
200
240
H2O
2 c
on
sum
ed
(m
M)
0 10 20 30 400
10
20
30
40
50
T (
ºC)
QUV
(kJUV
/L)
0 10 20 30 400
10
20
30
40
50
60
70
TD
I (m
g/L
)
QUV
(kJUV
/L)
RAD-ON RAD-ON

Chapter 7
218
From the speciation diagrams, it was possible to note that increasing the leachate temperature, the
maximum molar fraction of FeOH2+ is achieved at lower pH values. For instance, considering 10 and
50ºC, the amount of this species is higher at pH 3.1 and 2.7 (3.0 and 5.1%, respectively). Given that, in
a leachate treatment plant, the oxidation rate can be slightly increased if the photo-Fenton reaction is
performed at higher pH (3.1) during winter, and lower pH (2.7) during summer.
Figure 7.5 shows that higher temperatures lead to an increase of H2O2 consumption to achieve the same
mineralization, principally for temperatures above 30ºC, which can be associated with two mains factors:
(i) the thermal ferric ion reduction reactions and (ii) H2O2 decomposition at high temperatures (the rate
of H2O2 decomposition doubles when the temperature rises 10ºC, in addition, because of the exothermic
nature of the reaction, the rate of decomposition of H2O2 self-accelerates).
Considering temperature interval between 20ºC and 40ºC, the TDI concentration remained
approximately constant during the experiments with an average concentration in the range 55-58 mg/L.
For the temperature of 10ºC, TDI concentration decreased substantially at the beginning of the reaction
and remained approximately constant (30 mg/L) during the reaction, which can be attributed to the
complexation with degradation by-products. Figure 7.5 also indicates that for the temperature of 50ºC,
ferric and ferrous ion solubility decreases substantially, which is in agreement with the speciation
diagrams (see Table 7.4 and Figure 7.6). However, in this case, the reaction kinetics was similar to that
observed at 40ºC since dissolved iron concentration was sufficient to catalyse the reaction.
This means that, although temperature control in an industrial plant is economically non-viable, this
parameter must be taken into account in the calculation of CPCs area, according to the annual average
temperature (winter and summer).
Since the reaction performance at 30ºC led to good efficiency and lesser decomposition of H2O2 than at
40 and 50ºC, it was selected for the additional tests.

Chapter 7
219
Figure 7.6. Theoretical Fe3+ speciation diagrams as a function of solution pH in the conditions of the experiments
performed at different temperature values: (a) 10ºC; (b) 20ºC; (c) 30ºC; (d) 40ºC; and (e) 50ºC. Comparison of
the theorical molar fraction of FeOH2+ as a function of pH in the conditions of the experiments performed at
different temperature values (f): 10ºC ( ); 20ºC ( ); 30ºC ( ); 40ºC ( ); and 50ºC ( ).
0 1 2 3 4 13
0
10
20
30
40
50
60
70
80
100
0 1 2 3 4 13 14
0
10
20
30
40
50
60
70
80
100
0
10
20
30
40
50
60
70
80
100
0 1 2 3 4 13 14
0
10
20
30
40
50
60
70
80
100
0 1 2 3 4 13 14
0
10
20
30
40
50
60
70
80
100
0.0 0.8 1.6 2.4 3.2 4.0 4.8 5.60.0
0.5
1.0
1.5
2.0
2.5
3.0
3.5
4.0
4.5
5.0
5.5
6.0
Fe(OH)3(s)
Fe(SO4)
2
-
FeSO4
+
FeCl2+FeCl
2
+ Fe(OH)4
-Fe(OH)2
+
Fe3+
FeOH2+
pHM
ola
r F
ract
ion
(%
)
T = 10ºC
pH
(b)(a)
Mo
lar
Fra
ctio
n (
%)
T = 20ºC
Fe(OH)3(s)
Fe(SO4)
2
-
FeSO4
+
FeCl2+
FeCl2
+
Fe(OH)4
-
Fe(OH)2
+
Fe3+
FeOH2+
(d)(c)
T = 30ºC
Mo
lar
Fra
ctio
n (
%)
Fe(OH)3(s)
Fe(SO4)
2
-
FeSO4
+
FeCl2+FeCl
2
+
Fe(OH)4
-
Fe(OH)2
+
Fe3+
FeOH2+
Fe(OH)3(s)
Fe(SO4)
2
-
FeSO4
+
FeCl2+
FeCl2
+
Fe(OH)4
-Fe(OH)
2
+
Fe3+
FeOH2+
Fe(OH)3(s)
Fe(SO4)
2
-
FeSO4
+
FeCl2+
FeCl2
+Fe(OH)
4
-Fe(OH)
2
+
Fe3+
FeOH2+
Mo
lar
Fra
ctio
n (
%)
T = 40ºC
pH
Mo
lar
Fra
ctio
n (
%)
(f)
(e)
T = 50ºC
pH pH
FeO
H2
+ M
ola
r F
ract
ion
(%
)

Chapter 7
220
7.3.5 Solar photo-Fenton reaction: Influence of acid type
It is well known that higher photo-Fenton reaction rates are achieved at acidic pH and therefore
acidification of neutral wastewaters is necessary. Commonly, sulphuric acid is used in the acidification
step of the photo-Fenton reaction since it is a strong acid and commercially available in high
concentration (>96% < > [H+] ≈ 37 M) at low price. However, the discharge limit imposed by the
Portuguese legislation for the sulphate ions is merely 2 g/L. On the other hand, HCl is commercially
available at similar price but only at 37% ([H+] ≈ 12 M). However, discharge regulations into water
bodies do not include chloride ions concentration. Most often, the sanitary landfill leachate presents a
high alkalinity and buffer capacity, due to the high bicarbonate content, which requires the addition of
high amounts of acid to achieve the desired acidic pH values for the photo-Fenton reaction (as reported
in the Chapters 3-5). Thus, the influence of chloride and sulphate ions on leachate phototreatment was
assessed.
The presence of high concentration of chloride and sulphate ions can affect the photo-Fenton reaction
rate due to four possible reasons [26, 43, 44]: (i) complexation reactions with Fe2+ and Fe3+, which can
affect the distribution and the reactivity of the iron species (Eqs. (7.17)-(7.22) for IS = 0.1 M):
(7.17)
(7.18)
(7.19)
(7.20)
(7.21)
(7.22)
(ii) scavenging of hydroxyl radicals and formation of less reactive inorganic radicals (Cl•, Cl2•- and SO4
•-)
(Eqs. (7.4) and (7.23)-(7.26)):
(7.23)
(7.24)
FeClClFe2 -1M 88.2K
23 FeClClFe -1M 61.6K
2
3 FeClCl2Fe -1M 47.10K
4
2
4
2 FeSOSOFe -11 M 1029.2K
4
2
4
3 FeSOSOFe -12 M 1089.3K
24
2
4
3 )SO(FeSO2Fe -23 M 1047.4K
ClOHHOCl 1-19 sM 103.4k
HOClClOH 1-19 sM 100.6k

Chapter 7
221
(7.25)
(7.26)
(iii) H2O2 decomposition due to less reactive chloride and sulphate radicals, increasing the reagent
consumption (Eqs. (7.27)-(7.31)):
(7.27)
(7.28)
(7.29)
(7.30)
(7.31)
(iv) oxidation reactions involving these inorganic radicals.
Figure 7.7 illustrates the photo-Fenton reaction efficiency for the sanitary landfill leachate treatment
using H2SO4 or HCl individually, or combined (the amount of H2SO4 added was conditioned to the limit
of 2 g SO42-/L, taking into account the addition of iron sulphate, as iron source) in the acidification stage.
It can be seen that the best option is to use only H2SO4 in the acidification step. Furthermore, in the
presence of such high concentration of chloride ions, the presence of 2 g/L of sulphate doesn't affect the
reaction rate.
Unlike what was inferred from the tests at different values of pH and temperature, where the kinetic
constants were directly related to the theoretical FeOH2+ concentration, herein the opposite just happens.
The FeOH2+ concentration is higher, but the reaction rate is lower. It should be noted that the amount of
HCl required to achieve a pH of 2.8, leads to a final concentrations of chloride ions (≥ 200 mM) higher
than sulphate ions (93 mM), when just H2SO4 was employed (see Table 7.4). This causes a significant
change in the ionic composition of the reactional medium while in the other tests only occurred a slight
change in the sulphate concentration (trials with pH variation) and temperature. The presence of such
high chloride concentration results in a competitive formation of more FeCl2+ and FeCl2+ species (see
Table 7.4). Even taking into account the considerable amount of FeOH2+ species, the iron-chloride
complexes present higher molar absorptivity under UV radiation and photo-decompose with higher
quantum yields [23]. Moreover, De Laat et al. [45] have simulated the distribution of inorganic radicals
OHClHClOH 2 1-110 sM 104.2k
2ClClCl 1-19 sM 105.8k
2
2
4224 HOHSOOHSO 1-17 sM 102.1k
2
2
424 OHSOHOSO 1-19 sM 105.3k
222 HOHClOHCl 1-19 sM 100.1k
2222 HOHCl2OHCl 1-14 sM 101.4k
222 OHCl2HOCl 1-19 sM 100.3k

Chapter 7
222
as a function of solution pH, considering the presence of NaCl 0.1 M, and it was observed that, at pH
2.8, all hydroxyl radicals (HO•) are converted in dichlorine anion radicals (Cl2•-), which is a much less
reactive species. On the other hand, in the presence of high sulphate concentrations, the amount of HSO4-
is higher (about 5.4, 0.2 and 1.2 mM, for experiments with H2SO4, HCl and H2SO4 + HCl, respectively
– data not showed), and even if HSO4- converts all HO• in SO4
•-, this radical can be more reactive than
Cl2•-, hence the photo-oxidation rate is higher.
Figure 7.7. Evaluation of the DOC (closed symbols), H2O2 consumed (open symbols) and TDI concentration
(crossed symbols) during the photo-Fenton reaction for different acid types. Operational conditions: pH = 2.8;
T = 30ºC; [Fe] = 60 mg/L, I = 40 WUV/m2; ( ,, ) – H2SO4; (, , ) – HCl; (, , ) – H2SO4 + HCl.
Looking at the iron profile (Figure 7.7), it can be observed that when HCl is used in the acidification
procedure, the TDI concentration decreases at the beginning of photo-Fenton reaction and remains
approximately constant during the experiments, achieving average TDI concentrations near 30 mg/L.
This behaviour is in accordance with the theoretical Fe3+ speciation diagrams (Figure 7.8), where it was
predicted that when HCl or H2SO4 were only used, Fe(OH)3(s) was formed at pH ≥ 2.7 or pH ≥ 3.0,
respectively.
0 5 10 15 20 25 300
20
40
60
TD
I (m
g/L
)
QUV
(kJUV
/L)
200
300
400
500
600
700
800
900
DO
C (
mg
C/L
)
RAD-ON
0
20
40
60
80
100
120
140
160
H2O
2 c
on
sum
ed (
mM
)

Chapter 7
223
Figure 7.8. Theoretical Fe3+ speciation diagrams as a function of solution pH in the conditions of the experiments
performed with different acid types: (a) H2SO4; (b) HCl; (c) H2SO4 + HCl. Comparison of the theorical molar
fraction of FeOH2+ as a function of pH in the conditions of the experiments performed with different acid types
(d): H2SO4 ( ); HCl ( ) and H2SO4 + HCl ( ).
Crossing the kinetic data with the average TDI concentration, the reaction rate increased 2.3 times and
the average dissolved iron concentration rose from 30 to 55 mg/L (tests with HCl and H2SO4,
respectively). An analogous situation was observed for the group of experiments where the iron
concentration was changed, at 20 ºC (using only H2SO4). In this case it was observed that the increment
of the average dissolved iron concentration from 30 to 55 mg/L (tests with a desired TDI concentration
of 40 and 60 mg/L, respectively), led to an enhancement of the reaction rate of 2.2 times. This behaviour
suggests that the lack of iron, when the HCl was used, can also clarify the loss of the photo-Fenton
reaction efficiency.
0
10
20
30
40
50
60
70
80100
0 1 2 3 4 13 14
0
10
20
30
40
50
60
70
80100
0 1 2 3 4 13 14
0
10
20
30
40
50
60
70
80100
0.0 0.8 1.6 2.4 3.2 4.0 4.8 5.60
2
4
6
8
10
12
14
16
(b)(a)
H2SO
4
Mola
r F
ract
ion
(%
)
Fe(OH)3(s)
Fe(SO4)
2
-
FeSO4
+
FeCl2+FeCl
2
+
Fe(OH)4
-Fe(OH)
2
+
Fe3+
FeOH2+
Fe(OH)3(s)
FeSO4
+
FeCl2+
FeCl2
+
Fe(OH)4
-Fe(OH)2
+
Fe3+
FeOH2+
Fe(OH)3(s)
Fe(SO4)
2
-
FeSO4
+
FeCl2+
FeCl2
+
Fe(OH)4
-Fe(OH)2
+
Fe3+
FeOH2+
Mola
r F
ract
ion
(%
)
HCl
pH
Mola
r F
ract
ion
(%
)
(d)
(c)
H2SO
4+HCl
pH pH
FeO
H2
+ M
ola
r F
ract
ion
(%
)

Chapter 7
224
Considering the results presented above, the best option is to only use sulphuric acid in the preliminary
acidification step of the photo-Fenton reaction, leading to higher mineralization rates. Regarding the
high amount of ammonium in the leachate, a preliminary biological nitrification to nitrates/nitrites can
be an interesting approach for the consumption of the leachate alkalinity, reducing considerably the
amount of acid necessary for the acidification in the photo-Fenton reaction.
7.3.6 Solar photo-Fenton reaction: Influence of irradiance
Solar irradiance in a clear day usually rises from early morning to achieve a maximum intensity between
12:00 and 16:00, according to the location and season, and decreases again during the afternoon. In
Chapter 6, it was reported a monthly average solar UV radiation power in the specific location of the
sanitary landfill (north of Portugal), where the leachate was collected, of ca. 20 WUV/m2, in spring and
summer seasons, and 11 WUV/m2 in winter and autumn seasons. The insolation at the sanitary landfill
was of 2944 hours per year and the yearly average global UV radiation power was 17 WUV/m2.
Considering that the irradiance varies greatly along the day due to atmospheric conditions (clouds, rain
and fog), location and season and, high irradiances are associated to higher temperatures, the influence
of the irradiance on the photo-Fenton reaction efficacy must be evaluated.
Figure 7.9 shows that increasing the UV irradiance from 22 to 44 WUV/m2, the photo-Fenton reaction
rate: (i) is almost similar in terms of accumulated UV energy, although the H2O2 consumption decreases;
and (ii) increases ca. 56% (from 0.09±0.01 h-1 to 0.21±0.03 h-1), considering the reaction time. Increasing
the irradiance up to 68 WUV/m2, the photo-Fenton reaction rate: (i) decreases about 50% when compared
with the other UV irradiance values, which can be attributed to a loss of photons; and (ii) stays
approximately the same in terms of reaction time. This means that considering the optical length of the
reactor (borosilicate glass tube with 46.4 mm internal diameter), higher doses of iron are necessary to
absorb all the photons for irradiances higher than 44 WUV/m2. The decrease of H2O2 consumption with
the increase of the irradiance may be attributed to the predominance of the photochemical pathway
concerning the ferric ions regeneration in detriment of the thermal process.
As the maximum UV irradiance recorded in Portugal is around 44 WUV/m2 (spring and summer), it is
possible to conclude that all photons reaching the reaction medium will be absorbed, considering the
path length of the photoreactors. For lower irradiances (autumn and winter), the kinetic rate remains
constant in terms of accumulated UV energy, but the reaction takes longer time.
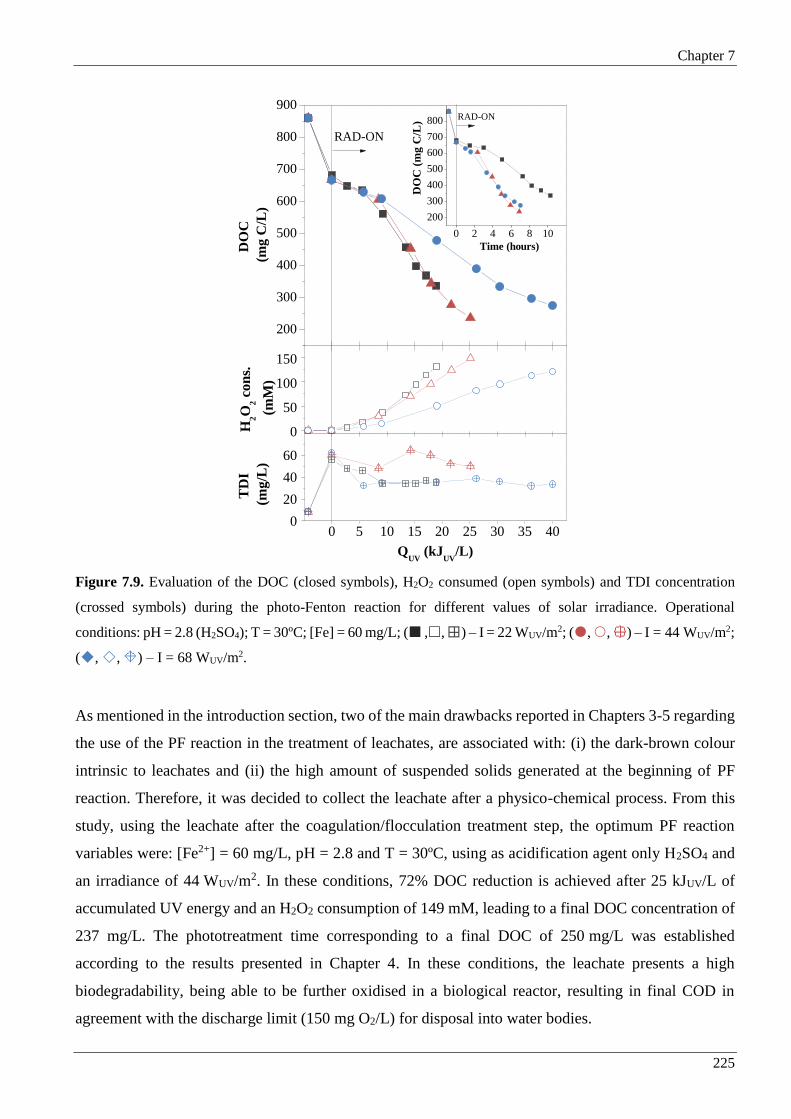
Chapter 7
225
Figure 7.9. Evaluation of the DOC (closed symbols), H2O2 consumed (open symbols) and TDI concentration
(crossed symbols) during the photo-Fenton reaction for different values of solar irradiance. Operational
conditions: pH = 2.8 (H2SO4); T = 30ºC; [Fe] = 60 mg/L; ( ,, ) – I = 22 WUV/m2; (, , ) – I = 44 WUV/m2;
(, , ) – I = 68 WUV/m2.
As mentioned in the introduction section, two of the main drawbacks reported in Chapters 3-5 regarding
the use of the PF reaction in the treatment of leachates, are associated with: (i) the dark-brown colour
intrinsic to leachates and (ii) the high amount of suspended solids generated at the beginning of PF
reaction. Therefore, it was decided to collect the leachate after a physico-chemical process. From this
study, using the leachate after the coagulation/flocculation treatment step, the optimum PF reaction
variables were: [Fe2+] = 60 mg/L, pH = 2.8 and T = 30ºC, using as acidification agent only H2SO4 and
an irradiance of 44 WUV/m2. In these conditions, 72% DOC reduction is achieved after 25 kJUV/L of
accumulated UV energy and an H2O2 consumption of 149 mM, leading to a final DOC concentration of
237 mg/L. The phototreatment time corresponding to a final DOC of 250 mg/L was established
according to the results presented in Chapter 4. In these conditions, the leachate presents a high
biodegradability, being able to be further oxidised in a biological reactor, resulting in final COD in
agreement with the discharge limit (150 mg O2/L) for disposal into water bodies.
0 5 10 15 20 25 30 35 400
20
40
60
TD
I
(mg
/L)
QUV
(kJUV
/L)
200
300
400
500
600
700
800
900
RAD-ON
DO
C
(mg C
/L)
RAD-ON
0 2 4 6 8 10
200
300
400
500
600
700
800
Time (hours)
DO
C (
mg C
/L)
0
50
100
150
H2O
2 c
on
s.
(mM
)

Chapter 7
226
Comparing with the results reported in Chapter 5, where the photo-oxidation reaction (pH = 2.8 (H2SO4);
TDIm = 33 mg/L (TDIadded = 80 mg/L); Tm = 35ºC; Im = 23 W/m2) was directly applied to a leachate just
after an aerobic lagooning stage, the coagulation/flocculation treatment step decreased in about 69% and
44% the required UV energy and H2O2 necessary for the photo-Fenton reaction, respectively, in order
to achieve a similar final DOC (261 mg/L).

Chapter 7
227
7.4 Conclusions
A solar photo-Fenton (PF) oxidation process showed to be an interesting approach for the mineralization
of recalcitrant leachates, and can be integrated in a treatment strategy consisting of the following steps:
aerated lagooning, aerated activated sludge, coagulation/flocculation, photo-Fenton oxidation and
aerated/anoxic activated sludge.
The coagulation/flocculation step improves substantially the efficiency of the PF reaction, both in terms
of energy (69% less) and H2O2 consumption (44% less), mainly associated with the decrease on TSS
(ca. 75% less) and precipitation of humic acids during the physico-chemical step.
Regarding the PF reaction variables it was possible to conclude that: (i) the best iron concentration was
60 mg/L and above this content the mineralization degree is not affected; (ii) the best pH value was 2.8,
since iron precipitation is avoided and the highest FeOH2+ concentration is achieved, nevertheless,
according to ferric speciation diagrams, the reaction rate constant could be improved if the pH was
increased to 3.0; (iii) the rise of leachate temperature benefits the reaction rate until 40ºC, mostly
attributed to the production of more hydroxyl radicals resulting from a higher ferric ion reduction
through thermal reactions and an increment of the FeOH2+ molar fraction; however, mainly above 30ºC,
more H2O2 was spent to achieve the same mineralization; (iv) higher reaction rates were achieved when
using only H2SO4 instead of HCl and H2SO4 + HCl, since (1) H2SO4 is commercially available at higher
concentration than HCl but at the similar price, being necessary a much lesser amount to acidify the
leachate, (2) the Cl and Cl2- radicals are less reactive than SO4
-, and (3) the ferric ions solubility
decreases in the presence of high chlorides content; (v) during spring and summer, when the irradiance
is around 44 WUV/m2 at maximum, considering the path length of the photoreactors, energy losses will
be negligible, and, over autumn and winter, the kinetic reaction rate remains constant in terms of
accumulated UV energy, but the reaction takes a longer time.
Ferric ion speciation diagrams showed to be a good tool to predict the dissimilarities on the photo-Fenton
reaction performance, according to the solution pH, temperature, concentration of chloride and sulphate
ions. When the pH and temperature values were individually changed, it was possible to achieve a linear
relation between the pseudo-first order kinetic constant and the theoretical FeOH2+ content. Furthermore,
in a full-scale plant, speciation diagrams can be used to predict the optimum pH value, taking into
account the leachate temperature variability and the amount of sulphate and chloride ions, and also the
required phototreatment time for a further biological treatment with high efficiency.

Chapter 7
228
7.5 References
[1] A. Baun, A. Ledin, L.A. Reitzel, P.L. Bjerg, T.H. Christensen, Xenobiotic organic compounds in leachates
from ten Danish MSW landfills--chemical analysis and toxicity tests, Water Research, 38 (2004) 3845-3858.
[2] C.B. Öman, C. Junestedt, Chemical characterization of landfill leachates - 400 parameters and compounds,
Waste Management, 28 (2008) 1876-1891.
[3] S. Renou, J.G. Givaudan, S. Poulain, F. Dirassouyan, P. Moulin, Landfill leachate treatment: Review and
opportunity, Journal of Hazardous materials, 150 (2008) 468-493.
[4] Y. Deng, J.D. Englehardt, Hydrogen peroxide-enhanced iron-mediated aeration for the treatment of mature
landfill leachate, Journal of Hazardous materials, 153 (2008) 293-299.
[5] D. Hermosilla, M. Cortijo, C.P. Huang, Optimizing the treatment of landfill leachate by conventional Fenton
and photo-Fenton processes, Science of the Total Environment, 407 (2009) 3473-3481.
[6] E.M.R. Rocha, V.J.P. Vilar, A. Fonseca, I. Saraiva, R.A.R. Boaventura, Landfill leachate treatment by solar-
driven AOPs, Solar Energy, 85 (2011) 46-56.
[7] M. Umar, H.A. Aziz, M.S. Yusoff, Trends in the use of Fenton, electro-Fenton and photo-Fenton for the
treatment of landfill leachate, Waste Management, 30 (2010) 2113-2121.
[8] J.J. Wu, C.-C. Wu, H.-W. Ma, C.-C. Chang, Treatment of landfill leachate by ozone-based advanced oxidation
processes, Chemosphere, 54 (2004) 997-1003.
[9] M. Panizza, C.A. Martinez-Huitle, Role of electrode materials for the anodic oxidation of a real landfill
leachate – Comparison between Ti–Ru–Sn ternary oxide, PbO2 and boron-doped diamond anode,
Chemosphere, 90 (2013) 1455-1460.
[10] S.S. Abu Amr, H.A. Aziz, New treatment of stabilized leachate by ozone/Fenton in the advanced oxidation
process, Waste Management, 32 (2012) 1693-1698.
[11] V.J.P. Vilar, T.F.C.V. Silva, M.A.N. Santos, A. Fonseca, I. Saraiva, R.A.R. Boaventura, Evaluation of solar
photo-Fenton parameters on the pre-oxidation of leachates from a sanitary landfill, Solar Energy, 86 (2012)
3301-3315.
[12] S. Cortez, P. Teixeira, R. Oliveira, M. Mota, Evaluation of Fenton and ozone-based advanced oxidation
processes as mature landfill leachate pre-treatments, Journal of Environmental Management, 92 (2011) 749-
755.
[13] J.L. de Morais, P.P. Zamora, Use of advanced oxidation processes to improve the biodegradability of mature
landfill leachates, Journal of Hazardous materials, 123 (2005) 181-186.
[14] H.-s. Li, S.-q. Zhou, Y.-b. Sun, P. Feng, J.-d. Li, Advanced treatment of landfill leachate by a new
combination process in a full-scale plant, Journal of Hazardous materials, 172 (2009) 408-415.
[15] V.J.P. Vilar, E.M.R. Rocha, F.S. Mota, A. Fonseca, I. Saraiva, R.A.R. Boaventura, Treatment of a sanitary
landfill leachate using combined solar photo-Fenton and biological immobilized biomass reactor at a pilot
scale, Water Research, 45 (2011) 2647-2658.

Chapter 7
229
[16] C. Sawyer, P. McCarty, G. Parkin, Chemistry for Environmental Engineering and Science, McGraw-Hill
Education, 2003.
[17] M. Silva, A. Trovó, R. Nogueira, Degradation of the herbicide tebuthiuron using solar photo-Fenton process
and ferric citrate complex at circumneutral pH, Journal of Photochemistry and Photobiology A: Chemistry,
191 (2007) 187-192.
[18] C.-H. Liao, M.-C. Lu, S.-H. Su, Role of cupric ions in the H2O2/UV oxidation of humic acids, Chemosphere,
44 (2001) 913-919.
[19] S.E. Cabaniss, Carboxylic acid content of a fulvic acid determined by potentiometry and aqueous Fourier
transform infrared spectrometry, Analytica Chimica Acta, 255 (1991) 23-30.
[20] J.J. Pignatello, E. Oliveros, A. MacKay, Advanced Oxidation Processes for Organic Contaminant Destruction
Based on the Fenton Reaction and Related Chemistry, Critical Reviews in Environmental Science and
Technology, 36 (2006) 1-84.
[21] J. Kiwi, A. Lopez, V. Nadtochenko, Mechanism and kinetics of the OH-radical intervention during Fenton
oxidation in the presence of a significant amount of radical scavenger (Cl-), Environmental Science &
Technology, 34 (2000) 2162-2168.
[22] A. Machulek Júnior, F.H. Quina, F. Gozzi, V.O. Silva, J.E.F. Moraes, Fundamental Mechanistic Studies of
the Photo-Fenton Reaction for the Degradation of Organic Pollutants, in: T. Puzyn, A. Mostrag-Szlichtyng
(Eds.) Organic Pollutants, Rijeka: InTech, 2011, pp. 1-22.
[23] A. Machulek Jr, J.E.F. Moraes, L.T. Okano, C.A. Silvério, F.H. Quina, Photolysis of ferric ions in the
presence of sulfate or chloride ions: implications for the photo-Fenton process, Photochemical &
Photobiological Sciences, 8 (2009) 985-991.
[24] J.T. Jasper, D.L. Sedlak, Phototransformation of wastewater-derived trace organic contaminants in open-
water unit process treatment wetlands, Environmental Science & Technology, 47 (2013) 10781-10790.
[25] T. Zeng, W.A. Arnold, Pesticide photolysis in prairie potholes: probing photosensitized processes,
Environmental Science & Technology, 47 (2012) 6735-6745.
[26] P. Neta, R.E. Huie, A.B. Ross, Rate constants for reactions for inorganic radicals in aqueous solution, Journal
of Physical and Chemical Reference Data, 17 (1988) 1027-1247.
[27] J. De Laat, T.G. Le, Kinetics and modeling of the Fe (III)/H2O2 system in the presence of sulfate in acidic
aqueous solutions, Environmental Science & Technology, 39 (2005) 1811-1818.
[28] A. El-Ghenymy, S. Garcia-Segura, R.M. Rodríguez, E. Brillas, M.S. El Begrani, B.A. Abdelouahid,
Optimization of the electro-Fenton and solar photoelectro-Fenton treatments of sulfanilic acid solutions using
a pre-pilot flow plant by response surface methodology, Journal of Hazardous materials, 221 (2012) 288-297.
[29] M.M. Ghoneim, H.S. El-Desoky, N.M. Zidan, Electro-Fenton oxidation of Sunset Yellow FCF azo-dye in
aqueous solutions, Desalination, 274 (2011) 22-30.
[30] J. Feng, X. Hu, P.L. Yue, H.Y. Zhu, G.Q. Lu, Degradation of azo-dye orange II by a photoassisted Fenton
reaction using a novel composite of iron oxide and silicate nanoparticles as a catalyst, Industrial &
Engineering Chemistry Research, 42 (2003) 2058-2066.

Chapter 7
230
[31] J.W.T. Spinks, R.J. Woods, An introduction to radiation chemistry, (1990).
[32] D.L. Jones, K.L. Williamson, A.G. Owen, Phytoremediation of landfill leachate, Waste Management, 26
(2006) 825-837.
[33] N. Klamerth, S. Malato, A. Agüera, A. Fernández-Alba, Photo-Fenton and modified photo-Fenton at neutral
pH for the treatment of emerging contaminants in wastewater treatment plant effluents: A comparison, Water
Research, 47 (2013) 833-840.
[34] X. Liu, F.J. Millero, The solubility of iron hydroxide in sodium chloride solutions, Geochimica et
Cosmochimica Acta, 63 (1999) 3487-3497.
[35] Y. Sun, J.J. Pignatello, Activation of hydrogen peroxide by iron (III) chelates for abiotic degradation of
herbicides and insecticides in water, Journal of Agricultural and Food Chemistry, 41 (1993) 308-312.
[36] Y. Sun, J.J. Pignatello, Organic intermediates in the degradation of 2, 4-dichlorophenoxyacetic acid by iron
(3+)/hydrogen peroxide and iron (3+)/hydrogen peroxide/UV, Journal of Agricultural and Food Chemistry,
41 (1993) 1139-1142.
[37] N. Klamerth, S. Malato, M.I. Maldonado, A. Agüera, A. Fernández-Alba, Modified photo-Fenton for
degradation of emerging contaminants in municipal wastewater effluents, Catalysis Today, 161 (2011) 241-
246.
[38] Y. Deng, Formation of iron(III) hydroxides from homogeneous solutions, Water Research, 31 (1997) 1347-
1354.
[39] S. Malato, P. Fernández-Ibáñez, M.I. Maldonado, J. Blanco, W. Gernjak, Decontamination and disinfection
of water by solar photocatalysis: Recent overview and trends, Catalysis Today, 147 (2009) 1-59.
[40] V.J.P. Vilar, S.M.S. Capelo, T.F.C.V. Silva, R.A.R. Boaventura, Solar photo-Fenton as a pre-oxidation step
for biological treatment of landfill leachate in a pilot plant with CPCs, Catalysis Today, 161 (2011) 228-234.
[41] V.J.P. Vilar, J.M.S. Moreira, A. Fonseca, I. Saraiva, R.A.R. Boaventura, Application of Fenton and Solar
Photo-Fenton Processes to the Treatment of a Sanitary Landfill Leachate in a Pilot Plant with CPCs, Journal
of Advanced Oxidation Technologies, 15 (2012) 107-116.
[42] F.C. Moreira, R.A.R. Boaventura, E. Brillas, V.J.P. Vilar, Degradation of trimethoprim antibiotic by UVA
photoelectro-Fenton process mediated by Fe(III)–carboxylate complexes, Applied Catalysis B:
Environmental, 162 (2015) 34-44.
[43] A.E. Martell, R.M. Smith, Critical stability constants, Plenum Press, New York, 1977.
[44] J. De Laat, T.G. Le, Effects of chloride ions on the iron (III)-catalyzed decomposition of hydrogen peroxide
and on the efficiency of the Fenton-like oxidation process, Applied Catalysis B: Environmental, 66 (2006)
137-146.
[45] J. De Laat, G. Truong Le, B. Legube, A comparative study of the effects of chloride, sulfate and nitrate ions
on the rates of decomposition of H2O2 and organic compounds by Fe(II)/H2O2 and Fe(III)/H2O2,
Chemosphere, 55 (2004) 715-723.
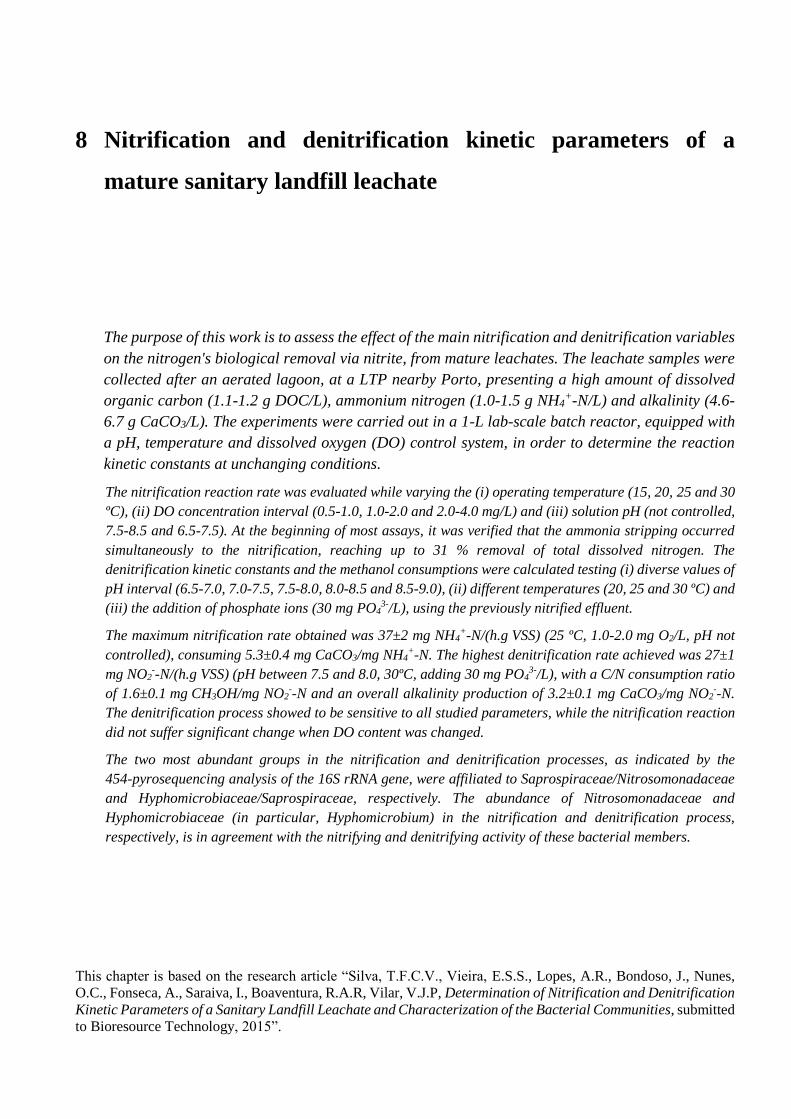
8 Nitrification and denitrification kinetic parameters of a
mature sanitary landfill leachate
The purpose of this work is to assess the effect of the main nitrification and denitrification variables
on the nitrogen's biological removal via nitrite, from mature leachates. The leachate samples were
collected after an aerated lagoon, at a LTP nearby Porto, presenting a high amount of dissolved
organic carbon (1.1-1.2 g DOC/L), ammonium nitrogen (1.0-1.5 g NH4+-N/L) and alkalinity (4.6-
6.7 g CaCO3/L). The experiments were carried out in a 1-L lab-scale batch reactor, equipped with
a pH, temperature and dissolved oxygen (DO) control system, in order to determine the reaction
kinetic constants at unchanging conditions.
The nitrification reaction rate was evaluated while varying the (i) operating temperature (15, 20, 25 and 30
ºC), (ii) DO concentration interval (0.5-1.0, 1.0-2.0 and 2.0-4.0 mg/L) and (iii) solution pH (not controlled,
7.5-8.5 and 6.5-7.5). At the beginning of most assays, it was verified that the ammonia stripping occurred
simultaneously to the nitrification, reaching up to 31 % removal of total dissolved nitrogen. The
denitrification kinetic constants and the methanol consumptions were calculated testing (i) diverse values of
pH interval (6.5-7.0, 7.0-7.5, 7.5-8.0, 8.0-8.5 and 8.5-9.0), (ii) different temperatures (20, 25 and 30 ºC) and
(iii) the addition of phosphate ions (30 mg PO43-/L), using the previously nitrified effluent.
The maximum nitrification rate obtained was 37±2 mg NH4+-N/(h.g VSS) (25 ºC, 1.0-2.0 mg O2/L, pH not
controlled), consuming 5.3±0.4 mg CaCO3/mg NH4+-N. The highest denitrification rate achieved was 27±1
mg NO2--N/(h.g VSS) (pH between 7.5 and 8.0, 30ºC, adding 30 mg PO4
3-/L), with a C/N consumption ratio
of 1.6±0.1 mg CH3OH/mg NO2--N and an overall alkalinity production of 3.2±0.1 mg CaCO3/mg NO2
--N.
The denitrification process showed to be sensitive to all studied parameters, while the nitrification reaction
did not suffer significant change when DO content was changed.
The two most abundant groups in the nitrification and denitrification processes, as indicated by the
454-pyrosequencing analysis of the 16S rRNA gene, were affiliated to Saprospiraceae/Nitrosomonadaceae
and Hyphomicrobiaceae/Saprospiraceae, respectively. The abundance of Nitrosomonadaceae and
Hyphomicrobiaceae (in particular, Hyphomicrobium) in the nitrification and denitrification process,
respectively, is in agreement with the nitrifying and denitrifying activity of these bacterial members.
This chapter is based on the research article “Silva, T.F.C.V., Vieira, E.S.S., Lopes, A.R., Bondoso, J., Nunes,
O.C., Fonseca, A., Saraiva, I., Boaventura, R.A.R, Vilar, V.J.P, Determination of Nitrification and Denitrification
Kinetic Parameters of a Sanitary Landfill Leachate and Characterization of the Bacterial Communities, submitted
to Bioresource Technology, 2015”.

Chapter 8
233
8.1 Introduction
Sanitary landfill leachates are characterized as a complex mixture of diverse organic and inorganic
contaminants [1, 2], which are usually removed by combining different treatment processes [3, 4].
Due to its simplicity, reliability, high cost-effectiveness and to the high nitrogen content (mostly in
the NH4+-N form) inherent in this type of effluent, the activated sludge biological process is almost
always applied in leachate treatment plants (LTPs) [5, 6]. Up to date, the nitrification reaction
followed by a denitrification step is the biological process most used for nitrogen removal from
wastewaters [7].
The nitrification reaction is a litho-autotrophic microbiological mechanism, occurring under
aerobic conditions, where the carbon dioxide is the carbon source and the molecular oxygen is the
final electron acceptor. Usually, nitrification reaction takes place in two steps: (i) first, ammonium
nitrogen is oxidised into nitrite (nitritation) by the ammonia-oxidising bacteria (AOB), frequently
Nitrosomonas, according to the Eq. (8.1); and (ii) then, in more restrictive operating conditions,
the nitrite is converted into nitrate (nitratation) by the nitrite-oxidising bacteria (NOB), such as
Nitrobacter or Nitrospira, in agreement with the Eq. (8.2) [8-10]. In wastewater treatment processes
with high organic load, the AOB and NOB coexist with organo-heterotrophic bacteria, since these
are the most responsible for the conversion of organic nitrogen compounds, such as proteins and
amino acids, into simplest products, including the ammonium ions [11-13].
2HOHNOO
2
3NH 2224 (8.1)
322 NOO2
1NO (8.2)
In contrast, the denitrification reaction is widely distributed among prokaryotic microorganisms,
being coupled with chemo-organo-heterotrophy or chemo-litho-autotrophy. It occurs under anoxic
conditions, because an ionic nitrogen oxide compound acts as the final electron acceptor. The
denitrification process involves the dissimilatory reduction of nitrate and/or nitrite into atmospheric
nitrogen, through a sequential production of gaseous nitrogen oxide intermediates. The linear
pathway of the reductive steps is shown in the Eq. (8.3) (where the values between parenthesis
represent the oxidation states of each nitrogen specie) [8, 9, 14]:
0
2
1
2
23
2
5
3 NONNONONO (8.3)

Chapter 8
234
Each oxidised nitrogen substrate is catalysed by a specific enzyme (NO3-, NO2
-, NO or N2O reductase)
and attends as electron acceptor on the denitrifying bacteria respiration, commonly, attached to the
oxidation of a biodegradable organic compound as electron donor for energy generation [8, 9].
Although, in general, leachates contain a high organic matter content, their biodegradable fraction
decreases with aging, due to the releasing of recalcitrant molecules (mainly humic and fulvic acids) from
the solid wastes deposited in the landfills. [5]. This fact combined with that of denitrification step being
preceded by nitrification (where the biodegradable carbon is already oxidized) often leads to the need of
adding an external carbon source to accomplish the denitrification reaction. Several carbon sources have
been used on this process, e.g., methanol, ethanol, glucose, methane, acetic and benzoic acid [15-19].
Among the various carbon sources commercially available, methanol is widely used, mainly because it
is the cheaper, it reduces the sludge production and its residual content can be easily removed by aeration
[15, 17, 20]. The Eqs. (8.4) - (8.6) represent the energy-yielding reactions involved in denitrification,
where the methanol provides energy to bacteria, such as Hyphomicrobium, and the gaseous dinitrogen
is released to the atmosphere [12]:
OH4CO2NO6OHCH26NO 22233 (8.4)
6OHOH3CO3N3OHCH36NO 22232 (8.5)
6OHOH7CO5N3OHCH56NO 22233 (8.6)
The biological nitrogen removal via nitrite, instead of nitrate, could be a good option since nitrite
is an intermediate of both nitrification and denitrification reactions. Thus, the nitrification could be
stopped at nitrite and the denitrification could start from there, by reducing the nitrite into nitrogen
gas, thereby saving about 25 % in the oxygen demand for the nitrification, 40 % in the needs of
external carbon source for the denitrification and 50 % in the size of the anoxic reactor [21, 22].
This shortcut was effectively implemented by Spagni and Marsili-Libelli [23], on the treatment of
sanitary landfill leachate with an average initial concentration of ammonium nitrogen of
1199 mg NH4+-N/L, using a sequencing batch reactor (SBR), at bench-scale. The authors achieved
efficiencies of 98 and 95 % on the nitrification and denitrification reactions, respectively, saving
about 35 % on the external carbon source.

Chapter 8
235
The extension of the nitrification reaction can be influenced by diverse abiotic factors, being the most
important the temperature, pH, dissolved oxygen (DO) deficiency, the presence of toxic or inhibitory
substances and the substrate concentration. The nitrite build-up occurs when, individually or in
combination, certain deviations in the abiotic factors repress the action of the nitrite-oxidizing bacteria
in detriment of the ammonia-oxidising bacteria. The denitrification process can be affected by the energy
source, the temperature, the pH and the presence of oxygen, since the bacteria begin to respire with
oxygen and stop to denitrify [8].
The main goal of the present work is to assess how the variation of certain operating conditions
may affect the reaction rates of nitrification and denitrification via nitrite, in a full-scale biological
treatment of a mature leachate, since this process is almost always incorporated in LTPs. To achieve
our goal, at lab-scale, the influence of: i) temperature, dissolved oxygen (DO) concentration and
pH, on the nitrification of a leachate collected at the outlet of an aerobic lagoon; and (ii) pH interval,
operating temperature and phosphate addition, on the denitrification of a nitrified leachate, was
assessed. The biological sludge used in both nitrification and denitrification reactions was
previously adapted to aerobic and anoxic conditions, respectively. Furthermore, the composition
and structure of the corresponding bacterial communities were assessed, using 454-pyrosequencing
of the 16S rRNA gene.
8.2 Experimental methodology
A set of 16 experiments was conducted in a respirometer, working as an activated sludge biological
reactor, at lab-scale, in order to calculate the kinetic constants of nitrification and denitrification
reactions under controlled conditions. Table 8.1 shows a short description of the operating conditions
applied on each test.
For nitrification assays, the activated sludge was collected from an aerobic biologica l reactor of a
leachate treatment plant (LTP), and it was acclimated for 3 months to the landfill leachate in aerobic
conditions, prior to the first test. During the acclimation process, the leachate collected after aerobic
lagooning was successively fed to a 10-L batch bioreactor (24 < t (h) < 48, 22 < T (ºC) < 28;
6.5 < pH < 9.0 (through the NaOH addition, after the leachate alkalinity exhaustion);
0.5 < DO (mg/L) < 4), up to almost complete oxidation of ammonium into nitrite (> 95%). This
reactor was kept running throughout entire nitrification test period, since it was the source of
biomass for the experiments in the respirometer. The obtained bio-treated leachate was saved for
later use on the denitrification tests and on the acclimation of the denitrifying bacteria.
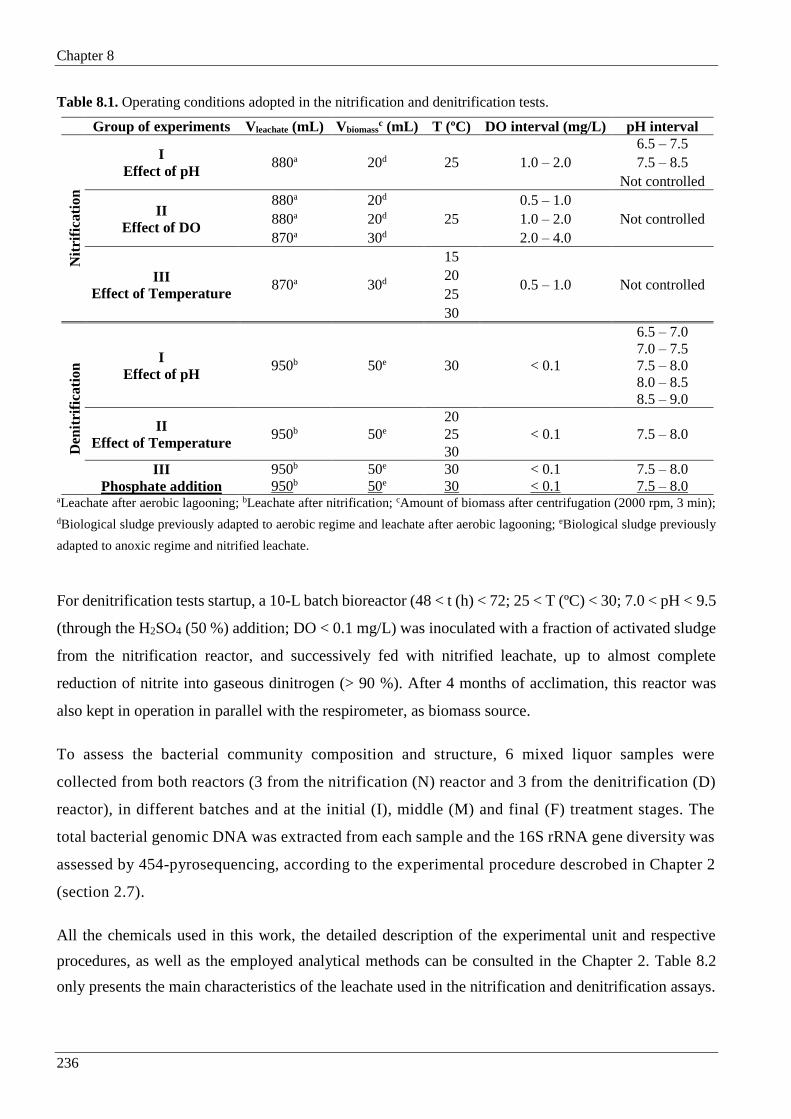
Chapter 8
236
Table 8.1. Operating conditions adopted in the nitrification and denitrification tests.
Group of experiments Vleachate (mL) Vbiomassc (mL) T (ºC) DO interval (mg/L) pH interval
Nit
rifi
cati
on
I
Effect of pH 880a 20d 25 1.0 – 2.0
6.5 – 7.5
7.5 – 8.5
Not controlled
II
Effect of DO
880a 20d
25
0.5 – 1.0
Not controlled 880a 20d 1.0 – 2.0
870a 30d 2.0 – 4.0
III
Effect of Temperature 870a 30d
15
0.5 – 1.0 Not controlled 20
25
30
Den
itri
fica
tio
n I
Effect of pH 950b 50e 30 < 0.1
6.5 – 7.0
7.0 – 7.5
7.5 – 8.0
8.0 – 8.5
8.5 – 9.0
II
Effect of Temperature 950b 50e
20
< 0.1 7.5 – 8.0 25
30
III
Phosphate addition
950b 50e 30 < 0.1 7.5 – 8.0
950b 50e 30 < 0.1 7.5 – 8.0 aLeachate after aerobic lagooning; bLeachate after nitrification; cAmount of biomass after centrifugation (2000 rpm, 3 min);
dBiological sludge previously adapted to aerobic regime and leachate after aerobic lagooning; eBiological sludge previously
adapted to anoxic regime and nitrified leachate.
For denitrification tests startup, a 10-L batch bioreactor (48 < t (h) < 72; 25 < T (ºC) < 30; 7.0 < pH < 9.5
(through the H2SO4 (50 %) addition; DO < 0.1 mg/L) was inoculated with a fraction of activated sludge
from the nitrification reactor, and successively fed with nitrified leachate, up to almost complete
reduction of nitrite into gaseous dinitrogen (> 90 %). After 4 months of acclimation, this reactor was
also kept in operation in parallel with the respirometer, as biomass source.
To assess the bacterial community composition and structure, 6 mixed liquor samples were
collected from both reactors (3 from the nitrification (N) reactor and 3 from the denitrification (D)
reactor), in different batches and at the initial (I), middle (M) and final (F) treatment stages. The
total bacterial genomic DNA was extracted from each sample and the 16S rRNA gene diversity was
assessed by 454-pyrosequencing, according to the experimental procedure descrobed in Chapter 2
(section 2.7).
All the chemicals used in this work, the detailed description of the experimental unit and respective
procedures, as well as the employed analytical methods can be consulted in the Chapter 2. Table 8.2
only presents the main characteristics of the leachate used in the nitrification and denitrification assays.

Chapter 8
237
Table 8.2. Physico-chemical characterization of the leachate used in the nitrification and denitrification tests.
Parameter Unities Nitrification tests Denitrification tests
pH Sorensen scale 8.3 ± 0.5 7.8 ± 0.2
Total dissolved carbon (TDC) g C/L 2.5 ± 0.3 1.2 ± 0.1
Dissolved inorganic carbon (DIC) g C/L 1.4 ± 0.2 0.05 ± 0.01
Alkalinitya g CaCO3/L 5.7 ± 0.9 0.19 ± 0.04
Dissolved organic carbon (DOC) g C/L 1.14 ± 0.07 1.2 ± 0.1
Total dissolved nitrogen (ND) g N/L 1.3 ± 0.2 1.1 ± 0.2
Total ammonia nitrogen g N-NH4+/L 1.3 ± 0.2 0.03 ± 0.02
Nitrate g N-NO3-/L 0.02 ± 0.01 0.03 ± 0.02
Nitrite g N-NO2-/L 0.08 ± 0.01 1.1 ± 0.2
Phosphate g PO43-/L 0.04 ± 0.01 0.015 ± 0.04
Sulphate g SO42-/L 0.12 ± 0.01 0.13 ± 0.03
Chloride g Cl-/L 2.47 ± 0.06 2.5 ± 0.2
Sodium g Na+/L 2.07 ± 0.06 2.7 ± 0.1
Potassium g K+/L 1.95 ± 0.05 2.06 ± 0.03
Magnesium g Mg2+/L 0.29 ± 0.02 0.24 ± 0.01
Calcium g C a2+/L 0.46 ± 0.08 0.58 ± 0.05 aAlkalinity values considering that, for pH < 11, the inorganic carbon was in the form of carbonates and bicarbonates [24].
8.3 Results and discussion
8.3.1 Nitrification
8.3.1.1 General Remarks
During all nitrification tests, the nitrate concentration was negligible, indicating that only the nitritation
reaction occurred, leading to the accumulation of nitrite inside the biological reactor. Whereby, the
nitrification kinetic constants were calculated in terms of ammonia removal and nitrite formation. The
cause of nitrite build-up was almost certainly due to the presence of free ammonia (NH3), which has
been described as being more inhibitory for the NOB (0.08-0.82 mg NH3-N/L) than for the AOB
(8.2-123 mg NH3-N/L) [10, 25]. Throughout the experiments, the maximum concentration of free
ammonia ranged between 29 and 469 mg NH3-N/L (see Table 8.3), which came to be inhibitory for both
nitrifying bacteria species. The amount of un-ionised ammonia ([NH3-N]) was correlated with the
concentration of total ammonia nitrogen ([TAN] = [NH3-N + NH4+-N], determined directly by ionic
chromatography), the solution pH and the temperature (in ºC), according to the Eq. (8.7) [25]:
pHT2736344
pH
310e
10TANNNH
(8.7)
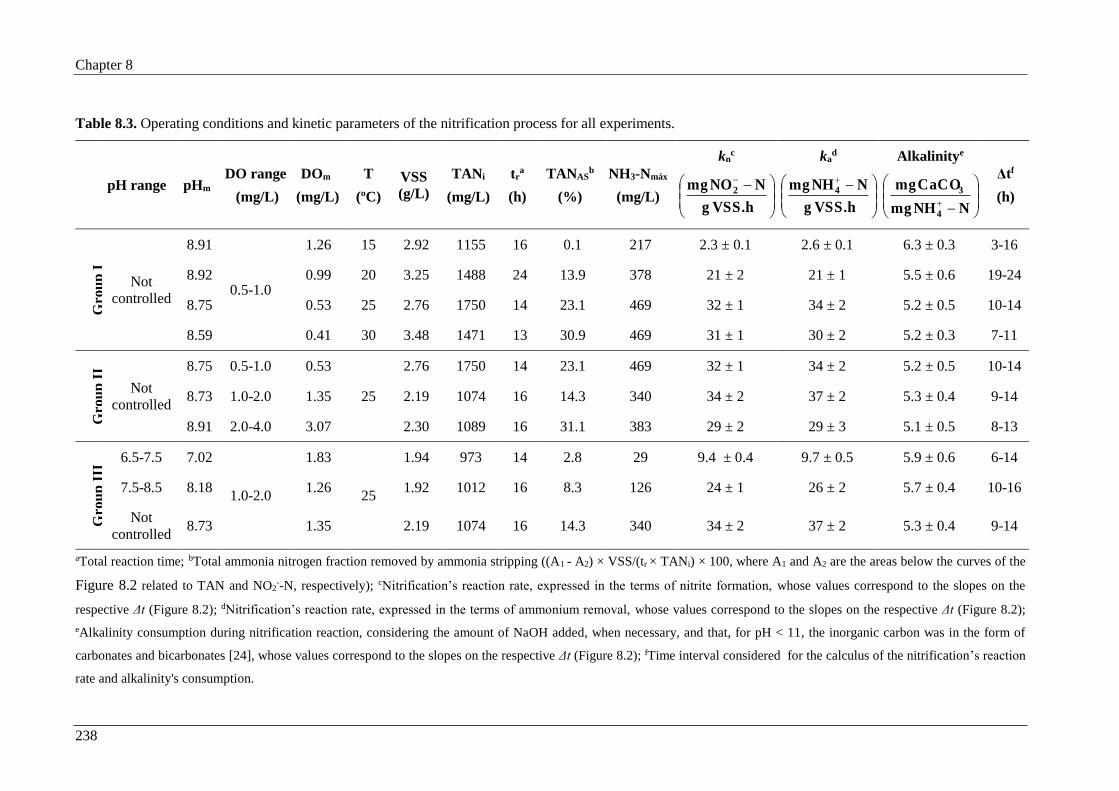
Chapter 8
238
Table 8.3. Operating conditions and kinetic parameters of the nitrification process for all experiments.
pH range pHm DO range
(mg/L)
DOm
(mg/L)
T
(ºC)
VSS
(g/L)
TANi
(mg/L)
tra
(h)
TANASb
(%)
NH3-Nmáx
(mg/L)
knc
VSS.h g
NNO mg 2
kad
VSS.h g
NNH mg 4
Alkalinitye
NNH mg
CaCO mg
4
3
Δtf
(h)
Gro
up
I
Not
controlled
8.91
0.5-1.0
1.26 15 2.92 1155 16 0.1 217 2.3 ± 0.1 2.6 ± 0.1 6.3 ± 0.3 3-16
8.92 0.99 20 3.25 1488 24 13.9 378 21 ± 2 21 ± 1 5.5 ± 0.6 19-24
8.75 0.53 25 2.76 1750 14 23.1 469 32 ± 1 34 ± 2 5.2 ± 0.5 10-14
8.59 0.41 30 3.48 1471 13 30.9 469 31 ± 1 30 ± 2 5.2 ± 0.3 7-11
Gro
up
II
Not
controlled
8.75 0.5-1.0 0.53
25
2.76 1750 14 23.1 469 32 ± 1 34 ± 2 5.2 ± 0.5 10-14
8.73 1.0-2.0 1.35 2.19 1074 16 14.3 340 34 ± 2 37 ± 2 5.3 ± 0.4 9-14
8.91 2.0-4.0 3.07 2.30 1089 16 31.1 383 29 ± 2 29 ± 3 5.1 ± 0.5 8-13
Gro
up
III
6.5-7.5 7.02
1.0-2.0
1.83
25
1.94 973 14 2.8 29 9.4 ± 0.4 9.7 ± 0.5 5.9 ± 0.6 6-14
7.5-8.5 8.18 1.26 1.92 1012 16 8.3 126 24 ± 1 26 ± 2 5.7 ± 0.4 10-16
Not
controlled 8.73 1.35 2.19 1074 16 14.3 340 34 ± 2 37 ± 2 5.3 ± 0.4 9-14
aTotal reaction time; bTotal ammonia nitrogen fraction removed by ammonia stripping ((A1 - A2) × VSS/(tr × TANi) × 100, where A1 and A2 are the areas below the curves of the
Figure 8.2 related to TAN and NO2--N, respectively); cNitrification’s reaction rate, expressed in the terms of nitrite formation, whose values correspond to the slopes on the
respective Δt (Figure 8.2); dNitrification’s reaction rate, expressed in the terms of ammonium removal, whose values correspond to the slopes on the respective Δt (Figure 8.2);
eAlkalinity consumption during nitrification reaction, considering the amount of NaOH added, when necessary, and that, for pH < 11, the inorganic carbon was in the form of
carbonates and bicarbonates [24], whose values correspond to the slopes on the respective Δt (Figure 8.2); fTime interval considered for the calculus of the nitrification’s reaction
rate and alkalinity's consumption.

Chapter 8
239
Furthermore, in practically all tests, it was verified that it was possible to divide the reaction into two
distinct periods: (i) a first phase, where the nitrification process occurred together with the ammonia
stripping (phenomenon which can take place at high pH values), before the nitrification stabilization
[26]; and (ii) a second phase, where almost only the nitrification reaction was observed. Hence, in order
to clarify the general behaviour of the experiments performed along the nitrification studies, initially, in
this subsection, will just be displayed, as example, the test performed without pH control, at 25 ºC,
dissolved oxygen (DO) between 0.5-1.0 mg/L and an average concentration of volatile suspended solids
(VSS) of 2.76 g/L (Figure 8.1). As can be inferred from total dissolved nitrogen, total ammonia nitrogen
(TAN) and total nitrite-nitrogen (TNN) profiles, up to the 8-hours, a considerable fraction of the
ammonia was lost by air-stripping, reducing the total nitrogen content by about 25%. After that, the
concentration of total nitrogen remained sensibly constant. However, only after 10-hours working
(moment from which pH began to decrease quickly), the TAN depletion rate became closest to the TNN
formation rate, as indicated by the kinetic constants of 34±2 mg NH4+-N/(h.g VSS) and
32±1 mg NO2--N/(h.g VSS), respectively. Until then, the TAN removal rate (42±1 mg NH4
+-N/(h.g
VSS)) was ca. 2 times higher than the TNN production rate (21±2 mg NO2-N/(h.g VSS)).
Figure 8.1. Evolution of total dissolved nitrogen ( ), total ammonia nitrogen ( - NH4+-N + NH3-N), free
ammonia ( - NH3-N), total nitrite-nitrogen ( - NO2--N), alkalinity (), pH ( ) and dissolved oxygen ( )
during a nitrification test (pH not controlled, OD = 0.5-1.0, T = 25 ºC, VSS = 2.76 g/L).
0 1 2 3 4 5 6 7 8 9 10 11 12 13 147.5
8.0
8.5
9.0
0
200
400
600
800
1000
1200
1400
1600
1800
2000
Nit
rogen
(m
g N
/L)
0
1000
2000
3000
4000
5000
6000
7000
8000
Alk
ali
nit
y (
mg C
aC
O3/L
)
pH
Time (hours)
0.0
0.5
1.0
1.5
Dis
solv
ed o
xygen
(m
g/L
)
Chapter 8
240
The air stripping process consists in the mass transfer of a volatile compound from a liquid phase to a
gas stream [14, 27]. In the present work, ammonia stripping also occurred together with the nitrification
reaction. This phenomenon was favoured by the high pH values observed during the tests, as can
depicted in Figure 8.1. The pH rise, observed at the beginning of the experiments, was due to the CO2
stripping that was significantly faster than the NH3 stripping, before the equilibrium conditions be
achieved, since the Henry’s constant for CO2 (150 atm/mole fraction, at 20 ºC) is greater than for NH3
(0.76 atm/mole fraction, at 20ºC) [28-30]. Along the nitrification tests, the total ammonia nitrogen
removal by air stripping varied between 0.1 and 31.1%, depending on the operating conditions (see
Table 8.3). Similarly, Jokela et al. [31] attested the occurrence of air stripping, during the nitrification
of a landfill leachate by a suspended carrier biofilm process, losing about 10 – 30% of nitrogen.
Given the above, the calculation of the nitrification kinetic constants (Table 8.3) was performed taking
into account only the period where the ammonia stripping no longer occurred. This period coincided
with the moment where the pH drop was faster and the free ammonia content was below
200 mg NH3-N/L.
8.3.1.2 Influence of the operating parameters
In order to evaluate and predict the behaviour of nitrification reaction, face to potential variations in the
operating conditions, 8 experiments were carried out, over approximately 16-hours each, where the
influence of the temperature (Group I – 15, 20, 25 and 30 ºC), dissolved oxygen (DO) content interval
(Group II – 0.5-1.0, 1.0-2.0 and 2.0-4.0 mg/L) and pH interval (Group III – not controlled, 7.5-8.5 and
6.5-7.5) was assessed (Table 8.3). The Figure 8.2 illustrates the profiles of total ammonia nitrogen
(TAN) removal and nitrite-nitrogen production per amount of volatile suspended solids used on each
experiment, along time, and the alkalinity removal, as a function of TAN removal. The respective
maximum reaction rates were obtained from the slopes of these plots, in the respective time interval (see
Table 8.3).
The Group I of experiments revealed that: i) for operating temperatures of 15 ºC, the activated
sludge was almost completely inhibited and, therefore, the extent of the nitrification reaction was
very low (2.6 ± 0.1 mg NH4+-N/(h.g VSS)); ii) increasing the temperature from 15 to 25 ºC, the
nitrification rate increased about 3.1 mg NH4+-N/(h.g VSS) per each Celsius degree, achieving a
maximum value of 34 ± 4 mg NH4+-N/(h.g VSS); and iii) for temperatures above the 25ºC, the
reaction rate was not improved. These results are in agreement with the literature, where the
optimum temperature was set in the range of 25-35ºC, for the general biological activity [14], and
28-32ºC for the nitrification process [12].

Chapter 8
241
Moreover, Shammas [32] studied the interaction of temperature, pH and biomass on the nitrification
reaction and found that, using high VSS concentrations (3200 mg/L), the maximum nitrification
rate was not affected by increasing the operating temperature from 25 to 33ºC. Likewise, Gabarró
et al. [33] investigated the influence of the temperature on the AOB activity on the partial
nitrification (PN) of a mature leachate, with 6 g NH4+-N/L, in an SBR. During the PN stabilization
period, they achieved average specific nitrogen loading rates of 34 ± 4 and 35 ± 10 mg N/(h.g VSS)
for 25 and 35 ºC, respectively, which perfectly agrees with the nitrification performance disclosed
in the present work.
Figure 8.2. Representation of the (.1) TAN removed/VSS ratio, and the (.2) NO2--N produced/VSS ratio, as a
function of time, and the (.3) alkalinity removed, as a function of TAN removed, along all nitrification tests, for
different (a) temperature values (15 ºC, ; 20 ºC, ; 25 ºC, and 30 ºC, ), (b) DO intervals (0.5-1.0 mg/L, ;
1.0-2.0 mg/L, and 2.0-4.0 mg/L, ) and (c) pH intervals (6.5-7.5, ; 7.5-8.5, and not controlled, ).
0
100
200
300
400
500
600
0
100
200
300
400
500
600
0
1000
2000
3000
4000
5000
6000
7000
0
100
200
300
400
500
0
100
200
300
400
500
0
1000
2000
3000
4000
5000
6000
0 2 4 6 8 10 12 14 16 18 20 22
0
100
200
300
400
500
0 2 4 6 8 10 12 14 16 18 20 22 24
0
100
200
300
400
500
0 200 400 600 800 1000 12000
1000
2000
3000
4000
5000
6000
TA
N r
emoved
/VS
S (
mg N
H4
+-N
/g V
SS
)
NO
- 2-N
pro
du
ced
/VS
S (
mg N
O2
- -N/g
VS
S)
Alk
ali
nit
y r
em
oved
(m
g C
aC
O3/L
)(c.3)(c.2)(c.1)
Time (hours)
(b.3)(b.2)(b.1)
(a.3)(a.2)(a.1)
Time (hours) TAN removed (mg NH
4
+-N/L)
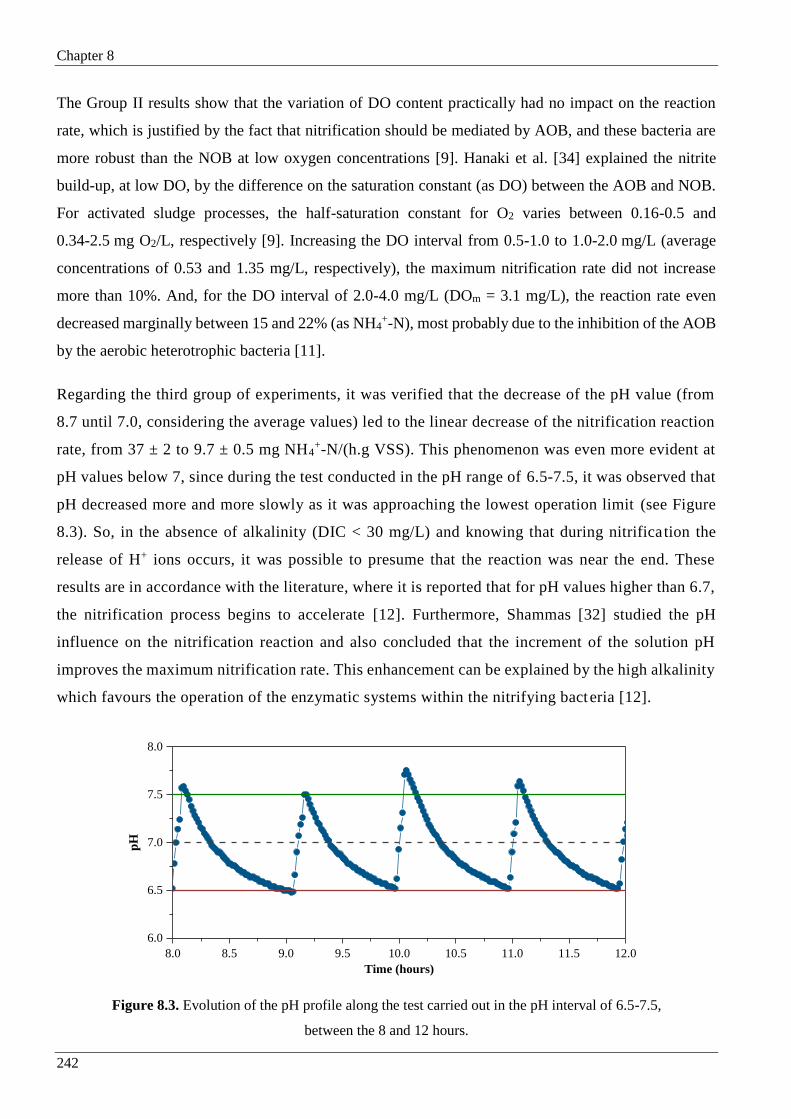
Chapter 8
242
The Group II results show that the variation of DO content practically had no impact on the reaction
rate, which is justified by the fact that nitrification should be mediated by AOB, and these bacteria are
more robust than the NOB at low oxygen concentrations [9]. Hanaki et al. [34] explained the nitrite
build-up, at low DO, by the difference on the saturation constant (as DO) between the AOB and NOB.
For activated sludge processes, the half-saturation constant for O2 varies between 0.16-0.5 and
0.34-2.5 mg O2/L, respectively [9]. Increasing the DO interval from 0.5-1.0 to 1.0-2.0 mg/L (average
concentrations of 0.53 and 1.35 mg/L, respectively), the maximum nitrification rate did not increase
more than 10%. And, for the DO interval of 2.0-4.0 mg/L (DOm = 3.1 mg/L), the reaction rate even
decreased marginally between 15 and 22% (as NH4+-N), most probably due to the inhibition of the AOB
by the aerobic heterotrophic bacteria [11].
Regarding the third group of experiments, it was verified that the decrease of the pH value (from
8.7 until 7.0, considering the average values) led to the linear decrease of the nitrification reaction
rate, from 37 ± 2 to 9.7 ± 0.5 mg NH4+-N/(h.g VSS). This phenomenon was even more evident at
pH values below 7, since during the test conducted in the pH range of 6.5-7.5, it was observed that
pH decreased more and more slowly as it was approaching the lowest operation limit (see Figure
8.3). So, in the absence of alkalinity (DIC < 30 mg/L) and knowing that during nitrification the
release of H+ ions occurs, it was possible to presume that the reaction was near the end. These
results are in accordance with the literature, where it is reported that for pH values higher than 6.7,
the nitrification process begins to accelerate [12]. Furthermore, Shammas [32] studied the pH
influence on the nitrification reaction and also concluded that the increment of the solution pH
improves the maximum nitrification rate. This enhancement can be explained by the high alkalinity
which favours the operation of the enzymatic systems within the nitrifying bacteria [12].
Figure 8.3. Evolution of the pH profile along the test carried out in the pH interval of 6.5-7.5,
between the 8 and 12 hours.
8.0 8.5 9.0 9.5 10.0 10.5 11.0 11.5 12.0
6.0
6.5
7.0
7.5
8.0
pH
Time (hours)

Chapter 8
243
Throughout the experiments, 5.5 ± 0.5 mg CaCO3 were consumed on average per 1 mg of NH4+-N
oxidised to accomplish the nitrification reaction, which is about 23% lesser than the stoichiometric ratio
(7.1 mg CaCO3/mg NH4+-N [12]). Except for the tests conducted in the pH ranges of 6.5-7.5 and 7.5-
8.5, where it was needed to add NaOH to keep the pH value within the intended interval, all the alkalinity
nullified by the releasing of the H+ ions was provided by the leachate.
It should also be noted that along these assays, commonly, the total amount of ammonia lost by air
stripping was raised by the increasing of the temperature, dissolved oxygen concentration, pH value and
initial amount of TAN (see Table 8.3), as expected [28, 29]. Looking at the Group II of experiments, it
could be noticed that for the lowest DO range, the percentage of ammonia stripping was not the lowest
because the initial TAN content was about 34% higher, and consequently, being the pH and temperature
values similar in all tests, the amount of available free ammonia was also higher.
8.3.2 Denitrification
Aiming the projection and assessment of the denitrification process performance when an alteration on
the operating conditions occurs, 8 tests were conducted, during approximately 12-36 hours. Throughout
each denitrification test, the nitrate concentration was negligible, therefore, the maximum denitrification
reaction rate was determined in terms of nitrite removal, regarding the influence of pH (Group I, pH
ranges: 6.5-7.0, 7.0-7.5, 7.5-8.0, 8.0-8.5 and 8.5-9.0), temperature (Group II – 20, 25 and 30 ºC) and
phosphate addition (Group III – without and with addition of 30 mg PO43-/L, respectively). All variables
and kinetic parameters achieved can be consulted in Table 8.4 while the respective reaction profiles can
be observed in Figure 8.4. Figure 8.4 represents the ratio between the amount of nitrite-nitrogen removed
and the VSS concentration, as a function of time, and the amount of methanol consumed and alkalinity
produced, as a function of NO2--N reduced, in all experiments. The maximum reaction rates, as well as
the methanol consumption and the alkalinity production, were obtained from the respective slopes (see
Table 8.4).
The 1st Group of experiments disclosed that the pH interval between 7.5 and 8.5 was the most
favourable to the good performance of the denitrification reaction at 30ºC, leading to a maximum
reaction rate of 19.4 ± 0.7 mg NO2--N/(h.g VSS). Besides that, this test also presented the lowest
values of methanol consumption and alkalinity production. The pH range between 8.0 and 8.5 also
showed itself quite proficient, being the specific reaction rate only 11% lower. However, the
application of this interval would result in an increasing of methanol and acid to be used. The higher
inhibition rate was observed for the lowest pH range (6.5-7.0), being the reaction rate only
5.5 ± 0.1 mg NO2--N/(h.g VSS), about 72% lower than the maximum kinetic constant.

Chapter 8
244
Table 8.4. Operating conditions and kinetic parameters of the denitrification process for all experiments.
pH range pHm T
(ºC)
VSS
(g/L)
NO2--Ni
(mg /L)
kdesn.a
VSS.h g
NNO mg 2
Methanolb
NNO mg
OHCH mg-2
3
Alkalinityc
NNO mg
CaCO mg
2
3
Gro
up
I
6.5-7.0 6.77
30
3.72 1389 5.5 ± 0.1 1.72 ± 0.08 3.5 ± 0.1
7.0-7.5 7.15 2.86 982 15.8 ± 0.2 1.62 ± 0.06 3.4 ± 0.1
7.5-8.0 7.86 3.24 1475 19.4 ± 0.7 1.61 ± 0.06 3.2 ± 0.1
8.0-8.5 8.14 2.92 1046 17.5 ± 0.4 1.67 ± 0.07 3.8 ± 0.1
8.5-9.0 8.90 3.34 1221 13.5 ± 0.2 1.69 ± 0.06 3.4 ± 0.1
Gro
up
II
7.5-8.0
7.42 20 2.00 1421 1.4 ± 0.1 4.3 ± 0.2 ---
7.78 25 2.70 1070 11.1 ± 0.3 2.19 ± 0.06 3.6 ± 0.1
7.86 30 3.24 1475 19.4 ± 0.7 1.61 ± 0.06 3.2 ± 0.1
Gro
up
III
7.5-8.0
7.86
30
3.24 1475 19.4 ± 0.7 1.61 ± 0.06 3.2 ± 0.1
7.85d 2.10d 909d 27 ± 1d 1.6 ± 0.1d 3.2 ± 0.1d
aDenitrification’s reaction rate, expressed in the terms of nitrite reduction, whose values correspond to the slopes in Figure
8.4; bMethanol consumption during denitrification reaction, whose values correspond to the slopes in Figure 8.4; cAlkalinity
production during denitrification reaction, considering the amount of H2SO4 added, and that, for pH < 11, the inorganic
carbon was in the form of carbonates and bicarbonates [24], whose values correspond to the slopes in Figure 8.4; dValues for
the experiment with the addition of 30 mg/L of phosphate ions.
The results concerning the pH variation are in agreement with literature, where it was reported that the
optimum pH for denitrification was around 7.5-8.5 and for low pH values (< 7) the reaction rate may
become slower [8, 12, 14]. At acidic pH (~6.8), the denitrification process can be inhibited by the
presence of free nitrous acid (HNO2), which is related to the nitrite ([NO2--N]) concentration, pH and
temperature (in ºC), according to Eq. (8.8) [9, 25]:
pHT2732300
22
10e
NNONHNO
(8.8)
It should be noted that, during the test performed at the lowest pH interval, the HNO 2 content
ranged between 0.26-0.47 mg HNO2-N/L (data not shown), while in the remaining tests the HNO2
concentration did not exceed 0.1 mg HNO2-N/L. Philips et al. [9] reported that the denitrification
is inhibited by the HNO2 in concentrations above 0.04 mg HNO2-N/L.

Chapter 8
245
Figure 8.4. Representation of the (.1) NO2--N reduced/VSS ratio, as a function of time, and the (.2) methanol
consumed and (.3) alkalinity removed, as a function of NO2--N reduced, along all denitrification tests, regarding
(a) different pH intervals (6.5-7.0, ; 7.0-7.5, ; 7.5-8.0, ; 8.0-8.5, and 8.5-9.5, ), (b) different temperatures
(20 ºC, ; 25 ºC, and 30 ºC, ) and (c) the addition ( ) or not ( ) of phosphate ions.
From the Group II of experiments, it was possible to infer that: i) between 20 and 30ºC, per each Celsius
degree of temperature increase, the denitrification rate rose about 1.8 mg NO2--N/(h.g VSS); and ii) for
temperatures below 20 ºC, the extension of the denitrification reaction was very low. In addition to the
fact that the highest reaction rate was achieved at 30 ºC, the lowest methanol consumption and alkalinity
production was achieved at the same conditions. However, in a full-scale plant, only on the summer, the
biological reactor would present temperatures near 30 ºC. Since heating/cooling systems are very
expensive, in the rest of the year, the denitrification reaction rate would be strongly conditioned by the
ambient temperature, which should be taken into account on the LTP design.
0
50
100
150
200
250
300
350
400
0
400
800
1200
1600
2000
2400
0
500
1000
1500
2000
2500
3000
3500
4000
0
50
100
150
200
250
300
350
0
400
800
1200
1600
2000
0
500
1000
1500
2000
2500
3000
3500
0 5 10 15 20 25 300
50
100
150
200
250
300
350
0 200 400 600 800 1000 12000
400
800
1200
1600
2000
0 200 400 600 800 1000 1200 14000
500
1000
1500
2000
2500
3000
3500
(a.1) (a.2) (a.3)
(b.1)
NO
2
- -N r
edu
ced
/VS
S (
mg N
O2
- -N/g
VS
S)
(b.2)
Met
han
ol
con
sum
ed (
mg C
H3O
H/L
)(b.3)
Alk
ali
nit
y p
rod
uce
d (
mg C
aC
O3/L
)
(c.1)
Time (hours)
(c.2)
NO2-N reduced (mg/L)
(c.3)
NO2-N reduced (mg/L)

Chapter 8
246
In the 3rd Group of experiments, it was evaluated the addition of phosphate, which is a source of
phosphorous, one of the most important nutrients for the microorganisms [14]. In fact, the
denitrification reaction presupposes a previous nitrification process, and then part of the initial
phosphate from the leachate had already been removed. The phosphate addition enhanced the
biomass activity during the denitrification, resulting in 39% increase on the kinetic constant,
consuming only 16 mg of PO43- per 1-L of leachate (data not shown), keeping the consumption of
methanol and acid. In a biological treatment system at full-scale, the lack of phosphorous can be
compensated by the utilization of phosphoric acid instead of the sulphuric acid used to nullify the
alkalinity produced.
Considering all the denitrification experiments carried out, with exception of test 20 (where it was not
possible to determine the alkalinity production and the methanol consumption was clearly an outlier),
on average, it was consumed 1.73 ± 0.07 mg of CH3OH per each mg of NO2--N removed, which was
only 13% higher than the mass stoichiometric ratio (1.53 mg CH3OH/mg NO2--N, considering the
methanol used for denitrification reaction and for cellular synthesis or sludge production [12, 35]). At
the same time it was produced 3.4 ± 0.1 mg of CaCO3 per each mg of NO2--N reduced, which was only
4.8% lower than the mass stoichiometric ratio (3.57 mg CaCO3/ mg NO2--N [12, 14]).
In order to take advantage of the alkalinity consumption, during nitrification, and the alkalinity
production, during denitrification, and thereby, suppress the need of chemicals to correct the pH
value, the best approaches to obtain a leachate in a full-scale LTP with a nitrogen content below 15
mg/L (emission limit value for discharge into water bodies) would be: i) the use of a SBR,
alternating between the aerobic and anoxic cycles so as to maintain the leachate’s pH among
7.5-8.5; or ii) the use of an anoxic continuous flow reactor followed by an aerobic one, with
recirculation to the anoxic reactor (also taking advantage of some biodegradable organic matter of
the leachate that could be used for the denitrification reaction).
8.3.3 Characterization of the bacterial communities
The phylogenetic composition and diversity of the bacterial community inhabiting the biological
treatment of the mature landfill leachate under aerobic and anoxic conditions, respectively, was assessed
by a 454-pyrosequencing analysis of the 16S rRNA gene. A total of 20 209 16S rRNA sequences were
obtained. Per sample, the number of high-quality sequences ranged between 2 490 and 4 358. Given
these variability and according to the recommendation of QIIME pipeline instructions [36], the samples
were normalized by rarefaction to 2 400 sequences per sample.

Chapter 8
247
Alpha diversity was evaluated determining the richness estimator Chao 1 [37], and the diversity indices
Simpson, Shannon and PD [38-40] (Table 8.5). Beta diversity was evaluated using the unweighted
UniFrac metric (Figure 8.5) [41].
Table 8.5. Diversity indices of the bacterial communities of the nitrification (N) and denitrification (D) reactors,
at the initial (I), middle (M) and final (F) treatment stages.
Sample Nitrification Reactor Denitrification Reactor
NI NM NF DI DM DF
No. OTUsa 401 451 359 225 173 194
Chao 1 523 614 502 352 276 281
Shannon index 6.95 7.39 6.82 4.09 3.12 4.05
Simpson index 0.98 0.99 0.98 0.76 0.61 0.80
PDb 38.7 43.2 31.9 25.9 20.4 20.4
aOperational taxonomic units; b Phylogenetic diversity.
Figure 8.5. PCoA biplot depicting the dissimilarities between the bacterial communities
from each biological sludge sample, based on the unweighted UniFrac distances.
PC1 – Percent variation explained 54.12 %
PCoA (unweighted unifrac)
PC
2 –
Per
cent
var
iati
on e
xp
lain
ed 1
4.9
6 %
NM
NI
NF
DM
DI
DF

Chapter 8
248
The bacterial diversity, as revealed by the values of diversity coverage (Chao 1), number of OTUs,
Shannon index and phylogenetic diversity (PD), was higher in the nitrification treatment than in
the denitrification (Table 8.5) In addition, the relative abundance of each bacterial member in the
nitrification reactor was more homogeneous (co-abundance of microorganisms) than in
denitrification reactor, as revealed by Simpson index values, which measures the evenness of the
communities. These differences were also observed when analysing the beta diversity as depicted
in the unweighted unifrac based PCoA (Figure 8.5), as the nitrification and denitrification bacterial
communities are separated over a gradient of 54.1 % dissimilarity.
Although the dissimilarity between the bacterial communities from the nitrification and denitrification
processes, in both reactors only 0.7 % and 0.1 % of the sequences obtained, respectively, were not
classified as Bacteria. The abundance of each phylogenetic group is expressed as the percentage of the
total number of rarefied bacterial sequences (2400) affiliated at each taxonomic level, classified using
RDP Classifier at a confidence threshold of 80%. The bacterial sequences obtained in the present study
were affiliated to 23 phyla out of which only 6 presented abundance above 1 %, whose distribution is
displayed in Figure 8.6.
Figure 8.6. Relative abundance of the members affiliated to the different phyla present in each biological sludge
sample. Phyla with abundance ranging from 0.1-1% include Acidobacteria, Chloroflexi, Gemmatimonadetes,
GNO2, SAR406, Spirochaetes, Synergistetes, Thermotogae, TM7, Verrucomicrobia and WPS-2. Phyla with
abundance < 0.1% include OD1, OP9, OP11, SR1, WS6, WYO.
NI NM NF DI DM DF0
10
20
30
40
50
60
70
80
90
100
0
10
20
30
40
50
60
70
80
90
100Denitrification
Rel
ati
ve
ab
un
dan
ce (
% o
f se
qu
ence
s)
Rel
ati
ve
ab
un
dan
ce (
% o
f se
qu
ence
s)
Legend:
Proteobacteria
Bacteroidetes
Firmicutes
Deinococcus-Thermus
Actinobacteria
Tenericutes
Phyla with abundance 0.1-1%
Phyla with abundance < 0.1%
Unclassified at phylum level
Nitrification

Chapter 8
249
Considering the bacterial community of the nitrification reactor, the 6 most abundant phyla were
Bacteroidetes (42.6 %), Proteobacteria (32.2 %), Firmicutes (11.0 %), Deinococcus-Thermus (3.0 %),
Actinobacteria (2.4 %) and Tenericutes (1.2%). Whereas for denitrification reactor the 6 most abundant
phyla were Proteobacteria (73.9 %), Bacteroidetes (16.1 %), Deinococcus-Thermus (4.3 %),
Tenericutes (1.5 %), Actinobacteria (1.0%) and Firmicutes (0.9 %).
Within the nitrification reactor, the most abundant members belonged to Bacteroidetes phylum and were
mainly affiliated to the classes Sphingobacteriia (60.8 %), Bacteroidia (18.4 %) and Flavobacteriia
(7.2 %). Members affiliated to Sphingobacteriia and Flavobacteriia are known to be involved in the
degradation of slowly biodegradable organic matter, such as complex organic molecules, including
humic acids [42, 43]. The class Sphingobacteriia included the most abundant family, from all of the
sequences obtained from nitrification process, which was Saprospiraceae (16.1%) (Table 8.6).
Regarding the proteobacterial members, most were affiliated to the classes Betaproteobacteria (67.6 %),
Alphaproteobacteria (20.7 %) and Gammaproteobacteria (9.1 %). In addition, members affiliated to
Betaproteobacteria, in particular to Nitrosomonadaceae (6.9%) and Comamonadaceae (5.7%) were also
among the three most abundant families (Table 8.6). Bacteria belonging to Nitrosomonadaceae are
associated with the oxidation of ammonia into nitrite [44, 45] and, in the present study, during the
nitrification reaction, there was nitrite accumulation. Thus, the presence/abundance of these members in
the nitrification reactor is in agreement with the results obtained from the nitrification tests. Moreover,
as expected, none of the OTUs was affiliated to Nitrobacteriaceae, which embraces nitrite-oxidising
bacteria that are strongly inhibited by the presence of free ammonia, as previously mentioned.
Additionally, the high abundance of members affiliated to the families Saprospiraceae and
Comamonadaceae was not surprising as these members are usually present in activated sludge plants
from municipal and industrial wastewater treatment plants [46-48]. Moreover, the family
Comamonadaceae is a group of prokaryotes which is phylogenetically coherent but physiologically
heterogeneous, encompassing different genera: aerobic organotrophs, anaerobic denitrifiers, hydrogen
oxidizers, iron (III)-reducing bacteria, photoautotrophic and photoheterotrophic bacteria, and
fermentative bacteria [49, 50]. Among these genera, there is also a group of bacteria which plays an
important role in the biodegradation of aromatic compounds and toxic wastes [49]. So, the presence and
high abundance of Comamonadaceae members in the treatment of an effluent like the landfill leachates,
where a myriad of different compounds are present, is perfectly conceivable. Even more, bacteria from
this family were already identified elsewhere [43], where the landfill leachate was treated by aerated
partial nitrification using a SBR.

Chapter 8
250
Table 8.6. Relative abundance (> 1%) of the families belonging to the bacterial phyla with an abundance higher than 1% in nitrification or/and denitrification
reactors.
Phylum Class Order Family Nitrification Denitrification
NI NM NF Mean DI DM DF Mean
Bacteroidetes
Bacteroidia Bacteroidales Porphyromonadaceae 3.50 3.58 2.33 3.14 0.63 0.38 0.25 0.42
Flavobacteriia Flavobacteriales Cryomorphaceae 0.38 0.17 1.50 0.68 0.08 0.00 0.00 0.03
Flavobacteriaceae 1.67 0.67 1.88 1.40 1.71 2.71 0.58 1.67
Sphingobacteriia Sphingobacteriales
Balneolaceae 1.71 2.58 2.13 2.14 1.83 1.00 0.29 1.04
Chitinophagaceae 2.42 2.08 1.67 2.06 0.38 0.50 0.25 0.38
Saprospiraceae 24.04 8.92 15.33 16.10 5.96 4.38 4.88 5.07
Deinococcus-
Thermus Deinococci Deinococcales Deinococcaceae 2.04 3.33 3.63 3.00 4.00 1.33 7.50 4.28
Firmicutes Clostridia Clostridiales Clostridiaceae 4.33 5.96 4.83 5.04 0.54 0.88 0.29 0.57
Proteobacteria
Alphaproteobacteria
Caulobacterales Caulobacteraceae 0.00 0.00 0.13 0.04 0.96 0.33 2.04 1.11
Rhizobiales Hyphomicrobiaceae 0.58 1.29 1.96 1.28 50.67 64.04 44.67 53.13
Phyllobacteriaceae 0.33 1.38 0.75 0.82 0.67 0.29 1.04 0.67
Rhodobacterales Rhodobacteraceae 1.50 2.63 3.46 2.53 1.50 1.50 3.38 2.13
Sphingomonadales Sphingomonadaceae 0.88 1.08 1.08 1.01 0.13 0.00 0.00 0.04
Betaproteobacteria
Burkholderiales Burkholderiaceae 0.46 0.63 0.71 0.60 0.92 0.88 1.46 1.08
Comamonadaceae 4.04 6.83 6.08 5.65 1.25 0.54 1.00 0.93
Nitrosomonadales Nitrosomonadaceae 6.25 5.96 8.58 6.93 0.21 0.04 0.13 0.12
Rhodocyclales Rhodocyclaceae 0.79 1.17 1.67 1.21 0.00 0.04 0.08 0.04
Gammaproteobacteria Xanthomonadales Xanthomonadaceae 0.71 0.96 1.08 0.92 6.75 6.54 11.00 8.10
Thiotrichales Piscirickettsiaceae 0.00 0.00 0.08 0.03 0.92 0.63 10.54 4.03
Tenericutes Mollicutes Acholeplasmatales Acholeplasmataceae 0.58 2.04 0.08 0.90 2.83 1.25 0.25 1.44
Anaeroplasmatales Anaeroplasmataceae 0.17 0.58 0.04 0.26 0.08 0.08 0.00 0.06

Chapter 8
251
Considering the bacterial communities from denitrification reactor proteobacterial members were the
most abundant and were mainly affiliated to the classes Alphaproteobacteria (78.3%),
Gammaproteobacteria (16.7 %) and Betaproteobacteria (4.8 %). The most abundant families were
Hyphomicrobiaceae (53.1 %), Xanthomonadaceae (8.1 %), which belong, respectively, to
Alphaproteobacteria and Gammaproteobacteria (see Table 8.6). In the denitrification reactor, about
74.7 % of the total sequences were classified to genus level. In contrast, only about 15.1 % of the overall
nitrification sequences were classified at genus level (data not shown). Curiously, 51.9% out of 74.7%
corresponded to the genus Hyphomicrobium from the family Hyphomicrobiaceae. These results indicate
the potential role of these members in the denitrification reactor. In fact, members from this genus are
known as denitrifiers. Moreover, this bacterium is known to use methanol as external carbon source,
which agrees with the present study use of methanol, both at the start-up period as throughout the
denitrification experiments [15, 51, 52]. In addition, members belonging to Bacteroidetes were mainly
affiliated to the classes Sphingobacteriia (58.6 %), Flavobacteriia (14.6 %) and Bacteroidia (7.3 %), as
observed for bacterial communities from the nitrification reactor. The existence of common members
on both reactors would already be expected since the activated sludge of the denitrification reactor was
inoculated from the nitrification reactor. In particular, the Sphingobacteriia members affiliated to
Saprospiraceae (5.1%) were among the three most abundant members (see Table 8.6).
Chapter 8
252
8.4 Conclusions
The biological nitrification revealed to be efficient on the removal of TAN from a high-strength leachate,
from an old sanitary landfill. About 31% of the TAN was removed by ammonia stripping, which is
favoured by the high initial values of pH and TAN content of the leachates, at the beginning of the
nitrification reaction. The abundance of Nitrosomonadaceae members in nitrification reactor samples
suggests that the remaining TAN was oxidised into nitrite by these bacteria, whose activity was strongly
inhibited by low values of temperature (< 20 ºC) and pH (< 7.5) and just slightly affected by variations
in the DO concentration.
The reduction of the nitrite ions into gaseous nitrogen, through the denitrification reaction, may have
been mediated by bacteria from the genus Hyphomicrobium, whose performance was strongly affected
by alterations in the operating temperature, very inhibited by low pH values (< 7.0) and quite benefited
by the presence of phosphorous.
Besides the presence of bacteria from the families Nitrosomonadaceae and Hyphomicrobiaceae,
responsible by the nitrification and denitrification reactions, respectively, the 454-pyrosequencing
analysis of the 16S rRNA gene also revealed the presence of bacteria associated to the classes
Sphingobacteriia and Flavobacteriia on both reactors, which have been reported as responsible for the
degradation of complex organic matter, one of the main constituents of the mature landfill leachates.
Summarizing, these results suggest that reactions involving (i) oxidation/reduction of nitrogen species
and (ii) degradation of organic matter were mostly mediated by bacteria from the phyla Proteobacteria
and Bacteroidetes, respectively.

Chapter 8
253
8.5 References
[1] C.B. Öman, C. Junestedt, Chemical characterization of landfill leachates – 400 parameters and compounds,
Waste Management, 28 (2008) 1876-1891.
[2] P. Kjeldsen, M.A. Barlaz, A.P. Rooker, A. Baun, A. Ledin, T.H. Christensen, Present and Long-Term
Composition of MSW Landfill Leachate: A Review, Critical Reviews in Environmental Science and
Technology, 32 (2002) 297-336.
[3] J. Wiszniowski, D. Robert, J. Surmacz-Gorska, K. Miksch, J. Weber, Landfill leachate treatment methods: A
review, Environmental Chemistry Letters, 4 (2006) 51-61.
[4] A.A. Abbas, G. Jingsong, L.Z. Ping, P.Y. Ya, W.S. Al-Rekabi, Review on Landfill Leachate Treatments,
Journal of Applied Sciences Research, 5 (2009) 534-545.
[5] S. Renou, J. Givaudan, S. Poulain, F. Dirassouyan, P. Moulin, Landfill leachate treatment: Review and
opportunity, Journal of Hazardous materials, 150 (2008) 468-493.
[6] U.E. Agency, Guidance for the Treatment of Landfill Leachate, Integrated Pollution Prevention and Control
(IPPC), in, Sector Guidance Note IPPC S5.03, 2007.
[7] G. Ruiz, D. Jeison, O. Rubilar, G. Ciudad, R. Chamy, Nitrification–denitrification via nitrite accumulation for
nitrogen removal from wastewaters, Bioresource Technology, 97 (2006) 330-335.
[8] M. Henze, P. Harremoës, J.I.C. Jansen, E. Arvin, Basic Biological Processes, in: Wastewater Treatment:
Biological and Chemical Processes, Second Edition, Springer-Verlag, Berlin, 1997.
[9] S. Philips, H.J. Laanbroek, W. Verstraete, Origin, causes and effects of increased nitrite concentrations in
aquatic environments, Reviews in environmental science and biotechnology, 1 (2002) 115-141.
[10] R. Canziani, V. Emondi, M. Garavaglia, F. Malpei, E. Pasinetti, G. Buttiglieri, Effect of oxygen concentration
on biological nitrification and microbial kinetics in a cross-flow membrane bioreactor (MBR) and moving-
bed biofilm reactor (MBBR) treating old landfill leachate, Journal of Membrane Science, 286 (2006) 202-
212.
[11] L.-k. Wang, G.-m. Zeng, Z.-h. Yang, L.-l. Luo, H.-y. Xu, J. Huang, Operation of partial nitrification to nitrite
of landfill leachate and its performance with respect to different oxygen conditions, Biochemical Engineering
Journal, 87 (2014) 62-68.
[12] M.H. Gerardi, Nitrification and Denitrification in the Activated Sludge Process, Wiley, 2003.
[13] H.K. Trivedi, Simultaneous Nitrification and Denitrification (SymBio® Process), in: L.K. Wang, N.K.
Shammas, Y.-T. Hung (Eds.) Advanced Biological Treatment Processes, Humana Press, 2009.
[14] Metcalf, Eddy, Wastewater Engineering Treatment and Reuse, 4th ed., Metcalf & Eddy, 2005.
[15] M. Ginige, J. Bowyer, L. Foley, J. Keller, Z. Yuan, A comparative study of methanol as a supplementary
carbon source for enhancing denitrification in primary and secondary anoxic zones, Biodegradation, 20 (2009)
221-234.
[16] M. Martienssen, R. Schöps, Biological treatment of leachate from solid waste landfill sites—Alterations in
the bacterial community during the denitrification process, Water Research, 31 (1997) 1164-1170.

Chapter 8
254
[17] J.-J. Her, J.-S. Huang, Influences of carbon source and C/N ratio on nitrate/nitrite denitrification and carbon
breakthrough, Bioresource Technology, 54 (1995) 45-51.
[18] J.A. Torà, J.A. Baeza, J. Carrera, J.A. Oleszkiewicz, Denitritation of a high-strength nitrite wastewater in a
sequencing batch reactor using different organic carbon sources, Chemical Engineering Journal, 172 (2011)
994-998.
[19] F. Thalasso, A. Vallecillo, P. García-Encina, F. Fdz-Polanco, The use of methane as a sole carbon source for
wastewater denitrification, Water Research, 31 (1997) 55-60.
[20] J. Park, Y. Yoo, Biological nitrate removal in industrial wastewater treatment: which electron donor we can
choose, Applied Microbiology and Biotechnology, 82 (2009) 415-429.
[21] S. Villaverde, F. Fdz-Polanco, P.A. Garcıa, Nitrifying biofilm acclimation to free ammonia in submerged
biofilters. Start-up influence, Water Research, 34 (2000) 602-610.
[22] O. Turk, D.S. Mavinic, Preliminary assessment of a shortcut in nitrogen removal from wastewater, Canadian
Journal of Civil Engineering, 13 (1986) 600-605.
[23] A. Spagni, S. Marsili-Libelli, Nitrogen removal via nitrite in a sequencing batch reactor treating sanitary
landfill leachate, Bioresource Technology, 100 (2009) 609-614.
[24] C. Sawyer, P. McCarty, G. Parkin, Chemistry for Environmental Engineering and Science, McGraw-Hill
Education, 2003.
[25] A. Anthonisen, R. Loehr, T. Prakasam, E. Srinath, Inhibition of nitrification by ammonia and nitrous acid,
Journal (Water Pollution Control Federation), (1976) 835-852.
[26] N.K. Shammas, L. K.Wang, ZuchengWu, Waste Stabilization Ponds and Lagoons, in: L.K. Wang, N.C.
Pereira, Y.-T. Hung (Eds.) Biological Treatment Processes, Humana Press, 2009.
[27] D. Green, R. Perry, Perry's Chemical Engineers' Handbook, Eighth Edition, McGraw-Hill Education, 2007.
[28] S. Marttinen, R. Kettunen, K. Sormunen, R. Soimasuo, J. Rintala, Screening of physical–chemical methods
for removal of organic material, nitrogen and toxicity from low strength landfill leachates, Chemosphere, 46
(2002) 851-858.
[29] J.C. Campos, D. Moura, A.P. Costa, L. Yokoyama, F.V.d.F. Araujo, M.C. Cammarota, L. Cardillo,
Evaluation of pH, alkalinity and temperature during air stripping process for ammonia removal from landfill
leachate, Journal of Environmental Science and Health, Part A, 48 (2013) 1105-1113.
[30] N.J. Horan, Nutrient Removal from Wastewaters, Taylor & Francis, 1994.
[31] J. Jokela, R. Kettunen, K. Sormunen, J. Rintala, Biological nitrogen removal from municipal landfill leachate:
low-cost nitrification in biofilters and laboratory scale in-situ denitrification, Water Research, 36 (2002) 4079-
4087.
[32] N.K. Shammas, Interactions of Temperature, pH, and Biomass on the Nitrification Process, Journal (Water
Pollution Control Federation), 58 (1986) 52-59.
[33] J. Gabarró, R. Ganigué, F. Gich, M. Ruscalleda, M.D. Balaguer, J. Colprim, Effect of temperature on AOB
activity of a partial nitritation SBR treating landfill leachate with extremely high nitrogen concentration,
Bioresource Technology, 126 (2012) 283-289.
Chapter 8
255
[34] K. Hanaki, C. Wantawin, S. Ohgaki, Nitrification at low levels of dissolved oxygen with and without organic
loading in a suspended-growth reactor, Water Research, 24 (1990) 297-302.
[35] N.K. Shammas, L. K.Wang, Emerging Attached-Growth Biological Processes, in: L.K. Wang, N.K.
Shammas, Y.-T. Hung (Eds.) Advanced Biological Treatment Processes, Humana Press, 2009.
[36] J.G. Caporaso, J. Kuczynski, J. Stombaugh, K. Bittinger, F.D. Bushman, E.K. Costello, N. Fierer, A.G. Pena,
J.K. Goodrich, J.I. Gordon, QIIME allows analysis of high-throughput community sequencing data, Nature
methods, 7 (2010) 335-336.
[37] A. Chao, Nonparametric estimation of the number of classes in a population, Scandinavian Journal of
statistics, (1984) 265-270.
[38] E.H. Simpson, Measurement of diversity, Nature, (1949).
[39] C.E. Shannon, W. Weaver, The mathematical theory of communication, University of Illinois Press, Urbana,
IL, 1963.
[40] D.P. Faith, Conservation evaluation and phylogenetic diversity, Biological conservation, 61 (1992) 1-10.
[41] C. Lozupone, R. Knight, UniFrac: a new phylogenetic method for comparing microbial communities,
Applied and environmental microbiology, 71 (2005) 8228-8235.
[42] J. Gabarró, P. González-Cárcamo, M. Ruscalleda, R. Ganigué, F. Gich, M.D. Balaguer, J. Colprim, Anoxic
phases are the main N2O contributor in partial nitritation reactors treating high nitrogen loads with alternate
aeration, Bioresource Technology, 163 (2014) 92-99.
[43] J. Gabarró, E. Hernández-del Amo, F. Gich, M. Ruscalleda, M.D. Balaguer, J. Colprim, Nitrous oxide
reduction genetic potential from the microbial community of an intermittently aerated partial nitritation SBR
treating mature landfill leachate, Water Research, 47 (2013) 7066-7077.
[44] B.-C. Kim, S. Kim, T. Shin, H. Kim, B.-I. Sang, Comparison of the bacterial communities in anaerobic,
anoxic, and oxic chambers of a pilot A2O process using pyrosequencing analysis, Current microbiology, 66
(2013) 555-565.
[45] L. Pal, B. Kraigher, B. Brajer-Humar, M. Levstek, I. Mandic-Mulec, Total bacterial and ammonia-oxidizer
community structure in moving bed biofilm reactors treating municipal wastewater and inorganic synthetic
wastewater, Bioresource Technology, 110 (2012) 135-143.
[46] Y. Xia, Y. Kong, T.R. Thomsen, P. Halkjær Nielsen, Identification and Ecophysiological Characterization
of Epiphytic Protein-Hydrolyzing Saprospiraceae (“Candidatus Epiflobacter” spp.) in Activated Sludge,
Applied and Environmental Microbiology, 74 (2008) 2229-2238.
[47] C. Kragelund, C. Levantesi, A. Borger, K. Thelen, D. Eikelboom, V. Tandoi, Y. Kong, J. Krooneman, P.
Larsen, T.R. Thomsen, Identity, abundance and ecophysiology of filamentous bacteria belonging to the
Bacteroidetes present in activated sludge plants, Microbiology, 154 (2008) 886-894.
[48] A.A. Khardenavis, A. Kapley, H.J. Purohit, Simultaneous nitrification and denitrification by diverse
Diaphorobacter sp, Applied Microbiology and Biotechnology, 77 (2007) 403-409.

Chapter 8
256
[49] K. Kersters, P.d. Vos, M. Gillis, J. Swings, P. Vandamme, E. stackebrandt, Introduction to the Proteobacteria,
in: M. Dworkin, S. Falkow, E. Rosenberg, K.-H. Schleifer, E. Stackebrandt (Eds.) The Prokaryotes: A
Handbook on the Biology of Bacteria, Springer, 2006.
[50] A. Willems, The Family Comamonadaceae, in: E. Rosenberg, E.F. DeLong, S. Lory, E. Stackebrandt, F.
Thompson (Eds.) The Prokaryotes: Alphaproteobacteria and Betaproteobacteria, Springer-Verlag Berlin
Heidelberg, 2014.
[51] C. Martineau, C. Villeneuve, F. Mauffrey, R. Villemur, Complete genome sequence of Hyphomicrobium
nitrativorans strain NL23, a denitrifying bacterium isolated from biofilm of a methanol-fed denitrification
system treating seawater at the Montreal Biodome, Genome announcements, 2 (2014) e01165-01113.
[52] T. Urakami, J. Sasaki, K.-I. Suzuki, K. Komagata, Characterization and Description of Hyphomicrobium
denitrificans sp. nov, International journal of systematic bacteriology, 45 (1995) 528-532.

9 Depuration of mature sanitary landfill leachate using
biological nitrification followed by coagulation and
photo-Fenton reaction, combining solar and artificial
radiation, at pre-industrial scale
In this chapter a new methodology for the treatment of landfill leachates, after aerobic lagooning, was
developed and adjusted, at a scale close to industrial. This methodology involves an aerobic biological pre-
oxidation by activated sludge, a coagulation/sedimentation step (240 mg Fe3+/L, at pH 4.2, 14-hours settling)
and a photo-oxidation through photo-Fenton reaction (60 mg Fe2+, at pH 2.8) combining solar and artificial
radiation, promoting the recalcitrant molecules degradation and consequent biodegradability enhancement.
The results demonstrate that the aerobic biological process applied to a leachate after aerobic lagooning,
with high organic and nitrogen content (DOC = 1.1-1.5 g C/L; COD = 3.0-4.3 g O2/L and ND = 0.8-
3.0 g N/L) and low biodegradability (BOD5/COD = 0.07-0.13), is capable to oxidise between 62 and 99% of
the ammonium nitrogen (NH4+-Nf = 8-250 mg/L), consuming only the affluent alkalinity (CaCO3,f = 0-
1.6 g/L), achieving alkalinity reductions between 70 and 100%.
The coagulation/sedimentation stage led to the humic acids precipitation, promoting a marked change in
leachate colour, from dark-brown to yellowish-brown, which is related to the presence of fulvic acids,
accompanied by a reduction of 60% on DOC (DOCf ≈ 400 mg/L), 58% on COD (CODf ≈ 1200 mg/L) and
88% on TSS (supernatant TSS = 135 mg/L), obtaining an amount of acid sludge of about 300 mL/L.
From the photo-Fenton trials, it was concluded that the best option would be combining natural sunlight
with artificial radiation (~1.3 kW/m3), thus optimizing the indirect costs. According to Zahn-Wellens test, a
leachate, with 419 mg DOC/L after coagulation, would have to be photo-oxidized until a DOC and an 254
nm absorbance (1:25 dilution) lesser than 300 mg/L and 0.13, respectively, consuming approximately
100 mM of H2O2 and 7.4 kJ/L of accumulated UV energy, in order to achieve an effluent than can be
biologically treated in compliance with the COD discharge limit (< 150 mg O2/L) into water bodies. The
biological process subsequent to the photocatalytic system would promote a 59% mineralization, being the
final COD of approximately 115 mg O2/L. If the ultimate goal is the discharge into sewerage system
(COD < 1000 mgO2/L), the full treatment would be finalized in the photo-treatment step, with a COD of
about 950 mg O2/L after a mineralization of 21% and a consumption of 1.5 kJ/L of UV energy and 76 mM of
H2O2.
The scale-up of a photocatalytic facility with a capacity to treat 100 m3 of leachate per day showed the need
to implement 1500 and 295 m2 of CPCs, or 38 and 8 UV-Vis lamps (with 4kW and 20,000-h of lifetime each),
targeting a COD value lesser than 150 and 1000 mg O2/L, respectively. Combining solar and artificial
radiation, it would be need 957 and 188 m2 of CPCs (considering the month of higher irradiance), and 30
and 6 lamps (considering the month of lesser irradiance), respectively. The cost of the photo-Fenton step,
aiming a COD lower than 150 and 1000 mg O2/L, respectively, prowled: 5.7 and 4.2 €/m3, resorting just to
CPCs; 5.79 and 4.22 €/m3, using only UV-Vis-Lamps; and 5.69 and 4.17 €/m3, combining CPCs and lamps.
The cost with H2O2 corresponds to about 44% of the total yearly cost.


Chapter 9
259
9.1 Introduction
Under the protocol established between FEUP/LSRE and EFACEC Engineering and Systems, a project
named LFOTOBIO was developed. The generic objective of the project was the development and
optimization of a solar photocatalytic technology for leachates treatment and, eventually, other
recalcitrant industrial wastewaters, with the purpose of upgrading wastewater treatment plants using this
new technology. The present thesis started under that project and the first results were presented in the
Chapters 3, 4, 5 and 6. The set of experiments carried out in that context allowed to define a leachate
treatment strategy composed by the following stages:
(i) Anoxic/aerobic lagooning of the raw leachate, promoting the elimination of the biodegradable
organic matter fraction and nitrogen, through nitrification/denitrification reactions.
The lagooning process would consist in a non-aerated lagoon in series with an aerated lagoon, with
recirculation, in order to (a) use the biodegradable organic matter as carbon source for
denitrification, and (b) eliminate alkalinity during nitrification, taking advantage of the alkalinity
produced along the denitrification, besides the raw leachate alkalinity. The resulting effluent would
be characterized by a low alkalinity, low nitrogen and low biodegradability mainly associated with
high humic substances content. It can be used also a sequential batch reactor, combining cycles of
nitrification and denitrification, to promote this first biological step.
(ii) Coagulation/sedimentation of the leachate after lagooning, using ferric chloride at acid pH, in order
to reduce the amount of recalcitrant organic matter mainly due to the humic acids precipitation and
suspended solids, changing the effluent colour from dark/brown to yellow/brown after
sedimentation, synonymous of the major presence of fulvic acids, which increases significantly the
light transmissibility in the subsequent photo-oxidation process.
The need to use high amounts of acid to correct the pH value, in addition to the increment of the
operating costs, also leads to an abrupt increase of sulphate ions concentrations, assuming the use
of sulphuric acid. This results in the formation of sulphate-ferric complexes with much lower
photoactivity than ferric hydroxo complexes, decreasing the photo-Fenton reaction rate, being
necessary a larger amount of UV energy for the photo-treatment step. Therefore, for the proper
operation of this step, it is important to minimize the leachate buffer capacity, through the alkalinity
consumption during the biological nitrification that takes place in the lagoon.
(iii) Photo-Fenton reaction combining natural solar light with artificial radiation. This process includes
the addition of a ferrous solution (about 60 mg Fe2+/L) and hydrogen peroxide at pH 2.8, since the
most photoactive iron species prevail, thus maximizing the production of hydroxyl radicals and
avoiding the iron hydroxide precipitation.

Chapter 9
260
The photo-Fenton reaction rate is drastically reduced by suspended solids, since they negatively
affect the light penetration in the reactional medium and absorb the UV-Vis photons.
The photo-oxidized leachate must have a DOC concentration between 220-280 mg/L and an
absorbance at 254 nm less than 0.08 (after dilution 1:25), in order to meet the discharge limit for
chemical oxygen demand (COD < 150 mg O2/L), at the end of a subsequent biological treatment.
(iv) Activated sludge biological treatment (sequential batch reactor) of the photo-oxidised leachate, after
neutralization, under aerobic and anoxic conditions, with the purpose of eliminating the remaining
fraction of nitrogen and biodegradable organic matter, obtaining a final effluent in agreement with
the discharge limits imposed by legislation.
Based on the first results and conclusions from the study at the solar pre-industrial plant, the initial
configuration was adjusted in order to implement a treatment strategy similar to the one described above.
The new plant comprises also a coagulation/sedimentation cylindrical tank and a set of UV-Vis lamps
was inserted in the recirculation tank of the photocatalytic system, which allows to use solar and/or
artificial radiation.
It was initially planned the use of the leachate after treatment in the LTP, which comprises a lagoon with
oxygen injection, an activated sludge biological reactor and a settling tank. However, at the beginning
of the experimental period, the effluent from the LTP presented high alkalinity (> 10 g CaCO3/L), which
required the use of the aerobic biological reactor of the pre-industrial plant to promote the nitrification
reaction. Since it was not possible to implement the complete strategy previously described, it was
decided to use a methodology based on the first three steps of the process initially defined:
(i) Initial biological oxidation by activated sludge under aerobic conditions, to promote nitrification
and the elimination of the alkalinity still existing in the leachate collected at the LTP, thus decreasing
the sulphuric acid consumption in the subsequent coagulation step;
(ii) Coagulation with ferric chloride at acid pH, followed by sedimentation, to reduce the amount of
suspended solids and organic compounds, such as humic acids, through precipitation, thus
increasing the light penetration in the reactional medium and consequently the phototreatment
efficiency.
(iii) Photo-Fenton oxidation combining ferrous ion with hydrogen peroxide and UV-Vis radiation, using
natural solar radiation, collected from 20.8 m2 of compound parabolic collectors (CPCs), and/or
artificial radiation, emitted by UV-Vis lamps (2 or 4) with a rated power between 850 and 1200 W.
This treatment step promotes the degradation of recalcitrant organic compounds, such as fulvic
acids, into simplest molecules, leading to biodegradability enhancement, until the point

Chapter 9
261
(DOC ≈ 250 mg/L) wherein a downstream biological treatment would allow to meet the discharge
limit into water bodies (COD < 150 mg O2/L).
Bear in mind the methodology adopted, the following objectives were established:
Leachate characterization along all stages (biological oxidation, coagulation and photo-oxidation);
Individual efficiency assessment of the:
o biological reactor, under aerobic regime;
o coagulation/sedimentation stage, for different values of pH and different settling times;
o photo-Fenton reaction, in the optimal conditions obtained at the lab-scale, using solar
and/or artificial radiation and changing the number and rated power of the lamps;
Evaluation of the leachate treatment train, integrating the biological oxidation process with the
coagulation/sedimentation and the photo-oxidation;
Economic analysis of the phototreatment step, based on the test conducted under the optimal
operating conditions.
9.2 Experimental methodology
During the trial period concerning this chapter, 15 experiments were carried out at the pre-industrial
scale plant, combining biological oxidation with physico-chemical processes
(coagulation/sedimentation with ferric chloride) and photo-oxidation (photo-Fenton reaction) using UV
solar/artificial radiation.
All the chemicals used in this work, the detailed description of the experimental unit and respective
procedures, as well as the employed analytical methods can be consulted in the Chapter 2. Table 9.1 just
shows a brief description of the experiments presented in this chapter.
It should be noted that the initial biological treatment was always performed under aerobic conditions
(trying to keep the dissolved oxygen concentration between 0.5-1.0 mg O2/L), without NaOH addition
during nitrification reaction, being only consumed the leachate alkalinity.
With the exception of experiments 5 and 6, at the end of photo-Fenton reaction, DOC was between 220
and 280 mg/L. These values are very close to the DOC values obtained in the Chapter 4, for a photo-
treated leachate corresponding to an easily biodegradable effluent, allowing to obtain a final COD in
agreement with the discharge limit (150 mg O2/L) for disposal into water bodies, after a subsequent
biological treatment.

Chapter 9
262
Table 9.1. Description of the tests performed.
Test
Coagulation Photo-Oxidation
Observations Fe3+
(mg/L) pH
Sed.a
(h) Rad.
Fe2+ad.
(mg/L) pH
1 240 2.8 14 Solar 60 2.8
At the beginning of the photo-Fenton reaction, a
fast consumption of H2O2 occurred, resulting in
the decrease of the solution pH, requiring the
addition of NaOH for pH correction. This
situation was observed in all tests.
2 240 3.0 14 Solar 60 2.8
It was observed the existence of gas trapped in
the acidic sludge settled at the bottom of
coagulation tank, which decreased the
sedimentation efficiency, leading to a
supernatant with higher amount of TSS.
3 240 3.0 3 Artificial
(4×1 kW) 60 2.8 It was observed that a settling time of 3 hours in
the coagulation tank was not enough to achieve a
low content of TSS in the supernantant. 4 240 3.0 3
Artificial
(4×1 kW) 60 2.8
5 - - - Artificial
(4×1 kW) 60 2.8
High H2O2 and energy consumption during
photo-Fenton, due to absence of coagulation.
6 - - - Artificial
(4×1 kW) 60 2.8
Acidification until pH 4, in order to reduce the
NaOH consumption at the beginning of
photo-reaction.
7 240 - 3 Artificial
(4×1 kW) 60 2.8
Only FeCl3 was added in the coagulation step, in
order to verify if H2O2 addition (at the beginning
of phototreatment) was enough to decrease the
pH value till the optimum for photo-Fenton
reaction and, thus, avoiding the need for NaOH
addition. It was disclosed that for pH > 5, the
H2O2 addition was not sufficient for leachate
acidification.
8 240 4.5 3 Artificial
(4×1 kW) 60 2.8
It was verified that, only for pH ≤ 4, the H2O2
was quickly consumed, lowering the pH value.
9 240 4.2 14 Artificial
(4×1 kW) 60 2.8
Coagulation carried out at pH 4.2, since the iron
sulphate addition leads to acidification to pH 4,
and then the H2O2 addition, at the beginning of
photo-Fenton oxidation, is capable to reduce the
pH until the optimum value, with lower NaOH
consumption.
10 240 4.2 14
Solar
Artificial
(4×1 kW)
60 2.8
The use of solar radiation together with artificial
radiation led to a decrease of the total amount of
energy needed and 50% of electricity.

Chapter 9
263
Table 9.1. Description of the tests performed.
Test
Coagulation Photo-Oxidation
Observations Fe3+
(mg/L) pH
Sed.a
(h) Rad.
Fe2+ad.
(mg/L) pH
11 120 4.2 14
Solar
Artificial
(4×1 kW)
60 2.8
The reduction of the iron content in the
coagulation step led to higher energy and H2O2
consumption during photo-oxidation.
12 240 4.2 14 Artificial
(2×1.2 kW) 60 2.8
The use of two lamps at maximum power
(1.2 kW) slightly increased the reaction time, but
decreased the total energy required.
13 240 4.2 14 Artificial
(2×0.85 kW) 60 2.8
The use of two lamps at the minimum power
(0.85 kW) made the process less efficient.
14 240 4.2 14 Artificial
(2×1.2 kW) 60 2.8 Validation test for the conditions used in test 12.
15 240 4.2 14
Solar
Artificial
(2×1.2 kW)
60 2.8
Experiment performed at the best conditions, for
further biodegradability evaluation of the
leachate during photo-Fenton oxidation, through
the Zahn-Wellens test.
aSedimentation time.
9.3 Results and discussion
9.3.1 Evaluation of the biological oxidation efficiency
The biological reactor (BR) effectiveness assessment was based on the characterization of the landfill
leachate along the treatment, for the experiments 1-15, mostly in terms of alkalinity and ammonium
nitrogen removal. The effluent fed to BR was transferred from the LTP settling tank, after aerobic
lagooning and aerobic biological oxidation with activated sludge. The inoculation of BR was performed
using the mixed liquor of the activated sludge reactor of the LTP, already adapted to the inhibitory
compounds present in this kind of wastewater.
Table 9.2 shows the values of all parameters analysed at the beginning (RB_0) and end (RB_F) of each
batch BR test, as well as the removal efficiency of total dissolved carbon (TDC); dissolved inorganic
carbon (DIC); dissolved organic carbon (DOC); alkalinity; chemical oxygen demand (COD); 5-day
biochemical oxygen demand (BOD5); total dissolved nitrogen (ND) and ammonium nitrogen (NH4+-N).

Chapter 9
264
Table 9.2. Physico-chemical characterization of the landfill leachate before and after biological treatment.
Test Sample pH T
(ºC)
TDC
(mg/L)
DIC
(mg/L)
DOC
(mg/L)
Alkalinitya
(g CaCO3/L)
COD
(mg/L)
BOD5
(mg/L)
BOD5
COD
SO42-
(mg/L)
Cl-
(mg/L)
NTD
(mg/L)
N-NH4+
(mg/L)
N-NO3-
(mg/L)
N-NO2-
(mg/L)
PT
(mg/L)
1
RB1.0 7.5 27.6 4039 2544 1495 10.6 4084 480 0.12 344 3269 2958 2170 0.56 151 14.3
RB1F 7.1 24.4 1151 7.5 1144 0.03 3724 40 0.01 337 2908 1919 224 4.87 1392 8.6
% Rem.b - - 71.5 99.7 23.5 99.7 8.8 91.7 - - - 35.1 89.7 - - -
2
RB2.0 7.3 29.2 1820 462 1357 1.93 4162 315 0.08 268 3266 2126 559 4.60 1276 11.4
RB2F 6.7 29.0 1191 < 5 1191 < 0.02 3902 45 0.01 257 3239 1887 212 8.98 1543 8.5
% Rem.b - - 34.6 100 12.2 100 6.2 85.7 - - - 11.2 62.1 - - -
3
RB3.0 7.4 29.6 1867 496 1370 2.07 4166 300 0.07 408 3464 2116 611 6.67 1295 12.6
RB3F 6.5 21.8 1240 13.8 1226 0.06 3809 50 0.01 464 3676 1492 137 8.93 1422 10.3
% Rem.b - - 33.6 97.2 10.5 97.1 8.5 - - - - 29.4 77.6 - - -
4
RB4.0 7.3 22.0 1803 575 1228 2.40 3969 410 0.10 467 3676 1371 244 7.28 1075 15
RB4F 6.9 19.0 1230 70 1160 0.29 3820 67.5 0.02 309 3502 1268 49 15.2 1204 9.6
% Rem.b - - 31.8 87.8 5.5 87.9 3.8 83.5 - - - 7.5 79.9 - - -
5
RB5.0 7.5 26.2 2197 873 1325 3.64 4261 380 0.09 303 3710 1304 339 11.9 766 7.3
RB5F 7.3 21.8 1461 211 1250 0.88 4091 70 0.02 201 3300 1237 9.6 4.75 1123 6.9
% Rem.b - - 26.2 75.8 5.7 75.8 4.0 81.6 - - - 5.1 97.2 - - -
6
RB6.0 7.6 25.2 2167 810 1358 3.37 3590 450 0.13 246 3527 1267 294 2.22 673 10.5
RB6F 7.1 16.2 1264 82.8 1181 0.34 3267 145 0.04 201 3313 1236 10 4.72 1162 7.4
% Rem.b - - 41.7 89.8 13.0 89.9 9.0 67.8 - - - 2.4 96.6 - - -
7
RB7.0 7.4 19.6 1772 547 1226 2.28 4169 390 0.09 204 3312 1285 204 4.17 901 12.2
RB7F 7.1 20.2 1299 82.9 1216 0.35 4019 200 0.05 197 3086 1213 19.4 15.1 1053 8.9
% Rem.b - - 26.7 84.8 0.8 84.6 3.4 48.7 - - - 5.6 90.5 - - -
8
RB8.0 7.7 21.8 2480 1151 1329 4.80 3904 490 0.13 254 3321 1159 488 3.47 409 9.5
RB8F 7.4 18.8 1403 171 1233 0.71 3679 90 0.02 164 2963 1067 7.54 14.6 937 6.5
% Rem.b - - 43.4 85.1 7.2 85.2 5.8 81.6 - - - 7.9 98.5 - - -

Chapter 9
265
Table 9.2. Physico-chemical characterization of the landfill leachate before and after biological treatment.
Test Sample pH T
(ºC)
TDC
(mg/L)
DIC
(mg/L)
DOC
(mg/L)
Alkalinitya
(g CaCO3/L)
COD
(mg/L)
BOD5
(mg/L)
BOD5
COD
SO42-
(mg/L)
Cl-
(mg/L)
NTD
(mg/L)
N-NH4+
(mg/L)
N-NO3-
(mg/L)
N-NO2-
(mg/L)
PT
(mg/L)
9
RB9.0 7.8 25.2 2680 1436 1244 5.98 4047 440 0.11 159 3167 1125 638 1.27 192 7.7
RB9F 7.5 15.8 1275 218 1058 0.91 3746 130 0.04 182 2822 961 9.28 3.35 854 7.2
% Rem.b - - 52.4 84.8 15.0 84.8 7.4 70.5 - - - 14.6 98.5 - - -
10
RB10.0 7.8 23.2 2528 1299 1228 5.41 3632 360 0.10 193 3050 832 523 0.82 182 6.8
RB10F 7.6 15.6 1416 310 1106 1.29 3443 175 0.05 142 2866 767 16.9 3.04 723 6.4
% Rem.b - - 44.0 76.1 9.9 76.2 5.2 51.4 - - - 7.8 96.8 - - -
11
RB11.0 7.8 23.8 2372 1224 1148 5.10 4052 310 0.08 421 2927 853 521 1.94 167 9.4
RB11F 7.7 14.4 1465 369 1096 1.54 3127 75 0.02 412 2830 714 8.94 9.05 662 8.5
% Rem.b - - 38.2 69.9 4.5 69.8 22.8 75.8 - - - 16.3 98.3 - - -
12
RB12.0 7.7 23.8 2683 1440 1243 6.00 3065 290 0.10 342 3034 1244 672 4.41 136 9.7
RB12F 7.7 14.8 1333 319 1015 1.33 2952 90 0.03 261 2709 781 91.6 24.2 773 8.2
% Rem.b - - 50.3 77.8 18.3 77.8 3.7 69.0 - - - 37.2 86.4 - - -
13
RB13.0 7.7 20.2 2487 1233 1254 5.14 3645 360 0.10 173 2692 981 334 8.43 277 7.5
RB13F 7.6 13.1 1358 233 1125 0.97 3308 95 0.03 258 2578 856 15.3 31.0 864 6.9
% Rem.b - - 41.4 81.1 10.3 81.1 9.2 73.6 - - - 12.7 95.4 - - -
14
RB14.0 7.6 17.4 2115 895 1220 3.73 3674 300 0.08 310 2686 1045 273 21.5 553 9.4
RB14F 7.3 12.4 1175 134 1041 0.56 3410 90 0.03 526 2727 888 29.3 23.0 978 8.3
% Rem.b - - 44.4 85.0 14.7 85.0 7.2 70.0 - - - 15.0 89.3 - - -
15
RB15.0 7.5 19.0 2102 922 1181 3.84 3786 320 0.09 675 2792 1202 416 14.0 603 10
RB15F 6.8 14.8 1055 52.5 1002 0.22 3566 110 0.03 538 2454 1105 68 20.7 1069 9.8
% Rem.b - - 49.8 94.3 15.2 94.3 5.8 65.6 - - - 8.1 83.7 - - -
aAlkalinity values considering that at pH lower than 8.3 the inorganic carbon is almost in the form of bicarbonates [9]; bRemoval percentage (100 – 100 × RB_0/RB_F).

Chapter 9
266
The reduction of the organic matter content during the biological tests was relatively low (1-24%, for
DOC and 2-23%, for COD), which together with the low values of the BOD5/COD ratio, confirm the
low leachate biodegradability. Similar finding was got by Spagni and Marsili-Libelli [1], that obtained
an average COD removal of 20% using a sequencing batch reactor (SBR) for the treatment of an old
leachate.
The recalcitrant character of the leachate suggests that a simple biological oxidation is not enough to
achieve a final effluent in agreement with the discharge limits, requiring the use of a non-conventional
treatment technology, such as advanced oxidation processes (AOPs), which have been reported to
enhance significantly the biodegradability of different recalcitrant wastewaters [2-6].
As previously mentioned, the biological treatment was performed under aerobic conditions, in order to
promote only the nitrification reaction, just consuming the inorganic carbon of the leachate. The
biological oxidation was interrupted when the final values of alkalinity and/or ammonium nitrogen
tended to zero, ranging between 7.5 – 250 mg NH4+-N/L and 0 – 1.6 mg CaCO3/L, respectively (see
Figure 9.1). During this step, on average, 9.1 mg of CaCO3 was consumed per 1 mg of NH4+-N
converted, which is 27% higher than the stoichiometric ratio (7.14 mg CaCO3/mg NH4+-N) [7, 8].
Figure 9.1. Variation of the alkalinity ( ) and ammonium nitrogen content ( ) at the end of the biological
treatment.
0
25
50
75
100
125
150
175
200
225
250
0.0
0.2
0.4
0.6
0.8
1.0
1.2
1.4
1.6
1 2 3 4 5 6 7 8 9 10 11 12 13 14 15
NH
4+-N
(m
g/L
)
Alk
ali
nit
y (
g C
aC
O3/L
)
Test
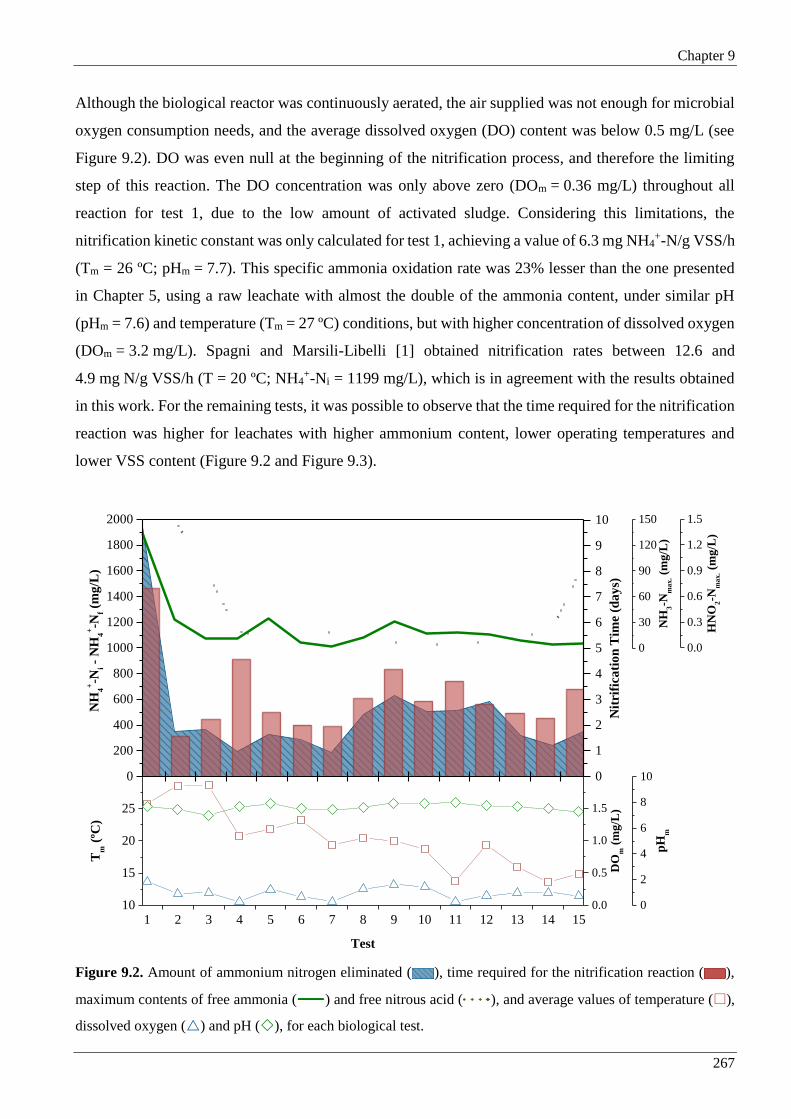
Chapter 9
267
Although the biological reactor was continuously aerated, the air supplied was not enough for microbial
oxygen consumption needs, and the average dissolved oxygen (DO) content was below 0.5 mg/L (see
Figure 9.2). DO was even null at the beginning of the nitrification process, and therefore the limiting
step of this reaction. The DO concentration was only above zero (DOm = 0.36 mg/L) throughout all
reaction for test 1, due to the low amount of activated sludge. Considering this limitations, the
nitrification kinetic constant was only calculated for test 1, achieving a value of 6.3 mg NH4+-N/g VSS/h
(Tm = 26 ºC; pHm = 7.7). This specific ammonia oxidation rate was 23% lesser than the one presented
in Chapter 5, using a raw leachate with almost the double of the ammonia content, under similar pH
(pHm = 7.6) and temperature (Tm = 27 ºC) conditions, but with higher concentration of dissolved oxygen
(DOm = 3.2 mg/L). Spagni and Marsili-Libelli [1] obtained nitrification rates between 12.6 and
4.9 mg N/g VSS/h (T = 20 ºC; NH4+-Ni = 1199 mg/L), which is in agreement with the results obtained
in this work. For the remaining tests, it was possible to observe that the time required for the nitrification
reaction was higher for leachates with higher ammonium content, lower operating temperatures and
lower VSS content (Figure 9.2 and Figure 9.3).
Figure 9.2. Amount of ammonium nitrogen eliminated ( ), time required for the nitrification reaction ( ),
maximum contents of free ammonia ( ) and free nitrous acid ( ), and average values of temperature (),
dissolved oxygen () and pH (), for each biological test.
1 2 3 4 5 6 7 8 9 10 11 12 13 14 1510
15
20
25
0
200
400
600
800
1000
1200
1400
1600
1800
2000 ?NH4+-N
NH
4
+-N
i - N
H4
+-N
f (m
g/L
)
0
1
2
3
4
5
6
7
8
9
10
Nit
rifi
cati
on
Tim
e (
da
ys)
0
30
60
90
120
150
NH3-N
NH
3-N
ma
x. (
mg/L
)
Tm
Tm
(ºC
)
Test
0.0
0.5
1.0
1.5
DOm
DO
m (
mg/L
)
0
2
4
6
8
10
pHm
pH
m
0.0
0.3
0.6
0.9
1.2
1.5
HNO2-N
HN
O2-N
ma
x. (
mg/L
)

Chapter 9
268
Figure 9.3. Evolution of total suspended solids (TSS), volatile suspended solids (VSS), 30-min settled sludge
volume (SSV30-min) and sludge volumetric index (SVI), in the biological reactor, along the experimental period.
Table 9.2 shows that during the nitrification process, ammonium was mainly converted in nitrites whose
concentration increased from 17 to 821%, indicating that only the nitritation reaction occurred, leading
to the accumulation of nitrite inside the biological reactor [10, 11]. It can also be observed that, contrary
to what would be supposed, the amount of total dissolved nitrogen decreased (2 – 37%), being the
formation of nitrous nitrogen lesser than the loss of ammonium nitrogen, suggesting that part of
ammonium was lost by ammonia stripping.
The nitrification reaction takes place in two steps: (i) first, ammonium nitrogen is oxidised into nitrite
(nitritation) by the ammonia-oxidising bacteria (AOB), according to the Eq. (9.1); and (ii) then, in more
restrictive operating conditions, the nitrite is converted into nitrate (nitratation) by the nitrite-oxidising
bacteria (NOB), in agreement with Eq. (9.2) [10, 12, 13].
NH4+ +
3
2O2 → NO2
‐ + H2O + 2H+ (9.1)
NO2‐ +
1
2O2 → NO3
‐ (9.2)
TSS
VSS
30-min SSV
SVI
0
1
2
3
4
5
6
7
8
9
TS
S;
VS
S (
g/L
)
0
200
400
600
800
1000
SS
V3
0-m
in (
mL
/L)
1 2 3 4 5 6 7 8 9 10 11 12 13 14 15
2.8 2.6 3.5 4.4 5.4 6.8 4.4 5.6 4.4 5.9 6.0 7.0 7.4 8.6 7.2
1.8 2.0 2.4 3.0 3.8 4.8 3.1 4.0 3.1 4.1 4.1 5.3 5.5 6.3 5.5
163 175 200 290 330 515 298 385 325 360 393 695 841 966 917
59 67 57 66 61 75 68 69 74 61 66 99 114 113 128
0
20
40
60
80
100
120
140
SV
I (m
L/g
)

Chapter 9
269
The extension of the nitrification can be influenced by diverse abiotic factors, being the most important
the temperature, pH, dissolved oxygen (DO) deficiency, the presence of toxic or inhibitory substances
and the substrate concentration [12]. The nitrite build-up occurs when, individually or in combination,
certain deviations in the abiotic factors repress the action of the NOB in detriment of the ABO.
The nitratation reaction can especially be inhibited by: (i) cold temperatures (< 14ºC), since the nitrite
oxidation by NOB is slower than the ammonium oxidation by AOB [8, 10]; (ii) high pH values, since
the optimal pH values are between 7.2 and 7.6 for NOB and between 7.9 and 8.2 for AOB [13, 14]; (iii)
low DO content (< 0.5 mg/L), since the oxygen deficit affects more significantly the activity of NOB
than that of AOB, thus being the nitrite oxidation strongly inhibited [8, 10, 15]; (iv) high concentrations
of un-ionised ammonia (NH3), which has been described as being more inhibitory for NOB
(0.08-0.82 mg NH3-N/L) than for AOB (8.2-123 mg NH3-N/L) [13, 16]; and (v) a content of free nitrous
acid or un-ionised nitrous acid (HNO2) higher than 0.06-0.83 mg HNO2-N/L [10, 16].
The amounts of un-ionised ammonia ([NH3-N]) and un-ionised nitrous acid [HNO2-N] are directly
related to the concentrations of total ammonia nitrogen ([TAN] = [NH3-N + NH4+-N]) and nitrite ([NO2
-
-N]), respectively, the pH and the temperature (in ºC), and can be estimated from the following
equations:
pHT273 6344
pH
310e
10TANNNH
(9.3)
pHT273 2300
22
10e
NNONHNO
(9.4)
Given the exposed above and looking at the Figure 9.2, it can be inferred that the cause of the nitrite
accumulation is the combination of low dissolved oxygen content along with the presence of free
ammonia and free nitrous acid (maximum concentrations between 2.0-134 mg NH3-N/L and
0.03-1.5 mg HNO2-N/L, respectively). The free ammonia seems to be the abiotic factor that more
represses the nitrite oxidation into nitrate, rising up to values that, according to Anthonisen et al. [16],
can inhibit both the species of nitrifying bacteria.
The ammonium nitrogen conversion to nitrite could be a good option, since the nitrite is an intermediate,
both of nitrification and denitrification reactions. Thus, the nitrification could be stopped at nitrite and
the denitrification could start from there, by reducing the nitrite into nitrogen gas, thereby saving 25%
in the oxygen demand for the nitrification and 40% in the needs of external carbon source for the
denitrification [17].

Chapter 9
270
Throughout this chapter it will be explained that a leachate downstream from the biological oxidation,
with high amounts of nitrite, affects directly the hydrogen peroxide consumption in the subsequent
photo-Fenton reaction. So, in the future, two measures could be implemented in the first biological
oxidation process, regarding a proficient integration of the treatment strategy under consideration,
namely: (i) to perform nitrification-denitrification via nitrite, taking into account the alkalinity balance
(consumed during nitrification plus the produced along denitrification), in order to assure that the
sulphate concentration (added as sulphuric acid and ferrous sulphate, in the coagulation and
photo-oxidation steps, respectively) does not exceed 2000 mg/L; or (ii) to carry out complete
nitrification to nitrate, optimizing the operating conditions (pH, OD and temperature) and the ammonium
nitrogen load fed to the biological reactor (for instance, using a sequential batch reactor (SBR) with 100
m3 capacity, being the treated volume of 25 m3, which means a dilution of four times of the inlet
leachate), minimizing the inhibition of nitrite-oxidising bacteria.
Figure 9.3 shows an oscillation on solids profile, with a progressive growing trend (TSS = 2.6 – 8.6 g/L
and VSS = 1.7 – 6.3 g/L), keeping the VSS/TSS ratio between 64 and 76%, along all biological oxidation
trials. The increment in solids content was associated with the microbial growth and the existence of
solids in the leachate fed to the biological reactor, while the decreasing was due to the purge of sludge.
In the course of the experimental period, the values of the settled sludge volume at 30 min, and the
sludge volumetric index increased up to a maximum of 966 mL/L and 128 mL/g, respectively, indicating
a poor sludge settling (SVI > 100 mL/g) [18]. The weak settleability perceived, mainly in the last four
experiments, was most likely caused by the increment of the sludge age and by the very low food to
microorganism ratio (F/M) [19], which ranged among 0.01 and 0.05 g BOD5 per 1 g of VSS per day.
9.3.2 Evaluation of the coagulation/sedimentation efficiency
Previous results showed that the preliminary acidification process of the photo-Fenton reaction led to
the formation of high amounts of sludge, increasing the turbidity and decreasing the light penetration
and consequently decreasing the photo-Fenton reaction rate, thus demanding high energy and H2O2
consumption to achieve a biodegradable effluent able to be coupled with a biological process (Chapters
3-5). Considering these aspects it was decided to perform an intermediate step of
coagulation/sedimentation, whose main purposes are: (i) removal of the recalcitrant organic matter
fraction, corresponding to the humic acids present in the effluent downstream the biological treatment;
and (ii) leachate clarification, in order to improve the efficiency of the upstream photo-oxidation step.
Chapter 9
271
In this process, ferric chloride was selected as coagulant, since the photo-Fenton reaction is carried out
with iron. Initially, the coagulation tests were performed at pH 2.8, since the photo-Fenton reaction is
more efficient at pH between 2.8 and 3.0 [20]. However, for the photo-oxidation experiments, the
addition of an alkaline solution was required due to the pronounced decrease of pH, at the beginning of
the photo-Fenton reaction (this will be explained in the next sub-section). Bearing in mind the
minimization of this unavoidable consumption of sodium hydroxide in the subsequent phototreatment
process, the coagulation step was also performed at higher pH values, and a pH of 4.2 was selected as
probable the optimum (discussion still going on). Moreover, Ntampou et al. [21] claimed that the
optimum pH value for the leachate treatment by coagulation, using ferric chloride (7 mmol Fe3+/L), was
around 4.5.
Since the coagulation pH had to be chosen taking into account the following photo-Fenton reaction and
there was no significant difference between the coagulation efficiencies at pH 3.0 and 4.2, only the
coagulant dose was tested, varying the ferric ion concentration between 120 and 600 mg Fe3+/L to
evaluate its influence on the coagulation/sedimentation process. The jar-test stirring speed was set at
100 rpm (equivalent to stirring speed in the coagulation tank). Figure 9.4 and Figure 9.5 show the
evolution of the colour, DOC concentration, and total suspended solids in the supernatant, and volume
of settled sludge after 30 minutes, for different additions of ferric chloride.
Increasing the coagulant dose from 120 to 600 mg/L, it was observed an increment (i) in the DOC
removal from 37% to 82%, (ii) in the TSS removal from 26% to 77% and (ii) in the amount of acid
sludge generated, approximately, from 120 to 600 mL/L (after half an hour). Figure 9.5 also shows that
the increment in the coagulant dose led to a change in the effluent colour, from dark-brown (associated
to humic acids) to yellow-brown and light yellow (associated to fulvic acids), which is related to the
precipitation of the negatively charged humic acids [22, 23]. The insoluble Fe(III)-HA complexes are
created when two or more iron coordination positions are occupied by HA ligand donor groups, forming
an internal ring structure, mostly due to the reactions with the HA functional groups that contain oxygen,
such as COOH, C=O and phenolic OH groups [24].
Figure 9.6 presents the images of an experiment where humic substances were extracted from a
biologically oxidised leachate by the acid-base treatment method [25, 26], with a DAX-8 resin column.
Figure 9.6b shows the dark colour of the humic substances extracted from the column. The sludge
volume was measured every 30 minutes, along 4.5 hours of sedimentation. After 2 hours, for the
experiments performed with the three higher iron doses, it was observed the flotation of a fraction of the
solid phase, probably due to the large amount of gas entrapped in the sludge.

Chapter 9
272
Figure 9.4. Evolution of the supernatant colour for coagulant doses
from 0 to 600 mg Fe3+/L.
Figure 9.5. Dissolved organic carbon (DOC), 30-min settled sludge volume (SS) and total
suspended solids (TSS) in the supernatant, as a function of coagulant concentration (pH 4.2).
Aziz et al. [27] also showed that the removal of colour, turbidity, suspended solids and COD increased
with the increasing of FeCl3 dose. For instance, the COD decreased 27% and 51%, when using 200 and
1200 mg/L of FeCl3 (CODi = 1533-3600 mg/L), respectively. They likewise concluded that the organic
matter is the main responsible for the leachate colour. On the other hand, Amokrane et al. [28] indicated
that to achieve a COD reduction of 55% (CODi = 4100 mg/L; DOCi = 1430 mg/L), the optimal iron
dose, for landfill leachate pretreatment by coagulation, was 0.035 mol/L (FeCl3), which is 4.8 times
higher than the dose obtained by Aziz et al [27].
0 120 240 360 480 600
SS 120 280 540 620 600
DOC 1174 739 515 371 273 216
TSS 475 350 215 125 100 110
0
100
200
300
400
500
0
200
400
600
800
1000
1200
TS
S (
mg
/L)
DO
C (
mg
/L);
SS
0.5
(mL
/L)
Fe3+ (mg/L)

Chapter 9
273
(a)
(b)
Figure 9.6. Extraction of humic substances from landfill leachate. (a) XAD-8 resin column after passing the
leachate previously nitrified and acidified. (b) Eluate samples collected at different times.
The coagulation step only promotes the transfer of the organic matter from the dissolved phase to the
particulate phase, leading to the formation of high amounts of acidic sludge, which currently constitutes
a serious problem and needs to be forwarded to the landfill. The coagulant dose selected was
240 mg Fe3+/L due to three main factors: i) minimum dose of coagulant able to precipitate the humic
acids and yield a light yellow leachate; ii) minimum dose of coagulant allowing to obtain a leachate with
low suspended solids and avoid the sludge flotation; iii) minimum production of acidic sludge and
maximum amount of organic matter to be oxidised in the phototreatment.
The coagulation tests performed at pre-industrial scale, using the same coagulant dose, showed a much
higher efficiency than that obtained in the jar-test, leading to an effluent with characteristics close to the
leachate obtained with the addition of 360 mg Fe3+/L in the jar-test (see Figure 9.7).
(a) (b) (c)
Figure 9.7. Comparison between the test performed in the pre-industrial scale plant using 240 mg
Fe3+/L (b), with the tests performed in the jar-test using 240 (a) and 360 (c) mg Fe3+/L.

Chapter 9
274
Table 9.3 shows the values of the main analysed parameters, at the beginning (CT_0 = BR_F) and the
end (CT_F) of each test, as well as the removal efficiency of TSS, DOC and COD. The concentration of
the TSS at the end of the experiment (TSSCT_F) refers to the value after the sedimentation period (Sed.)
and acid sludge removal. In the tests 5 and 6, the coagulation step was not carried out, aiming at
comparing the tests conducted in this set with those reported in Chapters 3, 4 and 5. Whenever the values
presented in the table refer to the moment after acidification, very low DOC and COD removals (< 35%)
were obtained. In the trial 7, only ferric chloride was added, in order to verify if the H2O2 addition, in
the subsequent photo-oxidation, would be enough to lower the pH value until the desired one, and it was
verified that, during coagulation, the organic matter removal was about 30% lesser than the average.
Finally, the experiment 11 was performed with less coagulant, with the intention of checking whether
the yield of photo-Fenton reaction was significantly affected. As will be seen, the use of a lower iron
dose led to a decrease in efficiency both of coagulation and photo-oxidation.
With exception of tests 5, 6 and 11, during the coagulation process, the chloride ions concentration
increased in average 540 mg/L, which is very close to the stoichiometric amount of this ion (490 mg/L)
added as ferric chloride commercial solution (considering the information of manufacturer: 40% FeCl3
and 1% HCl). The sulphate ions concentration simultaneously increased, during the coagulation step,
but in this case, due to sulphuric acid addition. By the analysis of the Table 9.3 and Figure 9.8, it appears
that, in general, the acid needs increase proportionally to the alkalinity concentration of the leachate fed
to the coagulation tank. Therefore, it is extremely important to achieve the complete removal of
alkalinity in the nitrification biological step in order to reduce the acid requirements. High doses of
sulphuric acid will lead to high amounts of sulphate ions in the treated leachate, exceeding the discharge
limit imposed by the Portuguese legislation (2 g/L). Beyond that, high sulphate content reduces
significantly the photo-Fenton reaction rate, as previously discussed in Chapter 7.
According to Table 9.3 and Figure 9.9, with exception of tests 5, 6 and 11, the coagulation step led to
DOC and COD removal efficiencies above 40% (average removal efficiency of 60 and 58%,
respectively). Ntampou et al [21] achieved similar results (COD removal of approximately 54%) using
4 mM of ferric ion (223 mg Fe3+/L) in the coagulation of a stabilized leachate. These values are in
agreement with those presented by Amokrane et al. [28]. The authors reported DOC and COD removal
efficiencies of approximately 10 – 25% for young leachates, and about 50 – 65% for stabilized leachates
or biologically oxidised leachates.
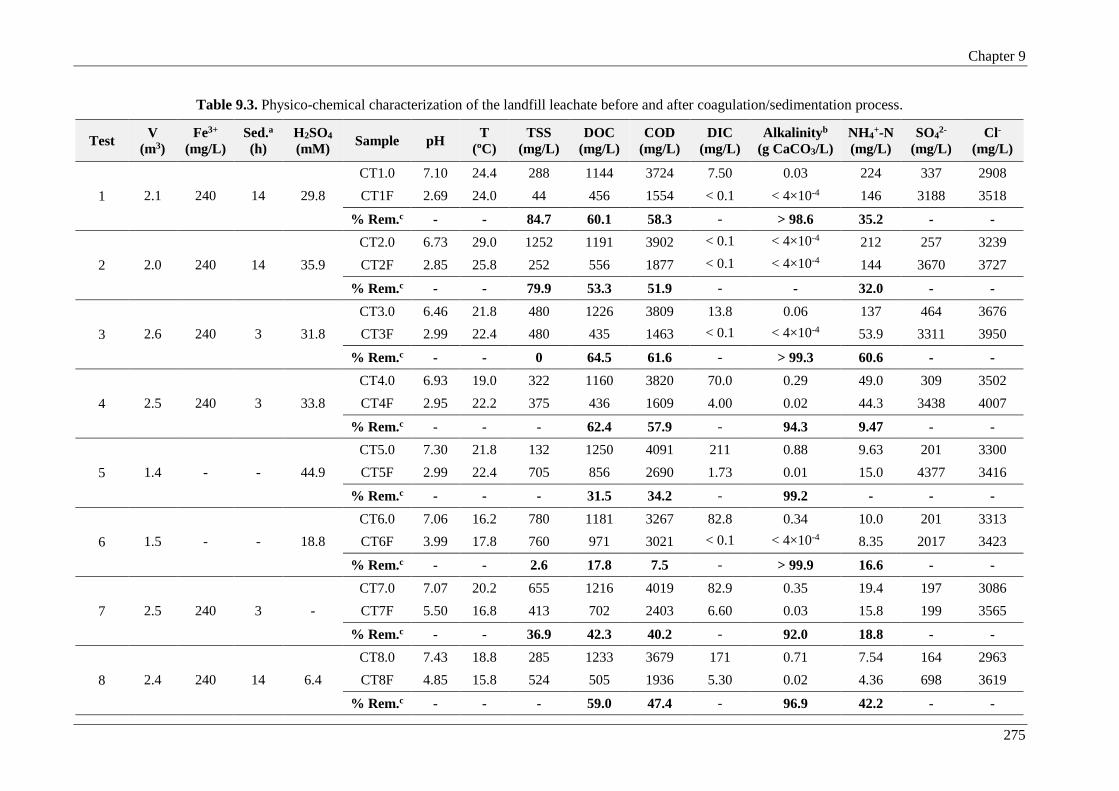
Chapter 9
275
Table 9.3. Physico-chemical characterization of the landfill leachate before and after coagulation/sedimentation process.
Test V
(m3)
Fe3+
(mg/L)
Sed.a
(h)
H2SO4
(mM) Sample pH
T
(ºC)
TSS
(mg/L)
DOC
(mg/L)
COD
(mg/L)
DIC
(mg/L)
Alkalinityb
(g CaCO3/L)
NH4+-N
(mg/L)
SO42-
(mg/L)
Cl-
(mg/L)
1
CT1.0 7.10 24.4 288 1144 3724 7.50 0.03 224 337 2908
2.1 240 14 29.8 CT1F 2.69 24.0 44 456 1554 < 0.1 < 4×10⁻⁴ 146 3188 3518
% Rem.c - - 84.7 60.1 58.3 - > 98.6 35.2 - -
2
CT2.0 6.73 29.0 1252 1191 3902 < 0.1 < 4×10⁻⁴ 212 257 3239
2.0 240 14 35.9 CT2F 2.85 25.8 252 556 1877 < 0.1 < 4×10⁻⁴ 144 3670 3727
% Rem.c - - 79.9 53.3 51.9 - - 32.0 - -
3
CT3.0 6.46 21.8 480 1226 3809 13.8 0.06 137 464 3676
2.6 240 3 31.8 CT3F 2.99 22.4 480 435 1463 < 0.1 < 4×10⁻⁴ 53.9 3311 3950
% Rem.c - - 0 64.5 61.6 - > 99.3 60.6 - -
4
CT4.0 6.93 19.0 322 1160 3820 70.0 0.29 49.0 309 3502
2.5 240 3 33.8 CT4F 2.95 22.2 375 436 1609 4.00 0.02 44.3 3438 4007
% Rem.c - - - 62.4 57.9 - 94.3 9.47 - -
5
CT5.0 7.30 21.8 132 1250 4091 211 0.88 9.63 201 3300
1.4 - - 44.9 CT5F 2.99 22.4 705 856 2690 1.73 0.01 15.0 4377 3416
% Rem.c - - - 31.5 34.2 - 99.2 - - -
6
CT6.0 7.06 16.2 780 1181 3267 82.8 0.34 10.0 201 3313
1.5 - - 18.8 CT6F 3.99 17.8 760 971 3021 < 0.1 < 4×10⁻⁴ 8.35 2017 3423
% Rem.c - - 2.6 17.8 7.5 - > 99.9 16.6 - -
7
CT7.0 7.07 20.2 655 1216 4019 82.9 0.35 19.4 197 3086
2.5 240 3 - CT7F 5.50 16.8 413 702 2403 6.60 0.03 15.8 199 3565
% Rem.c - - 36.9 42.3 40.2 - 92.0 18.8 - -
8
CT8.0 7.43 18.8 285 1233 3679 171 0.71 7.54 164 2963
2.4 240 14 6.4 CT8F 4.85 15.8 524 505 1936 5.30 0.02 4.36 698 3619
% Rem.c - - - 59.0 47.4 - 96.9 42.2 - -

Chapter 9
276
Table 9.3. Physico-chemical characterization of the landfill leachate before and after coagulation/sedimentation process.
Test V
(m3)
Fe3+
(mg/L)
Sed.a
(h)
H2SO4
(mM) Sample pH
T
(ºC)
TSS
(mg/L)
DOC
(mg/L)
COD
(mg/L)
DIC
(mg/L)
Alkalinityb
(g CaCO3/L)
NH4+-N
(mg/L)
SO42-
(mg/L)
Cl-
(mg/L)
9
CT9.0 7.54 15.8 175 1058 3746 217 0.91 9.28 182 2822
2.5 240 14 13.4 CT9F 4.18 13.8 72 388 1141 4.49 0.02 4.57 1333 3528
% Rem.c - - 58.9 63.3 69.5 - 97.9 50.7 - -
10
CT10.0 7.59 15.6 496 1106 3443 309 1.29 16.9 142 2866
2.4 240 14 18.4 CT10F 4.27 12.4 116 374 1162 1.93 0.01 2.04 1690 3365
% Rem.c - - 76.6 66.2 66.3 - 99.4 88.0 - -
11
CT11.0 7.76 14.4 540 1096 3127 368 1.54 8.94 412 2830
2.5 120 14 18.8 CT11F 4.31 14.8 416 613 2060 9.37 0.04 3.37 2202 3040
% Rem.c - - 23.0 44.1 34.1 - 97.5 62.3 - -
12
CT12.0 7.67 14.8 492 1015 2952 318 1.33 91.6 261 2709
2.3 240 14 19.5 CT12F 4.18 13.2 220 382 1297 10.7 0.04 12.3 1679 3256
% Rem.c - - 55.3 62.4 56.1 - 96.6 86.6 - -
13
CT13.0 7.60 13.1 164 1125 3308 233 0.97 15.3 258 2578
2.3 240 14 13.6 CT13F 4.29 10.4 168 410 1363 5.46 0.02 22.6 1397 3267
% Rem.c - - - 63.6 58.8 - 97.7 - - -
14
CT14.0 7.26 12.4 360 1041 3410 134 0.56 29.3 526 2727
2.5 240 14 9.4 CT14F 4.24 10.2 200 422 1498 7.82 0.03 26.5 1254 3308
% Rem.c - - 44.4 59.5 56.1 - 94.2 9.41 - -
15
CT15.0 6.82 14.8 528 1002 3566 52.5 0.22 68.0 538 2454
2.9 240 14 4.4 CT15F 4.20 9.4 40 419 936 6.08 0.03 32.9 901 2861
% Rem.c - - 92.4 58.2 73.8 - 88.4 51.6 - -
aSedimentation time; bAlkalinity values considering that at pH below 8.0 the inorganic carbon is almost in the form of bicarbonates ; cRemoval percentage (100 – 100 × RB_0/RB_F).
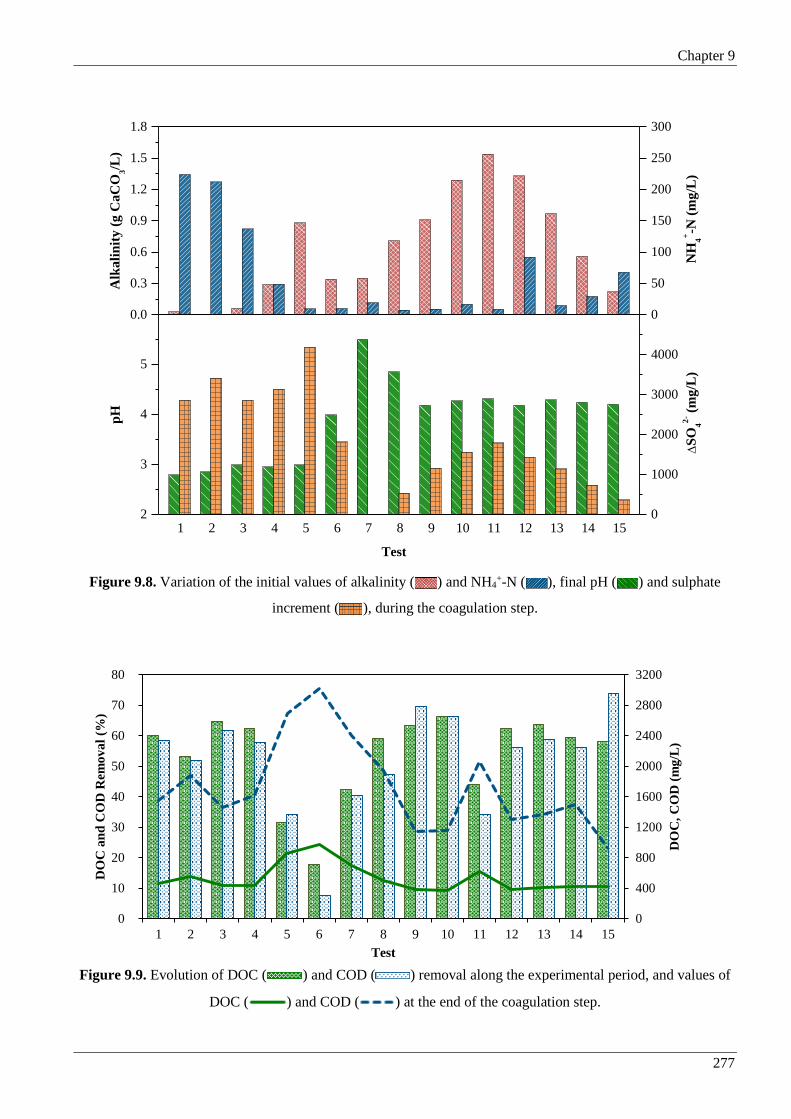
Chapter 9
277
Figure 9.8. Variation of the initial values of alkalinity ( ) and NH4+-N ( ), final pH ( ) and sulphate
increment ( ), during the coagulation step.
Figure 9.9. Evolution of DOC ( ) and COD ( ) removal along the experimental period, and values of
DOC ( ) and COD ( ) at the end of the coagulation step.
0.0
0.3
0.6
0.9
1.2
1.5
1.8A
lkali
nit
y (
g C
aC
O3/L
)
1 2 3 4 5 6 7 8 9 10 11 12 13 14 152
3
4
5
Test
pH
0
50
100
150
200
250
300
NH
4
+-N
(m
g/L
)
0
1000
2000
3000
4000
S
O4
2- (
mg
/L)
0
400
800
1200
1600
2000
2400
2800
3200
0
10
20
30
40
50
60
70
80
1 2 3 4 5 6 7 8 9 10 11 12 13 14 15
DO
C,
CO
D (
mg
/L)
DO
C a
nd
CO
D R
emo
va
l (%
)
Test

Chapter 9
278
The marked decay of the organic matter is most likely related to the removal of humic substances, mainly
humic acids, leading to a change in the leachate colour, from dark-brown, characteristic of humic acids
solutions, to brownish yellow, typical of fulvic acids solutions (see Figure 9.4), resulting in
approximately 300 mL (measured after 30 minutes; in the next day the sludge content was about
240 mL/L) of acidic iron sludge per 1-L of coagulated leachate.
Wu et al. [29] investigated the dissolved organic matter (DOM) composition during a multistage leachate
treatment strategy, including biological oxidation through SBR, coagulation, Fenton reaction and
biological aerated filtering (BAF). The DOM of the landfill leachate was fractionated in each stage into
humic acid (HA), fulvic acid (FA) and hydrophilic (Hyl) fractions. The coagulation step achieved a
removal efficiency of 71%, 53% and 37% for HA, Hyl and FA, respectively. This indicates that the high
molecular weight (MW) humic acids are preferentially eliminated in this stage.
Yoon et al. [30] reported similar results for the treatment of a leachate from an aerated lagoon with a
ferric iron driven coagulation process, using an ultrafiltration system for the organic compounds
fractionation. The authors showed that along the coagulation process, the organics with MW > 500 Da
were removed more easily (59 – 73%) than the organics with a MW < 500 Da (18%). The humic
substances can be removed from the aqueous phase by coagulation-sedimentation according to two
mechanisms [21, 31]: (i) charge neutralization by binding the cationic metal on the negatively charged
functional groups of the humic acids, reducing their solubility; and (ii) adsorption, by adhesion of
amorphous metal hydroxides onto the produced precipitates. As previously reported, the photo-Fenton
rate is drastically reduced by the presence of suspended solids due to three main factors: i) decrease of
the light penetration in the reactional medium; ii) absorption of UV-Vis photons, decreasing its
availability for the photo-oxidation process; iii) degradation of the particulate organic matter.
Aiming at correctly operate the subsequent phototreatment step, the coagulation/sedimentation stage
should be performed: (i) using ferric chloride, with a concentration of 240 mg of Fe3+ per 1-L of landfill
leachate, after suitable aerobic biological oxidation; (ii) at pH 4.2, once it was the ideal to initiate the
subsequent photo-Fenton reaction, ensuring that the sulphate ion concentration remains below the
discharge limit (2 g/L); and (iii) with a sedimentation period of approximately 14 hours, achieving a
supernatant’s TSS content lower than 250 mg/L.
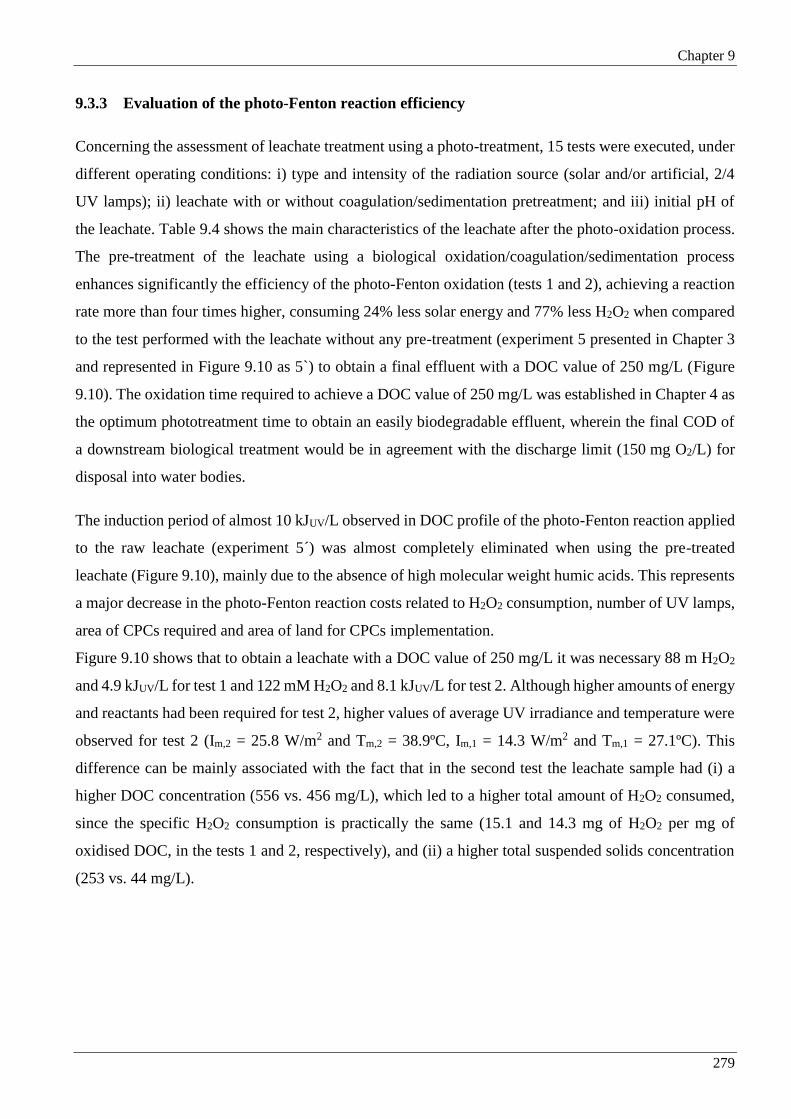
Chapter 9
279
9.3.3 Evaluation of the photo-Fenton reaction efficiency
Concerning the assessment of leachate treatment using a photo-treatment, 15 tests were executed, under
different operating conditions: i) type and intensity of the radiation source (solar and/or artificial, 2/4
UV lamps); ii) leachate with or without coagulation/sedimentation pretreatment; and iii) initial pH of
the leachate. Table 9.4 shows the main characteristics of the leachate after the photo-oxidation process.
The pre-treatment of the leachate using a biological oxidation/coagulation/sedimentation process
enhances significantly the efficiency of the photo-Fenton oxidation (tests 1 and 2), achieving a reaction
rate more than four times higher, consuming 24% less solar energy and 77% less H2O2 when compared
to the test performed with the leachate without any pre-treatment (experiment 5 presented in Chapter 3
and represented in Figure 9.10 as 5`) to obtain a final effluent with a DOC value of 250 mg/L (Figure
9.10). The oxidation time required to achieve a DOC value of 250 mg/L was established in Chapter 4 as
the optimum phototreatment time to obtain an easily biodegradable effluent, wherein the final COD of
a downstream biological treatment would be in agreement with the discharge limit (150 mg O2/L) for
disposal into water bodies.
The induction period of almost 10 kJUV/L observed in DOC profile of the photo-Fenton reaction applied
to the raw leachate (experiment 5´) was almost completely eliminated when using the pre-treated
leachate (Figure 9.10), mainly due to the absence of high molecular weight humic acids. This represents
a major decrease in the photo-Fenton reaction costs related to H2O2 consumption, number of UV lamps,
area of CPCs required and area of land for CPCs implementation.
Figure 9.10 shows that to obtain a leachate with a DOC value of 250 mg/L it was necessary 88 m H2O2
and 4.9 kJUV/L for test 1 and 122 mM H2O2 and 8.1 kJUV/L for test 2. Although higher amounts of energy
and reactants had been required for test 2, higher values of average UV irradiance and temperature were
observed for test 2 (Im,2 = 25.8 W/m2 and Tm,2 = 38.9ºC, Im,1 = 14.3 W/m2 and Tm,1 = 27.1ºC). This
difference can be mainly associated with the fact that in the second test the leachate sample had (i) a
higher DOC concentration (556 vs. 456 mg/L), which led to a higher total amount of H2O2 consumed,
since the specific H2O2 consumption is practically the same (15.1 and 14.3 mg of H2O2 per mg of
oxidised DOC, in the tests 1 and 2, respectively), and (ii) a higher total suspended solids concentration
(253 vs. 44 mg/L).

Chapter 9
280
Table 9.4. Main characteristics of the leachate after the photo-oxidation process.
Test
Radiation
Pretreatmentb V
(m3)
TSSic
(mg/L) pHi
c pHmd
Tmd
(ºC)
Femd
(mg/L) t (h)
QUV
(kJ/L)
EEe
(kWh/m3)
NaOHf
(mM)
H2O2g
(mM)
DOCic
(mg/L)
DOCfh
(mg/L)
Mini
(%)
H2O2/Cj
(mg H2O2
mg DOC)
Sourcea Intensity
1 Sol. 14.3 W/m2 BT + Coag. 1.0 44 2.69 2.52 27.1 72.4 7.0 7.3 - 34.9 123 456 178 61.0 15.1
2 Sol. 25.8 W/m2 BT + Coag. 1.0 253 2.85 2.59 38.9 74.0 4.2 9.2 - 34.9 140 556 222 60.1 14.3
3 Art. 4×1000 W BT + Coag. 1.4 480 2.99 2.64 42.1 75.9 6.2 19.7 16.3 27.9 125 435 176 59.5 16.4
4 Art. 4×1000 W BT + Coag. 1.4 575 2.95 2.58 32.4 81.5 9.8 30.3 23.3 34.9 174 436 193 55.7 24.4
5 Art. 4×1000 W BT 1.4 705 2.99 2.68 38.6 31.1 23.6 72.8 67.4 56.9 250 856 437 48.9 20.3
6 Art. 4×1000 W BT 1.5 760 3.99 2.62 33.0 59.2 18.6 53.5 49.6 23.0 203 971 520 46.4 15.3
7 Art. 4×1000 W BT + Coag. 1.5 413 5.50 3.11 35.1 60.2 11.9 34.3 31.8 16.0 187 702 292 58.4 15.5
8 Art. 4×1000 W BT + Coag. 1.4 524 4.85 2.64 29.9 53.8 11.8 36.5 25.0 17.0 202 505 198 60.8 22.4
9 Art. 4×1000 W BT + Coag. 1.6 72 4.18 2.69 28.3 52.1 7.0 19.0 15.0 14.0 119 388 222 42.8 24.4
10 Sol./Art. 23.7 W/m2
+ 4×1000 W BT + Coag. 1.7 116 4.27 2.59 29.0 56.3 5.3 17.7 7.5 12.0 133 374 172 54.0 22.4
11 Sol./Art. 14.1 W/m2
+ 4×1000 W BT + Coag. 1.7 416 4.31 2.72 31.9 49.8 13.3 46.0 25.9 12.0 170 613 229 62.6 15.1
12 Art. 2×1200 W BT + Coag. 1.4 220 4.18 2.59 25.2 56.7 8.1 15.0 10.9 11.0 115 382 240 37.2 27.6
13 Art. 2×850 W BT + Coag. 1.3 168 4.29 2.67 15.6 58.7 13.2 18.6 13.3 12.0 125 410 232 43.4 23.9
14 Art. 2×1200 W BT + Coag. 1.4 200 4.24 2.60 23.5 54.5 7.2 13.3 12.3 16.0 115 422 286 32.2 28.8
15 Sol./Art. 17.1 W/m2
+ 2×1200 W BT + Coag. 1.8 40 4.20 2.77 22.6 49.5 5.7 12.2 7.6 14.0 127 419 205 51.1 20.2
aSol. – Solar, Art. – Artificial; bBT – Biological treatment, Coag. – Coagulation; cInitial values of TSS, pH and DOC (equal to the final value of coagulation); dAverage values of
pH, temperature and dissolved iron concentration, during the photo-Fenton reaction; eElectricity consumed by the lamps; fSodium hydroxide consumed during the photo-Fenton
reaction plus the amount to be spent in the neutralization of the photo-treated leachate (~9.5 mM); gHydrogen peroxide concentration consumed; hFinal value of DOC; iMineralization
(1‐ CODf CODi⁄ , %); jRatio between the H2O2 consumed and DOC oxidised along photo-Fenton (H2O2 (CODi‐CODf) × 34,02⁄ ).
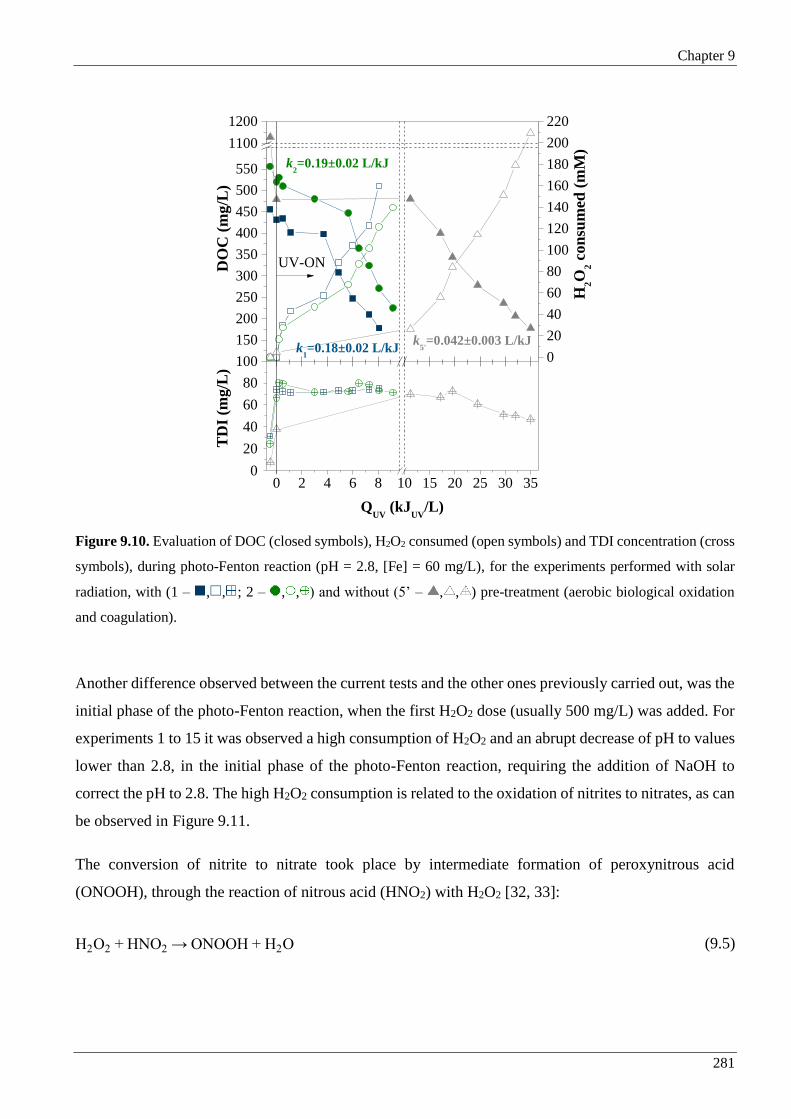
Chapter 9
281
Figure 9.10. Evaluation of DOC (closed symbols), H2O2 consumed (open symbols) and TDI concentration (cross
symbols), during photo-Fenton reaction (pH = 2.8, [Fe] = 60 mg/L), for the experiments performed with solar
radiation, with (1 – , , ; 2 – , , ) and without (5’ – , , ) pre-treatment (aerobic biological oxidation
and coagulation).
Another difference observed between the current tests and the other ones previously carried out, was the
initial phase of the photo-Fenton reaction, when the first H2O2 dose (usually 500 mg/L) was added. For
experiments 1 to 15 it was observed a high consumption of H2O2 and an abrupt decrease of pH to values
lower than 2.8, in the initial phase of the photo-Fenton reaction, requiring the addition of NaOH to
correct the pH to 2.8. The high H2O2 consumption is related to the oxidation of nitrites to nitrates, as can
be observed in Figure 9.11.
The conversion of nitrite to nitrate took place by intermediate formation of peroxynitrous acid
(ONOOH), through the reaction of nitrous acid (HNO2) with H2O2 [32, 33]:
H2O2 + HNO2 → ONOOH + H2O (9.5)
0 2 4 6 8 10 15 20 25 30 350
20
40
60
80
TD
I (m
g/L
)
QUV
(kJUV
/L)
100
150
200
250
300
350
400
450
500
550
1100
1200
k2=0.19±0.02 L/kJ
k1=0.18±0.02 L/kJ
DO
C (
mg
/L)
UV-ON
k5'=0.042±0.003 L/kJ
0
20
40
60
80
100
120
140
160
180
200
220
H2O
2 c
on
sum
ed (
mM
)

Chapter 9
282
The peroxynitrous acid in aqueous solution is a particularly unstable yellow species, with pKa = 6.8.
However, at alkaline pH its conjugated base, the very stable peroxynitrite anion is the predominant
species. In acidic medium, the peroxynitrous acid quickly decomposes itself into nitrate ion (see
Eq. (9.6)), releasing hydrogen ions, which promotes the acidification of the leachate [32-34].
ONOOH → NO3- + H+
(9.6)
The formation of peroxynitrous acid depends on the HNO2 concentration in solution, which is favoured
by acidic conditions. In aqueous solution, the nitrite ion is the conjugated base of the weak acid HNO2,
whose dissociation is represented by the following equilibrium equation [35, 36]:
HNO2(aq) ↔ NO2-(aq) + H+(aq) Ka = 7.1 × 10⁻⁴ mol/L (T = 25 ºC) (9.7)
Figure 9.11. Progression of H2O2 ( ) and NaOH ( ) consumption, and initial values of NO2--N
( ) and pH ( ), at the beginning of photo-Fenton reactions, using solar (S) and/or artificial (A)
radiation (R), along the experiments.
0
10
20
30
40
50
60
70
80
90AR
+SR
AR
SR + ARAR
H2O
2 c
on
sum
edi (
mM
)
SR
0
20
40
60
80
100
120
NO
- 2i (
mM
)
1 2 3 4 5 6 7 8 9 10 11 12 13 14 15
2
3
4
5
pH
i
Test
0
10
20
30
40
50
Na
OH
i (m
M)

Chapter 9
283
Taking into account the pKa value (3.15 at 25 ºC) of HNO2, and the respective distribution diagram
(Figure 9.12), it can be disclosed that only for pH below 5, the HNO2 starts to appear, and barely for pH
values below 3.15, [HNO2] > [NO2-]. This explains the fact that the reaction between H2O2 and HNO2,
and further decomposition of peroxynitrite acid, is faster at acidic pH values, which was experimentally
observable by the quicker pH decay.
Figure 9.12. Distribution diagram of the molar fractions of nitrous acid
( ) and nitrite ion ( ), as a function of pH (T = 25 ºC).
From Figure 9.11 it can be concluded that the initial H2O2 consumption is not directly proportional to
the initial nitrite ion concentration, in the following conditions:
(i) For leachate samples with the same initial pH value, but using a different radiation source, like in
experiments 2 and 4 (solar and artificial radiation, respectively, at pH 3). For test 2, the NO2- content
is higher but a lower H2O2 consumption is observed when compared to test 4. In this case, part of
the H2O2 was photolysed by the UV-C radiation emitted by UV- Vis lamps (which corresponds to
about 24% of the UV fraction of the lamp spectrum), increasing the total amount of H2O2 consumed
in the initial phase of the photo-Fenton reaction.
(ii) For the same radiation source, but using a leachate with a different initial pH value, such as in
experiments 4 and 9 (pH equal to 3.0 and 4.2, respectively; artificial radiation). During the initial
phase of test 9, it was consumed more 40% of H2O2 than in test 4, even being the NO2- concentration
29% lower. This dissimilarity can be attributed to the fact that for higher pH values, the molar
fraction of HNO2 is lower than NO2-, and consequently the amount of acid available to react with
H2O2 is lower, leaving more H2O2 free to be photolysed.
0
0.2
0.4
0.6
0.8
1
0 1 2 3 4 5 6 7
HN
O2
an
d N
O2
-m
ola
r fr
act
ion
pH

Chapter 9
284
It should be also noted that, when the pre-treatment (biological oxidation plus coagulation) was not
performed (tests 5 and 6), the concentration of H2O2 consumed was not affected by the initial pH value.
Moreover, as expected, the NaOH consumed to correct the solution pH considerably decreased for the
experiments performed at a higher initial pH. So, if the photo-Fenton reaction was started at pH 4.2
under artificial radiation, on average it will be consumed about 1 mol of H2O2 and 0.05 mol of NaOH
per 1 mol of NO2- fed to the photoreactor.
Figure 9.13 compares three photo-Fenton experiments after the initial biological oxidation: two of them
carried out after coagulation at pH 3.0, one using solar radiation (exp. 2) and the other using 4 UV-Vis
lamps, each one of 1000 W (exp. 4); and the last one was carried out without a previous coagulation
step, but with acidification up to pH 3.0 (exp. 5).
Figure 9.13. Evaluation of DOC (closed symbols), H2O2 consumed (open symbols) and TDI concentration (cross
symbols), during the photo-Fenton treatment (pH = 2.8, [Fe] = 60 mg/L) of the bio-coagulated treated leachate
using solar radiation (2 – , , ), 4 UV-Vis lamps (4 – , , ) and 4 UV-Vis lamps (without coagulation;
pH = 3.0) (5 – , , ).
0 5 10 15 20 25 40 60 800
20
40
60
80
TD
I (m
g/L
)
QUV
(kJUV
/L)
100
200
300
400
500
600
700
800
DO
C (
mg
/L)
UV-ON
0
40
80
120
160
200
240
H2O
2 c
on
sum
ed (
mM
)k
5=0.011±0.001 L/kJ
k2=0.19±0.02 L/kJ
k4=0.032±0.002 L/kJ

Chapter 9
285
The bio-treated leachate (without coagulation) exhibited an initial organic load 50% higher than the
bio-coagulated leachate, being necessary much more energy to reach the intended DOC value. On the
other hand, it is important to bear in mind that the coagulation process only promotes the pollutants
transfer from the liquid phase to the solid phase, leading to the formation of chemical sludge, which
needs to be treated in order to (i) be deposited in the landfill or (ii), as it contains a high amount of humic
acids, be reutilized as fertilizer for agriculture.
From Figure 9.13, it was also possible to infer that in the test performed with solar radiation, even starting
with a superior DOC (556 vs. 436 mg/L), the photo-Fenton reaction was more efficient, being the
specific H2O2 consumption and the amount of accumulated UV energy 1.8 and 2.6 times lower,
respectively, to reach a mineralization level 10% greater. Beyond that, the photo-Fenton reaction using
solar radiation (exp. 2) was performed at a higher average operating temperature (39 ºC compared to
32 ºC) and using a higher sedimentation period (14 instead of 3 hours), leading to a more clarified
leachate (TSS from exp. 2 was 56% lower than from exp. 4). This means that polychromatic sunlight is
more efficient than other light sources with shorter wavelength, since higher wavelengths are able to
better overcome the inner filter effects, and can promote the photolysis of ferric ion complexes [2].
Until the assay 5, the coagulation/acidification stage was performed at pH near 3, requiring high amounts
of NaOH to neutralize the high concentration of hydrogen ion generated from the decomposition of
peroxynitrite acid. In order to try to take advantage of this phenomenon, and additionally minimize the
NaOH consumption, it was decided to carry out an experiment (exp.6), with acidification up to pH 4.0,
and so it would be possible to verify if the H+ released from the decomposition of peroxynitrite acid was
enough to achieve the pH of 2.8. From test 6, it was found that, initiating the photo-Fenton reaction at
pH 4.0, the leachate pH value decreased to values below 2.8, and it was still necessary to add NaOH to
adjust this parameter. Test 6 also showed the ineffectiveness of the photo-treatment applied to the
bio-treated leachate without the coagulation step: approximately 200 mM of H2O2 and 54 kJ/L of
accumulated UV energy were required merely to reach a DOC of 520 mg/L.
Another photo-Fenton reaction (exp. 7) was performed using a bio-coagulated leachate with a pH of 5.5.
In this condition, the leachate pH during the initial part of the photo-Fenton reaction remained 5.5 and
the oxidation efficiency was negligible due to iron precipitation. The amount of HNO2 at pH 5.5 (Figure
9.12) is low and consequently the decomposition of H2O2 in the presence of nitrites and formation of H+
is not enough to drop the leachate pH. The same results were obtained for the bio-coagulated leachate at
pH 4.5 (exp. 8). So, further experiments were performed using a bio-coagulated leachate with a pH of
4.2, since the addition of ferrous sulphate, in the photo-treatment step, results in a pH abatement of
approximately 0.2. Taking into account the results obtained before, along with the values of TSS at the
beginning of the photo-oxidation, it was decided that the settling phase would pass to take 14 hours.

Chapter 9
286
Three more photo-Fenton reactions were performed using a bio-coagulated leachate with a pH of 4.2
and a sedimentation time in the coagulation step of 14 hours (Figure 9.14): (i) using 4 UV-Vis lamps
(1000 W each) (exp. 9); (ii) combining solar radiation and artificial light (4 UV-Vis lamps) (exp. 10);
and (iii) combining solar radiation and artificial light (4 UV-Vis lamps), but applying half of the
coagulant dose (exp. 11).
Figure 9.14. Evaluation of DOC (closed symbols), H2O2 consumed (open symbols), TDI concentration (cross
symbols) and pH (semi-filled symbols) during the photo-Fenton treatment (pH = 2.8, [Fe] = 60 mg/L) of the
bio-coagulated treated leachate using 4 UV-Vis lamps (9 – , , , ) and combining solar radiation with
4 UV-Vis lamps after coagulation with 240 mg Fe3+/L (10 - , , , ) and 120 mg Fe3+/L (11 – , , , ).
Figure 9.14 shows a steep initial DOC decay of 80, 60 and 190 mg/L for the tests 9, 10 and 11,
respectively, due to organic matter precipitation with the Fe3+ (obtained through the reaction of H2O2
with Fe2+). After that, the DOC profile presents an induction period until approximately 10 kJ/L, for the
assays 9 and 10, and 15 kJ/L for assay 11, in which less oxidized compounds are converted into more
oxidized ones but without significant mineralization. The second part of the DOC profile follows a
pseudo-first kinetic behavior.
0 3 6 9 12 15 18 20 30 40 500
20
40
60
TD
I (m
g/L
)
QUV
(kJUV
/L)
200
300
400
500
600
700
k11
=0.025±0.003 L/kJk
10=0.08±0.02 L/kJ
k9=0.036±0.009 L/kJ
DO
C (
mg/L
)
UV-ON
0
20
40
60
80
100
120
140
160
180
H2O
2 c
on
sum
ed (
mM
)
2.0
2.5
3.0
3.5
4.0 p
H

Chapter 9
287
The initial DOC abatement was higher in experiment 11, since in this case it was used half of the
coagulant dose in the coagulation step, remaining higher amounts of humic acids in solution, than
eventually were precipitated with ferric ions at the beginning of the photo-oxidation. Therefore, the
dissolved iron concentration that remained in the solution was 50% lower than in experiments 11 and
10.
The amount of accumulated UV energy and H2O2 consumption during the photo-oxidation was 3.1 and
1.5 times higher, to achieve a leachate with a DOC value of 250 mg/L, in the experiment 11 (half of the
coagulant dose) when compared to experiment 10. The leachate after the coagulation/sedimentation step
using 120 mg Fe3+/L presented: (i) higher organic load (about 64%), (ii) increased turbidity, (iii) higher
coloration (see second tube of the Figure 9.4), and (iii) increased TSS content in the supernatant
(416 vs. 116 mg/L), which greatly affects the light penetration into the reactional medium.
The DOC, H2O2 consumption, T, pH and dissolved iron concentration profiles are very similar for the
experiments performed using only artificial light (exp. 9) or combining solar and artificial light (exp.
10). However, after 10 kJ/L, the reaction rate almost doubled for the experiment combining both
radiation sources. The addition of 499 W of natural UV light (24 W/m2 of natural solar radiation, CPC
area of 20.8 m2) to 1200 W of UV artificial radiation (4 lamps with a rated power of 1000 W, emitting
30% of useful UV radiation), decreased the reaction time and the electric energy consumption was
reduced to half.
Figure 9.15 compares the efficiency of the photo-Fenton reaction in the treatment of a bio-coagulated
leachate using different number of UV lamps and power (exps. 9, 12 and 13). In all assays, the leachate
was submitted to the same pre-treatment: aerobic biological oxidation, where close values of alkalinity
were achieved (see Table 9.2); followed by coagulation/sedimentation with 240 mg Fe3+/L, at pH 4.2,
yielding equivalent values of sulphate ion concentration (see Table 9.3); and a settling period of 14
hours, reaching TSS contents in the supernatant ≤ 220 mg/L (see Table 9.3). The experiment 9 was
performed using 4 UV-Vis lamps regulated to a power of 1000 W, while the experiments 12 and 13 were
carried out with 2 UV-Vis lamps of 1200 and 850 W, respectively.
Figure 9.15 shows that all trials yielded a similar profile of H2O2 consumption and total dissolved iron
concentration. To reach a photo-treated leachate with a DOC value of 250 mg/L, in the experiments 9,
12 and 13, it was consumed, respectively: (i) 15.7, 13.2 and 15.9 kJ/L of accumulated UV energy; (ii)
105, 106 and 115 mM of H2O2; and (iii) 25.9, 27.3 and 24.5 mg of H2O2 per 1 mg of oxidized DOC.
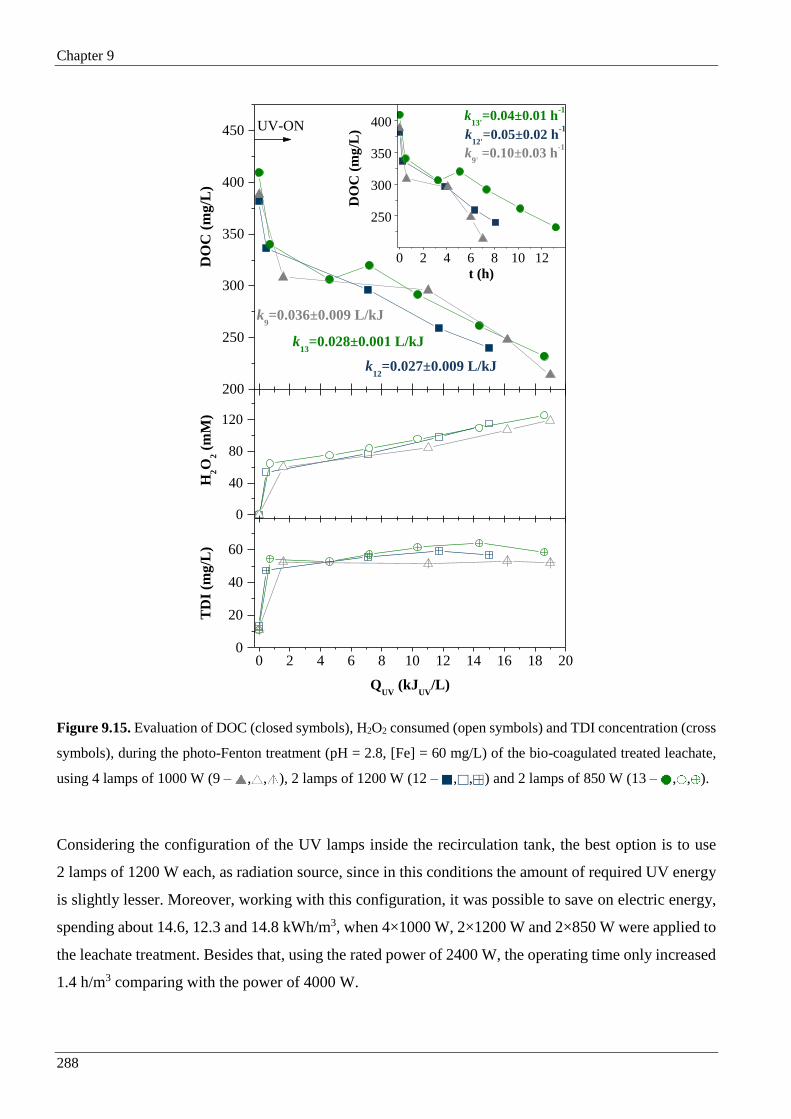
Chapter 9
288
Figure 9.15. Evaluation of DOC (closed symbols), H2O2 consumed (open symbols) and TDI concentration (cross
symbols), during the photo-Fenton treatment (pH = 2.8, [Fe] = 60 mg/L) of the bio-coagulated treated leachate,
using 4 lamps of 1000 W (9 – , , ), 2 lamps of 1200 W (12 – , , ) and 2 lamps of 850 W (13 – , , ).
Considering the configuration of the UV lamps inside the recirculation tank, the best option is to use
2 lamps of 1200 W each, as radiation source, since in this conditions the amount of required UV energy
is slightly lesser. Moreover, working with this configuration, it was possible to save on electric energy,
spending about 14.6, 12.3 and 14.8 kWh/m3, when 4×1000 W, 2×1200 W and 2×850 W were applied to
the leachate treatment. Besides that, using the rated power of 2400 W, the operating time only increased
1.4 h/m3 comparing with the power of 4000 W.
0 2 4 6 8 10 12 14 16 18 200
20
40
60
TD
I (m
g/L
)
QUV
(kJUV
/L)
200
250
300
350
400
450
k13
=0.028±0.001 L/kJ
k12
=0.027±0.009 L/kJ
k9=0.036±0.009 L/kJ
DO
C (
mg
/L)
UV-ON
0
40
80
120
H2O
2 (
mM
)
0 2 4 6 8 10 12
250
300
350
400k
12'=0.05±0.02 h
-1
k13'
=0.04±0.01 h-1
k9' =0.10±0.03 h
-1
DO
C (
mg
/L)
t (h)

Chapter 9
289
Figure 9.16 illustrates the mineralization values obtained in all the multi-stage treatment steps: (i) aerobic
biological oxidation (RB); physico-chemical process (CT); and (iii) photo-Fenton reaction (RT). The
DOC values of the initial leachate and at the end of each step are also presented. The removal percentages
obtained in each treatment stage were determined relatively to the initial DOC.
Figure 9.16. Evolution of DOC removal in the biological, coagulation/sedimentation and photo-oxidation
processes, as well as the initial and final DOC of each stage.
Comparing the organic matter removal efficiency in each treatment process, disregarding for this
purpose the tests 5 and 6, since the coagulation step was not performed, it appears that the highest
percentage was reached in the coagulation step, being the average value equivalent to 51%, followed by
the photo-treatment stage, with an average mineralization of about 20%, consuming 143 mM of H2O2
and 21.5 kJ/L of accumulated UV energy to achieve a DOC of 219 mg/L, and finally the biological
oxidation with 12%. As final remark one can say that this treatment strategy is able to remove more than
80% of the organic matter present in the sanitary landfill leachate, obtaining at the end a biodegradable
effluent, able to be oxidised in a final biological process, in order to fulfil the discharge limits imposed
by the Portuguese legislation.
1 2 3 4 5 6 7 8 9 10 11 12 13 14 15
Series4 11.9 16.4 11.8 15.7 33.0 38.3 23.8 14.9 17.8 14.0 19.9 19.3 18.5 23.4 17.4
%Rem.RB 23.5 12.2 23.5 5.5 5.7 13.0 0.8 7.2 15.0 9.9 4.5 18.3 10.3 14.7 15.2
%Rem.CT 46.0 46.8 47.4 59.0 29.7 15.5 41.9 54.8 53.9 59.6 42.1 50.9 57.0 50.7 49.4
%Rem.RT 18.6 24.6 17.3 19.8 31.6 33.2 33.4 23.1 13.3 16.4 33.4 11.4 14.2 11.1 18.1
DOCi 1495 1357 1495 1228 1325 1358 1226 1329 1244 1228 1148 1243 1254 1220 1181
DOC_BR 1144 1191 1144 1160 1250 1181 1216 1233 1058 1106 1096 1015 1125 1041 1002
DOC_CT 456 556 435 436 856 971 702 505 388 374 613 382 410 422 419
DOC_RT 178 222 176 193 437 520 292 198 222 172 229 240 232 286 205
0
200
400
600
800
1000
1200
1400
1600
0
10
20
30
40
50
60
70
80
90
100
DO
C (
mg
/L)
DO
C R
emo
va
l (%
)
Test

Chapter 9
290
9.3.4 Biodegradability assessment
Taking into account the tests presented until now, in order to obtain a leachate with a DOC value of
approximately 250 mg/L, the best treatment strategy combines (Figure 9.17): (i) a biological aerobic
oxidation process, in order to remove the biodegradable organic fraction and alkalinity, and promote the
conversion of NH4+ into NO2
-; (ii) followed by a coagulation step, with 240 mg Fe3+/L at pH 4.2 and
sedimentation period of 14 hours; and (iii) a photo-Fenton reaction, using solar light together with
artificial radiation, emitted by 2 UV-Vis lamps of 1200 W. In order to define the optimal photo-treatment
time to reach a biodegradable effluent that can be further biologically oxidized, a Zahn-Wellens test was
performed for different photo-oxidised samples of experiment 15, which was carried out using the
treatment strategy reported above.
Figure 9.17. Evolution of DOC and nitrogen content (NH4+-N - , NO2
--N - and NO3--N - ) along all
stages of the multi-treatment process, as a function of time, for the experiment in the best conditions.
Throughout this trial, the biological oxidation was the step with higher treatment time (about 43 h/m3),
while the photo-treatment was the one with lesser (c.a. 3.2 h/m3). In the biological process (VSS = 5.47
g/L, Tm = 15.3 ºC), it was achieve a final pH value of 6.8, a DOC of 1002 mg/L and an alkalinity and
ammonium nitrogen of 0.2 g CaCO3/L and 68 mg NH4+-N/L, respectively, with a very low nitrification
reaction rate of 0.78 mg NH4+-N/(h.g VSS), consuming about 11 mg CaCO3/mg NH4
+-N. Along this
stage, the SVI value was 128 mL/g, suggesting a poor sludge settling, since according to Metcalf and
Eddy [18], for a good biomass sedimentation, SVI values below 100 mL/g are desired. The weak
settleability could have been caused by the high sludge age, which tends to be raised in sequencing batch
0 24 48 72 96 120
0
200
400
600
800
1000
1200
NO3
--N
NO2
--N
Nit
rogen
con
ten
t (m
g N
/L)
NH4
+-N
126 129 132 135 138
Time (hours)
140 141 142 143 144 145
0
200
400
600
800
1000
1200Photo-OxidationCoagulation/SedimentationBiological Oxidation
D
OC
(m
g/L
)

Chapter 9
291
systems, as well as by the very low food to microorganism ratio (F/M) [19], which was only 0.01 g
BOD5 per 1 g of VSS per day. In the coagulation/sedimentation step, 58% of the organic matter fed to
the coagulation tank was removed. The final clarified leachate presented a DOC of 419 mg/L, a sulphate
ion concentration equal to 900 mg/L, a TSS content of 40 mg/L and pH value equal to 4.2. The
photo-oxidation stage was carried out with an average temperature, pH and iron concentration of 22.6 ºC,
2.8 and 49.5 mg/L, respectively (see Table 9.4 and Figure 9.18).
Figure 9.18. Evaluation of DOC ( ), H2O2 consumed ( ), TDI concentration ( ), TSS content ( ), QUV ( ),
pH ( ) and temperature ( ), as a function of accumulated UV energy and H2O2 consumed during the
photo-oxidation of the bio-coag-treated leachate.
During the initial period of the photo-Fenton reaction it was observed: (i) a decrease in the DOC value
of 93 mg/L and consequent increase of the total suspended solids of 360 mg/L (0<QUV<0.48 kJ/L), as a
result of ferrous sulphate and H2O2 addition, leading to the precipitation of ferric ions with the organic
matter which was not removed during the coagulation step; (ii) afterwards an increase of the total
dissolved iron concentration and decrease of the TSS content, most likely due to dissolution of the iron
precipitate as a result of the release of hydrogen ions from the reaction of H2O2 with nitrous acid, but
also due to the attack of the hydroxyl radicals generated through the decomposition of the H2O2 by the
UV-C radiation, until 1.46 kJ/L of accumulated UV energy; (iii) depletion of 60% of the total amount
of H2O2 required for the reaction up to 1.46 kJ/L, associated with the total conversion of nitrites into
nitrates, followed by a slow H2O2 consumption rate and stabilization of solution pH (see Figure 9.17);
(iv) DOC slight increase until 3.3 kJ/L of accumulated UV energy, suggesting that the initially
200
250
300
350
400
450
0 2 4 6 8 10 122.4
2.8
3.2
3.6
4.0
0 20 40 60 80 100 1200
5
10
15
20
25
DO
C (
mg
/L)
0
10
20
30
40
50
60
TSS (mg/L)TDI (mg/L)
0
70
140
210
280
350
420
200
250
300
350
400
450
DO
C (
mg
/L)
0
20
40
60
80
100
120
140
H2O
2 c
on
sum
ed (
mM
)
0
2
4
6
8
10
12
14
QU
V (
kJ
/L)
pH
QUV
(kJ/L)
0
5
10
15
20
25
T (ºC)
H2O
2 consumed (mM)
2.4
2.8
3.2
3.6
4.0
pH
Chapter 9
292
precipitated organic material was redissolved and during that period the complex organic molecules
were only broken down into simpler ones, still not occurring their complete mineralization into H2O and
CO2.
Given the results obtained along this trial period, and not being possible to perform a final biological
treatment, it became necessary to determine the optimum photo-treatment time, where a biodegradable
and non-toxic effluent would be obtained, and a downstream biological oxidation would allow to reach
a COD value lesser than 150 mg O2/L. To do this, a Zahn-Wellens test was applied to the samples
collected along the experiment 15. Besides the Zahn-Wellens test, it was also evaluated the absorbance
at 254 nm (Abs254), the average oxidation state (AOS) and the carbon oxidation state (COS). The two
last parameters are calculated from DOC and COD, according to equations (9.8) and (9.9), and indicate
the oxidation degree and the efficiency of the oxidative process. While AOS only considers the organic
matter in solution, the COS also considers the CO2 generated by mineralization.
AOS = 4 - 1.5COD
DOC (9.8)
COS = 4 - 1.5COD
DOC0
(9.9)
where DOC is the dissolved organic carbon at the sampling time t (mg C/L), DOC0 is the dissolved
organic carbon (mg C/L) at the beginning of the photo-Fenton reaction (QUV = 0 kJ/L) and the COD is
the chemical oxygen demand at the sampling time t (mg O2/L).
Figure 9.19 shows that as the H2O2 consumption increases, the values of DOC, COD and Abs254
decrease, following a similar tendency, indicating that during the treatment the most complex
compounds were degraded into simpler ones until CO2, H2O and mineral acids. The AOS values
increased initially until 60 mM of H2O2 consumed, indicating the formation of more oxidised
intermediary compounds. Regarding the COS behaviour, it can be seen an increase from +0.65,
indicating the presence of rather oxidised compounds, to +3.4, which means strong mineralization and
generation of highly oxidised intermediates.
Figure 9.20 shows the low-molecular-weight carboxylate anions (LMCA) detected along the oxidation
reaction period, as well as the fraction of dissolved organic carbon related to the identified carboxylic
acids.

Chapter 9
293
Figure 9.19. Progress of the DOC (), COD (), AOS (), COS () and Abs254 (), as a function of the
H2O2 consumed, along experiment 15.
Figure 9.20. Evolution of low-molecular-weight carboxylate anions (LMCA) concentration and LMCA/DOC
ratio, along experiment 15.
0 20 40 60 80 100 1200
100
200
300
400
1000
1100
COD CQO EMO EOC Abs (254 nm)
H2O
2 consumed (mM)
DO
C (
mg/L
)
0.0
0.5
1.0
1.5
2.0
2.5
3.0
3.5
AO
S;
CO
S
0.0
0.1
0.2
0.3
0.4
0.9
1.0
Ab
s 254 (
dil
ute
d 1
:25)
0
200
400
600
800
1000
3500
4000
4500 C
OD
(m
g/L
)
UV-ON
0
5
10
15
20
25
30
35
40
0
20
40
60
80
100
120
BR16.0 0 29 59 76 83 106 127
LM
CA
/DO
C (
%)
LM
CA
(m
g C
/L)
H2O2 consumed (mM)
Formate
Pyruvate
Valerate
Oxalate
Propionate
LMCA/DOC

Chapter 9
294
Initially few LMCA were detected, and throughout the oxidation process higher amounts of LMCA were
generated, particularly after 59 mM of H2O2 consumed, the point where the H2O2 started to be consumed
for the reaction itself and not for the indirect conversion of the nitrite into nitrate. The LMCA
concentration increased until 106 mM of H2O2 consumed, which is in accordance with the pH profile
(see Figure 9.18), where a slight decrease of the pH value can be observed. After 106 mM of H2O2
consumed, the amount of LMCA started to decrease, as a consequence of LMCA oxidation into CO2,
H2O and mineral acids. The tendency of the LMCA concentration together with the increment of
LMCA/DOC ratio along the oxidation period, suggests the breakdown of recalcitrant macromolecules
into short-chain carboxylic acids, and the consequent enhancement of the leachate biodegradability.
Regarding the proper assessment of the leachate biodegradability, the Zahn-Wellens test was performed
for each oxidized sample taken throughout the experiment 15. Figure 9.21 shows that the bio (BR15.0)
or bio-coag-treated (CT15F) leachate presents low biodegradability (≈ 15%). During the photo-oxidation
process a high enhancement of the leachate biodegradability was observed, achieving values higher than
70%. For the sample corresponding to 106 mM of H2O2 consumed, it was obtained a biodegradability
percentage of 59% and a final COD value lower than 150 mg O2/L (see Figure 9.22), at the end of the
Zahn-Wellens test (28 days), which is the discharge limit value imposed by the Portuguese legislation
(Decree-Law no. 236/98).
Figure 9.21. Zahn-Wellens test results for samples collected along experiment 15: Reference ( ); BR15.0 ( );
CT15F ( ); 29 ( ), 59 ( ), 76 ( ), 83 ( ), 106 ( ) and 127 ( ) mM of H2O2 consumed.
0 4 8 12 16 20 24 28
0
10
20
30
40
50
60
70
80
90
100
Dt (
%)
Time (days)
Reference
BR16.0
H2O
2 consumed (mM):
0
29
59
76
83
106
127

Chapter 9
295
Figure 9.22. Evaluation of DOC and COD at day 0 and 28 of the Zahn-Wellens test and percentage of
biodegradability at day 28.
According to results presented previously, the chemical oxidation process of a leachate with a DOC of
419 mg/L, after biological and coagulation/sedimentation pre-treatments, can be stopped after the
consumption of 106 mM of H2O2 and 7.4 kJ/L of accumulated UV energy, achieving an effluent with
DOC = 304 mg/L (27.5% of mineralization), and COD = 114 mg O2/L after a downstream biological
treatment.
In the hypothesis of the discharge of the treated leachate into sewerage systems, the final COD would
have to be lesser than 1000 mg O2/L, being the final biological treatment performed in the municipal
wastewater treatment plant. In this case, considering the results aforesaid, for an effluent with a DOC
approximately equal to 420 mg/L after a physical-chemical treatment process, it can be inferred that the
optimum photo-treatment time is achieved for 76 mM of H2O2 consumed and 1.5 kJ/L of accumulated
UV energy, obtaining a mineralization of 21% and a COD of 955 mg O2/L (see COD at day 0 in Figure
9.22).
BR15.0 0 29 59 76 83 106 127
COD (day 0) 3353 1381 1211 1132 955 741 540 338
COD (day 28) 2262 993 809 633 354 363 114 81
DOC (day 0) 1002 425 386 381 340 340 285 196
DOC (day 28) 790 354 322 291 182 174 104 53
Dt (day 28) 15.2 15.1 17.6 24.7 42.7 42.1 59.4 73.0
0
10
20
30
40
50
60
70
80
0
500
1000
1500
2000
2500
3000
3500
Dt(%
)
DO
C;
CO
D (
mg
/L)
H2O2 consumed (mM)
Optimum

Chapter 9
296
9.3.5 Economic analysis
In this sub-section, the scale-up and cost estimation for the photo-Fenton process will be presented,
based on the results obtained in the preceding sub-chapter, targeting a final wastewater with a COD of
150 or 1000 mg O2/L, according to Portuguese discharge regulations into water bodies and sewerage
systems, respectively. The overall costs were computed: (i) considering the solar/UV facilities, project’s
contingencies, system engineering and assembly, spare parts, personnel, maintenance material, electric
and chemicals supplies; and (ii) not bearing in mind the costs related to biological or physical-chemical
treatments, excepting the chemicals. This study was especially based on the book of Gálvez and
Rodríguez [37], as previously presented in the Chapter 6 (following the same formulas and steps).
First of all, it was necessary to set some project variables which underpinned the design of a facility
capable of treating 100 m3 of leachate per day, since it was the average daily flow of effluent generated
in the sanitary landfill. Table 9.5 shows the main process operation variables required for the scale-up
and economical assessment of a photo-oxidation plant prepared to treat an effluent from a biological and
a coagulation/sedimentation process, with a DOC of about 420 mg/L (experiment 15), followed by: (i)
a biological treatment able to oxidize the effluent up to the established limits for discharge into water
bodies (COD < 150 mg O2/L); or (ii) direct discharge into a municipal sewerage system (COD < 1000
mg O2/L).
Taking into account the two COD targets and the leachate characteristics, the total collectors area
required for the treatment of 100 m3/day is 1500 and 295 m2, respectively. Comparing the CPCs areas
obtained in this Chapter with those ones reported in Chapter 6, even for the optimal conditions, it can be
inferred that the implementation of the biological and coagulation/sedimentation pre-treatments,
substantially decreased (67% and 89%, for a target COD of 150 and 1000 mg O2/L, respectively) the
land area required, turning more feasible the use of the natural sunlight.
The capacity that the CPCs system has to treat a certain charge of organic matter (Δm = (DOCi – DOCf)
× Vy) or a determined volume of contaminated water (Vy) per unit of time and surface of solar collectors
(ACPC) can be estimated through the mass and volumetric treatment factors (Tfm and Tfv), respectively.
Considering the conditions of experiment 15, it was obtained a Tfm and a Tfv of 0.63 g C/h/m2 and 5.5
L/h/m2, respectively, to reach a final COD below 150 mg O2/L, after a subsequent biological oxidation,
and 2.4 g C/h/m2 and 28 L/h/m2, respectively, to achieve a final COD of 1000 mg O2/L.

Chapter 9
297
Table 9.5. Operation data for the treatment of 100 m3 per day of sanitary landfill leachate.
Parameter Target COD (mg O2/L)
150 1000
Initial-final DOCa (mg C/L) 419 - 304 419 - 332
H2O2 consumeda (mM) 106 76
Average operating temperature – Tma (ºC) 20.6 11.3
Accumulated UV energy – QUVa (kJUV/L) 7.4 1.5
Daily flow – Qd (m3/day) 100 100
Yearly volume - Vyb (m3) 36500 36500
Yearly average global UV irradiation - Imc (W/m2) 17 17
Total yearly hours of insolation – tinsc (h) 2944 2944
Yearly accumulated UV energy – Eyd (kJUV/m2) 180809 180809
Area of required CPCs – ACPCe (m2) 1500 295
Mass treatment factor – Tfmf (g C/h/m2) 0.63 2.4
Volumetric treatment factor – Tfvg (L/h/m2) 5.5 28
Land area required for CPCs implementation – ALand (m2) 5876 1214
Number of solar photons per unit of time and potency [37] - NPS
(photons/W/h) 5.8x10²¹ 5.8x10²¹
Number of UV photons required – NUVh (photons) 4.4x1029 8.6x1028
aData obtained from experiment 15;bVy=365.Qd; cRadiation annual data presented in the Chapter 6; dEy=3.6×Im×tins;
eACPC= QUV × Vy × 1000 Ey⁄ ; fTfm= (DOCi-DOCf)×Vy (tins×ACPC)⁄ ; gTfv= Vy (tins×ACPC)⁄ ; hNUV=NPS×Im×tins×A.
Table 9.6 and Figure 9.23 present the annual costs associated with the chemicals needs, based on the
reagents consumption obtained in experiment 15. For both scenarios, the cost associated with the first
biological oxidation was not considered, once it was assumed that the leachate alkalinity was enough to
achieve the complete conversion of ammonium into nitrites. The hydrochloric acid and methanol costs
were determined taking into account the nitrogen content at the end of the photo-Fenton reaction (exp.
15), to be removed in the final biological oxidation step (1.2 mg HCl/mg N and 2.4 mg CH3OH/mg N,
respectively).
The cost with the reagents for the phototreatment stage are the most representative, corresponding to
62% or 81% of the total yearly costs, targeting a COD value lower than 150 or 1000 mg O2/L,
respectively. Beyond that, the contribution of H2O2 is about 55% or 68% of the total yearly costs,
respectively. It should be underlined that the cost related to H2O2 can still be diminished in about 50%,
if the complete nitrification (NH4+ →NO2
- → NO3-) occurs in the first biological treatment.
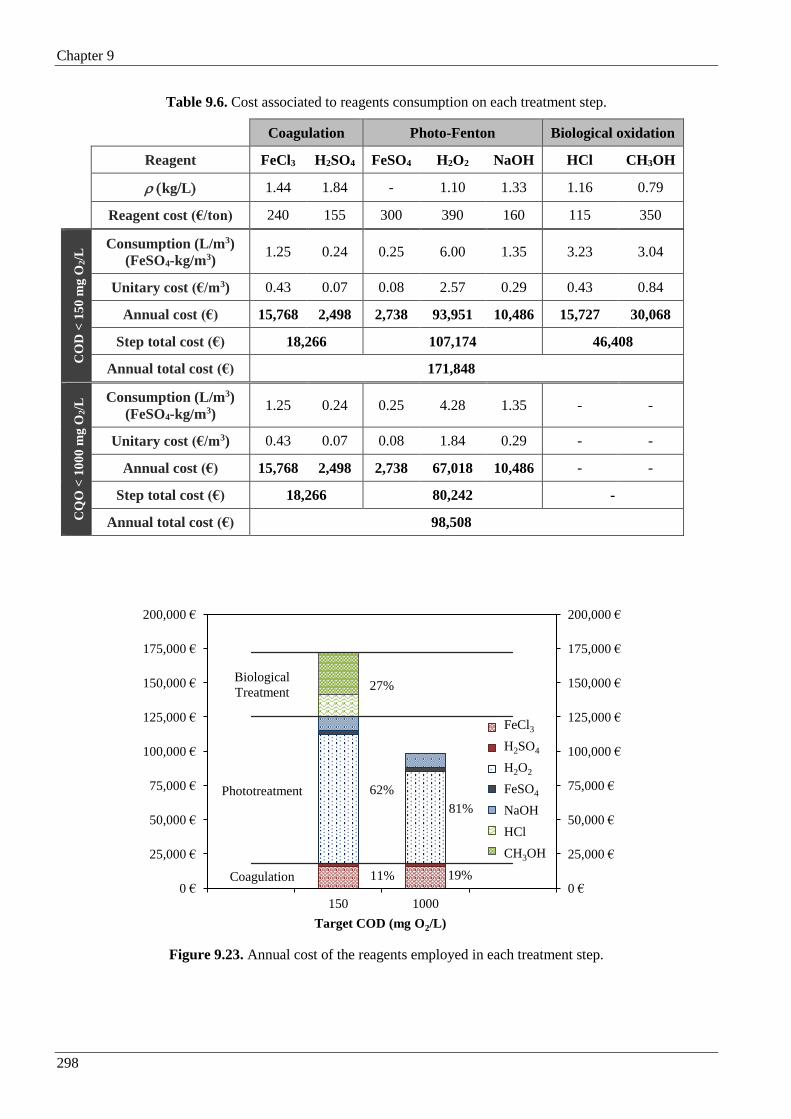
Chapter 9
298
Table 9.6. Cost associated to reagents consumption on each treatment step.
Coagulation Photo-Fenton Biological oxidation
Reagent FeCl3 H2SO4 FeSO4 H2O2 NaOH HCl CH3OH
kgL 1.44 1.84 - 1.10 1.33 1.16 0.79
Reagent cost (€/ton) 240 155 300 390 160 115 350
CO
D <
15
0 m
g O
2/L
Consumption (L/m3)
(FeSO4-kg/m3) 1.25 0.24 0.25 6.00 1.35 3.23 3.04
Unitary cost (€/m3) 0.43 0.07 0.08 2.57 0.29 0.43 0.84
Annual cost (€) 15,768 2,498 2,738 93,951 10,486 15,727 30,068
Step total cost (€) 18,266 107,174 46,408
Annual total cost (€) 171,848
CQ
O <
10
00
mg O
2/L
Consumption (L/m3)
(FeSO4-kg/m3) 1.25 0.24 0.25 4.28 1.35 - -
Unitary cost (€/m3) 0.43 0.07 0.08 1.84 0.29 - -
Annual cost (€) 15,768 2,498 2,738 67,018 10,486 - -
Step total cost (€) 18,266 80,242 -
Annual total cost (€) 98,508
Figure 9.23. Annual cost of the reagents employed in each treatment step.
0 €
25,000 €
50,000 €
75,000 €
100,000 €
125,000 €
150,000 €
175,000 €
200,000 €
0 €
25,000 €
50,000 €
75,000 €
100,000 €
125,000 €
150,000 €
175,000 €
200,000 €
0 150 1000 0
FeCl3
H2SO4
H2O2
FeSO4
NaOH
HCl
CH3OH
Biological
Treatment
Coagulation
Phototreatment
Target COD (mg O2/L)
FeCl3
H2SO4
H2O2
FeSO4
NaOH
HCl
CH3OH
19%
81%
11%
62%
27%

Chapter 9
299
Two of the primordial aims of the leachate treatment strategy presented in this chapter was (i) to remove
the alkalinity from the landfill leachate and, (ii) to diminish the amount of suspended solids, as well as
other light absorbing species, using the biological and coagulation/sedimentation pre-treatment steps.
This way the amount of acid required to acidify the effluent until 2.8, as well the concentration of H2O2
required for the photo-Fenton reaction, would be lesser, and consequently the associated costs.
Comparing these results with the ones obtained in the Chapter 6 for the optimal conditions, it can be
said that the objectives of the present multistage treatment were fully achieved, decreasing 3.4 times the
total annual expenses with H2SO4, while the yearly cost associated to the H2O2 was reduced by about
1.9 and 1.2 times, for a target COD of 150 and 1000 mg O2/L, respectively. Considering the costs
associated with coagulation/sedimentation and photo-Fenton oxidation steps, since no reactants are
required in the first biological process, 37% savings in the chemicals costs was still reached, compared
with the photo-Fenton reaction (in optimal conditions) without pre-treatments, in order to attain a COD
value of 150 mg O2/L.
Table 9.7 presents the financial-economic assessment of the phototreatment of 100 m3/day of the bio-
coag-treated leachate, according to the operating conditions of test 15, aiming a final effluent with COD
values lower than 150 and 1000 mg O2/L, based on three different setups to take advantage of the UV
radiation: (i) natural UV photons capture through CPCs technology; (ii) artificial UV photons emitted
by UV lamps; and (iii) combination of natural and artificial radiation, employing CPCs and UV lamps,
in accordance with the UV radiation energetic needs along the year.
Looking at all photocatalytic setups studied, it is notorious that the highest annual expense is related to
the reactants consumption, representing in average 60% and 64% of the total yearly cost, aiming a COD
lower than 150 and 1000 mg O2/L, respectively, even neglecting the costs of the reactants used in the
final biological oxidation. If the hydrochloric acid and methanol addition is taken into consideration, in
the case where a COD lower than 150 mg O2/L is the target requisite, the contribution of the chemicals
increases to 68%, being the total unitary cost approximately equal to 7 €/m3. It should also be noted that
the amount spent just with H2O2 consumption corresponds to about 44% of the total yearly cost.
However, as previously mentioned, this expenditure can be reduced by about 50%, if in the first
biological oxidation all ammonium nitrogen was converted into nitrate. Thus, the unitary cost to treat a
leachate, in the same conditions than the ones used in experiment 15, would become about 4 €/m3.

Chapter 9
300
Table 9.7. Yearly cost associated to the leachate phototreatment using CPCs technology and/or UV-Vis lamps (4 kW, 20,000 hours of useful lifetime), considering
the operability conditions of the test 15, in order to obtain a COD below 150 and 1000 mg O2/L.
Target COD (mg O2/L)
CPCs Lamps CPCs and Lamps
150 1000 150 1000 150 1000
Direct Cost
Principal Equipment:
Collectors area 1500 295 0 0 957 188
A – Total collector cost 255,269 € 60,109 € 0 € 0 € 170,139 € 44,389 €
Number of lamps (NL) 0 0 38 8 30 6
B – Lamp, Ballast and accessories (500NL) 0 € 0 € 19,000 € 4,000 € 15,000 € 3,000 €
C – Lamp reactor cost (100NL) 0 € 0 € 3,800 € 800 € 3,000 € 600 €
Principal Equipment Total Cost (PETC = A + B + C) 255,269 € 60,109 € 22,800 € 4,800 € 188,139 € 47,989 €
D – Pimping and tanks (8% of PETC)a 20,422 €a 20,422 €d 20,422 €e 20,422 €e 15,051 €a 15,051 €d
E – Auxiliary equipment and controls (10% of PETC)a 25,527 €b 25,527 €d 25,527 €e 25,527 €e 18,814 €b 18,814 €d
F – Others (15% of PETC)a 38,290 €c 38,290 €d 38,290 €e 38,290 €e 28,221 €c 28,221 €d
Total Direct Cost (TDC = PETC + D + E + F) 339,508 € 144,348 € 107,039 € 89,039 € 250,225 € 110,075 €
Indirect Cost
G – Contingencies (12% of TDC) 40,741 € 17,322 € 12,845 € 10,685 € 30,027 € 13,209 €
H – Spare parts (1% of TDC) 3,395 € 1,443 € 1,070 € 890 € 2,502 € 1,101 €
Total Capital Required (TCR = TDC + G + H) 383,644 € 163,113 € 120,954 € 100,614 € 282,754 € 124,385 €
Yearly Cost
I – Capital (12%f of TCR, 20 years) 46,037 € 19,574 € 14,514 € 12,074 € 33,930 € 14,926 €
J – Consumables 125,461 € 98,508 € 125,461 € 98,508 € 125,461 € 98,508 €
K – Operation and maintenanceg 36,000 € 36,000 € 36,000 € 36,000 € 36,000 € 36,000 €
L – Electricity cost (0.10 €/kWh)h 0 € 0 € 33,288 € 7,008 € 11,952 € 2,479 €
M – Lamp replacement (CR = (500+7.2) i × NL× tLOj/tLL
k)h 0 € 0 € 2,110 € 444 € 747 € 155 €
Total Yearly Cost (TYC = I + J + K + L + M + N) 207,498 € 154,082 € 211,374 € 154,034 € 208,101 € 152,071 €
Unitary Cost (UC = TYC/Vy) 5.68 €/m3 4.22 €/m3 5.79 €/m3 4.22 €/m3 5.70 €/m3 4.17 €/m3
a8% of PETC; b10% of PETC; c15% of PETC; dThe cost associated to the rubrics D, E and F was considered equal to that determined for the target COD of 150 mg O2/L.; eThe
expense concerning D, E and F was regarded as identical to that computed when CPCs are exclusively used; fFixed charge rate (FCR), for 20-year plant depreciation; gThis rubric
includes the expenses with personal and electric power, except the one consumed by the lamps; hThese amounts change monthly according with needs of UV-Vis lamps number
expressed on Table 9.8, when the CPCs technology is combined with UV-Vis lamps; iCost of 1-lamp plus labour cost with the replacement of 1-lamp; jLamp operation time; kLamp
lifetime.

Chapter 9
301
The cost of CPCs was calculated as a function of their area, according to the power regressions presented
in the Figure 9.24. This values were provided three years ago by the Portuguese Company Ao Sol
Energias Renováveis, Lda (CPCs patent holders), which no longer exists.
Figure 9.24. Estimative of the CPCs unitary cost as a function of their area, through a power regression used for
the calculation of the total expense with CPCs, targeting a COD of 1000 (a) and 150 (b) mg O2/L.
As regards the cost associated to secondary equipment (rubrics D, E and F of the Table 9.7), it was
estimated that: (i) for COD < 1000 mg O2/L, its value would be equal to the one obtained for the
COD < 150 mg O2/L, since the effluent volume to treat is the same in both cases. The main change is
the required CPCs area, which in the first case is much lesser (about 80 %), because less accumulated
UV energy is needed (1.5 face to 7.4 kJ/L) to reach the goal; and (ii) when UV lamps are only applied
during the phototreatment, the value would be equal to the one found in the case where CPCs are
uniquely used, since the comparison amongst the solar photons collection and the electric photons
generation is only affected by the photocatalytic reaction system, being the remaining components very
analogous as concerns cost and design [37]. For a solar energy system is necessary to include the
expenses derived from the solar photons collection. On the other hand, for a system based on UV lamps,
additionally to the electrical installation, it is necessary to include the expenses with electricity and
replacement of the lamps (rubrics L, M and N).
The total cost with the leachate treatment through the use of artificial radiation can change according
with the number of daily working hours of the lamps, because the number of required lamps is calculated
as a function of the operating time (see Eqs. (6.5) and (6.6) from Chapter 6). The costs presented in
Table 9.7 for the case where only UV lamps are applied were computed estimating that the UV lamps
would work during 6-hours per day, since less hours increase the total unitary cost and more hours don’t
affect this cost, as can be seen in Figure 9.25. In the case wherever UV lamps were combined with CPCs
technology, it was considered that the lamps would also work 6-hours per day.
C = 1,301.78A-0.33
R² = 0.991
180
200
220
240
260
280
300
320
340
0 100 200 300 400
CP
C u
nit
ary
co
st (
€/m
2)
Area (m2)
(a) 69 < A < 345 m2
C = 346.73A-0.097
R² = 0.991
150
160
170
180
190
200
0 1000 2000 3000 4000C
PC
un
ita
ry c
ost
(€
/m2)
Area (m2)
(b) 345 < A < 3448 m2
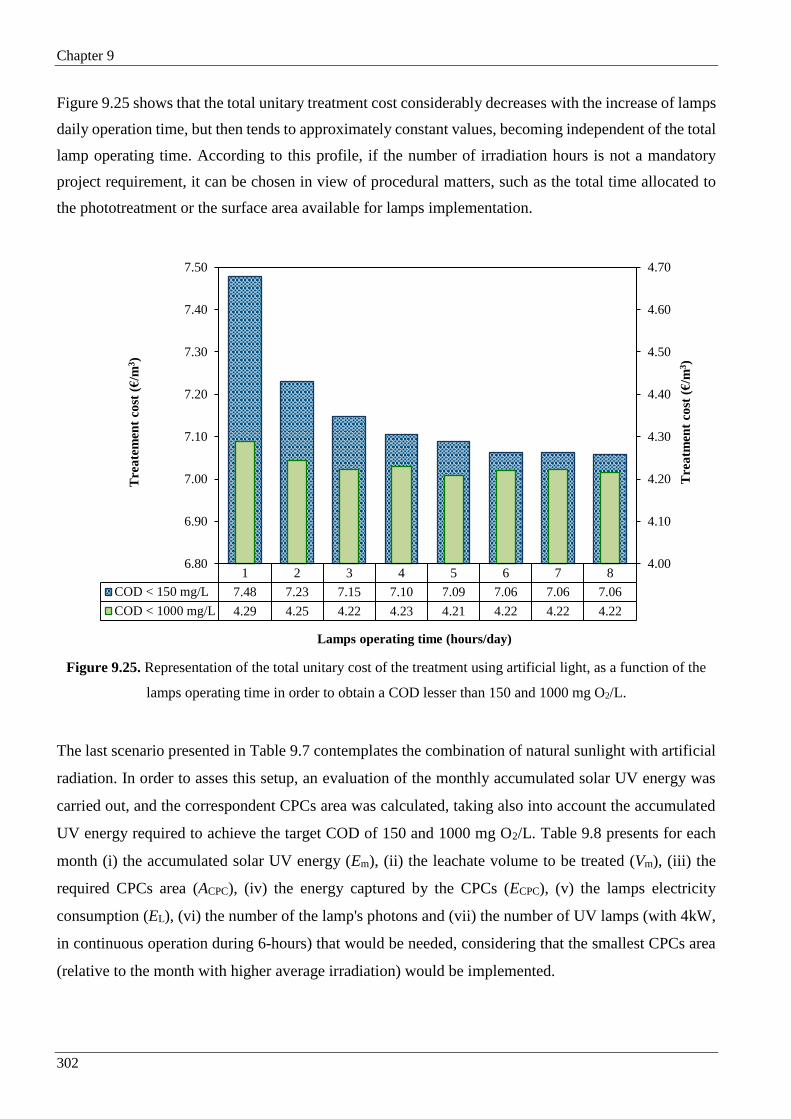
Chapter 9
302
Figure 9.25 shows that the total unitary treatment cost considerably decreases with the increase of lamps
daily operation time, but then tends to approximately constant values, becoming independent of the total
lamp operating time. According to this profile, if the number of irradiation hours is not a mandatory
project requirement, it can be chosen in view of procedural matters, such as the total time allocated to
the phototreatment or the surface area available for lamps implementation.
Figure 9.25. Representation of the total unitary cost of the treatment using artificial light, as a function of the
lamps operating time in order to obtain a COD lesser than 150 and 1000 mg O2/L.
The last scenario presented in Table 9.7 contemplates the combination of natural sunlight with artificial
radiation. In order to asses this setup, an evaluation of the monthly accumulated solar UV energy was
carried out, and the correspondent CPCs area was calculated, taking also into account the accumulated
UV energy required to achieve the target COD of 150 and 1000 mg O2/L. Table 9.8 presents for each
month (i) the accumulated solar UV energy (Em), (ii) the leachate volume to be treated (Vm), (iii) the
required CPCs area (ACPC), (iv) the energy captured by the CPCs (ECPC), (v) the lamps electricity
consumption (EL), (vi) the number of the lamp's photons and (vii) the number of UV lamps (with 4kW,
in continuous operation during 6-hours) that would be needed, considering that the smallest CPCs area
(relative to the month with higher average irradiation) would be implemented.
1 2 3 4 5 6 7 8
COD < 150 mg/L 7.48 7.23 7.15 7.10 7.09 7.06 7.06 7.06
COD < 1000 mg/L 4.29 4.25 4.22 4.23 4.21 4.22 4.22 4.22
4.00
4.10
4.20
4.30
4.40
4.50
4.60
4.70
6.80
6.90
7.00
7.10
7.20
7.30
7.40
7.50
Tre
atm
ent
cost
(€
/m3)
Tre
ate
men
t co
st (
€/m
3)
Lamps operating time (hours/day)

Chapter 9
303
Table 9.8. CPCs area and number of UV lamps required for all months of the year, targeting a final COD value
of 150 or 1000 mg O2/L.
Month Em
(kJ/m2)
Vm
(m3)
ACPC (m2) ECPC (kJ) EL (kJ) Lamp photons No. of Lamps
150* 1000* 150* 1000* 150* 1000* 150* 1000* 150* 1000*
Jan. 6597 3100 3492 686 6.3×10⁶ 1.2×10⁶ 1.7×10⁷ 3.3×10⁶ 2.7×1028 5.3×1027 28 6
Feb. 10194 2800 2041 401 9.8×10⁶ 1.9×10⁶ 1.1×10⁷ 2.2×10⁶ 1.8×1028 3.5×1027 20 4
Mar. 14226 3100 1619 318 1.4×10⁷ 2.7×10⁶ 9.4×10⁶ 1.9×10⁶ 1.5×1028 3.0×1027 16 3
Apr. 19774 3000 1127 222 1.9×10⁷ 3.7×10⁶ 3.4×10⁶ 6.6×10⁵ 5.4×1027 1.1×1027 6 1
May. 24078 3100 957 188 2.3×10⁷ 4.5×10⁶ 0 0 0 0 0 0
Jun. 17309 3000 1288 253 1.7×10⁷ 3.3×10⁶ 5.7×10⁶ 1.1×10⁵ 9.2×1027 1.8×1027 10 2
Jul. 20241 3100 1138 224 1.9×10⁷ 3.8×10⁶ 3.7×10⁶ 7.2×10⁵ 5.9×1027 1.2×1027 6 2
Aug. 20554 3100 1121 220 2.0×10⁷ 3.9×10⁶ 3.4×10⁶ 6.6×10⁵ 5.4×1027 1.1×1027 4 1
Set. 19971 3000 1116 219 1.9×10⁷ 3.8×10⁶ 3.2×10⁶ 6.3×10⁵ 5.1×1027 1.0×1027 4 1
Oct. 13995 3100 1646 323 1.3×10⁷ 2.6×10⁶ 9.6×10⁶ 1.9×10⁶ 1.6×1028 3.1×1027 16 3
Nov. 8648 3000 2578 506 8.3×10⁶ 1.6×10⁶ 1.4×10⁷ 2.8×10⁶ 2.3×1028 4.4×1027 24 5
Dec. 5456 3100 4221 829 5.2×10⁶ 1.0×10⁶ 1.8×10⁷ 3.5×10⁶ 2.9×1028 5.6×1027 30 6
*COD targets expressed in mg O2/L.
According to the irradiation profile and reaction energetic needs, the minimum CPCs area was obtained
in May, being equivalent to 957 and 188 m2, aiming COD values lesser than 150 and 1000 mg O2/L,
respectively. Assuming that the CPCs with this surface area would be installed, UV lamps would not be
necessary in May. However, in December about 30 or 6 lamps (maximum value) would be required, in
order to compensate the lack of solar irradiation. This is a good option to reduce the electrical energy
costs with the lamps and the investment costs with the CPCs. Regarding this scenario (see Table 9.7),
the capital cost was computed considering the minimum CPCs area and the maximum number of UV
lamps, in order to fulfil all the energetic needs along the year. The annual operating costs with electricity
and lamps replacement were calculated by the sum of their parts in each month.
When the CPCs were the selected technology to benefit from UV radiation, the cost with initial
investment in tangible fixed capital is the highest, being the total capital required comprised between
163 and 384 thousand euros, amortizable during 20-years at 12% FCR. On the other hand, the use of
UV lamps to produce the UV photons resulted in higher operating costs, mostly due to the need of
additional electrical power, being the respective annual expenses comprised between 7 and 33 thousand
euros. Concerning a target COD of 1000 mg O2/L, the total yearly cost was practically the same, using
any of these two photocatalytic setups, and the total unitary cost was even equal, as can be seen in Table
9.7 and Figure 9.26. Aiming a target COD of 150 mg O2/L, the total cost was slightly lesser (1.8%) when
CPCs were envisioned.
Chapter 9
304
Nevertheless, it is important to remind that the CPCs-based facility was projected considering a yearly
average irradiation of 17 W/m2, which is not observed along all the year. For instance, in December, the
specific accumulated solar UV energy is around 5500 kJ/m2 (the lowest value found), so if it is decided
to treat each month all the leachate produced (3100 m3), up to a COD lesser than 150 mg O2/L, it would
be required 4221 m2 of CPCs, which corresponds to a land area around 16700 m2, the equivalent to
4 soccer fields. Alternatively, if it is decided to use the 1500 m2 of CPCs (c.a. 1.4 soccer fields) initially
designed, only 66% of the leachate would be treated from October to March, being necessary an extra
storage capacity of approximately 6300 m3. So, in order to minimize the utilization of artificial energy
resources and taking the maximum advantage of a renewable and sustainable source, the best
configuration is the combination of natural sunlight with UV-Vis lamps, thus ensuring the proper
performance of the phototreatment step along all the year.
The economic and financial study of the last scenario, where solar and artificial radiation were
combined, indeed showed that the investment and operating costs declined, namely: i) the total capital
required decreased by about 24-26%, compared with the situation where CPCs were exclusively
considered; and ii) the total cost associated to the UV-Vis lamps diminished 64-65%, assuming that only
artificial radiation would be applied. This assumption resulted in a total unitary cost of 5.70 €/m3 (almost
the same as the CPCs, which was the lowest), targeting a COD lesser than 150 mg O2/L, and 4.17 €/m3
when the target COD was 1000 mg O2/L, which was the lowest cost from all.
Finally, it is performed a comparison (see Figure 9.26) between the costs obtained from the experiments
reported in this Chapter with the optimum results achieved in Chapter 6, aiming the same goals and
considering the simulated scenarios under identical conditions. In both cases the best option seems to be
the combination of CPCs and UV-Vis lamps, leading to a lower unitary cost, considering the most
beneficial situation regarding the annual radiation trend in Portugal.
The pre-treatment of the leachate reduces on average the costs associated with the phototreatment step
by 49% and 39%, targeting a COD of 150 and 1000 mg O2/L, respectively. Thereby, the leachate
pre-treatment steps are of extremely importance, improving the efficiency of the photo-Fenton reaction
and decreasing the global treatment costs, making this treatment sequence very competitive for
implementation at industrial scale. According to the Portuguese Regulatory Institute for Water and
Wastes (IRAR, in Portuguese: Instituto Regulador de Águas e Resíduos), 80% of existing leachate
treatment plants doesn't fulfill the requisites originally planned in the project [38].
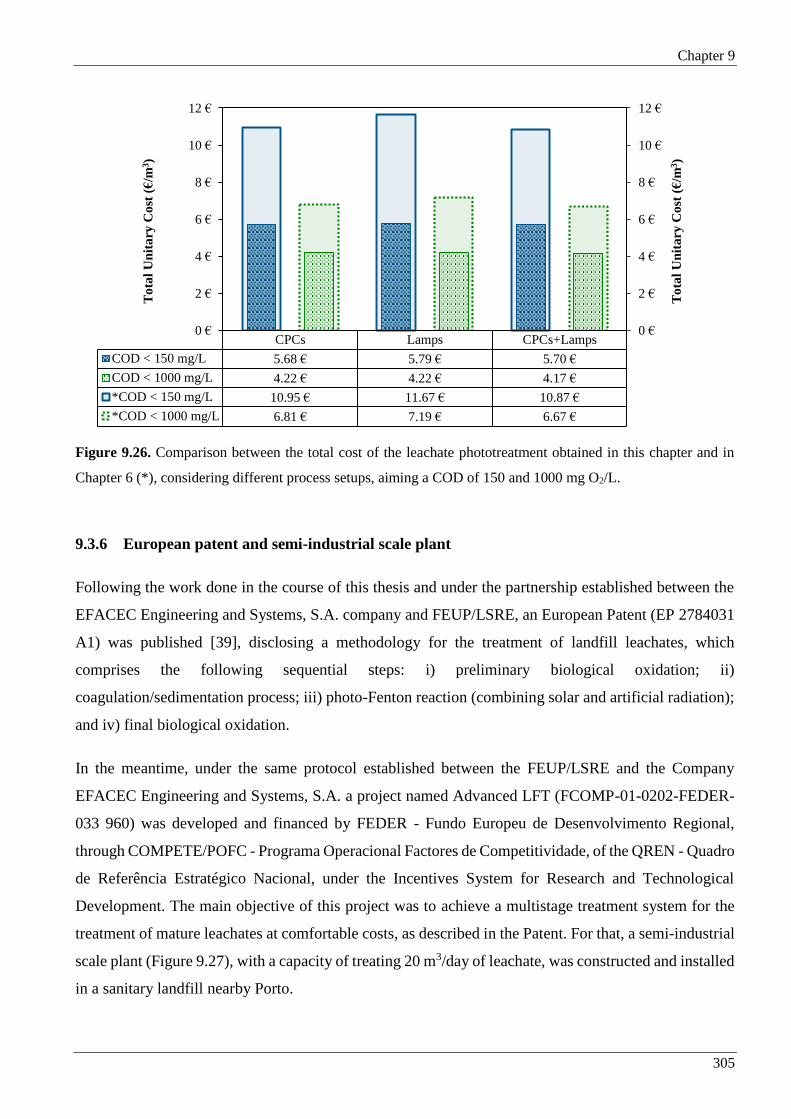
Chapter 9
305
Figure 9.26. Comparison between the total cost of the leachate phototreatment obtained in this chapter and in
Chapter 6 (*), considering different process setups, aiming a COD of 150 and 1000 mg O2/L.
9.3.6 European patent and semi-industrial scale plant
Following the work done in the course of this thesis and under the partnership established between the
EFACEC Engineering and Systems, S.A. company and FEUP/LSRE, an European Patent (EP 2784031
A1) was published [39], disclosing a methodology for the treatment of landfill leachates, which
comprises the following sequential steps: i) preliminary biological oxidation; ii)
coagulation/sedimentation process; iii) photo-Fenton reaction (combining solar and artificial radiation);
and iv) final biological oxidation.
In the meantime, under the same protocol established between the FEUP/LSRE and the Company
EFACEC Engineering and Systems, S.A. a project named Advanced LFT (FCOMP-01-0202-FEDER-
033 960) was developed and financed by FEDER - Fundo Europeu de Desenvolvimento Regional,
through COMPETE/POFC - Programa Operacional Factores de Competitividade, of the QREN - Quadro
de Referência Estratégico Nacional, under the Incentives System for Research and Technological
Development. The main objective of this project was to achieve a multistage treatment system for the
treatment of mature leachates at comfortable costs, as described in the Patent. For that, a semi-industrial
scale plant (Figure 9.27), with a capacity of treating 20 m3/day of leachate, was constructed and installed
in a sanitary landfill nearby Porto.
CPCs Lamps CPCs+Lamps
COD < 150 mg/L 5.68 € 5.79 € 5.70 €
COD < 1000 mg/L 4.22 € 4.22 € 4.17 €
*COD < 150 mg/L 10.95 € 11.67 € 10.87 €
*COD < 1000 mg/L 6.81 € 7.19 € 6.67 €
0 €
2 €
4 €
6 €
8 €
10 €
12 €
0 €
2 €
4 €
6 €
8 €
10 €
12 €
To
tal
Un
ita
ry C
ost
(€
/m3)
To
tal
Un
ita
ry C
ost
(€
/m3)

Chapter 9
306
Figure 9.27. Semi-industrial plant for the treatment of 20 m3/day of leachate, developed under the project
Advanced LFT.

Chapter 9
307
9.4 Conclusions
The leachate collected after the biological oxidation system of the LTP installed at the sanitary landfill,
object of this study, has an average biodegradable organic fraction of 11% (0.14 g C/L), being 71%
non-biodegradable organics (1.13 g C/L) attributed to humic substances. Beyond that, the leachate also
presents a high nitrogen content (1.3 g N/L), being 43 and 44% in the form of ammonium and nitrite,
respectively. Leachates are a high strength complex mixture and consequently an efficient and cost
effective universal solution capable of ensuring the environment resources protection has not been
found.
The present work presents a multistage treatment process adjustable to the characteristics of leachates
from urban sanitary landfills with its own ‘mix’ of toxic and recalcitrant chemical pollutants, as an
eco-efficient and cost effective technology, combining:
(i) Aerobic biological oxidation to achieve complete conversion of ammonia to nitrates, with
simultaneous removal of alkalinity and biodegradable organic carbon fraction;
During this phase, the biological reactor must operate in conditions that ensure complete nitrification
to nitrate, minimizing the H2O2 consumption in the subsequent photo-Fenton reaction and in the
alkalinity consumption, reaching a final pH value around 6.5. This minimizes the sulphuric acid
requirements for the acidification step of the photo-Fenton reaction, being able to achieve a final
treated leachate in agreement with the discharge limit for sulphate.
(ii) Physical-chemical process of coagulation/sedimentation with ferric chloride
(240 mg Fe3+/L), at pH 4.2 (partial nitrification to nitrite) or 3.0 (complete nitrification to
nitrate), followed by a 14-hours settling phase, in order to promote precipitation of the humic
acids and the sedimentation of the suspended solids generated, maximizing the light
penetration in the photoreactor;
The presence of suspended solids revealed itself, in the first studies, to be a negative factor on the
photo-Fenton efficiency, decreasing the capacity of the light to access the reaction medium,
increasing the H2O2 consumption and preventing the iron catalyst regeneration in different
phototreatment cycles. In this regard, the addition of a coagulant followed by a sedimentation period
will enhance the precipitation and elimination of recalcitrant organic matter, mostly humic acids,
resulting in a yellow colour leachate, mainly attributed to the presence of dissolved fulvic acids, with
a low suspended solids content and high UV-visible transmissibility.
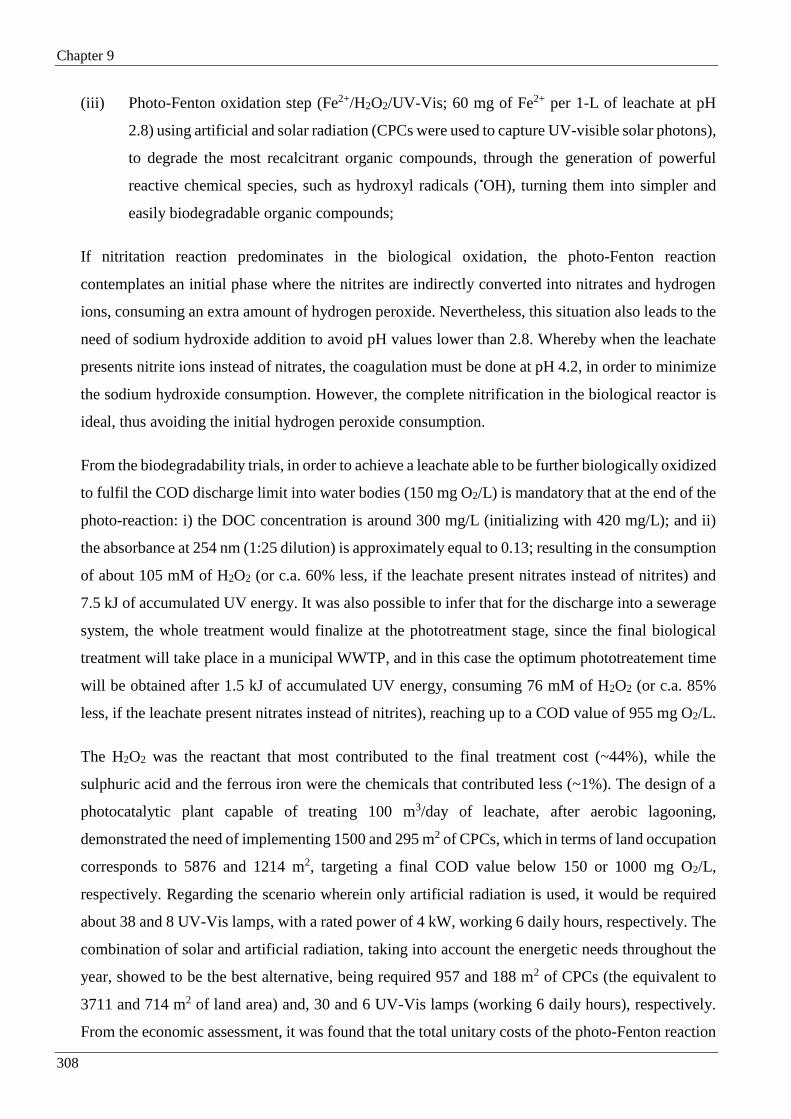
Chapter 9
308
(iii) Photo-Fenton oxidation step (Fe2+/H2O2/UV-Vis; 60 mg of Fe2+ per 1-L of leachate at pH
2.8) using artificial and solar radiation (CPCs were used to capture UV-visible solar photons),
to degrade the most recalcitrant organic compounds, through the generation of powerful
reactive chemical species, such as hydroxyl radicals (•OH), turning them into simpler and
easily biodegradable organic compounds;
If nitritation reaction predominates in the biological oxidation, the photo-Fenton reaction
contemplates an initial phase where the nitrites are indirectly converted into nitrates and hydrogen
ions, consuming an extra amount of hydrogen peroxide. Nevertheless, this situation also leads to the
need of sodium hydroxide addition to avoid pH values lower than 2.8. Whereby when the leachate
presents nitrite ions instead of nitrates, the coagulation must be done at pH 4.2, in order to minimize
the sodium hydroxide consumption. However, the complete nitrification in the biological reactor is
ideal, thus avoiding the initial hydrogen peroxide consumption.
From the biodegradability trials, in order to achieve a leachate able to be further biologically oxidized
to fulfil the COD discharge limit into water bodies (150 mg O2/L) is mandatory that at the end of the
photo-reaction: i) the DOC concentration is around 300 mg/L (initializing with 420 mg/L); and ii)
the absorbance at 254 nm (1:25 dilution) is approximately equal to 0.13; resulting in the consumption
of about 105 mM of H2O2 (or c.a. 60% less, if the leachate present nitrates instead of nitrites) and
7.5 kJ of accumulated UV energy. It was also possible to infer that for the discharge into a sewerage
system, the whole treatment would finalize at the phototreatment stage, since the final biological
treatment will take place in a municipal WWTP, and in this case the optimum phototreatement time
will be obtained after 1.5 kJ of accumulated UV energy, consuming 76 mM of H2O2 (or c.a. 85%
less, if the leachate present nitrates instead of nitrites), reaching up to a COD value of 955 mg O2/L.
The H2O2 was the reactant that most contributed to the final treatment cost (~44%), while the
sulphuric acid and the ferrous iron were the chemicals that contributed less (~1%). The design of a
photocatalytic plant capable of treating 100 m3/day of leachate, after aerobic lagooning,
demonstrated the need of implementing 1500 and 295 m2 of CPCs, which in terms of land occupation
corresponds to 5876 and 1214 m2, targeting a final COD value below 150 or 1000 mg O2/L,
respectively. Regarding the scenario wherein only artificial radiation is used, it would be required
about 38 and 8 UV-Vis lamps, with a rated power of 4 kW, working 6 daily hours, respectively. The
combination of solar and artificial radiation, taking into account the energetic needs throughout the
year, showed to be the best alternative, being required 957 and 188 m2 of CPCs (the equivalent to
3711 and 714 m2 of land area) and, 30 and 6 UV-Vis lamps (working 6 daily hours), respectively.
From the economic assessment, it was found that the total unitary costs of the photo-Fenton reaction

Chapter 9
309
applied to the bio-coag-treated leachate, were very close for the three configurations analysed, being
on average equal to 5.7 and 4.2 €/m3, targeting a COD value lesser than 150 and 1000 mg O2/L,
respectively.
(iv) Biological oxidation step under anoxic conditions to promote the denitrification and
elimination of the remaining biodegradable organic fraction;
The treatment of a photo-treated leachate with DOC < 300 mg C/L by an aerobic biological process
with activated sludge revealed, as reported in the first chapters, to be highly efficient, allowing to
obtain a final effluent with COD < 150 mg O2/L, at a retention time lower than 24-hours. Regarding
the denitrification reaction, it was achieved a maximum reaction rate of 5.8 mg (NO3--N+NO2
--N)/g
VSS/h, a minimum methanol consumption of 2.4 g CH3OH per each gram of NO3--N+NO2
--N
reduced and an alkalinity production of 4.3 g CaCO3/g (NO3--N+NO2
--N).

Chapter 9
310
9.5 References
[1] A. Spagni, S. Marsili-Libelli, Nitrogen removal via nitrite in a sequencing batch reactor treating sanitary
landfill leachate, Bioresource Technology, 100 (2009) 609-614.
[2] S. Malato, P. Fernández-Ibáñez, M.I. Maldonado, J. Blanco, W. Gernjak, Decontamination and disinfection
of water by solar photocatalysis: Recent overview and trends, Catalysis Today, 147 (2009) 1-59.
[3] V.J.P. Vilar, M.I. Maldonado, I. Oller, S. Malato, R.A.R. Boaventura, Solar treatment of cork boiling and
bleaching wastewaters in a pilot plant, Water Research, 43 (2009) 4050-4062.
[4] V.J.P. Vilar, L.X. Pinho, A.M.A. Pintor, R.A.R. Boaventura, Treatment of textile wastewaters by solar-driven
advanced oxidation processes, Solar Energy, 85 (2011) 1927-1934.
[5] A. Zapata, S. Malato, J.A. Sánchez-Pérez, I. Oller, M.I. Maldonado, Scale-up strategy for a combined solar
photo-Fenton/biological system for remediation of pesticide-contaminated water, Catalysis Today, 151
(2010) 100-106.
[6] I. Oller, S. Malato, J. Sánchez-Pérez, Combination of advanced oxidation processes and biological treatments
for wastewater decontamination—a review, Science of the Total Environment, 409 (2011) 4141-4166.
[7] Wastewater Treatment: Biological and Chemical Processes, Springer, 2002.
[8] M.H. Gerardi, Nitrification and Denitrification in the Activated Sludge Process, Wiley, 2003.
[9] C. Sawyer, P. McCarty, G. Parkin, Chemistry for Environmental Engineering and Science, McGraw-Hill
Education, 2003.
[10] S. Philips, H.J. Laanbroek, W. Verstraete, Origin, causes and effects of increased nitrite concentrations in
aquatic environments, Reviews in environmental science and biotechnology, 1 (2002) 115-141.
[11] A. Spagni, M.C. Lavagnolo, C. Scarpa, P. Vendrame, A. Rizzo, L. Luccarini, Nitrogen removal optimization
in a sequencing batch reactor treating sanitary landfill leachate, Journal of Environmental Science and Health
Part A, 42 (2007) 757-765.
[12] M. Henze, P. Harremoës, J.I.C. Jansen, E. Arvin, Basic Biological Processes, in: Wastewater Treatment:
Biological and Chemical Processes, Second Edition, Springer-Verlag, Berlin, 1997.
[13] R. Canziani, V. Emondi, M. Garavaglia, F. Malpei, E. Pasinetti, G. Buttiglieri, Effect of oxygen concentration
on biological nitrification and microbial kinetics in a cross-flow membrane bioreactor (MBR) and moving-
bed biofilm reactor (MBBR) treating old landfill leachate, Journal of Membrane Science, 286 (2006) 202-
212.
[14] J.E. Alleman, Elevated nitrite occurrence in biological wastewater treatment systems, Water Science and
Technology, 17 (1984) 409-419.
[15] K. Hanaki, C. Wantawin, S. Ohgaki, Nitrification at low levels of dissolved oxygen with and without organic
loading in a suspended-growth reactor, Water Research, 24 (1990) 297-302.
[16] A. Anthonisen, R. Loehr, T. Prakasam, E. Srinath, Inhibition of nitrification by ammonia and nitrous acid,
Journal (Water Pollution Control Federation), (1976) 835-852.

Chapter 9
311
[17] S. Villaverde, F. Fdz-Polanco, P.A. Garcıa, Nitrifying biofilm acclimation to free ammonia in submerged
biofilters. Start-up influence, Water Research, 34 (2000) 602-610.
[18] Metcalf, Eddy, Wastewater Engineering Treatment and Reuse, 4th ed., Metcalf & Eddy, 2005.
[19] H.K. Trivedi, Simultaneous Nitrification and Denitrification (SymBio® Process), in: L.K. Wang, N.K.
Shammas, Y.-T. Hung (Eds.) Advanced Biological Treatment Processes, Humana Press, 2009.
[20] J.J. Pignatello, E. Oliveros, A. MacKay, Advanced oxidation processes for organic contaminant destruction
based on the fenton reaction and related chemistry, Critical Reviews in Environmental Science and
Technology, 36 (2006) 1-84.
[21] X. Ntampou, A.I. Zouboulis, P. Samaras, Appropriate combination of physico-chemical methods
(coagulation/flocculation and ozonation) for the efficient treatment of landfill leachates, Chemosphere, 62
(2006) 722-730.
[22] G. Edge, T. Weller, The Best of The Growing Edge International, 2000-2005: Select Cream-of-the-crop
Articles for Soilless Growers, New Moon Publishing, 2005.
[23] R. Nieder, D.K. Benbi, Carbon and Nitrogen in the Terrestrial Environment, Springer, 2008.
[24] S. Park, T.-i. Yoon, The effects of iron species and mineral particles on advanced oxidation processes for the
removal of humic acids, Desalination, 208 (2007) 181-191.
[25] L.S. Clesceri, A.E. Greenberg, A.D. Eaton, Standard Methods for Examination of Water & Wastewater, 21st
ed. ed., American Public Health Association (APHA), American Water Works Association (AWWA) &
Water Environment Federation (WEF), 2005.
[26] E.M. Thurman, R.L. Malcolm, Preparative isolation of aquatic humic substances, Environmental Science &
Technology, 15 (1981) 463-466.
[27] H.A. Aziz, S. Alias, M.N. Adlan, Faridah, A.H. Asaari, M.S. Zahari, Colour removal from landfill leachate
by coagulation and flocculation processes, Bioresource Technology, 98 (2007) 218-220.
[28] A. Amokrane, C. Comel, J. Veron, Landfill leachates pretreatment by coagulation-flocculation, Water
Research, 31 (1997) 2775-2782.
[29] Y. Wu, S. Zhou, X. Ye, D. Chen, K. Zheng, F. Qin, Transformation of pollutants in landfill leachate treated
by a combined sequence batch reactor, coagulation, Fenton oxidation and biological aerated filter technology,
Process Safety and Environmental Protection, 89 (2011) 112-120.
[30] J. Yoon, S. Cho, Y. Cho, S. Kim, The characteristics of coagulation of fenton reaction in the removal of
landfill leachate organics, Water Science and Technology, 38 (1998) 209-214.
[31] J. Duan, J. Gregory, Coagulation by hydrolysing metal salts, Advances in Colloid and Interface Science,
100–102 (2003) 475-502.
[32] A. Saha, S. Goldstein, D. Cabelli, G. Czapski, Determination of optimal conditions for synthesis of
peroxynitrite by mixing acidified hydrogen peroxide with nitrite, Free Radical Biology and Medicine, 24
(1998) 653-659.
[33] S. Goldstein, G.L. Squadrito, W.A. Pryor, G. Czapski, Direct and indirect oxidations by peroxynitrite, neither
involving the hydroxyl radical, Free Radical Biology and Medicine, 21 (1996) 965-974.

Chapter 9
312
[34] M. Hughes, H. Nicklin, The chemistry of pernitrites. Part I. Kinetics of decomposition of pernitrous acid,
Journal of the Chemical Society A: Inorganic, Physical, Theoretical, (1968) 450-452.
[35] P.B. Kelter, M.D. Mosher, A. Scott, Chemistry: The Practical Science, Houghton Mifflin, 2008.
[36] D. Skoog, D. West, F. Holler, S. Crouch, Fundamentals of Analytical Chemistry, Cengage Learning, 2013.
[37] J.B. Gálvez, S.M. Rodríguez, Solar Detoxification, United Nations Educational, Scientific and Cultural
Organization, 2003.
[38] IRAR, (2008) Gestão e tratamento de lixiviados produzidos em aterros sanitários de resíduos urbanos.
Relatório IRAR n.º 03/2008.
[39] I.M.A. Saraiva, F.M.A.F. da, V.J.P. Vilar, T.F.C.V. Silva, R.A. da Rocha Boaventura, Method of treating
leachate, phototreatment reactors and respective use, in, Google Patents, 2014.

10 Final Remarks
This last chapter presents the most relevant results and conclusions reported in the
previous chapters, as well as some suggestions for future work.

Chapter 10
315
10.1 Conclusions
The main goal of the present thesis was the development and optimization of a multistage methodology
for the treatment of mature landfill leachates, aiming mostly the discharge into water bodies at
appellative costs. Regardless the multistage treatment system used, the treatment strategy involved
always an activated sludge biological oxidation (ASBO) and a photo-Fenton (PF) reaction. Later, it was
also incorporated a coagulation/sedimentation stage. All processes were tested at the lab and
pre-industrial scale units equipped with (i) biological reactor, which was prepared to work under aerobic
and anoxic conditions, and (ii) photoreactor containing compound parabolic collectors (CPCs) and/or
UV-Vis lamps. The results showed that the integration of these three oxidative processes applied to the
mature leachate treatment is an interesting and commercially viable option.
10.1.1 Integration of solar photo-Fenton reaction with biological oxidation
The leachate after lagooning pre-treatment showed low biodegradability, mainly due to the presence of
a high concentration of humic acids (~59% of DOC) and a high nitrogen load, mainly in the form of
ammonium. Firstly, based on the leachate characteristics, an integrated leachate treatment strategy was
proposed in Chapters 3 and 4, combining (i) solar PF reaction, as pre-oxidation process, to enhance the
leachate’s biodegradability, with (ii) ASBO, under aerobic and anoxic conditions, to oxidize the
remaining biodegradable organic fraction and completely eliminate nitrogen compounds, through
nitrification and denitrification, with the addition of an external carbon source. The tests were conducted
in a pre-industrial plant, incorporating a solar photocatalytic system with 39.52 m2 of CPCs and an
activated sludge reactor with 3.5 m3 capacity. The experimental unit was constructed and installed at a
sanitary landfill in order to evaluate the treatment efficiency, under real circumstances of leachate
variability and weather conditions.
The preliminary acidification step required by the PF reaction led to the precipitation of humic acids and
other organic compounds, and is responsible for an abatement of 20-58% of the soluble DOC. The acid
sludge produced after acidification decreased the PF reaction efficiency due to the lower light
transmission caused by the higher amount of suspended solids that competed with H2O2 and iron species
as photons absorbers. Therefore, higher amounts of H2O2 and energy were necessary to degrade also the
particulate organic matter. The major drawback of sludge elimination is associated with the
remediation/disposal of an acid sludge.

Chapter 10
316
The reutilization of iron sludge in consecutive oxidation treatments was not viable precisely due to the
increase of suspended solids, leading to lower reaction rates. The leachate photo-oxidation was also
strongly affected by weather conditions, mainly due to low values of irradiance and temperature in the
winter season, leading to low reaction rates, associated to the effects of the Fenton thermal reaction and
molar fraction of ferric species.
The PF reaction was able to enhance the leachate’s biodegradability above 70%, according to
Zahn-Wellens test. In order to achieve COD target values below 150 mg O2/L (in agreement with the
discharge limit into water bodies) after the final biological oxidation, it was necessary, for the
photo-oxidation, a hydrogen peroxide concentration between 180-225 mM. The good results obtained
in the PF reaction, even in the presence of high concentrations of sulphate and chloride ions, were
attributed to the formation of ferricarboxylate complexes.
Biological nitrification and denitrification reactions were strongly affected by the low temperatures
observed during the winter season. A maximum nitrification rate of 6.9 mg NH4+-N/(h.g VSS)
(T = 26.8 ºC, pH = 7.3) was achieved, consuming 20.0 g CaCO3/L or 9.9 mg CaCO3 per mg NH4+-N.
The maximum denitrification rate was 2.4 mg (NO2--N + NO3
--N)/(h.g VSS) (T = 26.2 ºC, pH = 8.8),
with a C/N consumption ratio of 3.1 mg CH3OH/mg (NO2--N + NO3
--N).
The post-treatment system by ASBO, operating under aerobic and anoxic conditions, allowed an almost
complete nitrogen removal, for levels below 15 mg N/L (emission limit value). The global DOC removal
efficiency in the combined system was approximately 86%, corresponding 55% to chemical oxidation
and 31% to biological oxidation.
Later, in Chapter 5, a multistage treatment system consisting in three sequential steps, ASBO/PF
reaction/ASBO, showed to be an interesting approach for the treatment of stabilized raw leachates from
sanitary landfills, concerning the elimination of organic matter and nitrogen compounds.
In the 1st ASBO system, under aerobic and anoxic conditions, 39% mineralization and 95% and 53%
reduction of the nitrogen and alkalinity content, respectively, were achieved. The highest nitrification
rate was 8.2 mg NH4+-N/(h.g VSS) (T = 26.9 ºC; pH = 7.6), consuming 21.6 g CaCO3 per liter of raw
leachate or 6.0 mg CaCO3 per mg NH4+-N. The maximum denitrification rate was 5.8 mg (NO2
--N +
NO3--N)/(h.g VSS) (T = 26.4 ºC; pH = 8.4), with a C/N consumption ratio of 2.4 mg CH3OH per mg
(NO2--N + NO3
--N), with an overall alkalinity production of 4.3 g CaCO3 per g (NO2--N + NO3
--N)
reduced.
Chapter 10
317
The precipitation of humic acids (37% of HS) after acidification of the bio-treated leachate corresponded
to 96% of the DOC abatement. The amount of UV energy and H2O2 consumption during the PF reaction
was 30% higher in the experiment without sludge removal and, consequently, the reaction rate was 30%
lower. The PF process led to the depletion of HS >80%, of low-molecular-weight carboxylate anions
>70% and other organic micropollutants >90%, thus resulting in a total biodegradability increase of
>70%, being possible to couple it with a further ASBO, achieving a final wastewater quality in
agreement with Portuguese discharge limits into receiving water bodies, with the exception of sulphate
ions.
Finally, in order to evaluate the feasibility of this approach to leachate treatment at full scale, a scale-up
and economic assessment of a PF plant was performed, in Chapter 6. The scale-up and economic
assessment of the PF plant, using solar and/or artificial radiation, were based on the operation variables
obtained at pre-industrial scale, considering the treatment of 100 m3 per day of a landfill leachate after
a biological pre-oxidation process, in order to achieve two targets COD values of 1000 and 150 mg O2/L,
regarding Portuguese discharge regulations into sewerage systems and water bodies, respectively.
The maximum mass and volumetric treatment factors (Tfm and Tfv) achieved were 2.35 g C/h/m2 and
3.22 L/h/m2 to achieve a final COD of 1000 mg O2/L and, 1.83 g C/h/m2 and 2.04 L/h/m2 to achieve a
final COD after biological treatment of 150 mg O2/L, considering a total of 2944 hours of insolation and
a yearly average solar UV radiation of 17 W/m2 (data collected at the location of the sanitary landfill).
The production of electrical photons was more expensive than solar photons capture, being the main
difference, between both UV photons sources, related to investment and operation costs, since, using
solar energy, the investment cost is higher than the operational cost and using electric energy, the
opposite happens.
The scale-up for the optimal conditions showed the need to implement 3836 and 6056 m2 of CPCs, or
25 and 39 UV lamps, to achieve targets COD of 1000 and 150 mg O2/L, respectively. Considering the
combined use of natural and artificial radiation, it is necessary to implement 2446 m2 of CPCs and 19
UV lamps, for COD of 1000 mg O2/L, and 3862 m2 of CPCs and 30 UV lamps, for COD of 150 mg
O2/L. For all scenarios, the expense associated just with H2O2 consumption represents, on average, about
30 and 39% of the total yearly cost, respectively to target COD of 1000 and 150 mg O2/L. The economic
assessment for optimal conditions led to a total unitary cost, aiming to achieve COD values of 1000 and
150 mg O2/L, respectively of: 6.8 and 11.0 €/m3, using only CPCs; 7.2 and 11.7 €/m3, resorting just to
UV lamps; and 6.7 and 10.9 €/m3, combining CPCs and UV lamps.

Chapter 10
318
It was notorious that the cost of the PF process increased proportionally to the leachate pollution load
and alkalinity; consequently its minimization would decrease the total expenditure. Moreover, the results
reported in Chapters 3-5 showed that the PF reaction efficiency was considerably affected by the (i)
weather conditions, mainly due to low irradiances and temperatures in the winter season, (ii) presence
of humic acids (associated with the dark-brown colour intrinsic to leachates), (iii) high amount of
suspended solids (resulting from the precipitation of some organic compounds with ferric ions) and (iv)
high amounts of sulphate ions due to addition of sulphuric acid required for the acidification step of the
PF. Considering all these aspects, it was concluded that the implementation of a preliminary biological
nitrification followed by a physico-chemical process would be the best strategy to reduce the content of
sulphates and photons absorbing species, during the photo-oxidation, thus also reducing the overall
treatment cost. So, it was decided to adapt the pre-industrial plant to this new methodology.
10.1.2 Integration of biological oxidation with coagulation and solar/UV photo-Fenton process
Complementarily to tests conducted at pre-industrial scale, some experiments at lab-scale were
performed, under controlled conditions, in order to evaluate and predict the behaviour of the PF process
and the nitrification and denitrification reactions, via nitrite, face to potential variations in the operating
conditions.
In Chapter 7, the main PF reaction variables (Fe2+ concentration, pH, temperature, acid type and UV
irradiance) were assessed using (i) a sanitary landfill leachate collected at the outlet of a leachate
treatment plant (LTP), which includes aerated lagooning followed by aerated activated sludge and a final
coagulation-flocculation step, and (ii) a lab-scale CPC photoreactor with artificial solar radiation. The
coagulation/flocculation step improved substantially the efficiency of the PF reaction, both in terms of
energy consumption (69% less) and H2O2 consumption (44% less), mainly associated with the decrease
on TSS (ca. 75% less) and precipitation of humic acids.
Regarding the PF reaction variables it was possible to conclude that: (i) the best iron concentration was
60 mg/L and above this content the mineralization degree is not affected; (ii) the best pH value was 2.8,
since the iron precipitation is avoided and the highest FeOH2+ concentration is achieved, nevertheless,
according to ferric speciation diagrams, the reaction rate constant could be improved if the pH was
increased to 3.0; (iii) the rise of leachate temperature benefits the reaction rate until 40ºC, mostly
attributed to the production of more hydroxyl radicals resulting from a higher ferric ion reduction
through thermal reactions and an increment of the FeOH2+ molar fraction; however, mainly above 30ºC,
more H2O2 was spent to achieve the same mineralization; (iv) higher reaction rates were achieved when
using only H2SO4 instead of HCl and H2SO4 + HCl, since (1) a much lesser amount of H2SO4 is required

Chapter 10
319
to acidify the leachate, (2) the Cl and Cl2- radicals are less reactive than SO4
-, and (3) the ferric ions
solubility decreases in the presence of high chlorides content; (v) during spring and summer, when the
irradiance is around 44 WUV/m2 at maximum, considering the path length of the photoreactors, the
energy losses will be negligible, and, over autumn and winter, the kinetic reaction rate remains constant
in terms of accumulated UV energy, but the reaction takes a longer time.
Ferric ion speciation diagrams help to predict the dissimilarities on the photo-Fenton reaction
performance, according to the solution pH, temperature, concentration of chloride and sulphate ions.
When the pH and temperature values were individually changed, it was possible to achieve a linear
relation between the pseudo-first order kinetic constant and the theoretical FeOH2+ content. Furthermore,
in a full-scale plant, speciation diagrams can be used to predict the optimum pH value, taking into
account the leachate temperature variability and the amount of sulphate and chloride, and also the
required phototreatment time for a further biological treatment with high efficiency.
Chapter 8 refers to the assessment of the effect of the main nitrification (temperature, dissolved oxygen
(DO) and pH) and denitrification (pH, temperature and PO43- concentration) variables on the nitrogen's
biological removal via nitrite, from mature leachates collected after aerobic lagooning or previously
nitrified. At the beginning of most nitrification assays, it was verified the occurrence of ammonia
stripping simultaneously to nitrification, leading up to 31 % removal of total dissolved nitrogen.
The maximum nitrification rate obtained was 37±2 mg NH4+-N/(h.g VSS) (25 ºC, 1.0-2.0 mg O2/L, pH
not controlled), consuming 5.3±0.4 mg CaCO3/mg NH4+-N. The highest denitrification rate achieved
was 27±1 mg NO2--N/(h.g VSS) (pH between 7.5 and 8.0, 30ºC, adding 30 mg PO4
3-/L), with a C/N
consumption ratio of 1.6±0.1 mg CH3OH/mg NO2--N and an overall alkalinity production of 3.2±0.1
mg CaCO3/mg NO2--N. The denitrification process showed to be sensitive to all studied parameters,
while the nitrification reaction was not significantly affected by the DO content.
The 454-pyrosequencing analysis of the 16S rRNA gene disclosed the presence of bacteria from the
families Nitrosomonadaceae and Hyphomicrobiaceae (in particular, genus Hyphomicrobium), in the
aerobic and anoxic bio-reactors, which are closely related to the reactions of nitrification and
denitrification, respectively. Furthermore, it was also disclosed the attendance of bacteria associated to
classes Sphingobacteriia and Flavobacteriia in both reactors, which have been reported as responsible
for the degradation of complex organic matter, one of the main constituents of the mature landfill
leachates. As a final point, it was also possible to conclude that, reactions involving (i)
oxidation/reduction of nitrogen species and (ii) degradation of organic matter were mostly mediated by
bacteria from the phyla Proteobacteria and Bacteroidetes, respectively.

Chapter 10
320
Finally, in Chapter 9, it was presented a multistage treatment approach adjustable to the characteristics
of leachates from urban sanitary landfills with their own ‘mix’ of toxic and recalcitrant pollutants, as an
eco-efficient and cost effective technology, combining: (i) an ASBO, under aerobic conditions, to
remove leachate’s alkalinity and the biodegradable organic carbon fraction (ii) a
coagulation/sedimentation step (240 mg Fe3+/L, at pH 4.2, 14-hours settling), to promote humic acids
precipitation and reduce the amount of TSS, and (iii) a photo-oxidation process through PF reaction (60
mg Fe2+/L, at pH 2.8), combining solar and artificial radiation (since during winter the irradiance is low),
to promote the recalcitrant molecules degradation and consequent biodegradability enhancement, until
the point (DOC ≈ 250 mg/L) wherein a downstream biological treatment would allow to meet the
discharge limit into water bodies (COD < 150 mg O2/L).
The results revealed that the aerobic biological process applied to a leachate after aerobic lagooning,
with high organic and nitrogen content (DOC = 1.1-1.5 g C/L; COD = 3.0-4.3 g O2/L and
ND = 0.8-3.0 g N/L) and low biodegradability (BOD5/COD = 0.07-0.13), was capable to oxidise
between 62 and 99% of the ammonium nitrogen (NH4+-Nf = 8-250 mg/L), consuming only the leachate
alkalinity (final concentration between 0-1.6 g CaCO3/L), achieving alkalinity reductions between 70
and 100%. The coagulation/sedimentation process led to the humic acids precipitation, promoting a
marked change in leachate colour, from dark-brown to yellowish-brown, which was related to the
presence of fulvic acids, accompanied by a reduction of 60% on DOC (DOCf ≈ 400 mg/L), 58% on
COD (CODf ≈ 1200 mg/L) and 88% on TSS (supernatant TSS = 135 mg/L), obtaining an amount of
acid sludge of about 300 mL/L. The implementation of the combined system of biological
nitrification/coagulation was able to keep the sulphate ions concentration below the legal discharge limit
into water bodies (2 g/L), which was not possible in the previous experiments.
The PF reaction showed an initial phase where the nitrites are indirectly converted to nitrates and
hydrogen ions, consuming an extra amount of hydrogen peroxide. Nevertheless, this situation also led
to the need of sodium hydroxide addition to avoid pH values lower than 2.8. Whereby, when the leachate
presents nitrite ions instead of nitrates, the coagulation must be done at pH 4.2, in order to minimize the
sodium hydroxide consumption. However, the complete nitrification in the biological reactor is ideal,
thus avoiding the initial hydrogen peroxide consumption.
From the photo-Fenton trials, it was concluded that the best option would be combining natural sunlight
with artificial radiation (~1.3 kW/m3), thus optimizing the indirect costs. According to Zahn-Wellens
test, a leachate, with 419 mg DOC/L after coagulation, would have to be photo-oxidized until a DOC
and an 254 nm absorbance (1:25 dilution) lesser than 300 mg/L and 0.13, respectively, consuming
approximately 105 mM of H2O2 (or c.a. 60% less, if the leachate present nitrates instead of nitrites) and

Chapter 10
321
7.5 kJ/L of accumulated UV energy, in order to achieve an effluent than can be biologically treated in
compliance with the COD discharge limit (< 150 mg O2/L) into water bodies. The biological process
subsequent to the photocatalytic system would promote a 59% mineralization, being the final COD ≈115
mg O2/L. If the ultimate goal is the discharge into sewerage system (COD < 1000 mgO2/L), the full
treatment would be finalized in the photo-treatment step, since the final biological treatment will take
place in a municipal WWTP, with a COD of about 950 mg O2/L after a mineralization of 21% and a
consumption of 1.5 kJ/L of UV energy and 76 mM of H2O2 (or c.a. 85% less, if the leachate present
nitrates instead of nitrites).
The scale-up of a photocatalytic facility with a capacity to treat 100 m3 of leachate per day showed the
need to implement 1500 and 295 m2 of CPCs, which in terms of land occupation corresponds to 5876
and 1214 m2, or 38 and 8 UV-Vis lamps (with 4kW and 20,000-h of lifetime each, working 6 daily
hours), targeting a COD value lesser than 150 and 1000 mg O2/L, respectively. Combining solar and
artificial radiation, only 957 and 188 m2 of CPCs (considering the month of higher irradiance), and 30
and 6 lamps (considering the month of lesser irradiance), respectively, would be required. From the
economic assessment, it was found that the total unitary costs of the PF reaction applied to the
bio-coag-treated leachate, were very close for the three configurations analysed, being on average equal
to 5.7 and 4.2 €/m3, targeting a COD value lesser than 150 and 1000 mg O2/L, respectively. The cost
with H2O2 corresponds to about 44% of the total yearly cost.
The application of this strategy to leachate treatment leads to a final effluent in agreement with the
discharge limits into water bodies, imposed by Portuguese legislation, including for sulphate ions.
Moreover, the cost of the PF step decreases about 50% when compared to the initial methodology.

Chapter 10
322
10.2 Suggestions for future work
The results presented in Chapter 9 showed that a leachate downstream from biological oxidation, with
high amounts of nitrite, affects directly the hydrogen peroxide consumption in the subsequent
photo-Fenton reaction. So, in the future, two measures could be implemented in the first biological
oxidation process, regarding a proficient integration with the coagulation and photo-Fenton processes,
namely: i) to perform nitrification-denitrification via nitrite, taking into account the alkalinity balance
(consumed during nitrification and produced along denitrification), in order to assure that the sulphate
concentration (added as sulphuric acid and ferrous sulphate, in the coagulation and photo-oxidation
steps, respectively) does not exceed 2 g/L; or (ii) to carry out complete nitrification to nitrate, optimizing
the operating conditions (pH, OD and temperature) and the ammonium nitrogen load fed to the
biological reactor (for instance, using a sequential batch reactor (SBR) with 100 m3 capacity, being the
treated volume of 25 m3, which means a dilution factor of four), minimizing the inhibition of
nitrite-oxidising bacteria.
It could also be interesting the study of a continuous biological treatment system composed by an anoxic
reactor followed by an aerobic one, with recirculation to the anoxic reactor, using raw leachate. Thus, it
would be possible to take advantage of the biodegradable organic fraction and alkalinity of the raw
leachate.
If nitrification-denitrification is performed in the first biological treatment, additional tests, applying
coagulation and photo-Fenton reaction to the leachate previously denitrified, should be conducted, in
order to determine the optimal conditions for the treatment of a leachate without nitrogen.
For future work, it is also suggested (i) to conduct photo-Fenton experiments with humic and fulvic
acids extracted from the leachate, (ii) the characterization of the leachate along all treatment sequence,
by size exclusion chromatography, in order to understand the molecular weight distribution changes,
and (iii) the study of the final biological treatment, after a multistage system composed by biological
oxidation, coagulation/sedimentation and photo-Fenton reaction.
Finally, efforts must be spent on the (i) development of new designs for photocatalytic reactors using
artificial radiation through computational fluid dynamics (CFD) tool, considering the fluid
hydrodynamics, lamp emission spectra and power and, respective distribution inside the reactor, and (ii)
optimization of the optical system for sunlight capture, based in CPCs systems, in terms of photon and
thermal flux and, volumetric capacity per unit of collector area using non imaging optics (NIO)
techniques.

Related Documents


