This article was downloaded by: [University of Cincinnati Libraries] On: 18 September 2014, At: 12:19 Publisher: Taylor & Francis Informa Ltd Registered in England and Wales Registered Number: 1072954 Registered office: Mortimer House, 37-41 Mortimer Street, London W1T 3JH, UK Journal of the Air & Waste Management Association Publication details, including instructions for authors and subscription information: http://www.tandfonline.com/loi/uawm20 Treatment of hydrophobic VOCs in trickling bed air biofilter: Emphasis on long-term effect of initial alternate use of hydrophilic VOCs and microbial species evolution Abderrahman Zehraoui a , David Wendell a & George A. Sorial a a Environmental Engineering Program, Department of Biomedical, Chemical, and Environmental Engineering, College of Engineering and Applied Science, University of Cincinnati, Cincinnati, OH, USA Accepted author version posted online: 04 Jun 2014.Published online: 16 Sep 2014. To cite this article: Abderrahman Zehraoui, David Wendell & George A. Sorial (2014) Treatment of hydrophobic VOCs in trickling bed air biofilter: Emphasis on long-term effect of initial alternate use of hydrophilic VOCs and microbial species evolution, Journal of the Air & Waste Management Association, 64:10, 1102-1111, DOI: 10.1080/10962247.2014.925522 To link to this article: http://dx.doi.org/10.1080/10962247.2014.925522 PLEASE SCROLL DOWN FOR ARTICLE Taylor & Francis makes every effort to ensure the accuracy of all the information (the “Content”) contained in the publications on our platform. However, Taylor & Francis, our agents, and our licensors make no representations or warranties whatsoever as to the accuracy, completeness, or suitability for any purpose of the Content. Any opinions and views expressed in this publication are the opinions and views of the authors, and are not the views of or endorsed by Taylor & Francis. The accuracy of the Content should not be relied upon and should be independently verified with primary sources of information. Taylor and Francis shall not be liable for any losses, actions, claims, proceedings, demands, costs, expenses, damages, and other liabilities whatsoever or howsoever caused arising directly or indirectly in connection with, in relation to or arising out of the use of the Content. This article may be used for research, teaching, and private study purposes. Any substantial or systematic reproduction, redistribution, reselling, loan, sub-licensing, systematic supply, or distribution in any form to anyone is expressly forbidden. Terms & Conditions of access and use can be found at http:// www.tandfonline.com/page/terms-and-conditions

Welcome message from author
This document is posted to help you gain knowledge. Please leave a comment to let me know what you think about it! Share it to your friends and learn new things together.
Transcript
This article was downloaded by: [University of Cincinnati Libraries]On: 18 September 2014, At: 12:19Publisher: Taylor & FrancisInforma Ltd Registered in England and Wales Registered Number: 1072954 Registered office: Mortimer House,37-41 Mortimer Street, London W1T 3JH, UK
Journal of the Air & Waste Management AssociationPublication details, including instructions for authors and subscription information:http://www.tandfonline.com/loi/uawm20
Treatment of hydrophobic VOCs in trickling bed airbiofilter: Emphasis on long-term effect of initialalternate use of hydrophilic VOCs and microbial speciesevolutionAbderrahman Zehraouia, David Wendella & George A. Sorialaa Environmental Engineering Program, Department of Biomedical, Chemical, andEnvironmental Engineering, College of Engineering and Applied Science, University ofCincinnati, Cincinnati, OH, USAAccepted author version posted online: 04 Jun 2014.Published online: 16 Sep 2014.
To cite this article: Abderrahman Zehraoui, David Wendell & George A. Sorial (2014) Treatment of hydrophobic VOCs intrickling bed air biofilter: Emphasis on long-term effect of initial alternate use of hydrophilic VOCs and microbial speciesevolution, Journal of the Air & Waste Management Association, 64:10, 1102-1111, DOI: 10.1080/10962247.2014.925522
To link to this article: http://dx.doi.org/10.1080/10962247.2014.925522
PLEASE SCROLL DOWN FOR ARTICLE
Taylor & Francis makes every effort to ensure the accuracy of all the information (the “Content”) containedin the publications on our platform. However, Taylor & Francis, our agents, and our licensors make norepresentations or warranties whatsoever as to the accuracy, completeness, or suitability for any purpose of theContent. Any opinions and views expressed in this publication are the opinions and views of the authors, andare not the views of or endorsed by Taylor & Francis. The accuracy of the Content should not be relied upon andshould be independently verified with primary sources of information. Taylor and Francis shall not be liable forany losses, actions, claims, proceedings, demands, costs, expenses, damages, and other liabilities whatsoeveror howsoever caused arising directly or indirectly in connection with, in relation to or arising out of the use ofthe Content.
This article may be used for research, teaching, and private study purposes. Any substantial or systematicreproduction, redistribution, reselling, loan, sub-licensing, systematic supply, or distribution in anyform to anyone is expressly forbidden. Terms & Conditions of access and use can be found at http://www.tandfonline.com/page/terms-and-conditions
TECHNICAL PAPER
Treatment of hydrophobic VOCs in trickling bed air biofilter: Emphasison long-term effect of initial alternate use of hydrophilic VOCs andmicrobial species evolutionAbderrahman Zehraoui, David Wendell, and George A. Sorial⁄Environmental Engineering Program, Department of Biomedical, Chemical, and Environmental Engineering, College of Engineering and AppliedScience, University of Cincinnati, Cincinnati, OH, USA⁄Please address correspondence to: George A. Sorial, Environmental Engineering Program, Department of Biomedical, Chemical, andEnvironmental Engineering, College of Engineering and Applied Science, University of Cincinnati, P.O. Box 210012, Cincinnati, OH45221, USA; e-mail: [email protected]
The main research objective of this study is to enhance the removal of recalcitrant compounds that are not readily bioavailabledue to limiting mass transfer rate between the liquid and gas phases. Four trickle-bed air biofilters (TBABs), loaded with pelletizeddiatomaceous earth support media, were run at an empty bed residence time (EBRT) of 120 sec. After an acclimation period atconstant loading rate (LR) of n-hexane (13.2 g m�3 hr�1) and intermittent feeding of methanol, n-hexane influent LR was thenincreased in step-wise fashion to 47.7 g m�3 hr�1 for biofilters receiving acidic nutrients (pH 4), and to 36.3 g m�3 hr�1 for biofiltersreceiving nutrient at pH 7. The results have shown that for TBABs receiving nutrient at pH 4, greater elimination capacities wereobtained as compared to TBABs working at pH 7. n-Hexane removal efficiency of more than 84% at LR up to 47.7 g m�3 hr�1 wasobtained for pH 4 nutrient-fed biofilters, while for biofilters with nutrients fed at pH 7, the removal efficiency did not exceed 64% forn-hexane LR of 36.3 g m�3 hr�1. The microbial analysis revealed that no fungal community was detected in TBABs run at neutralpH. The fungi communities that were initially acclimating TBABs run at pH 4, namely, Aspergillus niger and Fusarium solani, werenot detected at the end of the experiment, while Gibberella moniliformis (Fusarium verticillioides) genus became the dominantspecies. Gibberella moniliformis (Fusarium verticillioides) was present along all the biofilter media and sustained very high n-hexane elimination at steady-state condition.
Implications: With growing apprehension about sustainability and environmental protection, with limited resourcesavailable, and with the passage of the 1990 Amendments to the Clean Air Act, there is more need for using air pollution controltechniques that are sound economically and proven environmentally friendly. Biofiltration systems, namely, trickle-bed air biofilters,were for decades recognized as efficient in treating air pollutants. Thus, the application of this technique over a wide industrialspectrum would certainly contribute to reduction of hazardous gas emissions.
Introduction
In a world where there is growing apprehension about sus-tainability and environmental protection, global warming andgreenhouse gas emissions receive more public awareness andconcern. As a consequence, technologies for treatment of thesegases also become of paramount interest because of the limitedresources available and the requirement for the use of air pollu-tion control techniques that are proven to be economical andenvironmentally friendly. In fact, with the passage of the 1990Amendments to the Clean Air Act, gas-releasing facilities havebeen significantly affected by the rigorous application of regula-tions, standards, guidelines, and volatile organic compounds(VOCs) codes emissions (U.S. Environmental ProtectionAgency [EPA], 1990). To comply with the authorities’ emissionrequirements in achieving reduced concentration levels of VOCs
emissions, the development of techniques that enhance air qual-ity was evaluated.
In this regard, biofiltration systems have been for decadesthe most appropriate option, being proven the most econom-ical, robust, and reliable alternative to conventional technolo-gies (bioscrubbing, physical, chemical, and incineration), andthey are an environmentally friendly technique for combatingemitted VOCs (Estrada et al., 2010). In fact, biofiltration sys-tems offer a very flexible option in their maintenance and oftheir benign by-product effluents. More remarkably, trickle-bedair biofilters (TBABs) offer more optimal and controllableoperations along with low maintenance costs over traditionalbiofilters. Thus, they are more efficient in treating VOCs thatdo not engender acidic by-products (Deshusses and Cox,2000). Furthermore, due to their higher and consistent removalefficiency performance and harmless by-products generated,
1102
Journal of the Air & Waste Management Association, 64(10):1102–1111, 2014. Copyright © 2014 A&WMA. ISSN: 1096-2247 printDOI: 10.1080/10962247.2014.925522 Submitted January 10, 2014; final version submitted April 21, 2014; accepted May 12, 2014.
Dow
nloa
ded
by [
Uni
vers
ity o
f C
inci
nnat
i Lib
rari
es]
at 1
2:19
18
Sept
embe
r 20
14
TBABs are increasingly used for a wide spectrum of industrialapplications (Sempere et al., 2009).
The performance of TBABs is significantly affected by theVOCs’ solubility in water and their Henry’s law constant (Zhuet al., 2004). Hydrophilic compounds are more easily biodegrad-able than hydrophobic ones, which are more resilient to degrada-tion. In most cases, mass transfer from gas to liquid phase is rate-limiting in TBABs. Thus, an increase in bioavailability of VOCswill facilitate their biodegradation by microorganisms. Manyprocesses were tested for addressing the bioavailability of hydro-phobic contaminants. One is the introduction of surfactants (AlyHassan and Sorial, 2008; Woertz and Kinney, 2004), providingfavorable conditions for fungi (Aly Hassan and Sorial, 2008;Arriaga and Revah, 2005a; Hernández-Meléndez et al., 2008;Spigno and De Faveri, 2005; Van Groenestijn et al., 2001); othersinclude mixture of n-hexane with other less hydrophobic com-pound such as benzene (Aly Hassan and Sorial, 2010a), introduc-tion of more hydrophilic contaminants in mixture with n-hexane,suchmethanol (Zehraoui et al., 2012, 2013), andmost recently thealternate use of methanol with n-hexane (Zehraoui et al., 2014).
n-Hexane was the subject of many studies for being insolublein water. It is commonly used in a broad range of industrialapplications, which eventually lead to its emission from differentsources such as printing and publishing, polymer and human-made fiber, pulp and paper, and organic chemical industries(Zehraoui et al., 2012, 2013; Zehraoui et al., 2014). The reportedliterature reviews were on behalf of its biodegradation in tradi-tional biofilters, TBABs, or in new technologies such as thesilicone oil-amended biofilter, two liquid phase biofiltration,and two-phase partitioning bioreactor. The results were variedaccording to the biofilter or reactor used, support medium, andmode of operation. For instance, Zehraoui et al. (2013) obtaineda very high removal efficiency (RE) of 95% with high stabilityfor treating n-hexane after a period of use with methanol at aloading rate (LR) of 13.2 g m�3 hr�1, which corresponds to anelimination capacity (EC) of 12.5 gm�3 hr�1. Previously, AlyHassan and Sorial (2010a) obtained a 90% in RE at a LR of 47.7g m�3 hr�1 for a TBAB operating at pH 4. For TBABs operatingat pH 7 with and without surfactant, the elimination capacitiesobserved were 12.6 and 8.0 g m�3 hr�1, respectively, for LR of21.5 g m�3 hr�1 (Aly Hassan and Sorial, 2010a). Other resultsobtained in other new technologies showed very high ECs, buteither with low efficiencies, frequent instability in performance,or very short duration of study . For instance, Arriaga and Revah(2005a) obtained an average EC of 60 g m�3 hr�1 for n-hexaneload of 119 g m�3 hr�1 in a perlite-packed biofilter (i.e., 50% inRE). van Groenestijn and Lake (1999) used a mixture of siliconeoil and water as the trickling medium for n-hexane removal andobtained an EC of 80 g m�3 hr�1 for n-hexane load of 97 g m�3
hr�1. Although the study was promising, the high empty bedresidence time (EBRT) used prohibits its economical feasibilityfor industrial-scale application. In another study, Fazaelipooret al. (2006) obtained an ECmax of 167 g m�3 hr�1 for thesilicone oil-amended biofilter, while for the control biofilterwithout silicone oil the ECmax obtained was 114.9 g m�3 hr�1
for a 70-days operation.On the other hand, as the performance of any biofilter is
correlated with its active biomass, it is crucial to understand
and investigate the microbial ecology within the media biofilm.Current literature shows a very great interest in using molecularbiology techniques for microbial species identification fromenvironmental samples (García-Peña et al., 2008; Vigueraset al., 2009). Most reported species for n-hexane biodegradationwere Fusarium solani (Arriaga and Revah, 2005b; Hernández-Meléndez et al., 2008), Rhinocladiella similis (Vigueras et al.,2009), and Aspergillus niger (Spigno et al., 2003). Combinationof Fusarium solani, Aspergillus niger, and Dothioraceae. sp.was reported by Zehraoui et al. (2014). The results of all of thesestudies were in favor of biodegrading n-hexane using acidicnutrient to enhance fungi growth over bacteria and hence achiev-ing better performances (Aly Hassan and Sorial, 2010b). Thereasons behind using fungi in biodegradation of hydrophobicVOCs could be due its filamentous structure with aerial myceliaand large surface area, which could capture the contaminantwhile it is still in the gas phase. Other advantages in usingfungi over bacteria include their capability to degrade a largenumber of pollutants, as well as their tolerance to harsh andstressed environmental conditions where bacterial growthmight be limited (Vigueras et al., 2009).
The main research objective of this work is, therefore, thelong term removal of recalcitrant compounds that are not readilybioavailable due to the limiting mass transfer rate between theliquid and gas phases. For this purpose, n-hexane is used in thisstudy as a model hydrophobic compound to represent recalci-trant compounds. It is included in the 1990 Clean AirAmendment (EPA, 1990). The reported dimensionless Henry’slaw constant at 25�C for n-hexane is 40.7 � 2.78 (Yang et al.,2010). Four trickle-bed air biofilters (TBAB). A, B, C, and D,were previously run at a constant loading rate of n-hexane andintermittent addition of methanol (Zehraoui et al., 2014). Theywere fed with different nutrient pH buffers. TBABs A and Bwere operated at acidic pH of 4, while TBABs C and D were atneutral pH, with each biofilter receiving an increased n-hexaneLR. Characterization and identification of the microbial com-munity within the TBAB media, the effect of n-hexane influentconcentration step increase on the performance of the biofilters,biomass control strategies, and other operational parameterssuch as CO2 closure and biodegradation reaction kinetics, wereinvestigated and results were compared to our previous studies,which served as the control. The methods used to control bio-mass growth were a combination of stagnation and flow-switching and occasional backwashing.
Materials and Methods
Trickling biofilters
n-Hexane used in this study was obtained from FisherScientific (Fair Lawn, NJ) with 95% purity. It has been fed tofour TBABs: A, B, C, and D. The TBABs were run indepen-dently in this study. The TBABs were made up of seven cylind-rical glass sections with an internal diameter of 7.6 cm and a totallength of 130 cm. They were packed with pelletized diatomac-eous earth biological support media to a depth of about 60 cm(Celite 6 mmR-635 Bio-Catalyst Carrier; Celite Corp., Lompoc,
Zehraoui et al. / Journal of the Air & Waste Management Association 64 (2014) 1102–1111 1103
Dow
nloa
ded
by [
Uni
vers
ity o
f C
inci
nnat
i Lib
rari
es]
at 1
2:19
18
Sept
embe
r 20
14
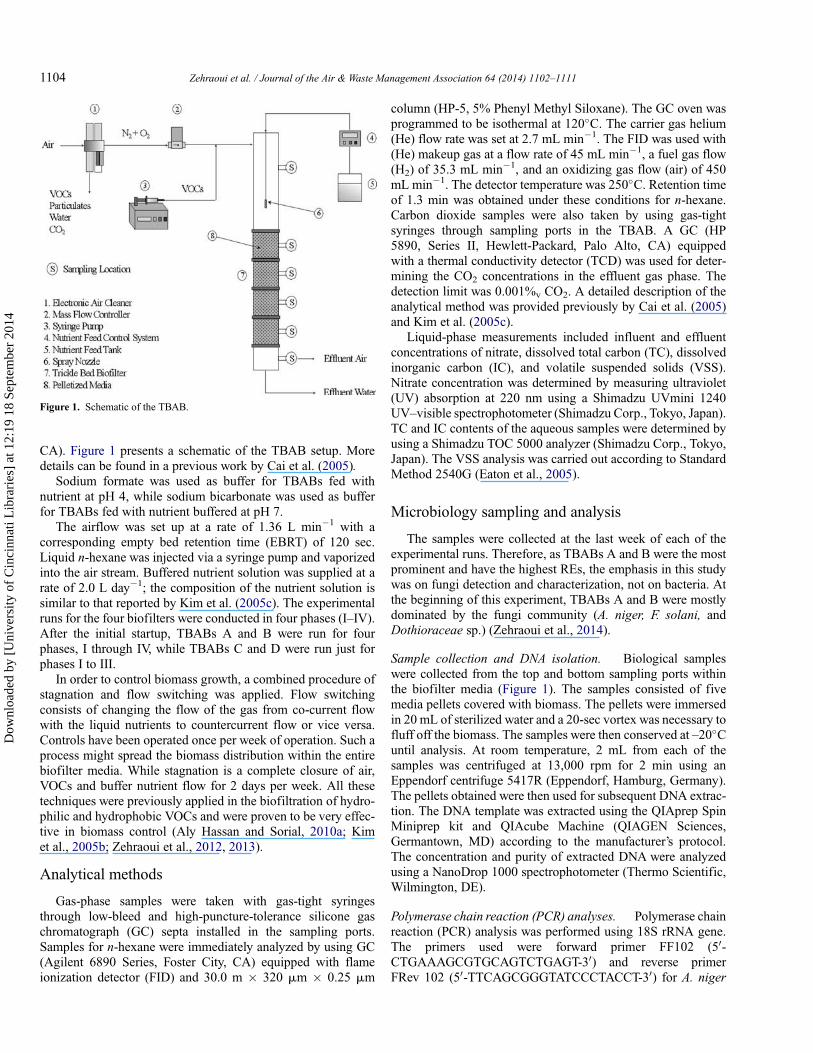
CA). Figure 1 presents a schematic of the TBAB setup. Moredetails can be found in a previous work by Cai et al. (2005).
Sodium formate was used as buffer for TBABs fed withnutrient at pH 4, while sodium bicarbonate was used as bufferfor TBABs fed with nutrient buffered at pH 7.
The airflow was set up at a rate of 1.36 L min�1 with acorresponding empty bed retention time (EBRT) of 120 sec.Liquid n-hexane was injected via a syringe pump and vaporizedinto the air stream. Buffered nutrient solution was supplied at arate of 2.0 L day�1; the composition of the nutrient solution issimilar to that reported by Kim et al. (2005c). The experimentalruns for the four biofilters were conducted in four phases (I–IV).After the initial startup, TBABs A and B were run for fourphases, I through IV, while TBABs C and D were run just forphases I to III.
In order to control biomass growth, a combined procedure ofstagnation and flow switching was applied. Flow switchingconsists of changing the flow of the gas from co-current flowwith the liquid nutrients to countercurrent flow or vice versa.Controls have been operated once per week of operation. Such aprocess might spread the biomass distribution within the entirebiofilter media. While stagnation is a complete closure of air,VOCs and buffer nutrient flow for 2 days per week. All thesetechniques were previously applied in the biofiltration of hydro-philic and hydrophobic VOCs and were proven to be very effec-tive in biomass control (Aly Hassan and Sorial, 2010a; Kimet al., 2005b; Zehraoui et al., 2012, 2013).
Analytical methods
Gas-phase samples were taken with gas-tight syringesthrough low-bleed and high-puncture-tolerance silicone gaschromatograph (GC) septa installed in the sampling ports.Samples for n-hexane were immediately analyzed by using GC(Agilent 6890 Series, Foster City, CA) equipped with flameionization detector (FID) and 30.0 m � 320 mm � 0.25 mm
column (HP-5, 5% Phenyl Methyl Siloxane). The GC oven wasprogrammed to be isothermal at 120�C. The carrier gas helium(He) flow rate was set at 2.7 mL min�1. The FID was used with(He) makeup gas at a flow rate of 45 mL min�1, a fuel gas flow(H2) of 35.3 mL min�1, and an oxidizing gas flow (air) of 450mL min�1. The detector temperature was 250�C. Retention timeof 1.3 min was obtained under these conditions for n-hexane.Carbon dioxide samples were also taken by using gas-tightsyringes through sampling ports in the TBAB. A GC (HP5890, Series II, Hewlett-Packard, Palo Alto, CA) equippedwith a thermal conductivity detector (TCD) was used for deter-mining the CO2 concentrations in the effluent gas phase. Thedetection limit was 0.001%v CO2. A detailed description of theanalytical method was provided previously by Cai et al. (2005)and Kim et al. (2005c).
Liquid-phase measurements included influent and effluentconcentrations of nitrate, dissolved total carbon (TC), dissolvedinorganic carbon (IC), and volatile suspended solids (VSS).Nitrate concentration was determined by measuring ultraviolet(UV) absorption at 220 nm using a Shimadzu UVmini 1240UV–visible spectrophotometer (Shimadzu Corp., Tokyo, Japan).TC and IC contents of the aqueous samples were determined byusing a Shimadzu TOC 5000 analyzer (Shimadzu Corp., Tokyo,Japan). The VSS analysis was carried out according to StandardMethod 2540G (Eaton et al., 2005).
Microbiology sampling and analysis
The samples were collected at the last week of each of theexperimental runs. Therefore, as TBABs A and B were the mostprominent and have the highest REs, the emphasis in this studywas on fungi detection and characterization, not on bacteria. Atthe beginning of this experiment, TBABs A and B were mostlydominated by the fungi community (A. niger, F. solani, andDothioraceae sp.) (Zehraoui et al., 2014).
Sample collection and DNA isolation. Biological sampleswere collected from the top and bottom sampling ports withinthe biofilter media (Figure 1). The samples consisted of fivemedia pellets covered with biomass. The pellets were immersedin 20 mL of sterilized water and a 20-sec vortex was necessary tofluff off the biomass. The samples were then conserved at –20�Cuntil analysis. At room temperature, 2 mL from each of thesamples was centrifuged at 13,000 rpm for 2 min using anEppendorf centrifuge 5417R (Eppendorf, Hamburg, Germany).The pellets obtained were then used for subsequent DNA extrac-tion. The DNA template was extracted using the QIAprep SpinMiniprep kit and QIAcube Machine (QIAGEN Sciences,Germantown, MD) according to the manufacturer’s protocol.The concentration and purity of extracted DNA were analyzedusing a NanoDrop 1000 spectrophotometer (Thermo Scientific,Wilmington, DE).
Polymerase chain reaction (PCR) analyses. Polymerase chainreaction (PCR) analysis was performed using 18S rRNA gene.The primers used were forward primer FF102 (50-CTGAAAGCGTGCAGTCTGAGT-30) and reverse primerFRev 102 (50-TTCAGCGGGTATCCCTACCT-30) for A. niger
Figure 1. Schematic of the TBAB.
Zehraoui et al. / Journal of the Air & Waste Management Association 64 (2014) 1102–11111104
Dow
nloa
ded
by [
Uni
vers
ity o
f C
inci
nnat
i Lib
rari
es]
at 1
2:19
18
Sept
embe
r 20
14
detection. For the fungus F. solani, forward and reverse primerswere 107F (50-AGAGGACCCCTAACTCTGTTTCT-30) and107R (50-TTTCCTCCGTCTTATTGATATGC-30), respectively.Both primers were successfully used in our previous work(Zehraoui et al., 2014). Another extra universal primer wasused to detect more fungi species. ITS86M-F and ITS4M-Rwere previously used for a wide range of fungi detection (Soetaet al., 2009). Forward and reverse primers were ITS86M-F(50-TGAATCATCGACTCTTTGA-30) and ITS4M-R (50-ATAGTTATTCGCCTCC-30), respectively. For 18S PCRs, 50mL contained 0.2 mM of primers, 0.8 mL of DFS Tag DNAPolymerase, 5 mL of buffer (Boca Scientific inc, FL), and 1 mLof dNTPMix N0447L (10 mM) (New England Biolabs, MA), aswell as 2 mL of sample DNA. Initial denaturation was at 94 mCfor 2 min, followed by 35 cycles of denaturation (at 94�C),annealing at 56�C for 107F/107R, at 54�C forFF102/FRev102, and at 66��C for ITS86M-F/ITS4M-R, all at30 sec, and extension at 72�C for 60 sec.
Microbial sequencing. The PCRs products were then clonedusing TACloning kits with pCR 2.1 vector and One Shot TOP10chemically competent Escherichia coli (Life Technologies, SanFrancisco, CA) according to the manufacturer’s protocol.Selected single large white colonies were placed inLB-ampicillin broth and cultured at 37�C overnight. The sam-ples were centrifuged and the pellets were sent for further DNAextraction and sequencing to the CCHMCGenetic Variation andGene Discovery Core Facility (Cincinnati, OH). Vector forwardT7 (pCR 2.1) was used as promoter for in vitro RNA transcrip-tion and sequencing. Sequences were then submitted to BLASThomology search algorithms to assess similarity to sequences inthe 18S rRNA sequences (Fungus) database (NCBI).
Results and Discussion
TBABs performance
Performance of TBABs during initial acclimation period.Initially, the TBABs were acclimated in a previous phase by
alternate feed of methanol and continuous feed of n-hexane.During this period, the TBABs received concentration ratios ofmethanol to n-hexane of (3:1) for TBAB A at pH 4 and TBABD at pH 7 and (5:1) for TBAB B at pH 4 and TBAB C at pH 7for 150 days. Afterward, only n-hexane was fed to the TBABs(Zehraoui et al., 2014). All TBABs received n-hexane influentconcentration of 127 ppmv (13.21 g m�3 hr�1), correspondingto methanol influent concentrations of 975 ppmv (37.7 g m�3
hr�1) and 1668 ppmv (64.5 gm�3 hr�1) depending on concen-tration ratios of methanol to n-hexane (Zehraoui et al., 2014).The removal efficiencies of n-hexane in presence of methanolwere 88%, 80%, 41%, and 69% for TBABs A, B, C, and D,respectively(Zehraoui et al., 2014). When methanol was sus-pended and only n-hexane was fed to the TBABs, n-hexaneremoval efficiencies increased substantially to reach 94%,95%, 88% and 89% for TBABs A, B, C, and D, respectively.The current study reports the biodegradation performance of n-hexane in these TBABs as sole VOC feed at step increase in LRimmediately after this acclimation period. The goal was tocheck whether after this acclimation period a long-termenhancement in n-hexane elimination is obtained as comparedto the previous study where n-hexane was treated under thesame operational conditions but without any methanol addi-tions (Aly Hassan and Sorial, 2010b).
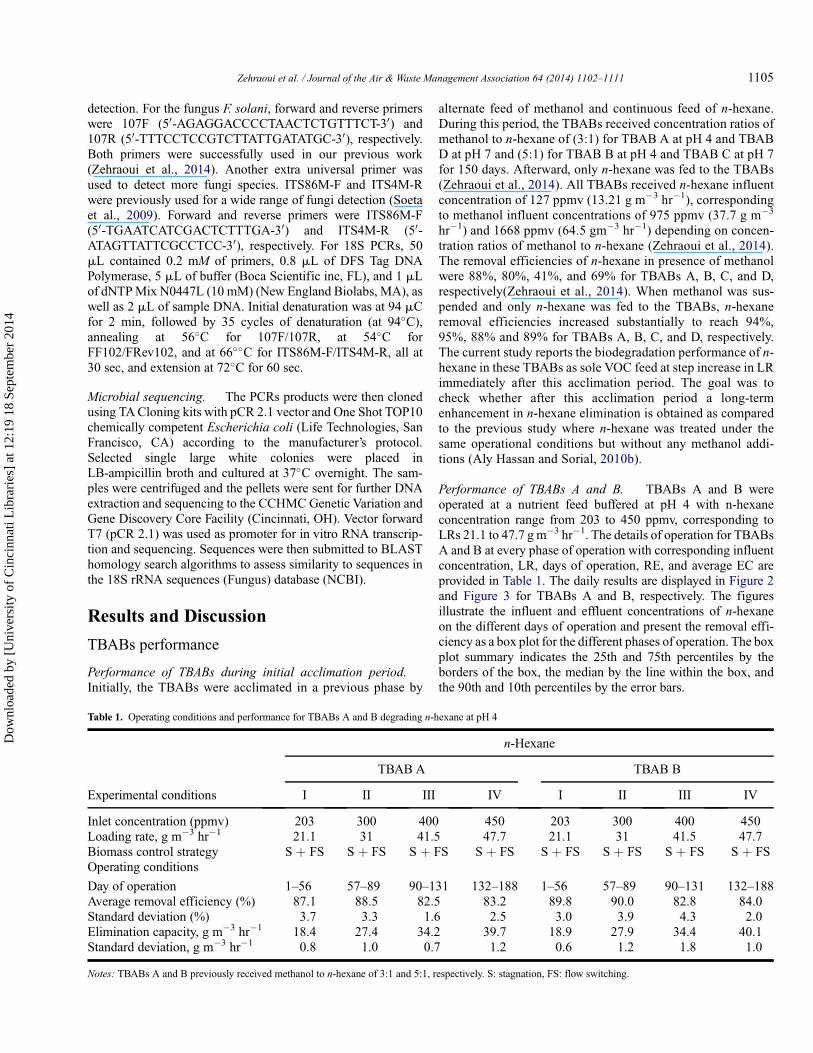
Performance of TBABs A and B. TBABs A and B wereoperated at a nutrient feed buffered at pH 4 with n-hexaneconcentration range from 203 to 450 ppmv, corresponding toLRs 21.1 to 47.7 g m�3 hr�1. The details of operation for TBABsA and B at every phase of operation with corresponding influentconcentration, LR, days of operation, RE, and average EC areprovided in Table 1. The daily results are displayed in Figure 2and Figure 3 for TBABs A and B, respectively. The figuresillustrate the influent and effluent concentrations of n-hexaneon the different days of operation and present the removal effi-ciency as a box plot for the different phases of operation. The boxplot summary indicates the 25th and 75th percentiles by theborders of the box, the median by the line within the box, andthe 90th and 10th percentiles by the error bars.
Table 1. Operating conditions and performance for TBABs A and B degrading n-hexane at pH 4
n-Hexane
TBAB A TBAB B
Experimental conditions I II III IV I II III IV
Inlet concentration (ppmv) 203 300 400 450 203 300 400 450Loading rate, g m�3 hr�1 21.1 31 41.5 47.7 21.1 31 41.5 47.7Biomass control strategy S þ FS S þ FS S þ FS S þ FS S þ FS S þ FS S þ FS S þ FSOperating conditions
Day of operation 1–56 57–89 90–131 132–188 1–56 57–89 90–131 132–188Average removal efficiency (%) 87.1 88.5 82.5 83.2 89.8 90.0 82.8 84.0Standard deviation (%) 3.7 3.3 1.6 2.5 3.0 3.9 4.3 2.0Elimination capacity, g m�3 hr�1 18.4 27.4 34.2 39.7 18.9 27.9 34.4 40.1Standard deviation, g m�3 hr�1 0.8 1.0 0.7 1.2 0.6 1.2 1.8 1.0
Notes: TBABs A and B previously received methanol to n-hexane of 3:1 and 5:1, respectively. S: stagnation, FS: flow switching.
Zehraoui et al. / Journal of the Air & Waste Management Association 64 (2014) 1102–1111 1105
Dow
nloa
ded
by [
Uni
vers
ity o
f C
inci
nnat
i Lib
rari
es]
at 1
2:19
18
Sept
embe
r 20
14
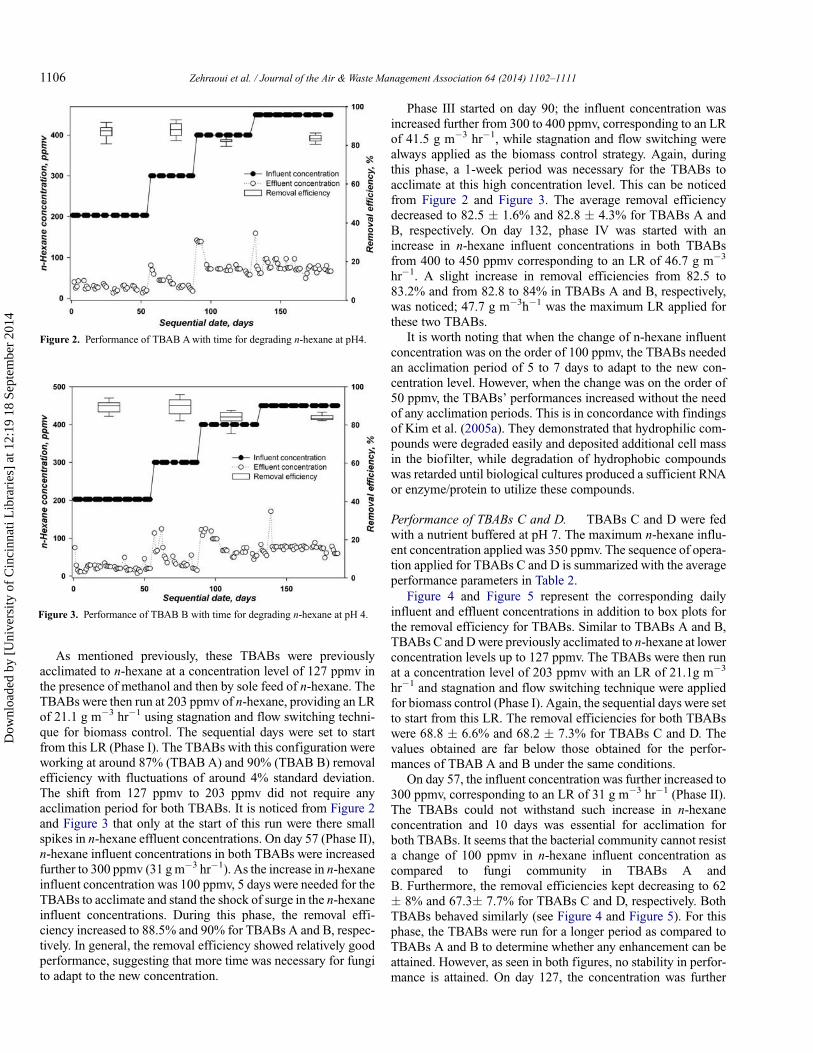
As mentioned previously, these TBABs were previouslyacclimated to n-hexane at a concentration level of 127 ppmv inthe presence of methanol and then by sole feed of n-hexane. TheTBABs were then run at 203 ppmv of n-hexane, providing an LRof 21.1 g m�3 hr�1 using stagnation and flow switching techni-que for biomass control. The sequential days were set to startfrom this LR (Phase I). The TBABs with this configuration wereworking at around 87% (TBAB A) and 90% (TBAB B) removalefficiency with fluctuations of around 4% standard deviation.The shift from 127 ppmv to 203 ppmv did not require anyacclimation period for both TBABs. It is noticed from Figure 2and Figure 3 that only at the start of this run were there smallspikes in n-hexane effluent concentrations. On day 57 (Phase II),n-hexane influent concentrations in both TBABs were increasedfurther to 300 ppmv (31 gm�3 hr�1). As the increase in n-hexaneinfluent concentration was 100 ppmv, 5 days were needed for theTBABs to acclimate and stand the shock of surge in the n-hexaneinfluent concentrations. During this phase, the removal effi-ciency increased to 88.5% and 90% for TBABs A and B, respec-tively. In general, the removal efficiency showed relatively goodperformance, suggesting that more time was necessary for fungito adapt to the new concentration.
Phase III started on day 90; the influent concentration wasincreased further from 300 to 400 ppmv, corresponding to an LRof 41.5 g m�3 hr�1, while stagnation and flow switching werealways applied as the biomass control strategy. Again, duringthis phase, a 1-week period was necessary for the TBABs toacclimate at this high concentration level. This can be noticedfrom Figure 2 and Figure 3. The average removal efficiencydecreased to 82.5 � 1.6% and 82.8 � 4.3% for TBABs A andB, respectively. On day 132, phase IV was started with anincrease in n-hexane influent concentrations in both TBABsfrom 400 to 450 ppmv corresponding to an LR of 46.7 g m�3
hr�1. A slight increase in removal efficiencies from 82.5 to83.2% and from 82.8 to 84% in TBABs A and B, respectively,was noticed; 47.7 g m�3h�1 was the maximum LR applied forthese two TBABs.
It is worth noting that when the change of n-hexane influentconcentration was on the order of 100 ppmv, the TBABs neededan acclimation period of 5 to 7 days to adapt to the new con-centration level. However, when the change was on the order of50 ppmv, the TBABs’ performances increased without the needof any acclimation periods. This is in concordance with findingsof Kim et al. (2005a). They demonstrated that hydrophilic com-pounds were degraded easily and deposited additional cell massin the biofilter, while degradation of hydrophobic compoundswas retarded until biological cultures produced a sufficient RNAor enzyme/protein to utilize these compounds.
Performance of TBABs C and D. TBABs C and D were fedwith a nutrient buffered at pH 7. The maximum n-hexane influ-ent concentration applied was 350 ppmv. The sequence of opera-tion applied for TBABs C and D is summarized with the averageperformance parameters in Table 2.
Figure 4 and Figure 5 represent the corresponding dailyinfluent and effluent concentrations in addition to box plots forthe removal efficiency for TBABs. Similar to TBABs A and B,TBABs C and Dwere previously acclimated to n-hexane at lowerconcentration levels up to 127 ppmv. The TBABs were then runat a concentration level of 203 ppmv with an LR of 21.1g m�3
hr�1 and stagnation and flow switching technique were appliedfor biomass control (Phase I). Again, the sequential days were setto start from this LR. The removal efficiencies for both TBABswere 68.8 � 6.6% and 68.2 � 7.3% for TBABs C and D. Thevalues obtained are far below those obtained for the perfor-mances of TBAB A and B under the same conditions.
On day 57, the influent concentration was further increased to300 ppmv, corresponding to an LR of 31 g m�3 hr�1 (Phase II).The TBABs could not withstand such increase in n-hexaneconcentration and 10 days was essential for acclimation forboth TBABs. It seems that the bacterial community cannot resista change of 100 ppmv in n-hexane influent concentration ascompared to fungi community in TBABs A andB. Furthermore, the removal efficiencies kept decreasing to 62� 8% and 67.3� 7.7% for TBABs C and D, respectively. BothTBABs behaved similarly (see Figure 4 and Figure 5). For thisphase, the TBABs were run for a longer period as compared toTBABs A and B to determine whether any enhancement can beattained. However, as seen in both figures, no stability in perfor-mance is attained. On day 127, the concentration was further
Figure 2. Performance of TBAB Awith time for degrading n-hexane at pH4.
Figure 3. Performance of TBAB B with time for degrading n-hexane at pH 4.
Zehraoui et al. / Journal of the Air & Waste Management Association 64 (2014) 1102–11111106
Dow
nloa
ded
by [
Uni
vers
ity o
f C
inci
nnat
i Lib
rari
es]
at 1
2:19
18
Sept
embe
r 20
14
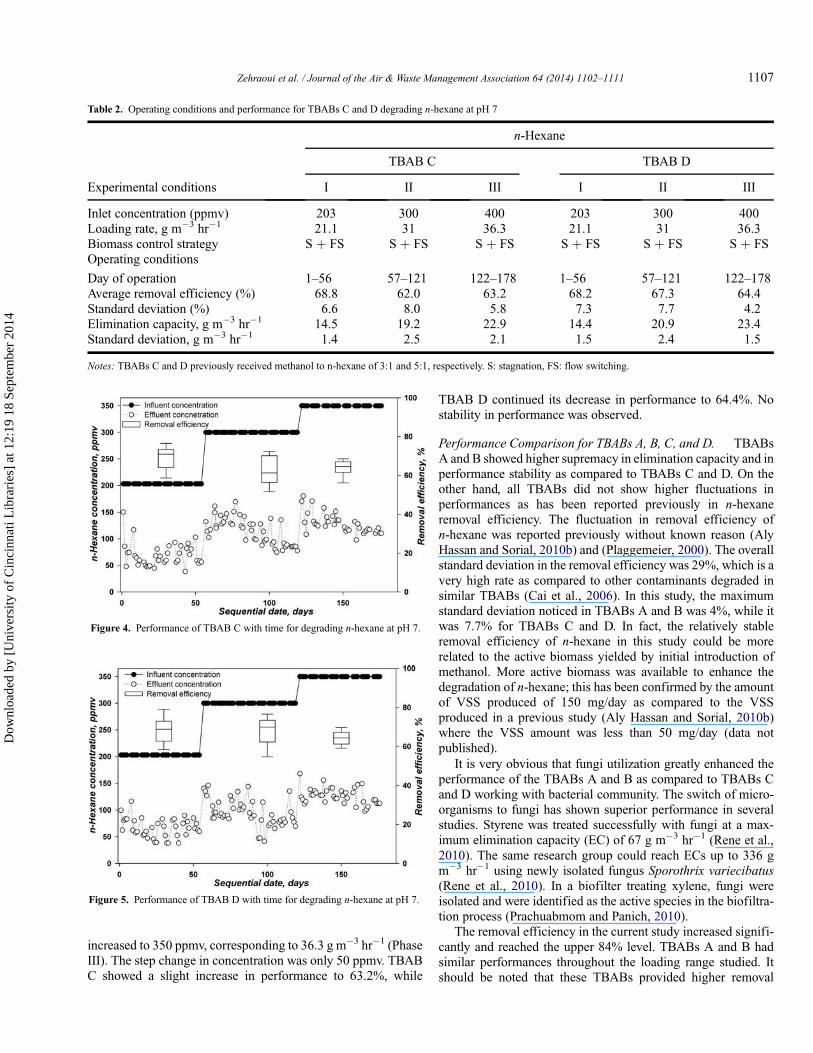
increased to 350 ppmv, corresponding to 36.3 g m�3 hr�1 (PhaseIII). The step change in concentration was only 50 ppmv. TBABC showed a slight increase in performance to 63.2%, while
TBAB D continued its decrease in performance to 64.4%. Nostability in performance was observed.
Performance Comparison for TBABs A, B, C, and D. TBABsA and B showed higher supremacy in elimination capacity and inperformance stability as compared to TBABs C and D. On theother hand, all TBABs did not show higher fluctuations inperformances as has been reported previously in n-hexaneremoval efficiency. The fluctuation in removal efficiency ofn-hexane was reported previously without known reason (AlyHassan and Sorial, 2010b) and (Plaggemeier, 2000). The overallstandard deviation in the removal efficiency was 29%, which is avery high rate as compared to other contaminants degraded insimilar TBABs (Cai et al., 2006). In this study, the maximumstandard deviation noticed in TBABs A and B was 4%, while itwas 7.7% for TBABs C and D. In fact, the relatively stableremoval efficiency of n-hexane in this study could be morerelated to the active biomass yielded by initial introduction ofmethanol. More active biomass was available to enhance thedegradation of n-hexane; this has been confirmed by the amountof VSS produced of 150 mg/day as compared to the VSSproduced in a previous study (Aly Hassan and Sorial, 2010b)where the VSS amount was less than 50 mg/day (data notpublished).
It is very obvious that fungi utilization greatly enhanced theperformance of the TBABs A and B as compared to TBABs Cand D working with bacterial community. The switch of micro-organisms to fungi has shown superior performance in severalstudies. Styrene was treated successfully with fungi at a max-imum elimination capacity (EC) of 67 g m�3 hr�1 (Rene et al.,2010). The same research group could reach ECs up to 336 gm�3 hr�1 using newly isolated fungus Sporothrix variecibatus(Rene et al., 2010). In a biofilter treating xylene, fungi wereisolated and were identified as the active species in the biofiltra-tion process (Prachuabmom and Panich, 2010).
The removal efficiency in the current study increased signifi-cantly and reached the upper 84% level. TBABs A and B hadsimilar performances throughout the loading range studied. Itshould be noted that these TBABs provided higher removal
Table 2. Operating conditions and performance for TBABs C and D degrading n-hexane at pH 7
n-Hexane
TBAB C TBAB D
Experimental conditions I II III I II III
Inlet concentration (ppmv) 203 300 400 203 300 400Loading rate, g m�3 hr�1 21.1 31 36.3 21.1 31 36.3Biomass control strategy S þ FS S þ FS S þ FS S þ FS S þ FS S þ FSOperating conditions
Day of operation 1–56 57–121 122–178 1–56 57–121 122–178Average removal efficiency (%) 68.8 62.0 63.2 68.2 67.3 64.4Standard deviation (%) 6.6 8.0 5.8 7.3 7.7 4.2Elimination capacity, g m�3 hr�1 14.5 19.2 22.9 14.4 20.9 23.4Standard deviation, g m�3 hr�1 1.4 2.5 2.1 1.5 2.4 1.5
Notes: TBABs C and D previously received methanol to n-hexane of 3:1 and 5:1, respectively. S: stagnation, FS: flow switching.
Figure 4. Performance of TBAB C with time for degrading n-hexane at pH 7.
Figure 5. Performance of TBAB D with time for degrading n-hexane at pH 7.
Zehraoui et al. / Journal of the Air & Waste Management Association 64 (2014) 1102–1111 1107
Dow
nloa
ded
by [
Uni
vers
ity o
f C
inci
nnat
i Lib
rari
es]
at 1
2:19
18
Sept
embe
r 20
14
efficiencies and greater elimination capacities as compared toTBABs C and D. These findings were in concordance with ourprevious published works where TBABs running under acidicconditions, using sodium formate as a nutrient buffer, had alwayshigher performances compare to the TBABs running underneutral pH using sodium bicarbonate as a buffer (Aly Hassanand Sorial, 2010b; Zehraoui et al., 2012, 2013; Zehraoui et al.,2014).
On the other hand, even though TBABs C and D, fed bynutrient buffer at pH 7, did not achieve results comparable withthose of TBABs A and B, the TBABs supported n-hexane LRs of36.3 g m�3 hr�1 to achieve an EC of 23.4 g m�3 hr�1. Ascompared to previous studies and for the same operating condi-tions, Aly Hassan and Sorial (2010b) obtained amaximum EC of8 g m�3 hr�1 for an LR of 21.5 g m�3 hr�1 for TBAB workingunder neutral buffer, while for the same TBAB with surfactantthe maximum EC obtained was 8.8 g m�3 hr�1 for an LR of 16.1g m�3 hr�1. In another study (Aly Hassan and Sorial, 2010a) intreating n-hexane with benzene, the maximum EC was 10.16g m�3 hr�1 for an LR of 21.48 g m�3 hr�1 with a high standarddeviation of 32%. In this study, the removal efficiency wasgreatly enhanced by at least three folds.
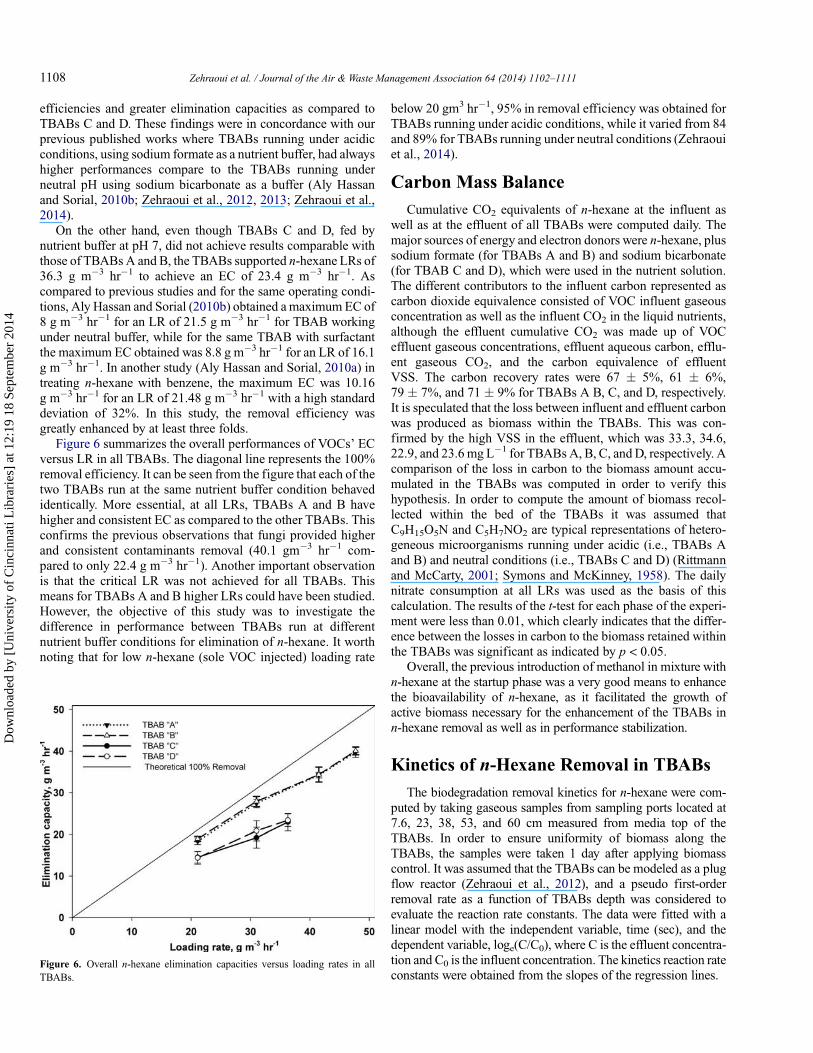
Figure 6 summarizes the overall performances of VOCs’ ECversus LR in all TBABs. The diagonal line represents the 100%removal efficiency. It can be seen from the figure that each of thetwo TBABs run at the same nutrient buffer condition behavedidentically. More essential, at all LRs, TBABs A and B havehigher and consistent EC as compared to the other TBABs. Thisconfirms the previous observations that fungi provided higherand consistent contaminants removal (40.1 gm�3 hr�1 com-pared to only 22.4 g m�3 hr�1). Another important observationis that the critical LR was not achieved for all TBABs. Thismeans for TBABs A and B higher LRs could have been studied.However, the objective of this study was to investigate thedifference in performance between TBABs run at differentnutrient buffer conditions for elimination of n-hexane. It worthnoting that for low n-hexane (sole VOC injected) loading rate
below 20 gm3 hr�1, 95% in removal efficiency was obtained forTBABs running under acidic conditions, while it varied from 84and 89% for TBABs running under neutral conditions (Zehraouiet al., 2014).
Carbon Mass Balance
Cumulative CO2 equivalents of n-hexane at the influent aswell as at the effluent of all TBABs were computed daily. Themajor sources of energy and electron donors were n-hexane, plussodium formate (for TBABs A and B) and sodium bicarbonate(for TBAB C and D), which were used in the nutrient solution.The different contributors to the influent carbon represented ascarbon dioxide equivalence consisted of VOC influent gaseousconcentration as well as the influent CO2 in the liquid nutrients,although the effluent cumulative CO2 was made up of VOCeffluent gaseous concentrations, effluent aqueous carbon, efflu-ent gaseous CO2, and the carbon equivalence of effluentVSS. The carbon recovery rates were 67 � 5%, 61 � 6%,79 � 7%, and 71 � 9% for TBABs A B, C, and D, respectively.It is speculated that the loss between influent and effluent carbonwas produced as biomass within the TBABs. This was con-firmed by the high VSS in the effluent, which was 33.3, 34.6,22.9, and 23.6 mg L�1 for TBABs A, B, C, andD, respectively. Acomparison of the loss in carbon to the biomass amount accu-mulated in the TBABs was computed in order to verify thishypothesis. In order to compute the amount of biomass recol-lected within the bed of the TBABs it was assumed thatC9H15O5N and C5H7NO2 are typical representations of hetero-geneous microorganisms running under acidic (i.e., TBABs Aand B) and neutral conditions (i.e., TBABs C and D) (Rittmannand McCarty, 2001; Symons and McKinney, 1958). The dailynitrate consumption at all LRs was used as the basis of thiscalculation. The results of the t-test for each phase of the experi-ment were less than 0.01, which clearly indicates that the differ-ence between the losses in carbon to the biomass retained withinthe TBABs was significant as indicated by p < 0.05.
Overall, the previous introduction of methanol in mixture withn-hexane at the startup phase was a very good means to enhancethe bioavailability of n-hexane, as it facilitated the growth ofactive biomass necessary for the enhancement of the TBABs inn-hexane removal as well as in performance stabilization.
Kinetics of n-Hexane Removal in TBABs
The biodegradation removal kinetics for n-hexane were com-puted by taking gaseous samples from sampling ports located at7.6, 23, 38, 53, and 60 cm measured from media top of theTBABs. In order to ensure uniformity of biomass along theTBABs, the samples were taken 1 day after applying biomasscontrol. It was assumed that the TBABs can be modeled as a plugflow reactor (Zehraoui et al., 2012), and a pseudo first-orderremoval rate as a function of TBABs depth was considered toevaluate the reaction rate constants. The data were fitted with alinear model with the independent variable, time (sec), and thedependent variable, loge(C/C0), where C is the effluent concentra-tion and C0 is the influent concentration. The kinetics reaction rateconstants were obtained from the slopes of the regression lines.
Figure 6. Overall n-hexane elimination capacities versus loading rates in allTBABs.
Zehraoui et al. / Journal of the Air & Waste Management Association 64 (2014) 1102–11111108
Dow
nloa
ded
by [
Uni
vers
ity o
f C
inci
nnat
i Lib
rari
es]
at 1
2:19
18
Sept
embe
r 20
14
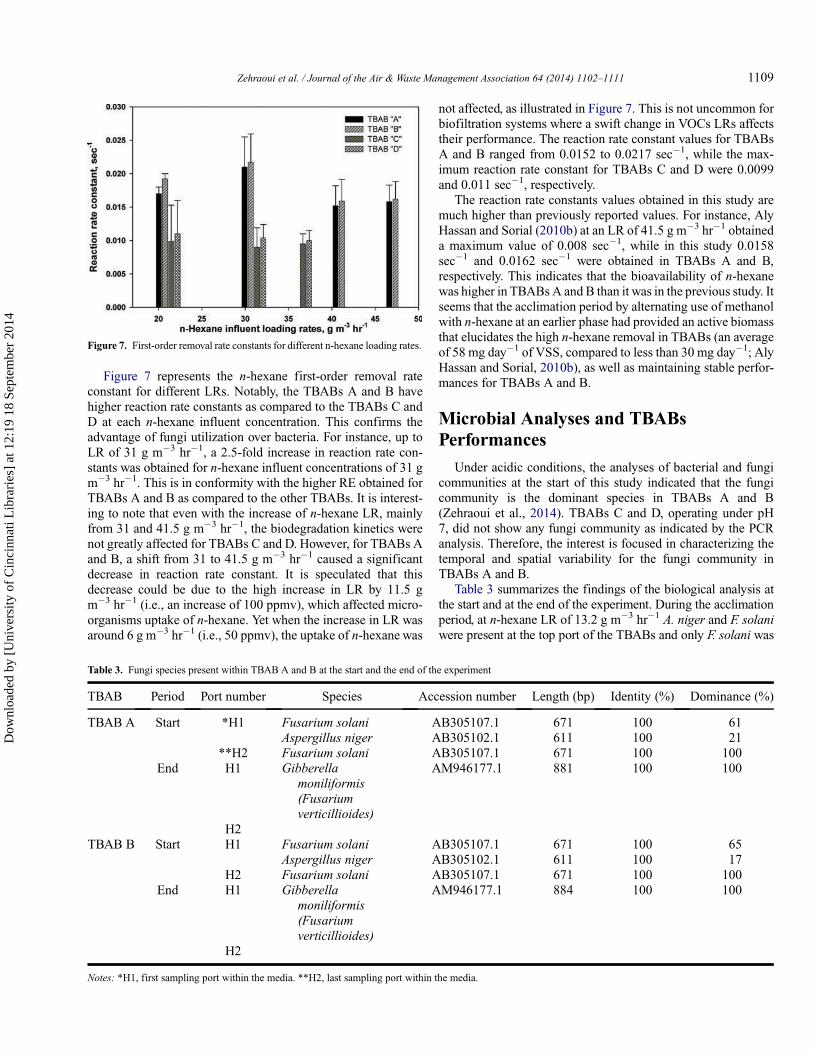
Figure 7 represents the n-hexane first-order removal rateconstant for different LRs. Notably, the TBABs A and B havehigher reaction rate constants as compared to the TBABs C andD at each n-hexane influent concentration. This confirms theadvantage of fungi utilization over bacteria. For instance, up toLR of 31 g m�3 hr�1, a 2.5-fold increase in reaction rate con-stants was obtained for n-hexane influent concentrations of 31 gm�3 hr�1. This is in conformity with the higher RE obtained forTBABs A and B as compared to the other TBABs. It is interest-ing to note that even with the increase of n-hexane LR, mainlyfrom 31 and 41.5 g m�3 hr�1, the biodegradation kinetics werenot greatly affected for TBABs C and D. However, for TBABs Aand B, a shift from 31 to 41.5 g m�3 hr�1 caused a significantdecrease in reaction rate constant. It is speculated that thisdecrease could be due to the high increase in LR by 11.5 gm�3 hr�1 (i.e., an increase of 100 ppmv), which affected micro-organisms uptake of n-hexane. Yet when the increase in LR wasaround 6 g m�3 hr�1 (i.e., 50 ppmv), the uptake of n-hexane was
not affected, as illustrated in Figure 7. This is not uncommon forbiofiltration systems where a swift change in VOCs LRs affectstheir performance. The reaction rate constant values for TBABsA and B ranged from 0.0152 to 0.0217 sec�1, while the max-imum reaction rate constant for TBABs C and D were 0.0099and 0.011 sec�1, respectively.
The reaction rate constants values obtained in this study aremuch higher than previously reported values. For instance, AlyHassan and Sorial (2010b) at an LR of 41.5 g m�3 hr�1 obtaineda maximum value of 0.008 sec�1, while in this study 0.0158sec�1 and 0.0162 sec�1 were obtained in TBABs A and B,respectively. This indicates that the bioavailability of n-hexanewas higher in TBABsA and B than it was in the previous study. Itseems that the acclimation period by alternating use of methanolwith n-hexane at an earlier phase had provided an active biomassthat elucidates the high n-hexane removal in TBABs (an averageof 58 mg day�1 of VSS, compared to less than 30 mg day�1; AlyHassan and Sorial, 2010b), as well as maintaining stable perfor-mances for TBABs A and B.
Microbial Analyses and TBABsPerformances
Under acidic conditions, the analyses of bacterial and fungicommunities at the start of this study indicated that the fungicommunity is the dominant species in TBABs A and B(Zehraoui et al., 2014). TBABs C and D, operating under pH7, did not show any fungi community as indicated by the PCRanalysis. Therefore, the interest is focused in characterizing thetemporal and spatial variability for the fungi community inTBABs A and B.
Table 3 summarizes the findings of the biological analysis atthe start and at the end of the experiment. During the acclimationperiod, at n-hexane LR of 13.2 g m�3 hr�1 A. niger and F. solaniwere present at the top port of the TBABs and only F. solani was
Figure 7. First-order removal rate constants for different n-hexane loading rates.
Table 3. Fungi species present within TBAB A and B at the start and the end of the experiment
TBAB Period Port number Species Accession number Length (bp) Identity (%) Dominance (%)
TBAB A Start *H1 Fusarium solani AB305107.1 671 100 61Aspergillus niger AB305102.1 611 100 21
**H2 Fusarium solani AB305107.1 671 100 100End H1 Gibberella
moniliformis(Fusariumverticillioides)
AM946177.1 881 100 100
H2TBAB B Start H1 Fusarium solani AB305107.1 671 100 65
Aspergillus niger AB305102.1 611 100 17H2 Fusarium solani AB305107.1 671 100 100
End H1 Gibberellamoniliformis(Fusariumverticillioides)
AM946177.1 884 100 100
H2
Notes: *H1, first sampling port within the media. **H2, last sampling port within the media.
Zehraoui et al. / Journal of the Air & Waste Management Association 64 (2014) 1102–1111 1109
Dow
nloa
ded
by [
Uni
vers
ity o
f C
inci
nnat
i Lib
rari
es]
at 1
2:19
18
Sept
embe
r 20
14
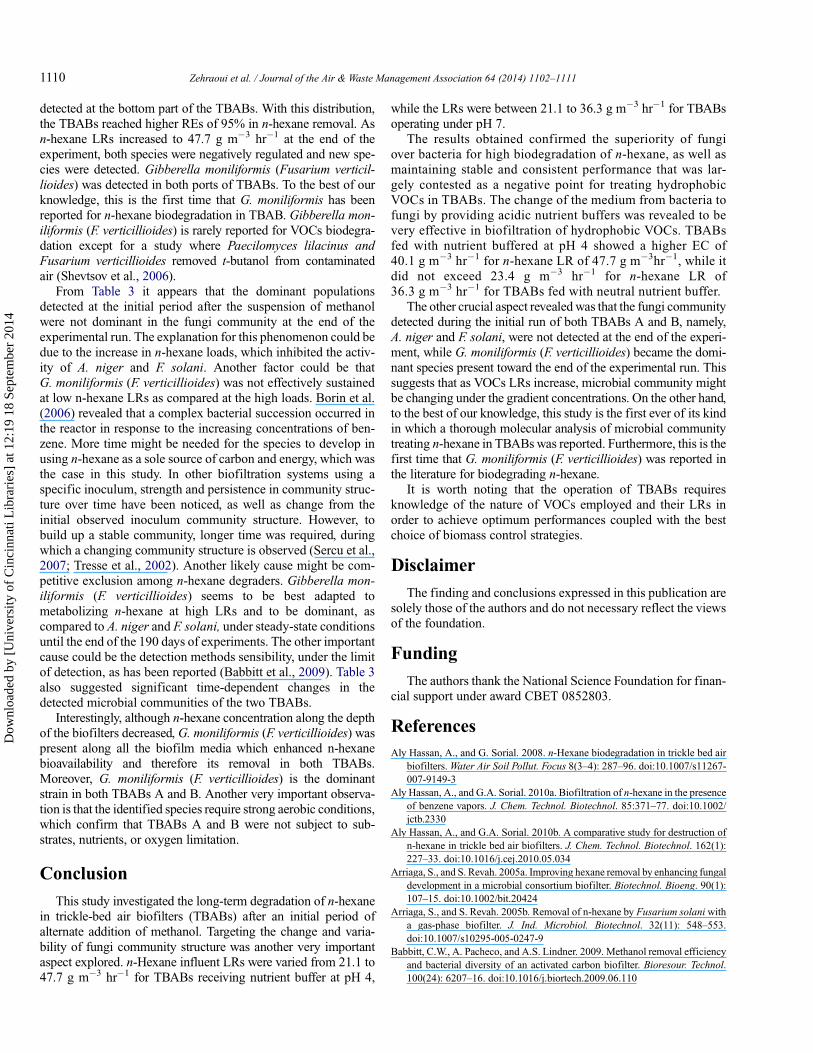
detected at the bottom part of the TBABs. With this distribution,the TBABs reached higher REs of 95% in n-hexane removal. Asn-hexane LRs increased to 47.7 g m�3 hr�1 at the end of theexperiment, both species were negatively regulated and new spe-cies were detected. Gibberella moniliformis (Fusarium verticil-lioides) was detected in both ports of TBABs. To the best of ourknowledge, this is the first time that G. moniliformis has beenreported for n-hexane biodegradation in TBAB. Gibberella mon-iliformis (F. verticillioides) is rarely reported for VOCs biodegra-dation except for a study where Paecilomyces lilacinus andFusarium verticillioides removed t-butanol from contaminatedair (Shevtsov et al., 2006).
From Table 3 it appears that the dominant populationsdetected at the initial period after the suspension of methanolwere not dominant in the fungi community at the end of theexperimental run. The explanation for this phenomenon could bedue to the increase in n-hexane loads, which inhibited the activ-ity of A. niger and F. solani. Another factor could be thatG. moniliformis (F. verticillioides) was not effectively sustainedat low n-hexane LRs as compared at the high loads. Borin et al.(2006) revealed that a complex bacterial succession occurred inthe reactor in response to the increasing concentrations of ben-zene. More time might be needed for the species to develop inusing n-hexane as a sole source of carbon and energy, which wasthe case in this study. In other biofiltration systems using aspecific inoculum, strength and persistence in community struc-ture over time have been noticed, as well as change from theinitial observed inoculum community structure. However, tobuild up a stable community, longer time was required, duringwhich a changing community structure is observed (Sercu et al.,2007; Tresse et al., 2002). Another likely cause might be com-petitive exclusion among n-hexane degraders. Gibberella mon-iliformis (F. verticillioides) seems to be best adapted tometabolizing n-hexane at high LRs and to be dominant, ascompared to A. niger and F. solani, under steady-state conditionsuntil the end of the 190 days of experiments. The other importantcause could be the detection methods sensibility, under the limitof detection, as has been reported (Babbitt et al., 2009). Table 3also suggested significant time-dependent changes in thedetected microbial communities of the two TBABs.
Interestingly, although n-hexane concentration along the depthof the biofilters decreased, G. moniliformis (F. verticillioides) waspresent along all the biofilm media which enhanced n-hexanebioavailability and therefore its removal in both TBABs.Moreover, G. moniliformis (F. verticillioides) is the dominantstrain in both TBABs A and B. Another very important observa-tion is that the identified species require strong aerobic conditions,which confirm that TBABs A and B were not subject to sub-strates, nutrients, or oxygen limitation.
Conclusion
This study investigated the long-term degradation of n-hexanein trickle-bed air biofilters (TBABs) after an initial period ofalternate addition of methanol. Targeting the change and varia-bility of fungi community structure was another very importantaspect explored. n-Hexane influent LRs were varied from 21.1 to47.7 g m�3 hr�1 for TBABs receiving nutrient buffer at pH 4,
while the LRs were between 21.1 to 36.3 g m�3 hr�1 for TBABsoperating under pH 7.
The results obtained confirmed the superiority of fungiover bacteria for high biodegradation of n-hexane, as well asmaintaining stable and consistent performance that was lar-gely contested as a negative point for treating hydrophobicVOCs in TBABs. The change of the medium from bacteria tofungi by providing acidic nutrient buffers was revealed to bevery effective in biofiltration of hydrophobic VOCs. TBABsfed with nutrient buffered at pH 4 showed a higher EC of40.1 g m�3 hr�1 for n-hexane LR of 47.7 g m�3hr�1, while itdid not exceed 23.4 g m�3 hr�1 for n-hexane LR of36.3 g m�3 hr�1 for TBABs fed with neutral nutrient buffer.
The other crucial aspect revealed was that the fungi communitydetected during the initial run of both TBABs A and B, namely,A. niger and F. solani, were not detected at the end of the experi-ment, while G. moniliformis (F. verticillioides) became the domi-nant species present toward the end of the experimental run. Thissuggests that as VOCs LRs increase, microbial community mightbe changing under the gradient concentrations. On the other hand,to the best of our knowledge, this study is the first ever of its kindin which a thorough molecular analysis of microbial communitytreating n-hexane in TBABswas reported. Furthermore, this is thefirst time that G. moniliformis (F. verticillioides) was reported inthe literature for biodegrading n-hexane.
It is worth noting that the operation of TBABs requiresknowledge of the nature of VOCs employed and their LRs inorder to achieve optimum performances coupled with the bestchoice of biomass control strategies.
Disclaimer
The finding and conclusions expressed in this publication aresolely those of the authors and do not necessary reflect the viewsof the foundation.
Funding
The authors thank the National Science Foundation for finan-cial support under award CBET 0852803.
ReferencesAly Hassan, A., and G. Sorial. 2008. n-Hexane biodegradation in trickle bed air
biofilters.Water Air Soil Pollut. Focus 8(3–4): 287–96. doi:10.1007/s11267-007-9149-3
Aly Hassan, A., and G.A. Sorial. 2010a. Biofiltration of n-hexane in the presenceof benzene vapors. J. Chem. Technol. Biotechnol. 85:371–77. doi:10.1002/jctb.2330
Aly Hassan, A., and G.A. Sorial. 2010b. A comparative study for destruction ofn-hexane in trickle bed air biofilters. J. Chem. Technol. Biotechnol. 162(1):227–33. doi:10.1016/j.cej.2010.05.034
Arriaga, S., and S. Revah. 2005a. Improving hexane removal by enhancing fungaldevelopment in a microbial consortium biofilter. Biotechnol. Bioeng. 90(1):107–15. doi:10.1002/bit.20424
Arriaga, S., and S. Revah. 2005b. Removal of n-hexane by Fusarium solaniwitha gas-phase biofilter. J. Ind. Microbiol. Biotechnol. 32(11): 548–553.doi:10.1007/s10295-005-0247-9
Babbitt, C.W., A. Pacheco, and A.S. Lindner. 2009. Methanol removal efficiencyand bacterial diversity of an activated carbon biofilter. Bioresour. Technol.100(24): 6207–16. doi:10.1016/j.biortech.2009.06.110
Zehraoui et al. / Journal of the Air & Waste Management Association 64 (2014) 1102–11111110
Dow
nloa
ded
by [
Uni
vers
ity o
f C
inci
nnat
i Lib
rari
es]
at 1
2:19
18
Sept
embe
r 20
14
Borin, S., M. Marzorati, L. Brusetti, M. Zilli, H. Cherif, A. Hassen, A. Converti,C. Sorlini, and D. Daffonchio. 2006. Microbial succession in a compost-packed biofilter treating benzene-contaminated air. Biodegradation 17(2):79–89. doi:10.1007/s10532-005-7565-5
Cai, Z., D. Kim, and G.A. Sorial. 2005. Removal of methyl isobutyl ketone fromcontaminated air by trickle-bed air biofilter. J. Environ. Eng. 131(9):1322–29. doi:10.1061/(ASCE)0733-9372(2005)131:9(1322)
Cai, Z., D. Kim, G.A. Sorial, P. Saikaly, M.M. Zein, and D.B. Oerther. 2006.Performance and Microbial Diversity of a Trickle-Bed Air Biofilter underInterchanging Contaminants. Eng. Life Sci. 6(1): 37–42. doi:10.1002/elsc.200620111
Deshusses, M.A., and H.H.J. Cox. 2000. Biotrickling filters for air pollutioncontrol. In The Encyclopedia of Environmental Microbiology, ed. G. Bitton,vol. 2, pp 782–795. New York, NY: Wiley.
Eaton, A.D., L.S. Clesceri, E.W. Rice, A.E. Greenberg, and M.A.H. Franson.2005. Standard Methods for Examination of Water & Wastewater, 21st ed.Washington, DC: American Public Health Association, American WaterWorks Association, Water Environment Federation.
Estrada, J.M., N.J.R.B. Kraakman, R. Muñoz, and R. Lebrero. 2010. A compara-tive analysis of odour treatment technologies in wastewater treatment plants.Environ. Sci. Technol. 45(3): 1100–6. doi:10.1021/es103478j
Fazaelipoor, M.H., S.A. Shojaosadati, and E.V. Farahani. 2006. Two liquid phasebiofiltration for removal of n-hexane from polluted air. Environ. Eng. Sci. 23(6): 954–59. doi:10.1089/ees.2006.23.954
García-Peña, I., I. Ortiz, S. Hernández, and S. Revah. 2008. Biofiltration ofBTEX by the fungus Paecilomyces variotii. Int. Biodeter. Biodegr. 62(4):442–47. doi:10.1016/j.ibiod.2008.03.012
Hernández-Meléndez, O., E. Bárzana, S. Arriaga, M. Hernández-Luna, and S.Revah. 2008. Fungal removal of gaseous hexane in biofilters packed withpoly(ethylene carbonate) pine sawdust or peat composites. Biotechnol.Bioeng. 100(5): 864–71. doi:10.1002/bit.21825
Kim, D., Z. Cai, and G.A. Sorial. 2005a. Impact of interchanging VOCs on theperformance of trickle bed air biofilter. Chem. Eng. J. 113(2–3): 153–60.doi:10.1016/j.cej.2005.04.004
Kim, D., Z. Cai, and G.A. Sorial. 2005b. Behavior of trickle bed air biofilter fortoluene removal: effect of non-use periods. Environ. Prog. 24(2): 155–61.doi:10.1002/ep.10079
Kim, D., Z. Cai, and G.A. Sorial. 2005c. Evaluation of trickle-bed air biofilterperformance under periodic stressed operating conditions as a function ofstyrene loading. J. Air Waste Manage. Assoc. 55(2): 200–9. doi:10.1080/10473289.2005.10464611
Plaggemeier, T. 2000. Elimination der schwer wasserloslichenModellabluftinhaltsstoffe n-Hexan und Toluol im Biorieselbettverfahren.Stuttgart, Germany: Universitaet Stuttgart.
Prachuabmom, A., and N. Panich. 2010. Isolation and identification of xylenedegrading microorganisms from biofilter. J. Appl. Sci. 10(7): 585–89.doi:10.3923/jas.2010.585.589
Rene, E.R., M.C. Veiga, and C. Kennes. 2010. Biodegradation of gas-phasestyrene using the fungus Sporothrix variecibatus: Impact of pollutant loadand transient operation. Chemosphere 79(2): 221–27. doi:10.1016/j.chemosphere.2010.01.036
Rittmann, B.E., and P.L. McCarty. 2001. Environmental Biotechnology:Principles and Applications, 128–29. New York, NY: McGraw-Hill.
Sempere, F., C. Gabaldón, V. Martínez-Soria, J.M. Penya-roja, and F.J. Álvarez-Hornos. 2009. Evaluation of a combined activated carbon prefilter andbiotrickling filter system treating variable ethanol and ethyl acetate gaseousemissions. Eng. Life Sci. 9(4): 317–23. doi:10.1002/elsc.200900011
Sercu, B., N. Boon, S.V. Beken, W. Verstraete, and H. Van Langenhove. 2007.Performance and microbial analysis of defined and non-defined inocula forthe removal of dimethyl sulfide in a biotrickling filter. Biotechnol. Bioeng. 96(4): 661–72. doi:10.1002/bit.21059
Shevtsov, J., I. Eraso, and G. Stutte. 2006. Paecilomyces lilacinus and Fusariumverticillioides Remove t-Butanol from Contaminated Air. SAE TechnicalPaper 2006-01-2150. doi:10.4271/2006-01-2150
Soeta, N., M. Terashima, M. Gotoh, S. Mori, K. Nishiyama, K. Ishioka, H.Kaneko, and T. Suzutani. 2009. An improved rapid quantitative detectionand identification method for awide range of fungi. J. Med. Microbiol. 58(8):1037–44. doi:10.1099/jmm.0.006858-0
Spigno, G., and D.M. De Faveri. 2005. Modeling of a vapor-phase fungi bior-eactor for the abatement of hexane: Fluid dynamics and kinetic aspects.Biotechnol. Bioeng. 89(3): 319–28. doi:10.1002/bit.20336
Spigno, G., C. Pagella, M. Daria Fumi, R. Molteni, and D. Marco De Faveri.2003. VOCs removal from waste gases: Gas-phase bioreactor for the abate-ment of hexane by Aspergillus niger. Chem. Eng. Sci. 58(3–6): 739–46.doi:10.1016/s0009-2509(02)00603-6
Symons, J.M., and R.E. McKinney. 1958. The biochemistry of nitrogen in thesynthesis of activated sludge. Sewage Ind. Wastes 30(7): 874–90.
Tresse, O., M.J. Lorrain, and D. Rho. 2002. Population dynamics of free-floatingand attached bacteria in a styrene-degrading biotrickling filter analyzed bydenaturing gradient gel electrophoresis. Appl. Microbiol. Biotechnol. 59(4–5): 585–90. doi:10.1007/s00253-002-1039-z
U.S. Environmental Protection Agency. 1990. The Clean Air Act Amendments of1990 List of Hazardous Air Pollutants. http://www.epa.gov/ttnatw01/orig189.html (accessed June 9, 2011).
Van Groenestijn, J.W., and M.E. Lake. 1999. Elimination of alkanes from off-gases using biotrickling filters containing two liquid phases. Environ. Prog.18(3): 151–55. doi:10.1002/(ISSN)1547-5921
Van Groenestijn, J.W., W.N.M. Van Heiningen, and N.J.R. Kraakman. 2001.Biofilters based on the action of fungi. Water Sci. Technol. 44:227–32.
Vigueras, G., S. Arriaga, K. Shirai, M. Morales, and S. Revah. 2009.Hydrophobic response of the fungus Rhinocladiella similis in the biofiltra-tion with volatile organic compoundswith different polarity. Biotechnol. Lett.31(8): 1203–9. doi:10.1007/s10529-009-9987-3
Woertz, J.R., and K.A. Kinney. 2004. Influence of sodium dodecyl sulfate andTween 20 on fungal growth and toluene degradation in a vapor-phase bior-eactor. J. Environ. Eng. 130(3): 292–99. doi:10.1061/(ASCE)0733-9372(2004)130:3(292)
Yang, C., F. Chen, S. Luo, G. Xie, G. Zeng, and C. Fan. 2010. Effects ofsurfactants and salt on Henry’s constant of n-hexane. J. Hazard. Mater. 175(1–3): 187–92. doi:10.1016/j.jhazmat.2009.09.147
Zehraoui, A., A.A. Hassan, and G.A. Sorial. 2012. Effect of methanol on thebiofiltration of n-hexane. J. Hazard. Mater. 219–220(0): 176–182.doi:10.1016/j.jhazmat.2012.03.075
Zehraoui, A., A.A. Hassan, and G.A. Sorial. 2013. Biological treatment of n-hexane and methanol in trickle bed air biofilters under acidic conditions.Biochem. Eng. J. 77:129–35. doi:10.1016/j.bej.2013.06.001
Zehraoui, A., V. Kapoor, D. Wendell, and G.A. Sorial. 2014. Impact of alternateuse of methanol on n-hexane biofiltration and microbial community structurediversity Biochem. Eng. J. 85: 110–18. doi:10.1016/j.bej.2014.02.009
Zhu, X., M.T. Suidan, A. Pruden, C. Yang, C. Alonso, B.J. Kim, and B.R. Kim.2004. Effect of substrate Henry’s constant on biofilter performance. J. AirWaste Manage. Assoc. 54(4): 409–18. doi:10.1080/10473289.2004.10470918
About the AuthorsAbderrahman Zehraoui is a Ph.D. graduate student and David Wendell is aprofessor in the Environmental Engineering Program, Department ofBiomedical, Chemical, and Environmental Engineering, College ofEngineering and Applied Science, University of Cincinnati, Cincinnati, OH.
George A. Sorial is a professor at the Environmental Engineering Program andDepartment Head, Department of Biomedical, Chemical, and EnvironmentalEngineering, College of Engineering and Applied Science, University ofCincinnati, Cincinnati, OH.
Zehraoui et al. / Journal of the Air & Waste Management Association 64 (2014) 1102–1111 1111
Dow
nloa
ded
by [
Uni
vers
ity o
f C
inci
nnat
i Lib
rari
es]
at 1
2:19
18
Sept
embe
r 20
14
Related Documents