NATIONAL INSTITUTE OF TECHNOLOGY ROURKELA PROJECT REPORT ON “TREATEMENT OF INDUSTRIAL EFFLUENTS IN A BIOREACTOR” SUBMITTED BY:- NAYANA KUMAR BEHERA ROLL NO-10500008 Session 2008-2009 UNDER THE GUIDANCE OF Mr. H.M. Jena DEPT OF CHEMICAL ENGINEERING NATIONAL INSTITUTE OF TECHNOLOGY ROURKELA-769008

Welcome message from author
This document is posted to help you gain knowledge. Please leave a comment to let me know what you think about it! Share it to your friends and learn new things together.
Transcript

NATIONAL INSTITUTE OF TECHNOLOGY
ROURKELA
PROJECT REPORT ON
“TREATEMENT OF INDUSTRIAL EFFLUENTS IN A
BIOREACTOR”
SUBMITTED BY:-
NAYANA KUMAR BEHERA
ROLL NO-10500008
Session 2008-2009
UNDER THE GUIDANCE OF
Mr. H.M. Jena
DEPT OF CHEMICAL ENGINEERING
NATIONAL INSTITUTE OF TECHNOLOGY
ROURKELA-769008

NATIONAL INSTITUTE OF TECHNOLOGY
ROURKELA
CERTIFICATE
This is to certify that the project entitled, “TREATEMENT OF INDUSTRIAL
EFFLUENTS IN A BIOREACTOR” submitted by Sri NAYANA KUMAR BEHERA in
partial fulfillments for the requirements for the award of Bachelor of Technology Degree in
Chemical Engineering at National Institute of Technology, Rourkela (Deemed University) is an
authentic work carried out by him under my supervision and guidance.
To the best of my knowledge, the matter embodied in the project report has not been
submitted to any other University / Institute for the award of any Degree or Diploma.
Mr. H. M. Jena Department of Chemical Engineering
Date:- National Institute of Technology
Rourkela – 769008

ACKNOWLEDGEMENT
I would like to make my deepest appreciation and gratitude to Mr H.M. Jena for his invaluable
guidance, constructive criticism and encouragement during the course of this project.
Thanks to Dr. R. K. Singh and Dr. S. K. Maity for being uniformly excellent advisor. He was
always open, helpful and provided strong broad idea .
I am also grateful to Prof. S. K. Agarwal, Head of the Department,
Chemical Engineering for providing the necessary opportunities for the completion of this
project
Rourkela NAYANA KUMAR BEHERA
Date ROLL NO-1050008
DEPT OF CHEMICAL ENGG
NIT, ROURKELA -769008

CONTENTS
Page No
ABSTRACT 1
1. 1.FRESH WATER CRISIS 2
1.2 .ENVIRONMENTAL POLLUTION 3
1.3. TREATEMENT AND RECYCLE 3
1.4. HAZARDOUS EFFECT OF PHENOL 5
1.4.1. PHENOL 5
1.4.2.USES OF PHENOL 5
1.4.3.TOXICITY OF PHENOL 5
1.4.4. PHENOLIC EFFULENT 6
1.4.5 NESSECITY OF PHENOL DEGRADATION 6
1.4.6 METHODS OF PHENOL DEGRADATION 7
1.5. TREATEMENT METHODS 7
1.5.1 BIODEGRADATION 8
1.5.2 AEROBIC DEGRADATION 9
1.5.3 DIGESTION PATHWAY 9
1.5.4 CHARACTESTIC OF AEROBIC BIORECTORS 10
1.5.5 ADVENTAGES OFAEROBIC BIORECTORS IN WASTEWATER TREATEMENT 11
1.5.6 FLUIDIZED BED BIORECTOR 11
1.5.7 FLUIDIZED BED BIORECTOR FOR WASTE WATER TREATEMENT 12
1.5.7 ACTIVATED SLUDGE 14
1.6 PSEUDOMONAS PUTIDA 15
1.7 IMMOBILIZATION OF MICROBIAL CELLS 15
2.1 ANALYTICAL METHODS FOR WATER QUALITY PARAMETERS 17

2.2 METHODS TO KNOW THE PHENOL CONCENTRATION IN THE EFFULENT 18
2.2.1 SPECTOPHOTOMETRIC METHOD 18
2.2.1.1 DIRECTPHOTOMETRIC METHOD 19
2.2.1.2 CHLOROPFORM EXTRACTION METHOD 20
2.3.DETERMINATION OF CHEMICAL OXYGEN DEMAND 20
2.3.1 PRINCIPLE 20
2.3.2 APPARATUS REQUIRED 20
2.3.3 REAGENT REQUIRED 21
2.3.4 PROCEDURE 21
2.4. DETERMINATION OF BIOCHEMICAL OXYGEN DEMAND 22
2.4.1 PRINCIPLE 22
2.4.2 APPARATUS REQUIRED 22
2.4.3 REGENT REQUIRED 22
2.4.4 PROCEDURE 23
3.1DIRECT PHOTOMETRIC METHOD 25
3.2 CHLOROFORM EXTRACTION METHOD 26
3.3 DETERMINATON OF CHEMICAL OXYGEN DEMAND 28
3.4 Future Work 32
4. Conclusion 33
REFERENCES 34

LIST OF FIGURES OR GRAPHS
Title Page no.
Structure of phenol 5
Schematic Diagram of Fluidized Bed 12
Schematic diagram of an activated sludge process 14
Pseudomonas putida 15
Direct photometric method 25
Chloroform extraction method 26
No phenol added 28
50 ppm phenol added 28
100 ppm phenol added 28
150 ppm phenol added 28
200 ppm phenol added 29
250 ppm phenol added 29
Increasing phenol conc 29
Constant phenol conc(100 ppm) 30
SEM image of Immobilized pseudomonas putida on plastic beads after 4 days. 31
Modified SEM image of Immobilized pseudomonas putida on plastic beads after 4 days. 32
LIST OF TABLES
Title Page no.
Characteristic of waste water from process industries 4
Direct photometric method (observation) 25
Chloroform extraction method (observation) 26
Cod reading for increasing phenol concentration 27
Cod reading for constant phenol addition (100 ppm) 29

1
ABSTRACT
The sources of occurrence of various pollutants from chemical process industries and there
harmful effects have been highlighted. Typical composition of wastewater from various sources
presented. The methods of treatment of wastewater briefly discussed. Special attention has been
paid to the biological treatment mentioning the drawbacks of the traditional methods. The
relative advantages of various modern bioreactors working on immobilization technique have
been projected. A comparative picture with respect to various modern bioreactors has been
presented and the uniqueness of the activated sludge and the fluidized bioreactors in the
treatment of wastewater has been emphasized.
Effluent was collected from Rourkela Steel Plant. BOD and COD were then done to measure the
oxygen requirement of the effluent. It was then subjected to batch culturing at pH 6.5 to 7.5 and
temperature 28 to 30ºC. COD was done on each day of batch culture. The gradual decrease of
COD determines the viability of the microorganisms in the batch. After some days of batch
culturing plastic beads were inserted so that adsorption over the plastic beads can occur and
immobilization can take place. Then SEM was used to know the thickness of the microbes
coated over the surface of the beads. Phenol is one of the most common contaminant, the
methods of treatment of phenolic wastewater discussed emphasis given on the aerobic biological
treatment. Special attention has been paid to the biological treatment. The relative advantages of
various modern bioreactors working on immobilization technique have been projected.
Keywords: Biological treatment, BOD, COD, Phenol, Cell Immobilization.

2
CHAPTER 1
Introduction and Literature Survey
1.1. Fresh Water Crisis
Water is, literally, the source of life on earth. About 70 percent of the earth is water, but only one
percent is accessible surface freshwater. The one percent surface fresh water is regularly renewed
by rainfall and other means and thus available on a sustainable basis and easily considered
accessible for human use. Water is the biggest crisis facing the world today. In India the crisis in
terms spread and severity affects one in three people. As per an estimate in 2000, there were
7,800 cubic meters of fresh water available per person annually. It will be 5,100 cubic meters
(51,00,000 liters) by 2025. Even this amount is sufficient for human needs, if it were properly
distributed. But, equitable distribution is not possible India, which has 16 percent of world’s
population, 2.45 percent of world’s land area and 4 percent of the world’s water resources, has
already faced with grave drinking water crisis. Water is the single largest problem facing India
today. Years of rapid population growth and increasing water consumption for agriculture,
industry and municipalities and other areas have strained Indian fresh water resources. In many
parts of our country chronic water shortages, loss of arable land, destruction of natural habitats,
degradation of environment, and widespread pollution undermine public health and threaten
economic and social progress. By 2050 more than 50 percent of population is expected to shift to
the cities and the drinking water scarcity will be acute. In the developed world, for example, the
United Kingdom must spend close to $60 billion building wastewater treatment plants over the
next decade to meet the new European water quality standards. The World Bank has estimated
that over the next decade between US $ 600 to 800 billion will be required to meet the total
demand for fresh water, including that for sanitation, irrigation and power generation. A water
short world is inherently unstable world. Now the world needs another revolution, i.e., a Blue
Revolution for conservation and proper maintenance of freshwater.
3
1.2. Environmental pollution
Environmental pollution is an emerging threat and of great concern in today’s context pertaining
to its effect on the ecosystem. Water pollution is one of the greatest concerns now a day. In
recent years, considerable attention has been paid to industrial wastes discharged to land and
surface water. Industrial effluents often contain various toxic metals, harmful dissolved gases,
and several organic and inorganic compounds. These may accumulate in soil in excessive
quantities in long-term use, ultimately physiologically adverse effects on crop productivity.
The worldwide rise in population and the industrialization during the last few decades have
resulted in ecological unbalance and degradation of the natural resources. One of the most
essential natural resources, which have been the worst victim of population explosion and
growing industrialization, is water. Huge quantity of wastewater generated from human
settlement and industrial Sectors accompany the disposal system either as municipal wastewater
or industrial wastewater. This wastewater is enriched with varied pollutants and harmful both for
human being and the aquatic flora and fauna, finds it way out into the nearly flowing or
stationary water bodies and thus makes natural sources of water seriously contaminated.
It has been estimated that over 5 million chemical substances produced by industries have been
identified and about 12000 of these are marketed which amount to around half of the total
production. Due to discharge of toxic effluents long-term consequence of exposure can cause
cancer, delayed nervous damage, malformation in urban children, mutagenic changes,
neurological disorders etc. Various acid manufacturing industries discharge acidic effluent,
which not only make the land infertile. But make the water of the river acidic also. The high
acidity causes stomach diseases and skin ailments in human beings
1.3. Treatment and recycle
Thus it is imperative to purify and recycle wastewater in view of reduced availability and
deteriorating water quality. Phenol along with other xenobiotic compounds is one of the most
common contaminants present in effluents from chemical process industries. Even at lower

4
concentration these compounds adversely affect aquatic as well as human life [1-4,8-13]. Also
these compounds form complexes with metal ions discharged from other industries, which are
carcinogenic in nature. It is water soluble and highly mobile. This imparts medicinal taste and
odour even at much lower concentration of 2 µg/l and it is lethal to fish at concentrations of 5-25
mg/l [10]. The maximum permitted concentration level of phenol being 0.5-1 mg/l for industrial
wastewater and 1µg/l for drinking water [15,17]. So it is highly essential to save the water
resources and aquatic life by removing these compounds from wastewater before disposal.
The main sources of phenolic wastewater are coal chemical plants, oil refineries, petrochemical
industries, fibre glass units, explosive manufacture, phenol-based polymerization process,
pharmaceuticals, plastic, paints and varnish producing units, textile units making use of organic
dyes, anticeptics, antirust products, biocides, photographic chemicals and smelting and related
metallurgical operations, etc [2,8-10,17,20].

5
1.4. Hazardous effect of phenol
1.4.1. Phenol :
Chemical Formula: C6H5OH
Other names: carbolicacid, Benzenol, PhenylicAcid,
Hydroxybenzene, Phenic acid.
solubility in water :Phenol has a limited solubility (8.3 g/100 ml)
at (20 °C) . And is slightly acidic.
Fig. 1 structure of phenol
Appearance: White Crystalline Solid
It contains a six-membered aromatic ring, bonded directly to a hydroxyl group (-OH).
1.4.2. Uses of Phenol:
• Medical Use: Phenol has antiseptic properties and is used for aseptic (germ-free)
techniques in surgery.
• Industrial Use: It is used in the production of drugs i.e(industrial production of aspirin),
herbicides, and synthetic resins etc.
• Laboratory Use: Phenol is used along with chloroform (a commonly-used mixture in
molecular biology for DNA & RNA purification from proteins).
• Beauty Products: Phenol is also used in the preparation of cosmetics including
sunscreens, hair dyes, and skin lightening preparations
1.4.3. Toxicity of Phenol
Acute exposure of phenol causes
• Disorders of central nervous system leading to collapse and coma.
• Hypothermia A reduction in body temperature.

6
• Acute exposure of phenol can result in myocardial depression.
• Muscle weakness and tremors are also observed.
• Phenol causes a burning effect on skin. Whitening and erosion of the skin may also result
due to phenol exposure.
• Exposure to phenol may result in irritation of the eye, corneal whitening and finally
blindness.
• Phenol can cause gastrointestinal disturbance, vomiting, weakness, weightlessness and
muscle pain.
• It is also suspected that exposure to phenol may cause paralysis, cancer as Phenol and its
derivatives are toxic and classified as hazardous materials.
1.4.4. Phenolic Effluent
• Phenol along with other xenobiotic compounds is one of the most common contaminants
present in effluents from chemical process industries.
• The main sources of phenolic wastewater are coal chemical plants, oil refineries,
petrochemical industries, fiber glass units, explosive manufacture, phenol-based
polymerization process, pharmaceuticals, plastic, paints and varnish producing units,
• Textile units making use of organic dyes, antiseptics, antirust products, biocides,
photographic chemicals and smelting and related metallurgical operations,
• Various acid manufacturing industries discharge acidic effluent, which not only make the
land infertile but make the water of the river also. The high acidity causes stomach
diseases and skin ailments in human beings.
1.4.5. Necessity of Phenol degradation
• Phenol is a major human carcinogen and is of considerable health concern, even at low
concentration.
• The high toxicity of phenol is a alarming reason itself to purify and recycle phenolic
wastewater.
• Many technologies have been investigated for removing and degradation of phenolic
compounds in wastewater.

7
1.4.6. Methods of Phenol Degradation
• Chemical oxidation -Chemical oxidation requires a reactor, which operates at high
temperature and high pressure, ultimately huge energy.
• Ion exchange adsorption- In adsorption commonly activated carbon is used which is
disposed by incineration. The process of incineration generates many new compounds
such as dioxins and furans have very severe consequences on human health.
• Solvent extraction -Solvent extraction there is a danger of contamination of treated water
by the solvent. The solvents used for phenol recovery are benzene, isopropyl ethyl and
butyl acetate. In addition to the presence of solvent in treated water, the high cost of
solvent is another disadvantage.
1.5. Treatment Methods
The conventional methods of treatment of phenolic and nitrate-nitrogen wastewater are largely
physical and chemical processes but these processes led to secondary effluent problems due to
formation of toxic materials such as cyanates, chlorinated phenols, hydrocarbons, etc. These
methods are mainly chlorination, ozonation, solvent extraction, incineration, chemical oxidation,
membrane process, coagulation, flocculation, adsorption, ion exchange, reverse osmosis,
electrolysis, etc [2,8,9,19].
In solvent extraction there is a danger of contamination of treated water by the solvent. The
solvents used for phenol recovery are benzene, isopropyl ethyl and butyl acetate. In addition to
the presence of solvent in treated water, the high cost of solvent is another disadvantage. In
adsorption commonly activated carbon is used which is disposed by incineration. The process of
incineration generates many new compounds such as dioxins and furans have very severe
consequences on human health. Chemical oxidation requires a reactor, which operates at high
temperature and high pressure, ultimately huge energy [2]. Aerobic and anaerobic biochemical
treatment techniques are replacing these methods because of their inherent advantages.

8
1.5.1. Biodegradation
Biodegradation is a biological treatment method and is attractive due to the potential to almost
degrade phenol and overcomes the disadvantages posed by other processes .It produces
producing innocuous end products, reduced capital and operating costs, maintain phenol
concentrations below the toxic limit.
Advantages:
• It is the most potential method to degrade phenol below the toxic limits
• No harmful byproducts
• Simple to install
• Low capital and operating cost
• Self regulating
Disadvantage:
• Degradation mechanism hardly known
• difficult to control
• slow response time
Features:
• Removes hydrocarbons and BOD/COD in contaminated water through an attached
growth biological treatment technology.
• Uses oxygen transfer with a large protected biofilm attachment area to achieve high
removal rates.
• Incorporates neutrally-buoyant Media Pac.
Benefits:
• Increases the efficiency of the biological treatment process by increasing the amount of surface
area.
• Capable of treating a variety of flow rates and contaminants.
• Minimal maintenance compared to other biological treatment systems.
• The FBBR Media Pac incorporates high surface area and large void spaces that are aggressively
sloughed to eliminate biofilm growth and fouling.
9
The most efficient Pseudomonas Putida is capable of using phenol as the sole source of carbon
and energy for cell growth and metabolism degrade phenol via metapathway. That is the benzene
ring of phenol is dehydroxylated to form catechol derivative and the ring is then opened through
meta-oxidation. The final products are molecules that can enter the tricarboxylic acid cycle.
The most common Bio-reactors are (1) Aerated lagoon, (2) Oxidation Ditch, (3) Activated
sludge system, (4) Anaerobic digestion system, (5) Oxidation pond, (6) Trickling filters, (7)
Rotating discs biological reactors, (8) Basket type bioreactors, (9) Hollow fiber membrane
bioreactor, and (10) Fluidized bed bioreactors [1,2,4].
Aerobic processes have several advantages, including a large range of wastewater that can be
treated, high degree of BOD removal, acceptability of toxic conditions, simultaneous nitrogen
and phosphorous removal, better chlorinated organic contaminants degradation, low solids
retention time, and feasible small plants.
1.5.2. Aerobic Degradation
The aerobic biodegradation process is represented by the following equation CxHy + O2 +
(microorganisms / nutrient) ----------→ H2O + CO2 + biomass. Aerobic treatment of waste is the
degradation and purification process in which bacteria that thrive in oxygen-rich environments
break down and digest the waste. The mixed aerobic microbial consortium uses the organic
carbon present in the effluent as their carbon and energy source. The complex organics finally
get converted to microbial biomass (sludge) and carbon dioxide.
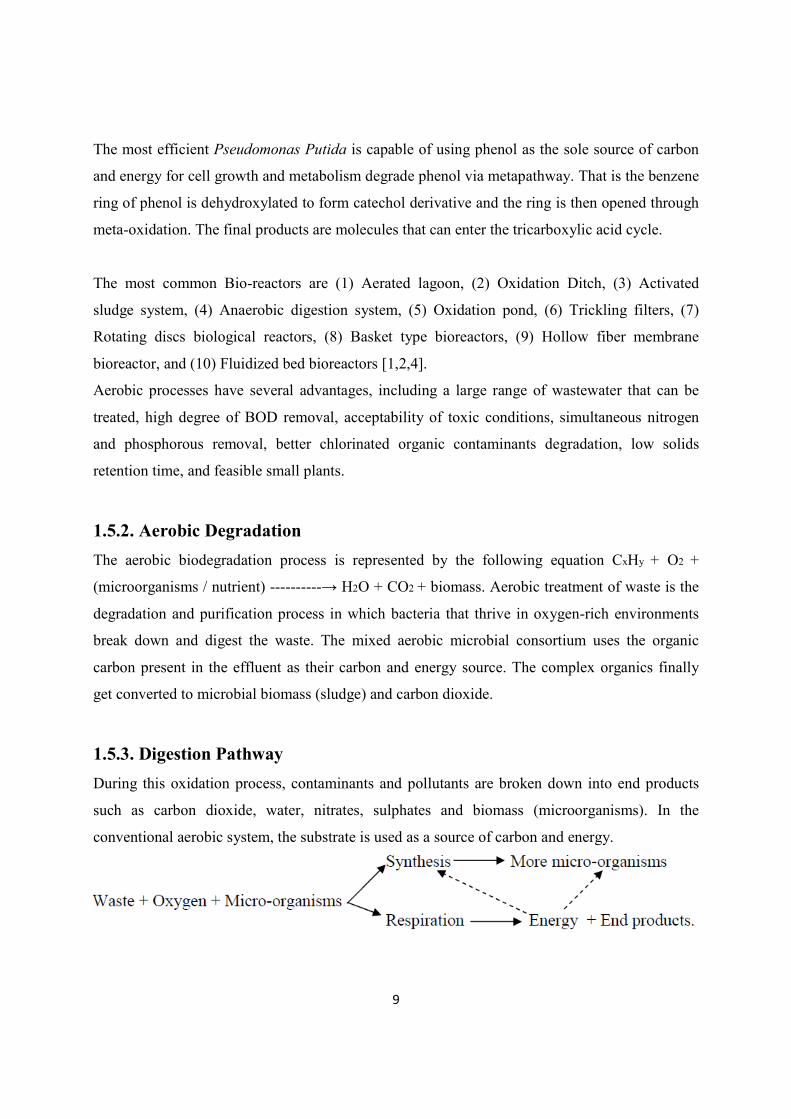
1.5.3. Digestion Pathway
During this oxidation process, contaminants and pollutants are broken down into end products
such as carbon dioxide, water, nitrates, sulphates and biomass (microorganisms). In the
conventional aerobic system, the substrate is used as a source of carbon and energy.

10
It serves as an electron donor, resulting in bacterial growth. The extent of degradation is
correlated with the rate of oxygen consumption in the same substrate. Two enzymes primarily
involved in the process are di and mono-oxygenases. The latter enzyme can act both aromatic
and aliphatic compounds, while the former can act only on aromatic compounds. Another class
of enzymes involved in aerobic condition is peroxidases, which are receiving attention recently
for their ability to degrade lignin.
1.5.4. Characteristics of aerobic bioreactors
A large range of waste water can be treated. Purification and resettling required. Can handle low
to high CODs. Suitable for both cold and warm effluent. Acceptable to toxic presence of toxic
materials to certain extent. Neutralization of alkaline wastewater required. Operated in
continuous mode with less stability and control. High oxygen requirement. Degree of BOD
removal is also high. Simultaneous nitrogen and phosphorous(nutrients) removal is possible.
Posses high degradation rate to Chlorinated organic contaminants. When carrier material is used
leads to clogging danger. Volumetric loading rates and solids retention time is low. Maintenance
required for aeration systems, sludge treatment. Has odour problems if open systems used.
Sludge production is high. Investment cost low to medium. High costs for aeration (power),
nutrients, sludge disposal. Small plants are possible.
Aerobic treatment produces greater amount of CO2 which is let out in the environment to
increase the atmospheric green house gas (GHG) content. For aerobic treatment the total, the
total output is 2.4 kg CO2/ kg COD ( 1.4 kg CO2/ kg COD due to oxidation of hydrocarbons and
rest due to degradation of the pollutants in the wastewater). CIS 1, 2 Dichloroethene (DCE) and
vinyl chloride concentrations reduced by an average of 80% in aerobic bioreactor. From the
study of the effect of toxic chemicals (inhibitory compounds), namely CrCl3, FeCl3, NaBO3,
NaCl, NaNO2, NaNO3, and CHCl3, it is found that the oxygen utilization reduced by the biomass
during the metabolism in the aerobic bioreactors. In dye wastewater treatment azo dyes are
cleaved to aromatic amines. These amines mineralized by means of aerobic treatment by
nonspecific enzymes through hydroxylation and ring opening giving rise to CO2, H2O and NH3
under aerobic conditions. For treatment of tannery water aerobic bioreactors superior in terms of
loading and presence of toxic chemicals and sludge produced contaminated only to a small

11
fraction with chromium. Studies carried out with wastewater from a poultry slaughterhouse
showed that COD removal ratio was generally higher in the aerobic bioreactor. Successfully
treats the Ploychlorinated Dibenzo Dioxin (PCDD) and Ploychlorinated Dibenzofuran (PCDF).
A large number microorganisms that includes Pseudomonas sp., degrade alkanes; mono and poly
aromatics, benzene, toluene etc. a part of petroleum hydrocarbon pollution.
The drawbacks are huge amounts of sludge and carbon dioxide production, less stability and
control of process, maintenance of aeration and sludge disposal systems, high costs for aeration
and sludge disposal, clogging danger when carrer material is used and odour problem in open
system.
1.5.5. Advancement of Aerobic Bioreactors in Wastewater Treatment
Over the conventional type free-culture bio-reactors the immobilization cell bioreactors like
CSTR, PFR, fluidized bed, air lift type, etc. has the following advantages like continuous reactor
operation at any desired liquid throughput without risk of cell washout, protection of cells from
toxic substrates, higher growth rate gives high concentration of cells in the reactor, easy cell-
treated water separation, enhanced gasliquid mass transfer rate, plug flow operation by
maintaining the immobilized cells as a stationary phase [1,2,8-10,14,15,17]. The fluidized bed
bioreactors are superior in performance due to immobilization of cells on solid particles reduce
the time of treatment, volume of reactor is extremely small, lack of clogging of bio-mass and
removal of phenol even at lower concentrations [1,2,4-6,9-19].
1.5.6. Fluidized Bed Bioreactor
Fluidized-bed bioreactors (FBR) have been receiving considerable interest in wastewater
treatment. A fluidizedbed bioreactor consists of microorganism coated particles suspended in
wastewater which is sufficiently aerated to keep the gas, liquid and the solid particles thoroughly
mixed. An FBB, on the other hand, is capable of achieving treatment in low retention time
because of the high biomass concentrations that can be achieved .A bioreactor has been
successfully applied to an aerobic biological treatment of industrial and domestic wastewaters.
Biological fixed films exhibit properties that make them preferable to suspended-cell systems for
a wide variety of wastewater treatment applications. These properties include high cell

12
concentrations, enhanced cell retention due to cell immobilisation and an increased resistance to
the detriment effects of toxic shock loadings.
Fig .2 Schematic Diagram of Fluidized Bed
1.5.7. Fluidized bed bioreactor for wastewater treatment
This reactor had been successfully applied in the treatment of several kinds of wastewater such
as ammonia-nitrogen containing wastewater, photographic processing wastewater, phenolic
waste water, coke oven wastewater, and other domestic and industrial wastes. Also used
successfully for the reductive biotransformation of mercuric ions to elemental mercury present in
the effluents from industrial amalgam process, combustors and power stations [1,2,4-6,9,11-
15,18,19].
A fluidized bed bioreactor (FBB) is capable of achieving treatment in low retention time because
of the high biomass concentration. FBB offers distinct mechanical advantages, which allow
small and high surface area media to be used for biomass growth [1,2,9,13-15]. Fluidization
overcomes operating problems such as bed clogging and the high-pressure drop, which would
13
occur if small and high surface area media were employed in packed-bed operation. Rather than
clog with new biomass growth, the fluidized bed simply expands. Thus for a comparable
treatment efficiency, the required bioreactor volume is greatly reduced. A further advantage is
the possible elimination of the secondary clarifier, although this must be weighed against the
medium-biomass separator [13,15].
Conventional FBB are operated in two different ways. In a bioreactor with a heavy (matrix
particle density larger than that of liquid) biomass support (e.g. silica sand, coal), fluidization is
commonly conducted with an upward co current flow of gas and liquid through a bed of
particles. Under fluidization conditions, the bed is fluidized with an upward flow of a liquid
counter to the net gravitational force of the particles. Once fluidized, each particle provides a
large surface area for biofilm formation and growth. The support media eventually become
covered with biofilm and the vast available growth surface afforded by the media results in a
biomass concentration approximately an order of magnitude greater than that maintained in a
suspended growth system [13,15].
A practical problem, which occurs in the operation of an FBB, is the excessive growth of
biomass on support media. This can lead to the channeling of bioparticles in fluidized beds since
biomass loading can increase to such extent that the bioparticles began to be carried over from a
bioreactor. The problem of over expansion of fluidized bed due to biomass growth has generally
been solved by the removal of heavily biomassladen particles from bioreactor, followed by the
addition of biomass-free particles. However this solution complicates operation of a bioreactor
and introduces the need for additional equipment external to the bioreactor, such as a vibrating
screen or an incinerator [13-15].
The degradation of phenolic type liquors, derived from coal processes, in a continuous stirred-
tank bioreactor (CSTB), packed-bed bioreactor (PBB) and FBB shown in [15]. The degradation
rates of 0.087, 0.053 and 0.012 kg phenol/m3 were achieved in the FBB, PBB and CSTB
respectively.
The nutrients for microbial growth are transported first from bulk phase to the surface of the
biofilm, and then transported to the inner regions of the biofilm via diffusion. The limiting mass
14
transport rate controls the performance of the biofilm reactor [12,15]. From literature it is seen
that the external resistance can be neglected in the case of a high fluidization flow rate [12]. In a
three-phase fluidized bed bioreactor it is found reaction rate follows first-order kinetics with
respect to oxygen and zero-order one with respect to phenol. For chemical and bio-chemical
process, where mass transfer is the rate-limiting step, it is important to know the gas hold-up as
this is related directly to mass transfer. The gas hold up at high pressures is always larger than
that at low pressures, regardless of the liquid velocity and particle size in three-phase
fluidization.
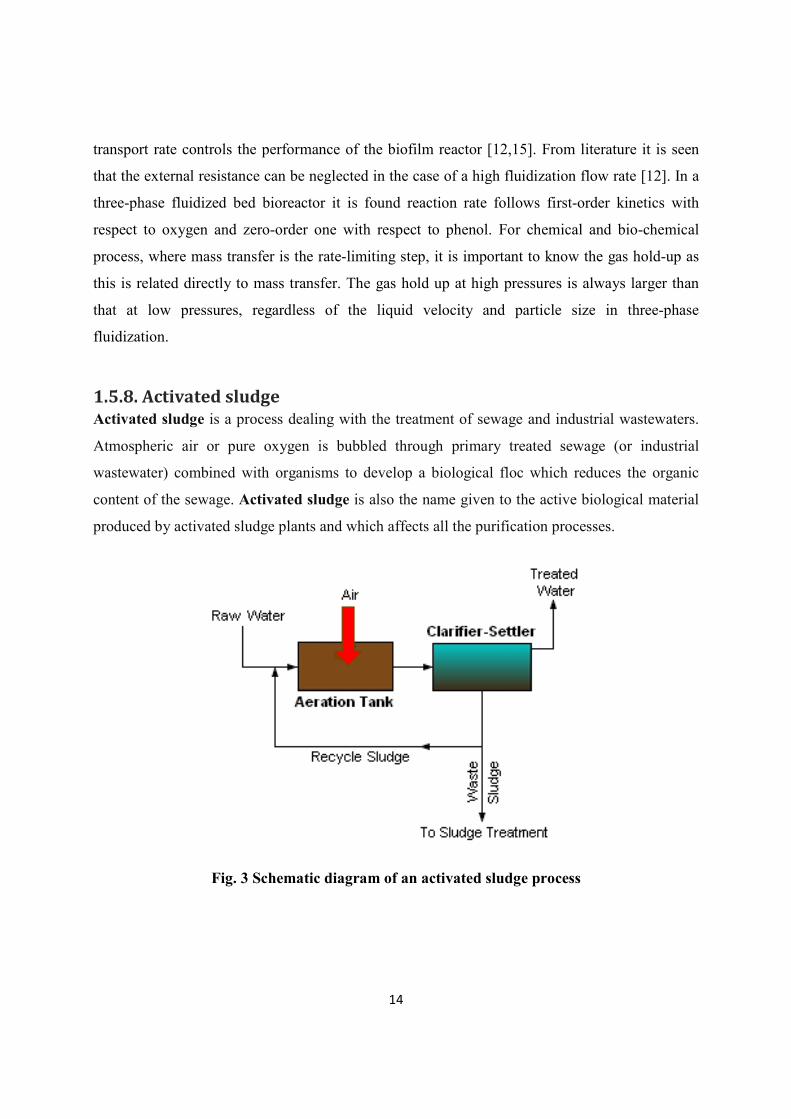
1.5.8. Activated sludge
Activated sludge is a process dealing with the treatment of sewage and industrial wastewaters.
Atmospheric air or pure oxygen is bubbled through primary treated sewage (or industrial
wastewater) combined with organisms to develop a biological floc which reduces the organic
content of the sewage. Activated sludge is also the name given to the active biological material
produced by activated sludge plants and which affects all the purification processes.
Fig. 3 Schematic diagram of an activated sludge process
15
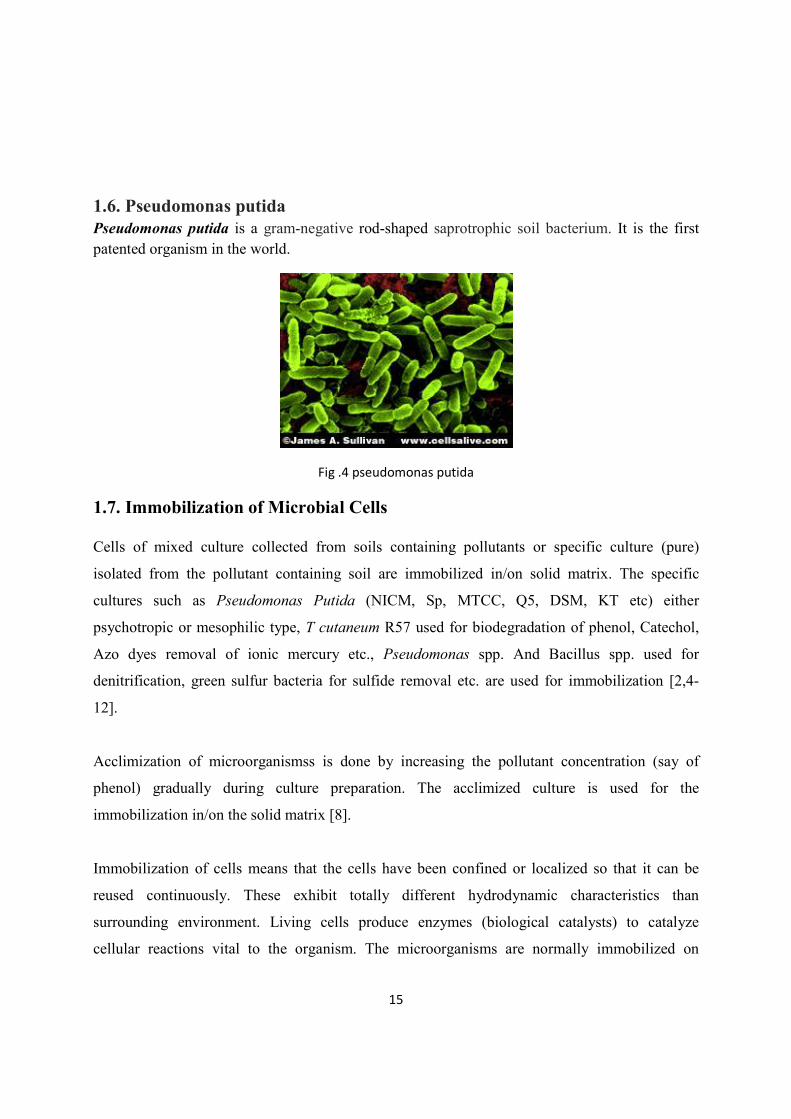
1.6. Pseudomonas putida
Pseudomonas putida is a gram-negative rod-shaped saprotrophic soil bacterium. It is the first
patented organism in the world.
Fig .4 pseudomonas putida
1.7. Immobilization of Microbial Cells
Cells of mixed culture collected from soils containing pollutants or specific culture (pure)
isolated from the pollutant containing soil are immobilized in/on solid matrix. The specific
cultures such as Pseudomonas Putida (NICM, Sp, MTCC, Q5, DSM, KT etc) either
psychotropic or mesophilic type, T cutaneum R57 used for biodegradation of phenol, Catechol,
Azo dyes removal of ionic mercury etc., Pseudomonas spp. And Bacillus spp. used for
denitrification, green sulfur bacteria for sulfide removal etc. are used for immobilization [2,4-
12].
Acclimization of microorganismss is done by increasing the pollutant concentration (say of
phenol) gradually during culture preparation. The acclimized culture is used for the
immobilization in/on the solid matrix [8].
Immobilization of cells means that the cells have been confined or localized so that it can be
reused continuously. These exhibit totally different hydrodynamic characteristics than
surrounding environment. Living cells produce enzymes (biological catalysts) to catalyze
cellular reactions vital to the organism. The microorganisms are normally immobilized on

16
natural and synthetic supports [10]. Various types of solid matrices like polyacrylamide gel, Ca
alginate, porous glass, plasic beeds, activated carbon, sand, charcoal, diatomaceous earth, cement
balls made of coal ash, cellulose, polymeric materials, polymeric ions, chitosan, lignins, chitins,
coal, collagens etc. have been used for immobilization of whole cells. In the recent years,
the immobilization of biocatalysts with polyvalent salts of alginic acids has received much
attention because of low cost of alginate and the mild conditions of immobilization[8].
Techniques of immobilization are broadly classified into four categories namely covalent
bonding, cross-linking (chemical methods), entrapment and adsorption (physical methods).
Covalent binding most extensively used technique, where cells or enzymes are covalently linked
to the support through the groups in them or through the functional groups in the support
material. In the cross-linking technique, the cells are immobilized through chemical cross-linking
using homo as well as hetero-bifunctional cross-linking agents. Adsorption is the simplest of all
techniques and does not alter the activity of the bound cells. Adsorption involves adhesion or
condensation of the cells to the surface of a carrier. The diving force causing immobilization is
the combined hydrophobic interactions, hydrogen bonding and salt bridge formation between the
adsorbent and cells. Entrapment within gels or fiber is a convenient method for reactions
involving low molecular weight substrates and mainly used for immobilization of whole cells.
This method is nothing but the polymerization of the unsaturated monomers in the presence of
Cells results in the entrapment of the cells within the interstitial spaces of the gel.
17
CHAPTER 2
EXPERIMENTAL
2.1. Analytical methods for water quality parameters
• BOD-The quantity of oxygen required by the microorganisms for the stabilization of the
biological decomposable organic matter. BOD tests measure the molecular oxygen
utilized during a specified incubation duration for the biochemical degradation of organic
material and the oxygen used to oxidize inorganic material such as ferrous iron and
sulfides. The most common BOD test consists of a 5 day period in which a sample is
placed in an airtight bottle under controlled conditions temperature (20ºC ± 1ºC), keeping
any light from penetrating the sample to prevent photosynthesis. The Dissolved Oxygen
(DO) in the sample is measured before and after the 5 day incubation period, and BOD is
then calculated as the difference between initial and final DO measurements. BOD can be
considered a more "natural" test in determining the oxygen required to oxidize organic
matter.
COD
• Chemical oxygen demand test determines the oxygen required for chemical oxydation of
organic component as well as the no. of inorganic component with the help of strong
oxidant i.e. potassium dichromate.
• Once oxidation is complete, the excess potassium dichromate is titrated with ferrous
ammonium sulfate (FAS) until all of the excess oxidizing agent has been reduced to Cr3+.
Typically, the oxidation-reduction indicator Ferroin is added during this titration step as
well. Once all the excess dichromate has been reduced, the Ferroin indicator changes
from blue-green to reddish-brown.
• COD is often preferred for daily analysis since it is inherently more reproducible,
accounts for changing conditions and takes a short time to complete.

18
2.2. Methods to know the phenol concentration in the effluent:
• Spectrophotometric analysis- phenolic materials react with 4- aminoantipyrine in the
presence of potassiumferricyanide at a pH of 10 to form a stable antipyrine dye. This can
be done with two methods direct photometric method and chloroform extraction method
by reading the absorbance at 510nm and 460nm respectively. Direct photometric
method is used when the phenol conc. in the effluent Is high. Chloroform extraction
method is used when the phenol conc. in the effluent is low.
2.2.1. SPECTROPHOTOMETRIC METHOD
Scope and application:
1. This method is application to the analysis of drinking, surface and saline water, domestic
and industrial waters
2. This method is capable of measuring phenol materials that contains 50ug/l in the aqueous
phase using phenol as a standard.
3. This method is not possible to use differentiate between kinds of phenols
Principle:
The distillable phenolic compounds react with 4-aminoantipyrine at pH 10+-0.2 in the
presence of potassium ferricyanide to form a colored antipyrine dye . This dye is kept in
aqueous solution and the absorbance is measured at 500nm.
Apparatus :
1. Ph meter
2. Spectrophotometer
3. Funnel
4. Filter paper
5. Reparatory funnels,500 or 1,000 ml
6. Membrane filter
19
Reagent
1. Phosphoric acid solution,1+9: dilute 10ml of 85% H3PO4 to 100 ml with distilled water .
2. Copper sulphate solution: dissolve 100g CUSO4 5H2O in distilled water and dilute to 1
liter.
3. Buffer solution: dissolve 16.9g NH4CL in 143 ml conc. NH4OH and dilute to 250 ml with
distilled water. Two ml should adjust 100 ml of distilled to PH 10.
4. Aminoantipyrine solution: dissolve 2 g of 4 AAP in distilled water and dilute to 100 ml.
5. Potassium ferricyanide solution: dissolve 8 g of K3Fe(CN)6 in distilled water and dilute to
100 ml .
6. Stock phenol solution: dissolve 1.0 g phenol in freshly boiled and cooled distilled water
and dilute to 100 ml.
7. Working solution A: dilute 10 ml stock phenol solution to 1 liter with distilled water 1 ml
=10 ug phenol.
8. Working solution B: dilute 100 ml of working solution A to 1000 ml distilled water 1
ml=1 ug phenol.
2.2.1.1. DIRECT PHOTOMETRIC METHOD
Procedure
1. Using working solution A prepare the following standards in 100 ml volumetric flasks.
2. To 100 ml of distillate or an aliquot to 100 ml or standards, add 2 ml of buffer solution
and mix. The pH of the sample and standards should be 10+0.2
3. Add 2.0 ml aminoantipyrine solution and mix.
4. Add 2.0 ml potassium ferricyanide solution and mix.
5. After 15 minutes read absorbance at 510 nm.

20
2.2.1.2. CHLOROFORM EXTRACTION METHOD
Procedure :
1. Using working solution B, prepare the following standards .standards may be prepared by
pipetting the required volumes into the separator funnels and diluting to 500 ml with distilled
water.
2. Place 500 ml of distillate or an aliquot diluted to 500 ml in a separator funnel. The sample
should not contain more than 25 ug phenol.
3. To sample and standards add 10 ml of buffer solution and mix. The pH should be 10+0.2.
4. Add. 0.6 ml aminoantipyrine solution and mix.
5. Add. 0.6 ml potassium ferricyanide solution and mix.
6. After three minutes, extract with 25 ml of chloroform. Shake the separatory funnel at least 10
times, let CHCL3 settle, shake again 10 times and let chloroform settle again.
7. Filter chloroform extracts through filter paper. Do not add more chloroform.
8. Read the absorbance of the samples and standards against the blank at 460 nm.
2.3. DETERMINATION OF CHEMICAL OXYGEN DEMAND (COD)
2.3.1. Principle:
The organic matter get oxidised completely by K2Cr2O7in the presence of H2SO4 to produce CO2
and H2O .The excess K2Cr2O7remaining after the reaction is titrated against Fe(NH4)2(SO4)2 .The
dichromate consumed gives the oxygen required for the oxidation of organic matter .
2.3.2. Apparatus Required :
1. Digestion apparatus includes reflux flask,250 ml conical flask with b 24 joint, liebig
condenser.
2. Measuring cylinder of 25ml ,100 ml capacity .
3. Burette ,50 ml capacity .
4. Pipettes glass beads of desired volume .
21
2.3.3. Reagent Required:
1. Mercuric Sulphate
2. Sulphuric acid and silver sulphate regeant : Add 10 g of AgSO4 to 1000ml of cons.
H2SO4 and keep overnight for complete dissolution.
3. Standard K2Cr2O7(0.25N):-Dissolve 12.25 g of K2Cr2O7dried at 1030c for 2 hours in
distilled water and dilute to 1000 ml.
4. Standard Ferrous Ammonium Sulphate (FAS)(0.1N):-Dissolve 39.2 g of
Fe(NH4)2(SO4)2.6H2O in about 400 ml distilled water .Add 20 ml conc.H2SO4 and dilute
to 1000ml .
5. Ferroin indicator :-Dissolve 1.485 g 1-10 phenanthroline(monohydrate) and 695 mg of
FeSO4.7H2O and dilute to 100 ml with distilled water .
6. Standard COD Reagent (500 ppm):Dissolve 0.4250 g of potassium hydrogen
phthalate(C8H5KO4),dried at 1050c for 2 hr and desiccated to room temperature, in
distilled water and make up to 1000 ml.
7. Standardisation of Fe(NH4)2SO4 into 250 ml conical flask followed by 10 ml of
conc.H2SO4 slowly with swirling under tap water to avoid explosion. Cool it under tap
water and add 2-3 drops of ferroin indicator . using FAS solution from the burette, titrate
.Sharp colour change from blue green to wine red indicator the end point . Use the same
volume of ferro in indicator for the samples also .
2.3.4. Procedure :
1. Place 0.4 gm of HgSO4 in reflux flask.
2. Add 20 ml of sample or an aliquote of sample diluted to 20 ml with distilled water . Mix
well .
3. Add glass beads followed by 10 ml 0.25 N K2Cr2O7 .
4. Add slowly 30 ml of sulphuric acid and silver sulphate reagent. Mix thoroughly . This
slow addition along with swirling prevent fatty acid escaping out to high temperature .
5. During thorough mixing if colour changes to green, either take fresh sample with lesser
aliquote or add more dichromate and acid.

22
6. Connect the flask to condenser .mix the content before heating. Improper mixing result in
bumping during digestion and sample may be blown out.
7. Reflux for minimum 2 hrs. Cool and then wash down the condenser with distilled water.
8. Dilute to 140 ml adding 80 ml distilled water.
9. Titrate excess K2Cr2O7 . with 0.1N FAS using ferroin indicator. Sharp colour change
fom blue green to wine red indicate end point.
10. Reflux blank in the same manner using distilled water instead of sample.
2.4. DETERMINATION OF BIOCHEMICAL OXYGEN DEMAND (BOD)
2.4.1. PRINCIPLE:
The BOD test measure the biodegradable organic carbon, under certain condition the oxidisable
nitrogen present in the waste water .The BOD by the definition is the quantity of oxygen
required by the microorganism for the stabilization of the biologically decomposable organic
matter in the aerobic condition in waste water at specific condition.
2.4.2. APPARATUS REQUIRED :
BOD incubator.
BOD bottles with stopcock (300 ml capacity)
Burette, 50 ml.
Pipette, 1ml,5 ml,10 ml.
Measuring cylinder, 1000 ml, 250 ml, 100 ml, 50 ml.
Aeration bottle, pumps
Distilled water with wash bottle.
2.4.3. REAGENTS REQUIRED :
1. Phosphate buffer:-Dissolve 8.5 g KH2PO4, 21.75 g K2HPO4, 33.4 Na2HPO4.7H2O and
2. 78 NH4Cl in distilled water and dilute 1 lit .Adjust pH to 7-2.
2. Magnesium Sulphate: Dissolve 82.5 g MgSO4.7H2O and dilute to 1 ltr.

23
3. Calcium Chloride. Dissolve 27.5 g anhydrous CaCl2 and dilute to 1 ltr.
4. Ferrichloride: Dissolve 0.25 g FeCl3.6H2O and dilute to 1 ltr.
5. Stock Sodium thiosulphate (0.1 N) dissolve 24.82 g of Na2S2O3.5H2O in freshly boiled
cooled distilled water and dilute to 1000 ml. Preserve it by adding 5 ml chloroform per
liter.
6. Standard sodium thiosulphate (0.025N) dilute 250 ml stock Na2S2O3 solution to 1000 ml
with freshly boiled and cooled distilled water . preserve by adding 5 ml chloroform per
liter .This solution has to be standardized against standard dichromate solution for each
set of titration.
7. Alkaline iodide azide reagent:-Dissolve 500 g NaOH and 150 g KI. Add 10 g NaN3
dissolved in 40 ml distilled water ,dilute to 1000 ml.
8. Manganous sulphate solution : Dissolve 480 g of Manganous Sulphate
tetrahydrate,MnSO4.4H2O and dilute to 1000 ml .filter if necessary .
9. Conc . H2SO4
10. Starch indicator :-prepare paste or solution of 0.5 starch powder in distilled water .pour
this solution of 0.5 g starch in distilled water .pour this solution in 100 ml boiling water
.Allow to boil for few minutes. Cool then use. preserve it with a pinch of mercury iodide.
2.4.4. PROCEDURE
2.4.4.1. PREPARATION OF DILUTION WATER
Aerate the required volume of distilled water in a container by bubbling compressed air
for 4-5 hour to attain dissolved oxygen saturation. Try to maintain the temperature closs
to the experimental temp.
Add 1 ml each of phosphate buffer, magnesium sulphate, calcium chloride and ferric
chloride solution for each liter of dilution water .mix well.
In the case of waste which are not expected to have sufficient bacterial population and to
the dilution water. Generally 2 ml settle sewage is considered sufficient for 1000 ml of
dilution water.

24
2.4.4.2. DILUTION OF SAMPLE
1. Neutralise the sample to pH around 7.0 if is highly alkaline or acidic.
2. The sample is made free from residual chlorine by using Na2S2O3 solution as follows.
Take 50 ml of sample and acidic with adding 10 ml 1:1 H2SO4.Add about 1 g of KI.
Titrate against 0.025 N Na2S2O3 using starch as indicator. Calculate the volume of
Na2S2O3 required for ml of sample and add accordingly, to the sample to be tested for
BOD.
3. Sample having high DO content i.e. 9 mg/l due to either algal growth or some other
reason, reduce the DO content by agitating the sample.
4. Make several dilution of the prepared sample so as to obtain 50% depletion of DO in
dilution water but not less than 2 mg and the residue oxygen after 5 day or 3 day of
incubation should not be less than 1 mg/l.
5. Siphone out seeded diluted water into a measuring cylinder half of required volume. Add
the required quantity of sample carefully. Make up to the desired volume with seeded
dilution water . mix it carefully so that with seeded dilution water. Mix it carefully so that
no air bubbles arise during mixing.
6. Prepare 2 to 3 dilution sample of each original sample and transfer each set of dilution
sample to two number BOD bottle. Out of these samples one is kept for incubation and
DO measured after incubation period. The other one is used for the measuring of DO
immediately.

25
CHAPTER 3
RESULTS
3.1. DIRECT PHOTOMETRIC METHOD
OBSERVATION
READING
GRAPH

26
3.2. CHLOROFORM EXTRACTION METHOD
OBSERVATION
READING
Ml of working
sol B
PH Absorbance
0.6 10.14 0.134
1.0 10.12 0.136
2.0 10.14 0.140
4.0 10.13 0.147
5.0 10.13 0.150
GRAPH
Fig.6 Chloroform Extraction Method

27
DAY DILUTION IN % PH TEMP COD PHENOL ADDED (PPM)
1 10 7.15 30 1200 -
2 10 7.2 30 800 -
3 10 7.2 30 300 50
4 20 7.3 29 2000 -
5 20 7.35 29 1900 -
6 10 7.2 30 1300 -
7 10 7.1 31 250 100
8 20 7.24 29 2400 -
9 20 7.32 28 2350 -
10 10 7.1 30 1600 -
11 10 7.2 31 300 150
12 20 7.3 31 2900 -
13 20 7.2 29 2850 -
14 20 7.2 30 2100 -
15 10 7.1 28 1500 -
16 10 7.15 27 300 200
17 20 7.2 28 3100 -
18 20 7.3 29 2900 -
19 20 7.14 30 2350 -
20 20 7.24 29 1800 -
21 10 7.1 29 850 -
22 10 7.2 29 300 250
23 20 7.15 28 3200 -
24 20 7.2 29 3100 -
25 20 7.24 27 2800 -
26 20 7.3 29 2750 -
27 20 7.3 28 2700 -
28 20 7.1 30 2700 -

28
3.3 DETERMINATION OF CHEMICAL OXYGEN DEMAND (COD)
COD= (A-B)N * 8* 1000
vol. of sample
A= ml of FAS for blank B= ml of FAS for sample
N= normality of FAS
FAS=ferrous ammonium sulphate
A=25ml, B=22ml, N=0.1, vol of sample=20ml
Then COD=1200mg/l at 10% dilution
AEROBIC TREATMENT OF PHENOLIC WASTEWATER
Fig.7 No phenol conc Fig.8 50ppm phenol
Fig.9 100 ppm phenol Fig.10 150 ppm phenol
29
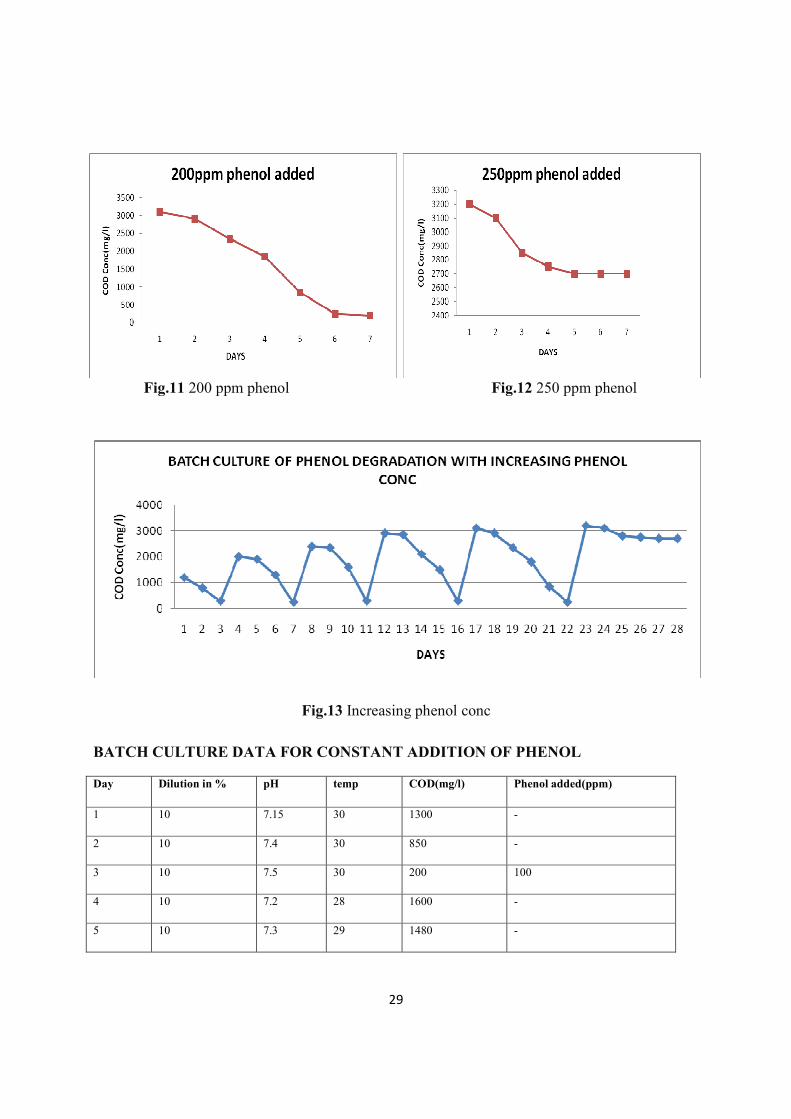
Fig.11 200 ppm phenol Fig.12 250 ppm phenol
Fig.13 Increasing phenol conc
BATCH CULTURE DATA FOR CONSTANT ADDITION OF PHENOL
Day Dilution in % pH temp COD(mg/l) Phenol added(ppm)
1 10 7.15 30 1300 -
2 10 7.4 30 850 -
3 10 7.5 30 200 100
4 10 7.2 28 1600 -
5 10 7.3 29 1480 -

30
6 10 7.2 28 920 -
7 10 7.3 30 250 100
8 20 7.2 30 1720 -
9 10 73 30 1600 -
10 10 7 30 900 -
11 10 7.1 30 200 100
12 20 7.0 30 1900 -
13 20 7.0 29 1800 -
14 10 7.1 28 1350 -
15 10 7.1 29 700 -
16 10 7.0 30 220 100
17 20 7.2 29 2000 -
18 20 7.15 28 1920 -
19 20 7.1 30 1900 -
20 20 7.2 29 1880 -
21 20 7.1 30 1880 -
Fig.14 Constant Phenol Conc(100 ppm)
31
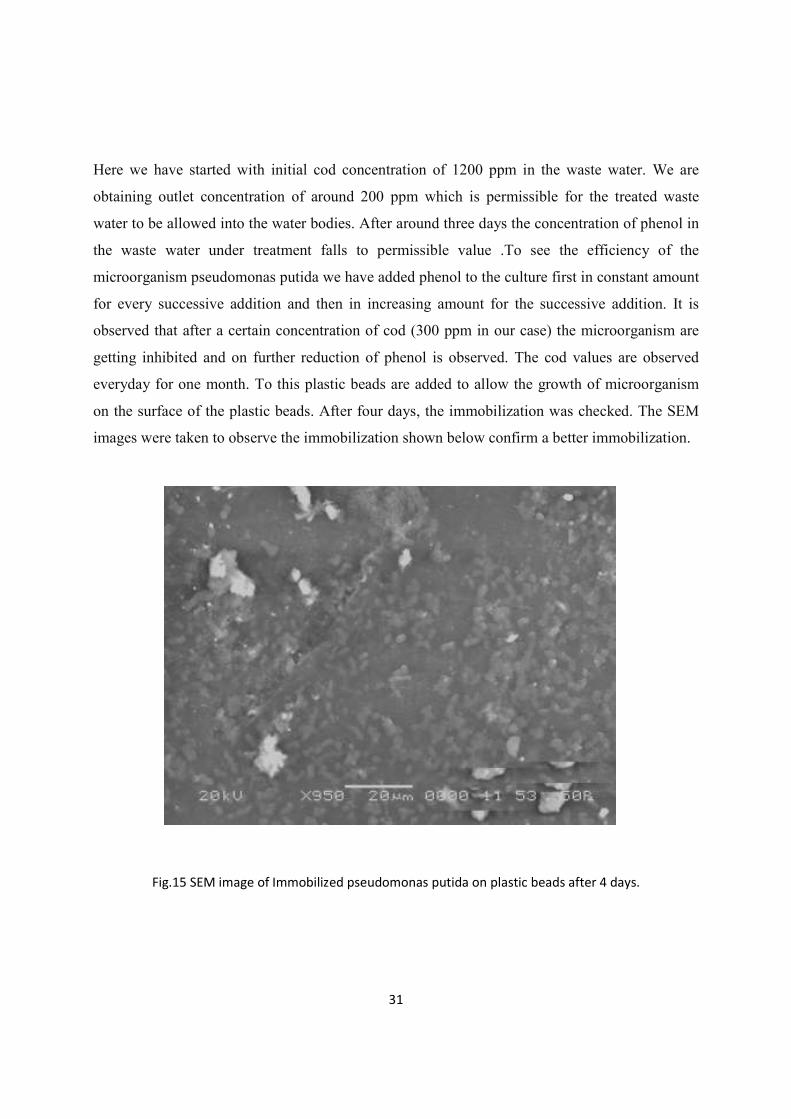
Here we have started with initial cod concentration of 1200 ppm in the waste water. We are
obtaining outlet concentration of around 200 ppm which is permissible for the treated waste
water to be allowed into the water bodies. After around three days the concentration of phenol in
the waste water under treatment falls to permissible value .To see the efficiency of the
microorganism pseudomonas putida we have added phenol to the culture first in constant amount
for every successive addition and then in increasing amount for the successive addition. It is
observed that after a certain concentration of cod (300 ppm in our case) the microorganism are
getting inhibited and on further reduction of phenol is observed. The cod values are observed
everyday for one month. To this plastic beads are added to allow the growth of microorganism
on the surface of the plastic beads. After four days, the immobilization was checked. The SEM
images were taken to observe the immobilization shown below confirm a better immobilization.
Fig.15 SEM image of Immobilized pseudomonas putida on plastic beads after 4 days.
32
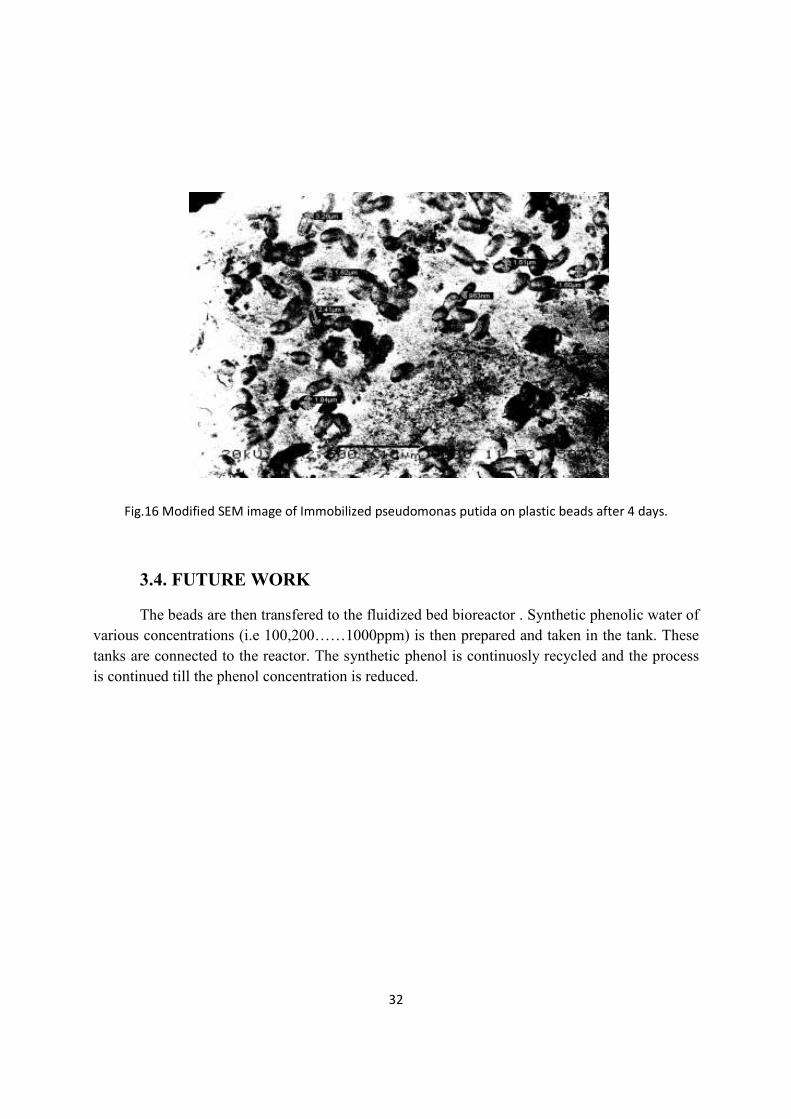
Fig.16 Modified SEM image of Immobilized pseudomonas putida on plastic beads after 4 days.
3.4. FUTURE WORK
The beads are then transfered to the fluidized bed bioreactor . Synthetic phenolic water of
various concentrations (i.e 100,200……1000ppm) is then prepared and taken in the tank. These
tanks are connected to the reactor. The synthetic phenol is continuosly recycled and the process
is continued till the phenol concentration is reduced.
33
CHAPTER 4 CONCLUSION
Immobilized cell bioreactors are better than free culture bioreactors. Among the immobilized cell
bioreactors, no doubt the semi-fluidized bed bioreactor is a novel and efficient one, which can be
adopted for the treatment of industrial wastewater containing phenolic compounds and other
pollutants even at lower concentration. A proper choice of immobilized culture, careful
consideration of various design parameters for semifluidized bed bioreactors will make
treatment process cost effective in the long run.
The operation of the bench scale activated sludge reactors was studied, under increased
concentration of phenol and cyanides. The SBR system showed almost complete phenol
degradation for influent concentrations up to 1200 mg/l, while removal of organic matter in
terms of COD and BOD5 and of ammonia nitrogen indicated no significant inhibition due to the
increased phenol loading.
34
REFERENCES
[1] B. C. Meikap, G. K. roy, Recent advances in biochemical reactors for treatment of waste water, IJEP, vol-15 (1), Jan-1995, 44-49.
[2] A. V. Vinod, G. V. Reddy, Dynamic behaviour of a fluidised bed bioreactor treating waste water, Indian Chem. Engr., Section A, Vol.45, No.1, Jan-Mar 2003, 20-27.
[3] T. K. Ghose, Environment and Biotechnology, Indian Chem. Engr., Section B,Vol.43, No.2, Apr-Jun 2001, 118-122.
[4] K. A. Onysko, C. W. Robinson, H. M. Budman, Improved modeling of the unsteady state behaviour of an immobilized-cell, fluidized-bed bioreactor for phenol biodegradation, The Canadian Journal of Chemical engineering, Vol.80, Apr 2002, 239-252.
[5] W. D. Deckwer, F. U. Becker, S. Ledakowicz, I. W. Dobler, Microbial removal of ionic mercury in a three-phase fluidized bed reactor, Environ. Sci. Technol. 2004, 38,1858-1865.
[6] W. Jianping, P. L. H. Wei, D. Liping, M. Guozhu, The denitrification of nitrate contained waste water in a gas-liquid-soild three-phase flow airlift loop bioreactor, Biochemical Engineering Journal 15 (2003) 153-157.
[7] A. Nuhoglu, T. Pekdemir, E. Yildiz, B. Keskinler, G. Akay, Drinking water denitrification by a membrane bio-reactor, Water Research 36 (2002) 1155-1166.
[8] K. Bandhyopadhyay, D. Das, P. Bhattacharyya, B. R. Maiti, Reaction engineering studies on biodegradation of phenol by Pseudomonas Putida MTCC 1194 immobilized on calcium alginate, Biochemical Engineering Journal 8 (2001) 179-186.
[9] B. C. Meikap, G. K. roy, Removal of phenolic compounds from industrial waste water by Semifluidised bed bioreactor, journal of the IPHE, India, vol. 1997, No. 3.
[10] A. Kumar, S. Kumar, S. Kumar, Biodegradation kinetics of phenol and catechol using Pseudomonas Putida MTCC 1194, Biochemical Engineering Journal 22 (2004)151-159.
[11] A. Hirata, T. Takemoto, K. Ogawa, J. Auresenia, S. Tsuneda, Evaluation of kinetic parameters of biochemical reaction in Three-phase fluidized bed biofilm reactor for waste water treatment, Biochemical Engineering Journal 5 (2000) 165-171.
[12] H. Beyenal, A. Tanyolac, The effects of biofilm characteristics on the external mass transfer coefficient in a differential fluidized bed biofilm reactor, Biochemical Engineering Journal 1 (1998) 53-61.
[13] W. Sokol, Treatment of refinery wastewater in a three-phase fluidized bed bioreactor with a low-density biomass support, Biochemical Engineering Journal 15 (2003) 1-10.
[14] G. Gonzalez, M. G. Herrera, M. T. Garcia, M. M. Pena, Biodegradation of phenol in a continuous process: comparative study of stirred tank and fluidized-bed bioreactors, Bio-resource Technology 76 (2001) 245-251.
35
[15] W. Sokol, W. Korpal, Determination of the optimal operational parameters for a three-phase fluidized bed bioreactor with a light biomass support when used in treatment of phenolic wastewaters, Biochemical Engineering Journal 20 (2004) 49-56.
[16] B-H. Jun, K. Miyanaga, Y. Tanji, H. Unno, Removal of nitrogenous and carbonaceous substances by a porous carrier-membarane hybrid process for wastewater treatment, Biochemical Engineering Journal 14 (2003) 37-44.
[17] C. S. A. Sa, R. A. R. Boaventura, Biodegradation of phenol by Pseudomonas Putida DSM 548 in a trickling bed reactor, Biochemical Engineering Journal 9 (2001) 211-219.
[18] S. Tsuneda, J. Auresenia, T. Morise, A. Hirata, Dynamic modeling and simulation of a three-phase fluidized bed batch process for wastewater treatment, Process Biochemistry 38 (2002) 599-604.
[19] G. Gonzalez, G. Herrera, M. T. Garcia, M. M. Pena, Biodegradation of phenolic industrial wastewater in a fluidized bed bioreactor with immobilized cells of Pseudomonas Putida, Bioresource Technology 80 (2001) 137-142.
[20] A. A. M. G. Monteiro, R. A. R. Boaventura, A. E. Rodrigues, Phenol biodegradation by Pseudomonas Putida DSM 548 in a batch reactor, Biochemical Engineering Journal 6 (2000) 45-49.
Related Documents