U.S. Department of the Treasury Treasury IT Performance Measures Guide Office of the Chief Information Officer (OCIO) Enterprise Architecture Program June 2007

Welcome message from author
This document is posted to help you gain knowledge. Please leave a comment to let me know what you think about it! Share it to your friends and learn new things together.
Transcript
U.S. Department of the Treasury
Treasury IT Performance Measures Guide
Office of the Chief Information Officer (OCIO) Enterprise Architecture Program June 2007

Revision History
June 13, 2007 (Version 1.1)
• Final – Updated to reflect changes based upon OMB A-11 Guidance
February 1, 2007 (Version 1.0)
• Final Document
Version 1.1 6/13/2007 Page 2 of 30

Treasury IT Performance Measures Guide
1 Introduction Performance measurement is the process whereby an organization establishes the parameters within which programs, investments, and acquisitions are reaching the desired results in support of the Treasury’s Strategic Goals. Performance measures for the Treasury’s IT investments are devised during the OMB Exhibit 300 submission process and assessed during subsequent OMB Exhibit 300 review and Treasury’s quarterly Control Review process. Measuring the performance of IT investments has many benefits. It highlights areas for improvement in the IT investment portfolio and captures IT contribution to Treasury’s strategic and business goals. Measuring performance allows the Department to direct funding decisions for IT based upon contribution to mission and business goals. In addition to documenting the value that IT investments add to the Department properly derived and structured performance measures allow IT project managers and other decision makers to see areas for improvement in an IT investment and highlight ways in which an investment can more effectively and efficiently meet its stated goals and objectives.
1.1 Purpose of the Performance Measures Guide This document provides the steps necessary to measure the performance of IT investments in accordance with the policies and guidance of the Office of Management and Budget (OMB), the Government Accountability Office (GAO) and the Federal Enterprise Architecture (FEA). The figure below outlines the steps in this document for measuring the performance of IT investments.
Figure 1: Steps for Measuring IT Investment Performance
DevelopPerformance Measures
• Establish Line of Sight• Define Measurement
Indicators
GatherPerformance Data
• Conduct Baseline Analysis• Set Improvement Targets• Measure Progress
ReportPerformance Information
• Report in Exhibit 300• Report in Control Review
This document contains guidance on developing performance measures and collecting performance data for IT investments using the Federal Enterprise Architecture (FEA) Performance Reference Model (PRM), as well as instructions on how to properly structure and report on performance measures through the OMB Exhibit 300 business case and the quarterly Control process for Major IT investments.
Version 1.1 6/13/2007 Page 3 of 30

Treasury IT Performance Measures Guide
Example Information
For the purposes of this guidance document the example of a Treasury financial reporting investment will be repeated throughout. Each step in the performance measurement process will be highlighted and information will be populated using this example investment.
1.2 Intended Audience This guidance is intended for Treasury and Bureau staff who write performance measures for IT investments and will be in charge of reporting performance data as part of the Control process. In order to have the best understanding of this guidance, IT project managers should familiarize themselves with the FEA PRM (available at http://www.egov.gov) and Treasury’s Target Performance Architecture (available on the Enterprise Architecture Resource Center).
1.3 The FEA Performance Reference Model The guidance contained in this document is based upon the FEA PRM framework for measuring performance and collecting performance information. The PRM provides the taxonomy and terminology used for developing and reporting on IT investment performance measures for the federal government. Treasury IT investment performance measures are expected to adhere to the standards and methodology of the FEA. The PRM contains a high-level performance architecture depicting the hierarchy of its structure and provides a framework that agencies populate by developing ‘operationalized’ indicators for their IT investments.
Figure 2: The FEA Performance Reference Model
Value
Value
INPUTS
Strategic Outcomes
HumanCapitalHumanCapital
Other Fixed Assets
Other Fixed Assets
TechnologyTechnology•Financial•Quality•Efficiency•Information & Data•Reliability & Availability•Effectiveness
Processes and ActivitiesProcesses and Activities•Financial•Productivity & Efficiency•Cycle Time & Timeliness
•Quality•Security & Privacy•Management & Innovation
Customer Results
Customer Results
•Customer Benefit•Service Coverage•Timeliness & Responsiveness•Service Quality•Service Accessibility
Mission and Business Results
Mission and Business Results
•Services for Citizens•Support Delivery of Services•Management of Government Resources
Value
Value
INPUTS
Strategic Outcomes
HumanCapitalHumanCapital
Other Fixed Assets
Other Fixed Assets
TechnologyTechnology•Financial•Quality•Efficiency•Information & Data•Reliability & Availability•Effectiveness
Processes and ActivitiesProcesses and Activities•Financial•Productivity & Efficiency•Cycle Time & Timeliness
•Quality•Security & Privacy•Management & Innovation
Customer Results
Customer Results
•Customer Benefit•Service Coverage•Timeliness & Responsiveness•Service Quality•Service Accessibility
Mission and Business Results
Mission and Business Results
•Services for Citizens•Support Delivery of Services•Management of Government Resources
Version 1.1 6/13/2007 Page 4 of 30
Treasury IT Performance Measures Guide
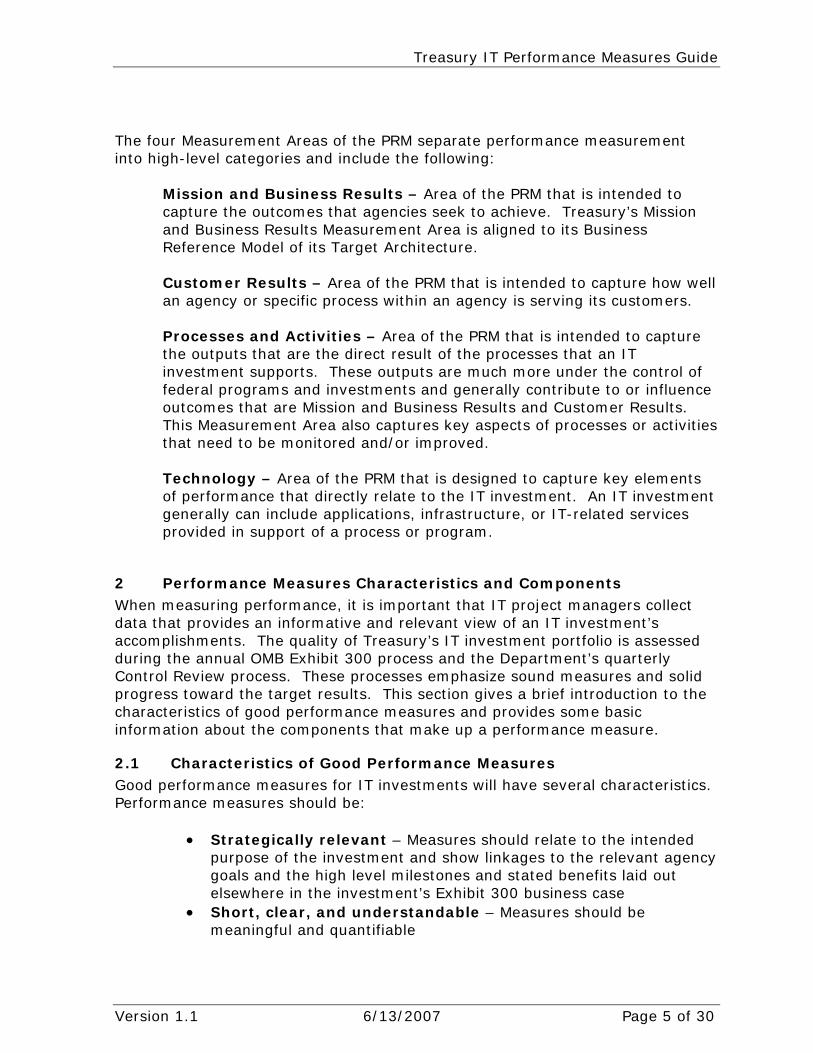
The four Measurement Areas of the PRM separate performance measurement into high-level categories and include the following:
Mission and Business Results – Area of the PRM that is intended to capture the outcomes that agencies seek to achieve. Treasury’s Mission and Business Results Measurement Area is aligned to its Business Reference Model of its Target Architecture. Customer Results – Area of the PRM that is intended to capture how well an agency or specific process within an agency is serving its customers. Processes and Activities – Area of the PRM that is intended to capture the outputs that are the direct result of the processes that an IT investment supports. These outputs are much more under the control of federal programs and investments and generally contribute to or influence outcomes that are Mission and Business Results and Customer Results. This Measurement Area also captures key aspects of processes or activities that need to be monitored and/or improved. Technology – Area of the PRM that is designed to capture key elements of performance that directly relate to the IT investment. An IT investment generally can include applications, infrastructure, or IT-related services provided in support of a process or program.
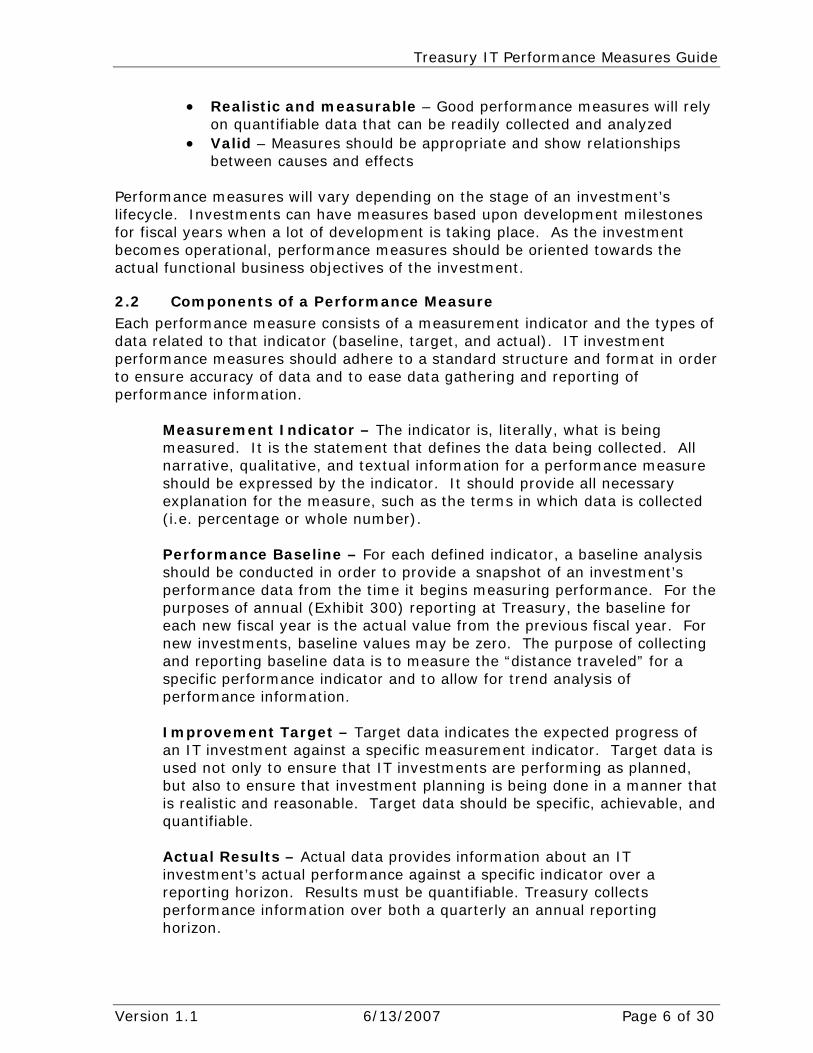
2 Performance Measures Characteristics and Components When measuring performance, it is important that IT project managers collect data that provides an informative and relevant view of an IT investment’s accomplishments. The quality of Treasury’s IT investment portfolio is assessed during the annual OMB Exhibit 300 process and the Department’s quarterly Control Review process. These processes emphasize sound measures and solid progress toward the target results. This section gives a brief introduction to the characteristics of good performance measures and provides some basic information about the components that make up a performance measure.
2.1 Characteristics of Good Performance Measures Good performance measures for IT investments will have several characteristics. Performance measures should be:
• Strategically relevant – Measures should relate to the intended purpose of the investment and show linkages to the relevant agency goals and the high level milestones and stated benefits laid out elsewhere in the investment’s Exhibit 300 business case
• Short, clear, and understandable – Measures should be meaningful and quantifiable
Version 1.1 6/13/2007 Page 5 of 30
Treasury IT Performance Measures Guide
• Realistic and measurable – Good performance measures will rely on quantifiable data that can be readily collected and analyzed
• Valid – Measures should be appropriate and show relationships between causes and effects
Performance measures will vary depending on the stage of an investment’s lifecycle. Investments can have measures based upon development milestones for fiscal years when a lot of development is taking place. As the investment becomes operational, performance measures should be oriented towards the actual functional business objectives of the investment.
2.2 Components of a Performance Measure Each performance measure consists of a measurement indicator and the types of data related to that indicator (baseline, target, and actual). IT investment performance measures should adhere to a standard structure and format in order to ensure accuracy of data and to ease data gathering and reporting of performance information.
Measurement Indicator – The indicator is, literally, what is being measured. It is the statement that defines the data being collected. All narrative, qualitative, and textual information for a performance measure should be expressed by the indicator. It should provide all necessary explanation for the measure, such as the terms in which data is collected (i.e. percentage or whole number). Performance Baseline – For each defined indicator, a baseline analysis should be conducted in order to provide a snapshot of an investment’s performance data from the time it begins measuring performance. For the purposes of annual (Exhibit 300) reporting at Treasury, the baseline for each new fiscal year is the actual value from the previous fiscal year. For new investments, baseline values may be zero. The purpose of collecting and reporting baseline data is to measure the “distance traveled” for a specific performance indicator and to allow for trend analysis of performance information. Improvement Target – Target data indicates the expected progress of an IT investment against a specific measurement indicator. Target data is used not only to ensure that IT investments are performing as planned, but also to ensure that investment planning is being done in a manner that is realistic and reasonable. Target data should be specific, achievable, and quantifiable. Actual Results – Actual data provides information about an IT investment’s actual performance against a specific indicator over a reporting horizon. Results must be quantifiable. Treasury collects performance information over both a quarterly an annual reporting horizon.
Version 1.1 6/13/2007 Page 6 of 30

Treasury IT Performance Measures Guide
More specific instructions about writing and structuring performance information will be provided in section 3 of this guidance.
3 Develop Performance Measures
This section provides detail on how the steps for developing performance measures are accomplished and how they contribute to a complete and appropriate set of measures for an IT investment.
Figure 3: Develop Performance Measures
DevelopPerformance Measures
DevelopPerformance Measures
• Establish Line of Sight• Define Measurement
Indicators
• Establish Line of Sight• Define Measurement
Indicators
GatherPerformance Data
• Conduct Baseline Analysis• Set Improvement Targets• Measure Progress
ReportPerformance Information
• Report in Exhibit 300• Report in Control Review
3.1 Establish Line of Sight Developing good performance measures begins by establishing a line of sight from inputs to outputs to outcomes for an IT investment. The description below provides a brief summary of the functions performed and the value provided by the example financial reporting system. This information will be useful for the establishment of line of sight for the sample investment.
Financial Reporting System Description
The example financial reporting system consists of several applications that receive general ledger accounting information from Treasury Bureaus and offices in order to produce quarterly financial statements and reports. The system receives financial data and validates the accounting information in order to produce reports that comply with OMB requirements and meet the needs of Bureau customers. By automating much of the financial analysis and reporting within the Department, this system allows for increased accuracy and quicker turnaround of financial reports. These applications produce timely, high quality financial reports that can be shared with the public and help contribute to success during audits of the Treasury Department. This process begins by understanding and classifying the various aspects of an IT investment. For the purpose of developing measures, the following definitions should be used:
• Inputs – Key enablers of a process or activity, including people, labor and other assets
• Outputs – The direct effects of activities and processes driven by desired outcomes; any tangible or real product (i.e. reports, analysis) produced by an activity or process
Version 1.1 6/13/2007 Page 7 of 30

Treasury IT Performance Measures Guide
• Outcomes – Mission or business oriented results; desired end state created by an investment or system; should be linked to a strategic goal for an office or agency
Establishing the line of sight from inputs to outcomes allows IT project managers to discern what aspects of their system(s) constitute quantifiable and measurable indicators of performance across the four areas of the PRM. The following diagram shows the kinds of questions IT project managers will ask when establishing line of sight
Figure 4: Establish the Line of Sight
OUTCOMESINPUTSINPUTS OUTPUTSCause and
Effect
Cause and
Effect
VA
LUEPeopleHuman Capital
TechnologyTechnology
Other Fixed AssetsOther Fixed Assets
Processes and Activities
Processes and Activities Customer
ResultsCustomer Results
Mission and Business Results
Mission and Business ResultsV
ALU
E
StrategicOutcomes
Line
of S
ight
WHAT
What are the relevant people,
technology, and/or fixed assets?
WHAT
What are the relevant people,
technology, and/or fixed assets?
HOW
How do these inputs contribute to processes and activities—and by
extension the organization’s
mission?
HOW
How do these inputs contribute to processes and activities—and by
extension the organization’s
mission?
HOW
How do these impact customers and contribute to
Mission and Business Results?
HOW
How do these impact customers and contribute to
Mission and Business Results?
WHAT
What are the processes and
activities?The products and
services?
WHAT
What are the processes and
activities?The products and
services?
WHO
Who are the customers of
these processes?
WHO
Who are the customers of
these processes?
HOW
How are these customers
impacted by the products and
serviced provided?
HOW
How are these customers
impacted by the products and
serviced provided?
WHAT
What is the purpose and mission of the organization?
WHAT
What is the purpose and mission of the organization?
HOW
How do these influence Strategic
Outcomes?
HOW
How do these influence Strategic
Outcomes?
WHAT
What is the highest-
level policy priority?
WHAT
What is the highest-
level policy priority?
3.1.1 Identify Inputs Inputs are the first step in an investment’s line of sight. The inputs are those things which enable the processes that produce the outputs of a system of application. Inputs may be technology and assets owned by a specific investment or they may be external to the investment or its organization. To identify inputs, the following questions should be asked:
• What are the relevant people, technology, and fixed assets? • How do these inputs contribute to processes and activities, and by
extension, the organization’s mission?
Version 1.1 6/13/2007 Page 8 of 30
Treasury IT Performance Measures Guide
Establish Line of Sight: Identify Inputs
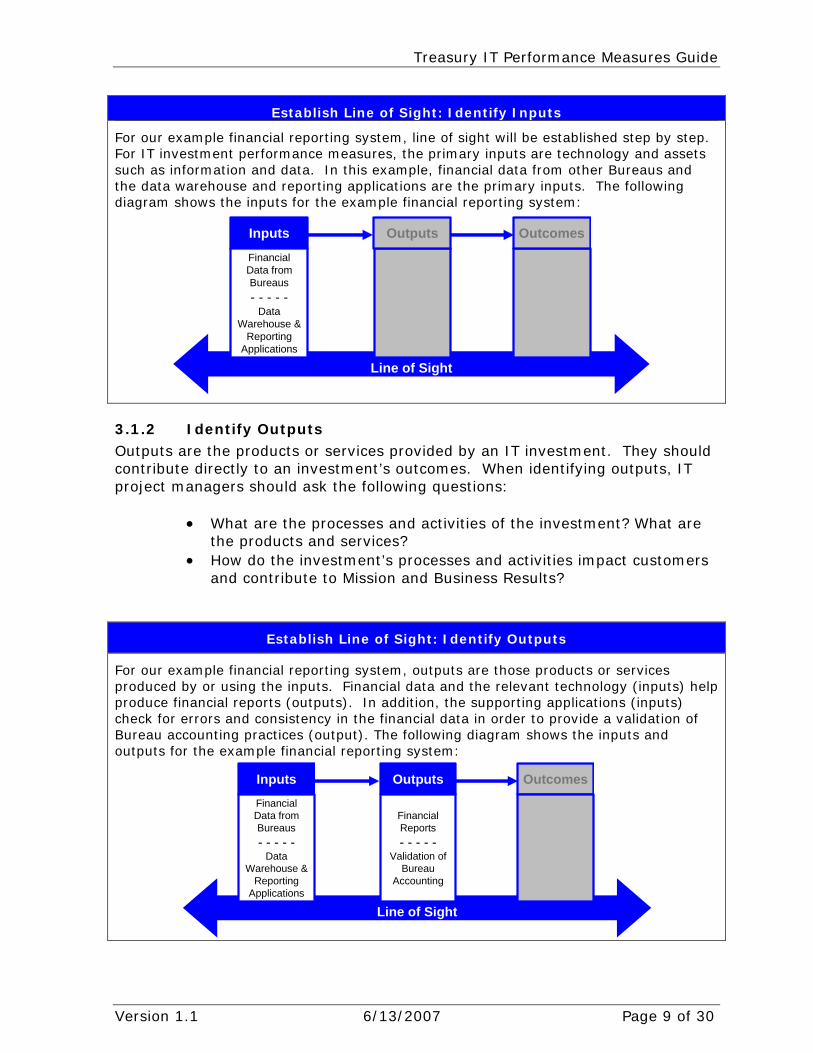
For our example financial reporting system, line of sight will be established step by step. For IT investment performance measures, the primary inputs are technology and assets such as information and data. In this example, financial data from other Bureaus and the data warehouse and reporting applications are the primary inputs. The following diagram shows the inputs for the example financial reporting system:
Inputs
Line of Sight
OutcomesFinancial Data from Bureaus- - - - -
Data Warehouse &
Reporting Applications
Outputs
3.1.2 Identify Outputs Outputs are the products or services provided by an IT investment. They should contribute directly to an investment’s outcomes. When identifying outputs, IT project managers should ask the following questions:
• What are the processes and activities of the investment? What are
the products and services? • How do the investment’s processes and activities impact customers
and contribute to Mission and Business Results?
Establish Line of Sight: Identify Outputs
For our example financial reporting system, outputs are those products or services produced by or using the inputs. Financial data and the relevant technology (inputs) help produce financial reports (outputs). In addition, the supporting applications (inputs) check for errors and consistency in the financial data in order to provide a validation of Bureau accounting practices (output). The following diagram shows the inputs and outputs for the example financial reporting system:
Inputs OutcomesOutputs
Line of Sight
Financial Reports- - - - -
Validation of Bureau
Accounting
Financial Data from Bureaus- - - - -
Data Warehouse &
Reporting Applications
Version 1.1 6/13/2007 Page 9 of 30

Treasury IT Performance Measures Guide
3.1.3 Identify Outcomes Outcomes are the conditions created by an IT investment’s success; they are results. Outcomes are the line of sight component that provides the best linkage to the higher level strategies and goals supported by the investment. For establishing outcomes, the following questions should be asked:
• Who are the customers of the investment’s processes? • How are these customers impacted by the products and services
provided? • What is the purpose and mission of the investment and
organization?
Establish Line of Sight: Identify Outcomes
For the example financial reporting system, the outcomes are the conditions achieved when inputs have been successfully leveraged and outputs have been achieved. Good financial reporting (output) produces clean audit opinions (outcome) and will provide an agency with better data about accounting and finances (outcome). The following diagram shows the inputs, outputs, and outcomes for the example financial reporting system:
OutputsInputs
Line of Sight
Clean Audit Opinion- - - - -ImprovedFinancial
Data
Outcomes
Financial Data from Bureaus- - - - -
Data Warehouse &
Reporting Applications
Financial Reports- - - - -
Validation of Bureau
Accounting
The line of sight draws a clear connection from an investment’s inputs to outputs to outcomes. Once the line of sight has been established, IT project managers and program managers should look for opportunities to measure the aspects of their IT investment’s performance.
3.2 Define Measurement Indicators Once the line of sight for an IT investment is established, specific measurement indicators can be defined. Indicators provide all of the narrative and descriptive information for a performance measure. The indicator is, literally, what is being measured. Good measurement indicators will have the following characteristics:
• Informative – The indicator helps to articulate success for the investment and the programs it supports. The indicator demonstrates progress towards goals, closing performance gaps, and achieving critical results.
Version 1.1 6/13/2007 Page 10 of 30

Treasury IT Performance Measures Guide
• Feasible – The data is currently being collected and available. The burden or cost of collecting new data for the indicator is reasonable considering how informative it would be for managers and decision-makers.
• Managed – Indicators should be linked to the investment’s business case, specifically any high level milestones and the stated benefits outlined in the alternatives analysis.
• Complete - The entire list of indicators collectively provides an accurate and broad enough "snapshot" of performance.
IT Project Managers should consider broader agency goals and objectives in the development of IT investment performance indicators. In addition to guidance from OMB, GAO audits and the Annual Performance Plans that track progress against Treasury’s Strategic Plan should be used to help IT Project Managers develop measures that are in line with the priorities of the department. Alignment to the Treasury Strategic Plan and Annual Performance Plans is necessary for reporting Performance Information as part of the OMB Exhibit 300. Additionally, IT investment performance indicators should reflect alignment to other aspects of the investment’s business case. Particularly, indicators should be reflective of the following areas of the Exhibit 300 business case: the brief summary and justification laid out in the Overview section; the business benefits laid out in the specific benefits section of the Alternatives Analysis section; and, for those investments with significant resources devoted to development, indicators should reflect any major DME milestones achieved during the fiscal year. This section should describe the benefits of the chosen approach and an investment’s measurement indicators can be used as a means of verifying that those benefits are realized. In this section, the example measurement indicators will relate to a benefit described in the description of the example financial reporting system. The PRM’s Measurement Areas and Measurement Categories provide the taxonomy for classification and reporting of measures once they have been fully developed. A good set of indicators will encompass all four Measurement Areas of the PRM. The following diagram from the FEA PRM shows the relationship between the various points along an investment’s line of sight from inputs to outcomes and the relationship those points have with the measurement areas of the PRM.
Version 1.1 6/13/2007 Page 11 of 30

Treasury IT Performance Measures Guide
Figure 5: Alignment of PRM to IT Investment Line of Sight
Value
Value
INPUTS
Outcomes
Outputs
Inputs
Strategic Outcomes
HumanCapitalHumanCapital
Other Fixed Assets
Other Fixed Assets
TechnologyTechnology•Financial•Quality•Efficiency•Information & Data•Reliability & Availability•Effectiveness
Processes and ActivitiesProcesses and Activities•Financial•Productivity & Efficiency•Cycle Time & Timeliness
•Quality•Security & Privacy•Management & Innovation
Customer Results
Customer Results
•Customer Benefit•Service Coverage•Timeliness & Responsiveness•Service Quality•Service Accessibility
Mission and Business Results
Mission and Business Results
•Services for Citizens•Support Delivery of Services•Management of Government Resources
Line of Sight Performance Reference Model
Value
Value
INPUTS
Outcomes
Outputs
Inputs
Outcomes
Outputs
Inputs
Strategic Outcomes
HumanCapitalHumanCapital
Other Fixed Assets
Other Fixed Assets
TechnologyTechnology•Financial•Quality•Efficiency•Information & Data•Reliability & Availability•Effectiveness
Processes and ActivitiesProcesses and Activities•Financial•Productivity & Efficiency•Cycle Time & Timeliness
•Quality•Security & Privacy•Management & Innovation
Customer Results
Customer Results
•Customer Benefit•Service Coverage•Timeliness & Responsiveness•Service Quality•Service Accessibility
Mission and Business Results
Mission and Business Results
•Services for Citizens•Support Delivery of Services•Management of Government Resources
Line of Sight Performance Reference Model
A comprehensive set of indicators for a Treasury IT investment will have at least one indicator for each of the four measurement areas, meaning that performance measures will exist at all stages along a investment’s line of sight. This section describes the four PRM Measurement Areas and gives a brief overview about how the PRM relates to a investment’s line of sight. For definitions of the PRM’s Measurement Areas and Measurement Categories, consult the PRM layer definitions found in the FEA Consolidated Reference Model (CRM) and the How To Use the Performance Reference Model Guide. Both can be found at http://www.whitehouse.gov/omb/egov/a-2-prm.html.
3.2.1 Technology Technology indicators capture success for an investment’s technology inputs. In order to derive Technology indicators, the Measurement Categories and Groupings under the Technology Measurement Area will give a sense of what information indicates success for an investment’s technology inputs. The Technology Measurement Area is divided into the Measurement Categories show in the diagram below:
Version 1.1 6/13/2007 Page 12 of 30
Treasury IT Performance Measures Guide
QualityFinancial
EffectivenessReliability and Availability
Information and DataEfficiency
Technology
QualityFinancial
EffectivenessReliability and Availability
Information and DataEfficiency
Technology
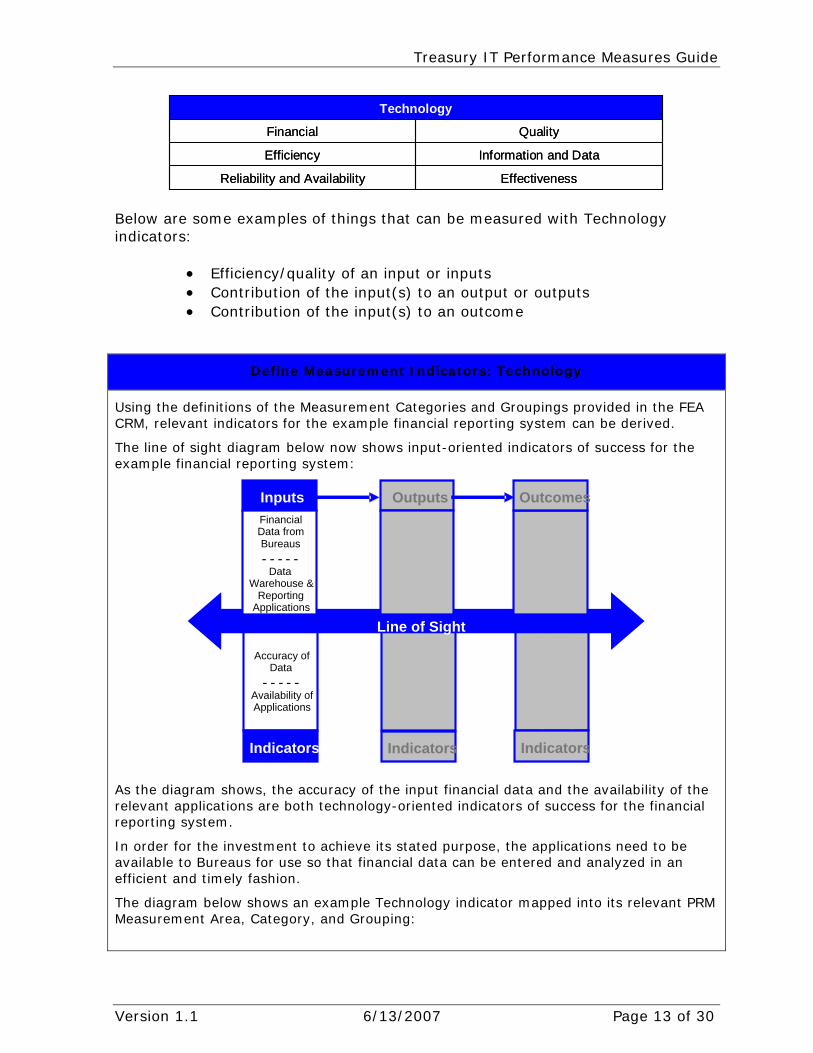
Below are some examples of things that can be measured with Technology indicators:
• Efficiency/quality of an input or inputs • Contribution of the input(s) to an output or outputs • Contribution of the input(s) to an outcome
Define Measurement Indicators: Technology
Using the definitions of the Measurement Categories and Groupings provided in the FEA CRM, relevant indicators for the example financial reporting system can be derived.
The line of sight diagram below now shows input-oriented indicators of success for the example financial reporting system:
As the diagram shows, the accuracy of the input financial data and the availability of the relevant applications are both technology-oriented indicators of success for the financial reporting system.
In order for the investment to achieve its stated purpose, the applications need to be available to Bureaus for use so that financial data can be entered and analyzed in an efficient and timely fashion.
The diagram below shows an example Technology indicator mapped into its relevant PRM Measurement Area, Category, and Grouping:
Number of Discrepancies During Audit
- - - - - Customer
satisfaction with financial
reporting
Timeliness of Reports - - - - -
Quality of Bureau
Financial Reports
Accuracy of Data
- - - - - Availability of Applications
Outputs Inputs
Line of Sight
Outcomes Financial Data from Financial Clean Audit Bureaus Reports Opinion - - - - - - - - - - - - - - -
Improved Data Validation of Warehouse & Bureau Financial
Accounting Data Reporting Applications
Indicators Indicators Indicators
Version 1.1 6/13/2007 Page 13 of 30
Treasury IT Performance Measures Guide
Measurement Area
Measurement Category
Measurement Grouping
Measurement Indicator
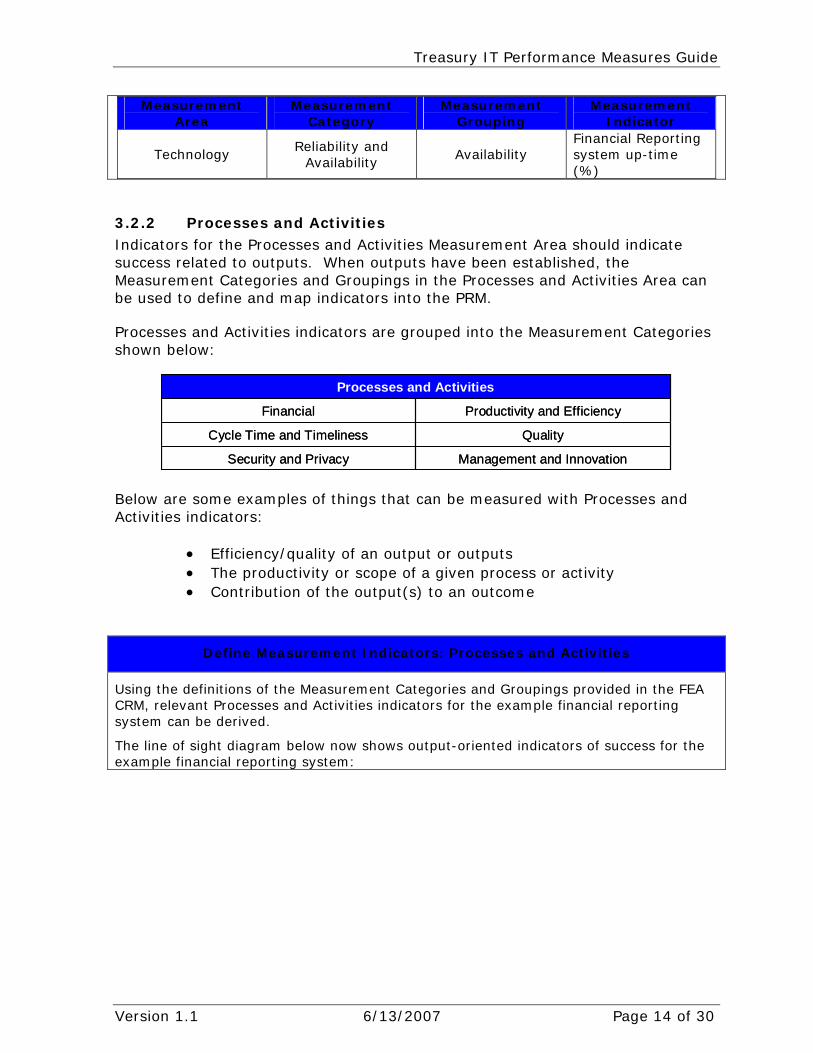
Technology Reliability and
Availability Availability
Financial Reporting system up-time (%)
3.2.2 Processes and Activities Indicators for the Processes and Activities Measurement Area should indicate success related to outputs. When outputs have been established, the Measurement Categories and Groupings in the Processes and Activities Area can be used to define and map indicators into the PRM. Processes and Activities indicators are grouped into the Measurement Categories shown below:
Productivity and EfficiencyFinancial
Processes and Activities
Management and InnovationSecurity and Privacy
QualityCycle Time and Timeliness
Productivity and EfficiencyFinancial
Processes and Activities
Management and InnovationSecurity and Privacy
QualityCycle Time and Timeliness
Below are some examples of things that can be measured with Processes and Activities indicators:
• Efficiency/quality of an output or outputs • The productivity or scope of a given process or activity • Contribution of the output(s) to an outcome
Define Measurement Indicators: Processes and Activities
Using the definitions of the Measurement Categories and Groupings provided in the FEA CRM, relevant Processes and Activities indicators for the example financial reporting system can be derived.
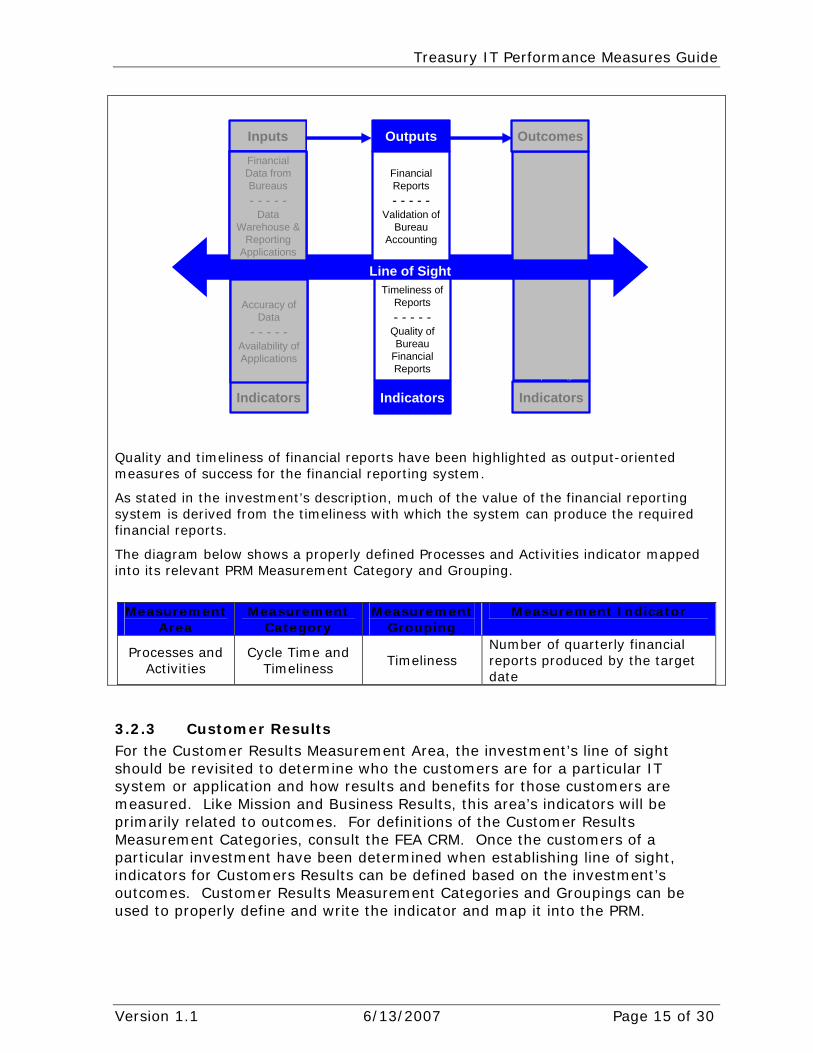
The line of sight diagram below now shows output-oriented indicators of success for the example financial reporting system:
Version 1.1 6/13/2007 Page 14 of 30
Treasury IT Performance Measures Guide
Quality and timeliness of financial reports have been highlighted as output-oriented measures of success for the financial reporting system.
As stated in the investment’s description, much of the value of the financial reporting system is derived from the timeliness with which the system can produce the required financial reports.
The diagram below shows a properly defined Processes and Activities indicator mapped into its relevant PRM Measurement Category and Grouping.
Measurement
Area Measurement
Category Measurement
Grouping Measurement Indicator
Processes and Activities
Cycle Time and Timeliness
Timeliness Number of quarterly financial reports produced by the target date
Number of Discrepancies During Audit
- - - - -Customer
satisfaction with financial
reporting
Timeliness of Reports- - - - -
Quality of Bureau
Financial Reports
Accuracy of Data
- - - - -Availability of Applications
OutputsInputs
Line of Sight
Clean Audit Opinion- - - - -
ImprovedFinancial
Data
Outcomes
Financial Data from Bureaus- - - - -
Data Warehouse &
Reporting Applications
Financial Reports- - - - -
Validation of Bureau
Accounting
Indicators Indicators Indicators
Accuracy of Data
- - - - -Availability of Applications
Financial Data from Bureaus- - - - -
Data Warehouse &
Reporting Applications
3.2.3 Customer Results For the Customer Results Measurement Area, the investment’s line of sight should be revisited to determine who the customers are for a particular IT system or application and how results and benefits for those customers are measured. Like Mission and Business Results, this area’s indicators will be primarily related to outcomes. For definitions of the Customer Results Measurement Categories, consult the FEA CRM. Once the customers of a particular investment have been determined when establishing line of sight, indicators for Customers Results can be defined based on the investment’s outcomes. Customer Results Measurement Categories and Groupings can be used to properly define and write the indicator and map it into the PRM.
Version 1.1 6/13/2007 Page 15 of 30
Treasury IT Performance Measures Guide
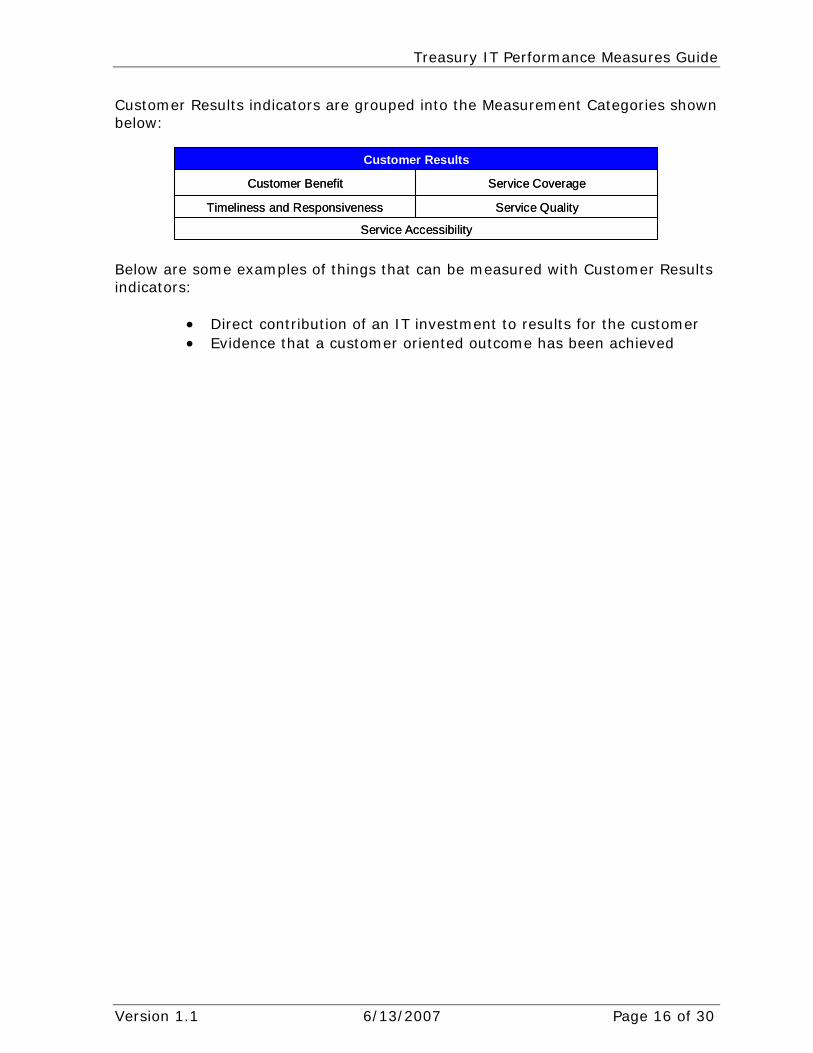
Customer Results indicators are grouped into the Measurement Categories shown below:
Service CoverageCustomer Benefit
Service Accessibility
Service QualityTimeliness and Responsiveness
Customer Results
Service CoverageCustomer Benefit
Service Accessibility
Service QualityTimeliness and Responsiveness
Customer Results
Below are some examples of things that can be measured with Customer Results indicators:
• Direct contribution of an IT investment to results for the customer • Evidence that a customer oriented outcome has been achieved
Version 1.1 6/13/2007 Page 16 of 30

Treasury IT Performance Measures Guide
Define Measurement Indicators: Customer Results
Using the definitions of the Measurement Categories and Groupings provided in the FEA CRM, relevant Customer Results indicators for the example financial reporting system can be derived.
The line of sight diagram below now shows outcome-oriented indicators of success for the example financial reporting system:
Customer satisfaction with financial reporting is identified as a customer-oriented indicator for the outcome of improved financial data.
The diagram below shows a properly defined Customer Results indicator:
Measurement
Area Measurement
Category Measurement
Grouping Measurement Indicator
Customer Results
Customer Benefit
Customer Satisfaction
Percentage of Bureau staff satisfied with quarterly financial reports (based upon survey conducted in Q1)
Number of Discrepancies During Audit
- - - - -Customer
satisfaction with financial
reporting
Timeliness of Reports- - - - -
Quality of Bureau
Financial Reports
Accuracy of Data
- - - - -Availability of Applications
OutputsInputs
Line of Sight
Clean Audit Opinion- - - - -
ImprovedFinancial
Data
Outcomes
Financial Data from Bureaus- - - - -
Data Warehouse &
Reporting Applications
Financial Reports- - - - -
Validation of Bureau
Accounting
Indicators Indicators Indicators
Accuracy of Data
- - - - -Availability of Applications
Financial Data from Bureaus- - - - -
Data Warehouse &
Reporting Applications
Timeliness of Reports- - - - -
Quality of Bureau
Financial Reports
Financial Reports- - - - -
Validation of Bureau
Accounting
3.2.4 Mission and Business Results The Mission and Business Results area maps directly to the FEA Business Reference Model (BRM). An investment’s BRM mapping should provide the basis for what aspects of mission and business contribution should be measured and how Mission and Business Results indicators should align to the PRM. For the Mission and Business Results Measurement Area, Measurement Categories are grouped into the three overarching categories shown below:
Version 1.1 6/13/2007 Page 17 of 30
Treasury IT Performance Measures Guide
Management of Government Resources
Support Delivery of ServicesServices to Citizens
Mission and Business Results
Management of Government Resources
Support Delivery of ServicesServices to Citizens
Mission and Business Results
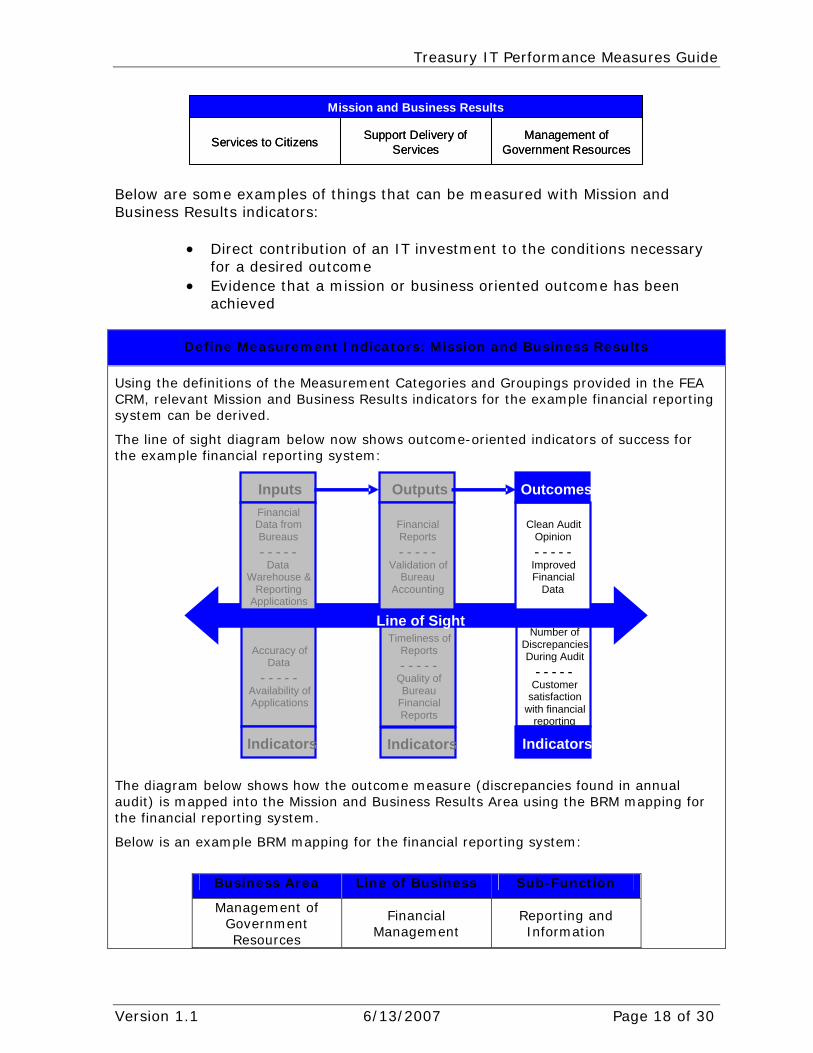
Below are some examples of things that can be measured with Mission and Business Results indicators:
• Direct contribution of an IT investment to the conditions necessary for a desired outcome
• Evidence that a mission or business oriented outcome has been achieved
Define Measurement Indicators: Mission and Business Results
Using the definitions of the Measurement Categories and Groupings provided in the FEA CRM, relevant Mission and Business Results indicators for the example financial reporting system can be derived.
The line of sight diagram below now shows outcome-oriented indicators of success for the example financial reporting system:
The diagram below shows how the outcome measure (discrepancies found in annual audit) is mapped into the Mission and Business Results Area using the BRM mapping for the financial reporting system.
Below is an example BRM mapping for the financial reporting system:
Business Area Line of Business Sub-Function
Management of Government Resources
Financial Management
Reporting and Information
Number of Discrepancies During Audit
- - - - - Customer
satisfaction with financial
reporting
Timeliness of Reports - - - - -
Quality of Bureau
Financial Reports
Accuracy of Data
- - - - - Availability of Applications
Outputs Inputs
Line of Sight
Outcomes Financial Data from Financial Clean Audit Bureaus Reports Opinion - - - - - - - - - - - - - - -
Improved Data Validation of Financial Warehouse & Bureau
Accounting Data Reporting Applications
Indicators Indicators Indicators
Version 1.1 6/13/2007 Page 18 of 30

Treasury IT Performance Measures Guide
As explained in the investment description, the financial reporting system’s validation of financial and accounting information provides improved financial reporting that contributes to positive audit findings for the Department.
Using the BRM mappings, the Mission and Business Results indicator is translated to the PRM in the diagram below:
Measurement
Area Measurement
Category Measurement
Grouping Measurement Indicator
Mission and Business Results
Financial Management
Reporting and Information
Number of discrepancies found in annual audit (conducted in Q3)
For more information about the layers of the PRM and using the PRM to define indicators, consult the CRM and the FEA How To PRM Guidance available at http://www.whitehouse.gov/omb/egov/a-1-fea.html.
4 Gather Performance Data Once measurement indicators have been defined, data gathering can begin.
Figure 6: Gather Performance Data
Develop
Performance Measures
• Establish Line of Sight• Define Measurement
Indicators
GatherPerformance Data
GatherPerformance Data
• Conduct Baseline Analysis• Set Improvement Targets• Measure Progress
• Conduct Baseline Analysis• Set Improvement Targets• Measure Progress
ReportPerformance Information
• Report in Exhibit 300• Report in Control Review
Three types of data must be collected for each indicator: baseline, target and actual data. All performance data should be expressed in terms that are quantifiable. All narrative or descriptive information should be contained in the description of the indicator. The baseline, target, and actual data should be expressed as a quantity (i.e. a number or percentage).
4.1 Conduct Baseline Analysis Agencies should conduct a baseline analysis consistent with the PRM framework in order to drive performance improvement. A baseline is a “snapshot” of the current state and/or quantifiable point from which to begin an effort and from which change can be measured and documented. Conducting baseline analysis involves setting a reference point from which improvement targets will be set and progress measured. It is important to set a baseline for each measurement indicator. This can be accomplished using current or previous data that coincides with when the
Version 1.1 6/13/2007 Page 19 of 30
Treasury IT Performance Measures Guide
investment began. There are multiple ways in which this baseline performance can be identified:
• Assess current performance against measurement indicators. For an IT investment, the performance of the existing legacy IT system (if there is one) can be identified. The investment’s current contribution to outputs and outcomes can then also be assessed.
• Benchmark current performance of other, similar organizations. If assessing current performance of the investment and/or agency is too time-consuming or not possible, other investments, agencies, or private sector organizations with similar characteristics can be used to approximate what current performance might be.
• Use initial requirements. For new programs or investments, the requirements for the new program or investment can be used as a baseline.
Both the OMB Exhibit 300 and Treasury Control form require IT project managers to provide a baseline for each performance measure indicator they report.
4.2 Set Improvement Targets Once the relevant baselines are established, the next step is to set performance targets for each measurement indicator identified. Performance targets are quantifiable estimates or expected results bound to a given time period. It is against these targets that performance will be measured. Setting targets provides the road map for performance improvement, and, in the case of investments that have reached an operational stage, targets provide the standards for effectiveness and efficiency that an investment should maintain.
4.2.1 Collect Relevant Data Improvement targets are set in the context of requirements from the Department, OMB, and Congress, as well as other sources of information, including service level agreements (SLA), customer feedback, baselines, historical data, and benchmarks.
• Directives the Department, OMB and Congress – The requirements or priorities that directly or indirectly affect the investment. These can include legislative mandates, Congressional directives, GAO or Inspector General recommendations, the OMB scorecard, agency Strategic and Annual Plans, or any other documents that may suggest improvements or specific levels of performance that are required.
• Customer Feedback – What customers say, through a variety of
forums, about the current level of performance and how it could be improved. Targeted sampling surveys, focus groups, literature, and third-party research are all ways to solicit customer feedback.
Version 1.1 6/13/2007 Page 20 of 30

Treasury IT Performance Measures Guide
• Benchmarking – The process of rating an organization’s processes, products, and performance against high-performers. Benchmarking involves seeking the “best-in-class” performers within and outside the organization, then learning from them what they do well, why they do it, and how they accomplish it. It is imperative to use standardized criteria (e.g. size, scope, mission) to identify organizations that may serve as appropriate benchmark partners.
• Baselines and Trends – Current and/or historical performance
data in the relevant areas of performance. To some extent, this information may be useful in projecting the range of possible improvement targets for the future. This information must be considered in the context of the factors that contributed to the trends and whether or not those factors will still be relevant in the future.
4.2.2 Identify Targets Once the relevant data has been collected, performance targets should be set for each measurement indicator. Targets should be set using a collaborative approach driven by leadership’s vision for improvement. Within these parameters, experience, perspective, and expertise should be leveraged at all levels of the organization—in particular from front-line employees who have critical insight into what is truly possible to achieve. This type of collaborative approach improves the chance that the relevant individuals will take ownership and be willing to be held accountable for progress. This approach also improves the chances the targets will be effective in driving improvements. Useful targets meet some or all of the following criteria:
• Specific - they focus attention on exactly what level of performance is expected
• Clarifying - they help executives, managers, and front-line
employees understand priorities and set strategies and manage resources accordingly
• Achievable, yet challenging - they “stretch” the organization to
improve but are realistic enough to be attained. The targets should be realistic but still spur improvement.
The OMB Exhibit 300 requires IT project managers to set annual performance targets, while the Treasury Control form requires Bureaus to set quarterly performance targets for each performance measure indicator they report.
4.3 Measure Progress The improvement targets set against each measurement indicator can now serve as the measuring stick for progress. Progress towards some input or output indicators may be useful on a weekly, monthly, or quarterly basis. Progress
Version 1.1 6/13/2007 Page 21 of 30

Treasury IT Performance Measures Guide
towards outcome indicators may only be available on an annual or bi-annual basis. Similarly, different stakeholders will need to track progress on different timeframes. IT project managers may wish to see weekly updates, while agency CIOs or OMB will see quarterly or annual updates.
5 Report Performance Information Once measures have been defined, data has been collected, and progress has been measured, the next step is for IT project managers to report performance information.
Figure 7: Report Performance Information
DevelopPerformance Measures
• Establish Line of Sight• Define Measurement
Indicators
GatherPerformance Data
• Conduct Baseline Analysis• Set Improvement Targets• Measure Progress
ReportPerformance Information
ReportPerformance Information
• Report in Exhibit 300• Report in Control Review
• Report in Exhibit 300• Report in Control Review
The two main vehicles for reporting performance information at the Treasury are the OMB Exhibit 300 business case, which collects performance data annually, and the CPIC Control Review Process, which collects performance data quarterly. This section provides information for how these reporting mechanisms are used to report performance information about IT investments.
5.1 Performance Information in the OMB Exhibit 300 This section provides an overview of how performance information should be reported annually as part of the OMB Exhibit 300 process at the Department of the Treasury. The Performance Information Table in the Exhibit 300 requires that performance measures be aligned to the PRM. The figure below illustrates how data should be entered in the Performance Information Table.
Figure 8: Example Performance Information Table
Performance Information Table
Fiscal Year
Strategic Goal(s)
Supported
Measurement Area
Measurement Grouping
Measurement Indicator Baseline Target Actual Results
2007 F4 Mission and Business Results
Reporting and Information
Number of discrepancies found in annual audit (conducted in Q3)
23 15 12
2007 M5 Customer Results Customer Satisfaction
% of Bureau staff satisfied with quarterly financial reports (based on survey conducted in Q1)
74 85 82
2007 M5 Processes and Timeliness Number of quarterly financial reports 90 100 105
Version 1.1 6/13/2007 Page 22 of 30
Treasury IT Performance Measures Guide
Activities produced by the target date
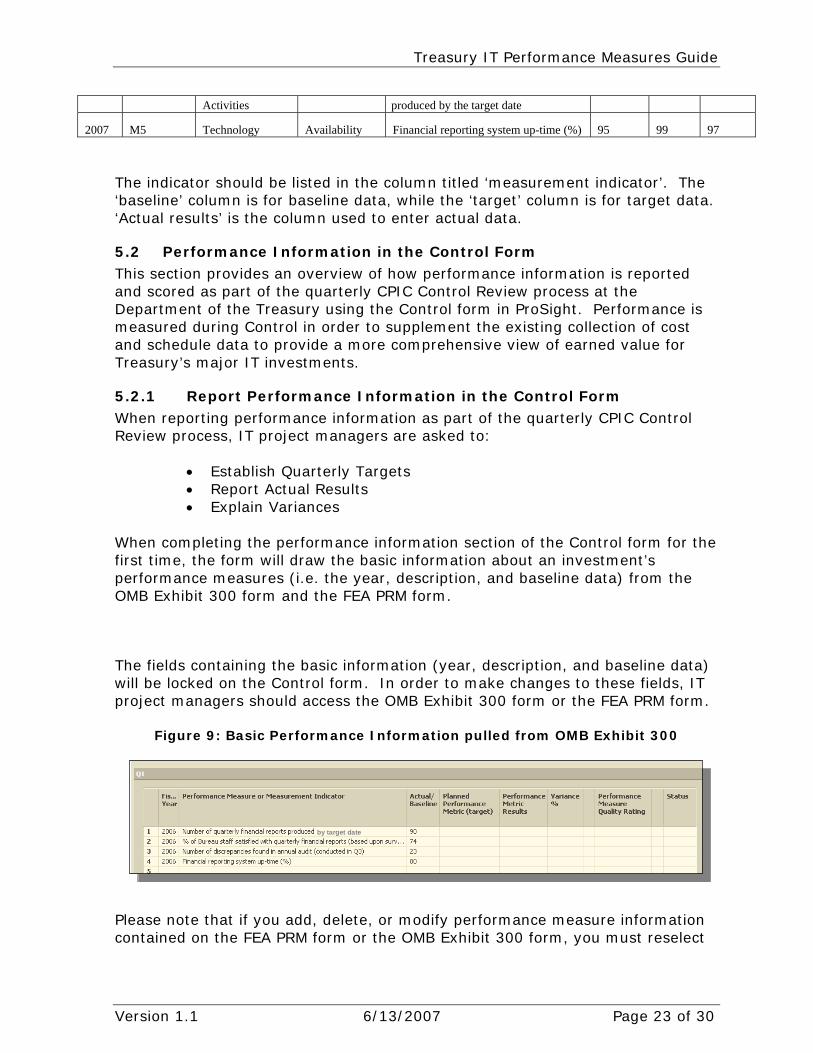
2007 M5 Technology Availability Financial reporting system up-time (%) 95 99 97
The indicator should be listed in the column titled ‘measurement indicator’. The ‘baseline’ column is for baseline data, while the ‘target’ column is for target data. ‘Actual results’ is the column used to enter actual data.
5.2 Performance Information in the Control Form This section provides an overview of how performance information is reported and scored as part of the quarterly CPIC Control Review process at the Department of the Treasury using the Control form in ProSight. Performance is measured during Control in order to supplement the existing collection of cost and schedule data to provide a more comprehensive view of earned value for Treasury’s major IT investments.
5.2.1 Report Performance Information in the Control Form When reporting performance information as part of the quarterly CPIC Control Review process, IT project managers are asked to:
• Establish Quarterly Targets • Report Actual Results • Explain Variances
When completing the performance information section of the Control form for the first time, the form will draw the basic information about an investment’s performance measures (i.e. the year, description, and baseline data) from the OMB Exhibit 300 form and the FEA PRM form.
The fields containing the basic information (year, description, and baseline data) will be locked on the Control form. In order to make changes to these fields, IT project managers should access the OMB Exhibit 300 form or the FEA PRM form.
Figure 9: Basic Performance Information pulled from OMB Exhibit 300
by target dateby target date
Please note that if you add, delete, or modify performance measure information contained on the FEA PRM form or the OMB Exhibit 300 form, you must reselect
Version 1.1 6/13/2007 Page 23 of 30

Treasury IT Performance Measures Guide
the lifecycle stage in order to pull in the updated information to the Control form. To do this, select “No Value” from the drop down menu, click Submit, then reselect the appropriate lifecycle stage and click Submit. The current information will now be populated in the Control form.
5.2.1.1 Establish Quarterly Targets Prior to the start of each fiscal year, IT project managers are required to access their Control forms and establish targets for each quarter of the year. The quarterly targets should be derived with the intent of serving as benchmarks for capturing progress towards the annual targets laid out in the OMB Exhibit 300 business case. IT project managers should complete this step prior to the start of each new fiscal year; the fourth quarter Control Review will be used to validate that this has been done. Target information must be quantifiable; the portfolio management tool will only accept numeric entries. Please note that this may require that the description of some performance indicators be reworded to allow for numeric targets (and actual results).
Figure 10: Performance Information with Quarterly Targets
by target dateby target dateby target dateby target date
The requirement for manual entry of quarterly targets is designed to allow IT project managers flexibility in the use of performance metrics. For example, investments with performance measures related to maintaining a certain level of performance (i.e. system up time) will derive quarterly targets differently than investments with measures related to successfully performing a process a certain number of times (i.e. number of applications processed). In the example above, the measure ‘Number of quarterly financial reports produced by target date’ uses quarterly targets that represent the cumulative number of applications processed up to the quarter in question. Generally speaking, this is better practice than simply setting a self-contained target for the quarter because it helps provide a better vantage point for progress towards the annual goal. Additionally, though frequent data collection and analysis is considered best practice in performance measurement, there will be measures for which data is not collected every quarter (i.e. the results of a customer satisfaction survey). In the case of annual or semi-annual data collection, IT project managers should fill out target data for the applicable quarter(s) and “N/A” for the other quarters.
Version 1.1 6/13/2007 Page 24 of 30

Treasury IT Performance Measures Guide
5.2.1.2 Report Actual Results Each quarter, as part of the CPIC Control Review process, IT project managers will be required to provide the actual results for their performance measures. IT project managers should only fill out the actual data for the quarter currently under review. Actual results information must be quantifiable; the portfolio management tool will only accept numeric entries. Please note that this may require that the description of some performance indicators be reworded to allow for numeric actual results (and targets).
Figure 11: Performance Information with Actual Results
by target dateby target dateby target dateby target date
While there is no annual aggregation of the performance data collected during the Control phase, the quarterly results will give IT project managers a view of their investments’ performance over a fiscal year and provide validation of the annual results given to OMB as part of the Exhibit 300 submission process. When looking at the annual results of Exhibit 300 measures, reviewers will use Control Review results for verification that targets were achieved as reported.
5.2.1.3 Explain Variances The variance between the actual results and the quarterly target will be calculated by the portfolio management tool based upon the data provided. The IT project manager will see this variance once the actual results information has been entered. Variances of greater than ±10% are considered outside of the acceptable range. IT project managers are required to provide an explanation for why any measure is not within ±10% variance of planned target.
Figure 12: Variance Explanation
Version 1.1 6/13/2007 Page 25 of 30
Treasury IT Performance Measures Guide
5.2.2 Assess and Score Performance Information The scoring process for performance information during the Control phase is performed by the Treasury Enterprise Architecture (EA) Program when all Control data has been submitted for the quarter. First, individual measures are evaluated and assessed, resulting in a status indicator for each measure. These indicators are then combined into an overall performance status for the investment for the reporting period.
5.2.2.1 Score Individual Performance Measures Each performance measure will be evaluated and scored according to two criteria:
1. Variance % between the actual results and quarterly target 2. Quality of the performance measure
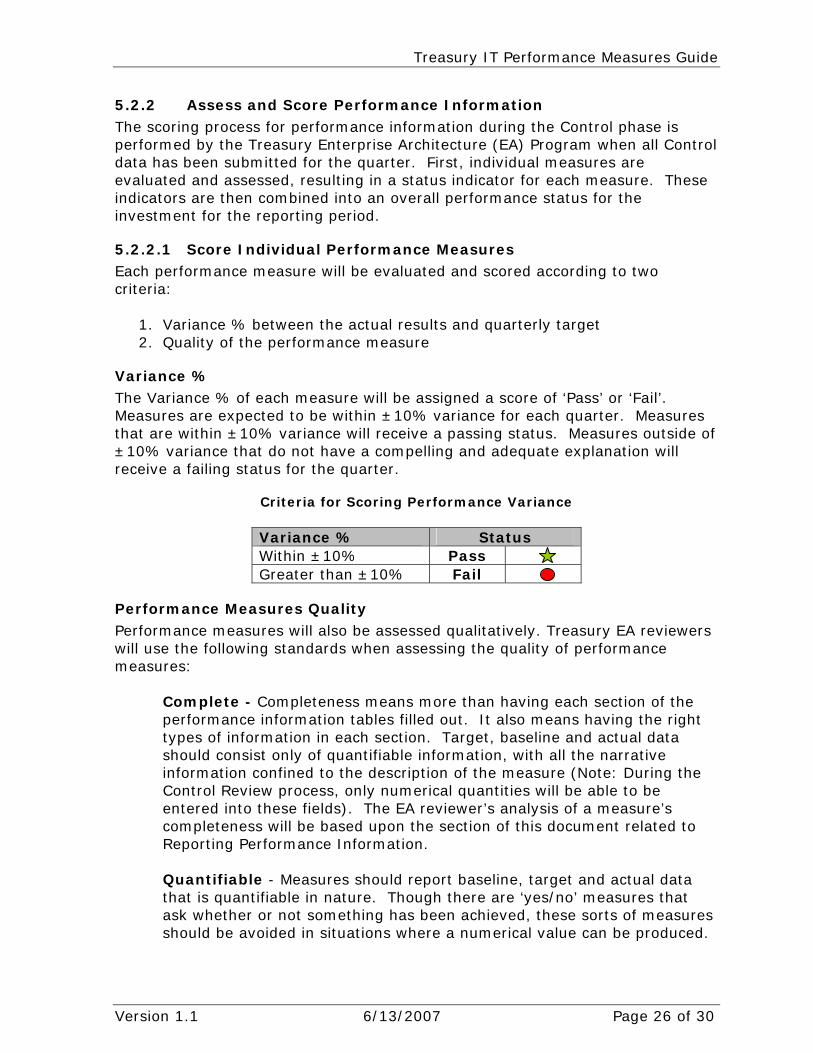
Variance % The Variance % of each measure will be assigned a score of ‘Pass’ or ‘Fail’. Measures are expected to be within ±10% variance for each quarter. Measures that are within ±10% variance will receive a passing status. Measures outside of ±10% variance that do not have a compelling and adequate explanation will receive a failing status for the quarter.
Criteria for Scoring Performance Variance
Variance % Status Within ±10% Pass Greater than ±10% Fail
Performance Measures Quality Performance measures will also be assessed qualitatively. Treasury EA reviewers will use the following standards when assessing the quality of performance measures:
Complete - Completeness means more than having each section of the performance information tables filled out. It also means having the right types of information in each section. Target, baseline and actual data should consist only of quantifiable information, with all the narrative information confined to the description of the measure (Note: During the Control Review process, only numerical quantities will be able to be entered into these fields). The EA reviewer’s analysis of a measure’s completeness will be based upon the section of this document related to Reporting Performance Information. Quantifiable - Measures should report baseline, target and actual data that is quantifiable in nature. Though there are ‘yes/no’ measures that ask whether or not something has been achieved, these sorts of measures should be avoided in situations where a numerical value can be produced.
Version 1.1 6/13/2007 Page 26 of 30

Treasury IT Performance Measures Guide
Quantifiable measures provide objective data that can be analyzed in order to observe trends and better highlight specific areas of performance that can be improved. In the case where a ‘yes/no’ measure is in use, IT project managers should consider instead finding quantifiable measures that contribute to achieving the desired state. The EA reviewer’s analysis of whether or not a measure is quantifiable will be based upon the section of this document related to Gathering Performance Data. Appropriate - Performance measures for IT investments should be appropriate indicators of success. They should reflect that a line of sight has been properly drawn from inputs to outcomes. Additionally, appropriate PRM mappings are a factor to be used when evaluating a performance measure for quality. Reviewers will be basing their analysis of the appropriateness of measures primarily on the sections of this document related to Establishing Line of Sight and Defining Measurement Indicators and on alignment to the PRM.
The quality of each measure will also be assigned a score of ‘Pass’ or ‘Fail’ by Treasury EA. The table below provides an overview of the analytics that will be used to determine the quality of a performance measure.
Figure 13: Criteria for Evaluating Performance Measure Quality
Quality Factor Status Performance measures and targets are complete and have been thoroughly developed Performance measures are quantifiable Measures and targets are appropriate indicators of performance
Pass
Performance measures were not developed
Performance measures are not quantifiable Performance information is incomplete (i.e. planned targets and/or actual results were not provided)
Fail
Scoring Status for Individual Measures Based upon the variance % and quality rating, each measure will receive an overall Pass or Fail status for that quarter.
Figure 14: Performance Measure Status
Variance % Performance Measure Quality Rating
Status
Within ±10% Pass Not within ±10% Pass Within ±10% Fail Not within ±10% Fail
Version 1.1 6/13/2007 Page 27 of 30
Treasury IT Performance Measures Guide
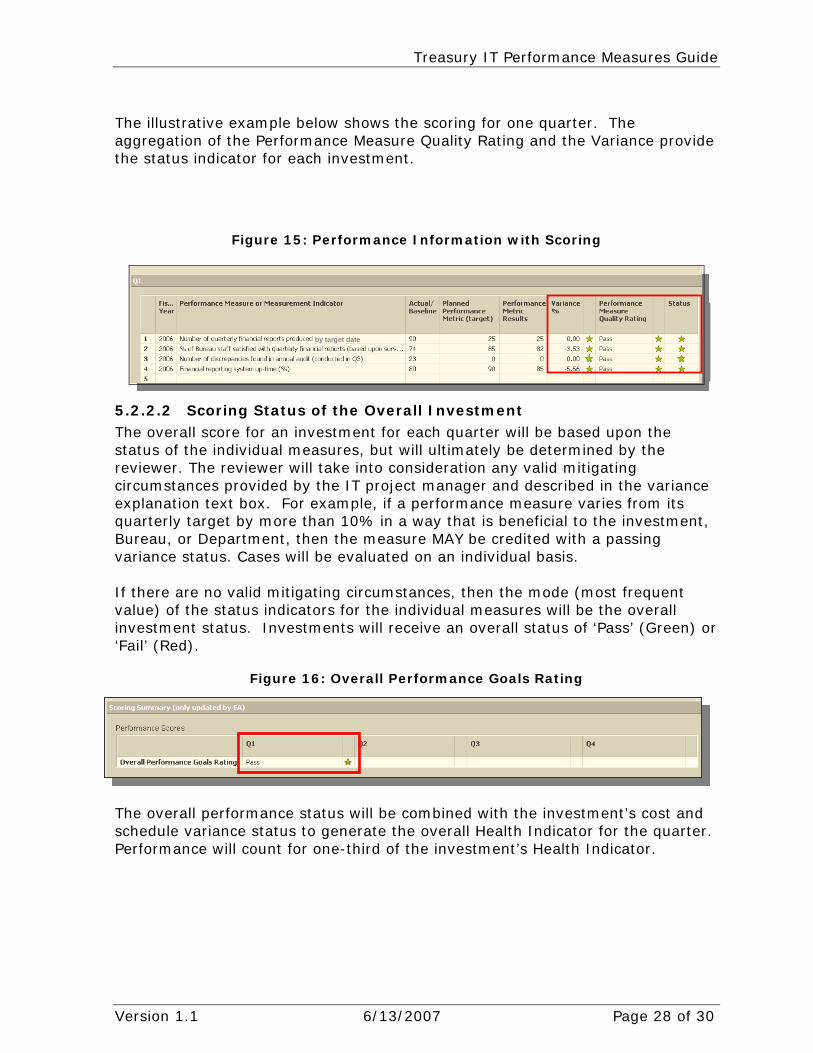
The illustrative example below shows the scoring for one quarter. The aggregation of the Performance Measure Quality Rating and the Variance provide the status indicator for each investment.
Figure 15: Performance Information with Scoring
by target dateby target date
5.2.2.2 Scoring Status of the Overall Investment The overall score for an investment for each quarter will be based upon the status of the individual measures, but will ultimately be determined by the reviewer. The reviewer will take into consideration any valid mitigating circumstances provided by the IT project manager and described in the variance explanation text box. For example, if a performance measure varies from its quarterly target by more than 10% in a way that is beneficial to the investment, Bureau, or Department, then the measure MAY be credited with a passing variance status. Cases will be evaluated on an individual basis. If there are no valid mitigating circumstances, then the mode (most frequent value) of the status indicators for the individual measures will be the overall investment status. Investments will receive an overall status of ‘Pass’ (Green) or ‘Fail’ (Red).
Figure 16: Overall Performance Goals Rating
The overall performance status will be combined with the investment’s cost and schedule variance status to generate the overall Health Indicator for the quarter. Performance will count for one-third of the investment’s Health Indicator.
Version 1.1 6/13/2007 Page 28 of 30

Treasury IT Performance Measures Guide
Figure 17: Investment Control Scorecard
Investment Control Scorecard
Current Q4 Q1 Q2 Q3
Control Metrics Status FY06 FY07 FY07 FY07
Overall Investment Status
Health Indicator
- Cost Variance
- Schedule Variance
- Performance Goals
Overall Risk Score
PM Qualification Status
Security Qualification Status
5.2.3 Feedback to Bureaus In order to offer guidance for improving the performance measures, the Treasury OCIO EA reviewer will include comments and recommendations to IT project managers through the “OCIO Comments” text box at the bottom of the Performance Information section of the Control form. At a minimum, the reviewer will provide comments and recommendations for any measure receiving a failing performance measure quality rating.
Version 1.1 6/13/2007 Page 29 of 30
Appendix A List of Sources and References FEA Consolidated Reference Model, Version 2.0 (FY08 Budget Formulation) http://www.whitehouse.gov/omb/egov/documents/FEA_CRM_v20_Final_June_2006.pdf How to Use the Performance Reference Model, Version 1 http://www.whitehouse.gov/omb/egov/documents/How_to_PRM.PDF Treasury IT CPIC Policy Guide Treasury Target Performance Architecture Executive Guide: Measuring Performance and Demonstrating Results for Information Technology Investments http://www.gao.gov/special.pubs/ai98089.pdf
Version 1.1 6/13/2007 Page 30 of 30
Related Documents