COUNTY OF LOS ANGELES TREASURER AND TAX COLLECTOR KENNETH HAHN HALL OF ADMINISTRATION 500 WEST TEMPLE STREET, ROOM 462 JOSEPH KELLY TREASURER AND TAX COLLECTOR LOS ANGELES, CALIFORNIA 90012 TELEPHONE: (213) 974-2139 FAX: (213) 626-1701 TO: FROM: April 28, 2017 Supervisor Mark Ridley-Thomas, Chairman Supervisor Hilda L. Solis Supervisor Sheila Kuehl Supervisor Janice Hahn Supervisor Kathryn Barge! f) Joseph Kelly '(LV {(' Treasurer and Tax Collector HOMEPAGE TTC.LACOUNTY.GOV PROPERTY TAX PORTAL LACOUNTYPROPERTYTAX.COM SUBJECT: REPORT OF INVESTMENTS FOR THE MONTH OF MARCH 2017 The Report of Investments for the month of March 2017 has been compiled pursuant to the California Government Code, and the Treasurer and Tax Collector's Investment Policy. In March 2017, the County's Treasury Pool Earnings Rate was 1.21 %. Short term investment yields continued to improve in the month, and we look for continued improvements in the capital markets for the remainder of the year. All investments made during the month of March 2017 were in accordance with the California Government Code and conform to the Treasurer and Tax Collector's Investment Policy. The two schedules attached summarize important Treasury Pool information. You will find the complete monthly Report of Investments at the following link: http://ttc.lacounty.gov/Proptax/investor info.asp. Should you have any questions, please contact me directly or your staff may contact Ms. Nai-len Ishikawa, Assistant Treasurer and Tax Collector, of my staff at (213) 974-2139 or [email protected]. JK:Nl:bp Attachments c: Chief Executive Officer Executive Officer, Board of Supervisors Auditor-Controller County Counsel Los Angeles Community College District Los Angeles County Office of Education

Welcome message from author
This document is posted to help you gain knowledge. Please leave a comment to let me know what you think about it! Share it to your friends and learn new things together.
Transcript

COUNTY OF LOS ANGELES TREASURER AND TAX COLLECTOR
KENNETH HAHN HALL OF ADMINISTRATION 500 WEST TEMPLE STREET, ROOM 462
JOSEPH KELLY TREASURER AND TAX COLLECTOR
LOS ANGELES, CALIFORNIA 90012 TELEPHONE: (213) 974-2139 FAX: (213) 626-1701
TO:
FROM:
April 28, 2017
Supervisor Mark Ridley-Thomas, Chairman Supervisor Hilda L. Solis Supervisor Sheila Kuehl Supervisor Janice Hahn Supervisor Kathryn Barge! f) Joseph Kelly '(LV {(' Treasurer and Tax Collector
HOMEPAGE TTC.LACOUNTY.GOV
PROPERTY TAX PORTAL LACOUNTYPROPERTYTAX.COM
SUBJECT: REPORT OF INVESTMENTS FOR THE MONTH OF MARCH 2017
The Report of Investments for the month of March 2017 has been compiled pursuant to the California Government Code, and the Treasurer and Tax Collector's Investment Policy.
In March 2017, the County's Treasury Pool Earnings Rate was 1.21 %. Short term investment yields continued to improve in the month, and we look for continued improvements in the capital markets for the remainder of the year.
All investments made during the month of March 2017 were in accordance with the California Government Code and conform to the Treasurer and Tax Collector's Investment Policy.
The two schedules attached summarize important Treasury Pool information. You will find the complete monthly Report of Investments at the following link:
http://ttc.lacounty.gov/Proptax/investor info.asp.
Should you have any questions, please contact me directly or your staff may contact Ms. Nai-len Ishikawa, Assistant Treasurer and Tax Collector, of my staff at (213) 974-2139 or [email protected].
JK:Nl:bp
Attachments
c: Chief Executive Officer Executive Officer, Board of Supervisors Auditor-Controller County Counsel Los Angeles Community College District Los Angeles County Office of Education

TREASURER AND TAX COLLECTOR REPORT OF INVESTMENTS FOR MARCH 2017
Detailed information regarding the pooled and specific portfolios, related earnings, and data required to be disclosed pursuant to statute is shown in the following report attachments.
GENERAL PORTFOLIO SCHEDULES
A - Portfolio Profiles
A1 - Credit Quality Distribution and Concentration of Credit Risk
B - Pooled Surplus Earnings Report
C - Summary Report of Treasurer’s Depository Accounts
D - Treasurer’s Activity and Cash Availability for the Next Six-Month Period
E - Treasurer’s Investment Strategy
ATTACHMENTS
I. Definitions of Securities
Detailed descriptions of the major security types invested in by the Treasury
II. Compliance Report
Detailed report of transactions, if any, which deviate from the Treasurer’s investment policy
III. Performance Report
Daily portfolio investment balances, and monthly averages
IV. Earnings on Investments (Accrual Basis) Chart
Graphic presentation of net earning rates on pool investments
V. Net Income for Month
Accrual basis net income for month, gross revenue less expenditures

TREASURER AND TAX COLLECTOR REPORT OF INVESTMENTS FOR MARCH 2017
ATTACHMENTS
VI. PSI Portfolio Participant Composition
Percentage breakdown by participant in the PSI Portfolio
VII. Composition of PSI Portfolio by Type Chart
Graphic presentation of the percentage composition of the pooled portfolio by major security type
VIII. Investment Transaction Journal
Listing of securities purchased, sold and transferred between portfolios during the month
IX. Comparison of Investment Cost to Market Value
Summary comparison of investment amortized cost to market value by security type
X. Treasurer Position Compared to Market Value Report
Inventory listing of portfolio securities showing amortized cost and market value for each investment
XI. Trustee and Managed Funds
Listing of funds and accounts managed by outside trustees
XII. Schedule of Floating Rate Securities
Inventory listing of portfolio securities where the stated interest rate changes between the purchase date and the maturity date
XIII. Schedule of Bond Anticipation Notes
Inventory listing of Bond Anticipation Notes held by the Pooled Surplus Investment portfolio and their current interest rates
XIV. Inventory Report – Totals Section Security Type Grouping
Summary of weighted-average time to maturity by security type

TREASURER AND TAX COLLECTOR REPORT OF INVESTMENTS FOR MARCH 2017
ATTACHMENTS
XV. Inventory Report – Totals Section Maturity Range Grouping
Summary of the amortized cost value of securities maturing within selected time frames
XVI. Composition of PSI Portfolio by Maturity Chart
Graphic presentation of the percentage composition of the pooled portfolio by selected maturity ranges
XVII. Pooled Money Investment Board Letter – Treasurer State of California
Summary of State Treasurer’s Local Agency Investment Fund (LAIF)
XVIII. Pending Transactions Report
Detail report of transactions with future settlement dates

Pooled SpecificSurplus Purpose
PORTFOLIO PROFILE Investments Investments
Inventory Balance at 3/31/17
At Cost 29,660,443,434$ 109,185,268$ At Market 29,461,591,318$ 106,928,891$
Repurchase Agreements -$ -$
Reverse Repurchase Agreements -$ -$
Composition by Security Type:
Certificates of Deposit 12.73% 22.90%United States Government and Agency Obligations 57.57% 34.14%Bankers Acceptances 0.00% 0.00%Commercial Paper 29.30% 0.00%Municipal Obligations 0.24% 3.91%Corporate and Deposit Notes 0.16% 0.00%Repurchase Agreements 0.00% 0.00%Asset-Backed 0.00% 0.00%Other 0.00% 39.05%
1-60 days 35.62% 0.00% 61 days-1 year 14.43% 62.02% Over 1 year 49.95% 37.98%
Weighted Average Days to Maturity 673
POOLED SURPLUS AND SPECIFIC PURPOSE INVESTMENTSAS OF MARCH 31, 2017
SCHEDULE A

POOLED SURPLUS AND SPECIFIC PURPOSE INVESTMENTS AS OF MARCH 31, 2017
SCHEDULE A1
The following is a summary of the credit quality distribution and concentration of credit risk by investment type as a percentage of each portfolio’s cost at March 31, 2017:
S&P Moody's Fitch % of PortfolioPSI
Commercial Paper A-1 P-1 F1 29.30%
Corporate and Deposit Notes A-1+ P-1 F1 0.08%
AA- Aa1 AA 0.08%
Los Angeles County Securities AA+ Aa2 AA 0.24%
Negotiable Certificates of Deposit A-1 P-1 F1 12.73%
U.S. Agency Securities AA+ Aaa AAA 52.79%
U.S. Treasury Securities:
U.S. Treasury Notes AA+ Aaa AAA 1.43%
U.S. Treasury Bills AA+ Aaa AAA 3.35%
100.00%
SPI
Local Agency Investment Fund Not rated Not rated Not rated 39.05%
Commercial Paper - - - 0.00%
Corporate and Deposit Notes - - - 0.00%
Mortgage Trust Deeds - - - 0.00%
Los Angeles County Securities AA+ Aa2 AA 3.91%
Negotiable Certificates of Deposit A-1+ P-1 F1+ 22.90%
U.S. Agency Securities AA+ Aaa AAA 34.14%
U.S. Treasury Securities:
U.S. Treasury Notes - - - 0.00%
U.S. Treasury Bonds - - - 0.00%
100.00%

Investment Balance 3/31/17 29,660,443,434$
Market Value at 3/31/17 29,461,591,318$
Average Daily Balance 27,991,451,147$
Gains and Losses:
For the Month 244,445$ For the Past 12 Months 6,075,024$
Unrealized Gains and Losses on Transfers between Portfolio for the Month -$
Earnings for the Month 28,972,605$
Earnings for the Past 12 Months 275,017,282$
Earnings Rate for the Month 1.21%
POOLED SURPLUS EARNINGS REPORT
MARCH 31, 2017
SCHEDULE B
TREASURER POOLED SURPLUSINVESTMENT PORTFOLIO

Bank Name
Bank of America - Concentration
Bank of the West - Concentration (A)
Citibank - Concentration
JP Morgan Chase - Concentration (B)
Union Bank- Concentration
Wells Fargo - Concentration
Total Ledger Balance for all Banks
(A)
(B)
2,293,455.63$
216,272,397.84$
$50 million of this amount is related to the deposit of funds in an interest-bearing
money market savings account, in accordance with the Treasurer's authority under
California Government Code Section 53633.
SUMMARY REPORT OF TREASURER'S DEPOSITORY ACCOUNTS
AS OF MARCH 31, 2017
SCHEDULE C
Balance
118,835,621.18$
$40.361 million of this amount is related to the deposit of funds in an interest-bearing
money market savings account, in accordance with the Treasurer's authority under
California Government Code Section 53633.
41,055,648.81$
-$
53,547,996.71$
539,675.51$

TREASURER’S ACTIVITY FOR MARCH 2017 AND CASH AVAILABILITY
FOR THE NEXT SIX-MONTH PERIOD
SCHEDULE D Government Code Section 53646 (b) (3) requires the Treasurer and Tax Collector to include a statement in the investment report, denoting the ability of the Pooled Surplus Investment Fund to meet its disbursement requirements for the next six months.
The Los Angeles County Pooled Surplus Investment Fund consists of funds in its treasury deposited by various entities required to do so by statute, as well as those entities voluntarily depositing monies in accordance with Government Code Section 53684.
The Treasurer and Tax Collector is required to disburse monies placed in the treasury as directed by the Auditor-Controller, except for the making of legal investments, to the extent funds are transferred to one or more clearing funds in accordance with Government Code Section 29808.
The Treasurer and Tax Collector, in his projection of cash availability to disburse funds as directed by the Auditor-Controller, is relying exclusively on historical Pooled Surplus Investment Fund deposits and disbursements and future cash flow projections provided by the depositing entities. No representation is made as to an individual depositor’s ability to meet their anticipated expenditures with anticipated revenues.
Summary of Activity for March 2017
Total Deposits $ 6,237,681,455.66 Total Disbursements $ 4,671,432,588.93
Discretionary Funds Liquidity Withdrawal Ratio: As of March 31, 2017 1.40
Six-Month Cash Availability Projection:
Investment Cumulative
Month Maturities Deposits Disbursements Available Cash
April 7,529,054,000.00$ 7,652,400,000.00$ 5,085,600,000.00$ 8,021,783,000.00$ May 3,188,800,000.00$ 2,985,400,000.00$ 5,452,700,000.00$ 13,454,131,000.00$ June 1,446,061,000.00$ 3,708,700,000.00$ 5,684,900,000.00$ 11,960,547,000.00$ July 275,000,000.00$ 3,364,300,000.00$ 5,316,700,000.00$ 10,402,777,000.00$ August 72,000,000.00$ 3,023,500,000.00$ 4,834,200,000.00$ 8,475,377,000.00$ September 273,055,000.00$ 4,042,000,000.00$ 4,438,500,000.00$ 6,714,677,000.00$

TREASURER’S INVESTMENT STRATEGY
SCHEDULE E
Two portfolios are maintained by the Los Angeles County Treasurer.
The Pooled Surplus Investment (PSI) Portfolio is used to account for all pooled investments. The PSI strategy is to maintain principal and to provide sufficient cash to meet expenditure needs. The cash flow needs of our pool members are monitored daily to ensure that sufficient liquidity is maintained to meet the needs of participants. A review of the PSI Portfolio’s cash flow projections at the preparation date of this report indicates that longer average days to maturity may be prudent. As yields increase in the two to three year maturity range, the average days to maturity will be prudently increased to the target of a range between 1 and 2 years.
In March 2017, the Treasurer placed $166.046 million in the Bank of the West Money Market Plus Account and $50 million in JP Morgan Chase Money Market Account in accordance with the Treasurer’s authority under California Government Code Section 53633. At month-end, $40.361 million remained in the Bank of the West Money Market Plus Account and $50 million in the JP Morgan Chase Money Market Account. These accounts are collateralized in accordance with California Government Code Section 53652. The balances and income are included in the Pool’s earnings rate calculations.
The Specific Purpose Investment Portfolio (SPI) is used to account for specific investments requested by various entities to provide for specific needs not available if monies are placed in a pool. The individual investment strategies are targeted for the needs of the requesting entity.
Expected cash flow projections for the next twelve months continue to indicate that sufficient cash is available for participants’ estimated needs. We will continue our basic investment philosophy to buy and hold to a designated maturity, high quality fixed income investments.

ATTACHMENT I
TREASURER AND TAX COLLECTOR
REPORT OF INVESTMENTS DEFINITIONS OF SECURITIES
AGENCIES – Securities (debentures and notes) issued by Federal agencies, such as Federal Home Loan Banks (FHLB), and Federal Farm Credit Banks (FFCB). Agency Securities are issued on both a discount and coupon basis and have a variety of maturity periods. A few are backed by the full faith and credit of the United States Government, some are guaranteed by the Treasury or supported by the issuing agency’s right to borrow from the Treasury, and some lack any formal governmental backing. Government National Mortgage Association (GNMA) and Federal Home Loan Mortgage Corp. (FHLMC) securities are mortgage-backed. ASSET BACKED SECURITIES – Corporate notes secured by an identifiable pool of assets such as loans, leases, and installment contracts or trade receivables. The interest rate is fixed and paid either on a monthly or semi-annual basis. In some cases a portion of the principal is also paid monthly. BANKERS ACCEPTANCES – Negotiable time drafts drawn on foreign or domestic banks to finance the export, import, shipment, and storage of goods. The drafts are sold at a discount and redeemed by the accepting bank at maturity for full face value. Maturities range from one to 270 days. COLLATERALIZED CERTIFICATES OF DEPOSIT – Non-negotiable instruments evidencing a time deposit made with a bank at a fixed rate of interest for a fixed period, secured by collateral such as United States Government securities or mortgages. COMMERCIAL PAPER – Promissory notes with a maturity of one to 270 days issued in the open market by various economic entities to finance certain short-term credit needs. Notes are issued on a discount or interest-bearing basis. CORPORATE NOTES – Unsecured, registered debt securities issued by corporations operating within the United States at fixed or variable rates of interest for a fixed period. Interest for floating rate corporate notes is payable periodically at a rate which is adjusted monthly according to a predetermined formula. Fixed rate corporate notes pay interest semi-annually. GOVERNMENTS – Negotiable United States Treasury securities such as Treasury bills, notes and bonds. Treasury bills are issued on a discount basis in 1-month, 3-month, 6-month, and 52-week maturities. Treasury notes and bonds are coupon issues, with one to ten year and ten to thirty year maturities, respectively. Treasury securities are guaranteed as to principal and interest by the United States Government.

Definitions of Securities Page 2 FORWARD CONTRACTS – Customized contracts traded in the Over The Counter Market where the holder of the contract is obligated to buy or sell a specific amount of an underlying asset at a specific price on a specific future date. FUTURE CONTRACTS – Standardized contracts traded on recognized exchanges where the holder of the contract is obligated to buy or sell a specific amount of an underlying asset at a specific price on a specific future date. INTEREST RATE SWAP AGREEMENT – Contractual agreement in which two parties agree to exchange interest payment streams for a specific term. There is no exchange of principal, but a “notional amount” is established to serve as the basis for calculating the interest payment. LOCAL AGENCY INVESTMENT FUND – Shares of beneficial interest issued by the State of California pursuant to Government Code Section 16429.1. MONEY MARKET FUND – Shares of beneficial interest issued by diversified management companies registered with the Securities and Exchange Commission in accordance with Section 270, 2a-7 of Title 17 of the Code of Federal Regulation. MUNICIPALS – Debt securities issued by state and local governments and their agencies, usually in the form of bonds, notes and certificates of participation. These securities may be short or long-term, and normally coupon issues are secured in some manner by the borrower. NEGOTIABLE CERTIFICATES OF DEPOSIT – Negotiable instruments evidencing a time deposit made with a commercial bank or thrift institution at a fixed rate of interest for a fixed period. Term certificates of deposits (CDs) are issued with maturities in excess of one year, and normally pay interest semi-annually. Eurodollar CDs are dollar-denominated CDs issued by foreign (mainly London) branches of major American and foreign commercial banks. Yankee CDs are dollar-denominated CDs issued by foreign commercial banks domiciled in the United States. OPTION CONTRACTS – Contracts traded in either the Over The Counter Market or recognized exchanges where the purchaser has the right but not the obligation to buy or sell a specific amount of an underlying asset at a specific price within a specific time period. PROMISSORY NOTE – An unsecured promise to pay between two entities. Notes are on a discount or interest- bearing basis. REVERSE REPURCHASE AGREEMENTS – A reverse repurchase agreement consists of two simultaneous transactions. One is the sale of securities by the County to a bank or dealer. The other is the commitment by the County to repurchase the securities at the same price at a mutually agreed upon date. The County invests the cash proceeds

Definitions of Securities Page 3 of the “sale” in other securities. The term of the reverse repurchase agreements may not exceed one year. The securities “sold” are typically treasury issues. REPURCHASE AGREEMENTS – A repurchase agreement consists of two simultaneous transactions. One is the purchase of securities by the County from a bank or dealer. The other is the commitment by the County to sell the securities back at an agreed upon date and price. The term of the repurchase agreements may not exceed thirty days. The securities “purchased” are typically treasury issues. SECURITIES LENDING AGREEMENTS – Agreements under which the County agrees to transfer securities to a borrower who, in turn agrees to provide collateral to the County. During the term of the agreement, both the securities and the collateral are held by a third party. At the conclusion of the agreement, the securities are transferred back to the County in return for the collateral. SUPRANATIONALS – United States dollar denominated senior unsecured unsubordinated obligations issued or unconditionally guaranteed by any of the supranational institutions identified in Government Code Section 53601(Q) which are eligible for purchase and sale within the United States. TRUST INVESTMENTS – Shares of beneficial interest issued by a joint powers authority organized pursuant to Government Code Section 6509.7 that invests in securities and obligations authorized in Section 53601 (a) to (o) of the Government Code.

ATTACHMENT II
TREASURER AND TAX COLLECTOR REPORT OF INVESTMENT TRANSACTIONS FOR MARCH 2017
COMPLIANCE REPORT
Portfolio Securities Not in Accordance with Treasurer Policy
For the Month of March 2017
No exceptions noted.

LOS ANGELES COUNTY TREASURERPERFORMANCE REPORTPORTFOLIO COSTTHROUGH 3/31/2017ATTACHMENT III
DAY TOTAL COST TOTAL COST
3/1/2017 28,255,619,901.69$ 109,185,228.76$
3/2/2017 28,241,161,871.96 109,185,228.76
3/3/2017 27,987,590,176.09 109,185,228.76
3/4/2017 27,987,590,176.09 109,185,228.76
3/5/2017 27,987,590,176.09 109,185,228.76
3/6/2017 27,758,961,633.04 109,185,228.76
3/7/2017 27,673,608,322.04 109,185,228.76
3/8/2017 27,538,398,171.66 109,185,228.76
3/9/2017 27,564,111,111.60 109,185,228.76
3/10/2017 27,493,537,396.03 109,185,228.76
3/11/2017 27,493,537,396.03 109,185,228.76
3/12/2017 27,493,537,396.03 109,185,228.76
3/13/2017 27,509,861,721.20 109,185,228.76
3/14/2017 27,488,008,975.25 109,185,228.76
3/15/2017 27,382,148,515.38 109,185,228.76
3/16/2017 27,315,403,145.54 109,185,228.76
3/17/2017 27,452,721,646.04 109,185,228.76
3/18/2017 27,452,721,646.04 109,185,228.76
3/19/2017 27,452,721,646.04 109,185,228.76
3/20/2017 27,511,753,412.05 109,185,228.76
3/21/2017 27,579,938,053.56 109,185,228.76
3/22/2017 27,546,210,768.32 109,185,228.76
3/23/2017 28,145,247,782.11 109,185,228.76
3/24/2017 28,161,669,268.23 109,185,228.76
3/25/2017 28,161,669,268.23 109,185,228.76
3/26/2017 28,161,669,268.23 109,185,228.76
3/27/2017 28,365,789,729.54 109,185,228.76
3/28/2017 29,491,049,462.92 109,185,228.76
3/29/2017 29,719,646,720.90 109,185,228.76
3/30/2017 29,701,067,367.41 109,185,228.76
3/31/2017 29,660,443,434.07 109,185,267.89
27,991,451,147.08$ 109,185,230.02$
POOLED SURPLUS INVESTMENTS SPECIFIC PURPOSE INVESTMENTS

0.95% 0.96% 1.02% 1.00% 1.01% 1.01%
1.11%
1.29%
1.21% 1.27%
1.36%
1.44% 1.44% 1.49%
1.44% 1.46%
1.63%
1.46%
0.11% 0.12% 0.14% 0.14% 0.17%
0.24% 0.26% 0.26% 0.26%
0.00%
0.20%
0.40%
0.60%
0.80%
1.00%
1.20%
1.40%
1.60%
1.80%
JUL AUG SEP OCT NOV DEC JAN FEB MAR
LOS ANGELES COUNTY TREASURER EARNINGS RATE ON INVESTMENTS
FISCAL YEAR 2016-17 ATTACHMENT IV
PSI
SPI
MMF*
* Source: Money Fund Report as of January 17, 2017. Provided for comparative purposes only.

LOS ANGELES COUNTY TREASURER
NET INCOME FOR THE MONTH-ENDED 3/31/2017 (ACCRUAL BASIS)
ATTACHMENT V
SPECIFIC
(PSI) PURPOSE
TRADING/NON-TRADING INVESTMENT
Revenues:
Interest Earnings $22,066,968 $135,311
Gains (Losses) on Sales of Non-Trading
Securities. - -
Gains (Losses) on Sales of Trading
Securities. 244,445
Amortization/Accretion 6,661,192 39
Prior Accrual Adjustment -
Total Revenues $28,972,605 $135,350
Expenses:
Interest Expense - -
*Investment Management Fee - 2,713
- $2,713
NET INCOME $28,972,605 $132,637
*Estimated and later adjusted.

Los Angeles County TreasurerPSI CompositionAs of March 31, 2017Attachment VI
PSI PORTFOLIO PARTICIPATION COMPOSITION
Non- Entity Discretionary Discretionary
Consolidated School Districts 48.41%
Los Angeles County and Related Entities 43.24%
Consolidated Sanitation Districts 2.38%
Metropolitan Transportation Authority 1.06%
Miscellaneous Agencies Pooled Investments 2.17%
South Coast Air Quality Management District 1.97%
Miscellaneous 0.02%
Subtotal 91.65% 7.60%
County Bond Proceeds and Repayment Funds 0.75%
Grand Total 91.65% 8.35%

In Thousands
Negotiable CD's 3,775,015
Corp & Deposit Notes 49,941
Bankers Acceptance -
Commercial Paper 8,689,733
Municipal 70,000
Agencies 15,657,924
Other -
Government 1,417,830
Total 29,660,443$
Investment Composition Is In Compliance With The Los Angeles County Treasurer's Investment Policy.
LOS ANGELES COUNTY TREASURER
COMPOSITION OF PSI PORTFOLIO BY SECURITY TYPE
AS OF MARCH 2017
ATTACHMENT VII
Negotiable CD's, 12.73% Corp & Deposit
Notes, 0.16%
Commercial Paper, 29.30%
Municipal, 0.24% Agencies, 52.79%
Government, 4.78%

1
Los Angeles County TreasurerInvestment Transactions JournalPurchase Detail ReportGroup: Pooled Surplus InvestmentsFor the Period: March 1, 2017 to March 31, 2017Attachment VIII
ACCOUNT Sec Type Settle Date Sec ID Description Face Rate Mat Date Par Amount Principal Purch Int Bank BrokerNTRD CPD 3/1/2017 104028 NATIXIS NY BRANCH CP 0.66 3/2/2017 50,000,000.00 49,999,083.33 0 CITI RBCCM
NTRD CPD 3/1/2017 104029 LA FAYETTE ASSET SEC LLC C 0.77 4/20/2017 30,000,000.00 29,967,916.67 0 CITI BLAYBV
NTRD CPD 3/1/2017 104030 THUNDER BAY FUNDING LLC CP 0.74 4/20/2017 45,000,000.00 44,953,750.00 0 CITI MFR
NTRD CPD 3/1/2017 104035 CHARIOT FUNDING LLC CP 0.72 4/11/2017 50,000,000.00 49,959,000.00 0 CITI BLAYBV
NTRD CPD 3/1/2017 104036 NATIXIS NY BRANCH CP 0.66 3/2/2017 50,000,000.00 49,999,083.33 0 CITI MISC
NTRD CPD 3/1/2017 104037 NATIXIS NY BRANCH CP 0.66 3/2/2017 50,000,000.00 49,999,083.33 0 CITI MISC
NTRD CPD 3/1/2017 104038 CRC FUNDING LLC CP 1.03 6/13/2017 14,665,000.00 14,621,363.48 0 CITI BLAYBV
NTRD CPD 3/1/2017 104032 SHEFFIELD RECEIVABLES CORP 0.77 4/6/2017 50,000,000.00 49,961,500.00 0 CITI LOOP
NTRD CPD 3/2/2017 104042 ABBEY NATIONAL TREAS SV PL 0.78 4/14/2017 50,000,000.00 49,953,416.67 0 CITI MFR
NTRD CPD 3/2/2017 104043 ABBEY NATIONAL TREAS SV PL 0.78 4/14/2017 25,000,000.00 24,976,708.33 0 CITI MFR
NTRD CPD 3/2/2017 104044 AUTOBAHN FUNDING CO LLC CP 0.72 4/5/2017 28,000,000.00 27,980,960.00 0 CITI BLAYBV
NTRD CPD 3/2/2017 104045 ATLANTIC ASSET SEC LLC CP 0.75 4/12/2017 50,000,000.00 49,957,291.67 0 CITI BCI
NTRD CPD 3/2/2017 104046 ATLANTIC ASSET SEC LLC CP 0.75 4/19/2017 50,000,000.00 49,950,000.00 0 CITI LOOP
NTRD CPD 3/2/2017 104047 ATLANTIC ASSET SEC LLC CP 0.8 4/25/2017 31,000,000.00 30,962,800.00 0 CITI MS
NTRD CPD 3/2/2017 104053 ABBEY NATIONAL TREAS SV PL 0.78 4/14/2017 33,000,000.00 32,969,255.00 0 CITI MFR
NTRD CPD 3/3/2017 104058 NATIXIS NY BRANCH CP 0.66 3/6/2017 50,000,000.00 49,997,250.00 0 CITI JPM
NTRD CPD 3/3/2017 104059 NATIXIS NY BRANCH CP 0.66 3/6/2017 50,000,000.00 49,997,250.00 0 CITI JPM
NTRD CPD 3/3/2017 104060 NATIXIS NY BRANCH CP 0.66 3/6/2017 50,000,000.00 49,997,250.00 0 CITI JPM
NTRD CPD 3/3/2017 104061 CRC FUNDING LLC CP 1.05 6/13/2017 25,000,000.00 24,925,625.00 0 CITI BLAYBV
NTRD CPD 3/3/2017 104062 ATLANTIC ASSET SEC LLC CP 0.81 4/25/2017 25,000,000.00 24,970,187.50 0 CITI MS
NTRD CPD 3/3/2017 104063 CREDIT AGRICOLE CIB NY BR 0.76 4/7/2017 50,000,000.00 49,963,055.56 0 CITI MFR
NTRD CPD 3/3/2017 104065 ABBEY NATIONAL TREAS SV PL 0.78 4/7/2017 50,000,000.00 49,962,083.33 0 CITI MFR
NTRD CPD 3/6/2017 104068 CHARIOT FUNDING LLC CP 0.73 4/17/2017 50,000,000.00 49,957,416.67 0 CITI JPM
NTRD CPD 3/6/2017 104077 ATLANTIC ASSET SEC LLC CP 0.8 4/19/2017 32,500,000.00 32,468,222.22 0 CITI MS
NTRD CPD 3/6/2017 104070 AUTOBAHN FUNDING CO LLC CP 0.75 4/10/2017 30,000,000.00 29,978,125.00 0 CITI BLAYBV
NTRD CPD 3/6/2017 104071 ABBEY NATIONAL TREAS SV PL 0.81 4/11/2017 50,000,000.00 49,959,500.00 0 CITI MFR
NTRD CPD 3/6/2017 104072 CHARIOT FUNDING LLC CP 0.73 4/18/2017 50,000,000.00 49,956,402.78 0 CITI JPM
NTRD CPD 3/6/2017 104075 NATIXIS NY BRANCH CP 0.66 3/7/2017 50,000,000.00 49,999,083.33 0 CITI BNY
NTRD CPD 3/7/2017 104087 LA FAYETTE ASSET SEC LLC C 0.88 4/26/2017 50,000,000.00 49,938,888.89 0 CITI MS
NTRD CPD 3/7/2017 104088 NATIXIS NY BRANCH CP 0.66 3/8/2017 50,000,000.00 49,999,083.33 0 CITI GPS
NTRD CPD 3/7/2017 104073 CHARIOT FUNDING LLC CP 0.74 4/10/2017 22,500,000.00 22,484,275.00 0 CITI BLAYBV
NTRD CPD 3/7/2017 104074 THUNDER BAY FUNDING LLC CP 0.86 4/24/2017 50,000,000.00 49,942,666.67 0 CITI RBCCM
NTRD CPD 3/7/2017 104090 CRC FUNDING LLC CP 1.08 6/13/2017 15,110,000.00 15,065,576.60 0 CITI BLAYBV
NTRD CPD 3/7/2017 104079 CHARIOT FUNDING LLC CP 0.73 4/18/2017 50,000,000.00 49,957,416.67 0 CITI JPM
NTRD CPD 3/7/2017 104080 CANCARA ASSET SEC LLC CP 0.85 4/13/2017 20,000,000.00 19,982,527.78 0 CITI JPM
NTRD CPD 3/7/2017 104081 LA FAYETTE ASSET SEC LLC C 0.8 4/20/2017 20,000,000.00 19,980,444.44 0 CITI BLAYBV
NTRD CPD 3/7/2017 104082 CHARIOT FUNDING LLC CP 0.73 4/21/2017 50,000,000.00 49,954,375.00 0 CITI JPM
NTRD CPD 3/7/2017 104083 ATLANTIC ASSET SEC LLC CP 0.82 4/19/2017 25,000,000.00 24,975,513.89 0 CITI MS
NTRD CPD 3/7/2017 104084 JUPITER SEC COMPANY LLC CP 0.71 4/12/2017 50,000,000.00 49,964,500.00 0 CITI LOOP
NTRD CPD 3/8/2017 104091 REGENCY MARKETS NO. 1 LLC 0.87 4/12/2017 50,000,000.00 49,957,708.33 0 CITI JPM

2
Los Angeles County TreasurerInvestment Transactions JournalPurchase Detail ReportGroup: Pooled Surplus InvestmentsFor the Period: March 1, 2017 to March 31, 2017Attachment VIII
ACCOUNT Sec Type Settle Date Sec ID Description Face Rate Mat Date Par Amount Principal Purch Int Bank BrokerNTRD CPD 3/8/2017 104092 REGENCY MARKETS NO. 1 LLC 0.87 4/12/2017 50,000,000.00 49,957,708.33 0 CITI JPM
NTRD CPD 3/8/2017 104093 REGENCY MARKETS NO. 1 LLC 0.87 4/12/2017 25,000,000.00 24,978,854.17 0 CITI JPM
NTRD CPD 3/8/2017 104094 NATIXIS NY BRANCH CP 0.66 3/9/2017 50,000,000.00 49,999,083.33 0 CITI RBCCM
NTRD CPD 3/8/2017 104095 SHEFFIELD RECEIVABLES CORP 0.9 5/1/2017 25,000,000.00 24,966,250.00 0 CITI BLAYBV
NTRD CPD 3/8/2017 104096 CAFCO LLC CP 1.08 6/15/2017 14,973,000.00 14,928,530.19 0 CITI BLAYBV
NTRD CPD 3/8/2017 104089 THUNDER BAY FUNDING LLC CP 0.855 4/18/2017 50,000,000.00 49,951,312.50 0 CITI GPS
NTRD CPD 3/9/2017 104097 AUTOBAHN FUNDING CO LLC CP 0.78 4/13/2017 25,000,000.00 24,981,041.67 0 CITI CRSU
NTRD CPD 3/9/2017 104098 NATIXIS NY BRANCH CP 0.66 3/16/2017 50,000,000.00 49,993,583.33 0 CITI BCI
NTRD CPD 3/9/2017 104099 REGENCY MARKETS NO. 1 LLC 0.9 4/6/2017 50,000,000.00 49,965,000.00 0 CITI BLAYBV
NTRD CPD 3/9/2017 104100 REGENCY MARKETS NO. 1 LLC 0.9 4/6/2017 15,558,000.00 15,547,109.40 0 CITI BLAYBV
NTRD CPD 3/9/2017 104101 REGENCY MARKETS NO. 1 LLC 0.88 4/6/2017 50,000,000.00 49,965,777.78 0 CITI LOOP
NTRD CPD 3/9/2017 104085 OLD LINE FUNDING LLC CP 0.86 4/20/2017 50,000,000.00 49,949,833.33 0 CITI BLAYBV
NTRD CPD 3/9/2017 104086 OLD LINE FUNDING LLC CP 0.86 4/20/2017 25,000,000.00 24,974,916.67 0 CITI BLAYBV
NTRD CPD 3/9/2017 104104 NATIXIS NY BRANCH CP 0.66 3/10/2017 50,000,000.00 49,999,083.33 0 CITI UBSSEC
NTRD CPD 3/9/2017 104105 ATLANTIC ASSET SEC LLC CP 0.87 5/2/2017 50,000,000.00 49,934,750.00 0 CITI MFR
NTRD CPD 3/9/2017 104106 ATLANTIC ASSET SEC LLC CP 0.78 3/22/2017 35,365,000.00 35,355,038.86 0 CITI RBCCM
NTRD CPD 3/10/2017 104108 ATLANTIC ASSET SEC LLC CP 0.86 4/25/2017 50,000,000.00 49,945,055.56 0 CITI MFR
NTRD CPD 3/10/2017 104109 AUTOBAHN FUNDING CO LLC CP 0.79 4/20/2017 37,000,000.00 36,966,710.28 0 CITI BLAYBV
NTRD CPD 3/10/2017 104111 CANCARA ASSET SEC LLC CP 0.86 4/18/2017 25,000,000.00 24,976,708.33 0 CITI KEYBANC
NTRD CPD 3/10/2017 104112 NATIXIS NY BRANCH CP 0.66 3/13/2017 50,000,000.00 49,997,250.00 0 CITI MISC
NTRD CPD 3/10/2017 104114 SHEFFIELD RECEIVABLES CORP 0.9 5/11/2017 30,000,000.00 29,953,500.00 0 CITI LOOP
NTRD CPD 3/10/2017 104115 CAFCO LLC CP 1.13 6/22/2017 6,910,000.00 6,887,442.69 0 CITI JPM
NTRD CPD 3/10/2017 104102 ATLANTIC ASSET SEC LLC CP 0.86 4/28/2017 50,000,000.00 49,941,472.22 0 CITI MS
NTRD CPD 3/10/2017 104103 SHEFFIELD RECEIVABLES CORP 0.82 4/20/2017 50,000,000.00 49,953,305.56 0 CITI BCI
NTRD CPD 3/13/2017 104113 ATLANTIC ASSET SEC LLC CP 0.86 4/28/2017 25,000,000.00 24,972,527.78 0 CITI MS
NTRD CPD 3/13/2017 104110 TOYOTA MOTOR CREDIT CORP C 0.85 4/20/2017 25,000,000.00 24,977,569.44 0 CITI TFS
NTRD CPD 3/13/2017 104124 ABBEY NATIONAL TREAS SV PL 0.84 4/17/2017 30,472,000.00 30,447,114.53 0 CITI MFR
NTRD CPD 3/13/2017 104117 SHEFFIELD RECEIVABLES CORP 0.9 5/1/2017 50,000,000.00 49,938,750.00 0 CITI MFR
NTRD CPD 3/13/2017 104118 REGENCY MARKETS NO. 1 LLC 0.95 4/18/2017 17,121,000.00 17,104,735.05 0 CITI JPM
NTRD CPD 3/13/2017 104119 TOYOTA MOTOR CREDIT CORP C 0.86 4/21/2017 50,000,000.00 49,953,416.67 0 CITI TFS
NTRD CPD 3/13/2017 104120 AUTOBAHN FUNDING CO LLC CP 0.81 4/20/2017 25,000,000.00 24,978,625.00 0 CITI BLAYBV
NTRD CPD 3/13/2017 104121 CANCARA ASSET SEC LLC CP 0.9 4/19/2017 25,000,000.00 24,976,875.00 0 CITI JPM
NTRD CPD 3/14/2017 104125 NATIXIS NY BRANCH CP 0.66 3/15/2017 50,000,000.00 49,999,083.33 0 CITI RBCCM
NTRD CPD 3/14/2017 104126 AUTOBAHN FUNDING CO LLC CP 0.83 4/17/2017 50,000,000.00 49,960,805.56 0 CITI LOOP
NTRD CPD 3/14/2017 104127 ATLANTIC ASSET SEC LLC CP 0.88 5/2/2017 50,000,000.00 49,940,111.11 0 CITI MS
NTRD CPD 3/14/2017 104128 SHEFFIELD RECEIVABLES CORP 0.87 4/20/2017 30,000,000.00 29,973,175.00 0 CITI JPM
NTRD CPD 3/14/2017 104129 THUNDER BAY FUNDING LLC CP 0.96 5/17/2017 25,000,000.00 24,957,333.33 0 CITI RBCCM
NTRD CPD 3/14/2017 104123 AUTOBAHN FUNDING CO LLC CP 0.81 4/17/2017 5,000,000.00 4,996,175.00 0 CITI BLAYBV
NTRD CPD 3/15/2017 104131 NATIXIS NY BRANCH CP 0.87 3/22/2017 50,000,000.00 49,991,541.67 0 CITI JPM
NTRD CPD 3/15/2017 104132 NATIXIS NY BRANCH CP 0.87 3/22/2017 25,000,000.00 24,995,770.83 0 CITI JPM

3
Los Angeles County TreasurerInvestment Transactions JournalPurchase Detail ReportGroup: Pooled Surplus InvestmentsFor the Period: March 1, 2017 to March 31, 2017Attachment VIII
ACCOUNT Sec Type Settle Date Sec ID Description Face Rate Mat Date Par Amount Principal Purch Int Bank BrokerNTRD CPD 3/15/2017 104133 CREDIT AGRICOLE CIB NY BR 0.91 4/21/2017 50,000,000.00 49,953,236.11 0 CITI MFR
NTRD CPD 3/15/2017 104134 ATLANTIC ASSET SEC LLC CP 0.9 4/20/2017 50,000,000.00 49,955,000.00 0 CITI RBCCM
NTRD CPD 3/15/2017 104135 SHEFFIELD RECEIVABLES CORP 0.88 4/24/2017 50,000,000.00 49,951,111.11 0 CITI BLAYBV
NTRD CPD 3/15/2017 104136 CANCARA ASSET SEC LLC CP 0.91 4/18/2017 42,100,000.00 42,063,817.39 0 CITI GPS
NTRD CPD 3/15/2017 104138 SHEFFIELD RECEIVABLES CORP 0.93 4/26/2017 25,000,000.00 24,972,875.00 0 CITI BCI
NTRD CPD 3/16/2017 104141 SHEFFIELD RECEIVABLES CORP 0.93 5/4/2017 50,000,000.00 49,936,708.33 0 CITI LOOP
NTRD CPD 3/16/2017 104142 CREDIT AGRICOLE CIB NY BR 0.91 4/28/2017 50,000,000.00 49,945,652.78 0 CITI MFR
NTRD CPD 3/16/2017 104143 ATLANTIC ASSET SEC LLC CP 0.94 5/3/2017 50,000,000.00 49,937,333.33 0 CITI MS
NTRD CPD 3/16/2017 104145 MONT BLANC CAPITAL CORP CP 0.96 5/10/2017 25,723,000.00 25,685,272.93 0 CITI KEYBANC
NTRD CPD 3/16/2017 104146 SHEFFIELD RECEIVABLES CORP 0.95 4/28/2017 50,000,000.00 49,943,263.89 0 CITI JPM
NTRD CPD 3/16/2017 104147 OLD LINE FUNDING LLC CP 0.96 5/16/2017 12,750,000.00 12,729,260.00 0 CITI CRSU
NTRD CPD 3/16/2017 104148 ATLANTIC ASSET SEC LLC CP 0.95 4/17/2017 25,000,000.00 24,978,888.89 0 CITI JPM
NTRD CPD 3/17/2017 104150 ATLANTIC ASSET SEC LLC CP 0.95 4/26/2017 25,000,000.00 24,973,611.11 0 CITI BLAYBV
NTRD CPD 3/17/2017 104151 SHEFFIELD RECEIVABLES CORP 0.95 5/1/2017 50,000,000.00 49,940,625.00 0 CITI JPM
NTRD CPD 3/17/2017 104152 SHEFFIELD RECEIVABLES CORP 0.98 4/19/2017 50,000,000.00 49,955,083.33 0 CITI MS
NTRD CPD 3/17/2017 104153 LA FAYETTE ASSET SEC LLC C 0.96 5/4/2017 25,000,000.00 24,968,000.00 0 CITI MS
NTRD CPD 3/17/2017 104154 CREDIT AGRICOLE CIB NY BR 0.92 4/20/2017 50,000,000.00 49,956,555.56 0 CITI MFR
NTRD CPD 3/17/2017 104144 AUTOBAHN FUNDING CO LLC CP 0.93 4/28/2017 50,000,000.00 49,945,750.00 0 CITI BLAYBV
NTRD CPD 3/17/2017 104157 AUTOBAHN FUNDING CO LLC CP 0.93 4/21/2017 25,000,000.00 24,977,395.83 0 CITI BLAYBV
NTRD CPD 3/17/2017 104159 THUNDER BAY FUNDING LLC CP 0.955 5/15/2017 27,575,000.00 27,531,841.30 0 CITI GPS
NTRD CPD 3/20/2017 104161 AUTOBAHN FUNDING CO LLC CP 0.93 4/21/2017 50,000,000.00 49,958,666.67 0 CITI CRSU
NTRD CPD 3/20/2017 104162 LA FAYETTE ASSET SEC LLC C 1 5/19/2017 50,000,000.00 49,916,666.67 0 CITI MFR
NTRD CPD 3/20/2017 104163 REGENCY MARKETS NO. 1 LLC 0.98 4/19/2017 50,000,000.00 49,959,166.67 0 CITI JPM
NTRD CPD 3/20/2017 104164 REGENCY MARKETS NO. 1 LLC 0.98 4/19/2017 50,000,000.00 49,959,166.67 0 CITI JPM
NTRD CPD 3/20/2017 104165 REGENCY MARKETS NO. 1 LLC 0.98 4/19/2017 13,732,000.00 13,720,785.53 0 CITI JPM
NTRD CPD 3/20/2017 104168 ATLANTIC ASSET SEC LLC CP 0.94 5/1/2017 50,000,000.00 49,945,166.67 0 CITI BLAYBV
NTRD CPD 3/20/2017 104169 SHEFFIELD RECEIVABLES CORP 0.92 4/20/2017 50,000,000.00 49,960,388.89 0 CITI BLAYBV
NTRD CPD 3/20/2017 104170 SHEFFIELD RECEIVABLES CORP 0.98 5/19/2017 40,000,000.00 39,934,666.67 0 CITI LOOP
NTRD CPD 3/20/2017 104171 NATIXIS NY BRANCH CP 0.9 3/21/2017 50,000,000.00 49,998,750.00 0 CITI GPS
NTRD CPD 3/20/2017 104172 NATIXIS NY BRANCH CP 0.9 3/21/2017 50,000,000.00 49,998,750.00 0 CITI GPS
NTRD CPD 3/20/2017 104173 CREDIT AGRICOLE CIB NY BR 0.92 4/3/2017 23,623,000.00 23,614,548.22 0 CITI MFR
NTRD CPD 3/20/2017 104155 OLD LINE FUNDING LLC CP 0.95 5/22/2017 50,000,000.00 49,916,875.00 0 CITI RBCCM
NTRD CPD 3/21/2017 104174 AUTOBAHN FUNDING CO LLC CP 0.92 4/25/2017 50,000,000.00 49,955,277.78 0 CITI LOOP
NTRD CPD 3/21/2017 104175 SHEFFIELD RECEIVABLES CORP 0.92 4/26/2017 50,000,000.00 49,954,000.00 0 CITI JPM
NTRD CPD 3/21/2017 104166 LA FAYETTE ASSET SEC LLC C 1 5/18/2017 25,000,000.00 24,959,722.22 0 CITI MS
NTRD CPD 3/21/2017 104167 TOYOTA MOTOR CREDIT CORP C 0.96 5/5/2017 50,000,000.00 49,940,000.00 0 CITI TFS
NTRD CPD 3/21/2017 104178 NATIXIS NY BRANCH CP 0.91 3/22/2017 50,000,000.00 49,998,736.11 0 CITI BCI
NTRD CPD 3/21/2017 104179 NATIXIS NY BRANCH CP 0.91 3/22/2017 50,000,000.00 49,998,736.11 0 CITI BCI
NTRD CPD 3/21/2017 104180 SHEFFIELD RECEIVABLES CORP 0.92 4/28/2017 50,000,000.00 49,951,444.44 0 CITI BLAYBV
NTRD CPD 3/21/2017 104182 ABBEY NATIONAL TREAS SV PL 0.95 5/5/2017 43,413,000.00 43,361,447.06 0 CITI MFR

4
Los Angeles County TreasurerInvestment Transactions JournalPurchase Detail ReportGroup: Pooled Surplus InvestmentsFor the Period: March 1, 2017 to March 31, 2017Attachment VIII
ACCOUNT Sec Type Settle Date Sec ID Description Face Rate Mat Date Par Amount Principal Purch Int Bank BrokerNTRD CPD 3/22/2017 104183 ABBEY NATIONAL TREAS SV PL 0.96 5/1/2017 50,000,000.00 49,946,666.67 0 CITI LOOP
NTRD CPD 3/22/2017 104184 AUTOBAHN FUNDING CO LLC CP 0.93 4/28/2017 32,000,000.00 31,969,413.33 0 CITI BLAYBV
NTRD CPD 3/22/2017 104185 ABBEY NATIONAL TREAS SV PL 0.96 5/3/2017 50,000,000.00 49,944,000.00 0 CITI MFR
NTRD CPD 3/22/2017 104186 SHEFFIELD RECEIVABLES CORP 0.92 4/25/2017 50,000,000.00 49,956,555.56 0 CITI JPM
NTRD CPD 3/22/2017 104187 LA FAYETTE ASSET SEC LLC C 1.15 6/19/2017 35,000,000.00 34,900,493.06 0 CITI MS
NTRD CPD 3/22/2017 104188 SHEFFIELD RECEIVABLES CORP 0.92 4/26/2017 50,000,000.00 49,955,277.78 0 CITI JPM
NTRD CPD 3/22/2017 104190 SHEFFIELD RECEIVABLES CORP 1.04 5/23/2017 50,000,000.00 49,910,444.44 0 CITI MFR
NTRD CPD 3/22/2017 104176 ATLANTIC ASSET SEC LLC CP 0.94 4/24/2017 50,000,000.00 49,956,916.67 0 CITI MS
NTRD CPD 3/23/2017 104177 ATLANTIC ASSET SEC LLC CP 0.96 4/24/2017 50,000,000.00 49,957,333.33 0 CITI BLAYBV
NTRD CPD 3/23/2017 104191 ATLANTIC ASSET SEC LLC CP 1.02 4/24/2017 50,000,000.00 49,954,666.67 0 CITI CRSU
NTRD CPD 3/23/2017 104192 AUTOBAHN FUNDING CO LLC CP 0.92 4/28/2017 25,000,000.00 24,977,000.00 0 CITI LOOP
NTRD CPD 3/23/2017 104193 CAFCO LLC CP 1.11 6/27/2017 50,000,000.00 49,852,000.00 0 CITI LOOP
NTRD CPD 3/23/2017 104194 SHEFFIELD RECEIVABLES CORP 0.92 4/26/2017 50,000,000.00 49,956,555.56 0 CITI BLAYBV
NTRD CPD 3/23/2017 104195 NATIXIS NY BRANCH CP 0.91 3/24/2017 50,000,000.00 49,998,736.11 0 CITI UBSSEC
NTRD CPD 3/23/2017 104196 NATIXIS NY BRANCH CP 0.91 3/24/2017 50,000,000.00 49,998,736.11 0 CITI UBSSEC
NTRD CPD 3/23/2017 104205 ABBEY NATIONAL TREAS SV PL 0.93 5/3/2017 15,041,000.00 15,025,069.07 0 CITI MFR
NTRD CPD 3/23/2017 104200 NATIXIS NY BRANCH CP 0.9 4/3/2017 50,000,000.00 49,986,250.00 0 CITI JPM
NTRD CPD 3/23/2017 104201 NATIXIS NY BRANCH CP 0.9 4/3/2017 25,000,000.00 24,993,125.00 0 CITI JPM
NTRD CPD 3/23/2017 104202 LA FAYETTE ASSET SEC LLC C 1.18 6/19/2017 36,000,000.00 35,896,160.00 0 CITI BLAYBV
NTRD CPD 3/23/2017 104203 ABBEY NATIONAL TREAS SV PL 0.93 5/2/2017 18,582,000.00 18,562,798.60 0 CITI MFR
NTRD CPD 3/23/2017 104198 TORONTO-DOMINION HLDG USA 1.12 6/23/2017 50,000,000.00 49,856,888.89 0 CITI MFR
NTRD CPD 3/24/2017 104206 AUTOBAHN FUNDING CO LLC CP 0.92 4/24/2017 50,000,000.00 49,960,388.89 0 CITI LOOP
NTRD CPD 3/24/2017 104207 AUTOBAHN FUNDING CO LLC CP 0.93 4/28/2017 50,000,000.00 49,954,791.67 0 CITI BLAYBV
NTRD CPD 3/24/2017 104208 NATIXIS NY BRANCH CP 0.91 3/27/2017 50,000,000.00 49,996,208.33 0 CITI JPM
NTRD CPD 3/24/2017 104209 NATIXIS NY BRANCH CP 0.92 3/31/2017 50,000,000.00 49,991,055.56 0 CITI JPM
NTRD CPD 3/24/2017 104210 CANCARA ASSET SEC LLC CP 0.95 4/3/2017 26,500,000.00 26,493,006.94 0 CITI JPM
NTRD CPD 3/24/2017 104211 AUTOBAHN FUNDING CO LLC CP 0.93 4/28/2017 25,000,000.00 24,977,395.83 0 CITI BLAYBV
NTRD CPD 3/24/2017 104212 NATIXIS NY BRANCH CP 0.92 3/31/2017 50,000,000.00 49,991,055.56 0 CITI UBSSEC
NTRD CPD 3/24/2017 104213 NATIXIS NY BRANCH CP 0.9 3/29/2017 40,000,000.00 39,995,000.00 0 CITI UBSSEC
NTRD CPD 3/27/2017 104217 CRC FUNDING LLC CP 0.97 5/12/2017 50,000,000.00 49,938,027.78 0 CITI JPM
NTRD CPD 3/27/2017 104218 AUTOBAHN FUNDING CO LLC CP 0.93 5/1/2017 50,000,000.00 49,954,791.67 0 CITI LOOP
NTRD CPD 3/27/2017 104219 SHEFFIELD RECEIVABLES CORP 0.92 4/28/2017 50,000,000.00 49,959,111.11 0 CITI BLAYBV
NTRD CPD 3/27/2017 104220 NATIXIS NY BRANCH CP 0.91 3/29/2017 50,000,000.00 49,997,472.22 0 CITI RBCCM
NTRD CPD 3/27/2017 104221 NATIXIS NY BRANCH CP 0.91 3/29/2017 50,000,000.00 49,997,472.22 0 CITI RBCCM
NTRD CPD 3/27/2017 104222 TORONTO-DOMINION HLDG USA 0.94 5/30/2017 50,000,000.00 49,916,444.44 0 CITI MFR
NTRD CPD 3/27/2017 104223 ABBEY NATIONAL TREAS SV PL 0.98 5/26/2017 50,000,000.00 49,918,333.33 0 CITI MFR
NTRD CPD 3/27/2017 104225 LA FAYETTE ASSET SEC LLC C 1.18 6/19/2017 24,500,000.00 24,432,543.33 0 CITI JPM
NTRD CPD 3/27/2017 104204 THUNDER BAY FUNDING LLC CP 0.92 4/26/2017 30,000,000.00 29,977,000.00 0 CITI BLAYBV
NTRD CPD 3/28/2017 104229 SHEFFIELD RECEIVABLES CORP 0.92 5/1/2017 50,000,000.00 49,956,555.56 0 CITI BLAYBV
NTRD CPD 3/28/2017 104230 CRC FUNDING LLC CP 0.98 5/9/2017 50,000,000.00 49,942,833.33 0 CITI LOOP

5
Los Angeles County TreasurerInvestment Transactions JournalPurchase Detail ReportGroup: Pooled Surplus InvestmentsFor the Period: March 1, 2017 to March 31, 2017Attachment VIII
ACCOUNT Sec Type Settle Date Sec ID Description Face Rate Mat Date Par Amount Principal Purch Int Bank BrokerNTRD CPD 3/28/2017 104231 MONT BLANC CAPITAL CORP CP 1.1 6/27/2017 30,000,000.00 29,916,583.33 0 CITI LOOP
NTRD CPD 3/28/2017 104232 DANSKE CORP CP 1.07 7/3/2017 50,000,000.00 49,855,847.22 0 CITI BLAYBV
NTRD CPD 3/28/2017 104235 NATIXIS NY BRANCH CP 0.91 3/29/2017 50,000,000.00 49,998,736.11 0 CITI JPM
NTRD CPD 3/28/2017 104236 NATIXIS NY BRANCH CP 0.91 3/29/2017 50,000,000.00 49,998,736.11 0 CITI JPM
NTRD CPD 3/28/2017 104237 NATIXIS NY BRANCH CP 0.91 3/29/2017 50,000,000.00 49,998,736.11 0 CITI JPM
NTRD CPD 3/28/2017 104238 NATIXIS NY BRANCH CP 0.91 3/29/2017 50,000,000.00 49,998,736.11 0 CITI JPM
NTRD CPD 3/28/2017 104239 CHARIOT FUNDING LLC CP 0.9 4/28/2017 31,300,000.00 31,275,742.50 0 CITI JPM
NTRD CPD 3/28/2017 104252 CREDIT AGRICOLE CIB NY BR 1.1 6/30/2017 50,000,000.00 49,856,388.89 0 CITI MFR
NTRD CPD 3/28/2017 104253 NATIXIS NY BRANCH CP 0.91 3/30/2017 50,000,000.00 49,997,472.22 0 CITI BNY
NTRD CPD 3/28/2017 104255 NATIXIS NY BRANCH CP 0.91 3/30/2017 50,000,000.00 49,997,472.22 0 CITI BNY
NTRD CPD 3/28/2017 104260 CREDIT AGRICOLE CIB NY BR 0.9 3/29/2017 50,000,000.00 49,998,750.00 0 CITI JPM
NTRD CPD 3/29/2017 104242 JUPITER SEC COMPANY LLC CP 1.06 6/20/2017 17,800,000.00 17,756,498.78 0 CITI KEYBANC
NTRD CPD 3/29/2017 104263 NATIXIS NY BRANCH CP 0.91 3/30/2017 50,000,000.00 49,998,736.11 0 CITI JPM
NTRD CPD 3/29/2017 104264 NATIXIS NY BRANCH CP 0.91 3/30/2017 50,000,000.00 49,998,736.11 0 CITI JPM
NTRD CPD 3/29/2017 104265 NATIXIS NY BRANCH CP 0.91 3/30/2017 50,000,000.00 49,998,736.11 0 CITI JPM
NTRD CPD 3/29/2017 104266 NATIXIS NY BRANCH CP 0.91 3/30/2017 50,000,000.00 49,998,736.11 0 CITI JPM
NTRD CPD 3/29/2017 104277 SHEFFIELD RECEIVABLES CORP 0.92 5/5/2017 50,000,000.00 49,952,722.22 0 CITI BLAYBV
NTRD CPD 3/29/2017 104278 CREDIT AGRICOLE CIB NY BR 0.9 3/30/2017 50,000,000.00 49,998,750.00 0 CITI MFR
NTRD CPD 3/29/2017 104279 CREDIT AGRICOLE CIB NY BR 0.9 3/30/2017 50,000,000.00 49,998,750.00 0 CITI MFR
NTRD CPD 3/29/2017 104274 OLD LINE FUNDING LLC CP 0.945 5/19/2017 50,000,000.00 49,933,062.50 0 CITI BLAYBV
NTRD CPD 3/29/2017 104282 MONT BLANC CAPITAL CORP CP 1.13 6/27/2017 28,200,000.00 28,120,335.00 0 CITI BLAYBV
NTRD CPD 3/30/2017 104285 AUTOBAHN FUNDING CO LLC CP 0.93 5/1/2017 50,000,000.00 49,958,666.67 0 CITI BLAYBV
NTRD CPD 3/30/2017 104286 AUTOBAHN FUNDING CO LLC CP 0.93 5/1/2017 10,000,000.00 9,991,733.33 0 CITI BLAYBV
NTRD CPD 3/30/2017 104287 AUTOBAHN FUNDING CO LLC CP 0.96 5/30/2017 35,000,000.00 34,943,066.67 0 CITI BLAYBV
NTRD CPD 3/30/2017 104288 OLD LINE FUNDING LLC CP 0.94 5/19/2017 42,000,000.00 41,945,166.67 0 CITI JPM
NTRD CPD 3/30/2017 104289 DANSKE CORP CP 1.08 6/29/2017 50,000,000.00 49,863,500.00 0 CITI JPM
NTRD CPD 3/30/2017 104246 OLD LINE FUNDING LLC CP 1.1 7/3/2017 50,000,000.00 49,854,861.11 0 CITI BLAYBV
NTRD CPD 3/30/2017 104261 AUTOBAHN FUNDING CO LLC CP 0.93 5/1/2017 50,000,000.00 49,958,666.67 0 CITI CRSU
NTRD CPD 3/30/2017 104262 AUTOBAHN FUNDING CO LLC CP 0.93 5/1/2017 25,000,000.00 24,979,333.33 0 CITI CRSU
NTRD CPD 3/30/2017 104292 SHEFFIELD RECEIVABLES CORP 1 5/18/2017 50,000,000.00 49,931,944.44 0 CITI MFR
NTRD CPD 3/30/2017 104293 ATLANTIC ASSET SEC LLC CP 0.96 5/11/2017 25,000,000.00 24,972,000.00 0 CITI MS
NTRD CPD 3/30/2017 104298 COCA COLA CO CP 1.06 8/23/2017 22,000,000.00 21,905,424.44 0 CITI BLAYBV
NTRD CPD 3/30/2017 104299 SHEFFIELD RECEIVABLES CORP 0.92 5/4/2017 50,000,000.00 49,955,277.78 0 CITI MFR
NTRD CPD 3/31/2017 104318 ATLANTIC ASSET SEC LLC CP 1.12 6/28/2017 29,473,000.00 29,391,392.54 0 CITI JPM
NTRD CPD 3/31/2017 104295 AUTOBAHN FUNDING CO LLC CP 0.92 5/4/2017 35,000,000.00 34,969,588.89 0 CITI LOOP
NTRD CPD 3/31/2017 104308 AUTOBAHN FUNDING CO LLC CP 0.93 5/5/2017 25,000,000.00 24,977,395.83 0 CITI BLAYBV
NTRD CPD 3/31/2017 104309 OLD LINE FUNDING LLC CP 0.93 5/15/2017 30,000,000.00 29,965,125.00 0 CITI BLAYBV
NTRD CPD 3/31/2017 104310 SHEFFIELD RECEIVABLES CORP 0.92 5/3/2017 25,000,000.00 24,978,916.67 0 CITI LOOP
CPD Total 8,041,486,000.00 8,034,177,708.32 0

6
Los Angeles County TreasurerInvestment Transactions JournalPurchase Detail ReportGroup: Pooled Surplus InvestmentsFor the Period: March 1, 2017 to March 31, 2017Attachment VIII
ACCOUNT Sec Type Settle Date Sec ID Description Face Rate Mat Date Par Amount Principal Purch Int Bank Broker
NTRD FCDN 3/28/2017 104240 FFCB D/N 1.05 2/16/2018 50,000,000.00 49,526,041.67 0 CITI UBSSEC
FCDN Total 50,000,000.00 49,526,041.67 0
NTRD FFCB 3/1/2017 103927 FFCB 1.71 (CALLABLE) 1.71 2/27/2020 25,000,000.00 25,000,000.00 4,750.00 CITI DCM
NTRD FFCB 3/2/2017 103975 FFCB 2.28 (CALLABLE) 2.28 3/1/2022 25,000,000.00 25,000,000.00 1,583.33 CITI RWB
NTRD FFCB 3/2/2017 103981 FFCB 2.28 (CALLABLE) 2.28 3/1/2022 25,000,000.00 25,000,000.00 1,583.33 CITI MFR
NTRD FFCB 3/23/2017 104181 FFCB 2.27 (CALLABLE) 2.27 3/23/2022 30,000,000.00 30,000,000.00 0 CITI DCM
NTRD FFCB 3/29/2017 104244 FFCB 2.18 (CALLABLE) 2.18 3/29/2022 40,000,000.00 40,000,000.00 0 CITI BNY
FFCB Total 145,000,000.00 145,000,000.00 7,916.66
NTRD FHLB 3/1/2017 103961 FHLB 2.25 (CALLABLE) 2.25 2/28/2022 18,400,000.00 18,400,000.00 3,450.00 CITI WFI
NTRD FHLB 3/2/2017 104027 FHLB 2.25 (CALLABLE) 2.25 2/1/2022 20,000,000.00 19,990,000.00 38,750.00 CITI TULL
NTRD FHLB 3/8/2017 104052 FHLB 2.22 (CALLABLE) 2.22 3/8/2022 25,000,000.00 25,000,000.00 0 CITI LOOP
NTRD FHLB 3/29/2017 104064 FHLB 2.00 (CALLABLE) 2 9/29/2020 25,000,000.00 25,000,000.00 0 CITI PIPE
NTRD FHLB 3/29/2017 104233 FHLB 2.20 (CALLABLE) 2.2 3/29/2022 13,500,000.00 13,500,000.00 0 CITI TULL
FHLB Total 101,900,000.00 101,890,000.00 42,200.00
NTRD FHLD 3/3/2017 104055 FHLB D/N 1 3/1/2018 30,000,000.00 29,697,500.00 0 CITI MFR
NTRD FHLD 3/28/2017 104254 FHLB D/N 1.07 3/26/2018 10,000,000.00 9,892,108.33 0 CITI MFR
NTRD FHLD 3/31/2017 104316 FHLB D/N 1.08 3/26/2018 15,000,000.00 14,838,000.00 0 CITI MFR
FHLD Total 55,000,000.00 54,427,608.33 0
NTRD FHLM 3/22/2017 104040 FHLMC 2.40 (CALLABLE) 2.4 3/22/2022 25,000,000.00 25,000,000.00 0 CITI JPM
NTRD FHLM 3/23/2017 104041 FHLMC 2.40 (CALLABLE) 2.4 3/22/2022 25,000,000.00 25,000,000.00 0 CITI DRE
NTRD FHLM 3/23/2017 104039 FHLMC 2.40 (CALLABLE) 2.4 3/22/2022 25,000,000.00 25,000,000.00 0 CITI MS
NTRD FHLM 3/28/2017 104056 FHLMC 2.33 (CALLABLE) 2.33 3/28/2022 25,000,000.00 25,000,000.00 0 CITI BLAYBV
NTRD FHLM 3/28/2017 104050 FHLMC 2.32 (CALLABLE) 2.32 3/28/2022 25,000,000.00 25,000,000.00 0 CITI MISC
NTRD FHLM 3/28/2017 104051 FHLMC 2.32 (CALLABLE) 2.32 3/28/2022 25,000,000.00 25,000,000.00 0 CITI FTNFCM
NTRD FHLM 3/29/2017 104251 FHLMC 2.215 (CALLABLE) 2.215 3/29/2022 50,000,000.00 50,000,000.00 0 CITI FTNFCM
NTRD FHLM 3/29/2017 104247 FHLMC 2.25 (CALLABLE) 2.25 2/28/2022 16,615,000.00 16,615,000.00 32,191.56 CITI JPM
FHLM Total 216,615,000.00 216,615,000.00 32,191.56
NTRD FHLMD 3/28/2017 104248 FHLMC D/N 0.9 9/26/2017 50,000,000.00 49,772,500.00 0 CITI MS
NTRD FHLMD 3/28/2017 104249 FHLMC D/N 0.9 9/26/2017 5,000,000.00 4,977,250.00 0 CITI MS
FHLMD Total 55,000,000.00 54,749,750.00 0
NTRD FNMA 3/14/2017 103946 FNMA 2.35 (CALLABLE) 2.35 3/14/2022 13,005,000.00 13,005,000.00 0 CITI UBIS

7
Los Angeles County TreasurerInvestment Transactions JournalPurchase Detail ReportGroup: Pooled Surplus InvestmentsFor the Period: March 1, 2017 to March 31, 2017Attachment VIII
ACCOUNT Sec Type Settle Date Sec ID Description Face Rate Mat Date Par Amount Principal Purch Int Bank BrokerNTRD FNMA 3/28/2017 104048 FNMA 2.40 (CALLABLE) 2.4 3/28/2022 25,000,000.00 25,000,000.00 0 CITI BCI
NTRD FNMA 3/29/2017 104245 FNMA 2.25 (CALLABLE) 2.25 2/14/2022 44,158,000.00 44,158,000.00 124,194.38 CITI RWB
FNMA Total 82,163,000.00 82,163,000.00 124,194.38
NTRD MCPN 3/28/2017 104057 FHLMC 4.125 (CALLABLE) 4.125 3/28/2022 25,000,000.00 25,000,000.00 0 CITI SUN
MCPN Total 25,000,000.00 25,000,000.00 0
NTRD MCSA 3/28/2017 104067 FHLMC 4.25 (CALLABLE) 4.25 3/28/2022 25,000,000.00 25,000,000.00 0 CITI GPS
MCSA Total 25,000,000.00 25,000,000.00 0
NTRD NCD1 3/30/2017 104290 WELLS FARGO BANK, NA CD 1.22 9/29/2017 50,000,000.00 50,000,000.00 0 CITI WFI
NTRD NCD1 3/30/2017 104300 WELLS FARGO BANK, NA CD 1.22 10/2/2017 50,000,000.00 50,000,000.00 0 CITI WFI
NCD1 Total 100,000,000.00 100,000,000.00 0
NTRD TBIL 3/2/2017 104031 UST BILL 0.905 3/1/2018 50,000,000.00 49,542,472.22 0 CITI MS
NTRD TBIL 3/2/2017 104034 UST BILL 0.9 3/1/2018 50,000,000.00 49,545,000.00 0 CITI BCI
NTRD TBIL 3/30/2017 104275 UST BILL 1.01 3/29/2018 50,000,000.00 49,489,388.89 0 CITI MS
NTRD TBIL 3/30/2017 104276 UST BILL 1.01 3/29/2018 50,000,000.00 49,489,388.89 0 CITI MS
NTRD TBIL 3/30/2017 104267 UST BILL 1.01 3/29/2018 50,000,000.00 49,489,388.89 0 CITI MFR
NTRD TBIL 3/30/2017 104268 UST BILL 1.01 3/29/2018 50,000,000.00 49,489,388.89 0 CITI MFR
TBIL Total 300,000,000.00 297,045,027.78 0.00
NTRD YANK1 3/2/2017 104049 NORDEA BANK AB NY CD 0.73 4/5/2017 50,000,000.00 50,000,000.00 0 CITI TULL
NTRD YANK1 3/6/2017 104069 BNP PARIBAS SF CD 0.71 4/12/2017 50,000,000.00 50,000,000.00 0 CITI BNPPSC
NTRD YANK1 3/6/2017 104076 TORONTO DOMINION BANK NY C 0.73 4/17/2017 50,000,000.00 50,000,000.00 0 CITI TULL
NTRD YANK1 3/13/2017 104122 TORONTO DOMINION BANK NY C 0.9 5/19/2017 50,000,000.00 50,000,000.00 0 CITI RBCCM
NTRD YANK1 3/13/2017 104116 BNP PARIBAS SF CD 0.84 4/14/2017 50,000,000.00 50,000,000.00 0 CITI BNPPSC
NTRD YANK1 3/15/2017 104137 BANK OF MONTREAL CHICAGO C 0.9 4/21/2017 50,000,000.00 50,000,000.00 0 CITI TULL
NTRD YANK1 3/15/2017 104139 BANK OF MONTREAL CHICAGO C 0.9 4/20/2017 50,000,000.00 50,000,000.00 0 CITI DCM
NTRD YANK1 3/17/2017 104158 BANK OF MONTREAL CHICAGO C 0.94 4/24/2017 50,000,000.00 50,000,527.26 0 CITI MFR
NTRD YANK1 3/17/2017 104156 SOCIETE GENERALE NY CD 0.93 4/20/2017 50,000,000.00 50,000,000.00 0 CITI MISC
NTRD YANK1 3/23/2017 104197 BNP PARIBAS SF CD 0.94 4/25/2017 50,000,000.00 50,000,000.00 0 CITI BNPPSC
NTRD YANK1 3/23/2017 104199 BANK OF MONTREAL CHICAGO C 0.95 5/1/2017 50,000,000.00 50,000,000.00 0 CITI TULL
NTRD YANK1 3/27/2017 104227 CREDIT AGRICOLE CIB NY CD 0.97 6/1/2017 50,000,000.00 50,000,915.06 0 CITI MFR
NTRD YANK1 3/27/2017 104224 SVENSKA HANDELSBANKEN NY C 0.92 4/28/2017 50,000,000.00 50,000,000.00 0 CITI TULL
NTRD YANK1 3/28/2017 104214 RABOBANK NEDERLAND NY CD 1.15 7/28/2017 50,000,000.00 50,000,000.00 0 CITI RABO
NTRD YANK1 3/28/2017 104215 TORONTO DOMINION BANK NY C 1.15 7/3/2017 50,000,000.00 50,001,343.10 0 CITI MFR
NTRD YANK1 3/28/2017 104228 SOCIETE GENERALE NY CD 1.07 6/1/2017 50,000,000.00 50,000,901.05 0 CITI MFR
NTRD YANK1 3/28/2017 104234 BNP PARIBAS SF CD 0.94 4/28/2017 50,000,000.00 50,000,000.00 0 CITI BNPPSC

8
Los Angeles County TreasurerInvestment Transactions JournalPurchase Detail ReportGroup: Pooled Surplus InvestmentsFor the Period: March 1, 2017 to March 31, 2017Attachment VIII
ACCOUNT Sec Type Settle Date Sec ID Description Face Rate Mat Date Par Amount Principal Purch Int Bank BrokerNTRD YANK1 3/28/2017 104241 CANADIAN IMP. BK OF COM NY 1.05 6/30/2017 50,000,000.00 50,001,302.02 0 CITI MFR
NTRD YANK1 3/28/2017 104243 BARCLAYS BANK PLC NY CD 1.26 6/28/2017 50,000,000.00 50,000,000.00 0 CITI BCI
NTRD YANK1 3/28/2017 104250 CREDIT AGRICOLE CIB NY CD 1.1 6/30/2017 50,000,000.00 50,000,000.00 0 CITI RBCCM
NTRD YANK1 3/29/2017 104280 BANK OF MONTREAL CHICAGO C 0.94 5/5/2017 50,000,000.00 50,000,000.00 0 CITI TULL
NTRD YANK1 3/29/2017 104281 BANK OF MONTREAL CHICAGO C 0.94 5/3/2017 50,000,000.00 50,000,000.00 0 CITI DCM
NTRD YANK1 3/29/2017 104284 BARCLAYS BANK PLC NY CD 1.26 6/29/2017 50,000,000.00 50,000,000.00 0 CITI BCI
NTRD YANK1 3/30/2017 104291 CREDIT AGRICOLE CIB NY CD 0.94 6/1/2017 50,000,000.00 50,000,000.00 0 CITI RBCCM
NTRD YANK1 3/30/2017 104257 RABOBANK NEDERLAND NY CD 1.15 7/31/2017 50,000,000.00 50,000,000.00 0 CITI RABO
NTRD YANK1 3/30/2017 104296 BARCLAYS BANK PLC NY CD 1.15 6/1/2017 50,000,000.00 50,000,000.00 0 CITI BCI
NTRD YANK1 3/30/2017 104297 TORONTO DOMINION BANK NY C 0.96 5/30/2017 50,000,000.00 50,000,000.00 0 CITI TULL
NTRD YANK1 3/30/2017 104294 CANADIAN IMP. BK OF COM NY 0.92 6/5/2017 50,000,000.00 50,000,928.98 0 CITI MFR
NTRD YANK1 3/31/2017 104311 NORDEA BANK AB NY CD 1 6/30/2017 50,000,000.00 50,000,000.00 0 CITI RBCCM
NTRD YANK1 3/31/2017 104312 BNP PARIBAS SF CD 0.94 5/5/2017 50,000,000.00 50,000,000.00 0 CITI BNPPSC
NTRD YANK1 3/31/2017 104313 CANADIAN IMP. BK OF COM NY 0.9 5/2/2017 50,000,000.00 50,000,444.09 0 CITI MFR
NTRD YANK1 3/31/2017 104314 TORONTO DOMINION BANK NY C 0.94 5/4/2017 50,000,000.00 50,000,000.00 0 CITI TULL
NTRD YANK1 3/31/2017 104315 NORDEA BANK AB NY CD 1 6/30/2017 50,000,000.00 50,000,000.00 0 CITI TULL
YANK1 Total 1,650,000,000.00 1,650,006,361.56 0
NTRD Total 10,847,164,000.00 10,835,600,497.66 206,502.60
TRADE NOTE 3/2/2017 104033 USTN 1.875 1.875 2/28/2022 50,000,000.00 49,704,302.50 5,095.11 CITI MFR
NOTE Total 50,000,000.00 49,704,302.50 5095.11
TRADE Total 50,000,000.00 49,704,302.50 5,095.11
PSI Total 10,897,164,000.00 10,885,304,800.16 211,597.71

9
Los Angeles County TreasurerInvestment Transactions JournalCall Detail ReportGroup: Pooled Surplus InvestmentsFor the Period: March 1, 2017 to March 31, 2017Attachment VIII
Settle Portfolio Instrument Txn/AccruedDate ID ID Description Txn Type Txn Price Par Principal Interest Net Cash Flow Profit/(Loss)
3/28/2017 TRADE 104033 USTN 1.875 Sell 99.9063 50,000,000.00 49,953,125.00 71,331.52 50,024,456.52 244,445.40
USTN Total 50,000,000.00 49,953,125.00 71,331.52 50,024,456.52 244,445.40
TRADE Total 50,000,000.00 49,953,125.00 71,331.52 50,024,456.52 244,445.40
PSI Total 50,000,000.00 49,953,125.00 71,331.52 50,024,456.52 244,445.40

Los Angeles County Treasurer
Comparison of Investment Cost to Market Value
As of March 31, 2017Attachment IX
POOLED SPECIFIC PURPOSE
Amortized Market Mkt Value Amortized Market Mkt Value
SECURITY TYPE Cost Value Difference Cost Value Difference
Collateralized CD's $0.00 $0.00 $0.00 $0.00 $0.00 $0.00
Negotiable CD's 3,775,015,390.31 3,775,186,148.50 $170,758.19 25,000,000.00 25,028,335.00 28,335.00
Euro CD's 0.00 $0.00 $0.00 0.00 0.00 0.00
Bankers Acceptances 0.00 $0.00 $0.00 0.00 0.00 0.00
Commercial Paper 8,689,733,387.99 8,688,962,844.96 ($770,543.03) 0.00 0.00 0.00
Governments 1,417,829,512.17 1,413,036,250.00 ($4,793,262.17) 0.00 0.00 0.00
Agencies 15,657,923,603.47 15,464,317,149.08 ($193,606,454.39) 37,274,483.37 34,989,771.59 (2,284,711.78)
Municipals 70,000,000.00 70,000,000.00 $0.00 4,275,000.00 4,275,000.00 0.00
Corp. & Deposit Notes 49,941,540.13 50,088,925.00 $147,384.87 0.00 0.00 0.00
Repurchase Agreements 0.00 0.00 $0.00 0.00 0.00 0.00
Asset Backed 0.00 0.00 0.00 0.00 0.00 0.00
Other 0.00 0.00 0.00 42,635,784.52 42,635,784.52 0.00
TOTAL $29,660,443,434.07 $29,461,591,317.54 ($198,852,116.53) $109,185,267.89 $106,928,891.11 ($2,256,376.78)
Market Pricing Policies and Source:
The Pooled Surplus Investment Portfolio (PSI) is market priced monthly using Citibank Valuation Total Report month-end prices. Securities not
actively traded, and therefore may not have a month-end price quoted in the Citibank Valuation Total Report, are priced in accordance with industry
pricing standards and are shown on Attachment IXa. Bond Anticipation Notes are private placements not actively traded, are not included in the
Citibank Valuation Total Report. Accordingly, market value is priced at Cost. Such non-traded securities make up 0.24% of the PSI Portfolio.

Los Angeles County Treasurer
Market Pricing Exceptions
As of March 31, 2017
Attachment IXa
Security Calculated
ID Security Description Market Price
96727 FHLB 7.35 (CALLABLE) 99.950000
103167 WESTPAC BANKING CORP NY FRCD 99.950000
103342 WESTPAC BANKING CORP NY FRCD 99.950000
103437 ROYAL BANK OF CANADA NY FRCD 99.950000
103504 BANK OF MONTREAL CHICAGO CD 100.001479
103755 FHLMC 2.29 (CALLABLE) 100.054000
103788 CANCARA ASSET SEC LLC CP 99.992500
103812 ABBEY NATIONAL TREAS SV PLC CP 99.992500
103815 LA FAYETTE ASSET SEC LLC CP 99.992500
103822 ATLANTIC ASSET SEC LLC CP 99.992500
103875 ATLANTIC ASSET SEC LLC CP 99.992500
103931 LA FAYETTE ASSET SEC LLC CP 99.992500
103943 LA FAYETTE ASSET SEC LLC CP 99.992500
103944 ATLANTIC ASSET SEC LLC CP 99.992500
104173 CREDIT AGRICOLE CIB NY BR CP 99.992500
104210 CANCARA ASSET SEC LLC CP 99.992500
104311 NORDEA BANK AB NY CD 99.967232
104312 BNP PARIBAS SF CD 99.999029
104313 CANADIAN IMP BK OF COM NY CD 99.995559
104314 TORONTO DOMINION BANK NY CD 99.999056
104315 NORDEA BANK AB NY CD 99.967232

Page 1
Los Angeles County TreasurerTreasurer Portfolio Compared to Market ValueFor the Period: March 1, 2017 to March 31, 2017Fund: Pooled Surplus InvestmentsAttachment X
Group Acct Sec Type SecID Description Face Rate Mat Date Par Amortized Cost Market ValuePSI NTRD BAN 96776 LACCAL BANS 3.75 6/30/2017 10,000,000.00 10,000,000.00 10,000,000.00
PSI NTRD BAN 97467 LACCAL BANS 3.75 6/30/2017 10,000,000.00 10,000,000.00 10,000,000.00
PSI NTRD BAN 98159 LACCAL BANS 3.75 6/30/2017 10,000,000.00 10,000,000.00 10,000,000.00
PSI NTRD BAN 98733 LACCAL BANS 3.75 6/30/2017 10,000,000.00 10,000,000.00 10,000,000.00
PSI NTRD BAN 100983 LACCAL BANS 1.115 6/30/2018 10,000,000.00 10,000,000.00 10,000,000.00
PSI NTRD BAN 102161 LACCAL BANS 1.115 6/30/2019 10,000,000.00 10,000,000.00 10,000,000.00
PSI NTRD BAN 102950 LACCAL BANS 1.115 6/30/2019 10,000,000.00 10,000,000.00 10,000,000.00
BAN Total 70,000,000.00 70,000,000.00 70,000,000.00
PSI NTRD BNOT3 103684 US BANK NA MTN 2 1/24/2020 25,000,000.00 24,950,477.63 25,092,950.00
BNOT3 Total 25,000,000.00 24,950,477.63 25,092,950.00
PSI NTRD CNFX 97696 TOYOTA MOTOR CREDIT CORP M 1.45 1/12/2018 12,500,000.00 12,495,531.25 12,497,987.50
PSI NTRD CNFX 97697 TOYOTA MOTOR CREDIT CORP M 1.45 1/12/2018 12,500,000.00 12,495,531.25 12,497,987.50
CNFX Total 25,000,000.00 24,991,062.50 24,995,975.00
PSI NTRD CPD 103633 JUPITER SEC COMPANY LLC CP 1 4/13/2017 10,779,000.00 10,775,407.00 10,775,640.19
PSI NTRD CPD 103694 CAFCO LLC CP 1.05 4/20/2017 23,550,000.00 23,536,949.38 23,538,641.84
PSI NTRD CPD 103788 CANCARA ASSET SEC LLC CP 0.9 4/3/2017 10,000,000.00 9,999,500.00 9,999,250.00
PSI NTRD CPD 103812 ABBEY NATIONAL TREAS SV PL 0.74 4/3/2017 50,000,000.00 49,997,944.44 49,996,250.00
PSI NTRD CPD 103815 LA FAYETTE ASSET SEC LLC C 0.84 4/3/2017 25,000,000.00 24,998,833.33 24,998,125.00
PSI NTRD CPD 103819 CRC FUNDING LLC CP 0.99 5/3/2017 35,000,000.00 34,969,200.00 34,969,263.00
PSI NTRD CPD 103822 ATLANTIC ASSET SEC LLC CP 0.82 4/3/2017 50,000,000.00 49,997,722.22 49,996,250.00
PSI NTRD CPD 103823 OLD LINE FUNDING LLC CP 1 5/10/2017 25,000,000.00 24,972,916.67 24,972,860.00
PSI NTRD CPD 103831 OLD LINE FUNDING LLC CP 0.82 4/3/2017 38,500,000.00 38,498,246.11 38,500,000.00
PSI NTRD CPD 103835 ATLANTIC ASSET SEC LLC CP 0.8 4/4/2017 50,000,000.00 49,996,666.67 49,994,835.00
PSI NTRD CPD 103848 CAFCO LLC CP 0.98 5/8/2017 13,513,000.00 13,499,389.41 13,500,119.41
PSI NTRD CPD 103852 MONT BLANC CAPITAL CORP CP 1.04 5/8/2017 37,856,000.00 37,815,536.14 37,817,197.60
PSI NTRD CPD 103855 CIESCO LLC CP 0.98 5/16/2017 20,000,000.00 19,975,500.00 19,974,622.00
PSI NTRD CPD 103857 LA FAYETTE ASSET SEC LLC C 1.05 5/8/2017 5,850,000.00 5,843,686.88 5,844,003.75
PSI NTRD CPD 103869 CANADIAN IMP BK OF COMMERC 0.92 5/9/2017 30,125,000.00 30,095,745.28 30,095,103.95
PSI NTRD CPD 103875 ATLANTIC ASSET SEC LLC CP 0.82 4/3/2017 1,600,000.00 1,599,927.11 1,599,880.00
PSI NTRD CPD 103876 ATLANTIC ASSET SEC LLC CP 0.82 4/11/2017 9,400,000.00 9,397,858.89 9,397,256.14
PSI NTRD CPD 103877 LA FAYETTE ASSET SEC LLC C 0.82 4/7/2017 25,000,000.00 24,996,583.33 24,995,915.00
PSI NTRD CPD 103879 CHARIOT FUNDING LLC CP 0.78 4/4/2017 50,000,000.00 49,996,750.00 49,995,390.00
PSI NTRD CPD 103881 ATLANTIC ASSET SEC LLC CP 0.8 4/11/2017 47,445,000.00 47,434,456.67 47,431,150.80
PSI NTRD CPD 103882 LA FAYETTE ASSET SEC LLC C 1.04 5/8/2017 26,639,000.00 26,610,525.87 26,611,695.03
PSI NTRD CPD 103883 LA FAYETTE ASSET SEC LLC C 1.04 5/8/2017 3,361,000.00 3,357,407.47 3,357,554.98
PSI NTRD CPD 103887 CIESCO LLC CP 0.97 5/19/2017 41,971,000.00 41,916,717.51 41,913,814.51

Page 2
Los Angeles County TreasurerTreasurer Portfolio Compared to Market ValueFor the Period: March 1, 2017 to March 31, 2017Fund: Pooled Surplus InvestmentsAttachment X
Group Acct Sec Type SecID Description Face Rate Mat Date Par Amortized Cost Market ValuePSI NTRD CPD 103895 ABBEY NATIONAL TREAS SV PL 0.83 5/19/2017 39,021,000.00 38,977,816.76 38,968,524.56
PSI NTRD CPD 103899 MONT BLANC CAPITAL CORP CP 1.03 5/10/2017 34,271,000.00 34,232,759.27 34,233,795.40
PSI NTRD CPD 103910 TORONTO-DOMINION HLDG USA 0.72 4/19/2017 50,000,000.00 49,982,000.00 49,977,540.00
PSI NTRD CPD 103911 LA FAYETTE ASSET SEC LLC C 0.79 4/5/2017 50,000,000.00 49,995,611.11 49,994,215.00
PSI NTRD CPD 103917 LA FAYETTE ASSET SEC LLC C 1.03 5/15/2017 25,000,000.00 24,968,527.78 24,969,062.50
PSI NTRD CPD 103922 TORONTO-DOMINION HLDG USA 0.73 4/17/2017 50,000,000.00 49,983,777.78 49,980,045.00
PSI NTRD CPD 103923 ATLANTIC ASSET SEC LLC CP 0.87 4/20/2017 10,000,000.00 9,995,408.33 9,994,472.00
PSI NTRD CPD 103925 ABBEY NATIONAL TREAS SV PL 0.74 4/14/2017 50,000,000.00 49,986,638.89 49,982,150.00
PSI NTRD CPD 103926 ABBEY NATIONAL TREAS SV PL 0.74 4/14/2017 28,698,000.00 28,690,331.26 28,687,754.81
PSI NTRD CPD 103930 NATIXIS NY BRANCH CP 0.79 4/14/2017 50,000,000.00 49,985,736.11 49,982,615.00
PSI NTRD CPD 103931 LA FAYETTE ASSET SEC LLC C 0.79 4/3/2017 50,000,000.00 49,997,805.56 49,996,250.00
PSI NTRD CPD 103933 CRC FUNDING LLC CP 0.97 5/24/2017 20,000,000.00 19,971,438.89 19,969,580.00
PSI NTRD CPD 103943 LA FAYETTE ASSET SEC LLC C 0.77 4/3/2017 25,000,000.00 24,998,930.56 24,998,125.00
PSI NTRD CPD 103944 ATLANTIC ASSET SEC LLC CP 0.74 4/3/2017 50,000,000.00 49,997,944.44 49,996,250.00
PSI NTRD CPD 103945 DANSKE CORP CP 0.93 5/16/2017 26,134,000.00 26,103,619.22 26,095,028.98
PSI NTRD CPD 103947 THUNDER BAY FUNDING LLC CP 0.75 4/6/2017 50,000,000.00 49,994,791.67 49,993,030.00
PSI NTRD CPD 103953 THUNDER BAY FUNDING LLC CP 0.75 4/5/2017 50,000,000.00 49,995,833.33 49,994,215.00
PSI NTRD CPD 103954 SHEFFIELD RECEIVABLES CORP 0.82 4/13/2017 50,000,000.00 49,986,333.33 49,979,920.00
PSI NTRD CPD 103956 ATLANTIC ASSET SEC LLC CP 0.73 4/7/2017 50,000,000.00 49,993,916.67 49,990,860.00
PSI NTRD CPD 103957 THUNDER BAY FUNDING LLC CP 0.75 4/25/2017 15,647,000.00 15,639,176.50 15,636,981.23
PSI NTRD CPD 103958 CRC FUNDING LLC CP 1 6/1/2017 17,750,000.00 17,719,923.61 17,718,298.50
PSI NTRD CPD 103962 LA FAYETTE ASSET SEC LLC C 0.77 4/18/2017 36,000,000.00 35,986,910.00 35,984,070.00
PSI NTRD CPD 103964 SHEFFIELD RECEIVABLES CORP 0.77 4/3/2017 50,000,000.00 49,997,861.11 50,000,000.00
PSI NTRD CPD 103965 NATIXIS NY BRANCH CP 1.2 7/31/2017 25,000,000.00 24,899,166.66 24,900,957.50
PSI NTRD CPD 103967 THUNDER BAY FUNDING LLC CP 0.8 4/25/2017 50,000,000.00 49,973,333.33 49,967,985.00
PSI NTRD CPD 103968 ABBEY NATIONAL TREAS SV PL 0.72 4/24/2017 40,064,000.00 40,045,570.56 40,038,943.97
PSI NTRD CPD 103969 SHEFFIELD RECEIVABLES CORP 0.76 4/5/2017 30,000,000.00 29,997,466.67 29,995,491.00
PSI NTRD CPD 103971 OLD LINE FUNDING LLC CP 0.75 4/5/2017 25,000,000.00 24,997,916.67 24,997,107.50
PSI NTRD CPD 103972 CAFCO LLC CP 0.98 6/5/2017 25,000,000.00 24,955,763.89 24,956,275.00
PSI NTRD CPD 103973 OLD LINE FUNDING LLC CP 0.99 6/19/2017 10,680,000.00 10,656,797.70 10,653,821.18
PSI NTRD CPD 103974 AUTOBAHN FUNDING CO LLC CP 0.72 4/6/2017 50,000,000.00 49,995,000.00 49,993,030.00
PSI NTRD CPD 103976 AUTOBAHN FUNDING CO LLC CP 0.71 4/5/2017 50,000,000.00 49,996,055.56 49,994,215.00
PSI NTRD CPD 103977 AUTOBAHN FUNDING CO LLC CP 0.71 4/5/2017 10,000,000.00 9,999,211.11 9,998,843.00
PSI NTRD CPD 103978 LA FAYETTE ASSET SEC LLC C 0.76 4/20/2017 48,000,000.00 47,980,746.67 47,976,129.60
PSI NTRD CPD 103980 LA FAYETTE ASSET SEC LLC C 0.77 4/13/2017 50,000,000.00 49,987,166.67 49,984,415.00
PSI NTRD CPD 103982 ABBEY NATIONAL TREAS SV PL 0.82 5/30/2017 13,009,000.00 12,991,517.35 12,987,100.65
PSI NTRD CPD 103983 LA FAYETTE ASSET SEC LLC C 0.77 4/20/2017 50,000,000.00 49,979,680.56 49,975,135.00
PSI NTRD CPD 103984 OLD LINE FUNDING LLC CP 0.75 4/17/2017 25,000,000.00 24,991,666.67 24,989,610.00
PSI NTRD CPD 103986 ATLANTIC ASSET SEC LLC CP 0.71 4/12/2017 50,000,000.00 49,989,152.78 49,984,015.00

Page 3
Los Angeles County TreasurerTreasurer Portfolio Compared to Market ValueFor the Period: March 1, 2017 to March 31, 2017Fund: Pooled Surplus InvestmentsAttachment X
Group Acct Sec Type SecID Description Face Rate Mat Date Par Amortized Cost Market ValuePSI NTRD CPD 103989 SHEFFIELD RECEIVABLES CORP 0.77 4/5/2017 50,000,000.00 49,995,722.22 49,992,485.00
PSI NTRD CPD 103990 ATLANTIC ASSET SEC LLC CP 0.75 4/13/2017 50,000,000.00 49,987,500.00 49,982,630.00
PSI NTRD CPD 103991 THUNDER BAY FUNDING LLC CP 0.75 4/20/2017 50,000,000.00 49,980,208.33 49,975,135.00
PSI NTRD CPD 103992 THUNDER BAY FUNDING LLC CP 0.75 4/20/2017 25,000,000.00 24,990,104.17 24,987,567.50
PSI NTRD CPD 103993 CHARIOT FUNDING LLC CP 0.74 4/27/2017 5,000,000.00 4,997,327.78 4,996,501.00
PSI NTRD CPD 103994 OLD LINE FUNDING LLC CP 0.74 4/24/2017 25,000,000.00 24,988,180.56 24,984,715.00
PSI NTRD CPD 103995 LA FAYETTE ASSET SEC LLC C 0.77 4/18/2017 50,000,000.00 49,981,819.45 49,977,875.00
PSI NTRD CPD 103996 LA FAYETTE ASSET SEC LLC C 0.77 4/18/2017 3,118,000.00 3,116,866.26 3,116,620.29
PSI NTRD CPD 103999 DANSKE CORP CP 0.93 5/16/2017 26,966,000.00 26,934,652.03 26,925,788.30
PSI NTRD CPD 104002 ATLANTIC ASSET SEC LLC CP 0.71 4/7/2017 50,000,000.00 49,994,083.33 49,990,860.00
PSI NTRD CPD 104006 ATLANTIC ASSET SEC LLC CP 0.73 4/4/2017 48,847,000.00 48,844,028.47 48,841,954.10
PSI NTRD CPD 104013 ATLANTIC ASSET SEC LLC CP 0.72 4/6/2017 50,000,000.00 49,995,000.00 49,992,200.00
PSI NTRD CPD 104014 ATLANTIC ASSET SEC LLC CP 0.72 4/6/2017 50,000,000.00 49,995,000.00 49,992,200.00
PSI NTRD CPD 104019 SHEFFIELD RECEIVABLES CORP 0.8 4/5/2017 50,000,000.00 49,995,555.56 49,992,485.00
PSI NTRD CPD 104020 CRC FUNDING LLC CP 1 6/9/2017 25,000,000.00 24,952,083.33 24,948,130.00
PSI NTRD CPD 104023 LA FAYETTE ASSET SEC LLC C 0.75 4/19/2017 36,000,000.00 35,986,500.00 35,983,087.20
PSI NTRD CPD 104029 LA FAYETTE ASSET SEC LLC C 0.77 4/20/2017 30,000,000.00 29,987,808.33 29,985,081.00
PSI NTRD CPD 104030 THUNDER BAY FUNDING LLC CP 0.74 4/20/2017 45,000,000.00 44,982,425.00 44,977,621.50
PSI NTRD CPD 104032 SHEFFIELD RECEIVABLES CORP 0.77 4/6/2017 50,000,000.00 49,994,652.78 49,990,950.00
PSI NTRD CPD 104035 CHARIOT FUNDING LLC CP 0.72 4/11/2017 50,000,000.00 49,990,000.00 49,986,935.00
PSI NTRD CPD 104038 CRC FUNDING LLC CP 1.03 6/13/2017 14,665,000.00 14,634,370.52 14,632,412.90
PSI NTRD CPD 104042 ABBEY NATIONAL TREAS SV PL 0.78 4/14/2017 50,000,000.00 49,985,916.67 49,982,150.00
PSI NTRD CPD 104043 ABBEY NATIONAL TREAS SV PL 0.78 4/14/2017 25,000,000.00 24,992,958.33 24,991,075.00
PSI NTRD CPD 104044 AUTOBAHN FUNDING CO LLC CP 0.72 4/5/2017 28,000,000.00 27,997,760.00 27,996,760.40
PSI NTRD CPD 104045 ATLANTIC ASSET SEC LLC CP 0.75 4/12/2017 50,000,000.00 49,988,541.67 49,984,015.00
PSI NTRD CPD 104046 ATLANTIC ASSET SEC LLC CP 0.75 4/19/2017 50,000,000.00 49,981,250.00 49,973,875.00
PSI NTRD CPD 104047 ATLANTIC ASSET SEC LLC CP 0.8 4/25/2017 31,000,000.00 30,983,466.67 30,977,996.20
PSI NTRD CPD 104053 ABBEY NATIONAL TREAS SV PL 0.78 4/14/2017 33,000,000.00 32,990,705.00 32,988,219.00
PSI NTRD CPD 104061 CRC FUNDING LLC CP 1.05 6/13/2017 25,000,000.00 24,946,770.83 24,944,447.50
PSI NTRD CPD 104062 ATLANTIC ASSET SEC LLC CP 0.81 4/25/2017 25,000,000.00 24,986,500.00 24,982,255.00
PSI NTRD CPD 104063 CREDIT AGRICOLE CIB NY BR 0.76 4/7/2017 50,000,000.00 49,993,666.67 49,991,355.00
PSI NTRD CPD 104065 ABBEY NATIONAL TREAS SV PL 0.78 4/7/2017 50,000,000.00 49,993,500.00 49,991,210.00
PSI NTRD CPD 104068 CHARIOT FUNDING LLC CP 0.73 4/17/2017 50,000,000.00 49,983,777.78 49,979,220.00
PSI NTRD CPD 104070 AUTOBAHN FUNDING CO LLC CP 0.75 4/10/2017 30,000,000.00 29,994,375.00 29,992,908.00
PSI NTRD CPD 104071 ABBEY NATIONAL TREAS SV PL 0.81 4/11/2017 50,000,000.00 49,988,750.00 49,986,065.00
PSI NTRD CPD 104072 CHARIOT FUNDING LLC CP 0.73 4/18/2017 50,000,000.00 49,982,763.89 49,977,875.00
PSI NTRD CPD 104073 CHARIOT FUNDING LLC CP 0.74 4/10/2017 22,500,000.00 22,495,837.50 22,494,681.00
PSI NTRD CPD 104074 THUNDER BAY FUNDING LLC CP 0.86 4/24/2017 50,000,000.00 49,972,527.78 49,969,430.00
PSI NTRD CPD 104077 ATLANTIC ASSET SEC LLC CP 0.8 4/19/2017 32,500,000.00 32,487,000.00 32,483,018.75

Page 4
Los Angeles County TreasurerTreasurer Portfolio Compared to Market ValueFor the Period: March 1, 2017 to March 31, 2017Fund: Pooled Surplus InvestmentsAttachment X
Group Acct Sec Type SecID Description Face Rate Mat Date Par Amortized Cost Market ValuePSI NTRD CPD 104079 CHARIOT FUNDING LLC CP 0.73 4/18/2017 50,000,000.00 49,982,763.89 49,977,875.00
PSI NTRD CPD 104080 CANCARA ASSET SEC LLC CP 0.85 4/13/2017 20,000,000.00 19,994,333.33 19,993,766.00
PSI NTRD CPD 104081 LA FAYETTE ASSET SEC LLC C 0.8 4/20/2017 20,000,000.00 19,991,555.55 19,990,054.00
PSI NTRD CPD 104082 CHARIOT FUNDING LLC CP 0.73 4/21/2017 50,000,000.00 49,979,722.22 49,973,750.00
PSI NTRD CPD 104083 ATLANTIC ASSET SEC LLC CP 0.82 4/19/2017 25,000,000.00 24,989,750.00 24,986,937.50
PSI NTRD CPD 104084 JUPITER SEC COMPANY LLC CP 0.71 4/12/2017 50,000,000.00 49,989,152.78 49,985,680.00
PSI NTRD CPD 104085 OLD LINE FUNDING LLC CP 0.86 4/20/2017 50,000,000.00 49,977,305.55 49,975,135.00
PSI NTRD CPD 104086 OLD LINE FUNDING LLC CP 0.86 4/20/2017 25,000,000.00 24,988,652.78 24,987,567.50
PSI NTRD CPD 104087 LA FAYETTE ASSET SEC LLC C 0.88 4/26/2017 50,000,000.00 49,969,444.45 49,966,485.00
PSI NTRD CPD 104089 THUNDER BAY FUNDING LLC CP 0.855 4/18/2017 50,000,000.00 49,979,812.50 49,977,875.00
PSI NTRD CPD 104090 CRC FUNDING LLC CP 1.08 6/13/2017 15,110,000.00 15,076,909.10 15,076,424.07
PSI NTRD CPD 104091 REGENCY MARKETS NO. 1 LLC 0.87 4/12/2017 50,000,000.00 49,986,708.33 49,985,680.00
PSI NTRD CPD 104092 REGENCY MARKETS NO. 1 LLC 0.87 4/12/2017 50,000,000.00 49,986,708.33 49,985,680.00
PSI NTRD CPD 104093 REGENCY MARKETS NO. 1 LLC 0.87 4/12/2017 25,000,000.00 24,993,354.17 24,992,840.00
PSI NTRD CPD 104095 SHEFFIELD RECEIVABLES CORP 0.9 5/1/2017 25,000,000.00 24,981,250.00 24,974,100.00
PSI NTRD CPD 104096 CAFCO LLC CP 1.08 6/15/2017 14,973,000.00 14,939,310.75 14,942,116.69
PSI NTRD CPD 104097 AUTOBAHN FUNDING CO LLC CP 0.78 4/13/2017 25,000,000.00 24,993,500.00 24,992,207.50
PSI NTRD CPD 104099 REGENCY MARKETS NO. 1 LLC 0.9 4/6/2017 50,000,000.00 49,993,750.00 49,993,030.00
PSI NTRD CPD 104100 REGENCY MARKETS NO. 1 LLC 0.9 4/6/2017 15,558,000.00 15,556,055.25 15,555,831.21
PSI NTRD CPD 104101 REGENCY MARKETS NO. 1 LLC 0.88 4/6/2017 50,000,000.00 49,993,888.89 49,993,030.00
PSI NTRD CPD 104102 ATLANTIC ASSET SEC LLC CP 0.86 4/28/2017 50,000,000.00 49,967,750.00 49,959,590.00
PSI NTRD CPD 104103 SHEFFIELD RECEIVABLES CORP 0.82 4/20/2017 50,000,000.00 49,978,361.11 49,968,190.00
PSI NTRD CPD 104105 ATLANTIC ASSET SEC LLC CP 0.87 5/2/2017 50,000,000.00 49,962,541.67 49,953,110.00
PSI NTRD CPD 104108 ATLANTIC ASSET SEC LLC CP 0.86 4/25/2017 50,000,000.00 49,971,333.34 49,964,510.00
PSI NTRD CPD 104109 AUTOBAHN FUNDING CO LLC CP 0.79 4/20/2017 37,000,000.00 36,984,573.06 36,981,599.90
PSI NTRD CPD 104110 TOYOTA MOTOR CREDIT CORP C 0.85 4/20/2017 25,000,000.00 24,988,784.72 24,988,027.50
PSI NTRD CPD 104111 CANCARA ASSET SEC LLC CP 0.86 4/18/2017 25,000,000.00 24,989,847.22 24,988,937.50
PSI NTRD CPD 104113 ATLANTIC ASSET SEC LLC CP 0.86 4/28/2017 25,000,000.00 24,983,875.00 24,979,795.00
PSI NTRD CPD 104114 SHEFFIELD RECEIVABLES CORP 0.9 5/11/2017 30,000,000.00 29,970,000.00 29,958,009.00
PSI NTRD CPD 104115 CAFCO LLC CP 1.13 6/22/2017 6,910,000.00 6,892,214.43 6,894,163.66
PSI NTRD CPD 104117 SHEFFIELD RECEIVABLES CORP 0.9 5/1/2017 50,000,000.00 49,962,500.00 49,948,200.00
PSI NTRD CPD 104118 REGENCY MARKETS NO. 1 LLC 0.95 4/18/2017 17,121,000.00 17,113,319.33 17,113,423.96
PSI NTRD CPD 104119 TOYOTA MOTOR CREDIT CORP C 0.86 4/21/2017 50,000,000.00 49,976,111.11 49,974,710.00
PSI NTRD CPD 104120 AUTOBAHN FUNDING CO LLC CP 0.81 4/20/2017 25,000,000.00 24,989,312.50 24,987,567.50
PSI NTRD CPD 104121 CANCARA ASSET SEC LLC CP 0.9 4/19/2017 25,000,000.00 24,988,750.00 24,988,255.00
PSI NTRD CPD 104123 AUTOBAHN FUNDING CO LLC CP 0.81 4/17/2017 5,000,000.00 4,998,200.00 4,997,922.00
PSI NTRD CPD 104124 ABBEY NATIONAL TREAS SV PL 0.84 4/17/2017 30,472,000.00 30,460,623.79 30,458,702.02
PSI NTRD CPD 104126 AUTOBAHN FUNDING CO LLC CP 0.83 4/17/2017 50,000,000.00 49,981,555.56 49,979,220.00
PSI NTRD CPD 104127 ATLANTIC ASSET SEC LLC CP 0.88 5/2/2017 50,000,000.00 49,962,111.11 49,953,110.00

Page 5
Los Angeles County TreasurerTreasurer Portfolio Compared to Market ValueFor the Period: March 1, 2017 to March 31, 2017Fund: Pooled Surplus InvestmentsAttachment X
Group Acct Sec Type SecID Description Face Rate Mat Date Par Amortized Cost Market ValuePSI NTRD CPD 104128 SHEFFIELD RECEIVABLES CORP 0.87 4/20/2017 30,000,000.00 29,986,225.00 29,980,914.00
PSI NTRD CPD 104129 THUNDER BAY FUNDING LLC CP 0.96 5/17/2017 25,000,000.00 24,969,333.33 24,967,522.50
PSI NTRD CPD 104133 CREDIT AGRICOLE CIB NY BR 0.91 4/21/2017 50,000,000.00 49,974,722.22 49,973,515.00
PSI NTRD CPD 104134 ATLANTIC ASSET SEC LLC CP 0.9 4/20/2017 50,000,000.00 49,976,250.00 49,972,360.00
PSI NTRD CPD 104135 SHEFFIELD RECEIVABLES CORP 0.88 4/24/2017 50,000,000.00 49,971,888.89 49,961,100.00
PSI NTRD CPD 104136 CANCARA ASSET SEC LLC CP 0.91 4/18/2017 42,100,000.00 42,081,908.70 42,081,370.75
PSI NTRD CPD 104138 SHEFFIELD RECEIVABLES CORP 0.93 4/26/2017 25,000,000.00 24,983,854.17 24,978,730.00
PSI NTRD CPD 104141 SHEFFIELD RECEIVABLES CORP 0.93 5/4/2017 50,000,000.00 49,957,375.00 49,942,810.00
PSI NTRD CPD 104142 CREDIT AGRICOLE CIB NY BR 0.91 4/28/2017 50,000,000.00 49,965,875.00 49,964,335.00
PSI NTRD CPD 104143 ATLANTIC ASSET SEC LLC CP 0.94 5/3/2017 50,000,000.00 49,958,222.22 49,951,505.00
PSI NTRD CPD 104144 AUTOBAHN FUNDING CO LLC CP 0.93 4/28/2017 50,000,000.00 49,965,125.00 49,963,480.00
PSI NTRD CPD 104145 MONT BLANC CAPITAL CORP CP 0.96 5/10/2017 25,723,000.00 25,696,248.08 25,695,075.11
PSI NTRD CPD 104146 SHEFFIELD RECEIVABLES CORP 0.95 4/28/2017 50,000,000.00 49,964,375.00 49,953,760.00
PSI NTRD CPD 104147 OLD LINE FUNDING LLC CP 0.96 5/16/2017 12,750,000.00 12,734,700.00 12,733,821.53
PSI NTRD CPD 104148 ATLANTIC ASSET SEC LLC CP 0.95 4/17/2017 25,000,000.00 24,989,444.45 24,988,430.00
PSI NTRD CPD 104150 ATLANTIC ASSET SEC LLC CP 0.95 4/26/2017 25,000,000.00 24,983,506.94 24,981,437.50
PSI NTRD CPD 104151 SHEFFIELD RECEIVABLES CORP 0.95 5/1/2017 50,000,000.00 49,960,416.67 49,948,200.00
PSI NTRD CPD 104152 SHEFFIELD RECEIVABLES CORP 0.98 4/19/2017 50,000,000.00 49,975,500.00 49,969,915.00
PSI NTRD CPD 104153 LA FAYETTE ASSET SEC LLC C 0.96 5/4/2017 25,000,000.00 24,978,000.00 24,977,307.50
PSI NTRD CPD 104154 CREDIT AGRICOLE CIB NY BR 0.92 4/20/2017 50,000,000.00 49,975,722.22 49,974,805.00
PSI NTRD CPD 104155 OLD LINE FUNDING LLC CP 0.95 5/22/2017 50,000,000.00 49,932,708.33 49,927,125.00
PSI NTRD CPD 104157 AUTOBAHN FUNDING CO LLC CP 0.93 4/21/2017 25,000,000.00 24,987,083.33 24,986,875.00
PSI NTRD CPD 104159 THUNDER BAY FUNDING LLC CP 0.955 5/15/2017 27,575,000.00 27,542,813.85 27,540,875.94
PSI NTRD CPD 104161 AUTOBAHN FUNDING CO LLC CP 0.93 4/21/2017 50,000,000.00 49,974,166.67 49,973,750.00
PSI NTRD CPD 104162 LA FAYETTE ASSET SEC LLC C 1 5/19/2017 50,000,000.00 49,933,333.34 49,931,875.00
PSI NTRD CPD 104163 REGENCY MARKETS NO. 1 LLC 0.98 4/19/2017 50,000,000.00 49,975,500.00 49,976,510.00
PSI NTRD CPD 104164 REGENCY MARKETS NO. 1 LLC 0.98 4/19/2017 50,000,000.00 49,975,500.00 49,976,510.00
PSI NTRD CPD 104165 REGENCY MARKETS NO. 1 LLC 0.98 4/19/2017 13,732,000.00 13,725,271.32 13,725,548.71
PSI NTRD CPD 104166 LA FAYETTE ASSET SEC LLC C 1 5/18/2017 25,000,000.00 24,967,361.11 24,966,732.50
PSI NTRD CPD 104167 TOYOTA MOTOR CREDIT CORP C 0.96 5/5/2017 50,000,000.00 49,954,666.67 49,954,595.00
PSI NTRD CPD 104168 ATLANTIC ASSET SEC LLC CP 0.94 5/1/2017 50,000,000.00 49,960,833.34 49,954,660.00
PSI NTRD CPD 104169 SHEFFIELD RECEIVABLES CORP 0.92 4/20/2017 50,000,000.00 49,975,722.22 49,968,190.00
PSI NTRD CPD 104170 SHEFFIELD RECEIVABLES CORP 0.98 5/19/2017 40,000,000.00 39,947,733.34 39,931,888.00
PSI NTRD CPD 104173 CREDIT AGRICOLE CIB NY BR 0.92 4/3/2017 23,623,000.00 23,621,792.60 23,621,228.28
PSI NTRD CPD 104174 AUTOBAHN FUNDING CO LLC CP 0.92 4/25/2017 50,000,000.00 49,969,333.33 49,967,985.00
PSI NTRD CPD 104175 SHEFFIELD RECEIVABLES CORP 0.92 4/26/2017 50,000,000.00 49,968,055.56 49,957,460.00
PSI NTRD CPD 104176 ATLANTIC ASSET SEC LLC CP 0.94 4/24/2017 50,000,000.00 49,969,972.22 49,966,100.00
PSI NTRD CPD 104177 ATLANTIC ASSET SEC LLC CP 0.96 4/24/2017 50,000,000.00 49,969,333.33 49,966,100.00
PSI NTRD CPD 104180 SHEFFIELD RECEIVABLES CORP 0.92 4/28/2017 50,000,000.00 49,965,500.00 49,953,760.00

Page 6
Los Angeles County TreasurerTreasurer Portfolio Compared to Market ValueFor the Period: March 1, 2017 to March 31, 2017Fund: Pooled Surplus InvestmentsAttachment X
Group Acct Sec Type SecID Description Face Rate Mat Date Par Amortized Cost Market ValuePSI NTRD CPD 104182 ABBEY NATIONAL TREAS SV PL 0.95 5/5/2017 43,413,000.00 43,374,048.89 43,372,478.31
PSI NTRD CPD 104183 ABBEY NATIONAL TREAS SV PL 0.96 5/1/2017 50,000,000.00 49,960,000.00 49,959,010.00
PSI NTRD CPD 104184 AUTOBAHN FUNDING CO LLC CP 0.93 4/28/2017 32,000,000.00 31,977,680.00 31,976,627.20
PSI NTRD CPD 104185 ABBEY NATIONAL TREAS SV PL 0.96 5/3/2017 50,000,000.00 49,957,333.33 49,956,180.00
PSI NTRD CPD 104186 SHEFFIELD RECEIVABLES CORP 0.92 4/25/2017 50,000,000.00 49,969,333.34 49,959,305.00
PSI NTRD CPD 104187 LA FAYETTE ASSET SEC LLC C 1.15 6/19/2017 35,000,000.00 34,911,673.62 34,914,208.00
PSI NTRD CPD 104188 SHEFFIELD RECEIVABLES CORP 0.92 4/26/2017 50,000,000.00 49,968,055.56 49,957,460.00
PSI NTRD CPD 104190 SHEFFIELD RECEIVABLES CORP 1.04 5/23/2017 50,000,000.00 49,924,888.89 49,907,175.00
PSI NTRD CPD 104191 ATLANTIC ASSET SEC LLC CP 1.02 4/24/2017 50,000,000.00 49,967,416.67 49,966,100.00
PSI NTRD CPD 104192 AUTOBAHN FUNDING CO LLC CP 0.92 4/28/2017 25,000,000.00 24,982,750.00 24,981,740.00
PSI NTRD CPD 104193 CAFCO LLC CP 1.11 6/27/2017 50,000,000.00 49,865,875.00 49,877,165.00
PSI NTRD CPD 104194 SHEFFIELD RECEIVABLES CORP 0.92 4/26/2017 50,000,000.00 49,968,055.56 49,957,460.00
PSI NTRD CPD 104198 TORONTO-DOMINION HLDG USA 1.12 6/23/2017 50,000,000.00 49,870,888.89 49,871,200.00
PSI NTRD CPD 104200 NATIXIS NY BRANCH CP 0.9 4/3/2017 50,000,000.00 49,997,500.00 50,000,000.00
PSI NTRD CPD 104201 NATIXIS NY BRANCH CP 0.9 4/3/2017 25,000,000.00 24,998,750.00 25,000,000.00
PSI NTRD CPD 104202 LA FAYETTE ASSET SEC LLC C 1.18 6/19/2017 36,000,000.00 35,906,780.00 35,911,756.80
PSI NTRD CPD 104203 ABBEY NATIONAL TREAS SV PL 0.93 5/2/2017 18,582,000.00 18,567,118.92 18,566,242.46
PSI NTRD CPD 104204 THUNDER BAY FUNDING LLC CP 0.92 4/26/2017 30,000,000.00 29,980,833.33 29,979,891.00
PSI NTRD CPD 104205 ABBEY NATIONAL TREAS SV PL 0.93 5/3/2017 15,041,000.00 15,028,566.10 15,027,818.07
PSI NTRD CPD 104206 AUTOBAHN FUNDING CO LLC CP 0.92 4/24/2017 50,000,000.00 49,970,611.11 49,969,430.00
PSI NTRD CPD 104207 AUTOBAHN FUNDING CO LLC CP 0.93 4/28/2017 50,000,000.00 49,965,125.00 49,963,480.00
PSI NTRD CPD 104210 CANCARA ASSET SEC LLC CP 0.95 4/3/2017 26,500,000.00 26,498,601.39 26,498,012.50
PSI NTRD CPD 104211 AUTOBAHN FUNDING CO LLC CP 0.93 4/28/2017 25,000,000.00 24,982,562.50 24,981,740.00
PSI NTRD CPD 104217 CRC FUNDING LLC CP 0.97 5/12/2017 50,000,000.00 49,944,763.89 49,942,715.00
PSI NTRD CPD 104218 AUTOBAHN FUNDING CO LLC CP 0.93 5/1/2017 50,000,000.00 49,961,250.00 49,958,965.00
PSI NTRD CPD 104219 SHEFFIELD RECEIVABLES CORP 0.92 4/28/2017 50,000,000.00 49,965,500.00 49,953,760.00
PSI NTRD CPD 104222 TORONTO-DOMINION HLDG USA 0.94 5/30/2017 50,000,000.00 49,922,972.22 49,920,000.00
PSI NTRD CPD 104223 ABBEY NATIONAL TREAS SV PL 0.98 5/26/2017 50,000,000.00 49,925,138.89 49,922,065.00
PSI NTRD CPD 104225 LA FAYETTE ASSET SEC LLC C 1.18 6/19/2017 24,500,000.00 24,436,558.61 24,439,945.60
PSI NTRD CPD 104229 SHEFFIELD RECEIVABLES CORP 0.92 5/1/2017 50,000,000.00 49,961,666.67 49,948,200.00
PSI NTRD CPD 104230 CRC FUNDING LLC CP 0.98 5/9/2017 50,000,000.00 49,948,277.77 49,947,240.00
PSI NTRD CPD 104231 MONT BLANC CAPITAL CORP CP 1.1 6/27/2017 30,000,000.00 29,920,250.00 29,916,912.00
PSI NTRD CPD 104232 DANSKE CORP CP 1.07 7/3/2017 50,000,000.00 49,861,791.66 49,830,930.00
PSI NTRD CPD 104239 CHARIOT FUNDING LLC CP 0.9 4/28/2017 31,300,000.00 31,278,872.50 31,277,138.48
PSI NTRD CPD 104242 JUPITER SEC COMPANY LLC CP 1.06 6/20/2017 17,800,000.00 17,758,071.11 17,755,663.76
PSI NTRD CPD 104246 OLD LINE FUNDING LLC CP 1.1 7/3/2017 50,000,000.00 49,857,916.67 49,849,600.00
PSI NTRD CPD 104252 CREDIT AGRICOLE CIB NY BR 1.1 6/30/2017 50,000,000.00 49,862,500.00 49,860,845.00
PSI NTRD CPD 104261 AUTOBAHN FUNDING CO LLC CP 0.93 5/1/2017 50,000,000.00 49,961,250.00 49,958,965.00
PSI NTRD CPD 104262 AUTOBAHN FUNDING CO LLC CP 0.93 5/1/2017 25,000,000.00 24,980,625.00 24,979,482.50
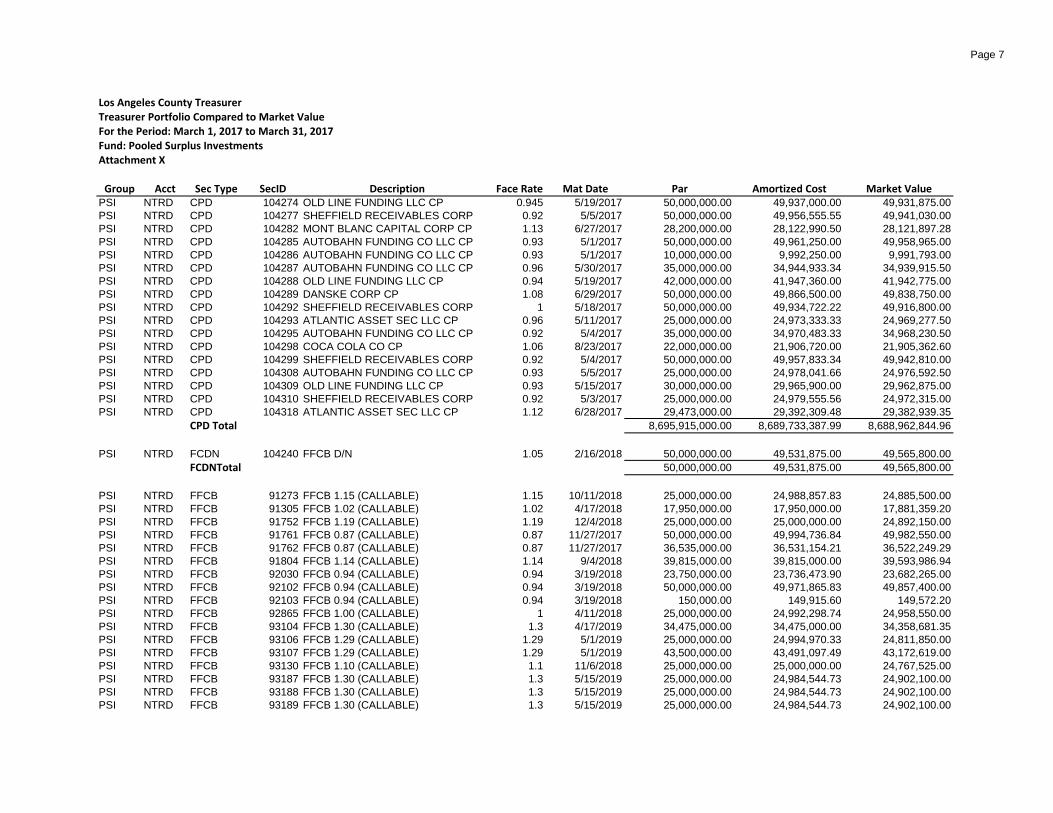
Page 7
Los Angeles County TreasurerTreasurer Portfolio Compared to Market ValueFor the Period: March 1, 2017 to March 31, 2017Fund: Pooled Surplus InvestmentsAttachment X
Group Acct Sec Type SecID Description Face Rate Mat Date Par Amortized Cost Market ValuePSI NTRD CPD 104274 OLD LINE FUNDING LLC CP 0.945 5/19/2017 50,000,000.00 49,937,000.00 49,931,875.00
PSI NTRD CPD 104277 SHEFFIELD RECEIVABLES CORP 0.92 5/5/2017 50,000,000.00 49,956,555.55 49,941,030.00
PSI NTRD CPD 104282 MONT BLANC CAPITAL CORP CP 1.13 6/27/2017 28,200,000.00 28,122,990.50 28,121,897.28
PSI NTRD CPD 104285 AUTOBAHN FUNDING CO LLC CP 0.93 5/1/2017 50,000,000.00 49,961,250.00 49,958,965.00
PSI NTRD CPD 104286 AUTOBAHN FUNDING CO LLC CP 0.93 5/1/2017 10,000,000.00 9,992,250.00 9,991,793.00
PSI NTRD CPD 104287 AUTOBAHN FUNDING CO LLC CP 0.96 5/30/2017 35,000,000.00 34,944,933.34 34,939,915.50
PSI NTRD CPD 104288 OLD LINE FUNDING LLC CP 0.94 5/19/2017 42,000,000.00 41,947,360.00 41,942,775.00
PSI NTRD CPD 104289 DANSKE CORP CP 1.08 6/29/2017 50,000,000.00 49,866,500.00 49,838,750.00
PSI NTRD CPD 104292 SHEFFIELD RECEIVABLES CORP 1 5/18/2017 50,000,000.00 49,934,722.22 49,916,800.00
PSI NTRD CPD 104293 ATLANTIC ASSET SEC LLC CP 0.96 5/11/2017 25,000,000.00 24,973,333.33 24,969,277.50
PSI NTRD CPD 104295 AUTOBAHN FUNDING CO LLC CP 0.92 5/4/2017 35,000,000.00 34,970,483.33 34,968,230.50
PSI NTRD CPD 104298 COCA COLA CO CP 1.06 8/23/2017 22,000,000.00 21,906,720.00 21,905,362.60
PSI NTRD CPD 104299 SHEFFIELD RECEIVABLES CORP 0.92 5/4/2017 50,000,000.00 49,957,833.34 49,942,810.00
PSI NTRD CPD 104308 AUTOBAHN FUNDING CO LLC CP 0.93 5/5/2017 25,000,000.00 24,978,041.66 24,976,592.50
PSI NTRD CPD 104309 OLD LINE FUNDING LLC CP 0.93 5/15/2017 30,000,000.00 29,965,900.00 29,962,875.00
PSI NTRD CPD 104310 SHEFFIELD RECEIVABLES CORP 0.92 5/3/2017 25,000,000.00 24,979,555.56 24,972,315.00
PSI NTRD CPD 104318 ATLANTIC ASSET SEC LLC CP 1.12 6/28/2017 29,473,000.00 29,392,309.48 29,382,939.35
CPD Total 8,695,915,000.00 8,689,733,387.99 8,688,962,844.96
PSI NTRD FCDN 104240 FFCB D/N 1.05 2/16/2018 50,000,000.00 49,531,875.00 49,565,800.00
FCDNTotal 50,000,000.00 49,531,875.00 49,565,800.00
PSI NTRD FFCB 91273 FFCB 1.15 (CALLABLE) 1.15 10/11/2018 25,000,000.00 24,988,857.83 24,885,500.00
PSI NTRD FFCB 91305 FFCB 1.02 (CALLABLE) 1.02 4/17/2018 17,950,000.00 17,950,000.00 17,881,359.20
PSI NTRD FFCB 91752 FFCB 1.19 (CALLABLE) 1.19 12/4/2018 25,000,000.00 25,000,000.00 24,892,150.00
PSI NTRD FFCB 91761 FFCB 0.87 (CALLABLE) 0.87 11/27/2017 50,000,000.00 49,994,736.84 49,982,550.00
PSI NTRD FFCB 91762 FFCB 0.87 (CALLABLE) 0.87 11/27/2017 36,535,000.00 36,531,154.21 36,522,249.29
PSI NTRD FFCB 91804 FFCB 1.14 (CALLABLE) 1.14 9/4/2018 39,815,000.00 39,815,000.00 39,593,986.94
PSI NTRD FFCB 92030 FFCB 0.94 (CALLABLE) 0.94 3/19/2018 23,750,000.00 23,736,473.90 23,682,265.00
PSI NTRD FFCB 92102 FFCB 0.94 (CALLABLE) 0.94 3/19/2018 50,000,000.00 49,971,865.83 49,857,400.00
PSI NTRD FFCB 92103 FFCB 0.94 (CALLABLE) 0.94 3/19/2018 150,000.00 149,915.60 149,572.20
PSI NTRD FFCB 92865 FFCB 1.00 (CALLABLE) 1 4/11/2018 25,000,000.00 24,992,298.74 24,958,550.00
PSI NTRD FFCB 93104 FFCB 1.30 (CALLABLE) 1.3 4/17/2019 34,475,000.00 34,475,000.00 34,358,681.35
PSI NTRD FFCB 93106 FFCB 1.29 (CALLABLE) 1.29 5/1/2019 25,000,000.00 24,994,970.33 24,811,850.00
PSI NTRD FFCB 93107 FFCB 1.29 (CALLABLE) 1.29 5/1/2019 43,500,000.00 43,491,097.49 43,172,619.00
PSI NTRD FFCB 93130 FFCB 1.10 (CALLABLE) 1.1 11/6/2018 25,000,000.00 25,000,000.00 24,767,525.00
PSI NTRD FFCB 93187 FFCB 1.30 (CALLABLE) 1.3 5/15/2019 25,000,000.00 24,984,544.73 24,902,100.00
PSI NTRD FFCB 93188 FFCB 1.30 (CALLABLE) 1.3 5/15/2019 25,000,000.00 24,984,544.73 24,902,100.00
PSI NTRD FFCB 93189 FFCB 1.30 (CALLABLE) 1.3 5/15/2019 25,000,000.00 24,984,544.73 24,902,100.00

Page 8
Los Angeles County TreasurerTreasurer Portfolio Compared to Market ValueFor the Period: March 1, 2017 to March 31, 2017Fund: Pooled Surplus InvestmentsAttachment X
Group Acct Sec Type SecID Description Face Rate Mat Date Par Amortized Cost Market ValuePSI NTRD FFCB 93225 FFCB 1.12 (CALLABLE) 1.12 8/20/2018 25,000,000.00 25,000,000.00 24,908,500.00
PSI NTRD FFCB 94778 FFCB 1.51 1.51 9/4/2018 21,805,000.00 21,805,000.00 21,907,178.23
PSI NTRD FFCB 99727 FFCB 1.36 (CALLABLE) 1.36 10/28/2019 25,000,000.00 24,967,830.25 24,810,500.00
PSI NTRD FFCB 99781 FFCB 1.36 (CALLABLE) 1.36 10/28/2019 25,000,000.00 25,000,000.00 24,810,500.00
PSI NTRD FFCB 99784 FFCB 1.36 (CALLABLE) 1.36 10/28/2019 25,000,000.00 25,000,000.00 24,810,500.00
PSI NTRD FFCB 100019 FFCB 1.34 (CALLABLE) 1.34 11/30/2018 25,000,000.00 25,000,000.00 24,969,075.00
PSI NTRD FFCB 100218 FFCB 1.375 (CALLABLE) 1.375 12/21/2018 25,000,000.00 24,992,826.19 25,000,325.00
PSI NTRD FFCB 100324 FFCB 1.72 (CALLABLE) 1.72 12/30/2019 18,486,000.00 18,486,000.00 18,486,018.49
PSI NTRD FFCB 100416 FFCB 1.47 (CALLABLE) 1.47 1/25/2019 41,000,000.00 41,000,000.00 40,981,017.00
PSI NTRD FFCB 100464 FFCB 1.53 (CALLABLE) 1.53 1/27/2020 21,000,000.00 21,000,000.00 20,870,787.00
PSI NTRD FFCB 100465 FFCB 1.53 (CALLABLE) 1.53 1/27/2020 21,000,000.00 21,000,000.00 20,870,787.00
PSI NTRD FFCB 100512 FFCB 1.35 1.35 1/28/2020 30,000,000.00 30,000,000.00 29,807,130.00
PSI NTRD FFCB 100535 FFCB 1.27 (CALLABLE) 1.27 1/28/2019 25,000,000.00 24,983,264.14 24,969,725.00
PSI NTRD FFCB 100627 FFCB 1.4 1.4 2/24/2020 25,000,000.00 25,000,000.00 24,816,025.00
PSI NTRD FFCB 100628 FFCB 1.4 1.4 2/24/2020 25,000,000.00 25,000,000.00 24,816,025.00
PSI NTRD FFCB 100641 FFCB 1.4 1.4 2/24/2020 27,000,000.00 27,000,000.00 26,801,307.00
PSI NTRD FFCB 100666 FFCB 1.40 (CALLABLE) 1.4 2/24/2020 19,150,000.00 19,150,000.00 19,009,075.15
PSI NTRD FFCB 100680 FFCB 1.62 (CALLABLE) 1.62 2/17/2021 50,000,000.00 49,961,150.68 49,276,300.00
PSI NTRD FFCB 100686 FFCB 1.35 (CALLABLE) 1.35 11/18/2019 25,000,000.00 25,000,000.00 24,757,750.00
PSI NTRD FFCB 100725 FFCB 1.40 (CALLABLE) 1.4 2/24/2020 25,000,000.00 24,986,409.14 24,816,025.00
PSI NTRD FFCB 100817 FFCB 1.65 (CALLABLE) 1.65 3/1/2021 12,390,000.00 12,385,148.49 12,202,700.37
PSI NTRD FFCB 100818 FFCB 1.65 (CALLABLE) 1.65 3/1/2021 19,410,000.00 19,402,399.70 19,116,579.03
PSI NTRD FFCB 100950 FFCB 1.59 1.59 3/23/2020 25,000,000.00 25,000,000.00 24,898,900.00
PSI NTRD FFCB 101149 FFCB 1.41 (CALLABLE) 1.41 1/7/2020 50,000,000.00 49,981,551.09 49,316,350.00
PSI NTRD FFCB 101151 FFCB 1.41 (CALLABLE) 1.41 1/7/2020 47,540,000.00 47,522,458.78 46,889,985.58
PSI NTRD FFCB 101152 FFCB 1.62 (CALLABLE) 1.62 4/12/2021 50,000,000.00 50,000,000.00 48,462,400.00
PSI NTRD FFCB 101154 FFCB 1.40 (CALLABLE) 1.4 4/7/2020 50,000,000.00 50,000,000.00 49,578,400.00
PSI NTRD FFCB 101156 FFCB 1.62 (CALLABLE) 1.62 4/12/2021 25,000,000.00 25,000,000.00 24,231,200.00
PSI NTRD FFCB 101159 FFCB 1.40 (CALLABLE) 1.4 4/7/2020 50,000,000.00 49,981,143.05 49,578,400.00
PSI NTRD FFCB 101210 FFCB 1.40 (CALLABLE) 1.4 4/7/2020 50,000,000.00 50,000,000.00 49,578,400.00
PSI NTRD FFCB 101277 FFCB 1.68 (CALLABLE) 1.68 4/12/2021 25,000,000.00 24,979,846.66 24,293,600.00
PSI NTRD FFCB 101295 FFCB 1.40 (CALLABLE) 1.4 4/13/2020 25,000,000.00 25,000,000.00 24,754,400.00
PSI NTRD FFCB 101296 FFCB 1.40 (CALLABLE) 1.4 4/13/2020 25,000,000.00 25,000,000.00 24,754,400.00
PSI NTRD FFCB 101300 FFCB 1.40 (CALLABLE) 1.4 4/13/2020 50,000,000.00 50,000,000.00 49,508,800.00
PSI NTRD FFCB 101324 FFCB 1.68 (CALLABLE) 1.68 4/12/2021 33,600,000.00 33,578,295.47 32,650,598.40
PSI NTRD FFCB 101325 FFCB 1.68 (CALLABLE) 1.68 4/12/2021 35,500,000.00 35,464,168.95 34,496,912.00
PSI NTRD FFCB 101349 FFCB 1.62 (CALLABLE) 1.62 4/20/2021 50,000,000.00 49,967,579.41 49,414,100.00
PSI NTRD FFCB 101354 FFCB 1.62 (CALLABLE) 1.62 4/20/2021 25,000,000.00 24,979,737.13 24,707,050.00
PSI NTRD FFCB 101356 FFCB 1.68 (CALLABLE) 1.68 4/12/2021 26,440,000.00 26,418,615.56 25,692,911.36

Page 9
Los Angeles County TreasurerTreasurer Portfolio Compared to Market ValueFor the Period: March 1, 2017 to March 31, 2017Fund: Pooled Surplus InvestmentsAttachment X
Group Acct Sec Type SecID Description Face Rate Mat Date Par Amortized Cost Market ValuePSI NTRD FFCB 101400 FFCB 1.62 (CALLABLE) 1.62 4/20/2021 30,000,000.00 29,968,372.60 29,648,460.00
PSI NTRD FFCB 101408 FFCB 1.42 (CALLABLE) 1.42 4/27/2020 25,000,000.00 25,000,000.00 24,732,125.00
PSI NTRD FFCB 101410 FFCB 1.42 (CALLABLE) 1.42 4/27/2020 10,900,000.00 10,900,000.00 10,783,206.50
PSI NTRD FFCB 101411 FFCB 1.42 (CALLABLE) 1.42 4/27/2020 25,000,000.00 25,000,000.00 24,732,125.00
PSI NTRD FFCB 101412 FFCB 1.42 (CALLABLE) 1.42 4/27/2020 25,000,000.00 25,000,000.00 24,732,125.00
PSI NTRD FFCB 101413 FFCB 1.42 (CALLABLE) 1.42 4/27/2020 25,000,000.00 25,000,000.00 24,732,125.00
PSI NTRD FFCB 101424 FFCB 1.40 (CALLABLE) 1.4 4/13/2020 46,645,000.00 46,573,664.38 46,186,759.52
PSI NTRD FFCB 101448 FFCB 1.70 (CALLABLE) 1.7 5/3/2021 25,000,000.00 24,979,559.15 24,522,675.00
PSI NTRD FFCB 101449 FFCB 1.70 (CALLABLE) 1.7 5/3/2021 25,000,000.00 24,979,559.15 24,522,675.00
PSI NTRD FFCB 101454 FFCB 1.62 (CALLABLE) 1.62 4/20/2021 20,710,000.00 20,667,757.99 20,467,320.22
PSI NTRD FFCB 101459 FFCB 1.68 (CALLABLE) 1.68 4/5/2021 25,000,000.00 24,963,354.64 24,281,075.00
PSI NTRD FFCB 101475 FFCB 1.47 (CALLABLE) 1.47 5/4/2020 50,000,000.00 50,000,000.00 49,532,850.00
PSI NTRD FFCB 101476 FFCB 1.47 (CALLABLE) 1.47 5/4/2020 25,000,000.00 25,000,000.00 24,766,425.00
PSI NTRD FFCB 101477 FFCB 1.47 (CALLABLE) 1.47 5/4/2020 25,000,000.00 25,000,000.00 24,766,425.00
PSI NTRD FFCB 101553 FFCB 1.47 (CALLABLE) 1.47 8/17/2020 40,000,000.00 40,000,000.00 39,471,920.00
PSI NTRD FFCB 101567 FFCB 1.47 (CALLABLE) 1.47 8/17/2020 27,000,000.00 26,991,327.02 26,643,546.00
PSI NTRD FFCB 101571 FFCB 1.47 (CALLABLE) 1.47 8/17/2020 25,000,000.00 24,980,122.42 24,669,950.00
PSI NTRD FFCB 101573 FFCB 1.47 (CALLABLE) 1.47 8/17/2020 30,000,000.00 29,974,715.72 29,603,940.00
PSI NTRD FFCB 101582 FFCB 1.36 (CALLABLE) 1.36 2/18/2020 23,600,000.00 23,587,311.77 23,236,465.60
PSI NTRD FFCB 101597 FFCB 1.55 (CALLABLE) 1.55 5/17/2021 45,650,000.00 45,631,141.84 44,946,716.10
PSI NTRD FFCB 101603 FFCB 1.55 (CALLABLE) 1.55 5/17/2021 25,000,000.00 24,969,051.20 24,614,850.00
PSI NTRD FFCB 101608 FFCB 1.58 (CALLABLE) 1.58 2/17/2021 25,000,000.00 24,974,474.37 24,687,825.00
PSI NTRD FFCB 101609 FFCB 1.58 (CALLABLE) 1.58 2/17/2021 25,000,000.00 24,978,137.46 24,687,825.00
PSI NTRD FFCB 101611 FFCB 1.58 (CALLABLE) 1.58 2/17/2021 25,000,000.00 24,978,150.06 24,687,825.00
PSI NTRD FFCB 101618 FFCB 1.58 (CALLABLE) 1.58 2/17/2021 30,000,000.00 29,974,255.33 29,625,390.00
PSI NTRD FFCB 101750 FFCB 1.52 (CALLABLE) 1.52 6/8/2020 25,000,000.00 25,000,000.00 24,508,675.00
PSI NTRD FFCB 101829 FFCB 1.40 (CALLABLE) 1.4 3/16/2020 49,000,000.00 48,980,672.02 48,262,305.00
PSI NTRD FFCB 101840 FFCB 1.55 (CALLABLE) 1.55 12/21/2020 25,000,000.00 25,000,000.00 24,401,300.00
PSI NTRD FFCB 101847 FFCB 1.55 (CALLABLE) 1.55 12/21/2020 33,000,000.00 32,972,650.82 32,209,716.00
PSI NTRD FFCB 101858 FFCB 1.54 (CALLABLE) 1.54 12/14/2020 9,000,000.00 9,000,000.00 8,879,688.00
PSI NTRD FFCB 101891 FFCB 1.40 (CALLABLE) 1.4 3/16/2020 41,500,000.00 41,493,432.97 40,875,217.50
PSI NTRD FFCB 101922 FFCB 1.47 (CALLABLE) 1.47 6/29/2020 50,000,000.00 50,000,000.00 48,893,500.00
PSI NTRD FFCB 101924 FFCB 1.42 (CALLABLE) 1.42 6/29/2020 25,000,000.00 25,000,000.00 24,722,225.00
PSI NTRD FFCB 101927 FFCB 1.42 (CALLABLE) 1.42 6/29/2020 25,000,000.00 25,000,000.00 24,722,225.00
PSI NTRD FFCB 101934 FFCB 1.62 (CALLABLE) 1.62 6/14/2021 50,000,000.00 50,000,000.00 49,168,450.00
PSI NTRD FFCB 101935 FFCB 1.47 (CALLABLE) 1.47 6/29/2020 25,000,000.00 25,000,000.00 24,446,750.00
PSI NTRD FFCB 101937 FFCB 1.42 (CALLABLE) 1.42 6/29/2020 17,730,000.00 17,730,000.00 17,533,001.97
PSI NTRD FFCB 101939 FFCB 1.42 (CALLABLE) 1.42 6/29/2020 25,000,000.00 25,000,000.00 24,722,225.00
PSI NTRD FFCB 102079 FFCB 1.24 (CALLABLE) 1.24 1/13/2020 35,500,000.00 35,484,192.37 34,913,540.00

Page 10
Los Angeles County TreasurerTreasurer Portfolio Compared to Market ValueFor the Period: March 1, 2017 to March 31, 2017Fund: Pooled Surplus InvestmentsAttachment X
Group Acct Sec Type SecID Description Face Rate Mat Date Par Amortized Cost Market ValuePSI NTRD FFCB 102087 FFCB 1.19 (CALLABLE) 1.19 7/13/2020 27,800,000.00 27,765,778.03 27,278,277.40
PSI NTRD FFCB 102186 FFCB 1.50 (CALLABLE) 1.5 7/28/2021 50,000,000.00 50,000,000.00 48,317,100.00
PSI NTRD FFCB 102187 FFCB 1.50 (CALLABLE) 1.5 7/28/2021 25,000,000.00 25,000,000.00 24,158,550.00
PSI NTRD FFCB 102188 FFCB 1.50 (CALLABLE) 1.5 7/28/2021 35,000,000.00 35,000,000.00 33,821,970.00
PSI NTRD FFCB 102215 FFCB 1.68 (CALLABLE) 1.68 8/16/2021 28,075,000.00 28,073,784.84 27,621,251.85
PSI NTRD FFCB 102407 FFCB 1.46 (CALLABLE) 1.46 9/1/2021 25,000,000.00 24,988,951.26 24,144,550.00
PSI NTRD FFCB 102416 FFCB 1.44 (CALLABLE) 1.44 8/16/2021 32,120,000.00 32,098,766.78 31,297,181.96
PSI NTRD FFCB 102431 FFCB 1.46 (CALLABLE) 1.46 9/1/2021 25,000,000.00 24,976,733.94 24,144,550.00
PSI NTRD FFCB 102475 FFCB 1.54 (CALLABLE) 1.54 9/8/2021 25,000,000.00 25,000,000.00 24,140,225.00
PSI NTRD FFCB 102476 FFCB 1.54 (CALLABLE) 1.54 9/8/2021 25,000,000.00 25,000,000.00 24,140,225.00
PSI NTRD FFCB 102477 FFCB 1.54 (CALLABLE) 1.54 9/8/2021 25,000,000.00 25,000,000.00 24,140,225.00
PSI NTRD FFCB 102479 FFCB 1.54 (CALLABLE) 1.54 9/8/2021 25,000,000.00 25,000,000.00 24,140,225.00
PSI NTRD FFCB 102514 FFCB 1.46 (CALLABLE) 1.46 9/1/2021 25,000,000.00 24,977,768.60 24,144,550.00
PSI NTRD FFCB 102522 FFCB 1.46 (CALLABLE) 1.46 9/1/2021 11,175,000.00 11,155,081.23 10,792,613.85
PSI NTRD FFCB 102633 FFCB 1.35 (CALLABLE) 1.35 9/21/2020 23,165,000.00 23,161,969.44 22,802,398.26
PSI NTRD FFCB 102653 FFCB 1.35 (CALLABLE) 1.35 9/21/2020 32,080,000.00 32,075,800.26 31,577,851.76
PSI NTRD FFCB 102666 FFCB 1.42 (CALLABLE) 1.42 10/4/2021 50,000,000.00 49,977,438.36 48,387,400.00
PSI NTRD FFCB 102708 FFCB 1.34 (CALLABLE) 1.34 10/13/2020 50,000,000.00 49,973,490.76 48,778,700.00
PSI NTRD FFCB 102756 FFCB 1.54 (CALLABLE) 1.54 10/12/2021 43,000,000.00 42,941,508.22 41,626,752.00
PSI NTRD FFCB 102781 FFCB 1.17 (CALLABLE) 1.17 1/13/2020 25,000,000.00 24,969,987.35 24,691,650.00
PSI NTRD FFCB 102782 FFCB 1.17 (CALLABLE) 1.17 1/13/2020 26,125,000.00 26,093,636.78 25,802,774.25
PSI NTRD FFCB 102806 FFCB 1.52 (CALLABLE) 1.52 10/25/2021 50,000,000.00 50,000,000.00 48,412,900.00
PSI NTRD FFCB 102809 FFCB 1.33 (CALLABLE) 1.33 10/26/2020 25,000,000.00 25,000,000.00 24,351,750.00
PSI NTRD FFCB 102814 FFCB 1.33 (CALLABLE) 1.33 10/26/2020 25,000,000.00 24,988,843.26 24,351,750.00
PSI NTRD FFCB 102831 FFCB 1.52 (CALLABLE) 1.52 10/25/2021 50,000,000.00 49,990,860.27 48,412,900.00
PSI NTRD FFCB 102832 FFCB 1.52 (CALLABLE) 1.52 10/25/2021 22,765,000.00 22,760,838.68 22,042,393.37
PSI NTRD FFCB 102850 FFCB 1.54 (CALLABLE) 1.54 10/12/2021 50,000,000.00 50,000,000.00 48,403,200.00
PSI NTRD FFCB 102851 FFCB 1.54 (CALLABLE) 1.54 10/12/2021 2,275,000.00 2,275,000.00 2,202,345.60
PSI NTRD FFCB 102926 FFCB 1.35 (CALLABLE) 1.35 11/2/2020 25,000,000.00 24,955,133.47 24,571,825.00
PSI NTRD FFCB 103109 FFCB 1.62 (CALLABLE) 1.62 6/14/2021 39,040,000.00 38,814,237.49 38,390,725.76
PSI NTRD FFCB 103115 FFCB 1.66 (CALLABLE) 1.66 5/25/2021 25,000,000.00 24,891,851.74 24,681,375.00
PSI NTRD FFCB 103182 FFCB 2.00 (CALLABLE) 2 12/6/2021 50,000,000.00 50,000,000.00 49,610,250.00
PSI NTRD FFCB 103222 FFCB 2.01 2.01 12/8/2021 50,000,000.00 50,000,000.00 49,997,000.00
PSI NTRD FFCB 103228 FFCB 1.65 (CALLABLE) 1.65 6/1/2020 50,000,000.00 49,977,295.92 49,823,050.00
PSI NTRD FFCB 103229 FFCB 1.65 (CALLABLE) 1.65 6/1/2020 16,000,000.00 15,992,734.69 15,943,376.00
PSI NTRD FFCB 103260 FFCB 2.00 (CALLABLE) 2 12/6/2021 15,000,000.00 15,000,000.00 14,883,075.00
PSI NTRD FFCB 103461 FFCB 2.32 (CALLABLE) 2.32 12/29/2021 10,000,000.00 10,000,000.00 10,003,080.00
PSI NTRD FFCB 103462 FFCB 2.32 (CALLABLE) 2.32 12/29/2021 10,110,000.00 10,110,000.00 10,113,113.88
PSI NTRD FFCB 103466 FFCB 2.35 (CALLABLE) 2.35 6/23/2021 39,350,000.00 39,350,000.00 39,350,275.45

Page 11
Los Angeles County TreasurerTreasurer Portfolio Compared to Market ValueFor the Period: March 1, 2017 to March 31, 2017Fund: Pooled Surplus InvestmentsAttachment X
Group Acct Sec Type SecID Description Face Rate Mat Date Par Amortized Cost Market ValuePSI NTRD FFCB 103482 FFCB 2.08 (CALLABLE) 2.08 12/20/2021 50,000,000.00 49,721,912.54 49,908,350.00
PSI NTRD FFCB 103483 FFCB 2.08 (CALLABLE) 2.08 12/20/2021 5,800,000.00 5,767,741.85 5,789,368.60
PSI NTRD FFCB 103485 FFCB 1.83 (CALLABLE) 1.83 12/14/2020 33,770,000.00 33,706,847.53 33,692,936.86
PSI NTRD FFCB 103496 FFCB 2.08 (CALLABLE) 2.08 12/20/2021 14,000,000.00 13,926,981.30 13,974,338.00
PSI NTRD FFCB 103559 FFCB 2.21 (CALLABLE) 2.21 1/11/2022 25,000,000.00 25,000,000.00 24,959,625.00
PSI NTRD FFCB 103562 FFCB 2.21 (CALLABLE) 2.21 1/11/2022 25,000,000.00 25,000,000.00 24,959,625.00
PSI NTRD FFCB 103659 FFCB 2.08 (CALLABLE) 2.08 1/24/2022 20,000,000.00 20,000,000.00 19,994,480.00
PSI NTRD FFCB 103660 FFCB 2.08 (CALLABLE) 2.08 1/24/2022 20,000,000.00 20,000,000.00 19,994,480.00
PSI NTRD FFCB 103661 FFCB 2.08 (CALLABLE) 2.08 1/24/2022 20,000,000.00 20,000,000.00 19,994,480.00
PSI NTRD FFCB 103721 FFCB 1.55 1.55 1/10/2020 41,980,000.00 41,974,093.29 41,961,780.68
PSI NTRD FFCB 103760 FFCB 1.67 (CALLABLE) 1.67 2/6/2020 18,000,000.00 18,000,000.00 17,974,044.00
PSI NTRD FFCB 103927 FFCB 1.71 (CALLABLE) 1.71 2/27/2020 25,000,000.00 25,000,000.00 25,000,200.00
PSI NTRD FFCB 103975 FFCB 2.28 (CALLABLE) 2.28 3/1/2022 25,000,000.00 25,000,000.00 24,991,700.00
PSI NTRD FFCB 103981 FFCB 2.28 (CALLABLE) 2.28 3/1/2022 25,000,000.00 25,000,000.00 24,991,700.00
PSI NTRD FFCB 104181 FFCB 2.27 (CALLABLE) 2.27 3/23/2022 30,000,000.00 30,000,000.00 29,999,940.00
PSI NTRD FFCB 104244 FFCB 2.18 (CALLABLE) 2.18 3/29/2022 40,000,000.00 40,000,000.00 39,903,720.00
FFCB Total 4,442,361,000.00 4,440,205,400.81 4,382,968,811.53
PSI NTRD FHLB 91731 FHLB 1.15 (CALLABLE) 1.15 12/11/2018 45,200,000.00 45,196,807.53 45,185,897.60
PSI NTRD FHLB 91806 FHLB 1.15 (CALLABLE) 1.15 12/11/2018 50,000,000.00 49,996,468.51 49,984,400.00
PSI NTRD FHLB 91821 FHLB 1.15 (CALLABLE) 1.15 12/11/2018 28,000,000.00 27,996,044.73 27,991,264.00
PSI NTRD FHLB 91914 FHLB 1.15 (CALLABLE) 1.15 12/21/2018 45,900,000.00 45,886,126.02 45,759,637.80
PSI NTRD FHLB 91915 FHLB 1.15 (CALLABLE) 1.15 12/21/2018 50,000,000.00 49,984,886.73 49,847,100.00
PSI NTRD FHLB 91933 FHLB 1.15 (CALLABLE) 1.15 12/21/2018 37,945,000.00 37,934,076.70 37,828,964.19
PSI NTRD FHLB 94411 FHLB 1.00 (CALLABLE) 1 8/22/2018 22,600,000.00 22,439,347.17 22,463,224.80
PSI NTRD FHLB 98523 FHLB 0.75 0.75 9/8/2017 50,000,000.00 50,000,000.00 49,954,750.00
PSI NTRD FHLB 98524 FHLB 0.75 0.75 9/8/2017 18,055,000.00 18,055,000.00 18,038,660.23
PSI NTRD FHLB 99488 FHLB 1.45 (CALLABLE) 1.45 10/2/2019 25,000,000.00 25,000,000.00 24,956,025.00
PSI NTRD FHLB 99751 FHLB 1.57 (CALLABLE) 1.57 4/29/2020 25,000,000.00 25,000,000.00 24,766,525.00
PSI NTRD FHLB 100765 FHLB 1.69 (CALLABLE) 1.69 2/26/2021 6,000,000.00 5,998,591.78 5,928,504.00
PSI NTRD FHLB 100766 FHLB 1.69 (CALLABLE) 1.69 2/26/2021 1,200,000.00 1,199,718.36 1,185,700.80
PSI NTRD FHLB 101232 FHLB 1.70 (CALLABLE) 1.7 4/26/2021 34,500,000.00 34,488,769.55 33,561,841.50
PSI NTRD FHLB 101261 FHLB 1.55 (CALLABLE) 1.55 10/26/2020 25,000,000.00 25,000,000.00 24,628,425.00
PSI NTRD FHLB 101316 FHLB 1.55 (CALLABLE) 1.55 10/26/2020 50,000,000.00 49,980,158.25 49,256,850.00
PSI NTRD FHLB 101329 FHLB 1.70 (CALLABLE) 1.7 4/26/2021 25,000,000.00 25,000,000.00 24,320,175.00
PSI NTRD FHLB 101892 FHLB 1.45 (CALLABLE) 1.45 6/15/2020 31,200,000.00 31,200,000.00 30,825,100.80
PSI NTRD FHLB 101994 FHLB 1.50 (CALLABLE) 1.5 6/30/2021 25,000,000.00 25,000,000.00 24,465,750.00
PSI NTRD FHLB 102008 FHLB 1.50 (CALLABLE) 1.5 6/30/2021 29,000,000.00 29,000,000.00 28,380,270.00
PSI NTRD FHLB 102013 FHLB 1.50 (CALLABLE) 1.5 6/30/2021 16,950,000.00 16,950,000.00 16,587,778.50

Page 12
Los Angeles County TreasurerTreasurer Portfolio Compared to Market ValueFor the Period: March 1, 2017 to March 31, 2017Fund: Pooled Surplus InvestmentsAttachment X
Group Acct Sec Type SecID Description Face Rate Mat Date Par Amortized Cost Market ValuePSI NTRD FHLB 102039 FHLB 1.625 (CALLABLE) 1.625 10/7/2021 50,000,000.00 50,000,000.00 48,964,550.00
PSI NTRD FHLB 102075 FHLB 1.44 (CALLABLE) 1.44 7/19/2021 29,695,000.00 29,688,617.04 28,595,572.32
PSI NTRD FHLB 102189 FHLB 1.50 (CALLABLE) 1.5 7/28/2021 24,000,000.00 24,000,000.00 23,416,200.00
PSI NTRD FHLB 102427 FHLB 1.55 (CALLABLE) 1.55 9/1/2021 25,000,000.00 24,977,902.52 24,374,050.00
PSI NTRD FHLB 102455 FHLB 1.56 (CALLABLE) 1.56 9/21/2021 25,000,000.00 25,000,000.00 24,582,825.00
PSI NTRD FHLB 102651 FHLB 1.47 (CALLABLE) 1.47 9/30/2021 41,500,000.00 41,500,000.00 40,137,638.00
PSI NTRD FHLB 102810 FHLB 1.55 (CALLABLE) 1.55 10/27/2021 50,000,000.00 50,000,000.00 48,830,450.00
PSI NTRD FHLB 102821 FHLB 1.55 (CALLABLE) 1.55 10/26/2021 17,500,000.00 17,500,000.00 17,068,030.00
PSI NTRD FHLB 102841 FHLB 1.375 (CALLABLE) 1.375 10/26/2020 25,000,000.00 25,000,000.00 24,474,275.00
PSI NTRD FHLB 102843 FHLB 1.375 (CALLABLE) 1.375 10/26/2020 25,000,000.00 25,000,000.00 24,474,275.00
PSI NTRD FHLB 103007 FHLB 1.625 (CALLABLE) 1.625 11/26/2021 50,000,000.00 50,000,000.00 49,252,200.00
PSI NTRD FHLB 103047 FHLB 1.82 (CALLABLE) 1.82 11/24/2021 50,000,000.00 50,000,000.00 49,263,150.00
PSI NTRD FHLB 103099 FHLB 2.00 (CALLABLE) 2 12/9/2021 25,000,000.00 25,000,000.00 24,785,075.00
PSI NTRD FHLB 103100 FHLB 2.00 (CALLABLE) 2 12/9/2021 25,000,000.00 25,000,000.00 24,785,975.00
PSI NTRD FHLB 103116 FHLB 2.00 (CALLABLE) 2 12/6/2021 25,000,000.00 25,000,000.00 24,838,700.00
PSI NTRD FHLB 103117 FHLB 2.02 (CALLABLE) 2.02 11/26/2021 25,000,000.00 25,000,000.00 24,809,100.00
PSI NTRD FHLB 103127 FHLB 2.02 (CALLABLE) 2.02 11/26/2021 25,000,000.00 25,000,000.00 24,809,100.00
PSI NTRD FHLB 103179 FHLB 2.00 (CALLABLE) 2 12/2/2021 24,200,000.00 24,200,000.00 24,102,183.60
PSI NTRD FHLB 103189 FHLB 2.00 (CALLABLE) 2 12/2/2021 15,000,000.00 15,000,000.00 14,939,370.00
PSI NTRD FHLB 103221 FHLB 2.01 (CALLABLE) 2.01 12/15/2021 25,000,000.00 25,000,000.00 24,850,150.00
PSI NTRD FHLB 103223 FHLB 1.875 1.875 11/29/2021 50,000,000.00 49,789,932.14 49,815,900.00
PSI NTRD FHLB 103224 FHLB 1.875 1.875 11/29/2021 50,000,000.00 49,789,932.14 49,815,900.00
PSI NTRD FHLB 103225 FHLB 1.875 1.875 11/29/2021 25,000,000.00 24,894,966.07 24,907,950.00
PSI NTRD FHLB 103226 FHLB 1.875 1.875 11/29/2021 50,000,000.00 49,859,642.86 49,815,900.00
PSI NTRD FHLB 103227 FHLB 1.875 1.875 11/29/2021 50,000,000.00 49,859,642.86 49,815,900.00
PSI NTRD FHLB 103279 FHLB 2.15 (CALLABLE) 2.15 12/23/2021 50,000,000.00 50,000,000.00 49,914,600.00
PSI NTRD FHLB 103326 FHLB 2.18 (CALLABLE) 2.18 12/27/2021 50,000,000.00 50,000,000.00 49,829,800.00
PSI NTRD FHLB 103406 FHLB 2.40 (CALLABLE) 2.4 12/22/2021 25,000,000.00 25,000,000.00 25,004,375.00
PSI NTRD FHLB 103424 FHLB 2.25 (CALLABLE) 2.25 12/27/2021 18,000,000.00 18,000,000.00 18,042,894.00
PSI NTRD FHLB 103738 FHLB 2.21 (CALLABLE) 2.21 2/15/2022 25,000,000.00 25,000,000.00 24,839,675.00
PSI NTRD FHLB 103961 FHLB 2.25 (CALLABLE) 2.25 2/28/2022 18,400,000.00 18,400,000.00 18,424,288.00
PSI NTRD FHLB 104027 FHLB 2.25 (CALLABLE) 2.25 2/1/2022 20,000,000.00 19,990,166.94 19,999,020.00
PSI NTRD FHLB 104052 FHLB 2.22 (CALLABLE) 2.22 3/8/2022 25,000,000.00 25,000,000.00 25,025,725.00
PSI NTRD FHLB 104064 FHLB 2.00 (CALLABLE) 2 9/29/2020 25,000,000.00 25,000,000.00 25,008,575.00
PSI NTRD FHLB 104233 FHLB 2.20 (CALLABLE) 2.2 3/29/2022 13,500,000.00 13,500,000.00 13,472,122.50
FHLB Total 1,738,345,000.00 1,737,256,797.90 1,721,002,337.64
PSI NTRD FHLD 104055 FHLB D/N 1 3/1/2018 30,000,000.00 29,721,666.67 29,723,340.00
PSI NTRD FHLD 104254 FHLB D/N 1.07 3/26/2018 10,000,000.00 9,893,297.22 9,900,830.00

Page 13
Los Angeles County TreasurerTreasurer Portfolio Compared to Market ValueFor the Period: March 1, 2017 to March 31, 2017Fund: Pooled Surplus InvestmentsAttachment X
Group Acct Sec Type SecID Description Face Rate Mat Date Par Amortized Cost Market ValuePSI NTRD FHLD 104316 FHLB D/N 1.08 3/26/2018 15,000,000.00 14,838,450.00 14,851,245.00
FHLD Total 55,000,000.00 54,453,413.89 54,475,415.00
PSI NTRD FHLM 90963 FHLMC 1.10 (CALLABLE) 1.1 2/28/2018 10,740,000.00 10,740,000.00 10,747,603.92
PSI NTRD FHLM 91635 FHLMC 1.00 (CALLABLE) 1 11/28/2017 50,000,000.00 50,000,000.00 50,005,400.00
PSI NTRD FHLM 91636 FHLMC 1.00 (CALLABLE) 1 11/28/2017 50,000,000.00 50,000,000.00 50,005,400.00
PSI NTRD FHLM 91637 FHLMC 1.00 (CALLABLE) 1 11/28/2017 50,000,000.00 50,000,000.00 50,005,400.00
PSI NTRD FHLM 99533 FHLMC 1.250 1.25 10/2/2019 50,000,000.00 49,866,456.18 49,721,150.00
PSI NTRD FHLM 99534 FHLMC 1.25 1.25 10/2/2019 50,000,000.00 49,866,456.18 49,721,150.00
PSI NTRD FHLM 99543 FHLMC 1.25 1.25 10/2/2019 50,000,000.00 49,915,774.74 49,721,150.00
PSI NTRD FHLM 99544 FHLMC 1.25 1.25 10/2/2019 50,000,000.00 49,915,774.74 49,721,150.00
PSI NTRD FHLM 99758 FHLMC 1.250 1.25 10/2/2019 50,000,000.00 49,938,939.46 49,721,150.00
PSI NTRD FHLM 99759 FHLMC 1.250 1.25 10/2/2019 50,000,000.00 49,938,939.46 49,721,150.00
PSI NTRD FHLM 100130 FHLMC 1.25 (CALLABLE) 1.25 8/1/2019 50,000,000.00 49,694,481.62 49,816,100.00
PSI NTRD FHLM 100154 FHLMC 1.25 (CALLABLE) 1.25 8/1/2019 50,000,000.00 49,694,481.62 49,816,100.00
PSI NTRD FHLM 100266 FHLMC 1.25 1.25 10/2/2019 45,000,000.00 44,618,917.35 44,749,035.00
PSI NTRD FHLM 100383 FHLMC 1.25 1.25 10/2/2019 50,000,000.00 49,600,666.67 49,721,150.00
PSI NTRD FHLM 100513 FHLMC 1.50 (CALLABLE) 1.5 2/10/2020 25,000,000.00 25,000,000.00 24,938,150.00
PSI NTRD FHLM 100531 FHLMC 1.52 (CALLABLE) 1.52 1/27/2020 25,000,000.00 25,000,000.00 24,923,900.00
PSI NTRD FHLM 100532 FHLMC 1.52 (CALLABLE) 1.52 1/27/2020 25,000,000.00 25,000,000.00 24,883,600.00
PSI NTRD FHLM 101088 FHLMC 1.375 (CALLABLE) 1.375 6/28/2019 49,750,000.00 49,750,000.00 49,264,987.25
PSI NTRD FHLM 101157 FHLMC 1.55 (CALLABLE) 1.55 10/13/2020 50,000,000.00 49,990,189.97 48,956,450.00
PSI NTRD FHLM 101176 FHLMC 1.40 (CALLABLE) 1.4 4/6/2020 50,000,000.00 50,000,000.00 49,330,650.00
PSI NTRD FHLM 101229 FHLMC 1.525 (CALLABLE) 1.525 10/7/2020 50,000,000.00 50,000,000.00 48,939,350.00
PSI NTRD FHLM 101510 FHLMC 1.50 (CALLABLE) 1.5 5/18/2020 25,000,000.00 25,000,000.00 24,965,675.00
PSI NTRD FHLM 101528 FHLMC 1.35 (CALLABLE) 1.35 5/26/2020 18,000,000.00 18,000,000.00 17,694,972.00
PSI NTRD FHLM 101574 FHLMC 1.46 (CALLABLE) 1.46 8/25/2020 25,000,000.00 24,994,198.13 24,530,775.00
PSI NTRD FHLM 101575 FHLMC 1.45 (CALLABLE) 1.45 5/28/2020 25,000,000.00 25,000,000.00 24,580,925.00
PSI NTRD FHLM 101581 FHLMC 1.50 (CALLABLE) 1.5 8/28/2020 25,000,000.00 25,000,000.00 24,513,100.00
PSI NTRD FHLM 101586 FHLMC 1.45 (CALLABLE) 1.45 5/22/2020 25,000,000.00 25,000,000.00 24,575,600.00
PSI NTRD FHLM 101588 FHLMC 1.50 (CALLABLE) 1.5 8/28/2020 10,000,000.00 10,000,000.00 9,805,240.00
PSI NTRD FHLM 101601 FHLMC 1.45 (CALLABLE) 1.45 5/22/2020 25,000,000.00 25,000,000.00 24,668,250.00
PSI NTRD FHLM 101641 FHLMC 1.70 (CALLABLE) 1.7 12/2/2020 25,000,000.00 25,000,000.00 24,583,750.00
PSI NTRD FHLM 101921 FHLMC 1.47 (CALLABLE) 1.47 6/29/2020 25,000,000.00 25,000,000.00 24,466,325.00
PSI NTRD FHLM 102001 FHLMC 1.33 (CALLABLE) 1.33 12/30/2020 50,000,000.00 50,000,000.00 48,686,400.00
PSI NTRD FHLM 102002 FHLMC 1.33 (CALLABLE) 1.33 12/30/2020 50,000,000.00 50,000,000.00 48,686,400.00
PSI NTRD FHLM 102006 FHLMC 1.33 (CALLABLE) 1.33 12/30/2020 25,000,000.00 25,000,000.00 24,343,200.00
PSI NTRD FHLM 102007 FHLMC 1.33 (CALLABLE) 1.33 12/30/2020 50,000,000.00 50,000,000.00 48,686,400.00
PSI NTRD FHLM 102011 FHLMC 1.33 (CALLABLE) 1.33 12/30/2020 50,000,000.00 50,000,000.00 48,693,350.00

Page 14
Los Angeles County TreasurerTreasurer Portfolio Compared to Market ValueFor the Period: March 1, 2017 to March 31, 2017Fund: Pooled Surplus InvestmentsAttachment X
Group Acct Sec Type SecID Description Face Rate Mat Date Par Amortized Cost Market ValuePSI NTRD FHLM 102012 FHLMC 1.28 (CALLABLE) 1.28 9/30/2020 50,000,000.00 50,000,000.00 48,516,700.00
PSI NTRD FHLM 102014 FHLMC 1.32 (CALLABLE) 1.32 9/30/2020 50,000,000.00 50,000,000.00 48,371,500.00
PSI NTRD FHLM 102015 FHLMC 1.33 (CALLABLE) 1.33 12/30/2020 50,000,000.00 50,000,000.00 48,686,400.00
PSI NTRD FHLM 102016 FHLMC 1.33 (CALLABLE) 1.33 12/30/2020 50,000,000.00 50,000,000.00 48,686,400.00
PSI NTRD FHLM 102291 FHLMC 1.45 (CALLABLE) 1.45 5/26/2021 50,000,000.00 50,000,000.00 48,392,950.00
PSI NTRD FHLM 102429 FHLMC 1.41 (CALLABLE) 1.41 2/24/2021 50,000,000.00 50,000,000.00 48,680,800.00
PSI NTRD FHLM 102432 FHLMC 1.62 (CALLABLE) 1.62 9/16/2021 25,000,000.00 25,000,000.00 24,257,125.00
PSI NTRD FHLM 102433 FHLMC 1.46 (CALLABLE) 1.46 9/14/2020 25,000,000.00 25,000,000.00 24,409,300.00
PSI NTRD FHLM 102448 FHLMC 1.43 (CALLABLE) 1.43 9/21/2020 25,000,000.00 25,000,000.00 24,364,750.00
PSI NTRD FHLM 102449 FHLMC 1.45 (CALLABLE) 1.45 9/14/2020 25,000,000.00 25,000,000.00 24,371,350.00
PSI NTRD FHLM 102458 FHLMC 1.625 (CALLABLE) 1.625 9/23/2021 25,000,000.00 25,000,000.00 24,201,025.00
PSI NTRD FHLM 102474 FHLMC 1.625 (CALLABLE) 1.625 9/23/2021 25,000,000.00 25,000,000.00 24,226,975.00
PSI NTRD FHLM 102625 FHLMC 1.50 (CALLABLE) 1.5 9/28/2021 50,000,000.00 50,000,000.00 48,323,550.00
PSI NTRD FHLM 102627 FHLMC 1.50 (CALLABLE) 1.5 9/28/2021 50,000,000.00 50,000,000.00 48,318,550.00
PSI NTRD FHLM 102628 FHLMC 1.50 (CALLABLE) 1.5 9/28/2021 50,000,000.00 50,000,000.00 48,269,500.00
PSI NTRD FHLM 102629 FHLMC 1.50 (CALLABLE) 1.5 9/28/2021 50,000,000.00 50,000,000.00 48,321,900.00
PSI NTRD FHLM 102630 FHLMC 1.50 (CALLABLE) 1.5 9/28/2021 50,000,000.00 50,000,000.00 48,267,900.00
PSI NTRD FHLM 102631 FHLMC 1.50 (CALLABLE) 1.5 9/28/2021 50,000,000.00 50,000,000.00 48,312,850.00
PSI NTRD FHLM 102700 FHLMC 1.56 (CALLABLE) 1.56 10/21/2021 50,000,000.00 50,000,000.00 48,485,650.00
PSI NTRD FHLM 102706 FHLMC 1.60 (CALLABLE) 1.6 10/27/2021 50,000,000.00 50,000,000.00 48,567,450.00
PSI NTRD FHLM 102711 FHLMC 1.61 (CALLABLE) 1.61 10/27/2021 25,000,000.00 25,000,000.00 24,263,550.00
PSI NTRD FHLM 102860 FHLMC 1.56 (CALLABLE) 1.56 10/27/2021 50,000,000.00 50,000,000.00 48,657,800.00
PSI NTRD FHLM 103009 FHLMC 1.625 (CALLABLE) 1.625 11/26/2021 50,000,000.00 50,000,000.00 48,826,600.00
PSI NTRD FHLM 103041 FHLMC 1.95 (CALLABLE) 1.95 12/6/2021 25,000,000.00 25,000,000.00 24,697,375.00
PSI NTRD FHLM 103043 FHLMC 1.93 (CALLABLE) 1.93 12/2/2021 25,000,000.00 25,000,000.00 24,669,825.00
PSI NTRD FHLM 103045 FHLMC 1.82 (CALLABLE) 1.82 12/1/2021 25,000,000.00 24,994,160.96 24,563,875.00
PSI NTRD FHLM 103053 FHLMC 1.95 (CALLABLE) 1.95 12/2/2021 25,000,000.00 25,000,000.00 24,721,700.00
PSI NTRD FHLM 103371 FHLMC 2.27 (CALLABLE) 2.27 12/30/2021 50,000,000.00 50,000,000.00 49,932,150.00
PSI NTRD FHLM 103372 FHLMC 2.20 (CALLABLE) 2.2 12/28/2021 50,000,000.00 50,000,000.00 50,002,100.00
PSI NTRD FHLM 103442 FHLMC 2.30 (CALLABLE) 2.3 12/30/2021 50,000,000.00 50,000,000.00 49,977,950.00
PSI NTRD FHLM 103471 FHLMC 2.35 (CALLABLE) 2.35 1/12/2022 25,000,000.00 25,000,000.00 25,000,850.00
PSI NTRD FHLM 103484 FHLMC 2.35 (CALLABLE) 2.35 1/19/2022 25,000,000.00 25,000,000.00 25,000,900.00
PSI NTRD FHLM 103486 FHLMC 2.33 (CALLABLE) 2.33 12/28/2021 50,000,000.00 50,000,000.00 50,001,200.00
PSI NTRD FHLM 103487 FHLMC 2.30 (CALLABLE) 2.3 12/28/2021 50,000,000.00 50,000,000.00 50,000,550.00
PSI NTRD FHLM 103489 FHLMC 1.55 (CALLABLE) 1.55 12/23/2019 50,000,000.00 49,931,467.89 49,880,250.00
PSI NTRD FHLM 103490 FHLMC 1.55 (CALLABLE) 1.55 12/23/2019 12,000,000.00 11,983,552.29 11,971,260.00
PSI NTRD FHLM 103598 FHLMC 2.20 (CALLABLE) 2.2 1/26/2022 22,520,000.00 22,520,000.00 22,470,703.72
PSI NTRD FHLM 103607 FHLMC 2.20 (CALLABLE) 2.2 1/27/2022 25,000,000.00 25,000,000.00 24,995,175.00
PSI NTRD FHLM 103665 FHLMC 2.15 (CALLABLE) 2.15 1/26/2022 25,000,000.00 25,000,000.00 25,009,975.00

Page 15
Los Angeles County TreasurerTreasurer Portfolio Compared to Market ValueFor the Period: March 1, 2017 to March 31, 2017Fund: Pooled Surplus InvestmentsAttachment X
Group Acct Sec Type SecID Description Face Rate Mat Date Par Amortized Cost Market ValuePSI NTRD FHLM 103680 FHLMC 2.30 (CALLABLE) 2.3 1/27/2022 25,000,000.00 25,000,000.00 25,003,375.00
PSI NTRD FHLM 103682 FHLMC 2.30 (CALLABLE) 2.3 1/27/2022 25,000,000.00 25,000,000.00 25,003,250.00
PSI NTRD FHLM 103693 FHLMC 2.29 (CALLABLE) 2.29 1/27/2022 25,000,000.00 25,000,000.00 25,003,250.00
PSI NTRD FHLM 103736 FHLMC 2.21 (CALLABLE) 2.21 2/14/2022 25,000,000.00 25,000,000.00 25,010,625.00
PSI NTRD FHLM 103737 FHLMC 2.30 (CALLABLE) 2.3 2/14/2022 25,000,000.00 25,000,000.00 25,004,100.00
PSI NTRD FHLM 103739 FHLMC 2.30 (CALLABLE) 2.3 2/15/2022 25,000,000.00 25,000,000.00 25,004,000.00
PSI NTRD FHLM 103749 FHLMC 2.32 (CALLABLE) 2.32 2/16/2022 25,000,000.00 25,000,000.00 24,978,125.00
PSI NTRD FHLM 103751 FHLMC 2.32 (CALLABLE) 2.32 2/16/2022 25,000,000.00 25,000,000.00 24,968,750.00
PSI NTRD FHLM 103755 FHLMC 2.29 (CALLABLE) 2.29 1/27/2022 25,000,000.00 25,000,000.00 25,013,500.00
PSI NTRD FHLM 103756 FHLMC 2.32 (CALLABLE) 2.32 2/16/2022 25,000,000.00 25,000,000.00 24,977,150.00
PSI NTRD FHLM 103764 FHLMC 1.70 (CALLABLE) 1.7 2/10/2020 25,000,000.00 25,000,000.00 24,967,925.00
PSI NTRD FHLM 103870 FHLMC 2.20 (CALLABLE) 2.2 1/28/2022 5,450,000.00 5,448,675.81 5,445,204.00
PSI NTRD FHLM 104039 FHLMC 2.40 (CALLABLE) 2.4 3/22/2022 25,000,000.00 25,000,000.00 25,005,275.00
PSI NTRD FHLM 104040 FHLMC 2.40 (CALLABLE) 2.4 3/22/2022 25,000,000.00 25,000,000.00 25,005,450.00
PSI NTRD FHLM 104041 FHLMC 2.40 (CALLABLE) 2.4 3/22/2022 25,000,000.00 25,000,000.00 25,004,850.00
PSI NTRD FHLM 104050 FHLMC 2.32 (CALLABLE) 2.32 3/28/2022 25,000,000.00 25,000,000.00 25,015,275.00
PSI NTRD FHLM 104051 FHLMC 2.32 (CALLABLE) 2.32 3/28/2022 25,000,000.00 25,000,000.00 25,015,050.00
PSI NTRD FHLM 104056 FHLMC 2.33 (CALLABLE) 2.33 3/28/2022 25,000,000.00 25,000,000.00 25,014,850.00
PSI NTRD FHLM 104247 FHLMC 2.25 (CALLABLE) 2.25 2/28/2022 16,615,000.00 16,615,000.00 16,587,552.02
PSI NTRD FHLM 104251 FHLMC 2.215 (CALLABLE) 2.215 3/29/2022 50,000,000.00 50,000,000.00 49,998,050.00
FHLM Total 3,390,075,000.00 3,388,018,133.07 3,343,612,557.91
PSI NTRD FHLMD 103997 FHLMC D/N 0.82 2/16/2018 50,000,000.00 49,633,277.78 49,565,800.00
PSI NTRD FHLMD 103998 FHLMC D/N 0.82 2/16/2018 50,000,000.00 49,633,277.78 49,565,800.00
PSI NTRD FHLMD 104000 FHLMC D/N 0.82 2/20/2018 50,000,000.00 49,628,722.23 49,560,350.00
PSI NTRD FHLMD 104001 FHLMC D/N 0.82 2/20/2018 50,000,000.00 49,628,722.23 49,560,350.00
PSI NTRD FHLMD 104004 FHLMC D/N 0.8 1/2/2018 50,000,000.00 49,692,222.22 49,634,650.00
PSI NTRD FHLMD 104005 FHLMC D/N 0.8 1/2/2018 50,000,000.00 49,692,222.22 49,634,650.00
PSI NTRD FHLMD 104015 FHLMC D/N 0.84 2/21/2018 50,000,000.00 49,618,500.00 49,559,000.00
PSI NTRD FHLMD 104016 FHLMC D/N 0.84 2/21/2018 50,000,000.00 49,618,500.00 49,559,000.00
PSI NTRD FHLMD 104248 FHLMC D/N 0.9 9/26/2017 50,000,000.00 49,776,250.00 49,792,200.00
PSI NTRD FHLMD 104249 FHLMC D/N 0.9 9/26/2017 5,000,000.00 4,977,625.00 4,979,220.00
FHLMD Total 455,000,000.00 451,899,319.46 451,411,020.00
PSI NTRD FNMA 91353 FNMA 1.05 (CALLABLE) 1.05 4/30/2018 14,800,000.00 14,798,911.01 14,752,669.60
PSI NTRD FNMA 91733 FNMA 1.10 (CALLABLE) 1.1 12/12/2018 50,000,000.00 50,000,000.00 49,897,650.00
PSI NTRD FNMA 91808 FNMA 1.15 (CALLABLE) 1.15 12/13/2018 50,000,000.00 50,000,000.00 49,764,550.00
PSI NTRD FNMA 91822 FNMA 1.20 (CALLABLE) 1.2 12/20/2018 20,900,000.00 20,894,009.49 20,820,099.30
PSI NTRD FNMA 91895 FNMA 1.17 (CALLABLE) 1.17 12/14/2018 50,000,000.00 50,000,000.00 49,903,400.00

Page 16
Los Angeles County TreasurerTreasurer Portfolio Compared to Market ValueFor the Period: March 1, 2017 to March 31, 2017Fund: Pooled Surplus InvestmentsAttachment X
Group Acct Sec Type SecID Description Face Rate Mat Date Par Amortized Cost Market ValuePSI NTRD FNMA 91896 FNMA 1.20 (CALLABLE) 1.2 12/28/2018 50,000,000.00 50,000,000.00 49,894,800.00
PSI NTRD FNMA 91916 FNMA 1.20 (CALLABLE) 1.2 12/27/2018 50,000,000.00 50,000,000.00 49,811,000.00
PSI NTRD FNMA 91927 FNMA 1.15 (CALLABLE) 1.15 12/27/2018 50,000,000.00 50,000,000.00 49,814,300.00
PSI NTRD FNMA 91932 FNMA 1.17 (CALLABLE) 1.17 12/27/2018 50,000,000.00 50,000,000.00 49,744,450.00
PSI NTRD FNMA 91949 FNMA 1.20 (CALLABLE) 1.2 12/27/2018 50,000,000.00 50,000,000.00 49,825,500.00
PSI NTRD FNMA 91952 FNMA 1.20 (CALLABLE) 1.2 12/27/2018 15,000,000.00 15,000,000.00 14,947,650.00
PSI NTRD FNMA 92036 FNMA 1.22 (CALLABLE) 1.22 12/27/2018 50,000,000.00 50,000,000.00 49,897,650.00
PSI NTRD FNMA 92154 FNMA 1.20 (CALLABLE) 1.2 12/28/2018 36,600,000.00 36,597,336.66 36,402,030.60
PSI NTRD FNMA 93086 FNMA 1.15 (CALLABLE) 1.15 10/30/2018 25,000,000.00 25,000,000.00 24,918,275.00
PSI NTRD FNMA 93103 FNMA 1.15 (CALLABLE) 1.15 10/30/2018 25,000,000.00 25,000,000.00 24,918,275.00
PSI NTRD FNMA 93161 FNMA 1.15 (CALLABLE) 1.15 11/28/2018 25,000,000.00 25,000,000.00 24,935,900.00
PSI NTRD FNMA 93226 FNMA 1.15 (CALLABLE) 1.15 11/16/2018 25,000,000.00 24,988,450.41 24,892,600.00
PSI NTRD FNMA 94399 FNMA 1.05 (CALLABLE) 1.05 5/25/2018 50,000,000.00 49,786,608.75 49,896,700.00
PSI NTRD FNMA 94400 FNMA 1.05 (CALLABLE) 1.05 5/25/2018 30,400,000.00 30,270,258.12 30,337,193.60
PSI NTRD FNMA 94792 FNMA 1.00 (CALLABLE) 1 4/30/2018 25,000,000.00 24,879,788.29 24,955,200.00
PSI NTRD FNMA 94799 FNMA 1.625 1.625 11/27/2018 50,000,000.00 50,000,000.00 50,305,900.00
PSI NTRD FNMA 94800 FNMA 1.625 1.625 11/27/2018 50,000,000.00 50,000,000.00 50,305,900.00
PSI NTRD FNMA 94801 FNMA 1.625 1.625 11/27/2018 50,000,000.00 50,000,000.00 50,305,900.00
PSI NTRD FNMA 94990 FNMA 1.625 1.625 11/27/2018 50,000,000.00 49,861,803.31 50,305,900.00
PSI NTRD FNMA 99598 FNMA 1.35 (CALLABLE) 1.35 10/28/2019 25,000,000.00 25,000,000.00 24,727,950.00
PSI NTRD FNMA 100029 FNMA 1.30 (CALLABLE) 1.3 4/29/2019 31,345,000.00 31,282,073.53 31,295,757.01
PSI NTRD FNMA 100387 FNMA 1.16 (CALLABLE) 1.16 11/16/2018 50,000,000.00 49,830,447.19 49,683,100.00
PSI NTRD FNMA 100388 FNMA 1.16 (CALLABLE) 1.16 11/16/2018 50,000,000.00 49,830,447.19 49,683,100.00
PSI NTRD FNMA 100389 FNMA 1.16 (CALLABLE) 1.16 11/16/2018 40,110,000.00 39,973,984.74 39,855,782.82
PSI NTRD FNMA 100654 FNMA 1.50 (CALLABLE) 1.5 8/17/2020 25,000,000.00 25,000,000.00 24,315,625.00
PSI NTRD FNMA 100670 FNMA 1.40 (CALLABLE) 1.4 5/22/2020 25,000,000.00 25,000,000.00 24,596,050.00
PSI NTRD FNMA 100746 FNMA 1.73 1.73 3/15/2021 25,000,000.00 25,000,000.00 24,500,900.00
PSI NTRD FNMA 100770 FNMA 1.40 (CALLABLE) 1.4 11/26/2019 25,000,000.00 25,000,000.00 24,791,075.00
PSI NTRD FNMA 100824 FNMA 1.40 (CALLABLE) 1.4 11/26/2019 31,120,000.00 31,114,477.05 30,859,930.16
PSI NTRD FNMA 100852 FNMA 1.31 (CALLABLE) 1.31 3/15/2019 25,000,000.00 25,000,000.00 24,796,225.00
PSI NTRD FNMA 100976 FNMA 1.250 (CALLABLE) 1.25 2/26/2019 50,000,000.00 49,967,507.00 49,829,300.00
PSI NTRD FNMA 101336 FNMA 1.45 (CALLABLE) 1.45 4/27/2020 50,000,000.00 50,000,000.00 49,350,950.00
PSI NTRD FNMA 101538 FNMA 1.30 (CALLABLE) 1.3 11/25/2019 25,000,000.00 25,000,000.00 24,787,500.00
PSI NTRD FNMA 101584 FNMA 1.50 (CALLABLE) 1.5 8/28/2020 25,000,000.00 25,000,000.00 24,484,925.00
PSI NTRD FNMA 101587 FNMA 1.65 (CALLABLE) 1.65 4/28/2021 25,000,000.00 24,995,884.96 24,688,950.00
PSI NTRD FNMA 101612 FNMA 1.51 (CALLABLE) 1.51 6/8/2020 25,000,000.00 25,000,000.00 24,560,875.00
PSI NTRD FNMA 101620 FNMA 1.71 (CALLABLE) 1.71 6/2/2021 25,000,000.00 25,000,000.00 24,453,725.00
PSI NTRD FNMA 101633 FNMA 1.625 (CALLABLE) 1.625 9/2/2020 25,000,000.00 25,000,000.00 24,579,450.00
PSI NTRD FNMA 101686 FNMA 1.70 (CALLABLE) 1.7 12/7/2020 25,000,000.00 25,000,000.00 24,410,125.00

Page 17
Los Angeles County TreasurerTreasurer Portfolio Compared to Market ValueFor the Period: March 1, 2017 to March 31, 2017Fund: Pooled Surplus InvestmentsAttachment X
Group Acct Sec Type SecID Description Face Rate Mat Date Par Amortized Cost Market ValuePSI NTRD FNMA 101928 FNMA 1.45 (CALLABLE) 1.45 6/30/2020 50,000,000.00 50,000,000.00 48,879,050.00
PSI NTRD FNMA 101942 FNMA 1.46 (CALLABLE) 1.46 9/30/2020 25,000,000.00 25,000,000.00 24,419,075.00
PSI NTRD FNMA 101952 FNMA 1.53 (CALLABLE) 1.53 12/29/2020 50,000,000.00 50,000,000.00 48,503,850.00
PSI NTRD FNMA 101953 FNMA 1.48 (CALLABLE) 1.48 6/29/2020 25,000,000.00 25,000,000.00 24,344,000.00
PSI NTRD FNMA 101954 FNMA 1.48 (CALLABLE) 1.48 6/29/2020 25,000,000.00 25,000,000.00 24,344,000.00
PSI NTRD FNMA 101956 FNMA 1.50 (CALLABLE) 1.5 9/29/2020 50,000,000.00 50,000,000.00 48,611,250.00
PSI NTRD FNMA 101959 FNMA 1.50 (CALLABLE) 1.5 9/29/2020 25,000,000.00 25,000,000.00 24,306,300.00
PSI NTRD FNMA 101970 FNMA 1.625 (CALLABLE) 1.625 6/30/2021 5,000,000.00 5,000,000.00 4,849,010.00
PSI NTRD FNMA 102082 FNMA 1.50 (CALLABLE) 1.5 7/27/2021 50,000,000.00 50,000,000.00 48,812,200.00
PSI NTRD FNMA 102101 FNMA 1.45 (CALLABLE) 1.45 1/27/2021 25,000,000.00 25,000,000.00 24,180,775.00
PSI NTRD FNMA 102104 FNMA 1.53 (CALLABLE) 1.53 7/27/2021 25,000,000.00 25,000,000.00 24,083,525.00
PSI NTRD FNMA 102105 FNMA 1.48 (CALLABLE) 1.48 4/27/2021 25,000,000.00 25,000,000.00 24,133,775.00
PSI NTRD FNMA 102106 FNMA 1.53 (CALLABLE) 1.53 7/27/2021 50,000,000.00 50,000,000.00 48,167,050.00
PSI NTRD FNMA 102110 FNMA 1.53 (CALLABLE) 1.53 7/27/2021 25,000,000.00 25,000,000.00 24,084,325.00
PSI NTRD FNMA 102111 FNMA 1.48 (CALLABLE) 1.48 4/27/2021 25,000,000.00 25,000,000.00 24,131,375.00
PSI NTRD FNMA 102112 FNMA 1.50 (CALLABLE) 1.5 4/27/2021 25,000,000.00 25,000,000.00 24,132,500.00
PSI NTRD FNMA 102126 FNMA 1.55 (CALLABLE) 1.55 7/27/2021 25,000,000.00 25,000,000.00 24,300,175.00
PSI NTRD FNMA 102135 FNMA 1.58 (CALLABLE) 1.58 7/27/2021 25,000,000.00 25,000,000.00 24,138,500.00
PSI NTRD FNMA 102141 FNMA 1.60 (CALLABLE) 1.6 7/27/2021 25,000,000.00 25,000,000.00 24,122,275.00
PSI NTRD FNMA 102146 FNMA 1.57 (CALLABLE) 1.57 7/27/2021 25,000,000.00 25,000,000.00 24,124,550.00
PSI NTRD FNMA 102178 FNMA 1.625 (CALLABLE) 1.625 7/27/2021 25,000,000.00 25,000,000.00 24,119,950.00
PSI NTRD FNMA 102190 FNMA 1.40 (CALLABLE) 1.4 5/8/2020 25,000,000.00 25,000,000.00 24,529,575.00
PSI NTRD FNMA 102197 FNMA 1.55 (CALLABLE) 1.55 7/27/2021 25,000,000.00 25,000,000.00 24,476,900.00
PSI NTRD FNMA 102198 FNMA 1.55 (CALLABLE) 1.55 7/27/2021 25,000,000.00 24,991,358.16 24,476,900.00
PSI NTRD FNMA 102200 FNMA 1.55 (CALLABLE) 1.55 7/28/2021 25,000,000.00 25,000,000.00 24,260,675.00
PSI NTRD FNMA 102202 FNMA 1.60 (CALLABLE) 1.6 7/27/2021 25,000,000.00 25,000,000.00 24,178,400.00
PSI NTRD FNMA 102282 FNMA 1.50 (CALLABLE) 1.5 8/25/2021 50,000,000.00 50,000,000.00 48,122,350.00
PSI NTRD FNMA 102292 FNMA 1.55 (CALLABLE) 1.55 8/17/2021 46,212,000.00 46,201,883.22 44,886,177.72
PSI NTRD FNMA 102333 FNMA 1.60 (CALLABLE) 1.6 8/24/2021 25,000,000.00 25,000,000.00 24,453,200.00
PSI NTRD FNMA 102537 FNMA 1.625 (CALLABLE) 1.625 9/30/2021 25,000,000.00 25,000,000.00 24,217,100.00
PSI NTRD FNMA 102573 FNMA 1.45 (CALLABLE) 1.45 9/15/2020 25,000,000.00 25,000,000.00 24,673,525.00
PSI NTRD FNMA 102603 FNMA 1.55 (CALLABLE) 1.55 9/28/2021 25,000,000.00 25,000,000.00 24,147,325.00
PSI NTRD FNMA 102604 FNMA 1.55 (CALLABLE) 1.55 9/28/2021 50,000,000.00 50,000,000.00 48,365,900.00
PSI NTRD FNMA 102626 FNMA 1.50 (CALLABLE) 1.5 9/29/2021 50,000,000.00 50,000,000.00 48,215,000.00
PSI NTRD FNMA 102648 FNMA 1.50 (CALLABLE) 1.5 9/30/2021 35,000,000.00 34,996,850.77 34,052,480.00
PSI NTRD FNMA 102650 FNMA 1.51 (CALLABLE) 1.51 9/30/2021 50,000,000.00 50,000,000.00 48,474,650.00
PSI NTRD FNMA 102652 FNMA 1.51 (CALLABLE) 1.51 9/30/2021 50,000,000.00 50,000,000.00 48,227,350.00
PSI NTRD FNMA 102664 FNMA 1.125 (CALLABLE) 1.125 9/9/2019 50,000,000.00 49,976,814.13 49,253,600.00
PSI NTRD FNMA 102669 FNMA 1.52 (CALLABLE) 1.52 10/12/2021 25,000,000.00 25,000,000.00 24,136,825.00

Page 18
Los Angeles County TreasurerTreasurer Portfolio Compared to Market ValueFor the Period: March 1, 2017 to March 31, 2017Fund: Pooled Surplus InvestmentsAttachment X
Group Acct Sec Type SecID Description Face Rate Mat Date Par Amortized Cost Market ValuePSI NTRD FNMA 102847 FNMA 1.51 (CALLABLE) 1.51 9/30/2021 50,000,000.00 49,989,040.58 48,474,650.00
PSI NTRD FNMA 102848 FNMA 1.51 (CALLABLE) 1.51 9/30/2021 50,000,000.00 49,989,040.58 48,474,650.00
PSI NTRD FNMA 102849 FNMA 1.51 (CALLABLE) 1.51 9/30/2021 14,070,000.00 14,066,916.02 13,640,766.51
PSI NTRD FNMA 102854 FNMA 1.53 (CALLABLE) 1.53 10/27/2021 50,000,000.00 49,990,854.33 48,619,350.00
PSI NTRD FNMA 102856 FNMA 1.56 (CALLABLE) 1.56 10/27/2021 50,000,000.00 50,000,000.00 48,644,750.00
PSI NTRD FNMA 102857 FNMA 1.56 (CALLABLE) 1.56 10/27/2021 50,000,000.00 50,000,000.00 48,644,750.00
PSI NTRD FNMA 103027 FNMA 1.85 (CALLABLE) 1.85 11/26/2021 50,000,000.00 50,000,000.00 49,072,600.00
PSI NTRD FNMA 103029 FNMA 1.85 (CALLABLE) 1.85 11/26/2021 25,000,000.00 25,000,000.00 24,653,350.00
PSI NTRD FNMA 103040 FNMA 1.95 (CALLABLE) 1.95 12/1/2021 25,000,000.00 25,000,000.00 24,708,225.00
PSI NTRD FNMA 103230 FNMA 1.20 (CALLABLE) 1.2 10/28/2019 50,000,000.00 49,675,402.08 49,494,850.00
PSI NTRD FNMA 103231 FNMA 1.20 (CALLABLE) 1.2 10/28/2019 50,000,000.00 49,675,402.08 49,494,850.00
PSI NTRD FNMA 103232 FNMA 1.20 (CALLABLE) 1.2 10/28/2019 10,451,000.00 10,383,152.54 10,345,413.55
PSI NTRD FNMA 103242 FNMA 1.50 1.5 11/30/2020 50,000,000.00 49,650,535.71 49,584,500.00
PSI NTRD FNMA 103247 FNMA 1.50 1.5 6/22/2020 50,000,000.00 49,855,365.25 49,781,100.00
PSI NTRD FNMA 103248 FNMA 1.50 1.5 6/22/2020 50,000,000.00 49,855,365.25 49,781,100.00
PSI NTRD FNMA 103249 FNMA 1.50 1.5 6/22/2020 25,000,000.00 24,927,682.63 24,890,550.00
PSI NTRD FNMA 103255 FNMA 1.375 1.375 2/26/2021 50,000,000.00 49,231,046.63 49,119,700.00
PSI NTRD FNMA 103757 FNMA 1.70 (CALLABLE) 1.7 1/27/2020 50,000,000.00 49,948,214.61 49,995,750.00
PSI NTRD FNMA 103758 FNMA 1.70 (CALLABLE) 1.7 1/27/2020 50,000,000.00 49,948,214.61 49,995,750.00
PSI NTRD FNMA 103759 FNMA 1.70 (CALLABLE) 1.7 1/27/2020 17,000,000.00 16,982,392.97 16,998,555.00
PSI NTRD FNMA 103946 FNMA 2.35 (CALLABLE) 2.35 3/14/2022 13,005,000.00 13,005,000.00 12,993,542.60
PSI NTRD FNMA 104048 FNMA 2.40 (CALLABLE) 2.4 3/28/2022 25,000,000.00 25,000,000.00 25,007,400.00
PSI NTRD FNMA 104245 FNMA 2.25 (CALLABLE) 2.25 2/14/2022 44,158,000.00 44,158,000.00 44,072,068.53
FNMA Total 3,730,171,000.00 3,726,570,519.85 3,672,228,452.00
PSI NTRD FRCDQ2 102398 TORONTO DOMINION BANK NY F 1.50011 5/22/2017 50,000,000.00 50,000,831.21 50,035,500.00
PSI NTRD FRCDQ2 103167 WESTPAC BANKING CORP NY FR 1.234 8/31/2017 50,000,000.00 50,001,935.33 49,975,000.00
PSI NTRD FRCDQ2 103278 ROYAL BANK OF CANADA NY FR 1.40622 12/8/2017 50,000,000.00 50,000,000.00 50,058,450.00
PSI NTRD FRCDQ2 103342 WESTPAC BANKING CORP NY FR 1.43122 12/15/2017 50,000,000.00 50,001,967.95 49,975,000.00
PSI NTRD FRCDQ2 103387 ROYAL BANK OF CANADA NY FR 1.45178 12/19/2017 50,000,000.00 50,000,000.00 50,063,050.00
PSI NTRD FRCDQ2 103397 WELLS FARGO BANK, NA FRCD 1.48733 12/15/2017 50,000,000.00 50,000,000.00 50,075,000.00
PSI NTRD FRCDQ2 103437 ROYAL BANK OF CANADA NY FR 1.47178 12/21/2017 50,000,000.00 50,000,000.00 49,975,000.00
FRCDQ2 Total 350,000,000.00 350,004,734.49 350,157,000.00
PSI NTRD MCPN 91354 FHLB 1.50 (CALLABLE) 0.65 11/13/2017 50,000,000.00 50,000,000.00 49,912,000.00
PSI NTRD MCPN 91390 FHLB 1.65 (CALLABLE) 0.55 11/13/2017 50,000,000.00 50,000,000.00 49,885,200.00
PSI NTRD MCPN 91953 FHLB 1.75 (CALLABLE) 0.8 12/28/2018 50,000,000.00 50,000,000.00 49,584,350.00
PSI NTRD MCPN 91977 FHLB 1.75 (CALLABLE) 0.8 12/28/2018 50,000,000.00 50,000,000.00 49,584,350.00
PSI NTRD MCPN 91978 FHLB 2.00 (CALLABLE) 0.73 12/28/2018 50,000,000.00 50,000,000.00 49,525,300.00

Page 19
Los Angeles County TreasurerTreasurer Portfolio Compared to Market ValueFor the Period: March 1, 2017 to March 31, 2017Fund: Pooled Surplus InvestmentsAttachment X
Group Acct Sec Type SecID Description Face Rate Mat Date Par Amortized Cost Market ValuePSI NTRD MCPN 92020 FHLB 2.00 (CALLABLE) 0.8 1/8/2019 50,000,000.00 50,000,000.00 49,550,650.00
PSI NTRD MCPN 92035 FHLB 2.25 (CALLABLE) 0.8 12/18/2018 50,000,000.00 50,000,000.00 49,610,150.00
PSI NTRD MCPN 92161 FHLB 2.50 (CALLABLE) 0.86 1/28/2019 50,000,000.00 50,000,000.00 49,578,350.00
PSI NTRD MCPN 92162 FHLB 2.50 (CALLABLE) 0.85 1/25/2019 50,000,000.00 50,000,000.00 49,590,500.00
PSI NTRD MCPN 92163 FHLB 2.85 (CALLABLE) 0.85 1/28/2019 50,000,000.00 50,000,000.00 49,571,150.00
PSI NTRD MCPN 92164 FHLB 2.50 (CALLABLE) 0.86 1/28/2019 50,000,000.00 50,000,000.00 49,577,150.00
PSI NTRD MCPN 92177 FHLB 3.00 (CALLABLE) 0.875 1/28/2019 50,000,000.00 50,000,000.00 49,587,000.00
PSI NTRD MCPN 92788 FHLB 3.00 (CALLABLE) 0.92 4/11/2019 25,000,000.00 25,000,000.00 24,776,500.00
PSI NTRD MCPN 92814 FHLB 3.50 (CALLABLE) 0.875 4/17/2019 25,000,000.00 25,000,000.00 24,768,475.00
PSI NTRD MCPN 93057 FHLB 3.50 (CALLABLE) 0.8 5/15/2019 25,000,000.00 25,000,000.00 24,641,325.00
PSI NTRD MCPN 93058 FHLB 3.50 (CALLABLE) 0.8 5/15/2019 25,000,000.00 25,000,000.00 24,641,325.00
PSI NTRD MCPN 93059 FHLB 2.50 (CALLABLE) 0.85 5/21/2019 25,000,000.00 25,000,000.00 24,647,500.00
PSI NTRD MCPN 93060 FHLB 2.50 (CALLABLE) 0.85 5/21/2019 25,000,000.00 25,000,000.00 24,647,500.00
PSI NTRD MCPN 93063 FHLB 3.50 (CALLABLE) 0.8 5/15/2019 25,000,000.00 25,000,000.00 24,638,925.00
PSI NTRD MCPN 93064 FHLB 3.75 (CALLABLE) 0.8 5/22/2019 25,000,000.00 25,000,000.00 24,593,175.00
PSI NTRD MCPN 93178 FHLB 3.50 (CALLABLE) 0.8 5/28/2019 25,000,000.00 25,000,000.00 24,679,100.00
PSI NTRD MCPN 93208 FHLB 4.00 (CALLABLE) 0.8 5/22/2019 50,000,000.00 50,000,000.00 49,245,550.00
PSI NTRD MCPN 93209 FHLB 4.00 (CALLABLE) 0.8 5/22/2019 25,000,000.00 25,000,000.00 24,622,775.00
PSI NTRD MCPN 93210 FHLB 4.00 (CALLABLE) 0.8 5/22/2019 25,000,000.00 25,000,000.00 24,622,775.00
PSI NTRD MCPN 93335 FHLB 6.00 (CALLABLE) 1 6/27/2019 50,000,000.00 50,000,000.00 49,459,300.00
PSI NTRD MCPN 96500 FHLB 7.125 (CALLABLE) 1.3 8/28/2019 25,000,000.00 25,000,000.00 25,018,525.00
PSI NTRD MCPN 96727 FHLB 7.35 (CALLABLE) 1.23 9/26/2019 25,000,000.00 25,000,000.00 24,987,500.00
PSI NTRD MCPN 97963 FHLB 7.75 (CALLABLE) 1.25 3/18/2020 25,000,000.00 25,000,000.00 24,765,350.00
PSI NTRD MCPN 98031 FHLB 6.50 (CALLABLE) 1.25 3/30/2020 25,000,000.00 25,000,000.00 25,023,425.00
PSI NTRD MCPN 98032 FHLB 6.50 (CALLABLE) 1.25 3/30/2020 25,000,000.00 25,000,000.00 25,023,425.00
PSI NTRD MCPN 98069 FHLB 7.50 (CALLABLE) 1.25 4/2/2020 25,000,000.00 25,000,000.00 24,743,100.00
PSI NTRD MCPN 98561 FHLB 6.00 (CALLABLE) 1.25 5/27/2020 25,000,000.00 25,000,000.00 24,604,250.00
PSI NTRD MCPN 98562 FHLB 6.00 (CALLABLE) 1.25 5/27/2020 25,000,000.00 25,000,000.00 24,604,250.00
PSI NTRD MCPN 98775 FHLB 8.50 (CALLABLE) 1.25 6/30/2020 25,000,000.00 25,000,000.00 24,430,900.00
PSI NTRD MCPN 98776 FHLB 7.50 (CALLABLE) 1.3 6/25/2020 25,000,000.00 25,000,000.00 24,434,400.00
PSI NTRD MCPN 101960 FHLMC 2.75 (CALLABLE) 1.5 6/29/2021 50,000,000.00 50,000,000.00 47,956,400.00
PSI NTRD MCPN 101961 FHLMC 2.75 (CALLABLE) 1.5 6/29/2021 10,000,000.00 10,000,000.00 9,591,280.00
PSI NTRD MCPN 102145 FHLMC 2.35 (CALLABLE) 2 7/27/2021 25,000,000.00 25,000,000.00 24,104,975.00
PSI NTRD MCPN 103048 FHLMC 3.20 (CALLABLE) 3.2 12/2/2021 25,000,000.00 25,000,000.00 24,230,600.00
PSI NTRD MCPN 103060 FHLMC 3.50 (CALLABLE) 3.5 12/2/2021 25,000,000.00 24,988,321.47 24,574,850.00
PSI NTRD MCPN 104057 FHLMC 4.125 (CALLABLE) 4.125 3/28/2022 25,000,000.00 25,000,000.00 25,061,600.00
MCPN Total 1,385,000,000.00 1,384,988,321.47 1,368,695,205.00
PSI NTRD MCSA 90103 FHLB 2.25 (CALLABLE) 0.5 6/5/2017 50,000,000.00 49,999,822.02 49,999,350.00

Page 20
Los Angeles County TreasurerTreasurer Portfolio Compared to Market ValueFor the Period: March 1, 2017 to March 31, 2017Fund: Pooled Surplus InvestmentsAttachment X
Group Acct Sec Type SecID Description Face Rate Mat Date Par Amortized Cost Market ValuePSI NTRD MCSA 101320 FHLB 2.25 (CALLABLE) 1.9 4/28/2021 50,000,000.00 50,000,000.00 48,665,100.00
PSI NTRD MCSA 102917 FHLB 2.125 (CALLABLE) 2.125 11/10/2021 25,000,000.00 25,000,000.00 24,286,625.00
PSI NTRD MCSA 103056 FHLB 3.00 (CALLABLE) 3 12/2/2021 25,000,000.00 25,000,000.00 24,328,100.00
PSI NTRD MCSA 103061 FHLB 1.50 (CALLABLE) 1.5 11/26/2021 25,000,000.00 25,000,000.00 24,878,925.00
PSI NTRD MCSA 103072 FHLB 1.50 (CALLABLE) 1.5 12/2/2021 25,000,000.00 25,000,000.00 24,907,050.00
PSI NTRD MCSA 103325 FHLB 3.25 (CALLABLE) 3.25 12/30/2021 50,000,000.00 50,000,000.00 49,732,000.00
PSI NTRD MCSA 103327 FHLB 2.875 (CALLABLE) 2.875 12/28/2021 50,000,000.00 50,000,000.00 49,277,550.00
PSI NTRD MCSA 103561 FHLMC 2.20 (CALLABLE) 2.2 1/27/2022 50,000,000.00 50,000,000.00 50,002,400.00
PSI NTRD MCSA 103587 FHLMC 3.50 (CALLABLE) 3.5 1/27/2022 50,000,000.00 50,000,000.00 49,223,500.00
PSI NTRD MCSA 104067 FHLMC 4.25 (CALLABLE) 4.25 3/28/2022 25,000,000.00 25,000,000.00 25,056,950.00
MCSA Total 425,000,000.00 424,999,822.02 420,357,550.00
PSI NTRD NCD1 102874 WELLS FARGO BANK, NA CD 1.08 4/20/2017 50,000,000.00 50,000,000.00 50,006,635.00
PSI NTRD NCD1 102875 WELLS FARGO BANK, NA CD 1.08 4/20/2017 50,000,000.00 50,000,000.00 50,006,635.00
PSI NTRD NCD1 103123 WELLS FARGO BANK, NA CD 1.1 5/30/2017 50,000,000.00 50,000,000.00 50,016,360.00
PSI NTRD NCD1 103527 AU & NZ BANKING GRP NY CD 1.3 12/29/2017 50,000,000.00 50,000,000.00 50,004,780.00
PSI NTRD NCD1 103528 BANK OF MONTREAL CHICAGO C 1.08 4/4/2017 50,000,000.00 50,000,000.00 50,000,905.00
PSI NTRD NCD1 104290 WELLS FARGO BANK, NA CD 1.22 9/29/2017 50,000,000.00 50,000,000.00 49,991,700.00
PSI NTRD NCD1 104300 WELLS FARGO BANK, NA CD 1.22 10/2/2017 50,000,000.00 50,000,000.00 49,990,540.00
NCD1 Total 350,000,000.00 350,000,000.00 350,017,555.00
PSI NTRD NOTE 101642 USTN 0.625 5/31/2017 50,000,000.00 49,995,636.64 49,994,750.00
PSI NTRD NOTE 101701 USTN 0.625 5/31/2017 50,000,000.00 49,991,765.20 49,994,750.00
PSI NTRD NOTE 103979 USTN 1.00 1 2/15/2018 25,000,000.00 25,028,328.61 24,987,300.00
PSI NTRD NOTE 104007 USTN 0.75 0.75 2/28/2018 50,000,000.00 49,939,415.67 49,859,400.00
PSI NTRD NOTE 104008 USTN 0.75 0.75 2/28/2018 50,000,000.00 49,939,415.67 49,859,400.00
NOTE Total 225,000,000.00 224,894,561.79 224,695,600.00
PSI NTRD TBIL 101473 UST BILL 0.59 4/27/2017 50,000,000.00 49,978,694.44 49,975,650.00
PSI NTRD TBIL 101474 UST BILL 0.59 4/27/2017 50,000,000.00 49,978,694.44 49,975,650.00
PSI NTRD TBIL 101643 UST BILL 0.6 4/27/2017 50,000,000.00 49,978,333.33 49,975,650.00
PSI NTRD TBIL 101722 UST BILL 0.636 5/25/2017 50,000,000.00 49,952,300.00 49,948,250.00
PSI NTRD TBIL 101723 UST BILL 0.636 5/25/2017 50,000,000.00 49,952,300.00 49,948,250.00
PSI NTRD TBIL 102642 UST BILL 0.5575 9/14/2017 50,000,000.00 49,871,465.28 49,804,850.00
PSI NTRD TBIL 102643 UST BILL 0.5575 9/14/2017 50,000,000.00 49,871,465.28 49,804,850.00
PSI NTRD TBIL 102758 UST BILL 0.6525 10/12/2017 50,000,000.00 49,824,187.50 49,762,000.00
PSI NTRD TBIL 102759 UST BILL 0.6525 10/12/2017 50,000,000.00 49,824,187.50 49,762,000.00
PSI NTRD TBIL 102760 UST BILL 0.655 10/12/2017 50,000,000.00 49,823,513.89 49,762,000.00
PSI NTRD TBIL 102761 UST BILL 0.655 10/12/2017 50,000,000.00 49,823,513.89 49,762,000.00

Page 21
Los Angeles County TreasurerTreasurer Portfolio Compared to Market ValueFor the Period: March 1, 2017 to March 31, 2017Fund: Pooled Surplus InvestmentsAttachment X
Group Acct Sec Type SecID Description Face Rate Mat Date Par Amortized Cost Market ValuePSI NTRD TBIL 103293 UST BILL 0.82 12/7/2017 50,000,000.00 49,715,277.77 49,679,650.00
PSI NTRD TBIL 103498 UST BILL 0.84 12/7/2017 50,000,000.00 49,708,333.34 49,679,650.00
PSI NTRD TBIL 103905 UST BILL 0.82 2/1/2018 50,000,000.00 49,651,500.00 49,596,200.00
PSI NTRD TBIL 104031 UST BILL 0.905 3/1/2018 50,000,000.00 49,580,180.55 49,543,050.00
PSI NTRD TBIL 104034 UST BILL 0.9 3/1/2018 50,000,000.00 49,582,500.00 49,543,050.00
PSI NTRD TBIL 104267 UST BILL 1.01 3/29/2018 50,000,000.00 49,492,194.45 49,495,000.00
PSI NTRD TBIL 104268 UST BILL 1.01 3/29/2018 50,000,000.00 49,492,194.45 49,495,000.00
PSI NTRD TBIL 104275 UST BILL 1.01 3/29/2018 50,000,000.00 49,492,194.45 49,495,000.00
PSI NTRD TBIL 104276 UST BILL 1.01 3/29/2018 50,000,000.00 49,492,194.45 49,495,000.00
TBIL Total 1,000,000,000.00 995,085,225.01 994,502,750.00
PSI NTRD YANK1 101192 WESTPAC BANKING CORP NY CD 1.08 4/10/2017 50,000,000.00 50,000,123.64 50,003,670.00
PSI NTRD YANK1 101193 WESTPAC BANKING CORP NY CD 1.08 4/10/2017 50,000,000.00 50,000,123.64 50,003,670.00
PSI NTRD YANK1 101385 WESTPAC BANKING CORP NY CD 1.11 4/20/2017 50,000,000.00 50,000,260.98 50,007,445.00
PSI NTRD YANK1 101386 WESTPAC BANKING CORP NY CD 1.11 4/20/2017 50,000,000.00 50,000,260.98 50,007,445.00
PSI NTRD YANK1 101393 ROYAL BANK OF CANADA NY CD 1.095 4/20/2017 50,000,000.00 50,000,000.00 50,004,110.00
PSI NTRD YANK1 102667 AU & NZ BANKING GRP NY CD 1.05 6/30/2017 50,000,000.00 50,000,000.00 49,997,895.00
PSI NTRD YANK1 102668 AU & NZ BANKING GRP NY CD 1.05 6/30/2017 50,000,000.00 50,000,000.00 49,997,895.00
PSI NTRD YANK1 102861 SVENSKA HANDELSBANKEN NY C 1.08 4/28/2017 50,000,000.00 50,000,372.97 50,011,635.00
PSI NTRD YANK1 102862 SVENSKA HANDELSBANKEN NY C 1.12 5/19/2017 50,000,000.00 50,000,662.50 50,020,670.00
PSI NTRD YANK1 103032 WESTPAC BANKING CORP NY CD 1.02 5/19/2017 50,000,000.00 50,000,663.21 50,007,165.00
PSI NTRD YANK1 103386 WESTPAC BANKING CORP NY CD 1.03 4/20/2017 50,000,000.00 50,000,000.00 50,005,400.00
PSI NTRD YANK1 103504 BANK OF MONTREAL CHICAGO C 1.08 4/3/2017 50,000,000.00 50,000,000.00 50,000,735.00
PSI NTRD YANK1 103530 ROYAL BANK OF CANADA NY CD 1.21 6/30/2017 50,000,000.00 50,000,000.00 50,009,390.00
PSI NTRD YANK1 103609 TORONTO DOMINION BANK NY C 1 4/20/2017 50,000,000.00 50,000,263.17 50,004,025.00
PSI NTRD YANK1 103631 BARCLAYS BANK PLC NY CD 0.85 4/14/2017 50,000,000.00 50,000,000.00 49,997,260.00
PSI NTRD YANK1 103731 CREDIT AGRICOLE CIB NY CD 1.03 4/20/2017 50,000,000.00 50,000,263.26 50,003,365.00
PSI NTRD YANK1 103780 CANADIAN IMP. BK OF COM NY 1.1 6/30/2017 50,000,000.00 50,001,244.20 50,004,655.00
PSI NTRD YANK1 103791 SVENSKA HANDELSBANKEN NY C 0.76 4/3/2017 50,000,000.00 50,000,027.74 50,000,000.00
PSI NTRD YANK1 103809 BARCLAYS BANK PLC NY CD 1 5/1/2017 50,000,000.00 50,000,000.00 49,997,600.00
PSI NTRD YANK1 103811 SOCIETE GENERALE NY CD 0.83 4/3/2017 50,000,000.00 50,000,027.74 50,000,000.00
PSI NTRD YANK1 103825 SOCIETE GENERALE NY CD 0.83 4/4/2017 50,000,000.00 50,000,041.61 49,999,875.00
PSI NTRD YANK1 103880 UBS AG STAMFORD CT CD 1.01 6/13/2017 50,000,000.00 50,000,000.00 50,002,430.00
PSI NTRD YANK1 103906 TORONTO DOMINION BANK NY C 0.74 4/13/2017 25,000,000.00 25,000,083.23 24,999,135.00
PSI NTRD YANK1 103915 BARCLAYS BANK PLC NY CD 1.08 5/15/2017 50,000,000.00 50,000,000.00 49,998,160.00
PSI NTRD YANK1 103934 SOCIETE GENERALE NY CD 0.78 4/14/2017 50,000,000.00 50,000,180.34 49,998,095.00
PSI NTRD YANK1 103959 SOCIETE GENERALE NY CD 0.78 4/14/2017 50,000,000.00 50,000,180.36 49,998,100.00
PSI NTRD YANK1 103966 UBS AG STAMFORD CT CD 0.97 5/31/2017 50,000,000.00 50,000,000.00 50,003,730.00
PSI NTRD YANK1 104017 BNP PARIBAS SF CD 0.71 4/14/2017 50,000,000.00 50,000,000.00 49,995,635.00

Page 22
Los Angeles County TreasurerTreasurer Portfolio Compared to Market ValueFor the Period: March 1, 2017 to March 31, 2017Fund: Pooled Surplus InvestmentsAttachment X
Group Acct Sec Type SecID Description Face Rate Mat Date Par Amortized Cost Market ValuePSI NTRD YANK1 104024 NORDEA BANK AB NY CD 0.7 4/3/2017 50,000,000.00 50,000,000.00 50,000,000.00
PSI NTRD YANK1 104049 NORDEA BANK AB NY CD 0.73 4/5/2017 50,000,000.00 50,000,000.00 49,998,590.00
PSI NTRD YANK1 104069 BNP PARIBAS SF CD 0.71 4/12/2017 50,000,000.00 50,000,000.00 49,996,290.00
PSI NTRD YANK1 104076 TORONTO DOMINION BANK NY C 0.73 4/17/2017 50,000,000.00 50,000,000.00 49,997,275.00
PSI NTRD YANK1 104116 BNP PARIBAS SF CD 0.84 4/14/2017 50,000,000.00 50,000,000.00 49,998,165.00
PSI NTRD YANK1 104122 TORONTO DOMINION BANK NY C 0.9 5/19/2017 50,000,000.00 50,000,000.00 49,997,860.00
PSI NTRD YANK1 104137 BANK OF MONTREAL CHICAGO C 0.9 4/21/2017 50,000,000.00 50,000,000.00 49,999,085.00
PSI NTRD YANK1 104139 BANK OF MONTREAL CHICAGO C 0.9 4/20/2017 50,000,000.00 50,000,000.00 49,999,155.00
PSI NTRD YANK1 104156 SOCIETE GENERALE NY CD 0.93 4/20/2017 50,000,000.00 50,000,000.00 50,001,015.00
PSI NTRD YANK1 104158 BANK OF MONTREAL CHICAGO C 0.94 4/24/2017 50,000,000.00 50,000,319.13 50,000,185.00
PSI NTRD YANK1 104197 BNP PARIBAS SF CD 0.94 4/25/2017 50,000,000.00 50,000,000.00 49,999,815.00
PSI NTRD YANK1 104199 BANK OF MONTREAL CHICAGO C 0.95 5/1/2017 50,000,000.00 50,000,000.00 50,000,375.00
PSI NTRD YANK1 104214 RABOBANK NEDERLAND NY CD 1.15 7/28/2017 50,000,000.00 50,000,000.00 49,992,075.00
PSI NTRD YANK1 104215 TORONTO DOMINION BANK NY C 1.15 7/3/2017 50,000,000.00 50,001,287.71 50,000,895.00
PSI NTRD YANK1 104224 SVENSKA HANDELSBANKEN NY C 0.92 4/28/2017 50,000,000.00 50,000,000.00 50,005,550.00
PSI NTRD YANK1 104227 CREDIT AGRICOLE CIB NY CD 0.97 6/1/2017 50,000,000.00 50,000,845.74 50,000,075.00
PSI NTRD YANK1 104228 SOCIETE GENERALE NY CD 1.07 6/1/2017 50,000,000.00 50,000,845.60 50,005,580.00
PSI NTRD YANK1 104234 BNP PARIBAS SF CD 0.94 4/28/2017 50,000,000.00 50,000,000.00 49,999,685.00
PSI NTRD YANK1 104241 CANADIAN IMP. BK OF COM NY 1.05 6/30/2017 50,000,000.00 50,001,246.61 49,998,600.00
PSI NTRD YANK1 104243 BARCLAYS BANK PLC NY CD 1.26 6/28/2017 50,000,000.00 50,000,000.00 49,998,010.00
PSI NTRD YANK1 104250 CREDIT AGRICOLE CIB NY CD 1.1 6/30/2017 50,000,000.00 50,000,000.00 49,999,860.00
PSI NTRD YANK1 104257 RABOBANK NEDERLAND NY CD 1.15 7/31/2017 50,000,000.00 50,000,000.00 49,990,880.00
PSI NTRD YANK1 104280 BANK OF MONTREAL CHICAGO C 0.94 5/5/2017 50,000,000.00 50,000,000.00 49,999,755.00
PSI NTRD YANK1 104281 BANK OF MONTREAL CHICAGO C 0.94 5/3/2017 50,000,000.00 50,000,000.00 49,999,860.00
PSI NTRD YANK1 104284 BARCLAYS BANK PLC NY CD 1.26 6/29/2017 50,000,000.00 50,000,000.00 49,997,495.00
PSI NTRD YANK1 104291 CREDIT AGRICOLE CIB NY CD 0.94 6/1/2017 50,000,000.00 50,000,000.00 49,997,505.00
PSI NTRD YANK1 104294 CANADIAN IMP. BK OF COM NY 0.92 6/5/2017 50,000,000.00 50,000,901.25 49,996,700.00
PSI NTRD YANK1 104296 BARCLAYS BANK PLC NY CD 1.15 6/1/2017 50,000,000.00 50,000,000.00 49,998,020.00
PSI NTRD YANK1 104297 TORONTO DOMINION BANK NY C 0.96 5/30/2017 50,000,000.00 50,000,000.00 49,999,995.00
PSI NTRD YANK1 104311 NORDEA BANK AB NY CD 1 6/30/2017 50,000,000.00 50,000,000.00 49,983,616.00
PSI NTRD YANK1 104312 BNP PARIBAS SF CD 0.94 5/5/2017 50,000,000.00 50,000,000.00 49,999,514.00
PSI NTRD YANK1 104313 CANADIAN IMP. BK OF COM NY 0.9 5/2/2017 50,000,000.00 50,000,430.21 49,997,779.50
PSI NTRD YANK1 104314 TORONTO DOMINION BANK NY C 0.94 5/4/2017 50,000,000.00 50,000,000.00 49,999,528.00
PSI NTRD YANK1 104315 NORDEA BANK AB NY CD 1 6/30/2017 50,000,000.00 50,000,000.00 49,983,616.00
YANK1 Total 3,075,000,000.00 3,075,010,655.82 3,075,011,593.50
NTRD Total 29,486,867,000.00 29,462,593,708.70 29,267,753,417.54NTRD-PSI Historical Total 29,450,072,996.69

Page 23
Los Angeles County TreasurerTreasurer Portfolio Compared to Market ValueFor the Period: March 1, 2017 to March 31, 2017Fund: Pooled Surplus InvestmentsAttachment X
Group Acct Sec Type SecID Description Face Rate Mat Date Par Amortized Cost Market ValuePSI TRADE NOTE 102351 USTN 1.125 1.125 7/31/2021 50,000,000.00 49,941,926.65 48,492,200.00
PSI TRADE NOTE 103017 USTN 1.125 1.125 9/30/2021 50,000,000.00 49,426,517.64 48,373,050.00
PSI TRADE NOTE 103018 USTN 1.125 1.125 9/30/2021 50,000,000.00 49,293,699.12 48,373,050.00
PSI TRADE NOTE 103046 USTN 1.25 1.25 10/31/2021 50,000,000.00 49,187,581.96 48,599,600.00
NOTE Total 200,000,000.00 197,849,725.37 193,837,900.00
TRADE Total 200,000,000.00 197,849,725.37 193,837,900.00TRADE-PSI Historical Total 197,666,015.63
PSI Total 29,686,867,000.00 29,660,443,434.07 29,461,591,317.54PSI Historical Total 29,647,739,012.32

Page 24
Los Angeles County TreasurerTreasurer Portfolio Compared to Market ValueFor the Period: March 1, 2017 to March 31, 2017Fund: Specific Purpose InvestmentsAttachment X
Group Acct Sec Type SecID Description Face Rate Mat Date Par Amortized Cost Market ValueSPI GF LTBD 35272 RPV TAX ALLOCATION BOND 19 5 9/2/2021 4,275,000.00 4,275,000.00 4,275,000.00
LTBD Total 4,275,000.00 4,275,000.00 4,275,000.00
GF Total 4,275,000.00 4,275,000.00 4,275,000.00
SPI PHHPA FFCB 100748 FFCB 3.00 (CALLABLE) 3 3/4/1931 5,000,000.00 5,000,000.00 5,010,570.00
SPI PHHPA FFCB 101632 FFCB 3.00 (CALLABLE) 3 4/21/1933 500,000.00 500,000.00 477,430.00
SPI PHHPA FFCB 102153 FFCB 2.70 (CALLABLE) 2.7 7/21/1936 1,500,000.00 1,492,760.78 1,344,484.50
FFCB Total 7,000,000.00 6,992,760.78 6,832,484.50
SPI PHHPA FHLB 101370 FHLB 3.125 (CALLABLE) 3.125 4/28/1936 5,000,000.00 5,000,000.00 4,792,725.00
SPI PHHPA FHLB 101841 FHLB 3.00 (CALLABLE) 3 6/16/1936 4,000,000.00 4,000,000.00 3,751,536.00
SPI PHHPA FHLB 102043 FHLB 2.875 (CALLABLE) 2.875 7/21/1936 10,000,000.00 10,000,000.00 9,177,090.00
SPI PHHPA FHLB 102496 FHLB 2.82 (CALLABLE) 2.82 9/13/1941 2,200,000.00 2,200,000.00 1,910,583.40
FHLB Total 21,200,000.00 21,200,000.00 19,631,934.40
SPI PHHPA FHLM 102369 FHLMC 2.75 (CALLABLE) 2.75 9/8/1936 3,976,000.00 3,976,000.00 3,569,557.38
FHLM Total 3,976,000.00 3,976,000.00 3,569,557.38
PHHPA Total 32,176,000.00 32,168,760.78 30,033,976.28
SPI SANIT FFCB 91930 FFCB 0.82 (CALLABLE) 0.82 12/12/2017 130,000.00 129,981.85 129,808.25
FFCB Total 130,000.00 129,981.85 129,808.25
SPI SANIT FHLB 102192 FHLB 1.50 (CALLABLE) 1.5 7/27/2021 600,000.00 599,740.74 582,398.40
FHLB Total 600,000.00 599,740.74 582,398.40
SPI SANIT FHLM 93170 FHLMC 1.00 (CALLABLE) 1 5/25/2018 476,000.00 476,000.00 475,112.26
FHLM Total 476,000.00 476,000.00 475,112.26
SPI SANIT FNMA 102191 FNMA 1.52 (CALLABLE) 1.52 7/28/2021 3,900,000.00 3,900,000.00 3,768,476.40
FNMA Total 3,900,000.00 3,900,000.00 3,768,476.40
SANIT Total 5,106,000.00 5,105,722.59 4,955,795.31
SPI SCAQM CTDQ 38556 S OF C LAIF 0 12/31/2017 1,758,350.54 1,758,350.54 1,758,350.54
SPI SCAQM CTDQ 38987 S OF C LAIF 0 12/31/2017 303,237.61 303,237.61 303,237.61
SPI SCAQM CTDQ 39856 S OF C LAIF 0 12/31/2017 327,715.76 327,715.76 327,715.76
SPI SCAQM CTDQ 40203 S OF C LAIF 0 12/31/2017 2,997,000.00 2,997,000.00 2,997,000.00
SPI SCAQM CTDQ 40651 S OF C LAIF 0 12/31/2017 338,455.53 338,455.53 338,455.53
SPI SCAQM CTDQ 41373 S OF C LAIF 0 12/31/2017 383,355.75 383,355.75 383,355.75
SPI SCAQM CTDQ 42150 S OF C LAIF 0 12/31/2017 249,219.92 249,219.92 249,219.92
SPI SCAQM CTDQ 42487 S OF C LAIF 0 12/31/2017 12,000,000.00 12,000,000.00 12,000,000.00

Page 25
Los Angeles County TreasurerTreasurer Portfolio Compared to Market ValueFor the Period: March 1, 2017 to March 31, 2017Fund: Specific Purpose InvestmentsAttachment X
Group Acct Sec Type SecID Description Face Rate Mat Date Par Amortized Cost Market ValueSPI SCAQM CTDQ 43227 S OF C LAIF 0 12/31/2017 315,549.21 315,549.21 315,549.21
SPI SCAQM CTDQ 44235 S OF C LAIF 0 12/31/2017 417,809.52 417,809.52 417,809.52
SPI SCAQM CTDQ 45085 S OF C LAIF 0 12/31/2017 450,282.68 450,282.68 450,282.68
SPI SCAQM CTDQ 46126 S OF C LAIF 0 12/31/2017 460,937.14 460,937.14 460,937.14
SPI SCAQM CTDQ 47348 S OF C LAIF 0 12/31/2017 433,556.17 433,556.17 433,556.17
SPI SCAQM CTDQ 48498 S OF C LAIF 0 12/31/2017 383,954.85 383,954.85 383,954.85
SPI SCAQM CTDQ 49799 S OF C LAIF 0 12/31/2017 330,882.23 330,882.23 330,882.23
SPI SCAQM CTDQ 50780 S OF C LAIF 0 12/31/2017 263,334.33 263,334.33 263,334.33
SPI SCAQM CTDQ 51466 S OF C LAIF 0 12/31/2017 218,395.70 218,395.70 218,395.70
SPI SCAQM CTDQ 52667 S OF C LAIF 0 12/31/2017 206,669.35 206,669.35 206,669.35
SPI SCAQM CTDQ 53917 S OF C LAIF 0 12/31/2017 201,264.73 201,264.73 201,264.73
SPI SCAQM CTDQ 55073 S OF C LAIF 0 12/31/2017 178,298.59 178,298.59 178,298.59
SPI SCAQM CTDQ 55622 S OF C LAIF 0 12/31/2017 8,000,000.00 8,000,000.00 8,000,000.00
SPI SCAQM CTDQ 56613 S OF C LAIF 0 12/31/2017 167,311.06 167,311.06 167,311.06
SPI SCAQM CTDQ 58052 S OF C LAIF 0 12/31/2017 171,568.16 171,568.16 171,568.16
SPI SCAQM CTDQ 59105 S OF C LAIF 0 12/31/2017 160,406.73 160,406.73 160,406.73
SPI SCAQM CTDQ 60182 S OF C LAIF 0 12/31/2017 154,317.15 154,317.15 154,317.15
SPI SCAQM CTDQ 61111 S OF C LAIF 0 12/31/2017 144,533.84 144,533.84 144,533.84
SPI SCAQM CTDQ 61966 S OF C LAIF 0 12/31/2017 141,619.71 141,619.71 141,619.71
SPI SCAQM CTDQ 62780 S OF C LAIF 0 12/31/2017 167,353.58 167,353.58 167,353.58
SPI SCAQM CTDQ 64002 S OF C LAIF 0 12/31/2017 200,949.57 200,949.57 200,949.57
SPI SCAQM CTDQ 64951 S OF C LAIF 0 12/31/2017 232,386.75 232,386.75 232,386.75
SPI SCAQM CTDQ 65950 S OF C LAIF 0 12/31/2017 281,845.96 281,845.96 281,845.96
SPI SCAQM CTDQ 66800 S OF C LAIF 0 12/31/2017 317,155.30 317,155.30 317,155.30
SPI SCAQM CTDQ 67819 S OF C LAIF 0 12/31/2017 363,715.38 363,715.38 363,715.38
SPI SCAQM CTDQ 68720 S OF C LAIF 0 12/31/2017 393,812.36 393,812.36 393,812.36
SPI SCAQM CTDQ 69520 S OF C LAIF 0 12/31/2017 449,659.59 449,659.59 449,659.59
SPI SCAQM CTDQ 70359 S OF C LAIF 0 12/31/2017 491,566.29 491,566.29 491,566.29
SPI SCAQM CTDQ 71268 S OF C LAIF 0 12/31/2017 513,938.89 513,938.89 513,938.89
SPI SCAQM CTDQ 72329 S OF C LAIF 0 12/31/2017 505,507.65 505,507.65 505,507.65
SPI SCAQM CTDQ 73503 S OF C LAIF 0 12/31/2017 515,367.27 515,367.27 515,367.27
SPI SCAQM CTDQ 74486 S OF C LAIF 0 12/31/2017 520,380.93 520,380.93 520,380.93
SPI SCAQM CTDQ 75694 S OF C LAIF 0 12/31/2017 492,274.30 492,274.30 492,274.30
SPI SCAQM CTDQ 77128 S OF C LAIF 0 12/31/2017 410,449.24 410,449.24 410,449.24
SPI SCAQM CTDQ 78106 S OF C LAIF 0 12/31/2017 304,980.32 304,980.32 304,980.32
SPI SCAQM CTDQ 78999 S OF C LAIF 0 12/31/2017 277,823.10 277,823.10 277,823.10
SPI SCAQM CTDQ 79884 S OF C LAIF 0 12/31/2017 252,862.59 252,862.59 252,862.59
SPI SCAQM CTDQ 80623 S OF C LAIF 0 12/31/2017 186,831.92 186,831.92 186,831.92
SPI SCAQM CTDQ 81267 S OF C LAIF 0 12/31/2017 150,112.75 150,112.75 150,112.75
SPI SCAQM CTDQ 81965 S OF C LAIF 0 12/31/2017 89,717.54 89,717.54 89,717.54
SPI SCAQM CTDQ 82763 S OF C LAIF 0 12/31/2017 60,335.73 60,335.73 60,335.73
SPI SCAQM CTDQ 83551 S OF C LAIF 0 12/31/2017 54,470.06 54,470.06 54,470.06
SPI SCAQM CTDQ 84325 S OF C LAIF 0 12/31/2017 55,045.25 55,045.25 55,045.25
SPI SCAQM CTDQ 85022 S OF C LAIF 0 12/31/2017 51,349.76 51,349.76 51,349.76

Page 26
Los Angeles County TreasurerTreasurer Portfolio Compared to Market ValueFor the Period: March 1, 2017 to March 31, 2017Fund: Specific Purpose InvestmentsAttachment X
Group Acct Sec Type SecID Description Face Rate Mat Date Par Amortized Cost Market ValueSPI SCAQM CTDQ 85933 S OF C LAIF 0 12/31/2017 45,607.02 45,607.02 45,607.02
SPI SCAQM CTDQ 86695 S OF C LAIF 0 12/31/2017 49,487.01 49,487.01 49,487.01
SPI SCAQM CTDQ 87359 S OF C LAIF 0 12/31/2017 47,004.27 47,004.27 47,004.27
SPI SCAQM CTDQ 88084 S OF C LAIF 0 12/31/2017 38,018.48 38,018.48 38,018.48
SPI SCAQM CTDQ 88969 S OF C LAIF 0 12/31/2017 38,087.21 38,087.21 38,087.21
SPI SCAQM CTDQ 89871 S OF C LAIF 0 12/31/2017 37,344.89 37,344.89 37,344.89
SPI SCAQM CTDQ 90623 S OF C LAIF 0 12/31/2017 35,081.45 35,081.45 35,081.45
SPI SCAQM CTDQ 91360 S OF C LAIF 0 12/31/2017 35,267.56 35,267.56 35,267.56
SPI SCAQM CTDQ 92236 S OF C LAIF 0 12/31/2017 32,073.73 32,073.73 32,073.73
SPI SCAQM CTDQ 92992 S OF C LAIF 0 12/31/2017 27,479.94 27,479.94 27,479.94
SPI SCAQM CTDQ 93692 S OF C LAIF 0 12/31/2017 23,860.66 23,860.66 23,860.66
SPI SCAQM CTDQ 94335 S OF C LAIF 0 12/31/2017 25,433.88 25,433.88 25,433.88
SPI SCAQM CTDQ 95109 S OF C LAIF 0 12/31/2017 25,351.54 25,351.54 25,351.54
SPI SCAQM CTDQ 95789 S OF C LAIF 0 12/31/2017 22,379.23 22,379.23 22,379.23
SPI SCAQM CTDQ 96361 S OF C LAIF 0 12/13/2017 21,649.61 21,649.61 21,649.61
SPI SCAQM CTDQ 96977 S OF C LAIF 0 12/31/2017 23,772.24 23,772.24 23,772.24
SPI SCAQM CTDQ 97763 S OF C LAIF 0 12/31/2017 25,014.27 25,014.27 25,014.27
SPI SCAQM CTDQ 98443 S OF C LAIF 0 12/31/2017 25,052.03 25,052.03 25,052.03
SPI SCAQM CTDQ 99034 S OF C LAIF 0 12/31/2017 27,631.43 27,631.43 27,631.43
SPI SCAQM CTDQ 99690 S OF C LAIF 0 12/31/2017 31,495.31 31,495.31 31,495.31
SPI SCAQM CTDQ 100461 S OF C LAIF 0 12/31/2017 36,232.89 36,232.89 36,232.89
SPI SCAQM CTDQ 101357 S OF C LAIF 0 12/31/2017 45,220.27 45,220.27 45,220.27
SPI SCAQM CTDQ 102142 S OF C LAIF 0 12/31/2017 53,353.16 53,353.16 53,353.16
SPI SCAQM CTDQ 102792 S OF C LAIF 0 12/31/2017 59,668.18 59,668.18 59,668.18
SPI SCAQM CTDQ 103648 S OF C LAIF 0 12/31/2017 66,991.29 66,991.29 66,991.29
CTDQ Total 39,396,475.89 39,396,475.89 39,396,475.89
SCAQM Total 39,396,475.89 39,396,475.89 39,396,475.89
SPI SCP61 NCD1 103467 WELLS FARGO BANK, NA CD 1.53 12/28/2017 10,000,000.00 10,000,000.00 10,011,334.00
NCD1 Total 10,000,000.00 10,000,000.00 10,011,334.00
SCP61 Total 10,000,000.00 10,000,000.00 10,011,334.00
SPI SCP6F NCD1 103468 WELLS FARGO BANK, NA CD 1.53 12/28/2017 10,000,000.00 10,000,000.00 10,011,334.00
NCD1 Total 10,000,000.00 10,000,000.00 10,011,334.00
SCP6F Total 10,000,000.00 10,000,000.00 10,011,334.00
SPI SCP6U NCD1 103470 WELLS FARGO BANK, NA CD 1.53 12/28/2017 5,000,000.00 5,000,000.00 5,005,667.00
NCD1 Total 5,000,000.00 5,000,000.00 5,005,667.00
SCP6U Total 5,000,000.00 5,000,000.00 5,005,667.00
SPI SLIM CTDQ 49798 S OF C LAIF 0 12/31/2017 47,625.37 47,625.37 47,625.37
SPI SLIM CTDQ 50781 S OF C LAIF 0 12/31/2017 95,920.45 95,920.45 95,920.45
SPI SLIM CTDQ 51467 S OF C LAIF 0 12/31/2017 79,551.40 79,551.40 79,551.40
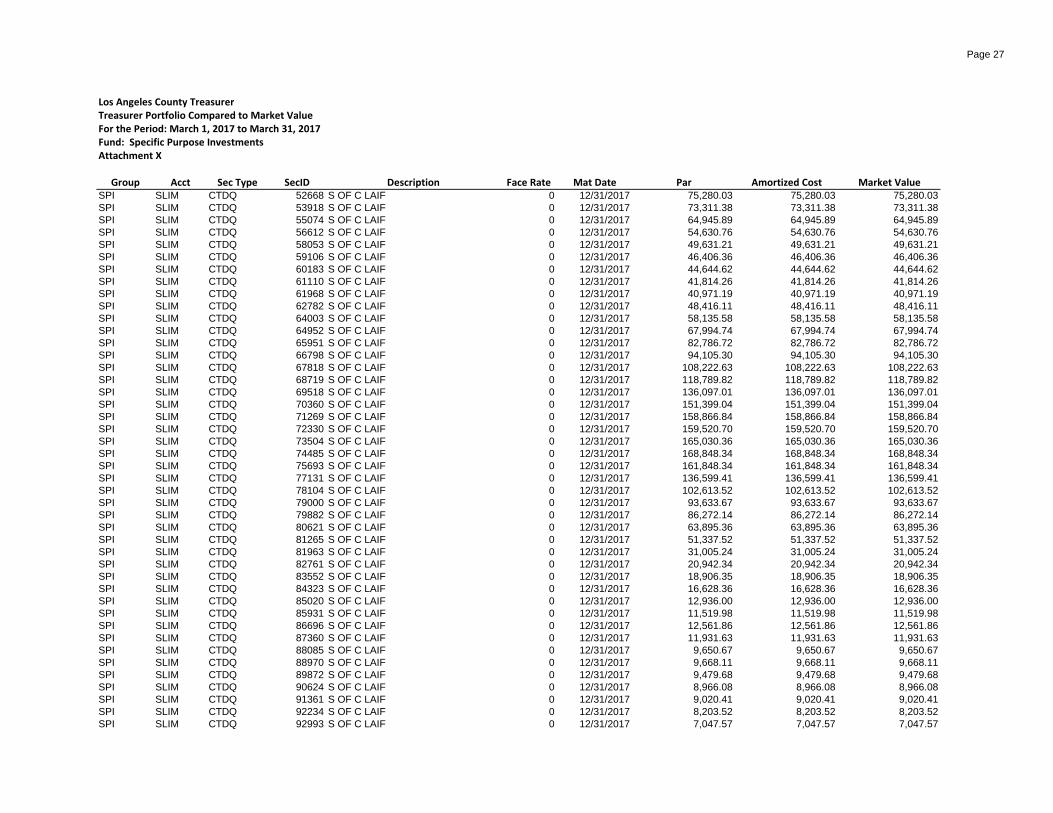
Page 27
Los Angeles County TreasurerTreasurer Portfolio Compared to Market ValueFor the Period: March 1, 2017 to March 31, 2017Fund: Specific Purpose InvestmentsAttachment X
Group Acct Sec Type SecID Description Face Rate Mat Date Par Amortized Cost Market ValueSPI SLIM CTDQ 52668 S OF C LAIF 0 12/31/2017 75,280.03 75,280.03 75,280.03
SPI SLIM CTDQ 53918 S OF C LAIF 0 12/31/2017 73,311.38 73,311.38 73,311.38
SPI SLIM CTDQ 55074 S OF C LAIF 0 12/31/2017 64,945.89 64,945.89 64,945.89
SPI SLIM CTDQ 56612 S OF C LAIF 0 12/31/2017 54,630.76 54,630.76 54,630.76
SPI SLIM CTDQ 58053 S OF C LAIF 0 12/31/2017 49,631.21 49,631.21 49,631.21
SPI SLIM CTDQ 59106 S OF C LAIF 0 12/31/2017 46,406.36 46,406.36 46,406.36
SPI SLIM CTDQ 60183 S OF C LAIF 0 12/31/2017 44,644.62 44,644.62 44,644.62
SPI SLIM CTDQ 61110 S OF C LAIF 0 12/31/2017 41,814.26 41,814.26 41,814.26
SPI SLIM CTDQ 61968 S OF C LAIF 0 12/31/2017 40,971.19 40,971.19 40,971.19
SPI SLIM CTDQ 62782 S OF C LAIF 0 12/31/2017 48,416.11 48,416.11 48,416.11
SPI SLIM CTDQ 64003 S OF C LAIF 0 12/31/2017 58,135.58 58,135.58 58,135.58
SPI SLIM CTDQ 64952 S OF C LAIF 0 12/31/2017 67,994.74 67,994.74 67,994.74
SPI SLIM CTDQ 65951 S OF C LAIF 0 12/31/2017 82,786.72 82,786.72 82,786.72
SPI SLIM CTDQ 66798 S OF C LAIF 0 12/31/2017 94,105.30 94,105.30 94,105.30
SPI SLIM CTDQ 67818 S OF C LAIF 0 12/31/2017 108,222.63 108,222.63 108,222.63
SPI SLIM CTDQ 68719 S OF C LAIF 0 12/31/2017 118,789.82 118,789.82 118,789.82
SPI SLIM CTDQ 69518 S OF C LAIF 0 12/31/2017 136,097.01 136,097.01 136,097.01
SPI SLIM CTDQ 70360 S OF C LAIF 0 12/31/2017 151,399.04 151,399.04 151,399.04
SPI SLIM CTDQ 71269 S OF C LAIF 0 12/31/2017 158,866.84 158,866.84 158,866.84
SPI SLIM CTDQ 72330 S OF C LAIF 0 12/31/2017 159,520.70 159,520.70 159,520.70
SPI SLIM CTDQ 73504 S OF C LAIF 0 12/31/2017 165,030.36 165,030.36 165,030.36
SPI SLIM CTDQ 74485 S OF C LAIF 0 12/31/2017 168,848.34 168,848.34 168,848.34
SPI SLIM CTDQ 75693 S OF C LAIF 0 12/31/2017 161,848.34 161,848.34 161,848.34
SPI SLIM CTDQ 77131 S OF C LAIF 0 12/31/2017 136,599.41 136,599.41 136,599.41
SPI SLIM CTDQ 78104 S OF C LAIF 0 12/31/2017 102,613.52 102,613.52 102,613.52
SPI SLIM CTDQ 79000 S OF C LAIF 0 12/31/2017 93,633.67 93,633.67 93,633.67
SPI SLIM CTDQ 79882 S OF C LAIF 0 12/31/2017 86,272.14 86,272.14 86,272.14
SPI SLIM CTDQ 80621 S OF C LAIF 0 12/31/2017 63,895.36 63,895.36 63,895.36
SPI SLIM CTDQ 81265 S OF C LAIF 0 12/31/2017 51,337.52 51,337.52 51,337.52
SPI SLIM CTDQ 81963 S OF C LAIF 0 12/31/2017 31,005.24 31,005.24 31,005.24
SPI SLIM CTDQ 82761 S OF C LAIF 0 12/31/2017 20,942.34 20,942.34 20,942.34
SPI SLIM CTDQ 83552 S OF C LAIF 0 12/31/2017 18,906.35 18,906.35 18,906.35
SPI SLIM CTDQ 84323 S OF C LAIF 0 12/31/2017 16,628.36 16,628.36 16,628.36
SPI SLIM CTDQ 85020 S OF C LAIF 0 12/31/2017 12,936.00 12,936.00 12,936.00
SPI SLIM CTDQ 85931 S OF C LAIF 0 12/31/2017 11,519.98 11,519.98 11,519.98
SPI SLIM CTDQ 86696 S OF C LAIF 0 12/31/2017 12,561.86 12,561.86 12,561.86
SPI SLIM CTDQ 87360 S OF C LAIF 0 12/31/2017 11,931.63 11,931.63 11,931.63
SPI SLIM CTDQ 88085 S OF C LAIF 0 12/31/2017 9,650.67 9,650.67 9,650.67
SPI SLIM CTDQ 88970 S OF C LAIF 0 12/31/2017 9,668.11 9,668.11 9,668.11
SPI SLIM CTDQ 89872 S OF C LAIF 0 12/31/2017 9,479.68 9,479.68 9,479.68
SPI SLIM CTDQ 90624 S OF C LAIF 0 12/31/2017 8,966.08 8,966.08 8,966.08
SPI SLIM CTDQ 91361 S OF C LAIF 0 12/31/2017 9,020.41 9,020.41 9,020.41
SPI SLIM CTDQ 92234 S OF C LAIF 0 12/31/2017 8,203.52 8,203.52 8,203.52
SPI SLIM CTDQ 92993 S OF C LAIF 0 12/31/2017 7,047.57 7,047.57 7,047.57

Page 28
Los Angeles County TreasurerTreasurer Portfolio Compared to Market ValueFor the Period: March 1, 2017 to March 31, 2017Fund: Specific Purpose InvestmentsAttachment X
Group Acct Sec Type SecID Description Face Rate Mat Date Par Amortized Cost Market ValueSPI SLIM CTDQ 93693 S OF C LAIF 0 12/31/2017 6,149.47 6,149.47 6,149.47
SPI SLIM CTDQ 94336 S OF C LAIF 0 12/31/2017 6,554.92 6,554.92 6,554.92
SPI SLIM CTDQ 95110 S OF C LAIF 0 12/31/2017 6,533.70 6,533.70 6,533.70
SPI SLIM CTDQ 95790 S OF C LAIF 0 12/31/2017 5,767.66 5,767.66 5,767.66
SPI SLIM CTDQ 96362 S OF C LAIF 0 12/31/2017 5,599.62 5,599.62 5,599.62
SPI SLIM CTDQ 96978 S OF C LAIF 0 12/31/2017 6,189.50 6,189.50 6,189.50
SPI SLIM CTDQ 97764 S OF C LAIF 0 12/31/2017 6,512.88 6,512.88 6,512.88
SPI SLIM CTDQ 98442 S OF C LAIF 0 12/31/2017 3,679.29 3,679.29 3,679.29
SPI SLIM CTDQ 99035 S OF C LAIF 0 12/31/2017 2,243.91 2,243.91 2,243.91
SPI SLIM CTDQ 99691 S OF C LAIF 0 12/31/2017 2,557.89 2,557.89 2,557.89
SPI SLIM CTDQ 100462 S OF C LAIF 0 12/31/2017 2,942.65 2,942.65 2,942.65
SPI SLIM CTDQ 101358 S OF C LAIF 0 12/31/2017 3,673.43 3,673.43 3,673.43
SPI SLIM CTDQ 102143 S OF C LAIF 0 12/31/2017 4,334.51 4,334.51 4,334.51
SPI SLIM CTDQ 102793 S OF C LAIF 0 12/31/2017 4,847.55 4,847.55 4,847.55
SPI SLIM CTDQ 103649 S OF C LAIF 0 12/31/2017 5,442.50 5,442.50 5,442.50
SLIM Total 3,200,643.35 3,200,643.35 3,200,643.35
SPI WASIA CTDQ 89873 S OF C LAIF 0 12/31/2017 4,160.52 4,160.52 4,160.52
SPI WASIA CTDQ 90625 S OF C LAIF 0 12/31/2017 12,083.56 12,083.56 12,083.56
SPI WASIA CTDQ 91362 S OF C LAIF 0 12/31/2017 12,156.78 12,156.78 12,156.78
SPI WASIA CTDQ 92235 S OF C LAIF 0 12/31/2017 9,736.54 9,736.54 9,736.54
SPI WASIA CTDQ 92994 S OF C LAIF 0 12/31/2017 25.51 25.51 25.51
SPI WASIA CTDQ 93694 S OF C LAIF 0 12/31/2017 23.17 23.17 23.17
SPI WASIA CTDQ 94337 S OF C LAIF 0 12/31/2017 24.7 24.7 24.7
SPI WASIA CTDQ 95111 S OF C LAIF 0 12/31/2017 24.62 24.62 24.62
SPI WASIA CTDQ 95791 S OF C LAIF 0 12/31/2017 21.73 21.73 21.73
SPI WASIA CTDQ 96363 S OF C LAIF 0 12/31/2017 21.1 21.1 21.1
SPI WASIA CTDQ 96979 S OF C LAIF 0 12/31/2017 23.32 23.32 23.32
SPI WASIA CTDQ 97765 S OF C LAIF 0 12/31/2017 24.54 24.54 24.54
SPI WASIA CTDQ 98441 S OF C LAIF 0 12/31/2017 24.58 24.58 24.58
SPI WASIA CTDQ 99036 S OF C LAIF 0 12/31/2017 27.11 27.11 27.11
SPI WASIA CTDQ 99692 S OF C LAIF 0 12/31/2017 30.9 30.9 30.9
SPI WASIA CTDQ 100463 S OF C LAIF 0 12/31/2017 35.55 35.55 35.55
SPI WASIA CTDQ 101359 S OF C LAIF 0 12/31/2017 44.38 44.38 44.38
SPI WASIA CTDQ 102144 S OF C LAIF 0 12/31/2017 52.36 52.36 52.36
SPI WASIA CTDQ 102794 S OF C LAIF 0 12/31/2017 58.56 58.56 58.56
SPI WASIA CTDQ 103650 S OF C LAIF 0 12/31/2017 65.75 65.75 65.75
WASIA Total 38,665.28 38,665.28 38,665.28
SPI Total 109,192,784.52 109,185,267.89 106,928,891.11 SPI Historical Total 109,184,854.52

LOS ANGELES COUNTY TREASURER Page: 1TRUSTEE & MANAGED FUNDS AS OF 3/31/2017TRUSTEE: DEUTSCHE BANKATTACHMENT XI
ISSUE FUND FUNDDATE TITLE BALANCE
08/31/11 HIGH DESERT COMPLEX SOLAR PROJECTS 2011 QECB 2,930,306.24
DEUTSCHE BANK - TRUSTEE TOTAL $2,930,306.24

LOS ANGELES COUNTY TREASURER Page: 2TRUSTEE & MANAGED FUNDS AS OF 3/31/2017TRUSTEE: BANK OF NEW YORK MELLON TRUST COMPANYATTACHMENT XI
ISSUE FUND FUNDDATE TITLE BALANCE
05/17/00 C.I. 2658M 446,329.15
03/08/06 CCTSA TOBACCO BONDS 2006 28,516,070.58
01/30/03 FLOOD CONTROL REFUNDING SER 2003A & 2005A 41.81
12/11/96 LACPWFA REFUNDING 1996 SERIES A & B 811,800.78
12/21/11 LAC-CAL 2011 SERIES A 2,066,944.21
BANK OF NEW YORK MELLON TRUST COMPANY - TRUSTEE TOTAL $31,841,186.53

LOS ANGELES COUNTY TREASURER Page: 3TRUSTEE & MANAGED FUNDS AS OF 3/31/2017TRUSTEE: U.S. BANKATTACHMENT XI
ISSUE FUND FUNDDATE TITLE BALANCE
02/09/93 DISNEY PROJECT 1993 17,153,489.07
03/21/12 DISNEY PROJECT, 2012 3,574,875.84
03/02/05 MASTER REFUNDING 2005A 10,092.11
11/23/10 MULTIPLE CAPITAL FAC PROJ I A & B (2010) 85,062,033.62
11/01/12 MULTIPLE CAPITAL FAC PROJ II (SERIES 2012) 38,278,513.12
06/26/14 COMMERCIAL PAPER 2014 1,021,233.24
01/05/06 COMMERCIAL PAPER 2016 1,375,862.17
U.S. BANK - TRUSTEE TOTAL $146,476,099.17

LOS ANGELES COUNTY TREASURER Page: 4TRUSTEE & MANAGED FUNDS AS OF 3/31/2017TRUSTEE: ZIONS BANKATTACHMENT XI
ISSUE FUND FUNDDATE TITLE BALANCE
02/04/15 MULTIPLE CAPITAL PROJECTS (2015 SERIES A) 27,910,120.6909/02/15 MULTIPLE CAPITAL PROJECTS (2015 SERIES B & C) 15,860,753.26
LEASE REVENUE BONDS (2016 SERIES D) 3,872,697.11
ZIONS BANK - TRUSTEE TOTAL $47,643,571.06

LOS ANGELES COUNTY TREASURER Page: 5TRUSTEE & MANAGED FUNDS AS OF 3/31/2017TRUSTEE: LOS ANGELES COUNTYATTACHMENT XI
ISSUE FUND FUNDDATE TITLE BALANCE
SPECIAL SAFEKEEPING (KNOX-KEENE) 301,698.08
TREASURER TOTAL $301,698.08

Los Angeles County Treasurer Floating Rate Securities - NTRD PSI Non-TradingAs of 3/31/17Attachment XII
Face Maturity
SEC ID Instrument Description Rate Date Par Cost Reset Provisions
FRCDQ2
102398 TORONTO DOMINION BANK NY FRCD 1.50 05/22/17 50,000,000.00 50,000,831.21 Cpn rate=Qtrly US$LIBOR+45bp.
103167 WESTPAC BANKING CORP NY FRCD 1.23 08/31/17 50,000,000.00 50,001,935.33 Cpn rate=Qtrly US$LIBOR+18bp.
103278 ROYAL BANK OF CANADA NY FRCD 1.41 12/08/17 50,000,000.00 50,000,000.00 Cpn rate=Qtrly US$LIBOR+30bp.
103342 WESTPAC BANKING CORP NY FRCD 1.43 12/15/17 50,000,000.00 50,001,967.95 Cpn rate=Qtrly US$LIBOR+30bp.
103397 WELLS FARGO BANK, NA FRCD 1.49 12/15/17 50,000,000.00 50,000,000.00 Cpn rate=Qtrly US$LIBOR+35bp.
103387 ROYAL BANK OF CANADA NY FRCD 1.45 12/19/17 50,000,000.00 50,000,000.00 Cpn rate=Qtrly US$LIBOR+30bp.
103437 ROYAL BANK OF CANADA NY FRCD 1.47 12/21/17 50,000,000.00 50,000,000.00 Cpn rate=Qtrly US$LIBOR+32bp.
FRCDQ2 Totals 350,000,000.00 350,004,734.49
CORPORATE AND AGENCY ISSUED TOTAL 350,000,000.00 350,004,734.49
BAN
96776 LACCAL BANS 3.75 06/30/17 10,000,000.00 10,000,000.00
97467 LACCAL BANS 3.75 06/30/17 10,000,000.00 10,000,000.00
98159 LACCAL BANS 3.75 06/30/17 10,000,000.00 10,000,000.00
98733 LACCAL BANS 3.75 06/30/17 10,000,000.00 10,000,000.00
100983 LACCAL BANS 1.12 06/30/18 10,000,000.00 10,000,000.00
102161 LACCAL BANS 1.12 06/30/19 10,000,000.00 10,000,000.00
102950 LACCAL BANS 1.12 06/30/19 10,000,000.00 10,000,000.00
BAN Totals 70,000,000.00 70,000,000.00
LOS ANGELES COUNTY ISSUED TOTAL 70,000,000.00 70,000,000.00
NTRD - PSI NON-TRADING Total 420,000,000.00 420,004,734.49
CORPORATE AND AGENCY ISSUED
6-month U.S. Treasury Bill + 50% at
the time of draw. Interest adjusted
on Jan 2 and July 1. Interest
accrued to that point will be
payable on that date. Reset to
Bank of America prime rate on the
3rd reset date.

BOND ANTICIPATION NOTES
LACCAL
SEC ID DESCRIPTION DRAW DATE AMOUNT RATE
96776 LACCAL 09/12/14 10,000,000.00 3.750%
97467 LACCAL 12/10/14 10,000,000.00 3.750%
98159 LACCAL 03/23/15 10,000,000.00 3.750%
98733 LACCAL 06/01/15 10,000,000.00 3.750%
100983 LACCAL 03/18/16 10,000,000.00 1.120%
102161 LACCAL 07/20/16 10,000,000.00 1.120%
102950 LACCAL 11/02/16 10,000,000.00 1.120%
70,000,000.00$
LOS ANGELES COUNTY TREASURERBOND ANTICIPATION NOTES AND LACCALAS OF 3/31/2017ATTACHMENT XIII

Los Angeles County Treasurer
Inventory Report - Totals Section
Security Type Grouping - Cost & Wtd Avg Days To Maturity
As of 3/31/17Attachment XIV
SECURITY TYPE COST COST
COLLATERALIZED CDS 0.00 0.00 DAYS 0.00 0.00 DAYS
NEGOTIABLE CDS 3,775,015,390.31 64.66 DAYS 0.00 0.00 DAYS
EURO CDS 0.00 0.00 DAYS 0.00 0.00 DAYS
BANKERS ACCEPTANCE 0.00 0.00 DAYS 0.00 0.00 DAYS
COMMERCIAL PAPER 8,689,733,387.99 27.85 DAYS 0.00 0.00 DAYS
GOVERNMENTS 1,219,979,786.80 211.34 DAYS 197,849,725.37 1,636.31 DAYS
AGENCIES 15,657,923,603.47 1,202.20 DAYS 0.00 0.00 DAYS
MUNICIPALS 70,000,000.00 351.71 DAYS 0.00 0.00 DAYS
CORP & DEPOSIT NOTES 49,941,540.13 657.70 DAYS 0.00 0.00 DAYS
REPURCHASE AGREEMENT 0.00 0.00 DAYS 0.00 0.00 DAYS
ASSET BACKED 0.00 0.00 DAYS 0.00 0.00 DAYS
OTHER 0.00 0.00 DAYS 0.00 0.00 DAYS
TOTAL $29,462,593,708.70 666.11 DAYS $197,849,725.37 1,636.31 DAYS
NON-TRADING TRADING
WTD AVG DTM WTD AVG DTM

Page: 1
Los Angeles County Treasurer
Inventory Report - Totals Section
Maturity Range Grouping
As of 3/31/17
Attachment XV
Maturity Range Date Range Par Amount % % Amortized Cost % %
PSI - NTRD/TRD
1 to 30 Days 04/01/17 - 04/30/17 $7,529,054,000.00 25.36 25.36 $7,526,971,279.14 25.38 25.38
31 to 60 Days 05/01/17 - 05/30/17 $3,038,800,000.00 10.24 35.60 $3,036,393,410.62 10.24 35.62
61 to 90 Days 05/31/17 - 06/29/17 $1,106,061,000.00 3.73 39.33 $1,104,815,857.82 3.72 39.34
91 to 120 Days 06/30/17 - 07/29/17 $690,000,000.00 2.32 41.65 $689,585,986.85 2.32 41.66
121 to 180 Days 07/30/17 - 09/27/17 $370,055,000.00 1.25 42.90 $369,359,627.55 1.25 42.91
181 to 270 Days 09/28/17 - 12/26/17 $986,535,000.00 3.32 46.22 $985,246,872.89 3.32 46.23
271 to 365 Days 12/27/17 - 03/31/18 $1,139,640,000.00 3.84 50.06 $1,132,410,169.48 3.82 50.05
1 to 1.5 YEARS 04/01/18 - 09/29/18 $282,370,000.00 0.95 51.01 $281,737,212.08 0.95 51.00
1.5 to 2 YEARS 09/30/18 - 03/31/19 $1,985,655,000.00 6.69 57.70 $1,984,903,344.37 6.69 57.69
2 to 3 YEARS 03/31/19 - 03/31/20 $2,589,522,000.00 8.72 66.42 $2,586,244,807.25 8.72 66.41
3 to 4 YEARS 03/31/20 - 03/31/21 $3,425,290,000.00 11.54 77.96 $3,423,238,084.82 11.54 77.95
4 to 5 YEARS 03/31/21 - 03/31/22 $6,543,885,000.00 22.04 100.00 $6,539,536,781.20 22.05 100.00
Portfolio Total: $29,686,867,000.00 $29,660,443,434.07
GF
4 to 5 YEARS 03/31/21 - 03/31/22 $4,275,000.00 100.00 100.00 $4,275,000.00 100.00 100.00
Portfolio Total: $4,275,000.00 $4,275,000.00
PHHPA
10 + YEARS 03/31/27 - 03/31/67 $32,176,000.00 100.00 100.00 $32,168,760.78 100.00 100.00
Portfolio Total: $32,176,000.00 $32,168,760.78
SANIT
181 to 270 Days 09/28/17 - 12/26/17 $130,000.00 2.55 2.55 $129,981.85 2.55 2.55
1 to 1.5 YEARS 04/01/18 - 09/29/18 $476,000.00 9.32 11.87 $476,000.00 9.32 11.87
4 to 5 YEARS 03/31/21 - 03/31/22 $4,500,000.00 88.13 100.00 $4,499,740.74 88.13 100.00
Portfolio Total: $5,106,000.00 $5,105,722.59

Page: 2
Los Angeles County Treasurer
Inventory Report - Totals Section
Maturity Range Grouping
As of 3/31/17
Attachment XV
Maturity Range Date Range Par Amount % % Amortized Cost % %
SCAQM
181 to 270 Days 09/28/17 - 12/26/17 $21,649.61 0.05 0.05 $21,649.61 0.05 0.05
271 to 365 Days 12/27/17 - 03/31/18 $39,374,826.28 99.95 100.00 $39,374,826.28 99.95 100.00
Portfolio Total: $39,396,475.89 $39,396,475.89
SCP61
271 to 365 Days 12/27/17 - 03/31/18 $10,000,000.00 100.00 100.00 $10,000,000.00 100.00 100.00
Portfolio Total: $10,000,000.00 $10,000,000.00
SCP6F
271 to 365 Days 12/27/17 - 03/31/18 $10,000,000.00 100.00 100.00 $10,000,000.00 100.00 100.00
Portfolio Total: $10,000,000.00 $10,000,000.00
SCP6U
271 to 365 Days 12/27/17 - 03/31/18 $5,000,000.00 100.00 100.00 $5,000,000.00 100.00 100.00
Portfolio Total: $5,000,000.00 $5,000,000.00
SLIM
271 to 365 Days 12/27/17 - 03/31/18 $3,200,643.35 100.00 100.00 $3,200,643.35 100.00 100.00
Portfolio Total: $3,200,643.35 $3,200,643.35
WASIA
271 to 365 Days 12/27/17 - 03/31/18 $38,665.28 100.00 100.00 $38,665.28 100.00 100.00
Portfolio Total: $38,665.28 $38,665.28

In Thousands %
1 - 30 days 7,526,971$ 25.38%
31 - 60 days 3,036,393 10.24%
61 - 180 days 2,163,761 7.29%
181 - 1 yr 2,117,657 7.14%
1 - 3 yrs 4,852,885 16.36%
3 - 5 yrs 9,962,775 33.59%
5 - 10 yrs - 0.00%
10+ yrs - 0.00%
29,660,443$ 100.00%
LOS ANGELES COUNTY TREASURER
COMPOSITION OF PSI PORTFOLIO BY MATURITY
AS OF MARCH 2017
ATTACHMENT XVI
L.A.C. INVESTMENT POOL
Maturity Limits Are In Compliance With The Los Angeles County Treasurer's Investment Policy.
0%
5%
10%
15%
20%
25%
30%
35%
40%
1-30 days 31-60 days 61-180 days 181 - 1 yr 1-3 yrs 3-5 yrs 5-10 yrs 10+ yrs

LOCAL AGENCY INVESTMENT FUND
FOR SPECIFIC INVESTMENTSAs of 3/31/17ATTACHMENT XVII
ISSUE FUND FUNDDATE TITLE BALANCE
SCHOOLS LINKED FOR INSURANCE MANAGEMENT (SLIM) $3,200,643.35SOUTH COAST AIR QUALITY MGMT DISTRICT (SCAQMD) 39,396,475.89 WHITTIER AREA SCHOOLS INSURANCE AUTHORITY (WASIA) 38,665.28
LAIF TOTAL $42,635,784.52

STATE TREASURER AND LOCAL AGENCY INVESTMENT FUND FEBRUARY20!7 A 1T ACHMENT XVII
~\"-VESr-41.
~~0"'1 POOLED MONEY INVESTMENT ACCOUNT
. ' .. .,.,.1:'• ., #"" '>-11~uiti<\'"
Summary of Investment Data A Comparison of February 2017 with February 2016
(Dollars In Thousands)
February 2017 II February 2016 II Change
Average Daily Portfolio ($)
Accrued Earnings ($)
Effective Yield (%)
Average Life-Month End (In Days)
Total Security Transactions
Amount($)
Number
Total Time Deposit Transactions
Amount($)
Number
Average Workday Investment Activity ($)
Prescribed Demand Account Balances
For Services ($)
1
68,284,159
40,712
0.777
186
24,757,319
496
1,933,300
79
1,404,769
950,700
64,724,907
23,930
0.467
159
24,307,388
488
2,840,000
117
1,357,369
2,024,500
+3,559,252
+16,782
+0.31
+27
+449,931
+8
-906,700
-38
+47,400
-1,073,800

ST ATE TREASURER AND LOCAL AGENCY INVESTMENT FUND FEBRUARY 2017 A TT ACHMJ\W XVII
~;\ r~ . ;9"'% POOLED MONEY INVESTMENT ACCOUNT
i,, ·~ -:. ... ;;--, - --~
"·t1au~·
Selected Investment Data Analysis of the Pooled Money Investment Account Portfolio
(Dollars In Thousands)
February 28, 2017
DIFFERENCE IN PERCENT OF
PERCENT OF PORTFOLIO FROM TYPE OF SECURITY AMOUNT!$! PORTFOLIO PRIOR MONTH
Government Bills 13,882,789 19.99 +2.45
Bonds 0 0.00 0
Notes 18,985,202 27.33 -3.23 Strips 0 0.00 0
Total Government 32,867,991 47.32 -0.78
Agency Debentures 1,923,827 2.77 +0.19
Certificates of Deposit 11,400,000 16.41 -0.20
Bank Notes 500,000 0.72 +0.18
Repurchases 0 0.00 0
Agency Discount Notes 7,670,102 11.04 +0.51
Time Deposits 5,412,740 7.79 +0.53
GNMAs 0 0.00 0
Commercial Paper 6,283,449 9.05 -1.77
Remics 46,922 0.07 0
Corporate Bonds 0 0.00 0
AB 55 Loans 535,094 0.77 +0.05
GF Loans 2,618,900 3.77 +1.27
Other 200,000 0.29 +0.02 Reversed Repurchases 0 0.00 0
Total (All Types) 69,459,025 100.00
INVESTMENT ACTIVITY FEBRUARY 2017 JANUARY 2017
NUMBER AMOUNT !~l NUMBER AMOUNT !~l
Pooled Money 496 24,757,319 468 23,329,761
Other 11 36,732 2 310
Time Deposits 79 1,933,300 159 4,022,000
Total 586 26,727,351 629 27,352,071
PMIA Monthly Average Effective Yield (%) 0.777 0.751
Year to Date Yield Last Day of Month(%) 0.675 0.662
2

ST ATE TREASURER AND LOCAL AGENCY INVESTMENT FUND FEBRUARY 2017 ATTACHMENT XVII
Pooled Money Investment Account Portfolio Composition
$69.5 billion 2/28/17
Commercial Paper 9.05%
Certificates of Deposit/Bank Notes
17.13%
Agencies 14.10%
Loans 4.54%
3
Mortgages 0.07%
Treasuries 47.32%

STATE TREASURER AND LOCAL AGENCY INVESTMENT FUND FEBRUARY2017 A IT AC HM ENT XVII
INVESTMENT TRANSACTIONS
~· .. MAtl.JRITY tRANs . i>AR:($f DA vs· .. ANloUlllt .. EFFECTIVE j ' DATE ... TYPE ... ... DESCRIPTION CPN 1%) DATE YIELD(%! (000) ...... HELD EARNED !Sl YIELD!%) ' ... .. ..• . .
02101/17 REDEMPTIONS
BN BOFA 0.850 02/01/17 0.850 50,000 218 257,361.11 0.862 BN BOFA 0.850 02/01/17 0.850 50,000 218 257,361.11 0.862 CP BNP NY 02/01/17 0.660 50,000 6 5,500.00 0.669 CP GECO 02/01/17 0.590 50,000 19 15,569.44 0.598 CP GECO 02/01/17 0.590 50,000 19 15,569.44 0.598 CP TOKYO NY 02/01/17 0.740 50,000 21 21,583.33 0.751 CP TOKYO NY 02/01/17 0.740 50,000 21 21,583.33 0.751 CP BNP NY 02/01/17 0.700 50,000 27 26,250.00 0.710 CP BNP NY 02/01/17 0.700 50,000 27 26,250.00 0.710 CP BNP NY 02/01/17 0.700 50,000 27 26,250.00 0.710 CP BNP NY 02/01/17 0.700 50,000 27 26,250.00 0.710 CP GECTS 02/01/17 0.550 50,000 ,, 62 47,361.11 0.558 CP BNP NY 02/01/17 0.740 50,000 83 85,305.56 0.752 CP BNP NY 02/01/17 0.740 50,000 83 85,305.56 0.752 CP MIZUHO NY 02/01/17 0.780 50,000 83 89,916.67 0.792 CP MIZUHO NY 02/01/17 0.780 50,000 83 89,916.67 0.792 CP LIBERTY 02/01/17 0.840 50,000 83 96,833.33 0.853 CP GECTS 02/01/17 0.580 50,000 97 78,138.89 0.589 CP GECTS 02/01/17 0.580 50,000 97 78,138.89 0.589 CP SOC GEN NY 02/01/17 0.850 50,000 97 114,513.89 0.864 CP SOC GEN NY 02/01/17 0.860 50,000 103 123,027.78 0.874 CP SOC GEN NY 02/01/17 0.860 50,000 103 123,027.78 0.874 CP CRC 02/01/17 1.040 50,000 139 200,777.78 1.059 CP CAFCO 02/01/17 1.060 50,000 183 269,416.67 1.081 CP CAFCO 02101/17 1.060 50,000 183 269,416.67 1.081 DN FNMA 02/01/17 0.410 50,000 161 91,680.56 0.416 DN FNMA 02/01/17 0.410 50,000 161 91,680.56 0.416 DN FNMA 02/01/17 0.410 50,000 161 91,680.56 0.416 DN FNMA 02/01/17 0.410 50,000 161 91,680.56 0.416 DN FHLMC 02/01/17 0.400 50,000 209 116,111.11 0.406 DN FHLMC 02/01/17 0.400 50,000 209 116,111.11 0.406 DN FNMA 02/01/17 0.400 50,000 222 123,333.33 0.407 DN FNMA 02/01/17 0.400 50,000 .222 123,333.33 0.407 DN FNMA 02/01/17 0.400 50,000 222 123,333.33 0.407 DN FNMA 02/01/17 0.400 50,000 222 123,333.33 0.407 DN FHLMC 02/01/17 0.470 50,000 224 146,222.22 0.478 DN FHLMC 02/01/17 0.470 50,000 224 146,222.22 0.478 DN FNMA 02/01/17 0.550 50,000 252 192,500.00 0.560 DN FNMA 02/01/17 0.550 50,000 252 192,500.00 0.560 YCD TOKYO-MIT 0.720 02/01/17 0.720 50,000 27 27,000.00 0.730 YCD TOKYO-MIT 0.720 02/01/17 0.720 50,000 27 27,000.00 0.730 YCD TOKYO-MIT 0.720 02/01/17 0.720 50,000 27 27,000.00 0.730 YCD TOKYO-MIT 0.720 02/01/17 0.720 ffe0,000 27 27,000.00 0.730 YCD SOC GEN 0.710 02/01/17 0.710 ·50,000 28 27,611.11 0.720 YCD SOC GEN 0.710 02/01/17 0.710 50,000 28 27,611.11 0.720 YCD MIZUHO 0.650 02/01/17 0.650 50,000 64 57,777.78 0.659 YCD MIZUHO 0.650 02/01/17 0.650 50,000 64 57,777.78 0.659
4

ST ATE TREASURER AND LOCAL AGENCY INVESTMENT FUND FEBRUARY 2017 A TI ACHMENT XVll
INVESTMENT TRANSACTIONS
ii . llilAtilR.itv TRANS PAR($) DAYS AMOUNT EFFEctiVif ' . DATE .. TYPE DESCRIPTION CPN {%} DATE YIELD{%} .. .. {DOOL .. HELD EARNED {ll YIELD{%}
02/01/17 REDEMPTIONS (Continued)
YCD NORINCHUK 0.850 02/01/17 0.850 50,000 89 105,069.44 0.862 YCD NORINCHUK 0.850 02/01/17 0.850 50,000 89 105,069.44 0.862 YCD TORONTO 0.690 02/01/17 0.690 50,000 90 86,250.00 0.700 YCD TORONTO 0.690 02/01/17 0.690 50,000 90 86,250.00 0.700 YCD BNP 0.840 02/01/17 0.840 50,000 90 105,000.00 0.852 YCD BNP 0.840 02/01/17 0.840 50,000 90 105,000.00 0.852 YCD MIZUHO 0.850 02/01/17 0.850 50,000 90 106,250.00 0.862 YCD MIZUHO 0.850 02/01/17 0.850 50,000 90 106,250.00 0.862 YCD BARCLAYS 0.810 02/01/17 0.810 50,000 92 103,500.00 0.821 YCD BARCLAYS 0.810 02/01/17 0.810 50,000 92 103,500.00 0.821 YCD TOKYO-MIT 0.860 02/01/17 0.860 50,000 93 111,083.33 0.872 YCD TOKYO-MIT 0.860 02/01/17 0.860 50,000 93 111,083.33 0.872 YCD BNP 0.870 02/01/17 0.870 50,000 103 124,458.33 0.882 YCD BNP 0.870 02/01/17 0.870 50,000 103 124,458.33 0.882
02/01/17 PURCHASES
CP RABO NY 02/02/17 0.660 50,000 CP RABO NY 02/02/17 0.660 50,000 CP RABO NY 02/02/17 0.660 50,000 CP RABO NY 02/02117 0.660 50,000 YCD BNP 0.710 03/02/17 0.710 50,000 YCD BNP 0.710 03/02/17 0.710 50,000 YCD BNP 0.710 03/02/17 0.710 50,000 YCD SUMITOMO 0.730 03/08/17 0.730 50,000 YCD SUMITOMO 0.730 03/08/17 0.730 50,000
02102/17 REDEMPTIONS
CP RABO NY 02/02/17 0.660 50,000 1 916.67 0.669. CP RABO NY 02/02/17 0.660 50,000 1 916.67 0.669 CP RABO NY 02/02/17 0.660 50,000 1 916.67 0.669 CP RABO NY 02/02/17 0.660 50,000 1 916.67 0.669 CP BNP NY 02/02/17 0.560 50,000 2 1,555.56 0.568 CP BNP NY 02/02/17 0.560 50,000 2 1,555.56 0.568 CP BNP NY 02/02/17 0.560 50,000 2 1,555.56 0.568 TR BILL 02/02/17 0.515 50,000 346 247,486.11 0.526 TR BILL 02/02/17 0.515 50,000 346 247,486.11 0.526 TR BILL 02/02/17 0.515 50,000 346 247,486.11 0.526 TR BILL 02102/17 0.508 50,000 349 245,996.53 0.519 TR BILL 02102/17 0.508 50,000 349 245,996.53 0.519 TR BILL 02/02/17 0.508 50,000 349 245,996.53 0.519 TR BILL 02102/17 0.508 50,000 349 245,996.53 0.519 TR BILL 02/02/17 0.505 50,000 350 245,486.11 0.516 TR BILL 02/02/17 0.505 50,000 350 245,486.11 0.516 TR BILL 02/02/17 0.515 50,000 364 260,361.11 0.526 TR BILL 02/02/17 0.515 50,000 364 260,361.11 0.526
5
ST ATE TREASURER AND LOCAL AGENCY INVESTMENT FUND FEBRUARY 2017 A TI ACHMENT XVII
INVESTMENT TRANSACTIONS
.
!! MATURITY . TRA.Ns· . F'AR ($} . DAYS ...... AMOUNT EFi=ECi'iVE] .DATE .. TYPE .. DESCRIPTION .. CPN !%! DATE YIELD!%! (000) HELD EARNED !Sl YIELD(%) , .. ,.J . 02/02/17 REDEMPTIONS (Continued)
TR BILL 02/02/17 0.528 50,000 364 266,680.56 0.539 TR BILL 02/02/17 0.528 50,000 364 266,680.56 0.539 TR BILL 02/02/17 0.538 50,000 364 271,736.11 0.549 TR BILL 02/02/17 0.538 50,000 364 271,736.11 0.549
02/02/17 PURCHASES
CP RABO NY 02/17/17 0.680 50,000 CP RABO NY 02117/17 0.680 50,000 CP CRC 08/01/17 1.160 50,000 TR BILL 02/01/18 0.795 50,000 TR BILL 02/01/18 0.795 50,000 TR BILL 02/01/18 0.810 50,000 TR BILL 02/01/18 0.810 . 50,000 TR BILL 02/01/18 0.810 50,000 TR BILL 02/01/18 0.815 50,000 TR BILL 02/01/18 0.815 50,000 YCD TOKYO-MIT 0.760 03/01/17 0.760 50,000 YCD TOKYO-MIT 0.760 03/01/17 0.760 50,000
02/03/17 SALES
TR NOTE 0.500 04/30/17 50,000 624 514,232.06 0.603 TR NOTE 0.500 04/30/17 50,000 624 514,232.06 0.603 TR NOTE 0.500 04/30/17 50,000 631 503,362.49 0.583 TR NOTE 0.500 04/30/17 50,000 631 503,362.49 0.583 TR NOTE 0.500 04/30/17 50,000 645 508,967.11 0.577 TR NOTE 0.500 04/30/17 50,000 645 508,967.11 0.577
02/03/17 REDEMPTIONS
CP BNP NY 02/03/17 0.680 50,000 7 6,611.11 0.690 CP BNP NY 02/03/17 0.680 50,000 7 6,611.11 0.690 CP TOKYO NY 02/03/17 0.730 50,000 9 9, 125.00 0.740 CP TOKYO NY 02/03/17 0.730 50,000 9 9, 125.00 0.740 CP GECO 02/03/17 0.560 50,000 11 8,555.56 0.568 CP GECO 02/03/17 0.560 50,000 11 8,555.56 0.568 CP TOKYO NY 02/03/17 0.730 50,000 15 15,208.33 0.740 CP TOKYO NY 02/03/17 0.730 50,000 15 15,208.33 0.740
02/03/17 PURCHASES
TR BILL 02/01/18 0.780 50,000 TR BILL 02/01/18 0.780 .50,000 TR BILL 02/01/18 0.780 50,000 TR BILL 02/01/18 0.780 50,000
6

ST ATE TREASURER AND LOCAL AGENCY INVESTMENT FUND FEBRUARY 2017 A TI ACHMENT XVII
INVESTMENT TRANSACTIONS
... .!!" MATURITY TRANS ... PAR($) . oAvs AMoU!\11' EFFECTIVE] . DATE ____ TYPE_ DESCRIPTION CPN 1%l DATE_ YIELD 1%l 1000) HELD ___ EARNED 1$) YIELD 1%l l .. . 02/03/17 PURCHASES (Continued)
TR BILL 02/01/18 0.795 50,000 TR BILL 02/01i18 0.795 50,000
02/06/17 REDEMPTIONS
CP TOKYO NY 02/06/17 0.740 50,000 25 25,694.44 0.751 CP TOKYO NY 02/06/17 0.740 50,000 25 25,694.44 0.751 CP GECO 02/06/17 0.600 50,000 26 21,666.67 0.609 CP GECO 02/06/17 0.600 50,000 26 21,666.67 0.609 CP TOYOTA 02/06/17 0.670 50,000 69 64,208.33 0.680 CP TOYOTA 02/06/17 0.670 50,000 69 64,208.33 0.680 YCD NORDEA AB 0.670 02/06/17 0.670 50,000 14 13,027.78 0.679 YCD NORDEA AB 0.670 02/06/17 0.670 50,000 14 13,027.78 0.679 YCD NORDEA AB 0.670 02/06/17 0.670 50,000 14 13,027.78 0.679 YCD NORDEA AB 0.670 02/06/17 0.670 50,000 14 13,027.78 0.679 YCD NORINCHUK 0.750 02/06/17 0.750 50,000 33 34,375.00 0.760 YCD NORINCHUK 0.750 02/06/17 0.750 50,000 33 34,375.00 0.760 YCD NORI NCH UK 0.750 02/06/17 0.750 50,000 33 34,375.00 0.760
02/06/17 NO PURCHASES
02/07 /17 SALES
TR NOTE 0.500 04/30/17 50,000 649 539,073.29 0.608 TR NOTE 0.500 04/30/17 50,000 649 539,073.29 0.608 TR NOTE 0.500 04/30/17 50,000 649 539,073.29 0.608 TR NOTE 0.500 04/30/17 50,000 649 539,073.29 0.608
02107/17 NO REDEMPTIONS
02/07/17 PURCHASES
TR BILL 02/01/18 0.766 50,000 TR BILL 02/01/18 0.766 50,000 TR BILL 02/01/18 0.770 50,000 TR BILL 02/01/18 0.770 50,000
02/08/17 REDEMPTIONS
CP SOC GEN NY 02/08/17 0.710 50,000 34 33,527.78 0.720 CP SOC GEN NY 02/08/17 0.710 50,000 34 33,527.78 0.720 CP SOC GEN NY 02/08/17 0.710 50,000 34 33,527.78 0.720 CP SOC GEN NY 02/08/17 0.71.0 50,000 34 33,527.78 0.720 YCD SUMITOMO 0.730 02/08/17 0.730 50,000 27 27,375.00 0.740 YCD SUMITOMO 0.730 02/08/17 0.730 50,000 27 27,375.00 0.740
02/08/17 NO PURCHASES
7

STATE TREASURER AND LOCAL AGENCY INVESTMENT FUND FEBRUARY 2017 A TI ACHMENT XVII
INVESTMENT TRANSACTIONS
.. !I MATl.JRii'Y TRANS PAR($) DAvs· AMOUNT EFFECTIVE
,_DATE TYPE.~ DESCRIPTION CPN (%} DATE .. YIELD(%} 02/09/17 REDEMPTIONS
-~~ ~~
(ODO} HELD EARNED(~} YIELD(%}
CP TOKYO NY 02/09/17 0.750 50,000 17 17,708.33 0.761 CP TOKYO NY 02/09/17 0.750 50,000 17 17,708.33 0.761 CP TOKYO NY 02/09/17 0.750 50,000 17 17,708.33 0.761 YCD DNB 0.660 02/09/17 0.660 50,000 15 13,750.00 0.669 YCD DNB 0.660 02/09/17 0.660 50,000 15 13,750.00 0.669 YCD SOC GEN 0.700 02/09/17 0.700 50,000 21 20,416.67 0.710 YCD SOC GEN 0.700 02/09/17 0.700 50,000 21 20,416.67 0.710 YCD SOC GEN 0.700 02/09/17 0.700 50,000 21 20,416.67 0.710 YCD SOC GEN 0.700 02/09/17 0.700 50,000 21 20,416.67 0.710
02/09/17 PURCHASES
CP BNP NY 02/10/17 0.660 50,000 CP BNP NY 02/10/17 0.660 50,000 CP BNP NY 02/10/17 0.660 50,000 CP BNP NY 02/10/17 0.660 50,000 CP RABO NY 02/10/17 0.660 50,000 CP RABO NY 02/10/17 0.660 50,000 CP RABONY 02/13/17 0.660 50,000 CP RABONY 02/13/17 0.660 50,000 CP TOKYO NY 03/06/17 0.760· 50,000 CP TOKYO NY 03/06/17 0.760 50,000 YCD SOC GEN 0.710 03/13/17 0.710 50,000 YCD SOC GEN 0.710 03/13/17 0.710 50,000
02/10/17 REDEMPTIONS
CP BNP NY 02/10/17 0.660 50,000 1 916.67 0.669 CP BNP NY 02/10/17 0.660 50,000 1 916.67 0.669 CP BNP NY 02/10/17 0.660 50,000 1 916.67 0.669 CP BNP NY 02/10/17 0.660, 50,000 1 916.67 0.669 CP RABO NY 02/10/17 0.660 50,000 1 916.67 0.669 CP RABO NY 02/10/17 0.660 50,000 1 916.67 0.669 CP BNP NY 02/10/17 0.690· 50,000 28 26,833.33 0.700 CP BNP NY 02/10/17 0.690 50,000 28 26,833.33 0.700
02/10/17 PURCHASES
CP RABO NY 02/21/17 0.670 50,000
02/13/17 REDEMPTIONS .. CP RABO NY 02/13/17 0.660 50,000 4 3,666.67 0.669 CP RABO NY 02/13/17 0.660 50,000 4 3,666.67 0.669 CP BNP NY 02/13/17 0.680 50,000 19 17,944.44 0.690 CP BNP NY 02/13/17 0.680, 50,000 19 17,944.44 0.690 CP BNP NY 02/13/17 0.680 50,000 19 17,944.44 0.690
8 ..

ST ATE TREASURER AND LOCAL AGENCY INVESTMENT FUND FEBRUARY2017 ATTACHMENT XVII
INVESTMENT TRANSACTIONS
!I MATURITY ..
TRANS PAR($) . DAYS AMOUNT EFFECTIVE 1 •
.J!A!S_.TYPE. .. DESCRIPTION CPN !%) ..... DATE .. YIELD !%l __ (OOOL_HELD ..... EARNED($) YIELD!%) • ,._,
02/13/17 PURCHASES
DEB FFCB 1.200 02/13/19 1.220 25,000
02/14/17 NO REDEMPTIONS
02/14/17 PURCHASES
CP RABONY 02/15/17 0.660 50,000
02/15/17 SALES
TR NOTE 0.500 04/30/17 50,000 624 539,757.80 0.633 TR NOTE 0.500 04/30/17 50.000 624 539,757.80 0.633 TR NOTE 0.500 04/30/17 50,000 636 537, 167.79 0.618 TR NOTE 0.500 04/30/17 50,000 636 537, 167.79 0.618
02/15/17 REDEMPTIONS
CP RABO NY 02/15/17 0.660 50,000 1 916.67 0.669 CP SOC GEN NY 02/15/17 0.710 50,000 29 28,597.22 0.720 CP SOC GEN NY 02/15/17 0.710 50,000 29 28,597.22 0.720 CP SOC GEN NY 02/15/17 0.710 50,000 29 28,597.22 0.720 CP TOKYO NY 02/15/17 0.760 50,000 33 34,833.33 0.771 CP TOKYO NY 02/15/17 0.760 50,000 33 34,833.33 0.771 CP SOC GEN NY 02/15/17 0.710 50,000 34 33,527.78 0.720 CP SOC GEN NY 02/15/17 0.710 50,000 34 33,527.78 0.720 CP SOC GEN NY 02/15/17 0.710 50,000 34 33,527.78 0.720 CP TOKYO NY 02/15/17 0.760 50,000 34 35,888.89 0.771 CP TOKYO NY 02/15/17 0.760 50,000 34 35,888.89 0.771 CP BNP NY 02/15/17 0.760 50,000 62 65,444.44 0.772 CP BNP NY 02/15/17 0.760 50,000 62 65,444.44 0.772 CP TOYOTA 02/15/17 0.700 50,000 76 73,888.89 0.711 CP TOYOTA 02/15/17 0.700 50,000 76 73,888.89 0.711 CP JPM LLC 02/15/17 0.920 50,000 189 241,500.00 0.937 CP JPM LLC 02/15/17 0.920 50,000 189 241,500.00 0.937 TR NOTE 0.625 02/15/17 0.783 50,000 785 838,824.73 0.785 TR NOTE 0.625 02/15/17 0.751 50,000 790 809,867.52 0.752 TR NOTE 0.625 02/15/17 0.751 50,000 790 809,867.52 0.752 TR NOTE 0.625 02/15/17 0.753 50,000 799 821,416.44 0.755 TR NOTE 0.625 02/15/17 0.753 50,000 799 821,416.44 0.755 TR NOTE 0.625 02/15/17 0.753 50,000 (99 821,416.44 0.755 TR NOTE 0.625 02/15/17 0.753 ·50,000 799 821,416.44 0.755 TR NOTE 0.625 02/15/17 0.751 50,000 800 820,312.50 0.753 TR NOTE 0.625 02/15/17 0.751 50,000 800 820,312.50 0.753 YCD MONTREAL 0.800 02/15/17 0.800 50,000 35 38,888.89 0.811 YCD MONTREAL 0.800 02/15/17 0.800 50,000 35 38,888.89 0.811 YCD SUMITOMO 0.730 02/15/17 0.730 50,000 40 40,555.56 0.740 YCD SUMITOMO 0.730 02/15/17 0.730 50,000 40 40,555.56 0.740
9

STATE TREASURER AND LOCAL AGENCY INVESTMENT FUND FEBRUARY 2017 ATTACHMENT XVII
INVESTMENT TRANSACTIONS
!! MATURITY tRANs PAR($) DAYS ..... AMOUNT EFFECTIVE . DATE.TYPE ........ DESCRIPTION CPN 1%! DATE YIELD 1%1 (0001 HELD EARNED IS) YIELD(%)
~ "-~' ··-~ . . ... 02/15/17 REDEMPTIONS (Continued)
YCD SVENSKA 0.750 02/15/17 0.750 50,000 58 60,416.67 0.760 YCD SVENSKA 0.750 02/15/17 0.750 50,000 58 60,416.67 0.760 YCD SE BANKEN 0.790 02/15/17 0.790 50,000 118 129,472.22 0.801 YCD SE BANKEN 0.790 02/15/17 0.790 50,000 118 129,472.22 0.801
02/15/17 PURCHASES
CP JPM LLC 08/16/17 1.170 50,000 CP JPM LLC 08/16/17 1.170 50,000 TR BILL 02/01/18 0.808 50,000 TR BILL 02/01/18 0.820 50,000 TR BILL 02/01/18 0.820 50,000 TR BILL 02/01/18 0.820 50,000 TR BILL 02/01/18 0.820 50,000
02/16/17 NO REDEMPTIONS
02/16/17 PURCHASES
BN BOFA 0.980 05/17/17 0.980 50,000 BN BOFA 0.980 05/17/17 0.980 50,000 CP RABO NY 02/28/17 0.680 50,000 CP RABO NY 02/28/17 0.680 50,000 CP BNP NY 03/01/17 0.680 50,000 CP BNP NY 03/01/17 0.680 50,000 CP TOKYO NY 03/08/17 0.720 50,000 CP TOKYO NY 03/08/17 0.720 50,000 CP TOKYO NY 03/08/17. 0.720 50,000 CP NISSAN 03/24/17 0.800 50,000 CP NISSAN 03/24/17 0.800 50,000 TR NOTE 1.375 02/15/20 1.565 50,000 TR NOTE 1.375 02/15/20 1.565 50,000 YCD MONTREAL 0.680 03/13/17 0.680 50,000 YCD MONTREAL 0.680 03/13/17 0.680 50,000 YCD SUMITOMO 0.700 03/28/17 0.700 50,000 YCD SUMITOMO 0.700 03/28/17 0.700 50,000
02/17/17 REDEMPTIONS
CP RABONY 02/17/17 0.680 50,000 15 14, 166.67 0.690 CP RABONY 02/17/17 0.680 50,000 15 14, 166.67 0.690
02/17/17 PURCHASES
CP RABO NY 02/28/17 0.670 50,000 CP RABO NY 02/28/17 0.670 50,000 YCD NORDEA AB 0.660• 02/28/17 0.660 50,000 YCD NORDEA AB 0.660 02/28/17 0.660 50,000
10

i
STATE TREASURER AND LOCAL AGENCY INVESTMENT FUND FEBRUARY2017 ATTACHMENT XVII
~-
. DATE . TYPE . DESCRIPTION 02/21/17 REDEMPTIONS
CP RABO NY
02/21/17 PURCHASES
CP TOKYO NY CP TOKYO NY CP BNP NY CP BNP NY CP BNP NY CP BNP NY CP GECO CP GECO
02/22/17 NO REDEMPTIONS
02/22/17 PURCHASES
CP RABO NY CP GECTS CP GECTS CP TD USA CP TD USA CP TD USA YCD DNB YCD DNB YCD MONTREAL YCD MONTREAL YCD BARCLAYS YCD BARCLAYS
02/23/17 NO REDEMPTIONS
02123/17 PURCHASES
CP RABO NY CP RABO NY CP TOKYO NY CP TOKYO NY CP TOKYO NY CP TOKYO NY CP BNP NY CP BNP NY CP TOKYO NY CP TOKYO NY CP TD USA CP TD USA CP TD USA CP TD USA
. .
INVESTMENT TRANSACTIONS
... ... MATURITY .TRANS PAR($j DAYS "AMOUNT . EFFECTIVE ] CPN 1%1 DATE YIELD 1%1 (000) HELD EARNED !SI YIELD(%) . .. ...
02/21/17 0.670 50,000 11 10,236.11 0.679
03/01/17 0.700 50,000 03/01/17 0.700 50,000 03/02/17 0.680 50,000 03/02/17 0.680 50,000 03/02/17 0.680 50,000 03/02/17 0.680 50,000 03/13/17 0.570 50,000 03/13/17 0.570 50,000
02/28/17 0.670 50,000 07/03/17 0.890 50,000 07/03/17 0.890 50,000 07/03/17 1.020 50,000 07/03/17 1.020 50,000 07/03/17 1.020 50,000
0.680 03/28/17 0.680 50,000 0.680 03/28/17 0.680 50,000 0.850 05/26/17 0.850 50,000 0.850 05/26/17 0.850 50,000 1.270 06/30/17 1.270 50,000 1.270 06/30/17 1.270 50,000
02/28/17 0.670 50,000 02/28/17 0.670 50,000 03/02/17 0.700 50,000 03/02/17. 0.700 50,000 03/02/17 0.700 50,000 03/02/17 0.700 50,000 03/08/17 0.680 50,000 •03/08/17 0.680 50,000 04/10/17 0.810 50,000 04/10/17 0.810 50,000 07/14/17 1.020 50,000 07/14/17 1.020 50,000 07/14/17 1.020 50,000 07/14/17 1.020 50,000
11

ST ATE TREASURER AND LOCAL AGENCY INVESTMENT FUND FEBRUARY 2017 A TI ACHMENT XVII
INVESTMENT TRANSACTIONS
~- .llllATURiTY TRANS . F'AR (SJ. oAvs ··A1111ouNT EFFECTIVE .. DATE_TYPE . ~DESCRIPTION CPN 1%l DATE YIELD 1%l IDDDL .. HELD EARNED($) YIELD 1%l
~,~ -- ... ~ "'''
02/23/17 PURCHASES (Continued)
DN IBRD 05/26/17 0.530 50,000 DN IBRD 05/26/17 0.530 50,000 DN FHLMC 08/01/17 0.615 50,000 DN FHLMC 08/01/17 0.615 50,000 DN FHLB 08/16/17 0.660 50,000 DN FHLB 08/16/17 0.660 50,000 DN FHLMC 08/28/17 0.650 50,000 DN FHLMC 08/28/17 0.650 50,000 DN FHLMC 09/01/17 0.660 50,000 DN FHLMC 09/01/17 0.660 50,000 DN FHLMC 09/27/17 0.670 50,000 DN FHLMC 09/27/17 0.670 50,000 TR BILL 06/22/17 0.500 50,000 TR BILL 06/22/17 0.500 50,000 TR BILL 06/22/17 0.500 50,000 TR BILL 06/22/17 0.500 50,000 TR BILL 06/22/17 0.500 50,000 TR BILL 06/22/17 0.500 50,000 TR BILL 06/22/17 0.500 50,000 TR BILL 06/22/17 0.500 50,000 YCD NORDEA AB 0.710 05/08/17 0.710 50,000 YCD NORDEA AB 0.710 05/08/17 0.710 50,000 YCD SOC GEN 0.990 05/26/17 0.990 50,000 YCD SOC GEN 0.990 05/26/17 0.990 50,000 YCD SOC GEN 0.990 05/26/17 0.990 50,000 YCD SOC GEN 0.990 05/26/17 0.990 50,000 YCD MONTREAL 0.850 05/30/17 0.850 50,000 YCD MONTREAL 0.850 05/30/17 0.850 50,000 YCD MONTREAL 0.850 05/30/17 0.850 50,000 YCD MONTREAL 0.850 05/30/17 0.850 50,000
02/24/17 REDEMPTIONS
YCDFR WESTPAC 0.979 02/24/17 0.979 50,000 365 563,868.66 1.131 YCDFR WESTPAC 0.979 02/24/17 0.979 50,000 365 563,868.66 1.131
02/24/17 PURCHASES
BN SOFA 1.280 10/02/17 1.280 50,000 BN SOFA 1.280 10/02/17 1.280 50,000 BN SOFA 1.280 10/02/17 1.280 50,000 BN SOFA 1.280 10/02/17 1.280 50,000 CD US BANK 1.040 10/02/17 1.040 50,000 CD US BANK 1.040 10/02/17 1.040 50,000 CP GECO 03/27/17 0.600 50,000 CP GECO 03/27/17 0.600 50,000 CP NISSAN 03/27/17 0.810 50,000
12

STATE TREASURER AND LOCAL AGENCY INVESTMENT FUND FEBRUARY 2017 A TI ACHMENT XVII
INVESTMENT TRANSACTIONS
!I MATURITY TRANS PAR($j DAYS AMOUNT. EFFECTi\ie ... DATE ... TYPE ..... DESCRIPTION .. CPN !%! . .DATE~ . YIELD!%) (000) HELD EARNED !Sl YIELD!%) !
. ·~· 02/24/17 PURCHASES (Continued)
CP MIZUHO NY 05/08/17 0.900 50,000 CP MIZUHO NY 05/08/17 0.900 50,000 CP MIZUHO NY 05/08/17 0.900 50,000 CP GECTS 08/01/17 1.000 50,000 DN FHLB 06/30/17 0.560 50,000 DN FHLB 06/30/17 0.560 50,000 DN FHLB 07/03/17 0.560 50,000 DN FHLB 07/03/17 0.560 50,000 DN FHLB 07/03/17 0.560 50,000 DN FHLB 07/03/17 0.560 50,000 DN FHLMC 08/01/17 0.610 50,000 DN FHLMC 08/01/17 0.610 50,000 TR BILL 02/01/18 0.765 50,000 TR BILL 02/01/18 0.765 50,000 TR BILL 02/01/18 0.765 50,000 TR BILL 02/01/18 0.765 50,000 TR NOTE 0.750 02/28/18 0.921 50,000 TR NOTE 0.750 02/28/18 0.921 50,000 TR NOTE 0.750 02/28/18 0.921 50,000 TR NOTE 0.750 02/28/18 0.921 50,000 TR NOTE 0.625' 06/30/18 0.990 50,000 TR NOTE 0.625 06/30/18 0.990 50,000 TR NOTE 0.625 06/30/18 0.990 50,000 TR NOTE 0.625 06/30/18 0.990 50,000 YCD MIZUHO 0.720 03/27/17 0.720 50,000 YCD MIZUHO 0.720 03/27/17 0.720 50,000 YCD MIZUHO 0.720 03/27/17 0.720 50,000 YCD MIZUHO 0.720 03/27/17 0.720 50,000 YCD NORINCHUK 0.710 03/28/17 0.710 50,000 YCD NORINCHUK 0.710 03/28/17 0.710 50,000 YCD DNB 0.710 04/10/17 0.710 50,000 YCD DNB 0.710 04/10/17 0.710 50,000 YCD CIBC 0.740 04/26/17 0.740 50,000 YCD CIBC 0.740 04/26/17 0.740 50,000 YCD TOKYO-MIT 0.850 05/05/17 0.850 50,000 YCD TOKYO-MIT 0.850 05/05/17 0.850 50,000 YCD BNP 0.810 05/08/17 0.810 50,000 YCD BNP 0.810 05/08/17 0.810 50,000 YCD TORONTO 0.850 05/17/17 0.850 50,000 YCD TORONTO 0.850 05/17/17 0.850 50,000 YCD SE BANKEN 0.980 07/03/17 0.980 50,000 YCD SE BANKEN 0.980 07/03/17 0.980 50,000
02/27/17 REDEMPTIONS
BN BOFA 1.160 02/27/17 1.160 50,000 202 325,444.44 1.176 BN BOFA 1.160 02127/17 1.160 50,000 202 325,444.44 1.176
13

STATE TREASURER AND LOCAL AGENCY INVESTMENT FUND FEBRUARY 2017 A TT AC HM ENT XVII
INVESTMENT TRANSACTIONS
!! ... MATURITY. TRANS PAR($) oAvs· .. AMOUNT EFFECTIVE DATE TYPE . DESCRIPTION .. CPN !%! .. DATE ... YIELD !%1 .. JOOO) HELD EARNED !SI YIELD!%! ... .. -····
02/27/17 REDEMPTIONS (Continued)
CP TOYOTA 02/27/17 0.770 50,000 74 79, 138.89 0.782 CP TOYOTA 02/27/17 0.770 50,000 74 79,138.89 0.782 CP CRC 02/27/17 1.200 50,000 187 311,666.67 1.224 CP CRC 02/27/17 1.200 50,000 187 311,666.67 1.224 CP SCOTIA NY 02/27/17 1.230 50,000 188 321,166.67 1.255 CP SCOTIA NY 02/27/17 1.230 50,000 188 321,166.67 1.255 DN IBRD 02/27/17 0.460 50,000 186 118,833.33 0.468 DN IBRD 02/27/17 0.460 50,000 186 118,833.33 0.468 YCD SVENSKA 0.720 02/27/17 0.720 50,000 41 41,000.00 0.730 YCD SVENSKA 0.720 02/27/17 0.720 50,000 41 41,000.00 0.730 YCD DNB 0.740 02/27/17 0.740 50,000 68 69,888.89 0.750 YCD DNB 0.740 02/27/17 0.740 50,000 68 69,888.89 0.750 YCD BARCLAYS 1.140 02/27/17 1.140 50,000 153 242,250.00 1.156 YCD BARCLAYS 1.140 02/27/17 1.140 50,000 153 242,250.00 1.156 YCD RB CANADA 1.200 02/27/17 1.200 50,000 186 310,000.00 1.217 YCD RB CANADA 1.200 02/27/17 1.200 50,000 186 310,000.00 1.217 YCD TORONTO 1.150 02/27/17 1.150 50,000 201 321,041.67 1.166 YCD TORONTO 1.150 02127/17 1.150 50,000 201 321,041.67 1.166 YCD CIBC 1.170 02/27/17 1.170 50,000 202 328,250.00 1.186 YCD CIBC 1.170 02/27/17 1.170 50,000 202 328,250.00 1.186
02/27/17 NO PURCHASES
02/28/17 REDEMPTIONS
CD BO WEST 0.800 02/28/17 0.800 50,000 62 68,888.89 0.811 CD BO WEST 0.800 02/28/17 0.800 50,000 62 68,888.89 0.811 CP RABO NY 02/28/17 0.670 50,000 5 4,652.78 0.679 CP RASO NY 02/28/17 0.670 50,000 5 4,652.78 0.679 CP RABO NY 02/28/17 0.670 50,000 6 5,583.33 0.679 CP RASO NY 02/28/17 0.670 50,000 11 10,236.11 0.679 CP RASO NY 02/28/17 0.670 50,000 11 10,236.11 0.679 CP RASO NY 02/28/17 0.680 50,000 12 11,333.33 0.690 CP RASO NY 02/28/17 0.680 50,000 12 11,333.33 0.690 CP BNP NY 02/28/17 0.710 50,000 29 28,597.22 0.720 CP BNP NY 02/28/17 0.710 50,000 29 28,597.22 0.720 CP TOKYO NY 02/28/17 0.780 50,000 29 31,416.67 0.791 CP TOKYO NY 02/28/17 0.780 50,000 29 31,416.67 0.791 CP BNP NY 02/28/17 0.710 50,000 36 35,500.00 0.720 CP BNP NY 02/28/17 0.710 50,000 36 35,500.00 0.720 DN FHLB 02/28/17 0.625 50,000 279 242, 187.50 0.637 DN FHLB 02/28/17 0.625 50,000 279 242, 187.50 0.637 DN FHLB 02/28/17 0.625 50,000 280 243,055.56 0.637 DN FHLB 02/28/17 0.625 50,000 280 243,055.56 0.637 DN FHLB 02/28/17 0.625 50,000 280 243,055.56 0.637 DN FHLB 02/28/17 0.625 50,000 280 243,055.56 0.637 TR NOTE 0.500 02/28/17 0.387 50,000 132 70,652.41 0.391 TR NOTE 0.500 02/28/17 0.387 50,000 132 70,652.41 0.391
14

ST ATE TREASURER AND LOCAL AGENCY INVESTMENT FUND FEBRUARY 2017 A TI ACHMENT XVII
INVESTMENT TRANSACTIONS
!! .. . MATURITY . TRANS .. PAR($) . DAYS AMOUNT EFFECTIVE. i .. . DATE ... TYPE .. DESCRIPTION~· CPN !%! ... .. DATE YIELD!%! (000) ··~HELD EARNED($) YIELD!%) ' i ... ..
··~
02/28/17 REDEMPTIONS (Continued)
TR NOTE 0.500 02/28/17 0.430 50,000 243 143,682.07 0.431 TR NOTE 0.500 02/28/17 0.430 50,000 243 143,682.07 0.431 TR NOTE 0.500 02/28/17 0.430 50,000 243 143,682.07 0.431 TR NOTE 0.500 02/28/17 0.430 50,000 243 143,682.07 0.431 TR NOTE 0.500 02/28/17 0.448 50,000 245 150,900.13 0.449 TR NOTE 0.500 02/28/17 0.448 50,000 245 150,900.13 0.449 TR NOTE 0.500 02/28/17 0.448 50,000 245 150,900.13 0.449 TR NOTE 0.500 02/28/17 0.448 50,000 245 150,900.13 0.449 TR NOTE 0.500 02/28/17 0.448 50,000 245 150,900.13 0.449 TR NOTE 0.500 02/28/17 0.448 50,000 245 150,900.13 0.449 TR NOTE 0.500 02/28/17 0.448 50,000 245 150,900.13 0.449 TR NOTE 0.500 02/28/17 0.448 50,000 245 150,900.13 0.449 TR NOTE 0.500 02/28/17 0.448 50,000 245 150,900.13 0.449 TR NOTE 0.500 02/28/17 0.448 50,000 245 150,900.13 0.449 TR NOTE 0.500 02/28/17 0.453 50,000 245 152,853.26 0.455 TR NOTE 0.500 02/28/17 0.453 50,000 245 152,853.26 0.455 TR NOTE 0.500 02/28/17 0.453 50,000 245 152,853.26 0.455 TR NOTE 0.500 02/28/17 0.453 50,000 245 152,853.26 0.455 TR NOTE 0.500 02/28/17 0.588 50,000 635 510,954.48 0.590 TR NOTE 0.500 02/28/17 0.588 50,000 635 510,954.48 0.590 TR NOTE 0.500 02/28/17 0.588 50,000 635 510,954.48 0.590 TR NOTE 0.500 02/28/17 0.588 50,000 635 510,954.48 0.590 TR NOTE 0.500 02/28/17 0.533 50,000 649 473,590.35 0.534 TR NOTE 0.500 02/28/17 0.533 50,000 649 473,590.35 0.534 TR NOTE 0.500 02/28/17 0.533 50,000 649 473,590.35 0.534 TR NOTE 0.500 02/28/17 0.537 50,000 651 478,855.29 0.539 TR NOTE 0.500 02/28/17 0.537 50,000 651 478,855.29 0.539 TR NOTE 0.500 02/28/17 0.534 50,000 671 490,489.13 0.535 TR NOTE 0.500 02/28/17 0.534 50,000 671 490,489.13 0.535 TR NOTE 0.500 02/28/17 . 0.534 50,000 671 490,489.13 0.535 TR NOTE 0.500 '02/28/17 . 0.534 50,000 671 490,489.13 0.535 TR NOTE 0.500 02/28/17 0.517 50,000 672 475,543.48 0.518 TR NOTE 0.500 02/28/17 0.517 50,000 672 475,543.48 0.518 TR NOTE 0.500 02/28/17 0.517 50,000 672 475,543.48 0.518 TR NOTE 0.500 02/28/17 0.517 50,000 679 480,298.91 0.518 TR NOTE 0.500 02/28/17 0.517 50,000 679 480,298.91 0.518 TR NOTE 0.500 02/28/17 0.519 50,000 679 482,252.03 0.520 TR NOTE 0.500 02/28/17 0.519 50,000 679 482,252.03 0.520 TR NOTE 0.500 02/28/17 0.519 50,000 679 482,252.03 0.520 TR NOTE 0.500 02/28/17 0.519 50,000 679 482,252.03 0.520 TR NOTE 0.500 02/28/17 0.519 50,000 679 482,252.03 0.520 TR NOTE 0.500 02/28/17 0.519 50,000 679 482,252.03 0.520 TR NOTE 0.500 02/28/17 0.519 50,000 679 482,252.03 0.520 TR NOTE 0.500 02/28/17 0.519 50,000 679 482,252.03 0.520 TR NOTE 0.500 02/28/17 0.487 50,000 685 457,031.25 0.488 TR NOTE 0.500 02/28/17 0.487 50,000 685 457,031.25 0.488 TR NOTE 0.500 02/28/17 0.487 50,000 685 457,031.25 0.488 TR NOTE 0.500 02/28/17 0.487 50,000 685 457,031.25 0.488
15

ST ATE TREASURER AND LOCAL AGENCY INVESTMENT FUND FEBRUARY 2017 ATTACHMENT XVII
INVESTMENT TRANSACTIONS
!! ... MATIJRlfY TRANS PAR ($) DAYS DATE TYPE ... DESCRIPTION CPN !%) DATE YIELD!%) (000} .HELD 02/28/17 REDEMPTIONS (Continued)
TR TR TR TR TR TR TR TR TR TR TR TR YCD YCD YCD YCD YCD YCD YCD YCD YCD
NOTE NOTE NOTE NOTE NOTE NOTE NOTE NOTE NOTE NOTE NOTE NOTE NORDEA AB NORDEA AB BNP BNP BNP NORINCHUK NORI NCH UK NB CANADA NB CANADA
02/28/17 PURCHASES
CP CP TR TR TR TR YCD YCD
BNP NY BNP NY NOTE NOTE NOTE NOTE ANZ ANZ
0.500 0.500 0.500 0.500 0.500 0.500 0.500 0.500 0.500 0.500 0.500 0.500 0.660 0.660 0.710 0.710 0.710 0.730 0.730 1.060 1.060
1.125 1.125 1.125 1.125 1.350 1.350
02/28/17 02/28/17 02/28/17 02/28/17 02/28/17 02/28/17 02/28/17 02/28/17 02/28/17 02/28/17 02/28/17 02/28/17 02/28/17 02/28/17 02/28/17 02/28/17 02/28/17 02/28/17 02/28/17 02/28/17 02/28/17
04/03/17 04/03/17 02/28/19 02/28/19 02/28/19 02/28/19 02/28/18 02/28/18
16
0.500 0.500 0.500 0.500 0.490 0.490 0.490 0.490 0.490 0.490 0.490 0.490 0.660 0.660 0.710 0.710 0.710 0.730 0.730 1.060 1.060
0.710 0.710 1.184 1.184 1.200 1.200 1.350 1.350
50,000 50,000 50,000 50,000 50,000 50,000 50,000 50,000 50,000 50,000 50,000 50,000 50,000 50,000 50,000 50,000 50,000 50,000 50,000 50,000 50,000
50,000 50,000 50,000 50,000 50,000 50,000 50,000 50,000
685 685 685 685 686 686 686 686 686 686 686 686
11 11 35 35 35 36 36
285 285
AMOUNT EFFECTIVE ; EARNED !Sl ... YIELD (%) :
468,750.00 468,750.00 468,750.00 468,750.00 459,663.72 459,663.72 459,663.72 459,663.72 459,663.72 459,663.72 459,663.72 459,663.72
10,083.33 10,083.33 34,513.89 34,513.89 34,513.89 36,500.00 36,500.00
419,583.33 419,583.33
0.501 0.501 0.501 0.501 0.490 0.490 0.490 0.490 0.490 0.490 0.490 0.490 0.669 0.669 0.720 0.720 0.720 0.740 0.740 1.075 1.075

ST ATE TREASURER AND LOCAL AGENCY INVESTMENT FUND FEBRUARY 2017 A TI ACHMENT XVII
FOOTNOTES
al The abbreviations indicate the type of security purchased, sold, or redeemed:
BA
BN
CB
CBFR
CD
CDFR
CP
DEB
DEB FR
DN
PC
POOL FR
REMIC
TR
YCD
YCD FR
Bankers Acceptances
Bank Notes
Corporate Bonds
Floating Rate Corporate Bonds
Negotiable Certificates of Deposit
Floating Rate Negotiable Certificates of Deposit
Commercial Paper
Federal/Supranational Agency Debentures - Federal Home Loan Bank (FHLB}, Federal Home Loan Mortgage Corporation (FHLMC}, Federal National Mortgage Association (FNMA), Federal Farm Credit Bank (FFCB), Federal Land Banks (FLB), Federal Intermediate Credit Banks (FICB), Federal Agricultural Mortgage Corporation (FAMC}, Central Bank for Cooperatives (CBC}, Tennessee Valley Authority (TVA}, Commodity Credit Corporation (CCC), International Bank for Reconstruction and Development (IBRD}, International Finance Corporation (IFC).
Federal/Supranational Agency Floating Rate Debentures - FHLB, FHLMC, FNMA, FFCB, FLB, FICB, FAMC, CBC, TVA, CCC, IBRD, IFC.
Federal/Supranational Agency Discount Notes- FHLB, FHLMC, FNMA, FFCB, FLB, FICB, FAMC, CBC, TVA, CCC, IBRD, IFC.
Federal Agency Mortgage-backed Pass-through Certificates - FHLMC, FNMA, Government National Mortgage Investment Conduit (GNMA)
Floating Rate Small Business Administration (SBA) Loan Pools
Federal Agency Real Estate Mortgage Investment Conduits - FHLMC, FNMA
U.S. Treasury Bills, Notes
Negotiable Yankee Certificates of Deposit
Floating Rate Negotiable Yankee Certificates of Deposit
bl Industry standard purchase yield calculation
cl Repurchase Agreement
di Par amount of securities purchased, sold or redeemed
el Securities were purchased and sold as of the same date.
fl Repurchase Agreement against Reverse Repurchase Agreement
9f. Outright purchase against Reverse Repurchase Agreement
hi Security "SWAP" transactions
iL Buy back agreement
RRP
RRS
Termination of Reverse Repurchase Agreement
Reverse Repurchase Agreement
17

ST ATE TREASURER AND LOCAL AGENCY INVESTMENT FUND FEBRUARY2017 A IT AC HM ENT XVII
TIME DEPOSITS
DEPOSIT PAR MATURITY 'FINANCIAL INSTITUTION .DATE YIELD !%j AMOUNT ISi .. . ... DATE ........ ,_, _ _, ...
ALHAMBRA
New Omni Bank, NA 12/01/16 0.500 13,000,000.00 03/02/17 New Omni Bank, NA 12/15/16 0.550 5,000,000.00 03/16/17 New Omni Bank, NA 10/05/16 0.460 5,000,000.00 04/05/17 New Omni Bank, NA 01/19/17 0.550 4,000,000.00 04/20/17 New Omni Bank, NA 01/26/17 0.530 5,000,000.00 04/27/17 New Omni Bank, NA 02/23/17 0.680 2,000,000.00 08/24/17
AUBURN
Community 1st Bank 12/16/16 0.570 2,000,000.00 03/17/17 Community 1st Bank 01/11/17 0.550 4,000,000.00 04/12/17 Community 1st Bank 01/18/17 0.570 5,000,000.00 04/12/17
BREA
Pacific Western Bank 09/14/16 0.550 40,000,000.00 03/15/17 Pacific Western Bank 10/07/16 0.490 10,000,000.00 04/07/17 Pacific Western Bank 11/17/16 0.630 50,000,000.00 05/18/17 Pacific Western Bank 01/25/17 0.620 40,000,000.00 07/26/17 Pacific Western Bank 02/22/17 0.670 50,000,000.00 08/23/17
BUENA PARK
Uniti Bank 11/30/16 0.520 2,000,000.00 03/08/17 Uniti Bank 01/04/17 0.630 3,000,000.00 07/05/17 Uniti Bank 02/10/17 0.640 3,000,000.00 08/11/17
CERRITOS
First Choice Bank 12/16/16 0.540 20,000,000.00 03/17/17
CHICO
Golden Valley Bank 02/03/17 0.540 8,000,000.00 05/05/17 Tri Counties Bank 12/07/16 0.500 50,000,000.00 03/08/17
DIAMOND BAR
Prospectors Federal Credit Union 12/08/16 0.530 4,000,000.00 03/09/17
DOWNEY
Financial Partners Credit Union 10/05/16 0.500 10,000,000.00 04/05/17
EL CENTRO
Community Valley Bank 02/17/17 0.680 3,000,000.00 08/18/17
18

ST ATE TREASURER AND LOCAL AGENCY INVESTMENT FUND FEBRUARY 2017 A TT AC HM ENT XVII
TIME DEPOSITS
DEPOSIT PAR MATURITY FINANCIAL INSTITUTION .... DATE. YIELD 1%1 AMOUNT!$) ·······-·QA!E.··-······ '' ~ -·' .. FOLSOM
Folsom Lake Bank 11/30/16 0.510 3,000,000.00 03/01/17 Folsom Lake Bank 01/11/17 0.540 1,500,000.00 04/12/17 Folsom Lake Bank 01/27/17 0.540 3,500,000.00 04/28/17 SAFE Credit Union 12/02/16 0.650 5,000,000.00 06/02/17 SAFE Credit Union 01/11/17 0.630 20,000,000.00 07/12/17
GARDEN GROVE
US Metro Bank 12/12/16 0.630 10,000,000.00 06/14/17 US Metro Bank 02/22/17 0.670 5,000,000.00 08/23/17
GOLETA
Community West Bank 10/12/16 0.490 13,000,000.00 04/12/17 Community West Bank 02/22/17 0.560 13,000,000.00 05/24/17 Community West Bank 12/01/16 0.640 14,000,000.00 06/01/17 Community West Bank 01/19/17 0.640 13,000,000.00 07/20/17
IRVINE
Banc of California, NA 01/04/17 0.530 50,000,000.00 04/05/17 Banc of California, NA 01/19/17 0.570 100,000,000.00 04/20/17 Banc of California, NA 02/17/17 0.550 100,000,000.00 04/20/17 CommerceWest Bank 12/09/16 0.510 5,000,000.00 03/10/17 CommerceWest Bank 01/12/17 0.530 5,000,000.00 04/13/17 CommerceWest Bank 01/27/17 0.520 5,000,000.00 04/28/17 First Foundation Bank 11/30/16 0.510 30,000,000.00 03/01/17 First Foundation Bank 12/01/16 0.550 32,000,000.00 04/06/17 First Foundation Bank 01/06/17 0.570 12,000,000.00 04/06/17 First Foundation Bank 01/20/17 0.570 25,000,000.00 04/21/17 First Foundation Bank 01/24/17 0.540 25,000,000.00 04/21/17 First Foundation Bank 02/09/17 0.570 12,000,000.00 05/25/17 Pacific Enterprise Bank 12/01/16 0.640 25,000,000.00 06/01/17 Pacific Premier Bank 02/16/17 0.570 10,000,000.00 05/18/17
LODI
Farmers & Merchants Bk Gen CA 11/30/16 0.490 35,000,000.00 03/01/17 Farmers & Merchants Bk Cen CA 12/07/16 0.480 20,000,000.00 03/08/17 Farmers & Merchants Bk Cen CA 10/20/16 0.490 35,000,000.00 04/20/17 Farmers & Merchants Bk Gen CA 01/11/17 0.600 25,000,000.00 07/12/17 Farmers & Merchants Bk Gen CA 01/13/17 0.620 35,000,000.00 07/12/17
LOS ANGELES
Bank Leumi USA 01/06/17 0.590 25,000,000.00 04/07/17 Bank Leumi USA 01/18/17 0.580 30,000,000.00 04/19/17 Bank Leumi USA 02/01/17 0.570 20,000,000.00 05/03/17
19

STATE TREASURER AND LOCAL AGENCY INVESTMENT FUND FEBRUARY 2017 A TI AC HM ENT XVII
TIME DEPOSITS
.. DEPOSIT PAR MATORl.TY •FINANCIAL INSTITUTION DATE ..... YIELD!%! AMOUNT!$! _DATE ...... .. _.__
LOS ANGELES (Continued)
Bank of Hope 11/30/16 0.510 90,000,000.00 03/01/17 Bank of Hope 12/09/16 0.530 75,000,000.00 03/10/17 Bank of Hope 01/05/17 0.540 90,000,000.00 04/06/17 Bank of Hope 01/13/17 0.550 45,000,000.00 04/14/17 California United Bank 01/06/17 0.570 10,000,000.00 04/07/17 Commonwealth Business Bank 12/09/16 0.510 8,500,000.00 03/10/17 Commonwealth Business Bank 12/16/16 0.540 10,000,000.00 03/17/17 Commonwealth Business Bank 01/06/17 0.550 15,000,000.00 04/07/17 Commonwealth Business Bank 01/27/17 0.520 15,000,000.00 04/28/17 Commonwealth Business Bank 02/09/17 0.550 5,000,000.00 05/11/17 Commonwealth Business Bank 02/17/17 0.680 18,000,000.00 08/18/17 CTBC Bank Corp. (USA) 01/04/17 0.530 50,000,000.00 04/05/17 CTBC Bank Corp. (USA) 10/27/16 0.530 10,000,000.00 04/27/17 CTBC Bank Corp. (USA) 01/12/17 0.560 50,000,000.00 04/27/17 Hanmi Bank 10/05/16 0.460 30,000,000.00 04/05/17 Hanmi Bank 11/14/16 0.570 25,000,000.00 05/17/17 Hanmi Bank 11/17/16 0.630 25,000,000.00 05/18/17 Hanmi Bank 02/02/17 0.650 30,000,000.00 08/03/17 Manufacturers Bank 12/08/16 0.530 50,000,000.00 03/09/17 Manufacturers Bank 10/14/16 0.520 50,000,000.00 04/14/17 Manufacturers Bank 11/10/16 0.590 35,000,000.00 05/11/17 Manufacturers Bank 01/06/17 0.670 100,000,000.00 07/07/17 Open Bank 11/09/16 0.540 10,000,000.00 05/10/17 Open Bank 12/08/16 0.640 10,000,000.00 06/08/17 Open Bank 12/14/16 0.640 10,000,000.00 06/14/17 Open Bank 01/04/17 0.630 14,000,000.00 07/05/17 Opus Bank 01/27/17 0.660 10,000,000.00 07/28/17 Pacific City Bank 11/09/16 0.540 18, 700,000.00 05/10/17 Pacific City Bank 02/22/17 0.540 21,300,000.00 05/10/17 Pacific City Bank 12/08/16 0.640 30,000,000.00 06/08/17 Pacific City Bank 01/06/17 0.650 30,000,000.00 07/07/17 Pacific Commerce Bank 09/16/16 0.550 10,000,000.00 03/17/17 Preferred Bank 02/17/17 0.540 30,000,000.00 03/24/17 Premier Business Bank 09/28/16 0.410 10,000,000.00 03/29/17 Woori America Bank 12/14/16 0.660 20,000,000.00 06/14/17 Woori America Bank 12/16/16 0.670 10,000,000.00 06/14/17 Woori America Bank 01/13/17 0.640 10,000,000.00 07/14/17
MONTEREY
1st Capital Bank 12/08/16 0.530 1,000,000.00 03/09/17
OAKDALE
Oak Valley Community Bank 12/01/16 0.520 3,500,000.00 03/02/17
OAKLAND
Beneficial State Bank 01/05/17 0.550 15,000,000.00 04/06/17 Beneficial State Bank 01/13/17 0.560 25,000,000.00 04/14/17
20

ST ATE TREASURER AND LOCAL AGENCY INVESTMENT FUND FEBRUARY 2017 ATTACHMENT XVII
TIME DEPOSITS
DEPOSIT . PAR . MATURITY FINANCIAL INSTITUTION .. _DATE .... YIELD !%1 AMOUNT!$! . ... !!AIS ....... -~~·-~-·----. .. OAKLAND (Continued)
California Bank of Commerce 01/11/17 0.540 13,500,000.00 04/12/17 California Bank of Commerce 01/12/17 0.580 5,000,000.00 05/10/17 California Bank of Commerce 12/09/16 0.660 10,000,000.00 06/09/17 California Bank of Commerce 02/09/17 0.660 5,000,000.00 08/10/17 Community Bank of the Bay 12/02/16 0.640 5,000,000.00 06/02/17 Metropolitan Bank 09/08/16 0.480 6,000,000.00 03/09/17 Metropolitan Bank 10/13/16 0.500 3,000,000.00 04/13/17 Metropolitan Bank 02/23/17 0.680 1,000,000.00 08/24/17
ORANGE
Grandpoint Bank 01/12/17 0.550 50,000,000.00 04/13/17 Grandpoint Bank 01/26/17 0.550 25,000,000.00 04/27/17 Grandpoint Bank 02/02/17 0.560 50,000,000.00 05/04/17
PALOS VERDES ESTATES
Malaga Bank, FSB 01/05/17 0.520 5,000,000.00 04/06/17 Malaga Bank, FSB 01/20/17 0.550 46,000,000.00 04/21/17 Malaga Bank, FSB 01/27/17 0.520 9,000,000.00 04/28/17 Malaga Bank, FSB 02/02/17 0.540 10,000,000.00 05/04/17
PASADENA
American Plus Bank, NA 11/16/16 0.640 500,000.00 05/24/17 American Plus Bank, NA 12/08/16 0.640 2,000,000.00 06/15/17 American Plus Bank, NA 12/15/16 0.670 2,240,000.00 06/15/17 American Plus Bank, NA 01/04/17 0.630 3,000,000.00 07/05/17 American Plus Bank, NA 01/18/17 0.620 3,000,000.00 07/19/17 American Plus Bank, NA 02/23/17 0.680 1,000,000.00 08/30/17 Community Bank 12/07/16 0.500 30,000,000.00 03/08/17 Community Bank 12/14/16 0.560 35,000,000.00 03/15/17 Community Bank 01/06/17 0.570 25,000,000.00 04/07/17 Community Bank 01/13/17 0.550 25,000,000.00 04/14/17 Community Bank 02/01/17 0.550 30,000,000.00 05/03/17 Community Bank 02/09/17 0.570 25,000,000.00 05/11/17 East West Bank 01/12/17 .. 0.550 50,000,000.00 04/13/17 East West Bank 01/18/17 0.560 175,000,000.00 04/19/17 East West Bank 02/03/17 . 0.560 75,000,000.00 05/05/17 EverTrust Bank 12/02/16 0.500 20,000,000.00 03/03/17 EverTrust Bank 12/07/16 0.480 30,000,000.00 03/08/17 EverTrust Bank 02/15/17 0.550 10,000,000.00 05/17/17 Wescom Central Credit Union 12/15/16 0.590 50,000,000.00 03/16/17 Wescom Central Credit Union 01/05/17 0.550 25,000,000.00 04/06/17 Wescom Central Credit Union 01/25/17 0.540 50,000,000.00 04/26/17 Wescom Central Credit Union 02/16/17 0.600 50,000,000.00 05/18/17
PASO ROBLES
Heritage Oaks Bank 12/07/16 0.500 25,000,000.00 03/08/17
21

STATE TREASURER AND LOCAL AGENCY INVESTMENT FUND FEBRUARY 2017 A TI ACHMENT XVII
TIME DEPOSITS
DEPOSIT PAR MATURITY FINANCIAL INSTITUTION .DATE ... YIELD 1%1 AMOUNT ISi ....... QAI5 -.. PORTERVILLE
Bank of the Sierra 12/01/16 0.520 ;20,000,000.00 03/02/17 Bank of the Sierra 12/08/16 0.530 20,000,000.00 03/09/17 Bank of the Sierra 01/11/17 0.540 20,000,000.00 04/12/17 Bank of the Sierra 01/20/17 0.570 20,000,000.00 04/21/17 Bank of the Sierra 02/02/17 0.560 20,000,000.00 05/04/17 Bank of the Sierra 02/23/17 0.560 20,000,000.00 05/25/17
RANCHO CORDOVA
American River Bank 10/19/16 0.490 3,000,000.00 04/19/17 American River Bank 11/17/16 0.650 6,500,000.00 05/18/17 American River Bank 12/08/16 0.660 (,500,000.00 06/08/17 American River Bank 12/15/16 0.690 2,500,000.00 06/15/17 American River Bank 01/04/17 0.650 4,500,000.00 07/05/17 American River Bank 01/18/17 0.640 2,500,000.00 07/19/17 American River Bank 02/02/17 0.670 2,500,000.00 08/03/17
REDDING
Cornerstone Community Bank 11/30/16 0.490 7,000,000.00 03/01/17
REDWOOD CITY
Provident Credit Union 12/01/16 0.500 20,000,000.00 03/02/17 Provident Credit Union 12/09/16 0.510 20,000,000.00 03/10/17 Provident Credit Union 12/14/16 0.540 20,000,000.00 03/15/17 Provident Credit Union 01/12/17 0.530 20,000,000.00 04/13/17 Provident Credit Union 01/19/17 0.550 40,000,000.00 04/20/17 Provident Credit Union 01/25/17 0.510 40,000,000.00 04/26/17 Provident Credit Union 02/15/17 0.550 20,000,000.00 05/17/17
RICHMOND
Mechanics Bank 12/08/16 0.530 20,000,000.00 03/09/17 Mechanics Bank 01/11/17 0.540 20,000,000.00 04/12/17 Mechanics Bank 01/19/17 0.570 20,000,000.00 04/20/17 Mechanics Bank 02/09/17 0.570 20,000,000.00 05/11/17
ROCKLIN
Five Star Bank 01/04/17 0.510 5,000,000.00 04/05/17 Five Star Bank 01/05/17 0.520 5,000,000.00 04/05/17 Five Star Bank 10/12/16 0.470 2,000,000.00 04/12/17 Five Star Bank 12/01/16 0.620 25,000,000.00 06/01/17
ROSEMEAD
Pacific Alliance Bank 10/12/16 0.470 4,000,000.00 04/12/17
22

STATE TREASURER AND LOCAL AGENCY INVESTMENT FUND FEBRUARY2017 ATTACHMENT XVII
TIME DEPOSITS
DEPO'SIT. PAR MATURITY. FINANCIAL INSTITUTION .... DATE ... YIELD!%! AMOUNT($) DATE ... .. .. . .. ROSEVILLE
Umpqua Bank 12/14/16 0.560 100,000,000.00 03/15/17 Umpqua Bank 09/22/16 0.530 20,000,000.00 03/23/17 Umpqua Bank 11/10/16 0.590 50,000,000.00 05/11/17
SACRAMENTO
Merchants National Bank of Sacramento 11/30/16 0.630 4,000,000.00 05/31/17 Merchants National Bank of Sacramento 01/04/17 0.650 2,000,000.00 07/05/17 Merchants National Bank of Sacramento 02/01/17 0.660 4,000,000.00 08/02/17 River City Bank 11/10/16 0.590 20,000,000.00 05/11/17 River City Bank 11/18/16 0.640 35,000,000.00 05/19/17 River City Bank 12/02/16 0.640 15,000,000.00 06/02/17 River City Bank 01/20/17 0.650 15,000,000.00 07/21/17 Schools Financial Credit Union 11/30/16 0.490 30,000,000.00 03/01/17
SAN DIEGO
Boll Federal Bank 11/30/16 0.500 25,000,000.00 03/16/17 California Coast Credit Union 11/30/16 0.610 25,000,000.00 05/31/17 California Coast Credit Union 01/19/17 0.620 25,000,000.00 07/20/17 California Coast Credit Union 02/28/17 0.660 25,000,000.00 08/30/17 Mission Federal Credit Union 01/13/17 0.530 10,000,000.00 04/14/17 San Diego County Credit Union 10/13/16 0.430 50,000,000.00 03/02/17 San Diego County Credit Union 12/15/16 0.530 50,000,000.00 03/16/17 San Diego County Credit Union 02/16/17 0.550 50,000,000.00 05/18/17 San Diego County Credit Union 01/05/17 0.610 50,000,000.00 07/06/17 San Diego County Credit Union 01/12/17 0.590 50,000,000.00 07/13/17 San Diego County Credit Union 02/15/17 0.640 50,000,000.00 08/16/17 Western Alliance Bank 11/10/16 0.590 65,000,000.00 05/11/17 Western Alliance Bank 11/16/16 0.660 75,000,000.00 05/17/17 Western Alliance Bank 12/09/16 0.660 50,000,000.00 06/09/17 Western Alliance Bank 12/16/16 0.670 50,000,000.00 06/16/17 Western Alliance Bank 01/04/17 0.650 35,000,000.00 07/05/17 Western Alliance Bank 01/05/17 0.650 25,000,000.00 07/05/17
SAN FRANCISCO
Bank of San Francisco 12/16/16 0.670 10,000,000.00 06/16/17 First Republic Bank 11/17/16 0.650 150,000,000.00 05/18/17 First Republic Bank 02/01/17 0.670 150,000,000.00 08/02/17 Mission National Bank 01/04/17 0.650 15,000,000.00 07/05/17 Mission National Bank 01/26/17 0.640 5,000,000.00 07/27/17 Presidio Bank 02/01/17 0.550 10,000,000.00 05/03/17 Presidio Bank 02/16/17 0.700 10,000,000.00 08/17/17 Trans Pacific National Bank 12/16/16 0.560 3,000,000.00 03/17/17 Trans Pacific National Bank 01/20/17 0.570 2,000,000.00 04/21/17
23

STATE TREASURER AND LOCAL AGENCY INVESTMENT FUND FEBRUARY2017 ATIACHMENT XVU
TIME DEPOSITS
DEPOSIT PAR 'MATURITY. !FINANCIAL INSTITUTION ....... QAIE ...... YIELD(%) AMOUNT(il .. ...... DATE ..... SANJOSE
. ' .
Heritage Bank of Commerce 11/16/16 0.660 20,000,000.00 05/17/17 Heritage Bank of Commerce 12/16/16 0.670 15,000,000.00 06/16/17 Heritage Bank of Commerce 01/19/17 0.640 50,000,000.00 07/20/17 Meriwest Credit Union 01/19/17 0.580 40,000,000.00 04/20/17
SAN RAMON
Tri-Valley Bank 11/30/16 0.540 4,000,000.00 03/10/17 Tri-Valley Bank 11/17/16 0.660 6,000,000.00 05/18/17
SANTA CLARITA
Bank of Santa Clarita 01/06/17 0.570 15,000,000.00 04/07/17 Bank of Santa Clarita 02/10/17 0.570 5,000,000.00 05/12/17
SANTA ROSA
First Community Bank 12/14/16 0.540 20,000,000.00 03/15/17 Summit State Bank 01/13/17 0.550 14,000,000.00 04/14/17 Summit State Bank 01/20/17 0.570 7,500,000.00 04/21/17 Summit State Bank 02/01/17 0.550 8,000,000.00 05/03/17 Summit State Bank 12/02/16 0.640 12,000,000.00 06/02/17 Summit State Bank 12/16/16 0.670 7,000,000.00 06/16/17
SOUTH SAN FRANCISCO
First National Bank of Northern California 11/30/16 0.630 19,000,000.00 05/31/17
VACAVILLE
Travis Credit Union 12/02/16 0.640 50,000,000.00 06/02/17 Travis Credit Union 01/05/17 0.650 50,000,000.00 07/06/17
WATSONVILLE
Santa Cruz County Bank 01/13/17 0.530 10,000,000.00 04/14/17 Santa Cruz County Bank 02/16/17 0.570 10,000,000.00 05/18/17
WEST SACRAMENTO
Community Business Bank 09/15/16 0.550 5,000,000.00 03/16/17 Community Business Bank 10/13/16 0.480 3,000,000.00 04/13/17 Community Business Bank 01/25/17 0.510 3,000,000.00 04/26/17 Community Business Bank 11/10/16 0.570 5,000,000.00 05/11/17 Community Business Bank 12/08/16 0.640 3,000,000.00 06/08/17 Community Business Bank 02/10/17 0.640 4,000,000.00 08/11/17
TOTAL TIME DEPOSITS FEBRUARY 2017 '5,412,740,000.00
24

ST ATE TREASURER AND LOCAL AGENCY INVESTMENT FUND FEBRUARY 2017 AITACHMENT XVII
DAY OF MONTH
1 2 3 4 5 6 7 8 9
10 11 12.
13 14 15 16 17 18 19 20 21
22' 23 24 25 26 27 28
BANK DEMAND DEPOSITS FEBRUARY 2017
$
($ in thousands)
DAILY BALANCES
BANK BALANCES
738,558 960,224 791,554 791,554 791,554 878,359
1,055,710 954,091
1,147,894 1,076, 169 1,076, 169 1,076, 169
861,170 1,129,708 1,064,()48 1,11(,826 1,112,706 1,112,706 1,112,706 1,112,706
791_,270 820,368 909,099 946,149 946,149 946,149 703,718
1,179,443
AVERAGE DOLLAR DAYS · $971,590,230 al
$
WARRANTS OUTSTANDING
3,962,565 2,611,910 3,972,932 3,972,932 3,972,932 3,302,367 2,714,484 2,822,196 2,961,933 2,786,051 2,786,051 2,786,051 2,294,961 2,079,575 2,283,157 2,258,684 2,681,288 2,681,288 2,681,288 2,681,288 2,270,184 2,222,234 2, 123,994 4,520,817 4,520,817 4,520,817 3,832,300 2,387,629
al The prescribed bank balance for February was $1,021,885. This consisted of $950,707 in compensating balances for services, balances for uncollected funds of $73,167 and a deduction of $1,989 for February delayed deposit credit.
25

STATE TREASURER AND LOCAL AGENCY INVESTMENT FUND DESIGNATION BY POOLED MONEY INVESTMENT BOARD FEBRUARY 2017 OF TREASURY POOLED MONEY INVESTMENTS AND DEPOSITS ATTACHMENT XVII 1812
In accordance with sections 16480 through 16480.8 of the Government Code, the Pooled Money Investment Board, at its meeting on February 15, 2017, has determined and designated the amount of money available for deposit and investment as of February 9, 2017, under said sections. In accordance with sections 16480.1 and 16480.2 of the Government Code, it is the intent that the money available for deposit or investment be deposited in bank accounts and savings and Joan associations or invested in securities in such a manner so as to realize the maximum return consistent with safe and prudent treasury management, and the Board does hereby designate the amount of money available for deposit in bank accounts, savings and loan associations, and for investment in securities and the type of such deposits and investments as follows:
1. In accordance with Treasurer's Office policy, for deposit in demand bank accounts as Compensating Balance for Services: $ 950,700,000
The active noninterest-bearing bank accounts designation constitutes a calendar month average balance. For purposes of computing the compensating balances, the Treasurer shall exclude from the daily balances any amounts contained therein as a result of nondelivery of securities purchased for "cash" for the Pooled Money Investment Account and shall adjust for any deposits not credited by the bank as of the date of deposit. The balances in such accounts may fall below the above amount provided that the balances computed by dividing the sum of daily balances of that calendar month by the number of days in the calendar month reasonably approximates that amount. The balances may exceed this amount during heavy collection periods or in anticipation of large impending warrant presentations to the Treasury, but the balances are to be maintained in such a manner as to realize the maximum return consistent with safe and prudent treasury management.
2.
( 1)
( 2)
( 3)
( 4)
( 5)
( 6)
( 7)
( 8)
( 9)
(10)
In accordance with law, for investment in securities authorized by section 16430, Government Code, or in term interest-bearing deposits in banks and savings and loan associations as follows:
Time Deposits in Various Financial
Institutions In Securities (sections 16503a Estimated
From To Transactions (section 16430)' and 16602t Total
2/13/2017 2/17/2017 $ (423,800) $ (5,354,823,800) $ 5,354,400,000 $ (423,800)
2/20/2017 2/24/2017 $ 2,406,900 $ (5,352.416,900) $ 5,354,400,000 $ 1,983,100
212712017 3/3/2017 $ (4,690,500) $ (5,357, 107.400) $ 5,354,400,000 $ (2,707,400)
3/6/2017 3/10/2017 $ (360,400) $ (5,357,467,800) $ 5,354,400,000 $ (3,067,800)
3/13/2017 3/17/2017 $ 1,188,400 $ (5,356,279,400) $ 5,354,400,000 $ (1,879,400)
3/20/2017 3/24/2017 $ 1,804,200 $ (5,354,475,200) $ 5,354,400,000 $ (75,200)
3/27/2017 3/31/2017 $ (3,013, 100) $ (5,357.488,300) $ 5,354,400,000 $ (3,088,300)
4/3/2017 4/7/2017 $ (2,293, 700) $ (5,359, 782,000) $ 5,354,400,000 $ (5,382,000)
4/10/2017 4/14/2017 $ 203,200 $ (5,359,578,800) $ 5,354,400,000 $ (5, 178,800)
4/17/2017 4/21/2017 $ 7,973,700 $ (5,351,605, 100) $ 5,354,400,000 $ 2,794,900
From any of the amounts specifically designated above, not more than 30 percent in the aggregate may be invested in prime commercial paper under section 16430(e), Government Code.
Additional amounts available in treasury trust account and in the Treasury from time to time, in excess of the amounts and for the same types of investments as specifically designated above.
Provided, that the availability of the amounts shown under paragraph 2 is subject to reduction in the amount by which the bank accounts under paragraph 1 would otherwise be reduced below the calendar month average balance of$ 950,700,000.
POOLED MONEY INVESTMENT BOARD:
Signatures on file at STO Chairperson
Member
Dated: February 15, 2017 *Government Code Member

Los Angeles County TreasurerPending Transactions Detail ReportAs of 3/31/17Attachment XVIII
Settle Counter Instrument Maturity Purchased
Date Trade Date Party ID Description Rate Date Price Par Principal Interest
NTRD - PSI NON-TRADING
04/04/17 03/09/17 KEYBANC 104107 FHLMC 2.42 (CALLABLE) 2.420 04/04/22 100 $25,000,000.00 $25,000,000.00 $0.00
04/13/17 03/28/17 WFI 104256 FHLMC 2.25 (CALLABLE) 2.250 04/13/22 100 $25,000,000.00 $25,000,000.00 $0.00
04/18/17 03/28/17 MS 104258 FHLMC 4.25 (CALLABLE) 4.250 04/18/22 100 $25,000,000.00 $25,000,000.00 $0.00
04/05/17 03/29/17 JPM 104269 FFCB 2.25 (CALLABLE) 2.250 03/14/22 100 $22,955,000.00 $22,955,000.00 $30,128.44
04/05/17 03/29/17 UBSSEC 104270 FFCB 2.24 (CALLABLE) 2.240 01/05/22 100 $35,750,000.00 $35,750,000.00 $0.00
04/13/17 03/29/17 MORCO 104271 FHLMC 2.26 (CALLABLE) 2.260 04/13/22 100 $25,000,000.00 $25,000,000.00 $0.00
04/19/17 03/29/17 RBCCM 104272 FHLMC 2.27 (CALLABLE) 2.270 04/19/22 100 $25,000,000.00 $25,000,000.00 $0.00
04/18/17 03/29/17 DRE 104273 FHLMC 2.29 (CALLABLE) 2.290 04/18/22 100 $25,000,000.00 $25,000,000.00 $0.00
04/06/17 03/30/17 CITGM 104302 FFCB 2.20 (CALLABLE) 2.200 04/06/22 100 $25,000,000.00 $25,000,000.00 $0.00
04/06/17 03/30/17 UBIS 104303 FFCB 2.20 (CALLABLE) 2.200 04/06/22 100 $20,000,000.00 $20,000,000.00 $0.00
04/06/17 03/30/17 BLAYBV 104304 FFCB 2.20 (CALLABLE) 2.200 04/06/22 100 $15,000,000.00 $15,000,000.00 $0.00
04/19/17 03/30/17 GPS 104305 FHLMC 4.30 (CALLABLE) 4.300 04/19/22 100 $25,000,000.00 $25,000,000.00 $0.00
04/19/17 03/30/17 DCM 104306 FHLMC 2.30 (CALLABLE) 2.300 04/19/22 100 $25,000,000.00 $25,000,000.00 $0.00
04/03/17 03/31/17 BLAYBV 104317 THUNDER BAY FUNDING LLC CP1.090 07/03/17 1.09 $30,000,000.00 $29,917,341.67 $0.00
PSI Non-Trading Total $348,705,000.00 $348,622,341.67 $30,128.44
Totals $348,705,000.00 $348,622,341.67 $30,128.44
Related Documents