Travel trends on Bing Network - Australia #BingAdsTravel • @BingAds December 2016

Welcome message from author
This document is posted to help you gain knowledge. Please leave a comment to let me know what you think about it! Share it to your friends and learn new things together.
Transcript

Travel trends on Bing Network - Australia
#BingAdsTravel • @BingAds
December 2016

Summary
Digital advertising within the travel space can be challenging: A traveller ’s road to decision is complex. Competition is fierce, therefore finding your audience may be tricky. Bing can help you by analysing consumer search behaviour within the travel vertical.
Bing is here to help
MethodologyMethodology
• AU Bing sindicated network traffic
• Top 100,000 travel queries based on volume
• Analysis period: September 2015 – August 2016
Objectives
• Identify travel trends across key sub-verticals
• Create profiles of travel searchers on Bing
• Analyse their search behaviours
• Identify advertiser opportunities
• Introduce new product features relevant to travel

List of content• Travel landscape overview
• Travel search trends
• Air travel
• Accommodation
• Cruise
• Car rental services
• Bing Ads travel essentials

Travel landscape overview

• Aussies rank #1 in how much they plan to spend on holidays in 2016 (overtaking Switzerland from 2015)
• 59% plan to try something new(compared to 59% Americans, 43% Britains, 57% Japanese)
Source: TripAdvisor TripBarometer Travel Trends 2016. 34,046 total respondents, 1,068 respondents from Australia.

+43% increase in adventure travel searches
+44% increase in camping caravan & RV
accommodation searches
+49% increase in agritourism searches
Travellers are shifting towards active pursuits
Source:
1. Tourism Research Australia Travel by Australians.pdf.
2. Microsoft internal data, query volume change January to September 2015 vs 2016.

$5.9B Estimate of AU digital sales in 2017
3.3%Estimated digital travel sales growth in 2017
Growth of digital travel sales in Australia expected to continue
5.71
5.89
6.05
6.17
5.4
5.5
5.6
5.7
5.8
5.9
6
6.1
6.2
6.3
2016 2017 2018 2019
Digital Travel Sales
Source: eMarketer Digital Travel Sales in Asia-Pacific, by Country 2015-2020.
Dig
ital Sale
s in
Billio
n

The domestic travel sector grew 7% from FY15 to FY16, to a record $78.5 billion
Source: Tourism Research Australia Travel by Australians – Domestic overnight trips spend $59 billion + Domestic day trip spend $19.6 billion.

The Bing Network audience is primed and ready for travel
Check the Internet to plan a trip
Income segment
% Bing audience within these income segments
Gender
% of Bing audience who are
38% 62%
6%
10%
11%
8%
16%
40%
Under $20K
$20K - <$30K
$30K - < $40K
$40K - <$50K
$50K - <$70K
$70K+
Age groups
% of Bing audience who fall under these age groups
3%
17%
37%
31%
7%
18-24 25-39 40-54 55-69 70+
like to travel to new places
Enjoy travelling and preferto stay in Australia
Source: Nielsen Consumer & Media View National Database, April ‘15 - March ‘16 Base: 14+.
7% more likely compared to all respondents
3% more likely compared to all respondents
11% more likely compared to all respondents

Let the Bing Network help you reach more travellers
Source: Microsoft internal data January – September 2014-2016.
With Bing Network, you’ll get access to over 6.5M qualified travel searches and a pool of affluent
searchers.
6.5MMonthly travel Searches
+30%Uplift of travel related searches year on year
1.4MMonthly travel clicks
+40%Uplift of travel related clicks year on year
$0.98 $1.00
$0.92
$0.10
$0.20
$0.30
$0.40
$0.50
$0.60
$0.70
$0.80
$0.90
$1.00
$1.10
2014 2015 2016
Avera
ge C
PC
fro
m J
an
uary
to
Sep
tem
ber

Travel search trends

0%
20%
40%
60%
80%
100%
120%
0%
20%
40%
60%
80%
100%
120%
140%
160%
Sep-15 Oct-15 Nov-15 Dec-15 Jan-16 Feb-16 Mar-16 Apr-16 May-16 Jun-16 Jul-16 Aug-16
Monthly Clicks Monthly Searches
Ind
exe
d M
on
thly
Searc
hes
vo
lum
e
In the lead up to the key holiday seasons travel searches increase
January sees the highest volume of clicks
Ind
exe
d M
on
thly
Click
s vo
lum
e
+8%*
+6%* +7%
*
Summer Holiday Easter/
Anzac Day Holiday
Source: Microsoft internal data, September 15 – August 16 monthly searches and clicks index.
* Indicates % growth
compared to monthly
average

7% 4% 11% 10%
12% 6% 5% 8%
10% 11% 8% 5% 18%
38% 16% 6% 7%
8% 12% 7%
17% 6% 4%
Sep Oct Nov Dec
2016
Cruise
Travel Media &
Publications
Tourist Attractions
& Destinations
Car Rental Services
Accommodations
Air Travel
Travel related searches increase in November across all subcategories, this is most likely due to
last minute planning
Cruise category registers strong volume increase between September to November
Sep -15 Oct -15 Nov-15 Dec -15 Jan- 16 Feb-16 Mar-16 Apr-16 May-16 Jun- 16 Jul- 16 Aug-16
Source: Microsoft internal data, September 15 – August 16 Monthly Searches Index.

Air travel dominates search share on Bing
Network
Accommodation as well as tourist attractions & destinations hold similar share of total searches
ClicksSearches
Air travel
Accommodation
Tourist attractions
& destinations
32% 47%
21% 28%
20% 4%
Transportation &
excursions 17% 4%
5%Cruises & cruise
services 4%
Source: Microsoft internal data
September 15 – August 16 monthly searches and clicks.
9%
8%
9%
10%
7%
9%
4%
4%
4%
4%
3%
4%
88%
88%
87%
86%
90%
87%
0% 10% 20% 30% 40% 50% 60% 70% 80% 90% 100%
Air travel
Accommodation
Travel media & publications
Tourist attractions & destinations
Car rental services
Cruise
The Bing Network audience prefers to use PC for travel research
Tourist attractions and destinations is the category with most mobile searches
Tablet PCMobile
Source: Microsoft internal data September 15 – August 16 total searches.

Millennials prefer travel as a way to explore new cultures
They are action-oriented, eco-conscious and tech-savvy
Source: Microsoft internal data November 15 – January 16. Search share across all generations in travel sub-categories.Roy Morgan Research, Same same but different: the holiday habits of Millennials.Forbes, Are Millennial Travel Trends Shifting in 2016?
Millennials account for % of category searches (Millennials, Gen-X, Baby Boomers):
33% 33% 38%
37% 33% 38%
33% 33% 38%
33% 38%

Gen-X travellers seek holiday of personal and financial
value
They enjoy a mix of work and play and in some cases
balancing family activities
31% 35% 45%share of searches
42% 33%34%
Source: Microsoft internal data November 15 – January 16. Search share across all generations in travel sub-categories. TripAdvisor, TripBarometer Travel Trends 2016.
Gen-X accounts for % of category searches (Millennials, Gen-X, Baby Boomers):

Baby boomers are travelling like never before
100% year on year increase for travel related searches on
the Bing Network
56% 42% 33%
40% 42% 36%
Source: Microsoft internal data November 15 – January 16. Search share across all generations in travel sub-categories. The Australian, Australia's seniors travelling more.
Baby-Boomers account for % of category searches (Millennials, Gen-X, Baby Boomers):

Air travel

Air travel related searches mildly seasonal with peaks prior to key holiday seasons
January sees the highest volume of searches and clicks followed by April
Summer Holiday Easter/
Anzac Day Holiday
Adjust your daily budgets
to capture the increase in
demand preceding key
holiday seasons
Key Months: January and
April, September,
November
Checklist
Ind
exe
d m
on
thly
searc
hes
vo
lum
e
0%
20%
40%
60%
80%
100%
120%
140%
160%
0%
20%
40%
60%
80%
100%
120%
Sep-15 Oct-15 Nov-15 Dec-15 Jan-16 Feb-16 Mar-16 Apr-16 May-16 Jun-16 Jul-16 Aug-16
Monthly Clicks Monthly Searches
Ind
exe
d m
on
thly
click
s v
olu
me
+10%* +8%*+4%
*
Source: Microsoft internal data September 15 – August 16.
* Indicates % growth
compared to monthly
average

0%
20%
40%
60%
80%
100%
120%
140%
0%
20%
40%
60%
80%
100%
120%
Oct-15 Nov-15 Dec-15 Jan-16 Feb-16 Mar-16
Non branded Searches Branded Searches
Non-branded searches peaked in January and February
Branded searches increased in November, January
Contact your Account
Manager today to review
your brand campaign
budget and performance
Key months for branded
searches: January,
November
Key months for non
branded searches:
January and February
Checklist
Ind
exe
d m
on
thly
bra
nd
ed
searc
hes
vo
lum
e
Ind
exe
d m
on
thly
no
n b
ran
ded
searc
hes
vo
lum
e
Source: Microsoft internal data October 15 – March 16.
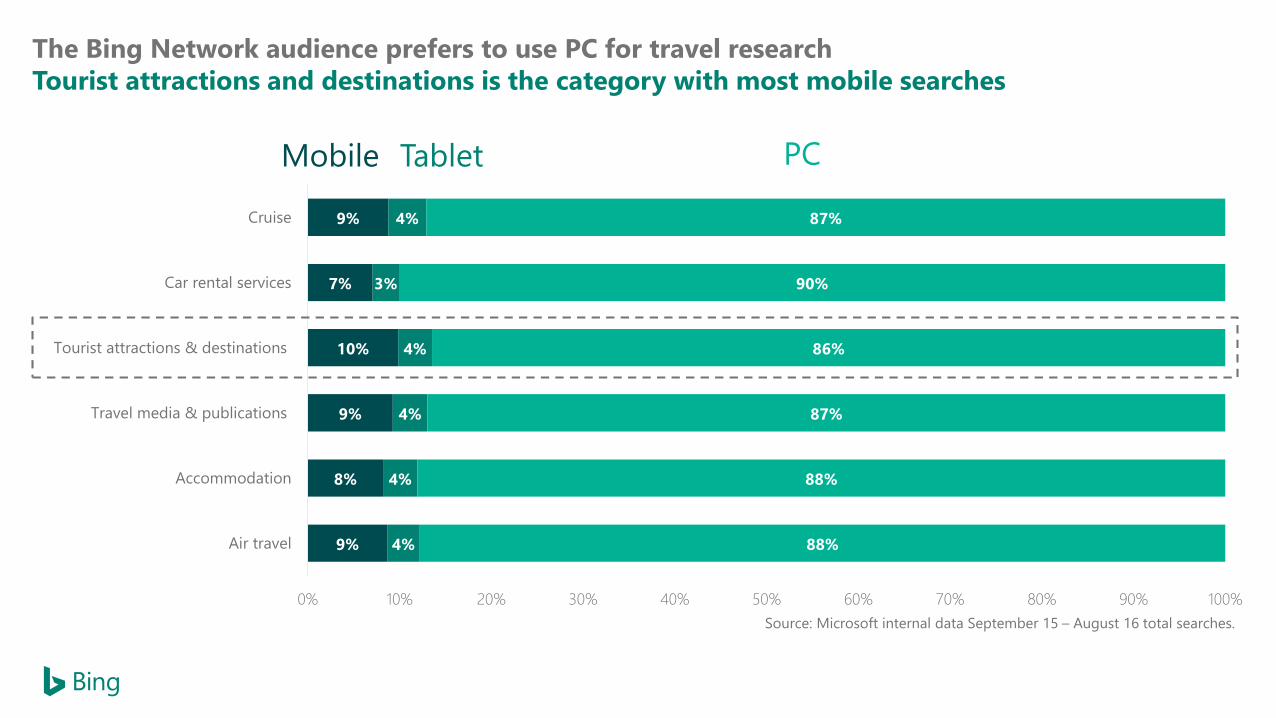
Qantas and Jetstar are the two most searched airline brands
Webjet is the most popular air travel booking website among users during summer period
Review your ad extensions adoption and leverage expanded text ad and structured snippet to secure larger
real estate for your brand search results
Source: Microsoft internal data.

Top 15 non-branded search terms in air travel
Top non-branded searches
Source: Microsoft internal data October 15 – March 16.
Contact your Account Manager today for a Keyword
Gap Analysis
cheap flights australia
cheapest flights
cheap flight
flights to melbourne
cheap flights to melbourne
airfares
cheap flights to bali
flights to bali
flight
cheap airfares
flights
flight tracker
cheap flights

0%
20%
40%
60%
80%
100%
120%
Oct-15 Nov-15 Dec-15 Jan-16 Feb-16 Mar-16
Domestic International
+3%*
January registered the highest search volume increase for both domestic and international
destinations in air travel
Uplift in November for international destinations could be attributed to last-minute bookings
Checklist
Ind
exe
d M
on
thly
Searc
hes
vo
lum
e
Secure top positions for
key destinations to
capture increased
demand
Key months for domestic
destinations: January –
March
Key months for
international destinations:
November, January-
March
+22%*
+15%*
Source: Microsoft internal data,
* Indicates % growth
compared to monthly
average

Canberra and Newcastle are gaining travellers’ attention
Top 10 most searched domestic destinations in air travel and their year on year growth in search volume
Source: Microsoft internal data, Top 10 domestic destinations air travel November -January ‘15 vs ’16,
Lastminute.Com.Au Reveals Australia's 2016 Travel Wish List,
Secure top positions for most searched destinations to capture increased demand
SYDNEY
+33%
MELBOURNE
+38%
BRISBANE
+32%
PERTH
+32%
ADELAIDE
+40%
CARINS
+34%
NEWCASTLE
+41%
DARWIN
+32%
CANBERRA
+44%
HOBART
+36%

Generation XMillennials Baby Boomers
Sydney 20%
Melbourne 16%
Perth 14%
Brisbane 14%
Adelaide 6%
Cairns 4%
Darwin 3%
Canberra 3%
Hobart 2%
Newcastle 2%
Rest of AU 15%
Melbourne 18%
Sydney 17%
Brisbane 15%
Perth 12%
Adelaide 8%
Cairns 4%
Darwin 3%
Canberra 3%
Townsville 2%
Newcastle 2%
Rest of AU 16%
Sydney 21%
Melbourne 17%
Brisbane 14%
Perth 13%
Adelaide 6%
Cairns 4%
Darwin 3%
Canberra 2%
Newcastle 2%
Hobart 2%
Rest of AU 16%
Melbourne has been crowned as the world’s most liveable city for 6 consecutive years, its subtle
charms and vibrant culture make it the most popular destination among millennial travellers
Top 10 most searched domestic destinations by age group in air travel
Source: Microsoft internal data October 15 – March 16,

November
1. Tasmania
2. Launceston
3. Mackay
4. Adelaide
5. Hobart
December
1. Broome
2. Townsville
3. Hobart
4. Perth
5. Adelaide
January
1. Newcastle
2. Canberra
3. Cairns
4. Darwin
5. Hobart
Tasmania has outshone other domestic destinations during summer period in air travel
Top 5 domestic destinations with highest increase in search volume from November to January
Reserve incremental budget for top gainers to capture search volume increases and set up shared budgets to
make sure your campaigns do not go dark
Source: Microsoft internal data.

Bing travellers are seeking beach getaways or big city experiences when travelling overseas
Top 10 most searched international destinations in air travel and their year on year growth in search volume
BALI
+107%
SINGAPORE
+25%
LONDON
+26%
AUCKLAND
+34%
Source: Microsoft internal data, Top 10 international destinations Air Travel, November - January ‘15 vs ’16.
FIJI
+9%
HAWAII
+27%
PHUKET
+21%
NEW YORK
+25%
BANGKOK
+11%
MANILA
+18%
Secure top positions for most searched destinations to capture increased demand

Bali is the #1 international destination in air travel across all age groups
Top 10 most searched international destinations by age group in air travel
Generation XMillennials Baby Boomers
Bali 12%
London 4%
Singapore 4%
Auckland 3%
Fiji 3%
Hawaii 2%
New York 2%
Phuket 2%
India 2%
Japan 2%
Rest of the world 64%
Bali 15%
Singapore 6%
London 5%
Fiji 3%
Auckland 3%
Hawaii 3%
Phuket 2%
Bangkok 2%
New York 2%
Manila 2%
Rest of the world 57%
Bali 11%
Singapore 5%
London 5%
Auckland 2%
Phuket 2%
Bangkok 2%
Fiji 2%
Hawaii 2%
Manila 2%
New York 1%
Rest of the world 66%
Source: Microsoft internal data October 15 – March 16.

November
1. Bali
2. Asia
3. USA
4. Honolulu
5. Auckland
December
1. India
2. Japan
3. Bangkok
4. Dublin
5. Queenstown
January
1. Rome
2. Paris
3. Hawaii
4. Athens
5. Las Vegas
Australians travelling internationally consider destinations closer to home in November and
DecemberTop 5 international destinations with highest increase in search volume from November to January
Reserve incremental budget for top gainers to capture search volume increases and set up shared budgets to
make sure your campaigns do not go dark
Source: Microsoft internal data.

Higher interest shown in air travel searches on weekdays for PC
Mobile and tablet searches increase towards the end of the week
0%
20%
40%
60%
80%
100%
120%
140%
Monday Tuesday Wednesday Thursday Friday Saturday Sunday
Mobile PC Tablet
Ind
exe
d b
ase
d o
n w
eekly
searc
hes
vo
lum
e a
vera
ge
Adjust your budget to capture the increase demand in earlier of the weekSource: Microsoft internal data October 15 – March 16.

0%
50%
100%
150%
200%
250%
300%
0 2 4 6 8 10 12 14 16 18 20 22 0 2 4 6 8 10 12 14 16 18 20 22 0 2 4 6 8 10 12 14 16 18 20 22
Mobile Tablet PC
PC searches peak around mid-day, tablet and mobile searches increase after 7pm
Millennials Generation X Baby Boomers
PC : 1 & 3 pm
Tablet: 7 pm
Mobile: 8 pm
PC : 1 pm
Tablet: 8 pm
Mobile: 8pm
PC : 3 pm
Tablet: 8 pm
Mobile: 7pm
Activate expanded device targeting to take control of your device bids
Ind
exe
d b
ase
d o
n d
aily s
earc
hes
vo
lum
e a
vera
ge
Source: Microsoft internal data October 15 – March 16.

Accommodation

Accommodation searches flourish during warmer months of the year
Uplift in search volume from September to April (compared to monthly average)
Adjust your daily budgets
to capture the increase in
demand preceding key
holiday seasons
Key Months: January,
April, September,
November
Checklist
Ind
exe
d m
on
thly
searc
hes
vo
lum
e
0%
20%
40%
60%
80%
100%
120%
140%
0%
20%
40%
60%
80%
100%
120%
Sep-15 Oct-15 Nov-15 Dec-15 Jan-16 Feb-16 Mar-16 Apr-16 May-16 Jun-16 Jul-16 Aug-16
Monthly Clicks Monthly Searches
Ind
exe
d m
on
thly
click
s v
olu
me +5%
* +10%*
+6%*
Source: Microsoft internal data September 15 – August16.
* Indicates % growth
compared to monthly
average
Summer Holiday Easter/
Anzac Day Holiday

Contact your Account Manager today to review your brand campaign budget and performance
Non Branded
searches
Non Branded
clicks70%
80%
90%
100%
110%
120%
130%
140%
150%
80%
85%
90%
95%
100%
105%
110%
Oct-15 Nov-15 Dec-15 Jan-16 Feb-16 Mar-16
Non branded Searches Branded Search
Ind
exe
d m
on
thly
no
n b
ran
ded
searc
hes
vo
lum
eBranded vs. non-branded
59% 42%
Bing users show more interest in non-branded search terms when looking for accommodation
Uplift in both branded and non-branded search terms in October, November and January
(compared to monthly average)
Ind
exe
d m
on
thly
bra
nd
ed
searc
hes
vo
lum
e
Source: Microsoft internal data.

Wotif is the most popular online travel agent among users during summer period
Search demand for peer to peer booking sites increased from January to March
Review your ad extensions adoption and leverage expanded text ad and structured snippet to secure larger
real estate for your brand search results
Source: Microsoft internal data.

Domestic accommodation search volume increase during summer
January registers highest search volume increase for international accommodation
0%
20%
40%
60%
80%
100%
120%
Oct-15 Nov-15 Dec-15 Jan-16 Feb-16 Mar-16
Domestic International
+5%* +5%
*
Checklist
Ind
exe
d M
on
thly
Searc
hes
vo
lum
e
Secure top positions for
key destinations to
capture increased
demand
Key months for domestic
destinations: January –
March, November
Key months for
international destinations:
January – March
Source: Microsoft internal data.
+19%*
* Indicates % growth
compared to monthly
average

Top 15 non-branded search terms in
Accommodation
Contact your Account Manager today for keyword gap
analysis
Source: Microsoft internal data October 15 – March 16.
accommodation gold coast
bali accommodation
motels
caravan park
melbourne accommodation
noosa accommodation
accommodation sydney
byron bay accommodation
hamilton island accommodation
accommodation melbourne
caravan parks
hotel
last minute hotel deals
accommodation
hotels
Top non-branded searches

Canberra and Darwin stand out for increase in consumer interest
Top 10 most searched domestic destinations in accommodation and their year on year growth in search volume
Source: Microsoft internal data Top 10 domestic destinations Air Travel November -January ‘15 vs ’16.
Lastminute.Com.Au Reveals Australia's 2016 Travel Wish List.
Secure top positions for most searched destinations to capture increased demand
SYDNEY
+27%
MELBOURNE
+23%
BRISBANE
+21%
PERTH
+27%
ADELAIDE
+29%
CANBERRA
+51%
DARWIN
+38%
HOBART
+21%
CAIRNS
+27%
NOOSA
+16%

Top 5 major cities searches contributed to more than 50% of total domestic accommodation
searches
Top 10 most searched domestic destinations by age group in accommodation
Generation XMillennials Baby Boomers
Sydney 17%
Melbourne 14%
Brisbane 7%
Perth 6%
Adelaide 6%
Canberra 3%
Hobart 3%
Cairns 2%
Tasmania 2%
Queensland 2%
Rest of AU 38%
Sydney 19%
Melbourne 15%
Brisbane 8%
Perth 7%
Adelaide 6%
Canberra 3%
Cairns 3%
Hobart 2%
Noosa 2%
Darwin 2%
Rest of AU 33%
Sydney 18%
Melbourne 14%
Brisbane 8%
Perth 7%
Adelaide 6%
Canberra 3%
Cairns 3%
Noosa 2%
Hobart 2%
Queensland 3%
Rest of AU 34%
Source: Microsoft internal data October 15 – March 16.

November
1. Canberra
2. Perth
3. Brisbane
4. Adelaide
5. Noosa
December
1. Broome
2. Ballarat
3. Townsville
4. Noosa
5. Wollongong
January
1. Noosa
2. Canberra
3. Hobart
4. Sydney
5. Cairns
Noosa is one of the fastest growing domestic destinations in accommodation during summer
Top 5 domestic destinations with highest increase in search volume from November to January
Reserve incremental budget for top gainers to capture search volume increase and set up shared budget to
make sure your campaigns do not go dark
Source: Microsoft internal data.

Secure top positions for most searched destinations to capture increased demand
BALI
-1%
FIJI
+17%
SINGAPORE
+20%
PHUKET
+10%
LONDON
+2%
NEW YORK
+12%
DUBAI
+7%
WAIKIKI
+23%
PARIS
+9%
SEMINYAK
+14%
International travel is growing despites weaker currency
Top 10 most searched international destinations in accommodation and their year on year growth in search volume
Source: Microsoft internal data, Top 10 international destinations in accommodation, November -January '15 vs '16.

USA cities remain popular holiday spots for millennials and generation X during summer
Top 10 most Searched international destinations by age group in accommodation
Generation XMillennials Baby Boomers
Bali 8%
Fiji 5%
Singapore 3%
Phuket 3%
London 2%
New York 2%
Seminyak 2%
Waikiki 2%
Los Angeles 1%
Dubai 1%
Rest of the world 71%
Bali 9%
Fiji 5%
Singapore 4%
Phuket 3%
London 2%
New York 2%
Waikiki 2%
Seminyak 2%
Las Vegas 1%Auckland 1%
Rest of the world 69%
Bali 6%
Singapore 5%
Fiji 3%
London 3%
Phuket 2%
New York 2%
Paris 2%
Waikiki 1%
Dubai 1%
Bangkok 1%
Rest of the world 74%
Source: Microsoft internal data October 15 – March 16.

November
1. Honolulu
2. Auckland
3. Pattaya
4. Christchurch
5. Log Vegas
December
1. Philippines
2. Seminyak
3. Manila
4. Bali
5. Tokyo
January
1. Barcelona
2. Venice
3. California
4. Italy
5. Waikiki
Searches for European destinations soar in January as users search for value deals
Top 5 international destinations with highest increase in search volume during November to January
Reserve incremental budget for top gainers to capture search volume increase and set up shared budget to
make sure your campaigns do not go dark.
Source: Microsoft internal data.

50%
60%
70%
80%
90%
100%
110%
120%
130%
Monday Tuesday Wednesday Thursday Friday Saturday Sunday
Mobile PC Tablet
Higher interest shown in accommodation searches on weekdays for PC
Mobile and tablet searches increase during weekends
Adjust your budget to capture the increase demand in earlier of the week
Ind
exe
d b
ase
d o
n w
eekly
searc
hes
vo
lum
e a
vera
ge
Source: Microsoft internal data October 15 – March 16.

0%
50%
100%
150%
200%
250%
300%
0 2 4 6 8 10 12 14 16 18 20 22 0 2 4 6 8 10 12 14 16 18 20 22 0 2 4 6 8 10 12 14 16 18 20 22
Mobile Tablet PC
PC searches peak around mid-day, mobile searches increase in the afternoon
Millennials Generation X Baby Boomers
PC : 1pm
Tablet: 7pm
Mobile: 5pm
PC : 1pm
Tablet: 8pm
Mobile: 5pm
PC : 3pm
Tablet: 8pm
Mobile: 4pm
Activate expanded device targeting to take control of your device bids
Ind
exe
d b
ase
d o
n d
aily s
earc
hes
vo
lum
e a
vera
ge
Source: Microsoft internal data October 15 – March 16.

Cruise

Bing users’ cruise research aligned to the “wave season”
September sees the highest volume of cruise related searches
Adjust your daily budgets
to capture the increase in
demand preceding key
holiday seasons
Key months: September
to end of January and
July
Checklist
Ind
exe
d m
on
thly
searc
hes
vo
lum
e
0%
20%
40%
60%
80%
100%
120%
140%
160%
180%
200%
0%
20%
40%
60%
80%
100%
120%
140%
160%
Sep-15 Oct-15 Nov-15 Dec-15 Jan-16 Feb-16 Mar-16 Apr-16 May-16 Jun-16 Jul-16 Aug-16
Monthly Clicks Monthly Searches
+6%*
+35%*
+4%*
Ind
exe
d m
on
thly
click
s v
olu
me
Source: Microsoft internal data.
* Indicates % growth
compared to monthly
average
Summer Holiday Easter/
Anzac Day Holiday

0%
20%
40%
60%
80%
100%
120%
140%
160%
0%
20%
40%
60%
80%
100%
120%
140%
Oct-15 Nov-15 Dec-15 Jan-16 Feb-16 Mar-16
Non branded Searches Branded Searches
Contact your Account Manager today to review your brand campaign budget and performance.
Branded
searches
Branded
clicks
Branded vs. non-branded
Bing users show more interest in non-branded search terms when looking for cruise related
information
Searches for non-branded terms trend high from October to January
46% 41%In
dexe
d m
on
thly
bra
nd
ed
searc
hes
vo
lum
e
Ind
exe
d m
on
thly
no
n b
ran
ded
searc
hes
vo
lum
e
Source: Microsoft internal data.

P&O and Princess Cruises are the two most searched cruise brands
Carnival Spirit is the most popular ship amongst users during summer period
Review your ad extensions adoption and leverage expanded text ad and structured snippet to secure larger
real estate for your brand search results.
Source: Microsoft internal data.

last minute cruises from sydney
mediterranean cruises
cruises from melbourne
cheap cruises discount
cheap cruises
cruises from brisbane
cruise deals
cruise
cruises from sydney
cruises
Top 10 non-branded search terms in cruise
Top non-branded searches
Contact your Account Manager today for keyword gap
analysis.
Source: Microsoft internal data October 15 – March 16.

Secure top positions for most searched destinations to capture increased demand.
AUSTRALIA
+37%
SYDNEY
+17%
BRISBANE
+76%
MELBOURNE
+61%
PERTH &
FREMANTLE
+68%
ADELAIDE
+78%
DARWIN
+35%
TASMANIA
+51%
CAIRNS
+68%
WHITSUNDAYS
+11%
Adelaide is gaining cruise travellers’ attention with +78% year on year search volume increase
Top 10 most searched domestic destinations in cruise and their year on year growth in search volume
Source: Microsoft internal data, Top 10 domestic destinations in cruise suppliers, November -January '15 vs '16.

Secure top positions for most searched destinations to capture increased demand.
SINGAPORE
+32%
HAWAII
+35%
ALASKA
+75%
MEDITERRANEAN
-7%
FIJI
+14%
ASIA
-16%
MILFORD SOUND
+69%
JAPAN
+50%
VIETNAM
+59%
NEW GUINEA
+59%
Cruise travel is gaining popularity at a rapid pace
Top 10 most searched international destinations in cruise and their year on year growth in search volume
Source: Microsoft internal data. Top 10 international destinations in cruise suppliers, November -January '15 vs '16.
CLIA 2016 Cruise Industry Outlook.

50%
60%
70%
80%
90%
100%
110%
120%
130%
140%
Monday Tuesday Wednesday Thursday Friday Saturday Sunday
Mobile PC Tablet
Higher interest shown in cruise searches on weekdays for PC
Mobile and tablet searches increase towards the end of the week
Adjust your budget to capture the increase demand in earlier of the week
Ind
exe
d b
ase
d o
n w
eekly
searc
hes
vo
lum
e a
vera
ge
Source: Microsoft internal data October 15 – March 16.

0%
50%
100%
150%
200%
250%
300%
0 2 4 6 8 10 12 14 16 18 20 22 0 2 4 6 8 10 12 14 16 18 20 22 0 2 4 6 8 10 12 14 16 18 20 22
Mobile Tablet PC
Ind
exe
d b
ase
d o
n d
aily s
earc
hes
vo
lum
e a
vera
ge
PC searches peak around mid-day, tablet and mobile searches increase after 7pm
Millennials Generation X Baby Boomer
PC : 3 pm
Tablet: 8 pm
Mobile: 8 pm
PC : 2-3 pm
Tablet: 7 pm
Mobile: 7-8pm
PC : 3 pm
Tablet: 7 pm
Mobile: 7pm
Activate expanded device targeting to take control of your device bids.Source: Microsoft internal data October 15 – March 16.

Car rental services

0%
20%
40%
60%
80%
100%
120%
140%
160%
0%
20%
40%
60%
80%
100%
120%
140%
Sep-15 Oct-15 Nov-15 Dec-15 Jan-16 Feb-16 Mar-16 Apr-16 May-16 Jun-16 Jul-16 Aug-16
Monthly Clicks Monthly Searches
+7%*
Car rental related search volume increase one month prior to the holiday seasons
March sees the highest volume of car rental related searches
Checklist
Adjust your daily budgets
to capture the increase in
demand preceding key
holiday seasons
Key months: March, April,
November
+7%* +10%
*
Ind
exe
d M
on
thly
Click
s v
olu
me
Source: Microsoft internal data.
* Indicates % growth
compared to monthly
average
Ind
exe
d m
on
thly
searc
hes
vo
lum
e
Summer Holiday Easter/
Anzac Day Holiday

Contact your Account Manager today to review your brand campaign budget and performance.
Branded
searches
Branded
clicks
1
70%
80%
90%
100%
110%
120%
130%
140%
150%
80%
85%
90%
95%
100%
105%
110%
Oct-15 Nov-15 Dec-15 Jan-16 Feb-16 Mar-16
Non branded Searches Branded Searches
Branded vs. non-branded
Users lean towards non-branded terms when looking for car rental services
Branded and non-branded searches increase in the same months
44% 45%
Branded vs. non-branded
Ind
exe
d m
on
thly
bra
nd
ed
searc
hes
vo
lum
e
Ind
exe
d m
on
thly
no
n b
ran
ded
searc
hes
vo
lum
e
Source: Microsoft internal data.

Top branded searches
car hire brisbane airport
hire car
car hire brisbane
car hire cairns
car hire melbourne
car hire uk
rental cars
car rentals
car rental
car hire
Top non-branded searches
Hertz and Avis are the two most searched car rental service brands
Review your ad extensions adoption and leverage expanded text ads and structured snippets to secure larger real estate for
your brand search results.
Contact your Account Manager today for keyword gap analysis. Source: Microsoft internal data October 15 – March 16.

Secure top positions for most searched destinations to capture increased demand.
MELBOURNE
+40%
BRISBANE
+26%
SYDNEY
+33%
PERTH
+31%
CAIRNS
+64%
HOBART
+41%
LAUNCESTON
+47%
ADELAIDE
+37%
TASMANIA
+38%
DARWIN
+41%
Cairns is the fastest growing domestic destination among car rental searches
Top 10 most searched domestic destinations in car rental services and their year on year growth in search volume
Source: Microsoft internal data, Top 10 domestic destinations in car rental services, November -January '15 vs '16.

Secure top positions for most searched destinations to capture increased demand.
AUCKLAND
+37%
USA
+13%
CHRISTCHURCH
+25%
QUEENSTOWN
+40%
WELLINGTON
+14%
LOS ANGELES
+38%
FIJI
+43%
HAWAII
+47%
LONDON
-6%
ITALY
+19%
New Zealand destinations stand out in terms of car rental searches
Top 10 most searched international destinations in in car rental services and their year on year growth in search volume
Source: Microsoft internal data, Top 10 international destinations in car rental services, November -January '15 vs '16.

50%
60%
70%
80%
90%
100%
110%
120%
130%
Monday Tuesday Wednesday Thursday Friday Saturday Sunday
Mobile PC Tablet
Higher interest shown in car rental searches on weekdays for PC
Mobile and tablet searches increase towards the end of the week
Adjust your budgets to capture the increase in demand earlier during the week.
Ind
exe
d b
ase
d o
n w
eekly
searc
hes
vo
lum
e a
vera
ge
Source: Microsoft internal data October 15 – March 16.
0%
50%
100%
150%
200%
250%
300%
0 2 4 6 8 10 12 14 16 18 20 22 0 2 4 6 8 10 12 14 16 18 20 22 0 2 4 6 8 10 12 14 16 18 20 22
Mobile Tablet PC
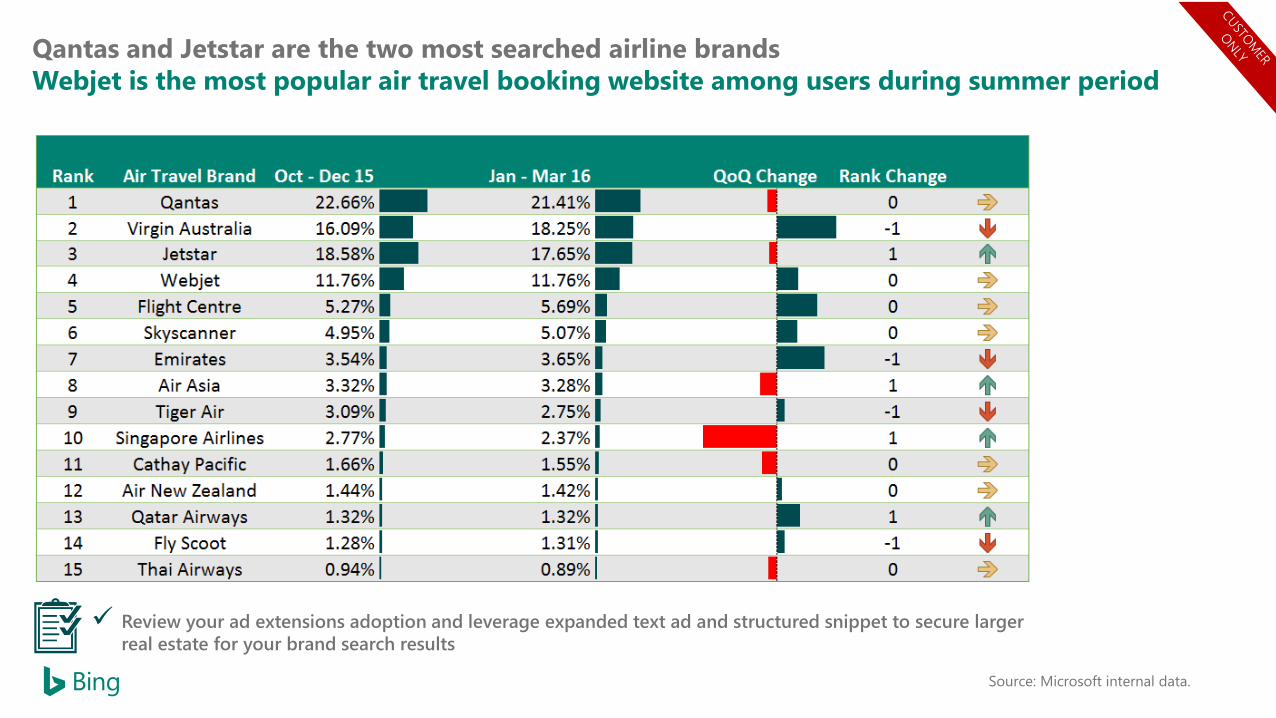
Mobile searches peak in the morning for car rental services
Millennials Generation X Baby Boomer
PC : 12 pm
Tablet: 8 pm
Mobile: 10 am
PC : 12 pm
Tablet: 8 pm
Mobile: 8 am
PC : 1-2 pm
Tablet: 7 pm
Mobile: 12 pm
Activate expanded device targeting to take control of your device bids.
Ind
exe
d b
ase
d o
n d
aily s
earc
hes
vo
lum
e a
vera
ge
Source: Microsoft internal data October 15 – March 16.

Remember your Bing Ads travel essentials

Grab attention with brand term bidding
During an internal study of 25 million clicks in the retail vertical, Bing found that brand term bidding yielded
a 64% lift in incremental paid and organic clicks.
52%
85%
48%
15%
Organic only Brand ad + organic
You
Your
competitor
Your
competitor
You
Source: Microsoft internal data, Bing Ads Brand Term Bidding Study US, March 2016.
Drive more clicks
You can drive more clicks by bidding on your own brand terms.
Protect your brand term
Do not lose leads and clicks for
your brand to your competitors.

Expanded Text Ads
Improve engagement with potential customers.
Watch a short video about Expanded Text Ads
or learn more from your Account Manager.
Create more compelling calls to action by presenting customers with more information about your business.
Increase audience engagement by
providing additional information
about your offerings.
Choose from 13 available
categories to showcase up to
10 highlights per ad.
Combine with Callout Extensions
and other ad extensions to increase
your click-through rate.
STANDARD EXPANDED
Contoso Flowers Online! | contosoflowers.comAd . contosoflowers.com
Up to 25% Off Beautiful Flowers Hand-Delivered by a Local Florist!
Contoso Flowers Online! – Beautiful Flowers Anytime!Ad . contosoflowers.com/birthday/roses
Up to 25% Off Beautiful Farm Fresh Flowers Hand-Delivered by a Local Florist!
80-character ad text limit
Customisable paths Additional ad title

Structured Snippet Extensions
Highlight specific products or services to provide more information about your business.
Watch a short video about Expanded Text Ads
or learn more from your Account Manager.
Longer ad title and text
The character limit has been increased
for the ad title and text
Seamless across devices
Ads are automatically mobile-optimised,
reducing the need for multiple ads by
device (mobile, tablet, desktop)
Optimised for Upgraded URLs
You can set up your Expanded Text Ads
using final URLs
Contoso FlowersAd . www.contoso.com
Wide Selection. Same Day Delivery Available.
100 Varieties . Fresh Flowers . Garden Supplies
Types: Flowers, Plants, Gift Baskets, Keepsake Gifts

Remarketing in Paid Search campaigns: The second opportunity for a conversion
It helps to reconnect, enticing people to come back and complete a transaction.
User added in remarketing listYour website
Former visitor searches on
Bing NetworkYour ad is
served
Your Ads
Visitor leavesVisitor
Users return to your assigned site/page
Watch a short video about remarketing
or learn more from your Account Manager.

Conversions are the specific actions
advertisers want their visitors to
complete on their website, after they
click their ad.
Remarketing allows advertisers to
define and engage users who have
previously visited their website.
Universal Event Tracking is a
prerequisite for both Conversion
Tracking* and Remarketing.
* This QRG focuses on UET for conversion tracking.
Tracks specific actions advertisers
want visitors to complete after clicking
their ad
Conversion Tracking
Allows advertisers to define and
engage users who have previously
visited their website.
Remarketing
Prerequisite
Universal Event Tracking (UET)
Universal Event Tracking
Universal Event Tracking (UET) is a powerful and simple campaign measurement solution that allows
advertisers to track conversions and other metrics important to their business.
Watch a short video about Universal Event Tracking
or learn more from your Account Manager.

Expanded Device Targeting
Get more control over device bid adjustments.
More bid adjustment flexibility to improve your return on ad spend.
Get additional device options
Desktop is a new device option, in
addition to tablet and mobile
Exclude underperforming devices
You can opt out of mobile and
tablet (new)
Use broader bid modifier ranges
Desktop 0% to +900%
Tablet -100% to +900%
Mobile -100% to +900%

Desktop
experience
Starting now,
increase your
visibility on PC
during weekdays to
capture more travel
searches and
conversions
Ready for Easter via Remarketing
Set up your
remarketing list in
summer to capture
users who have
engaged with your
products
Capture the summer surge
Adjust daily budgets
to capture increase
in demand
preceding key
holiday seasons
(particularly
November and
January)
Last-minute opportunity
Control share of
voice for popular
last minute summer
destinations and be
present on mobile
to acquire last
minute bookings
Top recommendations to keep in mind when planning summer travel marketing activities

Be there.

© 2016 Microsoft Corporation. All rights reserved. Microsoft, Windows, and other
product names are or may be registered trademarks and/or trademarks in the U.S.
and/or other countries.
The information herein is for informational purposes only and represents the current
view of Microsoft Corporation as of the date of this presentation.
Because Microsoft must respond to changing market conditions, it should not
be interpreted as a commitment on the part of Microsoft, and Microsoft cannot
guarantee the accuracy of any information provided after the date
of this presentation.
Microsoft MAKES NO WARRANTIES–EXPRESS, IMPLIED, OR STATUTORY–
REGARDING THEI NFORMATION IN THIS PRESENTATION.

© 2016 Microsoft Corporation. All rights reserved. Microsoft, Windows, and other product names are or may be registered trademarks and/or trademarks in the U.S. and/or other countries.
The information herein is for informational purposes only and represents the current view of Microsoft Corporation as of the date of this presentation. Because Microsoft must respond to changing market conditions, it should not be interpreted to be a
commitment on the part of Microsoft, and Microsoft cannot guarantee the accuracy of any information provided after the date of this presentation.
MICROSOFT MAKES NO WARRANTIES, EXPRESS, IMPLIED OR STATUTORY, AS TO THE INFORMATION IN THIS PRESENTATION.
Related Documents