asx release Classification Transurban Group Transurban International Limited ABN 90 121 746 825 Transurban Holdings Limited ABN 86 098 143 429 Transurban Holding Trust ABN 30 169 362 255 ARSN 098 807 419 [email protected] www.transurban.com Level 23 Tower One, Collins Square 727 Collins Street Docklands Victoria 3008 Australia Telephone +613 8656 8900 Facsimile +613 9649 7380 4 May 2017 TRANSURBAN INVESTOR DAY PRESENTATION Please find attached the investor presentation and NorthConnex information booklet that will be provided at the Transurban Investor Day today. The presentation will be webcast live from 9:30am AEST on the Transurban website www.transurban.com. Amanda Street Company Secretary Investor enquiries Jessica O’Brien Head of Investor Relations +61 3 8656 8364 Media enquiries Josie Brophy Senior Advisor, Media and Communications +61 4 3716 5424 For personal use only

Welcome message from author
This document is posted to help you gain knowledge. Please leave a comment to let me know what you think about it! Share it to your friends and learn new things together.
Transcript
asx release
Classification Transurban Group
Transurban International Limited
ABN 90 121 746 825
Transurban Holdings Limited
ABN 86 098 143 429
Transurban Holding Trust
ABN 30 169 362 255
ARSN 098 807 419
www.transurban.com
Level 23
Tower One, Collins Square
727 Collins Street
Docklands
Victoria 3008 Australia
Telephone +613 8656 8900
Facsimile +613 9649 7380
4 May 2017
TRANSURBAN INVESTOR DAY PRESENTATION
Please find attached the investor presentation and NorthConnex information booklet that will be provided at the Transurban Investor Day today. The presentation will be webcast live from 9:30am AEST on the Transurban website www.transurban.com.
Amanda Street Company Secretary Investor enquiries Jessica O’Brien Head of Investor Relations +61 3 8656 8364
Media enquiries Josie Brophy Senior Advisor, Media and Communications +61 4 3716 5424
For
per
sona
l use
onl
y
Investor Day 2017Transurban
4 May 2017
For
per
sona
l use
onl
y
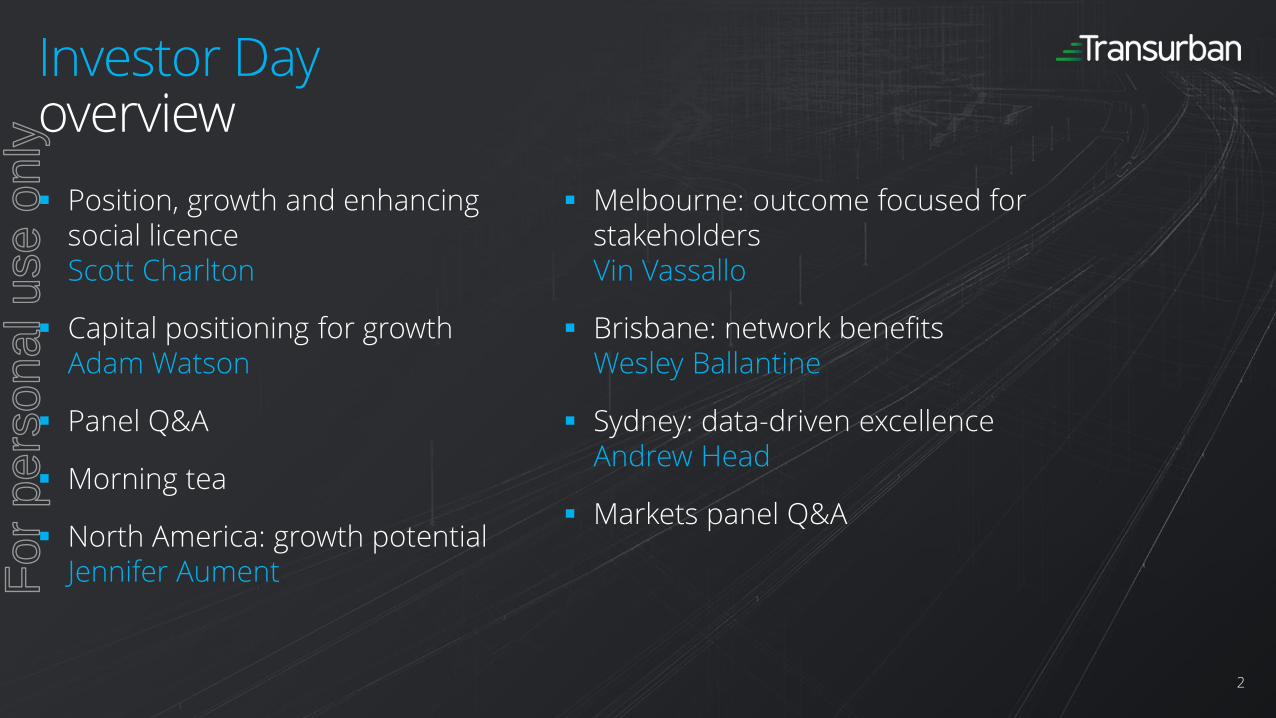
Investor Day overview
Position, growth and enhancing social licence Scott Charlton
Capital positioning for growthAdam Watson
Panel Q&A
Morning tea
North America: growth potentialJennifer Aument
Melbourne: outcome focused for stakeholdersVin Vassallo
Brisbane: network benefitsWesley Ballantine
Sydney: data-driven excellenceAndrew Head
Markets panel Q&A
2
For
per
sona
l use
onl
y

OurExecutive Committee
3
Scott CharltonChief Executive Officer
Adam WatsonChief Financial Officer
Jennifer AumentGGM, North America
Wesley BallantineGGM, Queensland
Andrew HeadGGM, New South Wales
Vin VassalloGGM, Victoria
Tony AdamsGGM, Project Delivery and Operational Excellence
Sue JohnsonGGM, Customer Operations and Human Resources
Lisa TobinGGM, Technology
Michele HueyGGM, Strategy
For
per
sona
l use
onl
y

Position, growth andenhancing social licence
Scott Charlton
For
per
sona
l use
onl
y

Our strategy
5
To be the partner of choice with governments providing effective and innovative urban road infrastructure and services utilising core capabilities
Operations
Communityengagement
Development& delivery
Technology
Network planning& forecasting
Customermanagement
For
per
sona
l use
onl
y

Strategy remains constant but continued success requires agility
6
Small, considered shifts in applications of strategy
Transurban’s IP in services and operations potentially deployed to 3rd party assets associated with our networks to enhance performance
Development pipeline in Australia andNorth America an opportunity for expansion of partnership approach
Project management of Gateway Upgrade North for Queensland Government
Project management of Monash Freeway Upgrade for Victorian Government
Delivery of ongoing operations and maintenance of ICB
Project management of ICB upgrade for Brisbane City Council
Explore new relationships with equity partners, concessionaires and contractors
Potential equity stakes to gain access to attractive assets and networks over time
New USA Administration looking to release infrastructure funding through policy initiatives which is expected to encourage proactive approaches regarding transport assets
For
per
sona
l use
onl
y

Political
Australia:
Infrastructure funding shortfall at federal level, states’ budget positions mixed
Short-term election cycles a barrier to long-term reform
USA:
Promise of $1 trillion investment
Specifics uncertain however policy landscape improving
Administration considering Australian policies including capital recycling to encourage infrastructure development
Economic Community Technology
Macro environment shifting—economic, community, political & technology
7
Australia:
Eastern states, particularly Sydney and Melbourne economies, driven by record infrastructure spend and population growth
House prices increasing but Reserve Bank monitoring risks
USA:
Households driving economic growth, supported by consumer sentiment
Geopolitical tensions may affect economic outlook
Trust has become a critical issue for corporates to manage
Increasing focus on social responsibilities of business community
Expectation that value proposition for all stakeholders is evident
Pace and magnitude of change creates opportunities
Flexibility and optionality required in decision making today
Transurban well positioned through targeted investments in different technologies to measure impact and opportunities for business
Strategic partnerships across technology spectrumF
or p
erso
nal u
se o
nly
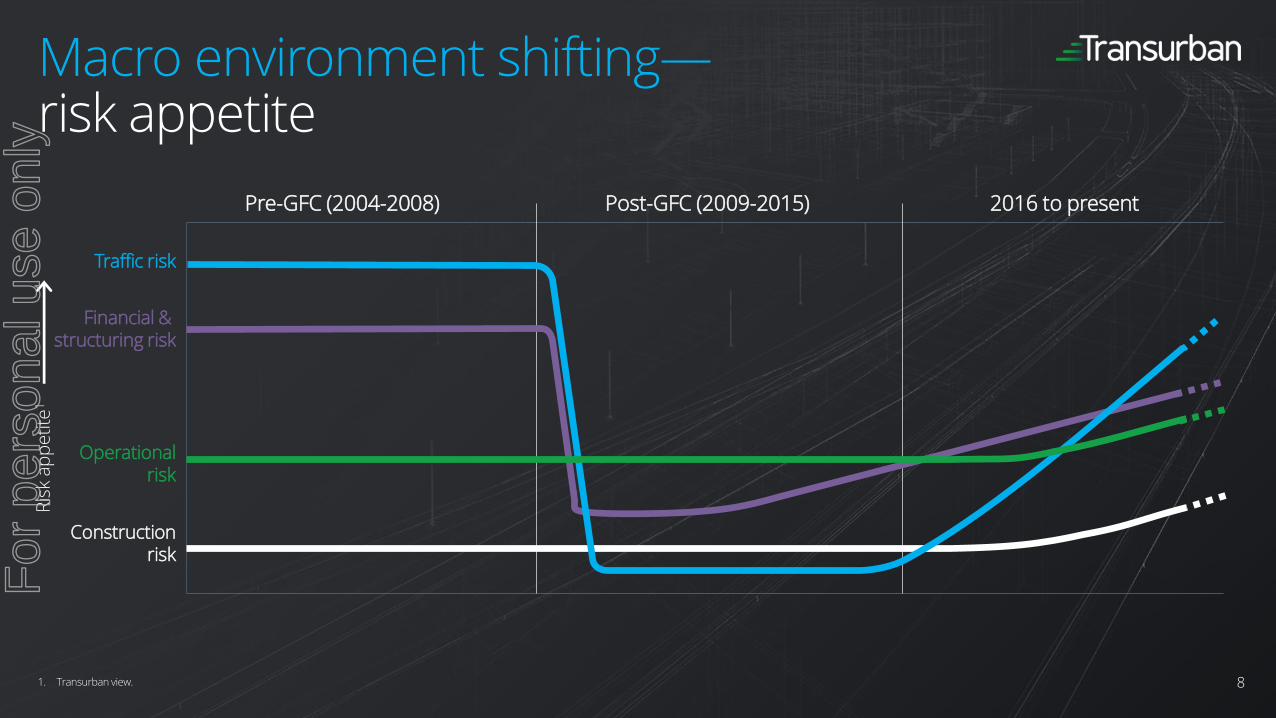
Macro environment shifting—risk appetite
8
Operationalrisk
Traffic risk
Financial & structuring risk
Constructionrisk
Pre-GFC (2004-2008) Post-GFC (2009-2015) 2016 to present
Ris
k ap
pe
tite
1
1. Transurban view.
For
per
sona
l use
onl
y
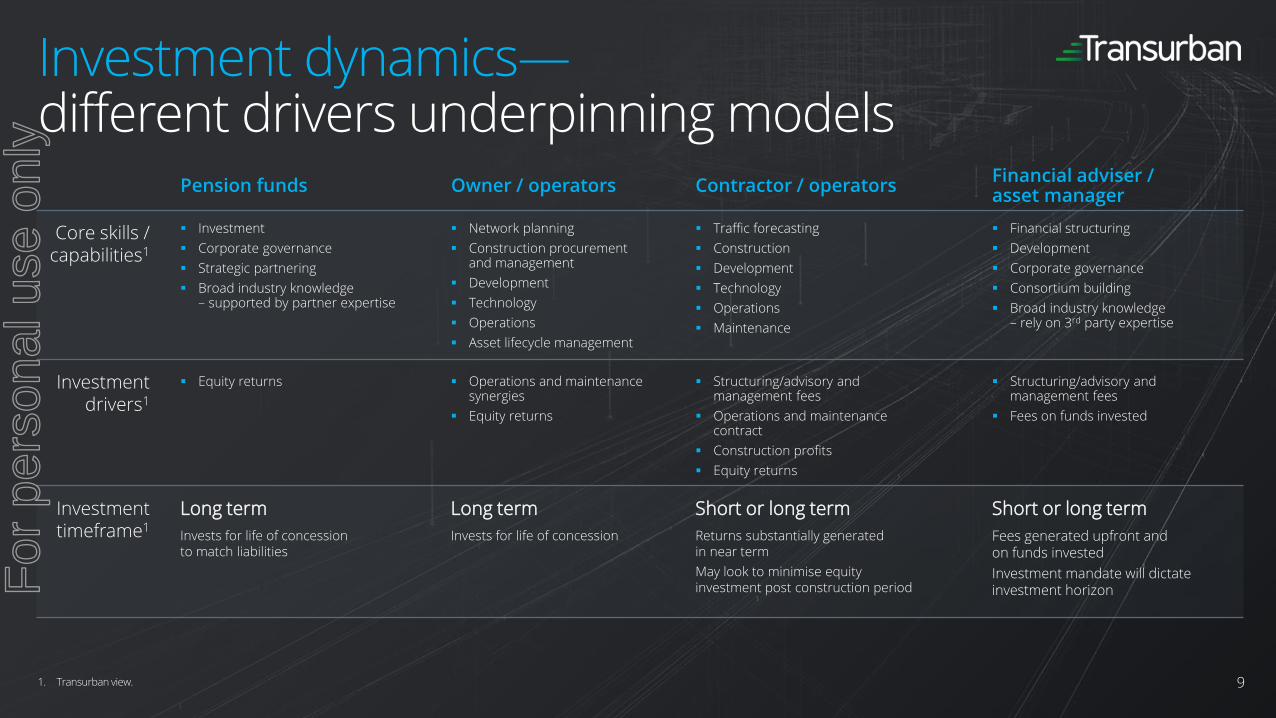
Pension funds Owner / operators Contractor / operatorsFinancial adviser / asset manager
Core skills / capabilities1
Investment
Corporate governance
Strategic partnering
Broad industry knowledge– supported by partner expertise
Network planning
Construction procurementand management
Development
Technology
Operations
Asset lifecycle management
Traffic forecasting
Construction
Development
Technology
Operations
Maintenance
Financial structuring
Development
Corporate governance
Consortium building
Broad industry knowledge– rely on 3rd party expertise
Investment drivers1
Equity returns Operations and maintenance synergies
Equity returns
Structuring/advisory and management fees
Operations and maintenance contract
Construction profits
Equity returns
Structuring/advisory and management fees
Fees on funds invested
Investmenttimeframe1
Long term
Invests for life of concessionto match liabilities
Long term
Invests for life of concession
Short or long term
Returns substantially generated in near term
May look to minimise equityinvestment post construction period
Short or long term
Fees generated upfront and on funds invested
Investment mandate will dictate investment horizon
Investment dynamics—different drivers underpinning models
91. Transurban view.
For
per
sona
l use
onl
y

Macro environment shifting Transurban will remain disciplined
10
Pre-GFC (2004-2008) Post-GFC (2009-2015) 2016 to present
Consortiums led by financial advisors /
asset managers and contractors
(led to significant distressed asset sales)
Significant investment by owner/operators and pension funds
Ris
k a
pp
eti
te1
Potential for higher risk models led by financial advisors /
asset managers and contractors
1. Transurban view.
For
per
sona
l use
onl
y
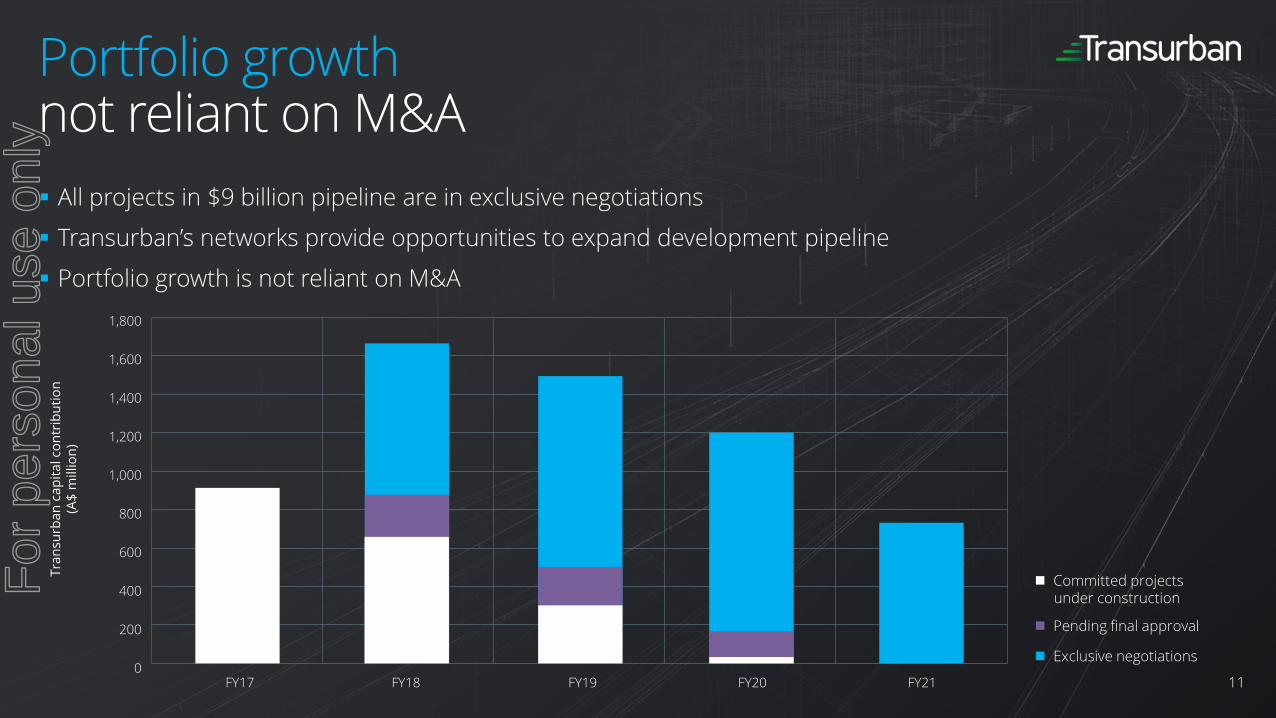
Portfolio growth not reliant on M&A
11
All projects in $9 billion pipeline are in exclusive negotiations
Transurban’s networks provide opportunities to expand development pipeline
Portfolio growth is not reliant on M&A
Tra
nsu
rba
n c
ap
ita
l co
ntr
ibu
tio
n
(A
$ m
illio
n)
1,800
1,600
1,400
1,200
1,000
800
600
400
200
0FY17 FY18 FY19 FY20 FY21
Exclusive negotiations
Committed projects under construction
Pending final approval
For
per
sona
l use
onl
y

Continued growth is reliant onmaintaining and enhancing social licence
12
Transurban’s
stakeholder map
Business partners
Employees
Customers
Investors
Community
Government
For
per
sona
l use
onl
y

Capital positioning for growthAdam Watson
For
per
sona
l use
onl
y
Capitalstrategy
Maintain strong investment grade credit metrics
Cost efficient funding through market cycles
Efficiently fund growth
Consistently growing distributions while creating long term value
14
14F
or p
erso
nal u
se o
nly

Global demand for high-quality infrastructure
Infrastructure remains attractive to global investors
Expectations of continued low global interest rates and growing pension liabilities support ongoing demand for investments delivering stable earnings
Limited availability of high-quality infrastructure investments expected to drive continued appetite for sector
Liquidity to support investment requirements
Diversified sources of capital available both domestically and internationally
Attractive tenors from debt capital markets
Liquidity supporting high quality investments expected to continue
Rising interest rate outlook from a historically low base
Interest rates are currently near historical all-time lows globally
Cautious approach by central banks to ensure smooth transition to tightening cycle
Expected to stay below long-term average for a sustained period of time
Observations capital markets
15
For
per
sona
l use
onl
y
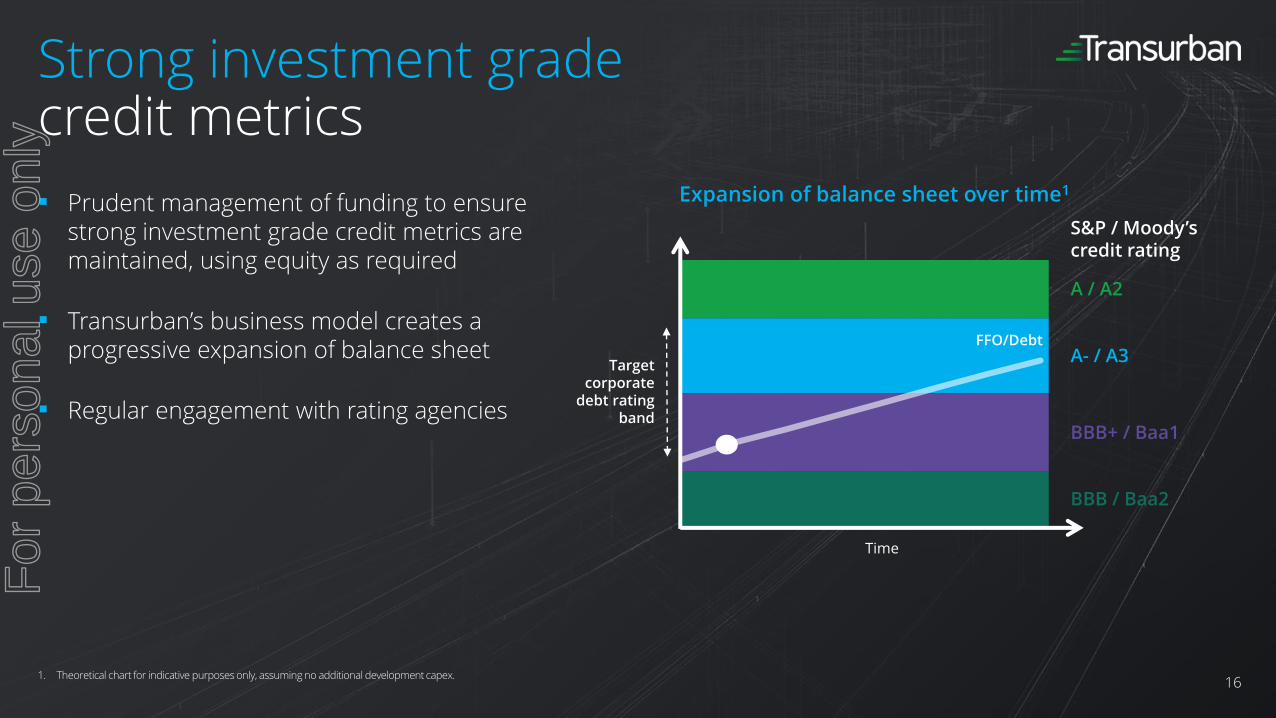
Strong investment gradecredit metrics
Prudent management of funding to ensure strong investment grade credit metrics are maintained, using equity as required
Transurban’s business model creates a progressive expansion of balance sheet
Regular engagement with rating agencies
16
Time
BBB+ / Baa1
A- / A3
A / A2
S&P / Moody’s credit rating
Expansion of balance sheet over time1
1. Theoretical chart for indicative purposes only, assuming no additional development capex.
FFO/Debt
Target corporate
debt rating band
BBB / Baa2
For
per
sona
l use
onl
y

0
2,000
4,000
6,000
8,000
10,000
12,000
14,000
16,000
18,000
A$
millio
n
GWA Sydney Brisbane Corporate Fixed amount
Hedged against rising interest ratesand protected against low inflation
1. Calculated on the full value of drawn debt including 100% of non-recourse drawn debt as at 31 March 2017. This overstates Transurban’s share of the debt. Non-AUD debt is converted at the hedged rate where cross currency swaps are in place. USD debt is converted at the spot exchange rate ($0.7629 at 31 March 2017) where no cross currency swaps are in place.
2. A$20 million drawn corporate working capital maturing June 2018 and A$44 million of drawn TQ capex maturing in December 2019 are unhedged. A$294 million PABs for 495 Express Lanes maturing in FY48 are hedged to FY28. A$16 million, of a total A$1.63 billion, M7 debt is unhedged from December 2017 to August 2019, and A$22 million is unhedged from August 2019 to August 2021.
3. A total of US$982 million corporate debt is not swapped to AUD, this debt forms part of the Group’s net investment hedge relating to US entities.
4. Revenue based on proportionate toll revenue as disclosed in the 1H17 Results Presentation.
5. Note each asset is subject to specific CPI conditions in the context of toll price adjustments.
Transurban interest rate hedging profile1Inflation-linked toll pricing, with upside4,5
99.6% interest rate hedged at31 March 2017
Hedge tenor is matched to the tenor of the debt on 98%2 of drawn debt
Currently 100% currency hedged3
82%
9%9%
■ CPI or greater
■ No CPI floor
■ Dynamic
17
For
per
sona
l use
onl
y
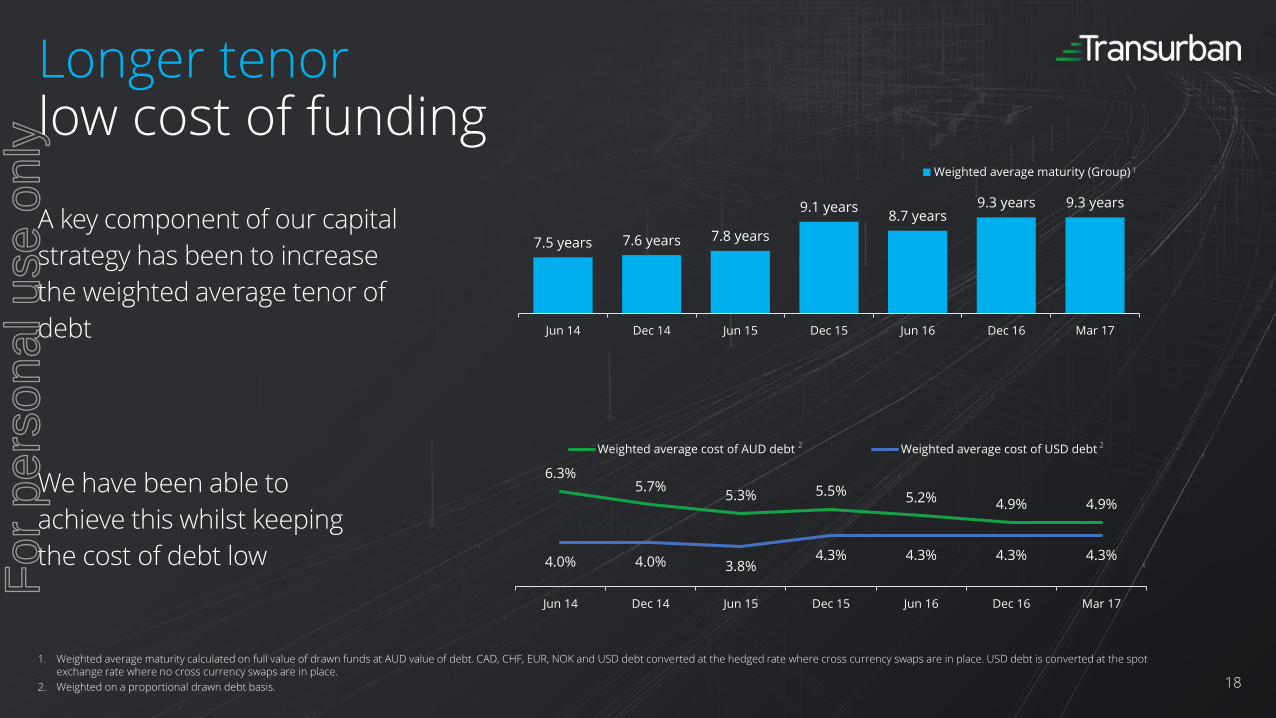
Longer tenorlow cost of funding
A key component of our capital
strategy has been to increase
the weighted average tenor of
debt
18
We have been able to
achieve this whilst keeping
the cost of debt low
7.5 years 7.6 years 7.8 years
9.1 years8.7 years
9.3 years 9.3 years
Jun 14 Dec 14 Jun 15 Dec 15 Jun 16 Dec 16 Mar 17
Weighted average maturity (Group)
6.3%5.7%
5.3% 5.5% 5.2% 4.9% 4.9%
4.0% 4.0% 3.8%4.3% 4.3% 4.3% 4.3%
Jun 14 Dec 14 Jun 15 Dec 15 Jun 16 Dec 16 Mar 17
Weighted average cost of AUD debt Weighted average cost of USD debt
1
2 2
1. Weighted average maturity calculated on full value of drawn funds at AUD value of debt. CAD, CHF, EUR, NOK and USD debt converted at the hedged rate where cross currency swaps are in place. USD debt is converted at the spot exchange rate where no cross currency swaps are in place.
2. Weighted on a proportional drawn debt basis.
For
per
sona
l use
onl
y

Diversification offunding sources
Refinancing bank debt into capital markets debt provides diversity and enables extension of average tenor of debt — a key component of our capital strategy
─ Reduced dependency on bank debt (from 48% at Jun 14 to 20% at Mar 17), increasing the capacity to fund new projects
Issuances during 1H17 diversified across markets — USD 144A, AMTN, NOK notes, CHF notes and USPP
─ Since FY14, new markets entered into include AUD PP, CHF notes, NOK notes and USD 144A
─ Diversification at both the corporate and asset level e.g. TQ, NWRG, ED, GWA
Enhanced optionality enables Transurban to consider multiple markets to optimise volume, price and tenor
1. Proportional drawn debt inclusive of issued letters of credit. Debt in AUD, CAD, CHF, EUR, NOK and USD debt converted at the hedged rate where cross currency swaps are in place. USD debt is converted at the spot exchange rate ($0.9420 at 30 June 2014 and $0.7629 at 31 March 2017) where no cross currency swaps are in place.
2. Proportional drawn debt exclusive of issued letters of credit. Debt in AUD, CAD, CHF, EUR, NOK and USD debt converted at the hedged rate where cross currency swaps are in place. USD debt is converted at the spot exchange rate ($0.9420 at 30 June 2014 and $0.7629 at 31 March 2017) where no cross currency swaps are in place. The security price was $7.39 at 30 June 2014 and $11.67 at 31 March 2017 with 1,896 million securities on issue at 30 June 2014 and 2,052 million securities on issue at 31 March 2017.
June 2014 Group debt1 March 2017 Group debt1
A$13,603MA$9,994M
Bank debt EUR notes USD notes (144A)
AUD notes CHF notes USD notes (PABs)
AUD private placements NOK notes Government debt
CAD notes US private placement Letters of credit
Gearing2: 35.6%36.4%
19
For
per
sona
l use
onl
y

-
1,000
2,000
3,000
4,000
5,000
FY17 FY18 FY19 FY20 FY21 FY22 FY23 FY24 FY25 FY26 - 29 FY30 - 34 FY35+
A$
millio
n
-
1,000
2,000
3,000
4,000
5,000
FY17 FY18 FY19 FY20 FY21 FY22 FY23 FY24 FY25 FY26 - 29 FY30 - 34 FY35+
A$
millio
n
Balance sheetto fund growth
Large refinancing completed to provide significant bank debt capacity for new issuances to support development pipeline
Earnings growth underpins balance sheet expansion
Sufficient capacity to fund current development pipeline
West Gate Tunnel is the only project in the current development pipeline potentially requiring additional equity funding
Access to incremental funding sources – capital releases and DRP
Strong liquidity through undrawn corporate working capital facility ($811 million1) and undrawn facilities at the asset level
1. As at 31 March 2017. Includes A$69 million letters of credit issued from working capital facilities.
2. The full value of debt facilities is shown as this is the value of debt for refinancing purposes. This overstates Transurban’s ownership share of the debt.
3. Debt is shown in the financial year in which it matures.
4. Debt values are in AUD as at 31 March 2017. CAD, CHF, EUR, NOK and USD debt are converted at the hedged rate where cross currency swaps are in place. USD debt is converted at the spot exchange rate where no cross currency swaps are in place.
June 2016 maturity profile2,3,4
March 2017 maturity profile2,3,4
20
Debt refinanced during the period
Debt refinanced during the period
For
per
sona
l use
onl
y

Capitalmanagement
21
DPS Compound annual growth of greater than 10% since FY09
Supported by the four pillars of earnings growth: traffic, price, operational efficiencies and development
DRP Incremental funding source Delivered $176 million in last 12 months1
Capital Releases Facilitates enhancement of asset capital structures
Managed prudently to ensure strong investment grade credit metrics are maintained
Part of upfront development considerations and deal structure to support investment
Opportunities with NWRG and TQ
Funding Priorities New corporate syndicated debt facility including additional liquidity buffer
WGTP—to be funded by a dedicated corporate tranche, new concession and concession extension
395 project—to be funded by a mix of local US debt sources (PABs and VTIB)
TQ—ongoing diversification into capital markets
1. DRP for 1H17 and 2H16.
22.0c 24.0c 27.0c 29.5c 31.0c 35.0c40.0c
45.5c51.5c
FY09 FY10 FY11 FY12 FY13 FY14 FY15 FY16 FY17
Actual
Guidance
For
per
sona
l use
onl
y

Growth potential in North AmericaJennifer Aument
For
per
sona
l use
onl
y
Maintain focus on heavily-congested, urban areas with strong demographics
Continue to leverage core capabilities and apply a long-term partnership approach
Prepare to effectively respond to changing market conditions and availability of distressed assets
Limit risk, exposure and costs associated with long-lead greenfield projects
Consider equity stakes and other roles to position for long-term expansion
Maximise the investment made and value created through our existing Express Lanes network
North America strategy
23
For
per
sona
l use
onl
y

North Americamacro environment
24
Economic Community
Increasing customer demands for service, information and choices
Long-term partner approach aligns with shifting political and consumer sentiment
Increasing household income levels driving consumer purchasing power
Forecast growth in regional employment
Volatility in Federal Government workforce but strong emphasis on defence spending
Political
Virginia elections in 2017 will appoint key leadership positions including a new governor
Federal Government focus on leveraging private capital to deliver infrastructure backlog
Executive action to streamline process, accelerate project delivery
New incentives for states to pursue divestment of assets and public-private partnerships
Expressed interest in Australian asset recycling approach
For
per
sona
l use
onl
y
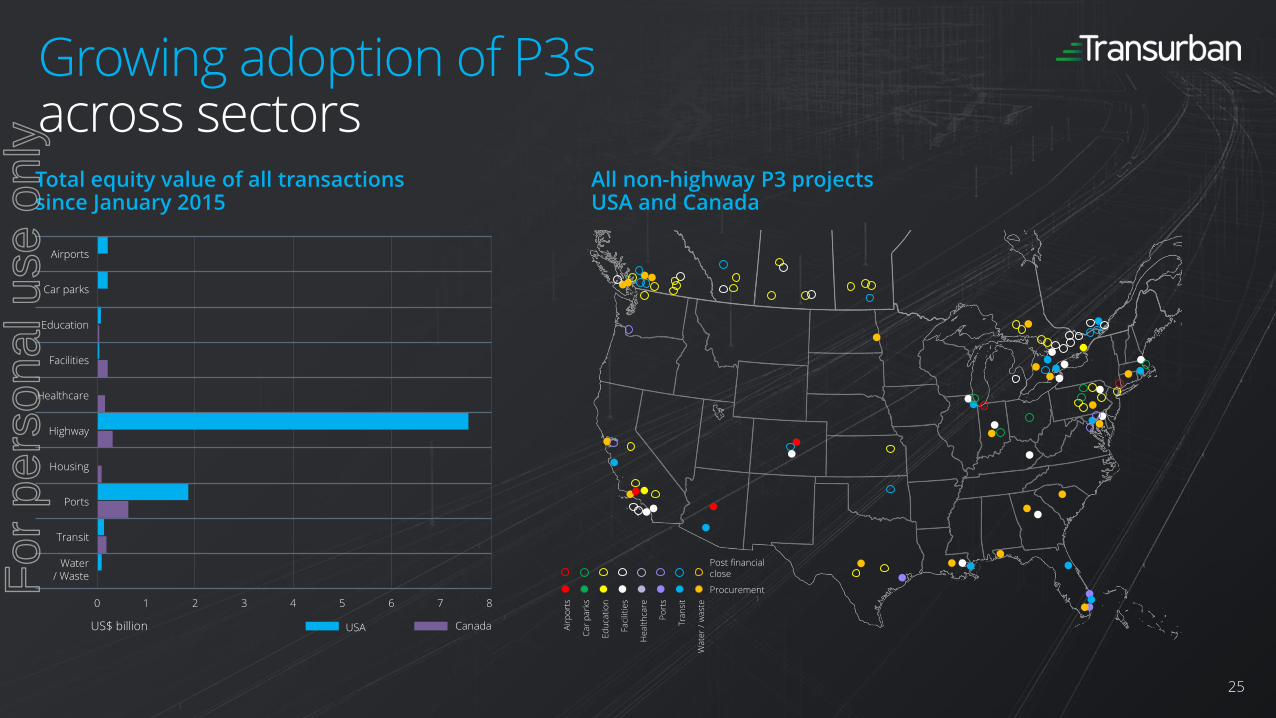
Growing adoption of P3sacross sectors
25
Air
po
rts
Ca
r p
ark
s
Ed
uca
tio
n
Faci
litie
s
He
alt
hca
re
Po
rts
Tra
nsi
t
Wa
ter
/ w
ast
e
Post financialclose
Procurement
All non-highway P3 projectsUSA and Canada
Total equity value of all transactionssince January 2015
US$ billion
Airports
Car parks
Education
Facilities
Healthcare
Highway
Housing
Ports
Transit
Water/ Waste
0 1 2 3 4 5 6 7 8
USA Canada
For
per
sona
l use
onl
y
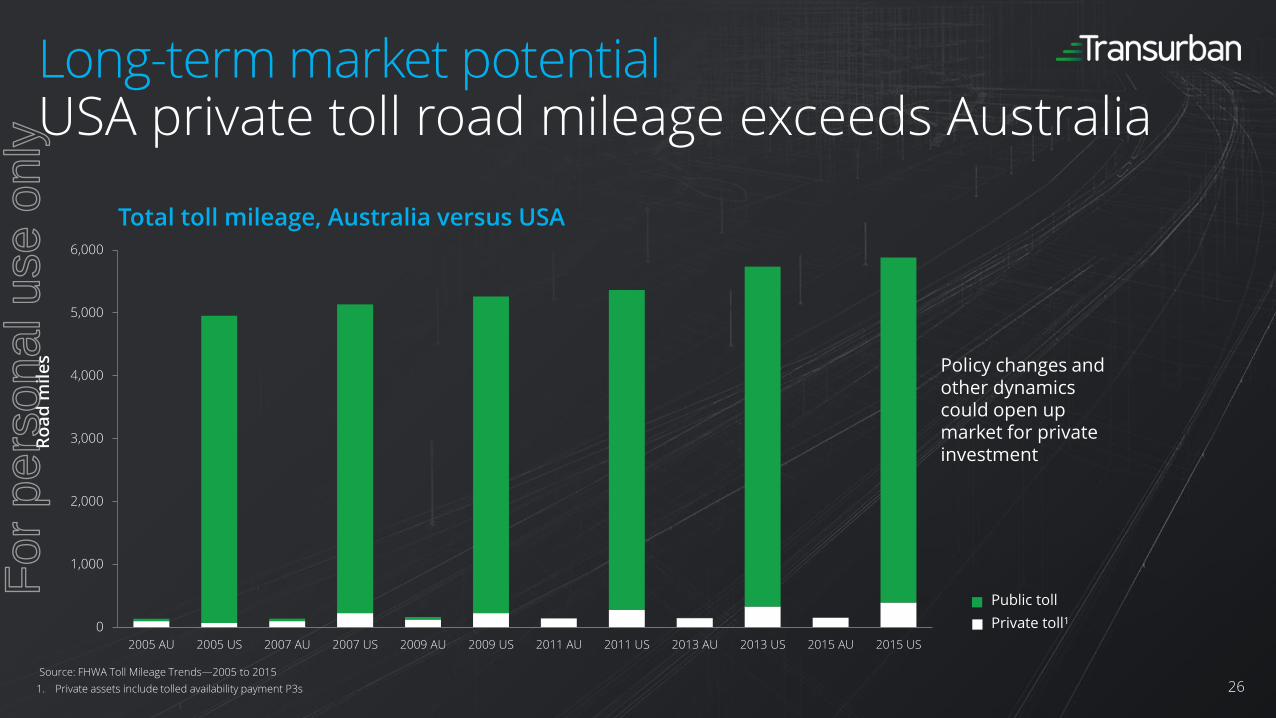
Long-term market potentialUSA private toll road mileage exceeds Australia
26
0
1,000
2,000
3,000
4,000
5,000
6,000
2005 AU 2005 US 2007 AU 2007 US 2009 AU 2009 US 2011 AU 2011 US 2013 AU 2013 US 2015 AU 2015 US
Total toll mileage, Australia versus USA
Source: FHWA Toll Mileage Trends—2005 to 2015
1. Private assets include tolled availability payment P3s
Ro
ad
mil
es
Public toll
Private toll1
Policy changes and other dynamics could open up market for private investment
For
per
sona
l use
onl
y
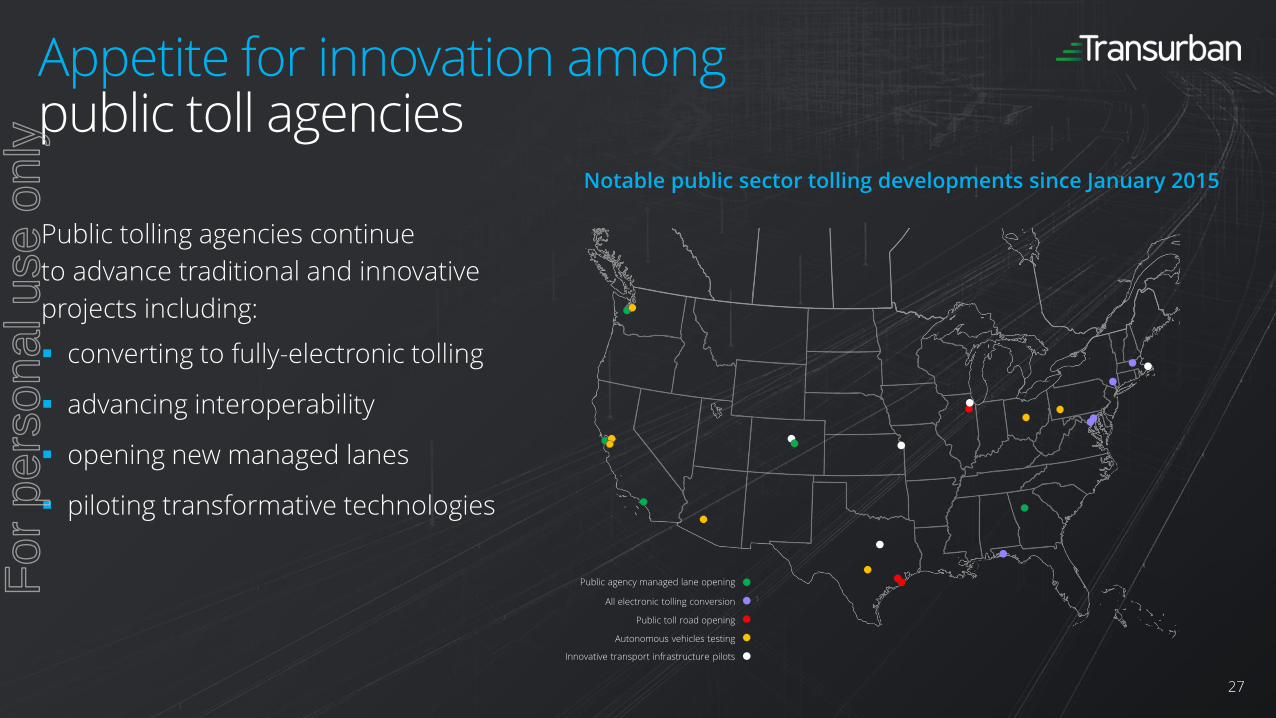
Appetite for innovation among public toll agencies
27
Notable public sector tolling developments since January 2015
Public agency managed lane opening
All electronic tolling conversion
Public toll road opening
Autonomous vehicles testing
Innovative transport infrastructure pilots
Public tolling agencies continue
to advance traditional and innovative
projects including:
converting to fully-electronic tolling
advancing interoperability
opening new managed lanes
piloting transformative technologies
For
per
sona
l use
onl
y
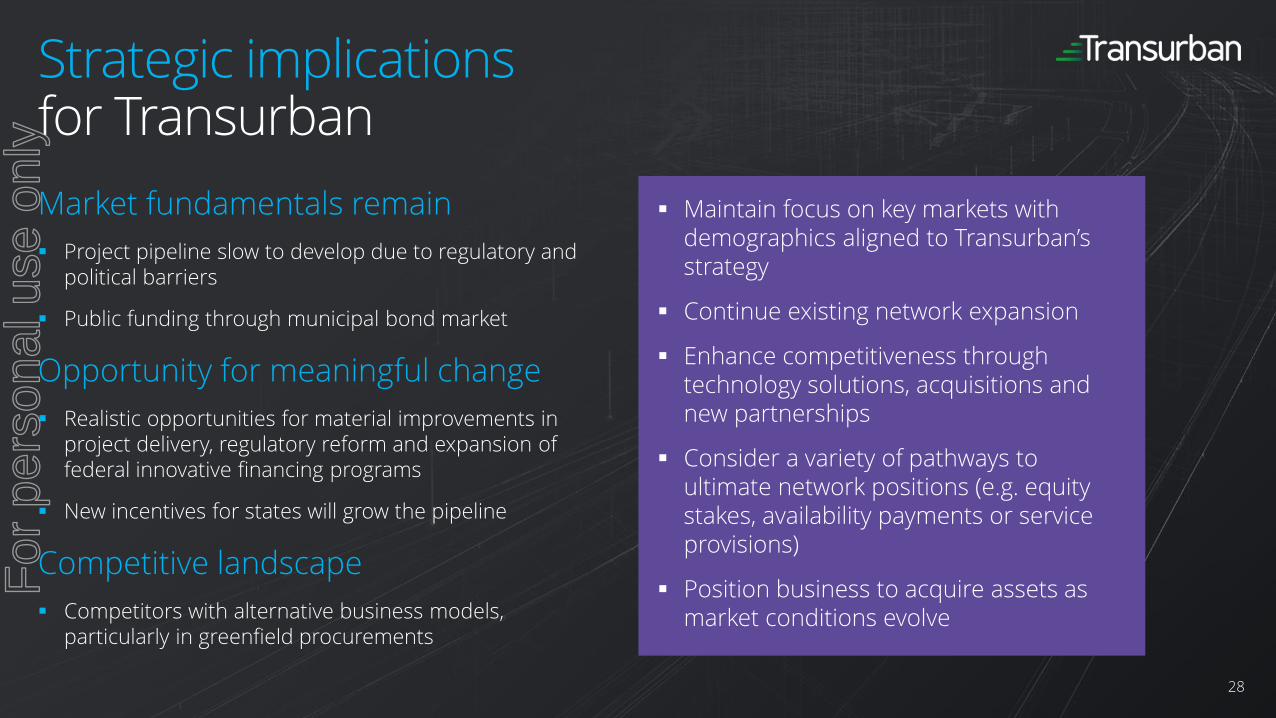
Market fundamentals remain
Project pipeline slow to develop due to regulatory and political barriers
Public funding through municipal bond market
Opportunity for meaningful change
Realistic opportunities for material improvements in project delivery, regulatory reform and expansion of federal innovative financing programs
New incentives for states will grow the pipeline
Competitive landscape
Competitors with alternative business models, particularly in greenfield procurements
Strategic implicationsfor Transurban
28
Maintain focus on key markets with demographics aligned to Transurban’sstrategy
Continue existing network expansion
Enhance competitiveness through technology solutions, acquisitions and new partnerships
Consider a variety of pathways to ultimate network positions (e.g. equity stakes, availability payments or service provisions)
Position business to acquire assets as market conditions evolve
For
per
sona
l use
onl
y

Outcome focusedfor stakeholders
Vin Vassallo
For
per
sona
l use
onl
y
Increase network capacity and efficiency through development of existing infrastructure
Enhance the liveability of local communities
Further explore opportunities to provide managed motorway services to assets adjacent to Transurban’s Victorian network
Work with partners to trial latest vehicle and road technologies
Successfully deliver major road infrastructure projects
Melbourne strategy
30
For
per
sona
l use
onl
y
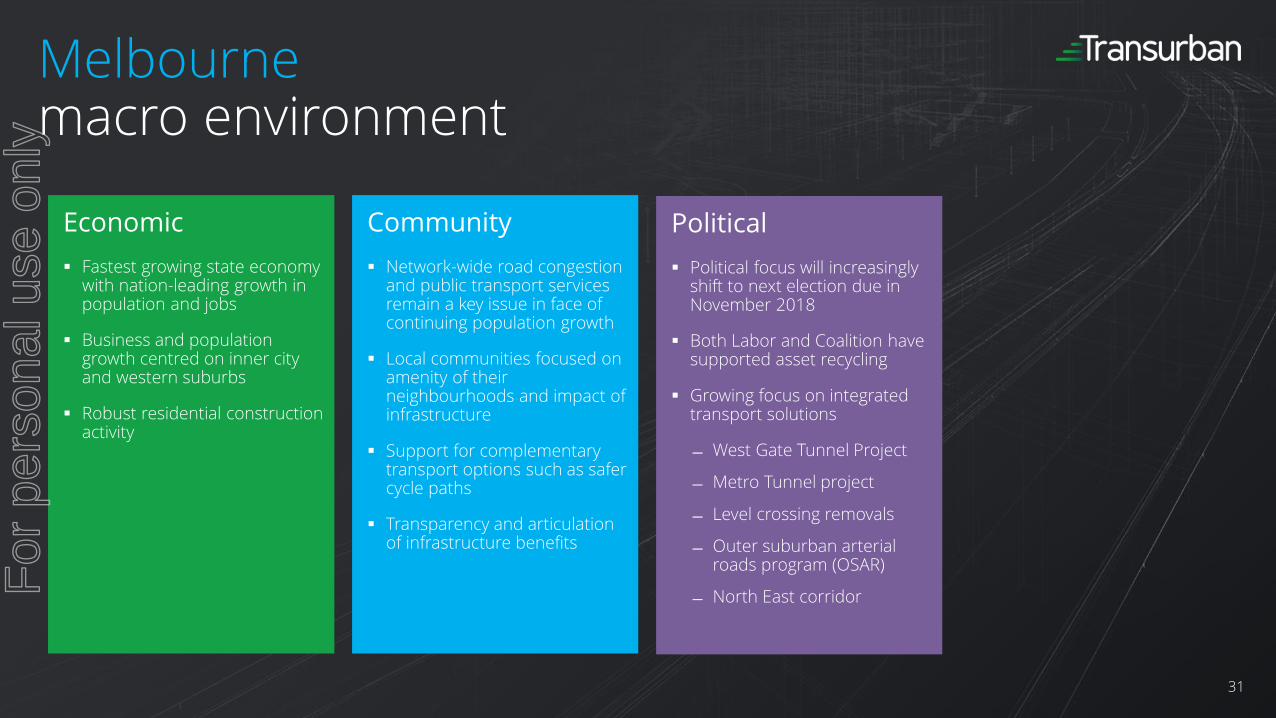
Melbournemacro environment
31
Political
Political focus will increasingly shift to next election due in November 2018
Both Labor and Coalition have supported asset recycling
Growing focus on integrated transport solutions
West Gate Tunnel Project
Metro Tunnel project
Level crossing removals
Outer suburban arterial roads program (OSAR)
North East corridor
Economic
Fastest growing state economy with nation-leading growth in population and jobs
Business and population growth centred on inner city and western suburbs
Robust residential construction activity
Community
Network-wide road congestion and public transport services remain a key issue in face of continuing population growth
Local communities focused on amenity of their neighbourhoods and impact of infrastructure
Support for complementary transport options such as safer cycle paths
Transparency and articulation of infrastructure benefits
For
per
sona
l use
onl
y

Ability to apply and deploy learnings from across the business:
Operations excellence
Design, construction and project management
Community and stakeholder engagement
Active period for Victoria with:
Two live construction projects—CTW and Webb Dock Access
One project management contract—Monash Freeway Upgrade (under construction)
One project in exclusive negotiations—WGTP
Outcome focusedfor stakeholders
32
For
per
sona
l use
onl
y

Preparing for enhanced operations
33
O&M planning for WGTP drawing on successes from across the business
O&M team members integrated into CTW, WGTP project delivery teams
– Ensuring long-term considerations embedded in planning phase
Operational technology considerations including:
– CAV applications
– Connected freeway management systems to provide more efficient and effective traffic flow
– Installation of overheight vehicle detection systems at tunnel entrances
Safety initiatives
– Incident response vehicle locations configured to improve response times
Maintenance
– Services housed beneath tunnel so as to be accessible during operations
– Fewer closures for maintenance required
Apr16
May16
Jun16
Jul16
Aug16
Sep16
Oct16
Dec16
Jan17
Feb17
Mar17
Tim
e
Significant improvement in incident response time
Nov16
‘Safe clearance’ incident
response model implemented
For
per
sona
l use
onl
y
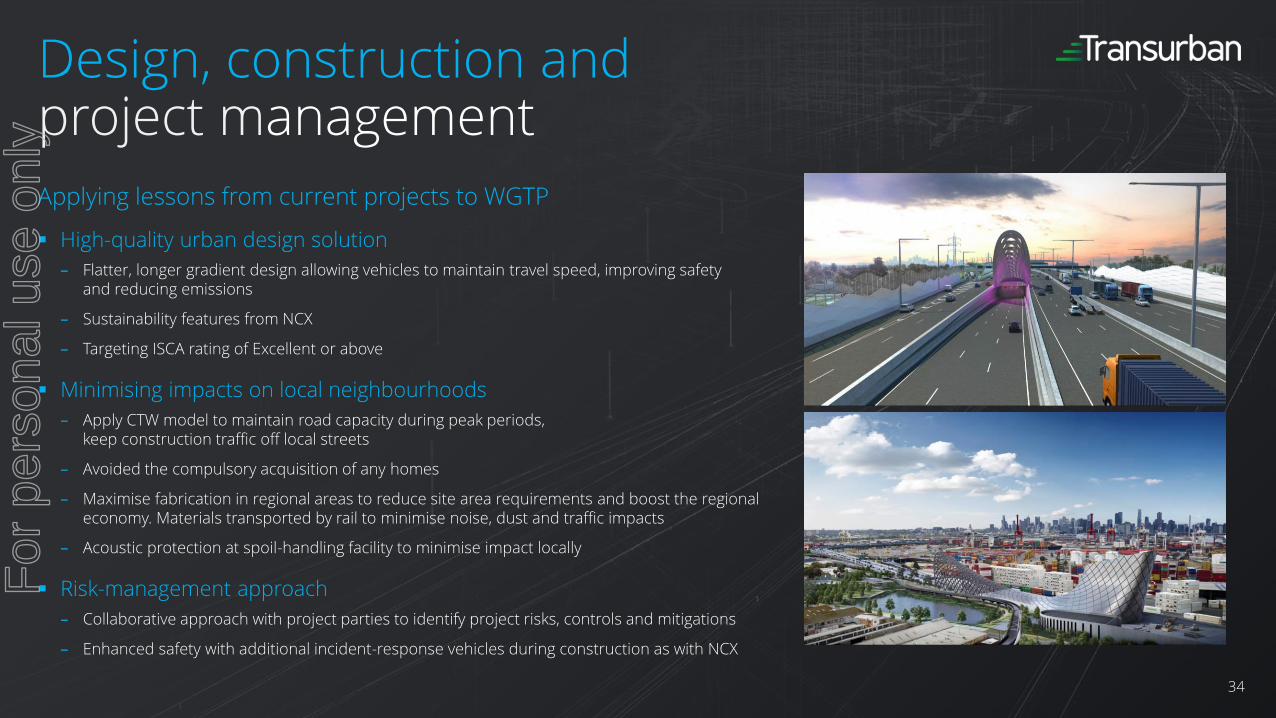
Applying lessons from current projects to WGTP
High-quality urban design solution
– Flatter, longer gradient design allowing vehicles to maintain travel speed, improving safetyand reducing emissions
– Sustainability features from NCX
– Targeting ISCA rating of Excellent or above
Minimising impacts on local neighbourhoods
– Apply CTW model to maintain road capacity during peak periods,keep construction traffic off local streets
– Avoided the compulsory acquisition of any homes
– Maximise fabrication in regional areas to reduce site area requirements and boost the regional economy. Materials transported by rail to minimise noise, dust and traffic impacts
– Acoustic protection at spoil-handling facility to minimise impact locally
Risk-management approach
– Collaborative approach with project parties to identify project risks, controls and mitigations
– Enhanced safety with additional incident-response vehicles during construction as with NCX
Design, construction andproject management
34
For
per
sona
l use
onl
y
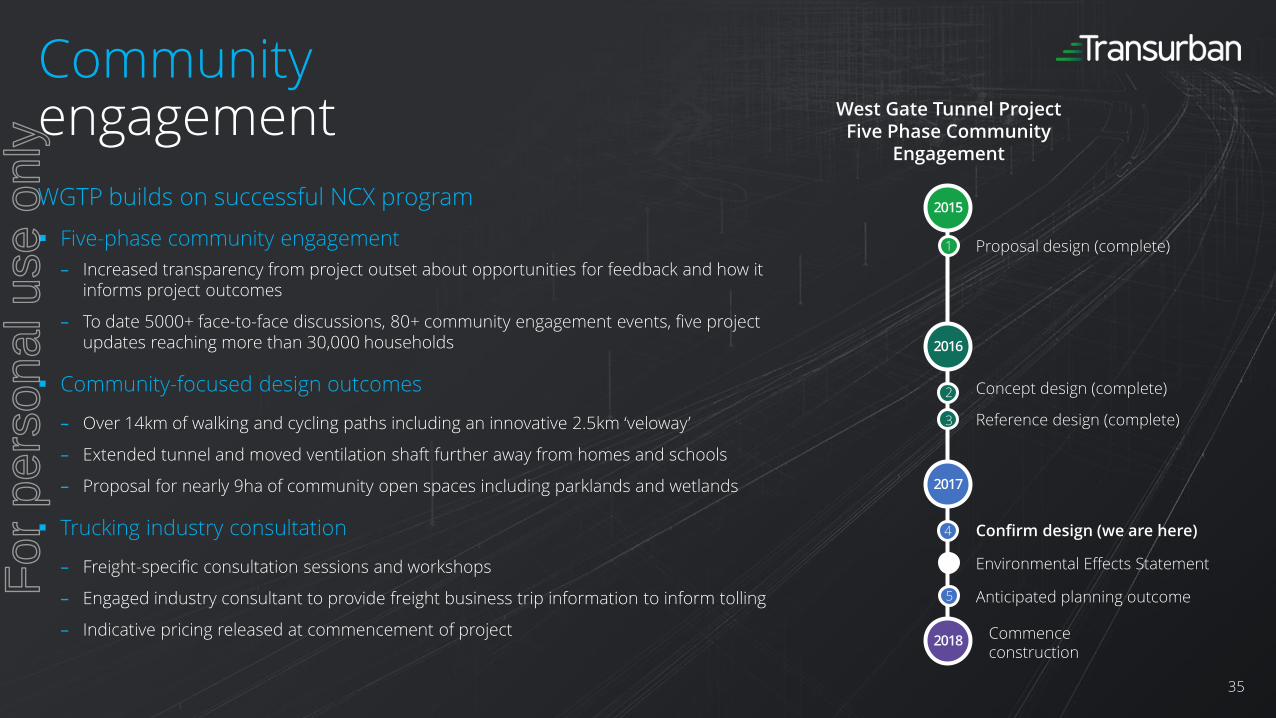
Communityengagement
35
Five-phase community engagement
– Increased transparency from project outset about opportunities for feedback and how it informs project outcomes
– To date 5000+ face-to-face discussions, 80+ community engagement events, five project updates reaching more than 30,000 households
Community-focused design outcomes
– Over 14km of walking and cycling paths including an innovative 2.5km ‘veloway’
– Extended tunnel and moved ventilation shaft further away from homes and schools
– Proposal for nearly 9ha of community open spaces including parklands and wetlands
Trucking industry consultation
– Freight-specific consultation sessions and workshops
– Engaged industry consultant to provide freight business trip information to inform tolling
– Indicative pricing released at commencement of project
WGTP builds on successful NCX program
Proposal design (complete)
Concept design (complete)
Reference design (complete)
Environmental Effects Statement
Confirm design (we are here)
Commence construction
2015
2016
2017
2018
4
2
3
West Gate Tunnel Project Five Phase Community
Engagement
5 Anticipated planning outcome
1
For
per
sona
l use
onl
y

Network benefitsWesley Ballantine
For
per
sona
l use
onl
y
Complete integration—final O&M arrangements and technology
Improve processes and deploy technology across the network to enhance the customer experience
Explore options to add capacity during peak periods and remain open to non-traditional roles
Brisbanestrategy
37
For
per
sona
l use
onl
y
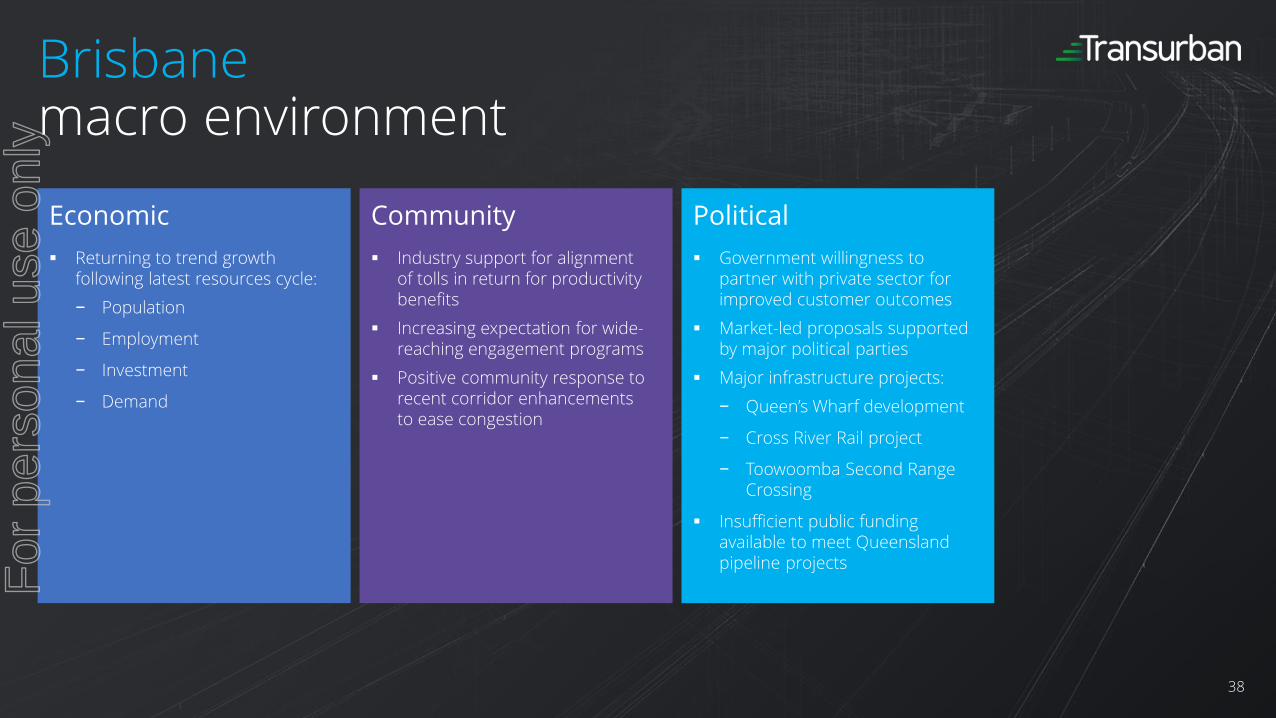
Political
Government willingness to partner with private sector for improved customer outcomes
Market-led proposals supported by major political parties
Major infrastructure projects:
− Queen’s Wharf development
− Cross River Rail project
− Toowoomba Second Range Crossing
Insufficient public funding available to meet Queensland pipeline projects
Economic
Returning to trend growth following latest resources cycle:
− Population
− Employment
− Investment
− Demand
Community
Industry support for alignment of tolls in return for productivity benefits
Increasing expectation for wide-reaching engagement programs
Positive community response to recent corridor enhancements to ease congestion
Brisbanemacro environment
38
For
per
sona
l use
onl
y
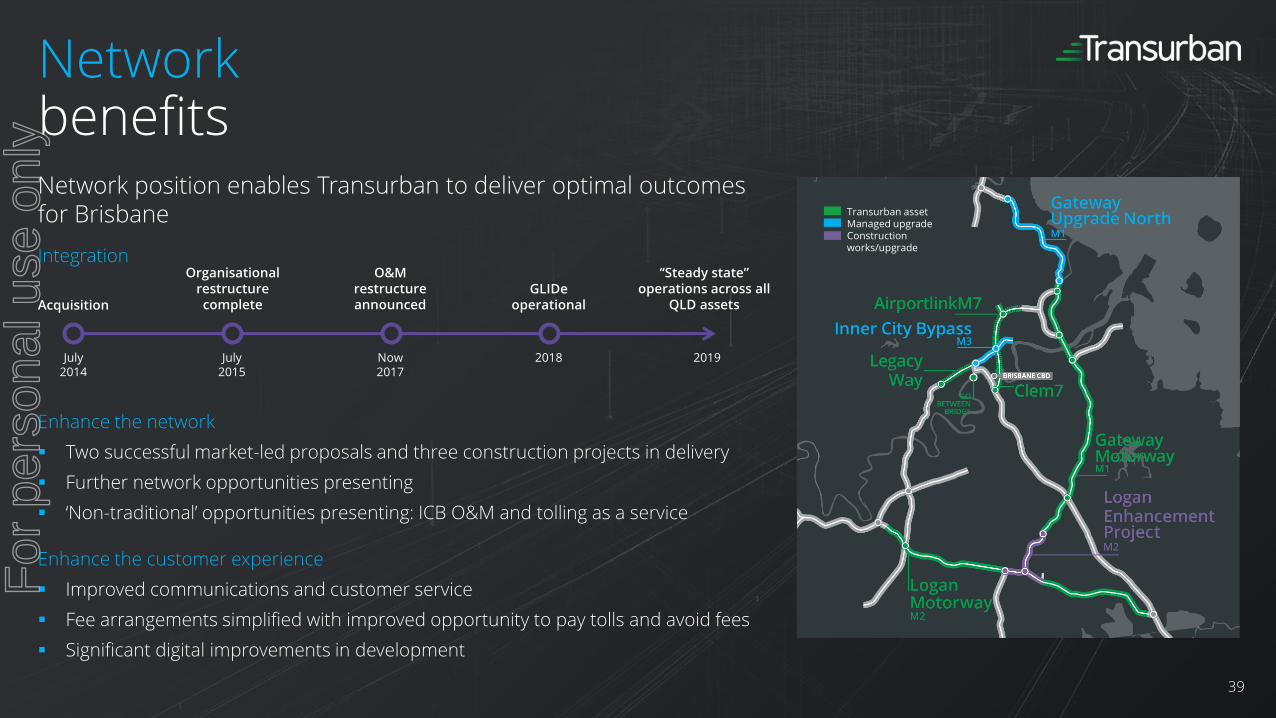
Network position enables Transurban to deliver optimal outcomes for Brisbane
Integration
Enhance the network
Two successful market-led proposals and three construction projects in delivery
Further network opportunities presenting
‘Non-traditional’ opportunities presenting: ICB O&M and tolling as a service
Enhance the customer experience
Improved communications and customer service
Fee arrangements simplified with improved opportunity to pay tolls and avoid fees
Significant digital improvements in development
Networkbenefits
39
July2014
July 2015
Now2017
2018 2019
Acquisition
Organisational restructure complete
O&M restructure announced
GLIDeoperational
“Steady state” operations across all
QLD assets
Transurban assetManaged upgradeConstructionworks/upgrade
For
per
sona
l use
onl
y

Holistic O&M approach
Tunnel network incident response and maintenance contracts awarded to Egis
Improved and consistent outcomes
− Transurban defined contract structure
− KPIs reflect concession and optimal network outcomes
Significant savings
Faster response times
Facilitates control room consolidation
Network-wide operations and maintenance driving enhanced outcomes
40
Transition period
Assetstrategy & condition
Projectdelivery
Road operations
Routinemaintenance
GovernanceIntelligenttransportsystems
Network approach
O&M tunnel cost forecast savings
Future steady state
Current state
>25% saving
Go Between BridgeJuly
Legacy WayAug
2017 2018 2019 2020
Inner City BypassAug
Clem7Apr
AirportlinkM7Jun
Transurban
Service provider
For
per
sona
l use
onl
y

Customer benefitsfrom continued network investments
41
Material improvements in customer service
− Call handling times and quality
− More than 1,000 in-person retail outlets
Process improvements resulting in material fee reduction
− Benefits customers—fewer fees
− Benefits TQ—tolls collected
− Benefits State and Council—fewer infringements
Significant capex program
Logan pavement program
Works completed with ‘customer-first’ approach
Significant technology improvement
GLIDe tolling system, apps
95% of customer issues resolved at first point of contact
Substantial reduction in customer fees through improved processes
$100M of capital expenditure since FY15
Market appsin development
For
per
sona
l use
onl
y

Leveraging position forgrowth
42
Network remains in need of significant investment in highly
congested corridors:
1. Centenary / Western Freeway
2. Pacific Motorway
3. Bruce Highway
4. CBD accessibility
Ability to apply core competencies for network benefits:
− ICB O&M
− Toowoomba Second Range Crossing Back Office Tolling
Further efficiencies:
− Control room consolidation
− O&M for open roads
Source: Google Traffic Typical Daily Conditions, March 2017
1 2
3
4
Traffic slowing, travelling less than 60 Km/h
Traffic slow, travelling less than 30 Km/h
BRISBANE, AUSTRALIA North
For
per
sona
l use
onl
y

Data-driven excellenceAndrew Head
For
per
sona
l use
onl
y
Work with government partners to provide transport solutions
Engage and strengthen relationships with local communities
Demonstrate outstanding project management on current / future construction projects
Prepare to participate in network growth opportunities
Continue to integrate technology solutions into our networks to improve the customer experience
Sydney strategy
44
For
per
sona
l use
onl
y
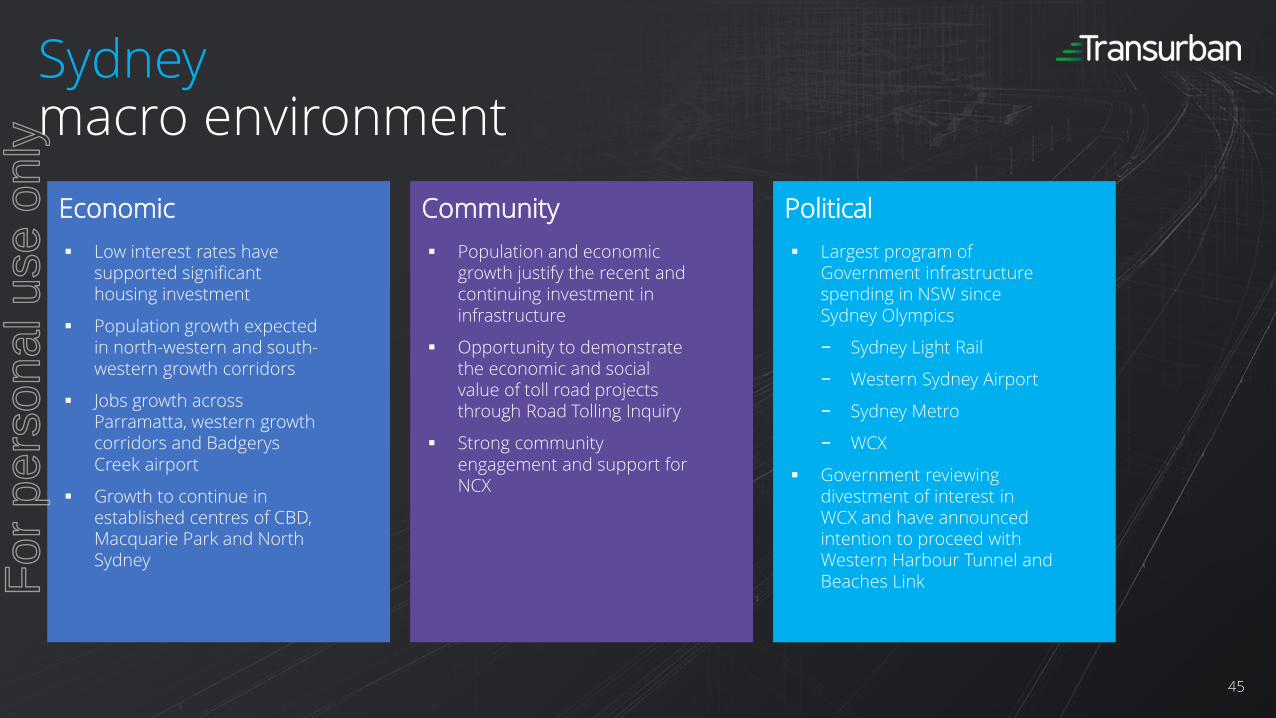
PoliticalEconomic Community
Sydneymacro environment
45
Low interest rates have supported significant housing investment
Population growth expected in north-western and south-western growth corridors
Jobs growth across Parramatta, western growth corridors and Badgerys Creek airport
Growth to continue in established centres of CBD, Macquarie Park and North Sydney
Largest program of Government infrastructure spending in NSW since Sydney Olympics
− Sydney Light Rail
− Western Sydney Airport
− Sydney Metro
− WCX
Government reviewing divestment of interest in WCX and have announced intention to proceed with Western Harbour Tunnel and Beaches Link
Population and economic growth justify the recent and continuing investment in infrastructure
Opportunity to demonstrate the economic and social value of toll road projects through Road Tolling Inquiry
Strong community engagement and support for NCX
For
per
sona
l use
onl
y
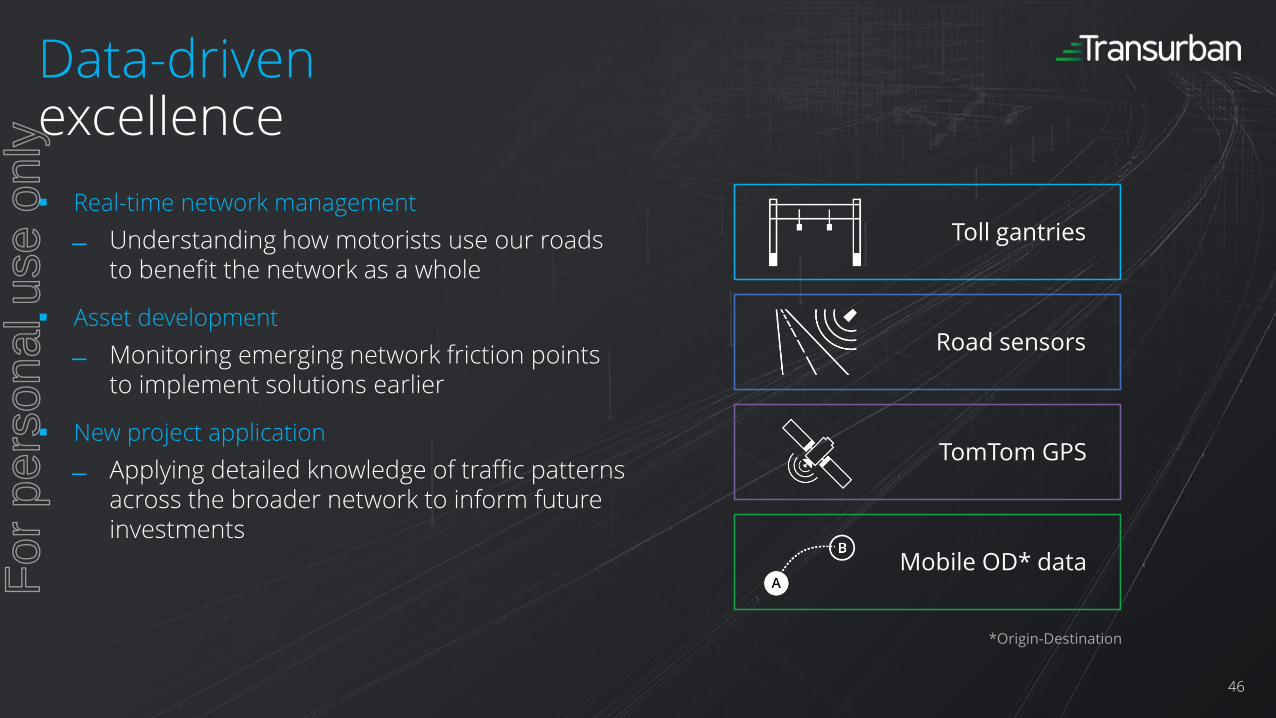
Real-time network management
Understanding how motorists use our roads to benefit the network as a whole
Asset development
Monitoring emerging network friction points to implement solutions earlier
New project application
Applying detailed knowledge of traffic patterns across the broader network to inform future investments
Data-drivenexcellence
46
Mobile OD* data
Toll gantries
Road sensors
TomTom GPS
*Origin-Destination
For
per
sona
l use
onl
y
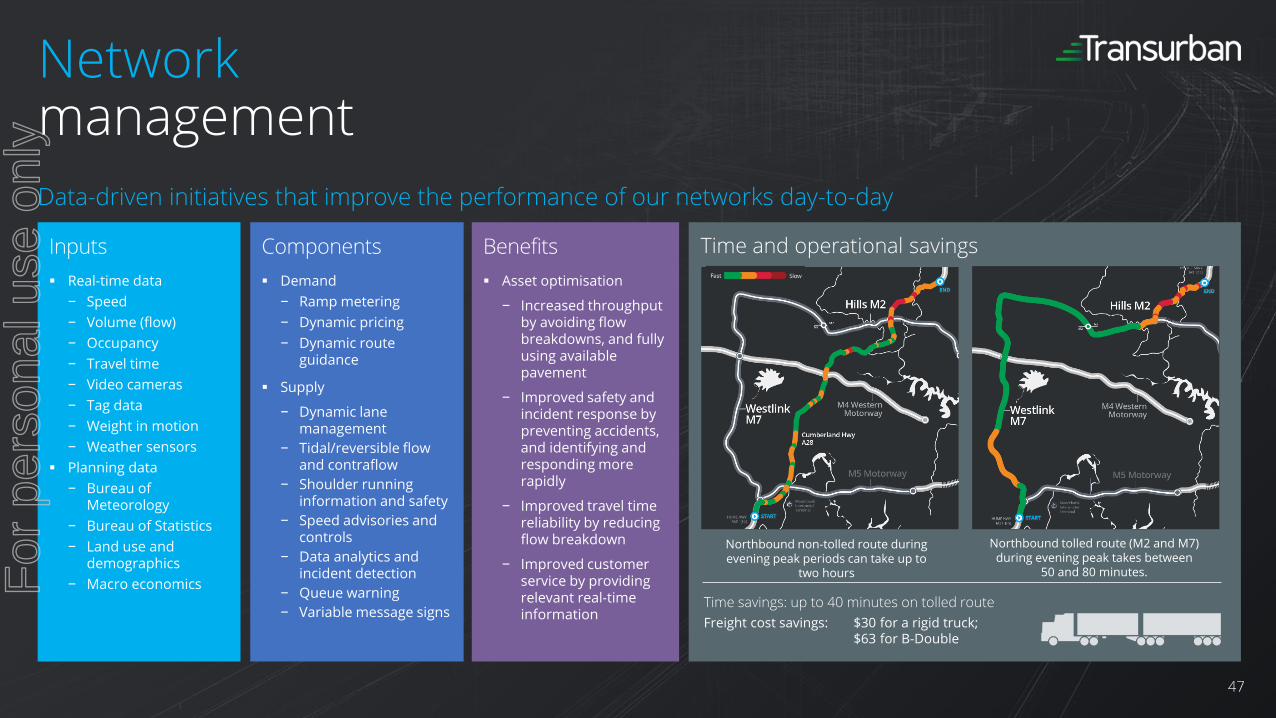
Data-driven initiatives that improve the performance of our networks day-to-day
Networkmanagement
47
Inputs
Real-time data
− Speed
− Volume (flow)
− Occupancy
− Travel time
− Video cameras
− Tag data
− Weight in motion
− Weather sensors
Planning data
− Bureau of Meteorology
− Bureau of Statistics
− Land use and demographics
− Macro economics
Components
Demand
− Ramp metering
− Dynamic pricing
− Dynamic route guidance
Supply
− Dynamic lane management
− Tidal/reversible flow and contraflow
− Shoulder running information and safety
− Speed advisories and controls
− Data analytics and incident detection
− Queue warning
− Variable message signs
Benefits
Asset optimisation
− Increased throughput by avoiding flow breakdowns, and fully using available pavement
− Improved safety and incident response by preventing accidents, and identifying and responding more rapidly
− Improved travel time reliability by reducing flow breakdown
− Improved customer service by providing relevant real-time information
Northbound non-tolled route during evening peak periods can take up to
two hours
Northbound tolled route (M2 and M7) during evening peak takes between
50 and 80 minutes.
Time and operational savings
Time savings: up to 40 minutes on tolled route
Freight cost savings: $30 for a rigid truck;$63 for B-Double
For
per
sona
l use
onl
y
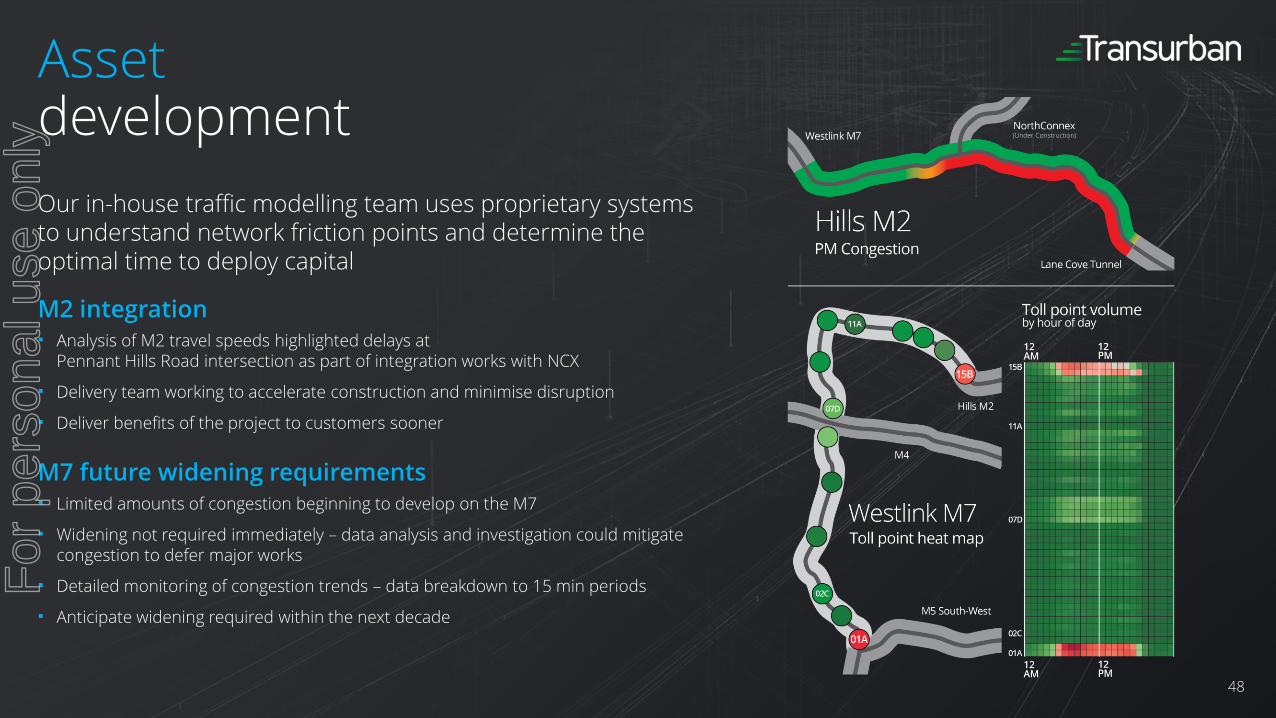
Our in-house traffic modelling team uses proprietary systems to understand network friction points and determine the optimal time to deploy capital
M2 integration Analysis of M2 travel speeds highlighted delays at
Pennant Hills Road intersection as part of integration works with NCX
Delivery team working to accelerate construction and minimise disruption
Deliver benefits of the project to customers sooner
M7 future widening requirements Limited amounts of congestion beginning to develop on the M7
Widening not required immediately – data analysis and investigation could mitigate congestion to defer major works
Detailed monitoring of congestion trends – data breakdown to 15 min periods
Anticipate widening required within the next decade
Assetdevelopment
48
(Under Construction)
For
per
sona
l use
onl
y
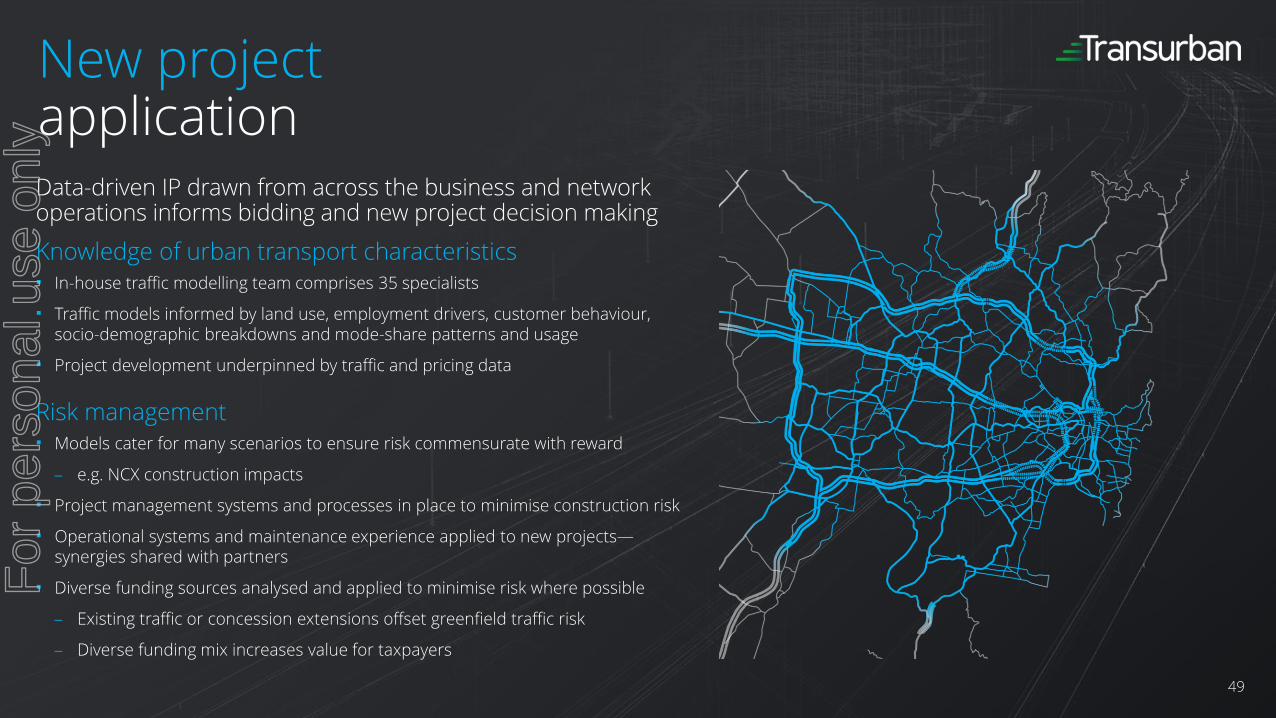
New projectapplication
49
Data-driven IP drawn from across the business and network operations informs bidding and new project decision making
Knowledge of urban transport characteristics In-house traffic modelling team comprises 35 specialists
Traffic models informed by land use, employment drivers, customer behaviour, socio-demographic breakdowns and mode-share patterns and usage
Project development underpinned by traffic and pricing data
Risk management Models cater for many scenarios to ensure risk commensurate with reward
e.g. NCX construction impacts
Project management systems and processes in place to minimise construction risk
Operational systems and maintenance experience applied to new projects—synergies shared with partners
Diverse funding sources analysed and applied to minimise risk where possible
Existing traffic or concession extensions offset greenfield traffic risk
Diverse funding mix increases value for taxpayers
For
per
sona
l use
onl
y

Analystdata pack
For
per
sona
l use
onl
y

Transurbanhistory
2000 2001 2002 2003 2004 2005 2006 2007 2008 2009 2010 2011 2012 2013 2014 2015 2016
CityLink
M1-CityLink Upgrade
CityLink-Tulla Widening
Hills M2
Hills M2 Upgrade
M7
ED & M51
M5 Widening
Lane Cove Tunnel
Cross City Tunnel
Gateway, Logan, Clem7 & Go Between Bridge2
Legacy Way2
AirportlinkM7
495 Express Lanes
95 Express Lanes
Transurban D&C projects—road opening date
Acquired
Upgrade project
1. Acquired as part of takeover bid of Sydney Roads Group.
2. Acquisition of Queensland Motorways. 51
For
per
sona
l use
onl
y

SummarisedGroup structure
TRANSURBAN HOLDINGS LIMITED TRANSURBAN HOLDING TRUST
CORPORATE ENTITIES
Transurban DRIVe Holdings LLC
ROAD/OPERATING ENTITIES CORPORATE ENTITIES
Transurban Finance Trust
OTHER ENTITIESROAD/OPERATING ENTITIES
CityLink Melbourne Limited
Hills Motorway Limited (M2)
Airport Motorway Limited (ED)
Interlink Roads Pty Limited (M5)
Airport Motorway Trust (ED)
NorthWestern Roads Group Pty Limited (M7, NCX)
NorthWestern Roads Group Trust (M7, NCX)
LCT MRE Pty Limited (LCT)
TRANSURBAN INTERNATIONAL LIMITED
Builds, operates and maintains road, and has own borrowings. Funding from non-
recourse borrowings.
Transurban Queensland Holdings Pty Ltd Transurban Queensland Invest Trust
Transurban CCT Pty Limited (CCT) Transurban CCT Trust (CCT)
CityLink Trust
Hills Motorway Trust (M2)
LCT MRE Trust (LCT)95 Express Lanes LLC
10
0%
ow
ne
dC
on
soli
da
ted
No
t co
nso
lid
ate
de
qu
ity
acc
ou
nti
ng
Including:Employing entityFinancing entityTrustee entities
50.0%
50.0%
Capital Beltway Express LLC (495)
US employing entity
62.5%
75.1%
Companies operating and maintaining roads Trusts holding asset and financing Corporate financing entity Companies operating and maintaining roads
Holding company
52
For
per
sona
l use
onl
y

Asset portfolio31 March 2017
MELBOURNE SYDNEY
OVERVIEW CITYLINK M5 M2 ED M7 NCX LCT CCT
Opening date Dec 2000 Aug 1992 May 1997 Dec 1999 Dec 2005Under
constructionMar 2007 Aug 2005
Remaining concession period 18 years 10 years 31 years 31 years 31 years 28 years1 31 years 19 years
Concession end date Jan 2035 Dec 2026 Jun 2048 Jul 2048 Jun 2048 Jun 2048 Jun 2048 Dec 2035
PHYSICAL DETAILS
Length—total 22km in 2 sections
22km 21km 6km 40km 9km 3.8km 2.1km
Length—surface 16.8km 22km 20.4km 4.3km 40km – 0.3km –
Length—tunnel 5.2km – 0.6km 1.7km – 9km 3.5km 2.1km
Lanes2x4 in most
sections2x3 2x3
2x3 2x2 some sections
2x2 2x22
2x22x3 some sections
2x22x3 some ramp
sections
OWNERSHIP
Transurban ownership 100% 50% 100% 75.1% 50% 50% 100% 100%
TOLLING
Large vehicle multiplierLCV: 1.6x HCV: 3x
3x 3x 2x 3x 3x 3x 2x
1. Concession period from expected opening date late 2019.
2. Capacity for 3 lanes in each direction in future if required. 53
For
per
sona
l use
onl
y

Asset portfolio31 March 2017
BRISBANE GREATER WASHINGTON AREA
OVERVIEWGATEWAY
MOTORWAYLOGAN
MOTORWAYCLEM7
GO BETWEENBRIDGE
LEGACYWAY
AIRPORTLINK M7495 EXPRESS
LANES2
95 EXPRESS LANES2
Opening date Dec 1986 Dec 1988 Mar 2010 Jul 2010 Jun 2015 Jul 2012 Nov 2012 Dec 2014
Remaining concession period 35 years 35 years 34 years 47 years 48 years 36 years 71 years 71 years
Concession end date Dec 2051 Dec 2051 Aug 2051 Dec 2063 Jun 2065 Jun 2053 Dec 2087 Dec 2087
PHYSICAL DETAILS
Length—total 23.1km 38.71 km 6.8km 0.3km 5.7km 6.7km 22km 46.6km
Length—surface 23.1km 38.71 km 2.0km 0.3km 1.1km 1.0km 22km 46.6km
Length—tunnel – – 4.8km – 4.6km 5.7km – –
Lanes6,8 and 10 (various) 12
Gateway Bridge 2x2 2x2 2x2 2x2 2x3 2x2 HOT lanes
2 and 3 reversible HOT lanes
OWNERSHIP
Transurban ownership 62.5% 62.5% 62.5% 62.5% 62.5% 62.5% 100% 100%
TOLLING
Large vehicle multiplierLCV – 1.5x
HCV – 2.65x4
LCV – 1.5xHCV – 2.65x4
LCV – 1.5xHCV – 2.65x5
LCV – 1.5xHCV – 2.65x5
LCV3 – 1.5xHCV3 – 2.65x6
LCV – 1.5xHCV – 2.65x
No multiplier –trucks >2 axle not permitted
No multiplier –trucks >2 axle not permitted
1. Length includes 9.8km of Gateway Extension Motorway.
2. On 29 June 2015, Transurban acquired the remaining equity interest in both the 495 and 95 Express Lanes.
3. Calculated based on the non-discount car and truck toll, which applied from 2 May 2016.
4. Logan and Gateway HCV tolls progressively moving up to 3.46 times cars post LEP (completion expected mid-2019).
5. Multiplier to increase to 3 times cars post-ICB upgrade (completion expected mid-2018).
6. Multiplier to increase to 3 times cars due to ICB upgrade (expected mid-2020). 54
For
per
sona
l use
onl
y

Tollingescalation
MOTORWAY ESCALATION
CityLink Escalated quarterly by the greater of quarterly CPI or 1.011065% per quarter for the first 16 years (until 31 December 2016), then quarterly by CPI. This is subject to a cap of annual CPI plus 2.5%, which cannot be exceeded.
M2 Escalated quarterly by the greater of quarterly CPI or 1%.
LCT Escalated quarterly by quarterly CPI. The toll cannot be lowered as a result of deflation, however, until inflation counteracts the deflation the toll cannot be increased.
ED Escalated quarterly by the greater of a weighted sum of quarterly AWE and quarterly CPI or 1%.
M7 Escalated or de-escalated quarterly by quarterly CPI.
M5 Escalated quarterly by quarterly CPI. The toll cannot be lowered as a result of deflation, however, until inflation counteracts the deflation the toll cannot be increased.
CCT Escalated quarterly by: the greater of quarterly CPI or 0.9853% (equivalent to 4% per annum) to June 2012; the greater of quarterly CPI or 0.7417% (equivalent to 3% per annum) to June 2018; quarterly CPI to concession end.
Logan Motorway Tolls escalate annually at Brisbane CPI. The toll cannot be lowered as a result of deflation.
Gateway Motorway Tolls escalate annually at Brisbane CPI. The toll cannot be lowered as a result of deflation.
Clem7 Tolls escalate annually at Brisbane CPI. The toll cannot be lowered as a result of deflation.
Go Between Bridge Tolls escalate annually at Brisbane CPI. The toll cannot be lowered as a result of deflation.
Legacy Way Tolls escalate annually at Brisbane CPI. The toll cannot be lowered as a result of deflation.
AirportlinkM7 Tolls escalate annually at Brisbane CPI. The toll cannot be lowered as a result of deflation.
495 Express Lanes Dynamic, uncapped.
95 Express Lanes Dynamic, uncapped.
55
For
per
sona
l use
onl
y
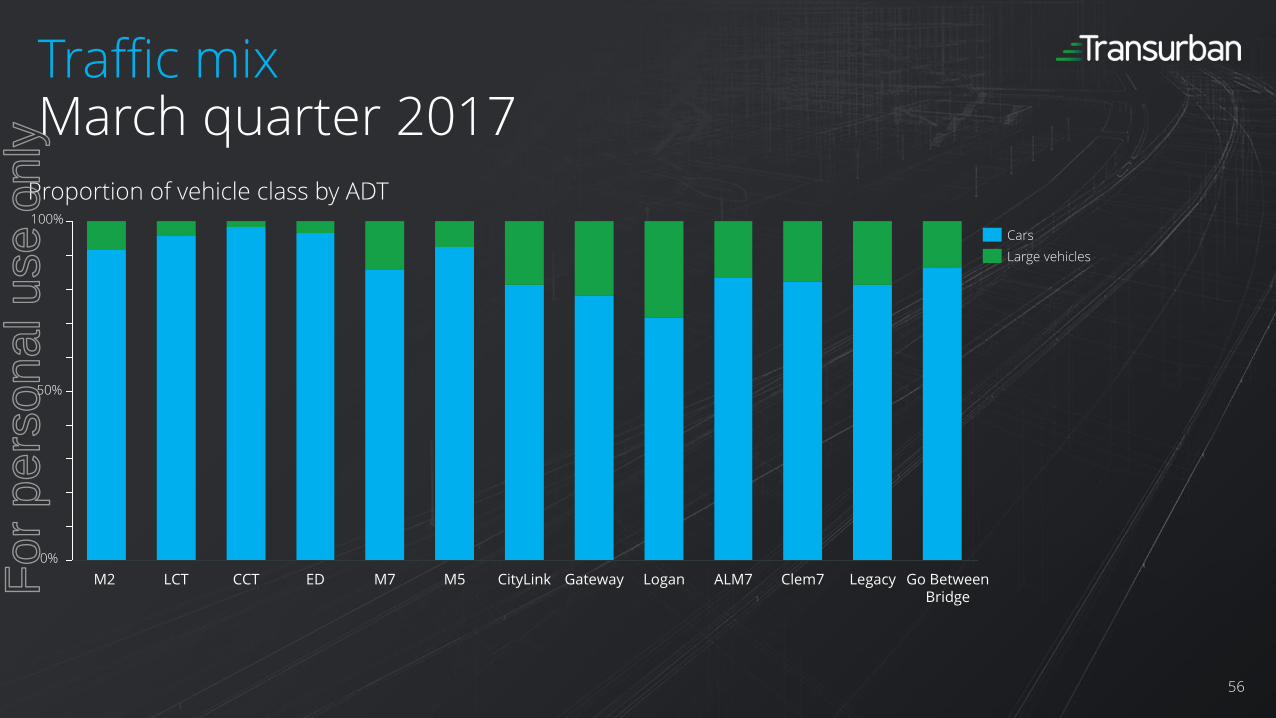
Traffic mixMarch quarter 2017
Go Between Bridge
LegacyClem7GatewayM7EDCCTLCTM2 ALM7LoganM5 CityLink
Large vehicles
Cars100%
50%
0%
Proportion of vehicle class by ADT
56
For
per
sona
l use
onl
y

Funding structure31 March 2017
1. Debt facilities including undrawn available facilities, in the base currency of debt before hedging.
2. Corporate working capital facilities are bilateral facilities and can be drawn in AUD and/or USD.
Transurban
Non-Recourse
Working Capital2
A$0.9B
PABsUS$0.2B
TIFIAUS$0.8B
PABsUS$0.2B
TIFIAUS$0.3B
AMTNA$0.3B
EMTN€1.6B
MapleC$0.3B
NOKNOK0.8B
Capital markets debt1
Bank debt1
Government debt1
144A
US$1.1B
USPPUS$0.8B
A$0.1B
M2
CCTA$0.3B
M2A$0.8B
M5A$0.7B
M7A$0.6B
ED
AMTNA$0.3B
ED
A$0.2B
LCT Term Debt
A$0.2B
LCTA$0.2B
M7
AMTNA$1.0B
EDLCT CCT M7 M5
AMTNA$0.7B
TQA$0.8B
USPPUS$1.1B
A$0.3B
AUD PP A$0.2B
EMTNCHF$0.4B
AirportlinkM7
A$1.0B
Brisbane
TQAirportlink
M7495 Express
Lanes95 Express
Lanes
GWA
Corporate Debt
Sydney
57
For
per
sona
l use
onl
y

Corporate debt maturities 31 March 2017
300375
100 125
165
254
219
206
213
94
300
233
798
833706
117
725
733296
-
200
400
600
800
1,000
1,200
1,400
1,600
1,800
2,000
FY17 FY18 FY19 FY20 FY21 FY22 FY23 FY24 FY25 FY26 FY27 FY28 FY29 FY30 FY31 FY32-41 FY42+
A$
millio
n
1. Debt is shown in the financial year in which it matures.
2. Debt values are in AUD as at 31 March 2017. CAD, EUR, NOK and USD debt are converted at the hedged rate where cross currency swaps are in place.
3. USD debt is converted at the spot exchange rate ($0.7629 at 31 March 2017) where no cross currency swaps are in place.
Working capital facilities Term bank deposit USPP AMTN EMTN 144A Letters of credit
58
For
per
sona
l use
onl
y

Non-recourse debt maturities 31 March 2017
1. The full value of debt facilities is shown as this is the value of debt for refinancing purposes. This overstates Transurban’s ownership share of the debt.
2. Debt is shown in the financial year in which it matures.
3. Debt values are in AUD as at 31 March 2017. CHF and USD debt are converted at the hedged rate where cross currency swaps are in place.
4. USD debt is converted at the spot exchange rate ($0.7629 at 31 March 2017) where no cross currency swaps are in place.
5. 95 Express Lanes and 495 Express Lanes maturities show final maturity dates.
495
845
475
250 279 200 200 203
440 302 293
200 406
277
225 300
405
350
369
225 400
535
100
278
75
77
80
85
90
98
108
116
160
60
200 40
294
1299
317
421
-
200
400
600
800
1,000
1,200
1,400
1,600
1,800
2,000
2,200
A$
millio
n
TQ (incl ALM7) ED M2 M7 CCT M5 LCT 495 95
59
For
per
sona
l use
onl
y
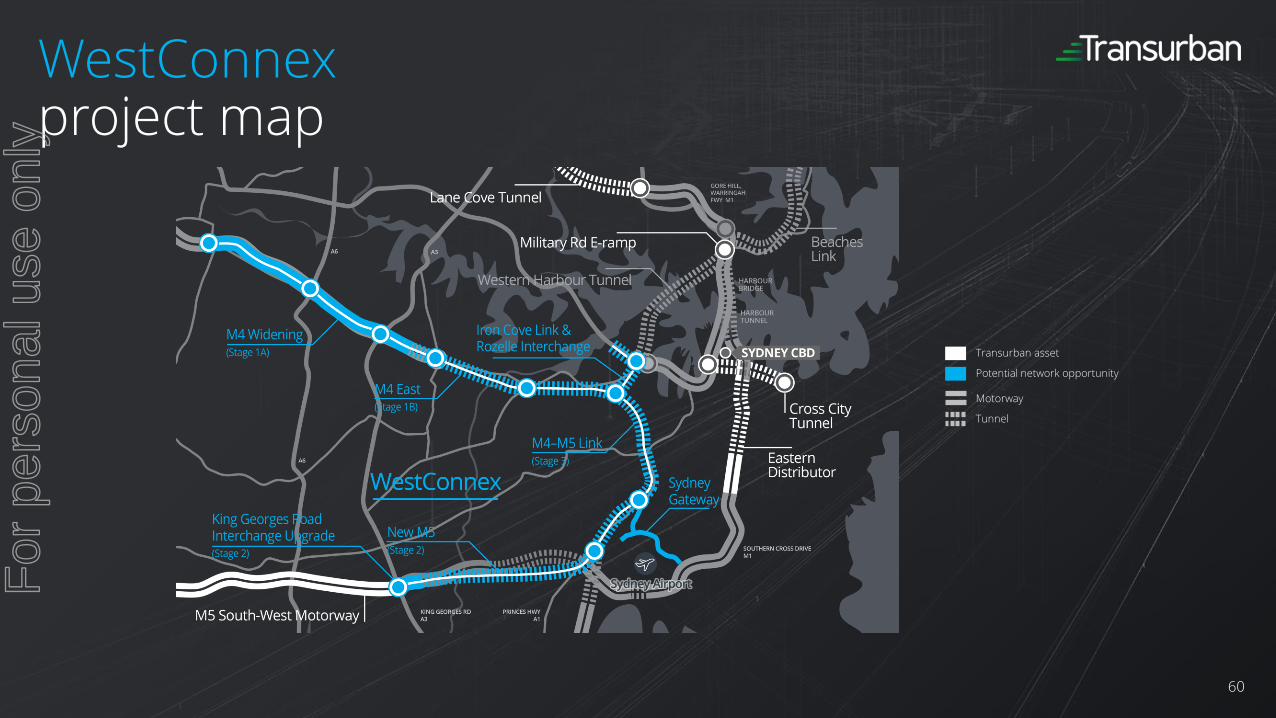
WestConnexproject map
Transurban asset
Potential network opportunity
Motorway
Tunnel
60
For
per
sona
l use
onl
y
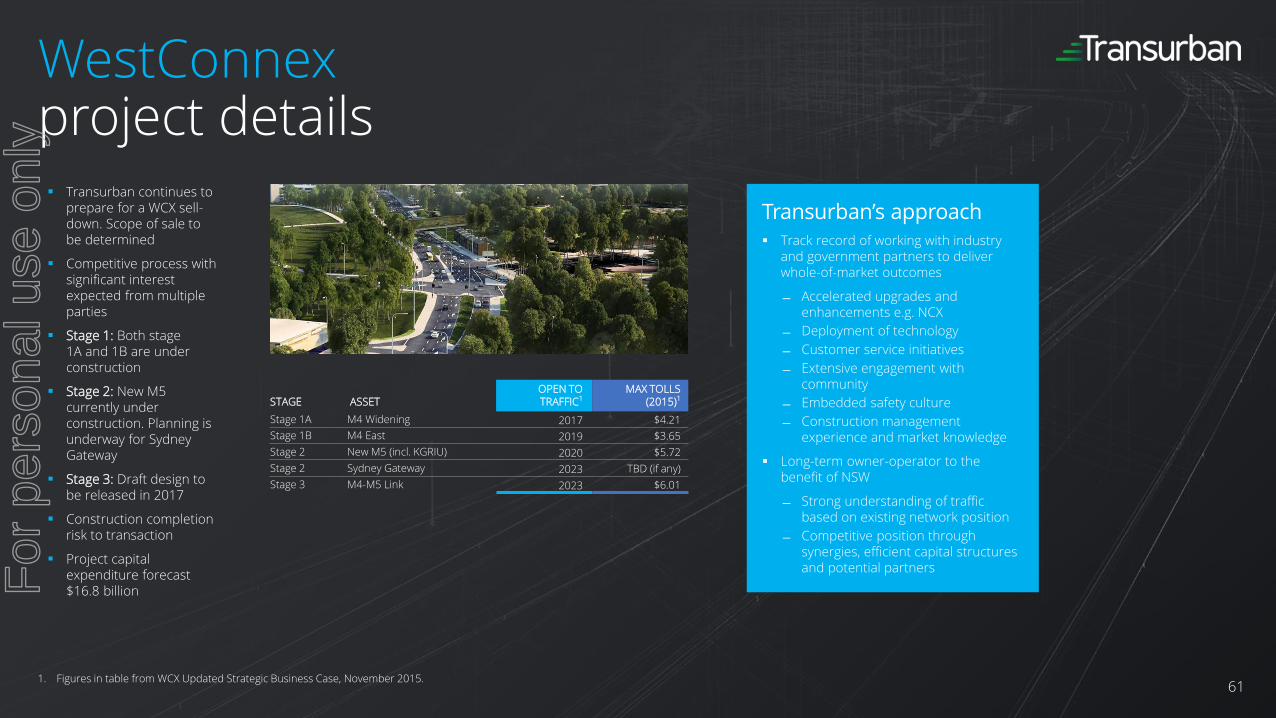
WestConnexproject details
STAGE ASSETOPEN TO TRAFFIC1
MAX TOLLS (2015)1
Stage 1A M4 Widening 2017 $4.21
Stage 1B M4 East 2019 $3.65
Stage 2 New M5 (incl. KGRIU) 2020 $5.72
Stage 2 Sydney Gateway 2023 TBD (if any)
Stage 3 M4-M5 Link 2023 $6.01
Transurban continues to prepare for a WCX sell-down. Scope of sale to be determined
Competitive process with significant interest expected from multiple parties
Stage 1: Both stage 1A and 1B are under construction
Stage 2: New M5 currently under construction. Planning is underway for Sydney Gateway
Stage 3: Draft design to be released in 2017
Construction completion risk to transaction
Project capital expenditure forecast $16.8 billion
Transurban’s approach Track record of working with industry
and government partners to deliver whole-of-market outcomes
Accelerated upgrades and enhancements e.g. NCX
Deployment of technology
Customer service initiatives
Extensive engagement with community
Embedded safety culture
Construction management experience and market knowledge
Long-term owner-operator to the benefit of NSW
Strong understanding of traffic based on existing network position
Competitive position through synergies, efficient capital structures and potential partners
1. Figures in table from WCX Updated Strategic Business Case, November 2015.61
For
per
sona
l use
onl
y
Glossary
For
per
sona
l use
onl
y

Glossary
ADT Average daily traffic ISCA Infrastructure Sustainability Council of Australia
ALM7 AirportlinkM7 KGRIU King Georges Road Interchange Upgrade
AUD Australian Dollars KPI Key performance indicator
CAD Canadian Dollars KM Kilometre
CAV Connected and autonomous vehicle KM/H Kilometres per hour
CBD Central business district LCT Lane Cove Tunnel
CCT Cross City Tunnel M&A Mergers and acquisitions
CHF Swiss Francs M2 Hills M2
CPI Consumer price index M5 M5 South West Motorway
CTW CityLink-Tulla Widening M7 Westlink M7
D&C Design and construction NCX NorthConnex
DPS Dividends per share NOK Norwegian Krone
DRP Dividend reinvestment plan NWRG NorthWestern Roads Group
ED Eastern Distributor O&M Operations and maintenance
EUR Euro OSAR Outer Suburban Arterial Roads
FFO Funds from operations P3/PPP Public private partnership
FY Financial year PAB Public activity bond
GFC Global financial crisis PP Private placement
GGM Group General Manager S&P Standard & Poor’s
GLIDe Tolling back office system TQ Transurban Queensland
GPS Global positioning system USD US Dollars
GWA Greater Washington Area VTIB Virginia Transportation Infrastructure Bank
ICB Inner City Bypass WCX WestConnex
IP Intellectual property WGTP West Gate Tunnel Project
63
For
per
sona
l use
onl
y

NorthConnexInvestor Day tour4 May 2017
For
per
sona
l use
onl
y
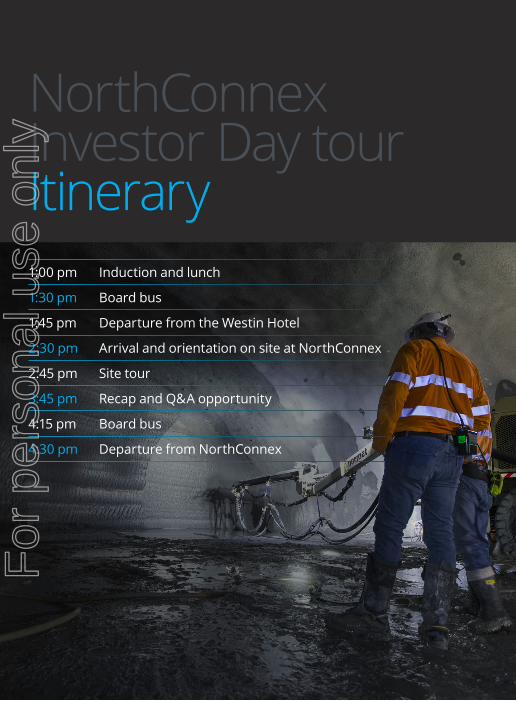
1:00 pm Induction and lunch
1:30 pm Board bus
1:45 pm Departure from the Westin Hotel
2:30 pm Arrival and orientation on site at NorthConnex
2:45 pm Site tour
3:45 pm Recap and Q&A opportunity
4:15 pm Board bus
4:30 pm Departure from NorthConnex
NorthConnexInvestor Day tour Itinerary
For
per
sona
l use
onl
y
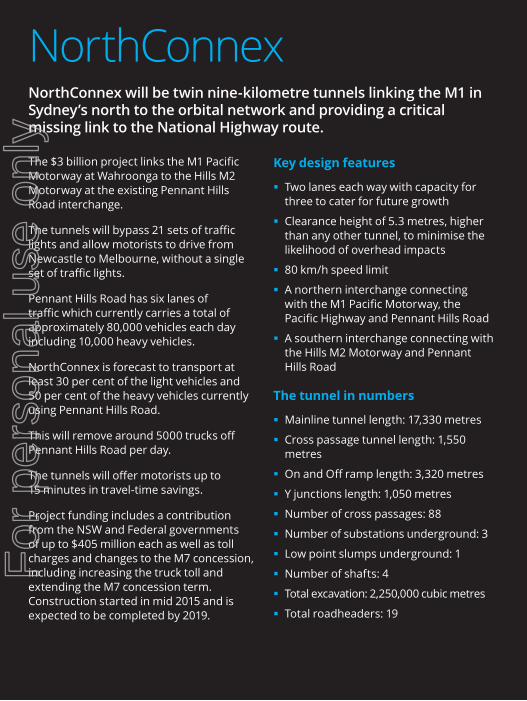
NorthConnexNorthConnex will be twin nine-kilometre tunnels linking the M1 in Sydney’s north to the orbital network and providing a critical missing link to the National Highway route.
The $3 billion project links the M1 Pacific Motorway at Wahroonga to the Hills M2 Motorway at the existing Pennant Hills Road interchange.
The tunnels will bypass 21 sets of traffic lights and allow motorists to drive from Newcastle to Melbourne, without a single set of traffic lights.
Pennant Hills Road has six lanes of traffic which currently carries a total of approximately 80,000 vehicles each day including 10,000 heavy vehicles.
NorthConnex is forecast to transport at least 30 per cent of the light vehicles and 50 per cent of the heavy vehicles currently using Pennant Hills Road.
This will remove around 5000 trucks off Pennant Hills Road per day.
The tunnels will offer motorists up to 15 minutes in travel-time savings.
Project funding includes a contribution from the NSW and Federal governments of up to $405 million each as well as toll charges and changes to the M7 concession, including increasing the truck toll and extending the M7 concession term. Construction started in mid 2015 and is expected to be completed by 2019.
Key design features
§ Two lanes each way with capacity for three to cater for future growth
§ Clearance height of 5.3 metres, higher than any other tunnel, to minimise the likelihood of overhead impacts
§ 80 km/h speed limit
§ A northern interchange connecting with the M1 Pacific Motorway, the Pacific Highway and Pennant Hills Road
§ A southern interchange connecting with the Hills M2 Motorway and Pennant Hills Road
The tunnel in numbers
§ Mainline tunnel length: 17,330 metres
§ Cross passage tunnel length: 1,550 metres
§ On and Off ramp length: 3,320 metres
§ Y junctions length: 1,050 metres
§ Number of cross passages: 88
§ Number of substations underground: 3
§ Low point slumps underground: 1
§ Number of shafts: 4
§ Total excavation: 2,250,000 cubic metres
§ Total roadheaders: 19
For
per
sona
l use
onl
y
Sustainability
NorthConnex has been independently recognised for its sustainable approach to design.
The NSW Minister for Planning’s Conditions of Approval require an Infrastructure Sustainability Council of Australia (ISCA) rating of ‘Excellent’ to be achieved on the project.
In October 2016, the project was awarded a ‘Leading’ Design rating by ISCA, the highest possible achievement in the IS rating scheme
To date, NorthConnex is one of only six projects, and the only motorway in Australia, to receive this rating. The team is now focused on achieving the corresponding operational rating.
Employment
The average daily peak workforce is up to 1,500 workers on site. At peak in 2018, about 2,000 workers will be on site daily.
The high levels of infrastructure investment in NSW and specialised nature of tunnelling have led to skill shortages. The project delivery team has met this challenge through a $10 million investment in training including a “NorthConnex Hub”, a classroom and training facility.
Around 300 workers will receive training through the NCXHub.
The project has had benefits for regional areas. So far NorthConnex has engaged more than 40 businesses from the Central Coast for uniforms, safety training, formwork, concreting and steel fixing. Almost 70 businesses have been engaged from the Newcastle and Hunter region.
Environmental benefits
NorthConnex has reduced the need to clear more than 1.3 hectares of vegetation including saving more than 470 square metres of endangered Sydney Turpentine Ironbark Forest and 742 Epacris Pururaescens shrubs, which is also listed as “vulnerable”.
In 2016
§ 100 per cent of spoil was beneficially reused
§ 95 per cent of construction waste was recycled
§ 714 environmental inspections were completed onsite
The project is working with RMS and Hornsby Council to help transform the disused Hornsby Quarry into public parkland. The project team identified an opportunity to assist Hornsby Council to achieve its goal of creating a new community space by helping to fill the old quarry site with around one million cubic tonnes of spoil from the tunnels.
This also helps to reduce truck movements minimising the distances required for transporting spoil by around 3.7 million kilometres.
For
per
sona
l use
onl
y
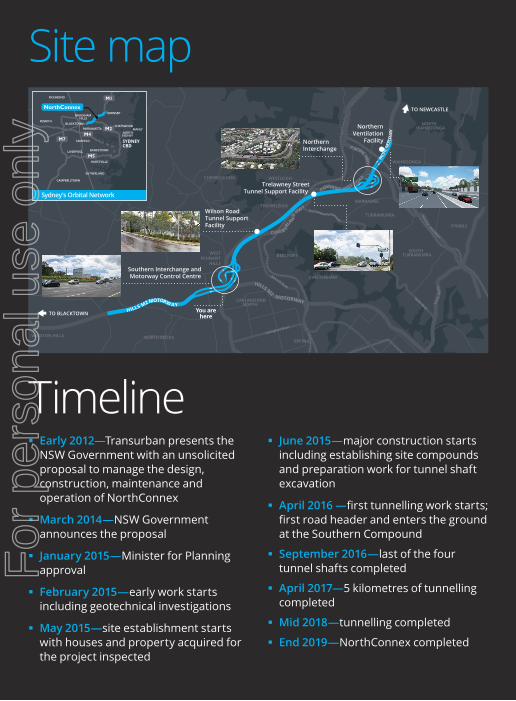
§ Early 2012—Transurban presents the NSW Government with an unsolicited proposal to manage the design, construction, maintenance and operation of NorthConnex
§ March 2014—NSW Government announces the proposal
§ January 2015—Minister for Planning approval
§ February 2015—early work starts including geotechnical investigations
§ May 2015—site establishment starts with houses and property acquired for the project inspected
§ June 2015—major construction starts including establishing site compounds and preparation work for tunnel shaft excavation
§ April 2016 —first tunnelling work starts; first road header and enters the ground at the Southern Compound
§ September 2016—last of the four tunnel shafts completed
§ April 2017—5 kilometres of tunnelling completed
§ Mid 2018—tunnelling completed
§ End 2019—NorthConnex completed
BAULKHAM HILLS
NorthernInterchange
NorthernVentilation
Facility
Wilson RoadTunnel SupportFacility
Trelawney StreetTunnel Support Facility
Southern Interchange and Motorway Control Centre
TO NEWCASTLE
TO BLACKTOWN
OR
NORTH WAHROONGA
WAHROONGA
WARRAWEE
TURRAMURRA
PYMBLE
SOUTHTURRAMURRA
THORNLEIGH
WESTLEIGHCHERRYBROOK
CHELTENHAM
BEECROFT
EPPING
CARLINGFORDNORTH
WINSTON HILLS
BELLA VISTAWEST
PENNANTHILLS
NORTH ROCKS
OLD
WIN
DS
ROAD
HILLS M2 MOTORWAY
Beecroft Road
Carlingford Road
RYD
ER
OA
D
Yanko Road
PACIFIC HIGHWAY
PACIF
IC MO
TORW
AY
The Comenarra Parkw
ay
You arehere
HILLS M2 MOTORW AY
P ENNANT HILLS R OAD
P ACIFIC HWY
CUM B ERLA
ND
HWY
Site map
Timeline
RICHMOND
PENRITH
CAMPBELLTOWN
SUTHERLAND
HURSTVILLE
LIVERPOOL
FAIRFIELD
BANKSTOWN
SYDNEYCBD
NORTHSYDNEY
BLACKTOWN
BAULKHAMHILLS
HORNSBY
MANLYCHATSWOOD
PARRAMATTA
Sydney’s Orbital Network
For
per
sona
l use
onl
y
Related Documents