Transportation leadership you can trus presented to Talking Freight Seminar presented by Michael Fischer Cambridge Systematics, Inc. December 12, 2007 Economic Impacts of Large Scale Freight Investments

Transportation leadership you can trust. presented to Talking Freight Seminar presented by Michael Fischer Cambridge Systematics, Inc. December 12, 2007.
Dec 15, 2015
Welcome message from author
This document is posted to help you gain knowledge. Please leave a comment to let me know what you think about it! Share it to your friends and learn new things together.
Transcript

Transportation leadership you can trust.
presented to
Talking Freight Seminar
presented by
Michael FischerCambridge Systematics, Inc.
December 12, 2007
Economic Impacts of Large Scale Freight Investments

2
Overview
Background and Purpose
Economic Impact Analysis Framework
Case Study – Baltimore Rail Tunnel
Overview of Toolbox

3
What Is Economic Impact Analysis?
Investments affect transportation system performance
Transportation system performance affects business costs, output, and profitability – economic effects
Economic effects impact general economy• Output (GDP), employment, income – macro economy
• Geography of effects
• Incidence of effects
Focus of guidebook is economic effects• National scale of benefits – large scale
• Public vs. private impacts
• Logistics and supply chain effects – second order

4
Challenges for Evaluating Large Scale Projects
Public benefit consideration
National level significance
Multiple modes of travel
Allocation of costs and benefits among wide array of stakeholders

5
Cost and Impact Perspectives
Freight Carriers(impact on delivery cost, access, performance)
Freight System Users(impact on access to suppliers & customers)
Public Interest (income for workers, prices for consumers, safety, security, government)
Non-Freight Users (impact on Nonfreight Users (impact on passenger travel & nonfreight-reliant industries)
Large Scale Freight Project(impact on transport capacity and performance)

6
Five-Step Framework
Step 1 – Classify the Type of Project (Transportation Impact)
Facility location – Local entry/access point, regional corridor, facility
Modes involved – Air, water, rail, truck, combinations of modes
Transport change – Capacity, access, speed/flow, and cost
Investment – Expand existing facility, build new or alternative facility
Step 2 – Define the Relevant Evaluation Issues (Economic Impact)
National and international scale freight network capacity and level-of-service needs
Economic competitiveness, growth, productivity, and trade
Benefits to specific regions, modes, or industry-specific targets
Allocation of costs and benefits among affected parties to assess equitable funding
Step 3 –Tools for Calculation of Transportation Impacts
Network analysis – Providing links, nodes, capacity, and performance – rail, highway
Facility handling analysis – Capacity/Cost for ports, terminals, bridges, tunnels
Logistics analysis – Ultimate cost implications of mode/facility choices

7
Five-Step Framework (continued)
Step 4 –Tools for Calculation of Expected Economic Impacts
Form of economic impact – Cost reduction, productivity, income generation, jobs
Geography of impacted markets – Local, regional, national, international
Distribution of economic impacts – Commodity and economic sector
Models – Supply chain, regional economic growth, national productivity, int. trade
Step 5 – Decision Methods
Benefit/cost analysis
Cost-effectiveness analysis
Equity impact analysis
Multicriteria weighting analysis

8
Basic Data Requirements
Transportation impact data
• Network supply conditions
• Travel demand patterns
Economic evaluation factors
• Economic performance measures
• Economic value of performance impacts
9
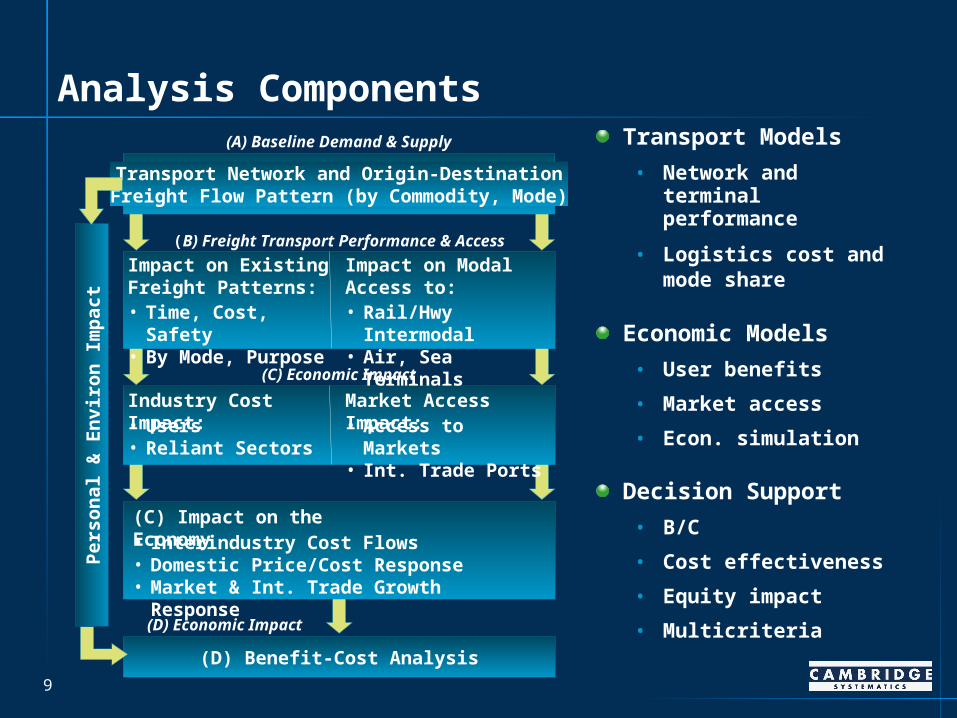
Transport Network and Origin-DestinationFreight Flow Pattern (by Commodity, Mode)
(B) Freight Transport Performance & Access
Impact on Existing Freight Patterns:• Time, Cost, Safety• By Mode, Purpose
Impact on Modal Access to:• Rail/Hwy Intermodal• Air, Sea Terminals
(C) Economic Impact
Industry Cost Impact:• Users• Reliant Sectors
Market Access Impact:• Access to Markets• Int. Trade Ports
(C) Impact on the Economy• Interindustry Cost Flows• Domestic Price/Cost Response• Market & Int. Trade Growth Response
(D) Benefit-Cost Analysis
(D) Economic Impact
Analysis ComponentsTransport Models
• Network and terminal performance
• Logistics cost and mode share
Economic Models
• User benefits
• Market access
• Econ. simulation
Decision Support
• B/C
• Cost effectiveness
• Equity impact
• Multicriteria
Per
son
al
& E
nvi
ron
Im
pac
t
(A) Baseline Demand & Supply

10
Step 1: Define Project Type
Functional Activities
• Facility Type
• Types of users and spatial scope of impact
Transportation Improvement Categories
Transportation Benefit Metrics

11
Table 3.1 Examples of Projects by Category of Transportation Improvement
Improvement Category Project Action Mode
Capacity Expansion – Link Add general public lanes Highway
Add truck-only lanes Highway
Add track Rail
Upgrade track (speed or weight) Rail
Upgrade/eliminate grade crossing Rail/Highway
Upgrade locks/dams Water
Navigable waterway improvement Water
Tunnel upgrades Rail
Correct design deficiencies All
Capacity Expansion – Terminal Channel deepening – harbor Water
Air draft improvement Water
Added lift capacity Rail/Water
Added terminal storage capacity Rail/Water
Added gate capacity Rail/Water

12
Table 3.1 Examples of Projects by Category of Transportation Improvement (continued)
Improvement Category Project Action Mode
Operational Improvements Roadway geometrics Highway
Track alignments Rail
Signalization improvements Highway
Electronic control Rail
Intelligent transportation systems All
Information systems – scheduling/cargo visibility
All
LCV upgrades Highway
Hours of operation All
Connectivity Intermodal connector improvements All
On-dock/near-dock rail Rail/Water
Gap closure Rail/Highway
Short haul rail Rail
13
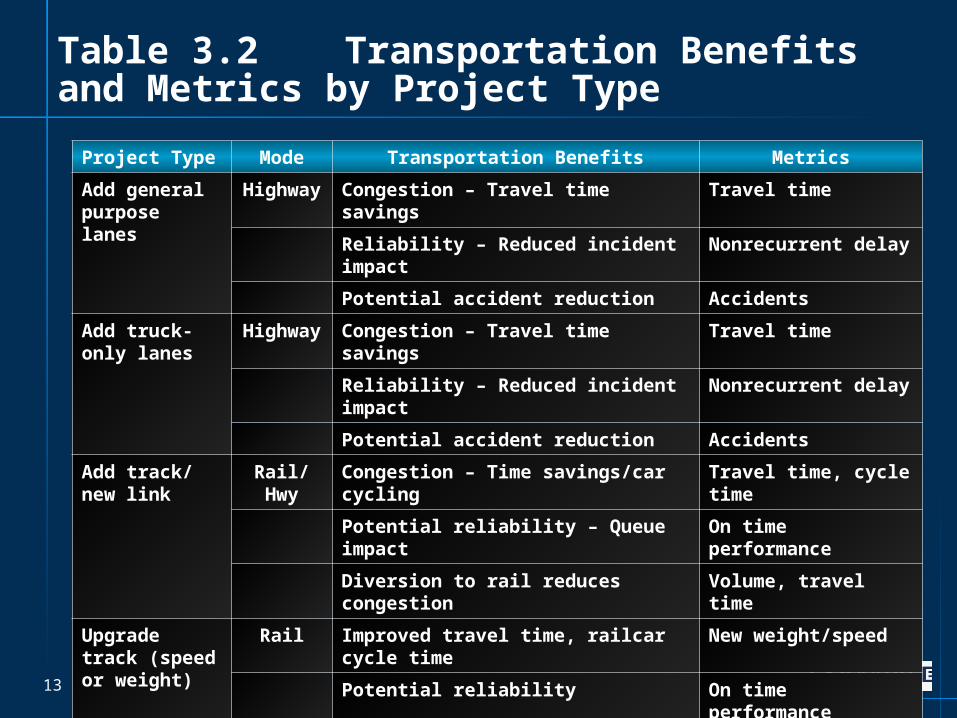
Table 3.2 Transportation Benefits and Metrics by Project Type
Project Type Mode Transportation Benefits Metrics
Add general purpose lanes
Highway Congestion – Travel time savings Travel time
Reliability – Reduced incident impact Nonrecurrent delay
Potential accident reduction Accidents
Add truck-only lanes
Highway Congestion – Travel time savings Travel time
Reliability – Reduced incident impact Nonrecurrent delay
Potential accident reduction Accidents
Add track/new link
Rail/Hwy Congestion – Time savings/car cycling Travel time, cycle time
Potential reliability – Queue impact On time performance
Diversion to rail reduces congestion Volume, travel time
Upgrade track (speed or weight)
Rail Improved travel time, railcar cycle time New weight/speed
Potential reliability On time performance
Potential safety Accidents
Upgrade/eliminate grade crossing
Rail/Hwy Potential speed/travel time savings Average speed
Accident reduction – Reliability savings
Accidents
14
Step 2: Define Evaluation Issues
Identifying Issues and Audiences
National and Local Issues
Stakeholders: Incidence of Benefits and Costs
Alternative Impact Metrics

15
Step 3: Transportation Impact Tools
Identification of Transportation Efficiency Benefits
Mode-Specific Performance Analysis
• Network and terminal performance
• Nontraditional metrics (e.g., reliability)
Modal Diversion Analysis
Treatment of Carrier and Shipper Costs – market relationships of costs and prices
Final Analysis and Presentation of Results

16
Example Portrayal of Findings from Transportation Analysis
Truck Rail Air Sea
System Performance Impacts
Increased Vehicle Capacity (TEUs or tons per vehicle)
Increased Line or Terminal Capacity (vehicles per hour)
Increased Schedule Frequency
Reduction in Recurrent Interchange or Bottleneck Delays
Reduction in Nonrecurrent Incident Delays
Improved Safety
System Throughput Changes
Predicted Change in Throughput Volume
Shipper Impacts
Reduced Transport Costs
Reduced Logistics Costs
Improved Productivity
Improved Terminal Access
Enlarged Delivery Market Area Access

17
Step 4: Select and Apply Economic Impact Tool
Screening: Overall Economic Benefit
Industry Reorganization Effects
Establishing National and Local Distinctions
Selection and Application of Economic Models
Final Analysis and Presentation of Results

18
Measuring the Economic Impacts of Transportation Projects
Input Output Final Output
National Economic Impacts
Reduced Transport Costs
Reduced Logistics Costs
Business Market Expansion
Exports and Imports
Total U.S. output
GDP (Value Added)
Personal income
Local/Regional Economic Impacts
Change in local production costsa; or
Change in final demandb ; or
Change in accessibility/ quality of rail, air/sea port, highwayc
Total local outputa,b
Output from new business attractionc
Local personal incomea
Local GDP (value added)a
State and local tax revenuea
Value of externalities (discussed elsewhere)

19
Measuring the Economic Impacts of Transportation Projects (continued)
Input Output Final Output
Sector-Specific Economic Impacts
Change in production costs
Employment by freight carriers (by mode)
Output by freight carriers (by mode)
Profits by freight carriers (by mode)
Employment at logistics firms
Output and Profits logistics firms
Employment in nontransportation sectorsd
Output in nontransportation sectorsd
Profits in nontransportation sectorsd
a Denotes econometric model;b Denotes multiplier analysis;c Denotes business attraction model; andd Denotes stratification by North American Industrial Classification System.

20
Rough “First Cut” Estimate of the Supply Chain Benefit from a 10% Transportation Improvement
Source: Boston Logistics Group, Inc.Note: These benefits are indicative and preliminary estimates only that are based on average
companies in a broad cross-section of industries, including many that have little transportation cost and do not move physical product. More precise estimates that are targeted at specific Supply Chain Types™ should be developed using the tools referenced throughout this text.
Infrastructural Benefit
Supply Chain Impact
Supply Chain Benefit
Expressed As % of Operating Cost
Supply Chain Benefit
Expressed As % of Transport Cost
10% Transport Cost Reduction
Lower material cost by substituting farther cheaper sources
0.1% 1.5%
Consolidate plants due to extended reach 0.2% 4.1%
Switch modes and reduce shipment size, decreasing inventory
0.1% 1.2%
10% Capacity Increase
Less safety stock 0.1% 1.1%
Rationalization of fleet and warehouse assets 0.01% 0.3%
Secondary Effects
Increasing service levels Not quantified Not quantified
Converting cost savings into price reductions Not quantified Not quantified
On demand supply chains Not quantified Not quantified
21
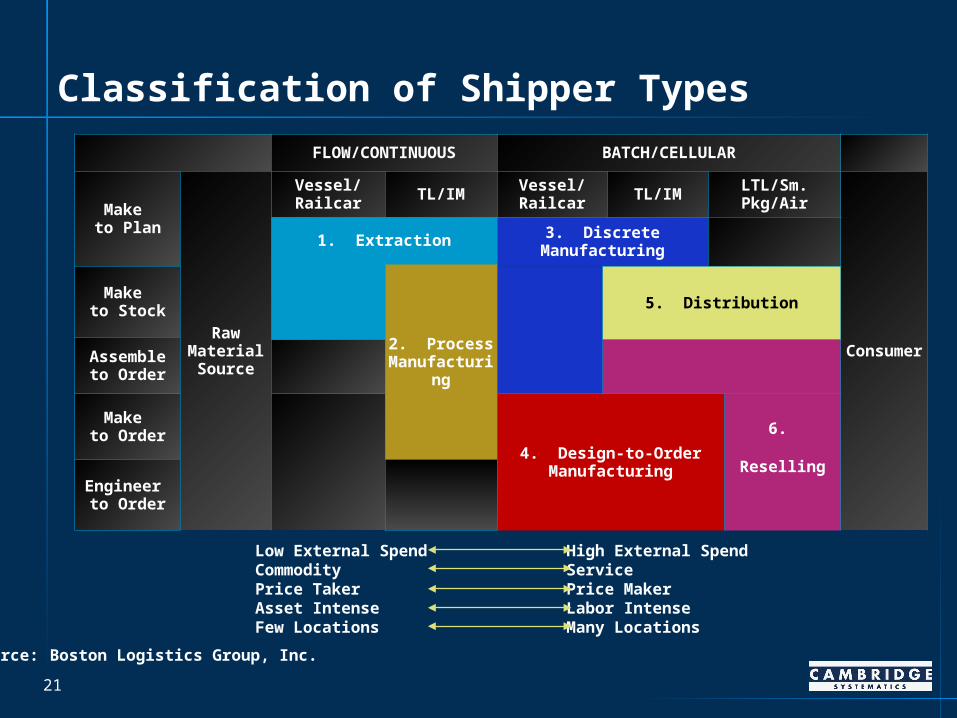
Classification of Shipper Types
Source: Boston Logistics Group, Inc.
FLOW/CONTINUOUS BATCH/CELLULAR
Make to Plan
Raw Material Source
Vessel/Railcar TL/IM Vessel/Railcar TL/IM LTL/Sm. Pkg/Air
Consumer
1. Extraction 3. Discrete Manufacturing
2. Process Manufacturing
Make to Stock 5. Distribution
Assembleto Order
Make to Order
4. Design-to-Order Manufacturing
6. Reselling
Engineer to Order
Low External Spend High External SpendCommodity ServicePrice Taker Price MakerAsset Intense Labor IntenseFew Locations Many Locations

22
Step 5: Select and Apply Decision Models
Alternative Views of Benefits
Benefit-Cost Calculation and Presentation
Incidence and Equity of Benefits and Costs
23
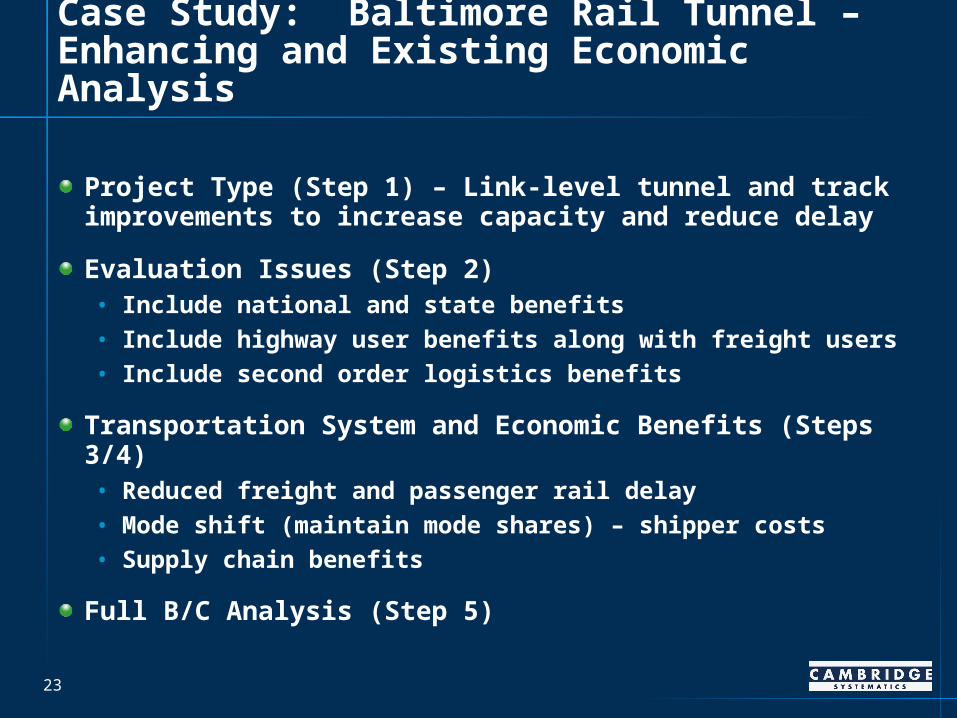
Case Study: Baltimore Rail Tunnel – Enhancing and Existing Economic Analysis
Project Type (Step 1) – Link-level tunnel and track improvements to increase capacity and reduce delay
Evaluation Issues (Step 2)• Include national and state benefits
• Include highway user benefits along with freight users
• Include second order logistics benefits
Transportation System and Economic Benefits (Steps 3/4)• Reduced freight and passenger rail delay
• Mode shift (maintain mode shares) – shipper costs
• Supply chain benefits
Full B/C Analysis (Step 5)

24
Benefit/Cost Results
BenefitScenario 1.
750/500Scenario 2.
500/300% Difference
Freight Rail Operators
Shipper Costs
Highway Travelers
Amtrak Users
Supply Chain
$270,229,331
$2,694,157,018
$625,621,147
$1,422,398,587
$2,013,629,007
$270,229,331
$1,655,796,822
$625,621,147
$873,653,722
$1,303,373,082
0.00%
62.70%
0.00%
62.80%
54.50%
Total Benefits
Total Costs
$7,026,035,090
$3,046,338,138
$4,728,674,104
$3,046,338,138
48.60%
–
Benefit/Cost 2.31 1.55 48.60%
Source: Baltimore Rail Studies by PB Consult for Maryland DOT and Cambridge Systematics, Inc.
25
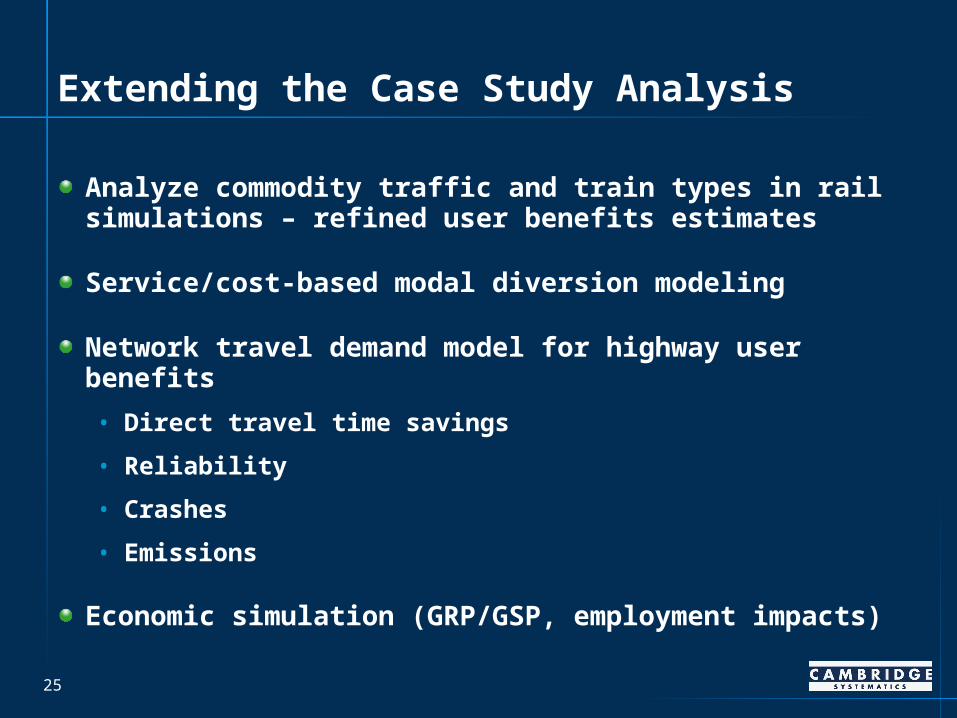
Extending the Case Study Analysis
Analyze commodity traffic and train types in rail simulations – refined user benefits estimates
Service/cost-based modal diversion modeling
Network travel demand model for highway user benefits
• Direct travel time savings
• Reliability
• Crashes
• Emissions
Economic simulation (GRP/GSP, employment impacts)
26
Toolbox
Freight Network and Terminal Performance
Modal Diversion and Logistics Cost Models
Cost and Access Benefit Calculations
Economic Simulation Models
Decision Support Tools

27
For More Information
Copies of the guidebook are available at:
http://www.dot.gov/freight/guide061018/index.htm
Contact:
Michael Fischer, Cambridge Systematics, [email protected]
Related Documents


