Transportation Economics and Project Evaluation Evaluation process safety in evaluation process and intro to micro economics

Transportation Economics and Project Evaluation Evaluation process safety in evaluation process and intro to micro economics.
Dec 31, 2015
Welcome message from author
This document is posted to help you gain knowledge. Please leave a comment to let me know what you think about it! Share it to your friends and learn new things together.
Transcript

Transportation Economics and Project Evaluation
Evaluation process safety in evaluation process and intro to micro economics

Objectives of project evaluation An objective and consistent method for the
making of investment decisions Which alternative design for a project should we
select? Which competing alternative approach should
we invest in? Which project or projects should we invest in? What category of projects would it be most
productive to invest in? E.G., streets or water distribution

Exception Methodology Manage by exception
Invest what you have always invested unless an exception arises
Example City capital improvement budget – invest
at the same level for every city service with a small increase for inflation.
Budget for contingencies where system exhibits a chronic problem (e.g. excessive congestion)

Pros and Cons of Exception Method
Pros Easily understood by decision makers Requires minimal amount of decisions
support systems Cons
No basis for making efficient decisions No basis for making trade-offs between
categories Perpetuates past misallocation of
resources

Traditional approach (popular) Performance measurement
Manage the performance of existing system Pavement roughness Delay encountered while traveling in system Travel speed Travel times Etc.
Establish minimum levels of performance Invest in projects which provide the maximum
improvement in performance for dollars spent.

Pros and Cons of Traditional Approach
Pros Manages to measurable criteria Builds on good management practice Supportable to public and decision makers
Cons Supports past legacies decisions Difficult to make comparisons between
investment categories Supports past misallocations of resources

Economic Evaluation (big idea) Levels of decisions
Operating and maintenance budget decisions What level of performance
Project design level decisions Design decisions regarding a project User benefits of competing designs are assumed equal
Project selection decision Give a number of alternatives for a project which one should be
selected. Mutually exclusive options
Network decisions Given a number of projects, which one should be invested in and
when Non-mutually exclusive options
Program allocation decisions Which category of investment should we invest in? Safety improvements or congestion reduction?
Operating budgeting decisions
Operating allocation – Budget to Meet performance identified in selection decision
Project selection process assumes operating costs allocation when the selection is made
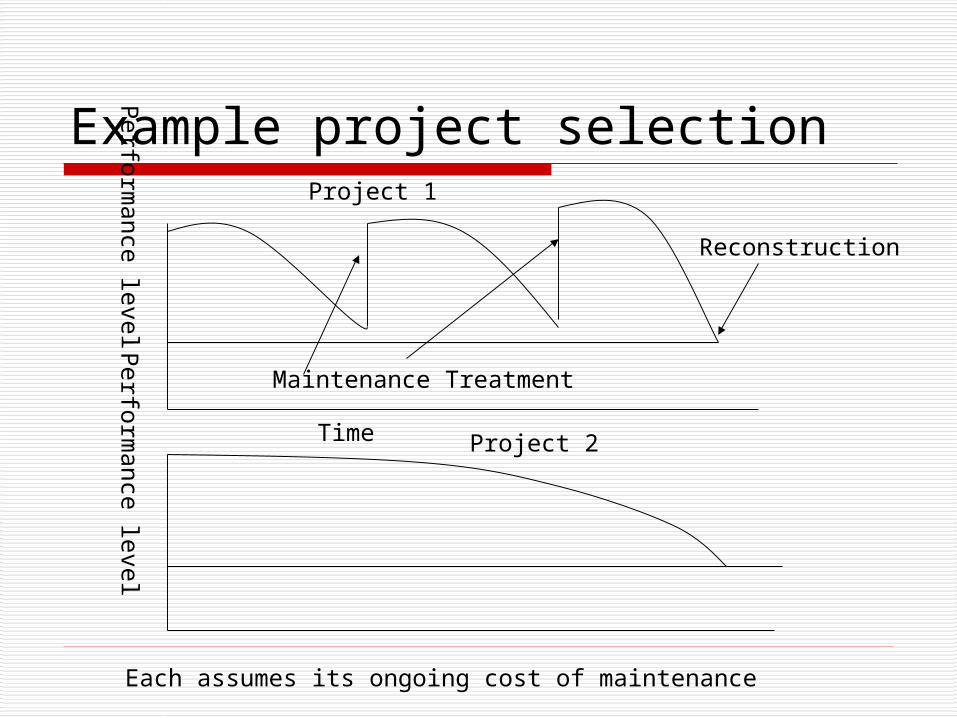
Example project selectionPerf
orm
ance
level
Time
Maintenance Treatment
Reconstruction
Project 1
Perf
orm
ance
level
Project 2
Each assumes its ongoing cost of maintenance
Project Design Selection Criteria
Select project designs which Minimizes Life Cycle Costs
Assumes that all design alternatives provides similar user benefits
Meets budget requirements Able to achieve minimum design
standards

Project Selection Decision Selects project from feasible alternatives Projects are mutually exclusive
Example – Two different alignments Benefit and costs streams of project
alternative vary Comparison methodologies
Benefit to cost ratio Minimum present worth Maximum internal rate of return
Comparison of incremental benefits and costs
Network Decision Making Planning level decision making
Should we invest in reconstructing the freeway in Council Bluffs, Davenport, four-laning U.S. 30, etc.
Non-mutually exclusive decisions Compare the benefits and costs of one
project to another Decision making criteria
Select project with greatest benefit to costs ratio Continue to select project until budget is
exhausted or there are not more cost beneficial projects.
Program Allocation Decisions There will always be projects where
the benefits exceed the costs so which category of activity should we invest? Example – should we be investing more
in education and less in transportation services?
Example – should we be investing more in winter maintenance and less in bridge maintenance?
Program allocation decision
Trade-offs between categories are very difficult
Rarely done based on economic information
Political and equity concerns conflict with pure economic rational (deep thought)

Benefit – Cost analysis Since transportation benefits are reduced
cost, costs and benefits often get confused. Costs are associated with the facility
Capital costs Construction costs Right-of-way costs Vehicle cost (if they are owned by the operator)
Maintenance costs Facility operation

Benefit-Costs analysis Reduced costs that are associated with benefits are
related to the users Travel time costs
Total hours and cost of system travel Travel time reliability
Vehicle operating costs Fuel Oil Insurance Maintenance Depreciation (vehicle ownership costs) Tires
Crash costs
Estimates of User Cost Savings Travel time reductions
Demand models Travel time reliability – user benefits are
difficult to measure Vehicle costs
Measure through historical data Value of reduced deaths and injuries
Technical costs are easy to measure Human loss is difficult to measure

What is a human life worth Industry must make trade-offs between
safer cars and profits Government must make trade-off between
safer roads and expenditures on highways Users make trade-offs between the
likelihood of dying and travel convenience How many of you would like to drive at 5 mph?

Example 1 of Calculation Ford Pinto Gas Tank Guard caseFord calculations
Ford costsGuard costs $11 per guardProject run of pinto – 12.5 millionTotal retrofit cost $135,000,000
User cost44 excess fatalities530 excess injuries7,500 excess PDOs

Example 1 continued
Societal cost of excess fatalities and injuriesFatal $200,000 (NHTSA and Safety
Council average)Injury accident $67,000 (very high)PDO $700
Total societal costs = $49,500,000B/C = 2.8 in favor of not doing the retrofit

Example 1
Was Ford right or wrong?Why?

Example 2 Right Turn on Red
Estimated national savingsUser savings – 1.4 gallons/veh/year
- 10 seconds/driver/dayUser costs - 22 excess fatalities
- 900 excess injuries- 10,300 PDO
B/C = 7.3 in favor of right on red

Comparison of two examples
Are you in favor of right on red?Is right-on-red worth the extra fatalities?
Why is it that we feel better about the decision to adopt right-on-red and not about Ford’s decision?
How much should we be willing to spend to save a human life?

Example 3The 9 Pennsylvania Miners that were
trapped were rescued after 77 hours of drilling
The initial cost estimate of performing the rescue was $10,000,000 with a low probability of success (assume 25% probability of success)
Assume value of human life is $2.5 million
2.5*0.25*9 = $5.625 million $5.625/$10 = B/C = 0.6

Why are we inconsistent in our perspective on human lifeAnonymity
“Identifiable Victim Effect”Jessica McClure, 9 Pennsylvania Miners
Assumed riskWhen the individual has accepted a higher level of risk
AstronautSky diver

How Should We Settle the Costs The nine miners rescued
Actual cost – approximately $6 million The mining company cannot afford to
cover these costs. U.S. Rep. John Murtha, of Johnstown,
obtained a $2 million federal grant State of Pennsylvania shelled out about
$2 million Remaining balance owed private
contractors is about $2 million How should we cover the unpaid
cost? Disney is paying each miner
$150,000 for their story – should this money be used to cover the costs?

So on what basis should we make decisions?
We need to recognize that people are willing to buy some benefits with human lifeOtherwise the speed limit would be 10mph.

How do we determine the value of Human Life
Societal value of life is the value to save one life.Not a specific lifeNot what you value your own lifeIt is a statistical life

Methods for valuing lifeWillingness to pay – what are we willing to pay
to reduce total deaths by one fatalitySince this is not a situation that is present in reality, we establish analogous situations.Suppose that 5 million people were willing to buy a car
with $100 safety improvement that would reduce their risk of dieing in car crash by one in 5,000. Thus we would be willing to pay $500 million to save 1,000 lives. Therefore, at a minimum society is willing to pay $500,000 for a life saved.
Included in the willingness to pay is the willingness to pay to avoid the pain and suffering to avoid injury or death.
Pain and Suffering
Accounting for the quality lifeQuality-adjusted life years lost (QALY)Value assigned to a perfect health year = 1Value assigned to a year of death = 0 Injuries fit on the continuum between 1 and 0

Methods for valuing human life cont.Direct-costs avoided
The amount of costs directly avoided by reducing by a single death.Medical costsEmergency servicesInsurance administrationEtc.
Human capital approachThe amount of economic value lost by a single death or injury.

NHTSA values for injuries and fatalities
Item Individual Cost Percent of TotalMedical $22,095 0.66%
Emergency Service $833 0.02%
Market Productivity $595,358 17.69%
HH Productivity $191,541 5.69%
Insurance Administration $37,120 1.10%
Workplace Costs $8,702 0.26%
Legal Costs $102,138 3.03%
Travel Delay $9,148 0.27%
Property Damage $10,237 0.30%
Quality of Life $2,389,179 70.97%
2000 value of human life $3,366,351 100.00%
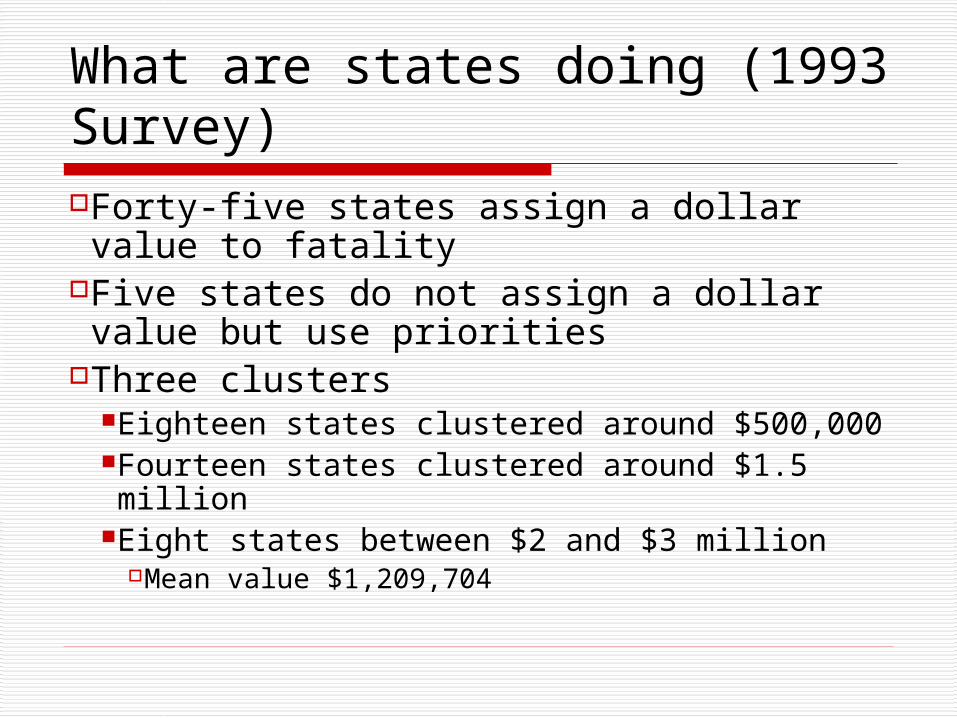
What are states doing (1993 Survey)Forty-five states assign a dollar value to fatality
Five states do not assign a dollar value but use priorities
Three clustersEighteen states clustered around $500,000Fourteen states clustered around $1.5 million
Eight states between $2 and $3 millionMean value $1,209,704

Factors Causing Crashes
Driver Vehicle Roadway Environment

Economic Cost of Crashes
Cost to society: $230.6 billion/ year medical, rehabilitation and long term
care cost ( $ 32.6 billion) Work place lost productivity $59 billion lost tax revenue (adding $200 from each
household) property damage $59.8 billion Travel Delay $25.6 billion
Source NHTSA

National Crash Frequency
Fatal Crashes – 37,795 Injury Crashes – 2,003,000 Property Damage Crashes –
4,282,000 Total killed 42,116 (5,500 were peds
and cyclists)

National Crash Frequency Fatal
1.51 Per HMVM 14.79 per 100,000 people 19.04 per 100,000 vehicles 22.02 per 100,000 licensed drivers
Injury 109 per hmvm 1,065 per 100,000 people 1,371 per 100,000 vehicles 1,585 per licensed driver
Source - FHWA

Fatal Crash Trends
Source – FHWA Crash Facts Book

Crash Rate Trend
Source – FHWA Crash Facts Book

Age Distribution of People Killed
Source – FHWA Crash Facts Book

Fatality Rate by Age

Iowa Crashes (2000)
445 fatalities 100 had BAC > 0.1 63,371 crashes 35,974 injuries

Iowa Fatal Crash Trends

Crash Rate Calculation
Accounts for volume May account for vehicle miles traveled (VMT)Crash rate =
where:n = analysis time period in years (5 years for the Iowa DOT) DEVnode = actual daily entering vehicles for nodes and
average daily traffic for road segments (for road segments up to 0.6 miles long and spot locations)
DEVlink = Absolute value of [(Link length/0.3)x(Actual DEV)]
(for road segments 0.6 miles and longer)
days/year) (365years) ( (DEV)
)(10 crashes) of(Number 6
n

Crash Rate Example
350 crashes over 5 years10,000 vehicles enter the intersection daily
Crash rate =
days/year) (365years) ( (DEV)
)(10 crashes) of(Number 6
n
= _____(350 x 106)_____ = 19.2 crashes per million vehicles
(10,000) x 5 x 365

Severity
Measures seriousness of accidents Iowa DOT (2001 values)
Fatality: $1,000,000 Major Injury: $150,000 Minor Injury: $10,000 Possible Injury: $2,500 Property damage: actual value or $2,000
if unknown

Crash Trend
Mn/DOT Traffic Safety Fundamentals Handbook

Fatality Rates in Upper Midwest
Mn/DOT Traffic Safety Fundamentals Handbook

Location of Crashes
Mn/DOT Traffic Safety Fundamentals Handbook

Crash Rates by Functional Class
Mn/DOT Traffic Safety Fundamentals Handbook

Crash Rates by Design Standard
Mn/DOT Traffic Safety Fundamentals Handbook

Crash Frequency on Mn Expressways
Traffic Safety Performance Function
Crash Density = 2x10⁻⁶(ADT)1.4632
0
5
10
15
20
25
0 10,000 20,000 30,000 40,000 50,000
Segment ADT
Cra
sh F
req
uen
cyC
rash
es p
er M
ile p
er Y
ear

Crash Frequency on Iowa Expressways
Traffic Safety Performance Function
Crash Density = 2x10⁻⁵(ADT)1.2896
0
2
4
6
8
10
12
0 5000 10000 15000 20000 25000
Segment ADT
Cra
sh F
req
uen
cyC
rash
es p
er m
ile
per
ye
ar

Crash Type Distribution
Mn/DOT Traffic Safety Fundamentals Handbook

Crash Rate per Accesses
Mn/DOT Traffic Safety Fundamentals Handbook

Crash Rates by Intersection Control
Mn/DOT Traffic Safety Fundamentals Handbook

Crash Type by Intersection
Mn/DOT Traffic Safety Fundamentals Handbook

Improving Safety 3 aspects
Driver Driver training Blood alcohol limits Speed limits Driver license restrictions
Road Design Maintenance operational
Vehicle Vehicle design has improved Air bags Better tires

Introduction to Economics Economics is the study of scarce resources.
Micro Economics is concerned with individual consumers and producers and groups of producers and consumers known as markets
Macro Economics is concerned with economic aggregates or the economy as a wholeMicro Economics Macro EconomicsPricing UnemploymentDemand InflationSupply Monetary policy

Elements of Economic Systems
Scarcity – all goods and services have relative degrees of scarcity
Activities Consumption of goods or services Production, conversion of inputs to
outputs Exchange – trading objects for other
objects

Markets – Demand-Supply Relationships
Demand Curves – The relationship between price and quantity consumed.
Price
Quantity

Characteristics of Demand Demand refers to a relationship
Quantity demanded refers to a point in the relationship
Demand is a reflection of wants and not needs
Demand curve defines what people would do when faced with certain conditions
Quantity demand is a function of time Demand curves slope downward to the
right

Market demand
Individual 1 Individual 2 Market Demand
Q1 Q2 Q3 Q4
P1
P2
Q1+Q3 Q2+Q4
2. Market Demand consists of two or more demanders of a good

Characteristics of Demand Market demand always has a slope that is
greater or equal to individual demand curves Price elasticities of demand is a
measurement of the relative relationship between price and quantity demand. Slope is no good because it is dependent on scale
DD
1
10
0
10
d
PPP
QQQ

Arc Elasticity
$6.00
$4.00
12 18
5.133.0
5.0
646
121812
Q
P
P
Q
P
P
Q
QPoint Elasticity

Properties of Elasticities Dimensionless Demand elasticities are always negative Demand elasticities are discussed in terms
of absolute valueLess then 1 = inelasticEqual to 1 = unitary elasticGreater than 1 = elastic
The elasticity of demand curves change across the entire range of the curve

Elasticity of Demand Curves
2/
)(
Function Demand
pq
Price
Quantity
1
Region Elastic
p
1
Region Inelastic
p
Unit Elasticity

Constant elasticity
0
0.5
1
1.5
2
2.5
3
3.5
0 5 10 15 20 25
5.13 PQ
5.3 PQ

Elasticity
Q
P
P
Q
P
P
QElasticityPo
Qint
5.13
*5.4
5.4
3
5.1
5.2
5.2
5.1
P
PP
PP
Q
PQ
p

Elasticity
DP*
- EP
Infinitely Elastic Demand

Elasticities
Would you expect transportation to be elastic or inelastic?
How would elasticities vary in the short and long runs?

Gasoline demand in the short run and the long run
DSR
DLR
People tend to drive smaller and more fuel efficient
cars in the long-run
Gasoline

Supply Curves The relationship between price and the
quantity produced Characteristics of Supply
Supply is a relationship but quantity supplied refers to a specific point along a supply curve
Supply defines what a producer would actually do, not what he or she would like to do.
Quantity supplied is always measured in time units.
Supply curve for normal goods slope upward and to the right

Supply – Demand analysis The study of supply – demand relationships
with respect to change
Problem – How do you know if you identified two points on a supply or a demand curve
Analysis of supply and demand can be done with either time series or cross sectional data
D
D
SS’
S’
D’
D’
D
DS
S

Time series Examining a phenomena's change through
time Changes in prices related to a good’s
demand. For example, price of gasoline is related to
demand for new cars (demand shift) Changes in prices of related to a goods
supply. For example, better opening a parralle route
would reduce congestion and, hence, change shift supply (supply shift)
Changes in income levels (demand Shift)

Cross-Section Analysis Changes in the real price of a good.
For example, changes in the real price of service as locations from different distances are examined (supply shift)
Changes in the real prices of alternative good. For example, the quantity of auto travel demand
relative the available of transit (demand shift) Change in income levels of cross sections
(demand shift)

Equilibrium Markets
q1
p1
q2
p2
q3
p3

Network Equilibrium
The paths through the network represent an equilibration between supply and demand

Wardrop’s principles Wardrop's first principle states: The journey times in
all routes actually used are equal and less than those which would be experienced by a single vehicle on any unused route. Each user non-cooperatively seeks to minimize his cost of transportation. The traffic flows that satisfy this principle are usually referred to as "user equilibrium" (UE) flows, since each user chooses the route that is the best. Specifically, a user-optimized equilibrium is reached when no user may lower his transportation cost through unilateral action.

Wardrop’s principles Wardrop's second principle states:
At equilibrium the average journey time is minimum. This implies that each user behaves cooperatively in choosing his own route to ensure the most efficient use of the whole system. Traffic flows satisfying Wardrop's second principle are generally deemed "system optimal" (SO).

Marginal Quantities
1
1
10
10 Q
P
TR Revenue Marginal
icePrQuantity
Revenue Total Revenue Average
Quantity x Price Revenue Total
Q P TR AR MR
0 10 0 0 0
1 9 9 9 9
2 8 16 8 7
3 7 21 7 5
4 6 24 6 3
5 5 25 5 1
6 4 24 4 -1
7 3 21 3 -3
8 2 16 2 -5
9 1 9 1 -7
10 0 0 0 -9

25
0
0 5 10
Total Revenue

p
q
10
10 5
AR
MR
66.06
41)6,4(
5.14
61)4,6(
15
51- 1
10
)5,5(
Demand ofty Elasticiti
d
QP
QP
P
Q
QP
Q
P
P
QQP
d
d
Average quantity is falling the marginal quantity is below the average.Average quantity is rising the marginal quantity is above the average Quantity.
Related Documents