TRANSPORTATION DEMAND MANAGEMENT – UNIVERSITY OF BRITISH COLUMBIA (UBC) U-PASS – A CASE STUDY BY SARAH ADEE WU EDO BREEMEN IDA MARTIN BRYAN MARK Date: April 2004

Welcome message from author
This document is posted to help you gain knowledge. Please leave a comment to let me know what you think about it! Share it to your friends and learn new things together.
Transcript
TRANSPORTATION DEMAND MANAGEMENT –
UNIVERSITY OF BRITISH COLUMBIA (UBC) U-PASS –
A CASE STUDY
BY SARAH ADEE WU EDO BREEMEN IDA MARTIN BRYAN MARK Date: April 2004

2

Table of Contents:
Abstract………………………………………………………………………………5
1.0 Introduction ............................................................................................................6
1.1 Transportation: Canada in a global context…………………………………8
1.2 A regional context ………………………………………………………….10
1.3 Tranportation demand management: an overview ………………………….14
1.4 Traffic dynamics in Vancouver ……………………………………………..16
1.5 Unlimited access programs ………………………………………………...26
1.6 UBC specific background information ……………………………………..30
2.0 A closer look at the UBC U-Pass program ……………………………………….35
2.1 tranportation programs at UBC …………………………………………….35
2.2 analysis of traffic count data ………………………………………………..37
2.2.1 UBC population and growth ………………………………………37
2.2.2 Analysis of trend to and from UBC ……………………………….38
2.2.3 Analysis of person trips by mode to and from UBC ………………39
2.2.4 Analysis of trip rates by mode to and from UBC …………………41
2.2.5 Analysis of mode split to and from UBC ………………………….46
2.3 Comparison of UBC transportation pattern with UBC OCP commitment…48
3.0 Other U-Pass programs ………………………………………………………….53
3.1 University of Wisconsin, Milwaukee ………………………………………54
3.2 University of Washinton, Seattle …………………………………………...58
3.3 Univeristy of California, Los Angles (UCLA) ……………………………..63
3

3.4 University of Colorado, Boulder …………………………………………...70
3.4.1 Student U-Pass ……………………………………………………70
3.4.2 Faculty and staff Eco-Pass ………………………………………...72
3.5 Eco-Pass in Santa Clara Valley (Silicon Valley) ……………………………75
3.6 How should U-Pass programs be compared? ………………………………77
3.7 Comparison of other U-Pass programs to the UBC U-Pass ……………….79
4.0 UBC U-Pass program survey ……………………………………………………83
4.1 Survey on students responses on the UBC U-Pass program ………………..83
4.1.1 Method ……………………………………………………………83
4.1.2 Survey Design …………………………………………………….83
4.2 Summary of responses ……………………………………………………...85
4.2.1 Responses for different modes ……………………………………85
4.2.2 Summary of mode splits for different residential areas …………..92
5.0 Analysis ………………………………………………………………………….97
5.1 Brief summary of findings ………………………………………………….97
5.2 Possible explanations ………………………………………………………97
5.3 Shortcomings of our study ………………………………………………….99
5.4 Further research …………………………………………………………...101
5.5 Recommendations for transportation at UBC ……………………………..101
6.0 Conclusions …………………………………………………………………….103
4

Abstract:
This thesis examines the effects of a pre-paid transit program called the U-Pass on
the community of University of British Colombia (UBC). Mode split data are
examined for UBC and four other universities at which a U-Pass is employed. UBC
had the overall highest transit ridership rate but the lowest increase in transit ridership
from implementing the U-Pass. Most of the increase in ridership came from previous
car-pool riders also known as high occupancy vehicle (HOV) riders. Single occupancy
vehicle (SOV) riderhip declined only 9% with the implementation of the U-Pass, less
than the goals of the program. A rough survey of 200 people was conducted to look
more closely at the effects of the U-Pass on the student body at UBC. There was
agreement with the statement that “The U-Pass makes UBC a more attractive
university” even among SOV commuters. The most common comment on the survey
was that the busses were overcrowded. SOV users tended to live in places where transit
was inconvenient (required two or more transfers to get to UBC). With enrolment
increasing every year the U-Pass is a helpful program in managing congestion.
However it can not be the complete solution to this problem because it does not
dramatically increase the level of public transit service nor does it address land use
issues.
5

1.0: Introduction
In September of 2003 the University of British Colombia (UBC) implemented
a pre-paid transit fare system for students known as the U-Pass as part of their strategic
transportation plan (STP). This system gives unlimited pre-paid access to all students
at UBC to all three zones of the Vancouver public transit system. There was a student
referendum in 2002 in which students approved a mandatory student fee increase of
$20/month for the U-Pass package. This package included not only fare-free access to
transit services across Vancouver but also increased bus service to UBC, especially at
off peak times, as well as other transportation infrastructure improvements such as
secure bike storage areas. In September of 2003, after U-Pass implementation the
busses to UBC were noticeably more crowded than before the U-Pass. The busses were
so crowded that it was, and still is, common for an overcrowded bus to pass by people
waiting at a bus stop to get to UBC. Some students who commute by car to UBC were,
and still are, grumbling about paying $80/term for a service which they do not use.
TREK, the administrative body at UBC in charge of transportation is calling the U-Pass
a great success. In this thesis we attempt to examine from a variety of angles a system
which affects every UBC student: the UBC U-Pass
There is not an overarching thesis question but rather a number of questions
aimed at more closely examining the UBC U-Pass system and its implications.
These questions are:
• What are the stated goals of the TREK program and how do they fit into a
global and regional context?
6

• How have the UBC U-Pass and other TREK initiatives changed the mode split
and parking demand of student commuters?
• How does the UBC U-Pass program compare to other U-Pass programs?
• How has the U-Pass affected UBC students’ lives?
• Does the U-Pass have other applications outside of the UBC setting?
• Are there better ways than a U-Pass to manage student transportation to school?
• How has the U-Pass changed traffic patterns in Vancouver?
The following methods were used in trying to answer these questions:
• Analyzing mode split data
• Research from journals on other U-Pass systems
• Interviews with Trek and Greater Vancouver Regional District (GVRD)
• Attending a public meeting of GVRD
• Conducting a survey on student thoughts
• Looking at transportation models in the GVRD
The thesis starts with background information on the problems associated with
high single occupancy vehicle (SOV) usage, some statistics for the GVRD and some
ways in which the city of Vancouver hopes to alleviate these problems. We then look at
the theory behind U-Pass systems and why they are implemented. Next we take a more
in-depth look at the UBC U-Pass, examining mode split data, conducting a survey on
student opinion, looking at parking data, and examining the costs of the program. After
7

that we look at how UBC compares to other U-Pass Universities. We then ask TREK
and Translink a few probing questions, and finish with our analysis of how the U-Pass
is affecting life and traffic in the UBC region with some recommendations on what
should happen in the future.
1.1 Transportation: Canada in a global context
Cars are so important to the average Canadian household that they spend an
average of $7 600 per year- three months average Canadian wage- just to keep their car
operable.1 Cars are convenient, comfortable, enjoyable, and a quick and easy way to
transport people and goods. In a car there are no bus schedules and routes to constrain
travel, and no weary legs or rain soaked bicycling gear. They allow access to jobs and
amenities that would be harder to reach by other means and have allowed an
unparalleled level of mobility.
Canadians have one of the highest rates of car ownership in the world, with close
to one vehicle for every two Canadians.2 Not only do Canadians own many cars but we
use them often. Cars account for 74% of trips in urban areas in Canada.3 This high use
of the automobile brings with it certain economic, social, and environmental costs not
1 “Quick Facts: Cost of Driving” TREK UBC. www.trek.ubc.ca 2“2001 Ontario Road Safety Annual Report
Canadian Motor Vehicle Traffic Collision Statistics 2001”
http://www.safety-council.org/info/traffic/stats2001.html
3 John Pucher and Christian Lefevre, The Urban Transportation Crisis in Europe and North America, (London: MacMillan Press 1996.)
8

covered by the automobile driver such as climate change, car accidents, air pollution
and traffic congestion. In many cities in Europe the percentage of trips taken by car is
half as large as is customary in North American cities. Below is a table of urban
mode-split by country.
Table 1.1
Mode Split in Urban Areas 4
Car Transit Cycling Walking Other
Austria 39% 13% 9% 31% 8%
Canada 74% 14% 1% 10% 1%
Denmark 42% 14% 20% 21% 3%
France 54% 12% 4% 30% 0%
Germany 52% 11% 10% 27% 0%
Netherlands 44% 8% 27% 19% 1%
Sweden 36% 11% 10% 39% 4%
Switzerland 38% 20% 10% 29% 3%
UK 62% 14% 8% 12% 4%
USA 84% 3% 1% 9% 2%
The design of many European cities is more conducive to public transit, cycling, and
walking trips. For this reason, a short term goal of emulating the mode-split of a Swiss
4 John Pucher and Christian Lefevre, The Urban Transportation Crisis in Europe and North America, (London: MacMillan Press 1996)
9

city in a Canadian city might not be realistic. It is useful however to know that there are
examples of industrialized countries in which the car plays a more minor role in urban
transportation.
1.2: A regional context
In Vancouver where 5.5 to 6 million person trips are made each day, the car
plays an important and growing role in urban transportation. The GVRD has the
highest car ownership rate in Canada. Forty-five percent of all trips are made by SOV
and another 29% are made with private vehicles including at least 1 passenger. This
means that 74% of all trips are made by car. The remainder of trips are made by transit
(11%) bicycle (2%) and by walking (12%). Of Canada’s major cities, Vancouver has
the lowest rate of transit ridership.5 A poll published in the Vancouver Sun showed that
47% of Lower Mainland citizens considered transportation to be the “most important
local issue facing residents”6. The political pressure to improve Vancouver’s traffic is
mounting. Building roads is limited by space. Below are some Vancouver specific
statistics taken from the Better Environmentally Sound Transportation (BEST) Fact
sheets on our dependence on the automobile and the effect of that dependence.
5“Transportation, Air Issues and Human Health” Pollution Probe. April 29th 2003. http://www.pollutionprobe.org/Happening/pdfs/transportconf/town.pdf 6 “Transportation Facts” Better Environmentally Sound Transportation. http://www.best.bc.ca/
10

BEST fact sheet Greater Vancouver transportation stats:
• There are approximately 5.5 million person-trips per day in the GVRD
• Travel times in the last decade have increased due to worsening congestion.
The average trip time has increased by 33 per cent - 20 minutes instead of 15.
"Rush hours" are 33 per cent longer - four instead of three hours in length.
• 1996 and 1999, rush-hour traffic on main roads and bridges in the GVRD
increased by eight per cent - twice the rate of the region's population growth.
(Source: TransLink, July 2002.)
• Congestion has caused transit speeds to slow by seven per cent during the past
decade. In the rush hour, one 40-foot bus can take the place of 21 cars, which
can occupy as much as 1,700 feet of a moving traffic lane. (Source: TransLink,
July 2002.)
• There were 1.2 million registered motor vehicles on Greater Vancouver roads
as of 1999 and that number is expected to increase by 60% in the next 20
years. (Source: Environment Canada. 2001. Pacific and Yukon Region
Environmental Indicators."Smog over the Lower Fraser Valley of British
Columbia." http://ecoinfo.org/env_ind/region/smog/smog.htm)
• Transportation is the single largest source of GHG emissions in Canada,
accounting for about 25% of Canada’s total emissions in 1997. The sector also
accounted for the largest share of the growth of emissions between 1990 and
1997. (Source: Government of Canada. Climate Change 2000 Backgrounder.
11

February 2000; “Vision and Balance: Report of the Canada Transportation Act
Review.” June 2001. Minister of Public Works and Government Services
Canada.)
• In his latest report on air quality, the Chief Medical Health Officer for
Vancouver and Richmond says 15-150 people die every year in the Lower
Mainland from air pollution. (Source: CBC British Columbia News Online.
23 February 2001.)
• The City of Vancouver has 2,997 Hectares of roads, streets and alleys. That
equals 26.5% of the total land area of the city. In contrast Burnaby’s roads
consume 27.8% of its land while Surrey’s consume 23.2%. This does not
include parking or other automobile related land uses. (Source: City of
Vancouver, Burnaby and Surrey websites.)
These maps from Translink show morning rush hour congestion in Vancouver in 2002
and the predicted congestion in 2021.7
7“Traffic congestion in Vancouver and surrounding areas” Passe-temps.ca. http://www.passe-temps.ca/congestionmaps.html
12

Figure 1.1
13

UBC contributes to the traffic load of Vancouver by about 117,800 person
trips a day. This accounts for nearly 2% of the close to six million person
trips made in the GVRD every day.8
1.3: Transportation Demand Management: an Overview
There has been a fair amount of research on how to mitigate the effects of the
car and manage the demand for SOV transportation. Solutions range from changing the
design of the city to be more accessible without the use of a car to having pay per use
roads. Measures, actions and policies that try to change people’s travel behavior to
reduce the amount of vehicle traffic and congestion are referred to as Transportation
Demand Management (TDM) strategies.9 There are three main ways of doing this:
1) Shifting the mode of transportation from SOV to High occupancy
vehicles (HOV), public transport, or bicycles
2) Eliminating trips
3) Lowering Peak demand
The methods for accomplishing these goals are broken down into carrot (incentive) and
stick (disincentive) measures. The U-Pass is a TDM strategy.
In 1993 as part of a project entitled Transport 2021, the Greater Vancouver
Regional District (GVRD) and the Province of British Columbia produced a report
8 “ UBC TREK Program Centre: Transportation Status Report: Fall 1997-Fall 2003” Prepared by Urban Systems. March 2004. www.trek.ubc.ca 9 “Transportation Demand Management Measures and Their Application in Greater Vancouver.” Prepared by GVRD and Province of BC. March 1993.
14
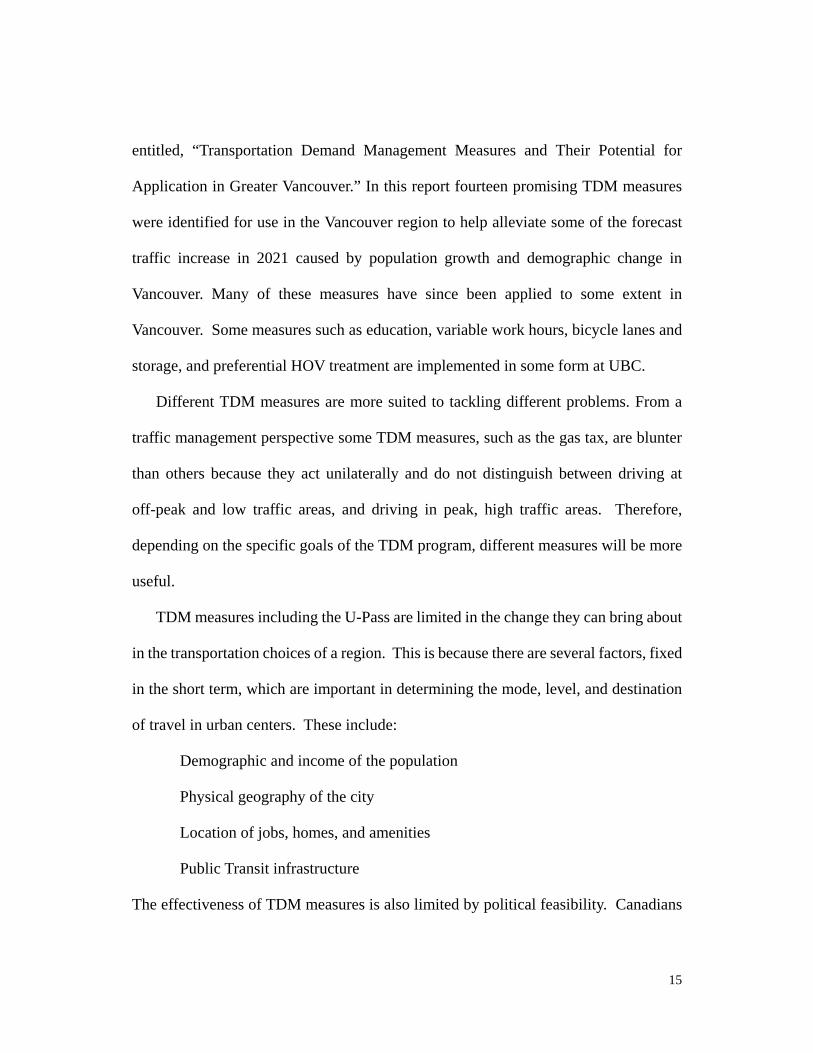
entitled, “Transportation Demand Management Measures and Their Potential for
Application in Greater Vancouver.” In this report fourteen promising TDM measures
were identified for use in the Vancouver region to help alleviate some of the forecast
traffic increase in 2021 caused by population growth and demographic change in
Vancouver. Many of these measures have since been applied to some extent in
Vancouver. Some measures such as education, variable work hours, bicycle lanes and
storage, and preferential HOV treatment are implemented in some form at UBC.
Different TDM measures are more suited to tackling different problems. From a
traffic management perspective some TDM measures, such as the gas tax, are blunter
than others because they act unilaterally and do not distinguish between driving at
off-peak and low traffic areas, and driving in peak, high traffic areas. Therefore,
depending on the specific goals of the TDM program, different measures will be more
useful.
TDM measures including the U-Pass are limited in the change they can bring about
in the transportation choices of a region. This is because there are several factors, fixed
in the short term, which are important in determining the mode, level, and destination
of travel in urban centers. These include:
Demographic and income of the population
Physical geography of the city
Location of jobs, homes, and amenities
Public Transit infrastructure
The effectiveness of TDM measures is also limited by political feasibility. Canadians
15
have come to expect free roads, inexpensive parking, and affordable gasoline. “Stick”
policies often put price tags on commodities such as rush hour road space which were
previously free. Even though transportation is often sited as the #1 problem facing
Vancouver, there is still public resistance to more taxes, road pricing, and increases in
parking costs.
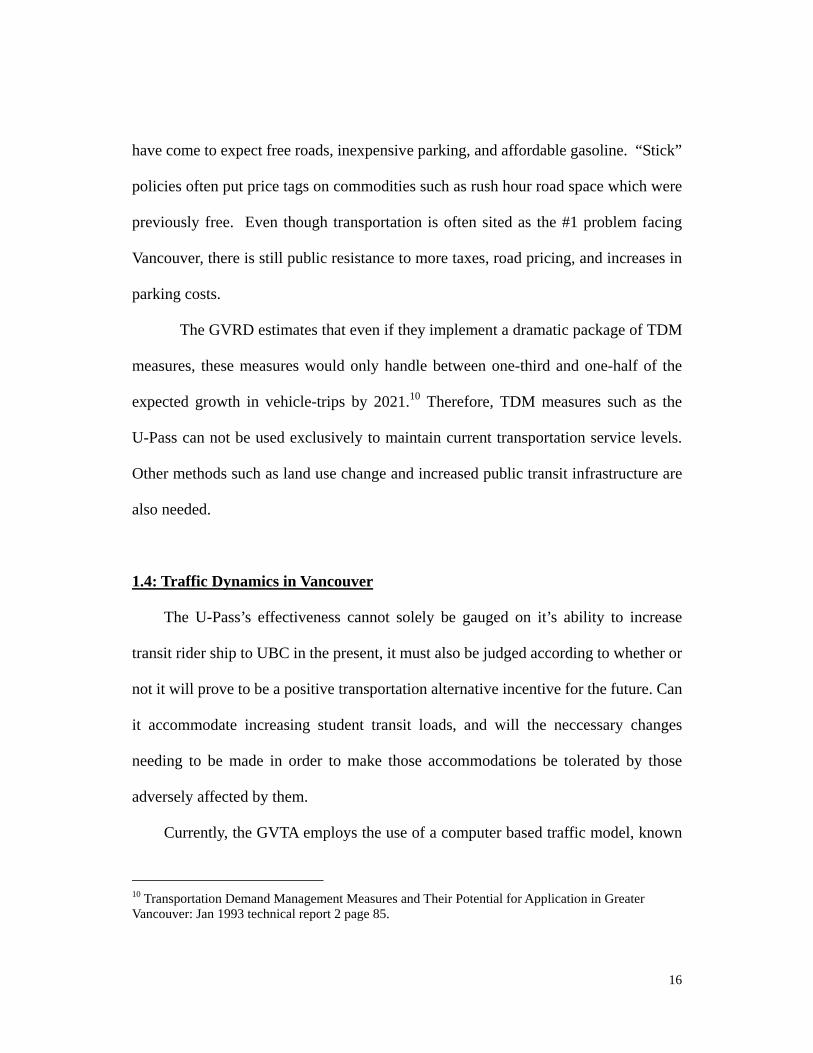
The GVRD estimates that even if they implement a dramatic package of TDM
measures, these measures would only handle between one-third and one-half of the
expected growth in vehicle-trips by 2021.10 Therefore, TDM measures such as the
U-Pass can not be used exclusively to maintain current transportation service levels.
Other methods such as land use change and increased public transit infrastructure are
also needed.
1.4: Traffic Dynamics in Vancouver
The U-Pass’s effectiveness cannot solely be gauged on it’s ability to increase
transit rider ship to UBC in the present, it must also be judged according to whether or
not it will prove to be a positive transportation alternative incentive for the future. Can
it accommodate increasing student transit loads, and will the neccessary changes
needing to be made in order to make those accommodations be tolerated by those
adversely affected by them.
Currently, the GVTA employs the use of a computer based traffic model, known
10 Transportation Demand Management Measures and Their Potential for Application in Greater Vancouver: Jan 1993 technical report 2 page 85.
16

as the EMME/2 model, to monitor vehicle flow rates within the city. It was designed in
1991 in British Columbia and has become world reknowned for its flexibility in
interpreting traffic dynamics. The fundamental strength of this model is that it allows
for the incorporation of accute local information such as employment, population,
roads, bus routes and other specific features of an urban environment. The City of
Vancouver regularly consults the EMME/2 when making political decisions that may
affect the way in which traffic operates in this city.
An original goal of this project was to incorporate the model into our study of the
U-Pass by looking at how its outputs for traffic flow have changed since the program’s
implementation. It was eventually discovered that a mere comprehension of the
EMME/2’s structure would have demanded a thesis project of it’s own. Making things
more complicated was the fact that to date there have been no official publications on
how the U-Pass has specifically affected the model, a fact verified by a telephone call
to the Engineering Services department of the city. Therefore, with nothing concrete to
go by, it was decided that a general overview of some of the more obvious factors
which do have an effect on the traffic dynamic of Vancouver would be more relvant to
the goals of this report. These included:
• Population growth of UBC student body, staff, “university town” residents,
and of the GVRD in general
• Political trends & changes in land zoning regulations
17

• Property value (and consequently rental rate) increases in the area surrounding
UBC
• Residential distribution of student body
• Possible changes to the current transportation network infrastructure
Growth of student body & Vancouver populations
It is estimated that with the increasing availability of placements, UBC’s student
population is increasing at the rate of 2% per year. TREK has also approximated that
60% of the student body residing off campus lives within a 10 kilometer radius of the
university11. If that trend continues, and private automobile use disincentives become
more severe as planned, the demand on transit loading capacity along the 4 streets
leading to UBC (4th, Broadway, 16th, & SW Marine Dr.) will become increasingly more
difficult for the city to cope with. The UBC planning document, the OCP, states that the
on campus population will double in the next twenty years.12
Translink busses operate on the same road network as private and commercial
vehicles and therefore are limited in service by the congestion levels of these vehicles,
especially during peak hours. If Vancouver’s population almost doubles in the next 4013
11Dr. Ken Denike and Mr. Andrew Murphy. “UBC Year 2000 Transportation Survey”
Department of Geography, U.B.C. October 18th. (17-18) 12 UBC Planning, The Official Community Plan, 1997. 13 Baxter, David and Jim Smerdon. “Housing Metropolitan Vancouver's Population:Demographics and
Long Run Housing Demand, 1999 to 2040”. The Urban Futures Institute Report 42, November 1999.
(2-3)
18

years, as it is expected to, there will undoubtedly be higher volumes of non-transit
vehicles traveling on sections of the links leading to UBC, particularly on those east of
Kitsilano as areas west of this community (under current zoning regulations) exhibit a
lower potential to facilitate significant increases in residential densities. Along the
current Broadway line, the efficiency of B-Line service might become notably
marginalized if the combination of increased numbers of trolleys with increased
numbers in personal automobiles continues to amplify congestion levels.
Political Factors
Factoring into this bottleneck traffic-jam problem is the issue that the sandwiched
neighborhoods between UBC and east of Granville are composed of some of the most
expensive real-estate in Vancouver, making it difficult for the GVRD to make any
serious infrastructure changes in the area. It is hard to imagine that someone who has
just purchased a home a few blocks off Broadway would be willing to quietly accept a
drastic change in transport land use policy that might significantly depreciate the value
of their property. This is known as the NIMBY factor, an acronym standing for “Not in
my backyard”. The question then is: How much of an increase in UBC-link transport
capacities and what methods are property owners in the bottleneck willing to withstand
before voicing a collective opinion of opposition? Not very much. Various businesses
19

located in the upper W.10th business district have already started to express concern
about UBC students who drive to the last B-Line stop before UBC (Sasamat & W.10th),
and park nearby. Although the problem here does not have to do directly with noisey
busses travelling through a quiet neigborhood, it is just as irritating for residents having
to deal with a lack of parking in front of their house when a normally available spot is
being used by a university student “shuttling” into campus. This is essentially a
question of public concern over land-use, which is in turn a concern that may
ultimately be addressed by political proceedings.
Land Value Factors & Projected Changes in Land Use
For students choosing to reside off campus, the quest for finding affordable and
convenient housing is not easy one. Most prefer to live in the area comprising West
Point Grey, Kitsilano, Mt. Pleasant, and Dunbar/Shaugnessy14.
Property values in these areas are currently experiencing dramatic increases as is
exemplified by the fact that a property a few blocks South from the Safeway near the
UBC Gates rose in worth by $100,000 over the past 5 years. As a consequence student
rent is also increasing, making the process of choosing a living location more
complicated, especially with the initiation of the U-Pass program. It is possible that the
14Dr. Ken Denike. “Travel Patterns to and from UBC and Response of Market Segments Collected via
an Internet Web-based Scenario.” Department of Geography, UBC
August 31st, 1998. (4.)
20

residential distribution of off-campus students will change dramatically with
modifications to the quality of rapid transit to UBC.
If transit traveling times from outlying areas of the GVRD are eventually brought
down to levels currently experienced within the 10km radius of UBC, there would be
more of an economic incentive for students to locate in the cheaper suburbs15. The
downside of this trend is that the relocation could play a role in increasing suburban
fringe sprawl which is considered to be taxing on the natural environment for the
reason that it takes more energy to supply goods and services to low density
communities that high density ones.
Conversely, it is also possible that the West Side will be further re-zoned to allow
more neighborhoods with double-lots than are already allowed for in the west Kits
neighborhood. This would increase the number of rentable units proximate to UBC
and keep rental costs level to a slower increase. Double-zoning typically adds to the
value of a property so from a political and economic standpoint, such a reform is
positive16. Doing this would also serve to curtail the spread of fringe sprawl, and
increase the potential for more sustainable micro-communities.
15 Berechman, J. “Public Transit Economics & Deregulation Policy”. Elsevier Science Pub. Amsterdam,
1993. (28-30) 16 Berechman, J. “Public Transit Economics & Deregulation Policy”. Elsevier Science Pub. Amsterdam,
1993. (27)
21
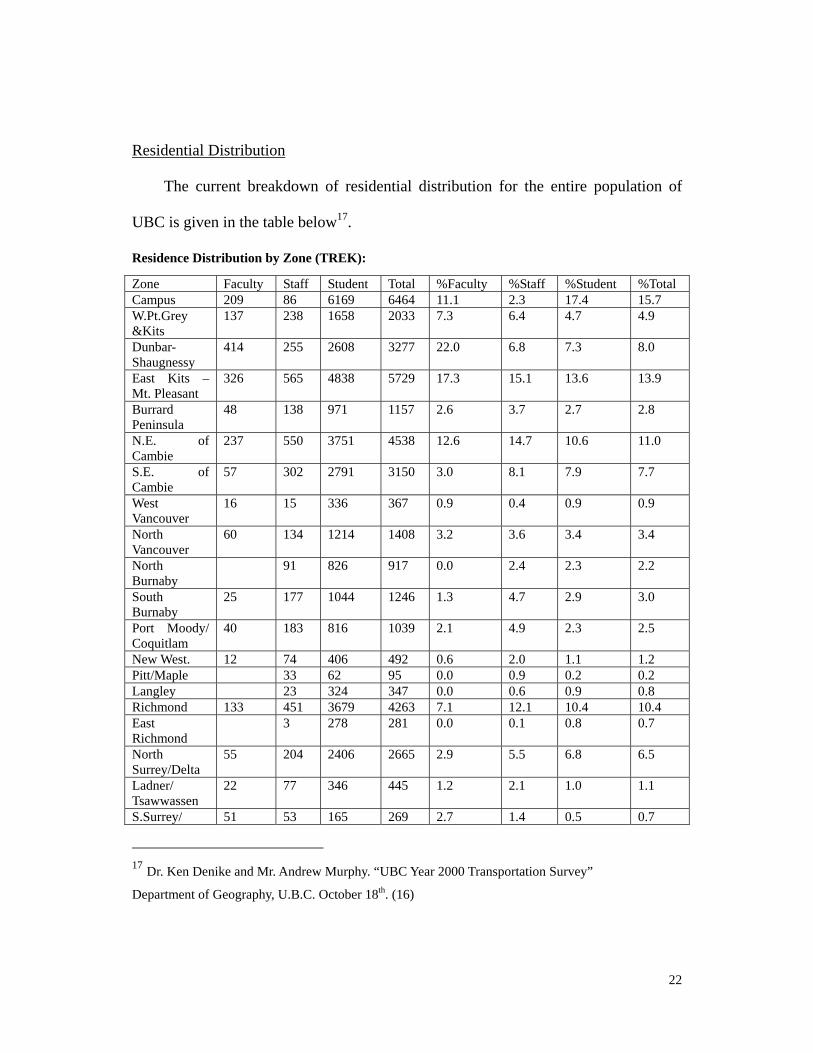
Residential Distribution
The current breakdown of residential distribution for the entire population of
UBC is given in the table below17.
Residence Distribution by Zone (TREK):
Zone Faculty Staff Student Total %Faculty %Staff %Student %Total Campus 209 86 6169 6464 11.1 2.3 17.4 15.7 W.Pt.Grey &Kits
137 238 1658 2033 7.3 6.4 4.7 4.9
Dunbar- Shaugnessy
414 255 2608 3277 22.0 6.8 7.3 8.0
East Kits – Mt. Pleasant
326 565 4838 5729 17.3 15.1 13.6 13.9
Burrard Peninsula
48 138 971 1157 2.6 3.7 2.7 2.8
N.E. of Cambie
237 550 3751 4538 12.6 14.7 10.6 11.0
S.E. of Cambie
57 302 2791 3150 3.0 8.1 7.9 7.7
West Vancouver
16 15 336 367 0.9 0.4 0.9 0.9
North Vancouver
60 134 1214 1408 3.2 3.6 3.4 3.4
North Burnaby
91 826 917 0.0 2.4 2.3 2.2
South Burnaby
25 177 1044 1246 1.3 4.7 2.9 3.0
Port Moody/ Coquitlam
40 183 816 1039 2.1 4.9 2.3 2.5
New West. 12 74 406 492 0.6 2.0 1.1 1.2 Pitt/Maple 33 62 95 0.0 0.9 0.2 0.2 Langley 23 324 347 0.0 0.6 0.9 0.8 Richmond 133 451 3679 4263 7.1 12.1 10.4 10.4 East Richmond
3 278 281 0.0 0.1 0.8 0.7
North Surrey/Delta
55 204 2406 2665 2.9 5.5 6.8 6.5
Ladner/ Tsawwassen
22 77 346 445 1.2 2.1 1.0 1.1
S.Surrey/ 51 53 165 269 2.7 1.4 0.5 0.7
17 Dr. Ken Denike and Mr. Andrew Murphy. “UBC Year 2000 Transportation Survey”
Department of Geography, U.B.C. October 18th. (16)
22

White Rock Outside Area 7 41 445 493 0.4 1.1 1.3 1.2 No Zone 33 48 374 455 1.8 1.3 1.1 1.1 Total 1882 3741 35507 41130 100 100 100 100
It is apparent that roughly 60% of the total and student commuting populations
live in Vancouver within a 10 km radius of the campus. About 5% live in West and
North Van, 12% in the municipalities from North Burnaby to Langley, and 23% in
Richmond to Surrey/Ladner. Although limited data is available it does appear,
according to 1998 and 2000 surveys carried out by TREK and Ken Denike of UBC
Geography, that there has been a slight increase in the proportion of students residing
in Vancouver and Richmond over the past 5 years. This trend can partly be attributed
to the implementation and constant improvement of the B-Line program which has
greatly increased the convenience of using public transport to commute to UBC. The 2
main B-Line corridors servicing UBC are the 98 and 99 routes, serving
Richmond/Burrard and Broadway Station/UBC respectively. It is however more likely
that the proportional increase is primarily the result of general population increase and
densification of Vancouver as its capacity to accommodate new recruits has not yet
reached a threshold.
Changes to the transportation network infrastructure
Planned Alternatives (to be implemented by 2010) affecting commutes to UBC
include:
23

• The highly controversial construction of a Richmond Airport Vancouver (RAV)
rapid transit line.
• New ~120 person capacity fast ferries in Burrard Inlet servicing areas of West
Vancouver
• The creation of a new rapid transit corridor extending from New Westminister
and Port Coquitlum into the City of Vancouver18.
The RAV line is being viciously scrutinized as it involves a nightmare of technical
planning and problem solving, will cost about $1.7 billion to complete, will be operated
and maintained by a private firm, and poses a threat to the value of residences adjacent
to where it is proposed to run. It’s construction will also detract from the quality of the
Port Coquitlum corridor as costs will far exceed those of a conventional RTL
(significant sections of the RAV line will run underground beneath False Creek and the
streets of Vancouver.
The proposed fast ferries on the other hand may prove to be very effective in
alleviating some of the peak hour down-town and bridge traffic caused by students
commuting from North and West Van. The drawback to this type of transit though is
that because of trip time and frequency limitations, the new boats may only be really
useful for those students having relatively flexible schedules.
*Both the RAV line and the fast ferries have just been approved for funding under a 4
18 GVRD. “2005 - 2007 Three-Year Plan& 10-Year OutlookStrategic Transportation Plan Amendment December 2003” (6-7)
24

billion dollar federal grant authorized by Prime Minister Paul Martin.
Unplanned Options for rapid transit to UBC:
There are three generally accepted alternative mode options for rapid transit to UBC:
• Existing articulated bus rapid transit vehicles
• Guided surface light rail transit (LRT)
• An underground extension of the skytrain (essentially a subway link)
Comparison of these modes by cost is shown in the following table19: Mode Capital Costs Operating Costs
per Vehicle Hour
Operating Costs
per Passenger Km
Max Daily
Rider Capacity
Articulated Bus ~$90 million $69 $0.051 97,000
LRT ~$800 million $100 $0.025 140,000
Skytrain ext. ~500 million $125 $0.023 150,000
The GVRD 10-year outlook report has stated that while the transportation
authority is not currently planning an upgrade to either LRT or Skytrain ext. from the
B-Line system, it does acknowledge that by 2013 the demand for transit loading along
links to UBC may exceed the supply at which time a switch will need to be made from
the existing method of constantly increasing B-Line service. From a NIMBY
standpoint the most desirable of these options would be the underground skytrain
19 City of Vancouver. “Skytrain Expansion in Vancouver: A City Perspective”: http//www.city.vancouver.bc.ca/tran/compare_options.htm
25
extension. It also seems like this would be the best choice in terms of being able to
buffer higher volumes of students commuting to UBC for a longer period of time as its
max rider capacity exceeds those of the other two modes.
1.5: Unlimited Access Programs
Unlimited access programs, an innovative TDM measure, provide unlimited,
pre-paid use of a public transportation system at a low cost to the user. There are over
70 universities and colleges across North America which currently have an unlimited
access program. The programs are growing rapidly with only a handful of programs in
existence 10 years ago.
Jeffrey Brown et al. conducted a survey on university administrations who chose
to implement a U-Pass program. He found that the main reasons universities chose to
implement a U-Pass program were to:
1) Reduce the demand for parking,
2) Increase students’ access to housing and employment,
3) Help universities recruit and retain students,
4) Reduce the cost of attending college,
5) Increase transportation equity.20
There are other factors that can be at play in choosing to implement an unlimited access
20 Fare-free public transit at universities - An evaluationBrown J, Hess DB, Shoup D JOURNAL OF
PLANNING EDUCATION AND RESEARCH 23 (1): 69-82 FAL 2003
26
program. These include:
1) Improving town-gown relations -traffic congestion in the neighborhoods
surrounding a campus often leads to conflict between the town and the
university.
2) City by-laws coupling development with transportation amelioration-
Universities that wish to expand might face pressure from the local government
to provide measures to alleviate traffic congestion.
3) Green image and environmental concerns- The image of a university is
important in recruiting students and obtaining government funding. If the
Kyoto protocol is ratified, universities would be able to trade carbon credits
from the reduction of GHG emissions associated with the U-Pass program.
The most common reason given for implementing an unlimited access program
remains to reduce parking demand. There are several problems associated with parking
supply. Parking is expensive to build, it takes up valuable space, and it is not visually
appealing. The costs associated with increasing the parking supply are not trivial. The
following example from the University of Colorado demonstrates how an expensive
staff U-Pass program can be cost effective.
“The faculty/staff bus pass program at the University of Colorado provides an
instructive example of reduced parking supply costs. This program allows each
permanent faculty or staff member who is eligible for benefits to ride local and
regional buses and light rail by showing his or her university identification.
27

Because some employees have reduced the number of times they drive to
campus or stopped driving to campus because of the availability of free transit,
some parking spaces are freed up—a total of 350. The annual cost of the bus
pass program is $393,400; it costs $1,125 per parking space left open. For
comparison, the annual debt service to provide one additional parking space is
$2,723. Thus, it is 2.5 times as expensive to provide one additional parking
space compared to reducing demand by one space. The net annual savings to
campus, compared to providing 350 new spaces, is thus $560,000”
(University of Colorado Environmental Center 2002, pp. 18–19)21
See also figure 3.4.2 later in the paper which further analyzes parking demand
savings by starting a U-Pass program.
The University administration is not the only organization which benefits from
having a fare free transportation system. The Transportation provider benefits as well.
It benefits by:
1) Increased transit ridership
2) A source of guaranteed revenue
3) Overall improvements to transit service which benefit and attract non
U-Pass customers.
21 Toor, Will. “The Road Less Traveled: Sustainable Transportation for Campuses.” Published on line at
http://www.colorado.edu/cuenvironmentalcenter/temp/The_Road_Less_Traveled.pdf
28

In 1997 a survey by Donald Shoup et al. looked at the average cost and change in
ridership of the 70 programs in existance in North America at the time.
The universities’ average cost for Unlimited Access was $30 US per student per
year. Student transit ridership increased between 50 percent and 200 percent during the
first year of Unlimited Access, and continued to increase 2-10% annually in
subsequent years.22
How are the universities able to offer such low per student costs on a universal bus
pass when monthly equivalents available to the public are so much higher?
The U-Pass can maintain its low cost relative to monthly bus passes because in most
programs the U-Pass card is given to all students whether or not they will use the bus,
whereas a monthly bus pass is purchased only by people who intend to use the bus
frequently. An average student will use the bus less frequently than the average bus
pass holder and so a U-Pass system can have a lower cost per student than a regular bus
pass.
The list of universities and colleges that have implemented the U-Pass is diverse.
Some institutions are in a large city, others are in a small town or a suburb. Some of the
institutions are large others are small. Some of the universities are responding mainly
to traffic congestion when implementing the U-Pass while others are concerned about
parking space.
22 Brown, Jeffrey et. al., “Unlimiteed Access” Transportation 28: 233-237, 2001. Netherlands, Kluwer
Academic Publishers.
29

1.6: UBC specific Background information:
As part of the Official Community Plan (OCP) TREK, the transportation body
at UBC-which is responsible for implementing the U-Pass was founded in 1997. Their
mission and mandate appear below.23
• Our mission is to:
o Improve your transportation choices by promoting sustainable
transportation at UBC.
• Our mandate is to:
o Reduce Single-Occupant Vehicle (SOV) trips and increase transit
ridership by 20%;
o Make UBC the lead agency in implementing a 'U-TREK Card', a
universal transportation pass for students, faculty, and staff;
o Coordinate goods movement and reduce truck traffic to and from
campus; and
o Act as a resource for UBC students, faculty, staff, & visitors.
o TREK: Trip Reduction, Research, Education, and Knowledge.
TREK was born out of the OCP’s section outlining the transportation element of
23 “TREK UBC: About Us” www.trek.ubc.ca
30

the development plan. Below is a copy of the transportation portion of the
Memorandum of Understanding, a document which contains specific goals in the areas
set out by the OCP.24
Transportation:
UBC WILL:
1.1 Transportation Demand Management
Building on its Transportation Demand Management (TDM) success to date and
placing emphasis on strategic partnerships, UBC will pursue the GVRD's goal of
reducing SOVs by 20%. UBC will also pursue a complementary goal of increasing
ridership on BC Transit to UBC by 20% by the date of the first OCP review.
The University is prepared to be the lead agency in creating a U-Pass system in
collaboration with the City of Vancouver, BC Transit and UBC neighbours.
UBC will develop and implement, as a top priority, a comprehensive and integrated
transportation management strategy. This strategy will include a staged
implementation plan and will be completed prior to adoption of the first area plan.
In order to accomplish these goals, UBC will immediately take the following actions:
a) Develop and implement, with the cooperation of BC Transit, a U-Pass system
24 “Memorandum of Understanding: Transportation” from the Official Community Plan at UBC. www.ocp.ubc.ca
31

specifically for UBC and commit initially $250,000 per year towards this system,
starting with the 1998/99 fiscal year. These revenues will come from increases to the
parking fees beyond those in the recently approved parking and transportation business
plan for the University. As the U-Pass system is defined and funding requirements
determined, UBC will pursue additional necessary resources to achieve the 20%
reduction in single occupant vehicles, with disputes as to what is required referred to
the GVRD-UBC Task Force.
b) Research and define the "markets" for a U-Pass system at UBC by identifying and
quantifying the travel requirements of University students and personnel. This work
will be carried out by a transportation expert drawing on the expertise and experiences
of the University of Washington's U-Pass System. This study could be undertaken
jointly with the City of Vancouver, the GVRD and BC Transit as an example for the
rest of the region and as a test of the validity of the "20%" targets
described above. UBC expects to share the significant databases currently available to
their strategic partners in this initiative.
c) Open negotiations immediately with BC Transit to design a unique U-Pass system
for UBC that can be put into operation by September 1999. This should give BC
Transit adequate time to secure additional buses or to reallocate resources to take
advantage of the resultant increased demand on UBC destination routes.
32
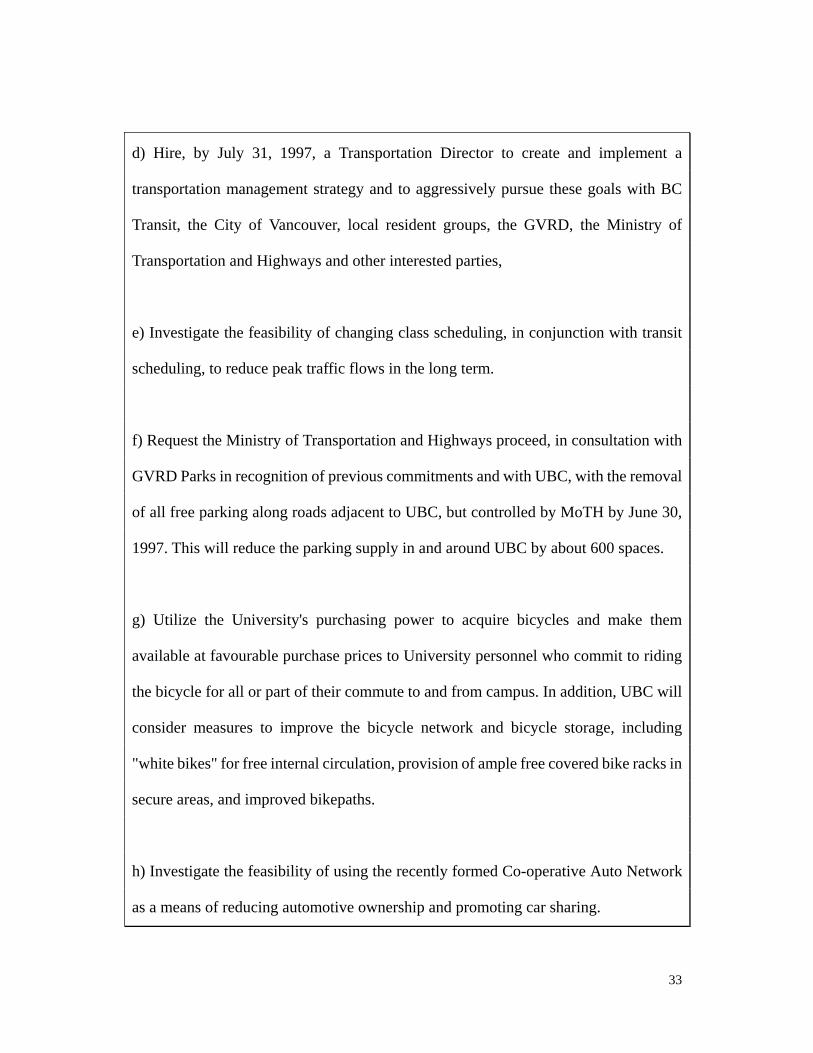
d) Hire, by July 31, 1997, a Transportation Director to create and implement a
transportation management strategy and to aggressively pursue these goals with BC
Transit, the City of Vancouver, local resident groups, the GVRD, the Ministry of
Transportation and Highways and other interested parties,
e) Investigate the feasibility of changing class scheduling, in conjunction with transit
scheduling, to reduce peak traffic flows in the long term.
f) Request the Ministry of Transportation and Highways proceed, in consultation with
GVRD Parks in recognition of previous commitments and with UBC, with the removal
of all free parking along roads adjacent to UBC, but controlled by MoTH by June 30,
1997. This will reduce the parking supply in and around UBC by about 600 spaces.
g) Utilize the University's purchasing power to acquire bicycles and make them
available at favourable purchase prices to University personnel who commit to riding
the bicycle for all or part of their commute to and from campus. In addition, UBC will
consider measures to improve the bicycle network and bicycle storage, including
"white bikes" for free internal circulation, provision of ample free covered bike racks in
secure areas, and improved bikepaths.
h) Investigate the feasibility of using the recently formed Co-operative Auto Network
as a means of reducing automotive ownership and promoting car sharing.
33

i) Continue promotion of telecommuting by University personnel.
j) Continue UBC's Transportation Committee and ensure that it has representation from
neighbouring communities.
k) Establish, as part of the transportation planning process, specific benchmarks for
the mutually supportive transportation goals of reducing single occupant vehicles by
20% as set out in the OCP and increasing transit ridership by 20%, through
development of a methodology and travel surveys during the fall of 1997. This work
will be carried out in consultation with GVRD, the City of Vancouver, BC Transit, the
Ministry of Transportation and Highways, and other interested parties.
34

2.0 A Closer Look at the UBC U-Pass Program
2.1: Transportation Programs at UBC
Since the adoption of the OCP in 1997, UBC has implemented a number of other
transportation programs and modifications intended to achieve the OCP objectives,
including carpooling programs, modification of class start-time, bicycle lanes/racks on
campus, and a guaranteed ride home program.
• Modification of Class Start-time in September 2001
In order to spread transit demand in the morning peak hours, UBC has
spread out the morning class start-times from the previous existing
campus-wide 8:30am start-time to classes beginning at 8:00am, 8:30am and
9:00am. Since the implementation of this modification, the peak is now
spread over a longer period in the morning (shown in Figure 2.1) and spreads
out the overcrowding situation on buses.
• Parking Supply and Costs
UBC has implemented a number of changes in parking supply and costs
since 1997: (1) roadside parking on SW Marine Drive, 16th Avenue and other
roadways leading into campus has been decreased; (2) part of the B-lot
parking area was removed for housing construction; (3) B-lot parking cost
has increased from $2.00 to $4.00 per day.
35

Figure 2.1 Transit Arrival and Departure Profile (Fall 1997 and Fall 2003)
• Increase of Transit Service Since 1997
Transit service to and from UBC each day has increased since 1997,
including increase service in Route 99-B Line, Route 44 express from
downtown, and all day service on Route 480 from Richmond Center.
• Improvements to Bicycle Facilities and Services
In order to increase the number of cyclists riding to and from UBC, new
bicycle lanes have been constructed on several roadways leading to UBC and
new bicycle racks and lockers have been added on-campus.
36

• UBC Carpooling/Vanpooling Program
The UBC Carpooling Program was implemented in 2001 to help
commuters organize carpools in an effort to reduce the number of SOV
coming to campus. Discounts on parking permits and rewards such as gift
certificates and vehicle maintenance vouchers are given to drivers who join
the program. There is also a vanpooling program available at UBC through
the Jack Bell Foundation.
2.2: Analysis of the Traffic Count Data
2.2.1: UBC Population and Growth
Based on the full- and part-time enrollment, staff and faculty, UBC’s daytime
population has increased from 42,300 in 1997 to 50,800 in 2003, a 20% increase in the
UBC population (shown in Table 2.1)
Table 2.1 - Annual Daytime Population Growth at UBC25
1997 1998 1999 2000 2001 2002 2003
Total Population at UBC
(headcount) 42,300 43,430 44,750 44,700 46,100 49,000 50,800
Overall Growth 20%
25 Urban Systems Ltd. Transportation Status Report – Fall 1997 to Fall 2003. UBC TREK Program Center. Mar. 2004. 10 Mar 2004. <http://www.trek.ubc.ca/>
37

2.2.2: Analysis of Travel To and From UBC
To represent how people are traveling to/from UBC, person trips are used. A
person trip is a one-way trip, to/from UBC, made by a single person. For example, a
student traveling to and from UBC once per day would count as two person trips. From
1997 to 2003, there has been an increase of 11,700 person trips (11%), but part of this
increase is due to population growth. Therefore, in order to take into account the
growth of the UBC population, trip rates are used when comparing changes in travel
patterns. The trip rate is the number of person or vehicle trips per person at UBC. From
1997 to 2003, the trip rate to/from UBC has decreased 7.6%. This means that fewer
person or vehicle trips were made per person in the Fall of 2003. The data is
summarized in Table 2.2.
38

Table 2.2 Analysis of Total Trips To/From UBC by Year (24-hour period)26
Fall Fall Fall Change from Change from Change from
1997 2002 2003 1997 to 2002 2002 to 2003 1997 to 2003
Total Daily Number
of Person Trips 106,100 113,500 117,800 7,400 7.0% 4,300 3.8% 11,700 11.0%
Annual Daytime Total
Population at UBC 42,300 49,000 50,800 6,700 15.8% 1,800 3.7% 8,500 20.1%
Trip Rates To/From UBC
(24-hr person trips per capita) 2.51 2.32 2.32 -0.19 -7.7% 0.0026 0.1% -0.19 -7.6%
2.2.3: Analysis of Person Trip by Mode To and From UBC
To determine how people have changed their mode of transportation to/from UBC
campus, it is necessary to compare the yearly travel mode data (summarized in Table
2.3). Changes in person trips by mode to/from UBC show whether or not UBC has
achieved its OCP commitments (further discussed in Section 2.5). The following are
person trip changes by mode from 1997 to 2002, from 2002 to 2003 (before and after
implementation of the U-Pass), and, overall, from 1997 to 2003:
• Single-occupant vehicle (SOV) person trips have increased 2,400 (5.2%) from
1997 to 2002, decreased 3,400 (7.0%) from 2002 to 2003, and, overall,
26 Urban Systems Ltd. Transportation Status Report – Fall 1997 to Fall 2003. UBC TREK Program Center. Mar. 2004. 10 Mar 2004. <http://www.trek.ubc.ca/>
39
decreased 1,000 (2.2%) from 1997 to 2003.
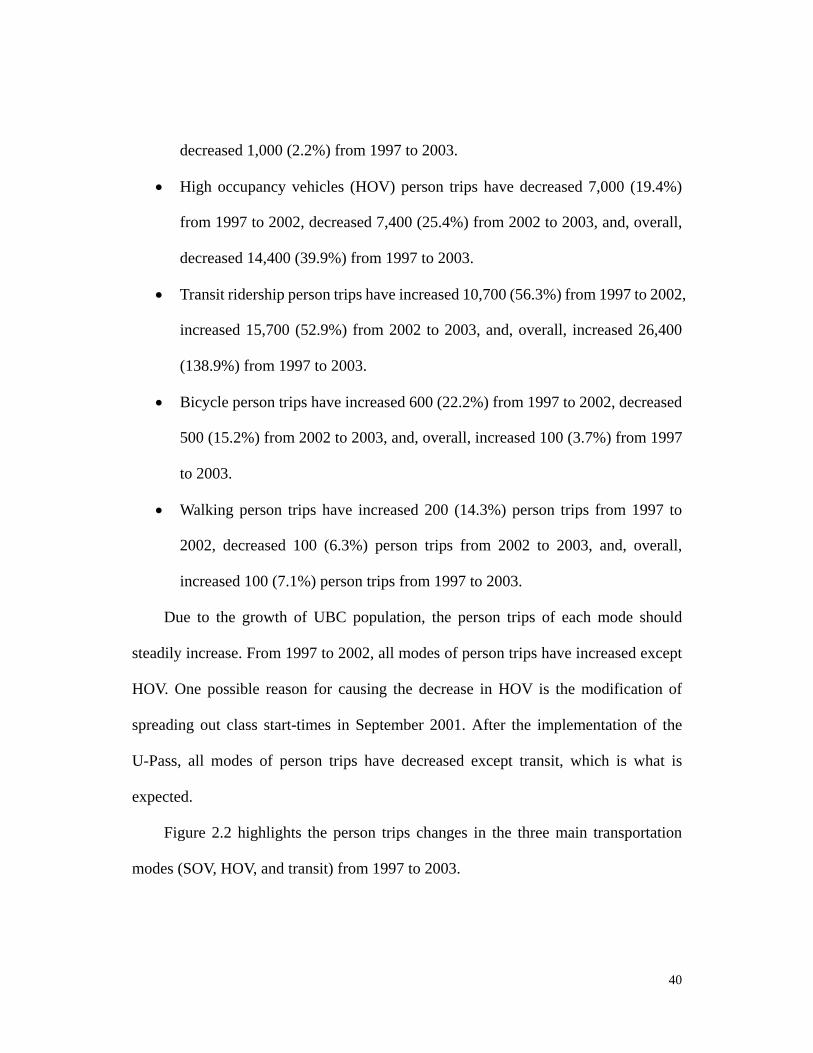
• High occupancy vehicles (HOV) person trips have decreased 7,000 (19.4%)
from 1997 to 2002, decreased 7,400 (25.4%) from 2002 to 2003, and, overall,
decreased 14,400 (39.9%) from 1997 to 2003.
• Transit ridership person trips have increased 10,700 (56.3%) from 1997 to 2002,
increased 15,700 (52.9%) from 2002 to 2003, and, overall, increased 26,400
(138.9%) from 1997 to 2003.
• Bicycle person trips have increased 600 (22.2%) from 1997 to 2002, decreased
500 (15.2%) from 2002 to 2003, and, overall, increased 100 (3.7%) from 1997
to 2003.
• Walking person trips have increased 200 (14.3%) person trips from 1997 to
2002, decreased 100 (6.3%) person trips from 2002 to 2003, and, overall,
increased 100 (7.1%) person trips from 1997 to 2003.
Due to the growth of UBC population, the person trips of each mode should
steadily increase. From 1997 to 2002, all modes of person trips have increased except
HOV. One possible reason for causing the decrease in HOV is the modification of
spreading out class start-times in September 2001. After the implementation of the
U-Pass, all modes of person trips have decreased except transit, which is what is
expected.
Figure 2.2 highlights the person trips changes in the three main transportation
modes (SOV, HOV, and transit) from 1997 to 2003.
40

Figure 2.2 Person Trips at UBC (24-hr period)27
0
20,000
40,000
60,000
80,000
100,000
120,000
140,000
1997 1998 1999 2000 2001 2002 2003
Fall Fall Fall Fall Fall Fall Fall
Year
Per
son
trip
s
Motorcyles, other
Heavy Trucks
Pedestrians
Bicycles
Transit
HOV
SOV
2.2.4: Analysis of Trip Rates by Mode To and From UBC
The following are trip rate changes by mode from 1997 to 2002, from 2002 to
2003 (before and after implementation of the U-Pass), and, overall, from 1997 to 2003:
• SOV trip rate has decreased 9.2% from 1997 to 2002, increased 10.3% from
2002 to 2003, and, overall, increased 18.5% from 1997 to 2003.
27 Urban Systems Ltd. Transportation Status Report – Fall 1997 to Fall 2003. UBC TREK Program Center. Mar. 2004. 10 Mar 2004. <http://www.trek.ubc.ca/>
41

• HOV trip rate has decreased 30.4% from 1997 to 2002, decreased 28.1% from
2002 to 2003, and, overall, decreased 49.9% from 1997 to 2003.
• Transit ridership trip rate has increased 34.9% from 1997 to 2002, increased
47.4% from 2002 to 2003, and, overall, increased 99.0% from 1997 to 2003.
• Bicycle trip rate has increased 5.5% from 1997 to 2002, decreased 18.2% from
2002 to 2003, and, overall, decreased 13.6% from 1997 to 2003.
• Walking trip rate has decreased 1.3% from 1997 to 2002, decreased 9.6% from
2002 to 2003, and, overall, decreased 10.8% from 1997 to 2003.
From 1997 to 2002, the numbers of SOV and HOV trips per person has decreased,
and the number of transit and bicycle trips per person has increased. This is due to
people increasingly using transit and bicycle instead of SOV and HOV. From 2002 to
2003, all modes of transportation have decreased except transit. Even though the
implementation of U-Pass has caused SOV and HOV trip rates to decrease, it has also
decreased bicycle and walking trip rates, which is not what was intended.
42

Table 2.3 Person Trips and Trip Rates at UBC (24-hr period, Fall 1997 - Fall 2003)28
Fall Fall Fall Change from Change from Change from
Mode
1997 2002 2003 1997 to 2002 2002 to 2003 1997 to 2003
SOV 46,000 48,400 45,000 2,400 5.2% -3,400 -7.0% -1,000 -2.2%
HOV 36,100 29,100 21,700 -7,000 -19.4% -7,400 -25.4% -14,400 -39.9%
Transit 19,000 29,700 45,400 10,700 56.3% 15,700 52.9% 26,400 138.9%
Bicycles 2,700 3,300 2,800 600 22.2% -500 -15.2% 100 3.7%
Pedestrians 1,400 1,600 1,500 200 14.3% -100 -6.3% 100 7.1%
Heavy Trucks 300 400 300 100 33.3% -100 -25.0% 0 0.0%
Person trips
Motorcycles, other 600 1,000 1,100 400 66.7% 100 10.0% 500 83.3%
Total 106,100 113,500 117,800 7,400 7.0% 4,300 3.8% 11,700 11.0%
Daytime campus population 42,300 49,000 50,800 6,700 15.8% 1,800 3.7% 8,500 20.1%
Trip rates SOV 1.09 0.99 0.89 -0.10 -9.2% -0.102 -10.3% -0.20 -18.5%
28 Urban Systems Ltd. Transportation Status Report – Fall 1997 to Fall 2003. UBC TREK Program Center. Mar. 2004. 10 Mar 2004. <http://www.trek.ubc.ca/>
43

HOV 0.85 0.59 0.43 -0.26 -30.4% -0.17 -28.1% -0.43 -49.9%
Transit 0.45 0.61 0.89 0.16 34.9% 0.29 47.4% 0.44 99.0%
Bicycles 0.064 0.067 0.055 0.0035 5.5% -0.012 -18.2% -0.009 -13.6%
Pedestrians 0.033 0.033 0.030 -0.00044 -1.3% -0.003 -9.6% -0.004 -10.8%
44
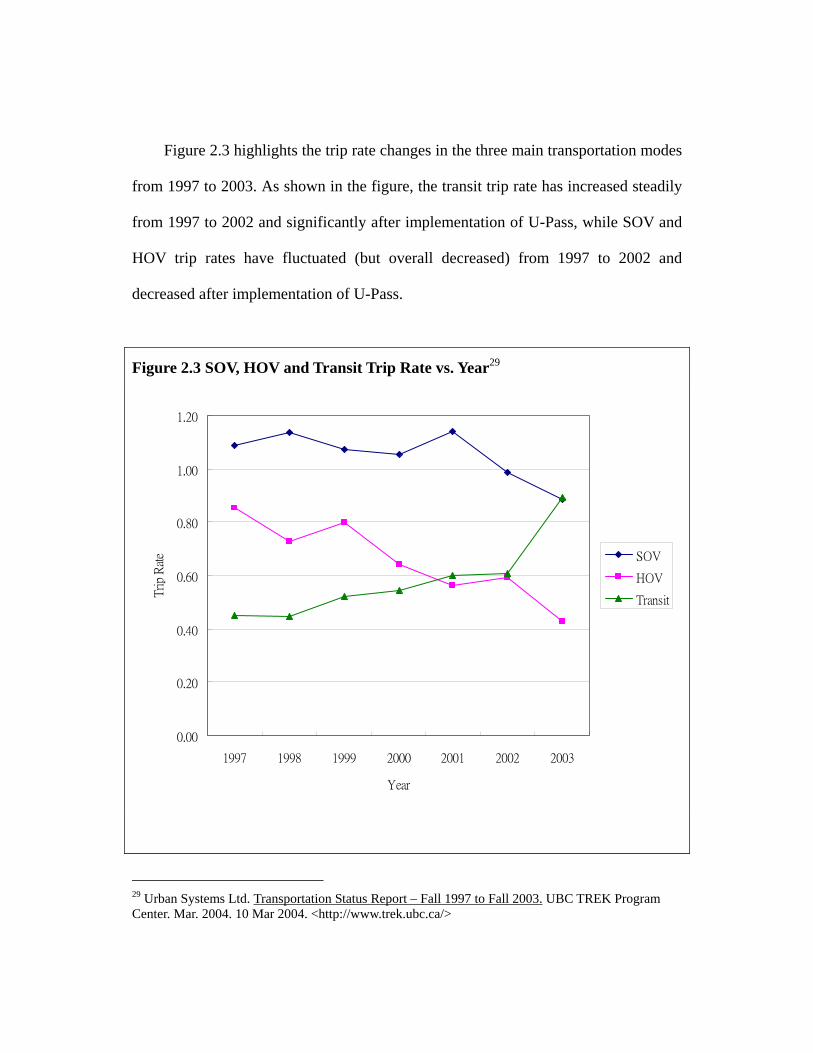
Figure 2.3 highlights the trip rate changes in the three main transportation modes
from 1997 to 2003. As shown in the figure, the transit trip rate has increased steadily
from 1997 to 2002 and significantly after implementation of U-Pass, while SOV and
HOV trip rates have fluctuated (but overall decreased) from 1997 to 2002 and
decreased after implementation of U-Pass.
Figure 2.3 SOV, HOV and Transit Trip Rate vs. Year29
0.00
0.20
0.40
0.60
0.80
1.00
1.20
1997 1998 1999 2000 2001 2002 2003
Year
Tri
p R
ate SOV
HOV
Transit
29 Urban Systems Ltd. Transportation Status Report – Fall 1997 to Fall 2003. UBC TREK Program Center. Mar. 2004. 10 Mar 2004. <http://www.trek.ubc.ca/>

2.2.5: Analysis of Mode Split To and From UBC
While person trips and trip rates analysis show the approximate number of trips
taken per person over a 24-hr period, the mode split give the relative proportions of
each travel mode used in a particular time period. The mode split data to/from UBC
(Table 2.4) shows how travel pattern to/from UBC has changed since 1997. The
following are the major changes in travel patterns:
• From 1997 to 2002, there was a shift of approximately 8% of total trips from
using the HOV as main mode of transportation to using the transit as the
main mode of transportation. Other mode shares stayed approximately the
same.
• From 2002 to present, the dominant mode of transportation has changed
from the SOV to transit. Mode shares of SOV, HOV, bicycles, pedestrians,
heavy trucks, motorcycles, and other, have decreased since 2002, and the
transit mode share has increased by 12.7% since 2002 and 21.0% since 1997.
46
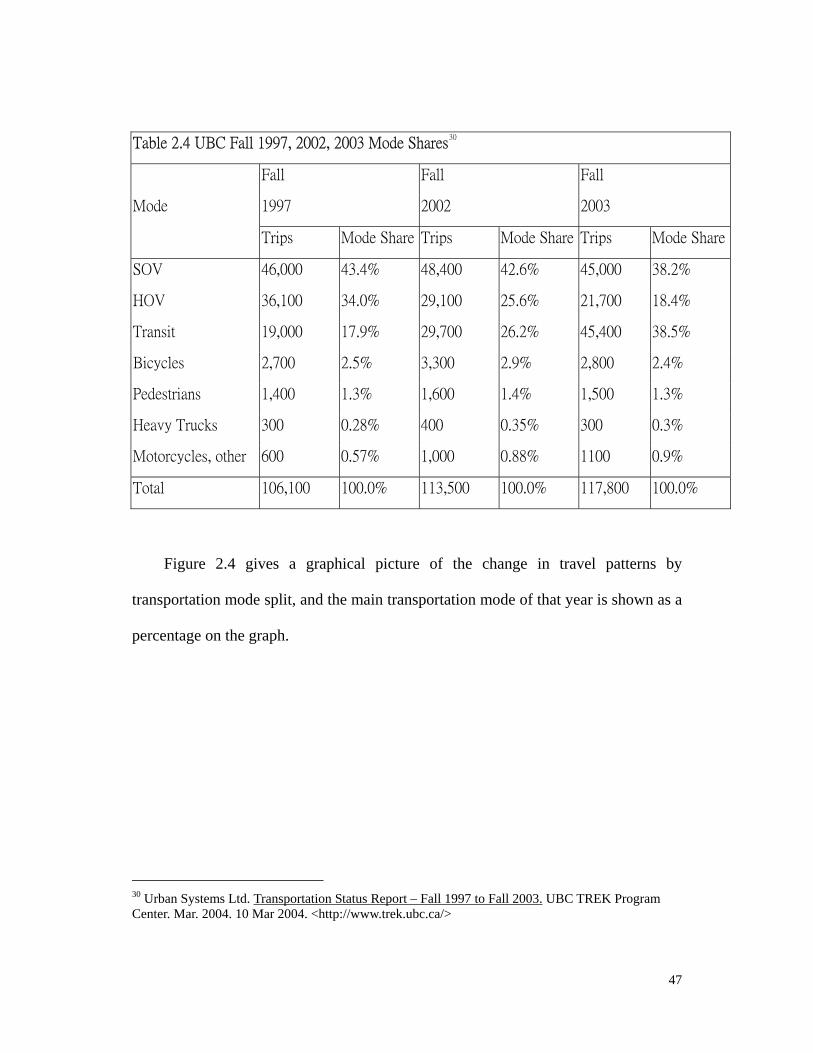
Table 2.4 UBC Fall 1997, 2002, 2003 Mode Shares30
Fall Fall Fall
1997 2002 2003 Mode
Trips Mode Share Trips Mode Share Trips Mode Share
SOV 46,000 43.4% 48,400 42.6% 45,000 38.2%
HOV 36,100 34.0% 29,100 25.6% 21,700 18.4%
Transit 19,000 17.9% 29,700 26.2% 45,400 38.5%
Bicycles 2,700 2.5% 3,300 2.9% 2,800 2.4%
Pedestrians 1,400 1.3% 1,600 1.4% 1,500 1.3%
Heavy Trucks 300 0.28% 400 0.35% 300 0.3%
Motorcycles, other 600 0.57% 1,000 0.88% 1100 0.9%
Total 106,100 100.0% 113,500 100.0% 117,800 100.0%
Figure 2.4 gives a graphical picture of the change in travel patterns by
transportation mode split, and the main transportation mode of that year is shown as a
percentage on the graph.
30 Urban Systems Ltd. Transportation Status Report – Fall 1997 to Fall 2003. UBC TREK Program Center. Mar. 2004. 10 Mar 2004. <http://www.trek.ubc.ca/>
47
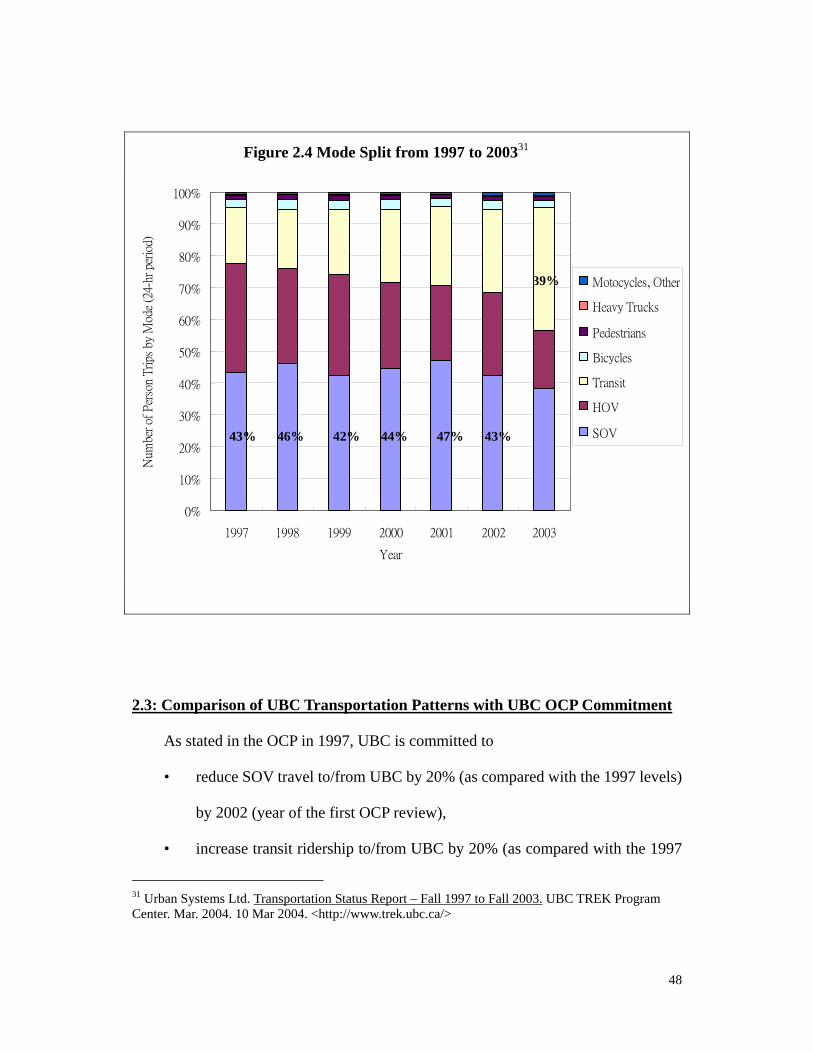
Figure 2.4 Mode Split from 1997 to 200331
0%
10%
20%
30%
40%
50%
60%
70%
80%
90%
100%
1997 1998 1999 2000 2001 2002
Year
Num
ber
of P
erso
n T
rips
by
Mod
e (2
4-hr
per
iod)
Motocycles, Other
2.3: Comparison of UBC Transportation Patterns with UB
As stated in the OCP in 1997, UBC is committed to
• reduce SOV travel to/from UBC by 20% (as compar
by 2002 (year of the first OCP review),
• increase transit ridership to/from UBC by 20% (as
31 Urban Systems Ltd. Transportation Status Report – Fall 1997 to Fall 20Center. Mar. 2004. 10 Mar 2004. <http://www.trek.ubc.ca/>
39%
Heavy Trucks
Pedestrians
Bicycles
Transit
HOV
SOV
43% 46% 43% 42% 44% 47%2003
C OCP Commitment
ed with the 1997 levels)
compared with the 1997
03. UBC TREK Program
48

levels) by 2002 (year of the first OCP review),
• reduce heavy truck (defined by the City of Vancouver’s bylaw as vehicle that
has a gross vehicle weight greater than 4500 kg and three or more axles in
tandem) travel to/from UBC,
• implement a U-Pass program.
The Fall 1997 benchmark levels and the targets and actual travel pattern for
Fall 2002 are listed in Table 2.5. The Fall 2002 targets are found by calculating a
20% reduction in SOV trips and a 20% increase in transit trips from the 1997
levels. For reducing heavy truck travel, UBC has set a limit of 300 truck trips per
day. The heavy truck trips per 24-hr period data are summarized in Table 2.6 and
Figure 2.5.
Table 2.5 1997 Benchmark, OCP 2002 Targets and 2002 Actual Travel Patterns3233
Fall 1997 OCP Fall Fall Difference between Mode
Benchmark 2002 Targets 2002 2002 and OCP Targets
SOV 46,000 36,800 48,400 11,600 31.5%
Transit 19,000 22,800 29,700 6,900 30.3%
32 UBC TREK Program Center. UBC Strategic Transportation Plan. Nov. 1999. 20 Jan 2004 <http://www.trek.ubc.ca/> 33 Urban Systems Ltd. Transportation Status Report – Fall 1997 to Fall 2003. UBC TREK Program Center. Mar. 2004. 10 Mar 2004. <http://www.trek.ubc.ca/>
49

Table 2.6 Heavy Trucks Trips To/From UBC (24-hr period, 1997-2003)34
Fall Fall Fall Fall Fall Fall Fall
1997 1998 1999 2000 2001 2002 2003
Heavy Trucks Trips 298 83 240 254 136 443 311
Figure 2.5 Heavy Truck Trips (24-hr period) from Fall 1997 to Fall 200335
0
50
100
150
200
250
300
350
400
450
500
1997 1998 1999 2000 2001 2002 2003
Fall Fall Fall Fall Fall Fall Fall
Year
Num
ber
of T
rips
34 Urban Systems Ltd. Transportation Status Report – Fall 1997 to Fall 2003. UBC TREK Program Center. Mar. 2004. 10 Mar 2004. <http://www.trek.ubc.ca/> 35 Urban Systems Ltd. Transportation Status Report – Fall 1997 to Fall 2003. UBC TREK Program Center. Mar. 2004. 10 Mar 2004. <http://www.trek.ubc.ca/>
50
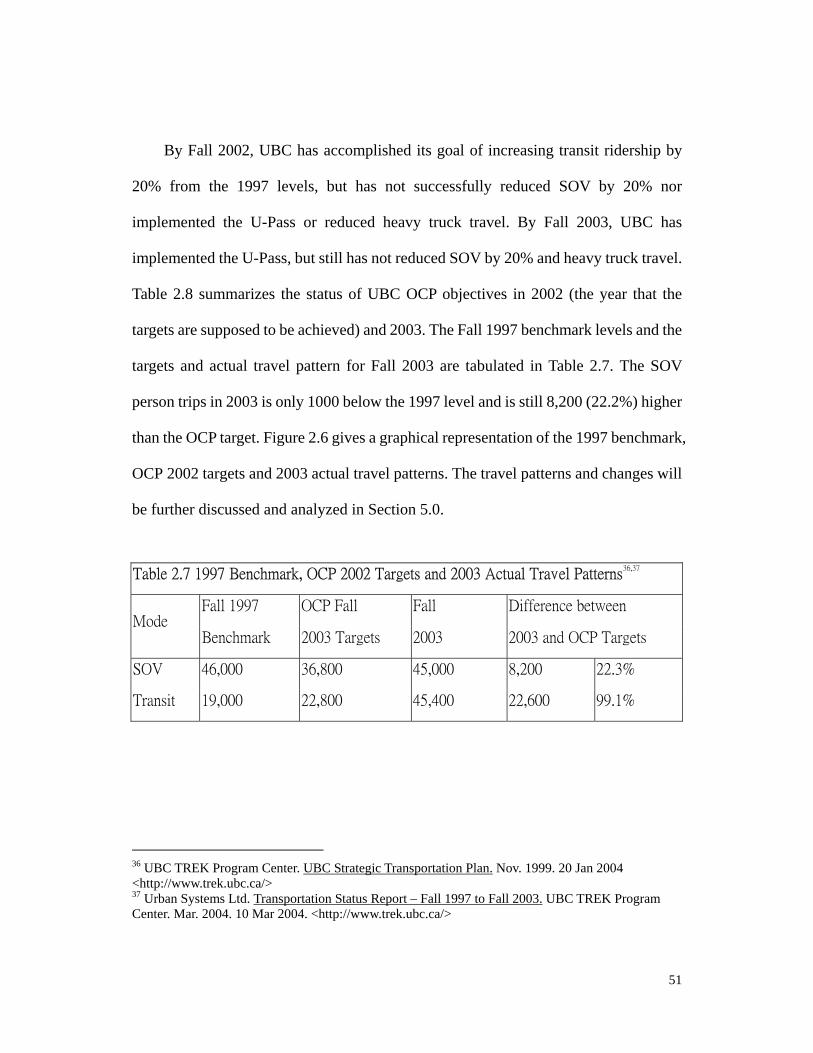
By Fall 2002, UBC has accomplished its goal of increasing transit ridership by
20% from the 1997 levels, but has not successfully reduced SOV by 20% nor
implemented the U-Pass or reduced heavy truck travel. By Fall 2003, UBC has
implemented the U-Pass, but still has not reduced SOV by 20% and heavy truck travel.
Table 2.8 summarizes the status of UBC OCP objectives in 2002 (the year that the
targets are supposed to be achieved) and 2003. The Fall 1997 benchmark levels and the
targets and actual travel pattern for Fall 2003 are tabulated in Table 2.7. The SOV
person trips in 2003 is only 1000 below the 1997 level and is still 8,200 (22.2%) higher
than the OCP target. Figure 2.6 gives a graphical representation of the 1997 benchmark,
OCP 2002 targets and 2003 actual travel patterns. The travel patterns and changes will
be further discussed and analyzed in Section 5.0.
Table 2.7 1997 Benchmark, OCP 2002 Targets and 2003 Actual Travel Patterns36,37
Fall 1997 OCP Fall Fall Difference between Mode
Benchmark 2003 Targets 2003 2003 and OCP Targets
SOV 46,000 36,800 45,000 8,200 22.3%
Transit 19,000 22,800 45,400 22,600 99.1%
36 UBC TREK Program Center. UBC Strategic Transportation Plan. Nov. 1999. 20 Jan 2004 <http://www.trek.ubc.ca/> 37 Urban Systems Ltd. Transportation Status Report – Fall 1997 to Fall 2003. UBC TREK Program Center. Mar. 2004. 10 Mar 2004. <http://www.trek.ubc.ca/>
51

Table 2.8 Status of UBC OCP Objectives38
Status as of Status as ofOCP Objective
Fall 2002 Fall 2003
20% reduction in SOV
20% increase in transit ridership
Reduction in heavy truck travel
U-Pass implementation
Figure 2.6 SOV and Transit Rider-ship Benchmark, Targets, and 2002 and 2003
Travel Patterns39,40
0
10,000
20,000
30,000
40,000
50,000
60,000
SOV T
Modes
pers
on tr
ips
1997 Benchmark
OCP Targets
Fall 2002
Fall 2003
38 Urban Systems Ltd. Transportation Status Report – Fall 1997 to Fall 2003.Center. Mar. 2004. 10 Mar 2004. <http://www.trek.ubc.ca/> 39 UBC TREK Program Center. UBC Strategic Transportation Plan. Nov. 199<http://www.trek.ubc.ca/> 40 Urban Systems Ltd. Transportation Status Report – Fall 1997 to Fall 2003.
+30.3%
+31.5%
+22.3%
ransit
UBC TR
9. 20 Jan
UBC TR
+99.1%
EK Program
2004
EK Program
52

3.0: Other U-Pass Programs
The UBC U-Pass is very similar to the systems that will be analyzed in the
following sections. After a brief outline of some of the other U-Pass programs, a
comparison of the different passes will be made.
While there are a large amount of universities that employ some type of U-Pass, in
one form or another, it is interesting to note that a very limited amount of study has
gone into analyzing the effects of these systems. Many of the programs have only
recently been implemented and perhaps, as in the case of UBC, there has not been time
for detailed analysis. Also, studies done by administrative bodies such as TREK, are
not often published and are difficult to locate. There are benefits to studying the effects
of a U-Pass program. The information gathered can be used to implement new
programs in a more effective manner, to identify the main issues underlying student
transportation decisions, and to help increase transit ridership at universities which
already have a U-Pass
Although there is no typical way to evaluate a U-Pass program, there are several
commonly used indicators of effectiveness. Modal shift patterns are of great interest in
the studies encountered while researching this paper. Also common are parking
changes, such as decline in permit purchases, spaces saved or money saved by not
needing to create more parking. Environmental effects are also briefly mentioned in
most of the studies, usually converting trips saved into a reduction in emissions of
greenhouse gas, volatile organics and particulate matter.
Center. Mar. 2004. 10 Mar 2004. <http://www.trek.ubc.ca/>
53

The quality and validity of surveys is also a matter of importance. Most of the
studies cited in this thesis conducted studies which are representative of the student
body and pose questions which can be analyzed with statistics. However, due to a lack
of time and statistical expertise, our survey is very limited in terms of its statistical
validity. The TREK survey that is currently being run will be analyzed professionally
and the results will not be available for a few years. Also, a number of the studies show
results collected at much earlier dates than would be desirable. The up-to-date versions
of these studies may not have been published yet or may not have even been conducted.
Following is an outline of 4 universities experiences with a U-Pass program.
3.1: University of Wisconsin, Milwaukee
The University of Wisconsin is located near Lake Michigan and a few miles from
the central business district. There are 11 transit routes to the University, 5 of which are
express buses. In addition to transit, the campus offers a UPARK program. This is
when a student drives to a satellite parking lot 3-5 miles away from campus and is then
shuttled to central campus. There are approximately 24,000 students attending classes
at the University. Of these, 2100 live on campus dorms while the rest live varying
distances from the university. The majority (approximately 55%) of these students
drive to school alone41. This reliance on cars has caused a lot of parking problems at
41 James Meyer and Edward A. Beimborn, “An Analysis of the Usage, Impacts and Benefits of an
Innovative Transit Pass Program”, January 14, 1998
54

the university.
In the fall of 1994, the University introduced its U-Pass program. This pass
allowed students unlimited access to the Milwaukee County Transit System (MCTS)
during school semesters. The program’s goals were to reduce single occupant vehicle
(SOV) trips, reduce parking strain and reduce the effects of traffic congestion and air
pollution. The pass fee is currently $31 US per student per semester. In order to
maintain the low per student price of the pass, students cannot opt out of the program.
Student support for the pass is very high. A survey taken in the fall of 1994 (after
implementation) shows that 90.4% of students strongly or somewhat support the
U-Pass42. In spring 1995 a follow up survey reports this dropped to 86.9%. Of all
survey respondents (from both 94 and 95) 90% said that the program should continue
to run.
There was a significant switch in mode shares (or mode split) to campus after the
implementation of the U-Pass. As can be seen by table 3.1.1, there was a large change
in transit mode split. Prior to U-Pass, 12% of students used transit whereas after the
U-Pass this rose to 26%, a 116% increase in ridership (26-12/12 x 100% = 116%).
SOV use also dropped significantly. Prior to the U-Pass, 54% of students drove to
school alone this dropped to 41% after the U-Pass was implemented. Of SOV drivers,
this is a 24% reduction.
42 James Meyer and Edward A. Beimborn, “An Analysis of the Usage, Impacts and Benefits of an
Innovative Transit Pass Program”, January 14, 1998
55

Table 3.1.1: Changes in mode-split after U-Pass implementation43
Mode Split Spring 94 Fall 94 %change
Car (SOV) 54% 41% -24%
Transit 12% 26% 116%
UPARK 17% 15% -12%
Walk 14% 16% 14%
Bike 3% 2% -33%
Table 3.1.2: Breakdown of mode split44
Spring 1994 Drive Alone MCTS Drive/ MCTS UPARK Car pool Walk/Other
Drive Alone 75.3 10.3 2.1 8.2 1.5 2.6
MCTS 9.8 70.5 1.6 3.3 4.9 9.8
Drive/MCTS 7.1 0 78.5 14.3 0 0
UPARK 19.0 8.6 3.4 58.6 1.7 8.6
Car pool 16.7 12.5 0 8.3 62.5 0
Walk/Other 5.4 27.7 0.9 2.7 0.9 62.5
The above table (3.1.2) indicates the percentage of each group that switched to
another mode. For example, the “Drive alone” row on the upper left indicates that:
75.3% remained drive alone commuters, 10.3% switched to MCTS (transit), 2.1%
chose a combination of driving and transit, etc.
43 James Meyer and Edward A. Beimborn, “An Analysis of the Usage, Impacts and Benefits of an
Innovative Transit Pass Program”, January 14, 1998 44 James Meyer and Edward A. Beimborn, “An Analysis of the Usage, Impacts and Benefits of an
Innovative Transit Pass Program”, January 14, 1998
56

The major trends to notice are the switches from the drive alone section. 10.3%
changed from driving to using transit, 8.2% began using the UPARK and another 5% or
so switched to other options. This was a 22% decrease in SOV mode split in the first
semester of the U-Pass program. 8.6% of UPARK users began using transit alone as
well. Another significant switch is the 28% of walkers who began using transit. This
trend is similarly noticed at UBC.
There are also some significant benefits to the environment as a result of the
U-Pass. From the mode split change, an estimated 221,055 vehicle trips were
eliminated to and from campus (due to drivers switching to transit). Taking into
account the average travel distance of students to the university, this reduced the
vehicle miles traveled by 5,084,265. This is only to and from campus, which fails to
take into account non-school trips made using the U-Pass, which may have been made
by car before. This reduction in car usage prevented 244 pounds of volatile organic
compounds, 264 pounds of nitrogen oxides and 1662 pounds of carbon monoxide from
being emitted daily. The emissions decrease may be slightly lower since more buses
were needed to meet increased demand. This also amounts to 242,108 gallons or
$295,371 worth of fuel saved per academic year. Based on the number of drivers
switching to transit, the U-Pass saved $1,490,000 needed for fuel, insurance and repair
costs. All of these benefits were realized by implementing the U-Pass at a cost of $1.2
million.
Students also felt that parking was easier to find. 19% said on campus parking was
easier to find and 16% said the same was true for off campus parking. Therefore not
57

only transit users benefit from the U-Pass but also drivers.
3.2: University of Washington, Seattle
The University of Washington in Seattle had an enrolment of 39,196 students in
2003. The U-Pass has been in place for a long time at the University. It was
implemented 13 years ago in 1991. The pass includes a late night shuttling service,
discounts at merchants near the campus, free carpool and vanpool parking, vanpool
subsidies and bicycle incentives. A major difference from many Universities is that the
pass at the University of Washington is not mandatory. This is because the program is
mostly funded by parking revenues, taxes and fines. The cost of the U-Pass for
students in 1990 was $20 US per academic quarter and as of 2002 was $35 US. The
U-Pass sales are shown below. This table does not take into account population
growth.
Table 3.2.1: U-Pass sales45
SALES: Year 1991 Year 2002 % change
Student 24,289 31, 367 29
Faculty 6062 9800 62
Total* 36,518 46,737 27
(*) includes complimentary passes
45 2001-02 Washington U-PASS Annual Report http://www.washington.edu/U-Pass/news_and_reports/reports.html
58

As of 2002, 86% of U-Pass holders were pleased. Of this 59% were very satisfied
and 26% somewhat satisfied.
The campus also had a problem with parking and high traffic volumes. One of the
program’s major goals was to alleviate parking and traffic troubles. By increasing
parking fees, introducing the pass and promoting telecommuting and compressed work
weeks, these goals were accomplished. Parking fees were increased by 50% in the first
year of implementation and an additional increase of 35% over the next 3 years. As of
1990 parking passes were $72 US per quarter and in 2002 rose to $196.32 US. As a
result, many people decided to switch to the U-Pass. The net result since the
introduction of the program was a decreased total use in parking spaces with an
increased campus population. These points are shown in table 3.2.2.
Table 3.2.2: Parking statistics46
SOV permits Year 1990 Year 2002
Faculty and Staff 6440 4392
Students 1027 633
Commuter Parking
Utilization
Year 1990 Year 2002
Spaces available 11,525 11,400
Average Vacant 1446 1720
Average Used 10,079 9680
Parking utilization 87% 85%
46 2001-02 Washington U-PASS Annual Report http://www.washington.edu/U-Pass/news_and_reports/reports.html
59

The university also introduced pay-per-use parking, like that at UBC, where you
pay each time you park. Drivers do not receive the savings they would on a pass, but if
they drive less often, they pay less per term for parking. If a student buys a parking
pass they also receive a free U-Pass card. This is in hopes that a driver will use the pass
on days when there is construction, bad weather or other bad driving conditions.
Drivers who are part of the U-Pass program and do not have a parking pass, can buy a
booklet of tickets that lets you pay less on parking 2 times a week. Thus drivers have
an incentive to use their cars only twice a week and take transit on the other days. To
further persuade drivers to switch, the “Hold That Spot” program was created. If a
student with a parking pass wishes to try the U-Pass, they can have their spot held for
up to 6 months in case they want to switch back to driving. This alleviates the stress of
having to re-wait through the waiting list if the U-Pass option does not work out.
Vanpools are also advertised and encouraged. All car and vanpools receive free
parking on campus at priority spots. There are numerous monetary incentives to
encourage the program including, amongst others, $40 per month for gas.
Another interesting portion of the program was that sports tickets could be used as
a transit ticket. Before this transit ridership to Husky stadium was 4.2% in 1984 and by
1997 rose to 20.6%.
Bicycle trips are also highly encouraged at the university. The U-Pass allows
students, faculty and staff discounted rates on helmets, lights, parts and repairs.
As with the Wisconsin U-Pass, there were large modal shifts at the University of
Washington following the implementation of a U-Pass.
60

Table 3.2.3: Percentage changes in mode from 1989 to 200247
Mode Faculty Staff Students*
Transit 11 to 24 25 to 36 21 to 39
Carpool/Vanpool 11 to 16 15 to 15 9 to 9
Bicycle 9 to 9 6 to 5 9 to 4
Walk 7 to 6 6 to 4 31 to 31
Other 2 to 2 4 to 2 4 to 2
Drive 60 to 43 44 to 38 25 to 16
*Note: the student mode switch to transit is not fully accounted for by switches from other modes. This
table was taken directly from the annual report where no explanation is given. The remainder may be
due to increased school population.
Note the significant decrease in all areas of SOV travel. Among faculty a 23%
reduction was noted. Staff reduced SOV travel by 6% and students decreased by 9%.
Conversely, student transit ridership was up 18%, staff up 11% and faculty up 13%.
From these modal shifts, an estimated 91 million car trips have been eliminated since
1991. Faculty car and vanpools have also increased since the U-Pass was implemented.
Carpool participation has almost doubled and vanpool participation has almost tripled
since the implementation of the U-Pass in 1990.
Despite the increased transit usage and decreased percentage of drivers, actual
vehicle trips have been increasing. This is illustrated in table 3.2.4. This
counter-intuitive fact is due to population growth. More people are attending classes
47 2001-02 Washington U-PASS Annual Report
61

than they were in 1991, but the percentage of SOV drivers amongst them has decreased.
While this represents an increased amount of pollution, it would be a larger amount if
the U-Pass was not implemented.
Table 3.2.4: Vehicle trips to and from campus48
Year 1991 Year 2002
Trips to Campus (7-9am) 6628 6738
Trips from campus (3-6pm) 8205 8951
Total Trips (24hrs) 56,316 60,010
As previously mentioned a large portion of the funding from the U-Pass is derived
from the parking fees and fines. The list of costs is shown in table 3.2.5 and the funding
in table 3.2.649.
Table 3.2.5: U-Pass costs
Operating costs $ Amount % of Cost
Admin and monitoring 341,286 3
Marketing and PR 228,814 2
Transit service contracts 10,277,761 91
Car/vanpool and ridematch 149,447 1
Night ride shuttle 198,755 2
Pedestrian/bike
improvements and other
127,160 1
TOTAL 11,323,223 100
http://www.washington.edu/U-Pass/news_and_reports/reports.html 48 2001-02 Washington U-PASS Annual Report http://www.washington.edu/U-Pass/news_and_reports/reports.html 49 2001-02 Washington U-PASS Annual Report
62

Table3.2.6: U-Pass funding sources
Funding $ Amount % of Cost
User fees 5,661,155 50
Parking Fees 4,128,578 37
Parking fine revenues 700,000 6
Other 833,490 7
TOTAL 11,323,223 100
As can be seen above, the vast majority of the cost goes to the transit authority for
providing service. In total, the U-Pass costs the University approximately $11.5
million. Half of the funding from this program comes from pass purchases. A large
portion comes from parking fines and fees. It has been a very successful system to date
in terms of reducing SOV use and increasing transit ridership and has received
numerous local and national rewards. 50
3.3: University of California, Los Angeles (UCLA)
Los Angeles is famous for its air pollution and traffic congestion. The thought of
dissuading people from driving their cars in LA would seem a daunting challenge.
However, the BruinGO program was implemented in UCLA as a trial U-Pass system.
The region has a number of transit companies, but for the BruinGO program only one
of them participated. The Santa Monica Municipal bus lines serve most of Santa
http://www.washington.edu/U-Pass/news_and_reports/reports.html 50 2001-02 Washington U-PASS Annual Report http://www.washington.edu/U-Pass/news_and_reports/reports.html
63
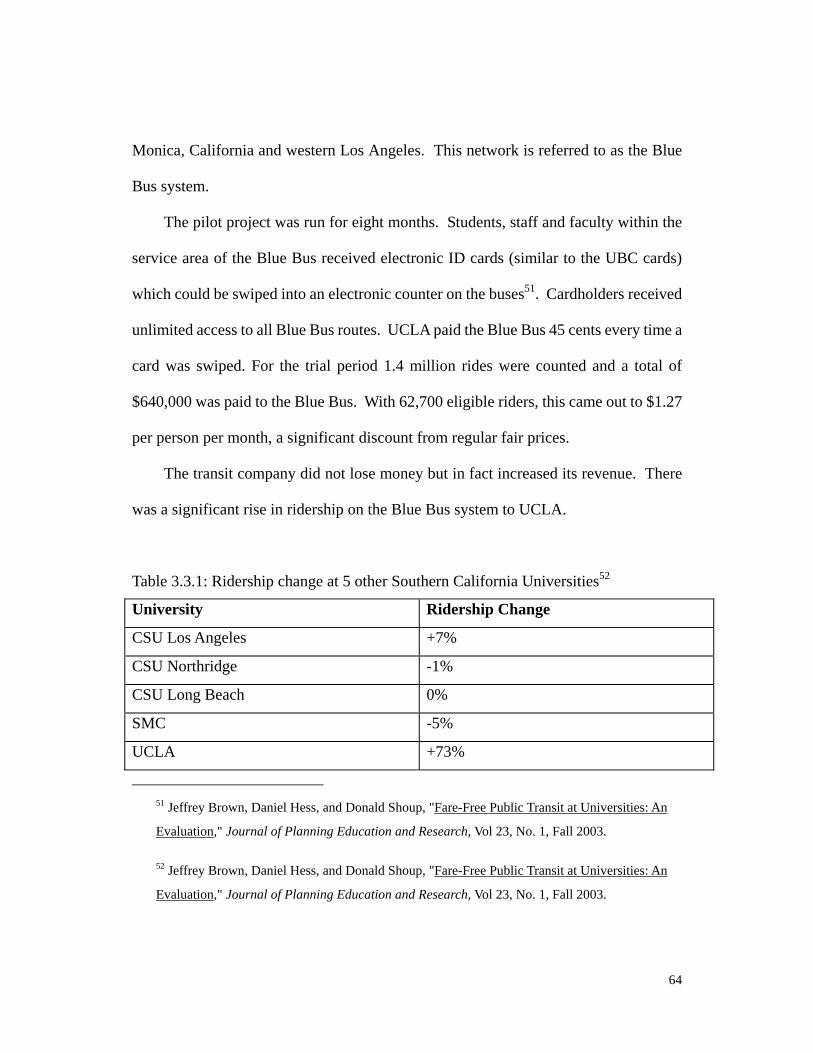
Monica, California and western Los Angeles. This network is referred to as the Blue
Bus system.
The pilot project was run for eight months. Students, staff and faculty within the
service area of the Blue Bus received electronic ID cards (similar to the UBC cards)
which could be swiped into an electronic counter on the buses51. Cardholders received
unlimited access to all Blue Bus routes. UCLA paid the Blue Bus 45 cents every time a
card was swiped. For the trial period 1.4 million rides were counted and a total of
$640,000 was paid to the Blue Bus. With 62,700 eligible riders, this came out to $1.27
per person per month, a significant discount from regular fair prices.
The transit company did not lose money but in fact increased its revenue. There
was a significant rise in ridership on the Blue Bus system to UCLA.
Table 3.3.1: Ridership change at 5 other Southern California Universities52
University Ridership Change
CSU Los Angeles +7%
CSU Northridge -1%
CSU Long Beach 0%
SMC -5%
UCLA +73%
51 Jeffrey Brown, Daniel Hess, and Donald Shoup, "Fare-Free Public Transit at Universities: An
Evaluation," Journal of Planning Education and Research, Vol 23, No. 1, Fall 2003.
52 Jeffrey Brown, Daniel Hess, and Donald Shoup, "Fare-Free Public Transit at Universities: An
Evaluation," Journal of Planning Education and Research, Vol 23, No. 1, Fall 2003.
64

The other Universities were monitored as control groups to compare against
UCLA. From this table it can be seen that a 73% increase was observed on the Blue
Bus. Compared to other Universities nearby that experienced no or slight change, this
increase is clearly the effect of the BruinGO program, since no other factors were
changed in the other Universities. After the BruinGO program was introduced, the
percentage of staff and students arriving by bus rose from 7.6% in 2000 to 13.1% in
2001. This is even more significant considering that this percentage had been falling
for the previous years.
As with the other U-Pass programs seen in this paper, the mode split change after
implementation demonstrates the effectiveness of the program.
65

Table 3.3.2: Mode split at UCLA inside the Blue Bus service area53
FACULTY AND
STAFF:
% Before BruinGo % After BruinGo % Change
Bus 9 20 134
Drive alone 46 42 -9
Car pool 13 9 -28
Vanpool 3 0 -85
Bike 4 3 -8
Walk 26 25 -5
STUDENTS:
Bus 17 24 43
Drive alone 17 12 -33
Carpool 5 4 -16
Bike 5 3 -42
Walk 43 45 3
From the above table it can be seen that a 134% change in transit ridership for
faculty and staff was observed. This large increase has promising implications for an
Eco-Pass program, which will be discussed in a later section. However, the van pool
participation at the school dropped drastically. This finding is similar to what has
occurred at UBC. Student ridership increased by 43%. Also encouraging are the
reduced number of drive alone travelers.
53 Jeffrey Brown, Daniel Hess, and Donald Shoup, "Fare-Free Public Transit at Universities: An
Evaluation," Journal of Planning Education and Research, Vol 23, No. 1, Fall 2003.
66

The study points to three reasons for ridership increase. The increase in transit
agencies revenue allows them to invest in more bus service. This increased service
then attracts more riders. Also, as people become more familiar with a bus system,
they are more likely to use it to get to destinations which they may not have before.
Lastly, some residential properties have found that properties advertising close access
to the Blue Bus are selling well to students. This supports the suggestion that the
U-Pass can affect where students choose to live. Therefore, after the implementation
of the U-Pass, there are short and long term benefits for riders, the transit system and
residential areas.
Those who drive also receive benefits from the BruinGO program. During the
program, parking usage decreased significantly. 1000 parking spaces were freed up
after implementation and the parking pass waiting list decreased. Most of the program
is funded by parking fees, permits and fines. The costs and benefits are outlined in
table 3.3.3.
67

Table 3.3.3: Costs and benefits of the BruinGO program54
Students Faculty and
Staff
University
Departments
Visitors Total
Total Cost $137,700 $202,500 $32,400 $437,400 $810,000
% of Cost 17 25 4 54 100
Reduced
fare benefits
$399,000 $125,000 0 0 $524,000
Reduced
parking
Demand
$463,000 $682,000 $109,000 $1,472,000 $2,726,000
Total Benefit $862,000 $807,000 $109,000 $1,472,000 $3,250,000
% of benefit 27 25 3 45 100
Net Benefit $724,000 $605,000 $77,000 $1,035,000 $2,440,000
As can be seen from this table the benefits significantly outweigh the costs for all
of those involved, especially students. Benefits in terms of reduced parking demand
were calculated as follows.
UCLA recently built a 1500 capacity parking structure at a cost of $47.3 million.
This comes out to $31,500 per parking space. It was thereby inferred that the
university would be willing to spend this amount per space. The BruinGO program
decreased parking demand by 1020 spaces. The percentage of spaces used by student,
faculty and staff, visitor and department parking, gives the reduced demand benefit per
54 Jeffrey Brown, Daniel Hess, and Donald Shoup, "Fare-Free Public Transit at Universities: An
Evaluation," Journal of Planning Education and Research, Vol 23, No. 1, Fall 2003.
68
group of the 1020 spaces.
The environment benefited greatly from the BruinGO program. By saving 1020
spaces, an estimated 1.5 million trips were eliminated. Using average car output, travel
distance etc. the emissions were reduced annually as follows:
• 87 tons of carbon dioxide
• 9 tons of nitrogen oxide
• 14 tons of reactive organic compounds
• 7 tons of particulate matter.
In LA this system was very successful since the transit system was running with
very low ridership levels. Therefore, the increased ridership was easily accommodated
on the existing buses. There was almost no need to increase bus service and therefore,
the emissions saved are much more realistic than seen in Milwaukee.
The system has been very well received. Student, staff and faculty comments
support this:
• “BruinGO is one of the smartest things UCLA has done in years. With this
program, I feel UCLA is finally showing it cares for students.”
• “I love the BruinGO system. I gave up my parking permit because of it!”
• “I save about 10$ weekly, getting back and forth from school. 40$ a month
buys a lot of groceries.”
• “I use the Blue Bus for meetings in Wilshire Center at least three days a week.
BruinGO saves a lot of time since I don’t have to find parking and also saves
69

UCLA money because I don’t need validation. Not to mention the Wilshire
traffic!”
3.4: University of Colorado, Boulder
3.4.1: Student U-Pass
The University of Colorado at Boulder has a student U-Pass and a faculty/staff
Eco-Pass. First, the student U-Pass will be briefly summarized. The following
information comes from Poinsatte and Toor55.
The student bus pass program arose after the University proposed two new
parking structures for 1990-91 without student notification and input. In response to
this action, an alternative transportation group emerged and set goals to increase
pedestrian, bike and transit use. Working together with the University and the city, the
group began collaborating to form a student bus pass program.
After an initial plan was created a poll was conducted to estimate student support.
A 4 to 1 ratio was observed in favour of establishing the pass. After the survey a $10
fee was imposed on students to raise the needed $550,000 for the program. The
regional transit district (RTD) argued that more funding would be needed. This was
negated when it was shown that student use would not coincide with peak hour travel.
Six years after implementation, transit ridership has increased from 300,000 to
1,500,000 trips. According to a survey, 42% of these new rides would have been
55 Poinsatte, Francois and Toor, Will, “Finding a New Way: Campus Transportation for the 21st Century”, April 1999
70

made by car if not for the pass. Biannual surveys indicate that from 1990 to 1998
student ridership has increased 550%. The program has received awards for increasing
student mobility and decreasing pollution. An estimated 3.2-6.5 million trips by car
have been eliminated per year, preventing 1700-3000 tons of greenhouse gases from
entering the atmosphere, not taking into account the increased number of buses.
The increased financial support of the program allowed expansion. The HOP and
SKIP shuttle bus systems were created with funding from the U-Pass program. The
HOP shuttle bus runs frequently from the University to downtown and the major
commercial shopping area in an efficient loop. SKIP shuttle buses travel north and
south spanning the city and stopping at the university along the way. These services
have since been increased when students voted 16 to 1 in favour of a $5 increase in fees
(bringing the total to $19.42). Now students receive free transit service to the Denver
international airport, local ski mountains and other regional trips that would cost a
significant amount if normal fares were paid.
As seen in other U-Pass systems, student driving rates decreased. At $72-$120
per semester for parking, the students found it cheaper to use transit or other means.
This reduced the need for more parking spaces and structures as the campus population
grew, not to mention the need to purchase additional land for parking.
The mode split data from Boulder tells the story:
In 1990, 35.9 % of all trips were on foot, 17.6% of all trips were taken by bicycle; 18.9
% by carpool; 23.8% by single occupant vehicle (SOV); 2.3 % by dorm shuttles, and
71

1.5% by transit. After five years of program operation, these numbers shifted
significantly. In 1996 39.8% were on foot; 19.9% by bicycle; 18.3% by carpool, 14.6%
by SOV, 4.2% by transit, and 3.2% by dorm shuttle. Note the large decline in SOV use,
and the significant increases in walking, biking and transit. (Poinsatte and Toor 1999)
This vastly successful program was achieved because of the co-operation of
students, the University, the city and the RTD. Due to the effectiveness of the student
program, the Eco-Pass was developed for faculty and staff.
3.4.2: Faculty and Staff Eco-Pass
The initial implementation of the faculty and staff eco-pass was slow, due to legal
restrictions. Laws needed to be changed to remove limitations on employee benefits.
The pass can be obtained by all permanent position employees and entails the same
benefits of the student pass: free transit on all RTD routes, HOP and SKIP shuttles and
even free taxi rides in the case of an emergency.
Parking revenues were proposed as a funding source but doubts were raised and a
feasibility study was conducted. The cost was estimated to be $500,000: $380,000 for
RTD contracts and $120,000 for administrative fees. In order for the program to
proceed, the parking net revenue needed to be $1.58 million. Changes in parking
behavior needed to be taken into account if the pass was to be implemented. At the
time 62% of faculty and staff drove to school (55% having parking permits), 13% on
transit and the remainder by carpool, bike or walking. The price elasticity of parking
72

was also calculated. Results showed that even a 25% increase in parking cost would
only cause a 4% decrease in parking use. Therefore, the study suggested a 10%
increase in parking in the first year and a 15% increase over the next 3 years to fund the
program. The study estimated that ridership would increase by 68% with 320,000 trips
increasing to 540,000 after Eco-pass implementation. Parking demand would also
decrease, freeing up 320 spaces and saving the University $2.6-3.2 million in parking
structure costs that would normally have been needed in the next 5 years.
Even though parking revenue would have been sufficient to fund the program,
complaints were made by some faculty members and the net result was that 30% of the
program was covered by parking revenue. 49% was covered by the general university
fund and the remaining 21% from a head tax. The total budget for the first year was
$110,000 lower than anticipated since RTD decreased its fee. Furthermore, the city of
Boulder contributed 25% of the total contract, to be phased out over the next five years.
After implementation 500 of the 5600 faculty and staff were surveyed. Bus
ridership increased from 4935 to 9090 after implementation of the Eco-pass. This was
an 84% increase, greater than the 68% predicted by the feasibility study. Parking rates
had also lowered, freeing up 147 spaces per day, a 5.69% decrease. The savings of
these spaces are compared to a structure that would carry an additional 147 spaces in
figure 3.4.2.
73

Figure 3.4.2: Comparing cost of Eco-pass to parking garage of similar capacity.
74

3.5: Eco-Pass in Santa Clara Valley (Silicon Valley)
The Eco-Pass at Santa Clara Valley is different from that in Boulder, Colorado.
This Eco-pass was implemented by a number of companies in the region. The
motivation here is for a different reason but achieves the same effect.
Businesses are required by law (throughout North America) to provide parking
spaces for their employees. A company has the option to pay an “in-lieu” fee instead of
building/providing parking. Donald Shoup suggests that an alternative of this in-lieu
fee could be managing parking demand through the implementation of an Eco-pass
system.56
The cost of the Eco-pass per employee annually depends on the size of the
company, since larger companies may require the transit agency to increase bus
coverage. Likewise, the price is also dependent on the service received by the
commuters. The transit agency must negotiate this price with the employer. Table
3.5.1 summarizes the prices in the Santa Clara Valley.
56 Shoup, Donald. "In Lieu of Required Parking", Journal of Planning Education and Research, Vol.
18, No. 4, Summer 1999, pp. 307-320.
75

Table 3.5.1: Price per employee per year in Santa Clara Valley Transport Authority
(SCVTA) 57
Number of Employees
Service 1-99 100-4999 5000+
Downtown San Jose
(heavy transit
coverage)
$80 $60 $40
Bus and Light rail $60 $40 $20
Bus only $40 $20 $10
The study found that after eco-pass implementation, SOV use in the region
decreased from 76% to 60%. Consequently transit usage increased from 11% to 27%.
These modal shifts caused a 19% decrease in parking demand. Again, this decrease in
parking demand saves space and money. Shoup calculates that a $1/year investment in
an eco-pass can save $23-337.
Currently in Silicon Valley, 40,000 eco-passes are in use while in Denver 38,000
are in use. An eco-pass could also be used for events such as concerts, plays in large
theatres and sporting events. As mentioned previously, Seattle Husky fans are able to
use game tickets as a transit pass. Eco-pass also has implications for large scale
residential complexes. The buildings could use the pass as a marketing strategy, to
attract transit users. This tactic would be especially effective in areas with good transit
57 Shoup, Donald. "In Lieu of Required Parking", Journal of Planning Education and Research, Vol.
18, No. 4, Summer 1999, pp. 307-320.
76

service (such as downtown cores). Hotels could even give temporary eco-passes to
visitors, eliminating the need to build large parking lots. This could also attract visitors
who do not wish to drive. Many hotels across the world already offer shuttles to tourist
locations nearby.
However, as of now using an eco-pass does not allow companies to avoid the
in-lieu fee of providing parking. In order to make the eco-pass more appealing the laws
in North America regarding required parking and in-lieu fees must change to allow
reducing parking demand to be another alternative.
3.6: How Should U-Pass Programs Be Compared?
What makes a good U-Pass? Does a good U-Pass: increase ridership on transit,
decrease SOV use, improve traffic congestion, reduce harmful emissions and promote
alternative transit methods? It may be a combination of these factors since they are all
important. How should one go about comparing these factors?
To effectively compare systems, they must actually be comparable! For this
reason modal split is usually used. Actually reducing SOV trips appears to be the main
goal of many of the U-Pass programs, since by doing so traffic congestion is lessened,
air pollution lowered and parking demand reduced. Yet actual SOV trips eliminated
may not be a comparable statistic, due to the fact that Universities are of different size.
Since mode split is a percentage, it makes comparison more valid. As can be seen with
some of the universities studied, SOV modal percent dropped while actual vehicle trips
increased. If vehicle trips were used instead of modal split, it would appear that SOV
77

use is continuously increasing, despite any U-Pass incentives to use transit. Yet the
modal split percentage can also be deceiving. A “low” 2% reduction in SOV mode
split may actually mean thousands of less vehicle trips for a large university, whereas a
20% reduction at a smaller university may account to only hundreds less vehicle trips.
An alternative to vehicle trips or modal split is person trips. A person trip is a one way
trip to a destination made by a certain mode. Thus it effectively allows one to compare
mode and actual trip data.
Another issue that arose in comparing the universities was the different criteria
used to measure the U-Pass effect on parking. Some studies showed how parking
utilization changed, others put a monetary value on reduced demand and others simply
stated the number of spots saved. It should be possible to convert the different data into
each other since the demand is per space based. Since monetary values may differ by
location (due to parking construction costs, space availability etc.) it should not be used
as a comparison. Since size of schools is also variable, this would make spaces saved
somewhat misleading. The criteria used to study the effects of the U-Pass should
therefore be measured in terms of utilization. For example, if parking spaces were
being used at 90% of capacity before U-Pass and then 85% after U-Pass, it can be a
valid comparison between universities of all size. One flaw in using utilization is that
sometimes Universities remove parking lots because of a successful U-Pass. This
would make the parking utilization increase since more people would be forced into a
different lot. Perhaps it should be noted if any parking lots were removed, this would
allow the necessary adjustments to be made. Overall, utilization appears to be the most
78
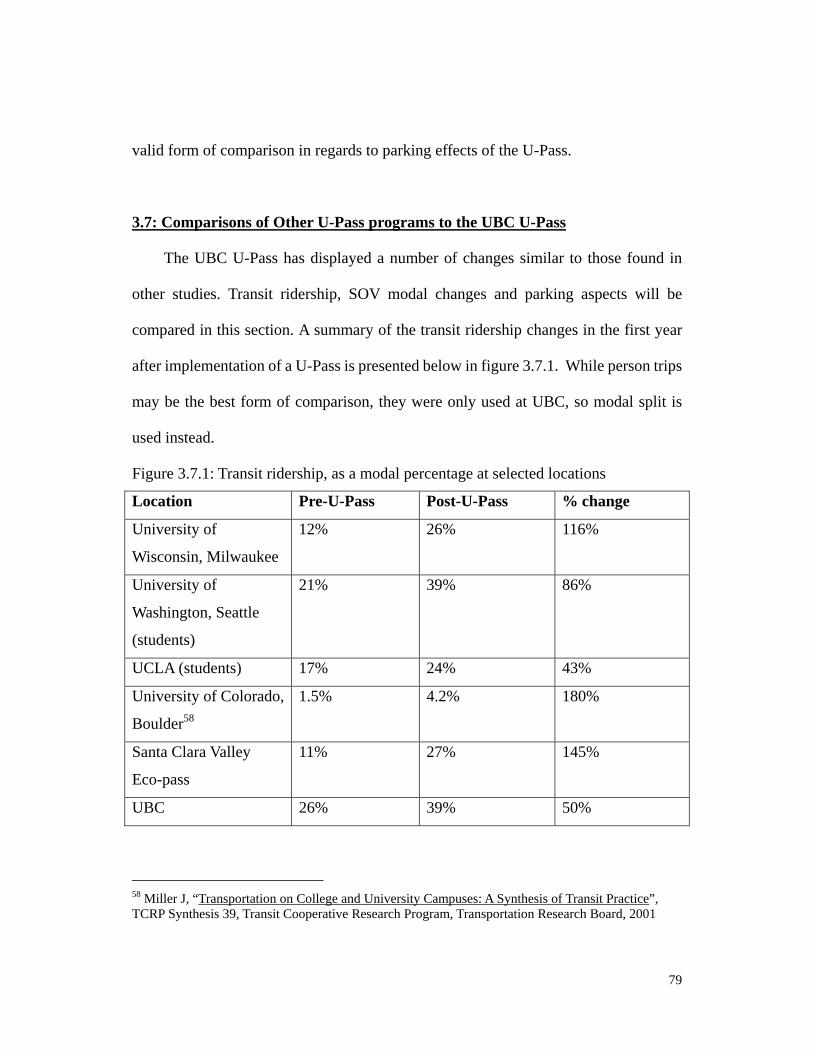
valid form of comparison in regards to parking effects of the U-Pass.
3.7: Comparisons of Other U-Pass programs to the UBC U-Pass
The UBC U-Pass has displayed a number of changes similar to those found in
other studies. Transit ridership, SOV modal changes and parking aspects will be
compared in this section. A summary of the transit ridership changes in the first year
after implementation of a U-Pass is presented below in figure 3.7.1. While person trips
may be the best form of comparison, they were only used at UBC, so modal split is
used instead.
Figure 3.7.1: Transit ridership, as a modal percentage at selected locations
Location Pre-U-Pass Post-U-Pass % change
University of
Wisconsin, Milwaukee
12% 26% 116%
University of
Washington, Seattle
(students)
21% 39% 86%
UCLA (students) 17% 24% 43%
University of Colorado,
Boulder58
1.5% 4.2% 180%
Santa Clara Valley
Eco-pass
11% 27% 145%
UBC 26% 39% 50%
58 Miller J, “Transportation on College and University Campuses: A Synthesis of Transit Practice”, TCRP Synthesis 39, Transit Cooperative Research Program, Transportation Research Board, 2001
79

As can be seen by the graph, the UBC U-Pass has increased ridership by 50%,
however this is one of the lowest percentages amongst the studied universities. It must
be mentioned that the goal target was a 20% change, so according to this, the U-Pass
has been effective. In addition, prior to U-Pass fare-free cards, other incentives have
increased transit ridership, so this must be taken into account. A comparison of SOV
modal percentages follows (again, person trips would have been optimal but is
impossible due to lack of this data from other universities).
Figure 3.71: SOV modal split as a % before and after U-Pass.
Location Pre-U-Pass Post-U-Pass % change
University of
Wisconsin,
Milwaukee
54% 41% -24%
University of
Washington, Seattle
(students)
25% 16% -36%
UCLA (students) 17% 12% -29%
University of
Colorado, Boulder
24% 15% -60%
Santa Clara Valley
Eco-pass
76% 60% -21%
UBC 43% 39% -9%
Again, modal change in SOV at UBC was the lowest change recorded amongst
the studied Universities. This shows that the U-Pass has so far not been very effective
80

at dissuading SOV travel.
Parking pass statistics were also commonly analyzed amongst the studied
universities. This portion of comparison is difficult to compare since the studies
employed different gauges to measure the effects on parking, such as reduced usage,
monetary savings or surveys reflecting driver’s opinions on the change in parking
availability. However, the most comparable statistic is parking utilization, figure 3.72
shows how utilization changed immediately after U-Pass implementation.
Figure 3.72: Parking utilization
Location Pre-U-Pass Post-U-Pass % change
University of
Washington, Seattle
(students)
87 79 -9%
UBC
Parkades:
B-Lots:
87%
90%
78%
71%
-10%
-21%
UCLA 100% 100% 0%
Santa Clara Valley
Eco-Pass
NA NA -19%*
* % of reduced parking demand, not a direct measurement of utilization.
We were unable to find parking utilization rates for many of the Universities.
However, compared to the University of Washington, UBC appears to be right on track
and is doing quite well in regards to the B-Lot parking. However, it must be noted that
81

due to construction on campus some of the B-lot is closed and people cannot park there.
This fact may not have been taken into account when data was collected.
An unforeseen effect of the U-Pass has been to decrease HOV travel. Compared
to 1997 levels, HOV trips per person (taking into account population and enrolment
growth) have decreased by 50%. This result was similarly seen in some other U-Pass
programs.
Looking at the charts, the UBC U-Pass has low modal shift changes. While the
net effects are positive, the results are not as significant as those observed at other
universities. (Perhaps the survey will help to explain these results.) However, the
university is very close to achieving some of the goals set out in 1997. But could we be
expecting more from UBC?
82

4.0 UBC U-Pass Program Survey
4.1 Survey on UBC Students’ Responses On The UBC U-Pass Program
4.1.1 Method
Subjects will be approached randomly at a UBC parking lot, the UBC bus loop,
and near on-campus student housing during the hours of 9am-5pm on a school day.
Subjects will be asked to read the cover letter on the survey and to complete the
attached questionaire if they consent to participating in the study. A minimum of sixty
questionaires will be given to people whose main mode of transportation to UBC is the
bus. A minimum of sixty questionaires will be given to people whose main mode of
transportation to UBC is a car. A minimum of thirty questionaires will be given to
people who live on campus. No identifying information such as a name or an address
will be asked on the questionaire. The information gathered by the survey will be
compiled into graphs and charts and compared with similar data gathered at other
universities with fare-free student transportation plans.
4.1.2 Survey Design
Although the survey design went through many revisions, the final copy still had
some features which made analysis difficult. A copy of the survey form is in appendix
D.
In the first question the survey failed to distinguish between calendar year and
school year when asking for the student’s main mode of transportation during the
previous year.
83

The next question asked the students why they chose their current mode of
transportation. Many people circled more than one answer making analysis of this
question difficult.
Later in the questionnaire respondents were asked to answer questions on a one
to five basis. According to some survey design experts our numbering should have
been the other way around to promote ease of understanding. These question stems
were positively framed which has been shown in other surveys on the u-pass to
positively skew the data59. In many questions the survey failed to provide a not
applicable or don’t know choice. As a result many people who lived on campus had
difficulty answering these questions.
“I live on campus” was included as a mode choice as well as a living location.
This lead this lead to complications later on when not everyone who lived on campus
chose the I live on campus option on how they travelled to school.
An additional last question, asking for other comments was added half way through our
survey.
Too little space was left for responses where writing was required.
The location of administering the survey most likely skewed the results. The
survey was conducted inside the Student Union Building, at the bus loop, at parking
facilities and at other locations around campus. The vast majority of people surveyed
however were either at the bus loop or at the SUB. In these places the overwhelming
majority of respondents were bus riders.
84
The posters advertising the survey to possible respondents were cheery, had lots
of colour and designs and were placed on bright pink and blue posters. The happy
appearance of the posters might have encouraged pro-U-Pass people to fill out a survey
while deterring anti-U-Pass sentiment. The survey administrators were repeatedly
asked whether they worked for Translink. This might have influenced some people to
include or exclude certain commentaries on their experiences with the U-Pass.
In conducting the survey candy was used as an incentive. Although no data on the
gender of the respondent was gathered, through observation the majority of the
respondants were female. If women and men have different responses then this could
also slant the data.60
For all of the above reasons, this survey is not useful to examine statistically. We
do however feel that brief comparisons between groups of people in the survey are
cautiously useful and so we have included a brief report below of our findings of
student responses for different travel modes and living location. The results reported in
the tables below are rounded means.
4.2: Summary of Responses
4.2.1: Responses for different modes
The following overview of our survey results is based both on median reported
answers and on answer distribution. The medians are presented in appendix
59 Dowlatabadi Interview 60 Dowlatabadi Interview
85
A and the distributions in appendix C.
Students driving to school responded, on medium, that the nearest bus stop to their
residences was between 5 and 10 blocks away. 50% of drivers also responded that they
had to make an average of 2 transit transfers in order to get to UBC while for all other
modes the majority of the responses fell within the 0 to 1 transfer range. These results
suggest that car drivers may choose to use their mode as the overall convenience of
walking a substantial distance in order to get to a bus stop, and then having to transfer
between busses, is outweighed by the convenience of driving a vehicle from doorstep
to doorstep (despite the higher costs associated with driving).
This is probably the same reason for why 14 out of 21 car respondents answered
“no” when asked if they used the U-Pass for trips other than those to UBC. In all other
modes at least 75% of the respondents answered “yes” to this question. All modes,
aside from the more evenly distributed answers of campus residents, tended to disagree
with the statement: “I go home more often during breaks at UBC because of the
U-Pass.” For the bus mode this result is somewhat surprising as 73% of riders said that
they did not need to make more than 1 transfer in order to get to school, while 44% said
they did not need to make any transfers. 71% of bus riders also reported that less than 5
blocks needed to be walked in order to get to the nearest bus stop. These two factors
might suggest that going home by transit between classes should be relatively easy.
However, considering the frequency and duration of breaks between classes, combined
with the time needed for waiting for busses and walking to and from the bus stop, even
short trips may be more hassle than they are worth. This inconvenience is further
86

amplified by the fact that 58% of riders reported their estimated travel time to UBC to
be between 30 minutes and over 1 hour.
On the issue of influence of the U-Pass on choice of next year’s location of
residence, 80% of car drivers and 75 % of bikers disagreed (disagreed to strongly
disagreed) with the statement: “I expect the U-Pass to influence where I live next year.”
Answers from bus riders were a little more evenly distributed, although, still, 48%
disagreed, while 34% agreed or strongly agreed, and 18% remained neutral. In
preliminary discussions amongst our project group members we had a strong hunch
that U-Pass implementation would likely have a significant influence over where
people chose to live next year, however, these results suggest otherwise. There are a
few possible explanations for this, one being that the availability of affordable student
housing on and off campus is significantly limited in Vancouver, making it difficult for
a renter to be particularly choosy about where to live. “Particularly choosy” in this
case should be loosely defined as trying to find an apartment/house with the specific
condition of it being close to a direct to UBC serviced bus stop, or B-Line stop. It is
probably of paramount important to choose a location within a radius of convenience
from the university campus. That radius has been suggested by some to be about 10 km,
so it could be hypothesized that as long as a reasonably affordable place of residence is
found within this radius, the subordinate criteria for choice of dwelling become
significantly less important.
There also may not yet exist significant enough of incentive for living near a
transit stop as during this first year of the U-Pass implementation, the Translink
87
network has been plagued with overcrowded busses passing waiting passengers during
peak time periods.
It is likely however, that these problems will be dissipated with the addition of
more busses and expansion of rapid transit routes like the B-Line, or any spin off
alternative modes of rapid transit to UBC. When that happens, the trend observed in
our survey might change dramatically in terms of the U-Pass being able to play a bigger
influence in choices of housing location. Conversely, it may happen that if commuting
by transit along rapid corridors becomes much more efficient than along other
subordinate routes, rental rates for dwellings near these corridors could increase. It is
beyond the scope of our study to investigate whether or not this is already happening,
or could possibly happen, but if this was the case, it could be interpreted as one
negative implication of the U-Pass program.
A final explanation to consider is that a large proportion of students living off
campus, especially those in undergraduate programs, still live at home with their
parents. It would be very unlikely that U-Pass availability would influence a change in
their residential distribution, or play a major role in a decision made to move out
To the statement: “U-Pass will make or has made me less likely to own a car in
Vancouver”, drivers were the only group to disagree by large majority (76%),
carpoolers’ answers were evenly distributed, while bus, bike, and campus modes
unanimously agreed (60% or greater agreement). Disagreement by drivers may also
partially be explained by the previously suggested argument that as long as a car
owner’s residence is inconveniently out of range of a transit stop, this mode of
88

transport will continue to be relied upon for commuting to UBC. The same reasoning
can be applied for the more subjective question-statement: “U-Pass makes it more
convenient/pleasant to get to campus.”, to which only drivers did not agree with,
although 35% of driving respondents answered neutrally to this question. This may
suggest that a certain proportion of drivers are entirely unaware of the implications of
transit use.
As for the U-Pass’s influence on trips made not for the purpose of attending
classes at UBC, it was clear that the bus, bike and campus modes benefited from it’s
implementation as all agreed by majority that the pass made it easier to access
amenities, and off and on campus entertainment events. Drivers and carpoolers (less
strongly) disagreed with statements 13-16 that the U-Pass makes non school related
activities more accessible. In hindsight it would have been interesting to have included
a question to get an idea of, on average, how many times a month drivers use their
mandatory-issue U-Passes. Their argument for making the subscription optional, and
their responses to this survey, might carry significantly less clout if it happened that
their pass usage came close to, or exceeded 10 individual trips, which equals the
monthly cost of $20 for the U-Pass. It would probably be unlikely that a driver,
especially for aforementioned reasons, would bother to do things like go grocery
shopping or banking, etc. on transit. But, for activities such as going out downtown, it
might make more sense to take bus or skytrain in order to avoid the associated
inconveniences with having to park, and possibly leave an automobile in the city
center.
89

The statement: “the U-Pass influences, or will influence my choice of job, or
whether or not to take a job at all, while going to UBC.”, did not elicit a clear majority
response from bus riders with 40% in agreement, 35% in disagreement, and 24%
neutral or indifferent.
A similar answer distribution was observed for on campus residents, while,
surprisingly, carpoolers agreed with a majority of 62.5% to the statement. Car drivers
were in general disagreement of 75% (strongly 60%). It may still be too early for
people to consciously be taking into consideration the U-Pass when looking for
employment. It would make sense that there exists more of an incentive for campus
residents to consider taking a job off campus if the former transportation cost of $64 for
a monthly bus pass, is no longer a limiting factor. For the rest of the modes, likely
explanations for the responses could simply be that once again drivers experience
significant inconveniences in using transit to commute to more serious engagements,
and that bus riders have the same incentives as they do in traveling to school, as they do
to work through use of the U-Pass.
Question 17, the statement of: “The U-Pass has made it easier to find parking on
campus.”, is flawed in that it contains no response for “not applicable” and thus forces
respondents who’ve already committed to the mode of bus, to answer based on an
assumed part-time alternate mode use of car. However, the fact that UBC is continually
expanding residential housing complexes into the B and C lots, and using the U-Pass,
to partly justify this decreased parking convenience, is evident in the response of the
drivers who disagreed with the statement by a 57% majority. Still 19% of them said
90

they “didn’t know”, so it will be interesting to see how that number changes as the
effects of dwindling parking lot availability become more pronounced. It is also
interesting to report that of those bus riders this year who drove to school last year,
there was strong disagreement (still need this chart) to the statement that U-Pass has
made on campus parking more convenient.
For the final all-mode-inclusive question, both bus, and bike (strongly), agreed by
majority of 75% or more that overall, the U-Pass makes UBC a more attractive
university. Campus residents also agreed with a majority of 62% and car drivers
responded the following: agree (agree & strongly agree) = 38%, neutral = 10%,
disagree (disagree & strongly) = 33%, don’t know = 19%. Considering the number of
times in this survey that drivers responded negatively to U-Pass implementation, this
result was surprising. It is somewhat of an acknowledgement that programs like the
U-Pass are important attributes of a quality academic institution, regardless of whether
it is applicable to everyone it includes.
Many respondents with whom we casually spoke to while conducting the survey
griped about the fact that busses have become unbearably full since the U-Pass
program’s implementation last September. Therefore it was interesting to see that these
complaints were validated through the last two survey questions. Bus and bike reported
that they experienced a seat-less bus ride to UBC about 50% of the time, this
percentage was significantly less for trips from UBC (bus=25%, bike, 10%). For bike
this also could have been interpreted as percentage of time the forward bike racks were
full upon pickup, but our survey, in it’s scope, fails to make this distinction. It is
91

definitely true that departures from campus are more leisurely in time restriction to
arrivals, making transit loading much more staggered and not in the form of sharp
“waves” of students.
A major problem with this question is that it leaves no room for car drivers who
occasionally use the bus for trips other than to UBC to comment on the level of
crowding they experience on those occasions. Since most of the car and campus and
bike respondents answered this question anyway, it is worth looking at their responses
keeping in mind that trip purpose is very unclear here.
Since car and campus modes probably use the U-Pass more for leisurely activities,
and shopping on their own time (especially in the case of campus residents going to
upper w. 10th and kits for groceries), they are less likely to experience the crunch of
peak hour transit loading. For this reason it is understandable that on both trips to and
from campus (which are not necessarily trips to and from campus for lack of an
alternate wording of the question) percentage of seatless trips was at the most 25%.
4.2.2: Summary of mode splits for different residential areas
In order to get an idea of the mode split for different residential areas in the GVRD,
we classified our survey respondents by their area codes in the following manner:
Burnaby: V5C, V5J, V5K, V3M, V3N, V5B, V5E, V5G, V5H
Campus: V6T
92

Coquitlam: V3B, V3L, V3H, V3J
Downtown: V6B, V6E, V6G, V6H
East Vancouver: V5S, V5P, V5X, V5N, V5R, V5V, V5W, V5L, V5M, V5T, V5Y
North Vancouver: V7N, V7S, V7J, V7L, V7P, V7R
Richmond: V6V, V6X, V7E, V7A, V4L, V4M, V7C, V4K, V6W
South of 33rd Avenue: V6M, V6P, V9C, V6M, V6N
Surrey: V3R, V3W, V4C
UBC to Granville (N. of 33rd): V6L, V6R, V6S, V6K, V6J
It was then possible to calculate the relative proportions of students traveling by
car, carpool, bus, or bike, from each of these commuting-source areas.
For the downtown area all 7 respondents reported using public transit as their
current mode for commuting to UBC. This was not surprising considering the
inconviences associated with keeping a car either downtown or on campus. For the
residential area located immediately next to UBC to the North of 33rd Ave. the mode
split was predominated by bus riders (89%), with an N=43. Only 2% drove, likewise
for carpoolers, while 7% or 3 respondents rode a bike to school. Out of the total 211
survey respondents, only 4 said they used a bike as current mode of transportation, and
it seemed to make sense that 3 of those riders lived relatively close to campus. Under
the 10 year GVRD outlook plan the amount of money spent annually on maintaining,
and improving bike routes will be raised from $2 million, to $6 million, which many
pro-bike lobby groups suggest is still not enough of a funding increase. Still, it should
93
be interesting to track changes in the proportion of those students biking to school,
when the new money is pumped into better facilities.
East Vancouver saw a slightly lower proportion of bus riders than the UBC to
Granville area, although it was still quite high at 84%. Car use was up at 9%, carpool at
5% and the only other biker to answer our survey also came from this area.
Burnaby exhibited mode split proportions similar to East Van with a slightly lower
percentage of bus riders and slightly higher percentages of car and carpoolers.
For the area within the city of Vancouver from 33rd Ave. southwards, the
proportion of riders dropped to 79%. Car drivers and poolers increased (14% & 7%
respectively) while there were no bikers for this or the rest of the other residential areas
studied. Currently there are no rapid transit routes in this area, and service on the
alternative routes, 25th Ave, and 41st/S.W. Marine Dr. is below adequate standards.
Over the past two terms, the frequency at which the #25 bus has been passing students
waiting to go to school has even caused some frustrated individuals to dub the U-Pass
as the “Pass-U” program. During off peak hours busses along this route come every 30
minutes, which can cause simple trips from UBC to Oak St. to last sometimes more
than an hour in duration. For these reasons the increase in car ridership for this area is
easily understood.
Getting out of the city of Vancouver, dramatic increases in the car mode are
observed. For the Richmond area there were 5 drivers and 2 carpoolers out of 20
respondents. Still, 65% of students living there took the bus to school a result most
likely attributed to the 98-BLine service which acts as a rapid transit link between
94

Richmond and the Broadway 99BLine route.
Farther south there were only 4 respondents living in Surrey, with 2 driving and 2
using transit. Because the N is so low, it is hard to make any worthy explanations about
this mode split.
North Vancouver residents are plagued by traffic bottle necks of both the Lion’s
Gate, and Second Narrows bridges. Despite the existence of bus-priority lanes leading
up to these bridges, most transit commutes from North Van to UBC require at least 2
transfers. This significantly hinders the convenience of using this mode, not to mention
the heavy traffic congestion that busses and private alike experience when battling
through the city center during peak commuting hours. In this area, out of 9 respondents,
4 reported a mode of car and the rest transit.
Finally in Coquitlam from a total of 8 respondents 2 drove, 2 carpooled, and 4
bussed in. Though the N is small here, it seems bus mode proportion of 50% is still
significant considering the distance of this area from UBC. Despite the fact that
Coquitlam has been promised a new rapid transit link into Vancouver for years, any
money that would have potentially been used for this project over at least the next 5
years will be diverted into the costly RAV project. This has left local MLA’s
questioning the integrity of the GVTA’s decisions as Coquitlam has much more
potential to increase its population density than Richmond does. Under the Agricultural
Land Reserve act of British Columbia, Richmond’s urban expansion into existing
farmlands is now heavily restricted.
Below is a table summarizing the differences in proportion of students using the
95

mode of public transit between this year and last year, for each of the nine examined
areas. Calculations for last year’s mode discluded those students who were not present
at UBC at that time. % Bus riders Last year This year Change
UBC to Granville 60 89 +29%
Vancouver south of 33rd 50 79 +29%
Downtown 83 100 +17%
East Vancouver 74 84 +10%
Burnaby 17 80 +63%
North Vancouver 0 56 +56%
Coquitlam 29 50 +21%
Richmond 33 65 +32%
Surrey 50 50 0%
When the percent increases from this table are averaged, we attain a general
transit ridership increase of 28.55%. This increase is substantially greater than TREK’s
reported ridership increase of 13%. Reasons for this difference most likely lie in the
inherent flaws of our survey as previously mentioned. However, despite the small scale
of our study, the increases we see here are not trivial. If the U-Pass’s key aim was to
dramatically increase the number of students traveling to UBC by bus, it has most
likely succeeded.
96
5.0: Analysis
5.1: Brief summary of findings
Immediately after U-Pass implementation there was a large change in modal
shares. Transit ridership increased 50% while SOV decreased 9% and HOV decreased
31%. The transit increase is relatively low compared to other universities. This low
percentage increase is misleading, UBC’s transit mode share is, in absolute terms, the
highest observed in our study. Buses are crowded and would not allow further
increases in ridership at peak times. The SOV decrease is the smallest observed in all
of the studied universities. HOV mode share decreased due to participants switching to
transit. The UBC U-Pass costs students $20/month. The full price paid to Translink
per student is $23/month. This is higher than any other school we looked at.
5.2: Possible explanations
There is no Skytrain, or subway service to UBC and UBC is located on a
peninsula away from the city center. The geography of the different universities may
not be the same and could account for some of the differences observed. When
comparing UBC mode split to that of other schools this needs to be kept in mind. Also,
this is the first year of implementation of the U-Pass at UBC. Other schools have seen
increases in transit use, decrease in SOV etc. over the course of a few years after
implementation. Keeping this in mind, here are some explanations for the trends that
we found:
97

Low transit ridership increase:
According to TREK this low percentage increase is explained by the high
ridership prior to the U-Pass61. Due to this high ridership, peak hour buses were
already at capacity and could not meet the increased demand caused by the fare free
U-Pass. Although bus service to UBC has increased, Translink must remain
revenue-neutral and so cannot immediately provide all of the needed buses. Other
issues include that SOV users are inconveniently located away from major bus routes
to UBC. Over time, this ridership may further increase as more buses are added and
people become more familiar with the transit system.
Low SOV decrease:
There are a number of factors contributing to the low decrease. Many students at
UBC travel from places such as New Westminster and North Vancouver. Of the people
surveyed, those whose primary mode of transportation to UBC was an SOV replied
that they required on average 2 transfers to get to UBC by bus.
High HOV decrease:
Most of the increase in transit ridership is matched by a decrease in HOV ridership.
The main effect of the U-Pass in terms of mode split is that it switched HOV riders into
bus riders. There are a number of possible explanations for why HOV riders have been
98

more sensitive to the U-Pass than have SOV riders:
1) HOV riders have to co-ordinate a carpool. There is a certain amount of hassle
involved which is avoided if one takes the bus.
2) HOV riders are less likely to have unlimited access to a car than are SOV riders.
They are also likely under more financial pressure as they opt for the hassles of a
carpool over having to pay single-handedly for the operation and maintenance of a
car. The U-Pass as a pre-paid system offers the thrifty student a free way to get to
and from school.
Cost of U-Pass:
Transit has a large mode share at UBC which means that Translink has to be
compensated for more trips per U-Pass holder than do other service providers at other
universities. Also, before the U-Pass many students already took transit. The busses
were at capacity. It is much more expensive to provide additional service than it is to
simply pick up more passengers in an empty bus.
5.3: Shortcomings of our study
Research:
Most of our data was taken from TREK and other administrative bodies at other
universities. These bodies have an interest in favorably portraying their transportation
61 Carol interview
99

system. An independent monitoring agency would be ideal for monitoring both the
suitability of their goals and their progress towards them. There is not, however, such a
body and so we used TREK, and the other administrative bodies’ data without
questioning its veracity. One possible problem with the TREK’s vehicle count data is
the location of the count. An estimated 100 commuters per day drive to just outside of
the count perimeter, park there to avoid parking fees, and take the bus from there.
These people are counted as bus riders even though their main form of transportation to
UBC is a car. Another problem with TREK’s vehicle count data is that they include the
trips taken by non-student on-campus residents, which are not accounted for in the
daytime UBC population. The data collected from these administrative bodies is not
always in a comparable form. This makes comparison of the results of different
universities transportation programs difficult. Also, there are many external influences
such as location of the university and quality of the transit service provided to the
university that we did not take into account when comparing their experiences with the
U-Pass. Taking these factors into account are beyond the scope of this thesis. There is a
lack of analysis and data collection on the effect of U-Pass systems. This severely
limited our choices of which U-Pass systems to examine.
Survey:
The survey had problems both in its format and in its administration. The people
surveyed are not representational of the UBC population. A more in-depth and
statistically significant study is being conducted by TREK. The results of this survey
100

will likely be much more useful in assessing the impact of the U-Pass on UBC students.
This data however will not be available for a few years. For deadline reasons, their
survey data could not be used in this thesis.
5.4: Further Research
TREK is one of the administrative bodies which has undertaken the most analysis
and data collection of any U-Pass. There is limited availability of similar in-depth data
from most other universities using a U-Pass system. A standard way of recording
mode-split data and a standard survey questionnaire form would enable more
meaningful comparisons between universities. Likewise, a common set of criteria for
evaluating a transportation program would help to clarify the objectives of these
programs. A good next step in this study would be to examine the number of buses
provided for service to UBC in 2003, 2004 and Translink’s plans for expansion in the
coming years. This would provide some information to help understand the problem of
over crowdedness on the busses. A closer examination of why SOV ridership has not
dropped as expected with the U-Pass would be an interesting further course of study.
Continued monitoring both in the form of surveys and in vehicle count data is critical to
being able to better understand the effects of a U-Pass system.
5.5: Recommendations for transportation at UBC
Switching SOV riders to transit riders has proven to be a difficult task. Many
SOV riders live outside the reach of easily accessible transit. Perhaps strategies aimed
101
at increasing HOV participation would be more effective at reducing SOV usage than
more transit benefits.
This raises the issue of the OCP goals. Transit ridership was at near capacity prior
to U-Pass implementation. The 20% increase in transit mode was met prior to
implementation of the U-Pass. Therefore, more focus should be aimed at converting
SOV’s to HOV’s.
Any initiatives aimed at decreasing the crowdedness on peak time busses to UBC
would meet with great approval from bus riders.
102

6.0: Conclusion
Transportation Demand Management strategies such as the U-Pass are limited in
the amount of change they can effect on mode split by land use patterns and public
transit infrastructure. UBC may be approaching that limit.
UBC has the highest transit mode share but one of the lowest increases in transit
mode share after U-Pass implementation observed in our study. Most of this increase is
due to former HOV users who now take the bus. The most common complaint
expressed on our survey was that the busses were too crowded. The average SOV
riders had to take two transfers- 3 buses- to get to UBC and lived more that 5 blocks
away from a bus stop. This makes transit inconvenient, a fact that can not be overcome
by a pre-paid ststem like the U-Pass.
The growth predictions from the OCP state that the on-campus population at UBC
will double within the next 20 years.62 This, when combined with increased enrollment
at UBC will mean a lot more traffic. The U-Pass was required by the OCP to mitigate
the congestion caused by growth. The U-Pass will not however be able to completely
solve the problem. This in not to say that it is useless only that other programs, such as
dedicating large portions of the increased housing on campus to students and
increasing the public transit infrastructure which services UBC, are also needed.
62 OCP document
103

APPENDIX A: Survey responses by mode split (median reported values). *(questions 9-17 are answered on a scale of 1-5 where 1 represents strong agreement and 5 strong disagreement, questions 16 and 17 include a response option #6 for “don’t know”)
Question #: 3. 6. 7. 8. 9. 10. Mode What is your
average travel time to UBC?
How many transfers needing to be made to get to UBC?
Nearest bus stop to your home with direct service to UBC
Do you use transit trips not to UBC?
I go home more often during breaks at UBC because of the UPass
I expect UPass to influence where I live next year
Car 30-60 minutes Over 2 5-10 blocks away No 5 5 Bus 30-60 minutes 1 <5 blocks away Yes 4 3 Bike <10 minutes 1 <5 blocks away Yes 4.5 4.5 Campus N/A 1 <5 blocks away Yes 3 3 Question #: 11. 12. 13. 14. 15.Mode UPass will make or has
made me less likely to own a car in Vancouver
UPass makes it more convenient & pleasant to get to campus
UPass makes it easier to attend entertainment events off campus
UPass makes it easier to attend entertainmentevents on campus
UPass has enabled easier access to amenities (eg. Grocery stores)
Car 5 3 4 4 5 Bus 2 2 2 2 2Bike 1.5 1.5 1.5 1.5 3Campus 2 1 1 3 1Question #: 16. 17. 18. 19. 20.Mode The UPass influences or will
influence my choice of job, or whether or not to take a job at all, while going to UBC
The UPass has made it easier to find parking on campus
Considering cost &convenience, the UPass makes UBC a more attractive university
(bus riders only): What fraction of time do you ride TO without a seat?
(bus only): What fraction of the time do you ride FROM UBC without a seat?
Car 5 5 4 25% 10%Bus 3 6 2 50% 25%Bike 3.5 4 1 50% 25%Campus 3 6 2 25% 25%
104

Survey responses by residential distribution (median reported values). *(same conditions for above table apply)
Question #: 3. 6. 7. 8. 9. 10. Area What is your
average travel time to UBC?
How many transfers needing to be made to get to UBC
Nearest bus stop to your home with direct service to UBC
Do you use transit trips not to UBC
I go home more often during breaks at UBC because of the UPass
I expect UPass to influence where I live next year
East Van 30-60 minutes 1 <5 blocks away Yes 4 4 Burnaby 30-60 minutes Over 2 5-10 blocks away Yes 5 4 Campus N/A 0 <5 blocks away Yes 3 2 Coquitlam >1 hour Over 2 5-10 blocks away No/Yes (even) 4.5 3.5 Downtown 30-60 minutes 1 5-10 blocks away Yes 5 3 North Van >1 hour Don’t know 5-10 blocks away Yes 5 4 Richmond 30-60 minutes Over 2 5-10 blocks away Yes 4.5 4.5 Van. S. of 33rd 10-30 minutes 1 5-10 blocks away Yes 3 4 Surrey >1 hour Don’t know 5-10 blocks away No/Yes (even) 5 3 UBC toGranville
10-30 minutes 0 <5 blocks away Yes 4 3
Question #: 11. 12. 13. 14. 15.Area UPass will make or has
made me less likely to own a car in Vancouver
UPass makes it more convenient/pleasant to get to campus
UPass makes it easier to attend entertainment events off campus
UPass makes it easier to attend entertainment events on campus
UPass has enabled easier access to amenities (eg. Grocery stores)
East Van 2 2 3 2 2Burnaby 3 2 2 2 3Campus 2 1 1 3 2Coquitlam 2 3.5 3.5 2.5 3Downtown 1 3 2 2 2North Van 3 3 2 2.5 2Richmond 3 2 3 3 3Van. S. of 33rd 2 2 2.5 2 2Surrey 3.5 3.5 3.5 4.5 4.5
105
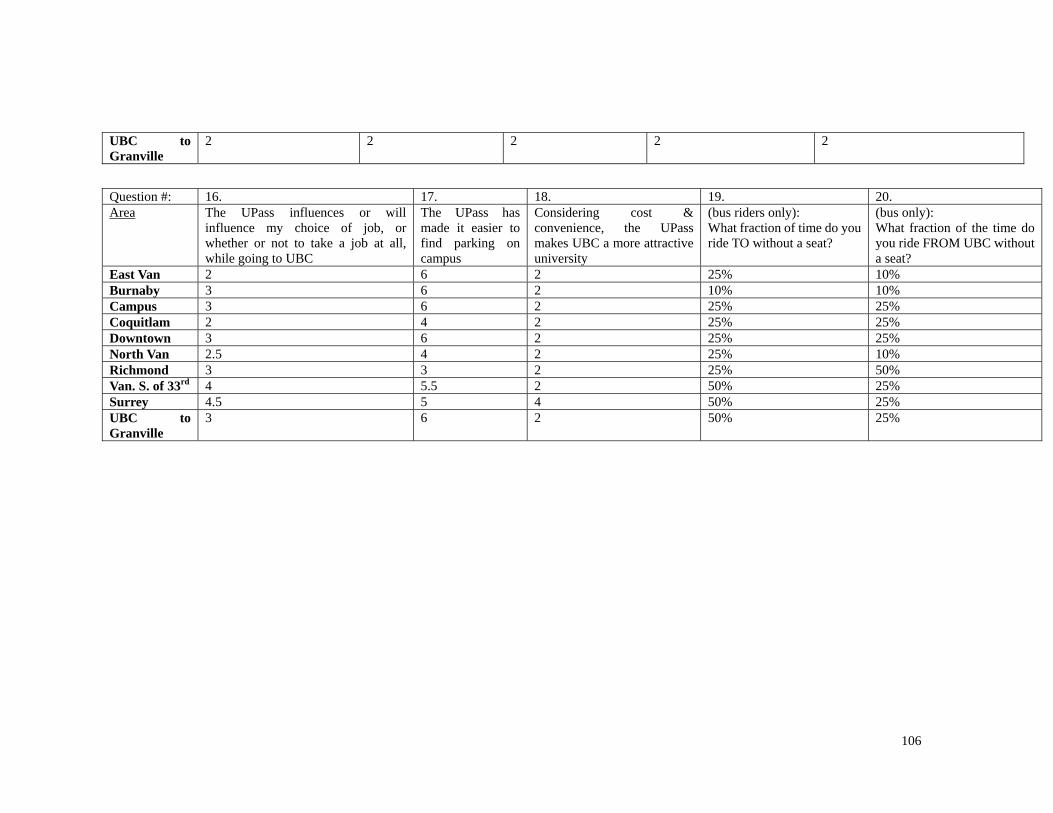
UBC toGranville
2 2 2 2 2
Question #: 16. 17. 18. 19. 20. Area The UPass influences or will
influence my choice of job, or whether or not to take a job at all, while going to UBC
The UPass has made it easier to find parking on campus
Considering cost &convenience, the UPass makes UBC a more attractive university
(bus riders only): What fraction of time do you ride TO without a seat?
(bus only): What fraction of the time do you ride FROM UBC without a seat?
East Van 2 6 2 25% 10%Burnaby 3 6 2 10% 10%Campus 3 6 2 25% 25%Coquitlam 2 4 2 25% 25%Downtown 3 6 2 25% 25%North Van 2.5 4 2 25% 10%Richmond 3 3 2 25% 50%Van. S. of 33rd 4 5.5 2 50% 25%Surrey 4.5 5 4 50% 25%UBC toGranville
3 6 2 50% 25%
106

Appendix B:
Appendix 1
107
Mode Split for UBC to Granville THIS YEAR (N=43)
Car2%
Carpool2%
Bus89%
Bike7%
CarCarpoolBusBike
Mode Split S. of 33rd (N=14)
car14%
carpool7%
bus79%
bike0%
carcarpoolbusbike
Mode Split North Van. (N=9)
car44%
carpool0%
bus56%
bike0%
carcarpoolbusbike
Mode Split East Van (N=42)
car9% carpool
5%
bus84%
bike2%
carcarpoolbusbike
Mode Split Burnaby (N=15)
car13%
carpool7%
bus80%
bike0%
carcarpoolbusbike
Mode Split for Downtown (N=7)
car0%
carpool0%
bus100%
bike0%
car
carpool
bus
bike

108
Mode Split Surrey (N=4)
car50%
carpool0%
bus50%
bike0%
carcarpoolbusbike
Mode Split Richmond (N=20)
car25%
carpool10%bus
65%
bike0%
carcarpoolbusbike
Mode Split Coquitlam (N=8)
car 25%
rpool25%
bus50%
bike0%
ca
car carpoolbusbike

Appendix C:
Main mode of Transportation to UBC during the last school year by mode chosen this year
0
10
20
30
40
50
60
70
80
90
car carpool bus bike live oncampus
not atUBC
othermode of transportation to ubc last year
num
ber o
f res
pond
ents car
carpoolBusbikelive on campus
Number of bus transfers needed to reach UBC from home
0
10
20
30
40
50
60
70
0 1 2 over 2 don't knownumber of transfers
num
ber o
f res
pond
ents car
carpoolbusbikelive on campus
109
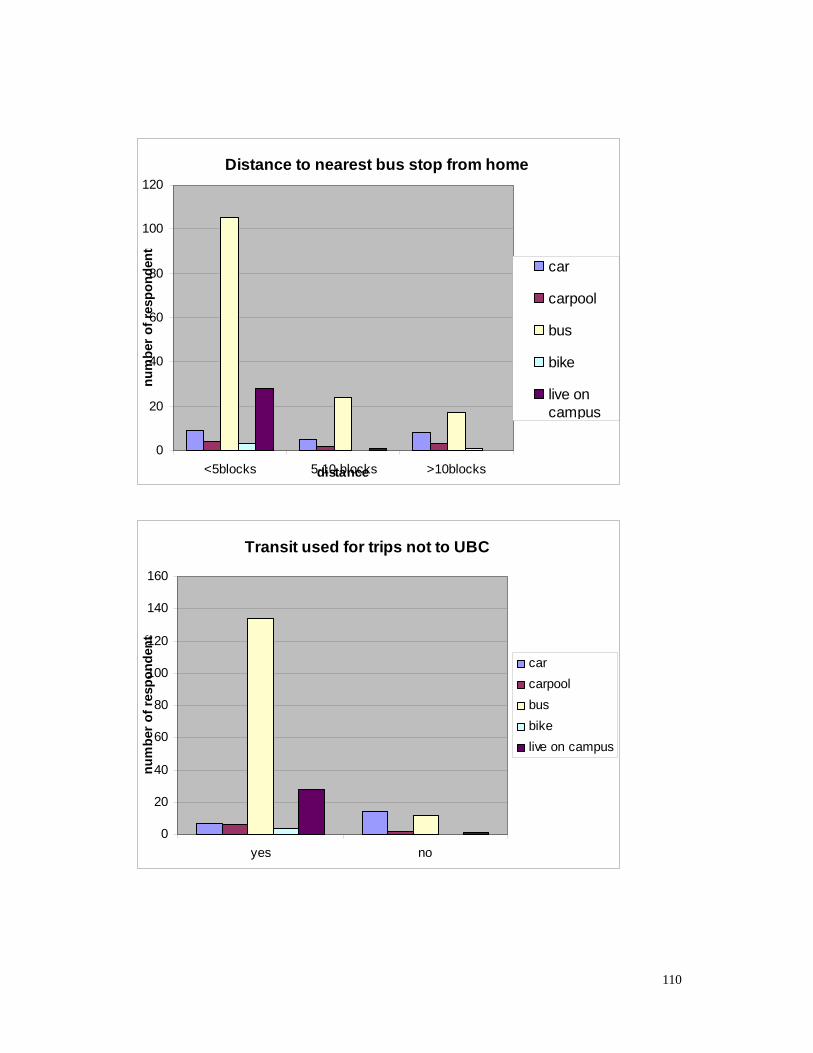
Distance to nearest bus stop from home
0
20
40
60
80
100
120
<5blocks 5-10 blocks >10blocksdistance
num
ber o
f res
pond
ents
car
carpool
bus
bike
live oncampus
Transit used for trips not to UBC
0
20
40
60
80
100
120
140
160
yes no
num
ber o
f res
pond
ents
carcarpoolbusbikelive on campus
110

I go home more often during breaks at UBC because of the U-Pass
0
10
20
30
40
50
60
stonglyagree
agree neutral disagree stronglydisagree
num
ber o
f res
pond
ents
car
carpool
bus
bike
live oncampus
I expect UPass to influence where I live next year
05
101520253035404550
stonglyagree
agree neutral disagree stronglydisagree
car
carpool
bus
bike
live oncampus
111

UPass will make or has made me less likely to own a car in Vancouver
0
10
20
30
40
50
60
70
stonglyagree
agree neutral disagree stronglydisagree
# of
resp
onde
nts
car
carpool
bus
bike
live oncampus
UPass makes it more convenient/pleasant ot get to campus
0
10
20
30
40
50
60
70
stonglyagree
agree neutral disagree stronglydisagree
# of
resp
onde
nts
car
carpool
bus
bike
live oncampus
112

UPass makes it easier to attend entertainment events off campus
0
10
20
30
40
50
60
3 4 3 5 6
stonglyagree
agree neutral disagree stronglydisagree
# of
resp
onde
nts
carcarpoolbusbikelive on campus
UPass makes it easier to attend entertainment events on campus
0
10
20
30
40
50
60
stonglyagree
agree neutral disagree stronglydisagree
# of
resp
onde
nts
car
carpool
bus
bike
live oncampus
113

UPass has enabled easier access to amenities (e.g. groceries)
0
5
10
15
20
25
30
35
40
45
stonglyagree
agree neutral disagree stronglydisagree
# of
res
pond
ents
car
carpool
bus
bike
live oncampus
The UPass influences or will influence my choice of job or whether to take a job while a student at
UBC
0
5
10
15
20
25
30
35
40
stonglyagree
agree neutral disagree stronglydisagree
don't know
# of
res
pond
ents
car
carpool
bus
bike
live oncampus
114

The UPass has made it easier to find parking on campus
0102030405060708090
100
stonglyagree
agree neutral disagree stronglydisagree
don'tknow
car
carpool
bus
bike
live oncampus
Considering cost and convenience, the UPAs makes UBC a more attractive university
010203040506070
stong
ly ag
reeag
ree
neutr
al
disag
ree
stron
gly di
sagre
e
don't
know
car
carpool
bus
bike
live oncampus
115
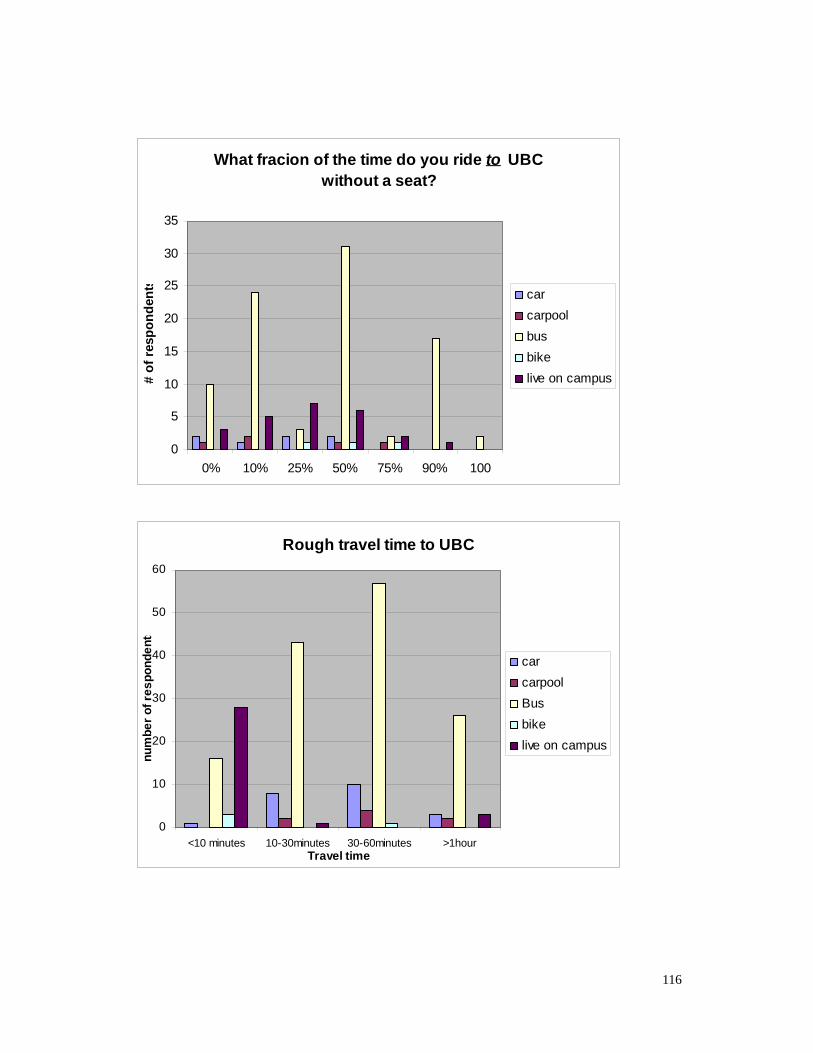
What fracion of the time do you ride to UBC without a seat?
0
5
10
15
20
25
30
35
0% 10% 25% 50% 75% 90% 100
# of
res
pond
ents car
carpoolbusbikelive on campus
Rough travel time to UBC
0
10
20
30
40
50
60
<10 minutes 10-30minutes 30-60minutes >1hourTravel time
num
ber o
f res
pond
ents
carcarpoolBusbikelive on campus
116

What fraction of the time do you ride from UBC without a seat?
0
5
10
15
20
25
30
35
40
45
0% 10% 25% 50% 75% 90% 100%
# of
res
pond
ents car
carpool
bus
bike
live oncampus
answer percentage breakdown for # of transfers made by car drivers
0
5
10
15
20
25
30
35
40
0 1 2 over 2 don't know
117

118

119

Appendix E
Map of GVRD
120

Bibliography
• “2001 Ontario Road Safety Annual Report Canadian Motor Vehicle Traffic Collision Statistics. 2001.” Canada Safety Council. 16 November 2003. <http://www.safety-council.org/info/traffic/stats2001.html>
• “Traffic congestion in Vancouver and surrounding areas” Passe-temps.ca. 16 January 2004. <http://www.passe-temps.ca/congestionmaps.html>
• “Transportation Facts.” Better Environmentally Sound Transportation. 10 November 2003. <http://www.best.bc.ca/>
• “Transportation, Air Issues and Human Health.” Pollution Probe. 29 April 2003. 1 December 2003. <http://www.pollutionprobe.org/Happening/pdfs/transportconf/town.pdf>
• Baxter, David and Jim Smerdon. “Housing Metropolitan Vancouver's Population:Demographics and Long Run Housing Demand, 1999 to 2040”. The Urban Futures Institute Report 42 November 1999: 2-3.
• Berechman, J. Public Transit Economics & Deregulation Policy. Amsterdam: Elsevier Science Pub. 1993: 27.
• Brown, J., D. B. Hess and D. Shoup. “Fare-free public transit at universities - An evaluation.” Journal of Planning Education and Research. 23.1 (2003 Fall): 69-82.
• Brown, Jeffrey et. al. “Unlimiteed Access.” Transportation. Netherlands: Kluwer Academic Publishers. 28(2001): 233-237.
• Brown, Jeffrey, Daniel Hess, and Donald Shoup. "Fare-Free Public Transit at Universities: An Evaluation." Journal of Planning Education and Research 23.1 (2003 Fall)
• City of Vancouver. Skytrain Expansion in Vancouver: A City Perspective. 16 February 2004. <http//www.city.vancouver.bc.ca/tran/compare_options.htm>
• Denike, Ken and Andrew Murphy. UBC Year 2000 Transportation Survey. Department of Geography, U.B.C. October 18th, 2000: 16.
• Denike, Ken. Travel Patterns to and from UBC and Response of Market Segments Collected via an Internet Web-based Scenario. Department of Geography, UBC.
• GVRD and Province of BC. Transportation Demand Management Measures
121

and Their Application in Greater Vancouver. March 1993. • GVRD Transportation Demand Management: 3 Forecast Modelling.
November 1994: 15. • GVRD. 2005 - 2007 Three-Year Plan& 10-Year Outlook Strategic
Transportation Plan Amendment. December 2003: 6-7. • GVRD-UBC Task Force. Memorandum of Understanding: Transportation. 25
October 2003. <www.ocp.ubc.ca> • Meyer, James and Edward A. Beimborn. An Analysis of the Usage, Impacts and
Benefits of an Innovative Transit Pass Program. 1998. • Miller, J. Transportation on College and University Campuses: A Synthesis of
Transit Practice. TCRP Synthesis 39, Transit Cooperative Research Program, Transportation Research Board. 2001.
• Ortuzar, Juan. Modelling Transport. UK: Wiley. Sussex. (2002): 287-289. • Poinsatte, Francois and Will Toor. Finding a New Way: Campus Transportation
for the 21st Century. 1999. • Pucher, John and Christian Lefevre. The Urban Transportation Crisis in Europe
and North America. London: MacMillan Press, 1996. • Shoup, Donald. "In Lieu of Required Parking" Journal of Planning Education and
Research. 18.4 (1999 Summer): 307-320. • Toor, Will. “The Road Less Traveled: Sustainable Transportation for
Campuses.” Planning for higher education. March-May 2003. 14 January 2004. <http://www.colorado.edu/cuenvironmentalcenter/temp/The_Road_Less_Traveled.pdf>
• Transportation Demand Management Measures and Their Potential for Application in Greater Vancouver. Jan 1993 technical report 2 page 85.
• Transportation Office of University of Washington. 2001-02 Washington U-Pass Annual Report. 12 January 2004. <http://www.washington.edu/upass/news_and_reports/reports.html>
• TREK UBC. Quick Facts: Cost of Driving. 5 January 2004. <www.trek.ubc.ca>
• TREK UBC. TREK UBC: About Us. 9 January 2004. <www.trek.ubc.ca> • UBC TREK Program Center. UBC Strategic Transportation Plan. November
1999. 20 January 2004. <http://www.trek.ubc.ca/>
122

• Urban Systems Ltd. Transportation Status Report – Fall 1997 to Fall 2003. UBC TREK Program Center. March 2004. 10 March 2004. <http://www.trek.ubc.ca/>
123
Related Documents