TRANSPORT SETA SECTOR SKILLS PLAN Update 2016/2017 01 August 2016(Final)

Welcome message from author
This document is posted to help you gain knowledge. Please leave a comment to let me know what you think about it! Share it to your friends and learn new things together.
Transcript

TRANSPORT SETA SECTOR SKILLS PLAN
Update 2016/2017 01 August 2016(Final)

344 Pretoria
Avenue
TETA House
Randburg
2194 Phone: 011 577 7000
Fax: 0867650514
Private Bag X
10016
Randburg
2125
Fraud-line: 0800221021
01 August 2016
TETA COVERING LETTER – Final SSP ANNUAL UPDATE – 2016/17. Dear Sir / Madam, Please be advised that the following has been undertaken in the second draft of the 2016/2017 SSP update (August submission):
1. Additions to the SSP include:
Consultations with the Stakeholders and an update of part of stakeholder engagement
An update on partnerships with TVETs, Universities, SETAs and other research institutions
Inclusion of the Continuous Improvement Action Plan for 2016 /17 as Annexure “A”;
Data collection instruments, data sampling and updated data; Inputs into the Pivotal Skills List for 2016/17 as Annexure “B” ; 2015/ 16 Belgian Cooperation (BTC) funded South African Candidates Tracer
study high level findings; An update of part of WSP and ATR data; An adjustment to all chapters of the SSP as instructed by both the SETA
Planning Review Panel and the Deputy Director of SETA support and Learnership Unit.
2. The following data gaps were realized: :
There are low participation rates into the submission of the WSP The WSP questionnaire itself, omits question which are critical to the sector
skills plan The time provided to collect data from other key sources such as the
Department of Labour, Presidential Infrastructure Coordinating Commission etc., was not sufficient
The recourse and plans for all these gaps have been dealt with in detail in Annexure 3 of the SSP document.
Yours Faithfully, CHIEF EXECUTIVE OFFICER CHAIRPERSON: TETA BOARD _________________________ _______________________ Mrs Maphefo Anno-Frempong Mr June Dube Date: 01 August 2016 Date: 01 August 2016
Page | 3
FOREWORD The Transport Sector Education and Training Authority (TETA) is a social partnership, led by TETA Board from business, trade unions and government. Our strategic objectives are to: • Maximise the impact of employment and skills development intervention programmes and employer behaviour to support jobs and economic growth and to have an internationally competitive skills base in the Transport Sector; • Work with TETA employer constituencies to develop the best labour market solutions which leverage greater investment in up skilling people in the Transport Sector; • Provide outstanding labour market intelligence which helps TETA constituency employers and people to make the best choices for them. The TETA 2016/17 Sector Skills Plan (SSP) Update has been prepared in accordance with the National Skills Development Strategy III as well as the Department of Higher Education and Training Guidelines and Framework for the development of Sector Skills Plans. The SSP is developed based on thorough research and a sound information base. It is a comprehensive statement of the labour market trends, supply and demand dynamics and growth prospects of the entire transport sector in South Africa. A thorough research process involving interviews with a large selection of Sector Key Informants and a survey of member companies was conducted in May to June 2016. Focus Groups Discussions (FGDs) with members of the eight sub-sectors were integrated into this year`s SSP. Sharing the findings of our research and engaging with our audience is important to further develop the evidence on which we base our work. Evidence Reports are our chief means of reporting our detailed analytical work. We hope you find this report useful and informative. If you would like to provide any feedback, or have any queries please e-mail: [email protected], quoting the report title or ISBN number or Volume. CHIEF EXECUTIVE OFFICER CHAIRPERSON: TETA BOARD _________________________ _______________________ Mrs Maphefo Anno-Frempong Mr June Dube Date: 01 August 2016 Date: 01 August 2016

Page | 4
Acronyms
ABET Adult Basic Education and Training
ATR Annual Training Report BBBEE Broad Based Black Economic Empowerment DBSA Development Bank of Southern Africa DHET Department of Higher Education and Training ETQA Education and Training Quality Assurance FET Further Education and Training FGDs Focus Groups Discussions GDP Gross Domestic Product HET Higher Education Training HRDSA Human Resource Development Strategy for South Africa HSRC Human Sciences Research Council IPAP Industrial Policy Action Plan MOU Memorandum of Understanding NDP National Development Plan NGP New Growth Path NQF National Qualifications Framework NVC National Certificate Vocational NSDS National Skills Development Strategy OFO Organising Framework for Occupations PFMA Public Finance Management Act PIVOTAL Professional, Vocational, Technical and Academic Learning QCTO Quality Council for Trades and Occupations QES Quarterly Employment Survey QLFS Quarterly Labour Force Survey RPL Recognition of Prior Learning SARS South African Revenue Services SAQA South African Qualifications Framework SDL Sector Development Levy SETA Sector Education and Training Authority SIC Standard Industrial Classification SIPs Strategic Integrated Projects SMME Small, Medium and Micro Enterprises SDF Skills Development Facilitator SSP Sector Skills Plan STATS SA Statistics South Africa TETA Transport Sector Education and Training Authority TVET Technical Vocational Education and Training WSP Workplace Skills Plan
Page | 5
Executive Summary
The Sector Skills Plan (SSP) is a sector report which serves as a guiding document for skills improvement. It is a continuously improving record of the performance of Transport Sector Education and Training Authority (TETA) as per Act 97 of 1998. In compiling the 2016/17 SSP for Transport, data were gathered through mixed methods from a variety of sources, surveys and desktop literature reviews. Key Findings: The transport sector contributes significantly to the economy of South Africa in terms of the country’s Gross Domestic Product (GDP) and employment. Since 2012, the Transport sector contributes approximately 9% to the country’s GDP. The sector revenue contribution increased from R 242 billion in 2012 to about R 256 billion in 2015. At the same time, this sector is home to 6% of the working labour force of the country. Gauteng Province serves as the province with the highest economic and labour activity for the transport sector. The coastal provinces of Kwazulu Natal, Western Cape and Eastern Cape, which are largely driven by ocean related business, trail directly behind Gauteng. As noted in earlier SSPs, the Transport sector continues to be among the least gender transformed sector. Between 2015 and 2016, gender and racial transformation was estimated to have increased by less than 1% of total employment in favour of previously disadvantaged groups. Consequently, it is recommended that TETA continues to review interventions aimed at empowering the formerly disadvantaged groups in order to monitor achievements of intended goals. Statistics South Africa (STATS SA) and South African Revenue Services (SARS) have identical definitions of the sector which covers all transport forms. On the other hand, the definition provided by Department of Higher Education and Training (DHET) and TETA tends to include other support businesses whose core business is not transport. The differences in definitions have the potential to mislead the TETA during allocation of skills development funds. The study also found some inconsistencies with sector data management. The nomenclature in Standard Industry Classification (SIC) codes used by DHET to allocate various businesses is not consistent with the one used by STATS SA for the same subsectors. This disparity will always manifest itself as a challenge in sector comparisons both domestically or with internationally based sectors. Similarly, the study also found that the definition of scarce skills was not consistently applied in the eight subsectors. TETA has a universal definition of skills scarcity. Integration of the definitions from all subsectors into the current universal definition will provide both TETA and DHET the basis on which the labour scarcity should be understood. Demand and supply of labour in the sector are highly affected by socio-economic and policy factors such as education levels and government regulations (Broad Based Black Economic Empowerment). TETA and its subsectors has a key role as a support sector to all other sectors to play in the country’s development and growth strategy as outlined in the National Development Plan. The Workplace Skills Plan (WSP) and Annual Training Report (ATR) survey dictate very small
Page | 6
samples for skills demand estimations and lack the ability to capture emerging sectorial trends, the sector ought to consider a different reporting framework to increase coverage. The traditional education institutions are not adequate suppliers of sector skills demand. Smaller and privately owned training institutions appear better positioned to accommodate sector context in their curriculum than traditional education institutions. The SSP recommends the sector needs to work towards building the capacity of key training institutions such as Universities and TVET colleges in developing curriculums that are relevant to sector needs. The SSP makes the following recommendations: TETA is urged to coordinate the process of standardizing the definition and industry classification codes in order to improve communication and coordination among the various institutions, namely DHET, SARS and STATS SA. It is recommended that TETA reviews its sector information collection process to increase the sample size and collect data which is more indicative of industry trends. TETA should coordinate capacity building in data collection systems, monitoring and evaluation among the TETA subsectors It is recommended that TETA should facilitate the process of curriculum modification; a process which should be a joint effort between employers and training providers. Interventions to improve the participation of formerly disadvantaged population groups appear to be having small effect and therefore more effort is required to achieve greater effectiveness. A number of TVET colleges are supported by TETA throughout the provinces to build the capacity of assessors, moderators and facilitators, and yet there is need to standardize and improve the quality of the training programmes from the TVETs.
CHIEF EXECUTIVE OFFICER CHAIRPERSON: TETA BOARD _________________________ _______________________ Mrs Maphefo Anno-Frempong Mr June Dube Date: 01 August 2016 Date: 01 August 2016
Page | 7
Contents FOREWORD ............................................................................................................................................. 3
Acronyms ................................................................................................................................................ 4
1 Chapter 1: Sector Profile ................................................................................................................. 1
1.1 Scope of Coverage .................................................................................................................. 1
1.2 Key Role-Players ...................................................................................................................... 3
1.2.1 Key Employers and Contributors .................................................................................... 3
1.2.2 Other Role Players .......................................................................................................... 4
1.3 Economic Performance ........................................................................................................... 7
1.4 Employer Profile ...................................................................................................................... 7
1.4.1 Employer Sizes ................................................................................................................ 9
1.5 Location of Employers ........................................................................................................... 10
1.5.1 Future Outlook of the Sector ........................................................................................ 11
1.5.2 Labour Market Profile Dynamics and Spread of Employment in the Sector ................ 12
1.6 Employment by Race and Gender in the Transport Sector .................................................. 16
1.7 Some Measurable Trends ..................................................................................................... 17
1.8 Lessons from chapter 1 ......................................................................................................... 19
2 Chapter 2: Key Skills Issues ........................................................................................................... 20
2.1 Introduction .......................................................................................................................... 20
2.2 Research Methods Applied ................................................................................................... 20
2.3 The Change Drivers ............................................................................................................... 20
2.3.1 Government legislation and regulations ....................................................................... 20
2.3.2 Entry of SMMEs into the industry ................................................................................. 20
2.3.3 Black Economic empowerment .................................................................................... 21
2.4 Green Economy ..................................................................................................................... 22
2.5 Technological advances ........................................................................................................ 22
Communicable Diseases (CDs) and Non-Communicable Diseases (NCDs ........................................ 22
2.6 Strategic Integrated Project (SIP) .......................................................................................... 23
2.6.1 Southern African Rail Network ..................................................................................... 23
2.7 Alignment with National Strategies and Plans ...................................................................... 25
2.8 Conclusion ............................................................................................................................. 27
3 Chapter 3: Extent of Skills Mismatches ......................................................................................... 28
3.1 Introduction .......................................................................................................................... 28

Page | 8
3.2 Extent and nature of Demand in the Transport Sector ........................................................ 28
3.3 What occupations have vacancies and Which Open Vacancies are hard to fill? ................. 29
3.4 What are the occupational wage trends? ............................................................................. 31
3.5 What are conditions of employment trends? ....................................................................... 33
3.6 How is migration impacting on the Sector? .......................................................................... 34
3.7 The extent of occupational skills supply in the Sector .......................................................... 34
3.7.1 What is the extend of occupational skills supply in the sector ..................................... 35
3.7.2 What is the State of Education and Training Provision ................................................ 35
3.7.3 What Supply Problems are firms experiencing ............................................................. 37
3.8 Identification of Skills gaps ................................................................................................... 38
3.8.1 Introduction .................................................................................................................. 38
3.8.2 What is the Extent of Scarcities within the Transport Sector ....................................... 39
3.9 Lessons from Chapter 3 ........................................................................................................ 49
4 Chapter 4: Sector Partnerships ..................................................................................................... 50
4.1 Introduction .......................................................................................................................... 50
4.2 Existing Partnerships ............................................................................................................. 50
4.3 Existing partnerships from the subsectors/chambers (2015/2016) ..................................... 51
4.4 Achievements and Challenges .............................................................................................. 54
4.5 New Parnerships ................................................................................................................... 54
5 Chapter 5: Skills Priority Actions .................................................................................................. 56
5.1 Findings from Chapter Two: Key Skills Issues ....................................................................... 57
5.2 Findings from Chapter Three: Extent of Skills Mismatches .................................................. 58
5.3 Findings from Chapter Four: Partnerships ............................................................................ 60
5.4 Recommended Actions ......................................................................................................... 60
Bibliography.......................................................................................................................................... 61
ANNEXURE 1: PIVOTAL SKILLS ANNEXURE 2: SCARES SKILLS ANNEXURE 3: CONTINUOUS IMPROVEMENT PLAN ANNEXURE 4: CRITICAL SKILLS

Page | 9
List of Figures Figure 1.1: Total Levy contribution by subsector ...................................................................... 3 Figure 1.2: Degree of Sector Unionization ................................................................................. 5 Figure 1.3: Percentage Distribution of formally registered businesses within the Transport Sector ......................................................................................................................................... 8 Figure 1. 4: Number of businesses disaggregated by reporting status ..................................... 8 Figure 1.5: Proportion of SDL payers across subsectors ............................................................ 9 Figure 1.6 : SDL Paying Businesses within the Transport Sector ............................................. 10 Figure 1.7. Percentage of Companies ...................................................................................... 11 Figure 1.8: Sector Employment performance in the year 2015 .............................................. 12 Figure 1.9: Human Resource Cost vs. Technology & Mechanisation Cost Ratio to Revenue (2025/2016) ............................................................................................................................. 13 Figure 1. 10 : Number of Employees in the Transport Sector per province (2014-15) ........... 14 Figure 1. 11: Occupation and Age distribution in 2015 ........................................................... 15 Figure 1. 12 : Occupation and Age Distribution in 2016 .......................................................... 16 Figure 1.13 : Number of employees in the Transport Sector by Gender ................................ 16 Figure 1.14 : Employment by Race and Gender proportion in the Transport Sector (2013-14).................................................................................................................................................. 18 Figure 1.15 : Change in Employment numbers across Sectors (2014-15) ............................... 19 Figure 3. 1: Average Monthly Earnings including Bonuses (QES, 2014) ................................. 32 Figure 3.2: Average Monthly Earning including bonuses (QES, 2016) ................................... 32 Figure 3. 3: Formal vs. Informal Employment in the Transport Sector ................................... 33 Figure 3. 4: Skills mismatch ..................................................................................................... 35 Figure 3. 5: Concentration of TETA Training Providers by Region ........................................... 37 List of Tables Table.1.0: Estimated Completeness of the WSP/ATR data of Transport Subsectors (2016/17)… (Research Processes and Methods) Table 1.1: STATS SA Official SIC codes ....................................................................................... 2 Table 1.2: DHET Official SIC Codes ............................................................................................. 2 Table 1.3: Location of the top 20 Levy Contributors by subsector ............................................ 3 Table 1.4: The Top 20 Employers in the Transport Sector ........................................................ 4 Table 1.5: Implications of Union Activity ................................................................................... 5 Table 1.6: Contribution of the Transport Sector to the GDP ..................................................... 7 Table 1 7: Share of Labour Market: 2013/2015 Financial year ............................................... 14 Table 1.8: Change in racial Proportions (2015-2016 Financial year) ....................................... 17 Table 1.9 : Employment by Race and Gender (2013-14) ......................................................... 17 Table 3.1: Estimate of Sector Skills Demand ........................................................................... 30 Table 3.2: Annual estimate of skills Surplus and Deficit .......................................................... 31 Table 3.3: Transport Subsectors 10(ten) most Scarce Skills List .............................................. 42 Table 3.4: The resultant PIVOTAL list is as follows: ................................................................ 47 Table 4. 1: TETA existing partnerships with Universities and TVET colleges .......................... 50 Table 4. 2: Maritime subsector partnerships withTVET, HET and SETA ................................. 52
Page | 10
Research Process and Methods: Compilation of the Transport Sector Skills Plan 2016/2017
Design of the Study
A cross sectional study design was adopted as appropriate for responding to the Sector Skills Plan (SSP) for 2016 to 2017. This design is relevant since the data is required for a “situational status” for a short defined period of time. The data was gathered during the months of March to June 2016. Similarly, the approaches were mixed methods consisting of literature reviews of secondary data analysis, using qualitative and quantitative approaches. The literature review has played a key role in the inputs to the five chapters which seek to discuss the sector profiles, key skills issues, skills mismatch, sector partnerships and a description of priority actions. Reports and databases were important sources of data for statistical analyses that provided inputs to the five chapters. Statistical software (for example, STATA) was used to synthesize data gathered through the Workplace Skills Plan (WSP) and the Annual Training Report (ATR). Qualitative data gathered through group discussions and in-depth interviews have formed an important input into this report.
Objectives of the study
The objective of the study was for TETA to meet its obligations as outlined in the Skills Development Act (Act 97 of 1998) which requires TETA to prepare and submit its Sector Skills Plans (SSPs) to the Department of Higher Education and Training. According to the Act, the TETA is expected to submit an annual plan on the status of skills in the Transport Sector.
Data collection tool
Most of the data were gathered from secondary data sources; namely, government departments and institutions, universities and similar entities that gather data targeting national levels. Reports gathered from these institutions provided raw data for the plan document. Two tools were developed to gather data. The first tool was used to gather data from planning workshops. The workshops solicited inputs from representatives of the different transport subsectors. The workshops were conducted with key stakeholders in provinces where there is a high volume of stakeholders. Hence, the workshops were conducted in Port Elizabeth (Eastern Cape Province), Cape Town (Western Cape Province), Durban (KwaZulu-Natal), Polokwane (Limpopo) and Johannesburg (Gauteng) in the months of April and May 2016. The purpose of the tool was to gather data along the lines of the 10 key question that sought data on the following; A list of 12 scarce skills in the sub-sectors.
Page | 11
Factors that ‘drive’ scarcity of skills in the different sub-sectors? (E.g. duration of training).
The relationship between subsector human resource decisions versus government policies , competition in the industry, BBBEE, Growth of SMEs (quantity and strength), change in Technology, Climate Change
Performance of university graduates in the industries. Response of training institutions in providing appropriate skills in the transport industry. How the education and training systems can be fine-tuned to produce a skilled
workforce to make firms competitive? General listing of most critical skills for your industry. How human resource investment in training and capacity building positively affected
human development as far as this skill is concerned and explanations of how the industry has dealt with this.
The second tool, directed at professional bodies and captains of industries was used to gather data through a survey. The survey was conducted of the professional bodies corresponding to the 8 subsectors of TETA as well as captains of the Transport industry. The data gathered were structured along the lines of the chapters of the report as required by DHET. The indicators were expected to gather data on broad topics such as, economic performance of the sector, employer profile and labour market issues.
1. Sample Size and Scope of the study
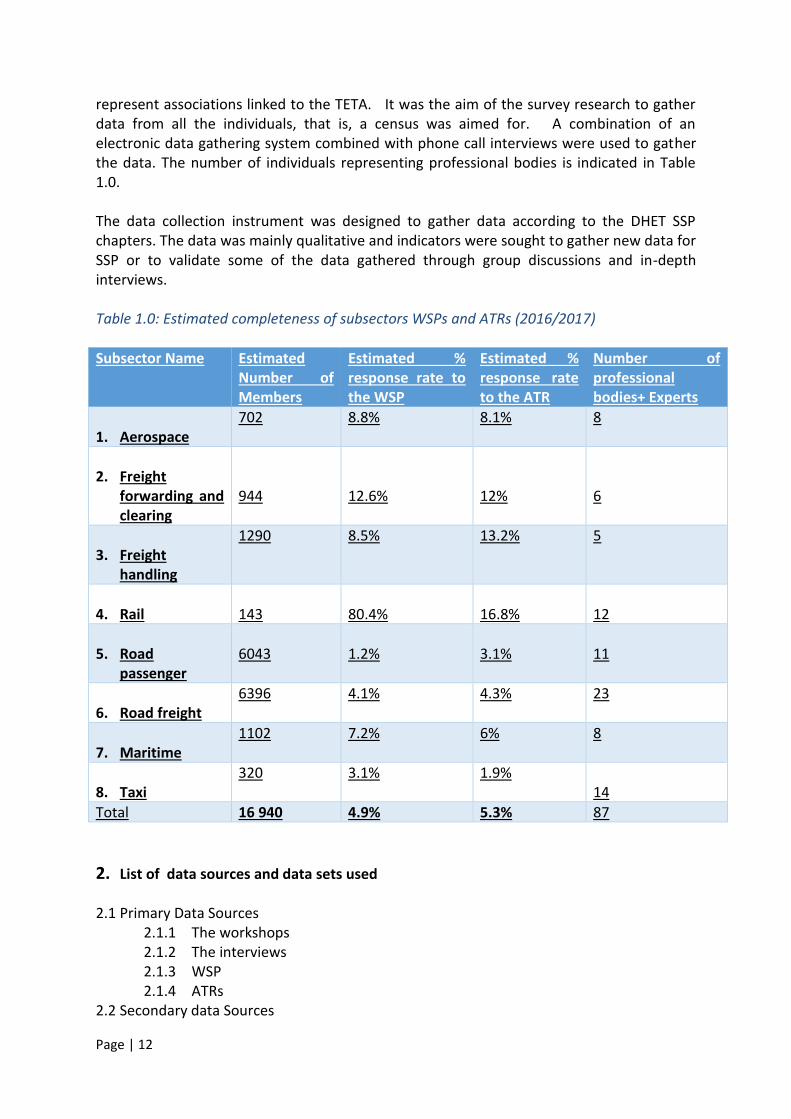
1.1 Sampling from Workplace Skills Plans (WSP) & the Annual Training Reports (ATR) The transport sector consists of 8 subsectors. On an annual basis, TETA gathers quantitative data from the 8 subsectors. The data is compiled into a database that is classified according to number of employees in the company, its provincial location, chamber or subsector, SIC code and SDL number. Though the database is with varying completeness, it has been used to calculate the response rate of the companies in each of the subsectors (Table 1.0). As with WSP, TETA expects to receive annual reports from subsectors, that is, ATRs from the 8 subsectors participating companies. Table 1.0 provides an estimation of companies that participated in the TETA reporting systems for 2016. From the table, it is noted that response rates for the WSP and ATR are only a small fraction of the total from all subsectors. For instance, from an estimated 16,940 companies, just less that 5 percent of companies provide data for reporting. Similarly, just over 5 percent of companies report their ATRs. Therefore, the table serves to indicate the level of completeness of the data. Given the state of databases, the number of cases used from the WSP and ATR databases depend more on the completeness of the report and less on a designed sample. 1.2 Sampling Scheme from the survey research Primary data were also gathered from professional bodies or individuals who represented professional bodies. Initial data indicated that there were 87 individuals that could
Page | 12
represent associations linked to the TETA. It was the aim of the survey research to gather data from all the individuals, that is, a census was aimed for. A combination of an electronic data gathering system combined with phone call interviews were used to gather the data. The number of individuals representing professional bodies is indicated in Table 1.0. The data collection instrument was designed to gather data according to the DHET SSP chapters. The data was mainly qualitative and indicators were sought to gather new data for SSP or to validate some of the data gathered through group discussions and in-depth interviews. Table 1.0: Estimated completeness of subsectors WSPs and ATRs (2016/2017)
Subsector Name Estimated Number of Members
Estimated % response rate to the WSP
Estimated % response rate to the ATR
Number of professional bodies+ Experts
1. Aerospace
702 8.8% 8.1% 8
2. Freight
forwarding and clearing
944
12.6%
12%
6
3. Freight
handling
1290 8.5% 13.2% 5
4. Rail
143
80.4%
16.8%
12
5. Road
passenger
6043
1.2%
3.1%
11
6. Road freight
6396 4.1% 4.3% 23
7. Maritime
1102 7.2% 6% 8
8. Taxi
320 3.1% 1.9% 14
Total 16 940 4.9% 5.3% 87
2. List of data sources and data sets used
2.1 Primary Data Sources 2.1.1 The workshops 2.1.2 The interviews 2.1.3 WSP 2.1.4 ATRs
2.2 Secondary data Sources
Page | 13
2.2.1 StatsSA Publications 2.2.2 Infrastructure Development Plans 2.2.3 The White Paper on Post School Education and Training 2.2.4 Labour statistics
3. Time Frame of the study: The time frame for putting together the different aspects of SSP was largely guided by the guidelines provided by the Department of Higher Education and Training. The guidelines set SSP planning cycle outputs and the timelines. Specifically, data for compiling the SSP were gathered in the months of March to June 2016.
4. Limitations of data and methods
The strength of conclusions strongly hinges on the quality of data that were gathered. Therefore, it is important to note the limitations of the data gathering processed of the data that fed into the SSP. Some of these are outlined below. The data had gaps in terms of the key elements of data quality, that is, validity,
reliability, Integrity, precision, timeliness and completeness. These elements of data quality were not tested for all the data used. One of the elements that was lacking was completeness as was evident from the ATR and the WPS. The data also had duplicated cases that needed to be checked.
The lack of standardization in the data gathering process is a gap that will need
attention. For instance, the workshops will need to be standardized for participation and the tools for gathering qualitative data also need standardization. The process will involve a quality improvement process which will use the previous instrument to improve the next one.
The response rate for the first attempt to gather data from associations associated with the TETA subsectors yielded an extremely low response rate.
Therefore, the issue of reporting data may call upon TETA to train the chamber members on how to improve their data gathering processes, analysis and reporting at their levels.

Page | 1
1 Chapter 1: Sector Profile 1.1 Scope of Coverage
1.1.1. Introduction Chapter one outlines the South African economy within the context of the Transport Sector, providing a synopsis of economic performance, employer and employee profile, trends and patterns, skills supply and demand in the sector. This chapter will also highlight the implications relating to Skills Development. Therefore, cover on the reporting based on the Transport Education and Training Authority (TETA) using Standard Industrial Classification codes (SIC codes). 1.1.1.2. Scope of the Transport Sector The definition of this sector includes the provision of passenger or freight transport, whether scheduled or not, by rail, pipeline, road, water or air and associated activities such as terminal and parking facilities, cargo handling etc. Included in this section is the renting of transport equipment with a driver or an operator, postal and courier activities (STATS SA, 2013). According to the Standard Industry Classifications, as published by both STATS SA and SARS, this sector excludes maintenance and repair of motor vehicles and other transportation equipment (see classes 4520 and 3315 of the SIC, respectively), the construction, maintenance and repair of roads, railroads, harbours, airfields (see classes 4210 and 4290 in the STATS SA SIC codes), as well as the renting of transport equipment without driver or operator (see classes 7710 and 7730) (STATS SA, 2013). On the other hand, the Transport Education and Training Authority’s definition of the Sector includes all of the provision of passenger or freight transport, whether scheduled or not, by rail, pipeline, road, water or air and associated activities such as terminal and parking facilities, cargo handling, and even postal and courier activities. However, the definition provided by the Transport Sector Education and Training Authority (SETA) also includes support business such as, repair and maintenance of harbours and airports, Forwarding and Clearing etc.; whereas the STATS SA and SARS excludes these (as indicated above) The TETA definition is synonymous to the International Industry Classification definition which includes the following:
Land Transport; Transport via Pipelines
Water Transport
Air Transport
Supporting and Auxiliary Transport Activities; Activities of Travel Agencies
Post and Telecommunications (ILO, 2016) The Transport SETA, together with other SETAs, however, is governed by the Department of Higher Education and Training (DHET). The official South African Standard Industry Classification Codes (SICs) which are normally published by STATS SA are actually not compatible to the SIC codes used to classify the same sectors and subsectors by DHET to allocate different businesses to the relevant SETAs. Table 1.1 shows a sample of the South African SIC codes as published by Statistics SA, describing the Transport Sector.

Page | 2
Table 1.1: STATS SA Official SIC codes
Code Description of activity
Section H Transportation
49 Land Transport and Transport via pipelines
491 Transport via railways
4911 Passenger rail Transport, interurban
49110 Passenger rail Transport, interurban
49110 Passenger Transport by inter-urban railways (for passenger Transport by urban and suburban transit systems, see 4921)
49110 Operation of sleeping cars or dining cars as an integrated operation of railway companies (for operation of sleeping cars or dining cars when operated by separate units, see 5590, 5610)
49120 Freight Transport on mainline rail networks as well as short-line freight railroads
492 Other land Transport
4921 Urban and suburban passenger Transport (for passenger Transport by inter-urban railways, see 4911)
49210 Urban and suburban passenger Transport (for passenger Transport by inter-urban railways, see 4911)
Source: STATS SA Sector SIC Codes, 2016 On the other hand, Table 1.2 shows a sample of SIC codes as applied by the Department of Higher Education and Training for the use of various SETAs. Table 1.2: DHET Official SIC Codes
Transport Education and Training Authority
SIC Code
Description
13100 Ocean and Coastal Fishing
71112 Railway Commuter Services
71200 Other Land Transport
71201 Land Transport
71211 Urban, Suburban and Inter-Urban Bus and Coach Passenger Lines
71212 School Buses
71221 Taxis
71230 Freight Transport by Road
71232 Freight Forwarding and Clearing
71300 Transport via Pipelines
72000 Water Transport
72111 Coastal Shipping
Source: DHET SETA SIC codes, 2016 Table 1.1 and 1.2 above are intended to describe the same Sector. However, it can be observed how distinct the SIC codes are from each other though describing same activities. This disparity in coding has the potential to become a challenge in both business operations and for purposes of research.

Page | 3
The mismatch in data classification among the three key organizations (DHET, STATS SA and SARS) can pose difficulties in the planning process difficult. It can also exasperate TETA’s efforts in intervention designing and financial planning. 1.2 Key Role-Players 1.2.1 Key Employers and Contributors According to SARS 2016 annual SDL (Skills Development Levy) report, the top 20 biggest contributors to skills development levy in the Transport Sector account for about 47% of the market share (by revenue) of the Sector. Table 1.3 below shows top 20 biggest contributors according to their subsectors. Table 1.3: Location of the top 20 Levy Contributors by subsector
Subsector Number of Businesses
Aerospace 5
Freight handling 2
Rail 4
Road freight 6
Road passenger 3
Total 20
Source: SARS 2016 Annual SDL Report Figure 1.1. below shows sector contribution to skills development levy in 2016 by subsector. It is noted that the biggest contributor is the rail subsector as far as sector skills levy is concerned. The figure also shows that although the taxi subsector is known to be the most common and historically the most important local transporter of millions of employees across the country; the subsector makes the least contribution to skills development. Figure 1.1: Total Levy contribution by subsector
Source: TETA SSP, 2016/2017 Furthermore, out of the list of levy contributors, Table 1.4 below shows the top twenty biggest employers in the Transport Sector in 2016.
RailAerospa
ceRoad
Freight
RoadPasseng
er
FreightHandlin
g
Forwarding &
ClearingMartime Taxi
Contribution R 165,40 R 39,30 R 35,10 R 25,70 R 24,00 R 16,80 R 10,50 R 0,80
R 165,40
R 39,30 R 35,10 R 25,70
R 16,80 R 10,50 R 0,80
R -
R 20,00
R 40,00
R 60,00
R 80,00
R 100,00
R 120,00
R 140,00
R 160,00
R 180,00
Mil
ZAR
Figure 1.1 : Total levy contribution by subsector

Page | 4
Table 1.4: The Top 20 Employers in the Transport Sector
Employer Trading Name Sum of Females
Sum of Males
Total Employees
TRANSNET SOC LTD 12803 41521 54324
TRANSNET SOC LTD (TFR) 8069 28993 37062
TRANSNET SOC LTD 3 (TE) 2660 8782 11442
TRANSNET SOC LTD (TPT) 1869 5583 7452
Imperial Logistics Shared Services a division of Imperial Group Ltd
933 5663 6596
South African Airways Pty Ltd 2702 2624 5326
Wits Metrorail 1845 3101 4946
Phakisa Freight Management Services pty ltd 858 3427 4285
Cape Metrorail 1614 2537 4151
G4s Cash Services Sa Pty Ltd - Head Office 1212 2749 3961
TRANSNET SOC LTD (TNPA) 1159 2501 3660
Putco Ltd 445 3144 3589
Vector Logistics Pty Ltd
719 2800 3519
Uti 1107 2118 3225
Airports Company Limited1 1269 1556 2825
Tfd Network Africa Pty Ltd 660 2085 2745
Golden Arrow Bus Services_pty Ltd 395 2192 2587
Ram Transport South Africa 489 2028 2517
Swissport South Africa 697 1643 2340
Source: TETA WSP, 2016/2017 From Table 1.4 above, the top four biggest employers are state-owned entities. This certainly makes the state parastatals a key stakeholder in skills development. This can also suggests that the Transport SETA (which is also state-owned) can have potentially more political leverage when making and implementing policies and, perhaps less resistance. 1.2.2 Other Role Players 1.2.2.1 Trade Unions
Trade unions in South Africa have a history dating back to the 1880s. From the beginning, unions could be viewed as a reflection of the racial disunity of the country, with the earliest unions being predominantly for white workers. Through the turbulent years of 1948–1991 trade unions played an important part in developing political and economic resistance, and eventually were one of the driving forces in realising the transition to an inclusive democratic government. Today trade unions are still an important force in South Africa, with 3.6 million members representing 25.3% of the formal work force (STATS SA, 2015). In the transport sector 48% of the work force is registered with a trade union, whiles the average across all sectors is

Page | 5
35% (STATS SA, 2015). Figure 1.2 below, shows that the Transport sector is the fourth most unionized sector out of 10 sectors. Figure 1.2: Degree of Sector Unionization
Source: TETA SSP, 2016/2017 In theory, a strong trade union presence in a sector is likely to have the following effects on skills development and economic performance: Table 1.5: Implications of Union Activity
Effect Implication to Skills development
Unions normally make it difficult to fire existing employees
The recruitment process is not perfect. Employers may get reluctant to recruit unexperienced candidates if it will be too stressful to replace them, or if it is too costly and time consuming to hire in the first place
Unions can complicate the hiring process and increase hiring costs.
Unions increase the human resource bill by increasing the non-wage costs of employees.
Unions generally stimulate and drive the up-ward movement in salary levels, sometimes notwithstanding business performance.
Artificial increases in cost of labour can destabilize the economic performance of business and exaggerate the cost of developing skills.
Unions are a way to balance power dynamics in the labour market
This assures fair treatment of employees (especially new and unexperienced individuals).
Unions can help regulate critical labour relation issues and protect employer rights.
Source: TETA SSP, 2016/2017
3,40%
9,60%
10,50%
23,70%
24,00%
38,30%
48,20%
55,70%
56,90%
78,50%
Private households with employed persons
Agriculture, hunting, forestry and fishing
Construction
Wholesale and retail trade
Financial, insurance, real estate and…
Manufacturing
Transport, storage and communication
Electricity, gas and water supply
Community, social and personal services
Mining and quarrying
Figure 1.2: Degree of Sector Unionization
Page | 6
According to SARS labour report of 2016, an average of 74.9% of employees who are registered with unions had their salary increases negotiated by the unions. Applying this in the Transport sector, it means only 35% (0.482 x 0.749) of the total work force in the Transport sector had its salary increases negotiated by unions. This certainly dilutes the extent and strength of union influence in the transport sector. Whereas trade unions are primarily for the benefit and protection of employees (demand side); professional bodies serve to regulate and standardize professional conduct; thereby setting employee performance standards. This is done through the regulation of operating licences and technology appropriateness within specific subsectors. Consequently, professional bodies are leaders in identifying skill needs, developing new skills and driving certification of specialized skills. In the Transport sector, subsectors such as Maritime and Rail depend on many specialized skills and therefore rely on various professional bodies to regulate matters of skill development and licencing.

Page | 7
1.3 Economic Performance Transport Sector plays both a direct and an indirect role in South Africa economic performance. Table 1.6 below shows a summary of revenue contributions to South African GDP per Sector, as measured by total turnover. It is noteworthy that the Transport Sector’s revenue contribution has been on an increase in nominal terms since 2012, contributing R 242 bill in 2012 to about R 256 mil in 2015. However, the Sector has not grown in relative terms; the percentage contribution has remained the same. In the year 2015, the Transport Sector was the 7th largest contributor in the country, above Mining and Quarry, Personal Services and Construction. Table 1.6: Contribution of the Transport Sector to the GDP
Sector % contribution 2012/13
2012/13 (R bill)
% contribution 2013/14
2013/14 (R bill)
% contribution 2014/15
2014/15 (R bill)
% contribution 2015/16
2015/16 (R bill)
Finance, real estate and business Services
21% R 561 22% R 578 22% R 591 22% R 607
General Government Services
17% R 437 17% R 451 17% R 464 17% R 468
Wholesale, retail and motor trade;catering andaccomodation
15% R 398 15% R 405 15% R 411 15% R 416
Manufacturing 14% R 376 14% R 378 14% R 379 14% R 379
Transport, storage and communications
9% R 242 9% R 247 9% R 252 9% R 256
Mining and quarrying
8% R 221 9% R 230 8% R 227 8% R 234
Personal services 6% R 155 6% R 158 6% R 160 6% R 162
Construction 4% R 97.8 4% R 100 4% R 103 4% R 105
Agriculture, forestry and fishing
3% R 668 3% R 678 3% R 716 2% R 656
Electricity, gas and water
3% R 688 3% R 683 3% R 683 2% R 676
Total value 100% R 2621 100% R 2682 100% R 2722 100% R 2763
Source: STATS SA, 2016
1.4 Employer Profile Businesses in the Transport sector cover operation in many different sectors. According to records from the South African Revenue Services (SARS), the Transport Sector consists of a total of 16 252 registered businesses. Figure 1.3 below depicts the percentages of formally registered businesses within the Transport Sector.

Page | 8
Figure 1.3: Percentage Distribution of formally registered businesses within the Transport Sector
Source: SARS, 2016 Of the 16 252 active businesses in the Sector, a subsector with the highest number of registered businesses is Road Freight, closely followed by the Road Passenger subsector; each constituting over 35% of the Sector. Earlier, it was shown that the Road Freight and Road Passenger subsectors are only the third and fourth biggest contributors (about R130-140 mil). This suggests that the level of competitiveness between the Rail and the two Road-based subsectors is “polarized” i.e. the Road Freight and Road Passenger subsectors appear to be highly competitive whereas the Rail subsector shows symptoms of a monopolistic market. The following hierarchy Figure 1.4 depicts the flow of information and level of Skills Development participation in the Sector. Figure 1. 4: Number of businesses disaggregated by reporting status
1%
2%
4%
6%
7%
8%
36%
38%
0% 5% 10% 15% 20% 25% 30% 35% 40%
Rail
Taxi
Aerospace
Forward and Clearing
Maritime
Freight Handling
Road Passenger
Road Freight
Figure 1.3 Percent Distribution of formally registered business within the Transport Sector ( n=16252)
Number of Registered Businesses
16 252 Registered businesses
852 Businesses Participate in the WSP
Survey
(5%)
15 400 Businesses do NOT Participate in WSP
(95%)
4 228 Businesses Pay SDL
(26%)
12 024 Businesses do NOT Pay SDL
(74%)

Page | 9
Source: TETA WSP, 2016/2017 Figure 1.5. below shows proportions of skills development levy payers across all subsectors. The rail contributes the most amount of money in Rands, though it has the least number of contributing companies. The Road Freight subsector has been confirmed as having the most number of contributors to SDL (36%). Road Passenger subsector follows with 30%. Again, the Taxi subsector has the smallest participation (in terms of number of business) in skills development levy. Figure 1.5: Proportion of SDL payers across subsectors
Source: TETA WSP, 2016/2017
1.4.1 Employer Sizes
Figure 1.6. Below shows proportions by size of companies who pay skills development levy. The size is based on number of employees. The figure illustrates the significance of small enterprises within each subsector. This significance is illustrated by the relative size of the blue space (representing small enterprises classified as size 0-49). It is noted that the blue space takes up the biggest proportions with each of the eight subsectors. In light of this finding, the report can conclude that the process of skills development as led by TETA primarily enjoys the biggest participation from small enterprises.
4 228 Businesses Pay SDL
(26%)
Aerospace
(6%)
Forwarding and Clearing
(9%)
Freight Handing
(5%)
Maritime
(8%)
Rail
(1%)
Road Freight
(36%)
Road Passenger
(30%)
Wrong Allocated Businesses
(1%)

Page | 10
Figure 1.6 : SDL Paying Businesses within the Transport Sector
Source: TETA WSP, 2016/2017 1.5 Location of Employers
As transport forms an integral part of each of the other sectors, it is only natural that its operations are mostly found in areas which show high levels of economic activity. In South Africa, big Metro Provinces such as Gauteng, Western Cape, Eastern Cape and Kwazulu Natal are formed on the basis that they attract high levels of business activity. Thus, it is not surprising that figure 1.7 below; showing the spread of all transport companies by Province; shows that the four Provinces hosting the most transport companies are those listed above. The spread of companies depicted below is likely to have the following implications:
Skills development plans and resources are likely to be crowded in accordance to provinces with the highest levels of economic activities (Kwazulu Natal, Gauteng, Western Cape and Eastern Cape)
With little economic activity observed therefore, little attention paid to the other Provinces; TETA is unlikely to learn about developments and trends happening in these Provinces.
81% 77%
89% 81%
86%
59%
84% 86% 92%
9%
9%
7%
5%
7% 4%
20%
5% 4% 0%
3%
5% 9%
4% 7% 6%
7%
7% 8% 8%
0%
4% 7% 3% 6% 4%
15%
4% 3% 0%
88%
Aerospace Forwardingand
Clearing
FreightHanding
FreightHandling
Maritime Rail RoadFreight
RoadPassenger
Taxi WronglyAllocatedto TETA
Figure 1.6 : SDL Paying Businesses within Subsectors
0-49 150+ 50-149 No Size Indicated

Page | 11
Figure 1.7. Percentage of Companies
Source: TETA WSP, 2016/2017 1.5.1 Future Outlook of the Sector In her article, ‘Investment Still Needed in Transport Infrastructure’, Linda Doke mentions that South Africa’s transport sector is a key contributor to the country’s competitiveness in global markets. Its five modalities — road, rail, sea, pipeline and air — are the biggest and most efficient transport networks in Africa, servicing industries that span the continent. Thus, the sector is seen by government as a crucial engine for economic growth and social development (Doke, 2015). Both the government and other interested key stakeholders in the private sector anticipate the following plans for the transport sector:
a R336-billion plan to expand South Africa’s rail, port and pipeline capacity to generate a significant increase in freight volumes (Doke, 2015)
Department of Transport‘s partnership with 11 universities and 11 Technical Vocational Education and Training colleges to enhance the capacity of the South African society towards the development of a sustainable transportation system for the country (D. Peters, 2015)
A 20 year infrastructure building project, categorized into 5 geographic Strategic Integrated Projects (SIPs). A multi-billion Rands projects which will unlock thousands of jobs across all eight subsectors (PICC, 2016)
A sample of projects listed above has direct implications on TETA’s effort to build skills for the Transport sector. The Transport SETA is likely to play a much bigger role in meeting such an increase in skills demand in the next 20 years.
Gauteng; 30%
Western Cape; 20%
KwaZulu-Natal; 19%
Eastern Cape; 12%
Mpumalanga; 5%
Free State; 5%
Limpopo; 4% North West; 4% Northern Cape; 3%
Figure 1.7 Percentage of Companies Gauteng Western Cape KwaZulu-Natal Eastern Cape Mpumalanga
Free State Limpopo North West Northern Cape

Page | 12
1.5.2 Labour Market Profile Dynamics and Spread of Employment in the Sector
Below, Figure 1.8 describes the labour market profile of the sector’s employment in the year 2015. Figure 1.8: Sector Employment performance in the year 2015
Sources: STATS SA Labour Annual Report, 2016 The Transport Sector is the 7th largest employer out of the ten selected Sectors. Its contribution is higher than that of Mining, Agriculture and Utilities Sectors. It is also observed that although the Transport Sector contributes more production to the GDP than the Construction Sector (see above); it does this with less human resources. This observation can suggest one of the following: 1. That the Transport Sector tends to be more productive as a unit of human resources, given equal levels of technology and mechanization. 2. The Transport Sector is more reliant on technology and mechanization than the construction industry. In order to test the second assertion, the research team ran some accounting ratios. In particular, the ratios are called; Asset expenditure to revenue (A/R) ratio and Labour cost to revenue ratio (L/R). These were run for all Sectors. The team used Sector accounting statements as published by STATS SA for the year 2015/2016. The explanations of the ratios are as follows:
A/R L/R
Expenditure on machinery and other equipment excluding building structures and equity. This includes rental expenditure on machinery and equipment. These are all divided by total revenue.
The full cost to companies of employing human resources. These are all divided by total revenue
Transport and Storage
6% Mining 3%
Private households 8%
Manufacturing 11%
Utilities 1%
Construction 9%
Agriculture 5%
Finance 14%
Services 23%
Trade 20%
Figure 1.8: Sector Employment in the year 2015

Page | 13
Figure 1.9 below shows comparisons of the two ratios across 10 Sectors including the Transport Sector. It shows that the Transport Sector spends equal proportions on both labour and mechanization. However, compared to a Sector which employs significantly less people (at least 1% less), such as Mining, the Transport Sector seems to be receiving its labour for a comparatively less amount. While at the same time, the Mining Sector’s asset expenditure is relatively less than that of the Transport Sector for each rand of revenue. This gives rise to yet another assumption; that the skills levels required to operate relatively expensive machinery in the Transport Sector are cheaper than those necessary for the Mining Sector. Thus, this finding potentially implies that, the expansion of the Transport Sector (given the same labour and asset to revenue ratios) seems to be more in favour of number of jobs produced than Sectors like mining. Figure 1.9: Human Resource Cost vs. Technology & Mechanisation Cost Ratio to Revenue (2025/2016)
Source: TETA SSP 2016/2017 Figure 1.10 below shows the employment at two time points (2014 & 2015) in the Transport Sector per province for 2014 and 2015. Between 2014 and 2015, there is no indication of a change in the level of employment. This is the case for every province. In comparing 2014 and 2015, data shows that Gauteng remains the province employing the highest number of people in the Transport Sector. This is followed by the coastal provinces as they have high involvement of the maritime subsector. Particularly, all three coastal Provinces are sustained by harbour operations as there is actually a negligible number of ships which are locally owned; over 90% of the Maritime Sector’s business is actually Harbour operations rather than shipping itself (UNCTAD, 2014.) The other Provinces are mainly driven by the Mining and the Construction business, with Limpopo, Mpumalanga and the North West mainly driven by the Platinum, Gold and Iron Ore mining (Besharati, 2014.)
0%
5%
10%
15%
20%
25%
30%
35%
40%
Service ExcludingGovernment
Electricity, gasand water
Transport,storage and
communication
Finance, realestate and
business Services
Wholesale, retailand motor
trade;cateringandaccomodation
Mining andquarrying
Construction Manufacturing
Figure 1.9: Human Resource Costs Vs. Technology & Machanization Cost Ratio to Revenue in 2015/2016
Employment Cost Expenditure on Technology and Mechanization

Page | 14
Figure 1. 10 : Number of Employees in the Transport Sector per province (2014-15)
Source: Stats SA, 2015. 1.5.2.1 Labour Market Share across Sectors: 2013/2015 Financial year It was very compelling to try and find a trend in the employment rate from the year 2013 to 2015 within the Transport Sector at a national level. Based on the observation from the Table 1.7 below, it is evident that there has not been any change in a period of three years, as there is a stagnant count of 6%. Therefore, there is a need to revise strategies of intervention to improve employment opportunities. Table 1 7: Share of Labour Market: 2013/2015 Financial year
Employment by Industry and Sector (2013/2015)
Years Percentages
Industry 2013 2014 2015 2013 2014 2015
Agriculture 713 724 891 4,7% 5% 6%
Mining 426 427 443 2,9% 3% 3%
Manufacturing 1 766 1 749 1779 12% 11% 12%
Utilities 127 104 143 1% 1% 0.90%
Construction 1 204 1 334 1322 8% 9% 9%
Trade 3 224 3 247 3046 21% 21% 20%
Transport 961 952 899 6% 6% 6%
Finance 2 037 2 039 2195 13% 13% 14%
Community and Social Services
3 470 3 501 3450
23% 23% 22%
Private Households 1 244 1 219 1288 8% 8% 8%
Other 5000 24 Not
available 33% 0.16% 0%
Total 15 177 15 320 15 459
Source: Stats SA Quarterly Labour Force Survey, Quarter 4, 2013, Quarter 4, 2014, Quarter 1, 2015. Rounded off to the nearest ‘000
0
1 000 000
2 000 000
3 000 000
4 000 000
5 000 000
6 000 000
Employees 2014
Employees 2015

Page | 15
1.5.2.2 Transport Sector Occupation and Age Distribution in 2015 This section looks at the Transport Sector occupations by age distribution of workers/employees across provinces. Figures 1.11 and 1.12 below highlight employment proportions across the various age groups over two consecutive years, from 2015 to 2016. The summary is based on data from the WSP sample. As we analyse this data, it is befitting to highlight three related facts:
In South Africa, the youth age is defined as people of the age between 18 and 35
Out of a population of people defined as the labour force, youth accounts for more than 30% of it (Stats SA, 2016)
The Government of South Africa has prioritized youth employment in the country (NDP, 2012)
In light of the facts listed above, the analysis of the portrayal above will use the proportion of employees classified as youth, as a point of reference. Despite the fact that youth constitutes the biggest proportion of the national labour force, note (in the graphs below) that this category of employees accounts for the smaller share of employment across all occupation groups. On average, youth only accounts for 12% share of employees across all occupation groups. Notably, it appears that the Transport Sector consists of older generations of employees as there is almost a 50:50 split of middle aged workers (ages between 35 and 55) and workers who are within the last 15 (fifteen) years of the official retirement age (65 years). The second observation made is that there is a significant proportion of employed youth among the occupation groups. Specifically, the proportions ranges between 22% and 52% in both years. Finally, over a period of a year, the Sector has shown very little shifts in generational transformation in the various occupation groups. Figure 1. 11: Occupation and Age distribution in 2015
Source: TETA WSP, 2016/2017
49% 52% 22% 34% 43% 49% 39% 40%
44% 40% 65% 53% 47% 41%
47% 48%
7% 9% 13% 14% 11% 9% 14% 12%
CLERICALSUPPORTWORKERS
ELEMENTARYOCCUPATIONS
MANAGERS PLANT ANDMACHINE
OPERATORS ANDASSEMBLERS
PROFESSIONALS SERVICE ANDSALES WORKERS
SKILLEDAGRICULTURAL,
FORESTRY,FISHERY, CRAFTAND RELATED
TRADESWORKERS
TECHNICIANSAND ASSOCIATEPROFESSIONALS
Occupation and Age in 2015
Age Under 35 in 2015 Age 35 To 55 in 2015 Age Over 55 in 2015

Page | 16
Figure 1. 12 : Occupation and Age Distribution in 2016
Source: TETA WSP, 2016/2017
1.6 Employment by Race and Gender in the Transport Sector The figure 1.13 below demonstrates the gender profile of the Transport Sector in 2014 and 2015. As is demonstrated, the data shows that males have a consistent dominance in employment in the Sector (80%) while females similarly maintain a consistent under-representation of 20% employment in the Sector. Figure 1.13 : Number of employees in the Transport Sector by Gender
. Source: Stats SA 4th Quarter 2014 and Stats SA, QLFS, 1st Quarter 2015
47% 52%
22% 35% 42% 49% 41% 38%
45% 40%
65% 52% 48%
45% 45% 51%
7% 8% 13% 13% 10% 6% 14% 12%
CLERICALSUPPORTWORKERS
ELEMENTARYOCCUPATIONS
MANAGERS PLANT ANDMACHINE
OPERATORS ANDASSEMBLERS
PROFESSIONALS SERVICE ANDSALES WORKERS
SKILLEDAGRICULTURAL,
FORESTRY,FISHERY, CRAFTAND RELATED
TRADES WORKERS
TECHNICIANS ANDASSOCIATE
PROFESSIONALS
Occupation and Age in 2016
Age Under 35 in 2016 Age 35 to 55 in 2016 Age Over 55 in 2016
0
100000
200000
300000
400000
500000
600000
700000
800000
900000
2014 2015
Male
Female

Page | 17
1.7 Some Measurable Trends 1.7.1.1 Racial Transformation Table 1.8: Change in racial Proportions (2015-2016 Financial year)
Racial Group CLERICAL SUPPORT WORKERS
ELEMENTARY OCCUPATIONS
MANAGERS PLANT AND MACHINE OPERATORS AND ASSEMBLERS
PROFESSIONALS SERVICE AND SALES WORKERS
SKILLED AGRICULTURAL, FORESTRY, FISHERY, CRAFT AND RELATED TRADES WORKERS
TECHNICIANS AND ASSOCIATE PROFESSIONALS
African 1.4% 0.0% 1.3% 0.2% 1.1% 0.2% 0.4% 0.2%
Coloured -0.1% 0.1% 0.0% 0.1% -0.8% 0.4% 0.0% 0.0%
Indian -0.1% 0.1% -0.9% 0.0% 0.2% 0.3% 0.1% -0.3%
White -1.1% -0.2% -0.5% -0.3% -0.5% -0.9% -0.5% 0.1%
Source: TETA SSP, 2016/2017 The table above shows movements in employment levels within each occupation group and across four racial classifications from 2015 to 2016 financial year. As can be observed in the table above, the movement within the African racial group has been positive throughout all occupation groups. However, the rate of transformation is very low, less than 1% on average. Of interest, note that there is a general decline of White labour in all occupation groups but one, further suggesting that there is progress as far as racial transformation in the sector is involved (however, little it is). Between 2014 and 2015, females maintained 20% of employment in the Sector. Gender transformation appears to be static hence not much transformation has taken place. This illustrates the need to escalate gender transformation in the Transport Sector to ensure more involvement of females in employment opportunities. Table 1.9 provides a breakdown of employment in the Transport Sector by race group and gender between 2013 and 2014. There is an increase in employment of Africans (both males and females) between the two years. This shows that there is some racial transformation taking place in the Sector. No matter how minimal, it is a step towards the right direction. Indian females appear to have increased their participation in the Transport Sector as they have the highest increase in involvement in the Sector as compared to the other races. Furthermore, employment of coloured females and whites appear to be decreasing in the Sector. Table 1.9 : Employment by Race and Gender (2013-14)
Population group Gender 2nd Quarter 2013
1st Quarter 2014
% change
African/Black Male 502 770 561 244 10.4%
Female 95 159 103 209 7.8%
Total 597 929 664 454 10.0%
Coloured Male 66 101 64 860 -1.9%
Female 26 791 24 719 -8.4%

Page | 18
Total 92 892 89 579 -3.7%
Indian/Asian Male 26 856 25 320 -6.1%
Female 9 129 11 721 22.1%
Total 35 984 37 041 2.9%
White Male 66 312 67 814 2.2%
Female 38 582 36 113 -6.8%
Total 104 895 103 926 -0.9%
GRAND TOTAL 831 700 895 000 7.1%
Source: Stats SA, Nesstar, QLFS, 2nd Quarter 2013 & 1st Quarter 2014 Figure 1.14 below shows the trend of employment by gender from 2013 to 2014. Generally, it is illustrated that in both years, male employment in the Sector was dominant across all races while female employment remained low. It was found that between 2013 and 2014, the Transport Sector has absorbed 16% of black females and 84% of black males. This further expands on the need to exacerbate gender transformation within the Sector. Figure 1.14 : Employment by Race and Gender proportion in the Transport Sector (2013-14)
Source: Stats SA, Nesstar, QLFS, 2nd Quarter, 2013 & 1st Quarter 2014 1.7.1.2 Transport Sector Employment Performance (2014 to 2015) During a difficult economic period in the country, and given the broad level of market exposure carried by the Transport Sector; the Sector has shown strong and positive performance as far as retaining and growing employment are concerned. Over the years 2014 to 2015, while some of the other key Sectors showed a negative employment outlook;
84%
16%
71%
29%
75%
25%
63%
37%
84%
16%
72%
28%
68%
32%
65%
35%
Male Female Male Female Male Female Male Female
African/Black Coloured Indian/Asian White
Figure 1.14: Employment by Race and Gender proportion in the Transport Sector (2013-14
Employment proportion by gender-2013 Employment proportion by gender-2014

Page | 19
the Transport Sector continued to show significant increases in the number of informal jobs (21,000 jobs). However, at the same time, the sector shed 25,000 formal jobs. Figure 1.15 : Change in Employment numbers across Sectors (2014-15)
1.8 Lessons from chapter 1
In conclusion, this chapter has illustrated the significant contribution of the Transport Sector both in terms of revenue (9% contribution to GDP) and employment in the country. Gauteng province is the highest employer of the Sector at 38%, not surprising given that it is the hub of economic activity. What has also been noteworthy from this chapter is the need for further gender and racial transformation within the Sector given that black employees and females involvement still remains low. In the description of the Sector profile which has been provided above; It is clear that the Transport Sector plays a critical role in its support of other Sectors of the economy. The eight subsectors contribute to the country’s gross domestic product and employment. Perhaps, the value of the sectors is under estimated given that not all the businesses are registered, paying levies or submitting their WPS and APRs. The development of skills in the Transport Sector has wide ranging implications on the economy at large.
MiningManufac
turingUtilities
Construction
TradeTranspor
tFinance Services
Movement in Informal Jobs 26000 -114000 -32000 -12000 108000 21000 24000 147000
Movement in Formal Jobs 4000 -27000 0 53000 7000 -25000 -1000 79000
Net Movement in Jobs 30000 -141000 -32000 41000 115000 -4000 23000 226000
-200000-150000-100000
-500000
50000100000150000200000250000
Tota
l Jo
bs
Movement in Job numbers 2014 to 2015

Page | 20
2 Chapter 2: Key Skills Issues 2.1 Introduction The objective of this chapter is to identify factors that will drive change in the Transport Sector, thus influencing demand and supply of skills. 2.2 Research Methods Applied To address this objective, data were gathered through desktop reviews of existing public domain information from different sources. Specifically, national documents such as the National Development Plan (NDP), the Human Resource Development Strategy for South Africa II (HRDSSA) were used. Stakeholder engagement workshops with key representatives from the eight sub-sectors complemented the desktop review data. The workshops provided in-depth and practical interpretation of the findings from the desktop reviews. 2.3 The Change Drivers
The demand and supply of labour in the South African Transport Sector is highly influenced by the socio-economic landscape, technological advances, environmental interests and policy factors in the country. Like with other sectors, Government regulations, technology, globalization, the business environment are some of the drivers of skills scarcity and occupational patterns in the transport sector. The key drivers in the transport sector are outlined below. 2.3.1 Government legislation and regulations The Department of Transport is responsible for the legislation and policies for all relevant subsectors. Most transport functions at the national level are implemented through public entities that are overseen by the Department of Transport (DoT). The 1996 White Paper on transport defines the different subsectors in the Transport Sector. 2.3.2 Entry of SMMEs into the industry
The Government of South Africa promotes the formation of SMMEs as vehicles of growth to address poverty, unemployment and inequality as per the NDP. Hence in 2014, the Department for Small Business Development was formed. The establishment of the department and support to establishment of small businesses will affect the existing players in the subsectors of the Transport industry. In capital intensive sub-Sectors such as maritime, freight handling and clearing, it is very difficult for small businesses to enter the market. Therefore, there is very little interference of SMMEs or competition from SMMEs for businesses. However, in the case of rail, which is dominated by the state through Transnet, there has been competition from SMMEs. With respect to SMMEs, commercial competition manifests itself not only in competition for business but for scarce labour as well. This situation, in turn, tends to perpetuate scarcity of skills in the sub-Sector. Given their relative sizes and position in the Sectors, and their eagerness to remain competitive in a tough market, SMMEs tend to take an innovative approach in their
Page | 21
operations and in a way they manage scarce skills. They have been known to help their employees to quickly gain experience and eventually excel in areas or fields where they operate. In this way, the businesses can acquire a wider range of skills with minimal head counts and cost to the small business. The unintended consequence of this is that a new “breed” of skilled individuals is getting established. With more and more SMMEs entering the market, this trend quickly becomes a standard for the subsector; that is, a new market with a combination of skills as well as being adaptable. Given that formal training does not necessarily catch up with market changes fast enough, this further exacerbates the scarcity of skills and difficulties in filling vacancies. The bulk of the maritime subsector’s core business directly depends on the local harbour’s ability to adequately satisfy the various shipping and clearing needs of internationally based businesses. Therefore, there is a compelling need for players in this sub-Sector to continuously keep up with consistently evolving operating standards of various multinational organizations. This also has a direct consequence on the operating certification and licensing of key individual working at the local ports. The following are some of the implications on Skills Development: o Training institutions are unlikely to keep up with changing curriculum requirements in
such a dynamic environment o Local organizations face competition for skilled labour from international companies
who, in most cases, pay employees in stronger currencies o There is a shortage of skilled and experienced individuals to serve as training instructors,
even when local companies try to close the skills gaps themselves. o Since most experts are usually from international organizations, provision of skills
training for unexperienced individuals is both expensive and difficult to organize logistically.
Discussions with participants in the SSP workshops showed that the Transport Industry is aware of the need for adjustments to respond to changing patterns in the global economy. They have to take account of the effect of climatic changes and carbon emissions. They also mentioned that costs were expected to escalate because of climatic changes and required adjustments. The importance of Science, Technology, Engineering and Mathematics (STEM) for training to address shortage of skills in the Sectors was evident. These subjects are required for the Sector to recruit candidates who are able to understand the new technologies and to respond adequately. 2.3.3 Black Economic empowerment
A highly debated factor in labour supply to the Sector is the Government’s policy known as the Broad-Based Black Economic Empowerment (BBBEE). BBBEE is an instrument by the South African Government that it uses as a vehicle to redress the effects of social and economic exclusion policies that were propagated during the Apartheid era. Therefore, BBBEE is a systematic as well as accelerated process to proactively provide economic opportunities for previously disadvantaged racial groups in the country (SA Act 53, 2003). This policy covers (in an explicit manner) issues of skills development and provides guide

Page | 22
lines and regulation around how employers should contribute to the development of workers’ skills. In this manner, the notion of BBBEE directly influences the employers’ hiring decisions and it certainly is one of the key drivers of labour demand and scarcity in the Transport Sector.
2.4 Green Economy Chapman (2007) 1indicates that transport accounts for 26% of global carbon emissions and that emissions in this sector are still growing. With greater concern over climate change as expressed through many international conferences (e.g Kyoto Protocol) in the past two decades, the transport sector will have to adapt to new government legislative frameworks and policies which will likely lead to technological and behavioural changes. Therefore, in the long run, attempts to change individual attitudes and behaviours will affect choices made within the sector and consequently and the skills to sustain it.
2.5 Technological advances The transport sector will continue to have an impact on the transport sector directly to improve its efficiency and effectiveness. The development of the Hyperloop and magnetic levitation trains, autonomous vehicles and smart cars are some of the developments which will have an impact on the type of skills to drive the industry. Concurrently, the development and access to technology by communities will also affect how the transport sector is used. For the users, the development of technologies and trends in people’s lifestyles will affect the way people use transport. Ease of connectivity between transport drivers and passengers, through smartphones and transport applications, is leading to ride-sharing services (e.g. Uber and Lyft). This technology is affecting how people use cars, the different skills that will drive the sector. Communicable Diseases (CDs) and Non-Communicable Diseases (NCDs)
In the class of communicable diseases, the most significant are HIV/AIDS and TB while non communicable diseases include diabetes, hypertension and cancers. Though currently mediated by population access to Anti-Retroviral Therapy, HIV/AIDs has been acknowledged as an important determinant of availability of skills in many sectors, including the transport sector. The impact of HIV/AIDS remains a core underlying focus area of the majority of Government initiatives and the private sector as the disease has direct impact on the mortality, morbidity, productivity, morale and skills of the people in the South Africa. Though not yet receiving prominence, NCDs are increasingly posing threats to the workforce and calling for outlay of more resources. It is imperative for the Transport Sector to factor the cost of CDs and NCDs on the sector in order to determine the skills development needs and initiatives of the Sector. Scarce Skills
1 1 Chapman, Lee. Transport and climate change: a review: Journal of Transport Geography:
Volume 15, Issue 5, September 2007, Pages 354–367

Page | 23
2.6 Strategic Integrated Project (SIP) Strategic Integrated Project (SIP) is a twenty year planning framework to co-ordinate a myriad of state infrastructure projects in 17 integrated projects to prevent stop-start patterns of development.
Facts Issues Skills Development Priorities
New Growth Path (NGP) targets the creation of 20 million jobs by 2020; identifies structural problems in the economy and points to opportunities in specific sectors and markets.
The first driver is infrastructure – laying the basis for job creation, economic growth and inclusivity.
SIP is aligned to skills development and human settlement planning as cross-cutters.
The Transport Sector is a cross-cutter, but there will be a focus on road, rail, ports and logistics.
All SIP have implications for the Transport Sector.
There is an acute need for large-scale skills training in the taxi industry.
Transport provides the good opportunities for job creation.
There is a need for TETA to work with SIP co-ordinators closely.
There is a need to identify skills supply and demand for SIP and determine skills gaps.
TETA should scale up its internal operations to focus on SIP.
Discretionary projects should “talk” to SIP.
Special measures should be taken by TETA to draw youth into SIP.
Strategic Plan and SSP should incorporate SIP priorities.
Bigger focus on learnerships and apprenticeships for youth.
Focus on high end skills development programmes.
Management training and development is vital because of weak implementation by state.
TETA should identify SIP projects to participate.
There should be a focus on RPL, ESDAs and bursary schemes.
Dialogue with SIP partners.
2.6.1 Southern African Rail Network
A heavy haul network stretching from Botswana through Zimbabwe and into Mozambique and Malawi could prove a game changer in regional logistics and exports for SADC. The proposed 1100km southern African rail network, which has many links to it, will have huge downstream spin-offs for the region.

Page | 24
Facts Issues Skills Development Priorities
The project is to begin in 2012 at an expected cost of $7 billion and will take 10 years.
The main funders are the World Bank, IMF, IFC and mining companies.
Transnet is under fire from the private sector for its operational inefficiencies of its rail network and bottlenecks at ports
Growth is the mining sector is being stymied by unreliable rail networks.
Mining companies can move 90 million tons of coal through Richards Bay but Transnet can only support 60 million tons on its rail network.
This project provides the good opportunities for job creation.
The mega rail and port is likely to reduce the reliance on freight and road networks.
The project has the potential to inject economic growth in rural regions of SADC.
There will be a need for all levels of skills – low, middle and high – for this project.
There will be spin-offs for other industries in the economy.
TETA needs to position itself for this project.
Better strategies for skill development will assist in developing more creative career pathways.
Increasing use of new technologies is a primary driver of the need for training of all categories of employees.
Management training and development is vital for employers as most enterprises in the transport sector are micro and small.
TETA should encourage employees and enterprises to move up the value chain.
Higher order skilling is key to the future of transport.

Page | 25
2.7 Alignment with National Strategies and Plans The growth strategies of the Transport Sector should be viewed in the context of the Government’s National Development Plan (NDP) which aims to eliminate poverty and reduce inequality by 2030. The NDP identifies the role to be played by different Sectors of the economy. In particular, the strategy recognizes the role that Transport plays for achieving better livelihoods for the population in terms of access to employment locations, water, and education and health services. Therefore, the Government has followed the NDP with plans for substantial investment in Transport to ensure “safe, reliable and affordable public Transport”. Similarly, the New Growth Path, which was announced by the Government in November 2010, seeks to address unemployment, poverty and inequality. With its ambitious plan to reduce unemployment to 15 percent, the plan seeks to create 250,000 jobs per year totalling 5 million jobs by 2030. Other plans such as the National Infrastructure Plan, the Industrial Policy Action Plan seek to consolidate and complement the NDP. Cross-cutting in these strategies is recognition of the role of infrastructure which is defined to include energy, water, and Transport. The National Infrastructure Plan, adapted by the South African Government in 2012, is drawn from the NDP and outlines a variety of infrastructure plans grouped into 18 Strategic Integrated Projects (SIPs). The projects cover infrastructure development of rail to support mining and mineral extraction in Limpopo, Mpumalanga and the North West provinces. Further, the project envisages expansion of the Durban and Cape Town ports; improvement of roads and construction of an Aerotropolis to encourage and support the tourism business and many others. Furthermore, the NDP is clear about its support for education infrastructure and support of vocational training to sustain all these infrastructure projects. A sample of projects
The Department of Transport is responsible for conducting Sector research, formulating legislation and policy to set the strategic direction of subsectors, assigning responsibilities to public entities and other levels of Government, regulating through setting norms and standards, and monitoring implementation. Consistent with the developmental plans cited above, the department can influence delivery of services and consequently the way the Transport Sector develops. There are a number of public entities that report to the Minister of Transport and these play an important role in the sector. Some of the key players are the Airports Company South Africa (ACSA), Air Traffic and Navigation Services (ATNS), Cross-Border Road Transport Agency (CBRTA), PRASA. Commercial role players include, Transnet, South African Airways (SAA), SA Express (SAX), Passenger Rail Agency of South Africa, and the Gautrain. When changes in plans and operations occur in these entities, they are likely to affect the

Page | 26
operations of the relevant subsector. Illustrative examples of plans and strategies are provided by the Gautrain and BRT systems. The Gautrain: The Gautrain is an 80 km-long mass rapid transit railway system that links Johannesburg, Pretoria and OR Tambo International Airport. The possible rapid rail extensions follow from the Gauteng 25-Year Integrated Transport Master Plan. This plan will ensure integration of Transport with spatial patterns as well as the integration between various Transport modes to move people effectively. The Bus Rapid Transport (BRT): Over the next few decades, South Africa plans to expand its Bus Rapid Transit (BRT) systems. Examples of the growth of some of these services are provided by the My Citi in Cape Town, Rea Vaya in Johannesburg, A Re Yeng in Pretoria and Go George in George. The BRT Programme is the road-based component of the Public Transport Strategy that was approved by Cabinet in March 2007. It is designed to move large numbers of people to all parts of a city quickly and safely. Government wants to ensure that by 2020, most city residents are no more than 500 m away from a BRT station. Service providers in the transport sector will have to work within the government plans and strategies. The system will feature dedicated bus-only lanes, as well as bus stations that are safe, comfortable, protected from the weather and friendly to passengers with special needs, such as children, the elderly, and those impaired with sight and hearing. In light of this, it is easy to deduce that the NDP will have a direct effect on skills development in the transport business. The following are some of the likely implications: The Transport Sector is likely to experience business expansion. Firstly, the sector will
provide logistical support for the implementation of the infrastructure plans and construction. Secondly, after the construction of the infrastructure, the transport sector will provide expanded transport capacity because of improved infrastructure.
The plans raise higher expectations regarding the process of skills development in the Sector. With an already pressurized skills environment, expansion in business is likely to worsen the situation.
In summary, the implementation of the SIPs implies that the Transport Sector may be forced to consider alternative ways to leverage their skills supply. This may include looking to other countries for scarce skill with an added intention to build local skills capacity for the future. The National Skills Development Strategy (NSD) III The NSD III builds upon the lessons learnt from NSDS I and II and aims at ensuring improved access to quality learning programmes. The NSD III has made commitments to address skills shortage in South Africa through the following strategies: establishing a creditable institutional mechanism for skills planning; increasing access to occupationally–directed programmes; promoting growth of a public TVET college system; seeking to improve the low level of skills in language and numeracy; encouraging better use of workplace-based skills development; encouraging and supporting cooperatives, small enterprises, worker-initiated, NGO and community training initiatives; increasing public Sector capacity for improved service delivery and supporting the building of a developmental state, and building career and vocational guidance among youth.

Page | 27
Further, the National Skills Fund, operated under the framework of the Human Resource Development Strategy for South Africa II (HRDSSA) and NSD III, will be one of the strategies to address skills shortages in line with the goals of the NSDS III. The HRDSSA has made commitments to address shortages in priority skills needs and seek to meet demands of South Africa’s emerging and social development priorities.
2.8 Conclusion
This chapter focused on some key skills issues for the transport sector. This chapter has illustrated the drivers of change that influence the demand and supply of skills within the sector. It is of paramount importance to note that Government regulations play a significant role in driving the supply and demand of skills within the Sector. This is through policies such as the NDP, NSD III and the BBBEE which regulate the skills environment. The Government developmental strategies and plans suggest that the transport subsectors should be poised for expansion. The operations of the stakeholders have to follow the government framework though challenges are noted in implementing programmes under BEE. Other challenges that will confront the industry are; scarcity of skilled human resources, variable fuel prices, stricter carbon requirements and a need to respond to changes in climate change and public health issues (NCDs and CD). A multi-pronged approach to developing skills is suggested. The National Infrastructure Plan suggests different strategies such as easing immigration in Sectors linked to scarce-skills categories, developing or strengthening partnerships with universities and other institutions that conduct training or sharing a pool of scarce skills between public Sectors. Implementation of the strategies will have to be tested to determine the best one for the subsectors.
Page | 28
3 Chapter 3: Extent of Skills Mismatches
3.1 Introduction
This chapter sets to identify and understand the occupation-specific skills and mismatch between demand and supply of skills for employers in the transport sector. Understanding the dynamics of skill mismatch, with analysis of the link between the skill needs and skill supply, is important for policies that aim to reduce inefficiencies in the transport sector labour market. Skills Mismatch is defined as the gap between an individual's job skills and the demands of the job market.The Skills Mismatch crisis has forced millions of workers to seek new jobs but their skills are often not those that employers are seeking, and this is one of the contributory factor affecting the unemployment levels in the country, including the transport sector. Empirical for future skills planning, the TETA need to gather information and understanding of the skills outlook of the transport sector and provide insights into how the sector can contribute to the policy goal of anticipating and matching skill needs. In identifying and understanding the occupation-specific skills and mismatch between demand and supply of skills for employers in the transport sector, the following topics will be discussed
Extent and nature of Demand in the Transport Sector
Extent and nature of Supply in the Transport Sector
Identification of skills gaps
Pivotal Skills Research Methods Multiple research methods were employed to determine the extent of skills mismatches in the Transport Sector. The methods included the following: • Workshops and focus group discussions with stakeholders. • Interviews with key informants in the Sector • Review of workplace skills plans and annual training reports; • Review of existing data and information sources; • Literature search of studies in the Sector; • Analysis of industry market reports; • TETA Annual Report and Strategic plan documents • TETA 2015/16 SSP Update The use of multiple research methods enables triangulation of findings and corroboration of research evidence. Through a process of data analysis from Workplace Skills Plans, existing figures and graphs on the industry profile and other industry parameters, the Sector’s skills demand, supply and identification of skills gaps were analysed
3.2 Extent and nature of Demand in the Transport Sector In highlighting the Extent and nature of Demand in the Transport Sector. Using findings of the stakeholder engagements workshop, including the results of the WSP data analysis as
Page | 29
indicated above this section will attempt to give answers to the following questions within the Transport Sector: • What occupations have vacancies? • Which occupations are hard to fill and why? • What are the occupational employment trends? • What are conditions of employment trends? • How is migration impacting on the Sector?
3.3 What occupations have vacancies and Which Open Vacancies are hard to fill?
In ideal circumstances, the process of estimating demand would have only included a straight forward count of the number of open (unfilled) vacancies from each of the individual businesses representing a “reported” population of the Transport Sector (DHET, 2016). It is usually unrealistic to get to each business in the Transport Sector and conduct a count. The Workspace Skills Plans (WSPs) questionnaire which was circulated to all registered Sector businesses received responses from only a “‘self-selected” subsection of the business in the Sectors. On average, only 5% of the known businesses in the Transport Sector responded to the WSP. It would be misleading to gather a basic count of open vacancies from businesses which responded to the survey and report the totals as the official Sector estimate of skills demand The Sample information from the WSP survey was used to estimate population information whereby the WSP data analysis through the Extrapolation methodology explored the possibility of using a statistical and mathematical method to use sample estimates. The rationale inferences about the full population was made in order to produce demand estimates which speaks to the actual size of the population of businesses in the transport sector. There are various types of extrapolation, and each type requires specific assumption about the characteristics of the population. The proportion of the sample size to the stated population size was used as the basis of extrapolation and then used the proportion as an adjustment factor to transform sample demand sizes to population estimates. With limited knowledge about sectorial skills demand trends, this extrapolation method assumes that the sample is an exact reflection of the population i.e. we expect that demand proportions of the sample will stay the same if the entire population completed the WSP questionnaire. The following are sector skills demand: The sample reported a total of 12 347 open vacancies classified as scarce skill across the all eight subsectors and occupations.
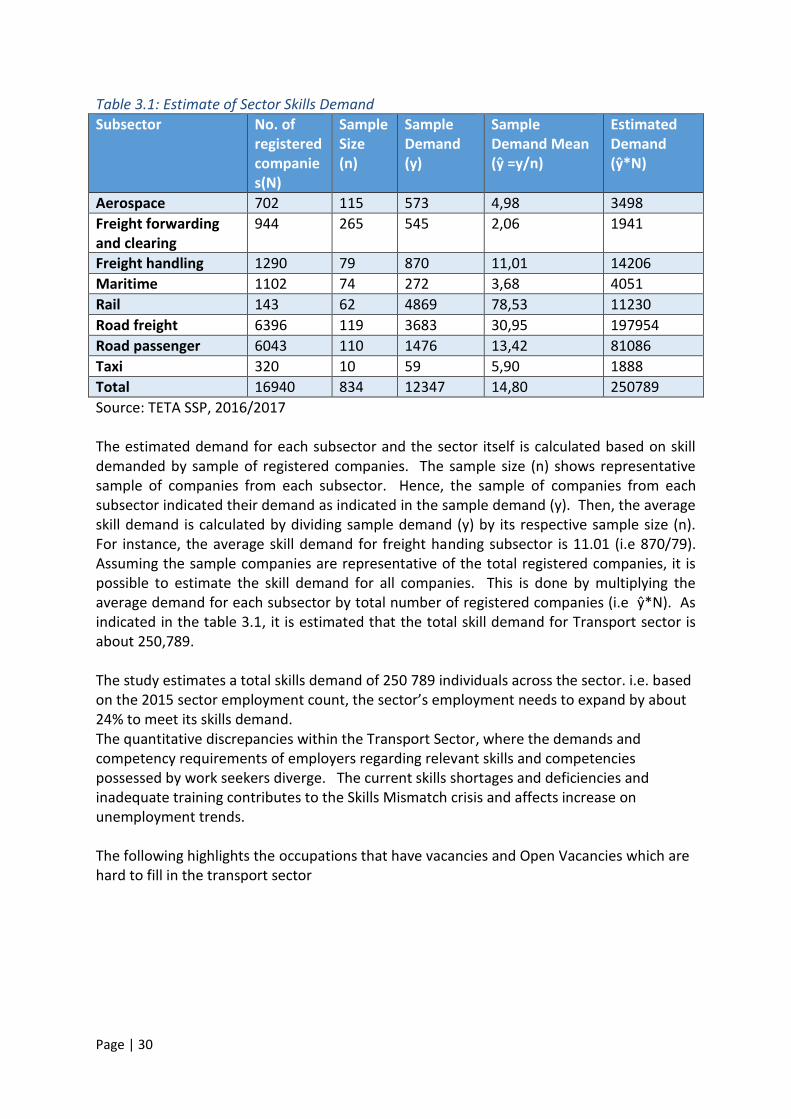
Page | 30
Table 3.1: Estimate of Sector Skills Demand
Subsector No. of registered companies(N)
Sample Size (n)
Sample Demand (y)
Sample Demand Mean (ŷ =y/n)
Estimated Demand (ŷ*N)
Aerospace 702 115 573 4,98 3498
Freight forwarding and clearing
944 265 545 2,06 1941
Freight handling 1290 79 870 11,01 14206
Maritime 1102 74 272 3,68 4051
Rail 143 62 4869 78,53 11230
Road freight 6396 119 3683 30,95 197954
Road passenger 6043 110 1476 13,42 81086
Taxi 320 10 59 5,90 1888
Total 16940 834 12347 14,80 250789
Source: TETA SSP, 2016/2017 The estimated demand for each subsector and the sector itself is calculated based on skill demanded by sample of registered companies. The sample size (n) shows representative sample of companies from each subsector. Hence, the sample of companies from each subsector indicated their demand as indicated in the sample demand (y). Then, the average skill demand is calculated by dividing sample demand (y) by its respective sample size (n). For instance, the average skill demand for freight handing subsector is 11.01 (i.e 870/79). Assuming the sample companies are representative of the total registered companies, it is possible to estimate the skill demand for all companies. This is done by multiplying the average demand for each subsector by total number of registered companies (i.e ŷ*N). As indicated in the table 3.1, it is estimated that the total skill demand for Transport sector is about 250,789. The study estimates a total skills demand of 250 789 individuals across the sector. i.e. based on the 2015 sector employment count, the sector’s employment needs to expand by about 24% to meet its skills demand. The quantitative discrepancies within the Transport Sector, where the demands and competency requirements of employers regarding relevant skills and competencies possessed by work seekers diverge. The current skills shortages and deficiencies and inadequate training contributes to the Skills Mismatch crisis and affects increase on unemployment trends. The following highlights the occupations that have vacancies and Open Vacancies which are hard to fill in the transport sector

Page | 31
Table 3.2: Annual estimate of skills Surplus and Deficit
Source: TETA SSP, 2016/2017 Training of employees is required in order to meet up with increasing requirements. Training opportunities for employees are limited (especially for low-educated and old workers), but improving. The Job quality contributes to the working image of a Sector and/or profession and by that to the possibilities to recruit and retain personnel. A distinction can be made between employment and work quality depending of occupational levels. Employment quality is affected by delocalisation of Transport jobs and social regime competition practices. To cut costs, pension and early retirement schemes are being restructured thus also affecting the employment trend. Working times are often irregular and in particular many Transport workers have to cope with irregular and (very) long absences from home and long hours of driving on the road. The Possibilities for part-time work in the Transport Sector are less than in other Sectors. Lastly, the work autonomy in the Transport Sector is relatively low. Problems caused by heavy physical work have been replaced by stress derived from time-pressures and efficiency improvements, thereby shifting from physical to social or psychological problems. The Transport Sector is considered a dangerous activity due to occurrence of accidents, public violence, and organized crime. Work intensity has increased due to, amongst others to increased traffic congestion and the use of ‘lean’ strategies or increasingly tight scheduled Transport services
3.4 What are the occupational wage trends? The two figures (Figure 3.1 & 3.2) below have been summarized from the Quarterly Employment Statistics (QES) reports as published by Stats SA (one in 2014 and one in 2016). The figures below shows average monthly salaries (including benefits) of the Transport sector. It is noted that, even though the figures show the same data during common years (2013 and 2014), the monthly salary estimates in the QES 2016 are two times higher than estimates in QES 2014. This may be largely due to differences in sample compositions in each report. Nonetheless, the difference makes it difficult to rely on trend information provided by it. It is also typical example of a data gaps experienced in the sector. Notwithstanding the difference in data as highlighted, it below clear that salary levels seem to fluctuate from one year to the next; i.e. the salary levels increase in one year and then
YearCLERICAL SUPPORT
WORKERS
ELEMENTARY
OCCUPATIONSMANAGERS
PLANT AND
MACHINE
OPERATORS AND
ASSEMBLERS
PROFESSIONALSSERVICE AND SALES
WORKERS
SKILLED
AGRICULTURAL,
FORESTRY, FISHERY,
CRAFT AND RELATED
TRADES WORKERS
TECHNICIANS AND
ASSOCIATE
PROFESSIONALS
Year 2013 13914 13571 7312 36111 -20749 8835 -16629 -88573
Year 2014 12959 19834 2564 47054 1579 8233 14770 11763
Year 2015 9798 10435 4779 35155 2886 15325 13654 15132
Year 2016 -99625 12916 -259037 -51930 -243085 -86 12910 11743

Page | 32
decreases the next year. Secondly, the data is an aggregation of different occupations in the TETA, thus making it difficult to discern levels and trends. Figure 3. 1: Average Monthly Earnings including Bonuses (QES, 2014)
Source: Stats SA Quarterly Employment Statistics, 2014 Figure 3.2: Average Monthly Earning including bonuses (QES, 2016)
Source: Stats SA Quarterly Employment Statistics, 2016
18 179
17 515
18 483
17 725
17 000
17 200
17 400
17 600
17 800
18 000
18 200
18 400
18 600
2013 2014 2015 2016
Average Monthly EarningS Including Bonuses (QES, 2014)
8 002
8 703
8 463
8 610 8 557
7 600
7 800
8 000
8 200
8 400
8 600
8 800
2010 2011 2012 2013 2014
Ave. Monthly Earning Including Bonuses (QES, 2016)

Page | 33
3.5 What are conditions of employment trends? The conditions of employment in the industry are broadly governed by the legislative framework of the country. Specifically, the main labour laws of South Africa are the Basic Conditions of Employment Amendment Act Number 11 of 2002, the Labour Relations Act 66 of 1995, the Skills Development Act of 97 of 1998, Employment Equity Act 55 of 1998, the Occupational Health and Safety Act 85 of 1993 and others. These acts lay out the framework for fair labour practices, wages and salary bargains. In this context, the employers and the employees can bargain for salaries and conditions of work. There are many drivers and determinants of work conditions. However, one of the common determinants are the characteristics (revenue, size, and product and service type) and behaviour of the employer. In particular, it is the extent to which the employer abides to the standards and regulations as dictated by the acts listed above. A practical example of a determinant of work condition is the category to which a business belongs. In South Africa, there are two broad categories of business operations; i.e. a business can either operate as an informal business (thereby categorized under the informal sector), or operate formally (thereby categorized under the formal sector). These categories have definitions and implications as explained below: Informal employment identifies persons who are in precarious employment situations irrespective of whether or not the entity for which they work is in the formal or informal sector. Persons in informal employment therefore comprise all persons in the informal sector, employees in the formal sector, and persons working in private households who are not entitled to basic benefits such as pension or medical aid contributions from their employer, and who do not have a written contract of employment. Informal sector: The informal sector has the following two components: i) Employees working in establishments that employ fewer than five employees, who do not deduct income tax from their salaries/wages; and ii) Employers, own-account workers and persons helping unpaid in their household business who are not registered for either income tax or value-added tax (STATS SA, 2016). Figure 3.3 below depicts information on the formal and informal job types within the Transport Sector. Figure 3. 3: Formal vs. Informal Employment in the Transport Sector
Source: STATS SA Annual Labour Report, 2016
Transport Sector Formal Employment
73%
Transport Sector Informal
Employment 27%
Job Types in the Transport Sector

Page | 34
Formal employment constitutes the majority of employment in the transport sector. Given the definition of informal employment and informal sector, the informal employment of more than 25% has two implications for TETA.
Although TETA is providing its skill development interventions, it is not earning revenue from the informal sector.
Moreover, there is an opportunity for workers to be placed in unregulated working condition.
There is a need to devise a strategy that engages with Department of Trade and Industry in formalizing the informal sector as the role of SMMEs in the transport sector is significant. 3.6 How is migration impacting on the Sector? The Transport Sector is directly affected by country and international migration. In country migration tends to be from rural to urban areas or to areas of commercial or industrial concentration. Such migration leads to population concentration which results in higher demand for Transport services. International migration between countries by land also leads to demand on land Transport (buses, Taxis, rail). This is the same with air travel; increased migration directly leads to increased demand. Therefore, in general, migration tends to increase demand in the Transport industry. 3.7 The extent of occupational skills supply in the Sector The extent of occupational skills supply in the Sector reviews the effect of under education on productivity and highlights the loss of competitiveness for firms when necessary skills are in short supply leading to production bottlenecks i.e. the analysis on total factor productivity and firm performance (e.g. output per head, value-added per worker). Furthermore, discussing the extent of occupational skills supply in the Sector consequently touches on quality of training of learners and graduates supplied by the Training institutions. The sector is faced with the issue of skills shortages and skill gaps which leads to inadequate readily competent graduates to enter the labour market. To infer the consequences of mismatch on productivity, For example, findings from the TETA WSP/ATR data analysis indicates that workers’ skills do not match the requirements of their jobs, therefore they may need additional training for which the employers will have to bear part of the cost. As is the case with other Sectors, the Transport Sector relies on both the formal education and training institutions and the vocational and/or private training institutions to train and supply the much needed skills for the Sector’s operations. The formal education and training institutions include traditional universities, technical universities and TVET colleges. These institutions generally operate independently and therefore enjoy academic and (most importantly) curriculum autonomy. They may choose to respond to specific industry needs (normally in the case of TVET colleges). The traditional ‘business’ model of these institutions is incentivized by factors which are not adequately responsive to Sectorial skills demand. The two main operating incentives for these education institutions are:

Page | 35
1. High enrollment and throughput (Mass production) 2. High research output (knowledge production)
In highlighting the extent of occupational skills supply in the transport sector, this section will respond to the following questions:
What is the extent of occupational skills supply in the sector?
What is the state of education and training provision?
What supply problems are firms experiencing?
3.7.1 What is the extend of occupational skills supply in the sector Figure 3.4 indicates aggregate skills mismatch of demand and supply of occupational skills. The Figure indicates the levels of total demand and supply for the years 2013 to 2016. For the years 2014 and 2015, the total demand was estimated to be less than supply. This suggests a possible availability of skills but not may not necessarily meeting needs of the sector. Figure 3. 4: Skills mismatch
3.7.2 What is the State of Education and Training Provision The fact that the traditional education institutions are seen as not adequate in their curriculum direction and training approach (they respond to some of the appropriate Sectorial needs) opens them up to criticism from the Sector and therefore, makes them a weaker supplier of skills appropriate for the Transport Sector. To further elaborate this finding, the research team conducted a stakeholder workshop engagement followed by a survey based research targeted at employers and recruiters in the Transport Sector. The findings of the engagement of key stakeholders in the sector, related to skills supply, are summarized as follows:
The curriculum relating to the Transport Sector operations in traditional education institutions are irrelevant and outdated and are therefore set to produce graduates which are not work ready
0
100000
200000
300000
400000
500000
600000
700000
800000
Year 2013 Year 2014 Year 2015 Year 2016
Axi
s Ti
tle
Axis Title
Figure 3.4: Skills Mismatch
Total Demand (no. of vacantposition for scarce & criticalskills)
Supply(no. of people withwork ready skills)

Page | 36
Traditional universities are not flexible enough to keep up with changes and needs in the Sector
Most university or college graduates arrive to the work place without any practical training which is a necessary requirement for work readiness
Companies which have volunteered themselves to provide practical training often have unrealistic expectation that graduates should be able to be productive during the training period, thereby signaling a confused message to the trainee
New Graduates (especially traditional university graduates) often have unrealistic expectation of remuneration relative to their ability to be productive in their first year of work, thereby reflecting non-studious attitude towards their training
It is a general feeling (of key stakeholders) that a lot of the Transport businesses are forced to take on graduate training (or apprenticeship) without any incentive to do so; and are purely doing so to meet regulation. This is more the case during an unfavorable economic situation
A few big organizations within the Sector (Transnet) have taken on the responsibility to become accredited training providers. A general impression is that (although this has high cost implication to the business) this produces high quality training and a supply of work-ready individuals for the Sector. Much better than the alternative.
On the other hand, the vocational and private training institutions are classified as all privately owned training service providers which are registered with TETA as vendors. These institutions generally provide very specialized and specific courses which are usually tailor-made to suit the functions of a single businesses or a group of businesses. The duration of these courses can range from 1 (one) day to two years. Most courses are SAQA accredited. The TETA therefore regulates its accredited training providers for compliance The ‘business’ model of these privately owned training institutions is such that it is easier for them to respond to industry changes and maintain relevance to the needs of the Transport Sector. These skill developers are incentivized by the following:
1. Sector relevance of their respective curricular and certification. It is important that they are industry compliant where licensing is necessary
2. The number of ‘graduates’ they actually placed in employment positions in the Sector
3. The number of businesses they have a relationship with (and the strength of the relationship with employers)
Despite the many challenges faced by these smaller institutions, it easy to recognize that they have more potential to satisfy the Sector’s skills needs. However, there are difficulties which the Sector experiences when dealing with such institutions. The difficulties are as follows:
As small training institution usually relies on one or two key individuals who are critical to its operations; such individual are normally either founders of the organizations or the continuation of the organization relies entirely on their continued involvement. It is generally risky for Sector businesses to have a long term relationship with these institutions.
These small training institutions are unable to produce large numbers of graduates at a time.

Page | 37
To illustrate the point made earlier about the extent to which these small training institutions track Sector operations to maintain relevance in order to get business; the following section describes geographical spread of the organizations and compares it to the concentration of Transport business activities. Figure 3.5 shows the spread of TETA approved and active skills training institution (public and private). From this figure, it is clear that Gauteng region enjoys the biggest proportion of skills training support, followed by KwaZulu Natal and the Western Cape. Therefore, the two figures together immediately show that supply side measures tend to follow or are attracted by the rate of Transport business activity. Figure 3. 5: Concentration of TETA Training Providers by Region
Source: TETA WSP 2016 The Sector still has a long way towards producing skills at the correct level of quality. This calls for further research and evaluation of some of the successful training models within the Sector, and how the rest of the Sector can learn to scale up from these.
3.7.3 What Supply Problems are firms experiencing
When there is a match between the occupation- specific skills in terms of demand and supply, then the Sector is in equilibrium. On the other hand if demand exceeds supply, then there is a scarcity of the occupation skills. When the supply exceeds demand then there exists an excess of skills in the market. The estimation of demand and supply is problematic because of inadequate data, unavailability of data and sometimes its quality is not of a high standard. Hence there is an
54%
16%
5%
12%
5%
3%
2%
3%
0%
Gauteng
KwaZulu-Natal
Eastern Cape
Western Cape
Mpumalanga
Limpopo
North West
Free State
Northern Cape
Figure 3.1: Concentration of TETA Training Providers By Region
%_Training _Institutions

Page | 38
attempt to use different sources of data to estimate the levels of mismatch and its characteristics. Some of the mismatch indicates that scarcity is associated with high level skills, such as engineering and similar technical skills. Then there is a shortage of occupations requiring management and specialist skills. Certain groups continue to experience a mismatch between demand and supply for different reasons. For instance, women in the technical skills, blacks in management and higher supervisory levels are not easily available.
The employment statistics is available in various forms from a number of statistical sources. For instance, Stats SA and secondary data sources from TETA provide some proxies to measure the utilization of labour in the Sector, but that not give information about its demand or supply. That suggests that in the long run regular forms of data systems from monitoring data and evaluations should be built to provide these data. During the SSP workshops, the stakeholders were asked to indicate the scarce skills as well as critical skills. The fact that they continue to indicate scarce skills is a clear confirmation that there is a gap between the demand and supply of skills in specific occupations. This remains a perpetual problem.
3.8 Identification of Skills gaps
3.8.1 Introduction
According to the DHET framework, Scarce Skills refer to those occupations in which there are a scarcity of qualified and experienced people, currently or anticipated in the future, either (a) because such skilled people are not available or (b) they are available but do not meet employment criteria (DHET, 2016). The DHET framework further elaborates that scarcity can be due to a selection of factors. The framework divides the driving factors into two categories, namely the absolute factors and relative scarcity. With respect to the first category, absolute factors which generally means that skilled individuals cannot be found in the market. For this category, this could be a result of a shift in the market and there is an emerging occupation, or a change in technology. The second group is relative scarcity, which generally means that skilled individuals exist in the market, but they do not meet the employment criteria. Factors which can influence this range from geographical challenges (people are not willing to relocate), to the fact that employers have to wait for a pool of potential candidates who are undergoing training. It is worthwhile to note that this definition (which for now serves as the South African definition) is not explicit about the normal market driver, which is salary. It also mentions very little about the matching function and matching efficiency. In considering the scarce skills definition, the following ought to be carefully considered: a. Inefficient matching (and hence skill shortages) may reflect a range of factors including
limited and asymmetric information and the heterogeneity of both individuals and jobs.

Page | 39
If either or both parties are too specific in their requirements there is likely to be inefficiency in matching – although insufficiently careful matching also has welfare costs
b. A skill shortage within an occupation is always dependent upon the scope for substitution across occupations – and also substitution between different qualification levels.
c. When applicant numbers swamp the jobs available, the efficiency of the labour market suffers and skill shortages can thus coexist with high unemployment levels. This can be particularly problematic when employers are geographically clustered.
d. If employers are pessimistic about the skills available in the labour market and so do not attempt to recruit at the requisite level, which may cause skill shortages to be under-reported.
e. The actual level of skill shortages in the economy will depend both on the institutional or micro-economic factors picked up by the Matching Function and by aggregate demand conditions, driven by macro-economic factors such as inflation and the policy of the central bank.
Elaboration on identification of skills gaps within the transport sector will give response to the following questions:
What is the extent of scarcities within the Transport Sector?
What are the skills gaps in the sector that need improving?
What is the impact of shortages on firms?
How employable are graduates in the sector?
3.8.2 What is the Extent of Scarcities within the Transport Sector In light of a local labour market dynamic introduced above, and for the reason of maintaining market appropriateness; the research team explored this definition of skills scarcity during stakeholder consultation workshops. The definitions from five of the eight subsectors were consistent with the universal definition. The definition “scarce skills” according to the Taxi Chamber The Taxi industry is historically an informal industry in its original design. It is evolving slowly in its role which it played historically as the dominant means of short-distance Transport for black South Africans during the Apartheid days. It has rendered itself almost completely impossible to regulate, mostly because the state did not understand the business model, (until very recently). It is the only Sector in the country which is fully controlled by the historically disadvantaged group of the South African population with all owners being either black or coloured South African. This industry in undergoing transformation from an informal to a more formal industry. South African statutes provide a clear guideline as to how this transformation process should be done (Act 5 of 2009 NLTA). In particular, this statute states that, as the industry goes through transformation, the values and results of transformation should first benefit active players (individuals) in the industry. These included, but not limited to current owners, current queue-marshals, clerks, current drivers and their immediate families. And, although this transformation is a national matter,

Page | 40
each association or a collection of associations has a clearly specified due-restriction needs definition which in most cases can be isolated by way of geography and, therefore, membership. Taking into consideration the dynamic explained above, it is intuitive to follow the logic of the Taxi industry scarcity definition provided above. When the Taxi industry declares a skill to be scarce, the industry actually means the following:
1. First of all, this is a formal skill which will be useful to the Sector in its formal state
2. A skilled individual cannot be identified from a population of association membership or their immediate family members.
3. The association will not look for any qualified individual outside the due-restriction of the association.
Therefore, the issue of scarce skill is not essentially shortage of skill for this industry but a skills gap. A skills gap occurs when an organization is unable to identify a specific skill from or within its existing pool of employees or ‘members’. The definition “scarce skills” according to the Road Passenger Chamber ‘A scarce skill exists when it is difficult to find a suitably qualified person (race, age and race) to fill a position’ Of all the sub-Sectors, the definition provided by the stakeholders of the Road Passenger chamber is perhaps the list sophisticated but, at the same time, a statutorily appropriate one. And perhaps, this is the very reason it was compelling for the team to highlight its departure from the universal definition elaborated above. This sub-Sector complies with the government requirements and guide lines regarding employment and skills development equity. It is by no surprise that this is the case as the Government owns a significant proportion of the industry as one of the ‘players’ through its parastatals. Therefore, it [Government] has a direct and significant control over hiring and labour demand. So, this Sector makes employment decisions based strictly on demographic elements (in accordance with BBBEE codes and requirements) such as gender, age and race; which can sometimes make it challenging to identify skilled candidates to recruit into occupations. Therefore, to expand and elaborate the subsector’s definition above, scarcity of skill for this sub-Sector is driven by equity based employment policies, i.e. when this Sector declares a specific skill scarce, what they actually mean is that:
1. there is not a sufficiently skilled individual who represents a previously disadvantaged sub-set of the population
2. unlike the Taxi industry, a skilled individual who is “previously disadvantaged” can be obtained anywhere in the country as long as the candidate is a South African citizen. Geography is therefore not a limitation nor is it a driver.
The driver of scarcity for this sub-Sector (factor influencing the scarcity of skills) has some implications about its ability to increase supply. One obvious implication is that the supply of skilled labour mainly depends on the market’s ability to train and attract the right type of individuals (gender, age and race).

Page | 41
Secondly, the power/bargaining dynamics as far as skills development in the Sector is concerned, are skewed in favour of the Government; both as a law-maker and a significant and direct ‘player’ in the market. This further suggests that this subsector is the easiest to govern, on the part of the Government. The definition “scarce skills” according to the Maritime Subsector “A scarce skill occurs when it is difficult or impossible to fill an occupation through normal recruitment channels. It is often the case when older and technically more experienced individuals leave the market. Such positions are almost impossible to replace as this is a highly technical industry” In contrast to the Road Passenger sub-Sector, the Maritime sub-Sector is by far more operationally sophisticated and complex as far as skills shortage and skills development are concerned. As much as this sub-Sector has a very high potential to create much needed job opportunities in large numbers (see description in the background above); it comes with challenges. When considering matters of skills shortages for this sub-Sector, the following points were identified as obstacles and drivers of skills scarcity during stakeholder consultation: a. This is a highly technical environment with an intense use of specialized machinery. This
means that the Sector is likely to be very “picky” and particular about employee selection. There is an inherent need and tendency to select individuals who generally have some notable technical skills or aptitude for technical education. In a South African context, this is particularly tricky as the education system battles to produce individuals who are exceptional in technical subjects such as Mathematics and Science (Besharati, 2014 and HRDC, 2014)
b. Although the state owns all the ports land through the National Ports Authority (Transnet, 2007), the marine operations and economic activity is still predominantly controlled by private business. The businesses in the Sector are mostly foreign owned. In fact, licencing and standards are controlled internationally, that is, the SA marine companies are forced (through their role and interaction during trade with international business) to adhere to international standards and norms, and so should individual employees. This can complicate skills training in the domestic South African market.
c. With rapidly changing technology and a dynamic skills needs environment, perpetuated
by the fact that many of the big machinery used in marine operations (ships), it is difficult to train new individuals domestically because acquiring trainers who qualified is a challenge on its own.
d. It is very expensive to train individuals (HRDC, 2007) in the Sector and it is equally
difficult for businesses to keep qualified individuals. Further, local businesses have to compete with international ones which generally pay more for the same skills levels due to stronger currency.
e. In light of the matters listed above, there is a need to view this sub-Sector as an outlier. Its drivers of scarcity are unique and complex and will require a higher level of attention.

Page | 42
3.8.2.1 What are the Skills Gaps in the Sector that need Improving
Subsector industries were asked to report the demand of scarce skills in their subsectors. Based on the data from the WSP, (Tables below) present the ten scarcest skills by subsector as well as demand. In light of the discussion of scarcity above, the following are the scarcest skills gaps in each sub Sector, together with an estimate of relative demands per skill that needs improving. The study has taken the top 10(ten) most scarce skills for each subsector. Below is the identified top 10 Scares skills list from the 8 Transport subsectors participating in skills development within TETA. The detailed list of subsector’s scarce skills list is attached in Annexure 2. Table 3.3: Transport Subsectors 10(ten) most Scarce Skills List
Aerospace
Occupation Demand OFO Number
Aircraft Maintenance Mechanic 3580 653201
Air Traffic Controller 2400 315401
Avionics Mechanic 1280 672101
Aeroplane Pilot 1140 315303
Aircraft Structures Worker 480 653202
Training and Development Professional 400 242401
Aeronautical Engineer 360 214403
Meteorologist 300 211201
Telecommunications Engineer 200 215301
Aeronautical Engineering Technician 180 311503
Freight forwarding and clearing
Occupation Demand OFO Number
Import Administrator 2620 335402
Clearing and Forwarding Agent 2160 333101
Customs Officer 1620 335101
Supply Chain Practitioner 800 333905
Dispatching and Receiving Clerk / Officer 680 432102
Freight Handler (Rail or Road) 560 833301
Sales Representative (Business Services) 280 333903
Call Centre Salesperson 200 524401
ICT Business Development Manager 200 243402
Importer or Exporter 140 142101
Freight handling
Occupation Demand OFO Number
Freight Handler (Rail or Road) 6600 833301
Truck Driver (General) 1260 733201
Office Supervisor 1100 334101
Store Person 1020 833402

Page | 43
Ship`s Master 800 315201
Ship`s Officer 800 315202
Crane or Hoist Operator 640 734301
Supply and Distribution Manager 480 132401
Warehouse Manager 440 132404
Forklift Driver 400 734402
Maritime
Occupation Demand OFO Number
Marine SaTVETy Officer 700 325702
Fishing Hand 580 821601
Deck Hand 500 735101
Skipper (Fishing Boat) 440 622201
Ship`s Officer 340 315202
Education or Training Advisor 320 235101
Clearing and Forwarding Agent 240 333101
Ship`s Master 240 315201
Ship`s Engineer 220 315101
Diver 200 684101
Rail
Occupation Demand OFO Number
Train Driver 28580 731101
Railway Signal Operator 15460 731201
Welder 13020 651202
Electrician 9060 671101
Diesel Fitter 8000 653304
Train Controller 3080 731202
Programme or Project Manager 2680 121905
Electrical Engineering Technician 1280 311301
Railways Assistant 1000 862920
Sheet Metal Worker 1000 651301
Road freight
Occupation Demand OFO Number
Truck Driver (General) 50360 733201
Supply and Distribution Manager 4500 132401
Freight Handler (Rail or Road) 2880 833301
Logistics Manager 2140 132402
Delivery Driver 1240 732101
Mechanical Engineering Technician 1160 311501
Transport Clerk 1080 432301
Diesel Mechanic 980 653306
Dispatching and Receiving Clerk / Officer 940 432102
Sales Representative (Business Services) 940 333903
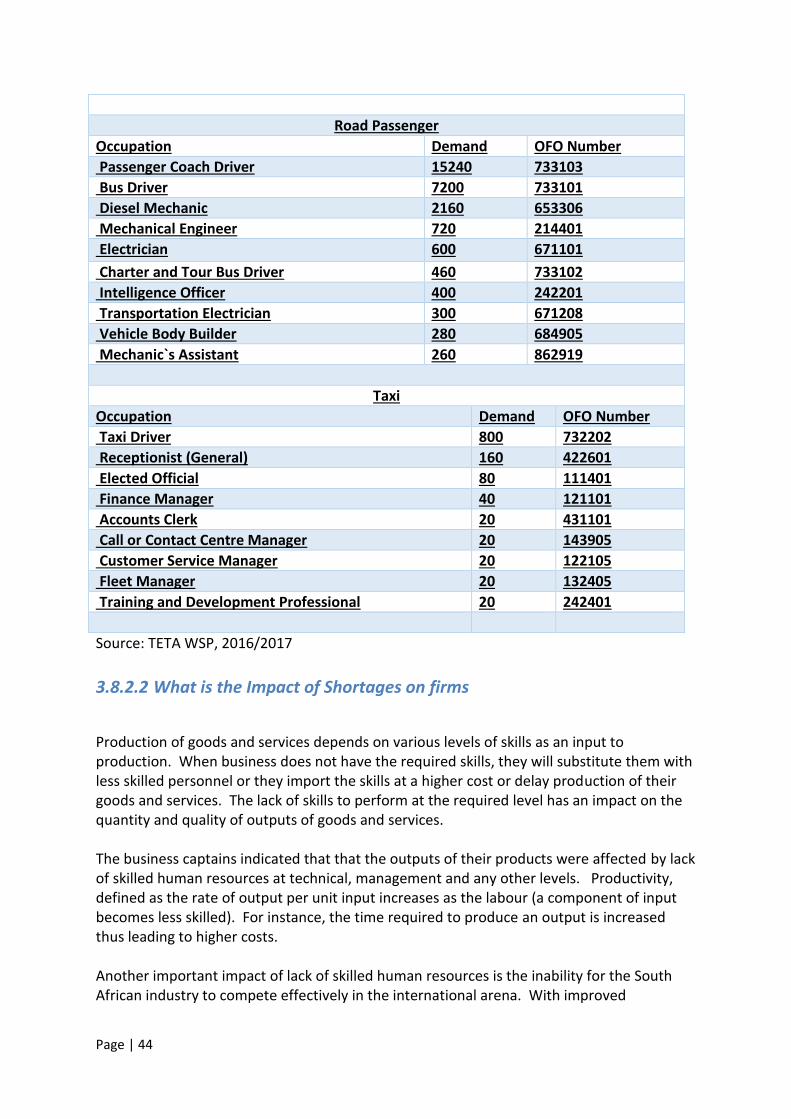
Page | 44
Road Passenger
Occupation Demand OFO Number
Passenger Coach Driver 15240 733103
Bus Driver 7200 733101
Diesel Mechanic 2160 653306
Mechanical Engineer 720 214401
Electrician 600 671101
Charter and Tour Bus Driver 460 733102
Intelligence Officer 400 242201
Transportation Electrician 300 671208
Vehicle Body Builder 280 684905
Mechanic`s Assistant 260 862919
Taxi
Occupation Demand OFO Number
Taxi Driver 800 732202
Receptionist (General) 160 422601
Elected Official 80 111401
Finance Manager 40 121101
Accounts Clerk 20 431101
Call or Contact Centre Manager 20 143905
Customer Service Manager 20 122105
Fleet Manager 20 132405
Training and Development Professional 20 242401
Source: TETA WSP, 2016/2017
3.8.2.2 What is the Impact of Shortages on firms
Production of goods and services depends on various levels of skills as an input to production. When business does not have the required skills, they will substitute them with less skilled personnel or they import the skills at a higher cost or delay production of their goods and services. The lack of skills to perform at the required level has an impact on the quantity and quality of outputs of goods and services. The business captains indicated that that the outputs of their products were affected by lack of skilled human resources at technical, management and any other levels. Productivity, defined as the rate of output per unit input increases as the labour (a component of input becomes less skilled). For instance, the time required to produce an output is increased thus leading to higher costs. Another important impact of lack of skilled human resources is the inability for the South African industry to compete effectively in the international arena. With improved
Page | 45
communication, the consumers of products search for the best quality products at the lowest prices. Therefore, since higher labour inputs are likely to lead to higher product costs, the products from the country then are likely to remain uncompetitive. Therefore, it can be concluded that shortages of skilled human resources have, in long run, an effect on the economy in terms of its employment, gross domestic products and other economic measures.
3.8.2.3 How Employable are Graduates in the Sector While various training models are lauded in addressing skills shortages, the SSP stakeholder consultations indicated concerns about the quality of training and work readiness depicted by graduates who were not involved in complementing theory with practice. A summary of the views was as follows: • Most graduates arrive at the workplace without any practical training which is a necessary requirement for work readiness •Companies which have volunteered to provide practical training often have unrealistic expectations that graduates should be able to be productive during the training period, thereby signaling a confusing message to the trainee •New Graduates (especially university graduates) often have unrealistic expectation of remuneration relative to their ability to be productive in their first year of work. • It is a general feeling that a lot of the Transport business are forced to take on graduate training (or apprenticeship) without any incentive to do so; and are purely doing so to meet Government regulations. This is more the case during an unfavorable economic situation •A few big organizations within the Sector (for example, Transnet) have taken on the responsibility to become an accredited training provider. A general impression is that this has high cost implications to the business but this model produces high quality training and a supply of work-ready individuals for the Sector. In Conclusion; In light of the points listed above, the training institutions and providers are working hard to meet the needs of the industry through traditional training as well as short term courses. The quality of the courses is supplemented by short terms courses illustrating that the practical component for university graduates may not be adequate. More collaboration between the Sectors will, in the long run, produce skills at the correct level of quality. As indicated by the SSP participants as well as documents reviewed, it is the case that there is a scarcity of some skills and the training systems are not yet able to cope with the demand. Issues related to the quality of training that students receive before employment was identified in the discussions and participants identified some of the gaps in the output (trainees, graduates) from training institutions (the supply side). The estimation of scarce and pivotal skills will continue to be a process that will require refinement with time. The estimation will involve the different stakeholders, namely, the

Page | 46
employers, the TVET and different Government departments. The process has started but will need for continuous improvement.

Page | 47
a. PIVOTAL LIST
The transport and storage sector has relied on both the Workplace Skills Plan survey and a separate survey in compiling the PIVOTAL list. The processes of compiling the list were as follows:
1. The SETA summarized a list of discretionary funding requests from the sector businesses to the SETA through the WSP. The prerequisite of the application process is that each business has to identify skills gaps within respective businesses
2. The SETA then compiled a shorter list from this summery. The shorter list consisted only of skills for which TETA has received the highest rates of funding requests.
3. Once the list was shortened, TETA then circulated the list back to all the sector
businesses for confirmation and possible adjustment
4. Based on corroborated responses from the sector businesses, the final list PIVOTAL list was compiled.
Table 3.4: The resultant PIVOTAL list is as follows:
OCCUPATION SPECIALISATION/ ALTERNATIVE TITLE
INTERVENTION PLANNED BY THE SETA
NQF LEVEL
NQF ALIGNED
QUANTITY NEEDED
Qty to be supported by SETA
Mechanical Engineers Air-conditioning, Heating and Ventilation (including fire) Engineer; Automotive Engineer; Diesel Engineer; Fluid Mechanics Engineer; Forensic Engineer; Heating and Ventilation Engineer; Machine Design and Development Engineer; Maintenance Management Engineer; Mechanical Engineer (Mines); Mechatronics Engineer; Piping Engineer; Pressurised Vessels Engineer; Rotational Plant Engineer, Structural Steel Engineer; Thermodynamics Engineer; Transportation Systems Engineer
Bursary 8 Y 50 30
Diesel Mechanic Diesel Electrical fitter; Diesel Fitter mechanic; Diesel Fuel Injection Mechanic; Diesel Fuel Injection Technician; Diesel Injector; Field Service Technician (diesel); Truck Mechanic;
Apprenticeships 4 Y 150 150
Transportation Electrician
Auto Electrician; Automotive Electrician; Automotive Electrical Fitter;Autotronics Technician; Locomotive Electrician; Ships Electrician; Transport Electrician; Vehicle Electrician; Aircraft Electrician
Apprenticeships 4 Y 100 50

Page | 48
Supply and Distribution Manager
Acquisitions Manager; Depot Manager; Freight Forwarding Customs Clearing Manager; Freight Manager; Goods Clearance Manager; Parts Manager; Procurement Manager; Purchase Manager; Supply Chain Executive; Supply Chain Manager; Supply Lead Manager
SCM Learnership 6 Y 50 50
Ship’s Engineer Chief engineer (< 750kW port operations), Chief engineer (< 1500kW port operations), Chief engineer officer (port operations), Engineer officer, Second engineer (< 3000kW), Chief engineer (< 3000kW), Second engineer, Chief engineer, Electro technical officer, Chief engineer officer (special grade)
Bursary (Tertiary qualification) / Learnership / Skills Programmes / Workplace Experience
6 Y 150 30
Electrical engineer Control Engineer; Electrical Design Engineer; Electrical Engineer (Mines); Electric Power Generation Engineer; Electromechanical Engineer; Illumination Engineer; Power Distribution Engineer; Power Systems Engineer; Power Transmission Engineer; Railway Signal Engineer
Bursary 8 Y 20 20
Logistics Manager Dispatch Logistics Manager SCM Learnership 6 Y 50 50
Mechanical Engineering Technician
Aeronautical; Automotive Engineering Technician; Fuel Cell Technician; Marine Engineering Technician; Naval Technician; Mechanical Instrument Technician.
Bursary/ Apprenticeships
6 Y 193 60
Driver Freight Operator, Lorry Driver, Tanker Driver, Truck Driver (general), Tilt Tray Driver, Petrol Tank Driver, Cement Mixer Driver, Road Train Driver, Logging Truck Driver, Plan Operator.
Learnership 4 & 5 Y 100 100
Facilities Manager Facilities Supervisor; Campus Administrator/Supervisor
Bursary 5 Y 350 30
Driver/ Operator Plant Operators / Truck Drivers Learnership 200 Y 350 30
Principal Provincial Inspector
Instructors / Facilitators ETDP Diploma 10 Y 350 30
Assistant Director & Deputy Director: Provincial Transport Management, Vehicle Technical Compliance Officer & Assistant Manager: Vehicle Inspectorate Support
Facilities Supervisor; Campus Administrator/Supervisor
Bursaries: Fleet Management
3, 8 Y 350 30
Source: TETA WSP, 2016/2017

Page | 49
As part of the completion of the WSP Discretionary grant application, each business is required to indicate what intervention is recommended to close the identified skills gap. It then became the transport SETA’s duty to consider each recommended intervention in relation to the corresponding skills gaps. The Transport SETA internally assessed each intervention separately to determine the ease of implementation and the intervention’s likelihood to close the skills gap. On the bases of this assessment, the final list of interventions was compiled. With this PIVOTAL list, the SETA understands that very specific skills gaps have been identified by sector employers. The SETA further understands that these skills gaps, if not “closed”, likely to hamper sector productivity and economic performance. Therefore, by addressing the identified skills gaps the SETA will provide the sector with the necessary skills to increase productivity, enhance economic performance and potentially grow the South African economy. The demanded quantities indicated in the table above are a result of requests from individual businesses that completed the WSP. From these quantities, TETA then formulated skills development targets based on its ability to, and availability of funding. This PIVOTAL list contains all skills gaps classified as the sector’s list of high priority skills. The final list itself is not put in any order. Each skill is as important as any other skill on the PIVOTAL list. 3.9 Lessons from Chapter 3 This chapter has offered the following lessons:
Through a process of linear extrapolation, it was estimated that the Transport sector demands over about 250 000 different skilled individuals to fill vacant positions
The quality and quantity of skills training does not need the skills needs of the sector. In particular, traditional education institutions are seen to be too theory based and lack practical components in curriculum development.
Small and private skills trainers are perceived to be potentially more appropriate to become relevant sector skills training providers
There are worrying data gaps as far as wage/salary trends are concerned. The sector ought to collect its own primary data
About a third of the sector’s employment is categorized as informal employment
Training provider are concentrated in provinces with high levels of economic activity (Gauteng, Western Cape, Eastern Cape and Kwazulu Natal)

Page | 50
4 Chapter 4: Sector Partnerships
4.1 Introduction The purpose of this chapter is to assess the effectiveness of existing TETA partnerships and to determine the outcomes of new partnerships the Transport Sector. It is important to understand the nature of the TETA partnerships in order to assess their effectiveness in addressing the skills development requirements of the sector. For this section, data from desk reviews of data gathered from chamber heads and other secondary data were used. 4.2 Existing Partnerships TETA is committed to forging partnerships with TVET Colleges and Universities to up skill the Transport Sector. We have rolled out a number of projects with TVET Colleges country wide ranging from training of assessors to the development of quality management systems. The TVET Colleges have the advantage of providing training in rural areas at an affordable cost. Their occupationally driven curricula fit in well with developing semi-skilled and unskilled workers in the Sector. TETA seeks to strengthen its effectiveness; it works with a wide range of TVET and higher educational institutions. The Universities of the Western Cape and the Witwatersrand (CLEAR – AA) are strategic research partners for TETA. The objective of the partnership is to provide credible research for Sector skills planning and build research capacity within the organisations. The universities of Cape Town and Kwa Zulu Natal also locate Centres of Excellence for the Transport Sector. These institutions, funded by the Department of Transport, fulfil the primary objective of increasing the supply of engineering skills in the Sector. Table 4.1 illustrates the partnerships with TVETs and universities. Table 4. 1: TETA existing partnerships with Universities and TVET colleges
PARTNERSHIPS WITH TVET & HET INSTITUTIONS
Province College Deliverables
KZN Gauteng Limpopo Free State Western Cape
Umfolozi TVET, eThekwini Victory TVET, Ekhuruleni TVET Lephalale TVET, Capricon TVET Motheo TVET, Goldfield TVET College of Cape Town, False Bay, Northlink
Training for assessors, moderator facilitators in line with ETD unit standards
Mpumalanga Northern Cape Western Cape Mpumalanga Northern Cape
Gert Sibande TVET Northern Cape Urban TVET College of Cape town, False Bay, Northlink Ehlanzeni TVET Northern Cape Rural TVET
TETA to provide QMS toolkit for programme approval
Mpumalanga Gauteng Northern Cape Western Cape
Gert Sibande TVET, Ehlanzeni TVET Victory TVET, Ekhuruleni TVET Northern Cape Urban TVET College of Cape town, False Bay,
Development & delivery of the learning materials within TETA mandate
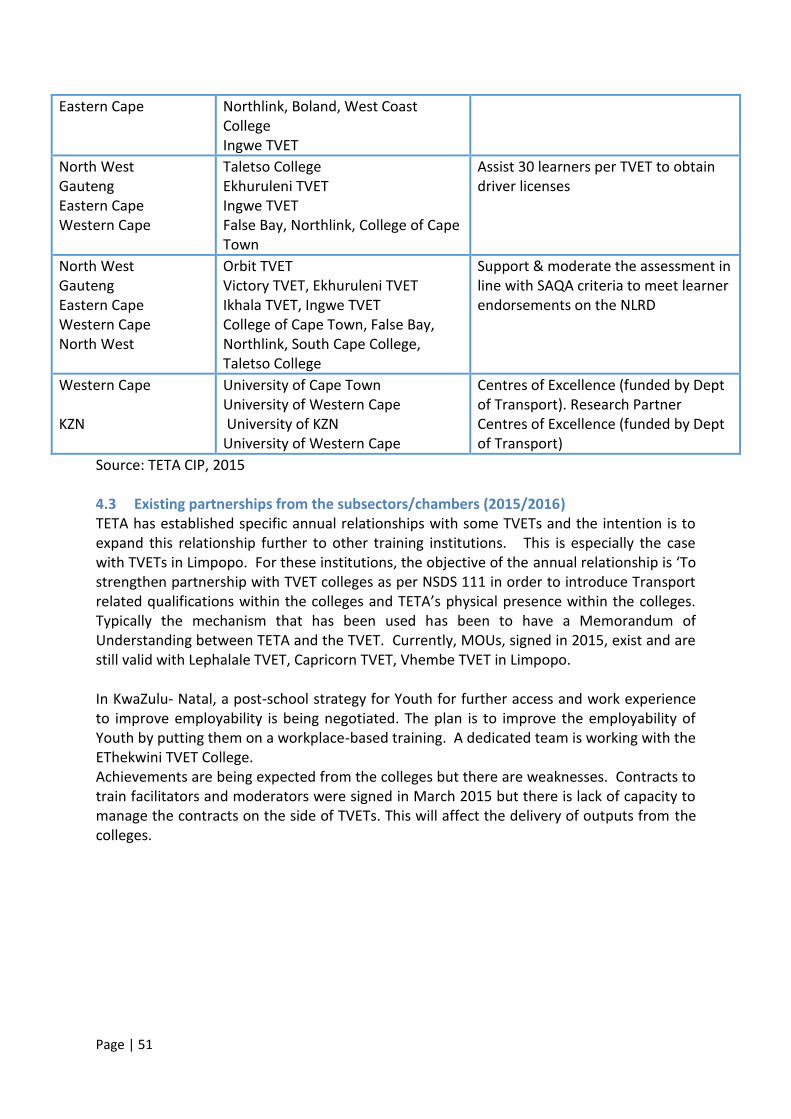
Page | 51
Eastern Cape Northlink, Boland, West Coast College Ingwe TVET
North West Gauteng Eastern Cape Western Cape
Taletso College Ekhuruleni TVET Ingwe TVET False Bay, Northlink, College of Cape Town
Assist 30 learners per TVET to obtain driver licenses
North West Gauteng Eastern Cape Western Cape North West
Orbit TVET Victory TVET, Ekhuruleni TVET Ikhala TVET, Ingwe TVET College of Cape Town, False Bay, Northlink, South Cape College, Taletso College
Support & moderate the assessment in line with SAQA criteria to meet learner endorsements on the NLRD
Western Cape KZN
University of Cape Town University of Western Cape University of KZN University of Western Cape
Centres of Excellence (funded by Dept of Transport). Research Partner Centres of Excellence (funded by Dept of Transport)
Source: TETA CIP, 2015 4.3 Existing partnerships from the subsectors/chambers (2015/2016) TETA has established specific annual relationships with some TVETs and the intention is to expand this relationship further to other training institutions. This is especially the case with TVETs in Limpopo. For these institutions, the objective of the annual relationship is ‘To strengthen partnership with TVET colleges as per NSDS 111 in order to introduce Transport related qualifications within the colleges and TETA’s physical presence within the colleges. Typically the mechanism that has been used has been to have a Memorandum of Understanding between TETA and the TVET. Currently, MOUs, signed in 2015, exist and are still valid with Lephalale TVET, Capricorn TVET, Vhembe TVET in Limpopo. In KwaZulu- Natal, a post-school strategy for Youth for further access and work experience to improve employability is being negotiated. The plan is to improve the employability of Youth by putting them on a workplace-based training. A dedicated team is working with the EThekwini TVET College. Achievements are being expected from the colleges but there are weaknesses. Contracts to train facilitators and moderators were signed in March 2015 but there is lack of capacity to manage the contracts on the side of TVETs. This will affect the delivery of outputs from the colleges.
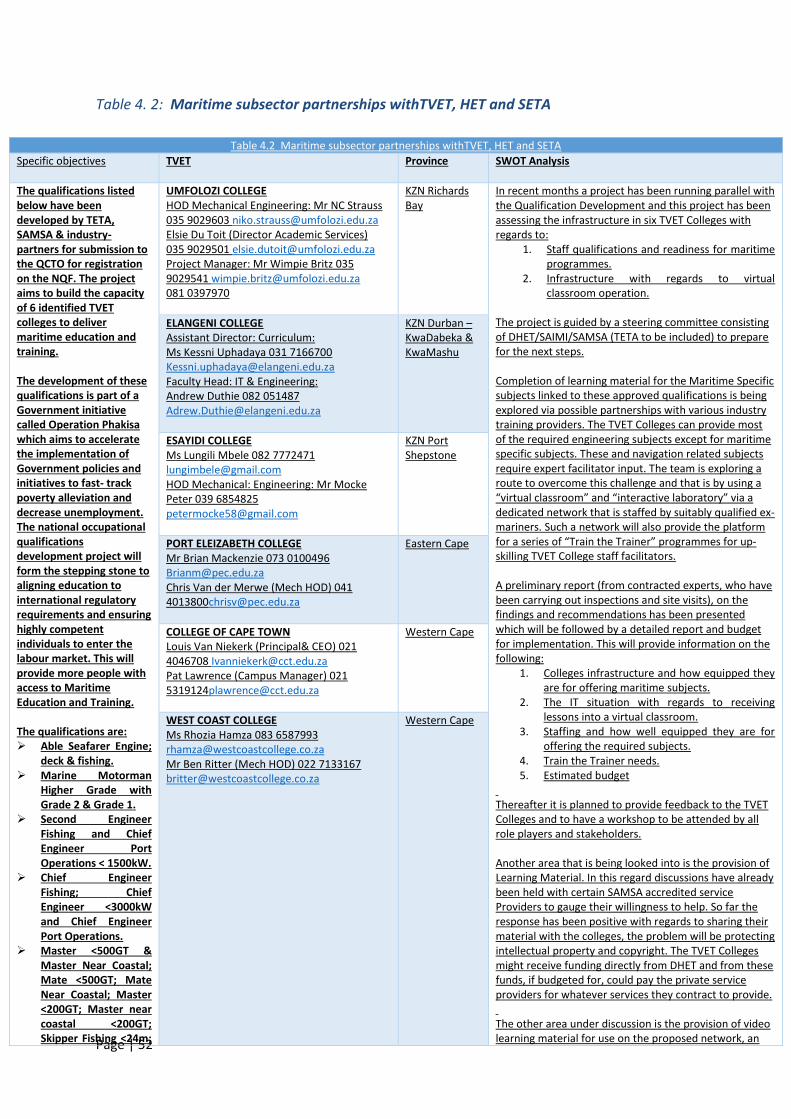
Page | 52
Table 4. 2: Maritime subsector partnerships withTVET, HET and SETA
Table 4.2 Maritime subsector partnerships withTVET, HET and SETA
Specific objectives
TVET Province SWOT Analysis
The qualifications listed below have been developed by TETA, SAMSA & industry-partners for submission to the QCTO for registration on the NQF. The project aims to build the capacity of 6 identified TVET colleges to deliver maritime education and training. The development of these qualifications is part of a Government initiative called Operation Phakisa which aims to accelerate the implementation of Government policies and initiatives to fast- track poverty alleviation and decrease unemployment. The national occupational qualifications development project will form the stepping stone to aligning education to international regulatory requirements and ensuring highly competent individuals to enter the labour market. This will provide more people with access to Maritime Education and Training. The qualifications are: Able Seafarer Engine;
deck & fishing. Marine Motorman
Higher Grade with Grade 2 & Grade 1.
Second Engineer Fishing and Chief Engineer Port Operations < 1500kW.
Chief Engineer Fishing; Chief Engineer <3000kW and Chief Engineer Port Operations.
Master <500GT & Master Near Coastal; Mate <500GT; Mate Near Coastal; Master <200GT; Master near coastal <200GT; Skipper Fishing <24m;
UMFOLOZI COLLEGE HOD Mechanical Engineering: Mr NC Strauss 035 9029603 [email protected] Elsie Du Toit (Director Academic Services) 035 9029501 [email protected] Project Manager: Mr Wimpie Britz 035 9029541 [email protected] 081 0397970
KZN Richards Bay
In recent months a project has been running parallel with the Qualification Development and this project has been assessing the infrastructure in six TVET Colleges with regards to:
1. Staff qualifications and readiness for maritime programmes.
2. Infrastructure with regards to virtual classroom operation.
The project is guided by a steering committee consisting of DHET/SAIMI/SAMSA (TETA to be included) to prepare for the next steps. Completion of learning material for the Maritime Specific subjects linked to these approved qualifications is being explored via possible partnerships with various industry training providers. The TVET Colleges can provide most of the required engineering subjects except for maritime specific subjects. These and navigation related subjects require expert facilitator input. The team is exploring a route to overcome this challenge and that is by using a “virtual classroom” and “interactive laboratory” via a dedicated network that is staffed by suitably qualified ex-mariners. Such a network will also provide the platform for a series of “Train the Trainer” programmes for up-skilling TVET College staff facilitators. A preliminary report (from contracted experts, who have been carrying out inspections and site visits), on the findings and recommendations has been presented which will be followed by a detailed report and budget for implementation. This will provide information on the following:
1. Colleges infrastructure and how equipped they are for offering maritime subjects.
2. The IT situation with regards to receiving lessons into a virtual classroom.
3. Staffing and how well equipped they are for offering the required subjects.
4. Train the Trainer needs. 5. Estimated budget
Thereafter it is planned to provide feedback to the TVET Colleges and to have a workshop to be attended by all role players and stakeholders. Another area that is being looked into is the provision of Learning Material. In this regard discussions have already been held with certain SAMSA accredited service Providers to gauge their willingness to help. So far the response has been positive with regards to sharing their material with the colleges, the problem will be protecting intellectual property and copyright. The TVET Colleges might receive funding directly from DHET and from these funds, if budgeted for, could pay the private service providers for whatever services they contract to provide. The other area under discussion is the provision of video learning material for use on the proposed network, an
ELANGENI COLLEGE Assistant Director: Curriculum: Ms Kessni Uphadaya 031 7166700 [email protected] Faculty Head: IT & Engineering: Andrew Duthie 082 051487 [email protected]
KZN Durban – KwaDabeka & KwaMashu
ESAYIDI COLLEGE Ms Lungili Mbele 082 7772471 [email protected] HOD Mechanical: Engineering: Mr Mocke Peter 039 6854825 [email protected]
KZN Port Shepstone
PORT ELEIZABETH COLLEGE Mr Brian Mackenzie 073 0100496 [email protected] Chris Van der Merwe (Mech HOD) 041 [email protected]
Eastern Cape
COLLEGE OF CAPE TOWN Louis Van Niekerk (Principal& CEO) 021 4046708 [email protected] Pat Lawrence (Campus Manager) 021 [email protected]
Western Cape
WEST COAST COLLEGE Ms Rhozia Hamza 083 6587993 [email protected] Mr Ben Ritter (Mech HOD) 022 7133167 [email protected]
Western Cape

Page | 53
Skipper Fishing >24m; Deck Officer Fishing <24m; Deck Officer Fishing >24m.
ongoing exploration. The Work Experience component will not be handled by the colleges. It is hoped that we will be in a position to run a pilot programme for one qualification in two colleges during the last quarter of 2016, and be ready to introduce maritime programmes into all six colleges in 2017, having all the developed qualifications registered on the National Qualification Framework, NQF.

Page | 54
Memoranda of Understanding (MoU) have also signed between TETA and other organisations, including SETAs. The Partnership between TETA and Other Organisations table has been attached as an annexure in the Continuous Improvement Plan (CIP 4.4 Achievements and Challenges TETA is building partnerships with different subsectors to improve the planning for the Transport industry. A number of TVET colleges spread throughout the provinces are working with TETA to build the capacity of assessors, moderators and facilitators while the universities form centres of excellence and provide research capacity for the Sector. TETA has signed MoU’s with TVET colleges, HEI and other SETA’s The implementation process is slow because of lack of project management capacity in the TVET colleges. Contracts to train facilitators and moderators were signed in March 2015 but there is lack of capacity to manage the contracts on the side of TVETs. Lack of equipment of the TVET colleges tends to affects the timely delivery of contract outputs as defined by MoU between TETA and TVETs. 4.5 New Partnerships TETA is committed to continually identify strategic partners and forge partnerships to upskill the transport sector. Partnership with QCTO The SETA has also established a working relationship with the Quality Council for Trades and Occupations (QCTO) and is actively working with the QCTO to register occupationally directed qualifications for the Sector. Partnership with Department of Environmental Affairs TETA has identified a need to form a partnership with Department of Environmental Affairs regarding Green Economy. The DEA is the lead agent for the Environmental Sector and the partnership will solicit avenues that can be undertaken to identify key areas of environmental skills demand and funding green skills learning programmes. Partnership with Industry and Labour TETA works closely with industry and Labour on the SSP development process. The new partnership with these stakeholders will contribute in accelerating the implementation of Post School Education and Training under NDS IV. TETA will also forge partnership with employer associations. The collaboration between TETA and the associations are important for a number of reasons such as industry policy formulation and Identification of industry skill needs and gaps Research Partnerships TETA will also continue to foster research partnerships with HEIs and other research-based institutions, such as HSRC, CSIR and others. TETA will embark on a process of appointing a Research Chair who will exercise authority on the review of all research proposals and shall in conjunction with the Research and Knowledge Manager, determine the suitability and appropriateness of the proposal for implementation and advice the relevant authorities

Page | 55
accordingly. The criteria for the Research Chair appointment shall ensure that only relevantly qualified researchers are contracted to conduct research studies. The Research Committee will be established and its role among other things will be to provide technical oversight over all research studies commissioned by TETA. The Research Committee shall review and approve research proposals and completed reports to determine their suitability for publication and advise the Research and Knowledge manager on suitable actions. The committee will also be responsible for the establishment of clearing house for dissemination of research results especially on sensitive issues requiring clearance by the Executive and the Board. Through the Service provider (CLEAR-AA, University of the Witwatersrand) TETA staff members involved in the SSP development process will be capacitated in Policy Analysis, ETQA / WSP / ATR Analysis and stakeholder engagement. This is an integral part of the project plan and takes place through job shadowing throughout the project and through a specific capacity building course as developed by the service provider. The development of research skills will be encouraged for staffs who are involved with the SSP development process Conclusion The TETA has a track record of a number of successful partnerships, with universities, TVETs, and research. Some partnerships have presented challenges that will help inform a more successful way forward. TETA will also apply innovative ideas to strengthen partnerships with TVET colleges and built partnerships with different sub-sectors to improve the skills planning for the transport sector. Further partnerships are required, in particular to address the skill development needs of Transport Sector (with Industry and Labour) and to address opportunities to realise synergies with other SETAs.

Page | 56
5 Chapter 5: Skills Priority Actions Findings from Chapter One: The Transport Sector profile The Transport Sector comprises of the provision of passenger or freight Transport, whether scheduled or not, by rail, pipeline, road, water or air and associated activities such as terminal and parking facilities, cargo handling and storage. It was noted that the SARS and STATSSA (SIA) Standard Industry Classification codes are different from those that are used by DHET for the purposes of SETA classifications. Further to this, the Sector definition of the Transport Sector used by TETA is wider than that used by STATSSA. The TETA definition includes some support businesses whose main focus or purposes is not Transport. This makes it difficult to corroborate information for research purposes and it can have the potential to mislead the SETA during allocation of skills development funds. As STATSSA reports, (STATSSA, 2016) the Transport and storage Sector contributes 9% to the country’s Gross Domestic Production. Further, an increase in revenue has been noted in the Sector since 2012, increasing revenue from R 242 billion in 2012 to about R 256 billion in 2015. Therefore, as a Sector, Transport Sector was the 5th largest contributor to the economy of RSA. As SARS reports (SARS; 2016), the Sector has 16 252 registered businesses, with the Road Freight and Road Passenger subsectors notably having the largest numbers. Further significance of the Sector is noted by examining employment figures which show that the Sector accounted for 6% of the national labour market in 2015. In addition to this, the Sector provides big exposure to the other Sectors, given its contribution to the supply chains of all the major Sectors. As a result it, contributes positively to the country’s labour market. Gauteng province is the highest employer of the Sector, employing a total of 38%. This is as a result of the high economic activity as well as availability of skills in the province. The Coastal provinces follow, taking into account that the maritime subsector is actively involved in the harbour operations there. As a hub of employment, Gauteng attracts a large number of international and local migrants. Consequently, migration has an impact on the demand and supply of skills in the Sector. With regards to gender transformation, the Transport Sector is among the least transformed industries compared to Services, Utilities, Agriculture, Construction, Finance and Trade. 82% of the labour market is still dominated by male employees. In terms of racial transformation, the Sector contributes 5.9% of employment to black South Africans. Therefore, this shows that there is still need for progress in the Sector in terms of racial and gender transformations. .The Transport Sector largely consists of formal (73%) as compared to informal employment. Formal employment in the Sector has continued to experience growth in providing jobs (supply of skills) over the years (2014-2015) while experiencing a decrease in informal jobs. This shows that the Sector continues to provide significant growth to the country’s formal employment Sector. Recommended Actions

Page | 57
The Transport Sector needs to address gender inequality in the workplace, that is, getting more women involved in the Sector as it is currently male dominated. There is need to provide career expos that get female students involved, training opportunities and motivation to get more women involved in the Sector from early stages of schooling.
Employment of more black people in the Sector is also recommended as there is still a low percentage. This should be considered in the recruitment of new skills within the Sector.
5.1 Findings from Chapter Two: Key Skills Issues
Desktop reviews with public domain information, SSP Workshops conducted in 5 provinces with key representatives from the subsectors and lastly surveys with representatives from associations in the subsectors where used to collect data. The data was used to provide information and understand the change drivers that influence the demand and supply of skills within the Sector The demand and supply of labour in the Transport Sector is highly influenced by socio-economic and policy factors in the country. Government regulations play a key role in driving demand and supply of labour as well as occupational patterns in the Sector. The NDP is a significant driver of change within the skills demand and supply of the Sector. The Transport Sector has a role to play to ensure that the goals of the NDP of alleviating poverty and reducing inequality are met. The NSD III has made commitments to address skills shortage in South Africa; as a result it plays a significant role in the development of skills within the Transport Sector. The NSD III mandates TETA to establishing a creditable institutional mechanism for skills planning and enhancing skills, addressing issues relating to quality, scarcity of skills, youth career guidance initiatives. The Department of Transport has influence on the development of the Sector as it contributes to regulation of the Sector through setting norms and standards hence influencing skills and service delivery within the Sector. Through the large array of public entities, the Department contributes significantly to skills and development of the Sector. Therefore, changes in their plans and operations have an impact on their specific subsectors. Further, the Broad-Based Black Economic Empowerment (BBBEE) is a key driver of labour demand and supply in the Sector as it addresses and provides regulations to issues of skills development in the country. This is through regulating the skills that are brought into workplaces as it ensures that people from previously disadvantaged backgrounds are given preference to jobs, this then affects the skills available in the Transport Sector. The entry and growth of other players in the industry also has an impact on skills in the Sector. Some subsectors such as rail within the Transport Industry are prone to competition –both for business and skills labour from the growth of SMMEs which has an impact on skills supply and demand in the Sector. This contributes to the challenge of scarce skills in the

Page | 58
Sector as SMME’s assists their employees to gain experience and eventually excel in areas or fields where they operate. A constantly changing work environment encompassing globalisation and climate changes also impacts on the skills demand and supply in the Sector. For instance, in the maritime subsector, there is a need to continuously keep up with constantly evolving operating standards of the various multinational organizations. As a result, this has an impact on skills and their development as training institutions have to continually readapt with the changes, compete for skilled labour from international companies, face shortages of skilled instructors as well as hefty training expenses. Technological advancements or changes also have an impact on skills demand; given that workers have to learn new skills to meet the technological changes resulting in the demand for more skills, those available may no longer be applicable. Recommended Actions
The Transport Sector/subsectors should become more aware of the climatic and environmental changes to their subsectors and therefore consider this in skills planning and development initiatives. This can be done by ensuring that training provided to improve on skills is adaptable and not rigid to suit the changes occurring.
To tackle the issue of skills development, the National Infrastructure Plan suggests easing immigration in Sectors linked to scarce-skills categories and sharing a pool of scarce skills between public Sectors.
5.2 Findings from Chapter Three: Extent of Skills Mismatches The relative degree of importance in answering the question of skills in each subsector relied deeply on answering the extent and nature of demand in each subsector. The study acknowledged the process of estimating demand would only include a straight forward count of the number of open (unfilled) vacancies from each of the individual businesses representing a “reported” population of the Transport Sector (±16 000) (DHET, 2016). In the discussion, it was acknowledged that approaches used to gather information such as the use of questionnaires are not usually reliable as these questionnaires are only circulated to selected subsections of the population. Only 5% of the known population of Transport Sector business responded and hence results and generalization from this group would be unrepresentative and inaccurate. This is because a basic count of open vacancies from businesses which respond to the survey and reporting the totals as the official Sector estimate of skills demand would be insufficient and incomplete. A more accurate approach was then identified and employed which involved using a simple statistical method of extrapolation. The idea of this was to create a rational that reflects the full size of the population. This way the study was to produce estimates that reflect to the actual size of the population in the Transport Sector. The study used sample information obtained from the WSP survey for 2015 to estimate the population. Using this extrapolation,

Page | 59
it was estimated that approximately 12 347 open vacancies which are classified as a scarce skill across all eight subsectors and occupations (with OFO codes) existed. The extrapolation method also helped to identify total skills demand of 246 940 individuals across the Sector; I.e. based on the 2015 Sector employment count. The method also identified that across all Sectors employment needs to expand by about 24% to meet its skills demand. The question of what qualifies as a scarce skill has been answered differently by each subsector. It was discovered that some subsectors had their own definition which at some point deviated from the actual universal definition provided by DHET. There were concerning findings identified in each subsector on what contributes to each Sector having problems in bridging the skills gap such as geographical challenges ( people are not willing relocate ), market being a driver ( potential candidates demanding high salaries when they lack experience The Taxi industry, scarce skills are not based on one having a formal qualification, but are tied to when the Taxi association cannot identify a specific skill within the due-restriction of the association. This on its own is very problematic to the question of how one Sector understands recruitment to bridge the skills gap. However, within the road passenger subsector, Government regulations play a part in the lenses of hiring, such in accordance with BBBEE codes and requirements. Thus, this plays a part in the skills gap. Discussion with subsector representatives indicated that TVET, colleges and institutions of higher learning are not providing relevant curriculum that responds to the scarce skills and skills gap that meets the demand of employers in the subsectors. On the other hand, companies which provide practical training often have unrealistic expectations when it comes to graduates as they expect them to be productive during the training period. It is a general feeling that a lot of the Transport businesses are forced to take on graduate training (or apprenticeships) without any incentive to do so; and are purely doing so to meet regulation. This is more the case during an unfavorable economic situation. A few big organizations within the Sector (Transnet) have taken on the responsibility to become an accredited training provider. A general impression is that (although this has high cost implication to the business) this produces high quality training and a supply of work-ready individuals for the Sector. Recommended Actions
To address the issue of skills demand, employees could ensure that they partner with universities in curriculum development to ensure quality in the skills that are made available to deal with the demands in their subsectors
The importance of STEM- Science, Technology, Engineering and Mathematics to address the shortage of skills in the subsector should be encouraged from early educational years. This will, in the long run assist the Sector in addressing skills shortages. Learners need to stay motivated in these fields.
Page | 60
Quality of training to be reviewed to include more practical work readiness activities. This will assist in improving on the skills gaps between what is provided in institutions and what is expected at workplaces.
5.3 Findings from Chapter Four: Partnerships TETA, being committed to provide services that reflect the public needs in bridging the skills gap, forges partnerships with TVET Colleges and Universities. It was thought that TVET colleges previously known as TVET Colleges have the advantage of providing training that is affordable to rural areas, especially when their occupationally driven curricula fits in well with developing semi-skilled and unskilled workers in the Sector. Too often, the rural areas are ignored in development; this is the reason why TETA in efforts to bridging the skills gap has embarked on spreading its partnerships with TVET colleges in all provinces of the country. It was of paramount importance for TETA to use the NSDS III as a guiding tool to define the partnership with TVET colleges and Training higher institutions. Higher Training institutions such as universities have been very responsive to helping bridge the skills gap in all 8 subsectors. Having highlighted that it was discovered that the mechanism used for collaboration has been memoranda of understanding between TETA and TVETs. Currently, MoUs, signed in 2015, exist and are still valid with Lephalale TVET, Capricorn TVET, Vhembe TVET in Limpopo. While there seems to be a smooth process on the implementation, it was identified in the discussion that some contracts to train facilitators and moderators were signed in 2015 but there seems to be lack of capacity to manage contracts on the part of TVETs. This problem retards the delivery of output from the colleges. Moreover, another great concern is that there is difficulty in responsiveness when it comes to attracting key stakeholders in some Provinces take part in the projects. This was reported by the TETA team in KZN. Based on the key findings from the chapters in the report, the following are the recommendations suggested:
5.4 Recommended Actions •There is a need to capacitate key training institutions such as Universities and TVET colleges in developing curricula that are relevant to Sector needs. A channel of communication should be opened between role players in the TETA subsectors with training institutions. This will be a practical exercise for institutions enabling them to build on what is relevant as the environment is always in constant state of flux. There is a need to have stakeholder engagement with the key public policy developers when it comes to the policies affecting companies as it is key that policy should reflect what concerns the public not to disadvantage them in performing their roles as employers.
Organise capacity building workshops that will act as a dialogue to identifying where real problems are and at the same time enabling active participation which can help in improving the intervention to reflect the beneficiary perspective.

Page | 61
Recommended Actions: for Research Methods & Process
Given the variability in indicators value from various data source, this would suggest that there is a need for TETA to standardize its methodology in developing SSP.
To develop a standardized process of engaging key stakeholders to develop the SSP. (For example, the associations for the subsections)
Synchronize classification of skills by StatsSA, SARS, DHET etc
Bibliography Creswell, J. W., & Clark, V. L. P. (2007). Designing and conducting mixed methods research. Department of Higher Education and Training. (2016). Sector Skills Plan Framework And Requirements. Pretoria, South Africa: Department of Higher Education and Training. Department of Higher Education and Training. Transport Education Training Authority. Strategic Plan 2015-2018. Department of Higher Education and Training. Updated January 2016. Transport SETA Sector Skills Plan. Dajo Associates. March 2015. TETA Tracer Study Report. Prepared for the TETA. Nofel Projects. March 2016. Close-out Report: TETA/BTC Tracer Study On Candidates Funded For Maritime And Logistics Studies Dolan, D. (n.d.). Inside SA’s R40bn Taxi industry. Retrieved from http://www.moneyweb.co.za/archive/sas-r398bn-Taxi-industry/ Haslam-McKenzie, F. M., & others. (2007). Attracting and retaining skilled and professional staff in remote locations. Desert Knowledge CRC. Kujava, B. (2008). Journal of Transport and Supply Chain Management. Journal of Transport and Supply Chain Management, 2(1), iii–iv. Schumer, L. (1974). Elements of Transport Butterworth’s. Sydney, Pg, 2. Stats, SA. (2013). Millennium development goals country report. Pretoria, South Africa: Statistics SA. Creswell, J.W., Clark, V.L.P., 2007. Designing and conducting mixed methods research. Department of Higher Education and Training, 2016. Sector Skills Plan Framework And Requirements. Department of Higher Education and Training, Pretoria, South Africa. Dolan, D., n.d. Inside SA’s R40bn Taxi industry [WWW Document]. URL http://www.moneyweb.co.za/archive/sas-r398bn-Taxi-industry/ Haslam-McKenzie, F.M., others, 2007. Attracting and retaining skilled and professional staff in remote locations. Desert Knowledge CRC. Kujava, B., 2008. Journal of Transport and Supply Chain Management. Journal of Transport and Supply Chain Management 2, iii–iv. Schumer, L., 1974. Elements of Transport Butterworth’s. Sydney, pg 2. Stats, S., 2013. Millennium development goals country report. Pretoria, South Africa: Statistics SA. Wilson, Stochniol, Fevrier, Faghfouri, 2014. Review of Maritime Transport (Review). UNITED NATIONS PUBLICATION, New York.
Related Documents


