DIRECTIONS IN DEVELOPMENT Infrastructure Transport Prices and Costs in Africa A Review of the International Corridors Supee Teravaninthorn and Gaël Raballand 46181 Public Disclosure Authorized Public Disclosure Authorized Public Disclosure Authorized ublic Disclosure Authorized

Welcome message from author
This document is posted to help you gain knowledge. Please leave a comment to let me know what you think about it! Share it to your friends and learn new things together.
Transcript

D I R E C T I O N S I N D E V E L O P M E N T
Infrastructure
Transport Prices and Costsin Africa
A Review of the International Corridors
Supee Teravaninthorn and Gaël Raballand
46181P
ublic
Dis
clos
ure
Aut
horiz
edP
ublic
Dis
clos
ure
Aut
horiz
edP
ublic
Dis
clos
ure
Aut
horiz
edP
ublic
Dis
clos
ure
Aut
horiz
ed
Transport Prices and Costs in Africa


Transport Prices and Costs in AfricaA Review of the Main International Corridors
Supee TeravaninthornGaël Raballand
© 2009 The International Bank for Reconstruction and Development / The World Bank
1818 H Street NWWashington DC 20433Telephone: 202-473-1000Internet: www.worldbank.orgE-mail: [email protected]
All rights reserved
1 2 3 4 11 10 09 08
This volume is a product of the staff of the International Bank for Reconstruction andDevelopment / The World Bank. The findings, interpretations, and conclusions expressed in thisvolume do not necessarily reflect the views of the Executive Directors of The World Bank or thegovernments they represent.
The World Bank does not guarantee the accuracy of the data included in this work. Theboundaries, colors, denominations, and other information shown on any map in this work do notimply any judgement on the part of The World Bank concerning the legal status of any territoryor the endorsement or acceptance of such boundaries.
Rights and Permissions
The material in this publication is copyrighted. Copying and/or transmitting portions or all ofthis work without permission may be a violation of applicable law. The International Bank forReconstruction and Development / The World Bank encourages dissemination of its work andwill normally grant permission to reproduce portions of the work promptly.
For permission to photocopy or reprint any part of this work, please send a request withcomplete information to the Copyright Clearance Center Inc., 222 Rosewood Drive, Danvers,MA 01923, USA; telephone: 978-750-8400; fax: 978-750-4470; Internet: www.copyright.com.
All other queries on rights and licenses, including subsidiary rights, should be addressed to theOffice of the Publisher, The World Bank, 1818 H Street NW, Washington, DC 20433, USA;fax: 202-522-2422; e-mail: [email protected].
ISBN-13: 978-0-8213-7650-8eISBN: 978-0-8213-7655-3DOI: 10.1596/978-0-8213-7650-8
Library of Congress Cataloging-in-Publication Data
Teravaninthorn, Supee.Transport prices and costs in Africa : a review of the main international corridors / by Supee
Teravaninthorn, Gaël Raballand.p. cm.
Includes bibliographical references.1. Transportation—Africa—Costs. I. Raballand, Gaël. II. Title.
HE195.5.A35T47 2008388'.049—dc22
2008040248
Cover photo: Gaël Raballand, Washington DC, United StatesCover design: Candace Roberts, Quantum Think, Philadelphia, PA, United States
Foreword xiAcknowledgments xiiiAbbreviations xv
Chapter 1 Introduction and Overview 1Past Research on Transport Prices and Costs 1Scope and Methodology of This Study 2Analysis of the Transport Environment 4Policy Recommendations 7Notes 12
Chapter 2 Trucking in Africa Compared with Other Regions 13Global Comparisons 14Regional Perspectives 18Market Regulation, Competition, and Prices in
the Trucking Industry 20Notes 26
Chapter 3 Key Logistics and Market Characteristics of the Transport Corridors 29West Africa 31
Contents
v

Central Africa 32The Northern Corridor in East Africa 32The North-South Corridor in Southern Africa 33Notes 35
Chapter 4 Main Determinants of Transport Prices and Trucking Profitability 37Heterogeneity of Transport Prices in Africa 37The Importance of Rail Competition
for Road Freight Prices 38Profitability Determinants 39Notes 44
Chapter 5 The Impact of Cartels on Transport Prices and Quality 47Impact of Freight-Sharing Schemes 49Truck Age and Utilization 55Cartels 58Fleet Size 59Notes 60
Chapter 6 Transport Costs Determinants 63Typology of Trucking Companies in Africa 64Operating Costs in the Subregions 64The Importance of Variable Costs 69Breakdown of Fixed Costs 72Public Procedures and the Opportunity
Cost of Delays 75Notes 77
Chapter 7 The Impact of Road Conditions on Transport Costs 79Road Conditions in the Study Corridors 79How Road Conditions Affect Operating Costs 79Notes 83
Chapter 8 The Trucking Market in Africa: Perceptions and Reality 85
vi Contents

Chapter 9 Assessment of Policy Options 89Policies for West and Central Africa 90Policies for East Africa 93Policies for Southern Africa 94Notes 96
Chapter 10 Implications for Economic and Fiscal Analysis and for Data Collection 97Finance Regular Studies of Transport Prices
and Costs Determinants 97Improve the Economic Analysis of Road Projects 98Assess the Impact of Fiscal Policies on Transport
Services 100Note 101
Chapter 11 Conclusions, Recommendations, and the Role of International Development Agencies 103Key Findings and Conclusions 103Recommendations 105The Role of Development Partners 106
Map 1 African Landlocked Countries 107
References 109
Annex 1 Bank Support for Africa Transport Corridors 113Note 114
Annex 2 Data Methodology and Reliability 1151. Data Selection 1152. Variable Description 1153. Regression Analysis 122Notes 123
Annex 3 Sample Survey Design and Data Quality Control 125An Example with Cameroon 125Sample Size 129
Annex 4 Freight Allocation through Freight Bureaus: The Cases of Central and West Africa 131Notes 133
Contents vii

Annex 5 Zambia’s Road Freight Industry and Business Practices in Southern Africa 135Notes 137
Index 139
Boxes5.1 History and Impact of the Queuing System in France 505.2 Captured Market Regulation: Cargo Reservation
Schemes in Maritime Transport 51
Figures1.1 Various Definitions Related to Transport 52.1 Average Transport Prices: A Global Comparison in 2007 142.2 Transport Quality Worldwide Based on the Logistics
Performance Index in 2007 172.3 Transport Services in Africa—Expensive and
Low Quality in 2007 172.4 Average Truck Mileage in Selected Developing
Countries in 2007 182.5 Cost and Price Trends before and after Market
Deregulation in France, 1980–97 222.6 Average Transport Prices from Mombasa to Kigali 242.7 Number of Registered Heavy Trucks in Rwanda 243.1 A Typology of Transport Corridors in Africa
Based on Market Access 314.1 Road-Rail Price Competition in Main
International Routes 395.1 Transport Quality Index Based on the
Trucking Survey Results 535.2 Fleet Age and Yearly Mileage 565.3 The Vicious Circle of Transport Prices and Costs in a
Strongly Regulated Environment 58
Tables1.1 Measures and Outcomes in West and Central Africa 81.2 Measures and Outcomes in East Africa 91.3 Measures and Outcomes in Southern Africa 102.1 Comparative Transport Costs, Africa and Europe
(Eastern and Western) in 2007 15
viii Contents

2.2 Comparative Transport Costs, Central Africa, East Africa, and France in 2007 16
2.3 Median Monthly Wages for Truckers in 2007 162.4 Comparison of Malawi and South African
Fleet Competitiveness 252.5 Summary of World Experiences in Transport
Services Deregulation 263.1 The Four Key Transport Corridors in Africa:
Ports and Countries 303.2 The Four Key Transport Corridors in Africa:
Key Economic Data 304.1 Transit Time and Transport Price (from Gateway
to Destination) 384.2 International Transport Prices, Costs, and Profit Margins
(from Gateway to Destination) 404.3 Regressions to Identify the Main Determinants of
Transport Prices 424.4 Regressions to Identify the Main Determinants of Margins 435.1 Main Regulatory Barriers in Sub-Saharan Africa 485.2 Main Methods Used by the Trucking
Industry to Get Freight 545.3 Method of Financing Truck Purchases 565.4 Infrastructure Condition and Load Control 575.5 Current Trucking Demand and Ideal Supply,
Central African Republic and Niger 606.1 A Typology of Trucking Companies in Africa 656.2 Transport Costs Composition 676.3 Truck Operating Costs in the Four Corridors 676.4 Comparison of Transport Costs for a Heavy Truck
Using Alternative Methods of Analysis 686.5 Variable Costs Breakdown for Subregions 696.6 Fixed Costs in the Subregions 706.7 Fuel Prices in Zambia 716.8 Heavy Truck Prices 726.9 Import Tariffs for Imported Trucks 736.10 Monthly Wage for Permanent Full-Time Truck Drivers 736.11 Ratio of Company Taxes to Total Costs 746.12 Licenses 756.13 Opportunity Cost of Delays 767.1 Infrastructure Condition and Load Control 80
Contents ix

7.2 Unit Vehicle Operating Costs Savings from Road Improvement 82
7.3 Vehicle Operating Costs Savings from Road Improvement 827.4 Indicative Internal Rate of Return of Infrastructure
Rehabilitation 828.1 Transport Prices and Trade Imbalance 868.2 Transport Prices and Trade Flows 868.3 Main Perceived Constraints to the Trucking Industry 878.4 Trucking Companies and Truckers Belonging
to an Association 879.1 Expected Impact of Policies in a Regulated Environment 909.2 Expected Impact of Policies in East Africa 939.3 Expected Impact of Policies in Southern Africa 9510.1 Transport Costs for Cocoa Beans from the
Field in Ghana to Europe 99A3.1 Survey Participation by Country 127A3.2 Number of Vehicles Surveyed by Country 130A5.1 Indicative Cost Factor Ranges for Zambia and
South Africa Trucking Companies Operating to and from Zambia 136
x Contents

xi
One of the few things that African policy makers, development partners,civil society, and policy researchers agree on is that Africa has a seriousinfrastructure deficit. Only 25 percent of Africans have access to electri -city. Less than 7 percent of arable land is irrigated. Two out of every threeAfricans lack access to sanitation. Only 65 percent have access to animproved water source. Perhaps the most compelling problem is that ofroad infrastructure. There are fewer kilometers of roads in Africa todaythan there were 30 years ago. Some 70 percent of Africa’s rural popula-tion lives more than 2 km from an all-season road. And the cost of trans-porting goods in Africa is the highest in the world. Not only have hightransport costs raised the cost of doing business, impeding private invest-ment, but they serve as an additional barrier to African countries’ bene-fiting from the rapid growth in world trade. Especially for Africa’s manylandlocked countries, high transport costs mean that, even if they liberal-ize their trade regimes, they will remain effectively landlocked.
While everyone agrees on the problem, there are different approaches toa solution. One view is that, if Africa has an infrastructure deficit, the solu-tion is to plug that deficit by investing in infrastructure—build new roads,power plants, and irrigation canals. Another is to identify the causes ofAfrica’s infrastructure deficit and address them directly. For if the problem
Foreword

xii Foreword
is policy or institutional failures that prevent infrastructure from beingproductive—irrational power tariffs, weak regulations, inadequate opera-tions, and poor maintenance—then simply building new infrastructurewithout addressing these problems will not improve the situation. Africawill still have an infrastructure deficit—but with higher debt.
This book is a contribution to the second approach. By examining thecosts associated with transporting goods on four major corridors in fourdifferent parts of the continent, the authors derive a surprising result.Along these corridors, Africa’s transportation costs are no higher than inother developing countries, such as China. But transportation prices aremuch higher. The difference is the set of informal payments and profitsearned by trucking companies. The authors go on to show that the sourceof these high profit margins is the set of regulations in many Africancountries that restrict entry of new companies, enabling incumbents toearn large profits. They point to the example of Rwanda—a landlockedcountry that deregulated its transport sector and saw a dramatic drop intransport prices almost overnight.
Just as important as the findings of this book is the process by whichit was prepared. Before publishing their results, the authors conductedextensive consultations with government officials, trucking companies,and civil society and policy analysts in Africa. We always have more con-fidence in the results when they have been vetted by the people on theground. But there is another benefit to these consultations. If we are toeffect change in Africa—to lower infrastructure costs so African firms cancompete better in world markets—we will need reforms in the policy andregulatory arenas. These reforms are deeply political. Vested interests willresist them. The only way reform will occur is if the public is informedabout the benefits—so politicians will see that it is in their interest to pro-mote such reform. This book, and the way it was produced, is a major stepin that direction.
Shantayanan DevarajanChief Economist, Africa Region
The World BankAugust 2008

xiii
The main authors of this paper are Supee Teravaninthorn and GaëlRaballand. Hernan Levy and Patricia Macchi contributed extensively tothis book as well as Jean-François Marteau, Arnaud Desmarchelier,Monique Desthuis-Francis, Charles Kunaka, and Rodrigo Archondo-Callao. Ann May edited the paper, and Ann Njuguna supported the team.Salim Refas also contributed at the beginning of the task.
The authors would like to thank our peer reviewers who reviewed thepaper throughout the research process: Aurelio Menendez, John Hine,Dino Merotto, and Baher El-Hifnawi. Their comments were always helpful.
Thanks also guidance from Sanjivi Rajasingham, resources from MarkTomlinson, Vivien Foster, Amakoé Adoléhoumé, and friends and col-leagues in the Africa Transport Unit (AFTTR) with whom we discussedthe subject issues during our research period.
The authors wish to thank Jacqueline Meyo (from the Commission dela Communauté Economique et Monétaire de l’Afrique [CEMAC]),Jean-Kizito Kabanguka (from the Northern Corridor Transit TransportCoordination Authority [NCTTCA]), and Barney Curtis (from theFederation of East and Southern African Road Transport Associations[FESARTA]) for their help in organizing the stakeholder’s workshops inBangui, Kampala, and Pretoria.
Acknowledgments

The authors also thank the European Economic Community (EEC)group and especially Fares Khoury for having supervised and carried out,under contract, the trucking survey, which has provided important pri-mary data for the study. Finally, the team is grateful to all the truckers andtrucking companies that responded to the surveys and participants in thestakeholders’ workshops in Ouagadougou, Bangui, Kampala, and Pretoria.
The findings and interpretations of this book are those of the authors.They do not represent the views of the World Bank, its executive directors, or the countries they represent. Any errors or imperfectionsthat remain in the book are the authors’.
xiv Transport Prices and Costs in Africaxiv Acknowledgments

xv
AFTTR Africa Transport UnitAPR annual percentage rateBARC Bureau d’Áffrètement Routier CentrafricainBGFT Bureau de Gestion du Fret TerrestreBNF Bureau National de FretBRF Bureau Régional de FretCAR Central African RepublicCAS Country Assistance StrategyCBC Conseil Burkinabé des ChargeursCEMAC Commission de la Communauté Economique et
Monétaire de l’AfriqueCNBRF Centre National des Bureaux Regionaux de FretCNR Comité National RoutierCNUT Conseil Nigérien des Utilisateurs des TransportsCSIR Council for Scientific and Industrial Research DRC Democratic Republic of CongoEAC East African CommunityEEC European Economic CommunityESW economic and social workEU European UnionFCFA Franc Communauté Financière Africaine
Abbreviations

FESARTA Federation of East and Southern African RoadTransport Associations
GDP gross domestic productGTZ Gesellschaft für Technische ZusammenarbeitHDM-4 Highway Development and Maintenance Model 4IEG Independent Evaluation GroupIFS International Financial StatisticsIMF International Monetary Fundkm kilometerLPI Logistics Performance IndexMFN most favored nationNCTTCA Northern Corridor Transit Transport Coordination
AuthorityNTC National Trade CorridorOECD Organisation for Economic Co-operation and
DevelopmentONT Office National du TransportOTRAF Organisation des Transporteurs Routiers du FasoRED Roads Economic DecisionSADC Southern African Development Community tkm ton-kilometerTRAINS Trade Analysis and Information SystemTRC Tanzania Railways CompanyUNCTAD United Nations Conference on Trade and
DevelopmentVAT value added taxVOC vehicle operating costWAEMU West African Economic and Monetary Union
All tons in this book are metric tons.
xvi Transport Prices and Costs in Africaxvi Abbreviations

The objective of the study is to examine, identify, and quantify the factorsbehind Africa’s high prices for road transport. Such prices are a majorobstacle to economic growth in the region, as shown in several studies. Forexample, Amjadi and Yeats (1995) concluded that transport costs in Africawere a higher trade barrier than were import tariffs and trade restrictions.Other analyses by the World Bank (2007a) demonstrated that Africa’stransport prices were high compared to the value of the goods transportedand that transport predictability and reliability were low by internationalstandards. This study’s findings should help policy makers take actions thatwill reduce transport costs to domestic and international trade.
Past Research on Transport Prices and Costs
A few empirical studies, including trucking surveys carried out since themid-1990s, demonstrated that transport prices were high in Africa com-pared with other regions. One study (Rizet and Hine 1993) estimatedthat road transport in three Francophone African countries (Cameroon,Côte d’Ivoire, and Mali) was up to six times more expensive than inPakistan and about 40 percent more expensive than in France (wherelabor rates are much higher). Another study comparing seven countries inthree continents demonstrated that for distances up to 300 kilometers,
C H A P T E R 1
Introduction and Overview
1

the unit costs of road transport in Africa were 40–100 percent more thanrates in South east Asia (Rizet and Gwet 1998). Transport prices for mostAfrican landlocked countries range from 15 to 20 percent of import costs(MacKellar et al. 2002)—a figure three to four times more than in mostdeveloped countries.
Key factors that raise costs include low productivity of the truckingindustry in Africa, notably because of infrastructure constraints (Pedersen2001); low levels of competition between service providers (Rizet andHine 1993); and weak infrastructure (Limao and Venables 2001). Limaoand Venables also suggested that weak infrastructure accounted for mostof Africa’s poor trade performance. From a cross-country regression, theyconcluded that trade was highly sensitive to transport costs. For example,a 10 percent drop in transport costs increases trade by 25 percent.
In the past, it was presumed that large investments in improving roadinfrastructure would reduce transport prices. Since the 1970s, the WorldBank has actively supported improvements to the transport corridors inAfrica, including much support focused almost exclusively on improvinginfrastructure (see annex 1). Although such improvements facilitatedroad transport and reduced costs for the trucks carrying cargo on the cor-ridors, no clear impact on the transport prices was evident. Furthermore,the end users of road transport services did not seem to fully benefitfrom the lower transport costs and better service quality resulting fromimproved infrastructure.
A review of the African corridor projects by the World Bank’sIndependent Evaluation Group (IEG)1 found that most projects coveredonly a single transport mode or agency and focused on the developmentor rehabilitation of physical facilities. These Bank projects did not estab-lish the prerequisites for future operations, such as regional agreementson corridor operations and streamlining and harmonization of regulationaffecting transport. Neither the IEG review nor other studies attemptedto explain why the reduction in operating costs did not result in lowertransport prices.
Scope and Methodology of This Study
Scope. The study focuses on four key international corridors in Africa’ssubregions that connect ports of entry and exit to the hinterland (seemap 1). In these corridors, the study analyzes transport costs and pricesby grouping a number of factors into three main categories: (i) infrastruc-ture, namely road network quality and coverage; (ii) factor costs, such as
2 Transport Prices and Costs in Africa

fuel, labor, and equipment; and (iii) market economics, including regula-tion, companies’ organization, and transport and trade procedures.
The four corridors selected for the study2 cover 13 countries in Africa’sfour subregions carrying more than 70 percent of the international tradeof the seven landlocked countries in the study.3 The 13 countries servedare as follows:
• West Africa: Ghana, Niger, Burkina Faso, Togo• Central Africa: Cameroon, Chad, the Central African Republic• East Africa: Kenya, Uganda, Rwanda• Southern Africa: South Africa, Zimbabwe, Zambia
The transport corridors are reviewed by the following characteristics:
• geography (entry ports and landlocked areas served)• corridor institutional structure and the degree of competition
between corridors and transport modes• shipping connections• regulatory regime and market structure
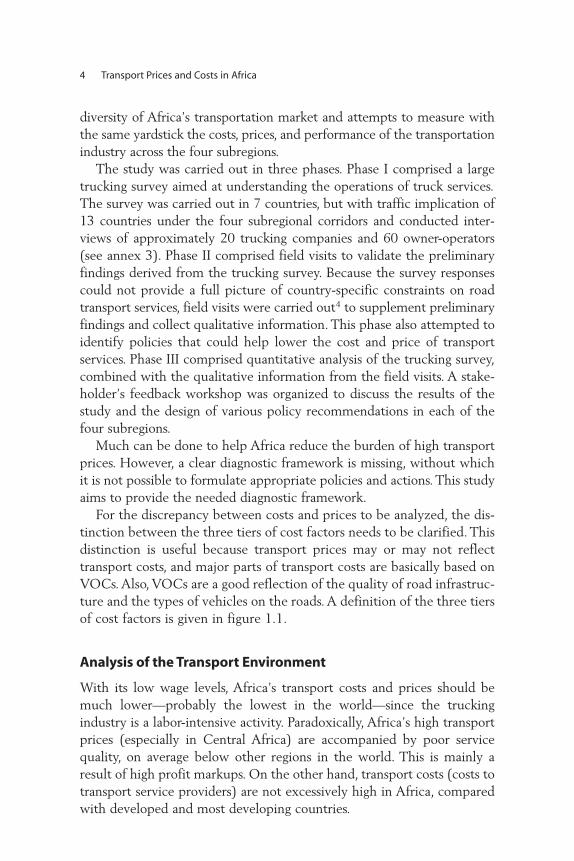
Methodology. Since much past research has been inconclusive, thisstudy attempts to expand both the breadth and depth of the research andcan claim to be original in several areas. Primarily, this is the first compre-hensive and practical effort in the past 15 years to measure and quantifythe high transport costs and prices in Africa using clear empirical evidence.This is also the first attempt of its kind in Africa and worldwide to disag-gregate input factors into three tiers of costs and prices: (i) transport pricesor tariffs incurred by end users, (ii) transport costs incurred by commercialtransport providers, and (iii) vehicle operating costs (VOCs). Logisticscosts are not formally assessed here but only used to complement theanalysis, as there is no agreed definition of logistics costs. However, in thecontext of this study, the term logistics may be defined as the process ofplanning, implementing, and controlling the efficient, cost-effective flowand storage of raw materials, in-process inventory, finished goods, andrelated information from point of origin to point of consumption. In otherwords, logistics costs encompass a much wider range of activities thando transport costs and include transaction costs (related to transport andtrade processing of permits, customs, and standards), financial costs (suchas inventory, storage, and security), and nonfinancial costs (such as insur-ance). Finally, this is the first study that clearly recognizes the regional
Introduction and Overview 3
diversity of Africa’s transportation market and attempts to measure withthe same yardstick the costs, prices, and performance of the transportationindustry across the four subregions.
The study was carried out in three phases. Phase I comprised a largetrucking survey aimed at understanding the operations of truck services.The survey was carried out in 7 countries, but with traffic implication of13 countries under the four subregional corridors and conducted inter-views of approximately 20 trucking companies and 60 owner-operators(see annex 3). Phase II comprised field visits to validate the preliminaryfindings derived from the trucking survey. Because the survey responsescould not provide a full picture of country-specific constraints on roadtransport services, field visits were carried out4 to supplement preliminaryfindings and collect qualitative information. This phase also attempted toidentify policies that could help lower the cost and price of transportservices. Phase III comprised quantitative analysis of the trucking survey,combined with the qualitative information from the field visits. A stake-holder’s feedback workshop was organized to discuss the results of thestudy and the design of various policy recommendations in each of thefour subregions.
Much can be done to help Africa reduce the burden of high transportprices. However, a clear diagnostic framework is missing, without whichit is not possible to formulate appropriate policies and actions. This studyaims to provide the needed diagnostic framework.
For the discrepancy between costs and prices to be analyzed, the dis-tinction between the three tiers of cost factors needs to be clarified. Thisdistinction is useful because transport prices may or may not reflecttransport costs, and major parts of transport costs are basically based onVOCs. Also, VOCs are a good reflection of the quality of road infrastruc-ture and the types of vehicles on the roads. A definition of the three tiersof cost factors is given in figure 1.1.
Analysis of the Transport Environment
With its low wage levels, Africa’s transport costs and prices should bemuch lower—probably the lowest in the world—since the truckingindustry is a labor-intensive activity. Paradoxically, Africa’s high transportprices (especially in Central Africa) are accompanied by poor servicequality, on average below other regions in the world. This is mainly aresult of high profit markups. On the other hand, transport costs (costs totransport service providers) are not excessively high in Africa, comparedwith developed and most developing countries.
4 Transport Prices and Costs in Africa

Logistics, regulation, competition. Among the logistics costs faced bythe trucking industry are market entry barriers such as access restrictions,technical regulations, customs regulations, and cartels.5 In Africa, theoverall political economy of freight logistics exacerbates problems intrade and transport facilitation that are found worldwide. Logistics arefertile ground for rent-seeking activities such as corruption, protection-ism, and inefficient trucking services, which in turn become a barrier toentry of modern operators. All these factors increase fragmentation andinhibit the emergence of the seamless supply chains needed by importersand exporters. Countries become trapped in vicious circles where ineffi-cient regimes sustain low-quality services (including transport and cus-toms broking) and high transport prices.
Of the market entry barriers, freight-sharing schemes probably aremost costly. The current system favors the use of large fleets, which con-sist mostly of old trucks in poor condition. Furthermore, it fosters corrup-tion because the only way for a transport provider to increase its volumeof cargo is to bribe the freight bureaus, the government entities chargedwith allocating freight among the various transport providers. Freight-sharing schemes also are the reason why direct contracting—a negotiatedarrangement between shipper and transporter that is one of the best signsof better logistics—is almost nonexistent in Central Africa and is marginal
Introduction and Overview 5
Labor cost
Tires
Maintenance
Vehicle operating costs
License and insurance
Toll and other roadblock payment
Total cost to transport provider
Transport prices(Input cost to end user)
Transport costs (TC’s) = VOCs + other indirectcosts, such as license, insurance, road toll,and roadblocks payment.
2.
3.
1. Transport prices are the rates charged by a transport company or a freight forwarder to the shipper or importer. Normally transportprices = TC’s + operator’s overhead andprofit margin.
Vehicle operating costs (VOCs) includevarious direct costs to operate a givenvehicle, notably maintenance, tires, fuel,labor, and capital costs.
Capital cost
Profit markup
Fuel
Figure 1.1 Various Definitions Related to Transport
Source: Study team.
in West Africa. The freight allocation system is entrenched in these sub-regions, and several attempts to abolish it have not been successful.
In West and Central Africa, large markups by providers in transportcartels6 are the main determinant of high transport prices. Cartels createa large gap between costs and prices and provide low quality. Operatorsin such markets achieve high profits despite low yearly utilization of theirvehicle fleets and many nontariff barriers. Under such conditions, itwould be expected that new operators would enter the market aggres-sively, but this does not happen. In fact, there is an oversupply of truck-ing capacity because outsiders find it hard to break into a market domi-nated by cartels and market access rules. In East Africa the truckingenvironment is more competitive and the market more mature. Majorcorridors in Southern Africa are the most advanced in terms of prices andefficiency of services, mainly because of a deregulated transport market.
Financing costs and import duties. Although the cost of financing isgenerally an issue for most sectors in Sub-Saharan Africa, neither thecost of financing trucks nor the level of custom duties (10 percentimport tariff for large, new trucks) explains why truckers operate oldfleets. Rather, old fleets persist in Central and West Africa because theregulatory systems in practice set a cap on truckers’ revenues, deterringinvestment in new, high-cost trucks.
Truck overloading. In some subregions, excess transport capacityresulting from the freight allocation and queuing systems results in lowlevels of truck utilization and high transport prices. The two main strate-gies that operators undertake to mitigate low truck utilization are usingsecondhand trucks and overloading the trucks. Overloading is known tobe a critical factor in damage to road structure and is therefore an impor-tant issue in many countries worldwide. Interventions in Africa by theWorld Bank and other donors to control overloading generally have notbeen successful. The reason, as determined by this study, is that moststakeholders in the trucking business have a vested interest in operatingwith overloads.
The impact of road conditions. In Sub-Saharan Africa, poor roads areperceived as being the main cause of high variable operating costs, sincethey increase fuel consumption, increase maintenance costs by damagingthe vehicles, reduce the life of tires, reduce vehicle utilization because oflower speeds, and reduce the life of trucks. Results from the study sug-gest that poor road conditions along the selected Sub-Saharan Africa cor-ridors do not add much to operating costs of trucks. The surveys and datasimulations using the Highway Development and Maintenance Model 4
6 Transport Prices and Costs in Africa

(HDM-4) the standard model for analyzing road investments, indicate amixed result. In Central and West Africa, where traffic is low and thetruck fleets are old, as long as international corridor routes are paved andin reasonable condition, further improvement of road conditions do notresult in significant reduction of transport costs. However, in some EastAfrican corridors with higher traffic levels and newer fleets, improvingroad condition or increasing road capacity has a greater impact on reduc-ing transport costs.
Different types of transport companies coexist on the same corridors.However, in general, the cost structure in Sub-Saharan Africa, even in themore modern and better-organized companies is, in general, differentfrom developed countries: in Africa, trucking companies’ variable costsare high while fixed costs are often low. Central and West Africa are theextreme cases with the variable costs to fixed costs ratios of 70/30, whilein East Africa the ratio is 60/40. In contrast, in a developed system suchas France, the variable to fixed costs ratio is 45/55. In all African corridors,fuel and lubricants are the main variable costs, accounting for at least 40percent of total VOCS. Tires are another important cost factor, whereasbribes do not seem to play a major role as has been generally perceivedon most African corridors.
Policy Recommendations
Policy recommendations need to distinguish between regulated and moremature market environments. In a competitive environment with hightraffic volumes, measures to improve road conditions and limit fuel pricesare likely to yield significant results. Furthermore, in such environments,measures aimed at reducing delays at the border or at weighbridgeswould also be useful as they would help increase truck utilization.
In regulated environments such as West and Central Africa, regulatoryconstraints (formal and informal) must be dismantled because they arethe root cause of limited competition, poor service, and high transportprices. International experience has shown that deregulating the truckingindustry is effective in generating more competition, lowering transportprices, and improving the quality of service in most cases (see table 2.1in chapter 2).
West and Central Africa. In these subregions, the most effectivemeasures to reduce transport costs are likely to be a decrease of fuel costs,an improvement of road condition, and, to a lesser extent, a reduction ofborder-crossing delays. Despite the perceived effects of informal payments,
Introduction and Overview 7

reducing them by 20 percent would have a marginal impact on transportcosts. The analysis shows that improving road conditions from fair to goodand reducing fuel prices by 20 percent could lead to reductions in trans-port costs by 5 percent and 9 percent, respectively (table 1.1).
However, such substantial reductions in transport costs would not leadto any reduction in transport prices because of the strongly regulatedtransport market in these regions. Therefore, any intervention should aimfirst at reforming cartels.
Breaking the regulatory status quo in many countries is difficult becauseof a coalition of interest groups against change. The corridors under reviewoften are the main, and sometimes the only, transport mode for interna-tional and domestic trade. Therefore, truckers have strong leverage withhigh-level authorities who can block trade. Furthermore, some of theseauthorities own or indirectly control trucks or trucking companies andtherefore benefit from the status quo and current market-sharing schemes.
Deregulating the trucking industry in West and Central Africa is less atechnical than a political and social issue. The main concern is that under aliberalized, competitive market, the demand could be served efficiently bya much smaller number of trucks. This would lead to a drop in truckingemployment and profits, since some companies (or owner-operators)would disappear and other would shrink. Participants in the stakeholders’workshops in Ouagadougou and Bangui emphasized the importance ofmitigating the social impact of a more efficient but smaller trucking indus-try. There is a chance that the coalition of interest groups opposing changein the transport market in most of West and Central African countriesmight accept reforms as long as compensation schemes are introduced withthe purpose of paying, at least partly, the social costs of such reforms.
8 Transport Prices and Costs in Africa
Table 1.1 Measures and Outcomes in West and Central Africa
Measures
Decrease intransport costs
(%)
Increasein sales
(%)
Decrease intransport price
(%)
Rehabilitation of corridor from fair to good –5 NS +/– 0
20% reduction of border crossingtime –1 +2 to +3 +/– 0
20% reduction of fuel price –9 NS +/– 020% reduction of informal
payment –1 NS +/– 0Source: Study team estimation based on trucking survey data.NS = Not significant.

East and Southern Africa. In these subregions, thanks to the competi -tive markets, and in contrast to the results in West and Central Africa,measures that would reduce transport costs would also lower transportprices. In East Africa, the most effective measures would be improving thecondition of the corridor road and lowering fuel prices. Reducing the timeof crossing the border would also have a positive although less significantimpact. Reducing informal payments would have a minimal impact oncosts, and no impact on transport prices.
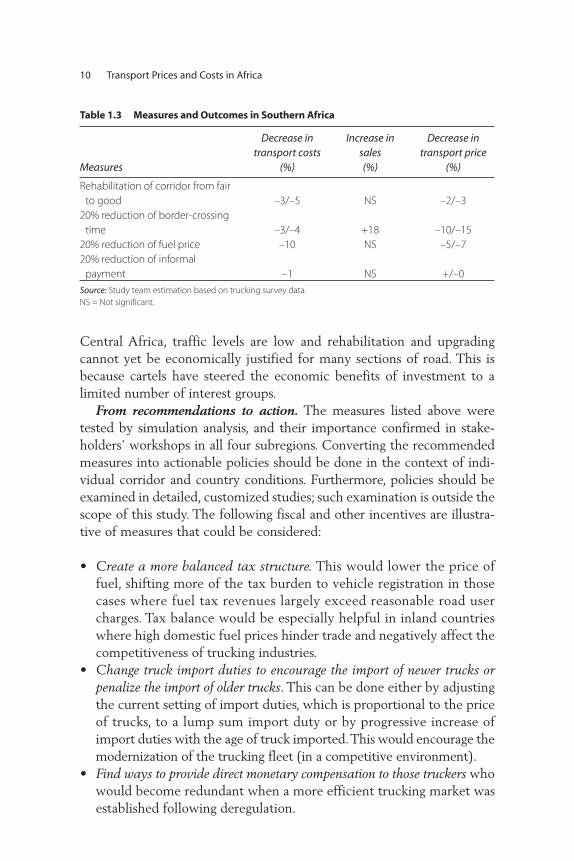
In Southern Africa, reduction in border crossing time has the biggestimpact on prices. This is mainly because the current delays in this corri-dor (especially at Beit Bridge and Chirundu) are at least twice as long(four days compared to a maximum of two) as at the Malaba border postin East Africa, and because of the more modern, pricier trucks used inSouthern Africa. Creation of a one-stop border post would be the idealsolution for this corridor. The second most effective measure is a reduc-tion in fuel prices, which has an impact similar to that in the East Africacorridor. Improvement in road conditions has a lower impact in SouthernAfrica because the road is in fair or good condition along the whole cor-ridor. As in East Africa, reducing informal payments would have no largeeffect on the price of trucking services (see tables 1.2 and 1.3).
The study, therefore, concludes that the northern corridor in EastAfrica would be the only one where improving the physical condition ofroad would both (i) be economically justified, because it would substan-tially lower transport costs, and (ii) result in a decrease in transport prices.This conclusion also applies to the north-south corridor in SouthernAfrica subregion, but to a lesser extent. On the contrary, in West and
Introduction and Overview 9
Table 1.2 Measures and Outcomes in East Africa
Measures
Decrease intransport costs
(%)
Increase insales (%)
Decrease intransport price
(%)
Rehabilitation of corridor from fair to good –15 NS –7/–10
20% reduction of border-crossingtime –1/–2 +2/+3 –2/–3
20% reduction of fuel price –12 NS –6/–820% reduction of informal
payment –0.3 NS +/–0Source: Study team estimation based on trucking survey data.NS = Not significant.
Central Africa, traffic levels are low and rehabilitation and upgradingcannot yet be economically justified for many sections of road. This isbecause cartels have steered the economic benefits of investment to alimited number of interest groups.
From recommendations to action. The measures listed above weretested by simulation analysis, and their importance confirmed in stake-holders’ workshops in all four subregions. Converting the recommendedmeasures into actionable policies should be done in the context of indi-vidual corridor and country conditions. Furthermore, policies should beexamined in detailed, customized studies; such examination is outside thescope of this study. The following fiscal and other incentives are illustra-tive of measures that could be considered:
• Create a more balanced tax structure. This would lower the price offuel, shifting more of the tax burden to vehicle registration in thosecases where fuel tax revenues largely exceed reasonable road usercharges. Tax balance would be especially helpful in inland countrieswhere high domestic fuel prices hinder trade and negatively affect thecompetitiveness of trucking industries.
• Change truck import duties to encourage the import of newer trucks orpenalize the import of older trucks. This can be done either by adjustingthe current setting of import duties, which is proportional to the priceof trucks, to a lump sum import duty or by progressive increase ofimport duties with the age of truck imported. This would encourage themodernization of the trucking fleet (in a competitive environment).
• Find ways to provide direct monetary compensation to those truckers whowould become redundant when a more efficient trucking market wasestablished following deregulation.
10 Transport Prices and Costs in Africa
Table 1.3 Measures and Outcomes in Southern Africa
Measures
Decrease intransport costs
(%)
Increase insales (%)
Decrease intransport price
(%)
Rehabilitation of corridor from fair to good –3/–5 NS –2/–3
20% reduction of border-crossingtime –3/–4 +18 –10/–15
20% reduction of fuel price –10 NS –5/–720% reduction of informal
payment –1 NS +/–0Source: Study team estimation based on trucking survey data.NS = Not significant.

Role for the World Bank and development partners. Given the find-ings presented in this report, development partners, including the WorldBank, should be encouraged to revise their development strategies.Transport services have been neglected for years under the assumptionthat reductions in VOC would automatically translate into lower trans-port costs, then transport prices. However, rent-seeking behaviors andpoor governance of the trucking industry are central to many of the issuesof low-income African countries. The list below suggests areas in whichthe donor community could help governments improve the efficiency ofthe transport market and eventually reduce transport prices.
• Support transport market deregulation. Support from developmentpartners in this area would make the biggest impact in reducing trans-port prices in many countries in Africa. Successful institutional changesuch as breaking trucking cartels requires patience, continued policydialogue, and strong support from development partners. Some part-ners might be inclined to drop their support if changes do not happenrapidly, but they should be aware that such actions could negativelyaffect several corridor projects.
• Support the collection of trucking industry data. Reliable data on thetrucking fleet and operations are essential for analysis and policy for-mulation. Trucking surveys should be carried out periodically, proba-bly every three to five years, as cost permits.
• Support a review of the effect of fiscal policies on transport services, espe-cially in those countries where lowering the tax on fuel could be auseful instrument to reduce trade costs and to improve the competi-tiveness of the local trucking industry.
• Support the use of country-specific trucking data in the economic analysisand design of road maintenance strategies. Such analysis is, in mostcountries, done with the HDM-4 model, although country-specifictrucking data are sparse. As a result, generic data with many assump-tions are used in such model simulations. Data from trucking surveyscould greatly improve the quality of the analysis and lead to more realistic results. One example is the need to introduce in the modelsthe actual purchase price of the trucks, which in West and CentralAfrica often are bought secondhand, instead of using the price of newtrucks. Using actual data would lead to different results, in particularreducing the possibility of overinvestment due to overestimation ofinvestment benefit. If the investment analysis were done properlywith realistic data, higher traffic levels might be needed to justify roadimprovements in some cases.
Introduction and Overview 11

Following this introductory chapter, the study is organized as follows:Chapter 2 compares trucking in Africa with other regions. Chapter 3reviews typical characteristics of the four study corridors, including ananalysis of each corridor’s transport market structure. Chapter 4 assessesthe main determinants of transport prices and profitability, and chapter 5demonstrates the impact of cartels on transport prices and service quality.Chapter 6 disentangles the main determinants of transport costs, andchapter 7 assesses the impact of road conditions on transport costs.Chapter 8 discusses perceptions about the trucking market, and chapter 9analyzes the main measures aimed at lowering transport prices. Chapter 10reviews the implications of the study for economic and fiscal analysis andfor monitoring of the trucking industry. Chapter 11 presents conclusionsand recommendations for ways international development agencies cansupport policies and for measures that could reduce transport prices.
Notes
1. World Bank (1994). This report covered 42 completed projects in 13 coun-tries, including 7 landlocked countries (Rwanda, Burundi, Malawi, Zambia,the Central African Republic, Burkina Faso, and Mali) and six littoral coun-tries (Kenya, Tanzania, Cameroon, Benin, Côte d’Ivoire, and Senegal).
2. West Africa: Cotonou–Ouagadougou, Cotonou–Niamey, Tema–Ouagadougou,Lomé–Ougadougou, Lomé–Niamey; Central Africa: Douala–Bangui,Douala–N’Djaména; East Africa: Mombasa–Kampala–Kigali; Southern Africa:Durban–Lusaka–Ndola.
3. Burkina Faso, Niger, the Central African Republic, Chad, Uganda, Rwanda,and Zambia.
4. The following field visits were carried out in June 2007: Burkina Faso/Niger/Benin, Cameroon/Central African Republic, Zambia/South Africa,Kenya/Rwanda.
5. In Africa, because of the thinness of some markets, cartels form more easilythan in Asia or Europe. However, market thinness does not necessarily inducethe existence of cartels, as the case of Rwanda demonstrates.
6. Cartels are composed of independent organizations or companies formed tolimit competition by controlling the production and distribution of a productor service. Cartels can set monopoly prices, which induce abnormal markup.
12 Transport Prices and Costs in Africa

The performance of transport corridors in other regions, especially thosein developing countries, can provide useful clues to assess the operationsand costs of road transport in Africa. To this end, this chapter provides abrief comparison of road freight operations and markets on transportcorridors in Africa with those in other regions. Subsequent chapters ofthis report analyze in more detail the situation in Africa.
The situation in no country or region is fully comparable with thatin Africa, yet in each region specific similarities or policy reforms inroad freight have been carried out that are of interest to Africa. CentralAsia’s countries have long distances to the sea, and many are landlockedas in Africa. Latin America has also two landlocked countries (Boliviaand Paraguay), which need to cross long distances to reach an oceanport. This region also offers useful experiences on transport deregula-tion, as does Central and Eastern Europe. Indonesia’s deregulated roadfreight market is also of interest, especially due to the large proportionof small trucking companies. The Southeastern European countries trademostly with countries outside their region, which is similar to the situ-ation in Africa. In Pakistan, utilizing mostly old vehicles, many boughtsecondhand as in Africa, truckers manage to achieve very low transportcosts and offer their services at low prices. Furthermore, Pakistan’s road
C H A P T E R 2
Trucking in Africa Compared with Other Regions
13

14 Transport Prices and Costs in Africa
infrastructure on the main corridors is comparable in quality to that ofthe main corridors in Africa.
Transport costs on the main international corridors are not outra-geously higher in Africa than elsewhere. But the paradox lies in the factthat with low wage levels, transport costs and prices should be muchlower and probably the lowest in the world, as the trucking industry isintensive in labor.
Moreover, the four African subregions (West, Central, East, andSouthern) are on average below other regions in the world with respectto transport quality, West Africa being the worst and Southern Africabeing the best within Africa.
Global Comparisons
Transport prices. As shown in figure 2.1, transport prices in Africa are,on average,1 higher than in South Asia or Brazil. Prices (per ton-kilometer(tkm)) on the Central African Douala–N’Djamena route (linkingCameroon with Chad) are more than three times higher than in Braziland more than five times higher than in Pakistan. Only the Durban–Lusakacorridor in Southern Africa approaches the price level of other regions ofthe world.
Figure 2.1 Average Transport Prices: A Global Comparison in 2007
2
3.5 45 5
67
8
11
0
2
4
6
8
10
12
Pakistan
Brazil
United Sta
tes
China
Weste
rn Euro
pe: long d
istance
(Fra
nce)
Africa
: Durb
an–Lusaka
Africa
: Lom
é–Ouagadougou
Africa
: Mom
basa–Kam
pala
Africa
: Douala–N’D
jaména
aver
age
tran
spo
rt p
rice
s(i
n U
S ce
nts
per
tkm
)
region/route
Source: Study team compilation of data from various sources.

Trucking in Africa Compared with Other Regions 15
Table 2.1 Comparative Transport Costs, Africa and Europe (Eastern and Western) in 2007
CentralAfrica
EastAfrica France Spain Germany Poland
Transport costs per vehicle-kilometer (US$) 1.87 1.33 1.59 1.52 1.71 2.18
Source: Trucking Surveys for Africa, Comité National Routier (CNR) for Europe.
Transport costs. Table 2.1 demonstrates that contrary to prices, trans-port costs on the main international corridors are not outrageously high.For instance, transport costs in Africa are not excessively higher than inWestern Europe. Table 2.2 shows that indeed, variable costs in Africa arehigher because of (i) high fuel costs; (ii) age of truck fleets, which leadsto much higher fuel consumption; and (iii) road conditions that are prob-ably the worst in the world. However, offsetting high variable costs, fixedcosts are much lower in Africa than in Europe because of much lowerwages and lower capital costs associated with aged trucks.
Despite such low wage levels, transport costs and prices were notmuch lower than in developed countries because of high variable costs.The trucking industry is labor intensive and, as such, the lower wages inAfrica help to keep total transport costs down (see table 2.3).
Quality of service. A yearly survey of international freight forwardersallows the creation of a Logistics Performance Index (LPI).2 The LPI,which is a useful indicator of quality of service, integrates a number ofquality attributes into a single number. As shown in figure 2.2, the fourAfrican subregions considered in this study rank on average below otherregions in the world on transport quality, West Africa being the worst andSouthern Africa the best within Africa.
Transport price and quality. Comparing transport prices and the qual-ity of service as measured by the LPI shows that Africa’s transport is bothmore expensive and lower in quality than developed countries such asFrance and United States (figure 2.3). In the figure, the greater the LPI,the better the transport quality. The United States has an LPI of 3.84,whereas Africa ranges between 2.19 (West Africa) and 2.73 (SouthernAfrica). The Central African region is an extreme case of high prices asso-ciated with low quality.
The above findings are striking. Within individual markets it can beexpected that higher-quality services command higher prices, since theynormally cost more. Yet, as noted above, the comparison with other

16 Transport Prices and Costs in Africa
Table 2.2 Comparative Transport Costs, Central Africa, East Africa, and France in 2007
Central Africaa East Africab France
Variable costs(US$ per km) 1.31 0.98 0.72
Fixed costs (US$ per km) 0.57 0.35 0.87c
Total transport costs (US$ per km) 1.88 1.02 1.59
Average fleet age (years) 11 7 7
Fuel consumption(liters per 100 km) 65 60 34
Yearly mileage (km) 65,000 100,000d 121,000
Average daily speed (km per hour)e 30 43 69
Payload utilizationf
(percent) 75 76 87Immobilization time
before loadingg
(hours) 13 6 1.6Articulated trucks
(US$) n.a. 169,200 138,000Source: CNR for France. Trucking surveys for Central and East Africa.Notes: East Africa truck price (in US$) corresponds to a heavy truck. n.a. = Not applicablea. Douala–N’Djaména corridor.b. Mombasa–Kampala corridor.c. Data for 2006. d. Based on interviews.e. Data from HDM-4 for African corridors.f. Ratio of the number of kilometers with payload over the total number of kilometers of a truck. Data arebased on rather similar truck capacity; African companies usually importing trucks from Europe after severalyears of use.g. Calculations for immobilization time before loading for African routes come from the trucking surveys whenloading at ports, in particular the following question: What was the average amount of time you waited to pickup freight once inside the port?
Table 2.3 Median Monthly Wages for Truckers in 2007
Country Median monthly wages (US$)
France 3,129Germany 3,937Chad 189Kenya 269Zambia 160Source: CNR for France and Germany. Trucking surveys for Chad and Kenya.For France and Germany, monthly wages include bonuses.

Trucking in Africa Compared with Other Regions 17
Figure 2.2 Transport Quality Worldwide Based on the Logistics Performance Index in 2007
2.19 2.272.49
2.733.01
3.14
3.91 3.99
2.0
2.5
3.0
3.5
4.0
4.5
WestAfrica
CentralAfrica
EastAfrica
SouthernAfrica
LatinAmerica
EasternEurope
UnitedStates
WesternEurope
tran
spo
rt q
ual
ity
(LP
I)
region
Source: World Bank, LPI (2007).
countries shows that transport services in Africa are both pricier (in mostcases) and significantly lower in quality.
Efficiency. Figure 2.4 compares truck utilization in Africa with that inselected developing countries. The figure shows, on the one hand, a largedisparity among the African countries, with South Africa’s trucks travelingalmost three times as many miles as trucks in Malawi. On the other hand,trucks in other developing countries also show a large disparity in truck uti-lization, with Pakistan’s trucks doing twice as many miles as China’s trucks.It is striking that the trucks in the higher-income countries in Eastern
Figure 2.3 Transport Services in Africa—Expensive and Low Quality in 2007
Southern Africa
East Africa
Central Africa
West Africa
United States
France
Spain
Germany
Poland
y = –1.7571x + 12.366
R2 = 0.4826
2
4
6
8
10
12
1.5 2.0 2.5 3.0 3.5 4.0 4.5transport quality
(LPI)
aver
age
tran
spo
rt p
rice
(in
U.S
. cen
ts p
er t
km)
Source: World Bank and task team compilation from various sources.

18 Transport Prices and Costs in Africa
Europe are not utilized efficiently. This is mainly explained by the fact thatthere are relatively few trucking companies established in these countriesthat operate across borders. Thus, yearly mileage within countries remainslower than it would be if the companies would operate transnationally.3
Regional Perspectives
Trade. An important aspect of the operations and performance of inter-national transport corridors is the nature of trade. In Africa, partly becauseof the similarity in production between the neighboring countries andpartly because of infrastructure and other barriers to trade, most trade isinternational and not subregional. This means that trade logistics encom-pass not only land transport, but also ports and shipping issues.
On other continents, there are varying situations. In Latin America, animportant part of exports in Bolivia and Paraguay go as final destinationto neighboring countries, Argentina or Brazil. In Southeastern Europe,there was little trade among the countries. Sub-regional trade comprisingonly about 6 percent of total external trade in 2000.4
Operational issues. In the Southeastern European transport corridors,the key problems directly related to international road transport includesome that are common to Sub-Saharan Africa, such as excessive waitingtimes at the border for clearing customs, and others that are more pecu-liar to the region. Such problems include difficulties in obtaining visas for
Figure 2.4 Average Truck Mileage in Selected Developing Countries in 2007
0
20
40
60
80
100
120
140M
alaw
i
Nig
er
Ch
ina
Cze
ch R
epu
blic
Eth
iop
ia
Hu
ng
ary
Pola
nd
Cam
ero
on
Co
lom
bia
Nig
eria
Ind
ia
Ind
on
esia
Ken
ya
Paki
stan
Sou
th A
fric
a
aver
age
tru
ck m
ileag
e(i
n t
ho
usa
nd
s)
country
Source: Londoño-Kent (2007) and trucking surveys for African countries.

Trucking in Africa Compared with Other Regions 19
professional drivers, lack of bilateral trip permits, and slow implementationof innovation in logistics.
Central Asian countries have the longest distances to an ocean port ofany region in the world. The capitals of four Central Asian countries are3,000 kilometers or more away from an ocean port. By comparison, dis-tances to a port in Africa are mostly in the 1,000–1,500 kilometer range,with only three countries (Zambia, Rwanda, and the Central AfricanRepublic) being in the 1,500–2,000 kilometer range.5
In Latin America, the two landlocked countries, Bolivia and Paraguay,have some similarities with the international corridors in Africa in thatthey need to transit through other countries for export-import trade. Themain international trade corridors run through Bolivia, which uses portson both the Pacific and the Atlantic to connect with overseas markets.Paraguay’s main route for both exports and imports is from Asunción tothe duty-free port of Paranagua in Brazil. There is also important corridortraffic by road between maritime countries. For example, Brazil’s tradecrosses Argentina to reach Latin American countries on the Pacific or touse their ports for overseas trade with Asia. The cost of crossing interna-tional borders varies greatly in Latin America, with some of the higher-cost(both in monetary and time dimensions) border crossings occurringbetween maritime countries (for example, between Argentina and Brazil),rather than between Bolivia or Paraguay and their transit countries.
South Asia shares many similarities regarding trade and internationaltransport with Sub-Saharan Africa: (i) both regions have a gross domes-tic product (GDP) per capita below US$1,000 (average US$684 forSouth Asia and US$830 for Sub-Saharan Africa); (ii) both regionstrade less than 10 percent of the exports and imports within the region;and (iii) both have poor-quality transport facilities and services alonginternational trade corridors. Yet there are important differences in howthe corridors operate. In South Asia, a key factor explaining why transportcorridors operate poorly is that national policies of most countries in theregion prohibit access of foreign trucks. As a result, freight needs to betransshipped at the border from one country’s trucks to the next coun-try’s trucks. Road transport costs in South Asia are the lowest in theworld. However, the high cost of transshipment at the border, coupledwith other problems in the logistics chain, negate the benefits of lowtrucking cost when international transport is concerned. Transshipmentnot only dramatically increases transport cost, but also poses a high risk tothe condition of the cargo.

20 Transport Prices and Costs in Africa
Pakistan’s National Trade Corridor (NTC) provides an excellent exam-ple of the operations of a national corridor, with a mix of good and badfeatures.6 The NTC links the Afghan border, close to Peshawar, throughLahore to Karachi and Port Qasim, with a link to Khunjrab. The NTChandles the major part of Pakistan’s external and internal trade. In manyrespects, Pakistan’s external transport and trade facilitation systems pro-vide an adequate level of connection with the global economy. Forinstance, Pakistan’s sea freight rates are in line with regional and interna-tional levels; its sea transit times are better for some major markets thanfor its competitors, and worse for others (largely a result of geography anddistance); and its road transport rates are some of the lowest in the world.However, the system has a number of weaknesses that result in high costand poor quality of service to the users. Major weaknesses include highport costs and rates; high dwell time for inbound containers; poor roadtransport services, with long transit times and unreliable service quality; theuse of old and technologically outdated trucks, a result of import regulationsand tariff structure; and poor road infrastructure with low capacity and qual-ity not suitable for rapid and reliable truck services. Unfortunately, oneof the main reasons for the low trucking costs in Pakistan is not efficientoperation but a very high level of overloading, causing major damage tothe roads. Some of these weaknesses can be removed by investments, butothers require policy changes and freedom for the private sector to makeits own decisions and investments.
Market Regulation, Competition, and Prices in the Trucking Industry
The prices charged for transport services and the quality of service dependsubstantially on the regulatory regimes and competitiveness in the truck-ing industry. International experience shows the benefits of strong compe-tition in the trucking industry.
Many countries have over the past two decades introduced substantialreforms to their trucking markets, by essentially deregulating the industry.Selected examples are described below.7
Mexico. Until 1989, trucking in Mexico was strongly regulated, as inmost of Latin America. Regulation was thought to promote fair pric-ing, prevent dangerous cost-cutting competition, and control qualityof service. In practice, regulation served to restrict competition andlimit supply to a few firms, resulting in high prices and poor service.

Trucking in Africa Compared with Other Regions 21
The government decided to deregulate trucking and did this graduallywith changes effected over a two-year period (1989–90) with verypositive impact.
Significant outcomes of the deregulation were as follows:
• Many new truck operators entered the market. Within a few monthsof completing the deregulation process in 1990, some 30,000 permitswere issued for new entrants.
• Within five years, road transport prices had dropped by 23 percent inreal terms.
• Trucking services improved in frequency, access, and speed of delivery.• More flexible pricing of both truck and rail increased competition in
the provision of transport services and helped to lower overall trans-port costs.
Today, after almost two decades of deregulation, the benefitsremain, although some problems remain to be fixed, such as the needfor states and local governments to complete harmonization agree-ments, the lack of which affects market structure and facilitates therebuilding of cartels.
Indonesia. As part of a major liberalization of the transport market, roadtransport prices were freed in 1985. Since then, prices have been set bythe market. Liberalization caused a large increase in the number of truckoperators, creating a competitive market. The majority of public trans-port companies own only a small number of vehicles, although someoperators own relatively large fleets. One of the restrictions to routefreedom is that freight vehicles are required to obtain licenses to crossprovincial boundaries, but such regulation does not seem to cause majoreconomic distortions.
The Czech Republic, Hungary, and Poland. Road freight transport wasone of the first sectors to be privatized and liberalized in most of theCentral and East European countries. Hungary, followed by Poland andthen the Czech Republic, was the earliest to adopt pro-competitionreforms. Hungary and Poland passed laws granting free entry to thetrucking market in 1988, as did the Czech Republic after 1990. Marketforces freely determine transport prices. The combination of privatiza-tion and liberalization, which included deregulation reforms such aselimination of rate and route controls, led to the entry of many new

22 Transport Prices and Costs in Africa
trucking operators with competitive prices and better-quality services. Aconsequence of the new competitive environment included several inno-vative logistics services initiated by the trucking companies, resulting infaster delivery times and less breakage or spoilage of cargo. In most cases,the more significant service innovations were started by the larger, inter-nationally connected trucking companies.
France. The 1986 deregulation of road transport in France led to dramaticlowering of road transport prices, as shown in figure 2.5. Comparing therelevant cost and price indexes, the figure clearly demonstrates a paralleltrend of cost and price movement before the deregulation and a sharpdivergence after the deregulation.
Morocco. Initial conditions of the transport services market matter for thesuccess of transport liberalization. Morocco is a relevant example in thisregard since liberalization induced strong price decreases but also dimin-ished transport quality.
For decades, road freight transport was strongly regulated, with themonopoly of freight allocation carried out by the Office National duTransport (ONT). However, because of the ONT fleet’s low produc-tivity, many individuals invested in trucks and oversupply graduallyincreased.
Figure 2.5 Cost and Price Trends before and after Market Deregulation in France, 1980–97
150
140
130
120
110
100
deregulation
90
80
ind
ex
year
70
60
50
19801982
19841986
19881990
19921994
19961997
cost index price index
Source: Darbéra (1998).

Trucking in Africa Compared with Other Regions 23
In 2003, the Law 16-99 entered into force and abolished themonopoly of freight allocation for the ONT, and transport pricesbecame deregulated.
Because of the initial large oversupply, along with exacerbated compe-tition and low professionalism among individual operators, transportprices decreased for years and reached a level below transport costs, witha subsequent low quality of transport service. As a result, the Moroccanfleet has continued to age, drivers have remained untrained, and informalservice predominates.
As a result, the Moroccan transport market is characterized by thefollowing:
• a predominance of the informal sector, estimated at 70–75 percent oftotal freight transport in Morocco
• atomized supply with 90 percent of companies operating one or twotrucks
• aging trucks (with 13 years as a median fleet age) • average transport price below transport costs on most national corridors
An African experience: Rwanda. The only deregulation experiencein the African region so far took place in Rwanda in 1994, and it had ahuge effect on transport prices, confirming the impact that cartels havehad elsewhere. After deregulation of international transport, pricesdeclined by more than 30 percent in nominal terms and by almost 75 percent in real terms when taking into account the continuedincrease in input prices (figure 2.6). The impact in Rwanda was prob-ably stronger than in most other countries because before deregulationroad freight services were a monopoly of a parastatal trucking com-pany (STIR) that was able to set high prices without any restraint(Mwase 2003). Furthermore, 1994 was also the bloodiest period of theRwandan Civil War, when for all practical purposes a road freight fleethad ceased to exist.
Deregulation not only resulted in lower prices, but also led to growthin the Rwandan fleet. This is in contrast to common fears that deregu-lation, which liberalizes market entry, leads to eradication of the fleetowned by truckers from landlocked countries. In the case of Rwanda,the fear was even stronger given the disappearance of its trucking fleetat the height of the Civil War in 1994. In fact, deregulation helped toachieve a rapid recovery of the domestically owned fleet. A distinctivefeature of the business strategy followed by Rwandan truckers has been

24 Transport Prices and Costs in Africa
their specialization in specific goods to capture niche and profitablemarkets, such as petroleum products. This largely explains why the current fleet is equal to the level prior to deregulation of internationaltransport (see figure 2.7).
Figure 2.7 Number of Registered Heavy Trucks in Rwanda
year
nu
mb
er o
f tru
cks
372
317298
234
69
112
190 178 189
240
0
50
100
150
200
250
300
350
400
1990 1991 1992 1993 1994 1995 1996 1997 1998 1999 2007
Source: Data from NCTTA.
Figure 2.6 Average Transport Prices from Mombasa to Kigali (US$, constant and current)
0
50
100
150
200
250
300
350
1989
1990
1991
1992
1993
1994
1995
1996
1997
1998
1999
2000
2001
2002
2003
2004
2005
2006
years
US$
/to
n
0
100
200
300
400
500
600
700
800
900
US$
/to
n
current transport tariffs (left) real transport tariffs - GDP deflator (right)
After liberalizationBefore liberalization
Source: Data from the Northern Corridor Transport and Transit Authority (NCTTA).
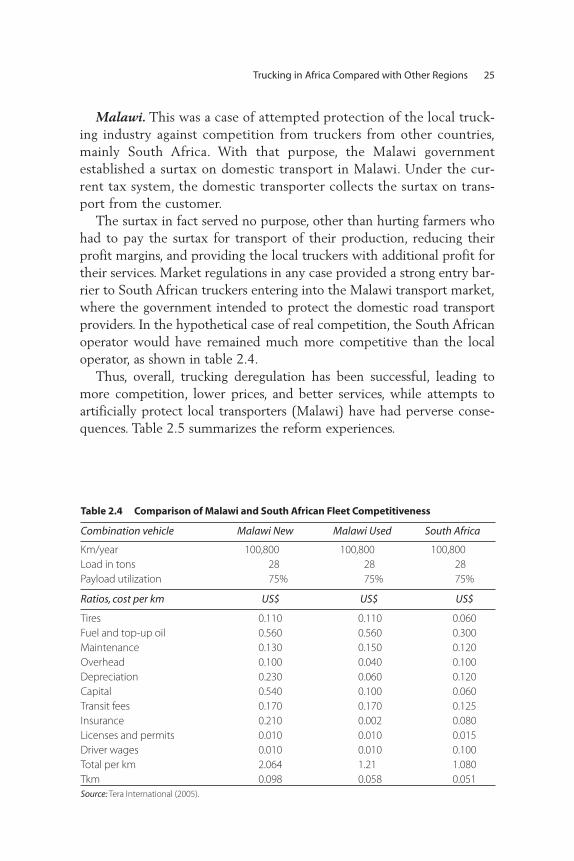
Malawi. This was a case of attempted protection of the local truck-ing industry against competition from truckers from other countries,mainly South Africa. With that purpose, the Malawi government established a surtax on domestic transport in Malawi. Under the cur-rent tax system, the domestic transporter collects the surtax on trans-port from the customer.
The surtax in fact served no purpose, other than hurting farmers whohad to pay the surtax for transport of their production, reducing theirprofit margins, and providing the local truckers with additional profit fortheir services. Market regulations in any case provided a strong entry bar-rier to South African truckers entering into the Malawi transport market,where the government intended to protect the domestic road transportproviders. In the hypothetical case of real competition, the South Africanoperator would have remained much more competitive than the localoperator, as shown in table 2.4.
Thus, overall, trucking deregulation has been successful, leading tomore competition, lower prices, and better services, while attempts toartificially protect local transporters (Malawi) have had perverse conse-quences. Table 2.5 summarizes the reform experiences.
Trucking in Africa Compared with Other Regions 25
Table 2.4 Comparison of Malawi and South African Fleet Competitiveness
Combination vehicle Malawi New Malawi Used South Africa
Km/year 100,800 100,800 100,800Load in tons 28 28 28Payload utilization 75% 75% 75%
Ratios, cost per km US$ US$ US$
Tires 0.110 0.110 0.060Fuel and top-up oil 0.560 0.560 0.300Maintenance 0.130 0.150 0.120Overhead 0.100 0.040 0.100Depreciation 0.230 0.060 0.120Capital 0.540 0.100 0.060Transit fees 0.170 0.170 0.125Insurance 0.210 0.002 0.080Licenses and permits 0.010 0.010 0.015Driver wages 0.010 0.010 0.100Total per km 2.064 1.21 1.080Tkm 0.098 0.058 0.051Source: Tera International (2005).

Notes
1. Average transport prices are difficult to disaggregate because transport pricesor freight rates/tariffs are dependent on several factors including the follow-ing: (i) return cargo—if backload is ensured, freight rates are lowered; (ii) cargotypes—tankers, oil products, machinery, and containers are more expensive totransport than general cargo in bags; (iii) commercial practices/discounts—thereare often large discrepancies between published tariff schedules and what cus-tomers actually pay; (iv) seasonal demand—prices are seasonal and are highlysensitive to supply/demand, especially for certain export commodities andsome imported finished goods.
However, although there are some possible biases and problems concerningdata reliability, transport prices are rather homogeneous along the studied routes
26 Transport Prices and Costs in Africa
Table 2.5 Summary of World Experiences in Transport Services Deregulation
Country Main achievements Background
Czech Republic,Hungary, Poland
Entry of many new operatorsPrices determined by marketInnovative logistics services
Major reform in 1998–90. Roadfreight transport was one of thefirst sectors to be privatized andliberalized in Central andEastern European countries.
France Dramatic reduction intransport prices
Major reform in 1986. Some 10 years after deregulation, overall prices increased by 40%,transport prices fell by over 10%.
Indonesia Entry of many new operatorsPrices set by the marketMost trucking companies small
Major reform in 1985. Vehicleswere required to obtain licensesto cross provincial boundaries,but there was no major impact.
Mexico Entry of many new operatorsTransport prices dropped by 23%
in real terms within five yearsTrucking services improved in
frequency, access, and speed of delivery
Major reform in 1989. The deregulation process was gradual over a period of twoyears.
Morocco Transport prices dropped dramatically
Abolition of government monopoly of freight allocation
Freight allocation abolished in 2003.Large initial oversupply was notreduced and led to atomized andlow quality of service, but priceswere reduced.
Rwanda Transport prices fell by 75% in real terms
Rapid recovery of locally owned fleet
Major reform in 1994. Reform occurred after the genocide,when the public trucking fleethad practically vanished.
Source: Task team compilation from various sources.

in the trucking surveys. Along a corridor, prices obviously vary: for instance, inU.S. dollars per ton-kilometer, from Mombasa, average prices are set at 4 centsper ton-kilometer for Kenya, 8.5 for Uganda, 9 for Rwanda, 11 for Burundi, and12 for Democratic Republic of the Congo (from Goma) (Oyer 2007).
2. The LPI measures perceptions of the logistics environment of 140 countrieson several dimensions (such as transport price, infrastructure, and customs).The survey uses an anonymous, Web-based questionnaire that asks respon-dents to evaluate their country of residence, as well as eight countries theyare dealing with, on the following logistics dimensions: international trans-portation costs, domestic transportation costs, timeliness of shipments,tractability of shipments, transport and IT infrastructure, customs and otherborder procedures, and logistics competence.
3. CNR (2005).
4. World Bank (2004).
5. Kazakhstan, Kyrgyzstan, Tajikistan, and Uzbekistan. These figures are quotedin Snow et al. (2003).
6. World Bank (2007b).
7. Presentation of these examples draws substantially on three papers:Londoño-Kent (2007), World Bank (1994), and Dutz (2005).
Trucking in Africa Compared with Other Regions 27


Logistics in Africa are organized along key trade and transport corridorsoriginating from the ports of entry and exit to the hinterland.1 In thischapter, the various transport corridors are characterized as follows:
• geography (entry ports and landlocked areas served)• corridor institutional structure and the degree of competition between
corridors and transport modes• shipping connections• regulatory regime and market structure
Table 3.1 shows the key international trade corridors from ports to theirhinterlands. Table 3.2 shows the economic importance and volume oftraffic for the relevant corridors.
The trucking environment and market structure in West and CentralAfrica are characterized by cartels offering low transport quality, whilein East Africa the trucking environment is more competitive and moremature. Major corridors in Southern Africa are the most advanced of allthe study corridors in terms of competitive and efficient services.
C H A P T E R 3
Key Logistics and MarketCharacteristics of the Transport Corridors
29

Table 3.1 The Four Key Transport Corridors in Africa: Ports and Countries
Corridors
West Africa Central Africa East Africa Southern Africa
Main ports of entry Abidjan,Tema,Lomé, Cotonou,Dakar
Douala Mombasa, Dar-es-Salaam
Durban, Maputo, Beira,Dar-es-Salaam
Landlocked countries served
Mali, Burkina,Niger
Chad, CentralAfrican Republic
Uganda, Rwanda,Burundi, Democratic Republic ofCongo (east)
Botswana,Malawi, Zambia, Zimbabwe, Democratic Republic ofCongo (south)
Source: Task team compilation.
30 Transport Prices and Costs in Africa
Table 3.2 The Four Key Transport Corridors in Africa: Key Economic Data
Region and countryGDP
(US$ billion)Population
(million)
GDP percapita(US$)
Annualimports
(US$ million )
Annualexports
(US$ million)
West AfricaTogo 2.2 6.1 359 1,026 743Benin 4.3 8.4 508 1,120 577Ghana 10.7 22.1 485 6,610 3,869Niger 3.4 14.0 244 825 512Burkina Faso 5.2 13.2 391 1,132 449
Central AfricaCameroon 16.9 16.3 1,034 4,282 3,922Central African Republic 1.4 4.0 339 174 126Chad 5.5 9.8 561 2,150 3,219
East AfricaKenya 18.7 34.3 547 6,540 5,126Rwanda 2.2 9.0 238 667 228Uganda 8.7 28.8 303 2,370 1,145
Southern AfricaSouth Africa 239.5 46.9 5,109 68,412 64,904Zimbabwe 3.4 13.0 259 1,785 1,443Zambia 7.3 11.7 623 1,835 1,192
Source: World Development Indicators, World Bank.Date of all countries except the Central African Republic corresponds to year 2005, and Central African Republicto 2002. Amounts are in current market prices, U.S. dollars.

Key Logistics and Market Characteristics of the Transport Corridors 31
West Africa
Economic importance. West Africa comprises several gateways (Ghana,Benin, Côte d’Ivoire, Senegal, Guinea, and Togo) and three inland coun-tries (Burkina Faso, Mali, and Niger). The 2002 crisis in Côte d’Ivoire,which resulted in the closing of the international road and rail routesstarting from Abidjan, caused a rerouting of freight to other ports in Togo,Benin, and Ghana. For Burkina Faso, the rerouting resulted in Loméand Tema increasing their share of the country’s trade (for Lomé, from20 percent in 1999 to 50 percent in 2004, and for Tema, from 7 percentto 36 percent during the same period). The crisis also affected Mali traf-fic, and as a result Burkina Faso became a transit country for Mali trade.
Trucking environment and market structure. West Africa is charac-terized by strong market regulation through freight bureaus and ship-pers’ councils (see chapter 5 and annex 4 for more details). The qualityof transport services is uniformly low. There are no large trucking
Figure 3.1 A Typology of Transport Corridors in Africa Based on Market Access
NO YES
NO YES
NO YES
Strong marketregulation
(bilateral quotasand queuing
system)
Strong obstacles tomarket entry, stronginfluence of the freightbureaus/transportassociations= Low to mediumquality and hightransport price
CASE 1
Relatively relaxedobstacles to market entry,weak influence of thefreight bureaus/transportassociations= Very low quality andrelatively low transportprice
CASE 2
= Low to mediumquality and lowtransport price
CASE 3
= Medium to highquality and low tomedium transportprice
CASE 4
Delays(cross-border
procedures androadblocks)
Roads in goodcondition
= High quality andlow to mediumtransport price
CASE 5
Source: Task team.Note: Figure 3.1 defines a typology of corridors with market access at the core of the distinction.

32 Transport Prices and Costs in Africa
companies and few new trucks, yet transport prices are relatively low(case 2 in figure 3.1).2
Central Africa
Economic importance. Traditionally, the regional transport industry inCentral Africa, particularly with respect to transit traffic, has been sharedbetween the road and road-rail corridors originating from the gatewayport of Douala and the rail-river-road corridors between Pointe-Noire(the Republic of Congo) or Matadi (the Democratic Republic of Congo[DRC]) and Bangui in the Central African Republic (rail-river) up toN’Djaména in Chad. However, the rail-river corridor has lost all its mar-ket shares of the Chadian trade since the early 1990s and has becomemarginal for the Central African Republic trade (except for oil productsthrough Matadi).
The regional transport industry thus is mainly dominated today by tworoad and road-rail corridors that link the port of Douala to the capitalcities of the Central African Republic and Chad. These corridors providethe economic lifeline between the coastal (Cameroon) and the two land-locked countries (Chad and the Central African Republic). Besides thetwo capital cities, two other subregions play a crucial role for interna-tional trade. These are the southwest region in Chad, where most of thecountry’s cotton exports and all the country’s oil exports are produced,and the southwest forest region in the Central African Republic, wherethe logging industry is concentrated. Thus, Douala is one of the mostimportant ports in West and Central Africa.
Trucking environment and market structure. Central Africa’s interna-tional transport is characterized by cartels. Transport quality is low butprices are high despite the fact that prices may differ widely along corri-dors of the region. In this subregion, freight bureaus and transport associ-ations are very powerful and do not allow many truck operators to bypassthe system (case 1 in figure 3.1).
The Northern Corridor in East Africa
Economic importance. The long-established northern corridor runs fromthe port of Mombasa via Nairobi to Kampala, with extensions to theDemocratic Republic of Congo, Rwanda, and Burundi. Mombasa, thelargest port in East Africa, is well endowed with equipment and facilities,has a natural port whose berths do not require constant dredging, and
Key Logistics and Market Characteristics of the Transport Corridors 33
has an adequate dock infrastructure. Mombasa now handles more than13 million tons a year. Although intraregional trade in the East AfricanCommunity (EAC) has been growing fast in recent years, it contributesonly 20 percent of the trade volume in the subregion, while more than80 percent of the trade flows are still going to and coming from outsidethe region. This corridor is now taking a new political and economicdimension with the recently reformed EAC, the regional organization ofKenya, Uganda, and Tanzania.
Trucking environment and market structure. East Africa is a competi-tive and mature market with “rates determined by market forces,” espe-cially for corridors originating from the port (Oyer 2007) (cases 3 and 4in figure 3.1).3 The largest professionalized trucking companies accountfor approximately 20 percent of total market shares according to our esti-mates,4 which is comparable to any mature trucking market in Europeor North America. There are about 20 large companies that operatemore than 100 trucks each. The largest Kenyan company owns a fleetof 600 trucks. These large companies obtain loads from long-termdirect contracting (from one to three years). Their yearly mileage toKampala can reach more than 100,000 kilometers, which is much higherthan the average mileage in Central Africa (at most 60,000 kilometersper year).
Transport quality in East Africa is higher than in Central or WestAfrica, with larger and more modern truck fleets. However, on average,transport prices are lower, especially services to Uganda. There is noabnormal disconnect between prices and costs along the NorthernCorridor (up to Kampala).
The North-South Corridor in Southern Africa
Economic importance. Four main trade corridors link Zambia and thesoutheast Democratic Republic of Congo to the subregion and overseasmarkets. These are Dar-es-Salaam, Walvis Bay, Beira, and the north-southcorridor through Durban. The north-south corridor serves a dual purpose:First, it serves as an intraregional trade route between Zambia (and furthersoutheast, the Democratic Republic of Congo and western Malawi) and itsneighbors, Botswana, Zimbabwe, and South Africa, and as a link to theport of Durban for overseas imports and exports. From south to north, thetwo main border crossing points are Beit Bridge between South Africa andZimbabwe, and Groblers Bridge/Martins Drift between South Africa andBotswana. Beit Bridge is the busiest border post in the region, handling as

34 Transport Prices and Costs in Africa
many as 500 trucks per day, whereas volumes through Martins Drift areabout half that number.
Freight demand in Zambia has been rising rapidly with the opening ofnew mines, the increase of copper prices, and the growth of the economy(see annex 5). In 2005, approximately 1.6 million tons were exported,and 3.3 million tons were imported. The main exports from Zambia aremineral and agricultural commodities. The main imports, volumewise, weremineral products, chemicals, heavy mining equipment, and manu facturedgoods. However, valuewise, Zambia’s main imports were machinery andmechanical appliances, fuels, electrical machinery, and vehicles.
Although the port of Beira in Mozambique is closer than Durban formost Zambian shippers, Durban is more convenient as it can be accesseddirectly by reliable road infrastructure and with channel-dredging equip-ment. Durban’s port equipment and lower maritime transport rates makeit also attractive for Zambian shippers.5
Durban is the largest port in the area, accounting for at least three-quarters of the total capacity provided by the various ports serving thecorridors in the subregion. The Durban–Lusaka corridor route is then themost utilized corridor for Zambia.
Trucking environment and market structure. The Southern Africacorridor is the most advanced of all corridors in this study, both in termsof regulatory regimes and efficiency of logistics services6 (cases 4 and 5in figure 3.1).
The transport market and operations in Southern Africa are of greatinterest for other countries in the subregion because they combine liber-alization with enforcement of quality and load control rules applicable toall trucking operators.
Operations to and from Southern Africa are governed by bilateral agree-ments. Unlike West and Central Africa, the Southern African agreementsdo not establish quotas. This enables direct contracting between shippersand transporters and creates incentives for transporters to be more efficient.The agreements contain the following provisions, among others:
• restrict the carriage of bilateral trade to carriers from the two countries
• prohibit cabotage• provide that the regulatory authorities of the two parties shall share
information concerning traffic development• define the types of permits that may be issued, namely 14 days, short
term (3 months), and long term (12 months)
Key Logistics and Market Characteristics of the Transport Corridors 35
• state that cargo rates and charges shall be determined by the market • provide for the establishment of a joint route management group to
determine transport needs on a route, among other things
Notes
1. Southern Africa is slightly different as a significant proportion of the importtraffic into neighboring countries originates from the industrial core of SouthAfrica and not from overseas through Durban.
2. Prices are relatively low compared with international standards, but this doesnot prevent profitability.
3. As in Central Africa, prices and profits may widely differ. Some oligopoliesmay be found on some marginal international routes, for instance afterKampala.
4. This is confirmed by Oyer (2007) who surveyed 15 percent of Kenyan truck-ing companies.
5. Since Durban is the hub port of the subregions, operators often prefer totruck containers directly from this port over longer distances instead ofadding a feeder link to less well served but closer ports.
6. For the Durban–Johannesburg corridor, the rail market remains relativelyimportant with 20 percent of the total market share (CSIR 2006, 18).


This chapter presents the findings obtained from the data gathered in thetrucking survey relating to prices and profitability. The main findings fromthe study indicated that transport prices in Sub-Saharan Africa differwidely depending mainly on market regulation and structure. In a stronglyregulated and noncompetitive environment, prices and profits are espe-cially high, trucking along many international corridors being a strongseller’s market and a profitable industry for most companies in Africa.
Heterogeneity of Transport Prices in Africa
Transport prices differ widely in Africa. In Southern Africa they are, onaverage, two to three times lower than in Central Africa. Some subregionssuch as Central Africa are characterized by a large spread in transportprices, explained by the fact that some large trucking companies subcon-tract to truckers at a much lower price, and others operate in a completeinformal market with low prices and extremely low transport quality.
Transport prices and time. These vary greatly between subregions.Central Africa is the most expensive, West and East Africa have similarprices, and Southern Africa is the cheapest. Transport time is also a goodindicator of quality of service. There are discrepancies in transport times
C H A P T E R 4
Main Determinants of TransportPrices and Trucking Profitability
37

38 Transport Prices and Costs in Africa
Table 4.1 Transit Time and Transport Price (from Gateway to Destination)
Gateway DestinationDistance
(km)
Transit timefrom ship
arrival to finaldestination
Transport price (in US$
per ton)
West AfricaLomé Ouagadougou 1,050 6–8 days 60–70Cotonou Niamey 1,000 6–8 days 65–95
Central AfricaDouala N’Djaména 1,830 12–15 days 200–210Douala Bangui 1,450 8–10 days 200–210
East AfricaMombasa Kampala 1,145 5–6 days 90Mombasa Kigali 1,700 8–10 days 100–110
Southern AfricaDurban Lusaka 2,300 8–9 days 90–130Durban Ndola 2,700 9–10 days 130–170
Source: Surveys of trucking companies and international logistics operators.Note: Because of traffic imbalance, export prices are at most equal to import prices. However, in most cases, export prices are lower than import prices because to avoid coming back empty, truckers prefer to give discounts to get backload.
from cargo arrival at the port to the hinterland destination; the highestdelivery speeds are in West and Southern Africa whereas the lowestreported speed is in Central Africa (see table 4.1).
Price factors. Data from the trucking survey provide clues about theimportance of cartels as a preeminent price factor in Africa, but there areother important factors in international transport. The findings also signalthat transport practices, prices, and costs mainly are route specific.
The Importance of Rail Competition for Road Freight Prices
On the main international corridors, an absence of rail services createsopportunities for the trucking industry to inflate its prices. That is whyintermodal competition on these corridors is critical. Increased compe-tition from rail services benefits transport users primarily through com-parable or lower transport costs.1 Actual or potential competition fromroad operators drastically limits the railways’ pricing power,2 even in thesituations where railways enjoy commanding market shares (WorldBank 2006).
Figure 4.1 compares rail and road prices in East and Central Africa. InEast Africa, road prices are established by trucking companies and take

Main Determinants of Transport Prices and Trucking Profitability 39
Figure 4.1 Road-Rail Price Competition in Main International Routes (US$ per ton-kilometer)
0
5
10
15
20
Mombasa–Nairobi
Mombasa–Kampala
Mombasa–Kigali
Douala–Yaoundé
Douala–Ngaoundéré
Douala–N'Djaména
East Africa Central Africa
US$
truck rail
Source: Trucking survey and own calculations. Prices are per container.
into account rail prices. Therefore, competition between rail and roadtransportation does exist.3
Similarly, in Central Africa, rail prices are comparable to road prices.As in East Africa, trucking companies surveyed acknowledged that railcompetition plays a role in the setting prices, especially for heavy andbulk commodities.4
Profitability Determinants
Trucking is a profitable industry for most companies in Africa, especiallyalong the main international corridors (see table 4.2). Managers of truck-ing companies acknowledge, for example, that paying back costs of anew or less than three-year-old truck takes less than three years. In themany African countries where transport demand, as a result of economicgrowth, is booming, truckers can rapidly recover costs. Road transporthas turned to a strong sellers’ market almost everywhere in Africa.
Profits are a function of market size and the number of market parti -cipants. In Africa, because of the thinness of some markets, the cartels areeasier to form than in Asia or Europe. However, this does not necessarilyinduce the existence of cartels, as we demonstrated in the case of Rwanda.
Fixed costs are abnormally high for Africa along the Douala–Banguiand the Ngaoundéré–Moundou corridors due to the extremely low yearlyvehicle mileage (used as a proxy to measure efficiency of trucking serviceprovision)—not because truckers use new trucks.
Standard deviation measures are especially high for prices. As notedabove, this can be explained by the strategy of some large trucking

40 Transport Prices and Costs in Africa
Table 4.2 International Transport Prices, Costs, and Profit Margins (from Gateway toDestination)
Route gateway–destinationa
Pricef
(US$ per km)
Variable cost (US$ per km)
Fixed cost (US$ per km)
Profitmargini,h,c
(percent)
West Africa(Burkina and Ghana)
Tema/Accra–Ouagadougou(Ghana)
3.53g
(2.01)
1.54(0.59)
0.66(0.64)
80
Tema/Accra–Bamako (Mali)
3.93(1.53)
1.67(0.23)
0.62(0.36)
80
Central Africa(Cameroon and Chad)
Douala–N’Djaména(Chad)
3.19(1.10)
1.31(0.32)
0.57(0.30)
73
Douala–Bangui (Central African Republic)
3.78(1.30)
1.21(0.35)
1.08(0.81)
83
Ngaoundéré–N’Djaména (Chad)
5.37(1.44)
1.83(0.25)
0.73(0.44)
118
Ngaoundéré–Moundou (Chad)
9.71(2.58)
2.49(0.64)
1.55(0.43)
163
East Africa (Kenya andUganda)
Mombasa–Kampalab
(Uganda)2.22(1.08)
0.98h
(0.47)
0.35(0.14)
86
Mombasa–Nairobic
(Kenya)2.26(1.36)
0.83(0.17)
0.53(0.19)
66
Southern Africa(Zambia)
Lusaka–Johannesburgd
(South Africa)
2.32(1.59)
1.54(0.41)
0.34(0.40)
18
Lusaka–Dar-es-Salaame (Tanzania)
2.55(0.08)
1.34(0.52)
0.44(0.51)
62
Source: Trucking survey data and own calculations. Exchange rates come from International Monetary Fund-International Financial Statistics.Note: Prices are in US$ per kilometer because most companies have the same truck capacity and similar(over)loading practices on a corridor. Moreover, because of questions in reporting overloading, prices in US$ perkilometer are probably much more reliable than prices per ton-kilometer. Prices and costs were obtained from reported truckload (approximately 30 metric tons). Values include trucking services (three or more trucks) andtruckers (one or two trucks). Standard deviation is in parentheses. a. Destination country is in parentheses.b. First segment of the northern corridorc. Second segment of the northern corridord. First segment of the north-south corridore. Second segment of the north-south corridorf. Some indicative prices are set by ministries of transportation in Africa but are not used. Prices set by freight allo-cation bureaus in Central Africa may be more respected.g. Prices from the trucking survey are similar to the ones given by the Conseil Burkinabe des Chargeurs (see tablebelow). Depending on the tonnage (official or real), prices per ton-kilometers may be more or less higher.h. Data should be taken cautiously since some companies may omit some costs or, conversely, double countsome costs.
Unit Official data from Burkina Faso shippers' council SurveyFCFA US$ US$
Ton 26,000–30,000 52–60 59Container 1,300,000–1,400,000 2,600–2,800 2,000
Note: Exchange rate US$/FCFA = 0.002.i. Data are consistent with Oyer (2007), who found US$1.10 per kilometer for Kenyan routes, without includingoverheads and management costs or border-crossing and bribes costs.

Main Determinants of Transport Prices and Trucking Profitability 41
companies, especially in a regulated environment, to subcontract freightto truckers at lower prices.5 Consequently, some small subcontractors andtruckers charge a low price and can hardly be profitable whereas somewell-known trucking companies benefit from the regulated price andconsequently reap large profits. Subcontracting also explains why old andnew trucks travel along the same corridor. In most cases, new fleets indi-cate abnormally high markups, whereas old trucks belong to the subcon-tractors of a well-known trucking company.
Even though prices are relatively low in West Africa on the main inter-national corridors compared with those in Central Africa, this does notprevent the trucking business from being profitable. Truckers keep pro-duction costs low through the combination of low capital costs (purchaseof secondhand trucks) and minimal maintenance expenditures whilemaximizing revenues through overloading.
Success can rapidly turn into failure in the African transport industryand vice versa. If all the right conditions are attained (a “good” managerwho gets access to the load, “good” drivers who find loads by themselveswhile limiting negative impacts to the truck, and a “good” truck that isreliable and cheap to maintain), then profitability can be high as thereturn on investment may average three years. Truckers who are unableto attain such conditions will not be profitable.
The various pricing strategies are all the more interesting, standarddeviation being much lower for variable transport costs. In other words,most companies bear more or less similar variable costs, which by far arethe most important determinants of transport costs.
Transport prices determinants. Table 4.3 confirms most of the findingsfrom descriptive statistics. However, there is a very strong disconnectbetween costs and prices, especially for Central Africa, where neithervariable nor fixed costs explain the high transport prices in the subregion.In fact, for Central Africa, the usual prices determinants are not statisti-cally significant if we accept (i) that overloading induces higher transportprices and (ii) that there is a tariff premium for international corridorscompared with national corridors. More surprisingly, higher transportprices are reported for roads in better condition. For example, roads alongthe Ngaoundéré–Moundou corridor are in very good condition and havehigh prices. This is most likely due to informal market-sharing agreements(see the section on market regulation).
Similarly, in West Africa, it is difficult to explain how transport pricesare not closely correlated with transport costs, which are closely related toroad conditions and variable costs. High fixed costs may explain hightransport prices, which probably are related to the fact that some operators
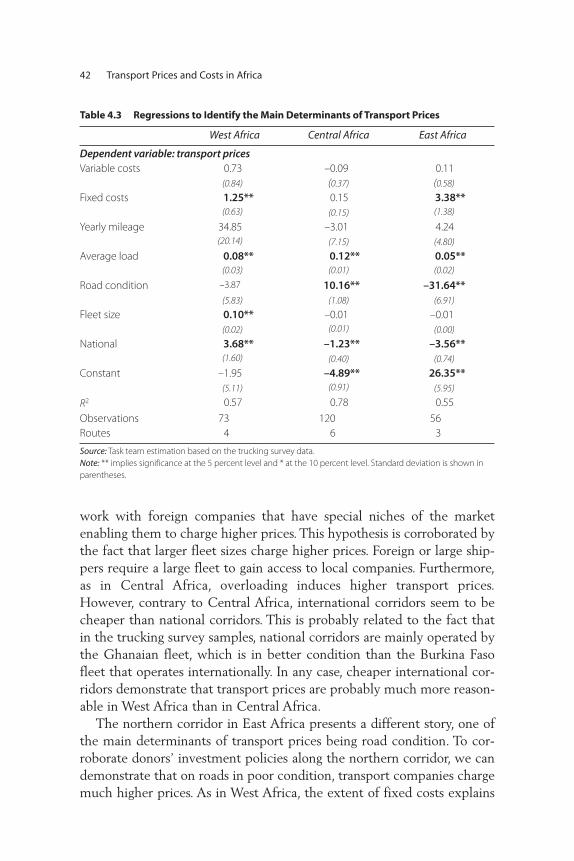
42 Transport Prices and Costs in Africa
Table 4.3 Regressions to Identify the Main Determinants of Transport Prices
West Africa Central Africa East Africa
Dependent variable: transport pricesVariable costs 0.73 –0.09 0.11
(0.84) (0.37) (0.58)
Fixed costs 1.25** 0.15 3.38**(0.63) (0.15) (1.38)
Yearly mileage 34.85 –3.01 4.24(20.14) (7.15) (4.80)
Average load 0.08** 0.12** 0.05**(0.03) (0.01) (0.02)
Road condition –3.87 10.16** –31.64**(5.83) (1.08) (6.91)
Fleet size 0.10** –0.01 –0.01(0.02) (0.01) (0.00)
National 3.68** –1.23** –3.56**(1.60) (0.40) (0.74)
Constant –1.95 –4.89** 26.35**(5.11) (0.91) (5.95)
R2 0.57 0.78 0.55Observations 73 120 56Routes 4 6 3
Source: Task team estimation based on the trucking survey data.Note: ** implies significance at the 5 percent level and * at the 10 percent level. Standard deviation is shown inparentheses.
work with foreign companies that have special niches of the marketenabling them to charge higher prices. This hypothesis is corroborated bythe fact that larger fleet sizes charge higher prices. Foreign or large ship-pers require a large fleet to gain access to local companies. Furthermore,as in Central Africa, overloading induces higher transport prices.However, contrary to Central Africa, international corridors seem to becheaper than national corridors. This is probably related to the fact thatin the trucking survey samples, national corridors are mainly operated bythe Ghanaian fleet, which is in better condition than the Burkina Fasofleet that operates internationally. In any case, cheaper international cor-ridors demonstrate that transport prices are probably much more reason-able in West Africa than in Central Africa.
The northern corridor in East Africa presents a different story, one ofthe main determinants of transport prices being road condition. To cor-roborate donors’ investment policies along the northern corridor, we candemonstrate that on roads in poor condition, transport companies chargemuch higher prices. As in West Africa, the extent of fixed costs explains

Main Determinants of Transport Prices and Trucking Profitability 43
transport prices, which demonstrates that many operators have a goodsense of their fixed costs (contrary to the situation in Central Africa).Similar to the other subregions, overloading induces higher transportprices. Finally, like in West Africa, international corridors seem to becheaper than national corridors, which means that companies operatingin the subregion charge a premium price. The main reasons for this pre-mium are explained in the following sections. In any event, internationaltransport in the northern corridor seems to be much more costly thannational Kenyan transport.
Profitability determinants. Trucking along international corridors isusually a profitable industry for most companies in Africa. There is astrong disconnect between costs and prices, but profits are relatively wellexplained by costs level (see table 4.4). Consequently, since price settingsare more or less exogenous, the most profitable companies in Africa arethe ones able to operate on routes with abnormal prices or with a certaindegree of cost efficiency. That is why, in East Africa, trucks operating onroads in good condition are profitable (probably because of the fact that
Table 4.4 Regressions to Identify the Main Determinants of Margins
West Africa Central Africa East Africa
Dependent variable: marginsVariable costs –0.59 –0.78** –1.00**
(0.41) (0.20) (0.39)
Fixed costs –0.28 –0.36** 1.75*(0.31) (0.08) (0.93)
Yearly mileage 20.63** 0.59 4.56(9.77) (3.81) (3.24)
Average load 0.03** 0.06** 0.04**(0.02) (0.01) (0.01)
Road condition –2.41 3.38** –21.24**(2.83) (0.58) (4.66)
Fleet size 3.3E–02** –3.3E–03 –4.6E–03*(1.1E–02) (3.0E–03) (2.8E–03)
National 1.84** –0.28 –2.44**0.78 0.21 0.50
Constant 0.74 –1.30** 17.81**(2.48) (0.48) (4.02)
R2 0.29 0.50 0.42Observations 73 120 56Routes 4 6 3Source: Task team estimation based on the trucking survey data.Note: ** implies significance at the 5 percent level and * at the 10 percent level. Standard deviation is shown inparentheses.
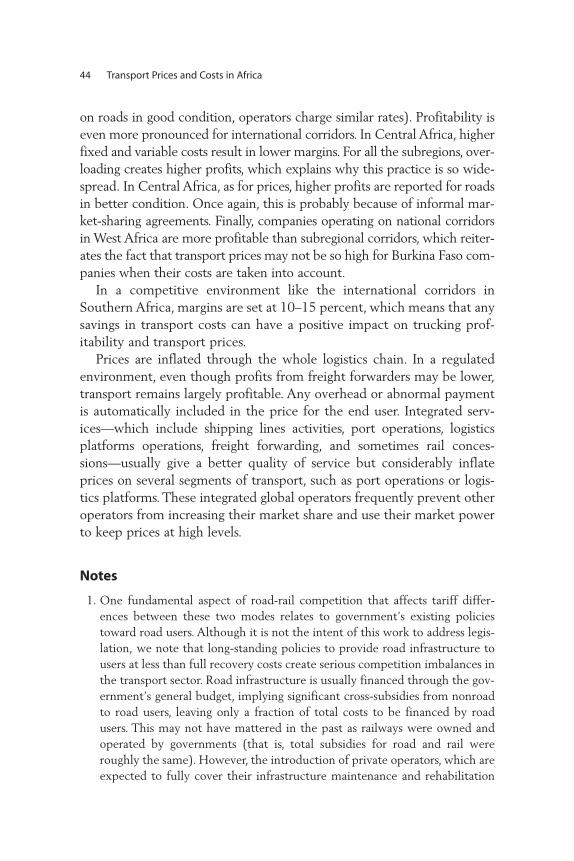
44 Transport Prices and Costs in Africa
on roads in good condition, operators charge similar rates). Profitability iseven more pronounced for international corridors. In Central Africa, higherfixed and variable costs result in lower margins. For all the subregions, over-loading creates higher profits, which explains why this practice is so wide-spread. In Central Africa, as for prices, higher profits are reported for roadsin better condition. Once again, this is probably because of informal mar-ket-sharing agreements. Finally, companies operating on national corridorsin West Africa are more profitable than subregional corridors, which reiter-ates the fact that transport prices may not be so high for Burkina Faso com-panies when their costs are taken into account.
In a competitive environment like the international corridors inSouthern Africa, margins are set at 10–15 percent, which means that anysavings in transport costs can have a positive impact on trucking prof-itability and transport prices.
Prices are inflated through the whole logistics chain. In a regulatedenvironment, even though profits from freight forwarders may be lower,transport remains largely profitable. Any overhead or abnormal paymentis automatically included in the price for the end user. Integrated serv-ices—which include shipping lines activities, port operations, logisticsplatforms operations, freight forwarding, and sometimes rail conces-sions—usually give a better quality of service but considerably inflateprices on several segments of transport, such as port operations or logis-tics platforms. These integrated global operators frequently prevent otheroperators from increasing their market share and use their market powerto keep prices at high levels.
Notes
1. One fundamental aspect of road-rail competition that affects tariff differ-ences between these two modes relates to government’s existing policiestoward road users. Although it is not the intent of this work to address legis-lation, we note that long-standing policies to provide road infrastructure tousers at less than full recovery costs create serious competition imbalances inthe transport sector. Road infrastructure is usually financed through the gov-ernment’s general budget, implying significant cross-subsidies from nonroadto road users, leaving only a fraction of total costs to be financed by roadusers. This may not have mattered in the past as railways were owned andoperated by governments (that is, total subsidies for road and rail wereroughly the same). However, the introduction of private operators, which areexpected to fully cover their infrastructure maintenance and rehabilitation

Main Determinants of Transport Prices and Trucking Profitability 45
costs through users’ fees, should alter significantly governments’ thinking inthis area.
2. The impact of road-rail competition appears, nevertheless, to differ notice-ably from one corridor to another as the spread between average road andrail prices varied in 2003 from 44 percent (Sitarail) to 213 percent (TRC)(World Bank 2006).
3. The governments of Kenya and Uganda concluded and support a joint railconcession between Mombasa and Kampala.
4. There is a strong correlation between average freight hauling distance andrail market share: the longer the route, the stronger a rail operator’s marketshare (World Bank 2006).
5. This dualism is common to many industries and is based on a product differ-entiation strategy. Probably standard deviation is high because both truckingcompanies and truckers were interviewed and have different pricing strategies.


The trucking survey indicates that a large markup or profit margin bytransport providers, made possible by the current regulatory regime, isprobably the main determinant of high transport prices along some inter-national corridors, such as that in Central Africa. The large disconnectbetween the transport cost incurred by the service providers and the costto the users (transport prices) signals the existence of a distorted transportmarket with a cartel.1 Profits achieved despite low yearly utilization of thetransporters’ vehicle fleet and many nontariff barriers suggest that newoperators would aggressively enter the market. Yet, this does not necessar-ily happen; the total fleet size does not increase. Furthermore, oversupplyremains rampant. This is explained by the fact that operators already par-ticipate in the current system of market regulation (formal and informal)and outsiders may find it hard to operate in a market where compliancewith operational regulation and market access rules is necessary.
The trucking industry in Sub-Saharan Africa faces various regulatoryconstraints, such as market entry barriers, market access restrictions, tech-nical regulations, and customs regulations (table 5.1). However, marketaccess restrictions through freight-sharing schemes have the largestimpact on the performance of the trucking industry. The current systemgives power to large fleets in poor condition and fosters corruption—the
C H A P T E R 5
The Impact of Cartels on TransportPrices and Quality
47

48
Table 5.1 Main Regulatory Barriers in Sub-Saharan Africa
West Africa Central Africa East Africa Southern Africa
Market entryLicenses Not restrictive
(especially for nationals)Not restrictive
(especially for nationals)Not restrictive
(especially for nationals)Not restrictive
Market accessBilateral agreement Yes Yes No YesQuotas/freight allocation Yes Yes No No
Queuing system Yes Yes No NoThird-country rule a Prohibited Prohibited Prohibited Allowed in some countries b
Technical regulation (road-usercharges, axle load, vehiclestandard, import restriction)
Problem of harmonization of axle-load regulation
Problem of harmonization ofaxle load enforcement
Problem of harmonization of axle load regulation, delays at weighbridges
Prohibition of secondhand imports inSouth Africa
Customs regulation Cumbersome transit procedures inducing border-crossing delays
Cumbersome transitprocedures inducing border-crossing delays
1. Prohibition for trailers intransit to pick up backloadsin Kenya
2. Cumbersome transit procedures inducing border-crossing delays
Cumbersome transit procedures inducing border-crossing delays
Source: Study team compilation of data from various sources.a. The third-country rule allows operation of trucks registered in a third-party country to transport goods between two other countries. b. South Africa, Zimbabwe (on a reciprocal basis), and Malawi (during a defined period of time).

The Impact of Cartels on Transport Prices and Quality 49
only way to increase transported volumes is to bribe the freight bureaus.This situation also explains why direct contracting, one of the best signsof better logistics, is almost nonexistent in Central Africa and marginal inWest Africa. The freight allocation system is entrenched in these sub -regions and several attempts to abolish it have been unsuccessful.
The different levels of truck utilization in Sub-Saharan African sub -regions are the result of oversupply of transport capacity, which explainsdifferences in transport prices. The two main strategies that operatorsuse to mitigate regulatory burdens are the use of secondhand trucksand overloading. See box 5.1 for an illustration of how this system wasabolished in the case of France.
Impact of Freight-Sharing Schemes
Market entry through the licensing process is relatively easy. Indeed,trucking companies and operators do not identify the licensing processas a main constraint of the sector. Moreover, except in Kenya andUganda, licenses to operate internationally remain marginal expenses intotal VOCs. Oversupply in many landlocked countries (see below) tendsto demonstrate that market entry and credit access to finance trucks arenot a major constraint to market entry.
However, customs regulations have a major impact on truck utiliza-tion and therefore on VOCs.2 For instance, Kenya bans trucks used forinternational transit from transporting domestic goods on return trips,which leads to cutting in half the average payload utilization on theMombasa–Kigali route. This is detrimental to trucking industry profitabil-ity. Moreover, cumbersome transit regimes induce delays at the borders,which can seriously limit truck utilization.3
Notably, the main regulatory issue concerns operational rules andmarket access restrictions, mainly through freight-sharing schemes. Theregulatory environment of landlocked countries in West and CentralAfrica is centered on two related regulations:4
• a transit bilateral treaty, which establishes quotas for the fleets of thecoastal and landlocked countries
• a formal/informal queuing system (“order of loading” or tour de rôle5)that allocates freight to transport companies, requiring the operator tobe affiliated with a transporter association
Even though the tour de rôle is perceived negatively by most stakeholders inlandlocked countries, the bilateral quotas are supported to protect truckers

50 Transport Prices and Costs in Africa
Box 5.1
History and Impact of the Queuing System in France
The queuing system in France originated with inland water shipping. Established in
1936, the system was codified by the law of March 22, 1941. Queuing was applied
to the road transport sector after the establishment of the regional freight bureaus
(BRF) in 1961.
Freight bureaus receive transportation requests from shippers. After centraliz-
ing requests regionally, a list of vessels is assigned chronologically to the transport
requests. The chronology of assignment mainly depends on when a carrier’s avail-
ability registration arrives at the freight bureau.
The queuing system was set up by a decree of July 28, 1965, to “ensure the
proper functioning of the freight transportation market and allow transport coor-
dination.” The BRF* took over coordinating supply and demand of transport, a
task that cafés had once performed unofficially. Each carrier was registered on
arrival at the BRF and then received a priority order to load freight.
Requests to the BRF for transportation always had to come from a transport
broker. The request was displayed on a blackboard with key information (ton-
nage, destination, type of goods, and so forth). If a carrier was interested in fulfill-
ing this request, an announcement was made in the office. If no other carrier
claimed the same freight, the batch was assigned to the carrier that registered
first. If the freight was claimed by another carrier, the first registered carrier got the
load; however, two subsequent vehicles from the same carrier could not be
loaded without a prescribed minimum delay. This system was established to pre-
vent large companies from controlling the BRF.
What was the impact of such a system? The BRF increasingly became respon-
sible for delays and poor transport quality. Indeed, guarantees of work made car-
riers complacent and competition nonexistent, which undermined transport
service quality. Queuing did not lead to an optimal distribution of traffic or give
incentives to provide better service, but led to an oversupply of trucks in a con-
text of freight shortage. Oversupply could oblige a trucker to stop running a truck
for a month or more. That also discouraged investment in new trucks, which
created high risk for future revenues. The queuing system gave more power to
large fleets in poor condition and fostered corruption, because the only way to
increase transported volumes was to bribe the freight bureau.
In France, this system was abolished 20 years ago in the road transport sector
and five years ago in the inland water shipping sector.
Source: Based on Souley (2001).* France was divided into 19 regions. A national center, CNBRF, coordinated the work of the regional BRF.

The Impact of Cartels on Transport Prices and Quality 51
Box 5.2
Captured Market Regulation: Cargo Reservation Schemes in Maritime Transport
The United Nations Convention on the Code of Conduct for Liner Conferences
(UNCTAD 1975), which entered into force in 1983 with ratification by 78 countries,
established the “40/40/20” Rule in maritime transport. The main provision of the
rule was that shipments carried between two state parties had to be shared in
the following way: 40 percent for shipowners established in the country of
origin, 40 percent for shipowners established in the country of destination, and
20 percent for shipowners from other countries (cross-traders).
Justification of the rule
This cargo reservation scheme was promoted to encourage the development of
the shipping industry in developing countries and to counteract the anticompet-
itive behaviors of the liner conferences,* which were cartel-like arrangements.
The rule was meant to give developing countries the opportunity to participate
in the carriage of their trade as a method to decrease the trade deficit in services
as well as to induce international trade (Fink et al. 2002). With the acceptance of
the Liner Code during the 1970s, the European conference members cooperated
with the African maritime authorities to share traffic with new national African
shipping companies.
Impact of the rule in developing countries
In general, the Liner Code has been counterproductive (Chasomeris 2005; European
Commission 2005) because local shipping industries did not take off. As a result
of the Code’s distorting practices, maritime transport prices increased. The
from inland countries. In fact, in many countries in West and Central Africa,authorities have tried to tackle the problem by declaring the system (orderof loading) unlawful. However, these attempts have not been very success-ful, mainly because the quota system gives a legal basis to restrictive practices.
A main justification for the queuing system is fairness and the possibil-ity of sharing transport profits with small operators. The rationale is thensocial. Despite the fact that supporting services provided by nationaloperators in developing countries may be laudable, in many cases the per-ceived benefits of market regulation in Sub-Saharan Africa are capturedby a few people at the expense of the whole economy (see box 5.2 forthe example of maritime transport).
(continued)

52 Transport Prices and Costs in Africa
In road transport, bilateral transit treaties with quotas and freight allo-cation and the queuing system play the same role that the “40/40/20” Ruleplayed in maritime transport. This system and rule lead to poor service andlow productivity, with no incentives to improve efficiency.6 So that trans-port quality could be assessed in such an environment, a measure of trans-port quality was developed that was based on trucking survey results.7 Themeasure is a proxy for a transport quality index and is based on factorsknown to influence transport quality.8 It includes the education level ofthe head of the company, the number of years in the industry for the headof the company, the perception of the importance of domestic competi-tion, the importance of load obtained through contracting, the use of atracking system, the fleet age and size, and the number of employees (see
Box 5.2 (Continued)
“40/40/20” Rule led to a protected market for African shipping companies, an
oligopolistic rent for European shipping lines, and strengthened vested inter-
ests in the sector. In reality, the rule created several national shipping compa-
nies without ships, which sold their country’s share of cargo to foreign shipping
lines without accepting any responsibility for the quality or cost of the services
provided (Harding et al. 2007). In addition, the Liner Code sometimes was used
as a justification for discriminatory practices that created market distortions. In
some instances, the Code provisions were misused to justify the extension of
the “40/40/20” Rule to the whole of liner trade or even to bulk transport.
The end of the rule
During the 1980s, it became increasingly difficult to keep some European and
Asian members of the conferences out of the market, and in 1992 the European
Court ruled that the liner conferences were illegal monopolies. In many West
and Central Africa countries, the lifting of the “40/40/20” Rule has led to increased
competition with Europe, which ultimately has led to decreased transport prices
(Pedersen 2001). As a result of maritime transport liberalization (still only de fac-
to in some countries) and the end of the rule, national shipping lines that had
been established under the umbrella of the Liner Code greatly diminished in size
and importance and were usually taken over by foreign shipping lines or went
bankrupt.
Source: Task team based on Souley (2001).* Shipping companies have organized themselves since the 19th century in the form of liner conferences, which fixed prices and regulated capacity. They are associations of shipowners operatingon the same route served by a secretariat.
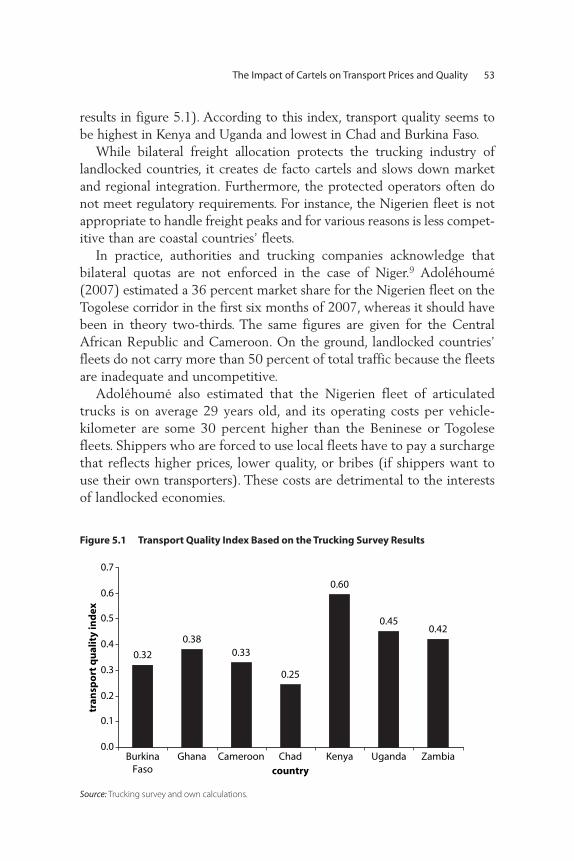
The Impact of Cartels on Transport Prices and Quality 53
results in figure 5.1). According to this index, transport quality seems tobe highest in Kenya and Uganda and lowest in Chad and Burkina Faso.
While bilateral freight allocation protects the trucking industry oflandlocked countries, it creates de facto cartels and slows down marketand regional integration. Furthermore, the protected operators often donot meet regulatory requirements. For instance, the Nigerien fleet is notappropriate to handle freight peaks and for various reasons is less compet-itive than are coastal countries’ fleets.
In practice, authorities and trucking companies acknowledge thatbilateral quotas are not enforced in the case of Niger.9 Adoléhoumé(2007) estimated a 36 percent market share for the Nigerien fleet on theTogolese corridor in the first six months of 2007, whereas it should havebeen in theory two-thirds. The same figures are given for the CentralAfrican Republic and Cameroon. On the ground, landlocked countries’fleets do not carry more than 50 percent of total traffic because the fleetsare inadequate and uncompetitive.
Adoléhoumé also estimated that the Nigerien fleet of articulatedtrucks is on average 29 years old, and its operating costs per vehicle-kilometer are some 30 percent higher than the Beninese or Togolesefleets. Shippers who are forced to use local fleets have to pay a surchargethat reflects higher prices, lower quality, or bribes (if shippers want touse their own transporters). These costs are detrimental to the interestsof landlocked economies.
Figure 5.1 Transport Quality Index Based on the Trucking Survey Results
0.32
0.380.33
0.25
0.60
0.450.42
0.0
0.1
0.2
0.3
0.4
0.5
0.6
0.7
BurkinaFaso
Ghana Cameroon Chadcountry
Kenya Uganda Zambia
tran
spo
rt q
ual
ity
ind
ex
Source: Trucking survey and own calculations.

54 Transport Prices and Costs in Africa
The bilateral quota system is prone to strengthen bribes because thetrucking association in charge of enforcing quotas “sells” market sharesand freight to truckers and trucking companies ready to pay the highestbribe. This helps explain why bilateral quotas are not enforced. Further,in the case of Niger, the trucking association frequently sells freight tonon-Nigerien companies.10
Direct contracting—that is, a medium- or long-term contract betweena shipper and a trucking company—is one of the best signs of good logis-tics. However, direct contracting is almost nonexistent in Central Africaand limited in West Africa to some institutional shippers, which bypassthe queuing system (see table 5.2). Stakeholders and representatives oftransport associations usually agree that such contracts are the only wayto develop an efficient transport industry. That is why the importance ofdirect contracting is an excellent proxy to assess modernization, or thelack of, in the trucking industry.
Central and West Africa are clear examples of the negative effects offreight-sharing schemes on transport prices and quality. However, thefreight allocation system entrenched in these subregions would not be easyto abolish. In Niger, there was a recent attempt to abolish the queuing sys-tem. A government decree11 states that (i) the two-thirds and one-thirdrule to distribute traffic between local transport companies and the mar-itime transport companies is still in effect, but (ii) all trucking operations
Table 5.2 Main Methods Used by the Trucking Industry to Get Freight (percentage by subregion)
Through independent
freight agents
Through public-private
institutions incharge of freight
allocations
By phone/faxand through
contracts from
customers
By trucks waiting atlorry parks and
finding their own loads Others
West Africa 42.7 21.0 16.2 1.9 18.2
Central Africa 35.7 11.4 2.1 24.1a 26.7
East Africa 12.7 20.7 27.3 5.1 34.2Southern
Africa 12.5 1.1 16.4 0.8 69.2Source: Trucking survey and own calculations. Data for Zambian fleet for Southern Africa.Note: It is difficult to capture the exact role of freight bureaus from the trucking survey. Interviews suggest thatbureaus are more important than surveys because truckers with old fleets benefit from the current system. a. This percentage, as well as the percentage of freight procured through independent agents, can be construedas part of the freight procured through allocation bureaus. Indeed, agents that “negotiate” with freight bureausand truckers waiting at lorry parks depend on paperwork issued by the freight bureau.

The Impact of Cartels on Transport Prices and Quality 55
within the Nigerien two-thirds are open to full competition.12 Yet a workshop organized by the government on the Nigerien transport indus-try with all stakeholders to discuss the decree was boycotted by truckingassociations.13
Up to now, the decree is nothing more than a signal. Indeed, the tour derôle never had any legal ground and was designed by the Nigerien truckersto be self-imposed. Hence, its implementation requires willingness fromNigerien trucker association representatives. The queuing system will per-sist as long as transport associations have leverage, thanks to the bilateraltransit agreement, which gives them the power to avoid direct contractingbetween the shipper and the transporter.
Occasionally, smart outsiders can enter this closed market, creatingsome competition. However, entering the market this way generallymeans long waiting times at the port and possible risks of retaliation fromthe trucking association or freight bureau.
Truck Age and Utilization
The large difference in transport prices (and costs) between SouthernAfrica on the one hand and Central and West Africa on the other is clearlycorrelated with the level of truck utilization and the oversupply level,which mainly depends on the existence of cartels. Although truckingcompanies in Southern Africa are able to utilize their vehicles at levelssimilar to European transporters (10,000–12,000 kilometers per month),operators in Central and West Africa utilize their vehicles at lower rates(sometimes as low as 2,000 kilometers per month).
The dismal truck utilization in West and Central Africa implies that theprofitability of the trucking operations comes from other factors. One fac-tor is the low capital investment where operators purchase old trucks. Table5.3 shows that only 34 percent of truckers or trucking companies financedtheir vehicles, partially through a bank loan in Central Africa, and only 21 percent in West Africa. The cost of a truck, more so than financing costs,may explain why truckers buy low-cost and old vehicles. Figure 5.2 showsthat fleet age is highest in West and Central Africa. These subregions alsohave the lowest yearly mileage because of cartels and oversupply.
Truck overloading. Another critical variable in the profitability of truck-ing is the load per truck. To maximize loads and revenues from limited tripsand low vehicle utilization, operators need to overload their vehicles. Sincethe revenue of the transport providers is generated on a per-ton basis andthe marginal cost of overload is low, overloading does make sense.14
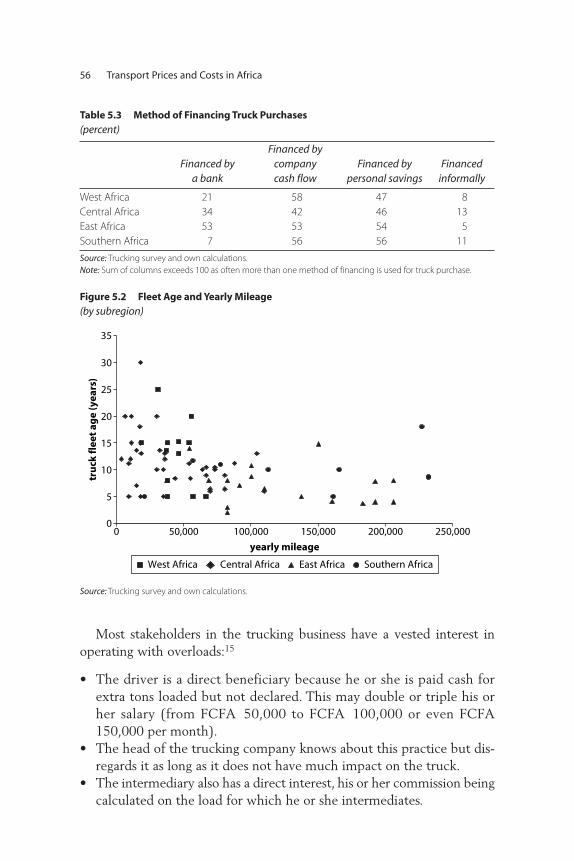
56 Transport Prices and Costs in Africa
Most stakeholders in the trucking business have a vested interest inoperating with overloads:15
• The driver is a direct beneficiary because he or she is paid cash for extra tons loaded but not declared. This may double or triple his orher salary (from FCFA 50,000 to FCFA 100,000 or even FCFA150,000 per month).
• The head of the trucking company knows about this practice but dis-regards it as long as it does not have much impact on the truck.
• The intermediary also has a direct interest, his or her commission beingcalculated on the load for which he or she intermediates.
Table 5.3 Method of Financing Truck Purchases(percent)
Financed by a bank
Financed by company cash flow
Financed by personal savings
Financed informally
West Africa 21 58 47 8Central Africa 34 42 46 13East Africa 53 53 54 5Southern Africa 7 56 56 11
Source: Trucking survey and own calculations.Note: Sum of columns exceeds 100 as often more than one method of financing is used for truck purchase.
Figure 5.2 Fleet Age and Yearly Mileage (by subregion)
0
5
10
15
20
25
30
35
0 50,000 100,000 150,000 200,000 250,000
yearly mileage
tru
ck fl
eet
age
(yea
rs)
West Africa Central Africa East Africa Southern Africa
Source: Trucking survey and own calculations.

The Impact of Cartels on Transport Prices and Quality 57
• The shipper also benefits since the load logged at the border will bethe legal one, resulting in large savings on tariff duties.
• Law enforcement agents (including customs agents) who overlook theobvious overload are adequately rewarded.
The only loser of this systematic overload is the economy of the coun-try, either directly through lower import tax revenues or indirectlythrough rapid road destruction.
Niger’s public authorities, for example, have relaxed their policy regard-ing overloading penalties. According to regulations of the West AfricanEconomic and Monetary Union (WAEMU), a penalty of US$120 peroverloading ton should be enforced on top of a flat penalty fee. However,in 2005, the government adopted a national regulation that reduced dras-tically the penalties for overloading. According to the old regulations, atruck with a 65-ton load (common in West Africa) should have beenpenalized more than US$1,000; the new regulation has reduced the over-loading fee to US$25. This policy adjustment certainly benefits truckingcompanies and truckers, but it heavily taxes the general public, who haveto pay for the premature deterioration of the country’s road assets.
The use of weighbridges to control loads has been ineffective, and notjust in Niger. As shown in table 5.4, several road sections with weigh-bridges are in no better condition than sections where there are fewer orno weighbridges. There is sufficient evidence to assume that overloadingis the main cause of road deterioration and, therefore, that the weigh-bridges are not being utilized effectively to control overloading.
Table 5.4 Infrastructure Condition and Load Control
Region Origin Destination
Percentage of roadsection in good or
fair conditionNumber of
weighbridges
West Africa Tema/Accra Ouagadougou 82 no dataTema/Accra Bamako 61 no data
Central Africa Douala N’Djaména 45 7Douala Bangui 53 6Ngaoundéré Moundou 100 0Ngaoundéré N’Djaména 61 2
East Africa Mombasa Kampala 86 4Kampala Kigali 75 2
Southern Africa Lusaka Johannesburg 100 no dataLusaka Dar-es-Salaam no data no data
Source: Task team calculations.Note: Good or fair condition reflects the percentage of the section that could be traveled at 50 km/hour in all seasons.

58 Transport Prices and Costs in Africa
A vicious circle of transport prices and costs. The combination of theregulation framework and the operators’ mitigation strategies, includingoverloading, is illustrated in figure 5.3. Three main issues affect risk fortruckers and shippers:
• limited market and oversupply, which makes freight scarce • cumbersome public procedures (freight-sharing schemes, controls on
goods in transit, border controls), which lead to truck underutilization• high costs of inputs and technical risks (linked to old fleets operat-
ed on roads that may be in poor condition), which make truck uti-lization costly
Truckers’ mitigation strategies are centered on the following issues:
• cartel formations • overloading• the use of secondhand vehicles
Cartels
Truckers have misconceptions about the benefits of cartels. One of car-tels’ negative consequences is oversupply. Indeed, this system attractsmore truckers because of the potential profits and increases technical risksbecause of the fleet age and overloading practices. Freight bureaus are
By truck service users
By truck owners
Limited market + oversupply
Cumbersome publicconstraints/procedures
Input and technicalrisks including roadconditions
TRUCK OWNER RISK: Low truck utilization
Strongmarketdistortions
Overload
Secondhandvehicles
Own account
High markuptransportprices/costs
TRUCK SERVICE USER RISK:Unreliability of services andhigh prices
Main issues Risks Mitigating strategies
Figure 5.3 The Vicious Circle of Transport Prices and Costs in a StronglyRegulated Environment
Source: Task team.

unconcerned, because as long as their fees (official and nonofficial) arepaid, freight is allocated irrespective of whether oversupply is rampant.Consequently, there are too many trucks and not enough freight.
Moreover, many transporters may ultimately suffer instead of benefit-ing from the regulatory regime, since commercial trucking becomes lessattractive to users. Indeed, shippers have to pay a high price for a lowservice quality—a strong incentive for widespread own-account trans-port. Representatives of transporters’ associations usually single outown-account transport as one of the main reasons for market oversupplyand unfair competition. However, they usually acknowledge that own-account transport is the result of the transport industry’s poor perform-ance.16 For shippers, the main mitigation strategy is to developown-account transport, which makes freight even more scarce for pro-fessional truckers. That is also why the model of trader-transporter is sowidespread in West and Central Africa.
Fleet Size
What is the ideal fleet size for landlocked countries? Under the currenttraffic allocation assigning two-thirds of international freight to land-locked countries, their fleets are up to three times larger that neededfor satisfactory levels of productivity for the capital invested in trucks.
Even considering long turnarounds and fleet characteristics, severallandlocked countries have larger truck fleets than they need to meet cur-rent demand. This is partially explained by cartels. For example, theCentral African Republic has a (theoretical) fleet of 600 trucks17 forapproximately 200,000 tons of exports and less than 100,000 tons ofimports. Assuming about one-third of the fleet is composed of inactiveor out- of-service trucks, this leaves about 395 trucks as the adjusted current active fleet. However, the demand—measured by currentimport/export volume—would only require 125 good-quality trucks tocarry the current freight volume. In West Africa, the total Nigerien fleet isapproximately 4,500 trucks. Applying the same one-third factor to discount trucks not in service, the operational fleet would still be threetimes larger than needed. With around 1 million tons of imports and two-thirds of the traffic for the Nigerien fleet, than 100 trucks per day areneeded. Fewer with a turnaround of 15 days, its ideal size should be about900 trucks (see table 5.5).
If freight quotas between coastal and landlocked countries’ fleet wereended, the market share for Niger’s and Burkina Faso’s fleets would likely
The Impact of Cartels on Transport Prices and Quality 59

60 Transport Prices and Costs in Africa
decrease. Because of higher capacity resulting from increased truck pro-ductivity, the oversupply ratio in these countries would be higher thanthree, at least until their fleets gradually were downsized.
Notes
1. A cartel is a consortium of independent organizations or companies formedto limit competition and set monopoly prices by controlling the productionand distribution of a product or service. Cartels induce abnormal markups.
2. An estimate of the impact of various measures is presented in chapter 10 ofthe report.
3. For more details on the impact of transit regimes on the trucking sector’scompetitiveness, see Arvis et al. (2007).
4. See annex 4 for more details.
5. Contrary to bilateral quotas, the tour de rôle has no legal basis whatsoever.
6. A landlocked country limiting access to its freight market for foreign compa-nies self-imposes higher transport prices on its trade. Transport cannot beoptimized with backloads, and transport providers, assuming no backload,charge higher prices one way.
7. It would have been better to assess transport quality from end users, but it isdifficult to get reliable data on transport quality from surveys of firms, suchas investment climate assessments.
Table 5.5 Current Trucking Demand and Ideal Supply, Central African Republic and Niger
Country
Adjustedcurrent
fleeta DemandOversupply
ratio Ideal fleet
Oversupply/idealfleet as percentage
of current fleet
Central African Republic
395 125b 3.15 100c 6%(25 trucks)
Niger 2,970 905 3.30 455 15%(450 trucks)
Source: Adoléhoumé (2007) for Niger data and Ministry of Transport for the Central African Republic data.a. Adjusted means total fleet less one-third.b. 140,000 metric tons of exports are loaded in Belabo (return transport time from Central African Republic (CAR) toBelabo is at most 5 days); 90,000 metric tons of imports come from Douala (return transport time Douala to CARis about 15 days). Without an overload of at least 10 percent (30 metric tons), we can estimate the average dailydemand for 12 trucks to go to Belabo and 8 trucks from Douala. Because of long turnaround times, the total demand is (12 � 5) + (8 � 15), of which two-thirds is for the CAR fleet.c. At the same current demand. Without overloading, we can estimate the average daily demand for 20 trucks togo to Belabo and 15 trucks from Douala. Because of shorter turnaround times, the total demand would be (19 � 3)+ (12 � 8), of which two-thirds is for the CAR fleet.

8. The index is calculated as a weighted average of indexes using the followingweights:
Weighting Parameter coefficient
Education level of the head of the company 2Experience in the industry of the head of the company 1Perception of the importance of domestic competition 2Importance of freight load obtained through contracting 2Use of tracking system 1Fleet size 1Fleet age 3Number of employees 1
9. This situation also was corroborated for Burkina Faso’s trade flows during thestakeholders’ workshop in Ouagadougou in February 2008.
10. International own-account transport is usually allocated to Beninese compa-nies. Shippers willing to overload prefer to use Beninese or Togolese fleets,which are younger.
11. Ministerial decree number 09/MT/DTT-MF of February 2007.
12. The most important articles of the decree are the following:
“Article 2: Within the two-thirds quota allocated to trucks registered inNiger, the importer is authorized to load its cargo on its own truck or anyNigerien trucker’s trucks of its choice with trucks registered in Niger (withvalid transport and registration documents).
Article 4: The CNUT is in charge to monitor the repartition betweenNigerien trucks and those from the transit country and will report it to theMinister of Transport.
All changes in truck assignments that violate the freight repartition asdone by the Comité Paritaire will be fined according to the law.”
13. Some companies attempt to enter the market without being part of a truckingassociation and of the queuing system, but usually on very limited niches.
14. The willingness for all parties to overload trucks to maximize profits doesnot favor containers, because their fixed maximum capacity prevents over-loading. That is why containerization rates remain low in most parts ofAfrica.
15. Despite being unable to estimate overloading in detail, Oyer (2007) found astrong positive correlation between vehicle operating costs for heavy trucksand cargo factor.
16. This point was discussed at length during the stakeholders’ workshop organ-ized in Burkina Faso in February 2008.
17. Figure given by the CAR Ministry of Transport.
The Impact of Cartels on Transport Prices and Quality 61


This chapter analyzes the factors influencing road transport costs. It startsby discussing the way companies organize and operate, and follows bysuggesting a typology of companies, which is important since transportcompanies’ organization affects both fixed and variable costs. It thenpresents a comparison of transport costs between the various corridors,and concludes with an analysis of variable and fixed costs as well as factors influencing them.
Based on the trucking survey carried out in this study, different typolo-gies of transport companies coexist on the same corridors. In general, thecost structure in Sub-Saharan Africa is opposite from those in developedcountries. In Africa, trucking companies’ costs are mostly variable, whilefixed costs are generally low. The extreme cases of high variable costs tofixed costs are in Central and West Africa (about a 70/30 ratio) whereasin East Africa the ratio is 60/40 between variable to fixed costs.
In all African corridors, the cost of fuel and lubricants are the mainvariable costs, accounting for at least 40 percent of total VOCs. Tire costis also an important factor. On the other hand, bribes do not seem to playa major role on most African corridors.
In East and Southern Africa, transport costs are severely affected by theopportunity cost of delays (at border crossings, weighbridges, and ports)and long custom procedures.
C H A P T E R 6
Transport Costs Determinants
63

64 Transport Prices and Costs in Africa
Typology of Trucking Companies in Africa
The way companies organize themselves and operate influences theircosts, both fixed and variable. Table 6.1 describes the typology of truckingcompanies, ranging from formal, professional companies to informal,owner-operator companies. Different types of trucking companies oper-ate on the same corridor and face different costs, making it necessary todetermine whether each type can compete and be profitable.
Operating Costs in the Subregions
Variable costs represent the bulk of total transport costs in Central andWest Africa, with a minimum average ratio of 70/30 for variable/fixedcosts; the main components of variable costs are fuel and tires.
Table 6.2 illustrates how the cost structure differs between African coun-tries and developed countries. In developed countries the trucking industryis labor intensive, which explains why numerous companies in WesternEurope employ cheap labor from Eastern Europe. In Africa, variable costsdominate, mainly fuel, tires, and, to a lesser extent, bribes in Central andWest Africa. The cost of capital may also be a problem in East Africa.
Transport costs. Table 6.3 shows the average operating costs ofselected routes in the four study corridors. The spread in transport costsis smaller than for transport prices. In general, variable operating costs1 inAfrican countries range between US$1.22 and US$1.83 per kilometerwith the exception of high variable costs on the Ngaoundéré–Moundouroute (US$2.49) and low variable costs on Mombasa–Kampala(US$0.98). On the other hand, fixed operating costs maínly depend onthe routes. As shown in the table, daily fixed costs in Africa can varythreefold, from US$21 to US$73, but this variation is small compared tofixed costs observed in Europe or the United States.
Along Central African corridors,2 routes that are comparable in distanceand average fleet age (9–11 years) include Douala to N’Djaména (1,830kilometers) and Douala to Bangui (1,450 kilometers). These routes havesimilar variable average operating costs, between US$1.22 and US$1.31per kilometer. However, they do not have similar fixed operating costssince relatively newer fleets operate to Bangui compared with those operating to N’Djaména.
Comparable routes starting in Ngaoundéré (Cameroon) with finaldestination in Chad are Ngaoundéré–N’Djaména (750 kilometers) andNgaoundéré–Moundou (460 kilometers). These routes have similar lowfixed costs, around US$22 per day, but face different variable operatingcosts. This is mostly explained by the higher expenses in tires, maintenance

Table 6.1 A Typology of Trucking Companies in Africa
Type of company
Characteristics
Comments
Freight forwardingand transit
activities
Own-accounttransport
service Fleet size Fleet financingFleet operation characteristics
1. Modern—professional
Yes No own-accounttransport
10 to 100+ Cash flow, leasing, and bank financing
High mileage (over80,000 km/year)
High fixed costsUsually own new
trucks
High fixed costs; low to hightransport prices dependingon market regulation
2. Modern—informal Yes Own-account transport
10 to 100+ Mainly leasing sec-ondhand vehicleswith guaranteesfrom traders
High mileageLower fixed costs than
professionalsLower total costsMix of new and
secondhand trucks
Cross-subsidy of activities andinformality, which enablescompanies to offer lowertransport prices and havelarge fleets
3. Formal—powerful No Usually no own-account transport
A few to dozens Various financing butmainly cash flow
Low mileage(50,000–70,000km/year)
Low fixed costs exceptif prices are extremelyhigh and allow forfleet improvement
Mix of new and secondhand trucks
Companies’ power (ties withpolitical decision makers, position in truckingassociations, law enforcement agents, includ-ing customs, police, and taxagents) allows them to cir-cumvent rules. Huge profitsin a regulated environment
65 (continued)

66
Table 6.1 A Typology of Trucking Companies in Africa (continued)
Type of company
Characteristics
Comments
Freight forwardingand transit
activities
Own-accounttransport
service Fleet size Fleet financingFleet operation characteristics
4. Own account No Own-account transport
Depends on the extent of industrial activities
Included in the fund-ing of main activities
Low mileageNew or secondhand
truck; depends on thecompany strategy
5. Informal—individuals
No No own-accounttransport
Limited to 1–3trucks
Cash flow Low mileage(50,000–60,000km/year)
Low fixed costsLow revenuesSecondhand trucks
Low transport prices becauseof oversupply of transport
Low quality of service to remain competitive; informalcosts (bribes) are a majorcost factor
Source: Task team compilation.

Transport Costs Determinants 67
costs (old fleets operating to Moundou), and bribes.3 On theNgaoundéré–Moundou route, some trucks are almost 20 years old,despite the fact that a new, rehabilitated road is open to traffic (financedby the European Union).
Table 6.2 Transport Costs Composition(percent)
Cost France Chad Kenya
Fuel 25 50 21Maintenance and tires 9 22 10Depreciation and insurance 12 8 24Toll roads/road-user charges 5 11 1Staff costs 35 6 19Administrative and overhead costs
and others14 3 25
Total 100 100 100Source: CNR for France, trucking surveys for Chad and Kenya.
Table 6.3 Truck Operating Costs in the Four Corridors
CorridorRoute gateway/
destination
Variablecost
(US$/km)
Fixed cost
(US$/day)
Yearly ratio FC/VC
(%)
Averagetruck fleet
age (years)
West Africa(Burkina Faso andGhana)
Tema/Accra–Ouagadougou (Burkina Faso)
1.51(0.59)
30(16)
10–89 13
Tema/Accra–Bamako(Mali)
1.67(0.23)
36(23)
10–89 9
Central Africa(Cameroon andChad)
Douala–N’Djaména(Chad)
1.31(0.34)
49(30)
17–82 11
Douala–Bangui (theCentral African Republic)
1.22(0.34)
73(43)
25–74 9
Ngaoundéré–N’Djaména (Chad)
1.83(0.27)
22(8)
7–92 15
Ngaoundéré–Moundou (Chad)
2.49(0.64)
21(6)
5–94 19
East Africa(Uganda andKenya)
Mombasa–Kampala(Uganda)
0.98(0.46)
61(30)
68–31 7
Kampala–Kigali (Rwanda)
1.47(0.84)
40(30)
56–43 10
Southern Africa(Zambia)
Lusaka–Johannesburg(South Africa)
1.54(0.41)
55(39)
61–38 9
Lusaka–Dar-es-Salaam(Tanzania)
1.34(0.52)
71(54)
75–24 10
Source: Trucking survey data and own calculations. Exchange rates come from IMF-IFS. Notes: FC = fixed costs; VC = variable costs; figures are averages with standard deviation shown in parentheses.

68 Transport Prices and Costs in Africa
In East Africa, a great discrepancy in the operating costs, both variableand fixed, exists on different corridors. A similar discrepancy exists withinthe same corridors between different trucking companies, mainlybetween those established in Uganda and Kenya. Kenyan companies facehigher fixed costs than Ugandan companies. This is explained by Kenya’srecent acquisition of a new fleet (incurring high depreciation and finan-cial costs), low variable costs due to a more modern and efficient fleet,and good road conditions on the main corridors.
Operating costs in Southern Africa are similar to those in East Africa.Fixed costs and variable cost ratios are higher compared with those inthe rest of Africa. The Zambian fleet, although older, manages to achievehigher yearly mileage than in East Africa, which creates certain cost dis-parities between these two subregions.
In West African countries, costs are relatively similar between nationalcorridors. Variable operating costs in both cases are one standard devia-tion away from the average. Fixed operating costs are low, and the coststructure is similar to that of the Chadian companies.
Calculations in this study are based on trucking survey data and com-pute all costs,4 which explains why our estimated fixed transport costs aremuch higher than transport costs estimated with models such as theHDM-4 (an extensively used methodology in many studies). It is worthnoting that because the HDM-4 uses data for new trucks as an input, vari-able maintenance costs are higher than our estimates. However, fuel andlubricant costs are much higher in our estimates (using actual data of oldtrucks with less fuel efficiency) than the usual values calibrated using newtrucks in the HDM-4. Overall, our estimated variable costs are higherthan the ones developed by HDM-4. Table 6.4 compares the valuesobtained using the two different approaches.
Table 6.4 Comparison of Transport Costs for a Heavy Truck Using Alternative Methods of Analysis (US$ per vehicle-km)
Costs
West Africa Central Africa East Africa
TS HDM Diff. TS HDM Diff. TS HDM Oyer Diff.
Variable costs 1.77 1.02 173% 1.30 0.99 131% 0.98 1.08 0.95 91%Fixed costs 1.02 0.14 749% 0.57 0.24 236% 0.35 0.17 0.15 201%Total costs 2.79 1.16 241% 1.87 1.23 152% 1.33 1.25 1.10 106%Source: Trucking survey data and own calculations. Notes: TS = trucking survey; HDM = highway development maintenance model; Oyer (2007); Diff = difference.

Transport Costs Determinants 69
The Importance of Variable Costs
Vehicle operating costs show a ratio of about 30/70 between fixed andvariable costs in Central Africa, 40/60 in East Africa, and 15/85 in WestAfrica (table 6.3). Overall, operating costs for a heavy truck are as high(in Southern Africa) and sometimes much higher (in Central Africa) thanin Europe.
Compared with European operators, African operators usually havelower fixed costs but higher variable costs. Low fixed costs (salary andequipment principally) can be attributed to the low cost of labor and theuse of cheap, secondhand trucks (as old as 10–15 years). High variablecosts can be attributed to high fuel consumption because of the trucks’characteristics—low capacity, old models, and poor maintenance. Becauseof the pervasive use of old trucks, average fuel consumption for trucks inAfrica can be more than 50 liters per 100 kilometers, which is high byEuropean standards.
In the corridors under review, the cost of fuel is the main variable cost.Three other variable costs—tires, maintenance, and bribes—are alsoimportant, although their contribution to variable costs depends on cor-ridors (table 6.5).
In Central Africa, fuel and lubricants account for 38–60 percent oftotal variable costs. Bribes account for 27 percent of the total variablecosts, which are sometimes equal to or higher than tire costs. The mainfixed costs are staff (up to 38 percent) and depreciation. Financial costs
Table 6.5 Variable Costs Breakdown for Subregions (percentage of total variable costs)
CorridorRoute gateway/
destination Fuel Tires Maintenance Bribes
West Africa Tema/Accra–Ouagadougou
74 16 4 6
Tema/Accra–Bamako 80 9 5 6
Central Africa Douala–N’Djaména 60 17 10 13Douala–Bangui 60 19 9 12Ngaoundéré–N’Djaména 53 11 14 22Ngaoundéré–Moundou 38 12 23 27
East Africa Mombasa–Kampala 79 13 6 2Kampala–Kigali 67 31 1 1
Southern Africa Lusaka–Johannesburg 51 48 1 0Lusaka–Dar-es-Salaam 60 38 1 1
Source: Trucking survey data and own calculations.

70 Transport Prices and Costs in Africa
are significant for the few companies that finance their capital invest-ments with bank credit or leasing (table 6.6).
In East Africa, fuel and lubricants represent the main variable costs.High fixed costs for Kenyan truckers are largely explained by high costsof staff, finance, and depreciation.
In Southern Africa, fuel and tires account for more than 90 percent ofthe variable costs. Zambian truckers consider the high levels of domesticfuel prices as their main impediment to capturing a larger share of thenorth-south corridor market.
In West Africa, the situation is similar to that in Central Africa. Fuel andlubricants account for the bulk of variable costs (more than 70 percent forfuel). Bribes are equal to or higher than tires (bribes are up to 10 percentof variable costs along the Tema/Accra–Bamako route). Fixed costs com-prise mainly staff and depreciation.
These results are consistent with Oyer (2007). Indeed, he found thatfuel consumption, at 42 percent, is the biggest portion of total VOC forheavy trucks in East Africa. Tire costs are the second largest componentof VOCs at 16 percent. Maintenance and parts costs were the second
Table 6.6 Fixed Costs in the Subregions (percentage of total)
CorridorRoute gateway/
destination
Staff (% of total
fixed costs)
Depreciation(% of totalfixed costs)
Finance (% of
total fixedcosts)
Othera (%of total
fixedcosts)
West Africa Tema/Accra–Ouagadougou
46 31 0 23
Tema/Accra–Bamako 44 43 0 13
Central Africa Douala–N’Djaména 35 33 15 17
Douala–Bangui 28 26 25 21
Ngaoundéré–N’Djaména
36 35 0 29
Ngaoundéré–Moundou
38 34 1 27
East Africa Mombasa–Kampala 27 20 15 38
Kampala–Kigali 27 29 3 41
Southern Africa Lusaka–Johannesburg 43 15 0 42
Lusaka–Dar-es-Salaam 53 8 0 39
Source: Trucking survey data and own calculations.a. Includes licenses costs, administrative costs, insurance, communication costs, security, and losses related tocrime and theft.
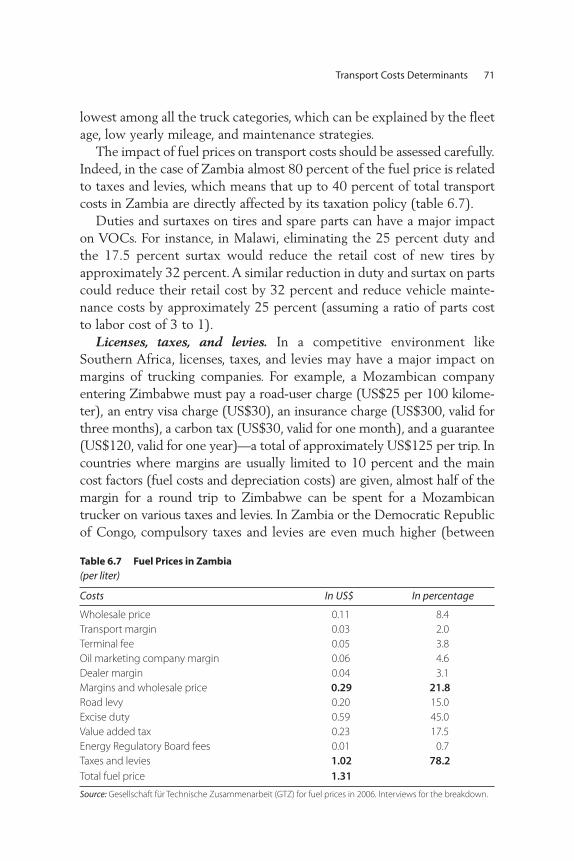
Transport Costs Determinants 71
lowest among all the truck categories, which can be explained by the fleetage, low yearly mileage, and maintenance strategies.
The impact of fuel prices on transport costs should be assessed carefully.Indeed, in the case of Zambia almost 80 percent of the fuel price is relatedto taxes and levies, which means that up to 40 percent of total transportcosts in Zambia are directly affected by its taxation policy (table 6.7).
Duties and surtaxes on tires and spare parts can have a major impacton VOCs. For instance, in Malawi, eliminating the 25 percent duty andthe 17.5 percent surtax would reduce the retail cost of new tires byapproximately 32 percent. A similar reduction in duty and surtax on partscould reduce their retail cost by 32 percent and reduce vehicle mainte-nance costs by approximately 25 percent (assuming a ratio of parts costto labor cost of 3 to 1).
Licenses, taxes, and levies. In a competitive environment likeSouthern Africa, licenses, taxes, and levies may have a major impact onmargins of trucking companies. For example, a Mozambican companyentering Zimbabwe must pay a road-user charge (US$25 per 100 kilome-ter), an entry visa charge (US$30), an insurance charge (US$300, valid forthree months), a carbon tax (US$30, valid for one month), and a guarantee(US$120, valid for one year)—a total of approximately US$125 per trip. Incountries where margins are usually limited to 10 percent and the maincost factors (fuel costs and depreciation costs) are given, almost half of themargin for a round trip to Zimbabwe can be spent for a Mozambicantrucker on various taxes and levies. In Zambia or the Democratic Republicof Congo, compulsory taxes and levies are even much higher (between
Table 6.7 Fuel Prices in Zambia (per liter)
Costs In US$ In percentage
Wholesale price 0.11 8.4Transport margin 0.03 2.0Terminal fee 0.05 3.8Oil marketing company margin 0.06 4.6Dealer margin 0.04 3.1Margins and wholesale price 0.29 21.8Road levy 0.20 15.0Excise duty 0.59 45.0Value added tax 0.23 17.5Energy Regulatory Board fees 0.01 0.7Taxes and levies 1.02 78.2Total fuel price 1.31
Source: Gesellschaft für Technische Zusammenarbeit (GTZ) for fuel prices in 2006. Interviews for the breakdown.

US$400 and US$700), which makes any trip to these countries for aMozambican company unprofitable. This is an example of unnecessarysegmentation of transport markets and limits competition, in this casefrom Mozambican companies.
Breakdown of Fixed Costs
Despite relatively low wages, staff costs remain the most important fixedcosts. Moreover, depreciation costs are also a major component of fixedcosts for most African trucking companies (in spite of the old fleet).
Truck prices. Table 6.8 shows the average prices of the last three vehi-cles purchased by the trucking companies and the truckers surveyed.Secondhand heavy trucks in Kenya cost more than in the other countries(approximately 70 percent more) because Kenyans buy relatively “new”secondhand vehicles.
Contrary to a widespread perception about the negative impact ofhigh import tariffs on imported trucks, an analysis of most-favored-nation(MFN) tariffs for imported heavy trucks does not seem to corroboratethis. Indeed, if we exclude South Africa and Zambia, import tariffs do notseem to explain why trucks are considered to be so expensive (seetable 6.9). However, import tariffs may be complemented with othertaxes such as value added tax (VAT) or environmental taxes, resulting in asimilar tax burden as in South Africa and Zambia and maybe even higher.Moreover, some countries may in reality continue to impose tariffs thatdiverge from the regional harmonized tariff schedule. Consequently, a newtruck costs three or four times as much as a used truck.
In an environment where truck utilization is low (40,000–60,000 kilometers) and transport prices are not extremely high, a trucker ortrucking company cannot afford to purchase a new truck because there is
72 Transport Prices and Costs in Africa
Table 6.8 Heavy Truck Prices (current US$)
Country New Second hand
Burkina Faso 163,333 27,000Ghana 113,333 24,688Ugandaa 93,000 30,690Kenya 169,200 52,144Zambia n.a. 19,613Source: Trucking survey data and own calculations.a. Prices are lower because Ugandan truckers/trucking companies usually operate with smaller new trucks. Butnew trucks remain operated marginally by Ugandan truckers and trucking companies.

a very high likelihood of defaulting on the loan. Truck prices then are aproblem, but the operating environment is even more problematic.Indeed, where long-term direct contracting does not exist and margins canhardly reach US$20,000–30,000 per year, it becomes extremely risky toinvest US$150,000 in a new truck. In a regulated environment, and whenlow allocated freight and bad connections with the freight allocationbureau are the case, there is absolutely no incentive to purchase a newtruck, even if import tariffs are lowered.
Low wages. Truck drivers’ wages are generally low in Sub-SaharanAfrica (table 6.10). Wages in Kenya and Cameroon are the highest in thesubregion, the most professional companies being located in East Africa.Some large companies have started to invest in truckers’ training and haveincreased wages in order to keep trained drivers. In West Africa and Chad,
Transport Costs Determinants 73
Table 6.9 Import Tariffs for Imported Trucks (percentage of value of imports)
Country MFN tariff Year
Rwanda 5.00 2005Cameroon 10.00 2005Central African Republic 10.00 2005Chad 10.00 2005Niger 10.00 2006Togo 10.00 2005Burkina Faso 10.00 2006Uganda 12.50 2006Kenya 12.50 2006South Africa 13.33 2006Zambia 15.00 2003Source: TRAINS, UNCTAD.Note: Data for trucks over 20 metric tons of gross vehicle weight (HS 870423).
Table 6.10 Monthly Wage for Permanent Full-Time Truck Drivers (in current US$)
Country MedianStandard deviation Maximum Minimum
Burkina Faso 131.1 41.3 350.0 60.0Ghana 193.0 82.8 420.0 70.0Cameroon 217.4 65.8 400.0 100.0Chad 189.0 56.9 400.0 100.0Kenya 269.0 92.8 504.0 144.0Uganda 162.5 42.9 240.0 72.0Zambia 160.2 111.5 683.7 43.4Source: Trucking survey data and own calculations.
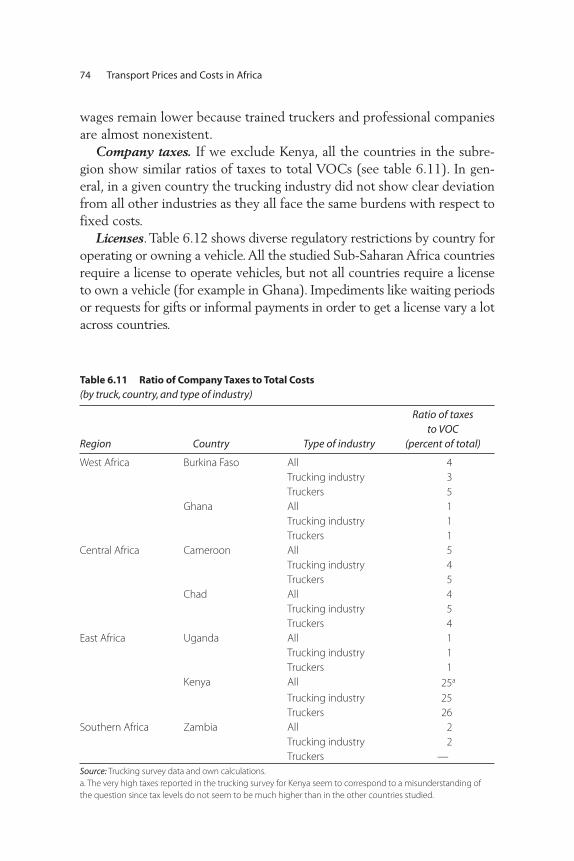
wages remain lower because trained truckers and professional companiesare almost nonexistent.
Company taxes. If we exclude Kenya, all the countries in the subre-gion show similar ratios of taxes to total VOCs (see table 6.11). In gen-eral, in a given country the trucking industry did not show clear deviationfrom all other industries as they all face the same burdens with respect tofixed costs.
Licenses. Table 6.12 shows diverse regulatory restrictions by country foroperating or owning a vehicle. All the studied Sub-Saharan Africa countriesrequire a license to operate vehicles, but not all countries require a licenseto own a vehicle (for example in Ghana). Impediments like waiting periodsor requests for gifts or informal payments in order to get a license vary a lotacross countries.
74 Transport Prices and Costs in Africa
Table 6.11 Ratio of Company Taxes to Total Costs (by truck, country, and type of industry)
Region Country Type of industry
Ratio of taxes to VOC
(percent of total)
West Africa Burkina Faso All 4Trucking industry 3Truckers 5
Ghana All 1Trucking industry 1Truckers 1
Central Africa Cameroon All 5Trucking industry 4Truckers 5
Chad All 4Trucking industry 5Truckers 4
East Africa Uganda All 1Trucking industry 1Truckers 1
Kenya All 25a
Trucking industry 25Truckers 26
Southern Africa Zambia All 2Trucking industry 2Truckers —
Source: Trucking survey data and own calculations.a. The very high taxes reported in the trucking survey for Kenya seem to correspond to a misunderstanding ofthe question since tax levels do not seem to be much higher than in the other countries studied.

Transport Costs Determinants 75
Table 6.12 Licenses
CountryLicense needed before
beginning operations (%)a
Number ofdays it takes toget the license
Gift or informal payment expected orrequested in order to
obtain the license (%)b
Burkina Faso License to operate 95 22.7 24License to own vehicle 61 4.2 5
Ghana License to operate 90 49.1 43License to own vehicle 19 100.3 23
Cameroon License to operate 99 34.1 60License to own vehicle 93 8.8 35
Chad License to operate 99 20.6 89License to own vehicle 100 15.2 77
Uganda License to operate 76 5.7 5License to own vehicle 55 6.3 0
Kenya License to operate 100 24.9 66License to own vehicle 97 26.4 64
Zambia License to operate 93 49.8 7License to own vehicle 70 23.3 8
Source: Trucking survey data and own calculations.a. The percentage represents the number of trucking industries/truckers that said YES to this question: Do youneed a license to operate?b. The percentage represents the number of trucking industries/truckers that said YES to this question: Was agift/informal payment expected or requested in order to obtain a license?
Public Procedures and the Opportunity Cost of Delays
Procedures such as customs and personnel checks at border crossingsinfluence truck utilization (see table 6.13). In Africa, there seems to be astrong positive correlation between transport prices and the number ofcross-border operations.
Trucking companies in East Africa illustrate the opportunity cost ofdelays (at borders, weighbridges, and port). For many years, trucks havebeen waiting between one to two days at Malaba, the main border postbetween Kenya and Uganda. There are several reasons for the delays,including limited parking space for trucks, limited space in the customsyard, poor cargo documentation, and duplication of processes with Kenyanand Ugandan customs. Although some freight forwarders present docu-mentation in advance of crossing, customs officials start to process docu-mentation only when trucks have entered the customs yard, which usuallytakes several hours because of congestion and the reasons given above.

Ugandan and Kenyan authorities are now working on establishing ajoint border post, which should enable trucks to go through with only onestop instead of two. When fully implemented, this initiative should helpdecrease delays at the border dramatically.
In addition to border delays, weighbridge operations (for instance atMariakani, Kenya, or at Mombasa port) also contribute to long delaysalong the northern corridor.
If all these delays (port, weighbridges, border) could be significantlyreduced, vehicle yearly mileage should improve by at least 20,000 kilo-meters, which would help increase the ratio of a vehicle’s capital utiliza-tion, thus reducing average yearly operating costs per vehicle and perhapsleading to transport price reductions.
In Southern Africa, delays at Beit Bridge or Chirundu border postshave a similar impact as those at Malaba in East Africa. Trucking compa-nies waste several days at these border posts between South Africa andZimbabwe and Zimbabwe and Zambia. For several years, authorities havebeen working on establishing a joint border post. These projects have notyet materialized, but important steps have been taken at Chirundu.Delays at Beit Bridge and Chirundu cost US$3.5 million each year totrucking companies only, which is equal to approximately a 25 percentsurcharge on transport costs along the corridor.5
76 Transport Prices and Costs in Africa
Table 6.13 Opportunity Cost of Delays
CountryTime to cross theborder (hours)
Time waited to pick up freightonce inside the port (hours)
Burkina Faso 25.36(14.9)
23.38(12.2)
Ghana 30.33(31.3)
24.71(23.1)
Cameroon 26.55(24.2)
12.38(12.4)
Chad 11.65(15.2)
12.38(12.4)
Uganda 15.25(15.9)
11.75(8.1)
Kenya 8.18(7.2)
5.93(1.32)
Zambia 26.5(26.0)
16.55(20.6)
Source: Trucking survey data and own calculations.Note: Figures are averages with standard deviation shown in parentheses.

If all these delays (port, border) could be significantly reduced, vehicleyearly mileage should improve by at least 30,000 kilometers along thenorth-south corridor, which would help reduce operating costs and prices.
Notes
1. Variable costs include fuel, tires, maintenance, and bribes, whereas fixed costsinclude staff, licensing, administrative expenses, insurance, communication,security, losses, finance, and depreciation.
2. The average operating costs are calculated on a significantly large sample oftrucks operating regularly on these routes: Douala–N’Djaména (35 observa-tions), Douala–Bangui (18 observations), Ngaounderé–N’Djaména (23 obser-vations), and Ngaoundéré–Moundou (17 observations).
3. See chapter 7, table 7.1, on infrastructure condition and overload control bycorridor.
4. In HDM-4, overhead, administrative costs, and bribes are not taken intoaccount.
5. If we assume fixed costs of a six-axle truck (from the South African roadfreight association), 2.5 days’ delay at Beit Bridge (Mthembu-Salter 2007), and 1.5 days’ delay at Chirundu (FESARTA 2007), more than US$1,180 are lost foreach trip in delays at border crossings. Traffic is assumed to be 500 trucks perday at Beit Bridge and 100 at Chirundu, with a conservative estimate of 25 turn-arounds per year. Delays on the return trip are not estimated.
Transport Costs Determinants 77


In Sub-Saharan Africa, most truck drivers and government officials blamepoor roads for the high variable operating costs of the trucks. However,results from this study suggest that road conditions do not have a largenegative impact on operating costs along the selected international corri-dors. This chapter analyzes the issue.
Road Conditions in the Study Corridors
Road conditions vary widely in the study corridors (table 7.1). For someroutes, only 45 percent of the road is in good condition (Douala–N’Djaména); for others, the whole route is in good condition (one routein Central Africa and the two routes in South Africa).
How Road Conditions Affect Operating Costs
Roads in poor condition result in higher variable costs of operationbecause they (i) reduce fuel efficiency; (ii) damage the vehicles, leadingto higher maintenance and higher operation costs; (iii) reduce the life oftires; (iv) reduce vehicle utilization because of lower speeds; and(v) reduce the life of the truck. How significant is the impact of poor roadson variable costs, and what factors make the impact bigger or smaller?
C H A P T E R 7
The Impact of Road Conditions on Transport Costs
79

80 Transport Prices and Costs in Africa
Table 7.1 Infrastructure Condition and Load Control
Region Origin DestinationPercentage of route in
good and fair condition
West Africa Tema/Accra Ouagadougou 82Tema/Accra Bamako 61
Central Africa Douala N’Djaména 45Douala Bangui 53Ngaoundéré Moundou 100Ngaoundéré N’Djaména 61
East Africa Mombasa Kampala 86Kampala Kigali 75
Southern Africa Lusaka Johannesburg 100Lusaka Dar-es-Salaam no data
Source: Task team calculations.Note: Figures represent the percentage of the route that could be traveled at 50 km/hour in all seasons.
The trucking survey and HDM-4 simulations show mixed results. Intwo African subregions where traffic is low and truck fleets are old, aslong as international corridor routes are paved and in fair condition roadconditions do not emerge as a major hindrance to transport efficiency.However, on East Africa’s main trade corridors, improving road condi-tions would have a significant impact on lowering transport costs, even ifthe roads are in fair condition to begin with.
Four variable costs usually are affected by road conditions: life of trucks,life of tires, maintenance costs, and fuel consumption. There are strategiesthat truckers can follow to reduce the impact of road conditions on oper-ating costs:
• Life of trucks. Poor road conditions might shorten the operational lifeof trucks due to increased wear and tear. Although it is likely that thisdoes take place, it is difficult to determine the respective share ofcauses such as suboptimal road condition, inadequate maintenancestrategy, poor quality of parts and repair jobs, overloads, or other factors.
• Life of tires. Often the main reason the operational life of tires is short-er than expected is the use of low-quality tires to reduce the initialcosts.1
• Vehicle maintenance costs.2 Maintenance costs caused by poor roadsdo not impact significantly overall VOCs along international corridors.This is because maintenance costs rarely exceed 20 percent of totalcosts. It seems that costs are kept low by the owners’ maintenance

The Impact of Road Conditions on Transport Costs 81
strategy for old trucks. Sometimes preventive maintenance is delayed oreven skipped altogether. On the other hand, old trucks also mean simpletechnology, which allows creative truckers to tinker with their enginesand improvise repairs and parts, thus limiting maintenance costs. Truck-ers should use their knowledge of actual conditions to decide what typeof truck to buy and which maintenance strategy is optimal.
• Fuel consumption. Like maintenance costs, fuel consumption is higherwhen road conditions are bad. However, the use of old, secondhandtrucks may be a more critical factor for fuel consumption than roadcondition. As with tires and maintenance, truckers should use theirknowledge of actual conditions to create an optimal strategy regardingtruck fleet age and truck specifications.
Travel time is much shorter than it used to be, in large part becausemuch road improvement has been carried out in Africa over past decadeswith the support of donors (mostly the European Union (EU) and theWorld Bank). Accessing the capital cities has become easier and faster.However, there are still a few road sections that require major improve-ments as well as some missing links to be built, notably in Central Africa.
Travel time between cities is not very dependent on the average speedat which a truck operates. More important than slow speed is the time atruck is idling while waiting for administrative procedures to be per-formed (at borders or at the terminals during loading or unloading). Forinstance, along the northern corridor in East Africa, truckers usually loseup to four hours in reduced speed because of poor road conditions alongsome segments, but they spend on average more than one day at the bor-der crossing between Kenya and Uganda.
Apparently, the only road condition that has a significant impact ontrip average speed is the congested exits to ports or major cities. Theseexits are found on routes such as Nairobi along the northern corridor orYaoundé in Central Africa. Most African ports were built during colonialtimes with the city built around them, and exit routes are now in mostcases inadequate.
Quantifying the impact of poor roads on transport costs. Tables7.2–7.4 give approximate figures for the impact of road rehabilitation onVOCs using the HDM-4 model, with parameters of the model collectedfrom the trucking survey. Estimates differ from the usual economic analy-ses of road projects for two reasons: (i) in almost all HDM-4 simulations,new truck prices are used, which inevitably inflates operating costs becauseof poor road condition; (ii) HDM-4 simulations assume high truck

82 Transport Prices and Costs in Africa
Table 7.3 Vehicle Operating Costs Savings from Road Improvement (US$ thousands per year)
Road condition
West Africa Central Africa East Africa
Minimaltraffica
Maximaltraffic
Minimaltraffic
Maximaltraffic
Minimaltraffic
Maximaltraffic
Fair to good 158.2 474.5 169.1 507.3 1,916.2 6,706.7Poor to good 674.9 2,024.7 901.9 2,705.7 8,878.6 31,075.1Source: Trucking survey data and own calculations.a. Minimal traffic corresponds to 50 trucks per day in West and Central Africa, 200 per day in East Africa (northerncorridor), and maximum traffic corresponds to 150 trucks per day in West and Central Africa and 700 per day inEast Africa.
Table 7.4 Indicative Internal Rate of Return of Infrastructure Rehabilitation (percent)
Road condition
West Africa Central Africa East Africa
50 kmproject
100 kmproject
50 kmproject
100 kmproject
50 kmproject
100 kmproject
Fair to goodMin. trafficMax. traffic
<0<0
<0<0
<0<0
<0<0
730
015
Poor to goodMin. trafficMax. traffic
<08
<01
<012
<03
38127
2065
Source: Trucking survey data and own calculations.Note: Assumptions are the following: savings are constant for 20 years for a 1,000 kilometer corridor, yearly trafficgrowth equal 3 percent, rehabilitation costs are US$500,000 per kilometer, road maintenance costs are excluded,and savings are discounted. We take into account only truck traffic.
Table 7.2 Unit Vehicle Operating Costs Savings from Road Improvement(US$ per vehicle-year)
Road condition West Africa Central Africa East Africa
Fair to good 3,163a 3,382 9,581Poor to good 13,498 18,038 44,393Source: Trucking survey data and own calculations.a. Data are based on weighing figures on the share of new and secondhand trucks from the trucking survey.
utilization, which results in higher than real maintenance costs; in fact,truck utilization in Africa is much lower than assumed in the simulations.
Table 7.3 gives an approximate computation of the impact of roadimprovements using figures obtained from HDM-4 simulations.
Table 7.4 presents indicative results of the cost-benefit analysis of par-tial road rehabilitation on a given corridor of 1,000 kilometers, depend-ing on changes in road condition.

The Impact of Road Conditions on Transport Costs 83
In West and Central Africa, because of low traffic, low truck utiliza-tion, and old fleets, even if rehabilitation is limited to 50 kilometers of aroad section in poor condition, the internal rate of return of the project isnot positive (taking into account only the vehicle operating costs savings).On the contrary, in East Africa, in almost all cases, road rehabilitation isjustified, mainly because of a relatively higher traffic volume (minimumtraffic along the northern corridor—up to Kampala—is at least 200 trucksper day).
Tables 7.2–7.4 demonstrate that because of the high cost of roadimprovement and the relatively old fleets, rehabilitation on hundreds ofkilometers of road would not be economically justified if traffic were lessthan 200 trucks per day. Below such traffic levels, rehabilitation probablyshould take place only when the road is in poor or very poor condition(and only if the benefit from VOCs reduction were passed on to the finaluser of transport services).
For roads with high traffic, such as routes along the northern corridor,a long-term investment plan probably should be developed in order tokeep the corridor in at least fair condition.
Notes
1. Low-quality tires eventually translate into higher costs per kilometer. Still,truckers in Africa need to take into account both initial and replacementcosts when making a decision on the purchase of tires.
2. It is worth noting that some maintenance costs could be inflated in realitybecause some drivers think of the costs of routine maintenance rather thanthe costs of infrequent major repairs. However, in general, maintenance costsremain marginal compared with fuel costs.

The trucking survey helps clarify perception and reality regarding truckers’and trucking companies’ views of the main factors influencing transportcosts and prices. This understanding is useful for formulating and imple-menting trucking market reforms.
Two factors often mentioned as explanatory variables for the level ofcosts and prices are trade imbalance and thickness of the market. Regardingtrade imbalance, the reality is that most companies are able to find returnfreight on the most important international corridors. Furthermore, coun-tries with the most unbalanced trade flows, like Uganda, are able to getlower transport prices than Central African countries such as Cameroonand Chad (table 8.1).
The thinness or thickness of the market is probably not a major factoreither, at least not compared to other factors such as the market compet-itiveness. The case of Zambia illustrates this point. Despite the fact thatZambia is a landlocked country and Cameroon a coastal country and thattotal traffic flows are lower in the former than in the latter, transportprices are much higher in Cameroon than in Zambia (table 8.2).
Data about trade imbalances and market thickness were discarded, orat least not taken seriously, by trucking companies and truckers surveyedfor this study. Operators had a consensus that the main factors influencing
C H A P T E R 8
The Trucking Market in Africa:Perceptions and Reality
85

86 Transport Prices and Costs in Africa
Table 8.1 Transport Prices and Trade Imbalance
Uganda Cameroon Chad
Export/import imbalance(percent) 10 45 30
Average transport price(in U.S. cents per tkm) 8 10 11
Source: Ports data for exports/imports imbalance.
their costs and prices were the price of fuel and the condition of roads.The actual impact of fuel prices and road conditions vary.
Fuel costs all over Africa are a legitimate concern inasmuch as theyaccount for approximately 50 percent of total VOCs, a share that contin-ues to grow with the surge in oil prices.
The impact of road conditions is less clear. Its perceived impact maybe explained by the fact that answers to the survey do not seem to be wellreasoned. For example, if road conditions were truly one of the main con-straints for this industry, trucking companies and truckers should also becomplaining about high vehicle maintenance and tire costs, because poorroad conditions are known to increase maintenance costs. However, exceptin East Africa and in Ghana, concerns about road conditions are notlinked with vehicle maintenance costs, which means that road conditionmay not be as critical as some truckers think (see table 8.3).
Moreover, truckers in Central Africa usually complain about the costsof corruption. The level of corruption is similar to that in West Africa, butit accounts for only a small fraction of operating costs. On the contrary, inEast Africa, the perceived constraints seem to be very consistent withresults of this study, probably because trucking professionalism is muchhigher than in Central and West Africa.
Equally interesting is that market regulation, freight allocation, anddelays at the border were not identified as major constraints by truckers andheads of trucking companies. It is probably easy to explain this omission.The interviewed companies and truckers are beneficiaries of the current
Table 8.2 Transport Prices and Trade Flows
Zambia Cameroon
Total traffic flows(in million metric tons per year) 4.1 6.1
Average transport price(in U.S. cents per tkm) 5–6 10
Source: Ports data for exports/imports imbalance.

The Trucking Market in Africa: Perceptions and Reality 87
Table 8.3 Main Perceived Constraints to the Trucking Industry(percent)
Region Country 1st obstacle 2nd obstacle 3rd obstacle
West Africa Burkina Faso Fuel cost,98
Missing road links, 88
Road condition,61
Ghana Fuel cost,33
High maintenancecost, 27
Vehicle cost,26
Central Africa Cameroon Fuel cost,46
Road condition,38
Corruption,32
Chad Road condition,76
Fuel cost,72
Corruption,70
East Africa Kenya Road condition,87
Fuel cost,54
High maintenance,47
Uganda Fuel cost,80
Road condition,78
High maintenance,62
Southern Africa Zambia Fuel cost,66
Road condition,36
Corruption,36
Source: Trucking survey data and own calculations.
system. They do not want more competition if some of them inevitablywould be expelled from the market. In this regard, a proxy could be themembership of companies or truckers in a trucking association. It seemsthat in regulated environment, as in West and Central Africa, companiesand truckers predominantly join a trucking association knowing thatwithout this membership getting a load would be much more difficult.However, in a deregulated environment, as in East Africa, a membershipis less important since sales depend on the individual professionalism of acompany and not on being part of the existing system of cartels or truck-ers’ association (see table 8.4).
Table 8.4 Trucking Companies and Truckers Belonging to an Association(percent)
Country All Trucking companies Truckers
Burkina Faso 66 88 58Ghana 67 53 71Cameroon 36 76 25Chad 76 86 74Kenya 30 71 15Uganda 39 65 32Zambia 11 37 2Source: Trucking survey data and own calculations.


The formulation of policy options requires policy makers to distinguishbetween a regulated and a more mature, competitive, and liberalizedtransport market:
• In a competitive environment with high traffic volumes, measures toimprove road conditions and limit fuel prices are likely to yield signif-icant results. Measures to reduce delays at borders or weighbridgeswould also help increase truck utilization.
• In a regulated environment, as in West and Central Africa, regulato-ry constraints (formal and informal) should be dismantled as theyare the root cause of limited competition, poor service, and hightransport prices.
This chapter analyzes policy options for West and Central Africa togetherbecause of the subregions’ similarity. East and South Africa are analyzedseparately because although their transport markets have similarities,there are differences in the impact of specific policies. In presenting poli-cies, this chapter also includes feedback from stakeholders’ workshopsconducted in the four subregions. All four workshops were attended by abalanced representation of all major stakeholders involved with the roadfreight market and operations.
C H A P T E R 9
Assessment of Policy Options
89

90 Transport Prices and Costs in Africa
Table 9.1 Expected Impact of Policies in a Regulated Environment (percent)
MeasuresDecrease in
transport costsIncreasein sales
Decrease intransport price
Rehabilitation of corridor from fair to good
–5 . . +/–0
20% reduction of border-crossing time
–1 +2/+3 +/–0
20% reduction of fuel price –9 . . +/–020% reduction of
informal payment–1 . . +/–0
Source: Trucking survey data and own calculations.Note: For the simulation, VOC data from the Tema/Accra–Ouagadougou corridor were used. . . Negligible (these items are unlikely to induce more turnarounds and then more sales).
Policies for West and Central Africa
On the basis of the trucking survey data, this study assessed the possibleimpact of various transport policies and facilitation measures. The intentionwas to determine which policies or measures would most reduce transportcosts and prices. Table 9.1 presents the expected approximate impact of thefollowing measures: (i) road rehabilitation of the corridor from fair to good,(ii) 20 percent reduction in border delays, (iii) 20 percent reduction in fuelprices, and (iv) 20 percent reduction in informal payments. The expectedimpact varies among companies. The cost for carrying out the measuresvaries widely. Road rehabilitation, for example, is capital intensive andrequires government funding, whereas a reduction in informal paymentscan be achieved at minimal or no cost to the government.
On transport costs, the most effective measures are likely to be adecrease in fuel costs, further road rehabilitation, and, to a lesser extent,reduction of border-crossing delays. The slight decrease in transport coststhat improving the corridor would yield is an indicator that, irrespectiveof the impact of road improvement on prices, rehabilitation of the cor-ridor may not be economically justified, either because the current roadcondition is good enough or the traffic level does not justify improve-ment, or both. On the contrary, despite the perceived effects of informalpayments, reducing them by 20 percent would have a marginal impacton transport costs.1
The crucial point is that such measures have no impact on reducingtransport prices. Indeed, without competition, truckers and trucking com-panies are likely to capture the reduction in costs and translate them intohigher profits rather than lower prices. Consequently, where cartels still

Assessment of Policy Options 91
prevail as in West and Central Africa, they should be dismantled becausethey prevent measures that would help the trucking industry reducetransport costs, needless to say transport prices.
Truckers in West and Central Africa may argue that currently there iscompetition, sometimes strong, in the transport market. The trucking sur-vey shows, however, that whenever competition does exist, it is not basedon price and quality of service, but on the capacity to circumvent therules and capture loads with little or no negotiation on prices or servicesquality. Thus, creating a true, strong competitive environment is essentialto reducing prices.
Deregulating the trucking industry in West and Central Africa.Breaking the regulatory status quo in many countries is difficult due to acoalition of interests opposing change. For example, truckers have strongleverage with high-level authorities who can block trade. This is the casebecause, in Africa, the trucking corridors under review often are the main,and sometimes the only, transport mode for international and domestictrade. Furthermore, governance problems occur in the trucking industrybecause some high-level authorities own or indirectly control trucks ortrucking companies. These authorities benefit from the status quo andmarket-sharing schemes.
Deregulating the trucking industry in West and Central Africa is less atechnical than a political and social issue. The main concern is the poten-tial large decrease in the number of truckers. Participants in the stake-holders’ workshops in Ouagadougou and Bangui strongly emphasized theimportance of mitigating the social impact that would result from a moreefficient but reduced trucking industry. The coalition of interests in mostWest and Central African countries might not resist reforms as long ascompensation schemes are introduced with the purpose of paying, atleast partly, for the social costs of such reforms.
Fiscal incentives could be put in place to obtain the support of stake-holders for market deregulation. Such incentives should aim at encourag-ing a maximum utilization of trucks. This is not the case today becausetruckers pay the brunt of taxes through fuel. This high fuel tax favorsunderused trucks, which pay tax only when moving.
One possible reform is to convert the majority of tax revenue col-lected through fuel (variable costs) into truck ownership and registrationtaxes (fixed costs). For truckers, this change would be a major tax increasefor operators who put less mileage on their trucks, but a significant sav-ing for those with higher mileage—higher-efficiency truckers. The taxchange would be fiscally neutral above a given level of truck utilization

92 Transport Prices and Costs in Africa
(100,000 kilometers per year, for instance). Such a change in the taxationstructure of the trucking activities would favor good performers and thusencourage a major structural change.
A queuing system would then be unable to protect low performerswhile encouraging all others to bypass it to access loads. Finally, the tourde rôle would disappear. Such a reform would be relatively politically easy(as all other road users would benefit from lower fuel taxes) but complexto design (as it would need a thorough review of a major component ofthe fiscal system to ensure good balance between revenue collection andtransport policy targets). It might also be difficult to implement as thecollection of high license fees would be a potential source of corruption.
Another possible and simpler fiscal reform would be to tax imports oftrucks, not as a proportion of their purchase costs, but as a lump sum. Ifhigh enough, this tax would favor the purchase of more expensive, morereliable trucks. This would in turn increase the fixed costs share in totalcosts and therefore encourage higher use of the truck fleet. Such a reformmight also result in a net increase in fiscal revenues for governments. Inthe current situation, new, expensive trucks are not imported at all, andtherefore the import tax revenue coming from new trucks is almost zero.In addition, taxes on old, imported trucks do not generate much revenue.
Even in a case where balancing fiscal revenue is not an issue, countries’policy on importing old vehicles should be reviewed in light of vehiclesafety and extra pollution emission from aged vehicles. Some measurescould be put in place to encourage import of “relatively young” second-hand trucks or to penalize the import of older ones. In such cases, importtariffs could be used not as a fiscal revenue generation target, but as a toolto control imports, as long as enforcement of such measures from customsadministrations seems possible. For example, a country could set a target forimport of secondhand trucks no older than eight years of age. It either couldput a total ban on import of trucks more than eight years old, or it couldprogressively levy import tariffs for those who brought in trucks older thaneight years. In sum, the study recommends a good review of secondhandtruck import policy in Africa as it has implications for transport costs, inaddition to road safety and the climate change agenda.
Stakeholders’ workshops feedback. Workshops conducted for West andCentral Africa2 focused on the study’s conclusion that without a liberaliza-tion of the transport market, measures reducing transport costs would notlower transport prices. The stakeholders, notably the trucking companiesand owner-operators, accepted the findings of the study but were con-cerned that appropriate compensation schemes should be developed to
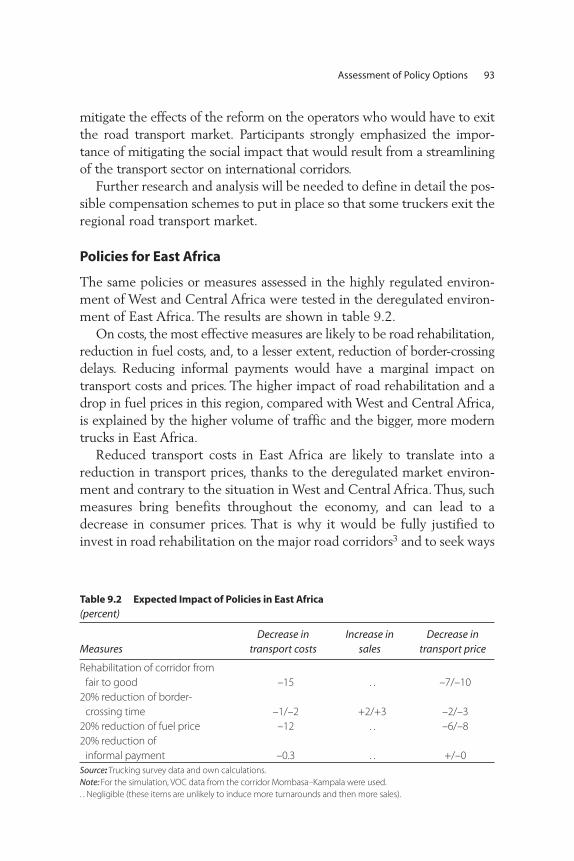
Assessment of Policy Options 93
mitigate the effects of the reform on the operators who would have to exitthe road transport market. Participants strongly emphasized the impor-tance of mitigating the social impact that would result from a streamliningof the transport sector on international corridors.
Further research and analysis will be needed to define in detail the pos-sible compensation schemes to put in place so that some truckers exit theregional road transport market.
Policies for East Africa
The same policies or measures assessed in the highly regulated environ-ment of West and Central Africa were tested in the deregulated environ-ment of East Africa. The results are shown in table 9.2.
On costs, the most effective measures are likely to be road rehabilitation,reduction in fuel costs, and, to a lesser extent, reduction of border-crossingdelays. Reducing informal payments would have a marginal impact ontransport costs and prices. The higher impact of road rehabilitation and adrop in fuel prices in this region, compared with West and Central Africa,is explained by the higher volume of traffic and the bigger, more moderntrucks in East Africa.
Reduced transport costs in East Africa are likely to translate into areduction in transport prices, thanks to the deregulated market environ-ment and contrary to the situation in West and Central Africa. Thus, suchmeasures bring benefits throughout the economy, and can lead to adecrease in consumer prices. That is why it would be fully justified toinvest in road rehabilitation on the major road corridors3 and to seek ways
Table 9.2 Expected Impact of Policies in East Africa (percent)
MeasuresDecrease in
transport costsIncrease in
salesDecrease in
transport price
Rehabilitation of corridor from fair to good –15 . . –7/–10
20% reduction of border-crossing time –1/–2 +2/+3 –2/–3
20% reduction of fuel price –12 . . –6/–820% reduction of
informal payment –0.3 . . +/–0Source: Trucking survey data and own calculations.Note: For the simulation, VOC data from the corridor Mombasa–Kampala were used.. . Negligible (these items are unlikely to induce more turnarounds and then more sales).
94 Transport Prices and Costs in Africa
to reduce fuel prices. Measures to reduce border delays should also be apriority and would help decrease transport prices.
Public authorities should scrutinize the efficiency of weighbridgeoperations in order to limit delays. Finally, transporters should be encour-aged to use trucks with lower operating costs.
Stakeholders’ workshop feedback. The stakeholders agreed with thefindings of the study and proposed specific additions on a country basis:
• Kenya/Uganda• Implement the one-stop border post in Malaba (a key point in the
economics of trucking in East Africa) while taking care of the infra-structure needs and minimized procurement. An extension of the sta-tus of “authorized economic operators” to several companies shouldlead to a reduction in waiting time at the Uganda–Kenya border.
• Introduce along the northern corridor simplified documentation requirements as stated in the northern corridor Transport and Tran-sit Agreement in order to reduce delays.
• Establish a long-term investment plan to ensure that the Mom-basa–Kampala corridor remains at least in fair condition in the medi-um and long term.
• Kenya• Review and probably lift the customs regulation that prohibits
trucks from taking backloads in Kenya as this rule severely affectstransport service costs along the northern corridor.
• Uganda• Review taxes on fuel and study the possibility of introducing a road
fund levy within the limit of the existing level of taxation on fuel.
Policies for Southern Africa
The same measures assessed in the highly regulated environment of Westand Central Africa were tested in the deregulated environment of SouthernAfrica. The results are shown in table 9.3.
The most effective measures are likely to be a reduction in fuel costs,increased road rehabilitation, and a reduction of border-crossing delays.Reducing informal payments would have a marginal impact on trans-port costs and prices. The higher impact of road rehabilitation and fuelprice changes in this region, compared with West and Central Africa, isexplained by the higher volumes of traffic and the larger and moremodern fleet.

Assessment of Policy Options 95
The reduction in transport costs in Southern Africa, thanks to itsderegulated market environment and contrary to the situation in West andCentral Africa, is likely to translate into a reduction in transport prices,especially in the case of lower fuel costs or smaller border-crossing delays.
Measures to reduce border delays should be a top priority in SouthernAfrica as they are much higher than in East Africa (the crossings at BeitBridge and Chirundu take a minimum of four days, which is at least twiceas long as the Malaba crossing in East Africa). Reducing such delays, tak-ing into account the high fixed cost of the Southern African truckingoperators, would significantly help improve utilization of the fleet andstaff and would lower transport prices.
Stakeholders’ workshop feedback. As in East Africa, stakeholdersagreed with the findings of the study and proposed specific additions ona country basis:
• North-South Corridor (South Africa/Zambia/Zimbabwe)• Implement the one-stop border-post principle (especially for Beit
Bridge and Chirundu border crossings) along the north-southcorridor.
• Prepare and sign as soon as possible, taking into account the strongpolitical will to facilitate trade along the corridor and the work un-dertaken by a consultant, a trilateral agreement to create a Corri-dor Management Institution along the corridor. This institutionshould be financially sustainable and based on a cost recovery prin-ciple whereby road users pay for the operation costs of the corridormanagement facilities.
Table 9.3 Expected Impact of Policies in Southern Africa (percent)
MeasuresDecrease in
transport costsIncrease in
salesDecrease in
transport price
Rehabilitation of corridor from fair to good –3/5 . . –2/–3
20% reduction of border-crossing time –3/4 +18 –10/–15
20% reduction of fuel price –10 . . –5/–720% reduction of
informal payment –1 . . +/–0Source: Trucking survey data and own calculations.Note: For the simulation, VOC data from the north-south corridor were used (using Zambia operators’ data).. . Negligible (these items are unlikely to induce more turnarounds and then more sales).

96 Transport Prices and Costs in Africa
• Review the implementation of bilateral transport agreements,road-user charges guidelines, and levies and taxes paid at bordercrossings.
• Support a strong technical link between donors, authorities, and theSouthern African Development Community (SADC) Secretariat(through the trade and transport panel of experts).
• Zambia • Review taxes on fuel.
• South Africa • Review procedures at the main international border crossings.
Notes
1. However, if roadblocks induce significant transport unpredictability, nontrans-port logistics costs may increase exponentially and have a major impact ontransport and logistics. See Arvis et al. (2007) for more details.
2. Workshops were carried out in Bangui for Central Africa in January 2008and in Ouagadougou for West Africa in February 2008.
3. As Oyer (2007) points out, some sections of the northern corridor roadcould be realigned to shorten the distance traveled and reduce repeated gearchanges. This would lower VOCs by reducing fuel and tire consumption.

The study findings suggest areas where countries should consider review-ing various approaches to economic analysis for transport investment, aswell as data collection in areas related to transport and trucking. In partic-ular, countries should work to improve the quality of economic analysis ofroad investments, the effectiveness of fiscal policies, and the monitoring ofthe road freight market.
Finance Regular Studies of Transport Prices and Costs Determinants
Data collection on the trucking fleet, transport prices, and costs is largelyinadequate in most countries in Sub-Saharan Africa. For instance, data onvehicle registration have to be used with caution as many vehicles out ofservice have not been removed from the database. Vehicle registrationdata need to be systematically updated. Hard data on overloading prac-tices are not available for most corridors in Africa despite the fact thatmajor rehabilitation works of road infrastructure have been carried out orare under way and overloading practices should have been monitored andcontrolled in parallel to the new investment.
C H A P T E R 1 0
Implications for Economic and Fiscal Analysis and forData Collection
97

98 Transport Prices and Costs in Africa
A good knowledge of market structure, regulation, and practices iscritical to identify measures likely to bring the most benefits to the endusers of transport services.
Improve the Economic Analysis of Road Projects
Better identification of interventions that lower the price end users payfor trucking services is crucial. In some regions, interventions targeted atincreasing competition rather than improving paved roads are likely to bethe most cost effective.
Economic analysis is the key tool for decisions on road investment andmaintenance strategies. In most African countries and elsewhere in thedeveloping world, investment in road projects and the design of mainte-nance strategies is done using the HDM-4 model, which requires data spe-cific to the country of the analysis, including statistics on the country’strucking industry. However, such data are often unavailable, or only a smallpart of the data required is actually collected through the country’s statis-tical systems. In the absence of country-specific data, analysts make use ofdata from other countries that they hope reflects the condition in thecountry of analysis. However, such data may be significantly different, thusaffecting the results obtained with the HDM-4.
One problem with inputting trucking data is that the HDM-4 modelassumes that truckers buy new trucks when they renew their fleets. TheHDM-4 analysis should be improved knowing that in many African coun-tries, truckers, especially those who operate on low-traffic roads, usuallybuy aged, secondhand trucks, at prices substantially below new trucks.Those low-priced vehicles are likely to benefit less from road improve-ments, which reduce the vehicle maintenance benefits that are part of themodel. The HDM-4 model cannot deal with large fleets of secondhandvehicles, which are, however, the most common in Africa.
Although this study focused only on international corridors, it can sug-gest more broadly that for national corridors and local roads a return to eco-nomic analysis of road investments should be reviewed to better understandthe impact of roads, especially rural roads,1 on accessibility. This wouldinclude a better assessment of roads’ development impact, both social andeconomic, and a better way to quantify the benefits of savings in travel time.The trucking survey and other literature suggest that such a return couldlead to a better way of assessing the benefits of road improvements.
Numerous studies demonstrate that rural roads substantially promotesocial and economic development; the question is how best to assess the

Implications for Economic and Fiscal Analysis and for Data Collection 99
Table 10.1 Transport Costs for Cocoa Beans from the Field in Ghana to Europe
Operation
Transporteddistance
(km)
Price(US$
per ton)
Share oftotal
transportcosts(%)
Price (U.S.cents/
ton-km)
Transporttime ofone ton(days)
Rural transport
Cocoa field tocollectionpoint 9 30 25 333.3 25.0
Trucking transport
From collectionpoint to port 300 27 23 3.0 0.3
Handling Reloading atdepot 8 7
Terminal handling
Handling at the port 10 8
Ocean shipping 7,435 43 37 0.7 0.9
Total 7,744 118 100Source: Pedersen (2001).
benefits and carry out economic analysis of rural road investments. This isespecially important for low-volume rural roads, where improvement sig-nificantly increases mobility and creates new opportunities for develop-ment and access to markets and social services.
In addition, the impact of improved, low-cost rural roads in reducingtransport time is not adequately captured in current economic decisionmodels such as the Roads Economic Decision model (RED, a simplerversion of the HDM-4). A study (Pedersen 2001) shows that 4 percentof total transport distance (rural and local trucking transport) contributesto almost 50 percent of total transport costs from Ghana to Europe.Rural transport is almost 500 times more expensive than maritime trans-port in U.S. dollars per ton-kilometer. The same study shows that reduc-ing rural transport time by 50 percent would reduce total transport costsby almost 15 percent (table 10.1). Because investments on the maininternational corridors remain the major share of transport investmentsin Sub-Saharan Africa, this survey, combined with other surveys of invest-ments on rural roads, could prove a milestone for road investment policyin the region.
It is possible, subject to more detailed study, that revisions of the roadeconomic analysis along the lines suggested above may lead to important

100 Transport Prices and Costs in Africa
changes in the composition of the road investment portfolio, giving moreimportance to secondary networks and rural access. Indeed, solving accessproblems in Africa remains vital for supporting both pro-growth and pro-poor policies. Such problems are directly linked to transport infrastruc-ture and involve the allocation of significant financial resources to themaintenance and rehabilitation of existing national roads (secondary andtertiary roads) and to the expansion and rehabilitation of the secondarynetwork and rural networks.
Assess the Impact of Fiscal Policies on Transport Services
Fiscal policies interact with transport services in several ways, but two areespecially important: (i) fuel taxes and (ii) tariffs on the importation ofvehicles, notably trucks. These policies are important because they signif-icantly affect transport prices and the efficiency of the trucking industry.
Fuel taxes in practically all countries are the instrument of choice forrecovering road maintenance costs from road users while generating rev-enue. As such, fuel taxes are both a user charge and a general tax. Theimpact of fuel taxes on transport costs and prices in Africa is substantial.On this continent, fuel costs amount to at least 40 percent of total VOCs,of which taxes amount to at least 50 percent. This means that at least 20 percent (and up to 40 percent) of VOCs are the result of fiscal policy.Because fuel taxes generally create less economic distortion than othertaxes and are easy and inexpensive to collect, it is unlikely that govern-ments will consider lowering fuel taxes and losing revenue.
However, in some countries, under some conditions, there may be acase for at least reviewing the level of the fuel tax. This would apply espe-cially to some landlocked countries where the fuel tax is already highenough to recover road maintenance costs and generate additional rev-enues as a general tax. In such countries, where transport distances andcrossing of the coastal country are significant trade barriers, the impact offuel taxes on transport prices may be another critical factor hamperingtrade. Thus, there is a trade-off, usually neglected, between fiscal policiesand truck competitiveness that needs to be carefully assessed. Furthermore,fuel prices at the pump in the landlocked country are significantly higherthan those in the coastal country. In this case, creating a level playing fieldfor the competition between the trucking industries of the landlocked andthe coastal country would require lowering the price of fuel at the pumpin the landlocked country. Zambia and Uganda are good examples of thissituation. In Zambia, a 15 percent fuel levy comprises 10 percent of total

Implications for Economic and Fiscal Analysis and for Data Collection 101
VOCs. Therefore, a drastic decrease of the fuel levy in Zambia could leadto a reduction of VOCs by no less than 4 percent.
Tariffs on truck imports are another dimension of the overlap betweenfiscal policies and transport. Such a tariff, depending on how it is set andstructured, may have a major influence on the efficiency of the truckingindustry and on the extent that road improvement programs benefit thetrucking industry. There are two aspects to consider: the relative import taxbetween new and old trucks and the level of the tax. As this study hasshown, the trucking fleet in most of Africa is old and inefficient. In mostcountries, the tariff on truck imports is a proportion of the truck price, andtherefore lower for used, cheap trucks. Old trucks not only are fuel ineffi-cient, but also create concerns on road safety hazard and pollution.Because of their inefficiency, they usually put on less annual mileage andthus do not benefit as much from road improvement as do newer trucks.Various alternative tariff policies could influence the truckers’ decisionregarding new versus old trucks. One policy would be a higher tariff (asa percentage of price) on secondhand trucks, relative to the age of trucks.Another could be a tariff set as a fixed lump sum, independent of thetruck price, which would have the effect of favoring the import of newertrucks (as long as the trucking industry is deregulated in order to give anincentive to the most efficient companies to invest in new trucks).
Note
1. Incorporating social benefits into HDM-4 analysis remains a challenge.Furthermore, for low-volume roads (fewer than 50 vehicles per day),HDM-4 is not considered appropriate, and the cost-effectiveness approachis recommended.


Key Findings and Conclusions
This study measured the level of costs and prices and disaggregated theminto three tiers: (i) VOCs, (ii) overall transport costs, and (iii) the transportprice paid by end users. The study identified factors that cause high trans-port prices in Sub-Saharan Africa, analyzed the differences in the cost andprice structure among the four subregions, and produced recommenda-tions to lower transport prices. The study’s main findings and conclusionsare summarized in this chapter.
Key Findings Our key findings are as follows:
• There is a substantial disconnect between transport costs and prices innumerous African countries. For example, transport costs in Africa arenot abnormally high, whereas transport prices are high along somecorridors, indicating a strong seller’s market.
• Despite many poor efficiency factors (low yearly vehicle utilization rate,aging vehicle fleet, unbalanced trade . . .), trucking companies in Africacan still charge high prices and have relatively large profit margins alongsome corridors.
C H A P T E R 1 1
Conclusions, Recommendations,and the Role of InternationalDevelopment Agencies
103

104 Transport Prices and Costs in Africa
• Market regulation is an eminent price determinant. It hinders efficiencyimprovements in the trucking industry and stifles competitiveness,leading to high transport prices in Africa.
• The poor condition of road infrastructure might not necessarily be acritical factor for high transport costs.
• Age of the truck fleet and low utilization of vehicles seem to be signif-icant determinants for transport costs, especially in West and CentralAfrica.
ConclusionsThe trucking industry in West and Central Africa is characterized by car-tels offering high prices and low service quality. In East Africa, the truck-ing environment is more competitive and the market more mature. Themain transport corridors in Southern Africa are the most advanced interms of efficiency, competitive prices, and service quality.
In West and Central Africa, there is a strong disconnect betweentransport costs and prices. Transport costs are not abnormally high, buttransport prices are, suggesting the existence of a strong seller’s market.In these subregions, despite poor efficiency in the operations, reflectedby low truck utilization rates and aging vehicle fleets, trucking operatorscan charge high prices and have relatively large profit margins. This ispossible because the cartels control the supply of transport services.Although in theory there is open entry to the road freight market, inpractice the cartels make it almost impossible for new entrants to gainaccess to freight. It is possible to identify measures that will producesome reduction of transport costs, such as lowering fuel prices, butbecause of the self-regulated trucking market, reducing transport costsdoes not lower prices.
In East and Southern Africa, measures to improve road conditions andreduce fuel prices or delays at border posts help lower transport costs, butthe two regions differ as to the level of impact of policy measures oncosts, and more so on prices.
Poor condition of the road infrastructure may not be the most criticalfactor behind transport prices. This is a major finding since much roadinvestment in Sub-Saharan Africa has been predicated on the assumptionsthat better roads lower transport costs and that truckers’ cost savings arepassed on to consumers as lower transport prices. The study finds theseassumptions are far from accurate where the market is strongly regulatedor where a cartel captures the benefits of road improvement.

Conclusions, Recommendations, and the Role of International Development Agencies 105
The trucking industry in some landlocked countries of East Africa isplaced at a competitive disadvantage because fuel prices at the pump inneighboring coastal countries are not as high, allowing their truckingcompanies to benefit from lower operating costs.
More broadly, the study has identified the need to review theapproaches to economic analysis of road projects, the impact of taxationpolicies on the transport market, and the need to regularly update data onthe trucking industry.
Recommendations
The study’s key recommendation is to initiate institutional changes. Rent-seeking behavior and governance of the trucking industry are at the coreof the issues faced by many low-income African countries. Withoutincreased competition and successfully liberalizing trucking services whereregulation remains strong, transport prices will remain high, service qual-ity will not improve, and road users will not reap all the benefits of costlyinvestments in infrastructure rehabilitation.
Deregulating the trucking industry in West and Central Africa wouldbe the first critical undertaking toward the positive institution and policyadjustment. However, there would also be many negative impacts fromthis major policy adjustment. A serious mitigating plan should be in placeto minimize the effects of introducing competition, including a reductionin the number of trucking operators. Deregulation should also facilitatenew entrants’ access to freight. A first step would be the abolition of car-tels. A next step could be changes in the tax structure to reward thosewho operate more modern vehicles and utilize them more intensively.
In East Africa, improvement of some critical road sections in the cor-ridor where the investment is economically justified will lead to lowertransport costs and transport prices. The same would happen in theSouthern Africa road network, although the corridor road considered inthis study is in good condition and thus would receive limited benefitfrom improvement. On the other hand, creation of one-stop border postswould help reduce delays in border crossing and would lead to significantreduction of transport prices, especially in Southern Africa.
In East Africa, there may be a case for lowering fuel taxes in landlockedcountries where the price of fuel at the pump is high relative to the pumpprice in neighboring coastal countries, thus handicapping the domestictrucking operators. A potential review of fuel taxes has to account for the

106 Transport Prices and Costs in Africa
fiscal impact and the need to ensure that fuel taxes actually are spent onroad maintenance.
Studies should be carried out at the country level to assess (i) the spe-cific situation of the trucking industry, (ii) the countries’ taxation policyaffecting fuel, and (iii) vehicle imports and their implications for trans-port costs and prices. Studies are also needed to look into ways and meansto operationalize the findings presented in this report.
The Role of Development Partners
International development agencies, including the World Bank, should beencouraged to adapt their strategies in support of trade and transport onAfrica’s main international transport corridors in a way that maximizesthe effect of their interventions. Transport services have been neglectedfor years on the assumption that reduction in VOCs would automaticallylower transport prices. A better identification of interventions that lowerthe price of transport is essential so that they benefit the economy at largerather than a group of transport providers.
Where the appropriate intervention is to support the deregulation ofthe transport market, development agencies should provide technicalassistance and help fund any compensation schemes required to mitigatethe social effects of deregulation. Without coordinated efforts from thedonor community, changes in regulation are unlikely to be implemented.Successful institutional change such as trucking deregulation requirespatience, policy dialogue, and support from the donor community.
This study has identified the need to review the economic analysis ofroad projects and to assess the impact of fiscal policies on the transportmarket. It has also identified the need for countries to regularly updatetrucking data. The development agencies are well positioned to supportthis work by financing at the country level the review of relevant fiscalpolicies and the data collection, as well as refining the current methodsof economic analysis of projects so as to facilitate a more effectiveinvestment decision.

107
Map 1. African Landlocked Countries


Adoléhoumé, A. 2007. “Analyse des Facteurs de Coûts et Prix de Transport enAfrique de l’Ouest: Cas du Niger.” Unpublished paper, World Bank,Washington, DC.
Amjadi, A., and A. J. Yeats. 1995. “Have Transport Costs Contributed to theRelative Decline of Sub-Saharan African Exports?” Policy Research WorkingPaper No. 1559, World Bank, Washington, DC.
Arvis, J. F., G. Raballand, and J. F. Marteau. 2007. “The Cost of Being Landlocked:Logistics Costs and Supply Chain Reliability.” Policy Research Working PaperNo. 4258, World Bank, Washington, DC.
Chasomeris, M. 2005. “South Africa’s Maritime Policy and Transformation of theShipping Industry.” Presentation at the 2005 Economic Society of SouthAfrica. http://www.essa.org.za/download/papers2005.htm.
Comité National Routier (CNR). 2005. “Le Transport Routier de Marchandisesen République Tchèque.” Les Cahiers de l’Observatoire 222.
———. 2008. “Transport Routier de Marchandises et Coûts de Personnel deConduite aux Pays-Bas.” http://www.cnr.fr/e-docs/00/00/01/EB/document_etudes_cnr.phtml.
Council for Scientific and Industrial Research (CSIR), 2006. Annual State ofLogistics Survey for South Africa. http://www.csir.co.za/Built_environment/pdfs/SOL2006.pdf.
References
109

110 References
Darbéra, R. 1998. “Measuring the Benefits from Road Haulage Deregulation:Example of Some French Results.” Contribution to proceedings of the WorldConference on Transport Research, Antwerp.
Dutz, M. 2005. “Road Freight Logistics, Competition and Innovation: DownstreamBenefits and Policy Implications.” Policy Research Working Paper No. 3768,World Bank, Washington, DC.
Dutz, M., A. Hayri, and P. Ibarra. 2000. “Regulatory Reform, Competition andInnovation: A Case Study of the Mexican Road Freight Industry.” PolicyResearch Working Paper No. 2318, World Bank, Washington, DC.
Dutz, M., J. Ordover, and R. Willig. 2000. “Entrepreneurship, Access Policy andEconomic Development: Lessons from Industrial Organization.” EuropeanEconomic Review 44: 739–47.
European Commission. 2005. The Application of Competition Rules to Liner Shipping.Final report, Brussels, European Commission.
Federation of East and Southern African Road Transport Associations (FESARTA).2007. “Chirundu One-Stop Border-Post Initiative Monitoring Project.”Unpublished paper.
Fink, C., A. Mattoo, and I. C. Neagu. 2002. “Trade in International MaritimeServices: How Much Does Policy Matter?” World Bank Economic Review16 (1): 81–108.
Gesellschaft für Technische Zusammenarbeit (GTZ). 2007. “International FuelPrices 2007.” http://www.gtz.de/fuelprices.
Harding, I., G. Palsson, and G. Raballand. 2007. “Port and Maritime TransportChallenges in West and Central Africa.” Sub-Saharan Africa Transport PolicyProgram SSATP Working Paper No. 84, World Bank, Washington, DC.
Limao, N., and A. J. Venables. 2001. “Infrastructure, Geographical Disadvantageand Transport Costs.” World Bank Economic Review 15 (3): 451–79.
Londoño-Kent, P. 2007. “Road Freight Transport Industry in Low and Middle-Income Countries.” Draft, World Bank, Washington, DC.
MacKellar, L., A. Wörgötter, and J. Wörz. 2002. “Economic Growth of LandlockedCountries.” In Ökonomie in Theorie und Praxis, ed. G. Chaloupek, A. Guger,E. Nowotny, and G. Schwödiauer, 213–26. Berlin: Springer.
Mthembu-Salter, G. 2007. “The Cost of Nontariff Barriers to Business along theNorth-South Corridor (South Africa–Zimbabwe) via Beit Bridge: A PreliminaryStudy and Working Paper.” South African Institute of International Affairs(SAIIA), Braamfontein, South Africa. http://saiia.org.za/images/upload/dttp_pap_mthembu-salter_ntb_20070827.pdf.
Mwase, N. 2003. “The Liberalisation, De-regulation and Privatisation of theTransport Sector in Sub-Saharan Africa: Experiences, Challenges andOpportunities.” Journal of African Economies 12 (AERC Supplement 2): 153–92.

References 111
Oyer, S. 2007. “Freight Rates Determinants along the Northern Corridor Road.”MSc Thesis, Nairobi UNES.
Pedersen, P. O. 2001. “Freight Transport under Globalization and Its Impact onAfrica.” Journal of Transport Geography 9: 85–99.
Raballand, G., C. Kunaka, and B. Giersing. 2007. “Effects of Regional Liberalizationand Harmonization in Road Transport: A Focus on Zambia number andLessons for Landlocked Countries.” Policy Research Working Paper, WorldBank, Washington, DC.
Rizet, C., and H. Gwet. 1998. “Transport de Marchandises: Une ComparaisonInternationale des Prix du Camionnage—Afrique, Asie du Sud Est, AmériqueCentrale.” Recherche–Transports–Sécurités 60: 68–88.
Rizet, C., and J. Hine. 1993. “A Comparison of the Costs and Productivity ofRoad Freight Transport in Africa and Pakistan.” Transport Reviews 13(2).
Snow, T., M. Faye, J. McArthur, and J. Sachs. 2003. “Country Case Studies on theChallenges Facing Landlocked Developing Countries.” Background paperfor HDR 2003. http://hdr.undp.org/en/reports/global/hdr2003/papers/landlocked_countries_2003.pdf.
Souley, H. 2001. “Dérèglementation du Transport Routier de Marchandises auNiger et Intégration Sous-Régionale.” PhD Thesis, INRETS, Paris.
Tera International. 2005. “Malawi Transport Cost Study.” Washington, DC.
United Nations Conference on Trade and Development (UNCTAD). 1975. Codeof Conduct for Liner Conferences. http://www.unctad.org/ttl/legal.
World Bank. 1994. Bank Lending for African Transport Corridors: An OEDReview. Washington, DC: World Bank.
———. 2004. Reducing the Economic Distance to Market. Washington, DC: WorldBank.
———. 2005. East Africa Trade and Transport Facilitation Project. Washington,DC: World Bank.
———. 2006. Review of Selected Railway Concessions in Sub-Saharan Africa.Washington, DC: World Bank.
———. 2007a. Agriculture in Sub-Saharan Africa. An Independent EvaluationGroup Review of World Bank Assistance. Washington, DC: World Bank.
———. 2007b. “Trade and Transport Facilitation in South Asia.” Unpublishedpaper, World Bank, Washington, DC.


The World Bank has supported transport corridors, in Africa and else-where, through two types of activities: (i) investment projects and analyt-ical studies of corridors in individual countries, and (ii) research on tradeand transport corridors.
World Bank support for transport corridors in Africa dates back to the1970s. However, support during the early years was almost exclusivelyfocused on improving infrastructure. A review of the African corridorprojects by the World Bank’s Independent Evaluation Group1 found thatmost projects were limited in coverage to a single transport mode oragency and centered upon the development or rehabilitation of physicalfacilities. The projects were meant primarily to meet the infrastructureneeds of the countries of project location. Project achievements withrespect to corridor transit traffic proved to be minimal, mainly because ofthe projects’ narrow focus on a single transport mode (therefore ignoringconnectivity and operations; for example, between ports and roads), andbecause of the lack of emphasis on institutional reforms. This is not sur-prising and was actually necessary at the early stage of Africa develop-ment back in the 1970s–90s, when focus had to be at the national levelof stability and accessibility. However, once the national level accesses andconnections are basically established, the investment strategy should be
A N N E X 1
Bank Support for AfricaTransport Corridors
113

114 Transport Prices and Costs in Africa
expanded to include a subregional and regional dimension. A key conclu-sion of the report was that the World Bank needs to step up its supportfor corridor projects and studies and that prerequisites for future opera-tions should be intercountry agreements on corridor operations, includingaccess, maintenance, and streamlining and harmonization of regulation.
One of the most comprehensive World Bank operations in recent yearshas focused on trade and facilitation in East Africa. Currently the Bankhas two investment projects of this type in the East and Central Africacorridor: one in the Western Africa corridor that recently was approved,and another project in the corridor between Abidjan and Lagos that iscurrently under preparation. Since 1995, the World Bank has supportedseveral rail concessions in Africa, including two binational concessions(Senegal–Mali and Burkina–Côte d’Ivoire). An important lesson fromthese projects is that the impact of rail concession is more on the reliabil-ity of service and stronger competition with road operators than on anactual decrease of transport costs.
Note
1. World Bank (1994). This report covered 42 completed projects in 14 countries,including eight landlocked countries (Rwanda, Burundi, Malawi, Zambia,Central African Republic, Burkina Faso, and Mali) and six littoral countries(Kenya, Tanzania, Cameroon, Benin, Côte d’Ivoire, and Senegal).

115
1. Data Selection
The final database is composed by 192 observations along 11 routesinclud ing 10 international routes in 7 countries: Burkina Faso, Ghana,Cameroon, Chad, Uganda, Kenya, and Zambia. The selected corridorswere chosen in terms of data reliability, route importance in terms oftrade volume, and significant amount of observations available. Outliershave been excluded from the database.1 In data selection few assump-tions (mentioned below) were taken while preserving the originalanswers from the survey.
2. Variable Description
2.a. Transport Prices
2.a.i. Inputs
Distance: Distance measured in kilometers. Source: Distance charts avail-able in the countries.
Payload utilization: Yearly mileage on empty haul for the route i / Yearlymileage (i = 1;2;3;4; or 5 for trucking companies and i = 1 for truckers).Variable measured in kilometers.
A N N E X 2
Data Methodology and Reliability

116 Transport Prices and Costs in Africa
Turnarounds: Number of turnarounds per year for a truck dedicated tothis route.
Yearly mileage: Turnarounds * Distance. Variable measured in kilometers.
Average load: Average load in tons from origin to destination (base valuefor return trip).
Price per trip:
If [unit = Tons] [Price per unit * Average load]If [unit = Container] [Price per unit]If [unit = Liters] [Price per unit * Average load * 1000]If [unit = Kilometers] [Price per unit * Average load * Distance]Else [Price per unit * Average load * Distance]
Price per trip is measured originally in local currency (converted into cur-rent U.S. dollars using IMF exchange rates) for a standard load (containerof truck load).
Assumption: Because of the lack of information about when the truck isempty we assume that:
If [Average route Price per trip to go >= Average route Price per tripreturn] [Price per trip = Price per trip to go]
Else [Price per trip = Price per trip return]
Principal product: Principal product transported2 categorical variable.Assumption: Because of the lack of information about when the truck isempty we assume that
If [Average route Price per trip to go >= Average route Price per tripreturn] [Principal product transported = Principal product transportedto go]
Else [Principal product transported = Principal product transportedreturn]
2.a.ii. OutputsYearly revenue: Yearly revenue to go + Yearly revenue return. Revenue ismeasured in terms of full truckload equivalents.
Given the lack of information about when the truck is empty, we assumethat if price discrepancies exist between the price to go and the pricereturn, the truck is going full loaded one way and partly loaded the otherway.3 Therefore, payload utilization impact is attributed to the least prof-itable way, using the following formulas:

Data Methodology and Reliability 117
Yearly revenue to go:
If [Price per trip to go > Price per trip return] [Price per trip to go *Turnarounds]
If [Price per trip to go = Price per trip return] [Price per trip to go *Turnarounds * Payload utilization]
If [Price per trip to go < Price per trip return] [Price per trip to go *Turnarounds * (Payload utilization)* 2]
Yearly revenue return:
If [Price per trip to go < Price per trip return] [Price per trip to go *Turnarounds]
If [Price per trip to go = Price per trip return] [Price per trip to go *Turnarounds * Payload utilization]
If [Price per trip to go > Price per trip return] [Price per trip return *Turnarounds * (Payload utilization–0.5) * 2]
2.b. Transport CostsFleet: New vehicles + Secondhand vehicles
Age: New vehicles * Average age of new vehicles + Secondhand vehicles* Average age of secondhand vehicles] / Fleet
2.b.i. Fixed costs per day is the sum of staff costs, license costs, over-head costs, insurance costs, communication costs, security costs, losses,financial costs, and depreciation costs. All fixed costs are calculated as anaverage for a truck owned by the company (that is, Total costs dividedby Fleet) and per calendar day (divided by 365). The original values arein local currency and were converted into current U.S. dollars using IMFexchange rates.
Staff: Cost of labor, including wages, salaries, and bonuses and social pay-ments / Fleet
License: Cost of licenses / Fleet
Overhead: Overhead costs, including rental of land/buildings, equipment,and furniture and excluding all the other fixed costs / Fleet
Insurance: Insurance cost / Fleet
Communication: Cost of communication / Fleet
Security: If [The establishment paid for security = Yes] [Total annual security cost /
Fleet] or [Annual cost as percentage of total sales * Total sales / Fleet]Else [0]

118 Transport Prices and Costs in Africa
Losses: If [The establishment experienced losses as a result of road accidents
or theft and robbery = Yes] [Total annual losses / Fleet] or [Percentage oftotal sales * Total sales / Fleet]
Else [0]
Finance: Interest rates provided by the survey respondents are supposedto be actual annual percentage rates (APR) for truck purchases.Companies that do not have access to bank loans to finance their trucks(cash financing) are supposed to bear no financial costs.
If [Percentage of recent purchases financed by bank loan is all blank][0] (i.e., the establishment has not bought trucks in the last 3 years andhas therefore no bank loan to repay)
If [Percentage of recent purchases financed by bank loan is all null] [0](i.e., the establishment does not finance its fixed assets through bank loans)
Else, [Percentage of bank loan finance purchace/100 * Interestrate/100 * Purchase price of the truck]
Depreciation: All companies bear depreciation costs. These costs are,however, inversely proportionate to the number of years of use and aretherefore almost null for companies that use their truck for a large num-ber of years. Some companies do not fully depreciate their new trucksand secondhand trucks and keep a good resale value. We have modeledthe resale value drop of an average new truck owned by the establish-ment by the following formula:
Drop new = minimum(logarithm(Years of use / 4 * (exponential(0,5)–1)+1);1) and the resale value drop of an average secondhand truckowned by the establishment by the formula value:
Drop secondhand = minimum(logarithm(Years of use / 5 * (exponential(0,5)–1)+1);1).
The main assumption here is the logarithmic drop of the truck resale value,with an estimated residual value of 50 percent reached after 4 years for newtrucks and 5 years for secondhand trucks. After 11 years and 14 years,respectively, for new and secondhand trucks, the residual value would benull. The periods have been extrapolated from local interviews of transportcompanies. As for the purchase value, we use the value provided by the person interviewed or a default value when data were not provided. We differentiated between years of use on the road for new trucks and years ofuse on the road for secondhand trucks.

Data Methodology and Reliability 119
Depreciation costs = (Depreciation costs new + Depreciation costs secondhand) / Fleet
If [New vehicles > 0] [Depreciation costs new = New truck purchasevalue * New vehicles * minimum[Drop new; 100 percent] / Years of use]
Else [0]
If [Secondhand vehicles > 0] [Depreciation costs secondhand =Secondhand truck purchase value * Secondhand vehicles * minimum[Drop secondhand; 100 percent] / Years of use]
Else [0]
2.b.ii. Variable costs per kilometer is the sum of fuel costs, tire costs,maintenance costs, and bribes. Variable costs are route specific (i = 1; 2;3; 4; or 5). Survey data, however, do not relate variable costs to routestraveled (except for bribes), and we assume that fuel and tire consump-tion and maintenance costs are uniform within the company fleet. Theoriginal values are in local currency and were converted into current U.S.dollars using IMF exchange rates.
Fuel: Companies have provided the average fuel consumption of light-weight, mediumweight, and heavyweight trucks. The tonnage ranges usedin the questionnaire are, respectively, 0–5 tons for light weight, 5–7 tonsfor medium weight, and 7+ for heavy weight. However, feedback frominterviewers has encouraged us to use different ranges: 0–10 tons, 10–20tons, and 20–30 tons, respectively, because these are more representativeof actual loads.
The unit fuel cost (LCU per liter) has been derived from “InternationalFuel Prices (2007), 5th edition data preview, GTZ (2006 values) usingthe IMF-IFS exchange rates (Q4 2006). We have used the super gasolineprice (3 to 10 percent higher than the diesel price in the countriesselected) as an estimate of the fuel plus lubricant unit cost (no relevantsource of lubricant cost available).
For trucking companies, fuel cost per km is:
If [Actual load <= 10] [Fuel consumption light weight/100 * Unit fuelcost]
If [10 > Actual load >= 20] [Fuel consumption medium weight/100 *Unit fuel cost]
If [Actual load > 20] [Fuel consumption heavy weight/100 * Unit fuelcost]
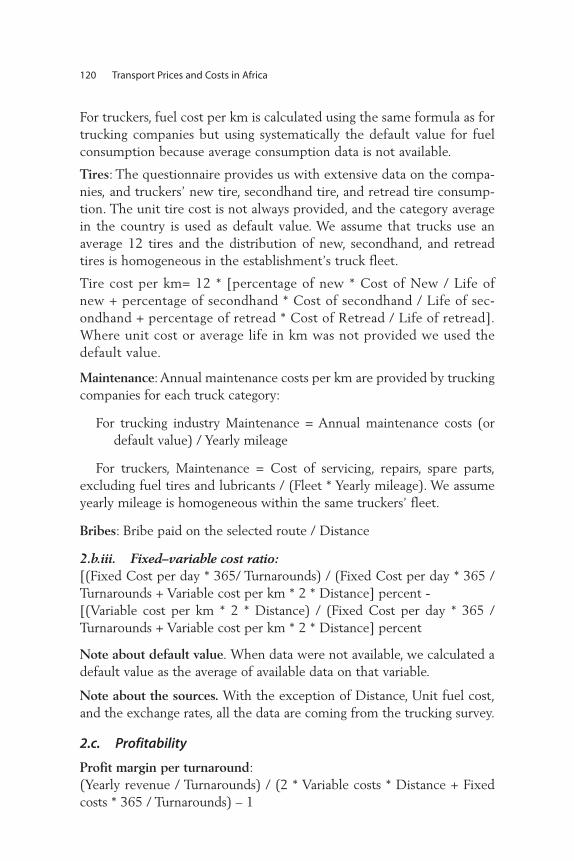
120 Transport Prices and Costs in Africa
For truckers, fuel cost per km is calculated using the same formula as fortrucking companies but using systematically the default value for fuelconsumption because average consumption data is not available.
Tires: The questionnaire provides us with extensive data on the compa-nies, and truckers’ new tire, secondhand tire, and retread tire consump-tion. The unit tire cost is not always provided, and the category averagein the country is used as default value. We assume that trucks use anaverage 12 tires and the distribution of new, secondhand, and retreadtires is homogeneous in the establishment’s truck fleet.
Tire cost per km= 12 * [percentage of new * Cost of New / Life ofnew + percentage of secondhand * Cost of secondhand / Life of sec-ondhand + percentage of retread * Cost of Retread / Life of retread].Where unit cost or average life in km was not provided we used thedefault value.
Maintenance: Annual maintenance costs per km are provided by truckingcompanies for each truck category:
For trucking industry Maintenance = Annual maintenance costs (ordefault value) / Yearly mileage
For truckers, Maintenance = Cost of servicing, repairs, spare parts,excluding fuel tires and lubricants / (Fleet * Yearly mileage). We assumeyearly mileage is homogeneous within the same truckers’ fleet.
Bribes: Bribe paid on the selected route / Distance
2.b.iii. Fixed–variable cost ratio:[(Fixed Cost per day * 365/ Turnarounds) / (Fixed Cost per day * 365 /Turnarounds + Variable cost per km * 2 * Distance] percent - [(Variable cost per km * 2 * Distance) / (Fixed Cost per day * 365 /Turnarounds + Variable cost per km * 2 * Distance] percent
Note about default value. When data were not available, we calculated adefault value as the average of available data on that variable.
Note about the sources. With the exception of Distance, Unit fuel cost,and the exchange rates, all the data are coming from the trucking survey.
2.c. Profitability
Profit margin per turnaround:(Yearly revenue / Turnarounds) / (2 * Variable costs * Distance + Fixedcosts * 365 / Turnarounds) – 1
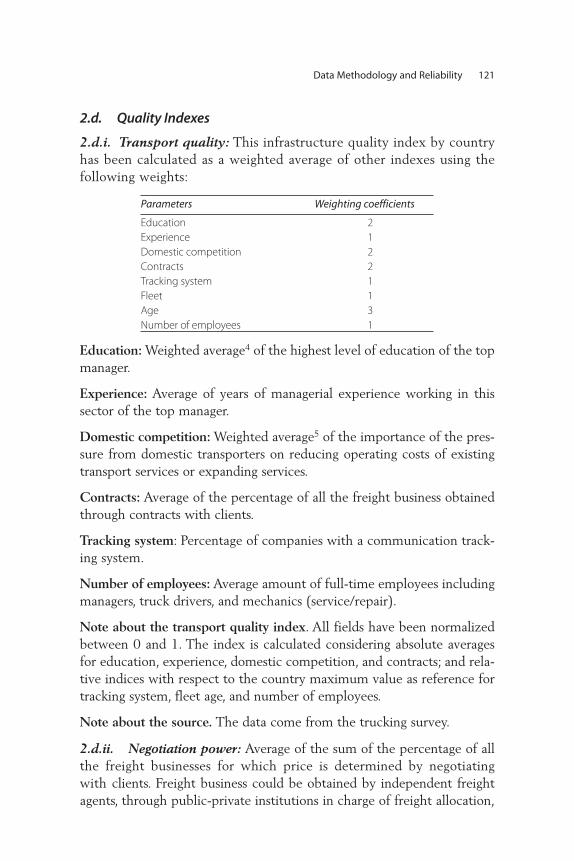
Data Methodology and Reliability 121
2.d. Quality Indexes
2.d.i. Transport quality: This infrastructure quality index by countryhas been calculated as a weighted average of other indexes using thefollowing weights:
Education: Weighted average4 of the highest level of education of the topmanager.
Experience: Average of years of managerial experience working in thissector of the top manager.
Domestic competition: Weighted average5 of the importance of the pres-sure from domestic transporters on reducing operating costs of existingtransport services or expanding services.
Contracts: Average of the percentage of all the freight business obtainedthrough contracts with clients.
Tracking system: Percentage of companies with a communication track-ing system.
Number of employees: Average amount of full-time employees includingmanagers, truck drivers, and mechanics (service/repair).
Note about the transport quality index. All fields have been normalizedbetween 0 and 1. The index is calculated considering absolute averagesfor education, experience, domestic competition, and contracts; and rela-tive indices with respect to the country maximum value as reference fortracking system, fleet age, and number of employees.
Note about the source. The data come from the trucking survey.
2.d.ii. Negotiation power: Average of the sum of the percentage of allthe freight businesses for which price is determined by negotiatingwith clients. Freight business could be obtained by independent freightagents, through public-private institutions in charge of freight allocation,
Parameters Weighting coefficients
Education 2Experience 1Domestic competition 2Contracts 2Tracking system 1Fleet 1Age 3Number of employees 1

122 Transport Prices and Costs in Africa
by telephone/fax from customers, by trucks waiting at lorry parks, bydrivers finding their own loads, and through contract with clients. Indexnormalized between 0 and 1.
2.d.iii. Logistic perception index (LPI): The LPI is a set of indicatorsthat measure perceptions of the logistics environment of 140 countries onseveral logistics dimensions (such as transport cost, infrastructure, customs,and so forth). The survey uses an anonymous, Web-based questionnairethat asks respondents to evaluate their country of residence, as well as eightcountries they are dealing with, on several logistics dimensions:
• International transportation costs• Domestic transportation costs• Timeliness of shipments• Tractability of shipments• Transport and IT infrastructure• Customs and other border procedures• Logistics competence
Source: Global facilitation partnership for transportation and trade.
2.d.iv. Infrastructure condition: This index measures the percentage ofthe road section in good and fair condition. Index normalized between 0and 1. Source: Africa transport unit.
2.e. Other VariablesRail competition: Categorical variable6 that represents the level of obstaclethat rail competition represents to the current transport operations of theestablishment.Taxes: Taxes paid on the establishment / Fleet. The original values are inlocal currency. Number of borders: Number of borders crossed by the truck (route spe-cific variable).Region: Regional7 dummy variable.
3. Regression Analysis
3.a. Regression VariablesIn the regression analysis, the variables are measured in current U.S. dol-lars per kilometer per truck. The original variables were recalculated as
Prices per km: Price per trip / Distance
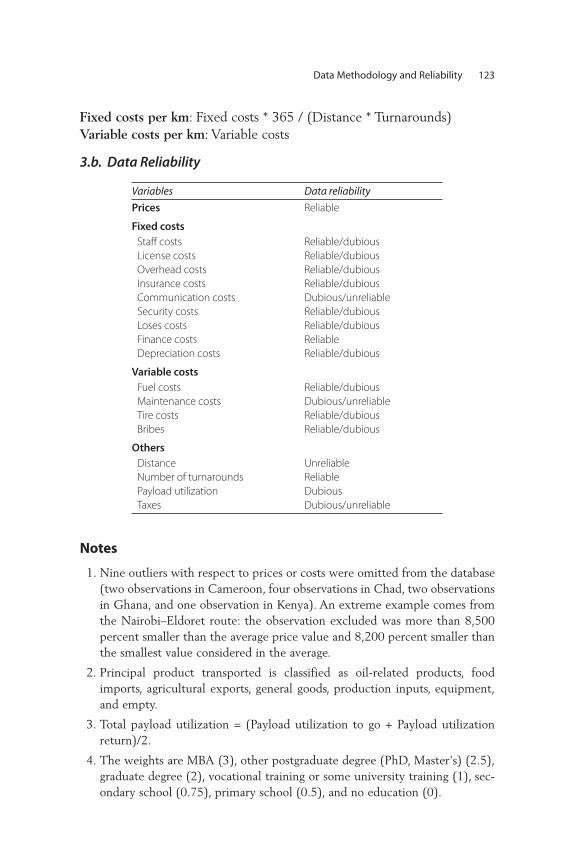
Data Methodology and Reliability 123
Fixed costs per km: Fixed costs * 365 / (Distance * Turnarounds) Variable costs per km: Variable costs
3.b. Data Reliability
Variables Data reliability
Prices Reliable
Fixed costsStaff costs Reliable/dubiousLicense costs Reliable/dubiousOverhead costs Reliable/dubiousInsurance costs Reliable/dubiousCommunication costs Dubious/unreliableSecurity costs Reliable/dubiousLoses costs Reliable/dubiousFinance costs ReliableDepreciation costs Reliable/dubious
Variable costsFuel costs Reliable/dubiousMaintenance costs Dubious/unreliableTire costs Reliable/dubiousBribes Reliable/dubious
OthersDistance UnreliableNumber of turnarounds ReliablePayload utilization DubiousTaxes Dubious/unreliable
Notes
1. Nine outliers with respect to prices or costs were omitted from the database(two observations in Cameroon, four observations in Chad, two observationsin Ghana, and one observation in Kenya). An extreme example comes fromthe Nairobi–Eldoret route: the observation excluded was more than 8,500percent smaller than the average price value and 8,200 percent smaller thanthe smallest value considered in the average.
2. Principal product transported is classified as oil-related products, foodimports, agricultural exports, general goods, production inputs, equipment,and empty.
3. Total payload utilization = (Payload utilization to go + Payload utilizationreturn)/2.
4. The weights are MBA (3), other postgraduate degree (PhD, Master’s) (2.5),graduate degree (2), vocational training or some university training (1), sec-ondary school (0.75), primary school (0.5), and no education (0).
5. The weights are very important (1), fairly important (2/3), slightly impor-tant (1/3).
6. Levels of obstacle are classified as no obstacle, minor, moderate, major, andvery severe obstacle.
7. West Africa: Ghana, Burkina Faso; Central Africa: Cameroon, Chad; EastAfrica: Kenya, Uganda; Southern Africa: Zambia.
124 Transport Prices and Costs in Africa

An Example with Cameroon
Survey CoverageThe Trucking Survey in Cameroon targeted trucking companies and com-panies conducting their own transportation. A trucking company isdefined as a company that conducts trucking as its main operation andthat has five or more full-time paid employees. The companies surveyedserve at least one of the following routes:
• Douala–Yaoundé• Douala–Ngaoundéré• Douala–N’Djaména• Douala–Bangui• Douala–Bertoua• Douala–Garoua Boulai• Douala–Bafoussam• Yaoundé–Bafoussam
The survey also sampled a selection of truckers (trucking operators withfewer than five full-time permanent paid employees) that serve the mainroads listed above.
A N N E X 3
Sample Survey Design and Data Quality Control
125

126 Transport Prices and Costs in Africa
Companies with Five or More Full-Time Paid Permanent EmployeesA list of Cameroonian trucking operators was obtained from the World BankTransport Unit. This list was completed and updated during the early stagesof the survey. To validate the list and to classify the establishments accordingto size, the EEC team tried to contact a selection of establishments drawnrandomly from the list. Following the results of the validation process, a sam-ple frame consisting of a population of 52 establishments was set.
An attempt was made to contact each of these establishments. Duringthe survey, it was discovered that 10 establishments were closed, 8 estab-lishments were unreachable despite repeated attempts by phone, 12 establishments refused to participate, and 22 establishments agreedto participate, resulting in 22 completed trucking questionnaires, ofwhich 5 companies provided their own transportation.
TruckersIn this survey, the trucker’s stratum covers all establishments of the truck-ing industry with fewer than five employees. For many reasons, includingthe small size of establishments, their expected high rate of turnovers, thehigh level of “informality” of establishments, and consequently the diffi-culty in obtaining trustworthy information from official sources, the sur-vey firm selected an aerial sampling approach to estimate the populationof establishments and select the sample in this stratum according to theroads to be covered.
First, to randomly select individual truckers establishments for survey-ing, the following procedure was followed: (i) select districts and specificzones of each district where there are lorry parks or where truckers usu-ally off-load; (ii) count all truckers who generally stop in these specificlorry parks; (iii) in accordance with this count, create a virtual list andselect establishments at random from that virtual list; and (iv) on the basisof the ratio between the number selected in each specific zone and thetotal population in that zone, create and apply a skip rule for selectingestablishments in that zone.
The survey firm went into the field to count truckers in the selectedareas. Once the count for each zone was completed, the numbers weresent back to the firm headquarters.
At head office the following procedure was followed: the count byzone was converted into a list of sequential numbers for the entire surveyregion, and a computer program performed a random selection of thedetermined number of establishments from the list. Then, depending onthe number that the computer selected in each specific zone, a skip rule

Sample Survey Design and Data Quality Control 127
was defined to select truckers to survey in that zone. The skip rule foreach zone was sent back to the field team.
In Cameroon, enumerators were sent to each zone with instructions asto how to apply the skip rule defined for that zone as well as how to selectreplacements in the event of a refusal or other cause of nonparticipation(see table A3.1 below).
Data Quality ControlA management policy for the interviewers was established, and the following procedures were applied during the execution of the survey:
(A) Daily meetings with each interviewer at the end of the day for thefirst revision of their questionnaire(s). The objectives of this firstpass through the questionnaire were(1) To verify that all of the questions had been answered and that
basic constraints had been respected. If the questionnaire failedthis aspect of the review badly, it was returned to the enumeratorto complete (through a return visit if necessary). The basicchecks here included
Table A3.1 Survey Participation by Country
Country Companies Approached Closed Refused Unavailable Surveyed Actual
Burkina Faso
Trucking companies — — — — 18 16
Truckers — — — — 45 45Ghana Trucking
companies 35 4 6 7 18 15Truckers 110 0 30 25 55 54
Cameroon Trucking companies 52 10 12 8 22 14
Truckers 120 0 40 23 57 57Chad Trucking
companies 34 0 8 8 18 14Truckers 135 0 50 28 57 57
Kenya Trucking companies 64 1 2 1 22 21
Truckers — — — — — 55Uganda Trucking
companies 47 4 8 14 21 17Truckers 100 0 20 23 57 57
Zambia Trucking companies 50 4 20 1 1 19
Truckers — — — — — 45Source: Trucking survey.Note: No available data for Burkina Faso.

128 Transport Prices and Costs in Africa
(a) that no fields had been left empty (other than explicitlyskipped fields),
(b) that no fields had been filled in ambiguously (that is, witha dash, slash, or squiggle),
(c) that coded responses of DK (don’t know), NA (not appli-cable), and R (refused to answer) seemed plausible for thefield in question,
(d) that percentages, where required, added up to 100 percent,and
(e) that fields with known relationships to adjacent fields respected those relationships (for example, the year of man-ufacturing a vehicle is smaller than the year of purchasingthat vehicle).
(2) To take the opportunity to reinforce the enumerators’ awareness ofthe logical links between questions, by quickly checking the moreobvious ones, demonstrating what they are doing, highlighting anyinconsistencies, and asking for explanations. Some of the consis-tency checks that might be done quickly at this stage included:(a) if the establishment did or did not perform cross-border oper-
ations (that is, yes or no but not NA), in which case the mainpoint of exit that the establishment used should be listed;
(b) if the establishment owned lightweight vehicles, it shouldhave the total cost of maintenance and the average fuelconsumption for this type of vehicle;
(c) if there are some trips with overload fines in certain routesthey should have the amount of overload fines per trip.
(3) To ensure that the full consistency checks were carried out us-ing an SPSS script after the data had been entered, and reviewedin a second meeting with the enumerator (see C below).
(4) To assess the interviewer’s ability to correctly fill out the ques-tionnaire and to clarify any concerns regarding his understand-ing of the questionnaire, if necessary.
(B) Following this review, the questionnaire was retained by the firm survey for data entry and the administration of coherence tests, un-less it badly failed the first basic tests listed in A(1) above. Within ashort time frame (one or two days after the first meeting), the ques-tionnaire was entered, and the coherence and completion tests foreach questionnaire were executed.
(C) There was a second meeting with the interviewer in order to go overthe results of the coherence and completion tests and, if necessary, return the questionnaire for further completion/verification.

(D) Data entry and consistency checks(1) When data entry was finished for the day, for each type of
questionnaire for which additional cases were entered or existing cases were updated, that data files were exported toSPSS format.
(2) The resulting SPSS script was run to open the data in SPSS.(3) The consistency and completion tests scripts were run in order
to generate data regarding the completion status of each caseand to validate the consistency checks. This procedure generat-ed a report detailing these results as well as the completion sta-tus of the whole sample with respect to sales.
(4) Whenever possible, this report was printed and reviewed withthe enumerators and possible return visits were executed if required shortly thereafter.
(E) Completion tests
A questionnaire was considered “final” when it contained answers to85 percent of the questions in each section. In addition, across the entireset of completed questionnaires, each variable was submitted to an 85percent completion test. Finally, all information pertaining to the screenerportion of the questionnaire had to be completed.
Sample Size
The number of vehicles surveyed and details about those vehicles areshown in table A3.2.
Sample Survey Design and Data Quality Control 129

130 Transport Prices and Costs in Africa
Table A3.2 Number of Vehicles Surveyed by Country
Country CompaniesLight weight
(<5 tons)
Mediumweight
(>=5–7 tons)
Heavyweight
(> 7 tons) Total
Burkina Faso Trucking companies 4 22 216 242Truckers 3 17 117 137
Ghana Trucking companies 0 1 298 299Truckers 2 12 77 91
Cameroon Trucking companies 15 10 389 414Truckers 14 32 42 88
Chad Trucking companies 0 0 290 290Truckers 0 1 66 67
Kenya Trucking companies 20 67 1,096 1,183Truckers 0 15 122 137
Uganda Trucking companies 104 66 240 410Truckers 2 16 72 90
Zambia Trucking companies 66 109 495 670Truckers 32 32 29 93
Source: Trucking survey.Note: Each weight category includes trucks, trailers, and semitrailers. Tractors and towing vehicles are not included.

The strong regulation of transport activities is probably the most distinc-tive feature of the Central African corridors. Transit is governed by transitagreements signed between the governments of Cameroon and Chad, onthe one hand, and the governments of Cameroon and the Central AfricanRepublic, on the other hand. Apart from banning cabotage, these agree-ments signed in 1999 set the principles of traffic allocation between fleetsof coastal and landlocked countries: 65 percent of freight throughCameroon has to be allocated to Chadian freight operators and 60 percentto Central African freight operators.
Three national institutions, called freight bureaus, are responsible forthe implementation of these agreements’ provisions:
• for Cameroon, the Bureau de Gestion du Fret Terrestre (BGFT)• for Chad, Bureau National de Fret (BNF)• for the Central African Republic, the Bureau d’Affrètement Routier
Centrafricain (BARC)
Although they have different legal status, their objectives are similar:
• to collect and publish offers and demand for transport• to manage the issuance of cargo and transit-related documents
A N N E X 4
Freight Allocation through FreightBureaus: The Cases of Central and West Africa
131

132 Transport Prices and Costs in Africa
• to ensure, on behalf of their country, that the freight quotas are respected
• to monitor the movement of goods overland and to keep statistics related to goods transport
The BGFT also organizes the transit operations and oversees proceduraland transit facilitation issues from Douala and Ngaoundéré. In theory, thethree structures act as arbitrators to balance the differences in quotaimplementation and ensure that small operators have the same access tocargo as larger ones. Their regulatory role is normally limited to quotaoversight, but they also define reference freight rates that in practice setthe actual rates charged by transporters.
In reality, to get a load, truck drivers have to be registered on the BGFTdirectory and wait in a parking lot at the exit of the Douala (or in theequivalent parking lots in Ngaoundéré and Belabo). The transaction isnegotiated separately between the importer and the truck owner. Thisnegotiation is theoretically a free negotiation between the transporter andthe importer agent. However, the “market price,” extremely high and veryuniform between operators, clearly shows that the importer’s negotiationpower is nonexistent.
Long-term contracting is nonexistent in the subregion. Getting a loaddepends on the issuance of transport documents from the BGFT and BNFor BARC. Consequently, if a shipper/transporter wishes to bypass thefreight bureaus, transport documents are not issued and then the trans-porter/shipper takes a high risk of problems with the controlling agencies.
West Africa’s regulatory environment is similar to that of CentralAfrica. Bilateral treaties are in place because after a crisis that followed the1992 transport deregulation, the government of Burkina Faso signed anagreement with all its corridor partners (Ghana, Côte d’Ivoire, Togo, andBenin) to establish quotas: one third for transit country truckers and twothirds for the Burkinabé truckers. The CBC (Conseil Burkinabé desChargeurs) has the responsibility of ensuring that this rule is enforced. Itsagents in each port deliver transport authorization for each load. In theory,as in Central Africa, freight allocation is the result of a free and independ-ent bargain between the shipper and the trucker. The CBC registers theresult of this business transaction with no involvement whatsoever. It onlyenforces the one-third/two-third rule when necessary.1
In practice, the CBC has been put in a unique monopolistic positionthat allows it to control the market. It is de facto a freight allocationbureau that distributes loads between trucking companies with the active

Freight Allocation through Freight Bureaus: The Cases of Central and West Africa 133
support of the main trucking company association, OTRAF (Organisationdes Transporteurs du Faso). OTRAF is the only transporters’ associationin the country. It was created in 1995 with the active support of the gov-ernment and the chamber of commerce to be a unique interlocutor ratherthan the then four competing associations. However, OTRAF was in amonopolistic position that was rapidly captured by some well-connectedindividuals. As a result, competing associations soon reemerged but so farhave not managed to successfully compete with OTRAF.
The unofficial rules in a port in West Africa are as follows:
• A shipper informs the CBC it has a shipment to be transported toBurkina Faso.
• The CBC then informs the OTRAF about this shipment and all its details. It may or may not negotiate the tariff with the shipper.
• OTRAF turns to its constituents and assigns the load on a firstcome–first served basis. This tour de rôle is updated in real time: when atruck arrives in the port, the driver goes to the OTRAF representative tobe added to the waiting list.
• Once the contract is established, the trucker pays its due to the asso-ciation (FCFA 10,000) for the service it provided and to the CBC(FCFA 10,200) for the loading authorization.2
Notes
1. To make sure that the whole trade flows are accounted for, no shipper has theright to be its own trucker: no own-account trucking is allowed from the port,although exceptions are granted by the administration on a case-by-case basis.
2. Such costs are close to 10 times higher in Central Africa.


Zambia’s road freight industry faces competition from other SouthernAfrican operators. Several foreign trucking companies operate extensivelyalong Zambian main transport corridors. The importance of foreign oper-ators can be seen in table A5.1, which gives the estimated1 numbers oftrucks that operate on a continuous basis on the different routes and thatare registered in other SADC countries. The market is therefore highlycompetitive, but Zambian trucking companies’ market share is close to40 percent, which is more than the “real” market share of landlockedcountries in other regulated systems.
The number of foreign trucks operating in Zambia is high becauseZambia is a net exporter in terms of freight volumes. Consequently, thismakes it economically viable for South African companies to undertaketurnaround trips. The South African fleet is the most important in the sub-region, benefiting from economies of scale. The Gauteng heavy truck fleetis about eight times larger than the Zambian fleet.2 Thus, some large SouthAfrican trucking companies have taken over control of several largeZambian companies, which is also a specificity of Zambian trucking indus-try. Foreign direct investment in the trucking industry has been the mainsolution South African companies found to bypass market/entry barriers.However, it is worth noting that although some large companies benefitfrom South African capital, they are run by Zambian management.
Zambia’s Road Freight Industry and Business Practices in Southern Africa
135
A N N E X 5

Table A5.1 Indicative Cost Factor Ranges for Zambia and South Africa Trucking Companies Operating to and from Zambia
Cost factor Zambia South Africa
Truck acquisitionUsed trucks Used trucks—purchase from Europe or America. No
government incentives to renew fleet.Used—purchased on domestic market. Levels of utiliza-
tion would not be able to meet costs of new truck.Financing Self-financing, informal borrowing, local interest rates
said to be high.Local banks, but finance charges are high
(17 percent).Lifespan 8–10 years 5–10 yearsTrailers Bought locally or South Africa. Bought locally.
Spares and tires Keep in-house stock, bought directly from suppliers. Borrowed financing.
Limited in-house stock for routine maintenance needs.Other spares readily available on local market.
Average annual mileage range 96–108,000 km per year (one company reported as highas 120,000 km per year). Vehicles make 2–2.5 trips per month.
96–108,000 km per year for cross border and up to240,000 km per year for domestic operations.Vehicles make 2–2.5 trips per month.
Fuel costs (2007) US$1.50 per liter US$0.88 per liter
Turnaround time 8–12 days 7–14 daysDowntime because of breakdown Minimal, but total downtime including maintenance
can be up to 20 percent of the time.1–2 percent of the transport time, stringent mainte-
nance regimes.
Empty running 0–5 percent, better able to secure export traffic, which isthinner so minimizes empty running.
0–5 percent, agents in each country.
Weighbridges Roads authority, spend on average three hours waiting. Offload if overloaded, driver and transporter fined.
In-house, municipal for self regulation.Offload if overloaded, driver and transporter fined.
Labor Shortage of well-trained drivers. Bonus for drivers. Not an issue. Drivers paid mileage bonus.
Rates Rates determined by RSA operators. Fro example: R 28,396 for Johannesburg–Copperbelt(approx. US$4,028) for a 34 ton payload, or approx.US$118 per ton.
Range is US$90–170 per ton.Export rates can be 60–100 percent of import rate.
136

In terms of freight rate determination, once the agents are approachedby a shipper, they obtain quotes from trucking companies and negotiate arate within the limits set by the shipper with an allowance for the agents’own margin. The large agents insist that they work with reputable andlarge transport companies so they are better able to deliver a reliable serv-ice. The agents, who deal mainly with import traffic, prefer to use SouthAfrican trucking companies.
Despite the existence of a competitive shipping agents sector, some ofthe trucking companies are increasingly entering into direct contracts withthe shippers. As a result of the trend toward direct contracting, shippingagents have to adapt and offer more comprehensive logistics services.
Contrary to widespread trends in West and Central Africa, and to alesser extent East Africa, axle load regulation is widely enforced. That iswhat was concluded from the results of an independent axle load bench-mark test carried out in October–November 2006 in Zambia. At a mobileweighbridge located just before the Kafue Weighbridge Station comingfrom Chirundu, only 4.22 percent of the tested vehicles were loaded withmore than 5 percent of the gross vehicle mass (compared with 7 percentin 2005). At Kapiri Mposhi, only 4.33 percent of vehicles passing throughthe mobile weighbridge were overloaded, down from 35 percent in theprevious test. This is attributed to strict enforcement by the authoritiesand also to the fact that all the operators were consulted, especially thetransporters.
Notes
1. The statistics provided by the cross-border agencies in Zambia and SouthAfrica, and also the Zambian Revenue Authority, do not included data on thenumber of trucks using the various road corridors. The only effective way toobtain this information would be to undertake a detailed border-post and cus-toms survey. Temporary permits do not indicate the numbers of trips carriedout by each truck for the duration of the permit. Estimates are based on datafrom cross-border permits, customs records, previous observations of borderposts, and information provided by selected transport providers.
2. Gauteng represents 38 percent of South Africa’s vehicles, but more likelyabout 50 percent of the registered heavy trucks in South Africa.
Zambia’s Road Freight Industry and Business Practices in Southern Africa 137

A
AfricaSee Central Africa; East Africa; Southern
Africa; West Africa
B
Bolivia, 19Border crossing time
causes of delay, 18–19as determinant of transport costs, 63, 75,
76–77, 81opportunity costs of delays, 75policy reform options in East Africa, 94policy reform options in Southern
Africa, 94recommendations for East and Southern
Africa, 9, 9t, 10t, 105reductions in, projected impact on
transport costs of, 90, 93, 94, 95trucking company perceptions, 86–87
Brazil, 14Bribes, as transport cost factor, 64,
69, 70
C
Cartelsas cause of oversupply, 6, 55, 58–59definition, 12 n.6, 60 n.1fleet size and, 59–60market conditions and formation of, 12
n.5as obstacles to improving transport per-
formance, 5, 6, 55, 90–91reform recommendations, 105as transport price factor, 38, 47, 55
Central Africabenefits of road rehabilitation, 83countries of analysis, 3determinants of transport costs, 63, 64fleet characteristics, 6, 8, 55freight allocation system, 5–6, 54–55operating costs, 7, 64, 69–70policy reform options, 89, 90–93profit and markup in transport sector,
6, 41quality of transport services, 32rail transport competition, 38–39, 39recommendations for transport policies,
7–8, 105
Index
139
Page numbers followed by n. and a number refer to numbered notes. Page numbers followed by tor f refer to tables or figures, respectively. Page numbers in italic refer to boxed text.

regulatory system, 7, 8, 32, 49–51,91–92
sociopolitical obstacles to regulatoryreform, 8, 91
trade and transport corridors, 32transport infrastructure, 7transport market conditions, 29, 32, 104transport prices, 32, 37, 41truck utilization, 55
Central Asia, 13trade logistics, 19
Central Europe, 13China, 17Competition in transport sector
causes of high costs in Africa, 2characteristics of African transport corri-
dors, 29current status, 5–6deregulation and, 7fuel costs as factor in, 8implications for policy reform, 89international comparison of policies and
outcomes, 20–25profitability and, 44rail competition, 38–39regional comparison, 104transport policy recommendations, 7,
90–91Containerized shipping, 61 n.14Corruption
bilateral quota system and, 54current transport environment, 5freight-sharing schemes, 5, 47–49in regulated industries, 47–49as transport cost factor, 86trucking company perceptions, 86See also Bribes
Costs of road transport in Africacategories and components, 2–3countries and corridors of interest, 3current status, 1–2determinants of, 2, 6–7, 15, 41, 63economic significance, 1infrastructure factors, 2, 6–7, 15, 79–83,
86, 104international comparison, 1–2, 4, 13, 15,
64market thickness and, 85policy options to reduce, 90–96policy recommendations to reduce,
7–10, 105–106regional diversity, 3–4, 63, 64–68
regulation and operator mitigationstrategies and, 58
research goals, 3research methodology, 3–4research needs, 11, 97–101, 106role of international donors in reducing,
11three tiers of prices and, 3, 4, 5ftrade imbalances and, 85transport company profits and, 43transport prices and, 2, 3, 4, 8, 41–42,
103, 104trucking company perceptions, 85–87See also Equipment costs, transport;
Financing costs; Fixed costs; Fuelcosts; Labor costs; Variable costs
Czech Republic, 21–22
D
Data collection for transport sector analysis, 97–98
Developed countriesoperating costs in transport sector, 69transport costs, 4, 64vehicle operating costs, 7
Diagnostic framework, 4Direct contracting
definition, 54disincentives for new truck purchase, 73prevalence in Africa, 54significance of, 54
E
East Africabenefits of road rehabilitation, 83border crossing procedures and delays,
75–76, 94countries of analysis, 3determinants of transport costs, 63, 64fleet characteristics, 33labor costs, 73operating costs, 7, 68, 69, 70policy reform options, 89, 93–94, 104quality of transport services, 33rail transport competition, 38–39recommendations for transport policy,
9–10, 105trade and transport corridors, 32–33
140 Index

transport infrastructure, 7transport market conditions, 6, 29, 33,
104transport prices, 42–43
Eastern Europe, 13, 17–18, 64Efficiency of transport services
African subregion comparison, 17international comparison, 17–18regulatory obstacles, 49in Southern Africa, 34truck import tariffs and, 101truck utilization patterns, 55
Employees, transportcompensation for job loss in market
reforms, 10motivation to overload vehicles, 56–57
Entry barriers, 5, 47deregulation outcomes, 20–22, 25licensing process, 49
Equipment costs, transportfinancing costs, 6import duties, 6, 10, 72, 92research needs, 11road condition effects, 80taxes, 72, 92as transport cost factor, 2–3, 69truck prices, 10, 72–73See also Vehicle operating costs
F
Factor costsdeterminants of transport costs, 2–3, 38See also Equipment costs, transport; Fuel
costs; Labor costsFinancing costs
profitability of transport sector and, 55as transport cost factor, 69–70transport equipment, 6
Fixed costscomponents, 72–74international comparison, 69modeling methodology, 68regional differences, 63, 64–68
Fleet characteristicsage, 15, 55, 104deregulation outcomes in Rwanda,
23–24East Africa, 33efficiency, 17–18fuel consumption and, 69
obstacles to regulatory reform in Centraland West Africa, 8
own-account transport, 59policy reform options to improve, 92, 101regulatory influences, 5, 6, 47, 48research needs for economic analysis, 98size, 59–60transport prices and, 42, 104utilization patterns, 6, 55See also Oversupply of transport capacity
France, 15, 22Freight allocation system
corruption and, 5, 47–49direct contracting arrangements and,
5–6, 54disincentives for new truck purchase, 73effects on transport sector performance,
47–49, 52, 53French experience, 50in maritime transport, 51–52obstacles to reform, 5–6, 54–55rationale, 51reform options in Central and West
Africa, 92trucking association membership and, 87trucking company perceptions, 86–87
Fuel costseffect on regional competitiveness of
East African trucking companies, 8effect on transport costs, 8, 15, 64, 69,
70, 71, 86, 100evaluation of tax policy outcomes,
100–101fleet characteristics and, 69projected impact on transport costs of
reductions in, 90, 93–94recommendations for East and Southern
Africa, 9, 9t, 10t, 105–106recommendations for tax reform, 10recommendations for transport policies,
7–8road condition effects, 81
G
Geography, African transport corridors, 29
H
HDM-4 model, 11, 68, 81–82, 98Hungary, 21–22
Index 141

I
Import pricesevaluation of tariff policy outcomes, 101transport equipment, 6, 10, 72, 92transport prices as percentage of, 2
Incomes in transport industry, motivationto overload vehicles, 56–57
Indonesia, 13, 21Informal payments
recommendations for East and SouthernAfrica, 9, 9t, 10t
reductions in, projected impact on transport costs of, 90, 93
Infrastructure, transportbenefits of rehabilitation, 82–83as determinant of transport prices, 41,
86, 104economic analysis needed for policy
decisions, 98–100improvements to, projected impact on
transport costs of, 90, 93–94investment outcomes to date, 2overloaded vehicles and, 6, 57political economy, 44–45 n.1recommendations for East and Southern
Africa, 9, 9t, 10t, 105recommendations for transport policies,
7–8regional comparison, 79, 80tresearch needs, 11rural, 98–99trade performance and, 2transport company profitability and,
43–44as transport cost factor, 2, 6–7, 15,
79–82Integrated services, 44International institutions
foreign aid for road improvements, 2role in African transport system reform,
11, 106
L
Labor costsinternational comparison, 16tregional comparison, 73–74transport costs in Africa and, 4, 14, 15,
69Latin America, 13, 19
Licensing processas market entry barrier, 49as transport cost factor, 71, 74vehicle registration data, 97
Logisticscharacteristics of African transport
corridors, 29costs, 3, 5definition, 3direct contracting, 54political economy, 5profitability and, 44trade, 18–19
Logistics Performance Index, 15, 17f, 27n.2
M
Maintenance costs, 64–67African fleet characteristics, 69,
70–71HDM-4 estimates, 11, 68road condition effects, 6, 80–81, 86
Malawi, 25Mexico, 20–21Morocco, 22–23
O
Overloading of vehicles, 41enforcement and penalties, 57motivation, 6, 49, 56–57, 58profitability of transport and, 41, 44, 55research needs, 97road quality and, 6, 57transport prices and, 42, 43
Oversupply of transport capacitycartels as cause of, 6, 47, 55, 58–59deregulation outcomes, 22, 23fleet size, 47, 59–60freight system allocation and, 50market conditions and, 49
Own-account transport, 59
P
Pakistan, 13–14, 17, 20Paraguay, 19Poland, 21–22
142 Index

Policies, transportCentral and West African reform
options, 90–93data collection needs for, 97–98diagnostic framework, 4East African reform options, 93–94economic analysis for, 98–100market conditions and, 7, 89outcomes evaluation, 100–101recommendations, 7–10, 105–106reform implementation costs, 90reform implementation strategies, 10regional differences in reform options, 89research needs, 106role of development partners in reform
of, 11, 106Southern Africa reform options, 89,
94–96, 104Political economy
obstacles to regulatory reform in Centraland West Africa, 8, 91, 92–93
railroad transport competition, 44–45n.1
strategies for obtaining stakeholder support, 92–93
transport logistics, 5Prices, transport
Central Africa, 32, 37deregulation outcomes, 20–25determinants, 26–27 n.1, 37, 41–43, 47,
104East Africa, 42–43fleet size and, 42international comparison, 14, 15–17rail vs. road, 38–39regional differences, 37regulation and operator mitigation
strategies and, 58, 104Southern Africa, 37transport costs and, 2, 3, 4, 41–42, 103,
104transport quality and, 15–17West Africa, 32, 43
Profits and markup, transport sectorin Africa, generally, 4, 39, 40t, 103competition and, 6, 44determinants of, in Africa, 39–41,
43–44, 55overloading of vehicles and, 55–57regulatory caps on, 6subcontracting and, 39–41as transport price factor, 4, 6
Q
Quality of transport serviceAfrican subregion comparison, 14, 53fCentral Africa, 32East Africa, 33effects of freight allocation system, 52,
53international comparison, 14, 15–17market conditions and, 5measurement, 52–53, 60 n.7, 61 n.8Southern Africa, 15speed of delivery, 37–38transport prices and, 4, 15–17in West Africa, 31
Queuing systems. See Freight allocationsystem
R
Rail transport, 38–39Regional differences within Africa
competitiveness, 104determinants of transport costs, 63efficiency of transport services, 17labor costs, 73–74operating costs, 64–68profit margins in transport sector, 39,
40tquality of transport services, 14reform options, 89research goals, 3–4road conditions, 79, 80tsubregions, 3transport corridor characteristics, 29, 30ttransport prices, 37See also specific region
Regulationbilateral transit treaties with quotas,
49–51, 52, 53, 54Central Africa, 32, 49–51, 91–92competition and, 7corruption and, 47–49current transport system in Africa,
47–49as determinant of transport costs, 3, 104fleet characteristics and, 6implications for policy reform, 89international comparison of policies and
outcomes, 20–25obstacles to efficiency, 49
Index 143

reform recommendations, 105role of international donors in improving
African transport, 11, 106sociopolitical obstacles to reform,
8, 91Southern Africa, 34–35transport company profitability
and, 44transport policy recommendations,
7, 11trucking company perceptions, 86–87vehicle registration data, 97vicious circle of transport prices and
costs, 58West Africa, 7, 8, 31, 49–51, 91–92See also Freight allocation system
Rural roads, 98–99Rwanda, 23–24
S
Size of transport fleets, 59–60South Asia, 14, 19Southern Africa
border crossing procedures and delays, 9,76, 94, 95
corridor management proposal, 95countries of analysis, 3determinants of transport costs, 63fleet characteristics, 6labor costs, 73operating costs, 68, 69, 70per capita gross domestic product, 19policy reform options, 89, 94–96, 104profit and markup in transport sector, 44quality of transport service, 15recommendations for transport policy,
9–10regulatory environment, 34–35trade corridors and performance, 19,
33–34transport infrastructure, 6–7transport market conditions, 6, 29, 104transport prices, 14, 37truck utilization, 55vehicle operating costs, 7
Speed of deliveryregional comparison, 37–38road condition effects, 81rural transport, 99
Subcontracting, 37, 39–41
T
Tax structurecorporate taxes, 74domestic transport surtax in Malawi, 25evaluation of tax policy outcomes,
100–101imported vehicle taxes and tariffs, 72,
92, 101recommendations for transport policies,
10, 105–106reform options in Central and West
Africa, 91–92as transport cost factor, 71–72vehicle parts duties and surtaxes, 71
TradeAfrican trade and transport corridor
characteristics, 20, 30t, 31, 32–34determinants of transport costs, 3distance to seaports, 19logistical factors, 18–19trade imbalances as transport cost
factor, 85transport factors in trade performance, 2
Typology of trucking companies, 64, 65t
U
United States, 15
V
Variable costscomponents, 63, 64, 69–72, 77 n.1international comparison, 69modeling methodology, 68regional differences, 63, 64–68road condition effects, 80–81
Vehicle operating costsas component of transport costs, 3, 4components, 63, 70–71, 100–101current patterns, 7customs regulation and, 49in developed economies, 7recommendations for tax reform, 10road condition effects, 80–81, 82tspare parts duties and taxes, 71tax ratios, 74See also Equipment costs, transport
144 Index

W
Weighbridges, 57, 76, 94West Africa
benefits of road rehabilitation, 83countries of analysis, 3determinants of transport costs, 63, 64fleet characteristics, 6, 55freight allocation system, 5–6, 54–55labor costs, 73–74operating costs, 64, 68, 69, 70policy reform options, 89, 90–93profit and markup in transport sector, 6,
41, 43–44quality of transport service, 15, 31
recommendations for transport policies,7–8, 105
regulatory system, 7, 8, 31, 49–51,91–92
sociopolitical obstacles to regulatoryreform, 8, 91
trade corridors, 31transport infrastructure, 7transport market conditions, 29, 31–32,
104transport prices, 31–32, 43, 104truck utilization, 55vehicle operating costs, 7
Western Europe, 15, 64World Bank, 2, 11, 106
Index 145


ECO-AUDIT
Environmental Benefits Statement
The World Bank is committed to preservingendangered forests and natural resources. TheOffice of the Publisher has chosen to printTransport Prices and Costs in Africa: AReview of the Main International Corridorson recycled paper with 30 percent post con-sumer fiber, in accordance with the recom-mended standards for paper usage set by theGreen Press Initiative, a nonprofit programsupporting publishers in using fiber that is notsourced from endangered forests. For moreinformation, visit www.greenpressinitiative.org.
Saved:• 4 trees• 20 million BTUs of
total energy• 3,002 lbs. of net green-
house gases• 9,763 gallons of waste
water• 1,152 lb. of solid waste
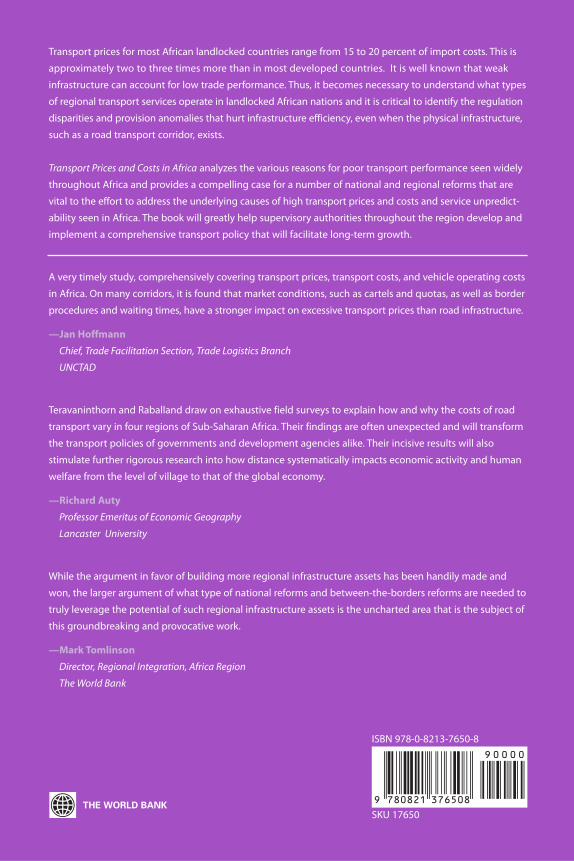
ISBN 978-0-8213-7650-8
SKU 17650
Transport prices for most African landlocked countries range from 15 to 20 percent of import costs. This is
approximately two to three times more than in most developed countries. It is well known that weak
infrastructure can account for low trade performance. Thus, it becomes necessary to understand what types
of regional transport services operate in landlocked African nations and it is critical to identify the regulation
disparities and provision anomalies that hurt infrastructure efficiency, even when the physical infrastructure,
such as a road transport corridor, exists.
Transport Prices and Costs in Africa analyzes the various reasons for poor transport performance seen widely
throughout Africa and provides a compelling case for a number of national and regional reforms that are
vital to the effort to address the underlying causes of high transport prices and costs and service unpredict-
ability seen in Africa. The book will greatly help supervisory authorities throughout the region develop and
implement a comprehensive transport policy that will facilitate long-term growth.
A very timely study, comprehensively covering transport prices, transport costs, and vehicle operating costs
in Africa. On many corridors, it is found that market conditions, such as cartels and quotas, as well as border
procedures and waiting times, have a stronger impact on excessive transport prices than road infrastructure.
—Jan Hoffmann
Chief, Trade Facilitation Section, Trade Logistics Branch
UNCTAD
Teravaninthorn and Raballand draw on exhaustive field surveys to explain how and why the costs of road
transport vary in four regions of Sub-Saharan Africa. Their findings are often unexpected and will transform
the transport policies of governments and development agencies alike. Their incisive results will also
stimulate further rigorous research into how distance systematically impacts economic activity and human
welfare from the level of village to that of the global economy.
—Richard Auty
Professor Emeritus of Economic Geography
Lancaster University
While the argument in favor of building more regional infrastructure assets has been handily made and
won, the larger argument of what type of national reforms and between-the-borders reforms are needed to
truly leverage the potential of such regional infrastructure assets is the uncharted area that is the subject of
this groundbreaking and provocative work.
—Mark Tomlinson
Director, Regional Integration, Africa Region
The World Bank
Related Documents