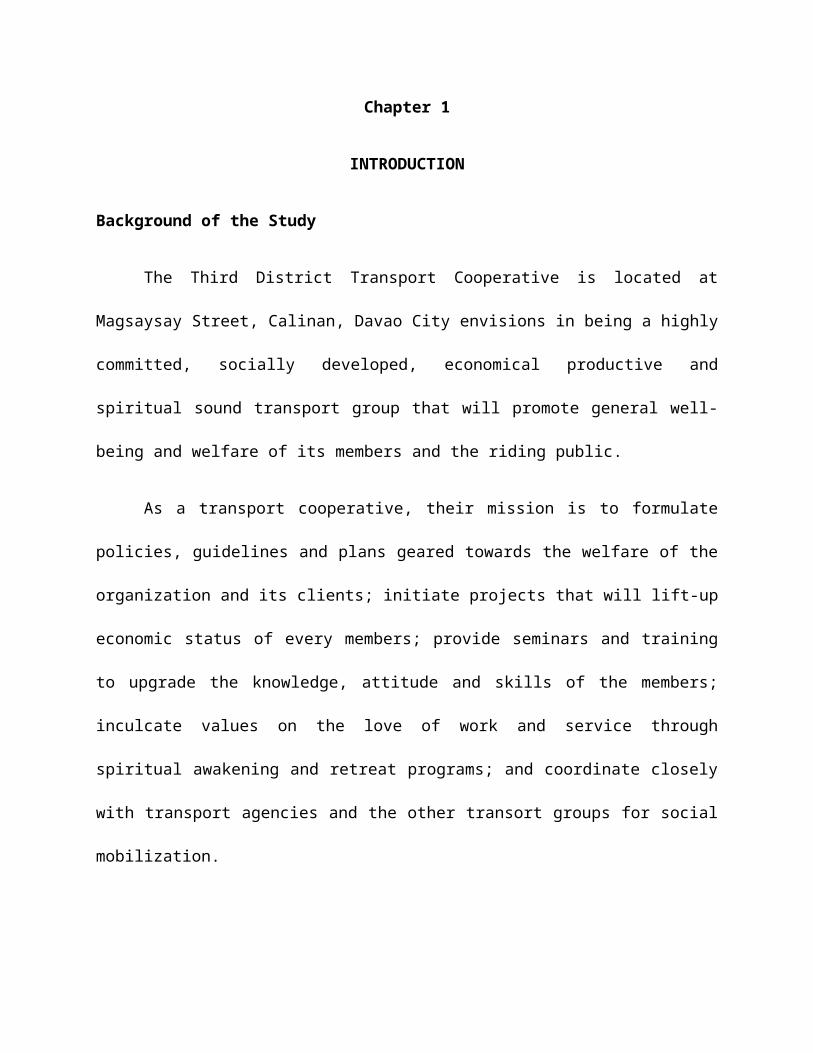
Chapter 1 INTRODUCTION Background of the Study The Third District Transport Cooperative is located at Magsaysay Street, Calinan, Davao City envisions in being a highly committed, socially developed, economical productive and spiritual sound transport group that will promote general well- being and welfare of its members and the riding public. As a transport cooperative, their mission is to formulate policies, guidelines and plans geared towards the welfare of the organization and its clients; initiate projects that will lift-up economic status of every members; provide seminars and training to upgrade the knowledge, attitude and skills of the members; inculcate values on the love of work and service through spiritual awakening and retreat programs; and coordinate closely with transport agencies and the other transort groups for social mobilization.

Welcome message from author
This document is posted to help you gain knowledge. Please leave a comment to let me know what you think about it! Share it to your friends and learn new things together.
Transcript
Chapter 1
INTRODUCTION
Background of the Study
The Third District Transport Cooperative is located at
Magsaysay Street, Calinan, Davao City envisions in being a highly
committed, socially developed, economical productive and
spiritual sound transport group that will promote general well-
being and welfare of its members and the riding public.
As a transport cooperative, their mission is to formulate
policies, guidelines and plans geared towards the welfare of the
organization and its clients; initiate projects that will lift-up
economic status of every members; provide seminars and training
to upgrade the knowledge, attitude and skills of the members;
inculcate values on the love of work and service through
spiritual awakening and retreat programs; and coordinate closely
with transport agencies and the other transort groups for social
mobilization.
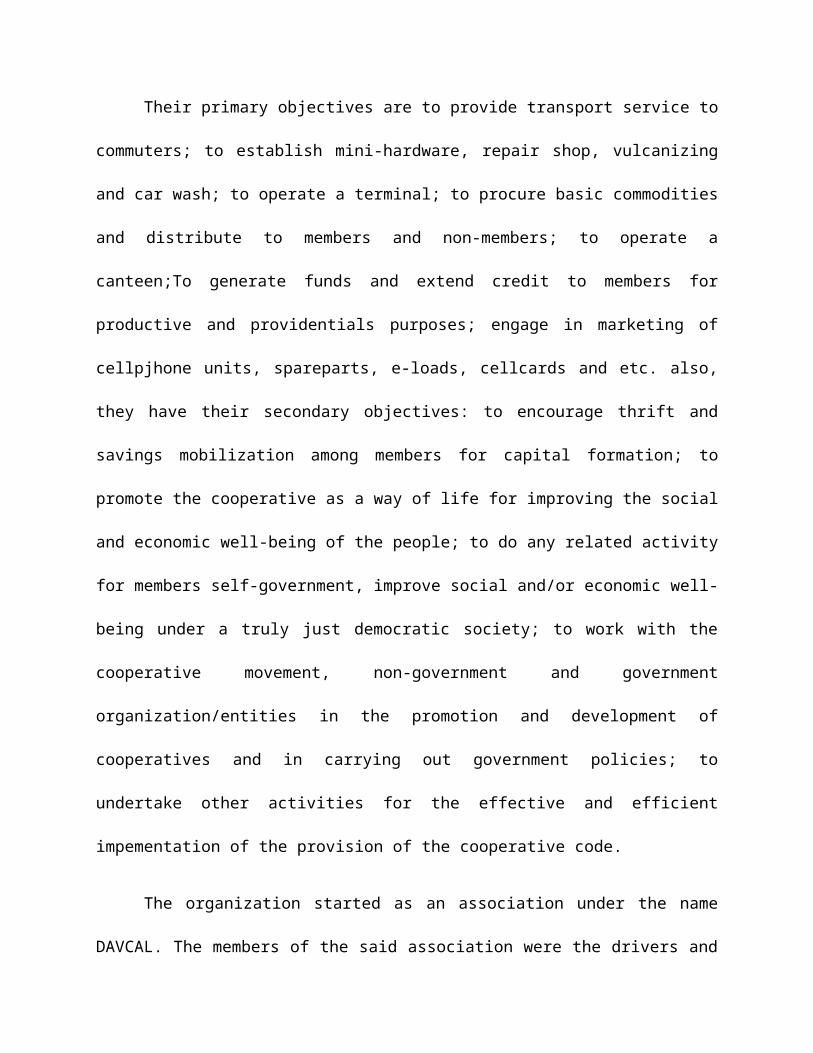
Their primary objectives are to provide transport service to
commuters; to establish mini-hardware, repair shop, vulcanizing
and car wash; to operate a terminal; to procure basic commodities
and distribute to members and non-members; to operate a
canteen;To generate funds and extend credit to members for
productive and providentials purposes; engage in marketing of
cellpjhone units, spareparts, e-loads, cellcards and etc. also,
they have their secondary objectives: to encourage thrift and
savings mobilization among members for capital formation; to
promote the cooperative as a way of life for improving the social
and economic well-being of the people; to do any related activity
for members self-government, improve social and/or economic well-
being under a truly just democratic society; to work with the
cooperative movement, non-government and government
organization/entities in the promotion and development of
cooperatives and in carrying out government policies; to
undertake other activities for the effective and efficient
impementation of the provision of the cooperative code.
The organization started as an association under the name
DAVCAL. The members of the said association were the drivers and
operators of van units both colorum and those with franchise
operating the Davao-Calinan route. As an association, they have
encountered tremendous problem especially on the availability of
terminal to settle their units and the commuting public.
As such, they have learned that in order to solve their
problems they have to register themselves as cooperative. On
September 21, 1999, TDTC (Third District Transport Cooperative)
was registered with the Cooperative Development Authority (CDA)-
Davao Extension Office with registration no.RN-6023-DVO. With a
starting capital of P. 49,500.00 and the determination to help
each and everyone to improve their economic situation they have
started operating a terminal as its first activity with only 10
units catering Calinan route.
But during this time, it was not good as they expected. Due
to poor recording, less transparent operation and conflict
between or among officers, the cooperative expereienced a
worsening condition in the year 2000 and 2001 respectively
wherein it can no longer provide and serve the needs of its
members.
In 2001, when TDTC conducted its election, they found hope
in getting into the track, the chance of recovering and bringing
the coop to the place where it should be. It was this time that
Mr. Rogelio Rolona become the chairman of TDTC. Being an original
member and a witness to the undesirable occurrence in the
cooperative, he envisioned for the coop to grow each year. Using
his experience in the organization and his strong will to help
the fellow members, he introduced some reforms into the system
taking into consideration proper recording, transparency,
linkage, continuous education and a hard fist to implement the
policies of the cooperative.
From then on and every year after the other, the cooperative
is enjoying a continuous success and growth. From its humble
beginning, the assets increased to more than P 6,000,000.00 and
the number of units operating increased to more than 30.Today the
cooperative is successfully providing its members services like
regular loan, emergency loan, petty cash loan and auto loan aside
the opreation and management of terminal.
Cooperatives, as economic enterprises and as self-help
organizations, play a meaningful role in uplifting the socio-
economic conditions of their members and their local
communities.With their concern for their members and communities,
they represent a model of economic enterprise that places high
regard for democratic and human values and respect for the
environment.
While relatively few in number, cooperatives in the
transportation sector encompass a broad range of functionality.
Often members of cooperatives in this sector are other service
organizations. The cooperatives may be organized to meet the
demand for services in lower-density rural areas, or in areas
that cross geographic jurisdictional boundaries. The cooperative
may be created to meet specialized transport requirements of
school districts or those with limited mobility. Cooperatives are
also organized to offer transportation alternatives that reduce
the number of car trips in an effort to address environmental and
sustainability issues that accompany the heavy traffic demands of
urban areas.
As the world today faces unstable financial systems,
increased insecurity of food supply, growing inequality
worldwide, rapid climate change and increased environmental
degradation, it is increasingly compelling to consider the model
of economic enterprise that cooperatives offer.The cooperative
sector, especially in developing countries, also presents itself
as an important element that can contribute to the realization of
the Millennium Development Goals (MDGs) by 2015.
Chapter 2
REVIEW OF RELATED LITEARATURE
This chapter contains literature and studies from magazines,
books, the internet, and journals related to the study, theory
base, the conceptual framework, and hypothesis of the study.
Related Literature and Study
A cooperative ("coop") or co-operative ("co-op") is an
autonomous association of persons who voluntarily cooperate for
their mutual social, economic, and cultural benefit.
[1] Cooperatives include non-profit community organizations and
businesses that are owned and managed by the people who use its
services (a consumer cooperative) or by the people who work there
(a worker cooperative) or by the people who live there (a housing
cooperative), hybrids such as worker cooperatives that are also
consumer cooperatives or credit unions, multi-stakeholder
cooperatives such as those that bring together civil society and
local actors to deliver community needs, and second and third
tier cooperatives whose members are other cooperatives.
The International Co-operative Alliance was the first
international association formed by the movement. It includes
the World Council of Credit Unions. A second organization was
formed later in Germany, the International Raiffeisen Union. In
the United States, the National Cooperative Business
Association (NCBA) serves as the sector's oldest national
membership association. It is dedicated to ensuring that
cooperative businesses have the same opportunities as other
businesses operating in the country and that consumers have
access to cooperatives in the marketplace. A U.S. National
Cooperative Bank was formed in the 1970s. By 2004, a new
association focused on worker co-ops were founded, the United
States Federation of Worker Cooperatives.
http://en.wikipedia.org/wiki/Cooperative
A cooperative is a legal entity owned and democratically
controlled by its members. Members often have a close association
with the enterprise as producers or consumers of its products or
services, or as its employees.
In some countries, e.g. Finland and Sweden, there are specific
forms of incorporation for cooperatives. Cooperatives may take
the form of companies limited by shares or by guarantee,
partnerships or unincorporated associations. In the UK they may
also use the industrial and provident society structure. In the
USA, cooperatives are often organized as non-capital stock
corporations under state-specific cooperative laws. However, they
may also be unincorporated associations or
business corporations such as limited liability companies
or partnerships; such forms are useful when the members want to
allow.
1.some members to have a greater share of the control, or
2.Some investors to have a return on their capital that
exceeds fixed interest,neither of which may be allowed
under local laws for cooperatives.
Cooperatives often share their earnings with the membership
as dividends, which are divided among the members according to
their participation in the enterprise, such as patronage,
instead of according to the value of their capital
shareholdings (as is done by a joint stock company).
Identity
Cooperatives are typically based on the cooperative values of
"self-help, self-responsibility, democracy and equality, equity
and solidarity" and the seven cooperative principles:
1.Voluntary and open membership
2.Democratic member control
3.Economic participation by members
4.Autonomy and independence
5.Education, training and information
6.Cooperation among cooperatives
7.Concern for community
Cooperatives are dedicated to the values of openness, social
responsibility and caring for others. Such legal entities have a
range of social characteristics. Membership is open, meaning that
anyone who satisfies certain non-discriminatory conditions may
join. Economic benefits are distributed proportionally to each
member's level of participation in the cooperative, for instance,
by a dividend on sales or purchases, rather than according
to capital invested.
Cooperatives may be classified as
either worker, consumer, producer, purchasing or housing cooperatives.
They are distinguished from other forms of incorporation in that
profit-making or economic stability are balanced by the interests
of the community. Co-ops can sometimes be identified on the
Internet through the use of the .coop suffix of internet
addresses. Organizations using .coop domain names must adhere to
the basic co-op values.
According to the definition of an article, “Management
Strategies”, cooperatives are the SHOs (Self-Help Organizations)
presently utilized by the government as the more effective tools
for economic development. The Cooperative Development Authority
(CDA), the government agency in charge of development and
monitoring cooperatives in the country gives this definition - a
voluntary organization of people who have agreed to pool their
resources together in order to undertake an economic enterprise
for the purpose of meeting their common needs, and which they
themselves democratically manage and control, and share the
economic benefits on the basis of participation and patronage.
In this definition, cooperatives are SHOs which are also
business enterprises which the members themselves own, manage and
control in accordance with accepted democratic principles. They
are not organized primarily for profit or to serve other people
but to serve the needs of their own members. Memberships in
cooperatives is voluntary and open to all those who need their
services. Finally, the economic benefits from cooperatives are
shared by the members in proportion to the individual member's
patronage of the business or enterprise.
A study of cooperatives in Uruguay, Burdín and Dean (2009)
show that during the 2002 Argentine financial crisis, worker
cooperatives decreased employment less than conventional firms.
They argue that conventional firms produce a socially inefficient
level of lay-offs during recessionary periods due to their
“inability to establish credible commitments between owners and
workers.” In contrast, cooperatives are more able to adjust wages
rather than employment during crises, which Burdín and Dean call
a more egalitarian adjustment method. Burdín (2012) looks at
cooperative and conventional firm survival in Uruguay. He finds
that cooperatives have a 24-38% lower hazard of exit than
conventional firms when controlling for other firm
characteristics. The study provides econometric support for the
aforementioned descriptive work done on cooperative survival in
various Canadian provinces.
In general, there are multiple strategies that firms can
follow to get new technology that they need to compete and to
grow. For example, firms can develop new patents, or license new
technology from another company. Cooperatives can and do pursue
these strategies, but in addition, cooperatives have comparative
advantages in certain types of innovation.
Theories of Co-operation
The history of the co-operative enterprise is intertwined
with the economic and social theories that have shaped the past
165 years of its existence. Compared with Marxism and its liberal
free market alternative, co-operative enterprise has remained
largely apolitical and pragmatic in nature. However, it has also
been weak in terms of the development of strong underlying
theory, due in part to its focus on applied and practical
outcomes.
Theories of co-operation and competition suggest that human behaviour
involving co-operative exchanges is motivated by desires for reward and self-
advancement rather than altruism. As such it is consistent with the
underlying principles of free market economics based on the
concept of self-advancement and reward seeking. In many cases co-
operative behaviour can serve as a means of reducing selfishness,
free riding and cheating within the system as individuals realise
that mutual benefits can emerge by collaborative engagement.
Theoretical foundations of co-operative behaviour can be
found in game theory and the notion of “tit-for-tat” responses to
free riding or cheating.
Faced with mutual reciprocity that can either reward co-operative behaviour or
punish selfishness the individual is more likely to choose a co-operative path.
Reciprocal altruism suggests that individuals who give or share
benefits with others expect a return from those who receive such
benevolence. Free riding and cheating can damage such reciprocal
behaviour and is more likely where the population is highly
mobile. In more stable communities such behaviour is quickly
punished by having these individuals excluded from further
participation in future collaboration.
Co-operation between individuals requires the existence of
mutual trust and a sense of procedural justice. Where a minority
of individuals behaves in a purely selfish manner without any
consequences the underlying sense of fairness, morality and
mutual obligation breakdown within the community and the majority
also begin to behave in a selfish manner.
The participation of individuals in co-operatives can be
explained in terms of the mutual incentives theory which draws together
theories of social exchange and social co-operation. The first
suggests that people engage in social relationships after
considering the costs and benefits of doing so. The second
suggests that co-operation is motivated by a sense of common or
shared goals between individuals.
Chapter 3
PRESENTATION, ANALYSIS AND INTERPRETATION OF DATA
This chapter contains the analysis and the interpretation of
data gathered.
Financial Condition
Table 1. Statement of Assets
Table 1 shows the statement of assets of Third District
Transport Cooperative (TDTC) from year 2009 up to 2013. In terms
of cash and cash equivalent from year 2009 to 2010 it increases
from 242,118.63 to 243,790.43 up to 2011 it decreases to
232,849.21 up to 2012 it continues to decrease to 71,033.35 but
in 2013 it increases back to 88,402.55 but it is smaller compared
to year 2009 and 2010. In terms of loans and receivables from
year 2009 to 2010 it decreases from 8,706,371.63 to 6,683,023.19
up to 2011 it increases back to 6,710,762.12 but decreases back
to 6,636,220.12 but it year 2013 it increases back to
6,687,135.97 but smaller compared in year 2009. From their
current assets, from the year 2009 to 2013, it decreases from
9,312,753.42 down to 6,874,538.50. In their non-current assets,
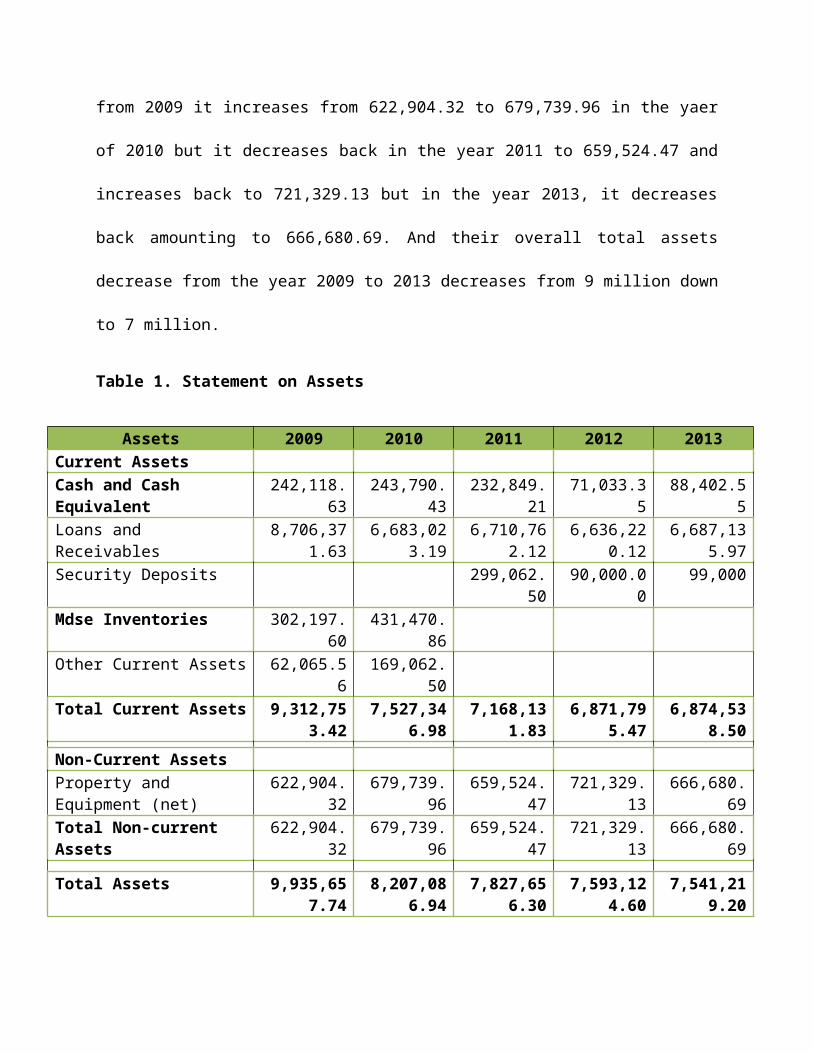
from 2009 it increases from 622,904.32 to 679,739.96 in the yaer
of 2010 but it decreases back in the year 2011 to 659,524.47 and
increases back to 721,329.13 but in the year 2013, it decreases
back amounting to 666,680.69. And their overall total assets
decrease from the year 2009 to 2013 decreases from 9 million down
to 7 million.
Table 1. Statement on Assets
Assets 2009 2010 2011 2012 2013Current AssetsCash and Cash Equivalent
242,118.63
243,790.43
232,849.21
71,033.35
88,402.55
Loans and Receivables
8,706,371.63
6,683,023.19
6,710,762.12
6,636,220.12
6,687,135.97
Security Deposits 299,062.50
90,000.00
99,000
Mdse Inventories 302,197.60
431,470.86
Other Current Assets 62,065.56
169,062.50
Total Current Assets 9,312,753.42
7,527,346.98
7,168,131.83
6,871,795.47
6,874,538.50
Non-Current AssetsProperty and Equipment (net)
622,904.32
679,739.96
659,524.47
721,329.13
666,680.69
Total Non-current Assets
622,904.32
679,739.96
659,524.47
721,329.13
666,680.69
Total Assets 9,935,657.74
8,207,086.94
7,827,656.30
7,593,124.60
7,541,219.20
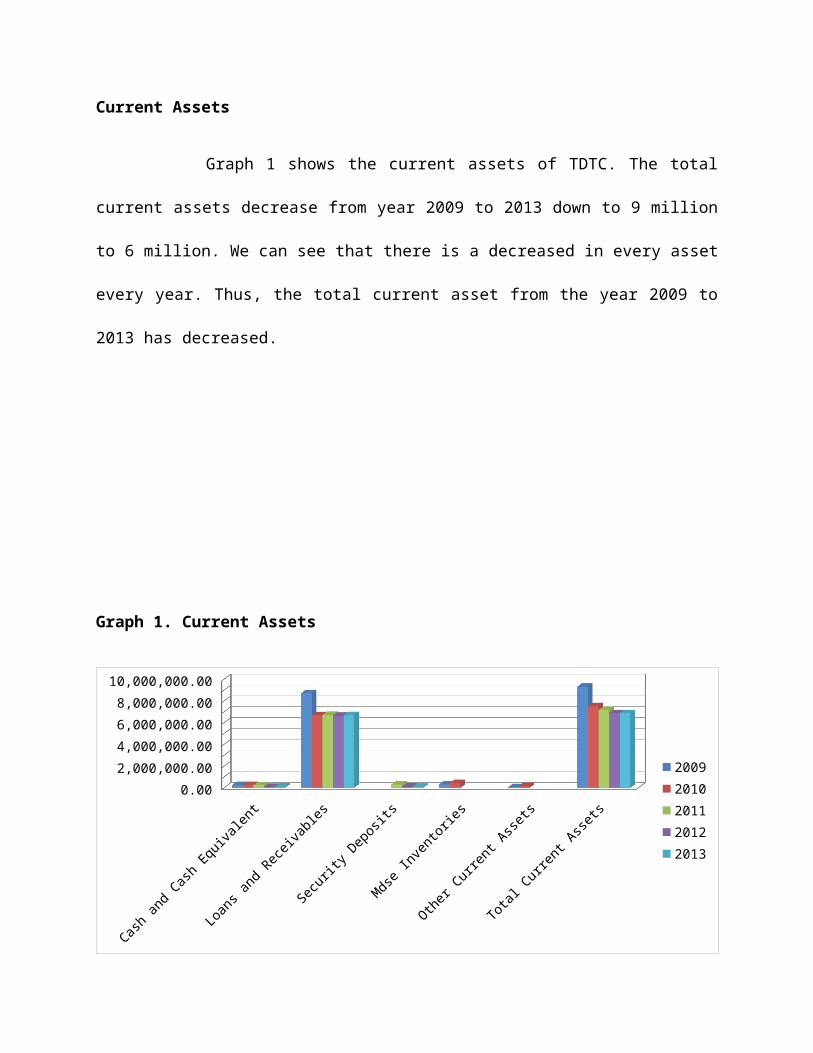
Current Assets
Graph 1 shows the current assets of TDTC. The total
current assets decrease from year 2009 to 2013 down to 9 million
to 6 million. We can see that there is a decreased in every asset
every year. Thus, the total current asset from the year 2009 to
2013 has decreased.
Graph 1. Current Assets
Cash and Cash Equivalent
Loans and Receivables
Security Deposits
Mdse Inventories
Other Current Assets
Total Current Assets
0.002,000,000.004,000,000.006,000,000.008,000,000.0010,000,000.00
20092010201120122013
Current Assets in Percentage
Graph 2 shows the current assets of Third District Transport
Cooperative (TDTC) from the year 2010 to 2013. In the year 2010
the total current asset has a percentage of 19.2%; in 2011 the
total current asset has a percentage of 23%; in 2012 the total
current asset has a percentage of 26.2%; in 2013 the total
current asset is still on its stable condition with a percentage
of 26.2%.
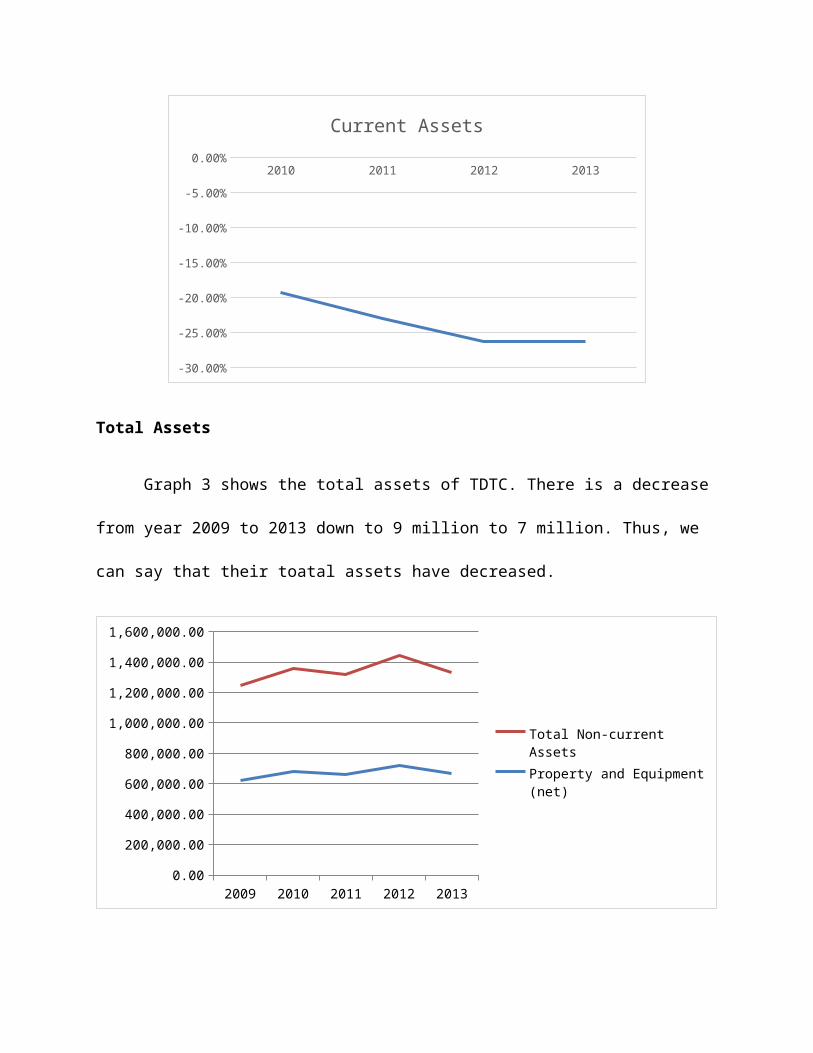
Graph 2. Current Assets in Percentage
2010 2011 2012 2013
-30.00%
-25.00%
-20.00%
-15.00%
-10.00%
-5.00%
0.00%
Current Assets
Total Assets
Graph 3 shows the total assets of TDTC. There is a decrease
from year 2009 to 2013 down to 9 million to 7 million. Thus, we
can say that their toatal assets have decreased.
2009 2010 2011 2012 20130.00
200,000.00
400,000.00
600,000.00
800,000.00
1,000,000.00
1,200,000.00
1,400,000.00
1,600,000.00
Total Non-current AssetsProperty and Equipment (net)
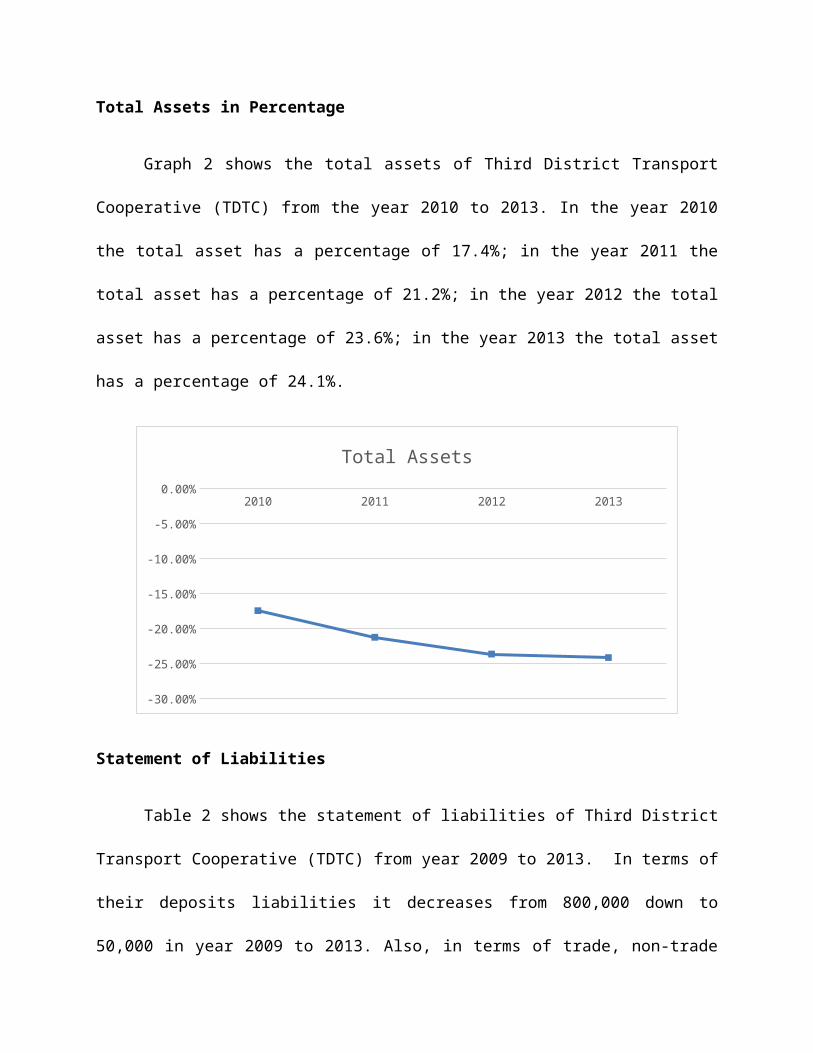
Total Assets in Percentage
Graph 2 shows the total assets of Third District Transport
Cooperative (TDTC) from the year 2010 to 2013. In the year 2010
the total asset has a percentage of 17.4%; in the year 2011 the
total asset has a percentage of 21.2%; in the year 2012 the total
asset has a percentage of 23.6%; in the year 2013 the total asset
has a percentage of 24.1%.
2010 2011 2012 2013
-30.00%
-25.00%
-20.00%
-15.00%
-10.00%
-5.00%
0.00%
Total Assets
Statement of Liabilities
Table 2 shows the statement of liabilities of Third District
Transport Cooperative (TDTC) from year 2009 to 2013. In terms of
their deposits liabilities it decreases from 800,000 down to
50,000 in year 2009 to 2013. Also, in terms of trade, non-trade
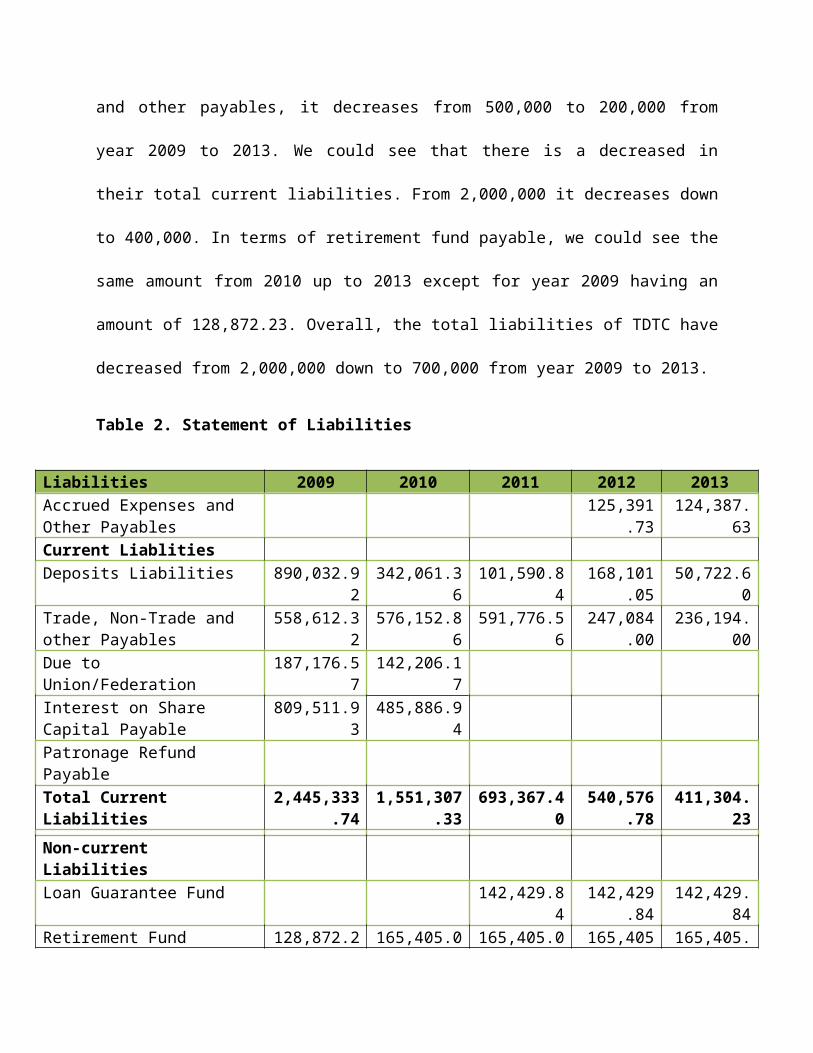
and other payables, it decreases from 500,000 to 200,000 from
year 2009 to 2013. We could see that there is a decreased in
their total current liabilities. From 2,000,000 it decreases down
to 400,000. In terms of retirement fund payable, we could see the
same amount from 2010 up to 2013 except for year 2009 having an
amount of 128,872.23. Overall, the total liabilities of TDTC have
decreased from 2,000,000 down to 700,000 from year 2009 to 2013.
Table 2. Statement of Liabilities
Liabilities 2009 2010 2011 2012 2013Accrued Expenses and Other Payables
125,391.73
124,387.63
Current LiablitiesDeposits Liabilities 890,032.9
2342,061.3
6101,590.8
4168,101
.0550,722.6
0Trade, Non-Trade and other Payables
558,612.32
576,152.86
591,776.56
247,084.00
236,194.00
Due to Union/Federation
187,176.57
142,206.17
Interest on Share Capital Payable
809,511.93
485,886.94
Patronage Refund PayableTotal Current Liabilities
2,445,333.74
1,551,307.33
693,367.40
540,576.78
411,304.23
Non-current LiabilitiesLoan Guarantee Fund 142,429.8
4142,429
.84142,429.
84Retirement Fund 128,872.2 165,405.0 165,405.0 165,405 165,405.
Payable 3 8 8 .08 08Total Non-current Liabilities
128,872.23
165,405.08
307,834.92
307,834.92
307,834.92
Total Liabilities 2,574,205.97
1,716,712.41
1,001,202.03
848,411.07
719,139.15
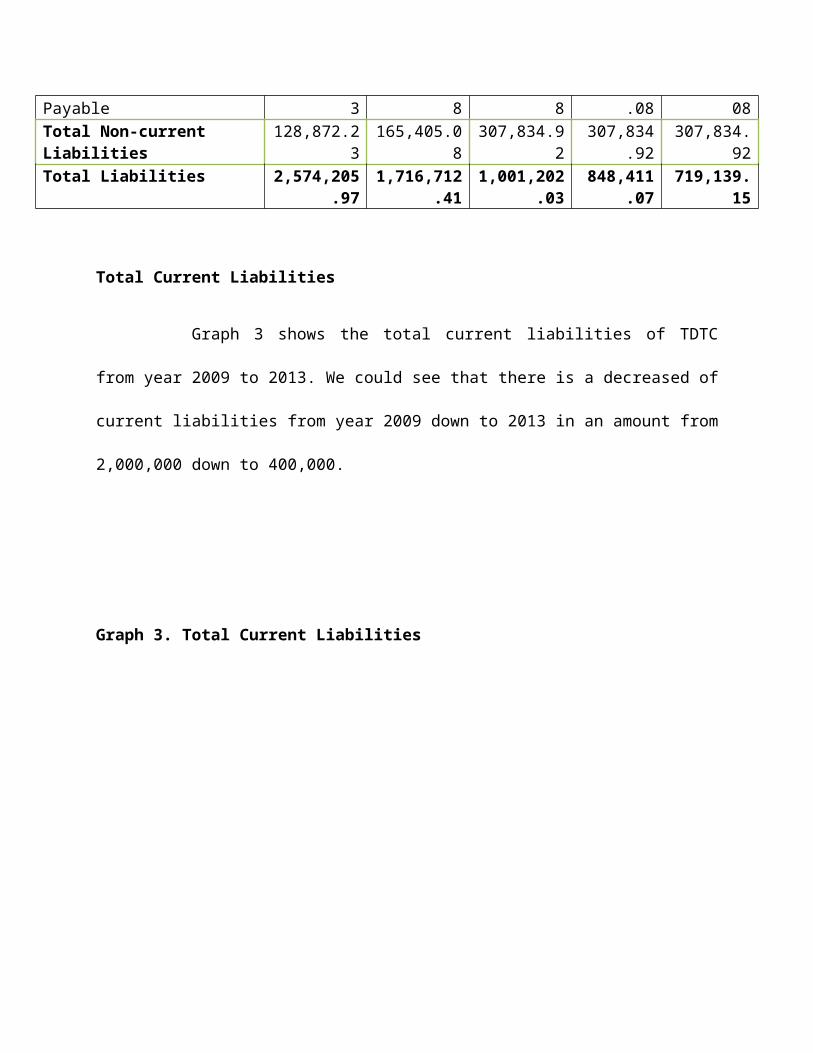
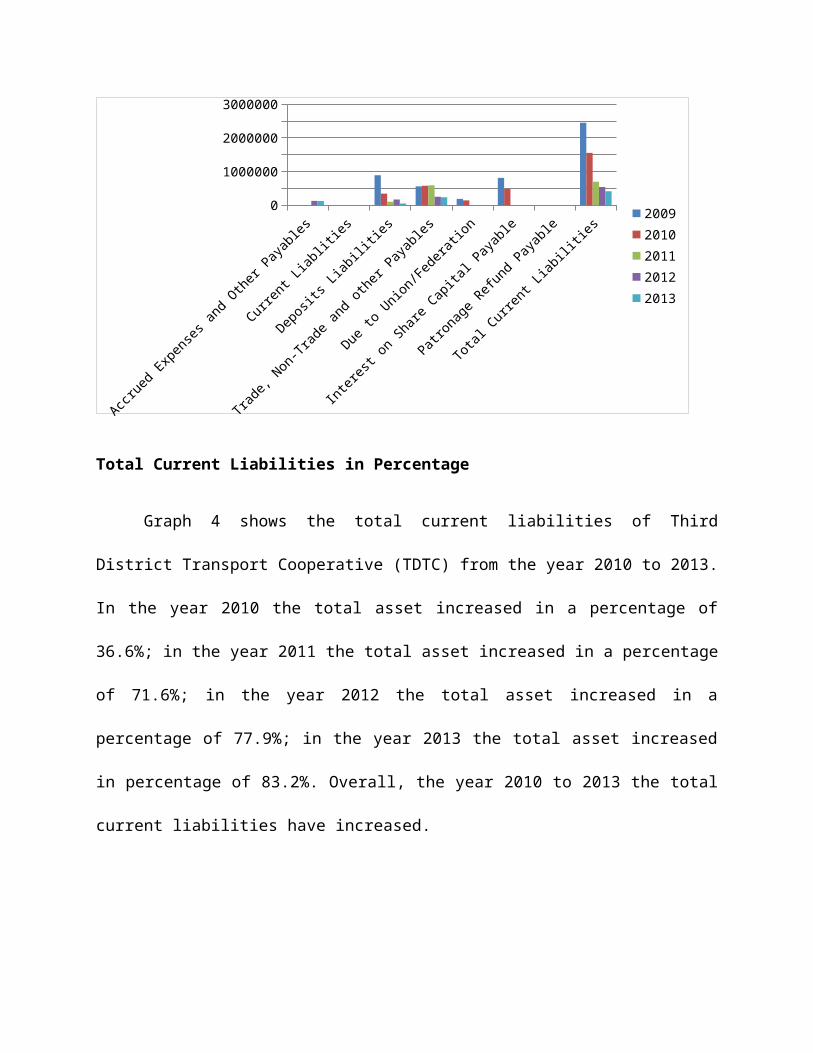
Total Current Liabilities
Graph 3 shows the total current liabilities of TDTC
from year 2009 to 2013. We could see that there is a decreased of
current liabilities from year 2009 down to 2013 in an amount from
2,000,000 down to 400,000.
Graph 3. Total Current Liabilities
0
1000000
2000000
3000000
20092010201120122013
Total Current Liabilities in Percentage
Graph 4 shows the total current liabilities of Third
District Transport Cooperative (TDTC) from the year 2010 to 2013.
In the year 2010 the total asset increased in a percentage of
36.6%; in the year 2011 the total asset increased in a percentage
of 71.6%; in the year 2012 the total asset increased in a
percentage of 77.9%; in the year 2013 the total asset increased
in percentage of 83.2%. Overall, the year 2010 to 2013 the total
current liabilities have increased.
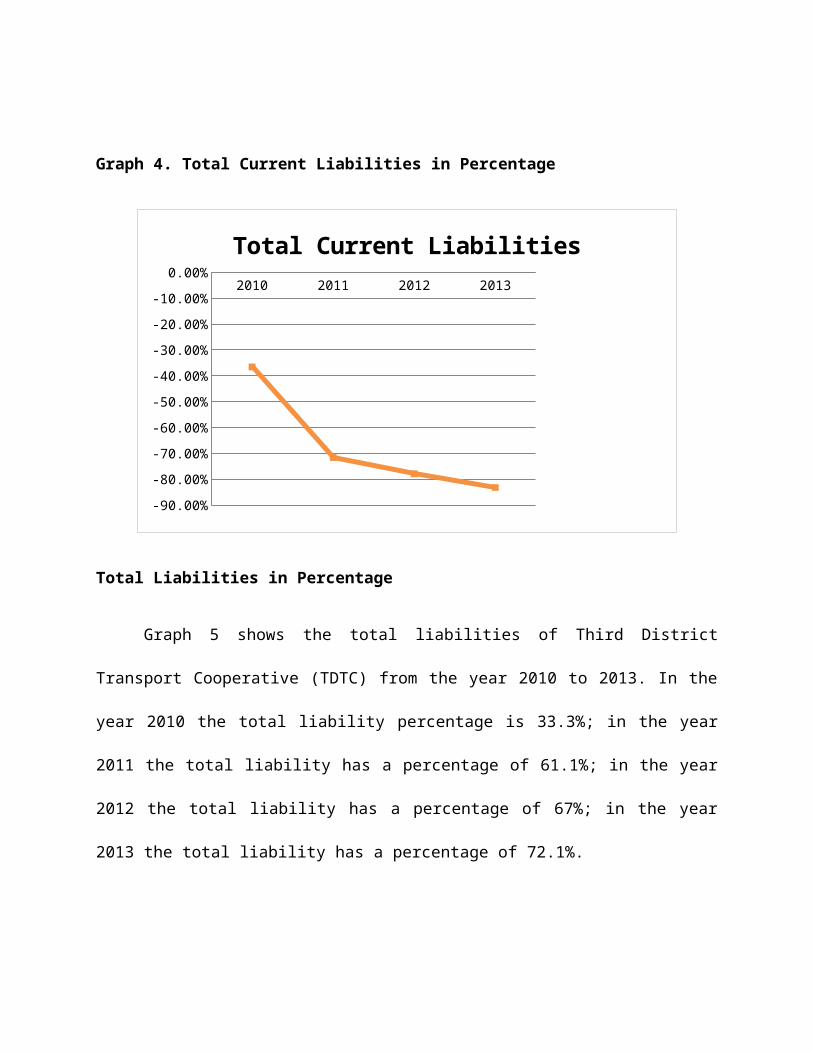
Graph 4. Total Current Liabilities in Percentage
2010 2011 2012 2013
-90.00%-80.00%-70.00%-60.00%-50.00%-40.00%-30.00%-20.00%-10.00%0.00%
Total Current Liabilities
Total Liabilities in Percentage
Graph 5 shows the total liabilities of Third District
Transport Cooperative (TDTC) from the year 2010 to 2013. In the
year 2010 the total liability percentage is 33.3%; in the year
2011 the total liability has a percentage of 61.1%; in the year
2012 the total liability has a percentage of 67%; in the year
2013 the total liability has a percentage of 72.1%.
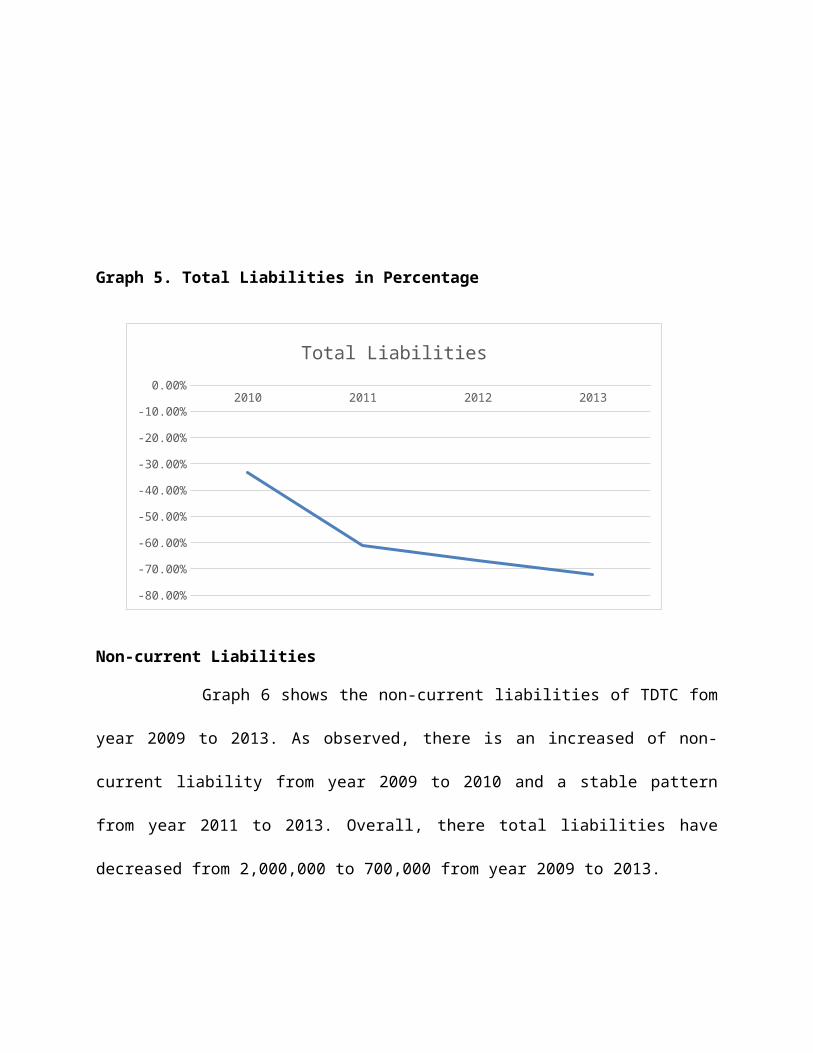
Graph 5. Total Liabilities in Percentage
2010 2011 2012 2013
-80.00%
-70.00%
-60.00%
-50.00%
-40.00%
-30.00%
-20.00%
-10.00%
0.00%
Total Liabilities
Non-current Liabilities
Graph 6 shows the non-current liabilities of TDTC fom
year 2009 to 2013. As observed, there is an increased of non-
current liability from year 2009 to 2010 and a stable pattern
from year 2011 to 2013. Overall, there total liabilities have
decreased from 2,000,000 to 700,000 from year 2009 to 2013.
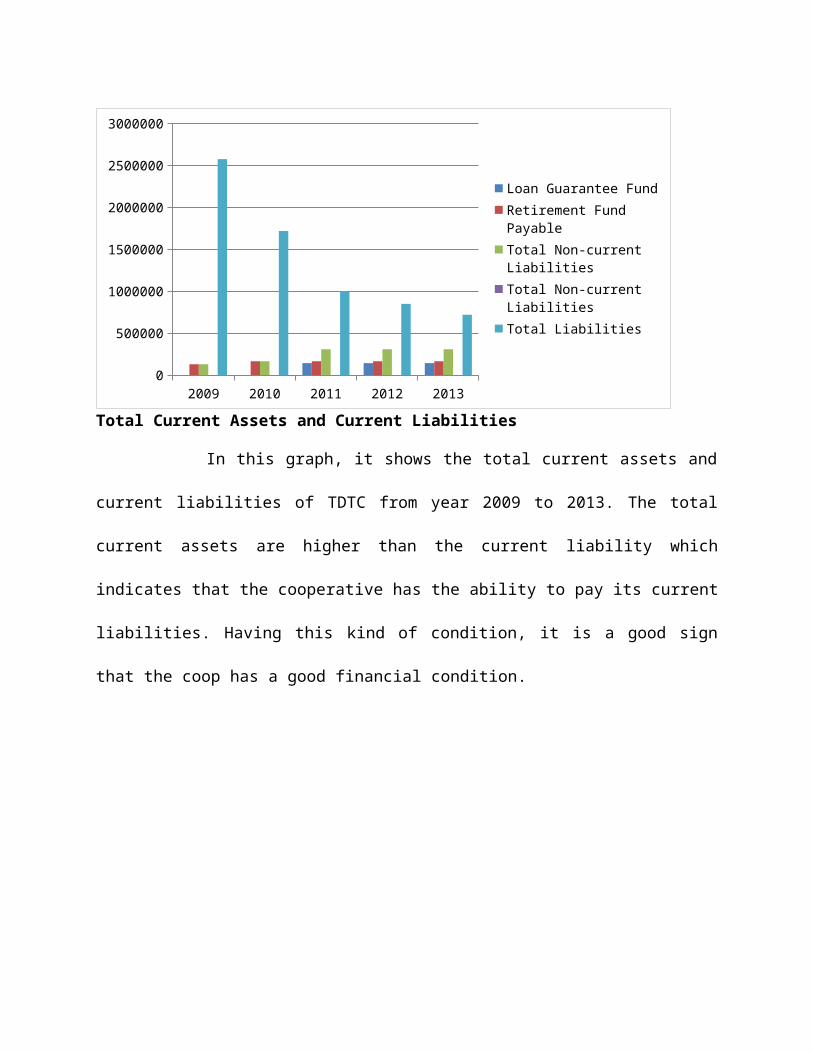
Total Current Assets and Current Liabilities
In this graph, it shows the total current assets and
current liabilities of TDTC from year 2009 to 2013. The total
current assets are higher than the current liability which
indicates that the cooperative has the ability to pay its current
liabilities. Having this kind of condition, it is a good sign
that the coop has a good financial condition.
2009 2010 2011 2012 20130
500000
1000000
1500000
2000000
2500000
3000000
Loan Guarantee FundRetirement Fund PayableTotal Non-current LiabilitiesTotal Non-current LiabilitiesTotal Liabilities
2009 2010 2011 2012 20130.00
1,000,000.002,000,000.003,000,000.004,000,000.005,000,000.006,000,000.007,000,000.008,000,000.009,000,000.0010,000,000.00
Total Current AssetsTotal Current Liabilities
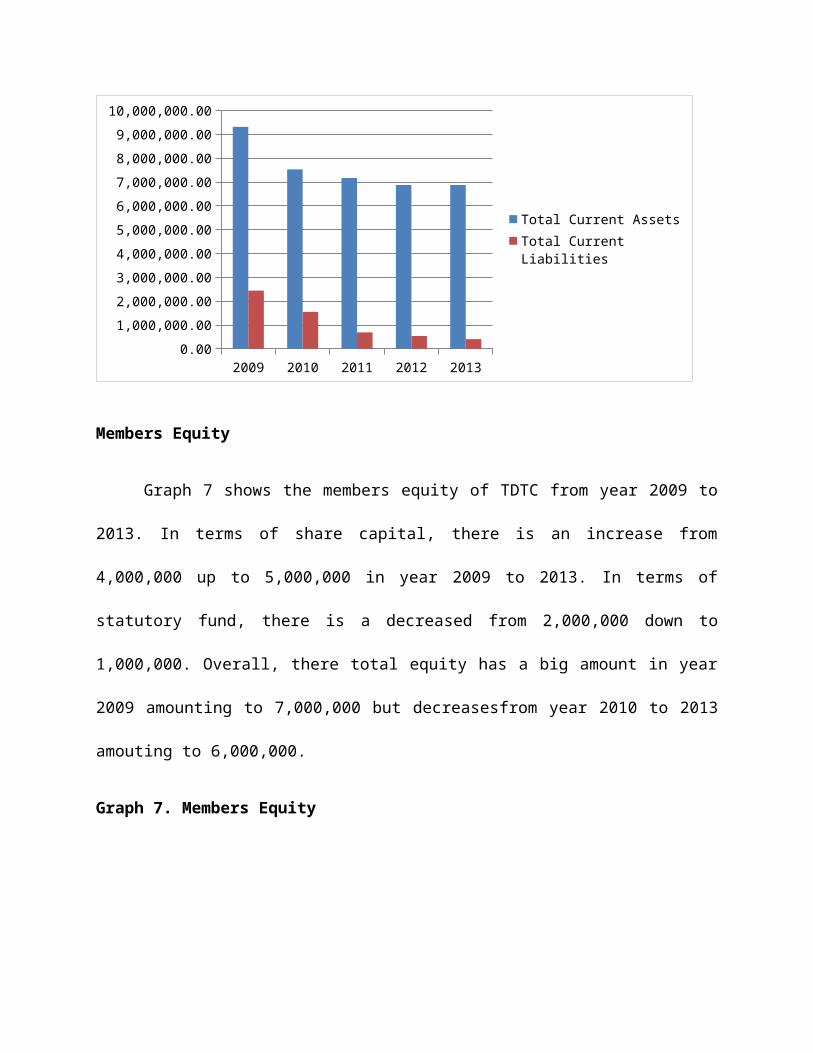
Members Equity
Graph 7 shows the members equity of TDTC from year 2009 to
2013. In terms of share capital, there is an increase from
4,000,000 up to 5,000,000 in year 2009 to 2013. In terms of
statutory fund, there is a decreased from 2,000,000 down to
1,000,000. Overall, there total equity has a big amount in year
2009 amounting to 7,000,000 but decreasesfrom year 2010 to 2013
amouting to 6,000,000.
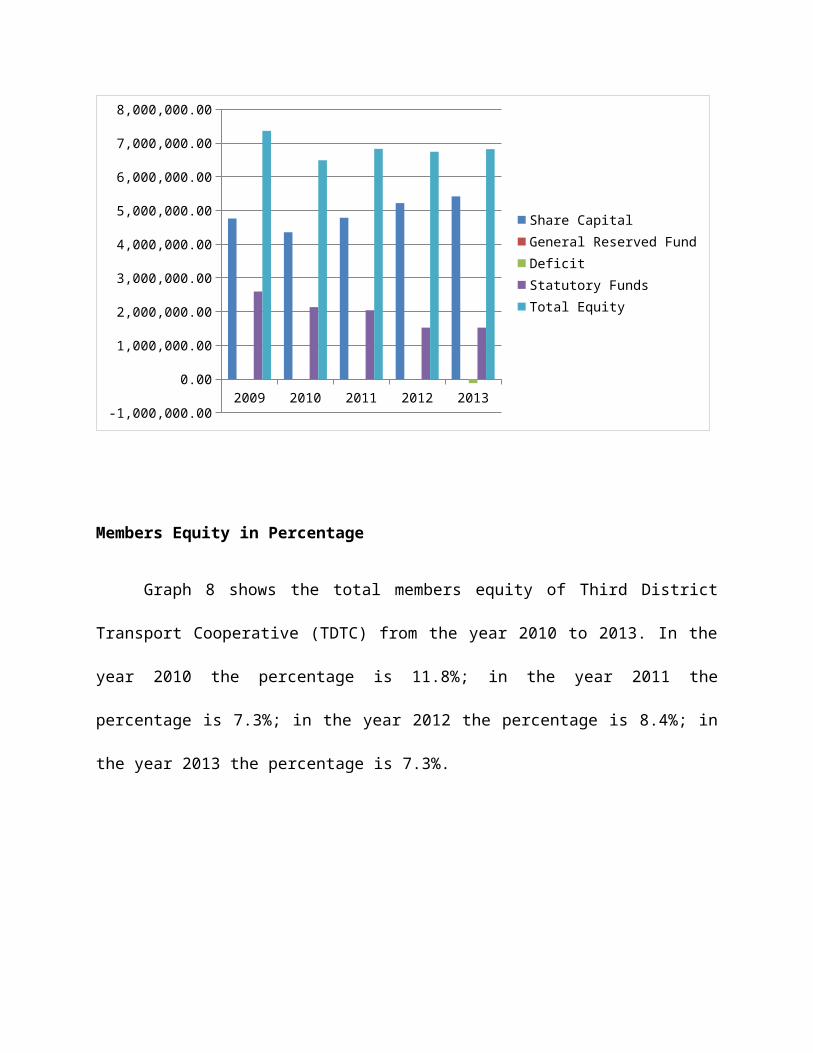
Graph 7. Members Equity
2009 2010 2011 2012 2013-1,000,000.00
0.00
1,000,000.00
2,000,000.00
3,000,000.00
4,000,000.00
5,000,000.00
6,000,000.00
7,000,000.00
8,000,000.00
Share CapitalGeneral Reserved FundDeficitStatutory FundsTotal Equity
Members Equity in Percentage
Graph 8 shows the total members equity of Third District
Transport Cooperative (TDTC) from the year 2010 to 2013. In the
year 2010 the percentage is 11.8%; in the year 2011 the
percentage is 7.3%; in the year 2012 the percentage is 8.4%; in
the year 2013 the percentage is 7.3%.
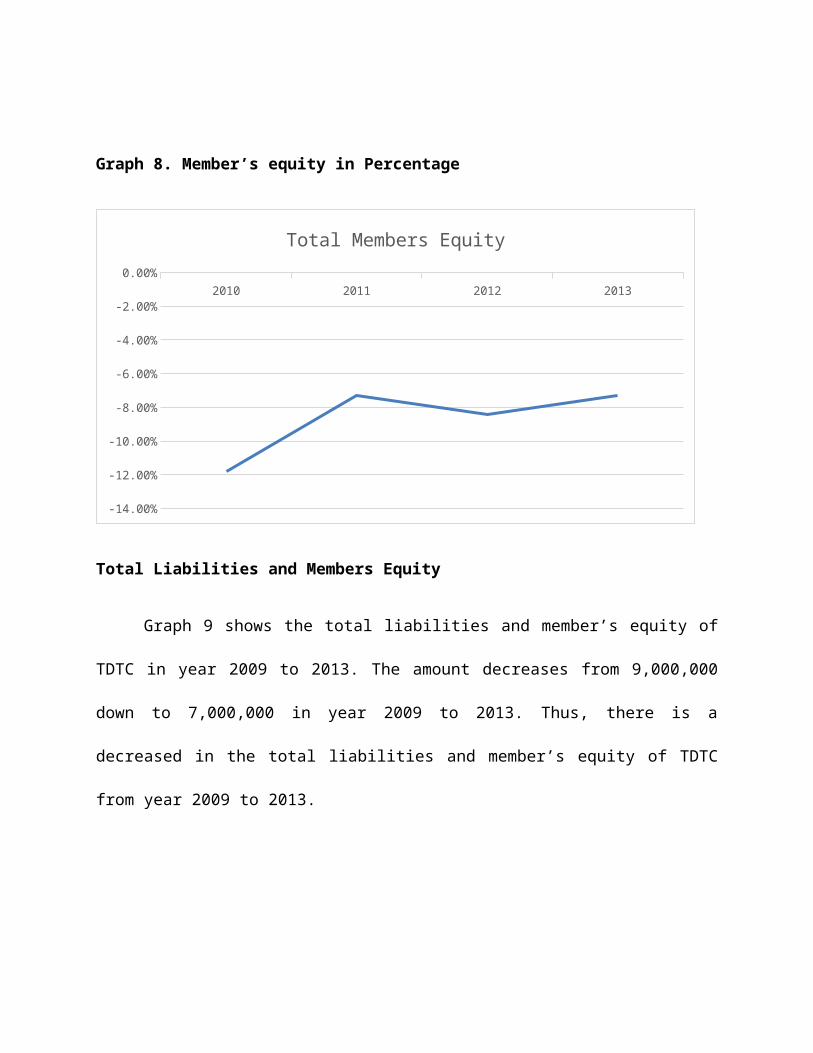
Graph 8. Member’s equity in Percentage
2010 2011 2012 2013
-14.00%
-12.00%
-10.00%
-8.00%
-6.00%
-4.00%
-2.00%
0.00%
Total Members Equity
Total Liabilities and Members Equity
Graph 9 shows the total liabilities and member’s equity of
TDTC in year 2009 to 2013. The amount decreases from 9,000,000
down to 7,000,000 in year 2009 to 2013. Thus, there is a
decreased in the total liabilities and member’s equity of TDTC
from year 2009 to 2013.
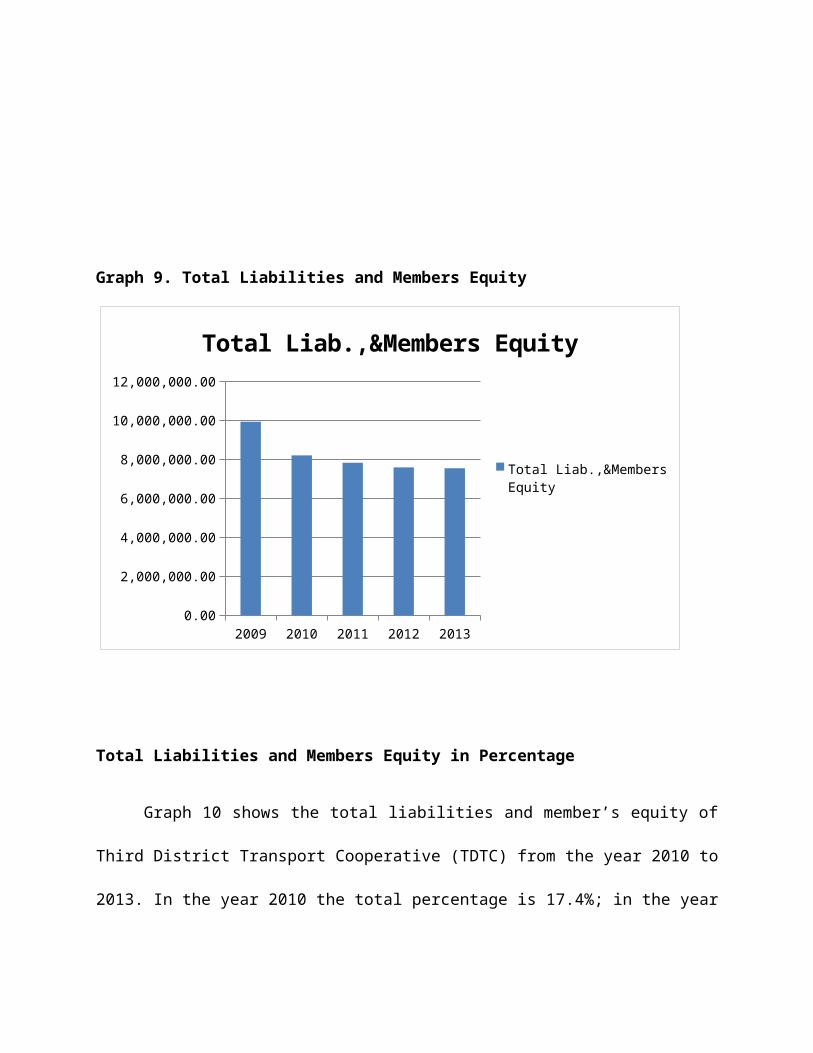
Graph 9. Total Liabilities and Members Equity
Total Liabilities and Members Equity in Percentage
Graph 10 shows the total liabilities and member’s equity of
Third District Transport Cooperative (TDTC) from the year 2010 to
2013. In the year 2010 the total percentage is 17.4%; in the year
2009 2010 2011 2012 20130.00
2,000,000.00
4,000,000.00
6,000,000.00
8,000,000.00
10,000,000.00
12,000,000.00
Total Liab.,&Members Equity
Total Liab.,&Members Equity
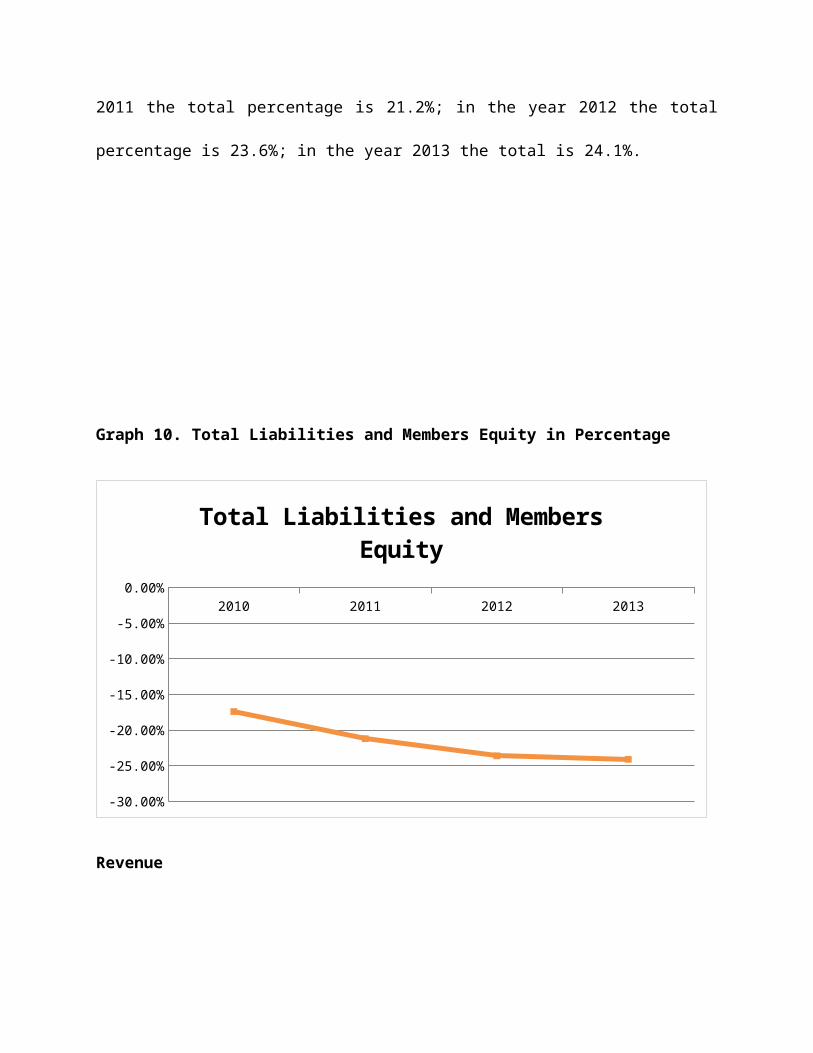
2011 the total percentage is 21.2%; in the year 2012 the total
percentage is 23.6%; in the year 2013 the total is 24.1%.
Graph 10. Total Liabilities and Members Equity in Percentage
2010 2011 2012 2013
-30.00%
-25.00%
-20.00%
-15.00%
-10.00%
-5.00%
0.00%
Total Liabilities and Members Equity
Revenue
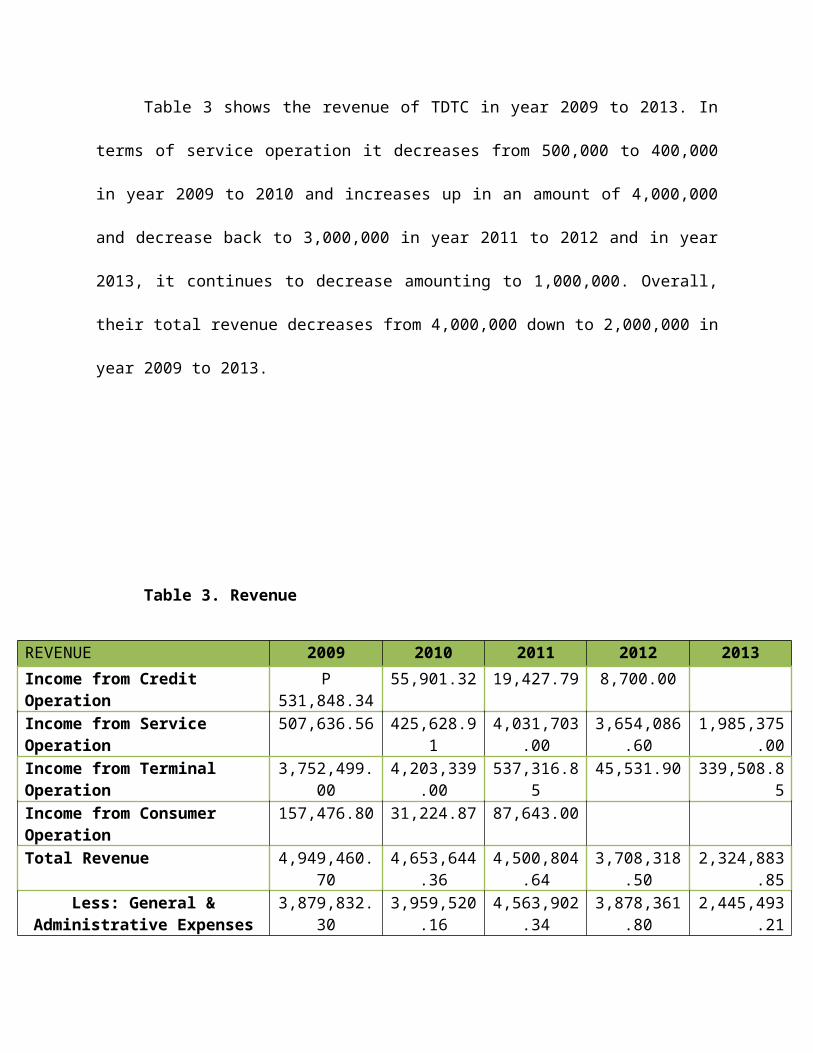
Table 3 shows the revenue of TDTC in year 2009 to 2013. In
terms of service operation it decreases from 500,000 to 400,000
in year 2009 to 2010 and increases up in an amount of 4,000,000
and decrease back to 3,000,000 in year 2011 to 2012 and in year
2013, it continues to decrease amounting to 1,000,000. Overall,
their total revenue decreases from 4,000,000 down to 2,000,000 in
year 2009 to 2013.
Table 3. Revenue
REVENUE 2009 2010 2011 2012 2013Income from Credit Operation
P531,848.34
55,901.32 19,427.79 8,700.00
Income from Service Operation
507,636.56 425,628.91
4,031,703.00
3,654,086.60
1,985,375.00
Income from Terminal Operation
3,752,499.00
4,203,339.00
537,316.85
45,531.90 339,508.85
Income from Consumer Operation
157,476.80 31,224.87 87,643.00
Total Revenue 4,949,460.70
4,653,644.36
4,500,804.64
3,708,318.50
2,324,883.85
Less: General &Administrative Expenses
3,879,832.30
3,959,520.16
4,563,902.34
3,878,361.80
2,445,493.21
Net Surplus P1,069,628.
40
649,124.20
63,097.70 -170,043.3
0
-120,609.4
4
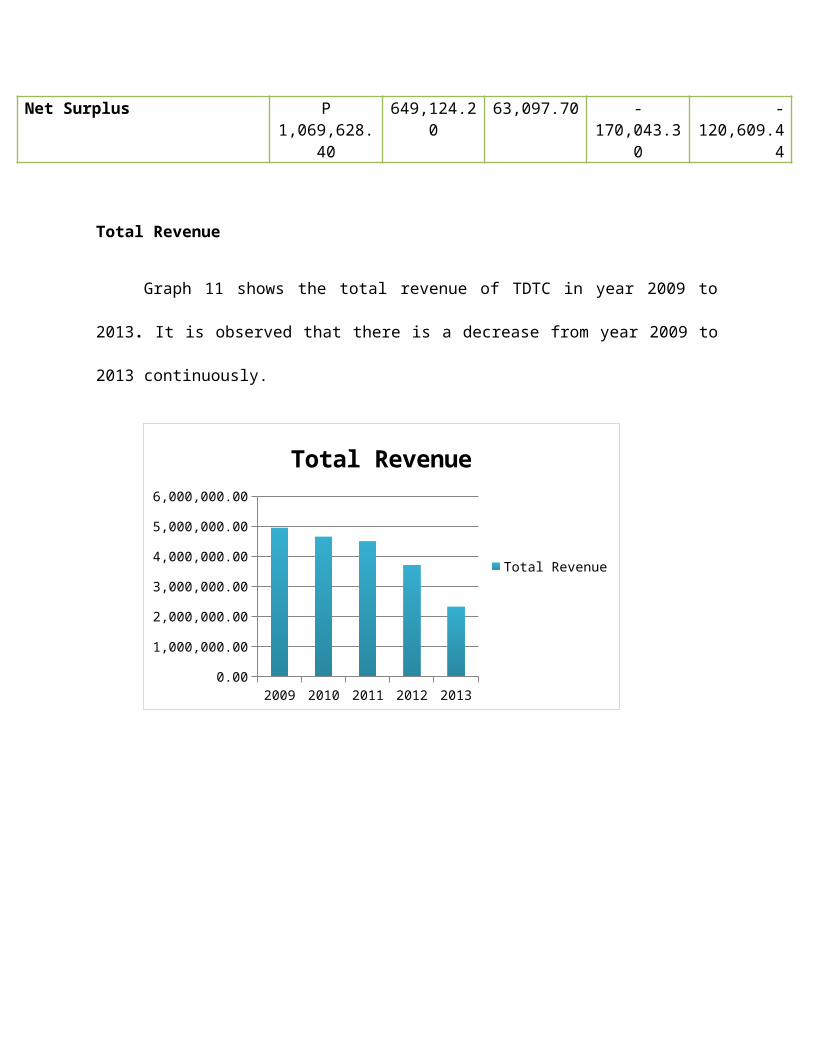
Total Revenue
Graph 11 shows the total revenue of TDTC in year 2009 to
2013. It is observed that there is a decrease from year 2009 to
2013 continuously.
2009 2010 2011 2012 20130.00
1,000,000.00
2,000,000.00
3,000,000.00
4,000,000.00
5,000,000.00
6,000,000.00
Total Revenue
Total Revenue
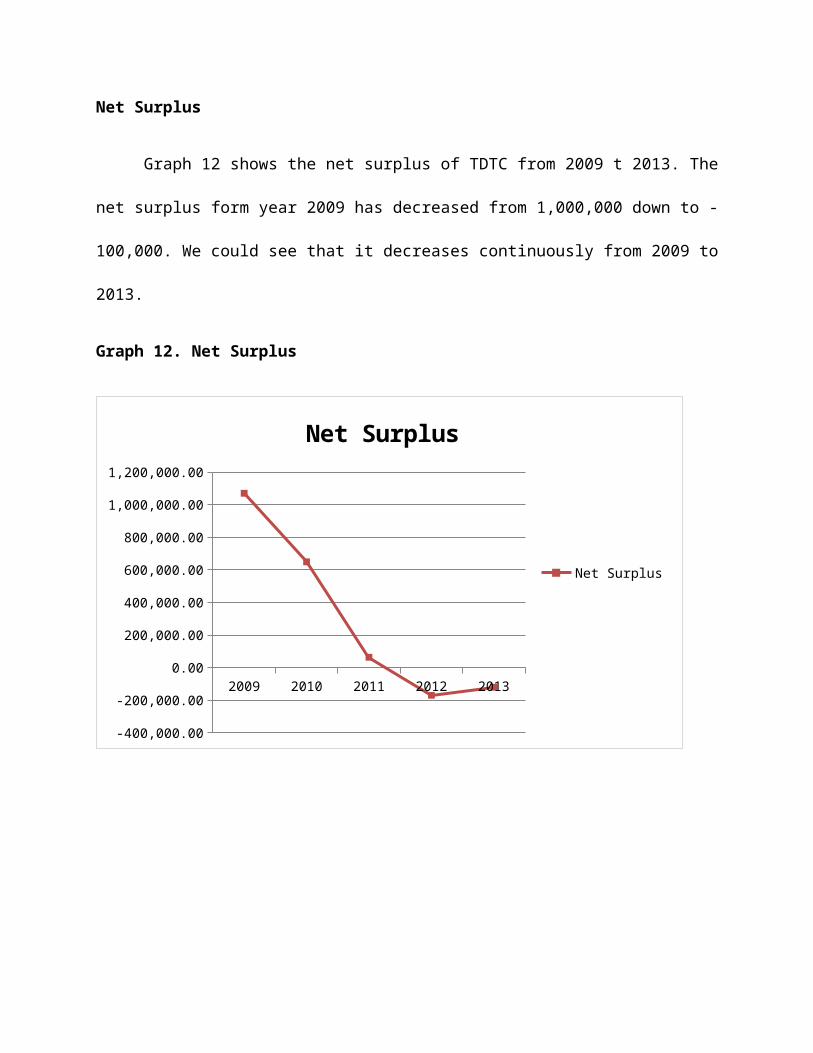
Net Surplus
Graph 12 shows the net surplus of TDTC from 2009 t 2013. The
net surplus form year 2009 has decreased from 1,000,000 down to -
100,000. We could see that it decreases continuously from 2009 to
2013.
Graph 12. Net Surplus
2009 2010 2011 2012 2013
-400,000.00
-200,000.00
0.00
200,000.00
400,000.00
600,000.00
800,000.00
1,000,000.00
1,200,000.00
Net Surplus
Net Surplus
Chapter IV
SUMMARY OF FINDINGS, CONCLUSIONS AND RECOMMENDATIONS
Presented in this chapter are the summary of findings,
conclusion and recommendations based on the results on the
analysis and interpretation of data.
Summary of Findings
Statement of Assets
The current assets of Third District Transport Cooperative
(TDTC) have been decreasing from year 2009 down to 2013. From its
loans and receivable, it is good that they have lessened it every
year. Also, the total current assets are higher than the current
liability which indicates that the cooperative has the ability to
pay its current liabilities. In linw with this, it is a good sign
that the coop has a good financial condition. It has also been
observed that there is a decrease in total assets every year of
the cooperative. But good thing is that their liability is not
increasing but decreasing.
Statement of Liabilities
The total liabilties of the cooperative have been
decreasing every year. It is a good sign that they have been able
to pay their liabilities and lessened it. In comparing their
current assets and current liabilities, their assets are higher
than current liabilities.
Members Equity
It is observed that their sharing of capital is
increasing. And their total equity is high in year 2009 compared
in year 2011 to 2013.
Revenue
It is observed that the total revenue of the
cooperative has been decreasing continuously every year. In this
situation, it is alarming if the revenue continues to decrease on
the following year. The financial ability of the cooperative
would be at risk if this may happen.
Net surplus
Referring to graph 12, the net surplus has been
decreasing from year 2009 down to 2013.
Conclusion
The current assets of Third District Transport Cooperative
(TDTC) have been decreasing from year 2009 down to 2013.
The total liabilties of the cooperative have been decreasing
every year.
It is observed that their sharing of capital is increasing.
It is observed that the total revenue of the cooperative has
been decreasing continuously every year.
The net surplus has been decreasing from year 2009 down to
2013.
Recommendation
The cooperative board of members must take an action on the
decreasing revenue of the cooperative. In order to avoid a
continuous decrease every year.
A systematic review and appraisal of the cooperative in
relation to the development of its most essential building
blocks-its members, its people, and its distinctive
contribution to the development of its community and society
as a whole.
Related Documents