Ž . Marine Chemistry 73 2001 153–171 www.elsevier.nlrlocatermarchem Transport and diagenesis of trace metals and organic matter in Palos Verdes shelf sediments affected by a wastewater outfall Peter H. Santschi ) , Liang-Saw Wen 1 , Laodong Guo 2 Laboratory for Oceanographic and EnÕironmental Research, Texas A & M UniÕersity, 5007, AÕe U, GalÕeston, TX 77551, USA Received 4 April 2000; received in revised form 21 September 2000; accepted 28 September 2000 Abstract Ž . Particles from the Whites PointrJWPCP outfalls operated by the Los Angeles County Sanitation District LACSD have Ž . been discharged onto the Palos Verdes PV shelf, Southern California, since the late 1930s. Since the early 1950s, they have made a significant contribution to the sedimentary deposits on the shelf. In order to study the transport and diagenesis of Ž . organic carbon OC and associated trace metals, replicate sediment cores were collected during 1996 and 1997 at four different sites at the ;60 m isobath on the PV shelf, and analyzed for OC, Ag, Al, Cd, Cr, Cu, Mn, Ni, Pb, and Zn. We conclude from these results that a significant fraction of OC and associated heavy metals were transported laterally on silt particles from shallower environments. Cross-shelf transport of sediments caused multiple peaks in measured profiles of OC and trace metals at site 6C, 2 km away from the outfall. The same mechanism is likely to contribute to a concentration decrease that is smaller than that expected from decreases from the Whites Point outfall emissions. Based on PbrOC ratios in sediments, deposited in 1971, and comparisons to the outfall from the same year, we estimate that 50 "10% of the OC deposited in the early 1970s, now buried at 30–50 cm depth, had oxidized since that time, implying a half-life of about 26 Ž y2 y1 . years for the outfall-OC, as an upper limit. The average OC oxidation rate at peak depth about 2 mg C cm year is, Ž y2 y1 . however, only about 10% of the present-day OC accumulation rate 20 mg C cm year , which itself is adding not much Ž y2 . more than 1% per year to the post-1950s OC inventory ;1500 mg cm . We furthermore estimate that the OC inventory in PV shelf sediments in 1971 was equivalent to about 35% of that emitted by the outfall. OC and trace metal inventories did not decrease in the period 1981 to 1997, contrary to those of other contaminants such as DDTs and PCBs. q 2001 Elsevier Science B.V. All rights reserved. Keywords: Trace metals; Organic matter; Shelf sediments; Sediment transport; Sediment diagenesis; Palos Verdes shelf ) Corresponding author. Tel.: q 1-409-740-4476; fax: q 1-409-740-4786. Ž . Ž . Ž . E-mail addresses: [email protected] P.H. Santschi , [email protected] L.-S. Wen , [email protected] L. Guo . 1 Present Address: National Centre for Ocean Research, National Taiwan University, Taipei, Taiwan, R.O.C. 2 Present Address: International Arctic Research Centre, University of Alaska, Fairbanks, AK, 99750, USA. 0304-4203r01r$ - see front matter q 2001 Elsevier Science B.V. All rights reserved. Ž . PII: S0304-4203 00 00102-X

Welcome message from author
This document is posted to help you gain knowledge. Please leave a comment to let me know what you think about it! Share it to your friends and learn new things together.
Transcript
Ž .Marine Chemistry 73 2001 153–171www.elsevier.nlrlocatermarchem
Transport and diagenesis of trace metals and organic matter inPalos Verdes shelf sediments affected by a wastewater outfall
Peter H. Santschi), Liang-Saw Wen 1, Laodong Guo 2
Laboratory for Oceanographic and EnÕironmental Research, Texas A&M UniÕersity, 5007, AÕe U,GalÕeston, TX 77551, USA
Received 4 April 2000; received in revised form 21 September 2000; accepted 28 September 2000
Abstract
Ž .Particles from the Whites PointrJWPCP outfalls operated by the Los Angeles County Sanitation District LACSD haveŽ .been discharged onto the Palos Verdes PV shelf, Southern California, since the late 1930s. Since the early 1950s, they have
made a significant contribution to the sedimentary deposits on the shelf. In order to study the transport and diagenesis ofŽ .organic carbon OC and associated trace metals, replicate sediment cores were collected during 1996 and 1997 at four
different sites at the ;60 m isobath on the PV shelf, and analyzed for OC, Ag, Al, Cd, Cr, Cu, Mn, Ni, Pb, and Zn. Weconclude from these results that a significant fraction of OC and associated heavy metals were transported laterally on siltparticles from shallower environments. Cross-shelf transport of sediments caused multiple peaks in measured profiles of OCand trace metals at site 6C, 2 km away from the outfall. The same mechanism is likely to contribute to a concentrationdecrease that is smaller than that expected from decreases from the Whites Point outfall emissions. Based on PbrOC ratiosin sediments, deposited in 1971, and comparisons to the outfall from the same year, we estimate that 50"10% of the OCdeposited in the early 1970s, now buried at 30–50 cm depth, had oxidized since that time, implying a half-life of about 26
Ž y2 y1.years for the outfall-OC, as an upper limit. The average OC oxidation rate at peak depth about 2 mg C cm year is,Ž y2 y1.however, only about 10% of the present-day OC accumulation rate 20 mg C cm year , which itself is adding not much
Ž y2 .more than 1% per year to the post-1950s OC inventory ;1500 mg cm . We furthermore estimate that the OC inventoryin PV shelf sediments in 1971 was equivalent to about 35% of that emitted by the outfall. OC and trace metal inventories didnot decrease in the period 1981 to 1997, contrary to those of other contaminants such as DDTs and PCBs. q 2001 ElsevierScience B.V. All rights reserved.
Keywords: Trace metals; Organic matter; Shelf sediments; Sediment transport; Sediment diagenesis; Palos Verdes shelf
) Corresponding author. Tel.: q1-409-740-4476; fax: q1-409-740-4786.Ž . Ž . Ž .E-mail addresses: [email protected] P.H. Santschi , [email protected] L.-S. Wen , [email protected] L. Guo .
1 Present Address: National Centre for Ocean Research, National Taiwan University, Taipei, Taiwan, R.O.C.2 Present Address: International Arctic Research Centre, University of Alaska, Fairbanks, AK, 99750, USA.
0304-4203r01r$ - see front matter q 2001 Elsevier Science B.V. All rights reserved.Ž .PII: S0304-4203 00 00102-X
( )P.H. Santschi et al.rMarine Chemistry 73 2001 153–171154
1. Introduction
Submarine discharges of sewage and wastewateron continental shelves are conducted by a number oflarge cities in the world. One such treated wastewa-ter discharge is near Whites Point, on the Palos
Ž .Verdes PV shelf near San Pedro, CA, operated byŽ .the Los Angeles County Sanitation District LACSD .
The currently used outfalls are located at a depth ofabout 60 m and below the pycnocline. The effluent isdispersed in a general northwest direction by theprevailing bottom currents. Before 1971, the sedi-ments contained relatively high concentrations of alarge number of pollutants such as the chlorinated
Žhydrocarbon DDTs Young et al., 1977; Eganhouseand Kaplan, 1982, 1988; Schafer, 1989; Lee, 1994;Eganhouse and Pontolillo, 2000; Eganhouse et al.,
. Ž2000 and heavy metals Morel et al., 1975; Finney.and Huh, 1989; Huh et al., 1992 . Fluxes of pollu-
tants to the sediments have declined since about thatŽtime e.g., Young et al., 1977; Schafer, 1977, 1989;
.Lee, 1994; Carry, 1996; Stull et al., 1996 . Cur-rently, the highest concentrations of these com-pounds are found buried at 30–50 cm below thesediment–water interface. Some of the concentra-tions and sediment inventories of organic com-pounds, such as DDTs, have declined since 1971 by
Ž .50% or more Lee, 1994 , possibly due to microbialŽ .degradation Quensen et al., 1998 . Marine sedi-
ments are thus expected to contain a record of thesechemical inputs, possibly modified by microbiallycontrolled diagenetic reactions related to organic car-
Ž .bon OC oxidation.Previous studies have contributed a great deal to
our understanding of the impact of these buriedmaterials to the coastal environment. For example,
Ž .the physical circulation Hickey, 1992 , geologyŽ .Gorsline, 1992; Huh et al., 1990 , sediment
Žgeochronology Finney and Huh, 1989; Huh et al.,.1990, 1992; Wong et al., 1992 , and organic matter
Žcycling Venkatesan and Kaplan, 1980; Williams et.al., 1992 in the California Borderlands basins of the
Southern California Bight have been described in theliterature. Published accounts on the PV shelf areainclude also the effects of waste water disposal to the
Žcoastal waters of Southern California for anoverview, see Bascom, 1982; for SDDT com-pounds, and other organic chemicals, see Young et
al., 1977; Venkatesan and Kaplan, 1980; Eganhouseand Kaplan, 1982, 1988; Stull et al., 1996; Venkate-san et al., 1996; Eganhouse and Pontolillo, 2000;Eganhouse et al., 2000 for trace metals, see Chow etal., 1973; Morel et al., 1975; Bruland et al., 1974;Stull and Baird, 1985; Finney and Huh, 1989; Huh etal., 1992; and for benthic ecosystem changes, seeStull et al., 1986, 1996; Swartz et al., 1986;
.Wheatcroft and Martin, 1996 .However, the fate of pollutants such as DDTs and
heavy metals as well as organic carbon buried at30–50 cm depth in these sediments is still controver-
Ž .sial Renner, 1998 and thus of great interest. Thedecreasing inventory and peak concentrations ofSDDT in the sediment deposits has been taken asevidence for loss through the sediment surface,caused by deep bioturbation coupled to sediment
Žresuspension Drake et al., 1994; Niedoroda et al.,.1996 . If particle-reactive pollutants were lost by
such a mechanism, heavy metal peak concentrationsŽ .at depth and inventories would have had to declineas well. However, peak concentrations and invento-ries of metals at most locations on the shelf have not
Ždecreased since 1983 LACSD, unpublished data,. Žand discussed later , but those of SDDT did Lee,
.1994 .Ž .Santschi et al. 1999 investigated the fate of Hg
Ž .buried in Lavaca Bay Texas sediments during the1960s, and concluded that anthropogenically en-hanced sedimentation and natural recovery are suffi-ciently fast so that Hg buried below 10 cm from thesurface is part of the historical layer and not avail-able for bioaccumulation and food chain transfer to
Ž .the overlying water. Similarly, Santschi et al. 2000a ,using natural and fallout radionuclides, demonstratedin a companion study to this paper that natural andanthropogenically enhanced sedimentation continuesto bury the pollutants on the PV shelf, and thus,severely restricts transfer from depth to the surface.
In order to evaluate the various sources and path-ways, as well as short-term and long-term oxidationrates of OC, we determined concentration profiles ofOC, total nitrogen, sulfur, and various trace metalsfrom a number of sediment core profiles on the PalosVerdes shelf, and compared these to each other aswell as to similar profiles from the literature. Bycomparing trace metal and OC profiles in theseoutfall-affected sediments and relating them to their
( )P.H. Santschi et al.rMarine Chemistry 73 2001 153–171 155
input functions, one can gain valuable insights notonly about mechanisms of transport and depositionof these species, but also about possible post-deposi-tional processes.
2. Methodology
2.1. Sampling
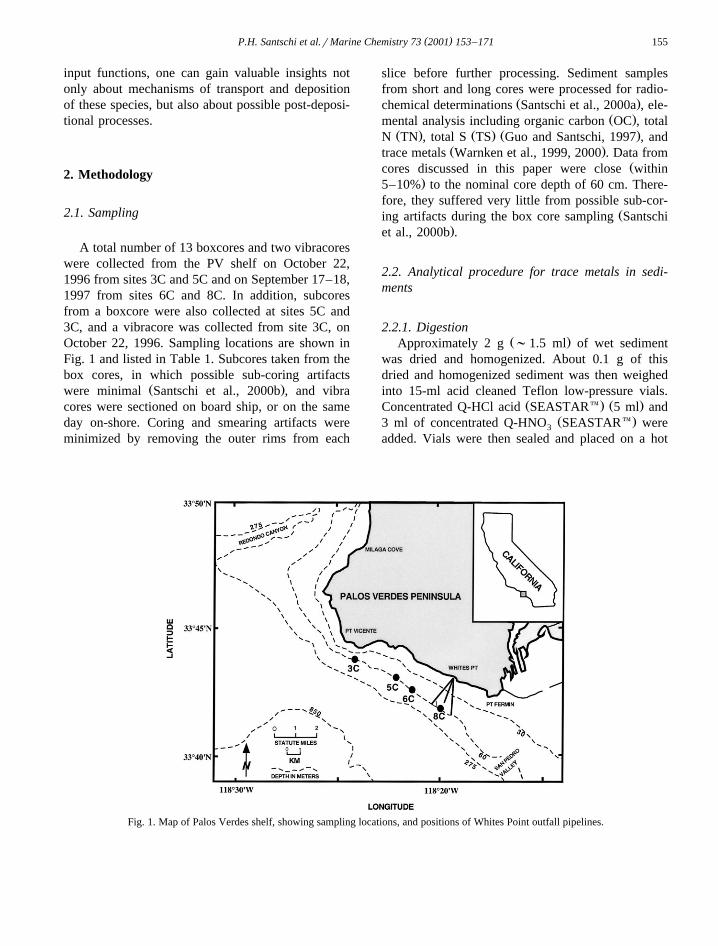
A total number of 13 boxcores and two vibracoreswere collected from the PV shelf on October 22,1996 from sites 3C and 5C and on September 17–18,1997 from sites 6C and 8C. In addition, subcoresfrom a boxcore were also collected at sites 5C and3C, and a vibracore was collected from site 3C, onOctober 22, 1996. Sampling locations are shown inFig. 1 and listed in Table 1. Subcores taken from thebox cores, in which possible sub-coring artifacts
Ž .were minimal Santschi et al., 2000b , and vibracores were sectioned on board ship, or on the sameday on-shore. Coring and smearing artifacts wereminimized by removing the outer rims from each
slice before further processing. Sediment samplesfrom short and long cores were processed for radio-
Ž .chemical determinations Santschi et al., 2000a , ele-Ž .mental analysis including organic carbon OC , total
Ž . Ž . Ž .N TN , total S TS Guo and Santschi, 1997 , andŽ .trace metals Warnken et al., 1999, 2000 . Data from
Žcores discussed in this paper were close within.5–10% to the nominal core depth of 60 cm. There-
fore, they suffered very little from possible sub-cor-Žing artifacts during the box core sampling Santschi
.et al., 2000b .
2.2. Analytical procedure for trace metals in sedi-ments
2.2.1. DigestionŽ .Approximately 2 g ;1.5 ml of wet sediment
was dried and homogenized. About 0.1 g of thisdried and homogenized sediment was then weighedinto 15-ml acid cleaned Teflon low-pressure vials.
Ž . Ž .Concentrated Q-HCl acid SEASTARe 5 ml andŽ .3 ml of concentrated Q-HNO SEASTARe were3
added. Vials were then sealed and placed on a hot
Fig. 1. Map of Palos Verdes shelf, showing sampling locations, and positions of Whites Point outfall pipelines.
( )P.H. Santschi et al.rMarine Chemistry 73 2001 153–171156
Table 1Sampling locations and ancillary parameters
a Ž .Sitercore Sampling location Water Porosity Ø Average recentŽ .depth m sedimentationLatitude Longitude Surface Max Min
y1 bŽ .rate cm yearX XŽ .8C BC 33842.00 118820.05 56 0.70 0.80 0.70 1.2X XŽ .6C BC 33842.51 118821.20 59 0.70 0.78 0.70 1.3X XŽ .6C VC 33842.51 118821.20 59 0.70 0.80 0.50 1.1X XŽ .5C BC 33842.91 118821.90 58 0.70 0.78 0.50 1.5X XŽ .3C BC 33843.84 118824.13 58 0.65 0.65 0.50 1.2X XŽ .3C VC 33843.84 118824.13 58 0.68 0.65 0.47 1.1
a BCsbox core; VCsvibra core.b Ž .From Santschi et al. 2000b .
plate in a class-100 fume hood, and heated for ;24h. After samples cooled down, each vial was placedon a hot plate for another 24 h after the addition of 2
Ž .ml of concentrated Q-HF SEASTARe . Then, 0.2Ž .ml of concentrated perchloric acid OPTIMA, Fisher
was added, and again heated for 24 h in a class-100fume hood. For QArQC purposes, digestion proce-
Ž . Ždure blanks a total of six , duplicate digestions for.5% sample loads , two standard certified standard
Žreference materials NBS 1646 estuarine sediment.and NIST 2704 Buffalo River sediment were per-
formed following the same procedures. Final di-gested samples were then transferred into acidcleaned 30-ml HDPE bottles and diluted to 30 mlwith 18 MV ultrapure water. Agreement betweenmeasured and certified values for sediment standards
Žwas within the errors of the measurements i.e., 1s
.error F3% .
2.3. Analysis
Trace metal concentrations of digested samples inthe 30 ml HDPE bottles were determined by a PerkinElmer 5100 Atomic Absorption Spectrometerequipped with Zeeman background correction sys-tem and graphite furnace with pyrocoated L’vovplatform tube. Instrument blank was frequently mon-
Žitored and standard reference material NIST 1643d,.Trace Element in Natural Waters was also analyzed
as a sample during each measurement cycle. Thequantitative analysis method with six point externalcalibration was used to determine the elements of
Table 2Analytical procedural blanks and results from the analyses of certified standard reference materials
Elements Analytical NIST 1643d NBS 1646 NIST 2704Ž . Ž . Ž .procedure trace elements in water Estuarine Sediment Buffalo River Sediment
Ž .blanks ng Measured Certified Measured Certified Measured Certifiedy1 y1 y1 y1 y1 y1Ž . Ž . Ž . Ž . Ž . Ž .mg kg mg kg mg g mg g mg g mg g
Ag n.d. 7.60"0.09 7.62"0.25 – – – –4 4 4 4Al 4.9"1.8 50.8"0.6 52.0"1.5 6.00"0.02 10 6.25"0.20 10 6.10"0.09 10 6.11"0.16 10
Cd n.d. 22.60"0.20 22.79"0.96 0.36"0.02 0.36"0.07 3.50"0.16 3.45"0.22Cr 2.4"0.6 38.65"0.55 38.6"1.6 74.8"1.9 76"3 133.7"0.98 135"5Cu 1.3"0.3 85.3"0.4 85.2"1.2 18.0"1.2 18"3 101.4"2.1 98.6"5.0
4 4 4 4Fe 4.2"1.5 32.2"0.1 34.3"1.6 3.39"0.05 10 3.35"0.10 10 3.97"0.06 10 4.11"0.10 10Mn 1.2"0.6 37.6"0.5 37.66"0.83 362"7 375"20 554"7 555"19Ni 0.6"0.5 28.3"0.7 27.4"0.8 33.6"1.1 32"3 44.3"0.9 44.1"3Pb 1.1"0.4 27.2"0.8 27.89"0.14 28.2"1.8 27.69"1.24 167.2"0.1 161"1.7Zn 2.3"1.2 51.0"1.8 53.2"1.1 136"2 138"6 433"4 438"12
( )P.H. Santschi et al.rMarine Chemistry 73 2001 153–171 157
interest. Selected metals at sites 3C and 5C were alsoŽ .analyzed by ICP-MS Warnken et al., 1999, 2000 .
Table 2 documents the analytical precision and accu-racy of trace metal analysis, as derived from analysisof standard reference materials.
2.4. Organic carbon and nitrogen analysis
Measurements of OC and nitrogen were carriedout according to previously published proceduresŽ .Guo et al., 1996; Guo and Santschi, 1997 . Sedi-ments were first freeze dried on a Freeze DrierŽ .LABCONCO, Model 77545 and then pulverized in
Ž .a MixerrMill SPEX 8000 . A subsample from eachsediment was measured for its total carbon andnitrogen concentrations on a CHNSrO elemental
Ž .analyzer PE 240 Series II . The CHNSrO AnalyzerŽwas calibrated using standard chemicals acetanilide
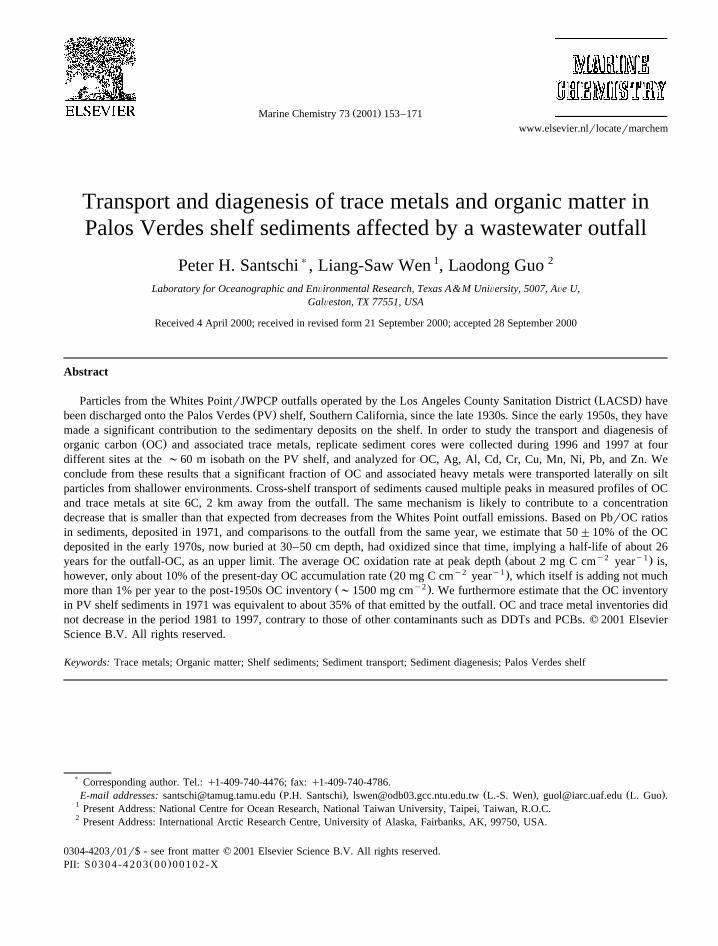
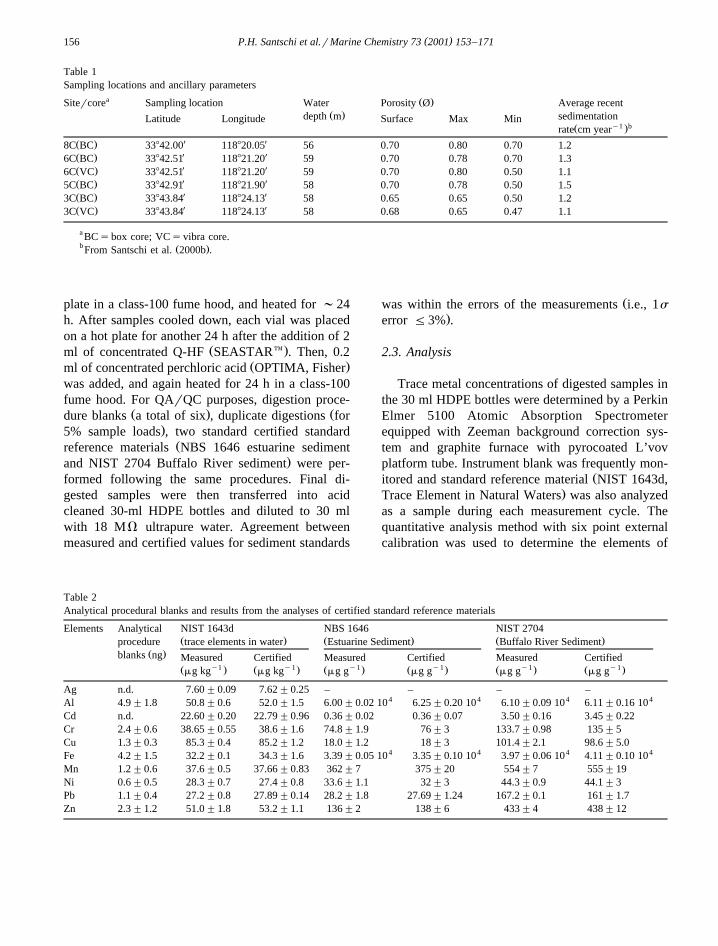
Fig. 2. Selected trace metal profiles at site 6C. Peaks wereassigned to specific dates in accordance with radionuclide and
Ž .organic carbon data Santschi et al., 2000a .
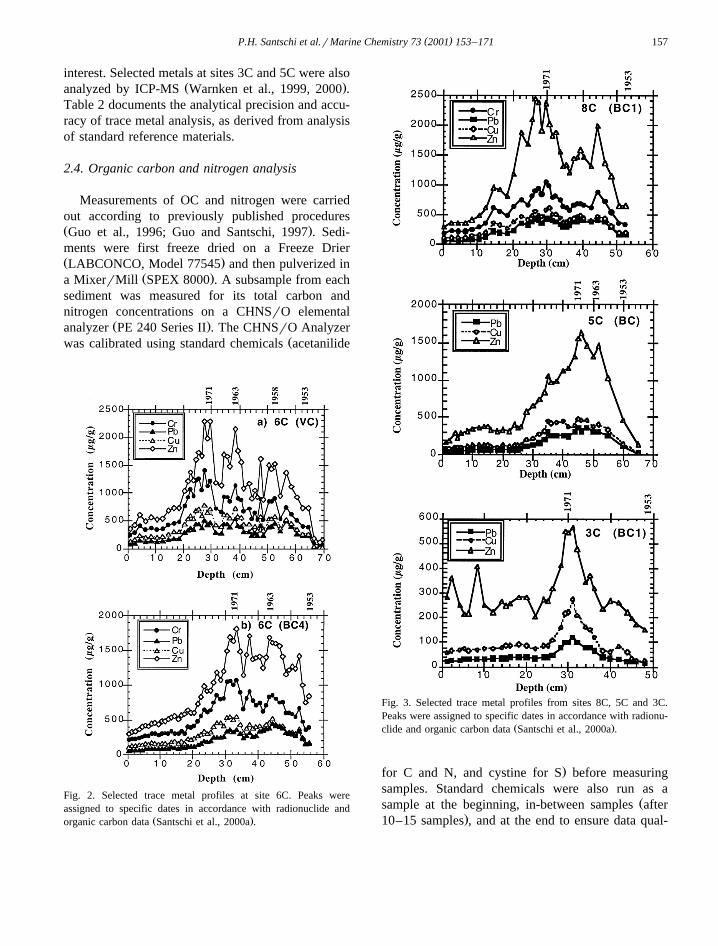
Fig. 3. Selected trace metal profiles from sites 8C, 5C and 3C.Peaks were assigned to specific dates in accordance with radionu-
Ž .clide and organic carbon data Santschi et al., 2000a .
.for C and N, and cystine for S before measuringsamples. Standard chemicals were also run as a
Žsample at the beginning, in-between samples after.10–15 samples , and at the end to ensure data qual-
( )P.H. Santschi et al.rMarine Chemistry 73 2001 153–171158
ity. Consistent QA and QC procedures were appliedto all C, N and S analysis, with 10–20% of thesamples run as replicates. Analytical precision waswithin 1% for carbon, 3% for nitrogen, and 5% forsulfur.
For OC analysis, freeze dried sediments werefurther treated with ;2 N HCl to remove inorganic
Žcarbon e.g., Hedges and Stern, 1984; Guo and.Santschi, 2000 , dried again, and run for carbon
analysis.
3. Results and discussion
3.1. Trace metal and OC profiles in sediments
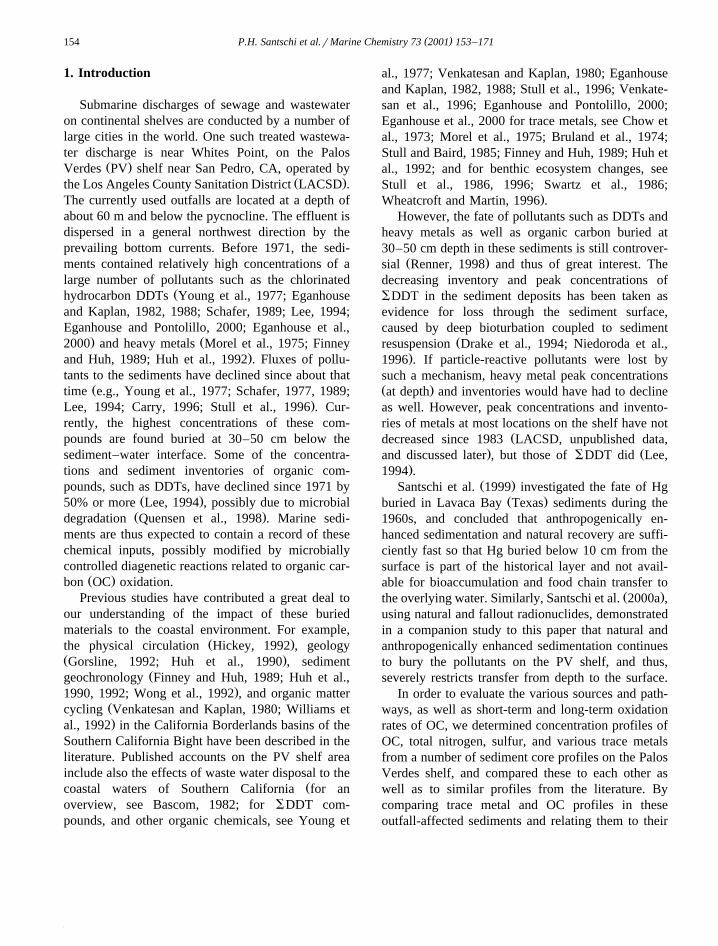
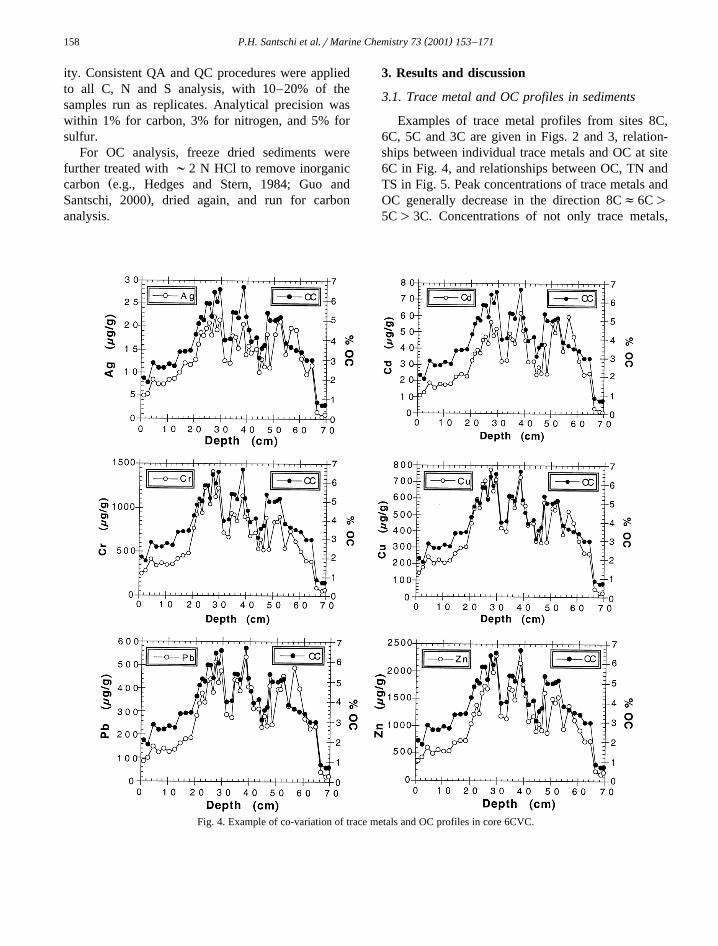
Examples of trace metal profiles from sites 8C,6C, 5C and 3C are given in Figs. 2 and 3, relation-ships between individual trace metals and OC at site6C in Fig. 4, and relationships between OC, TN andTS in Fig. 5. Peak concentrations of trace metals andOC generally decrease in the direction 8Cf6C)
5C)3C. Concentrations of not only trace metals,
Fig. 4. Example of co-variation of trace metals and OC profiles in core 6CVC.
( )P.H. Santschi et al.rMarine Chemistry 73 2001 153–171 159
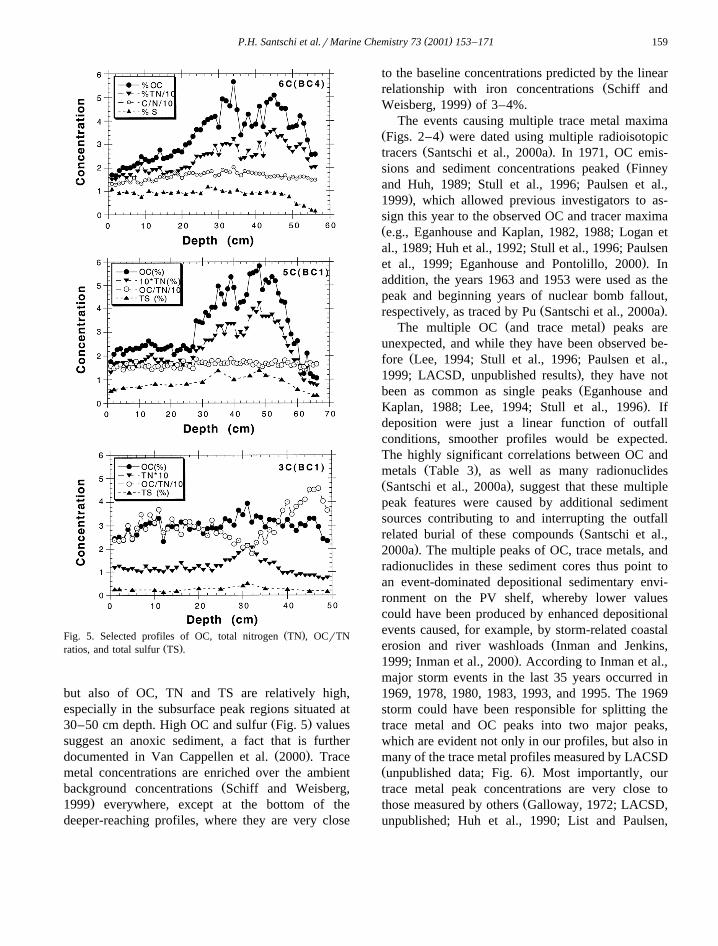
Ž .Fig. 5. Selected profiles of OC, total nitrogen TN , OCrTNŽ .ratios, and total sulfur TS .
but also of OC, TN and TS are relatively high,especially in the subsurface peak regions situated at
Ž .30–50 cm depth. High OC and sulfur Fig. 5 valuessuggest an anoxic sediment, a fact that is further
Ž .documented in Van Cappellen et al. 2000 . Tracemetal concentrations are enriched over the ambient
Žbackground concentrations Schiff and Weisberg,.1999 everywhere, except at the bottom of the
deeper-reaching profiles, where they are very close
to the baseline concentrations predicted by the linearŽrelationship with iron concentrations Schiff and
.Weisberg, 1999 of 3–4%.The events causing multiple trace metal maxima
Ž .Figs. 2–4 were dated using multiple radioisotopicŽ .tracers Santschi et al., 2000a . In 1971, OC emis-
Žsions and sediment concentrations peaked Finneyand Huh, 1989; Stull et al., 1996; Paulsen et al.,
.1999 , which allowed previous investigators to as-sign this year to the observed OC and tracer maximaŽe.g., Eganhouse and Kaplan, 1982, 1988; Logan etal., 1989; Huh et al., 1992; Stull et al., 1996; Paulsen
.et al., 1999; Eganhouse and Pontolillo, 2000 . Inaddition, the years 1963 and 1953 were used as thepeak and beginning years of nuclear bomb fallout,
Ž .respectively, as traced by Pu Santschi et al., 2000a .Ž .The multiple OC and trace metal peaks are
unexpected, and while they have been observed be-Žfore Lee, 1994; Stull et al., 1996; Paulsen et al.,
.1999; LACSD, unpublished results , they have notŽbeen as common as single peaks Eganhouse and
.Kaplan, 1988; Lee, 1994; Stull et al., 1996 . Ifdeposition were just a linear function of outfallconditions, smoother profiles would be expected.The highly significant correlations between OC and
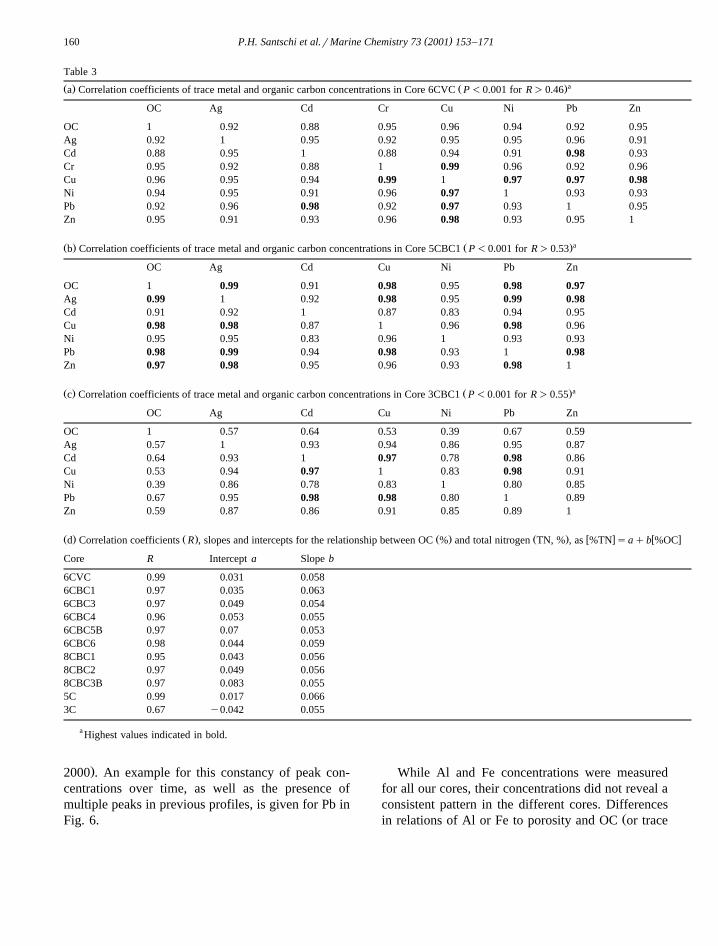
Ž .metals Table 3 , as well as many radionuclidesŽ .Santschi et al., 2000a , suggest that these multiplepeak features were caused by additional sedimentsources contributing to and interrupting the outfall
Žrelated burial of these compounds Santschi et al.,.2000a . The multiple peaks of OC, trace metals, and
radionuclides in these sediment cores thus point toan event-dominated depositional sedimentary envi-ronment on the PV shelf, whereby lower valuescould have been produced by enhanced depositionalevents caused, for example, by storm-related coastal
Žerosion and river washloads Inman and Jenkins,.1999; Inman et al., 2000 . According to Inman et al.,
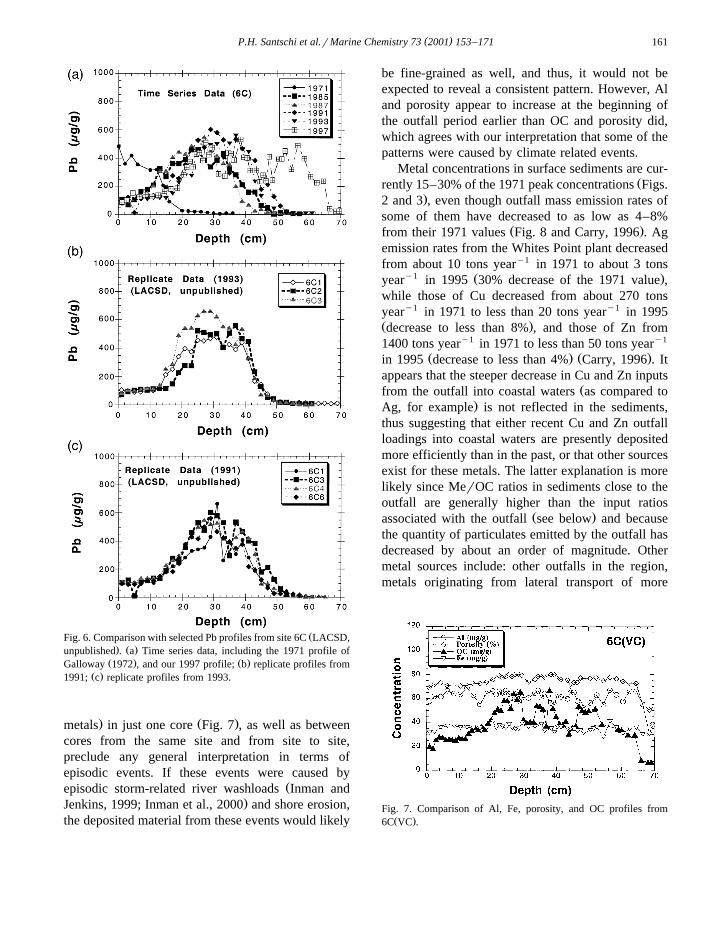
major storm events in the last 35 years occurred in1969, 1978, 1980, 1983, 1993, and 1995. The 1969storm could have been responsible for splitting thetrace metal and OC peaks into two major peaks,which are evident not only in our profiles, but also inmany of the trace metal profiles measured by LACSDŽ .unpublished data; Fig. 6 . Most importantly, ourtrace metal peak concentrations are very close to
Žthose measured by others Galloway, 1972; LACSD,unpublished; Huh et al., 1990; List and Paulsen,
( )P.H. Santschi et al.rMarine Chemistry 73 2001 153–171160
Table 3aŽ . Ž .a Correlation coefficients of trace metal and organic carbon concentrations in Core 6CVC P-0.001 for R)0.46
OC Ag Cd Cr Cu Ni Pb Zn
OC 1 0.92 0.88 0.95 0.96 0.94 0.92 0.95Ag 0.92 1 0.95 0.92 0.95 0.95 0.96 0.91Cd 0.88 0.95 1 0.88 0.94 0.91 0.98 0.93Cr 0.95 0.92 0.88 1 0.99 0.96 0.92 0.96Cu 0.96 0.95 0.94 0.99 1 0.97 0.97 0.98Ni 0.94 0.95 0.91 0.96 0.97 1 0.93 0.93Pb 0.92 0.96 0.98 0.92 0.97 0.93 1 0.95Zn 0.95 0.91 0.93 0.96 0.98 0.93 0.95 1
aŽ . Ž .b Correlation coefficients of trace metal and organic carbon concentrations in Core 5CBC1 P-0.001 for R)0.53
OC Ag Cd Cu Ni Pb Zn
OC 1 0.99 0.91 0.98 0.95 0.98 0.97Ag 0.99 1 0.92 0.98 0.95 0.99 0.98Cd 0.91 0.92 1 0.87 0.83 0.94 0.95Cu 0.98 0.98 0.87 1 0.96 0.98 0.96Ni 0.95 0.95 0.83 0.96 1 0.93 0.93Pb 0.98 0.99 0.94 0.98 0.93 1 0.98Zn 0.97 0.98 0.95 0.96 0.93 0.98 1
aŽ . Ž .c Correlation coefficients of trace metal and organic carbon concentrations in Core 3CBC1 P-0.001 for R)0.55
OC Ag Cd Cu Ni Pb Zn
OC 1 0.57 0.64 0.53 0.39 0.67 0.59Ag 0.57 1 0.93 0.94 0.86 0.95 0.87Cd 0.64 0.93 1 0.97 0.78 0.98 0.86Cu 0.53 0.94 0.97 1 0.83 0.98 0.91Ni 0.39 0.86 0.78 0.83 1 0.80 0.85Pb 0.67 0.95 0.98 0.98 0.80 1 0.89Zn 0.59 0.87 0.86 0.91 0.85 0.89 1
Ž . Ž . Ž . Ž . w x w xd Correlation coefficients R , slopes and intercepts for the relationship between OC % and total nitrogen TN, % , as %TN saqb %OC
Core R Intercept a Slope b
6CVC 0.99 0.031 0.0586CBC1 0.97 0.035 0.0636CBC3 0.97 0.049 0.0546CBC4 0.96 0.053 0.0556CBC5B 0.97 0.07 0.0536CBC6 0.98 0.044 0.0598CBC1 0.95 0.043 0.0568CBC2 0.97 0.049 0.0568CBC3B 0.97 0.083 0.0555C 0.99 0.017 0.0663C 0.67 y0.042 0.055
a Highest values indicated in bold.
.2000 . An example for this constancy of peak con-centrations over time, as well as the presence ofmultiple peaks in previous profiles, is given for Pb inFig. 6.
While Al and Fe concentrations were measuredfor all our cores, their concentrations did not reveal aconsistent pattern in the different cores. Differences
Žin relations of Al or Fe to porosity and OC or trace
( )P.H. Santschi et al.rMarine Chemistry 73 2001 153–171 161
ŽFig. 6. Comparison with selected Pb profiles from site 6C LACSD,. Ž .unpublished . a Time series data, including the 1971 profile of
Ž . Ž .Galloway 1972 , and our 1997 profile; b replicate profiles fromŽ .1991; c replicate profiles from 1993.
. Ž .metals in just one core Fig. 7 , as well as betweencores from the same site and from site to site,preclude any general interpretation in terms ofepisodic events. If these events were caused by
Žepisodic storm-related river washloads Inman and.Jenkins, 1999; Inman et al., 2000 and shore erosion,
the deposited material from these events would likely
be fine-grained as well, and thus, it would not beexpected to reveal a consistent pattern. However, Aland porosity appear to increase at the beginning ofthe outfall period earlier than OC and porosity did,which agrees with our interpretation that some of thepatterns were caused by climate related events.
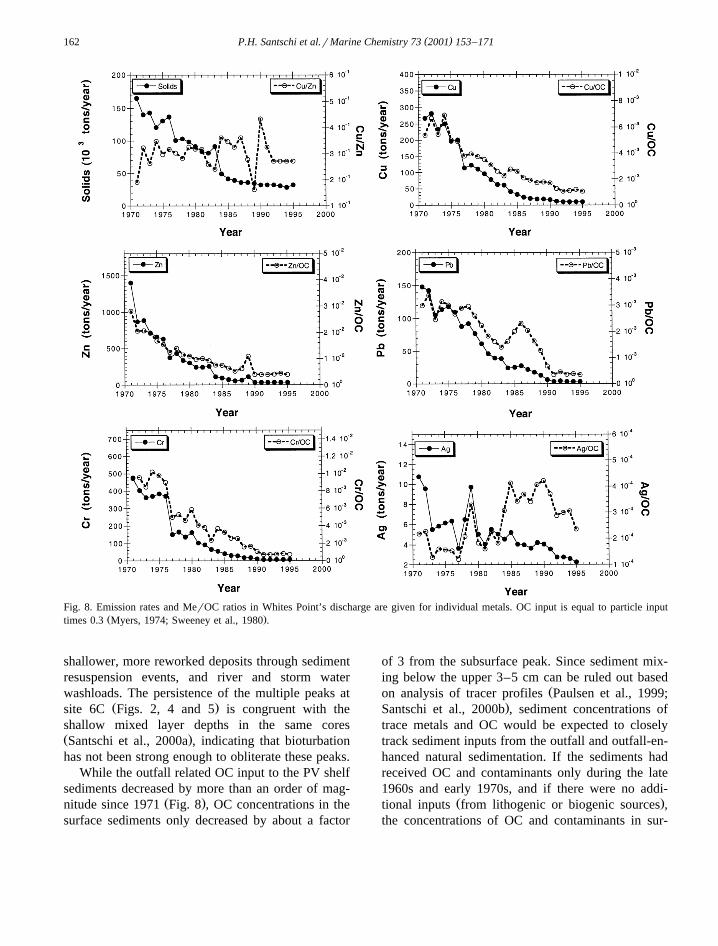
Metal concentrations in surface sediments are cur-Žrently 15–30% of the 1971 peak concentrations Figs.
.2 and 3 , even though outfall mass emission rates ofsome of them have decreased to as low as 4–8%
Ž .from their 1971 values Fig. 8 and Carry, 1996 . Agemission rates from the Whites Point plant decreasedfrom about 10 tons yeary1 in 1971 to about 3 tons
y1 Ž .year in 1995 30% decrease of the 1971 value ,while those of Cu decreased from about 270 tonsyeary1 in 1971 to less than 20 tons yeary1 in 1995Ž .decrease to less than 8% , and those of Zn from1400 tons yeary1 in 1971 to less than 50 tons yeary1
Ž . Ž .in 1995 decrease to less than 4% Carry, 1996 . Itappears that the steeper decrease in Cu and Zn inputs
Žfrom the outfall into coastal waters as compared to.Ag, for example is not reflected in the sediments,
thus suggesting that either recent Cu and Zn outfallloadings into coastal waters are presently depositedmore efficiently than in the past, or that other sourcesexist for these metals. The latter explanation is morelikely since MerOC ratios in sediments close to theoutfall are generally higher than the input ratios
Ž .associated with the outfall see below and becausethe quantity of particulates emitted by the outfall hasdecreased by about an order of magnitude. Othermetal sources include: other outfalls in the region,metals originating from lateral transport of more
Fig. 7. Comparison of Al, Fe, porosity, and OC profiles fromŽ .6C VC .
( )P.H. Santschi et al.rMarine Chemistry 73 2001 153–171162
Fig. 8. Emission rates and MerOC ratios in Whites Point’s discharge are given for individual metals. OC input is equal to particle inputŽ .times 0.3 Myers, 1974; Sweeney et al., 1980 .
shallower, more reworked deposits through sedimentresuspension events, and river and storm waterwashloads. The persistence of the multiple peaks at
Ž .site 6C Figs. 2, 4 and 5 is congruent with theshallow mixed layer depths in the same coresŽ .Santschi et al., 2000a , indicating that bioturbationhas not been strong enough to obliterate these peaks.
While the outfall related OC input to the PV shelfsediments decreased by more than an order of mag-
Ž .nitude since 1971 Fig. 8 , OC concentrations in thesurface sediments only decreased by about a factor
of 3 from the subsurface peak. Since sediment mix-ing below the upper 3–5 cm can be ruled out based
Žon analysis of tracer profiles Paulsen et al., 1999;.Santschi et al., 2000b , sediment concentrations of
trace metals and OC would be expected to closelytrack sediment inputs from the outfall and outfall-en-hanced natural sedimentation. If the sediments hadreceived OC and contaminants only during the late1960s and early 1970s, and if there were no addi-
Ž .tional inputs from lithogenic or biogenic sources ,the concentrations of OC and contaminants in sur-
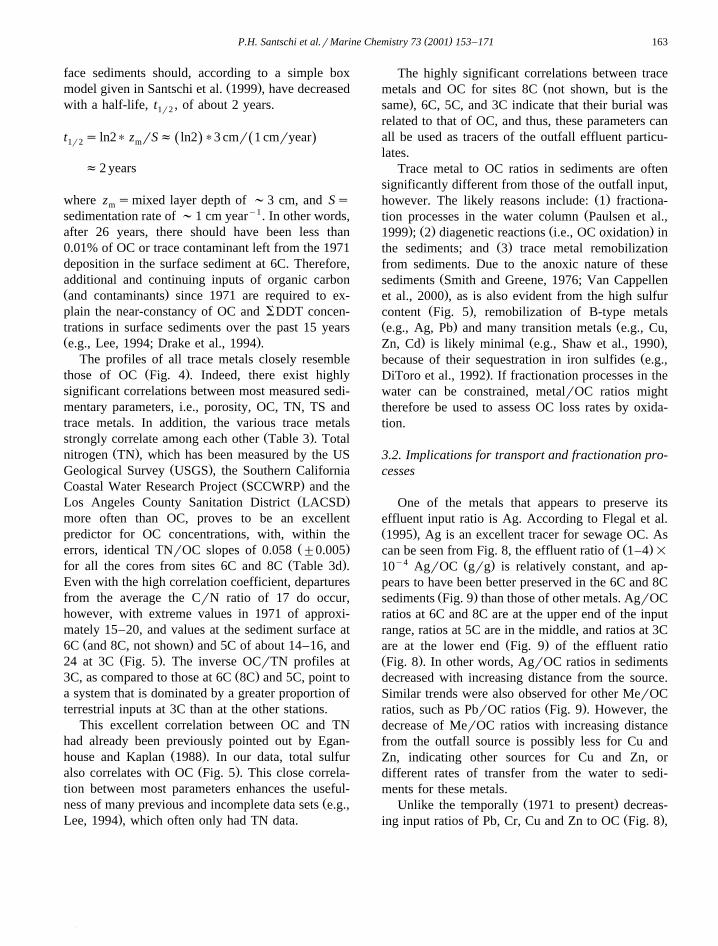
( )P.H. Santschi et al.rMarine Chemistry 73 2001 153–171 163
face sediments should, according to a simple boxŽ .model given in Santschi et al. 1999 , have decreased
with a half-life, t , of about 2 years.1r2
t s ln2) z rSf ln2 )3 cmr 1 cmryearŽ . Ž .1r2 m
f2 years
where z smixed layer depth of ;3 cm, and Ssm
sedimentation rate of ;1 cm yeary1. In other words,after 26 years, there should have been less than0.01% of OC or trace contaminant left from the 1971deposition in the surface sediment at 6C. Therefore,additional and continuing inputs of organic carbonŽ .and contaminants since 1971 are required to ex-plain the near-constancy of OC and SDDT concen-trations in surface sediments over the past 15 yearsŽ .e.g., Lee, 1994; Drake et al., 1994 .
The profiles of all trace metals closely resembleŽ .those of OC Fig. 4 . Indeed, there exist highly
significant correlations between most measured sedi-mentary parameters, i.e., porosity, OC, TN, TS andtrace metals. In addition, the various trace metals
Ž .strongly correlate among each other Table 3 . TotalŽ .nitrogen TN , which has been measured by the US
Ž .Geological Survey USGS , the Southern CaliforniaŽ .Coastal Water Research Project SCCWRP and the
Ž .Los Angeles County Sanitation District LACSDmore often than OC, proves to be an excellentpredictor for OC concentrations, with, within the
Ž .errors, identical TNrOC slopes of 0.058 "0.005Ž .for all the cores from sites 6C and 8C Table 3d .
Even with the high correlation coefficient, departuresfrom the average the CrN ratio of 17 do occur,however, with extreme values in 1971 of approxi-mately 15–20, and values at the sediment surface at
Ž .6C and 8C, not shown and 5C of about 14–16, andŽ .24 at 3C Fig. 5 . The inverse OCrTN profiles at
Ž .3C, as compared to those at 6C 8C and 5C, point toa system that is dominated by a greater proportion ofterrestrial inputs at 3C than at the other stations.
This excellent correlation between OC and TNhad already been previously pointed out by Egan-
Ž .house and Kaplan 1988 . In our data, total sulfurŽ .also correlates with OC Fig. 5 . This close correla-
tion between most parameters enhances the useful-Žness of many previous and incomplete data sets e.g.,
.Lee, 1994 , which often only had TN data.
The highly significant correlations between traceŽmetals and OC for sites 8C not shown, but is the
.same , 6C, 5C, and 3C indicate that their burial wasrelated to that of OC, and thus, these parameters canall be used as tracers of the outfall effluent particu-lates.
Trace metal to OC ratios in sediments are oftensignificantly different from those of the outfall input,
Ž .however. The likely reasons include: 1 fractiona-Žtion processes in the water column Paulsen et al.,
. Ž . Ž .1999 ; 2 diagenetic reactions i.e., OC oxidation inŽ .the sediments; and 3 trace metal remobilization
from sediments. Due to the anoxic nature of theseŽsediments Smith and Greene, 1976; Van Cappellen.et al., 2000 , as is also evident from the high sulfur
Ž .content Fig. 5 , remobilization of B-type metalsŽ . Že.g., Ag, Pb and many transition metals e.g., Cu,
. Ž .Zn, Cd is likely minimal e.g., Shaw et al., 1990 ,Žbecause of their sequestration in iron sulfides e.g.,
.DiToro et al., 1992 . If fractionation processes in thewater can be constrained, metalrOC ratios mighttherefore be used to assess OC loss rates by oxida-tion.
3.2. Implications for transport and fractionation pro-cesses
One of the metals that appears to preserve itseffluent input ratio is Ag. According to Flegal et al.Ž .1995 , Ag is an excellent tracer for sewage OC. As
Ž .can be seen from Fig. 8, the effluent ratio of 1–4 =y4 Ž .10 AgrOC grg is relatively constant, and ap-
pears to have been better preserved in the 6C and 8CŽ .sediments Fig. 9 than those of other metals. AgrOC
ratios at 6C and 8C are at the upper end of the inputrange, ratios at 5C are in the middle, and ratios at 3C
Ž .are at the lower end Fig. 9 of the effluent ratioŽ .Fig. 8 . In other words, AgrOC ratios in sedimentsdecreased with increasing distance from the source.Similar trends were also observed for other MerOC
Ž .ratios, such as PbrOC ratios Fig. 9 . However, thedecrease of MerOC ratios with increasing distancefrom the outfall source is possibly less for Cu andZn, indicating other sources for Cu and Zn, ordifferent rates of transfer from the water to sedi-ments for these metals.
Ž .Unlike the temporally 1971 to present decreas-Ž .ing input ratios of Pb, Cr, Cu and Zn to OC Fig. 8 ,
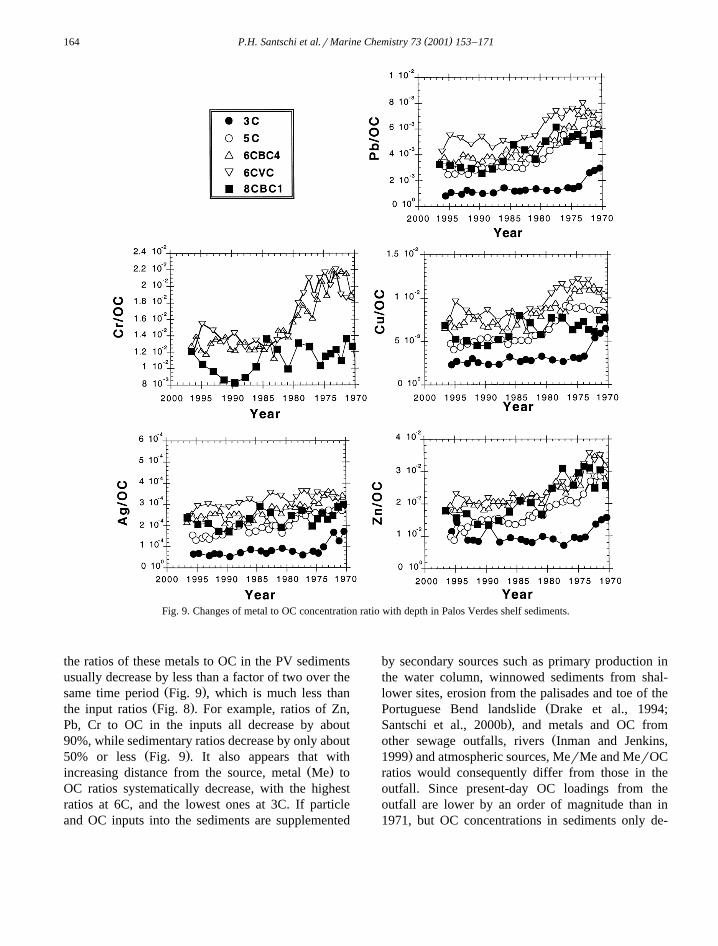
( )P.H. Santschi et al.rMarine Chemistry 73 2001 153–171164
Fig. 9. Changes of metal to OC concentration ratio with depth in Palos Verdes shelf sediments.
the ratios of these metals to OC in the PV sedimentsusually decrease by less than a factor of two over the
Ž .same time period Fig. 9 , which is much less thanŽ .the input ratios Fig. 8 . For example, ratios of Zn,
Pb, Cr to OC in the inputs all decrease by about90%, while sedimentary ratios decrease by only about
Ž .50% or less Fig. 9 . It also appears that withŽ .increasing distance from the source, metal Me to
OC ratios systematically decrease, with the highestratios at 6C, and the lowest ones at 3C. If particleand OC inputs into the sediments are supplemented
by secondary sources such as primary production inthe water column, winnowed sediments from shal-lower sites, erosion from the palisades and toe of the
ŽPortuguese Bend landslide Drake et al., 1994;.Santschi et al., 2000b , and metals and OC from
Žother sewage outfalls, rivers Inman and Jenkins,.1999 and atmospheric sources, MerMe and MerOC
ratios would consequently differ from those in theoutfall. Since present-day OC loadings from theoutfall are lower by an order of magnitude than in1971, but OC concentrations in sediments only de-
( )P.H. Santschi et al.rMarine Chemistry 73 2001 153–171 165
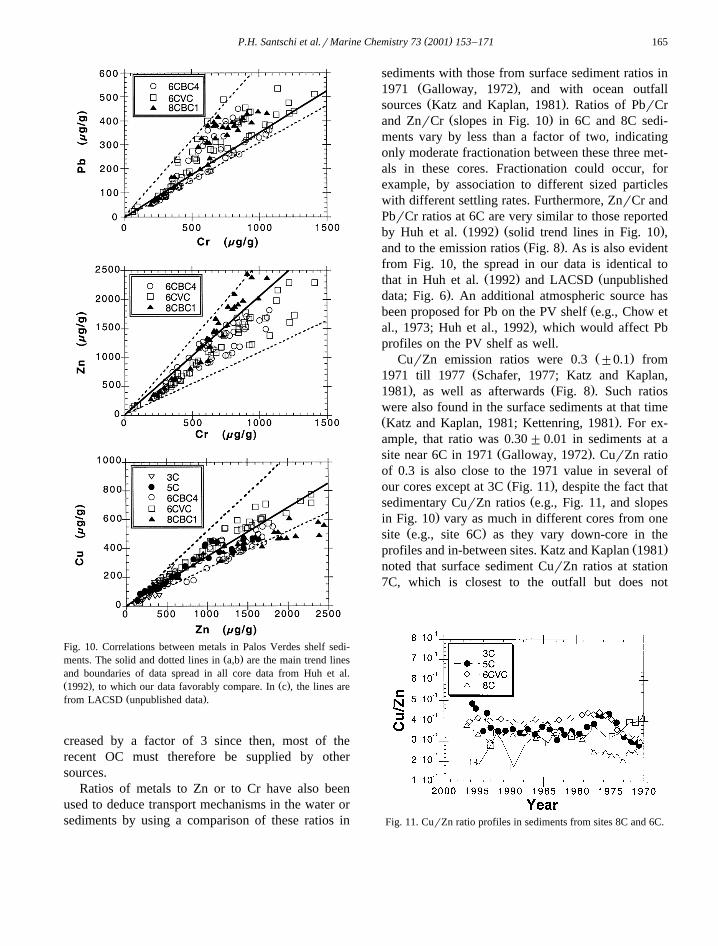
Fig. 10. Correlations between metals in Palos Verdes shelf sedi-Ž .ments. The solid and dotted lines in a,b are the main trend lines
and boundaries of data spread in all core data from Huh et al.Ž . Ž .1992 , to which our data favorably compare. In c , the lines are
Ž .from LACSD unpublished data .
creased by a factor of 3 since then, most of therecent OC must therefore be supplied by othersources.
Ratios of metals to Zn or to Cr have also beenused to deduce transport mechanisms in the water orsediments by using a comparison of these ratios in
sediments with those from surface sediment ratios inŽ .1971 Galloway, 1972 , and with ocean outfallŽ .sources Katz and Kaplan, 1981 . Ratios of PbrCr
Ž .and ZnrCr slopes in Fig. 10 in 6C and 8C sedi-ments vary by less than a factor of two, indicatingonly moderate fractionation between these three met-als in these cores. Fractionation could occur, forexample, by association to different sized particleswith different settling rates. Furthermore, ZnrCr andPbrCr ratios at 6C are very similar to those reported
Ž . Ž .by Huh et al. 1992 solid trend lines in Fig. 10 ,Ž .and to the emission ratios Fig. 8 . As is also evident
from Fig. 10, the spread in our data is identical toŽ . Žthat in Huh et al. 1992 and LACSD unpublished
.data; Fig. 6 . An additional atmospheric source hasŽbeen proposed for Pb on the PV shelf e.g., Chow et
.al., 1973; Huh et al., 1992 , which would affect Pbprofiles on the PV shelf as well.
Ž .CurZn emission ratios were 0.3 "0.1 fromŽ1971 till 1977 Schafer, 1977; Katz and Kaplan,
. Ž .1981 , as well as afterwards Fig. 8 . Such ratioswere also found in the surface sediments at that timeŽ .Katz and Kaplan, 1981; Kettenring, 1981 . For ex-ample, that ratio was 0.30"0.01 in sediments at a
Ž .site near 6C in 1971 Galloway, 1972 . CurZn ratioof 0.3 is also close to the 1971 value in several of
Ž .our cores except at 3C Fig. 11 , despite the fact thatŽsedimentary CurZn ratios e.g., Fig. 11, and slopes
.in Fig. 10 vary as much in different cores from oneŽ .site e.g., site 6C as they vary down-core in the
Ž .profiles and in-between sites. Katz and Kaplan 1981noted that surface sediment CurZn ratios at station7C, which is closest to the outfall but does not
Fig. 11. CurZn ratio profiles in sediments from sites 8C and 6C.
( )P.H. Santschi et al.rMarine Chemistry 73 2001 153–171166
underlie it, were identical in 1977 to the averageoutfall ratios of 0.31"0.02 between 1974 and 1977.They also mentioned that all other stations furtheraway from the outfall had surface sediment CurZnratios that were larger than the emission ratio. This isalso reflected in our data, which show highest valuesin 1971 at site 3C, furthest away from the outfall.However, since the 1980s, the CurZn ratios at 3Care anomalously low. This suggests some fractiona-tion between the two metals, likely related to thedifferential sorption behavior of these metals in theeffluent plume. In addition, the characteristics of theparticles likely have changed over time. Cu and Znare currently still being buried at CurZn ratios rang-
Ž .ing from 0.2 to 0.5 Fig. 11 , close to the emissionratio of 0.3"0.1.
3.3. Sedimentary OC oxidation processes
Since lateral inputs of sediment could affect OCpeak concentrations in sediment cores taken overtime, another way to calculate OC oxidation rates isneeded. Table 4 compares MerOC ratios in the peak
Ž .region of sediments Figs. 2–4 and 9 to those inŽ .effluents Fig. 8 . Such an approach requires that the
Ž .metal is little fractionated Faisst, 1976 , nor solubi-lized to any large degree before or during burial. Aspointed out before, the high levels of hydrogensulfide and total sulfur in the sediments would assurethat most heavy metals would be present as an
Ž .insoluble sulfide DiToro et al., 1992 . Low levels ofsolubilization and association with more rapidly
Žsinking particles Faisst, 1976; Katz and Kaplan,.1981 make Pb a good tracer for deducing OC
oxidation rates in PV sediments. Another suitablemetal is Cr. Because metals such as Cu and Znappear to have been partly fractionated by being
Ž .associated with different sized particles Faisst, 1976Ž .or solubilized Katz and Kaplan, 1981 in the water
column, or supplied from other sources, they mightbe less useful for such a purpose.
Organic matter oxidation rates for the year 1971could be calculated from the difference between the
Ž .OC maximum concentration at 6C in 1971 12%Ž .Myers, 1974; Sweeney et al., 1980 and in 1997Ž .6% . Peak OC concentrations at 6C were abouttwice as high in 1971 as they were in 1996r1997,suggesting a half-life of about 26 years. An im-proved approach is to use differences in themetalrOC ratios, such as PbrOC and CrrOC, be-
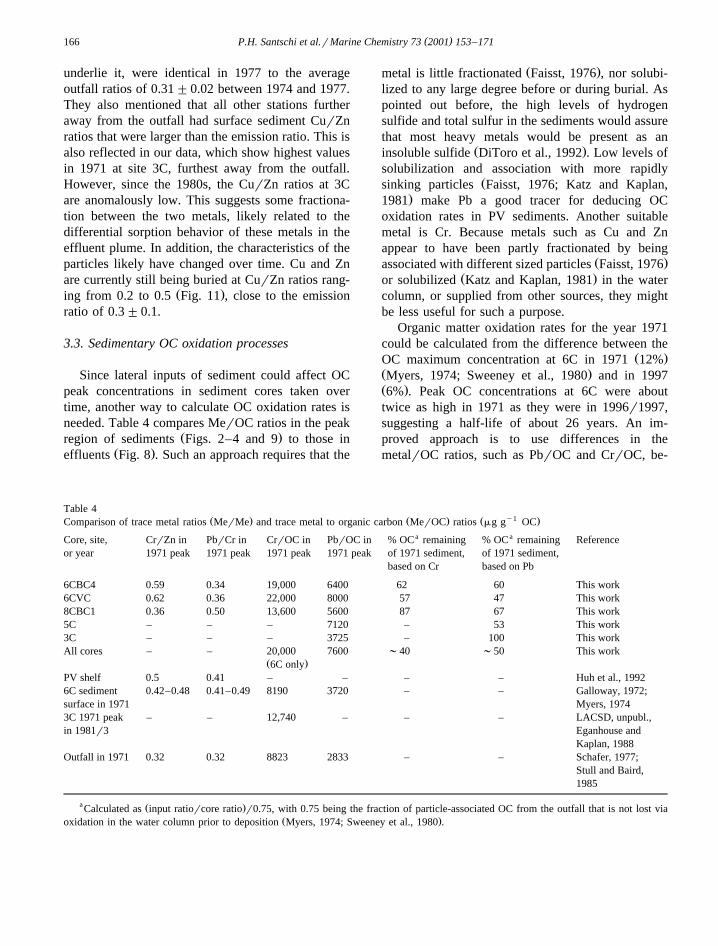
Table 4Ž . Ž . Ž y1 .Comparison of trace metal ratios MerMe and trace metal to organic carbon MerOC ratios mg g OC
a aCore, site, CrrZn in PbrCr in CrrOC in PbrOC in % OC remaining % OC remaining Referenceor year 1971 peak 1971 peak 1971 peak 1971 peak of 1971 sediment, of 1971 sediment,
based on Cr based on Pb
6CBC4 0.59 0.34 19,000 6400 62 60 This work6CVC 0.62 0.36 22,000 8000 57 47 This work8CBC1 0.36 0.50 13,600 5600 87 67 This work5C – – – 7120 – 53 This work3C – – – 3725 – 100 This workAll cores – – 20,000 7600 ;40 ;50 This work
Ž .6C onlyPV shelf 0.5 0.41 – – – – Huh et al., 19926C sediment 0.42–0.48 0.41–0.49 8190 3720 – – Galloway, 1972;surface in 1971 Myers, 19743C 1971 peak – – 12,740 – – – LACSD, unpubl.,in 1981r3 Eganhouse and
Kaplan, 1988Outfall in 1971 0.32 0.32 8823 2833 – – Schafer, 1977;
Stull and Baird,1985
a Ž .Calculated as input ratiorcore ratio r0.75, with 0.75 being the fraction of particle-associated OC from the outfall that is not lost viaŽ .oxidation in the water column prior to deposition Myers, 1974; Sweeney et al., 1980 .
( )P.H. Santschi et al.rMarine Chemistry 73 2001 153–171 167
tween sediment and effluent particles to estimate theOC oxidation rates more accurately. A comparison
Ž .of the metal e.g., Cr, Pb to OC ratios in thesediment layer with maximum OC concentration in
Ž .1971 to that in 1996r1997 Table 4 , reveals thatabout 40–60% of the OC emitted by the JWPCPplant and deposited onto the PV shelf sediments at
Ž .6C and 67–87% at 8C is still present in the 1971layer where the OC and metal concentrations peaked.This confirms the half-life of 26 years for outfall-OCdeduced above, as an upper limit. A half-life of thatmagnitude is close to the half-life of DDE on the PV
Žshelf of about 20 years List and Paulsen, 2000;.Drake et al., 1994 , suggesting a possible link be-
tween DDE disappearance and OC degradation. Ahalf-life of 26 years would require an OC degrada-
y2 y1 Žtion rate of about 1.5–3 mg C cm year averagey2 y1.2 mg C cm year , depending on assumptions of
reaction order.Experimental and field observations indicate that
about 25% of the OC emitted by the Whites PointŽoutfall is degraded in the water before burial Myers,
.1974; Sweeney et al., 1980 , and that outfall parti-cles, as they come out the pipe, contained about30–35% OC. From these observations, one can also
Ž .estimate that about 50% 12%r0.325r0.75f50%of the particles deposited on the PV shelf in 1971originated from the outfall, in agreement with previ-
Ž .ous estimates Myers, 1974; Sweeney et al., 1980 .Ž Ž . .Thus, approximately 37% f6r 12r0.75 )100%
of the OC resident on a particle discharged from theoutfall in 1971 presently resides on that particle in itssediment repository. Given that the sediment layerdeposited in 1971 at site 6C currently has a porosityof about 80%, and likely was deposited over a 1.5–2
Žcm interval Logan et al., 1989; Paulsen et al., 1999;.Santschi et al., 2000b , the 1971 layer therefore losty2 Ž y1about 54 mg C cm s60 mg C g )0.5 g
y3 .cm )1.75 cm in 26 years, or, if oxidation wouldhave been a continuous process, about 2 mg cmy2
yeary1. The assumption of continuous organic matteroxidation, even at 30–50 cm depth, is likely notfulfilled, however. As DOC, Fe and Mn concentra-
Žtions in the pore waters from sites 6C and 8C Van.Cappellen et al., 2000 show, early diagenesis of
organic matter, Fe and Mn is most intense in theupper 10 cm of sediment. DOC in the pore waterpeaks near the sediment surface, Mn at 7 cm, and Fe
at 10 cm depth at 6C, with similar depth profiles at8C. Rates of diagenesis 26 years ago, are, however,not known. Therefore, this half-life of OC of 26years for outfall-derived OC in PV sediments is along-term average.
While other sources of OC were clearly of minorimportance in 1971, this is not the case at the presenttime. Therefore, a different approach is needed toestimate present-day OC oxidation rates. Van Cap-
Ž .pellen et al. 2000 have estimated OC oxidationrates at site 6C to be about 1130 mmol C cmy2
yeary1, or 13 mg cmy2 yeary1, from modeling porewater profiles of oxygen, sulfate, sulfide, alkalinity,pH, Fe, Mn, nitrate and ammonia. Given the recentsediment accumulation rate of about 0.8–0.9 g cmy2
y1 Ž .year at that site Santschi et al., 2000a , this wouldamount to about 15 mg C gy1 of sediments or about1.5% OC, which would presently be lost from thesediments during early diagenesis. Organic carbonoxidation at 6C is, however, significantly accom-
Žplished by sulfate reduction Van Cappellen et al.,2000: 80% at 6C; Berelson et al., 2000: 30% at a
.nearby site . The higher value of the OC oxidationrates in recently deposited sediments than in thelayer deposited in 1971 is likely related to the factthat freshly produced OC is more degradable thanthe residual fraction of refractory OC from outfallinputs.
Present-day accumulation of OC to the shelf ofy2 y1 Žabout 20 mg cm year calculated from values
given in Paulsen et al., 1999 and Santschi et al.,.2000b is, while an order of magnitude higher than
the outfall-derived OC oxidation rate, still onlyŽadding a little more than 1% per year to the OC and
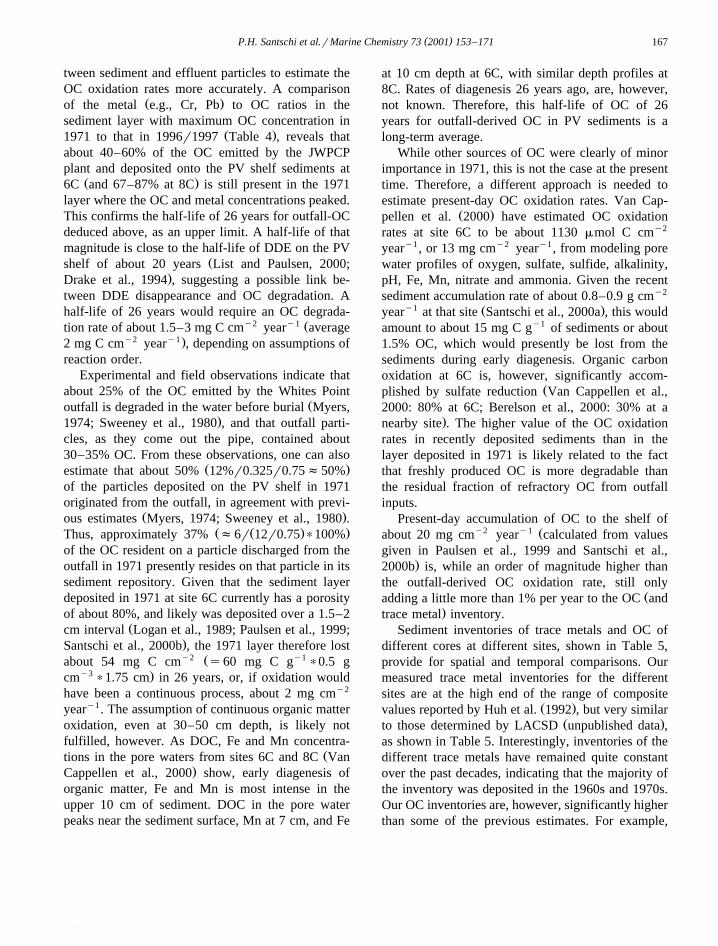
.trace metal inventory.Sediment inventories of trace metals and OC of
different cores at different sites, shown in Table 5,provide for spatial and temporal comparisons. Ourmeasured trace metal inventories for the differentsites are at the high end of the range of composite
Ž .values reported by Huh et al. 1992 , but very similarŽ .to those determined by LACSD unpublished data ,
as shown in Table 5. Interestingly, inventories of thedifferent trace metals have remained quite constantover the past decades, indicating that the majority ofthe inventory was deposited in the 1960s and 1970s.Our OC inventories are, however, significantly higherthan some of the previous estimates. For example,
( )P.H. Santschi et al.rMarine Chemistry 73 2001 153–171168
Table 5Ž y2 . Ž y2 . Ž y2 .Comparison of sediment inventories for trace metal mg cm , organic carbon OC, mg-C cm and total nitrogen TN, mg-N cm at
Žsites 3C, 5C, 6C and 8C calculated down to a depth which was deposited at around 1953; this is 65 cm for the vibracore, or shorter for the.other cores, where the core bottom depth was dated to around 1953 using radiochemical methods by Santschi et al., 2000a,b
a bw x w x w x w x w x w x w x w x w xSiterCore Zn Pb Ni Cu Cr Cd Ag OC TN Reference
Ž .3C-BC 1996 14 3 2 5 – 0.3 0.1 1500 60 1Ž .5C-BC 1996 29 7 2.4 10 – 0.25 0.3 1505 107 1Ž .8C-BC1 1997 34.3 7.6 2.4 10.0 17.0 0.95 0.4 1491 94 1Ž .6C-BC4 1997 34.6 7.5 2.3 10.8 20.1 0.9 0.4 1225 87 1Ž .6C-VC 1997 43.9 11.6 3.0 16.4 26.4 1.3 0.55 1557 105 1
Ž .6C 1983 32.5 – 1.8 10.2 18.1 0.8 – – – 2Ž . Ž .6C 1993 31.7"2.0 8.5"0.6 2.0"0.3 11.2"0.8 17.4"1.6 1.0"0.06 – – 122"11 2 ns3Ž .6C 1992 – – – – – – – 1514 – 3Ž .3C 1981 – – – – – – – 924 – 4Ž .3C 1983 10.9 – 1.2 5.4 9.6 0.25 – – – 2Ž . Ž .3C 1993 10.8"1.1 3.0"0.6 1.4"0.3 4.7"0.8 8.0"1.2 0.3"0.08 – – 74"9 2 ns3Ž .3C 1992 – – – – – – – 767 – 3
a BCsbox core; VCsvibra core.b Ž . Ž . Ž .1: This work; 2: LACSD unpublished data , which had possibility for core top loss Lee, 1994 ; 3: USGS Lee, 1994 ; 4: Eganhouse
Ž .and Kaplan 1988 , with possible core top loss.
Ž .Myers 1974 estimated OC inventories of about0.15, 0.25, 0.25, and 0.7 g cmy2 for sites 3C, 5C,6C and 8C, respectively, in 1972, when a largefraction of the total outfall-OC should have alreadybeen deposited. Our inventories in cores collected in1996 at site 3C are also higher than those published
Ž .by Eganhouse and Pontolillo 2000 for site 3C,collected in 1992r1993. Our data, however, indicatethat OC inventories for sites 3C, 5C, 6C and 8C are
y2 Ž .consistently high, about 1.5 g cm Table 3 . Asimilar value can also be calculated for a site 6C
Ž .core collected in 1992 by USGS Table 5 . Thus, itappears that some of the previous data underesti-mated the OC inventory. Given the fact that the OCpeak region from our 6C cores likely lost about 50%of the outfall-OC due to oxidation, the discrepancybetween the two estimates appears even larger.Non-outfall sources of OC deposited since the early1980s, the use of low sediment densities used by
Ž .Myers 1974 for OC inventory calculations, sedi-Ž .ment loss during coring Lee, 1994 , andror sedi-
ment heterogeneity could be reasons for the high OCinventories determined in 1996r1997.
It is also important to know what fraction of OCemitted by the outfall was deposited onto PV sedi-ments in 1971. This can be estimated from an aver-age sediment accumulation rate of 0.8 g cmy2 yeary1
Ž .Paulsen et al., 1999; Santschi et al., 2000b , and an
Žobserved OC concentration of 6% to 12% Sweeney.et al., 1980 in 1971 in surface sediments covering
2 Žan area of about 40 km Lee, 1994; Drake et al.,. y2 y1 Ž .1994 , i.e., 0.8 g cm year = 0.06 to 0.12 =40
=1010 cm2 s1.9 to 3.8=107 kg OC yeary1 for1971. This estimate can be compared to the OCemission rate from the wastewater outfall in the early
Ž . 6 Ž y1 .1970s Fig. 8 , which was 165=10 kg year =Ž Ž .y1 . 70.3 kg C kg sewage particles s5.5=10 kg C
yeary1. The fraction of total outfall-OC that wasburied in the PV sediments in the early 1970s wastherefore at least 35% of the OC outfall discharge.Our estimate for the year 1971 falls in between those
Ž . Ž . Ž .of Huh et al. 1992 12–20% and Farley 1990Ž .63% for the sediments within 20 km from theoutfall. These estimates are, however, significantly
Žhigher than other estimates Galloway, 1972; Myers,.1974; Katz and Kaplan, 1981 .
4. Summary and conclusions
Ž .Not only are a large fraction ;35% of OC andtrace metal emissions deposited on the Palos Verdesshelf, the resulting sediment inventories have beenrelatively constant over the past 10 to 15 yearsŽ .Table 3 , thus indicating that recent additions andlosses must have been relatively small, or balance
( )P.H. Santschi et al.rMarine Chemistry 73 2001 153–171 169
each other. Changes of OCrmetal ratios in sedi-ments and comparison to input ratios could thereforebe used to estimate an outfall-OC oxidation rate ofabout 2 mg cmy2 yeary1 since 1971. The half-lifeof 15–26 years for this outfall-derived OC at sites3C and 6C, respectively, is surprisingly close to the
ŽDDE half-life on the PV shelf List and Paulsen,.2000 , suggesting a possible relationship between the
disappearance of DDE and OC degradation. Present-day accumulation of OC to the shelf is about 20 mg
y2 y1 Žcm year Paulsen et al., 1999; Santschi et al.,.2000b . While this is an order of magnitude higher
than outfall-OC oxidation, because most of the OCinventory is deeply buried, it still adds only a little
Ž .more than 1% per year to the OC and trace metalinventory. Due to the close correlation of OC with
Ž .heavy metals and other contaminants e.g., DDTs ,the same argument likely applies to them, too, de-spite the fact that they have different sources. Whilethere has been a decrease in OC concentrationsburied in the sediments in 1971, no such decreasehas been observed for trace metals at site 6C.
While inventories and surface layer concentra-tions of OC show only small or no differences in the
Ždirection away from the outfall e.g., between 6C.and 3C, which are about 5 km apart , trace metal,
nitrogen and sulfur inventories and surface concen-trations significantly decrease from 6C to 3C, likelyindicating multiple sources of OC to the Palos Verdes
Ž .sediments: 1 aquagenic OC derived from nutrient-enhanced primary productivity in the overlying water
Ž .column; 2 riverine OC, especially during storms;Ž .3 OC associated with eroded shore-line material;Ž . Ž .4 OC from the wastewater outfall; and 5 scaveng-ing of OC from the ocean waters to the underlyingsediments. OC from the wastewater outfall is likely
Ž .also an important contributor directly or indirectlyto reduced S and N, as well as trace metals, explain-ing the decreasing concentrations and inventoriesaway from the outfall. OC and trace metal invento-ries have been remarkably constant since 1981r1983,contrary to reported declines in inventories of other
Žcontaminants such as DDTs and PCBs Lee, 1994;.Eganhouse and Pontolillo, 2000 on the Palos Verdes
Shelf.The multiple-source explanation is consistent with
the fact that surface concentrations in recently de-posited sediments are higher than expected from the
outfall emission records. In addition, this explanationaccounts for the multiple maxima and minima in theOC, N, S and trace metal profiles. If deposition ismodulated by cross-shelf transport processes, whichmix and erode sediment previously deposited in shal-lower parts of the shelf, and re-deposit these sedi-ments in somewhat deeper waters, then the strongcorrelations we observed between chemical con-stituents in the PV sediment profiles would be ex-pected. Therefore, the multiple-source and cross-shelftransport explanation provides the most coherent ac-counting of the complex, and sometimes difficult torecreate, observations from the effluent-affected sed-iment profiles on the Palos Verdes Shelf.
Acknowledgements
We acknowledge helpful comments by threeanonymous reviewers, and John List and SusanPaulsen on an earlier version of this manuscript. Wefurthermore acknowledge the organizational talent ofShaunna Asbill, who was of great help in the fieldwork, and the initial sample preparation. This re-search was supported by Montrose Chemical of Cali-fornia, Stauffer Management, Rhone-Poulenc, andChris-Craft Industries.
References
Bascom, W., 1982. The effects of waste disposal on the coastalwaters of Southern California. Environ. Sci. Technol. 16,226A–236A.
Berelson, W.M., Johnson, K., Coale, K., Li, H.-C., 2000. Organicmatter diagenesis in the sediments of the San Pedro Shelfalong a transect affected by sewage effluent. Cont. Shelf Res.,in press.
Bruland, K.W., Bertine, K., Koide, M., Goldberg, E.D., 1974.History of metal pollution in Southern California coastal zone.Environ. Sci. Technol. 11, 297–299.
Carry, C.W., 1996. Los Angeles County Sanitation Districts An-nual Report. Palos Verdes Ocean Monitoring 1995.
Chow, T.J., Bruland, K.W., Bernine, K., Soutar, A., 1973. Leadpollution: Records in Southern California coastal sediments.Science 181, 551–552.
DiToro, D.M., Mahony, J.D., Hansen, D.J., Scott, K.S., Carlson,A.R., Ankley, G.T., 1992. Acid volatile sulfide predicts theacute toxicity of cadmium and nickel in sediments. Environ.Sci. Technol. 26, 96–101.
( )P.H. Santschi et al.rMarine Chemistry 73 2001 153–171170
Drake, D.E., Sherwood, C.R., Wiberg, P.L., 1994. Predictivemodeling of the natural recovery of the contaminatedeffluent-affected sediment, Palos Verdes Margin, SouthernCalifornia. Expert Report, incl. Appendices. USGS ExpertReport.
Eganhouse, R.P., Kaplan, I.R., 1982. Extractable organic matter inmunicipal wastewaters. 1. Petroleum hydrocarbons: Temporalvariations and mass emission rates to the ocean. Environ. Sci.Technol. 16, 180–196.
Eganhouse, R.P., Kaplan, I.R., 1988. Depositional history ofrecent sediments from San Pedro shelf, California: Reconstruc-tion using elemental abundance, isotopic composition andmolecular markers. Mar. Chem. 24, 163–191.
Eganhouse, R.P., Pontolillo, J., 2000. Depositional history oforganic contaminants on the Palos Verdes Shelf, California.Mar. Chem. 70, 317–338.
Eganhouse, R.P., Pontolillo, J., Leiker, T.J., 2000. Diagenetic fateof organic contaminants on the Palos Verdes Shelf, California.Mar. Chem. 70, 289–315.
Faisst, W.K., 1976.Digested sludge: delineation and modeling forocean disposal. PhD Thesis. Calif. Inst. Technol. Pasadena,Ca, 193 pp.
Farley, K.J., 1990. Predicting organic accumulation in sedimentsŽ .near marine outfalls. J. Environ. Eng. 116 1 , 144–165.
Finney, B.P., Huh, C.-A., 1989. History of metal pollution in theSouthern California Bight: An update. Environ. Sci. Technol.23, 294–303.
Flegal, A.R., Sanudo-Wilhelmy, S.A., Scelfo, G.M., 1995. Silverin the Eastern Atlantic Ocean. Mar. Chem. 49, 315–320.
Galloway, J.N., Mans’s Alteration of the Natural GeochemicalCycle of Selected Trace Metals. PhD Dissertation, ScrippsInstitution of Oceanography, University of California SanDiego, 143 pp.
Gorsline, D.S., 1992. The geological setting of Santa Monica andSan Pedro Basins, California Borderland. Prog. Oceanog. 30,1–36.
Guo, L., Santschi, P.H., 1997. Isotopic and elemental characteriza-tion of colloidal organic matter from the Chesapeake Bay andGalveston Bay. Mar. Chem. 59, 1–15.
Guo, L., Santschi, P.H., 2000. Sedimentary sources of old highmolecular weight dissolved organic matter from the oceanmargin benthic nepheloid layer. Geochim. Cosmochim. Acta64, 651–660.
Guo, L., Santschi, P.H., Cifuentes, L.A., Trumbore, S., Southon,J., 1996. Cycling of dissolved organic matter in the Middle
Ž13 14 .Atlantic Bight as revealed by carbon isotopic C, Csignatures. Limnol. Oceanogr. 41, 1242–1252.
Hedges, J.I., Stern, J.H., 1984. Carbon and nitrigen determinationsof carbonate-containing solids. Limnol. Oceanogr. 29, 657–663.
Hickey, B.M., 1992. Circulation over the Santa Monica–SanPedro Basin and Shelf. Prog. Oceanog. 30, 37–115.
Huh, C.-A., Small, L.F., Niemnil, S., Finney, B.P., Hickey, B.M.,Kachel, N.B., Gorsline, D.S., Williams, P.M., 1990. Sedimen-tation dynamics in the Santa Monica–San Pedro Basin off LosAngeles: radiochemical, sediment trap and transmissometerstudies. Cont. Shelf Res. 10, 137–164.
Huh, C.-A., Finney, B.P., Stull, J.K., 1992. Anthropogenic inputsof several heavy metals to nearshore basins off Los Angeles.Prog. Oceanog. 30, 335–351.
Inman, D.L., Jenkins, S.A., 1999. Climate change and the episod-icity of sediment flux of small California rivers. J. Geol. 107Ž .3 , 251–270.
Inman, D.L., Jenkins, S.A., Masters, P.M., 2000. Budget ofsediment and fate of DDT at the ocean edge of the SouthernCalifornia Bight. Technical report submitted as an expertreport in United States of America, et al. vs. Montrose Chemi-
Ž .cal Corporation of California, et al., CV 90 3122-AAH JRx .Katz, A., Kaplan, I.R., 1981. Heavy metals behavior in coastal
sediments of Southern California: A critical review and syn-thesis. Mar. Chem. 10, 261–299.
Kettenring, K.N., Jr., 1981. The trace metal stratigraphy andrecent sedimentary history of anthropogenous particulates onthe San Pedro Shelf, California. PhD Dissertation, Univ. ofCalifornia, Los Angeles. 156 pp.
Lee, H.J., 1994. The Distribution and Character of ContaminatedEffluent-Affected Sediment, Palos Verdes Margin, SouthernCalifornia, USGS Expert Report.
List, E.J., Paulsen, S.C., 2000. In situ biodegradation rates ofp,p’-DDE in the sediments of the Palos Verdes Shelf, South-ern California: An analysis of field evidence. Technical reportsubmitted as an expert report in United States of America, etal. vs. Montrose Chemical Corporation of California, et al.,
Ž .CV 90 3122-AAH JRx .Logan, B.E., Steele, J.A., Arnold, R.G., 1989. Computer simula-
tion of DDT distribution in Palos Verdes shelf sediments. J.Ž .Environ. Eng. 115 1 , 221–238.
Morel, F.M.M., Westall, J.C., O’Melia, C.R., Morgan, J.J., 1975.Fate of trace metals in Los Angeles County wastewater dis-charge. Environ. Sci. Technol. 9, 756–761.
Myers, E.P., The concentration and isotopic composition of car-bon in marine sediments affected by a sewage discharge. PhDDissertation, Calif. Inst. of Technol., Pasadena, CA., 179 pp.
Niedoroda, A.W., Swift, D.J.P., Reed, C.W., Stull, J.K., 1996.Contaminant dispersal on the Palos Verdes continental margin:III. Processes controlling transport, accumulation and re-emer-gence of DDT-contaminated sediment particles. Sci. TotalEnviron. 179, 109–133.
Paulsen, S.C., List, E.J., Santschi, P.H., 1999. Modeling variabil-ity in 210 Pb and sediment fluxes near the Whites Point out-falls, Palos Verdes shelf, California. Environ. Sci. Technol. 33Ž .18 , 3077–3085.
Quensen, J.F., Mueller, S.A., Jain, M.K., Tiedje, J.M., 1998.Reductive dechlorination of DDE to DDMU in marine sedi-ment microcosms. Science 280, 722–724.
Renner, R., 1998. ANaturalB remediation of DDT, PCBs debated.Ž .Environ. Sci. Technol. 32 15 , 360A–363A.
Santschi, P.H., Allison, M., Asbill, S., Perlet, A.B., Cappellino,S., Dobbs, C., McShea, L., 1999. Sediment transport and Hgrecovery in Lavaca Bay, as evaluated from radionuclide andHg distributions. Environ. Sci. Technol. 33, 378–391.
Santschi, P.H., Guo, L., Asbill, S., Allison, M., Kepple, A.B.,Wen, L., 2000a. Accumulation Rates and Sources of Sedi-ments and Organic Carbon on the Palos Verdes Shelf Based
( )P.H. Santschi et al.rMarine Chemistry 73 2001 153–171 171
Ž137 239,240 210 234 238on Radioisotopic Tracers Cs, Pu, Pb, Th, U14 .and C . Mar. Chem., this volume.
Santschi, P.H., Guo, L., Wen, L.-S., 2000b. Box coring artifacts insediments affected by a waste water outfall. Mar. Poll. Bull.,in press.
Schafer, H.A., 1977. Characteristics of municipal wastewater dis-charges, SCCWRP Annu. Rep., El Segundo, CA.
Schafer, H.A., 1989. Historical trends in municipal wastewateremissions. J. Water Poll. Control Fed. 61, 1395–1401.
Schiff, K.C., Weisberg, S.B., 1999. Iron as a reference element fordetermining trace metal enrichment in Southern Californiacoastal shelf sediments. Mar. Environ. Res. 48, 161–176.
Shaw, T.J., Gieskes, J.M., Jahnke, R.A., 1990. Early diagenesis indiffering depositional environments: The response of transitionmetals in pore water. Geochim. Cosmochim. Acta 54, 1233–1246.
Smith, R.W., Greene, C.S., 1976. J. Water Poll. Cont. Fed. 48,1894–1912.
Stull, J.K., Baird, R.B., 1985.Trace metals in marine surfacesediments of the Palos Verdes Shelf, 1974 to 1980. JournalWPCF 57r8, 833-840.
Stull, J.K., Haydock, C.I., Smith, R.W., Montagne, D.E., 1986.Long-term changes in the benthic community on the coastalshelf of Palos Verdes, Southern California. Mar. Biol. 91,539–551.
Stull, J.K., Swift, D.J.P., Niedoroda, A.W., 1996. Contaminantdispersal on the Palos Verdes continental margin: I. Sedimentand biota near a major California wastewater discharge. Sci.Total Environ. 179, 73–90.
Swartz, R.C., Cole, F.A., Schults, D.W., DeBen, W.A., 1986.Ecological changes in the Southern California Bight near alarge sewage outfall: benthic conditions in 1980 and 1983.Mar. Ecol. Prog. Ser. 31, 1–13.
Sweeney, R.E., Kalil, E.K., Kaplan, I.R., 1980. Characterizationof domestic and industrial sewage in Southern California
coastal sediments using nitrogen, carbon, sulphur and uraniumtracers. Mar. Environ. Res. 3, 225–243.
Van Cappellen, P., Santschi, P.H., Cai, W.-J., Wen, L.-S., 2000.Organic matter degradation and bioirrigation in marine sedi-
Žments impacted by wastewater outfall Palos Verdes Shelf,.Southern California Bight . Mar. Chem., to be submitted.
Venkatesan, M.I., Kaplan, I.R., 1980. Vertical and lateral trans-port of organic carbon and the carbon budget in Santa MonicaBasin, California. Prog. Oceanog. 30, 291–312.
Venkatesan, M.I., Maldonado, C., Bayona, J.M., 1996. Sewagemarkers in the sediments of Santa MonicarSan Pedro Basins,California. 212th Natl. ACS Meeting, Orlando, Florida, Aug.
Ž .25–29, 1996, Extended Abstracts 36 pp. 164–165, 2 .Warnken, K.W., Gill, G.A., Wen, L.-S., Griffin, L.L., Santschi,
P.H., 1999. Trace metal analysis of natural waters by ICP-MSwith on-line preconcentration and ultrasonic nebulization. J.
Ž .Anal. Atomic Spectrom. 14 2 , 247–252.Warnken, K.W., Gill, G.A., Griffin, L.L., Santschi, P.H., 2000.
Sediment–water exchange fluxes of Mn, Fe, Ni, and Zn inGalveston Bay, Texas. Mar. Chem., in press.
Wheatcroft, R.A., Martin, W.R., 1996. Spatial variation in short-Ž234 .term Th sediment bioturbation intensity along an
organic-carbon gradient. J. Mar. Res. 54, 763–792.Williams, P.M., Robertson, K.J., Soutar, A., Griffin, S.M., Druf-
Ž .fel, E.R.M., 1992. Isotopic signatures 14C, 13C, 15N astracers of sources and cycling of soluble and particulateorganic matter in the Santa Monica Basin, California. Prog.Oceanog. 30, 253–290.
Wong, K.M., Jokela, T.A., Eagle, R.J., Brunk, J.L., Noshkin,V.E., 1992. Radionuclide concentrations, fluxes, and residencetimes at Santa Monica and San Pedro Basins. Prog. Oceanog.30, 353–391.
Young, D.R., McDermott-Ehrlich, D., Heesen, T.C., 1977. Sedi-ments as sources of DDT and PCB. Mar. Pollut. Bull. 8,254–257.
Related Documents