88 Driving success by executing our goals Transport & Energy

Welcome message from author
This document is posted to help you gain knowledge. Please leave a comment to let me know what you think about it! Share it to your friends and learn new things together.
Transcript

88
Driving successby executing our goals
Transport & Energy

89
Vehicles
Salvatore Bianconi
Managing Director
Driving successby executing our goals
89

90
Key achievements:
2006 Investor day: Revenues 2010E: €810 m
2007 Investor day: Revenues 2010E: €825 m, Ebit 2010E: 2%;
Ansaldobreda is following an intensive and deep industrial restructuring plan, whichaffect entirely the industrial structure. Achievements:
strengthen engineering capabilities
� key know-how and tools now available and consistent with needs;� IC4, EMU72, E403 programmes critical issues recovered;
enhance methodologies for risk assessment and mitigation� structured approach implemented already in tender phase;
successful completion of the “Crash Programme”(basic process strengthening mainly in factory logistics)

91
Actions in process
Ongoing activities:
“Process Programme”:� extensive process which implement all in-process improvement actions, performing a general re-engineering of the value chain main processes, acting on organisation, structures and operation behaviour;� main areas involved: Product and Process Engineering, Materials, Logistic and Purchase Management, Production;
Production sites specialisation:� configuration of a specific “mission” for each production site, characterised by an industrial structure “tailored” for a specific product;� targets: industrial reorganisation with optimisation of logistics processes, production efficiency and effectiveness;
Human Resources Optimisation:� from 2007 Ansaldobreda is developing a strong action of rationalisation and improvement on personnel mix.

92
RoW11%
Italy35%
Europe46%
USA8%
RoW3%
Italy58%
Europe32%
USA7%
Regional15%
Main Line18%
Mass Transit45%
Service22%
Service26%
Mass Transit43%
Main Line15%
Regional16%
Revenues growth 2006 - 2010
Business Area
Geographical Area
€460 m
2006 2010
€825 m

93
Revenues growth: Drivers
Orders backlog: €2.1 bn (at 30/09/2007)
2008-2010 Orders Forecast:
� Total: €2.5 bn
� Annual Average: €0.8 bn
� Annual growth rate: 12%
Tenders forecast: €10 bn
Coverage rate (orders / tenders): 25% (as per 2003-2007 results)
Main projects:� High Speed Train Trenitalia (Trenitalia investment plan €1.1 bn)
� TSR / EMUs DD (Trenitalia / Regional operators & European countries)
� EMUs (electrical multiple unit) Russia
� HRVs (heavy rail vehicle)/MLA (automatic rail vehicle) Italy (Rome, Milan, Naples)
� HRVs/MLA Europe (Madrid, Athens, …) and China
� Sirio Europe & Turkey (Gothenburg, Kayseri …)
� Global Service (Madrid, Norway…)

94
Profitability growth: Drivers
cost reduction through process plan implementation
improvement, leaning, integration, traceability of industrial process
sites restructuring/reorganisation
higher efficiency and lower logistics costs
resource optimisation
300 heads out /180 in, with same throughput
higher direct/indirect ratio
2006-2010 orders profile average margin = 13%
New orders economic global profile: Margin 13%; R&D 1.5%; G&A 7.5%; Ebit 4%
The economic profile of new orders derives from the company’srestructuring process:
All leading to a significant improvement in total company efficiency

95
Investments: R&D and CAPEX
CAPEX IN 2007-2010:
Product development
41%
Maintenance45%
Mandatory14%
Total Gross R&D Investments 2007-2010: €59 m
Capitalised52%
Expensed 48%
Capitalised R&D 2007-2010:
Urban 41%
Regional 36%
Main Line 23%
€30 m
€78 m
96
Investments: R&D and CAPEX
Capital Expenditure: Targets of the plan being implemented :
� Improve and specialise the mission of the 4 plants (“product driven mission”)� Implement state of the art capabilities for key manufacturing process� Improve the plants layout to efficiently manage the final assembly and
functional test
Overall spent (2007-2010) : approx. €78 m
R&D: Priority given to significant-transversal technology improvements and innovation, to assure fallout on all AnsaldoBreda products being developed/upgraded (Main Line-Mass Transit- Regional-Urban), such as:
� Enhanced SW solutions and development environment� Improved integrated traction systems� Smart diagnostics/prognostics systems� Innovative command and control solutions
Overall spent (2007-2010): approx. €59 m

97
Investments: overview

99
Energy
Giuseppe ZampiniCEO
Driving successby executing our goals

100
Finmeccanica Investor Day ’07 vs. ‘06
Last year’s target:
• Group Revenues @ €1.4bn
• ROS @ 9%
New Units• Strengthened sales &
marketing organisation• Developed low emission
burners (<15 ppm) for V94.3A4
2010 Target Change Today’s target:
•Group Revenues @ €1.7bn
•ROS @ 9+%
Stronger & sustainable market
Higher profitability & market share on New Units
Very solid backlog, higher than expected
Service• Acquisition of
Thomassen Turbine System (NL) & Energy Service Group (CH)
• Double digit organic growth (+20%)
Main Achievement ‘06

101
Extend market reach and service share
2006 2010
Service contribution to EBIT from approx 35% in 200 6 to approx 60% in 2010
Rest of EuropeNorth & South
America1%
Middle East &
Africa
Italy
66%
12%
Asia2%
€961 m 19%
€961 m
New Units
75%
21%
4%Service
Nuclear
22%
North & South America
1%
Middle East &
Africa
29%
Asia
Rest of EuropeItaly
5%
43%€1.7 bn
€1.7 bn 33%62%
5%New Units
Service
Nuclear
ROS=6%+ ROS=9%+

102
Target Regions
New units business:€1bn of revenues by 2010
• Increase production capacity (€40m+ workshop investments in 2008-10)…and preserving flexibility
• Global supply chain• Decrease G&A by 1 pt %
(on revenues)Backlog @ 3Q07 New Orders Margins
~1750
900950
1050
100%
130%
2007E 2008F 2009F 2010F
Data in €/000
Power Generation Market
Roadmap towards €1 bn revenues
[GW]
Souce: International Energy Outlook 2007- EIA
103 102 111
336 340 369
427 535731
178173
175297
322
343
2004 2010 2020Oil Coal Gas Nuclear Renewables
1729
14721341
Indexed
Scenario Effects
• World Wide + 70% Gas Turbine Orders
• Target Regions: +100% GT orders
• Market Trend very strong until 2010 and positive thereafter
• Doubled order intake and increased GT market share 2007 (5.7% vs 4%, YTD Sept 30)
• Higher profitability in a sellers market

103
Service business:€560 m of revenues by 2010
• OEM Installed fleet: LTSA & Flow• Increase profitability: In-source critical processes
• Improve value proposition
• OSPTM strategy: increase product portfolio also by acquisitions and technology
• Thomassen Turbine Systems turnaround: + 50% vs. ’06 orders
Total GT & ST Service Market
AEN 2006 Evaluation
Data in B€/year
22.8
Increase Service Entitlement & Customer Penetration :Primarily an Organic Gameplan
AEN as OEM
AEN as OSPTM
Other OEM’s Technology
Other OEM‘s Technology not accessible to AEN as OEM
19.4
Other
OEM‘s Known Technology
2.9
AEN Fleet
0.5Additional Accessible Technologies with AEN OSPTM strategic plan
10.8
8.6
Enhance Service Portfolio: Primarily an Inorganic Gameplan • OEM service market on own installed
fleet expected to grow at 10% CAGR in
next ten years
• Enhancing service portfolio and increase
playground as OSPTM (*)
Data in €/000
600
700800
~1200
100%
~115%
2007E 2008F 2009F 2010F
New OrdersBacklog @‘3Q07 Margins
Power Generation Service Market
Growing towards €560 m revenues
Indexed
(*) Original Service Provider, e.g. combining the Technology Excellence gained as an OEM with the entrepreneurialship and the flexibility matured as an Independent Service Provider
104
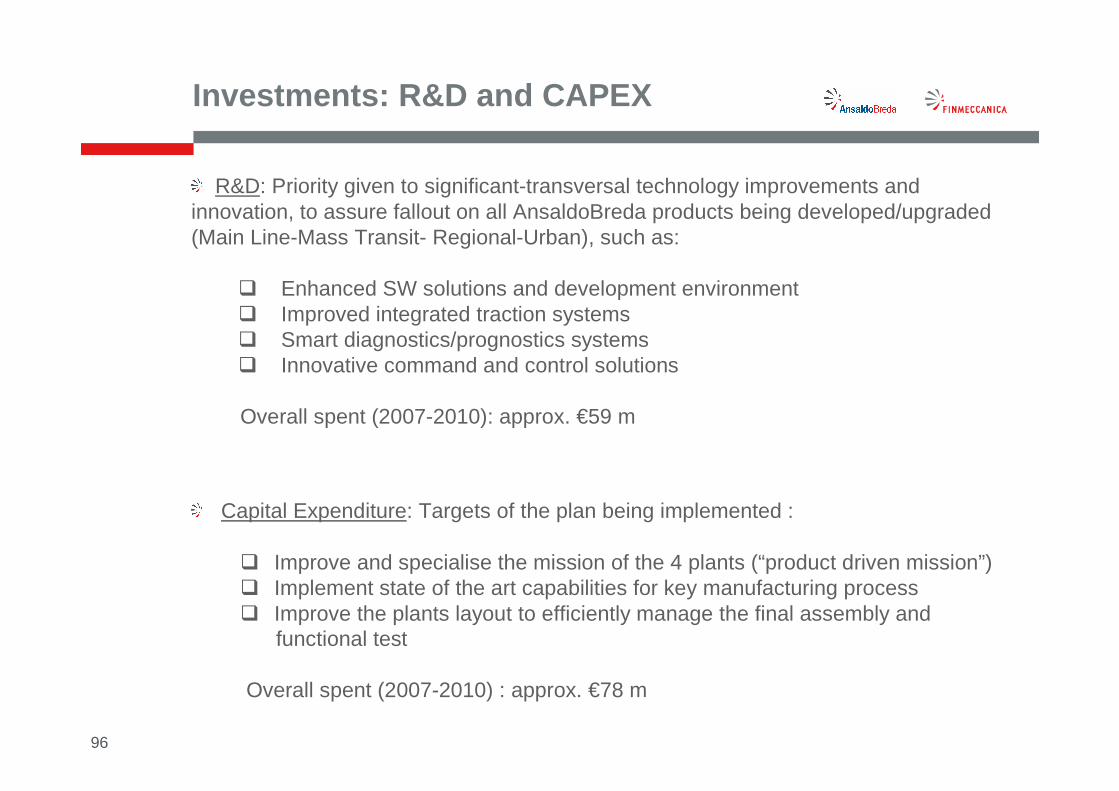
Technology: Building the future
• New Units
• Focus on Gas Turbines: performance improvements with retrofitable upgrades
• Large Size V94.3A(5): 450MW 58% Eff. in Combined Cycle
• Medium Size V94.2(7): 270MW @ 53.5% Eff. in Combined Cycle
• CC operational flexibility
• Ultra supercritical development for Steam Turbines
• Extend air cooled generators up to 400MVA
• V94.2 Life Extension
• V94.3A Extend Maintenance Intervals
• Field service improvements
• GE…extend portfolio and solutions• Other technologies on GTs
• Service OEM
• Service OSPTM
• Renewable • Fuel Cells: 1MW by 2012
105
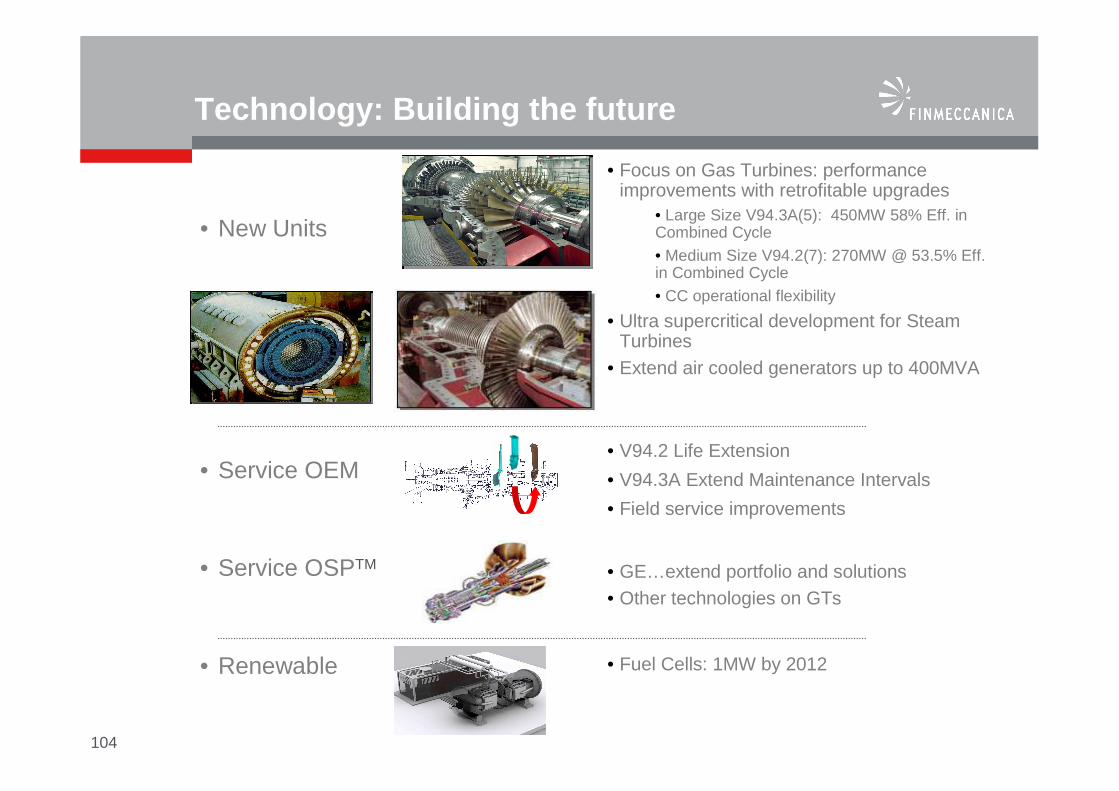
Total Gross R&D 2007-2010
Capitalised30%
Expensed70%
Investments: R&D and CAPEX
Total R&D (Accumulated 2007-2010)
~€125 m
• Product development focused on GT upgrades and OSP portfolio extension
• Maintenance includes workshop capacity enhancement
• Minimum acceptable IRR for CAPEX and R&D @ 15%
Total Capex (Accumulated 2007-2010)
Product Development
15%
Mandatory9%
Mantainance76% ~€165 m
Capitalised R&D 2007-2010
OEM TurboGas76%
OSP24%
~€37 m
Related Documents