Transport above the Asian summer monsoon anticyclone inferred from Aura Microwave Limb Sounder tracers Mijeong Park, 1 William J. Randel, 1 Andrew Gettelman, 1 Steven T. Massie, 1 and Jonathan H. Jiang 2 Received 29 November 2006; revised 23 May 2007; accepted 5 June 2007; published 31 August 2007. [1] Tracer variability above the Asian summer monsoon anticyclone is investigated using Aura Microwave Limb Sounder (MLS) measurements of carbon monoxide, ozone, water vapor, and temperature during Northern Hemisphere summer (June to August) of 2005. Observations show persistent maxima in carbon monoxide and minima in ozone within the anticyclone in the upper troposphere–lower stratosphere (UTLS) throughout summer, and variations in these tracers are closely related to the intensity of underlying deep convection. Temperatures in the UTLS are also closely coupled to deep convection (cold anomalies are linked with enhanced convection), and the three-dimensional temperature patterns are consistent with a dynamical response to near- equatorial convection. Upper tropospheric water vapor in the monsoon region is strongly coherent with deep convection, both spatially and temporally. However, at the altitude of the tropopause, maximum water vapor is centered within the anticyclone, distant from the deepest convection, and is also less temporally correlated with convective intensity. Because the main outflow of deep convection occurs near 12 km, well below the tropopause level (16 km), we investigate the large-scale vertical transport within the anticyclone. The mean vertical circulation obtained from the ERA40 reanalysis data set and a free-running general circulation model is upward across the tropopause on the eastern end of the anticyclone, as part of the balanced three- dimensional monsoon circulation. In addition to deep transport from the most intense convection, this large-scale circulation may help explain the transport of constituents to tropopause level. Citation: Park, M., W. J. Randel, A. Gettelman, S. T. Massie, and J. H. Jiang (2007), Transport above the Asian summer monsoon anticyclone inferred from Aura Microwave Limb Sounder tracers, J. Geophys. Res., 112, D16309, doi:10.1029/2006JD008294. 1. Introduction [2] The Asian summer monsoon anticyclone is a domi- nant feature of the circulation in the upper troposphere – lower stratosphere (UTLS) during Northern Hemisphere (NH) summer. The anticyclone is a closed circulation, which encompasses a westerly jet in midlatitudes and an easterly jet in the tropics, and strong mean meridional motions [Dunkerton, 1995]. It occurs as a response to heating associated with persistent deep convection over the South Asian region during summer [Hoskins and Rodwell, 1995; Highwood and Hoskins, 1998]. The anticy- clone is also observed to coincide with persistent maxima (or minima) in various trace constituents in the UTLS region, such as water vapor [Rosenlof et al., 1997; Jackson et al., 1998; Dethof et al., 1999], ozone [Randel et al., 2001; Gettelman et al., 2004], methane and nitrogen oxides [Park et al., 2004] and carbon monoxide [Filipiak et al., 2005; Li et al., 2005a; Fu et al., 2006]. This likely occurs because the strong winds and closed streamlines associated with the anticyclone act to isolate air within the anticyclone [Li et al., 2005a; Randel and Park, 2006]. The anticyclonic circula- tion and constituent extrema extend into the lower strato- sphere, are an important aspect of stratosphere-troposphere coupling during summer [Dethof et al., 1999]. Diagnostic and modeling studies have furthermore suggested that lower-stratospheric water vapor may be strongly influenced by the upward extension of the monsoon circulation [Bannister et al., 2004; Gettelman et al., 2004; Dessler and Sherwood, 2004; Fu et al., 2006]. [3] Recently, Randel and Park [2006] (hereafter RP) have studied synoptic variability of the monsoon anticyclone and its coupling to transient deep convective forcing, as well as variability in upper tropospheric water vapor and ozone using measurements from the Atmospheric Infrared Sounder (AIRS) [Aumann et al., 2003]. The AIRS observations reveal coherent fluctuations in water vapor and ozone inside the anticyclone that are linked with deep convection, temperature, and the intensity of the anticyclone. However, one limitation of the AIRS constituent data (particularly JOURNAL OF GEOPHYSICAL RESEARCH, VOL. 112, D16309, doi:10.1029/2006JD008294, 2007 Click Here for Full Articl e 1 National Center for Atmospheric Research, Boulder, Colorado, USA. 2 Jet Propulsion Laboratory, California Institute of Technology, Pasadena, California, USA. Copyright 2007 by the American Geophysical Union. 0148-0227/07/2006JD008294$09.00 D16309 1 of 13

Welcome message from author
This document is posted to help you gain knowledge. Please leave a comment to let me know what you think about it! Share it to your friends and learn new things together.
Transcript

Transport above the Asian summer monsoon anticyclone
inferred from Aura Microwave Limb Sounder tracers
Mijeong Park,1 William J. Randel,1 Andrew Gettelman,1 Steven T. Massie,1
and Jonathan H. Jiang2
Received 29 November 2006; revised 23 May 2007; accepted 5 June 2007; published 31 August 2007.
[1] Tracer variability above the Asian summer monsoon anticyclone is investigatedusing Aura Microwave Limb Sounder (MLS) measurements of carbon monoxide, ozone,water vapor, and temperature during Northern Hemisphere summer (June to August) of2005. Observations show persistent maxima in carbon monoxide and minima inozone within the anticyclone in the upper troposphere–lower stratosphere (UTLS)throughout summer, and variations in these tracers are closely related to the intensity ofunderlying deep convection. Temperatures in the UTLS are also closely coupled to deepconvection (cold anomalies are linked with enhanced convection), and thethree-dimensional temperature patterns are consistent with a dynamical response tonear- equatorial convection. Upper tropospheric water vapor in the monsoon region isstrongly coherent with deep convection, both spatially and temporally. However, at thealtitude of the tropopause, maximum water vapor is centered within the anticyclone,distant from the deepest convection, and is also less temporally correlated withconvective intensity. Because the main outflow of deep convection occurs near �12 km,well below the tropopause level (�16 km), we investigate the large-scale verticaltransport within the anticyclone. The mean vertical circulation obtained from the ERA40reanalysis data set and a free-running general circulation model is upward across thetropopause on the eastern end of the anticyclone, as part of the balanced three-dimensional monsoon circulation. In addition to deep transport from the most intenseconvection, this large-scale circulation may help explain the transport of constituents totropopause level.
Citation: Park, M., W. J. Randel, A. Gettelman, S. T. Massie, and J. H. Jiang (2007), Transport above the Asian summer monsoon
anticyclone inferred from Aura Microwave Limb Sounder tracers, J. Geophys. Res., 112, D16309, doi:10.1029/2006JD008294.
1. Introduction
[2] The Asian summer monsoon anticyclone is a domi-nant feature of the circulation in the upper troposphere–lower stratosphere (UTLS) during Northern Hemisphere(NH) summer. The anticyclone is a closed circulation,which encompasses a westerly jet in midlatitudes and aneasterly jet in the tropics, and strong mean meridionalmotions [Dunkerton, 1995]. It occurs as a response toheating associated with persistent deep convection overthe South Asian region during summer [Hoskins andRodwell, 1995; Highwood and Hoskins, 1998]. The anticy-clone is also observed to coincide with persistent maxima(or minima) in various trace constituents in the UTLSregion, such as water vapor [Rosenlof et al., 1997; Jacksonet al., 1998; Dethof et al., 1999], ozone [Randel et al., 2001;Gettelman et al., 2004], methane and nitrogen oxides [Park
et al., 2004] and carbon monoxide [Filipiak et al., 2005; Liet al., 2005a; Fu et al., 2006]. This likely occurs because thestrong winds and closed streamlines associated with theanticyclone act to isolate air within the anticyclone [Li et al.,2005a; Randel and Park, 2006]. The anticyclonic circula-tion and constituent extrema extend into the lower strato-sphere, are an important aspect of stratosphere-tropospherecoupling during summer [Dethof et al., 1999]. Diagnosticand modeling studies have furthermore suggested thatlower-stratospheric water vapor may be strongly influencedby the upward extension of the monsoon circulation[Bannister et al., 2004; Gettelman et al., 2004; Desslerand Sherwood, 2004; Fu et al., 2006].[3] Recently, Randel and Park [2006] (hereafter RP) have
studied synoptic variability of the monsoon anticyclone andits coupling to transient deep convective forcing, as well asvariability in upper tropospheric water vapor and ozoneusing measurements from the Atmospheric Infrared Sounder(AIRS) [Aumann et al., 2003]. The AIRS observationsreveal coherent fluctuations in water vapor and ozone insidethe anticyclone that are linked with deep convection,temperature, and the intensity of the anticyclone. However,one limitation of the AIRS constituent data (particularly
JOURNAL OF GEOPHYSICAL RESEARCH, VOL. 112, D16309, doi:10.1029/2006JD008294, 2007ClickHere
for
FullArticle
1National Center for Atmospheric Research, Boulder, Colorado, USA.2Jet Propulsion Laboratory, California Institute of Technology,
Pasadena, California, USA.
Copyright 2007 by the American Geophysical Union.0148-0227/07/2006JD008294$09.00
D16309 1 of 13

water vapor) is that they have an upper limit near �150 hPa,and they provide little quantitative information on constit-uents in the lower stratosphere (and their coupling toconvection). The focus of this study is to analyze constituentbehavior at the top of the monsoon anticyclone, usingobservations from the Microwave Limb Sounder (MLS)on the NASA Aura satellite [Waters et al., 2006]. Aura MLSmeasurements include water vapor, ozone and carbon mon-oxide that are useful tracers of tropospheric and stratosphericair; these data have been used to document enhanced levelsof carbon monoxide in the upper troposphere over the Asianmonsoon [Li et al., 2005a; Filipiak et al., 2005] and alsoover the North American summer monsoon [Li et al.,2005b].[4] The purpose of this work is to explore constituent
structure and variability in the UTLS over the Asianmonsoon region on the basis of MLS data, and studycoupling to the large-scale circulation of the anticycloneand to variations in convection. Correlated variations ofcarbon monoxide (a tropospheric tracer) and ozone(a stratospheric tracer) are used to quantify transport behav-ior, and the observed coherence among deep convection,temperature and constituents are analyzed to deduce theinfluence of convection on the UTLS. We analyze thestructure and variability of water vapor from the uppertroposphere through the lower stratosphere, and quantifycoherence with deep convection. A key question from theMLS data is how constituents with origins in the lowertroposphere (such as carbon monoxide) attain altitudes ashigh as 16 km (100 hPa) as a result of convection (for whichthe main outflow region is closer to �12 km). We thusinclude analysis of large-scale vertical transport within theanticyclone, using three-dimensional winds from meteoro-logical reanalyses (based on assimilation), and also onwinds from a free-running general circulation model. Ide-alized three-dimensional trajectory calculations are used toquantify the transport above the monsoon anticyclone.
2. Data and Analyses
[5] The MLS instrument aboard the Aura spacecraft, oneof the NASA Earth Observing System (EOS) platforms, hasbeen measuring atmospheric parameters since August 2004[Schoeberl et al., 2006]. MLS uses microwave limb sound-ing to measure temperature and chemical constituents,including carbon monoxide (CO), water vapor (H2O) andozone (O3) in the upper troposphere and stratosphere. TheMLS field-of-view vertically scans the limb in the orbitplane and gives 82�S–82�N latitude coverage on each orbit[Waters et al., 2006]. The standard MLS vertical grid has sixlevels per decade of pressure at 10�n/6 hPa (. . .100.0, 82.5,68.1. . .hPa), with a vertical resolution of �3 km (�6 km fortemperature); the available vertical coverage varies for eachconstituent [Livesey et al., 2005]. MLS can measure in thepresence of cirrus cloud and aerosol. The horizontal reso-lution is �3� along the orbit, with 14 orbits per day (�25�longitude sampling).[6] Vertical profiles of carbon monoxide, ozone, water
vapor and temperature are obtained from MLS version 1.5(v1.5) level 2 products. We construct gridded data on 5�latitude � 10� longitude grids by averaging profiles insidethe bins every 2 days. The quality screening of individual
profiles are processed by the instructions given by Liveseyet al. [2005]. The accuracy of ozone and carbon monoxideis estimated at �40 ppbv + 5% and �30 ppbv + 30% forpressures of 147 hPa and less, respectively. The root meansquare average of the estimated precision of carbon mon-oxide at 100 hPa is 20 ppbv with ±20 ppbv possible biasand 40 ppbv for ozone at 100 hPa (N. J. Livesey et al.,Validation of Aura Microwave Limb Sounder O3 and COobservations in the upper troposphere and lower strato-sphere, Journal of Geophysical Research, in review). TheMLS ozone may have a small positive bias in the UTLSregion, based on validation with ozonesondes over Beijing,China [Bian et al., 2007]. For water vapor, typical single-profile precisions are 0.9, 0.7, and 0.5 ppmv at 215, 147,and 100 hPa, respectively [Livesey et al., 2005]. The typicalestimated precision of the temperature measurement is 1 Kat 100 hPa [Froidevaux et al., 2006].[7] We also use temperature from National Centers for
Environmental Prediction/National Center for AtmosphericResearch (NCEP/NCAR) reanalysis [Kalnay et al., 1996],covering the same time period as the MLS observations(summer 2005). The vertical velocity fields in NCEP dataare available only over 1000–100 hPa. Because we areinterested in vertical velocity fields above 100 hPa, we alsoinclude analyses of three-dimensional circulation using theERA40 data set [Uppala et al., 2005]. These data cover theperiod up to August 2002, so that our analyses are simplyfor climatological summer statistics, rather than for thespecific year 2005. Outgoing longwave radiation (OLR) isused as a convective proxy and obtained from NOAA-CIRESClimate Diagnosis Center (http://www.cdc.noaa.gov/). Thesedata are discussed by Liebman and Smith [1996].[8] We also include results on monsoon dynamical struc-
ture derived from the NCAR Community AtmosphereModel, version 3 (CAM3) [Collins et al., 2006]. Wespecifically focus on the vertical velocity fields and radia-tive dynamical balance of the monsoon anticyclone in the(free-running) CAM3 results, and these are included as acomplement to the results based on assimilated meteoro-logical reanalyses. The model uses a horizontal resolution of1� latitude � 1.25� longitude and has 26 vertical levels. Weuse the 2003 calendar year data extracted from a 4-year runusing 2001–2004 sea surface temperatures.
3. Anticyclone Dynamical Structure and Links toConvection
[9] The climatological structure of the Asian summermonsoon anticyclone is examined using meteorologicalfields from NCEP reanalysis. The horizontal structure of2-month (July–August 2005) average NCEP geopotentialheight and wind anomalies (deviation from the zonal mean)at 100 hPa (�16 km) is shown in Figure 1a. A stronganticyclonic circulation is located between �20�–120�E inNH, centered to the northwest side of the time averageddeep convection (low OLR). There is also an approximatelysymmetric, smaller amplitude anticyclone in the SouthernHemisphere (SH) subtropics. These anticyclonic circula-tions are characteristic of Rossby waves forced by low-frequency heating in the tropics, and are also accompaniedby a Kelvin wave signature along the equator to the east ofthe heating [Gill, 1980; Hoskins and Rodwell, 1995], as
D16309 PARK ET AL.: TRANSPORT ABOVE THE ASIAN SUMMER MONSOON
2 of 13
D16309

illustrated in Figure 1b. The fact that the convective heatingis located north of the equator introduces a much strongercirculation in that hemisphere, as also discussed by Gill[1980]. The schematic diagram of three-dimensional struc-ture of this heat-induced circulation can be found in the workof Highwood and Hoskins [1998, Figure 9].[10] It is important to note the relation between the
anticyclonic circulation and the location of the deep con-vection, as they are distinct. This is illustrated more clearlyin Figure 2, which shows a streamfunction (Y) highlightingthe location of strongest winds at 100 hPa (used here todefine the time averaged anticyclone), together with thetime averaged OLR (a proxy for convection). The strongestconvection occurs over the Indian Ocean and SoutheastAsia, on the southeastern edge of the anticyclone; thisbehavior is consistent with the dynamical structure of theGill response (Figure 1b). There is relatively less of thedeepest convection within the anticyclone, and only aweaker maximum over the Tibetan plateau (noted with grayshading in Figure 2). Analyses of the correlations betweentracers and convection (OLR) show that tracers within the
Figure 1. (a) Horizontal structures of July–August 2005 average National Centers for EnvironmentalPrediction (NCEP) geopotential height anomalies (deviations from the zonal mean, unit: meter) andhorizontal winds (m s�1) at 100 hPa. Horizontal wind fields are shown as vectors, and shaded regionsindicate deep convection (outgoing longwave radiation (OLR) � 205 W m�2). (b) Revised ‘‘Gill-type’’solution at the upper level of the atmosphere [adapted from Gill, 1980, Figure 1b]. Shaded regionsindicate the imposed heat source. Copyright Royal Meteorological Society. Reproduced with permission.Permission is granted by John Wiley and Sons Ltd on behalf of RMETS.
Figure 2. Climatological location of the monsoon antic-yclone (defined as streamfunction (Y) calculated fromNCEP horizontal winds, contour: 400 m2 s�1) averaged inJuly–August 2005. Red contours indicate deep convection(OLR contours of 205, 195, 185. . . W m�2, with valuesbelow 195 hatched red), and Tibetan plateau is shown asgray shading where the elevation is �3 km.
D16309 PARK ET AL.: TRANSPORT ABOVE THE ASIAN SUMMER MONSOON
3 of 13
D16309

anticyclone as a whole are best correlated with OLR in theregion �60�–120�E and 15�–30�N, and we use OLRaveraged over this area as a reference time series for theconvective forcing.[11] The monsoon anticyclone is characterized by cold
temperatures in the UTLS region, overlying warm anoma-lies in the middle troposphere [RP, 2006]. Figure 3 showsthe MLS time averaged (July–August) temperature at100 hPa, expressed as deviations from the zonal mean,showing that coldest temperatures are colocated with theanticyclonic circulation (not with the strongest convection).However, temperatures within the anticyclone do varycoherently with the monsoon convection. This is illustratedin Figure 4a, showing time series of 100 hPa temperatureswithin the cold region (20�–40�N and 20�–120�E) togetherwith the proxy for monsoon convection. These time seriesshow a strong negative correlation (r =�0.86), demonstratingthat cold temperatures near the tropopause are amplified inresponse to the convection. The fact that the temperatureresponse near the tropopause is not colocated with convection(Figure 3) demonstrates that it is mainly a dynamicalresponse, rather than a result of overshooting deep convection[e.g., Kuang and Bretherton, 2004].[12] The dynamical coupling to convection is further
highlighted by examining the latitude-height structure ofcorrelations between temperature (averaged over 20�–120�E) and the convection proxy (OLR), as shown inFigure 4b; here we use NCEP temperatures to cover a widervertical range. The spatial patterns in Figure 4b show strongpositive correlations (warming) in the troposphere andnegative correlations (cooling) near and above the tropo-pause in the region of the anticyclone (�20�–40�N).Furthermore, there are approximately mirror image correla-tion patterns in SH subtropics (�20�–35�S). This symmet-ric structure in the correlations is consistent with the(nonlocal) dynamical response to convective diabatic heat-ing discussed above (Figure 1). Overall, both the timeaverage structure of temperature (Figure 3) and space-timecoherence with convection (Figures 4a–4b) demonstrate
that nonlocal convection primarily controls temperaturevariability within the anticyclone.
4. Carbon Monoxide and Ozone
[13] The climatological behavior of tracers in the UTLS isclosely linked to the dynamical structure seen in Figure 1.The horizontal structure of July–August 2005 average car-bon monoxide and ozone at 100 hPa is shown in Figure 5.Carbon monoxide has a broad maximum within the Asianmonsoon anticyclone, which is identified as strong horizontalcirculation, over 20�–120�E in the NH subtropics. Theserelatively high values of carbon monoxide near the tropo-pause are evidence of transport from near-surface levels[Filipiak et al., 2005; Li et al., 2005a]. MLS ozone exhibitsa minimum over the same region, marked as a streamfunctioncontour, colocated with the maximum in carbon monoxide.This structure is consistent with the minimum in uppertropospheric ozone observed from AIRS data [RP, Figure 1]and likely results from the upward transport of near-surface airwith low-ozone mixing ratios.[14] There is a substantially weaker anticyclone apparent
over North America in Figure 1a, and little evidence ofcorresponding carbon monoxide or ozone extrema inFigure 5. However, a weak secondary maximum in carbonmonoxide is present over the SH subtropics in the longitudeband of the Asian monsoon. There is a similar structure for(low) ozone, with the minimum in SH subtropics havingrelatively lower values with a broad zonal structure (�60�–180�E). The overall ozone structure in Figure 5b is consis-tent with the climatology from the Stratospheric Aerosoland Gas Experiment (SAGE) II measurements [Randel etal., 2001, Figure 7b].[15] The meridional structure of July–August 2005 aver-
aged carbon monoxide for 20�–100�E longitudes (over themonsoon region) is shown in Figure 6. Because of knownbiases in the data in the tropics, we only show results above215 hPa. Isentropes are added as thin solid lines in Figure 6,and the thermal tropopause is marked as a thick dashed line.There is evidence of increased carbon monoxide above the
Figure 3. Horizontal structure of July–August 2005 average temperature anomaly (deviations from thezonal mean, unit: K) at 100 hPa. Overlaid is a streamfunction (Y) contour (400 m2 s�1) defining themonsoon anticyclone, from Figure 2.
D16309 PARK ET AL.: TRANSPORT ABOVE THE ASIAN SUMMER MONSOON
4 of 13
D16309

tropopause in both hemispheres (around 30� latitude), andthese correspond to the maxima observed over the Asianmonsoon and in the SH subtropics (and minima near theequator) in Figure 5a. This ‘‘double-peak’’ structure is mostevident from the tropopause up to 68 hPa, and is also seen
in other MLS tracers such as water vapor, HCl and HNO3(not shown).[16] The synoptic variability of carbon monoxide and
ozone at 100 hPa in the region of the anticyclone throughoutthe summer is shown via Hovmoller diagrams in Figure 7.Relatively high CO mixing ratios are observed in themonsoon region (�20�–120�E), with a clear maximum inJune, and several slightly smaller maxima in July andAugust. Variability observed in CO is closely coupled tothat of ozone in Figure 7b, with high CO linked with lowozone. The episodic highest values of COand lowest ozone areobserved over longitudes �60�–100�E, and subsequentlymove westward, which likely results from advection by theanticyclonic flow (easterly winds in the latitude band 10�–30�N). This strong anticorrelation between carbon monoxideand ozone demonstrates a common source of variability withinthe Asian monsoon anticyclone at this level, and this couplingis enhanced by dynamical confinement within the anticyclone[Li et al., 2005a] (RP).[17] Figure 8 compares time series of 100 hPa carbon
monoxide inside the anticyclone with the OLR convectionproxy from May to September 2005. Carbon monoxide isaveraged over 15�–30�N and 20�–100�E at 100 hPa, wherethe climatology shows a maximum in Figure 5a. Figure 8shows a strong correlation (r = 0.77) between variations indeep convection and carbon monoxide without evidence ofsubstantial time lags. This relationship is similar to thatfound between deep convection and upper troposphericwater vapor in the monsoon region, as shown in RP. Thereis a corresponding negative correlation between ozone at100 hPa and the convection proxy time series (not shown).[18] Because CO and ozone act as tracers of tropospheric
and stratospheric air, respectively, their statistical relation-ship can be used to quantify air mass characteristics andorigins. Several studies have used tracer-tracer relationshipsbetween constituents with tropospheric and stratosphericsources (particularly CO and ozone) to identify the transi-tion region between troposphere and stratosphere air masses[Fischer et al., 2000; Hoor et al., 2002; Pan et al., 2004].The covariability of CO and ozone at 100 hPa over 60�S–60�N for 1–5 July is shown as a scatter plot in Figure 9a.While the overall pattern in Figure 9a is similar to thatobserved in aircraft measurements [e.g., Fischer et al.,2000], the relationships are less compact, and it is notsimple to empirically define stratospheric and troposphericair masses in the MLS data. This is possibly due to thevertical resolution and limb path averaging associated withthe MLS observations, and possibly noise in the respectiveretrievals. Instead of fitting linear slopes to identify strato-spheric and tropospheric air masses as used by Pan et al.[2004], we empirically choose specific values of carbonmonoxide and ozone to identify air mass characteristics.Accordingly, we define stratospheric air as containing highozone (�300 ppbv) and low carbon monoxide (<60 ppbv),and tropospheric air as having low ozone (<300 ppbv) andhigh carbon monoxide (�60 ppbv). Air with characteristicsmidway between these limits is then specified as a transitionregion (blue dots in Figure 9a).[19] Using this CO-ozone relationship, we use each MLS
profile measurement over 2 months to quantify statisticalcharacteristics of air masses at 100 hPa, and present a mapin Figure 9b. First, we assign three primary colors (red,
Figure 4. (a) OLR (W m�2) time series averaged in15�–30�N and 60�–120�E longitudes (plus) and micro-wave limb sounder (MLS) temperature (K) time series at100 hPa averaged in 15�–30�N and 20�–120�E long-itudes (solid line, top) from May to September 2005.Correlation coefficient (r = �0.86) is noted at the upperright. (b) Correlations between the OLR time series averagedover 15�–30�N and 60�–120�E and the NCEP temperatureanomaly (deviations from the zonal mean) averaged over20�–120�E for May to September 2005. Contour interval is0.25, and zero contour is omitted. Plus and minus signsindicate the strongest correlations in both hemispheres. The5% significance level, evaluated using a resamplingtechnique [Efron and Tibshirani, 1993], is near 0.3 andshown as shadings. Thermal tropopause derived fromNCEP/National Center for Atmospheric Research (NCAR)reanalysis is noted by thick solid line, and the topography isadded at the bottom.
D16309 PARK ET AL.: TRANSPORT ABOVE THE ASIAN SUMMER MONSOON
5 of 13
D16309

yellow, and blue) to each point according to the relationshipin Figure 9a on a profile-by-profile basis. Then, measure-ments are accumulated for July and August and binned in2.5� latitude � 5� longitude grid boxes (with typically 20–40 observations in each box). The colors in the map(Figure 9b) are then determined by the relative numbersof air types accumulated in the grid boxes, and this showsthe statistical characteristics of air in the individual measure-ments over 2 months. The primary color is given where thelargest number is bigger than twice the second number, andthe statistical properties of the transition regions are furtherseparated by using mixed colors (e.g., green = yellow +blue, purple = red + blue, and orange = red + yellow). Forexample, green denotes an approximately equal mixture ofstratosphere (yellow) and transition region (blue) air. Theresults in Figure 9b show that air within the monsoonanticyclone has a primarily tropospheric signature (redpoints, representing high carbon monoxide and low ozone).Air throughout the rest of the tropics has mixed character-istics, with a transition to stratospheric air at higher lati-
tudes. More frequent transitions between the stratosphereand transition region (green points) occur on the eastern sideof the Asian anticyclone and also near North America inFigure 9b; these are regions of frequent troposphere-strato-sphere transport [Stohl et al., 2003] and Rossby wavebreaking [Postel and Hitchman, 1999] during NH summer.Also, there are a few orange points denoting approximatelyequal proportions of stratospheric and tropospheric air (butless transition air) on the northern edge of the Asiananticyclone. A corresponding analysis at 68 hPa (notshown) suggests that tropospheric or transition air existsin the Asian summer monsoon region and the SH subtrop-ics, while air over the rest of the globe is stratospheric incharacter. The overall results are not sensitive to the exactthreshold values chosen above.
5. Water Vapor
[20] Relatively high values of water vapor near the tropo-pause are a well-known observational feature of the Asian
Figure 5. Horizontal structures of July–August 2005 average (a) MLS carbon monoxide (ppbv) andNCEP horizontal wind fields (shown as vectors) at 100 hPa. (b) MLS ozone (ppbv) and the 400 m2 s�1
streamfunction (Y) contour (thick dashed line) defining the monsoon anticyclone (as in Figure 2) at100 hPa.
D16309 PARK ET AL.: TRANSPORT ABOVE THE ASIAN SUMMER MONSOON
6 of 13
D16309

monsoon anticyclone [e.g., Rosenlof et al., 1997; Randelet al., 2001; Dessler and Sherwood, 2004; Gettelman et al.,2004]. Calculated relative humidity values in this regionare high, and frequent subvisual cirrus clouds are aclimatological feature near the tropopause [Wang et al.,1996; Massie et al., 2002]. However, the processes thatmaintain high water vapor in this region are poorly under-stood, including the specific links to variability in loweraltitudes, convection and clouds. Here we analyze thebehavior of MLS water vapor, and describe the space-timevariability in relation to these factors (although the MLS datado not include information regarding tropopause cirrusclouds).[21] The horizontal structures of July–August 2005 aver-
age water vapor in the upper troposphere (216 hPa) and nearthe tropopause (100 hPa) are shown in Figure 10; note thereis more than an order of magnitude difference in the amountof water vapor at these levels. The water vapor at 216 hPa(Figure 10b) shows a maximum that is nearly coincidentwith the region of deep convection on the southeast side ofthe anticyclone. The time average structure at 100 hPa(Figure 10a) shows a contrasting spatial structure, withhighest water vapor centered within the anticyclone (similarto CO and ozone) and distant from the deepest convection.Figure 11 shows time series of the water vapor mixing ratio
Figure 6. Vertical structures of July–August 2005 averageMLS carbon monoxide (ppbv) averaged over 20�–100�E.Thin solid lines denote isentropes (320, 340, 360, 380, 450,and 500 K), and thermal tropopause derived from NCEP/NCAR reanalysis is noted by thick dashed line.
Figure 7. Hovmoller diagrams of (a) MLS carbon monoxide (ppbv) and (b) ozone (ppbv) at 100 hPaaveraged over 15�–30�N from June to August 2005.
D16309 PARK ET AL.: TRANSPORT ABOVE THE ASIAN SUMMER MONSOON
7 of 13
D16309

at these two pressure levels (averaged over the respectivemaxima, 40�–100�E at 100 hPa and 60�–120�E at 216 hPa)together with the reference OLR time series. The water vaporat 216 hPa shows strong correlation with OLR (r = 0.86),demonstrating that water vapor in the upper troposphere iscoherent with monsoon deep convection both temporallyand spatially. This finding is consistent with the results ofRP [2006] based on AIRS data, and can be reasonablyexplained as simple upward transport of water vaporwithin deep convection.
[22] The time variability of water vapor at 100 hPa inFigure 11 (top) shows less correlation (r = 0.6) with OLRthan water vapor data at lower levels and also lowercorrelation than for other tracers at 100 hPa, namely COand ozone. This weaker temporal correlation with convec-tion, in addition to the 100 hPa water vapor maximum beingspatially removed from the deep convection (Figure 10a),suggests more complicated behavior than simple verticaltransport to this level. Time series of relative humidityderived from MLS water vapor and NCEP temperature datain this region at 100 hPa show relatively high values (�60–100%), with variability primarily linked to temperatureswithin the anticyclone (not shown). The high relativehumidity, together with the climatological occurrence oftropopause cirrus clouds noted above, suggest that in situdehydration could contribute to the decoupling of watervapor at 100 hPa with values below (although dehydrationis difficult to diagnose on the basis of the area averagesinherent to satellite data, together with a lack of synopticcirrus observations). It is also possible that overshootingdeep convection could directly influence the water vaporbudget at this level, at scales smaller than those observed byMLS, and Dessler and Sherwood [2004] have used anidealized model to suggest that convective transport playsa key role for water vapor near the tropopause. However,the results of Gettelman et al. [2002] show that almost noconvection reaches to the tropopause level in this region(over Iran and Afghanistan). Overall the processes thatcontrol water vapor near the tropopause are poorly under-stood, and this is a key area for further research.
6. Large-Scale Vertical Transport in the MonsoonAnticyclone
[23] The observations of MLS carbon monoxide andozone show clear evidence of tropospheric air at altitudes
Figure 8. (bottom) OLR (W m�2) time series averagedover 15�–30�N and 60�–120�E. (top) MLS carbonmonoxide (ppbv) time series at 100 hPa averaged over15�–30�N and 20�–100�E from May to September 2005.Correlation coefficient (r = 0.77) is noted at the upper right.
Figure 9. (a) Scatter plot of MLS carbon monoxide (ppbv) and ozone (ppbv) at 100 hPa over 60�S–60�N for 1–5 July 2005. Yellow dots represent stratospheric air (O3 � 300 and CO < 60 ppbv), and reddots denote tropospheric air (O3 < 300 and CO � 60 ppbv), respectively. Blue dots located in betweendenote the troposphere and stratosphere transition layer. (b) Map of air mass statistics diagnosed fromCO-O3 relationship in Figure 9a for July–August 2005. Colors represent statistical air masscharacteristics defined in this study, e.g., yellow: stratosphere, red: troposphere, blue: transition layer,green: stratosphere or transition layer, purple: troposphere or transition layer, orange: stratosphere ortroposphere. See text for details.
D16309 PARK ET AL.: TRANSPORT ABOVE THE ASIAN SUMMER MONSOON
8 of 13
D16309

near (and above) the tropopause within the anticyclone, anda natural question is how these tracers reach such highaltitudes (>16 km). It is likely that deep convection isresponsible for transporting near-surface air vertically intothe middle and upper troposphere, but the outflow level forthe majority of deep convection is probably near or below�12 km, with a small fraction reaching the tropopauselevel [Gettelman et al., 2002; Liu and Zipser, 2005]. Whilethis small fraction could still significantly influence thebudgets of CO, ozone and water vapor near the tropopause[Dessler, 2002; Dessler and Sherwood, 2004], it is also ofinterest to understand the large-scale vertical circulation inthe anticyclone.[24] It is straightforward to analyze vertical transport on
the basis of vertical velocities derived from operational orreanalysis data sets. However, there are substantial uncer-tainties in vertical velocities in the UTLS region in currentassimilated data sets, because the values are relatively small(derived as a result of assimilated horizontal wind andtemperature fields) and there are no direct measurementsof vertical velocity that contribute to the assimilation. Thusthe vertical velocities in analyses or reanalyses are not well
Figure 10. Horizontal structures of July–August 2005 average (a) MLS water vapor (ppmv) at 100 hPaand (b) 216 hPa. Solid lines indicate deep convection, with contours as in Figure 2. Thick dashed linesindicate (a) 400 and (b) 730 m2 s�1 streamfunction contours defining the monsoon anticyclone,respectively.
Figure 11. (bottom) OLR (W m�2) and MLS 216 hPawater vapor (ppmv) time series averaged over 15�–30�Nand 60�–120�E. (top) MLS water vapor (ppmv) time seriesaveraged over 15�–30�N and 40�–100�E at 100 hPa forMay to September 2005.
D16309 PARK ET AL.: TRANSPORT ABOVE THE ASIAN SUMMER MONSOON
9 of 13
D16309

constrained and may reflect the behavior (biases) of theunderlying assimilation model, and should be interpreted inthat light. Therefore we have analyzed results from twosources: We use ‘‘observational’’ data from the ERA40reanalysis data set, covering the years 2000–2002, andwe also include results from a free running climate model(CAM3) [Collins et al., 2006]. The CAM3 results arecomplementary to the ERA40 assimilation data in that theyare not influenced by assimilation of sparse data over theUTLS monsoon region.[25] Figure 12a shows a horizontal map of the July–
August average vertical velocity at 104 hPa derived fromthe ERA40 reanalysis data (averaged over 2000–2002),together with the 214 hPa horizontal wind vectors and a fewgeopotential height contours at 200 hPa for the same period(which highlight the location of the Asian monsoon anticy-clone). The ERA40 vertical velocity shows upward motionover the eastern side of the anticyclone, with magnitude
�0.6 mm s�1, and weak (�0.2 mm s�1) downward motionover the western side. There is also upward vertical velocityin the SH subtropics near the region of the weaker,symmetric anticyclone �20�S (Figure 1a), but relativelyweak upwelling over the equator (aside from a localizedregion near the date line). A vertical cross section of theERA40 vertical velocity over longitudes 60�–150�E (theregion of maximum values) is shown in Figure 12b. Thisreveals strong upward vertical velocity throughout thetroposphere (the rising branch of the Hadley circulation,associated with persistent deep convection), and this upwardmotion extends across the tropopause into the lower strato-sphere. There is also a region of upward motion in the SHsubtropics (�20�S), near and above the tropopause.[26] Corresponding results from the CAM3 simulation
show very similar results. CAM3 reproduces a reasonableAsian summer monsoon anticyclonic circulation, and thenear-tropopause vertical velocity in the model exhibits
Figure 12. (a) Horizontal map of July–August average ERA40 vertical velocity (mm s�1) averaged for2000–2002 at 104 hPa (averaged 95 and 113 hPa). Red and blue shaded regions indicate upward anddownward vertical velocity, respectively. A number of geopotential height contours at 200 hPa areoverlaid to identify the Asian anticyclone, and horizontal winds at 214 hPa (averaged 201 and 228 hPa)are shown as vectors. (b) Vertical section of ERA40 vertical velocity averaged over 60�–150�E. Thicksolid line is thermal tropopause derived from NCEP/NCAR reanalysis.
D16309 PARK ET AL.: TRANSPORT ABOVE THE ASIAN SUMMER MONSOON
10 of 13
D16309
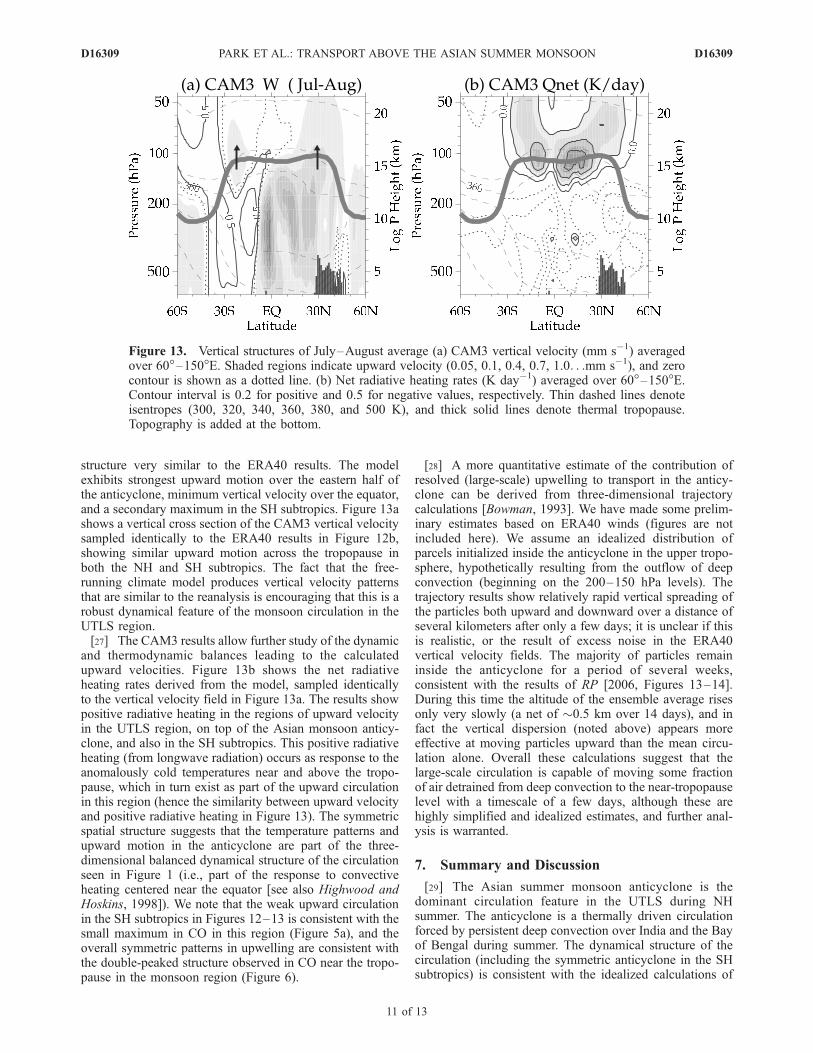
structure very similar to the ERA40 results. The modelexhibits strongest upward motion over the eastern half ofthe anticyclone, minimum vertical velocity over the equator,and a secondary maximum in the SH subtropics. Figure 13ashows a vertical cross section of the CAM3 vertical velocitysampled identically to the ERA40 results in Figure 12b,showing similar upward motion across the tropopause inboth the NH and SH subtropics. The fact that the free-running climate model produces vertical velocity patternsthat are similar to the reanalysis is encouraging that this is arobust dynamical feature of the monsoon circulation in theUTLS region.[27] The CAM3 results allow further study of the dynamic
and thermodynamic balances leading to the calculatedupward velocities. Figure 13b shows the net radiativeheating rates derived from the model, sampled identicallyto the vertical velocity field in Figure 13a. The results showpositive radiative heating in the regions of upward velocityin the UTLS region, on top of the Asian monsoon anticy-clone, and also in the SH subtropics. This positive radiativeheating (from longwave radiation) occurs as response to theanomalously cold temperatures near and above the tropo-pause, which in turn exist as part of the upward circulationin this region (hence the similarity between upward velocityand positive radiative heating in Figure 13). The symmetricspatial structure suggests that the temperature patterns andupward motion in the anticyclone are part of the three-dimensional balanced dynamical structure of the circulationseen in Figure 1 (i.e., part of the response to convectiveheating centered near the equator [see also Highwood andHoskins, 1998]). We note that the weak upward circulationin the SH subtropics in Figures 12–13 is consistent with thesmall maximum in CO in this region (Figure 5a), and theoverall symmetric patterns in upwelling are consistent withthe double-peaked structure observed in CO near the tropo-pause in the monsoon region (Figure 6).
[28] A more quantitative estimate of the contribution ofresolved (large-scale) upwelling to transport in the anticy-clone can be derived from three-dimensional trajectorycalculations [Bowman, 1993]. We have made some prelim-inary estimates based on ERA40 winds (figures are notincluded here). We assume an idealized distribution ofparcels initialized inside the anticyclone in the upper tropo-sphere, hypothetically resulting from the outflow of deepconvection (beginning on the 200–150 hPa levels). Thetrajectory results show relatively rapid vertical spreading ofthe particles both upward and downward over a distance ofseveral kilometers after only a few days; it is unclear if thisis realistic, or the result of excess noise in the ERA40vertical velocity fields. The majority of particles remaininside the anticyclone for a period of several weeks,consistent with the results of RP [2006, Figures 13–14].During this time the altitude of the ensemble average risesonly very slowly (a net of �0.5 km over 14 days), and infact the vertical dispersion (noted above) appears moreeffective at moving particles upward than the mean circu-lation alone. Overall these calculations suggest that thelarge-scale circulation is capable of moving some fractionof air detrained from deep convection to the near-tropopauselevel with a timescale of a few days, although these arehighly simplified and idealized estimates, and further anal-ysis is warranted.
7. Summary and Discussion
[29] The Asian summer monsoon anticyclone is thedominant circulation feature in the UTLS during NHsummer. The anticyclone is a thermally driven circulationforced by persistent deep convection over India and the Bayof Bengal during summer. The dynamical structure of thecirculation (including the symmetric anticyclone in the SHsubtropics) is consistent with the idealized calculations of
Figure 13. Vertical structures of July–August average (a) CAM3 vertical velocity (mm s�1) averagedover 60�–150�E. Shaded regions indicate upward velocity (0.05, 0.1, 0.4, 0.7, 1.0. . .mm s�1), and zerocontour is shown as a dotted line. (b) Net radiative heating rates (K day�1) averaged over 60�–150�E.Contour interval is 0.2 for positive and 0.5 for negative values, respectively. Thin dashed lines denoteisentropes (300, 320, 340, 360, 380, and 500 K), and thick solid lines denote thermal tropopause.Topography is added at the bottom.
D16309 PARK ET AL.: TRANSPORT ABOVE THE ASIAN SUMMER MONSOON
11 of 13
D16309

Gill [1980], and also the more realistic model of Hoskinsand Rodwell [1995]. The results show that heating centerednorth of the equator results in symmetric anticycloniccirculation systems, with stronger response in the NH.The strong coherence between transient convection andremote temperature fluctuations (Figure 4) is convincingevidence of these dynamical links. The cold temperaturesnear the tropopause are a result of the large-scale balanceddynamics, not a result of convective overshooting (as thecold temperatures are not colocated with convection; seeFigure 3). The OLR data show that the strongest convectionoccurs to the southeast of the anticyclone, not over the Tibetplateau (Figure 2); this result is somewhat different to theanalyses of Fu et al. [2006], who argue for a dominant roleof convection over the Tibet plateau region.[30] The strong winds of the Asian summer monsoon
anticyclone act to isolate air from the surrounding area, withthe result that tracer observations often show extrema withinthe anticyclone throughout the UTLS [Park et al., 2004; Liet al., 2005a; RP, 2006]. The MLS observations here showthat this behavior extends into the lower stratosphere, withmaxima in carbon monoxide and water vapor, and minimain ozone, on top of the Asian monsoon anticyclone. Thereare also smaller magnitude constituent maxima in the SHsubtropics, near the corresponding SH anticyclone, so thatthere is a double-peaked latitudinal structure over thelongitude range �20�–120�E. The high carbon monoxideand low-ozone signatures near the tropopause suggest thatair in these regions is mostly tropospheric in character. TheMLS observations furthermore show that variations incarbon monoxide (and ozone) at 100 hPa within theanticyclone are coupled to the monsoon deep convection(Figures 7–8). Overall, the observations are consistent withthe vertical transport of lower-tropospheric air to the UTLSregion (linked with deep convection), and confinementwithin the anticyclone.[31] We have used CO-ozone correlations derived from
the MLS data to empirically characterize air with strato-spheric and tropospheric character, and transitional behavior.The MLS data show the characteristic ‘‘L-shaped’’ structureto the CO-ozone correlations (Figure 9a), although therelationships are less compact than those derived fromhigh-resolution aircraft measurements [e.g., Hoor et al.,2002; Pan et al., 2004]; this may be a result of the limbpath averaging inherent to the MLS data, or possibly noise inthe individual retrievals. In any case, these correlations allowstatistical characterization of a region of stratospheric andtropospheric air, and locations that contain some mixture ofthe two (Figure 9b). According to this diagnostic the easternedge of the monsoon anticyclone has a relatively highfrequency of transition region air, and thus might be regionsof more frequent stratosphere-troposphere exchange.[32] Upper tropospheric water vapor in the monsoon
region is strongly coherent with deep convection, bothspatially and temporally. However, at the altitude of thetropopause, maximum water vapor is centered within theanticyclone (similar to CO), distant from the deepest con-vection; it is also less temporally correlated with convectiveintensity. It is likely that the processes that transport (high)CO and (low) ozone to 100 hPa within the anticyclone alsotransport relatively high water vapor, and so the lack ofstrong correlation between convection and water vapor at
100 hPa might suggest additional processes acting on watervapor (namely, dehydration and/or direct transport withinovershooting convection). Calculation of the relative hu-midity at 100 hPa from the MLS data shows relatively highvalues (�60–100%), and variability is mainly controlled bytemperature. One possibility is that the cold tropopausetemperatures lead to frequent dehydration, and this contrib-utes to decoupling water vapor and the other tracers (andfrequent formation of cirrus cloud near the tropopause).However, the large volume sampling of MLS data (whichprecludes estimates of local supersaturation), plus the lackof synoptic information on cirrus clouds near the tropopausedo not allow quantitative assessment of this mechanism atpresent.[33] The MLS data suggest that air near the tropopause
(�16 km) has been transported from the lower troposphereand is linked to deep convection, although a relatively smallfraction of convection detrains above 12 km. While a smallamount of overshooting convection can contribute signifi-cantly to chemical budgets [Dessler and Sherwood, 2004],we have also investigated the large-scale vertical transportin the anticyclone. We have analyzed the vertical velocitiesfrom ERA40 reanalysis (with assimilated observations) anda free-running climate model (CAM3) in the UTLS region.Both data sources show slow upward motion across thetropopause, with a maximum over the eastern side of theAsian anticyclone (Figure 12); there is also a weakermaximum associated with the anticyclone over the SHsubtropics. This upward circulation is in balance withanomalously cold temperatures near the tropopause, whichresults in positive longwave radiative heating (diagnosedwith the CAM3 results). The upward circulation in theanticyclone is consistent with enhanced carbon monoxidemixing ratios crossing the tropopause. A weaker maximumin carbon monoxide above the tropopause, and weakupward motion, is also observed in the SH subtropics (farremoved from deep convection). This symmetric pattern ofupward circulation is in quantitative agreement with thedouble-peaked meridional structure observed in CO near thetropopause (Figure 6). Quantitative estimates of verticaltransport based on three-dimensional trajectory calculationsusing the ERA40 winds show slow upward net transport ofparticles within the anticyclone, in addition to rapid verticaldispersion (which may or may not be a realistic result).There are substantial uncertainties in these calculations, sothat the details of large-scale vertical transport (and thecontribution of overshooting convection) are topics thatrequire more investigation.
[34] Acknowledgments. We thank the MLS instrument team fordiscussions and production of an excellent data product. We thank PhilDuffy of Lawrence Livermore National Labs for assisting with the CAM3runs. We thank three anonymous reviewers for detailed and thoughtfulreviews, which resulted in substantial improvements to an earlier version ofthis paper. This work was partially supported under the NASA ACMAPAura Validation Project. Author J.H.J. was supported by the Jet PropulsionLaboratory, California Institute of Technology, under contract with NASA.The National Center for Atmospheric Research is operated by the Univer-sity Corporation for Atmospheric Research, under sponsorship of theNational Science Foundation.
ReferencesAumann, H. H., et al. (2003), AIRS/AMSU/HSB on the Aqua Mission:Design, science objectives and data products, IEEE Trans. Geosci. Re-mote Sens., 41, 253–264.
D16309 PARK ET AL.: TRANSPORT ABOVE THE ASIAN SUMMER MONSOON
12 of 13
D16309

Bannister, R. N., A. O’Neill, A. R. Gregory, and K. M. Nissen (2004),The role of the south–east Asian monsoon and other seasonal featuresin creating the ‘‘tape-recorder’’ signal in the Unified Model, Q. J. R.Meteorol. Soc., 130, 1531–1554.
Bian, J., A. Gettelman, H. Chen, and L. L. Pan (2007), Validation ofsatellite ozone profile retrievals using Beijing ozonesonde data, J. Geo-phys. Res., 112, D06305, doi:10.1029/2006JD007502.
Bowman, K. P. (1993), Large-scale isentropic mixing properties of theAntarctic polar vortex from analyzed winds, J. Geophys. Res., 98,23,013–23,027.
Collins, W. D., et al. (2006), The formulation and atmospheric simulation ofthe Community Atmosphere Model version 3 (CAM3), J. Clim., 19,2144–2161.
Dessler, A. E. (2002), The effect of deep tropical convection on the tropicaltropopause layer, J. Geophys. Res., 107(D3), 4033, doi:10.1029/2001JD000511.
Dessler, A. E., and S. C. Sherwood (2004), Effect of convection on thesummertime extratropical lower stratosphere, J. Geophys. Res., 109,D23301, doi:10.1029/2004JD005209.
Dethof, A., A. O’Neill, J. M. Slingo, and H. G. J. Smit (1999), A mechan-ism for moistening the lower stratosphere involving the Asian summermonsoon, Q. J. R. Meteorol. Soc., 125, 1079–1106.
Dunkerton, T. J. (1995), Evidence of meridional motion in the summerlower stratosphere adjacent to monsoon regions, J. Geophys. Res., 100,16,675–16,688.
Efron, B., and R. J. Tibshirani (1993), An Introduction to the Bootstrap,436 pp., CRC Press, Boca Raton, Fla.
Filipiak, M. J., R. S. Harwood, J. H. Jiang, Q. Li, N. J. Livesey, G. L.Manney, W. G. Read, M. J. Schwartz, J. W. Waters, and D. L. Wu (2005),Carbon monoxide measured by the EOS Microwave Limb Sounder onAura: First results, Geophys. Res. Lett., 32, L14825, doi:10.1029/2005GL022765.
Fischer, H., F. G. Wienhold, P. Hoor, O. Bujok, C. Schiller, P. Siegmund,M. Ambaum, H. A. Scheeren, and J. Lelieveld (2000), Tracer correlationsin the northern high latitude lowermost stratosphere: Influence of cross-tropopause mass exchange, Geophys. Res. Lett., 27, 97–100.
Froidevaux, L., et al. (2006), Early validation analyses of atmosphericprofiles from EOS MLS on the Aura satellite, IEEE Trans. Geosci. Re-mote Sens., 44(5), 1106–1121.
Fu, R., Y. Hu, J. S. Wright, J. H. Jiang, R. E. Dickinson, M. Chen,M. Filipiak, W. G. Read, J. W. Waters, and D. L. Wu (2006), Shortcircuit of water vapor and polluted air to the global stratosphere byconvective transport over the Tibetan Plateau, Proc. Natl. Acad. Sci.U. S. A., 103, 5664–5669.
Gettelman, A., M. L. Salby, and F. Sassi (2002), Distribution and influenceof convection in the tropical tropopause region, J. Geophys. Res.,107(D10), 4080, doi:10.1029/2001JD001048.
Gettelman, A., D. E. Kinnison, T. J. Dunkerton, and G. P. Brasseur (2004),Impact of monsoon circulations on the upper troposphere and lowerstratosphere, J. Geophys. Res. , 109 , D22101, doi:10.1029/2004JD004878.
Gill, A. E. (1980), Some simple solutions for heat-induced tropical circula-tion, Q. J. R. Meteorol. Soc., 106, 447–462.
Highwood, E. J., and B. J. Hoskins (1998), The tropical tropopause, Q. J. R.Meterol. Soc., 124, 1579–1604.
Hoor, P., H. Fischer, L. Lange, J. Lelieveld, and D. Brunner (2002), Sea-sonal variations of a mixing layer in the lowermost stratosphere as iden-tified by the CO-O3 correlation from in situ measurements, J. Geophys.Res., 107(D5), 4044, doi:10.1029/2000JD000289.
Hoskins, B. J., and M. J. Rodwell (1995), A model of the Asian summermonsoon. Part I: The global scale, J. Atmos. Sci., 52, 1329–1340.
Jackson, D. R., S. J. Driscoll, E. J. Highwood, J. E. Harries, and J. M.Russell III (1998), Troposphere to stratosphere transport at low latitudesas studied using HALOE observations of water vapour 1992–1997, Q. J.R. Meteorol. Soc., 124, 169–192.
Kalnay, E., et al. (1996), The NCEP/NCAR 40-year reanalysis project, Bull.Am. Meteorol. Soc., 77, 437–471.
Kuang, Z., and C. S. Bretherton (2004), Convective influence on the heatbalance of the tropical tropopause layer: A cloud-resolving model study,J. Atmos. Sci., 61, 2919–2927.
Li, Q., et al. (2005a), Trapping of Asian pollution by the Tibetan antic-yclone: A global CTM simulation compared with EOS MLS observa-tions, Geophys. Res. Lett., 32, L14826, doi:10.1029/2005GL022762.
Li, Q., et al. (2005b), North American pollution outflow and the trapping ofconvectively lifted pollution by upper-level anticyclone, J. Geophys.Res., 110, D10301 doi:10.1029/2004JD005039.
Liebman, B., and C. A. Smith (1996), Description of a complete (interpo-lated) outgoing longwave radiation dataset, Bull. Am. Meteorol. Soc., 77,1275–1277.
Liu, C., and E. J. Zipser (2005), Global distribution of convection penetrat-ing the tropical tropopause, J. Geophys. Res., 110, D23104, doi:10.1029/2005JD006063.
Livesey, N. J. (2005), et al. Data Quality Document for the EOS MLSVersion 1.5 Level 2 Data Set, Jet Propul. Lab., Pasadena, Calif., (Avail-able at http://mls.jpl.nasa.gov).
Massie, S., A. Gettelman, W. Randel, and D. Baumgardner (2002), Dis-tribution of tropical cirrus in relation to convection, J. Geophys. Res.,107(D21), 4591, doi:10.1029/2001JD001293.
Pan, L. L., W. J. Randel, B. L. Gary, M. J. Mahoney, and E. J. Hintsa(2004), Definitions and sharpness of the extratropical tropopause: A tracegas perspective, J. Geophys. Res., 109, D23103, doi:10.1029/2004JD004982.
Park, M., W. J. Randel, D. E. Kinnison, R. R. Garcia, and W. Choi (2004),Seasonal variation of methane, water vapor, and nitrogen oxides near thetropopause: Satellite observations and model simulations, J. Geophys.Res., 109, D03302, doi:10.1029/2003JD003706.
Postel, G. A., and M. H. Hitchman (1999), A climatology of Rossby wavesbreaking along the subtropical tropopause, J. Atmos. Sci., 56, 359–373.
Randel, W. J., and M. Park (RP) (2006), Deep convective influence on theAsian summer monsoon anticyclone and associated tracer variability ob-served with Atmospheric Infrared Sounder (AIRS), J. Geophys. Res., 111,D12314, doi:10.1029/2005JD006490.
Randel,W. J., F.Wu, A. Gettelman, J. M. Russell III, J. M. Jawodny, and S. J.Oltmans (2001), Seasonal variation of water vapor in the lower strato-sphere observed in Halogen Occultation Experiment data, J. Geophys.Res., 106, 14,313–14,325.
Rosenlof, K. H., A. F. Tuck, K. K. Kelly, J. M. Russell III, and M. P.McCormick (1997), Hemispheric asymmetries in water vapor and infer-ences about transport in the lower stratosphere, J. Geophys. Res., 102,13,213–13,234.
Schoeberl, M. R., et al. (2006), Overview of the EOS aura mission, IEEETrans. Geosci. Remote Sens., 44(5), 1066–1074.
Stohl, A., H. Wernli, P. James, M. Bourqui, C. Forster, M. A. Liniger,P. Seibert, and M. Sprenger (2003), A new perspective of stratosphere-troposphere exchange, Bull. Am. Meteorol. Soc., 84, 1565–1573.
Uppala, S. M., et al. (2005), The ERA-40 re-analysis, Q. J. R. Meteorol.Soc., 131, 2691–3012.
Wang, P.-H., P. Minnis, M. P. McCormick, G. S. Kent, and K. M. Skeens(1996), A 6-year climatology of cloud occurrence frequency from Strato-spheric Aerosol and Gas Experiment II observations (1985–1990),J. Geophys. Res., 101, 29,407–29,430.
Waters, J. W., et al. (2006), The Earth Observing System microwave limbsounder (EOS MLS) on the Aura satellite, IEEE Trans. Geosci. RemoteSens., 44(5), 1075–1092.
�����������������������A. Gettelman, S. T. Massie, M. Park, and W. J. Randel, National Center
for Atmospheric Research, P.O. Box 3000, Boulder, CO 80307, USA.([email protected])J. H. Jiang, Microwave Atmospheric Science Team, Jet Propulsion
Laboratory, California Institute of Technology, M.S. 183-701, 4800 OakGrove Drive, Pasadena, CA 91109, USA.
D16309 PARK ET AL.: TRANSPORT ABOVE THE ASIAN SUMMER MONSOON
13 of 13
D16309
Related Documents