P OLICY R ESEARCH WORKING P APER 4401 Transparency, Trade Costs, and Regional Integration in the Asia Pacific Matthias Helble Ben Shepherd John S. Wilson The World Bank Development Research Group Trade Team November 2007 WPS4401 Public Disclosure Authorized Public Disclosure Authorized Public Disclosure Authorized Public Disclosure Authorized

Welcome message from author
This document is posted to help you gain knowledge. Please leave a comment to let me know what you think about it! Share it to your friends and learn new things together.
Transcript
Policy ReseaRch WoRking PaPeR 4401
Transparency, Trade Costs, and Regional Integration in the Asia Pacific
Matthias HelbleBen Shepherd John S. Wilson
The World BankDevelopment Research GroupTrade TeamNovember 2007
WPS4401P
ublic
Dis
clos
ure
Aut
horiz
edP
ublic
Dis
clos
ure
Aut
horiz
edP
ublic
Dis
clos
ure
Aut
horiz
edP
ublic
Dis
clos
ure
Aut
horiz
ed

Produced by the Research Support Team
Abstract
The Policy Research Working Paper Series disseminates the findings of work in progress to encourage the exchange of ideas about development issues. An objective of the series is to get the findings out quickly, even if the presentations are less than fully polished. The papers carry the names of the authors and should be cited accordingly. The findings, interpretations, and conclusions expressed in this paper are entirely those of the authors. They do not necessarily represent the views of the International Bank for Reconstruction and Development/World Bank and its affiliated organizations, or those of the Executive Directors of the World Bank or the governments they represent.
Policy ReseaRch WoRking PaPeR 4401
The authors show in this paper that increasing the transparency of the trading environment can be an important complement to traditional liberalization of tariff and non-tariff barriers. Our definition of transparency is grounded in a transaction cost analysis. The authors focus on two dimensions of transparency: predictability (reducing the cost of uncertainty) and simplification (reducing information costs). Using the
This paper—a product of the Trade Team, Development Research Group—is part of is part of a broader “Transparency and Competitiveness” project supported through a Trust Fund established by the Australian Department for Foreign Affairs and Trade and the Australian Agency for International Development (AUSAID). The work here is aligned with and has benefited from a project on Trade Costs and Facilitation at the Bank with support of the U.K. Department for International Development. This paper is based on a report prepared for the Asia-Pacific Economic Cooperation. Policy Research Working Papers are also posted on the Web at http://econ.worldbank.org. The authors may be contacted at [email protected], [email protected], or [email protected]
Asia Pacific Economic Cooperation (APEC) member economies as a case study, the authors construct indices of importer and exporter transparency for the region from a wide range of sources. Our results from a gravity model suggest that improving trade-related transparency in APEC could hold significant benefits by raising intra-APEC trade by proximately $148 billion or 7.5 pecent of baseline trade in the region.

Transparency, Trade Costs, and Regional Integration in the Asia Pacific
Matthias Helble, Ben Shepherd and John S. Wilson1, 2 The World Bank 1818 H St. NW
Washington D.C. 20433
Keywords: Transparency, Uncertainty, Trade Costs, Non Tariff Barriers, APEC Economies
JEL Codes: F 13, F 14, F 15, O 24, R 58
1 The first author is with the World Health Organization, second is a Consultant and third author a Lead Economist, in the Development Research Group—Trade, The World Bank. This paper is based on a report prepared for the Asia-Pacific Economic Cooperation, and is part of a broader “Transparency and Competitiveness” project supported through a Trust Fund established by the Australian Department for Foreign Affairs and Trade and the Australian Agency for International Development (AUSAID). The work here is aligned with and has benefited from a project on Trade Costs and Facilitation at the Bank with support of the U.K. Department for International Development. We are grateful to David Laborde, Alina Mustra, Alessandro Nicita, and Jerzy Rozanski for assistance with data. We benefited from helpful discussions and comments from Bernard Hoekman, Gary Hufbauer, and Beata Smarzynska Javorcik. Witold Czubala provided very capable research assistance. Comments to: [email protected], [email protected] or [email protected]. 2 The findings, interpretations, and conclusions expressed in this paper are entirely those of the authors. They do not necessarily represent the view of the World Bank, its Executive Directors, or the countries they represent.

2
1 Introduction
In the development context, it is increasingly recognized that tariff liberalization, while
necessary, is not on its own sufficient to ensure the integration of an economy into
international markets (World Bank IEG, 2006). Barriers other than tariffs, as well as
supply side constraints, hinder firms in emerging economies from successfully entering
export markets. With falls in applied tariff rates in many countries over recent decades,
attention has increasingly shifted to non-tariff barriers (NTBs) and other non-traditional
sources of trade costs. Gradually, the boundaries of the trade policy space have moved
further behind the border, as analysts and policymakers have come to recognize the very
broad range of economic and institutional features that can impact international trade
flows. When looking at the factors influencing trade performance, it is therefore
important to take a holistic approach that includes all aspects of a country’s trading
environment.
The key contribution of this paper is to provide a framework within which to analyze an
important but under-researched aspect of the trading environment, namely its
transparency. Our contention is that exporters’ and importers’ incentives are impacted not
just by what governments do, but by how they do it. The nominal restrictiveness of trade
policy makes up most of the “what”, while transparency is an important part of the
“how”. We provide transparency with precise analytical content by defining it in terms of
two fundamental attributes: simplification and predictability. A simpler and more certain
trading environment is thus considered to be a more transparent one. Using APEC
member economies as a case study, we show in turn that a more transparent trading
environment is associated with increased bilateral trade.
While a number of previous studies have examined the broader links between institutions
and trade, ours is the first to analyze in detail the issue of transparency—one particularly
important aspect of a country’s institutional setup. Anderson and Marcouiller (2002) find
that weak institutions act as significant barriers to international trade: import/export
transactions are inherently risky due to, for example, imperfect contract enforceability,

3
and such factors are in effect given free rein under weak institutional regimes.3 Those
authors use World Economic Forum data to construct an index of the strength of
institutions that support trade, focusing on contract enforcement and the existence of
impartial and transparent government policies. Thus, while the concept of transparency is
crucial to their work, their empirical development of its scope is much broader than ours:
whereas they consider the general transparency of a country’s governance structure, we
focus on the trading environment itself to develop a multi-dimensional measure of
transparency that is as closely related as possible to the processes of exporting and
importing.
Levchenko (2007) complements the Anderson and Marcouiller (2002) approach by
embedding cross-country institutional differences affecting contract enforceability in a
general equilibrium model of trade. Using import share data for the USA, he shows
empirically that higher institutional quality in the exporting country is associated with
stronger trade flows in complex products, which are argued to be institutionally intensive
due to the need to contract for intermediate goods. He measures institutional quality using
the rule of law component of the World Bank’s World Governance Indicators dataset.
By contrast, de Groot et al. (2004) take a much broader approach to examining
institutions and trade, including all of the World Governance Indicators in their measure
of institutional quality. In addition to rule of law, they also take account of voice and
accountability, political stability, government effectiveness, regulatory quality, and
control of corruption. Using a gravity model, they find that both institutional quality and
the existence of similar institutions in trading partners are positively associated with
bilateral trade.
Finally, Francois and Manchin (2007) measure institutional quality through the lens of
economic freedom, focusing on aspects such as the size of government, freedom of trade,
protection of property rights, and business regulation. They find that strong institutions in
this sense are associated with increased trade at both the intensive and extensive margins.
3 Ranjan and Lee (2007) report similar findings using more detailed data on contract enforcement. They also find evidence that the link between contract enforcement and trade is stronger for differentiated goods than for homogeneous ones.
4
That is, they result not only in stronger bilateral trade flows, but also an increased
probability that countries will trade at all.
We extend this recent work in three ways. First, “unbundling” institutions and focusing
on one important aspect—transparency in the trading environment—allows us to bring
additional focus and clarity to what is potentially a very wide-ranging area. In this sense,
our approach is complementary to the recent work on contract enforcement referred to
above: it too concentrates on just one aspect of the broader links between institutions and
trade.
Second, we develop a comprehensive set of indicators that measure the transparency of a
country’s trading environment from a number of different perspectives. Using APEC
member economies for our empirical work, we examine both perceptions-based and
“objective” data taken from sources such as the Global Competitiveness Report, the
Doing Business dataset, and a new Logistics Perception Index developed by the World
Bank. These data cover issues such as the prevalence of trade-related corruption, political
favoritism, efficiency of customs and border agencies, the extent of hidden trade barriers,
and uncertainty surrounding trade policy settings, logistics performance, and corruption.
We then use factor analysis to combine these indicators into two composite measures of
transparency: the Importer Transparency Index (ITI) and the Exporter Transparency
Index (ETI).
Third, our empirical work using a gravity model of intra-APEC trade attempts to account
for the possible endogeneity of transparency using an instrumental variables strategy. In
our APEC sample, we find that British colonization prior to the 20th Century is closely
associated with higher transparency today. We therefore exploit variation in the pattern of
British colonization to identify exogenous changes in transparency. That our core result is
robust to instrumental variables estimation is an important finding, since existing work on
institutions and trade assumes—but does not test for—exogeneity.
The paper proceeds as follows. In the next section, we discuss in greater detail the links
between transparency and trade. Our analysis takes a transaction cost perspective, in
which predictability and simplification of the trading environment are associated with
lower cost burdens facing exporters and importers. Section 3 introduces our dataset, and

5
provides an overview of trading environment transparency in the APEC region. After
reviewing individual indicators, we synthesize them into two comprehensive measures:
the ITI and ETI. Results from a theory-consistent gravity model in section 4 provide
evidence in favor of our contention that transparency of the trading environment can
impact trade over and above the effects from trade policy measures such as tariffs and
NTBs, which we control for explicitly. Section 5 concludes with some preliminary policy
implications of our work, as well as suggestions for future research in this area.
2 Transparency, Transaction Costs, and Trade: What are the Links?
The extent of a country’s integration into the world trading system depends on the
incentives facing its potential importing and exporting firms. High transaction costs due
to tariff or non-tariff barriers, excessive transport costs, or unduly burdensome
export/import procedures can easily be seen to reduce the attractiveness of trade from a
firm’s point of view, thus inducing them (at the margin) to look inwards rather than
outwards in terms of their development.4
To make clear that the variety of sources of trade transaction costs is much broader than
the set of measures traditionally subsumed under the heading of trade policy, we refer to
these factors as a country’s trading environment. By analogy with the literature on
investment climate (World Bank, 2005), we envisage the concept of trading environment
as encompassing the full set of location-specific factors that shape opportunities and
incentives for firms to engage in import and export transactions. The trading environment
thus includes the full range of transaction costs affecting trade, both “hard”—e.g.,
infrastructure and geography—and “soft”—e.g., institutional quality. Trade facilitation,
in the broad sense in which Wilson et al. (2005) use that term, can be seen as the set of
policy instruments aimed at improving a country’s trading environment by reducing
unnecessarily high transaction costs across all of these fronts.
4 This dynamic can be seen clearly in recent models of trade with heterogeneous firms, following Melitz (2003): domestic producers self-select into export markets based on firm productivity and the extent of cost barriers that they face.

6
Recent empirical work looking at the various aspects of trade transaction costs has tended
to focus on what governments do—or could do—to try and directly influence the levels
of particular costs. For instance, action to improve trade-related infrastructure, such as
roads and ports, can impact “hard” trade transaction costs and thus bilateral trade flows
(see Limao and Venables, 2001; and Wilson et al., 2005). Similarly, there is now also
empirical evidence that action to improve contract enforceability can reduce “soft” trade
transaction costs, with similar flow-on effects to observed bilateral trade (see Anderson
and Marcouiller, 2002; and Levchenko, 2007).
In this paper, we seek to broaden the scope of discussions on trade transaction costs and
their impacts by recognizing that the trading environment has a procedural aspect in
addition to the substantive ones examined in the research mentioned above. In a nutshell,
we will argue that it is not just what governments do that matters for trade transaction
costs, but also how they do it. Unpredictability and undue complexity in the design,
implementation and administration of trade policy can constitute independent sources of
transaction costs, over and above those flowing from the nominal restrictiveness of the
trade policy measures themselves. To clarify exactly what we mean by this, it is useful to
consider a couple of examples that bring out the importance of the “how”: using tariff
bindings to reduce the uncertainty of the trading environment, and simplifying it by
reducing the information costs firms must absorb in order to find out exactly what a
country’s trade policy actually is.
2.1 Tariff Bindings and Internet Use: Two Examples of Promoting Transparency
Francois (2001) and Francois and Martin (2004) show that while reductions of applied
tariffs can have obvious, first-order impacts on exporters’ and importers’ incentives,
locking in those cuts—or “binding” them in WTO terms—can have additional economic
impacts over and above those of the tariff cut itself. The economic logic behind this is
simple, and is an example of an important, more general argument in relation to
transparency: increased predictability can reduce the effective trade costs faced by
business.
When making plans, firms care about their expected level of profits. This in turn depends
on the transaction costs they expect to face when importing or exporting. The process of
7
binding tariffs acts directly on firms’ expectations, by placing an upper limit on the rate
that a particular tariff can take in the future. A simple tariff cut without binding can be
undone relatively easily, and so does not impact firms’ expectations to the same extent.
To give an idea of the orders of magnitude involved, Francois and Martin (2004) find that
in the case of wheat tariffs pre- and post-Uruguay Round, reductions in tariff uncertainty
were responsible for at least half the overall welfare gains in four of the seven economies
studied.
In addition to its direct costs, trade policy can also impose indirect costs on firms due to
the need to gather information on the set of measures in place and the steps required to
comply with them. The complexity of the trading environment is clearly a key variable in
assessing the potential magnitude of these information costs. For the hypothetical case in
which the only trade cost is a bound, ad valorem tariff published through a government
website, the associated information costs for traders are clearly very small. When a
nominally equivalent level of cost is achieved using a combination of an ad valorem
tariff, licensing requirements, product standards and certification, complex customs
procedures, delays at port, and perhaps the occasional bribe to avoid one or all of these
hurdles, then the information costs facing potential exporters or importers can be very
high indeed.
An important example of this dynamic is the role played by the internet in expanding
trade over recent years. Freund and Weinhold (2004) argue that the spread of the internet
could be one factor reducing the costs of export market entry, since it makes foreign
information easier (and cheaper) to obtain. Those authors conclude that growth in web
hosts contributed on average to a 1% rise in annual export growth between 1997 and
1999. Thus, simplification of the trading environment through a reduction in effective
information costs can be a useful force in promoting bilateral trade.
2.2 Consolidation: Transparency as Predictability and Simplification
Transparency is a very broad concept. If it is to be of use in empirical research and policy
work, it must be given more precise analytical content so that it can plausibly be related
to observable data. As the above discussion suggests, viewing transparency in terms of
the “how” side of the trading environment assists us in identifying two important aspects

8
of the concept: predictability and simplification. The first of these is a way of reducing
“soft” transaction costs stemming from uncertainty—as in the case of tariff bindings—
while the second reduces information costs related to an overly complex cost
environment.
There is as yet little quantitative evidence as to country performance in relation to
transparency, or economic impacts of reform. However, transparency as a concept is
well-entrenched in the architecture of the multilateral system (see Woolfe, 2003, for a
review). A few well-known examples suffice to make the point. As already noted,
binding tariffs (GATT Article II) is one way of promoting transparency through increased
predictability. In addition, Article VIII recognizes the desirability of simplifying import
and export formalities and documentation, while Article X requires prior publication of
certain trade-related laws and regulations, as well as their impartial administration. The
first is an example of transparency through simplification, while the second can be seen
as a measure designed to enhance predictability. In a different context, the Agreement on
Antidumping sets up a system of obligations designed to ensure a minimum of procedural
fairness in the context of antidumping investigations and determinations (Article 6),
thereby providing firms with some level of assurance that the rules will be applied in a
relatively predictable fashion. Finally, the WTO’s Trade Policy Review Mechanism
contributes to transparency by ensuring that basic trade policy information is regularly
put into the public domain, and gives Members the opportunity to ensure that the rules of
the game are being complied with, thereby enhancing predictability.
As this discussion suggests, even focusing just on two crucial aspects of transparency—
predictability and simplification—opens the field to a range of considerations. The
remainder of the paper focuses on developing a methodology for measuring country
performance along these two dimensions using a wide variety of indicators, and on
assessing the quantitative impact that transparency thus defined has on international trade
flows.

9
3 Measuring the Transparency of the Trading Environment: An
APEC Case Study
The member economies of APEC provide an ideal case study platform for the approach
to transparency developed in this paper. APEC is an extremely diverse regional grouping,
including economies at markedly different levels of economic development, and with
vastly different institutional environments. Moreover, APEC has been active in
promoting a wide-ranging approach to reducing trade transaction costs through its
initiatives on trade facilitation. In its 2001 Principles on Trade Facilitation, the role that
transparency can play in improving the trading environment is brought out by explicit
references to the two dimensions of primary interest here, predictability and
simplification:
“Simplification, Practicability and Efficiency: Rules and procedures relating to
trade should be simplified to ensure that they are no more burdensome or restrictive
than necessary…
Consistency and Predictability: Rules and procedures relating to trade should be
applied in a consistent, predictable and uniform manner with integrity so as to
minimize uncertainty to the trade and trade related parties. …”
We now proceed to develop in greater detail our proposed measures of transparency in
the trading environment by reference to the situation prevailing among APEC member
economies. First, we present data on individual indicators related to predictability and
simplification. We then use factor analysis to produce composite indices of transparency
from the exporter and importer perspectives.
3.1 Predictability Measures
Predictability of the trading environment implies that all agents involved in import and
export transaction are informed in a comprehensive and timely manner on existing and
upcoming policy measures. Furthermore, in addition to the what of government action,
predictability is particularly important in how government implement their measures. If
the rules and laws are applied in a consistent and transparent manner, traders are able to
10
better anticipate the trade costs (such as time and administrative costs) they face for
international transactions.
Since predictability comes in different guises, on the empirical side one needs to have
regard to different measures. As mentioned above, an important indicator of
predictability in tariff policy is the percentage of bound tariff rates. WTO members are
able to bind their tariffs at a certain rate, which cannot easily be exceeded.5 Tying the
authorities’ hands with respect to the level of tariffs translates into a higher predictability
for traders, which ultimately reduces costs of doing business. Gauging the percentage of
bound tariff rates reveals the degree of tariff certainty that traders face.
Another empirical measure of the complexity of a tariff schedule is the dispersion of
tariff rates across products. A high dispersion would indicate that the tariffs fluctuate
substantially and therefore can render the expected applied tariffs less predictable. In the
extreme case of a “flat” tariff—i.e., the same ad valorem rate applied to almost all goods,
as in Chile or Hong Kong China—there is no scope for dispute between a foreign
exporter and the customs administration as to the rate of duty that should be applied to a
particular shipment of goods. However, the more complex a national tariff schedule
becomes, the more scope exists for classification disputes to arise. We therefore argue
that a less dispersed, or “flatter”, tariff schedule is associated with greater policy
predictability.
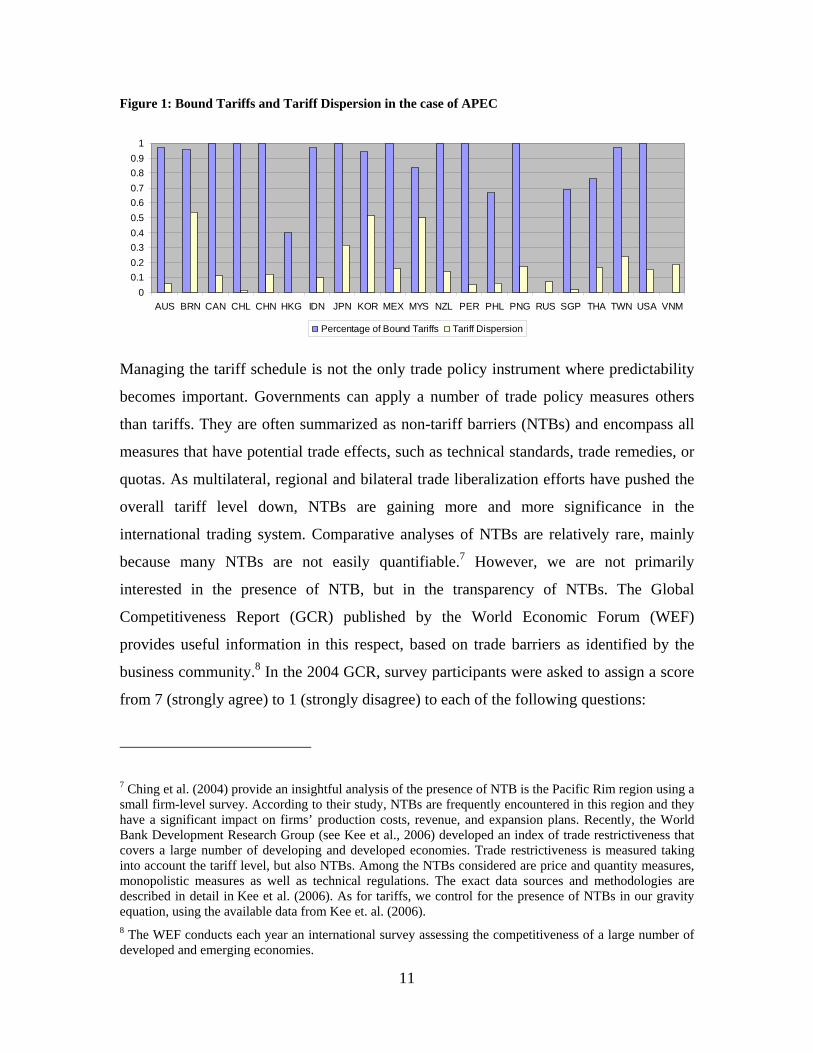
The second column of Figure 1 depicts the standard deviation of effective applied MFN
tariffs6 in HS 6 digit product groups for all 21 APEC economies. It is interesting to
observe that Chile, which applies for almost every product line a flat tariff, Hong Kong
China, which allows duty-free trade across all lines, and Singapore, all show relatively
low levels of tariff dispersion—as expected given their policy respective policy choices.
5 WTO Members are allowed to apply a lower tariff level and freely change it as long as it stays below the bound rate. WTO members therefore often prefer to bind their tariffs at a relatively high level in order to maintain considerable freedom in their tariff policy decisions. 6 The effective applied MFN rate takes into account specific tariffs by dividing them by the unit value. For more information see data appendix.
11
Figure 1: Bound Tariffs and Tariff Dispersion in the case of APEC
00.10.20.30.40.50.60.70.80.9
1
AUS BRN CAN CHL CHN HKG IDN JPN KOR MEX MYS NZL PER PHL PNG RUS SGP THA TWN USA VNM
Percentage of Bound Tariffs Tariff Dispersion
Managing the tariff schedule is not the only trade policy instrument where predictability
becomes important. Governments can apply a number of trade policy measures others
than tariffs. They are often summarized as non-tariff barriers (NTBs) and encompass all
measures that have potential trade effects, such as technical standards, trade remedies, or
quotas. As multilateral, regional and bilateral trade liberalization efforts have pushed the
overall tariff level down, NTBs are gaining more and more significance in the
international trading system. Comparative analyses of NTBs are relatively rare, mainly
because many NTBs are not easily quantifiable.7 However, we are not primarily
interested in the presence of NTB, but in the transparency of NTBs. The Global
Competitiveness Report (GCR) published by the World Economic Forum (WEF)
provides useful information in this respect, based on trade barriers as identified by the
business community.8 In the 2004 GCR, survey participants were asked to assign a score
from 7 (strongly agree) to 1 (strongly disagree) to each of the following questions:
7 Ching et al. (2004) provide an insightful analysis of the presence of NTB is the Pacific Rim region using a small firm-level survey. According to their study, NTBs are frequently encountered in this region and they have a significant impact on firms’ production costs, revenue, and expansion plans. Recently, the World Bank Development Research Group (see Kee et al., 2006) developed an index of trade restrictiveness that covers a large number of developing and developed economies. Trade restrictiveness is measured taking into account the tariff level, but also NTBs. Among the NTBs considered are price and quantity measures, monopolistic measures as well as technical regulations. The exact data sources and methodologies are described in detail in Kee et al. (2006). As for tariffs, we control for the presence of NTBs in our gravity equation, using the available data from Kee et. al. (2006). 8 The WEF conducts each year an international survey assessing the competitiveness of a large number of developed and emerging economies.

12
• “In your country, hidden import barriers (that is, barriers other than published
tariffs and quotas) are an important problem or not an important problem?”
• “In your industry, how commonly would you estimate that firms make
undocumented extra payments or bribes connected with the import and export
permits?”
The first question aligns well with the subject of interest here and the answer serves as a
proxy to gauge the degree of transparency in the application of non-tariff measures. The
second question goes in a similar direction, but focuses more on NTBs related to red-tape
and corruption.
We have collected the answers to these two questions for 19 available9 APEC economies
and rescaled the results from 0 (hidden import barriers/extra payments or bribes are not a
problem) to 1 (hidden import barriers/extra payments or bribes are a problem). The
results are presented in the first and second columns of Figure 2. In order to allow a
comparison of APEC economies with other economies we also report the average
performance of economies classified by the World Bank as low-income, lower- and
upper-middle income, as well as high income.
Figure 2: Hidden Trade Barriers and Irregular Payments (Coef. of Var.) in the case of APEC
0.000.100.200.300.400.500.600.700.800.901.00
AUSBRN
CANCHL
CHNHKG ID
NJP
NKOR
MEXMYS
NZLPER
PHLPNG
RUSSGP
THATW
NUSA
VNMLo
wMidd
leHigh
Hidden Trade Barriers Coef. of Var. Irreg. Paym.
According to the GCR data, Hong Kong China, New Zealand, and Singapore take the
lead in this comparison. Most of the middle-income economies in APEC do better than
9 Brunei Darussalam and Papua New Guinea were not covered in the GCR 2004.

13
the world income group average. However, in China, the Philippines, Russia, and
Thailand the business community perceives hidden trade barriers that are above the
world-average for middle income economies. Finally, in the one APEC economy which
belongs to the low-income group, namely Vietnam, traders still appear to struggle with
hidden trade barriers, also compared to other low-income economies.
The GCR provides not only the average score for each of these questions, but also the
standard deviation of the replies. The standard deviation reveals important information
about the certainty of traders to be confronted with hidden trade barriers or irregular
payments. Even though the standard deviation is not a direct measurement of uncertainty,
the dispersion of answers indicates how differently the issue is perceived and therefore
helps us gauge the uncertainty among traders. In the second column of Figure 2 depicts
the coefficient of variation for the replies given to the question on irregular payments for
imports and exports. The two extremes are New Zealand on the one hand and the
Philippines on the other. In New Zealand, irregular payments appear not only to be rare,
but traders also know what to expect. In the Philippines irregular payments for imports
and exports remain present and their size varies substantially.
The Logistics Perception Index (LPI) 2006 of the World Bank is another valuable source
to measure particular dimensions of transparency in the trading environment (Arvis and
Mustra, 2007). The LPI tries to capture the logistics “friendliness” of economies and is
based on a survey of global freight forwarders and express carriers. The data covers 100
economies, including all APEC economies except Brunei Darussalam, Papua New
Guinea, and Chinese Taipei. The LPI contains variables that can be used to derive
measures of predictability.
The LPI records the maximum and minimum lead time for exports and imports. The gap
between both reveals interesting information about the predictability of clearance time for
traders. If the difference between both variables is small, traders are able to manage the
supply-chain with great accuracy. On the other hand, as the gap between the two
variables becomes large, it indicates that the clearance time can vary substantially. This
implies a high degree of uncertainty for traders, which ultimately translates into

14
additional business costs due to the need to maintain larger inventories (Arvis, Raballand,
and Marteau, 2007).
In the first column of Figure 3, we present the gaps in clearance times for imports for
APEC economies as well as the average for low-, middle-, and high-income economies.
Figure 3 illustrates that Vietnam, the only low-income economy in APEC covered by
LPI, has very small gaps in both dimensions placing it among the best performers, such
as Singapore. The middle-income economies in APEC have similar gaps to the world
average for middle-income group. Among the high-income economies, Hong Kong
China and New Zealand take the lead.
Figure 3: Lead Time Gap (Imports), Lack of E-Readiness, and Favoritism in the Case of APEC
0.000.200.400.600.801.00
AUSCAN
CHLCHN
HKGID
NJP
NKOR
MEXMYS
NZLPER
PHLRUS
SGPTHA
USAVNM
Low
Middle
High
Lead Time Gap Imports Lack of e-readiness Favoritism
Effective use of information technology is another possible way in which governments
can make the trading environment more transparent. We assess this dimension using the
UN’s ranking of the e-government readiness of its Member States.10 It measures the level
of telecommunication and human capital infrastructure development in an economy, and
reflects to what extent governments make use of this infrastructure for the provision of
information, products and services.
In the second column of Figure 3 we summarize the performance of APEC economies
with respect to e-government readiness (lower values indicate a higher degree of e-
government readiness).11 In this comparison, nearly all middle- and high-income APEC
10 The ranking is based on a composite index comprising the Web measure index, the Telecommunication Infrastructure index and the Human Capital index. 11 UN Global E-government Readiness Report does not contain data for Hong Kong China and Chinese Taipei.

15
economies do far better than the world average of the corresponding income group.
Australia, Canada, Korea, New Zealand Singapore, and the USA have achieved a
particularly high level of e-government readiness. In Papua New Guinea as well as
Vietnam much work remains to be done in order to increase the government’s use of the
internet and to build up a comprehensive information technology infrastructure.
Finally, the GCR asks one question that captures the extent of favoritism in
administrative decisions. The question is as follows:
• When deciding upon policies and contracts, government officials (1 = usually
favor well-connected firms and individuals, 7 = are neutral among firms and
individuals)
We argue that excessive liberty for administrators to favor particular firms signals a lack
of transparency. The results of the GCR on favoritism are summarized in the last column
of Figure 3. New Zealand and Singapore stand out as economies in which favoritism is
perceived as almost absent. Chile shows the strongest performance in their income group.
Favoritism seems to severely impact business in other economies, especially several
developing member economies.
3.2 Measures of Simplification
Simplification in the trading environment aims at organizing all procedures and actions
involved in import and exports in the most efficient way. In many economies, the flow of
goods and services remains hindered by overly burdensome customs regulations,
insufficient use of modern technology in customs, or by other shortcomings. Inefficiently
organized and administrated customs procedure cause additional costs when selling or
buying goods and services on international markets and can therefore severely impede the
competitiveness of firms.
The annual Doing Business Report of the World Bank collects, among other data,
detailed data on trade facilitation measures that relate to the concept of simplification. For

16
example, the efficiency of customs is documented in data which record the number of
documents as well as the number of days needed for importing or exporting. Fewer
documentary requirements, and quicker clearance times, translate into lower
administrative costs for exporters and importers. They can also mean lower information
costs in terms of understanding the set of steps that must be taken in order to ensure
smooth passage through customs and border administrations.
In Figure 4 we present the respective Doing Business data for 20 APEC economies
(Brunei was not covered by the survey) as well as the average results for the low-,
middle-, and high-income groups. The first interesting observation is that the number of
documents and days needed for exports are lower in most economies compared to
imports. Only in the case of Australia and the USA are more documents required for
exports than for imports. Furthermore, only in Russia, Thailand, and Vietnam does the
delay for exports exceed the delay for imports. The two low-income economies among
the APEC economies, namely Papua New Guinea and Vietnam, require less
documentation for exports and imports than the low-income average. Most middle-
income APEC economies require a number of export or import documents that is similar
to the world average for this income group. The Philippines and Mexico perform
particularly well in this comparison. Among the high-income APEC members Canada
achieves the best score, asking for only three export and four import documents.
The difference in APEC economies is particularly pronounced concerning the days
needed for imports and exports. Several empirical studies have pointed out the
importance of timeliness for the trading performance of economies (e.g. Hummels, 2001,
Evans and Harrigan, 2005). In a recent World Bank study, Djankov et al. (2006) find that
a one day delay before shipping is estimated to reduce trade by 1%. In nearly all APEC
high-income economies, the number of days required for imports and exports is lower
than the world average for this income group. In particular, Singapore has been very
successful in streamlining the customs procedures. The majority of middle-income APEC
economies show a similar above-average performance in the category. Furthermore, it is
promising to see that Papua New Guinea and Vietnam have clearance times that are
similar to the middle-income average and substantially superior to the average of low-
income economies.

17
Figure 4: Number of Days/Documents for Import/Export in the Case of APEC
0
10
20
30
40
50
60
AUSBRN
CANCHL
CHNHKG
IDN
JPN
KORMEX
MYSNZL
PERPHL
PNGRUS
SGPTHA
TWN
USAVNM
Low
Middle
High
Nbr
. of D
ocum
ents
/Day
s
Nbr. of Documents for Exports Nbr. of Documents for ImportsNbr. of Days for Exports Nbr. of Days for Imports
The LPI also contains two variables which are worthwhile studying in the context of
simplification, namely the number of border agencies involved in imports or exports. We
expect that fewer agencies will be associated with firms spending less time—and
therefore money—on dealing with administrators and ensuring compliance with the
separate requirements of each agency. The majority of APEC economies demonstrate a
strong performance in this respect (results are not reported). Compared to the three
different world averages, they have less border agencies involved in imports than the
respective average. Especially Singapore appears to possess a highly efficient structure of
customs.
Finally, as mentioned above, the GCR measures the extent to which unofficial payments
in imports and exports play a role in an economy. Being obliged to make unofficial
payments imposes an extra dimension of costs on exporters and importers. An example is
the case when a bribe is required in order to “facilitate” access to the national market,
even after payment of official duties and taxes.12 Looking at the APEC economies
(results are not reported), one finds that all high-income economies do better than the
12 We are aware, however, that the mechanism will not always work in this way. If a bribe is paid in order to avoid official duties, then by assumption it should result in lower nominal trade costs. Nonetheless, the importer or exporter will still need to deal with an added “layer” of costs, in the sense of having to deal with customs agents in order to “negotiate” an acceptable deal.
18
world average, the only exception being Korea which has a score close to the average of
middle-income economies. However, in Indonesia, the Philippines, Russia, as well as
Thailand extra payments or bribes connected with import and export permits are
apparently widespread.
Table 1 provides an overview of all indicators included in this study, dividing them into
predictability and simplification measures. The following section shows how to use these
indicators to create an index for exporter and importer transparency.
3.3 Importer and Exporter Transparency Index
In the previous sections we have presented a large number of indicators on the two
dimensions of trade policy transparency that we are primarily interested in, namely
predictability and simplification. In order to provide a straightforward summary indicator
of overall performance against these benchmarks, we will now present results of
statistical analysis designed to summarize the above information into just two variables:
importer transparency and exporter transparency. This approach also facilitates the
econometric analysis in Section 4, since it makes it possible to avoid technical problems
caused by strong correlation among these indicators.
Both importer transparency and exporter transparency are constructed as regional indices
on a scale of 0 (lowest) to 1 (highest). Each index is a weighted average of a number of
the measures examined above in terms of predictability and simplification. To decide on
the weight to be given to each component when taking the average, we use results from a
statistical method known as factor analysis.
Factor analysis refers to a set of statistical techniques that can be used to produce an
index summarizing performance across a number of correlated indicators. In broad terms,
the index is derived by assuming that an unobserved factor (“transparency”) is
responsible for the common variation in the original set of indicators. Statistical
techniques can be used to identify that unobserved factor in terms of a weighted average
of the original indicators (see Table 4 in the appendix for the exact principal factor
weights).
This methodology reflects the approach taken by Anderson and Marcouiller (2002) in
producing a composite security index, and is close to the principal components

19
methodology used by Francois and Manchin (2007) to produce summary indices of
country performance in the areas of infrastructure and institutions. We prefer the first
principal factor to the first principal component because the former allows for variation
within the indicator set to be due to both common and individual causes, while the latter
assumes that all variation is common.
The above variables are available for all APEC member economies except Brunei
Darussalam, Papua New Guinea, and Chinese Taipei. The importer transparency index
has more variables than does the exporter transparency index, since there are a number of
aspects of transparency (e.g., tariff rate dispersion) that are only relevant from an
importing point of view. Final results for the two indices are reported in Figure 5 and
Figure 6.
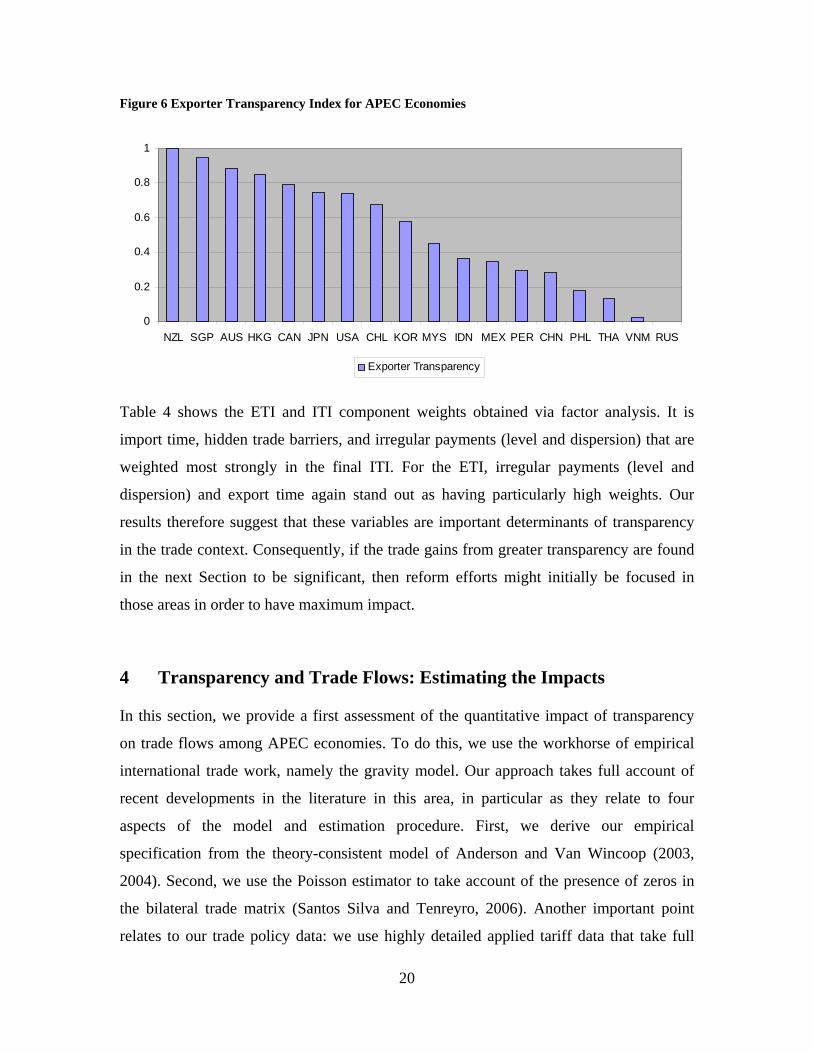
We find that both importer and exporter transparency vary considerably across the
region. This is quite in line with expectations, given that APEC as a regional grouping is
very diverse. The list of economies with relatively high ITI and ETI scores is
unsurprising: Singapore and New Zealand are at the head of both lists. By contrast,
Russia and Vietnam arrive at the opposite end of the scale in both cases.
Figure 5 Importer Transparency Index for APEC Economies
0
0.2
0.4
0.6
0.8
1
SGP NZL AUS HKG USA JPN CAN CHL KOR MYS MEX IDN CHN PER THA PHL VNM RUS
Importer Transparency
20
Figure 6 Exporter Transparency Index for APEC Economies
0
0.2
0.4
0.6
0.8
1
NZL SGP AUS HKG CAN JPN USA CHL KOR MYS IDN MEX PER CHN PHL THA VNM RUS
Exporter Transparency
Table 4 shows the ETI and ITI component weights obtained via factor analysis. It is
import time, hidden trade barriers, and irregular payments (level and dispersion) that are
weighted most strongly in the final ITI. For the ETI, irregular payments (level and
dispersion) and export time again stand out as having particularly high weights. Our
results therefore suggest that these variables are important determinants of transparency
in the trade context. Consequently, if the trade gains from greater transparency are found
in the next Section to be significant, then reform efforts might initially be focused in
those areas in order to have maximum impact.
4 Transparency and Trade Flows: Estimating the Impacts
In this section, we provide a first assessment of the quantitative impact of transparency
on trade flows among APEC economies. To do this, we use the workhorse of empirical
international trade work, namely the gravity model. Our approach takes full account of
recent developments in the literature in this area, in particular as they relate to four
aspects of the model and estimation procedure. First, we derive our empirical
specification from the theory-consistent model of Anderson and Van Wincoop (2003,
2004). Second, we use the Poisson estimator to take account of the presence of zeros in
the bilateral trade matrix (Santos Silva and Tenreyro, 2006). Another important point
relates to our trade policy data: we use highly detailed applied tariff data that take full
21
account of preferences, as well as ad valorem equivalents of non-tariff. Finally, we use an
instrumental variables strategy based on colonial history to deal with the possible
endogeneity of transparency with respect to bilateral trade, drawing on the growth and
institutions literature (e.g., Acemoglu et al., 2001).
4.1 Empirical Model
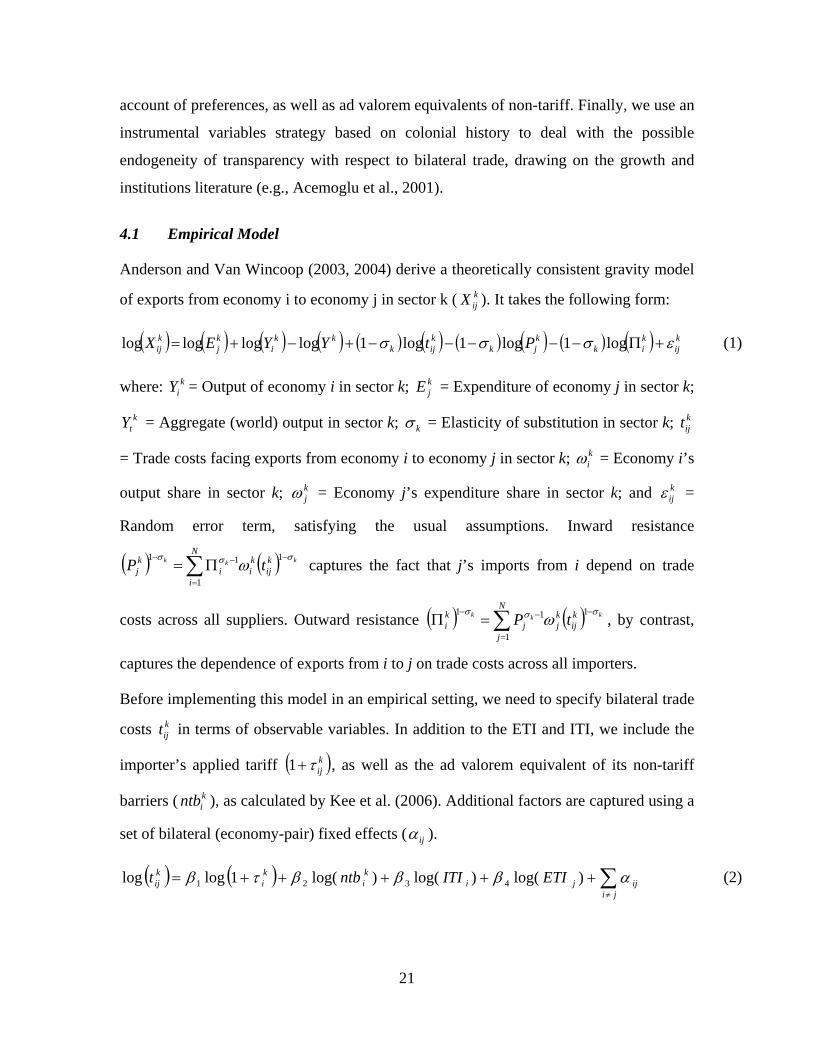
Anderson and Van Wincoop (2003, 2004) derive a theoretically consistent gravity model
of exports from economy i to economy j in sector k ( kijX ). It takes the following form:
( ) ( ) ( ) ( ) ( ) ( ) ( ) ( ) ( ) ( ) kij
kik
kjk
kijk
kki
kj
kij PtYYEX εσσσ +Π−−−−−+−+= log1log1log1loglogloglog (1)
where: kiY = Output of economy i in sector k; k
jE = Expenditure of economy j in sector k;
ktY = Aggregate (world) output in sector k; kσ = Elasticity of substitution in sector k; k
ijt
= Trade costs facing exports from economy i to economy j in sector k; kiω = Economy i’s
output share in sector k; kjω = Economy j’s expenditure share in sector k; and k
ijε =
Random error term, satisfying the usual assumptions. Inward resistance
( ) ( )∑=
−−−Π=
N
i
kij
kii
kj
kkk tP1
111 σσσω captures the fact that j’s imports from i depend on trade
costs across all suppliers. Outward resistance ( ) ( )∑=
−−−=Π
N
j
kij
kjj
ki
kkk tP1
111 σσσ ω , by contrast,
captures the dependence of exports from i to j on trade costs across all importers.
Before implementing this model in an empirical setting, we need to specify bilateral trade
costs kijt in terms of observable variables. In addition to the ETI and ITI, we include the
importer’s applied tariff ( )kijτ+1 , as well as the ad valorem equivalent of its non-tariff
barriers ( kintb ), as calculated by Kee et al. (2006). Additional factors are captured using a
set of bilateral (economy-pair) fixed effects ( ijα ).
( ) ( ) ∑≠
+++++=ji
ijjiki
ki
kij ETIITIntbt αβββτβ )log()log()log(1loglog 4321 (2)
22
Substituting (2) into (1) and including sector fixed effects in addition to economy-pair
fixed effects gives our baseline estimating equation:13
( ) ( ) ( )kijkji
ki
kiji
jiij
kij
ETIITI
ntbYYX
εγββ
βτβββα
++++
++++++=
∑
∑≠
)log()log(...
...)log(1log)log(loglog
65
4321 (3)
We estimate (3) using Poisson pseudo-maximum likelihood (Santos Silva and Tenreyro,
2006) in order to take into account the presence of bilateral trade flows that are zero or
missing from the dataset. The intuition behind this approach is simple. The first order
conditions for Poisson estimation are mathematically equivalent to those for weighted
least squares of the non-linear model given by exponentiation of (3). Thus, the potential
problem posed by taking the logarithm of zero on the left-hand side is avoided.14
Our data and sources are set out in full in Table 1. For our baseline results, we use
bilateral trade data disaggregated to the HS 2-digit level. Our tariff data come from the
MAcMap database (Laborde et al., Forthcoming). MAcMap applied tariffs are bilaterally
disaggregated, and take full account of regional agreements and preference schemes. We
aggregate the original HS 6-digit data to the HS 2-digit level using a reference group
weighting scheme that limits endogeneity problems (Laborde et al., Forthcoming).
Essentially, tariffs for economy i are weighted by the import patterns of comparable
countries, rather than by those of economy i itself. We take ad valorem equivalents of
non-tariff barriers from Kee et al. (2006)—and aggregate them to the 2-digit level in the
same way—while GDP data are sourced from the World Development Indicators. We
estimate the model for a cross-section of APEC member economies for the year 2004.
13 In fact, this involves a slight simplification. A strict derivation from (1) would imply a large number of additional parameters, including fixed effects in the country-pair-sector dimension and interaction terms between each of the trade cost parameters and the sector fixed effects. See Baldwin and Taglioni (2006) on this and similar points. The expedient we have adopted represents a compromise between theoretical rigor and empirical tractability. 14 We prefer Poisson to the Heckman sample selection estimator proposed by Helpman et al. (2007) for two largely technical reasons. First, over-identification of the Heckman model is difficult in this context, and the literature does not yet provide a convincing solution to this problem. Second, the first stage probit model on which the Heckman estimator is based can be biased and inconsistent in the presence of standard, unconditional fixed effects (see generally Greene, 2004, on this point). Poisson is one of relatively few non-linear panel data models which do not suffer from this problem, and remain consistent in fixed effects models.

23
Although it would be desirable to expand our analysis to a panel setting, we are currently
constrained by data limitations (in particular the Doing Business, Logistics Perception
Index, and MAcMap datasets).
4.2 Estimation Results
Table 5 presents our baseline estimation results. The first column covers all HS Chapters,
while the second excludes raw materials (Chapters 1-27) and the third excludes in
addition basic manufactures (Chapters 1-83). We find that coefficients generally carry the
expected signs and are statistically significant at the 5% level. However, results are
noticeably clearer for the trade policy variables in the last two columns when raw
materials are excluded. The reason is probably that the markets for agricultural goods and
raw materials are often still heavily distorted through different economic policy
interventions that are not adequately captured by ad valorem tariffs. For our analysis we
therefore focus on the estimation results with this sector excluded.
Moving down column 2, we find that both importer and exporter market size (GDP) are
positively associated with bilateral trade, with an income elasticity approaching unity.
Similarly, higher bilateral tariffs are associated with reduced trade: it is approximately the
case that a 1% cut in applied tariffs is associated with a 2.8% increase in trade. The same
applies to non-tariff barriers, although the elasticity is less than half as strong. Finally, the
two variables of main interest, namely the ETI and ITI, both have estimated coefficients
that are strongly positive and statistically significant. Column 2 suggests elasticities of
6.8 and 8.9 respectively. Indeed, the effects for all dimensions of trade policy, including
transparency, would appear to be even stronger on the basis of column 3.
These results suggest that the impact of transparency might be stronger for manufactured
goods than for raw materials. To test this hypothesis more extensively, we re-estimate the
gravity model separately for differentiated and homogeneous goods. We identify these
products using the classification scheme due to Rauch (1999), who divides all products at
the 4 SITC digit level into three groups: goods traded on an organized exchange,
reference priced goods, and differentiated products. We consider the first two as
homogenous products and the later group as bringing together heterogeneous products.
Running the same gravity equation on both groups yields the results which are presented

24
in the last two columns of Table 5. In column (4), where only differentiated products
enter the equation, the estimation results appear to support our earlier claim that
transparency is of special importance for heterogeneous goods. Column (5) shows that
the coefficients decrease considerably when homogeneous goods are considered: the ITI
elasticity drops by over two-thirds, while for the ETI the fall is over 50%. Whereas both
the ITI and ETI have an economically strong and statistically significant impact on trade
flows for differentiated goods, their impact is much weaker and statistically insignificant
in the case of homogeneous goods.
In interpreting these results, we have been careful thus far to avoid references to
causality. It would not be appropriate to conclude from Table 5, for instance, that
improved transparency necessarily “causes” an increase in bilateral trade. This is because
simple gravity results like those in Table 5 do not account for possible estimation bias
due to the endogeneity of transparency with respect to trade. While Table 5 is consistent
with a causal link running from transparency to bilateral trade, it is also consistent with a
link running in the opposite direction: i.e., economies may tend to create more
transparency trading environments because they have higher trade volumes, which leads
to greater pressure for reform. Indeed, it is likely in reality that causation runs in both
directions at once, and that improved transparency leads to more intense bilateral trade
flows, while more trade also leads to greater transparency.
We adopt a simple instrumental variables technique to try and take account of the
probable endogeneity of transparency with respect to bilateral trade. As usual, the
principal difficulty lies in identifying an appropriate set of instruments for the ETI and
ITI. One possible candidate in this case is colonial history (cf. Acemoglu et al., 2001).15
Pre-20th Century colonization generally leaves institutional marks on the colonized area,
including potentially those institutions most directly affecting the trade policy
environment. Indeed, our dataset reveals that in the APEC sample, a dummy variable
15 Given the relatively small number of countries included in the dataset used here, it proved impossible to effectively implement alternative instrumentation strategies for transparency, such as latitude (Hall and Jones, 1999) or settler mortality (Acemoglu et al., 2001). In future work, we will expand data coverage to include a wider number of countries. We expect this will facilitate the use of alternative instruments, and thereby provide an additional robustness check on the results reported here.
25
coded so as to capture colonization by Great Britain is strongly positively correlated with
our two transparency indices: the simple correlation coefficient is 0.72 for the ITI and
0.74 for the ETI. Since British colonization took place in this region largely in the 18th
and 19th centuries, we can be confident that it is exogenous to current (i.e., 2004) bilateral
trade flows. We therefore use two dummy variables, one for exporter colonization by
Great Britain and another for importer colonization by Great Britain, as instruments for
exporter and importer transparency respectively. They are sourced from the CEPII
distance database (Mayer and Zignago, 2006).16
Wooldridge (2002, pp. 663-665) sets out a straightforward methodology for instrumental
variables estimation of Poisson models. In the first stage, the endogenous explanatory
variables (ETI and ITI) are regressed by OLS on the exogenous explanatory variables
(distance, GDP, tariffs, and NTBs) and the instruments (British colonization). The
residuals from the first stage regressions are then included as additional regressors in the
final Poisson regression.17 We apply this approach to obtain the results in Table 6,
treating ETI and ITI as the only endogenous variables. (For first stage regression results
using the full sample, see Table 7.) Tariffs and non-tariff barriers are treated as
exogenous in this case, because the reference group aggregation scheme we have used to
produce HS 2-digit data means that the endogeneity problem is far more limited than
would be the case if, for instance, simple trade weighting had been used.
Moving down column 2, we see that the estimated coefficients on both importer and
exporter GDP retain their expected positive signs and are statistically significant at the
1% level, while tariffs and NTBs both impact negatively on bilateral trade. While NTBs
are statistically significant at the 5% level, bilateral tariffs are only marginally significant
at the 15% level (prob. = 0.151). In both cases, however, the impacts of these variables
16 It is also necessary for the instruments to be excludable from the gravity regression itself. It is arguable that our colonization dummies satisfy this criterion, since country-pair fixed effects already account for the impact of common colonial history, which gravity models often find to be a significant determinant of bilateral trade. However, instrument choice and excludability are important questions for future work in this area to address. 17 Note that the estimated standard errors have not been adjusted to take account of the use of first stage residuals. Thus, they tend to understate reality.
26
on trade are economically significant: a 1% tariff cut or reduction on the ad valorem
equivalents of NTBs increases bilateral trade flows by around 1%.18
In terms of our transparency indices, it is primarily the ITI that has a discernable negative
impact on trade: a 1% improvement in the economy’s index score is associated with a
nearly 2% boost to trade. This effect is statistically significant at the 1% level. In the case
of the ETI, our results are harder to interpret. Although the coefficient on that variable in
column 2 has a negative sign, it does not accord with the logic developed in the rest of
this paper to interpret that result literally. Rather, we conclude that the absolute impact of
exporter transparency is considerably less than for importer transparency, and thus it is
the latter that is likely to be the main variable of economic interest in this context. This
interpretation sits well with the general thrust of our regression results in Tables 5-6,
where the estimated ETI coefficients more often tend to be positive and/or statistically
insignificant. It would also be consistent with the view that it is primarily import market,
rather than export market, transparency which matters for bilateral trade. However, this
interpretation must be regarded as tentative, and other possible reasons behind the
unexpected sign of the ETI coefficient in Table 6 will need to be investigated further in
future research on this subject.
Comparing Table 6 with Table 5 suggests that endogeneity of our transparency measures
is indeed important, and has the capacity to impact results significantly. For example, the
ITI elasticity in column (2) of Table 5 is 8.9, while it is only 1.9 in Table 6. Accounting
for reverse causality running from trade flows to transparency can be seen to be important
so as to avoid over-estimating the relevant elasticity. This is potentially an important
point to be taken up in future research, since standard gravity model formulations tend to
treat trade costs as exogenous, rather than potentially endogenous. Use of colonial history
as an instrument for institution-related trade costs is just one of many possible
18 One result on NTBs which is worthy of future research is the unexpected positive sign that its estimated coefficient carries in the final column of Table 6. We suspect that this may be due to the difficulty in measuring NTBs and converting them to ad valorem equivalents in the context of the agriculture and primary products sectors, which represent the bulk of the homogeneous products group used here.
27
approaches, and we expect that future research will provide greater clarity as to which are
the most effective in particular circumstances.
4.3 Simulation of Possible Gains from Improved Trade Policy Transparency
Results from our gravity equation suggest that higher levels of trade policy transparency,
particularly in relation to importing, are indeed associated with stronger bilateral trade
links. From a policy point of view, it is also important to be able to gauge the strength of
that effect relative to other policy options. To provide some first indications in this
direction, we now use the gravity model results in column 2 of Table 6 to conduct some
simple counterfactual simulations (cf. Wilson et al., 2005). For each simulation, we
specify the counterfactual in terms of a given exogenous “shock” to a single policy
variable. We then map that shock to trade impacts using the elasticities we have
estimated. Comparing impacts from one simulation to another gives an idea of the
relative trade gains involved.
Concretely, we consider three simulation scenarios, each of which represents an
ambitious but, we believe, feasible medium-term objective within APEC:
• Scenario I: Improve importer transparency within the APEC region such that no
economy is below the current regional average (0.54).
• Scenario II: Reduce applied tariffs within the APEC region such that no economy
applies a higher level of protection than the regional average for each HS Chapter.
• Scenario III: Reduce the ad valorem equivalents of non-tariff barriers within the
APEC region such that no economy applies a higher level of protection than the
regional average for each HS Chapter.
In line with our estimations, trade impacts for these scenarios refer to intra-APEC trade
only, and exclude raw materials (HS Chapters 1-27). Results show that APEC member
economies can indeed boost intra-regional trade significantly by cutting tariffs, reforming
NTBs, or promoting transparency. Relative to other ready alternatives, policies aimed at
increasing trade policy transparency in the APEC region would appear to have the
potential for high impact: improving importer transparency to the regional average is
28
associated with an increase in intra-regional trade on the order of 7.5%, as compared with
only 0.9% for scenario II and 1.8% for scenario III. In monetary terms, these effects
equate to approximately US$148bn, US$18bn, and US$35bn respectively.19
Overall, we conclude that the potential intra-regional trade gains from reform are
substantial for all three counterfactual scenarios. This is reinforced by a consideration of
the distribution of export and import gains, which shows that certain economies stand to
benefit to a level far in excess of the regional average.
Before concluding this Section, it is important to stress that our results, like all simulation
results, are subject to a number of caveats. First, we are dealing with trade effects and
not economic welfare as such. Second, our results apply only to intra-regional trade in
manufactures, and do not take account of possible extra-regional effects. Given that the
policy reforms contemplated here—in particular in Scenario I—can be implemented in a
non-discriminatory manner, there is considerable scope to produce gains for economies
outside APEC as well. Assuming that non-discrimination is adhered to, our results could
therefore be interpreted as a lower bound for the likely range of overall (worldwide)
effects. Third, our simulations implicitly assume that the elasticities on which they are
based remain constant before and after the policy shock. While this may be the case for
small policy changes, it is unlikely to hold for major regime shifts. Fourth, our
simulations are based on data for the year 2004. As new data become available, we
expect that the results for economies having undergone major policy shifts since then—
such as WTO accession for Vietnam—may change significantly. Finally, Scenarios II
and III do not take account of quantitative restrictions that may represent binding
constraints on bilateral trade even once tariffs and other NTBs are lowered.
19 Region-wide aggregates obscure the fact that these results are subject to considerable heterogeneity across economies. Our results in Table 8 suggest that the import gains from reform tend to be concentrated in a few economies, while the export (market access) gains are spread more widely across the region. Such a distribution is inherent in the design of our counterfactuals: only those economies with transparency, tariff, or NTB scores below the regional average receive a policy “shock”, and therefore only those economies can reap an import gain from reform. However, to the extent that other APEC member economies export to reforming economies, then they can take advantage of a corresponding market access gain.
29
It is also important to note the issue of cost. Reductions in tariffs and ad valorem
equivalents of NTBs impose relatively few direct resource costs on central governments.
However, for trade facilitation measures including those aimed at transparency, the cost
implications are potentially larger. While we do not have sufficient information available
to assess the costs in this case, we would simply highlight that when compared with other
trade facilitation measures—such as upgrades of “hard” infrastructure—the cost of
improving performance across the set of transparency measures we are dealing with here
is likely to involve manageable levels of costs. The government actions required are often
legal and administrative in character, along with equipment upgrades in some cases (e.g.,
e-government readiness), and are therefore unlikely to involve costs on the level of, for
instance, a port or road network upgrade. However, the nature of these actions also
suggests an ongoing need for technical cooperation and capacity building, since the
measures involved are often complex.20
5 Conclusions and Suggestions for Further Research
This paper has drawn on a wide range of objective and perception-based indicators to
develop new, quantitative measures of transparency in the trading environment. Our
approach is grounded in the view that it is the full range of factors in a country’s trading
environment that can influence exporters’ and importers’ incentives—which means that
efforts to promote regional and global integration need to address policy reform across a
number of areas, not limited to traditional trade policy measures such as tariffs. There is
thus an important complementary role to be played by trade facilitation in the broad sense
(Wilson et al., 2005).
Taking APEC as a case study, we have used these measures to provide some of the first
quantitative evidence suggesting that increasing the transparency of the trading
environment through greater predictability and simplification can be an important way of
reducing trade costs. We have found that the impact from transparency reforms comes in
20 On the basis of six case studies, including one APEC member economy, McLinden (2006) reports that the costs of implementing improved trade facilitation may be smaller than previously thought. The improvements considered by the author, based on the possible contours of a future WTO agreement, would involve costs ranging from US$165,000 to US$1.3m per economy.
30
addition to the effects stemming from a more liberal stance in respect of “traditional”
trade policy measures such as tariffs and quotas. It appears particularly strong for
differentiated products. Moreover, our instrumental variables results suggest that our
findings are robust to the possible endogeneity of transparency to bilateral trade.
In policy terms, these results are generally supportive of the important place given to
transparency both in the multilateral system, and in some regional groupings like APEC.
As one means of reducing trade transaction costs, transparency reforms can legitimately
be part of the trade facilitation agenda. However, translation of this policy program into
concrete reforms would benefit from more detailed research on a number of points.
First, it will be important to identify in greater detail the economic mechanisms at work
in particular cases of transparency reform. Here, we have focused on two dimensions—
predictability and simplification—that we measure using multiple indicators. By
aggregating these indicators via factor analysis, we can produce a summary measure of
the overall impact of transparency on bilateral trade. But to inform the details of policy
reform, it will be necessary to “unbundle” transparency even further and to examine
particular aspects—such as corruption or policy uncertainty—that might be of particular
importance in some national contexts. Since transparency reforms are not always
politically easy (more on this below), it will be important for this body of research to
identify whenever possible the relative economic payoffs from different measures, in
order to help policymakers invest their political capital where the economic return is
highest.
Second, while this study has focused on the general area of trade in goods, this is not the
only domain in which increased transparency could potentially have benefits in terms of
regional integration. Issues of regulatory transparency are also crucial in relation to trade
in services, and more broadly in terms of regulatory reform affecting services sectors.
However, measuring the extent of barriers to services trade, and quantifying their
economic impacts, is an extremely challenging task (see Hoekman, 2006, for a review).
This is because such barriers are almost always linked to important issues of “behind-the-
border” regulation. Similar comments apply to the issue of international investment
flows. Behind-the-border barriers, including transparency-related factors, are important in

31
understanding the determinants of foreign direct investment. However, just as for
services trade, they tend to be extremely difficult in terms of identification and impact
assessment. It will therefore be important for future research on transparency to cover all
of these dimensions.
Finally, a question as to the mechanics of reform underlies all of the above points.
Although increased transparency and regulatory reform might be in the national interest,
such moves might be opposed by vested interests and lobby groups. The political
economy of reform is thus an important area for future research—including most
importantly in relation to corruption and unofficial payments. Corruption does not exist
in a vacuum, but is the outcome of a complex set of interactions among traders and
officials, taking place against the background of national trade policy choices.21 Moving
forward on corruption therefore requires detailed analysis of its determinants, as well as
on the design of incentive-compatible policy reforms.
References Acemoglu, Daron, Simon Johnson, and James A. Robinson, 2001, “The Colonial Origins of Comparative Development: An Empirical Investigation”, American Economic Review, 91(5), 1369-1401.
Anderson, James E., and Douglas Marcouiller, 2002, “Insecurity and the Pattern of Trade: An Empirical Investigation”, Review of Economics and Statistics, 84(2), 342-352.
Anderson, James E. and Eric Van Wincoop, 2003, “Gravity with Gravitas: A Solution to the Border Puzzle”, The American Economic Review, 93(1), 170-192.
Anderson, James E. and Eric Van Wincoop, 2004, “Trade Costs”, Journal of Economic Literature, 42(3), 691-751.
Arvis, Jean-François, and Monica Alina Mustra, 2007, “Measuring Global Connections: A New Set of Logistics Indicators”, Mimeo, The World Bank.
21 On this point, see: Fisman and Wei (2004), Gatti (1999, 2004), Javorcik and Narciso (2007), and Fisman and Gatti (2006).

32
Arvis, Jean-François, Gael Raballand, and Jean-François Marteau, 2007, “The Cost of Being Landlocked: Logistics Costs and Supply Chain Reliability”, Mimeo, The World Bank.
Baldwin, Richard E. and Daria Taglioni, 2006, “Gravity for Dummies and Dummies for Gravity Equations”, Working Paper No. 12516, NBER.
Djankov, Simeon, Caroline Freund and Cong S. Pham, 2006, “Trading on Time”, Policy Research Working Paper No. 3909, The World Bank.
De Groot, Henri L.F., Gert-Jan Linders, Piet Rietveld, and Uma Subramanian, 2004, “The Institutional Determinants of Bilateral Trade Flows”, Kyklos, 57(1), 103-123.
Evans, Carolyn L., and James Harrigan, 2005, “Distance, Time, and Specialization: Lean Retailing in General Equilibrium”, American Economic Review, 95(1), 292-313.
Fisman, Raymond, and Roberta Gatti, 2006, “Bargaining for Bribes: The Role of Institutions”, Discussion Paper No. 5712, CEPR.
Fisman, Raymond, and Shang-Jin Wei, 2004, “Tax Rates and Tax Evasion: Evidence from ‘Missing Imports’ in China”, Journal of Political Economy, 112(2), 471-500.
Francois, Joseph F., 2001, “Trade Policy Transparency and Investor Confidence”, Review of International Economics, 9(2), 303-316.
Francois, Joseph F., and Miriam Manchin, 2007, “Institutions, Infrastructure, and Trade”, Policy Research Working Paper No. 4152, The World Bank.
Francois, Joseph F., and William J. Martin, 2004, “Commercial Policy Variability, Bindings, and Market Access”, European Economic Review, 48(3), 665-679.
Freund, Caroline L., and Diana Weinhold, 2004, “The Effect of the Internet on International Trade”, Journal of International Economics, 62(1), 171-189.
Gatti, Roberta, 1999, “Corruption and Trade Tariffs, or a Case for Uniform Tariffs”, Policy Research Working Paper No. 2216, The World Bank.
Gatti, Roberta, 2004, “Explaining Corruption: Are Open Countries Less Corrupt?”, Journal of International Development, 16(6), 851-861.
Greene, William, 2004, “The Behavior of the Maximum Likelihood Estimator of Limited Dependent Variable Models in the Presence of Fixed Effects”, Journal of Econometrics, 7, 98-119.
Hall, Robert E., and Charles I. Jones, 1999, “Why do Some Countries Produce So Much More Output per Worker than Others?”, Quarterly Journal of Economics, 114(1), 83-116.
Helpman, Elhanan, Marc Melitz, and Yona Rubinstein, 2007, “Trading Partners and Trading Volumes”, Working Paper, http://post.economics.harvard.edu/faculty/helpman/ papers/TradingPartners.pdf.
Hoekman, Bernard M., 2006, “Liberalizing Trade in Services: A Survey”, Policy Research Working Paper No. 4030, The World Bank.

33
Javorcik, Beata S., and Gaia Narciso, 2007, “Differentiated Products and Evasion of Import Tariffs”, Policy Research Working Paper No. 4123, The World Bank.
Kee, Hiau Looi, Nicita, Alessandro, and Olarreaga, Marcelo, 2006 “Estimating Trade Restrictiveness Indices”, Policy Research Working Paper No. 3840, The World Bank.
Laborde, David, Houssein Boumelassa, and Maria Cristina Mitaritonna, Forthcoming, “A consistent picture of the protection across the world in 2004: MacMapHS6 v2”, Mimeo, CEPII.
Levchenko, Andrei, Forthcoming, “Institutional Quality and International Trade”, Review of Economic Studies.
Mayer, Thierry and Soledad Zignago, 2006, “Notes on CEPII’s Distance Measures”, Mimeo.
Ranjan, Priya, and Jae Young Lee, 2007, “Contract Enforcement and International Trade”, Economics and Politics, 19(2), 191-218.
Rauch, James, 1999, “Networks Versus Markets in International Trade,” Journal of International Economics, 48, 7-35.
Santos Silva, J.M.C. and Silvana Tenreyro, 2006, “The Log of Gravity”, Review of Economics and Statistics, 88(4), 641-658.
Wilson, John S., Catherine L. Mann and Tsunehiro Otsuki, 2005, “Assessing the Benefits of Trade Facilitation: A Global Perspective”, The World Economy, 28(6), 841-871.
Wolfe, Robert, 2003, “Regulatory Transparency, Developing Countries, and the WTO”, World Trade Review, 2(2), 157-182.
Wooldridge, Jeffrey, 2001, Econometric Analysis of Cross Section and Panel Data, MIT Press.
World Bank, 2005, World Development Report 2005: A Better Investment Climate for Everyone, Washington, D.C.: The World Bank.
World Bank Independent Evaluation Group, 2006, Assessing World Bank Support for Trade, 1987-2004, World Bank, Washington, D.C.
Tables Table 1: Summary of Variables Measuring Predictability and Simplification Predictability Simplification • Percentage of bound tariff lines (MM) • Standard deviation of applied tariffs (MM) • Absence of “hidden” trade barriers (GCR) • Standard deviation of unofficial payments in
imports/exports (GCR) • Spread of import/export delays (LPI) • Favoritism in administrative decisions (GCR) • E-government readiness (UN)
• Number of documents required for import/export (DB)
• Number of days required for import/export (DB) • Number of border agencies (LPI) • Unofficial payments in imports and exports
(GCR)
Abbreviations: GCR: Global Competitiveness Report, DB: Doing Business, LPI: Logistics Perception Index, MM: MacMap, UN: United Nations E-government Readiness.
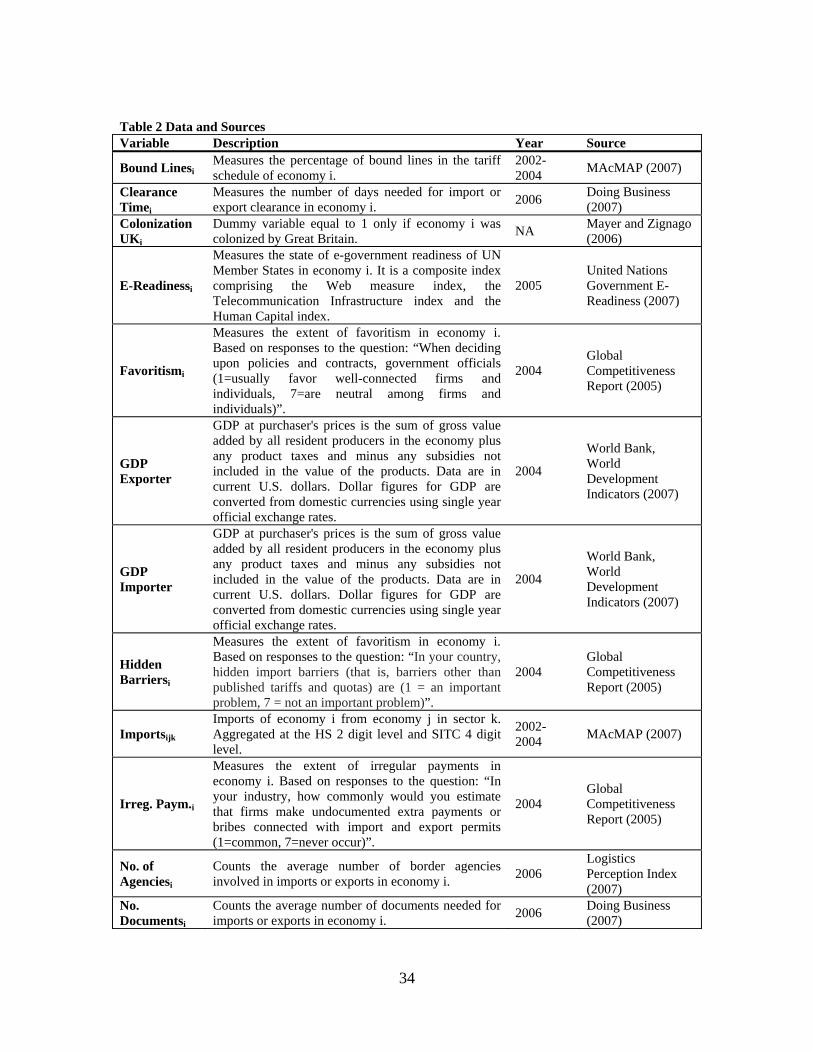
34
Table 2 Data and Sources Variable Description Year Source
Bound Linesi Measures the percentage of bound lines in the tariff schedule of economy i.
2002-2004 MAcMAP (2007)
Clearance Timei
Measures the number of days needed for import or export clearance in economy i. 2006 Doing Business
(2007) Colonization UKi
Dummy variable equal to 1 only if economy i was colonized by Great Britain. NA Mayer and Zignago
(2006)
E-Readinessi
Measures the state of e-government readiness of UN Member States in economy i. It is a composite index comprising the Web measure index, the Telecommunication Infrastructure index and the Human Capital index.
2005 United Nations Government E-Readiness (2007)
Favoritismi
Measures the extent of favoritism in economy i. Based on responses to the question: “When deciding upon policies and contracts, government officials (1=usually favor well-connected firms and individuals, 7=are neutral among firms and individuals)”.
2004 Global Competitiveness Report (2005)
GDP Exporter
GDP at purchaser's prices is the sum of gross value added by all resident producers in the economy plus any product taxes and minus any subsidies not included in the value of the products. Data are in current U.S. dollars. Dollar figures for GDP are converted from domestic currencies using single year official exchange rates.
2004
World Bank, World Development Indicators (2007)
GDP Importer
GDP at purchaser's prices is the sum of gross value added by all resident producers in the economy plus any product taxes and minus any subsidies not included in the value of the products. Data are in current U.S. dollars. Dollar figures for GDP are converted from domestic currencies using single year official exchange rates.
2004
World Bank, World Development Indicators (2007)
Hidden Barriersi
Measures the extent of favoritism in economy i. Based on responses to the question: “In your country, hidden import barriers (that is, barriers other than published tariffs and quotas) are (1 = an important problem, 7 = not an important problem)”.
2004 Global Competitiveness Report (2005)
Importsijk Imports of economy i from economy j in sector k. Aggregated at the HS 2 digit level and SITC 4 digit level.
2002-2004 MAcMAP (2007)
Irreg. Paym.i
Measures the extent of irregular payments in economy i. Based on responses to the question: “In your industry, how commonly would you estimate that firms make undocumented extra payments or bribes connected with import and export permits (1=common, 7=never occur)”.
2004 Global Competitiveness Report (2005)
No. of Agenciesi
Counts the average number of border agencies involved in imports or exports in economy i. 2006
Logistics Perception Index (2007)
No. Documentsi
Counts the average number of documents needed for imports or exports in economy i. 2006 Doing Business
(2007)
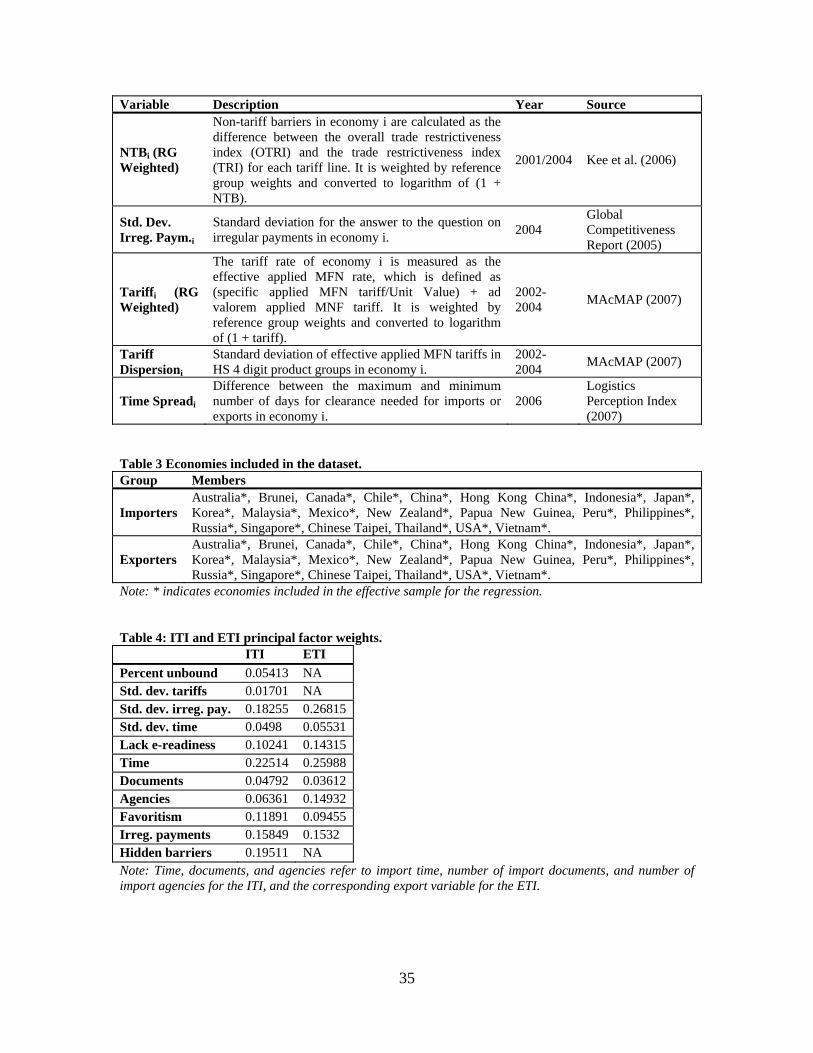
35
Variable Description Year Source
NTBi (RG Weighted)
Non-tariff barriers in economy i are calculated as the difference between the overall trade restrictiveness index (OTRI) and the trade restrictiveness index (TRI) for each tariff line. It is weighted by reference group weights and converted to logarithm of (1 + NTB).
2001/2004 Kee et al. (2006)
Std. Dev. Irreg. Paym.i
Standard deviation for the answer to the question on irregular payments in economy i. 2004
Global Competitiveness Report (2005)
Tariffi (RG Weighted)
The tariff rate of economy i is measured as the effective applied MFN rate, which is defined as (specific applied MFN tariff/Unit Value) + ad valorem applied MNF tariff. It is weighted by reference group weights and converted to logarithm of (1 + tariff).
2002-2004 MAcMAP (2007)
Tariff Dispersioni
Standard deviation of effective applied MFN tariffs in HS 4 digit product groups in economy i.
2002-2004 MAcMAP (2007)
Time Spreadi Difference between the maximum and minimum number of days for clearance needed for imports or exports in economy i.
2006 Logistics Perception Index (2007)
Table 3 Economies included in the dataset. Group Members
Importers Australia*, Brunei, Canada*, Chile*, China*, Hong Kong China*, Indonesia*, Japan*, Korea*, Malaysia*, Mexico*, New Zealand*, Papua New Guinea, Peru*, Philippines*, Russia*, Singapore*, Chinese Taipei, Thailand*, USA*, Vietnam*.
Exporters Australia*, Brunei, Canada*, Chile*, China*, Hong Kong China*, Indonesia*, Japan*, Korea*, Malaysia*, Mexico*, New Zealand*, Papua New Guinea, Peru*, Philippines*, Russia*, Singapore*, Chinese Taipei, Thailand*, USA*, Vietnam*.
Note: * indicates economies included in the effective sample for the regression.
Table 4: ITI and ETI principal factor weights. ITI ETI Percent unbound 0.05413 NA Std. dev. tariffs 0.01701 NA Std. dev. irreg. pay. 0.18255 0.26815 Std. dev. time 0.0498 0.05531 Lack e-readiness 0.10241 0.14315 Time 0.22514 0.25988 Documents 0.04792 0.03612 Agencies 0.06361 0.14932 Favoritism 0.11891 0.09455 Irreg. payments 0.15849 0.1532 Hidden barriers 0.19511 NA Note: Time, documents, and agencies refer to import time, number of import documents, and number of import agencies for the ITI, and the corresponding export variable for the ETI.
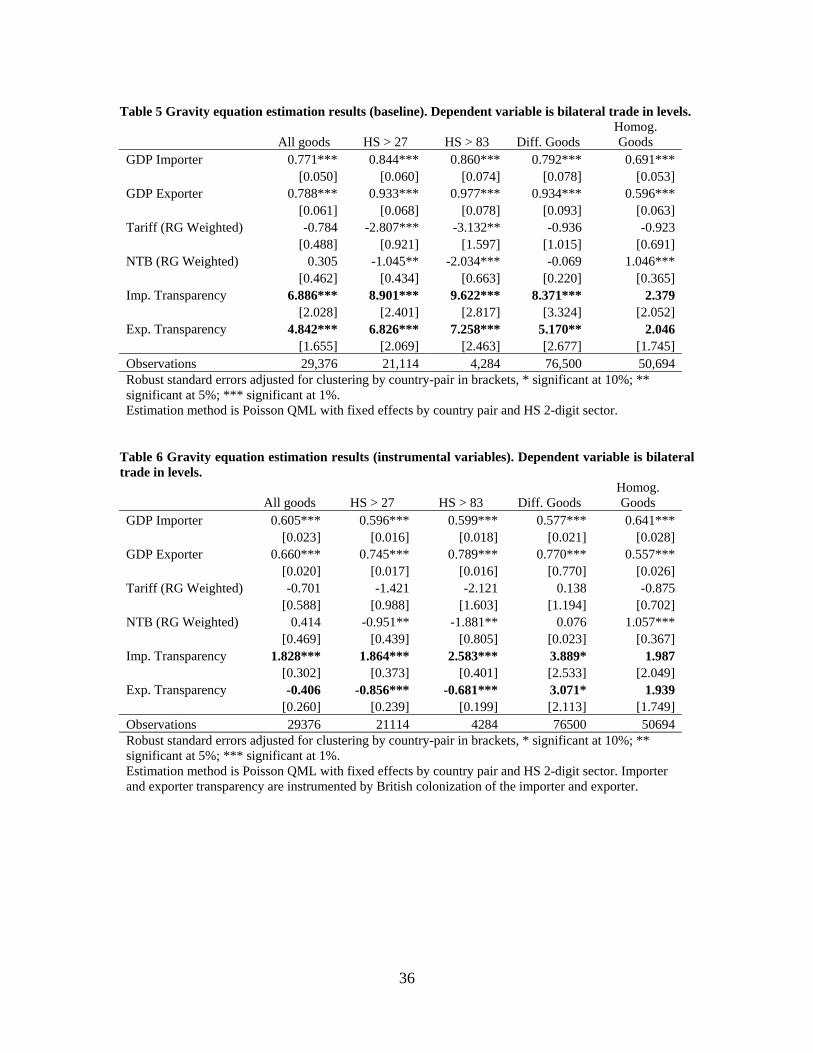
36
Table 5 Gravity equation estimation results (baseline). Dependent variable is bilateral trade in levels.
All goods HS > 27 HS > 83 Diff. Goods Homog. Goods
GDP Importer 0.771*** 0.844*** 0.860*** 0.792*** 0.691*** [0.050] [0.060] [0.074] [0.078] [0.053] GDP Exporter 0.788*** 0.933*** 0.977*** 0.934*** 0.596*** [0.061] [0.068] [0.078] [0.093] [0.063] Tariff (RG Weighted) -0.784 -2.807*** -3.132** -0.936 -0.923 [0.488] [0.921] [1.597] [1.015] [0.691] NTB (RG Weighted) 0.305 -1.045** -2.034*** -0.069 1.046*** [0.462] [0.434] [0.663] [0.220] [0.365] Imp. Transparency 6.886*** 8.901*** 9.622*** 8.371*** 2.379 [2.028] [2.401] [2.817] [3.324] [2.052] Exp. Transparency 4.842*** 6.826*** 7.258*** 5.170** 2.046 [1.655] [2.069] [2.463] [2.677] [1.745] Observations 29,376 21,114 4,284 76,500 50,694 Robust standard errors adjusted for clustering by country-pair in brackets, * significant at 10%; ** significant at 5%; *** significant at 1%. Estimation method is Poisson QML with fixed effects by country pair and HS 2-digit sector.
Table 6 Gravity equation estimation results (instrumental variables). Dependent variable is bilateral trade in levels.
All goods HS > 27 HS > 83 Diff. Goods Homog. Goods
GDP Importer 0.605*** 0.596*** 0.599*** 0.577*** 0.641*** [0.023] [0.016] [0.018] [0.021] [0.028] GDP Exporter 0.660*** 0.745*** 0.789*** 0.770*** 0.557*** [0.020] [0.017] [0.016] [0.770] [0.026] Tariff (RG Weighted) -0.701 -1.421 -2.121 0.138 -0.875 [0.588] [0.988] [1.603] [1.194] [0.702] NTB (RG Weighted) 0.414 -0.951** -1.881** 0.076 1.057*** [0.469] [0.439] [0.805] [0.023] [0.367] Imp. Transparency 1.828*** 1.864*** 2.583*** 3.889* 1.987 [0.302] [0.373] [0.401] [2.533] [2.049] Exp. Transparency -0.406 -0.856*** -0.681*** 3.071* 1.939 [0.260] [0.239] [0.199] [2.113] [1.749] Observations 29376 21114 4284 76500 50694 Robust standard errors adjusted for clustering by country-pair in brackets, * significant at 10%; ** significant at 5%; *** significant at 1%. Estimation method is Poisson QML with fixed effects by country pair and HS 2-digit sector. Importer and exporter transparency are instrumented by British colonization of the importer and exporter.
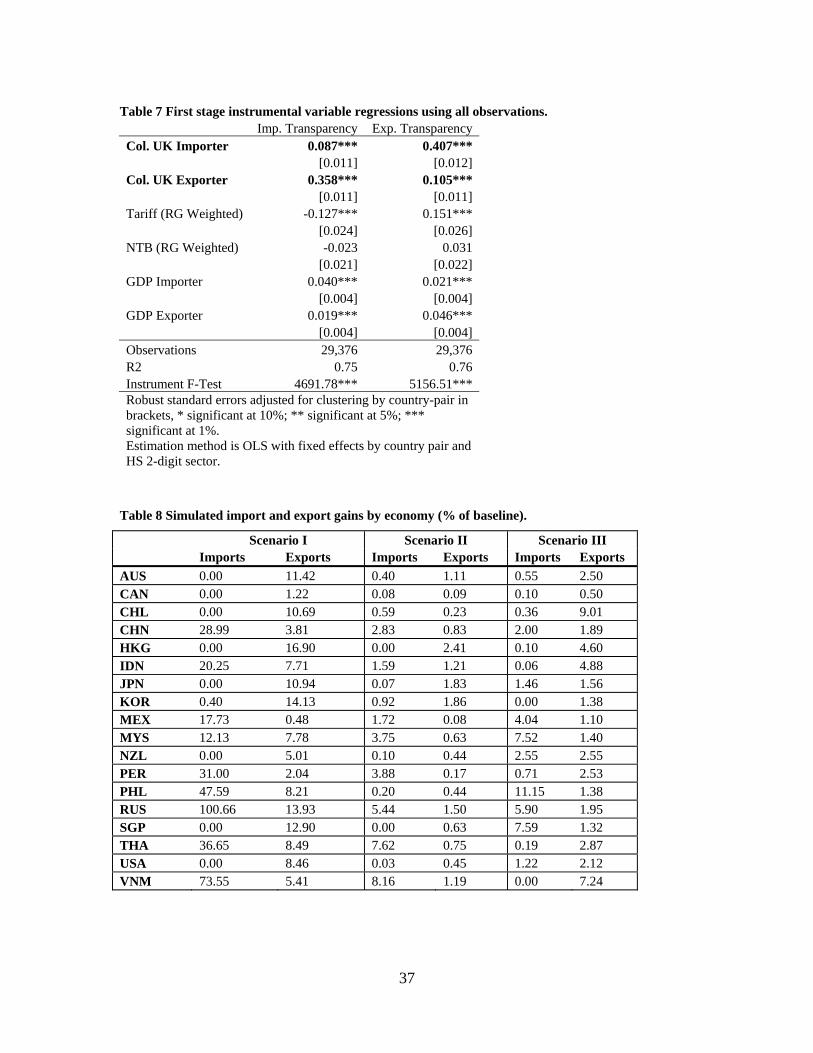
37
Table 7 First stage instrumental variable regressions using all observations. Imp. Transparency Exp. Transparency Col. UK Importer 0.087*** 0.407*** [0.011] [0.012] Col. UK Exporter 0.358*** 0.105*** [0.011] [0.011] Tariff (RG Weighted) -0.127*** 0.151*** [0.024] [0.026] NTB (RG Weighted) -0.023 0.031 [0.021] [0.022] GDP Importer 0.040*** 0.021*** [0.004] [0.004] GDP Exporter 0.019*** 0.046*** [0.004] [0.004] Observations 29,376 29,376 R2 0.75 0.76 Instrument F-Test 4691.78*** 5156.51*** Robust standard errors adjusted for clustering by country-pair in brackets, * significant at 10%; ** significant at 5%; *** significant at 1%. Estimation method is OLS with fixed effects by country pair and HS 2-digit sector.
Table 8 Simulated import and export gains by economy (% of baseline).
Scenario I Scenario II Scenario III Imports Exports Imports Exports Imports Exports AUS 0.00 11.42 0.40 1.11 0.55 2.50 CAN 0.00 1.22 0.08 0.09 0.10 0.50 CHL 0.00 10.69 0.59 0.23 0.36 9.01 CHN 28.99 3.81 2.83 0.83 2.00 1.89 HKG 0.00 16.90 0.00 2.41 0.10 4.60 IDN 20.25 7.71 1.59 1.21 0.06 4.88 JPN 0.00 10.94 0.07 1.83 1.46 1.56 KOR 0.40 14.13 0.92 1.86 0.00 1.38 MEX 17.73 0.48 1.72 0.08 4.04 1.10 MYS 12.13 7.78 3.75 0.63 7.52 1.40 NZL 0.00 5.01 0.10 0.44 2.55 2.55 PER 31.00 2.04 3.88 0.17 0.71 2.53 PHL 47.59 8.21 0.20 0.44 11.15 1.38 RUS 100.66 13.93 5.44 1.50 5.90 1.95 SGP 0.00 12.90 0.00 0.63 7.59 1.32 THA 36.65 8.49 7.62 0.75 0.19 2.87 USA 0.00 8.46 0.03 0.45 1.22 2.12 VNM 73.55 5.41 8.16 1.19 0.00 7.24
Related Documents