Transnational U r banward Migration, 1830-1 980 Brian J.L. Berry School of Social Sciences, University of Texas at Dallas, Richardson, TX 75083 FAX 214/690-2735 Abstract. Data sets are provided that measure the volume of transnational urbanward immi- gration and yield estimates of the contribu- tions of transnational migrants to urban growth for an expanding p&el of countries from 1830-1 980. Urbanward immigration is found to be cyclical, pulsatingwith long-wave rhythmicity. This cyclicality is the source of long-term surges and sags of urban growth in both receiving and sending countries. Since World War II, variations in the relationship have emerged across levels of development. The historical association of transnational mi- gration and urban growth is still to be seen in low- and middle-income countries, but among higher-incomecountries, transnational urbanward immigration now is inversely re- lated to urban growth: the countries with the lowest rates ofurban growth are those with the greatest foreign inflows, which speeds the globalization of urban populations in the world's most developed regions. Key Words: migration, urban growth, trans- national flows, long waves, cycles, development. HE reader who expects a convention- ally-structured paper that proceeds from theory and hypothesis through method- ology and data to tests and conclusions will be unhappy with this essay. Despite an immense literature on migration and urban growth, there has been no systematic research on trans- national urbanward migration. Rather, the focus has been upon domestic rural-to-urban shifts. Among the few exceptions is a study by Brinley Thomas (1972) on the relationship of British and American long cycles during the late nine- teenth century. To the extent that there are related studies, they are typified by David Ward's monograph on migration and urban growth, which contains seven pages on the urban destinations of immigrants to the US., the numbers obtained by calculating the per- centages of the populations of large American cities reported as foreign-born in the censuses of 1870 and 1910 (Ward 1971). The lack of research is directly attributable to a lack of data. Systematic information on transnational urban- ward migration flows has been neither col- lected nor generated by statistical analysis, and in the absence of any readily accessible data set, investigators have turned their attention elsewhere. The usual sections that review re- ceived theory and previous literature are there- fore omitted here. The last attempt to compile a comprehensive global record of transnational migration was that of Ferenczi and Willcox in 1929, but they dealt with gross migration, not with the flows directed specifically towards urban destina- tions. The first purpose of this paper is to fill this gap. Two new data sets are described, the second of which provides lower-bound esti- mates of transnational urbanward migration flows on a country-by-country basis for each decade, 1830-1 980, for which baseline statis- tics are available. It is this second data set that opens for investigation unexplored terrain con- cerning the de facto transfer of urban growth from origin to destination countries. The sec- ond purpose of the paper is to begin this ex- Annals of the Assocration of American Geographers, 83(3), 1993, pp. 389-405 0 Copyright 1YYJ by Association 01 American Geographers Published by Blackwell Publisheri, 238 Main Street, Cambridge, MA 02142, and 108 Cowley Road, Oxford, OX4 lJF, UK

Welcome message from author
This document is posted to help you gain knowledge. Please leave a comment to let me know what you think about it! Share it to your friends and learn new things together.
Transcript

Transnational U r ban ward Migration, 1830-1 980
Brian J.L. Berry
School of Social Sciences, University of Texas at Dallas, Richardson, TX 75083
FAX 214/690-2735
Abstract. Data sets are provided that measure the volume of transnational urbanward immi- gration and yield estimates of the contribu- tions of transnational migrants to urban growth for an expanding p&el of countries from 1830-1 980. Urbanward immigration is found to be cyclical, pulsating with long-wave rhythmicity. This cyclicality is the source of long-term surges and sags of urban growth in both receiving and sending countries. Since World War II, variations in the relationship have emerged across levels of development. The historical association of transnational mi- gration and urban growth is still to be seen in low- and middle-income countries, but among higher-income countries, transnational urbanward immigration now is inversely re- lated to urban growth: the countries with the lowest rates ofurban growth are those with the greatest foreign inflows, which speeds the globalization of urban populations in the world's most developed regions.
Key Words: migration, urban growth, trans- national flows, long waves, cycles, development.
HE reader who expects a convention- ally-structured paper that proceeds from theory and hypothesis through method-
ology and data to tests and conclusions will be unhappy with this essay. Despite an immense literature on migration and urban growth, there has been no systematic research on trans- national urbanward migration. Rather, the focus has been upon domestic rural-to-urban shifts. Among the few exceptions is a study by Brinley
Thomas (1972) on the relationship of British and American long cycles during the late nine- teenth century. To the extent that there are related studies, they are typified by David Ward's monograph on migration and urban growth, which contains seven pages on the urban destinations of immigrants to the US., the numbers obtained by calculating the per- centages of the populations of large American cities reported as foreign-born in the censuses of 1870 and 1910 (Ward 1971). The lack of research is directly attributable to a lack of data. Systematic information on transnational urban- ward migration flows has been neither col- lected nor generated by statistical analysis, and in the absence of any readily accessible data set, investigators have turned their attention elsewhere. The usual sections that review re- ceived theory and previous literature are there- fore omitted here.
The last attempt to compile a comprehensive global record of transnational migration was that of Ferenczi and Willcox in 1929, but they dealt with gross migration, not with the flows directed specifically towards urban destina- tions. The first purpose of this paper is to fill this gap. Two new data sets are described, the second of which provides lower-bound esti- mates of transnational urbanward migration flows on a country-by-country basis for each decade, 1830-1 980, for which baseline statis- tics are available. It is this second data set that opens for investigation unexplored terrain con- cerning the de facto transfer of urban growth from origin to destination countries. The sec- ond purpose of the paper is to begin this ex-
Annals of the Assocration of American Geographers, 83(3), 1993, pp. 389-405 0 Copyright 1YYJ by Association 01 American Geographers Published by Blackwell Publisheri, 238 Main Street, Cambridge, MA 02142, and 108 Cowley Road, Oxford, OX4 lJF, UK

390 Berry
ploration, and to point to a number of avenues o f future research. Associations between fluc- tuations in transnational urbanward migration flows and the cyclicality of urban growth are examined. A 50-year long-wave rhythm is sug- gested, consistent with a reemergent literature on innovation waves, economic growth, and global price movements that is briefly re- viewed for the reader who may not be familiar with the ideas.
I make no apologies for the fact that the paper is long on graphs and tables and short on convention, whether it be obeisance to forebears or conformity to any particular model of social analysis. Sometimes it is useful to ex- plore new terrain unconstrained by preformed mental maps, letting the process of discovery shape the account as observations trigger as- sociated images. That is what I attempt here.
Two Data Sets’
As a first step, I made an attempt to update the inventory of global migration flows last as- sembled by Ferenczi and Willcox in 1929 by creating a global migration matrix Xi, in which the rows (i) represent countries of origin, the columns 0) represent destination countries, and the layers (t) represent time periods. This information has not been gathered systemati- cally on a global basis in any continuing fash- ion, derived as it must be from individual des- tination countries’ reports on landed immi- grants by country of origin by time period. Few origin countries have been successful in keep- ing track of emigration by their citizens. This is not a serious problem, however. By using the immigration records to fill the columns of the matrix, the rows and layers are completed and the information on emigration and on trends in migration is generated automatically.
There are, of course, many limitations to the data. Any such matrix is only as good as the individual countries’ immigration reports. The time periods of data availability vary, resulting in an expanding panel of countries over time. Many countries’ boundaries have changed, so the numbers frequently refer to shifting na- tional entities. Some countries have reported on immigrants on a regular basis, others only episodically. Some measure and others guess. Some report country of birth and others the country of last residence. Adding to the litany of limitations, immigration reports clearly un-
dercount, since, by definition, illegals are ex- cluded and by practice, refugees who plan to return to their origins are not recorded. So why bother? The answer is obvious: To study global migration in a systematic fashion over any span of time there is no alternative. No better data sources exist.
Unfortunately, a matrix of the type just de- scribed tells us nothing about transnational ur- banward migration. Information on the in- tended residence of landed immigrants is sel- dom solicited and is unreliable at best: People relocate, moving around in search of opportu- nity. How, then, might the urban share of trans- national flows be estimated? In closed national societies, urban growth has two sources, natu- ral increase and rural-to-urban migration. In an open system of interacting nations, not all of a given nation‘s rural surplus may end up as do- mestic urban growth, however; some emi- grate,* and some of these emigrants settle in urban areas elsewhere? For sending nations, ceteris paribus, urban growth is then less than it would have been under conditions of clo- sure; for receiving nations, there is a more rapid rate of urban growth.
This suggests another route to estimating ur- banward flows, via demographic analysis. Na- tional population censuses report on the rates of population growth in urban and rural areas, and central statistical offices on rates of natural increase in these areas. The difference be- tween population growth and natural increase in any time period is the surplus or deficit ac- counted for by migration. Typically, natural in- crease exceeds population growth in rural ar- eas; the surplus shows up in rural-to-urban mi- gration or in emigration. Just as typically, popu- lation growth exceeds natural increase in urban areas, with the difference accounted for by a combination of domestic rural-to-urban migra- tion and transnational urbanward immigration. If the rural surplus (excess of natural increase over population growth in rural areas) is calcu- lated and if it is assumed that all of this surplus translates into domestic rural-to-urban migra- tion, transnational urbanward migration may be estimated as a residual (urban population growth minus natural increase in urban areas minus the rural surplus). This residual is a lower bound. To the extent that rural residents emi- grate directly, the computed rural surplus will exceed actual domestic rural-to-urban migra- tion and the residual will be less than the actual transnational flows by an equivalent amount.

Transnational Urbanward Migration 391
The undercount will be less, of course, when potential rural emigrants use domestic towns and cities as way stations.
Accepting this limitation, Figures 1 and 2 pro- vide an example of the computations made when deriving estimated transnational urban- ward flows. The example uses Venezuelan data, with the numbers converted to rates. In Figure 1, Venezuela's average annual urban growth rate for each decade is charted (line with solid dots), together with the annual growth rate that would have occurred had it been based solely upon natural increase (line with hollow dots). The difference between the two is that portion of the urban growth rate attributable to a combination of rural-to-urban and transnational urbanward migration. This estimated portion is transferred to Figure 2 (line with solid dots). To this figure is added an es- timate of what the portion would have been if it had been accounted for solely by Vene- zuela's rural surplus population via domestic rural-to-urban migration (line with hollow dots). To obtain this estimate, the rural surplus was calculated (excess of natural increase over population growth) and, assuming that it trans- lated completely into rural-to-urban migration, was converted into a share of the urban growth rate. Differences between the two lines in Figure 2 reveal the contribution of trans- national migration to Venezuela's urban growth-significant from the mid-I 920s to 1951 when net urbanward migration exceeds the imputed share of rural-to-urban flows, but very small thereafter. In the early 192Os, the rural surplus exceeded the urban growth due to migration, suggesting that at this time there was a net transnational outflow.
Similar pairs of graphs were produced for every country in the world for which the nec- essary information was available, over the time- span for which it was available. This required use of each country's censuses and central sta- tistical office reports, supplemented by a wide range of secondary documents on natural in- crease and urban and rural population growth. To reiterate: The results are only as sound as the baseline data, however. No attempt was made to standardize urbanhural definitions. Each country's official definitions were used, and countries differ as to what they consider an urban area to be. Nor was it possible to adjust for the changing political map, except as reflected in the expanding set of countries over time. One concession to consistency was
1931 L9ll l52l I531 1941 1951 1961 1971 1981
Figure 1. Venezuela: Annual urban growth rate 1901-81, and the contribution of natural increase to that growth rate, 1911 -81. Information is plotted at the end-point of the decade for which the growth rates were estimated, i.e., 1911 refers to 1901-11, etc. The difference between the two lines is the con- tribution of migration to urban growth.
y air
y/ + Rural-to-Urban Migration
1931 ,911 I521 193I 1941 1951 1961 1971 1981
Figure 2. Venezuela: Contribution of migration to the urban growth rate, 1911 -81, and the growth rate that would have occurred if all rural emigrants in Venezuela settled in Venezuelan urban areas, ceteris paribus, during the same time period. The difference between the two is a lower-bound estimate of the contribution of transnational urbanward migration to the rate of urban growth.
made. Because countries' censuses have varied in timing and frequency, country-by-country estimates of transnational urbanward migration, initially made for each intercensal interval, sub- sequently were interpolated to yield a stan- dardized decadal data set in which the 1830s represent 1831 -40, etc.
With all these caveats, the cynic may once again ask: Why bother? (as some reviewers of early drafts of this paper did). The answer is the same as before: To study transnational ur- banward migration flows-the transfer of po- tential urbanization across the globe-some-

392 Berry
thing that has not been attempted heretofore, the estimates may be the best numbers avail- able.
The Estimated Transnational Flows
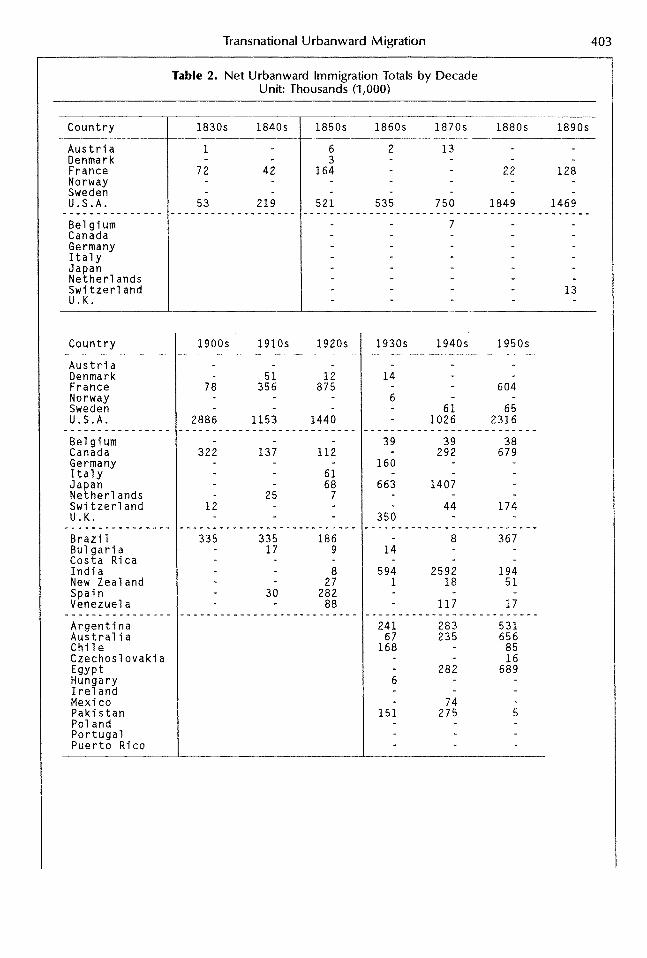
Some of these estimates are set down in Tables 1 and 2. Table 1 reports the annual con- tributions of transnational urbanward migration to rates of urban growth by decade for every decade for which the calculations could be completed. Table 2 has the decadal trans- national urbanward immigration totals.
Note, first, the expanding set of countries. The calculations could only be made for six countries in the 1830s and 1 8 4 0 ~ ~ but more than 130 countries in the 1960s and 1970s. Second, observe that Table 1 includes both positive and negative numbers. To interpret these, look at the entries for the U S . and the U.K. In the 1 8 4 0 ~ ~ the annual urban growth rate of the U S . was 1 .I 8 percentage points greater because of urbanward immigration than it would have been if, ceteris paribus, the only sources of urban growth had been natural in- crease and rural-to-urban migration. In the 1860s, the annual urban growth rate in the U.K. would have been 0.51 percentage points greater if the rural surplus had not emigrated (-0.51 in the table). Translating to totals in Table 2, there were 219,000 net urbanward immi- grants to the U S . in the 1840s and, of course, none to the U.K. in the 1860s since a portion of Britain's potential urban growth was ex- ported.
That the estimates are reasonable may be confirmed by a variety of external validity checks. For example, between 1820 and the early 192Os, more than 33 million people en- tered the U S . (Ward 1971 , 52). Of these, one- third, by our calculations, settled in urban ar- eas. The other major beneficiaries of urban- ward immigration, as evidenced by Table 2, have been France, Canada, Australia, Argen- tina, Brazil, South Africa, India, Pakistan, West Germany and Japan. Referring once again to Table 1, nineteenth-century sources of emigra- tion, such as Sweden, turn around and be- come recipients of urbanward flows in the twentieth century. Big losers in the 1960s and 1970s include many belligerents, contrasting with the fortunes of the major Persian Gulf oil
producers and such countries as The Ivory Coast, whose urban growth has been driven by transnational immigration.
The relationships are dynamic and variable across the globe, as the examples graphed in Figure 3 suggest (in reading these graphs, be aware that the vertical scales change to accom- modate differences in magnitudes). As already noted, Britain, the most urbanized nation in the world throughout much of this period, would have become more highly urbanized more rapidly in the absence of net emigration. Only during the most major of global economic cri- ses did Britons, on balance, return home, as evidenced by the crossover of the curves for the U S . and the U.K. during the Great Depres- sion. Sweden's nineteenth-century losses con- trast with immigration-enhanced growth after World War II, a growth that correlates with Finland's losses. Norway's and Denmark's ex- periences parallel those of Sweden, albeit with some lag after World War II, and with the ex- ception of immigration to Danish cities as a consequence of the Schleswig-Holstein boundary adjustments. Germany was charac- terized by net emigration until the 192Os, and then by the contrasting experiences of east and west after the Second World War. Italy and Greece have moved in concert, as have Spain and Portugal, except that there was net urban- ward immigration to Spain during the 1940s. Similarly, in the southern hemisphere, the rhythms of Australia and New Zealand are con- sistent, as are those of Argentina and Brazil.
What is revealed are numerous temporal and regional patterns needing explanation. Why have certain groups of countries experienced changes in concert? Why have there been the turnarounds from being net exporters of urban growth to being net importers? How and why have preferred destinations changed over time? What have been the roles of war, dis- ease, and natural disaster in shifting urban growth across the globe? These are some of the questions that need to be explored.
Global Magnitudes
What have been the overall global magni- tudes involved and how have they changed? The available data permit the aggregate num- bers of urbanward migrants to be estimated for only a few countries in the early nineteenth century, but for a much greater array in recent

Transnational Urbanward Migration 393
6 4 -
'g 2 - -UnitedStates
P
I +United Kingdom % 4 - , * ~ ' " ' " ' ' ' ' ~ i
-Sweden
,Finland \d
+ W. Germany L P
$ -1 5
s 1810 1830 1850 IS0 18" 1910 1930 1950 IT70 -2
g 8m
3 700 +Aushalia -
6 M -
5m - C
C .B m -
I00 a Y 5 O .
g-I00 ' ' ' ' ' , ' ' ' I . I ' '
3 1810 1830 I850 1870 1894 1910 1930 1950 I970
s
2 Figure 3. Urbanward immigrationlemigration by decade for selected countries over the time spans for which estimates could be made.

394 Berry
L -
decades. The total volume of transnational ur- banward migration calculated for any given decade therefore is partly a product of the number of countries for which estimates could be made, and partly a product of shifts in the propensity to migrate, as revealed by Figures 4 and 5.
Figure 4 charts the total number of urban- ward immigrants for four sets of countries: those for which data were available over the entire time span (6 countries); a larger set with data for the period 1851 -1 980 (1 4 countries); the set with data for the period 1901-80 (21 countries); and finally, the complete set of countries for which estimates were made 1951 -80. Despite the consequences of ex- panding the array of countries, there is clear evidence of the rising tide of transnational ur- banward immigration over the 150 years stud- ied, and indeed, many of the current partici- pants were beyond the pale of significant mi- gration flows in the earlier time periods. Since World War I I , more than half of the total has been accounted for by the world's new na- tions. In the 197Os, more than 3 million poten- tial urbanites moved each year from their countries of origin to live in towns and cities in other countries, a significant shift in the locus of urban growth. The number had been less than a million annually on the eve of the Sec- ond World War, and only ha& that in 1900.
Is this rising tide of urbanward immigration simply a function of increasing global migration generally, or is something else at work? Figure 4 also plots the total global migration, urban- ward plus ruralward, as recorded in the first data matrix, described earlier. By comparing to- tal migration with the urbanward estimates, we conclude that prior to the Great Depression, urbanward migration averaged some 20 per- cent of total transnational migration flows; as much as 80 percent of all migrants settled in rural areas. Since the Second World War, this share has been reversed, however: urbanward migration now exceeds 80 percent of the total.
Figure 4 also shows that during the Great Depression, the estimated volume of trans- national urbanward migration exceeded the re- ported global migration total, which is counter- intuitive. Why should this be so? The reason, I suspect, is that when nationals who have emi- grated return to their native country, they are not reported in the official statistics to be im- migrants, but they show up in the demograph- ics of urban growth. The substantial volume of
I
181" 1820 1810 1MO 1880 19w 1920 lW0 IW 1980
Figure 4. Urbanward and total transnational migra- tion. Total migration numbers come from the global migration matrix discussed earlier. The urbanward migration totals come from the several panels of countries in Table 2. The great surge of global migra- tion that occurred between the 1865 and 1920 long- wave peaks was one in which one-fifth of the move- ment was urbanward. The 1920-80 surge has been one in which more than four-fifths of the movements have been urbanward.
0.700 2 E m -
L( 500 % p rm
data set 1951-1980 / -
-
1901-1980 -
Figure 5. The rising tide of transnational urbanward migration, 1801 -1 980. Separate rates have been cal- culated, over the time spans available, for the differ- ent panels of countries in Table 2.
return migration during the Great Depression from the U.S. to cities in countries of origin could have produced this result.
Figure 4 reports raw numbers, but there also has been a mushrooming global population. Is what the figure shows simply a reflection of global population growth, or has the migration rate increased as well? The evidence is pro- vided by Figure 5. Overall, we see that urban- ward mobility has quickened, not simply as more countries have entered the global sys- tem, also because the global migration rate has increased. The estimated transnational urban- ward migration rate was seven times greater in

Transnational Urbanward Migration 395
1980 than it was in 1900, and fourteen times that of 1860. Today, 7 out of every 1,000 of the world’s population migrates each year, settling in a town or city in some other country, a clear measure of the global transfer of urban growth.
The Question of Cyclicality
For the countries with the longest records of urbanward immigration, there is also a sugges- tion of cyclicality in Figure 5. There may be two distinct rhythms, the first that of the “long cy- cles” discussed by Brinley Thomas (1 9721, and the second that of the “long waves“ most re- cently explored by Berry (1 991 ).
Thomas’s Long Cycles
In his 1972 study, Migration and Urban De- velopment, Brinley Thomas thought he could discern that, between 1870-1 91 3, there had been 20-year cycles in migration and urban development in the Atlantic economy, particu- larly with reference to the ways in which the processes of urbanization in Britain and Amer- ica interacted as the result of international movements of population and capital. Spe- cifically, he argued that the US. experience in the period 1870-1913 could best be inter- preted within the ambit of the inverse long- swing relationship between the “periphery” (i.e., the US.) and Great Britain, with an alter- nation of infrastructure development at home in Britain and export upsurges overseas. Home investment in Britain, he said, was dominated by population-sensitive capital formation, and long swings in the latter were associated with inverse swings in migration of people and ex- port of capital between Great Britain and the periphery. When times were good in Britain, capital stayed home and was applied to do- mestic infrastructure building. When the do- mestic economy sagged, capital was exported and people migrated, producing growth else- where. Extending the core-periphery idea, he went on to argue that long cycles in America, Canada, Argentina, and Australia were all in- verse to the British cycles.
Does our new evidence cast light on Thomas’s generalizations? Figure 6 plots the U.S./U.K. urbanward migration data for the critical 1870-1 91 0 period. There do indeed ap- pear to be inverse swings. If we refer to the
I United Kingdom
1870 1880 1890 19M) 1910
Figure 6. The Thomas hypothesis examined: coun- tervailing rhythms of U.S. urbanward immigration and of emigration from the U.K. during the period that Britain dominated the Atlantic economy, 1870-1910.
top left-hand graph in Figure 3, however, we find that these occur within a larger over- arching framework of US. urban growth due to urbanward immigration, and the persistent reduction of potential urban growth in the U.K. due to emigration, a framework that was only reversed during the Great Depression. Thomas went to great lengths to criticize what he termed “one-sided interpretations” based on fluctuations in the ”pull” of the United States economy (Thomas 19721, yet Figure 6 shows clearly enough that the very modest inverse U.K/U.S. swings between 1870-1 91 0 occurred within the larger context of that pull.
Long-Wave Rhythms
A more general notion is that of long waves: Over the past two centuries, the progress of economic history has been marked by the rise and fall of successive technological systems, centering first on wind, water, and wood, next on coal, steam, and steel, and most recently on petroleum, internal combustion, and elec- tricity, with the interval from takeoff of new innovations to market saturation by the new technologies averaging some 50-60 years (Fig. 7).
Linked with these successive technological systems have been 55-year long waves of

396 Berry
i R O i n 0 ,*lo ,*I0 181" ,**" ,>I" lo," /Y1/3 897,) , l o
Figure 7. Growth of different techno-economic sys- tems from innovation to peak deployment and thence to replacement, 1790-1 990. Source: Berry, et al. (1993).
17- ,780 im L8W ISIO , 860 1880 ixa ,920 ,940 ,Me 1980 2m
Figure 8. Long-wave rhythms of prices in the U.S. and the U.K. 1760-1990. Source: Berry, et al. (1993).
>790 1810 1810 IBSO 1810 iBU0 ipio $930 ips0 iwo LPYO
Figure 9. Relationships of expansion of the coal- railroad-steel techno-economic system to U.S. price movements. Source: Berry, et al. (1993).
prices, the so-called Kondratiev waves (Fig. 8). The connection between the two is that while each technological system involves the mas- sive development of new infrastructures that initially open new product and factor markets, each also inevitably reaches limits in which there are decreasing returns to scale and pres-
sures on these factor markets that drive up prices. As new growth opportunities vanish, all that is left of the rising tide is inflationary pres- sure. Thus, as technological systems approach market saturation, they kick off the inflationary spirals that mark long-wave peaks of prices, and perhaps also the contention for markets and materials that has resulted in major wars (Fig. 9).
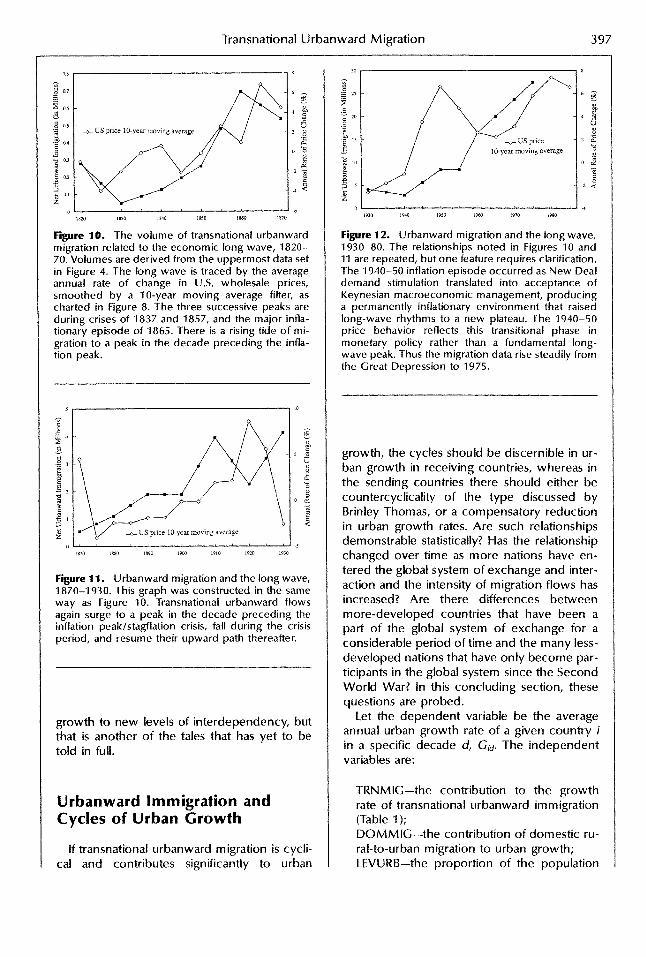
Global urbanward migration displays these long-wave rhythms. Figures 10, 11, and 12 plot the total volume of urbanward migration for the time periods 1820-70, 1870-1930, and 1930-80, in each case using the information for the maximum number of countries for which the information was available, combining it with information on the long-wave movement of US. prices (refer to Fig. 8). The results are dramatic. In Figure 10, as prices rise out of the 1840s trough towards the 1865 peak, the vol- ume of urbanward migration increases. Like the water-wood-wind technological system (Fig. 7), the migration flows peak ahead of the inflation peak, and then decline during the ac- companying stagflation crisis. In other words, global migration displays exactly the pattern of growth of the prevailing techno-economic sys- tem, a relationship that is repeated in Figure 11 as prices move from a trough in the 1890s to the 1920 peak. The pattern recurs for a third time in Figure 12, provided the anomalous be- havior of prices between 1940-50 is under- stood. This particular time-period spanned a combination of adoption of Keynesian macro- economic management, abandonment of the gold standard, and the emergence of a military- industrial complex fed by deficit spending that together elevated long-wave price fluctuations into a permanently inflationary environment (Berry 1991, 13, 31-34). The anomalous peak reflects this transition, and once it is accounted for, what remains in Figure 12 is the long-wave pattern.
What is very strongly suggested is that each new techno-economic system has brought with it a surge in the volume of transnational urbanward migration. Each successive surge has also raised the volume and intensity of these flows to new levels. Comparing Figures 10 , l l and 12, the peak volume preceding suc- cessive inflation peaks appears to have been increased in each case by a factor of six or seven. The story that is suggested is one of long-wave surges of economic development that have successively ratcheted global urban
Transnational Urbanward Migration 397
10-year moving average
,820 m n I%! ,850 ,860 ,810
Figure 10. The volume of transnational urbanward migration related to the economic long wave, 1820- 70. Volumes are derived from the uppermost data set in Figure 4. The long wave is traced by the average annual rate of change in U.S. wholesale prices, smoothed by a 10-year moving average filter, as charted in Figure 8. The three successive peaks are during crises of 1837 and 1857, and the major infla- tionary episode of 1865. There is a rising tide o f mi- gration to a peak in the decade preceding the infla- tion peak.
- 6 - E - 4 5 6
8
M
- I E a 2
- 2 :
-
1
+-US price 10-year moving average w \ +-US price 10-year moving average
Figure 11. Urbanward migration and the long wave, 1870-1 930. This graph was constructed in the same way as Figure 10. Transnational urbanward flows again surge to a peak in the decade preceding the inflation peakktagflation crisis, fall during the crisis period, and resume their upward path thereafter.
growth to new levels of interdependency, but that is another of the tales that has yet to be told in full.
Urbanward Immigration and Cycles of Urban Growth
If transnational urbanward migration is cycli- cal and contributes significantly to urban
30 r *
0 1 ' ' ' ' ' ' 8 ' ' ' ' S L m o 1940 i9so i9ia to70 ,980
Figure 12. Urbanward migration and the long wave, 1930-80. The relationships noted in Figures 10 and 11 are repeated, but one feature requires clarification. The 1940-50 inflation episode occurred as New Deal demand stimulation translated into acceptance of Keynesian macroeconomic management, producing a permanently inflationary environment that raised long-wave rhythms to a new plateau. The 1940-50 price behavior reflects this transitional phase in monetary policy rather than a fundamental long- wave peak. Thus the migration data rise steadily from the Great Depression to 1975.
growth, the cycles should be discernible in ur- ban growth in receiving countries, whereas in the sending countries there should either be countercyclicality of the type discussed by Brinley Thomas, or a compensatory reduction in urban growth rates. Are such relationships demonstrable statistically? Has the relationship changed over time as more nations have en- tered the global system of exchange and inter- action and the intensity of migration flows has increased? Are there differences between more-developed countries that have been a part of the global system of exchange for a considerable period of time and the many less- developed nations that have only become par- ticipants in the global system since the Second World War? In this concluding section, these questions are probed.
Let the dependent variable be the average annual urban growth rate of a given country i in a specific decade d, Gid. The independent variables are:
TRNMIC-the contribution to the growth rate of transnational urbanward immigration (Table 1); DOMMIC-the contribution of domestic ru- ral-to-urban migration to urban growth; LEVURB-the proportion of the population

398 Berry
living in urban areas, to control for an hy- pothesized decrease in the urban growth rate with increases in the level of urbaniza- tion.
The third source of urban growth, natural in- crease, was omitted because, by definition, it, TRNMIG, and DOMMIC are perfectly collin- ear.
These variables are combined in a pooled cross-sectional time-series format that cali- brates the effects for five different panels of countries, reflecting expanding data-set avail- abilities 1830-1 980, 1850-1 980, 1900-80, 1930-80 and 1960-80. For each panel,
Gtd = a0 + Z, (b, X,) + el + e d + e l d
in which c , d is the urban growth rate for each country in each decade, a, is an intercept, the X, are the independent variables (TRNMIG, DOMMIG, LEVURB) for which are estimated the coefficients b,. The e,, ed and e l d terms are components of the residual variance: el, vari- ance specific to a particular country; e d , vari- ance specific to a particular decade; and e,d, error variance. The el and e d serve as intercept shifters for particular countries and decades, helping eliminate selection bias by using indi- vidual countries as their own controls to net out individual differences (Sayrs 1989). The in- tercept shifters are estimated by including country and decade dummies in the estimating equation.
Several versions of the fixed effects model were run. The first set of analyses was com- posed of a sequence of models that initially treated TRNMIG, DOMMIC, and LEVURB as continuous variables, but later the three inde- pendent variables were interacted with dummy variables representing each decade (T.TRNMIG, T.DOMMIC and T.LEVURB). This enabled the intercept shifters e d to be dropped, in the attempt to ascertain whether coefficients have shifted over time. The final set of runs appears in Table 3.5
The second set dealt only with the countries and data available for the time period 1960-80, and explored relationships to levels of eco- nomic development. The countries were di- vided into three groups according to income level, as classified by the World Bank ca. 1980, and the pooled analyses repeated. The final sets of these results are presented in Table 4.
The first impression in Table 3 is that of the
power of the models. Coefficients of each of the independent variables are statistically sig- nificant throughout, but there are differences in behavior. If the 1830-1980 panel is exam- ined first, it will be found that the parameter values for DOMMIG are consistent across dec- ades, varying around a value of 1.0, those for LEVURB are negative and consistent across decades until the 196Os, but the parameter val- ues for TRNMIG fluctuate substantially, forming long-wave rhythms. Figure 13, which charts the parameter values, is the easiest way to visu- alize this behavior. Evidently, for the group of six countries for which data were available for the entire period 1830-1 980 (see Table 1 ), do- mestic rural-to-urban migration has been a consistent force in urban growth. These coun- tries’ urban growth rate also has declined con- sistently with increasing level of urbanization, at least until the most recent decades. Ceteris paribus, however, their urban growth has re- sponded in a strongly cyclical manner to trans- national urbanward migration.
The stability of the relationship between ur- ban growth and DOMMIG is maintained across all five panels of countries (Fig. 14), but the evidence for cyclicality of urban growth related to TRNMIG is not as clear in the panels of countries that include increasing numbers of new nations (Fig. 15). This suggests that there may be differences across levels of economic development, a question that is probed in Ta- ble 4 for the 1960-80 panel.
In Table 4, each of the models is again highly significant, as are each of the independent vari- ables, but parameter values of all three vari- ables shift across levels of development. Trans- national migration is a positive and significant source of urban growth for low- and middle- income countries. That the largest coefficient for low-income countries is in the most recent decade speaks to the rising force of extraterri- torial influences on urban growth in those na- tions that are in the earliest stages of their de- velopment. For high-income countries, al- though the coefficient was positive in the 1 9 6 0 ~ ~ it turned negative in the 1970s and be- came even more so in the 1980s: The greater the contribution of transnational urbanward migration to the urban growth rate, the lower that growth rate. Simultaneously, for high-in- come countries, the coefficients for DOMMIG also reveal a declining influence of domestic rural-to-urban migration on urban growth.

Transnational Urbanward Migration 399
(4 d -
Figure 13. Parameter values for the three inde- pendent variables in the 1830-1980 panel of Table 3. Note the consistency of the DOMMIG and LEVURB coefficients and the cyclicality of these for FORMIC.
2
1
Y o 3
+Dataset 1830-1980 +Dataset18501980 +DatasetIWO-1980
IUI-I150 1861-1870 1881.1890 1901-1910 192-I930 194-1950 1961.1970 1981-I990
Figure 14. Parameter values for the DOMMIG vari- able in all panels of Table 3 are consistent and vary around a value of 1.0.
..m-DataselI8301980 2
I
Y o
8 -1 F P 8 4
fa set 19001980
Data set 1930-1980
Data set 1960-1980 3
4 1841-1830 1861.1870 3881-1890 19J1-IPIO 192-1930 $el-1950 1961-1970 $981-1990
Figure 15. Parameter values for FORMIC in all pan- els of Table 3.
Many high-income countries thus are seeing increasing shares of their urban populations coming from elsewhere. Indeed, transnational urbanward immigration is now the most sig- nificant force in urbanization where the urban growth rate is least.
For both middle- and low-income countries, the opposite is the case: Both transnational and domestic migration drive urban growth, with the roles of the two more or less coequal. The first is, however, a cyclical source and the sec- ond a much steadier contributor to urban growth. Level of urbanization also is important in the low-income cases: Higher urban growth rates are associated with the more urbanized of the low-income countries where, presum- ably, basic urban agglomeration thresholds have been achieved. Interestingly, LEVURB is not significant for the middle-income coun- tries, presumably because some critical level of urban agglomeration has been achieved.
Conclusions
Clearly, transnational urbanward migration is an important force that redistributes urban growth across the globe. The sharply-rising rate of this migration reflects radical increases in the underlying migration propensities: a sev- enfold increase 1900-80; and fourteenfold 1860-1 980. Between 1870-1 920, it constituted only 20 percent of total global migration flows, but since 1950, it has accounted for more than 80 percent, a remarkable shift. Transnational urbanward flows have not been a steady source of urban growth, however. Rather, they have fluctuated with a long-wave rhythmicity that mirrors the movement of successive techno-economic systems from innovation to market saturation. Surges of transnational mi- gration have brought pulses of development to the towns and cities of receiving nations and, by the same token, have been reflected in counterrhythms of reduced growth in sending nations. Significant differences have emerged in the relationship across levels of develop- ment since World War II. Transnational migra- tion remains a potent source of urban growth in a number of low- and middle-income coun- tries, at the expense of other countries at these levels of development. At the high-income end of the scale, however, its role appears to be one of shoring up urbanization in those coun- tries where urban growth has been least, while simultaneously accelerating the globalization of their urban populations.
But such conclusions are preliminary. As many questions as answers arise from initial exploration of new data sets, as they should.

400 Berry
Not the least of these questions relate to the specific mechanisms by which pulsations of transnational urbanward migration arise from long-wave economic rhythms to globalize ur- ban development, how and why the linkages between "core" (receiving) and "peripheral" (sending) nations develop, and how and why the associations now vary with level of eco- nomic development. These and other ques- tions should provide a fertile ground for new rounds of urban research.
Notes
1. Partial support of the data collection and estima- tion process by the National Science Foundation under award SES-8706620 is hereby acknowl- edged.
2. It is, of course, possible for the process to proceed staffelweise: The rural surplus heads for the cities and urbanites emigrate. If urban emigration ex- ceeds rural-to-urban migration, the effect on ur- ban growth is identical to direct emigration of an equal number of the rural surplus.
3. Emigrants may also, of course, settle in rural areas. Rural growth in the receiving nation then com- prises natural increase, foreign immigration, and domestic migration. If natural increase plus foreign immigration exceed the reported population growth rate, the surplus should show up in rural- to-urban migration or in emigration. Thus foreign migration to rural areas may increase the contri- bution of domestic migration to urban growth, a second-order effect.
4. 1 hesitate to provide an extensive exposition of long-wave theory here, since I reviewed the lit- erature at length in my book Long-Wave Rhythms in Economic Development and Political Behavior (1991). One of the reviewers of an earlier draft of the paper criticized me for this, charging that "the
author arrogantly refers us to his book in 1991 for a fuller description of the ideas about long-wave cycles," and demanding that I review the concepts in some detail. Yet I am sure that had I done so in the earlier draft, another reviewer would have charged me with "self-plagiarism." Faced by Hob- son's choice, my solution is to offer a brief pictorial overview of key concepts, drawn from Berry et al. (1993). See also Earle (1992).
5. Results of the earlier runs are available from the author.
References
Berry, B.J.L. 1991. Long-wave rhythms in eco- nomic development and political behavior. Balti- more: johns Hopkins University Press.
waves driven by techno-economic transforma- tions? Evidence for the U.S. and the U.K. Tech- nological Forecasting and Social Change 449 - 25.
Earle, C. 1992. Geographical inquiry and American historical problems. Stanford, CA: Stanford Uni- versity Press.
Ferenczi, I., and Willcox, W.F. 1929. hternational migrations. New York: National Bureau of Eco- nomic Research.
Sayrs, L. 1989. Pooled time series analysis. New- bury Park, CA: Sage Publications.
Thomas, B. 1972. Migration and urban develop- ment. A reappraisal of British and American long cycles. London: Methuen & Co.
Ward, D. 1971. Cities and immigrants. A geography of change in nineteenth-century America. New York: Oxford University Press.
-* , Kim, H.; and Kim, H-M. 1993. Are long
Submitted 9/92, revised 2/93, accepted 3/93.

Transnational Urbanward Migration 401
Table 1 . Average Annual Percentage Change in Urban Population Due to Foreign Migration by Decade
C o u n t r y
A u s t r i a Denmark F r a n c e Norway Sweden U.S.A.
Be1 g i um Canada Germany I t a l y J a p a n Netherl a n d s Swi t z e r l and U . K .
- - - - _ - - - - _ _ _ - _ -
C o u n t r y
A u s t r i a Denmark F r a n c e Norway Sweden U.S.A.
Belgium Canada Germany I t a l y J a p a n Netherl a n d s Swi t z e r l and U . K .
B r a z i 1 8ul g a r i a C o s t a R i c a I n d i a New Z e a l a n d S p a i n Venezuel a
A r g e n t i n a A u s t r a l i a Chile C z e c h o s l o v a k i a Egypt Hungary I r e 1 and Mexico P a k i s t a n Pol and P o r t u g a l P u e r t o Rico
_ - - - _ _ - - - _ _ _ - _ _ -
_ - _ _ _ _ - - _ _ - _ _ _ _ _
- - - - - - - - - - - - - _ - -
1830s 1840s
0 .52 0.11 - 0 . 1 3 -0 .10
0.12 -0.07 0.02 0.02
- 0 . 0 3 -0 .14 0.47 1.18 . - _ - - - - - - - _ - - _ _ - _ - -
1 8 5 0 s 1860s 1870s 1880s 1890s
0.07 0.10 0 .21
-0.27 - 0 . 0 8
1.46
-0.06
-0 .24
- - _ - - - _ - - _
n a na na na na na
0 .01 0.07 -0 .06 -0.27
-0 .22 na -0 .46 - 0 . 2 3
-0.42 0.16 0.00 o . i i -0 .16 - 0 . 7 5 - 1 . 0 4 -0 .29 -0.45 -0 .39 -0.95 - 0 . 5 1 0 .86 0.73
-0.27 0.04 na -0 .19
-0 .20 -0.23 - 0 . 0 1 -0 .15
na na na na na - 0 . 1 3
- 0 . 5 1 -0.36
1 . 3 1 0 .66
-0 .02 0.01 -0 .42 na -0 .37 -0 .03 - 0 . 3 6 -0 .36 0.06 -0 .18
-0 .20 -0 .27 -0 .43 0 . 3 1 -0.46 -0 .18
- - - _ - _ _ - - _ _ - _ _ _ _
1900s 1910s 1920s
na na na -0 .27 0 .55 0 .00 0.05 0.24 0.50
-0 .70 -0.07 -0 .28 - 0 . 5 1 na na 0 . 9 6 0.27 0.27
0.01 -0 .04 na 1.78 0.48 0.29
-1 .53 -0.07 -0 .03 - 0 . 4 1 - 0 . 4 1 0 .08 -0 .34 - o . i ? - 0 . 0 7 -0 .16 0.07 0.02
0.17 -0 .24 -0 .18 - 0 . 2 6 - 1 . 1 6 - 1 . 1 2
2.22 2.22 0.47 -0.36 0.20 0 .29 0.06 -0.26 -0 .42
-0 .11 -0 .17 0.02 na 0.39 0.70
-0 .23 0.04 0.00 na -0 .02 0 .03
_ _ _ _ _ _ _ _ _ _ _ _ _ _ _ - - _ _ _ - - - - -
1930s 1940s 1950s
na -0 .10 -0.23 0.09 -0 .06 -0 .12
-0 .40 -0.05 0.45 0 . 0 8 -0 .19 -0 .06
- 0 . 0 3 0.14 0.20 -0.09 0.14 0.24
0.08 0.07 0.07 -0 .09 0.49 0 .91 0.13 na na
- 0 . 1 3 - 0 . 3 1 -0 .02
0 .01 0.15
na - 0 . 1 8 -0 .90
0.20 0.15 0.28 0 .01
0 .35 0.09
- - - - - -
_ - _ - - -
-0 .25 - 0 . 1 6 1 . 2 5 -0 .08
-0.34 -0.19 0.35 1.01
-0.07 - 0 . 0 1
0.02 0.25 0.27 -0.49
na -0 .12 0.64 -0.02 0.57 0.49
-0 .09 -0.33 0.01 0.00
0 . 3 1 0.45 1.33 0 .89
_ - _ _ - _ _ - _ - - _ _ - - _ _ _ -
- - - _ - _ - - - - - - - - - - - - -
0 .79 -0.44 0.38 . . . .
- 1 .69 -0.78 0.09 -0.87 0.27 1 . 2 1 0.02 -0.57 - 0 . 1 3
- 0 . 7 1 -0 .90 - 1 . 4 6 na 0.19 -0 .32
0 .59 0.72 2.74 -0.03 -0 .80 - 0 . 1 0 -0 .36 -0 .17 -0 .59 - 0 . 0 6 -1.58 - 2 . 3 1

402 Berry
Table 1 (continued)
C o u n t r y
A u s t r i a Denmark F r a n c e Norway Sweden U.S.A.
Be1 g i um Canada I t a l y J a p a n Nether1 a n d s Swi t zer l a n d U . K .
B r a z i 1 Bul g a r i a C o s t a R i c a I n d i a New Z e a l a n d S p a i n V e n e z u e l a
A r g e n t i n a A u s t r a l i a Chile C z e c h o s l o v a k i a
Hungary I r e 1 and Mexico P a k i s t a n Pol and P o r t u g a l P u e r t o Rico
A f g h a n i s t a n A l b a n i a A1 g e r i a Angola Bahamas Bang1 a d e s h Benin Botswana B r u n e i B u r k i n a F a s o Burundi Cameroon Cen. A f r i c a Chad China Col ombi a Comoros I s l . Congo Cape V e r d e Cyprus Dominican R . Ecuador El S a l v a d o r Eq. Guinea Fin1 and Gabon Gambia E . Germany W . Germany Ghana G r e e c e Guatemala
- - - - - - - - - - - - - - - _ -
- - - - - - - - - - - _ - - _ - -
- _ _ - - _ _ - _ - - - - - - - _
Egypt
- _ - _ _ _ - - - - - - _ - _ _ -
-
1960s 1970s
0.10 0.16 0 .04 0.08 0 .48 0.27
- 0 . 0 3 0.22 0 .24 0.19 0.18 0.47
2 . 5 2 -0 .09 -2 .52 -0 .77
2.12 - 1 . 2 3
0.42 -6 .96
1 .79 - 0 . 2 1 - 1 . 7 3
2 . 7 1 1 . 3 6 1 . 9 0 0.77 0 . 1 5 1 . 3 6 1 .72 0 .18
-0 .61 -1.13 - 0 . 0 8 - 0 . 1 4 - 0 . 2 1 - 0 . 7 4
9.85 5 .74
- 0 . 0 4 0 . 3 7 2.99
- 0 . 6 4 - 7 . 9 7
-4 .83 -0 .22 - 0 . 3 0
1.26 -0 .06 -0 .33 -1.29
3.28 0.69
-1 .40 - 1 . 7 1
0.59 2.33
-0 .16 0.32
-0 .52 2.96 0.11
-1.70 -0 .88
0 .58 - 0 . 9 0
na -0 .48
0 .00 0.15 0.23
-0 .09 0.34 2.37 0.43
-14.32
C o u n t r y
Guinea Guinea-BS Guyana H a i t i Honduras Hong Kong I c e 1 and I n d o n e s i a I r a n I r a q I s r a e l I v o r y C o a s t J a m a i c a J o r d a n Kenya N . Korea S . Korea Kuwait Lebanon L e s o t h o L i b e r i a Libya Luxembourg Madagascar Ma1 awi Ma1 a y s i a Ma1 i M a u r i t a n i a M a u r i t i u s Mongol i a Morocco Mozambique Nepal N i c a r a g u a N i g e r N i g e r i a Panama P a r a g u a y P e r u P h i l i p p i n e s Reunion Romania Rwanda Samoa S a u d i A r a b i a S e n e g a l S e y c h e l 1 es S i e r r a Leone Soma1 i a S o u t h A f r i c a S o v i e t Union S r i Lanka Sudan Swazi 1 and Taiwan T a n z a n i a T h a i 1 and Togo T r i n i d a d & T. T u n i s i a T u r k e y Uganda Yemen Y u g o s l a v i a Z a i r e Zambia Zimbabwe
1960s 1970s
0 .61 - 1 . 3 0 - 1 . 8 1
na -2.35
0 .17 -0 .43 -0 .68 -0 .54
2 .20 1.68 3.08
-0 .40 -0 .40 4 . 1 1
-0 .12 -0 .18
6.39 -5 .59
1.77 0.23
-1.02 0 .47 0.09
-0.34 1 .21
-0 .30 -1.06 -0.45 -0 .38 - 0 . 8 4 3 .54
- 0 . 0 1 -1.12
1.80 - 0 . 0 2 - 0 . 4 7 -0 .78
0.75 1.04
-0 .36 - 0 . 0 1
0 .11 0 .02
-0 .04 -1 .08 -0 .43 -0.67
0.26 2.96 0.11
-0.26 -1.27 7 .41 1.03
-0.10 - 0 . 1 1 0.45
-4.37 -2 .00 -0.15
2 .31 -2 .84 -0 .13
1.72 -0 .01
2.56
1 .07 5.92 0 .04
- 1 . 6 9 1 .94 1 .08
-0 .29 0.03
- 1 . 4 8 2.72 0.47 3.29
- 0 . 2 7 - 5 . 2 1 4 .58 0.10
-0 .74 3 .43
- 0 . 2 6 2.58 0.57 2.86 0.81
-0 .42 - 0 . 5 3
0 . 1 1 0 . 8 1 0.32
- 0 . 4 7 -0 .14 - 0 . 7 6 3 .52 0.59
na - 0 . 8 4
0 . 6 1 - 0 . 3 6 -0 .85 -1 .92 0.27
-0 .88 - 0 . 1 1
1.09 -1 .00 2.08 3.77
-0 .52 0.46
-0 .36 2.73 0 . 1 3
-0 .56 1 . 1 2 0 . 2 8
-0 .30 0.89 0.33
- 0 . 4 4 0.39
- 0 . 8 7 - 0 . 1 2 -0 .29 -0 .25 - 0 . 0 2 -1 .06 - 0 . 2 3 - 0 . 2 5
Transnational U r b a n w a r d Migra t ion 403
Table 2. Net Urbanward Immigration Totals by Decade Unit: Thousands (1,000)
C o u n t r y I 1830s 1840s 1850s 1860s 1870s 1880s 1890s
A u s t r i a Denmark France Norway Sweden U.S .A .
Be1 g i urn Canada Germany I t a l y Japan N e t h e r l ands Swi t z e r l and U.K.
- _ _ - _ _ - - _ _ - - _ _ _
13
C o u n t r y I 1900s 1910s 1920s I 1930s 1940s 1950s
A u s t r i a Denmark France Norway Sweden U.S.A.
Be1 g i urn Canada
- - _ - - _ - - - - - - - - - -
Germany I t a l y Japan N e t h e r l ands S w i t z e r l a n d U.K . - - - - - - - - - - - - _ - - - B r a z i 1 8ul g a r i a Costa R ica I n d i a New Zealand S p a i n Venezuela
A r a e n t i na - - - - - - - - - - - _ _ - - -
A u i t r a l i a C h i l e Czechos lovak ia Egypt Hungary I r e 1 and Mexico P a k i s t a n Pol and P o r t u g a l P u e r t o R i c o
6 1 68
25 7
594 2592 194 1 18 5 1
67 235 168
282
74 1 5 1 275
6
656 85 16
689
5

404 Berry
Table 2 (continued)
C o u n t r y
A u s t r i a Denmark F r a n c e Norway Sweden U.S.A.
Be1 g i um C a n a d a I t a l y J a p a n N e t h e r 1 a n d s Swi t z e r l a n d U . K .
B r a z i l Bul g a r i a C o s t a R i c a I n d i a New Z e a l a n d S p a i n V e n e z u e l a
A r g e n t i n a A u s t r a l i a C h i l e C z e c h o s l o v a k i a
H u n g a r y I r e 1 a n d Mexico P a k i s t a n Pol a n d P o r t u g a l P u e r t o Rico
A f g h a n i s t a n A1 b a n i a A1 g e r i a Angol a Ba h ama s Bang1 a d e s h B e n i n B o t s w a n a B r u n e i B u r k i n a F a s o B u r u n d i Cameroon C e n . A f r i c a Chad C h i n a Col ombi a Comoros I s l . Congo C a p e V e r d e C y p r u s D o m i n i c a n R . E c u a d o r E l S a l v a d o r Eq. G u i n e a F i n 1 a n d Gabon Gambia E . Germany W . Germany Ghana Greece G u a t e m a l a
_ _ _ _ _ _ _ _ _ _ _ _ _ _ _ _ _
_ _ - - _ - - - _ - - - - - - - -
- _ _ - _ _ _ _ _ - - _ _ _ _ _ _
E g y p t
_ _ _ _ _ - - _ - - - _ - - _ - _
1960s 1970s
116 17 397
193
382 752 416
279
390 473 10 9
45
1583 12
98
- - _ - _ _ _ - - - _ _ - _ _ _ 227
107 12
8 16
6 7
187 105 38 93 3 1
5503 4721 498
3 6 55 25
709
79 35 12 6
1834 1680
158
C o u n t r y
G u i n e a G u i n e a - B i s s a u Guyana H a i t i Honduras Hong Kong I c e l a n d I n d o n e s i a I r a n I r a q I s r a e l I v o r y C o a s t J a m a i c a J o r d a n Kenya N . Korea S . Korea Kuwai t Lebanon L e s o t h o L i b e r i a L i b y a Luxembourg M a d a g a s c a r Ma1 awi Ma1 a y s i a Ma1 i M a u r i t a n i a M a u r i t i u s Mongol i a Morocco Mozambique Nepal N i c a r a g u a N i g e r N i g e r i a Panama P a r a g u a y Peru P h i 1 i p p i n e s Reunion Romania Rwanda Samoa S a u d i A r a b i a S e n e g a l S e y c h e l l es S i e r r a Leone Soma1 i a S o u t h A f r i c a S o v i e t Union S r i Lanka Sudan Swazi1 and Taiwan T a n z a n i a T h a i l a n d Toao T r i n i d a d & T. Tuni s i a T u r k e y Uganda Yemen Y u g o s l a v i a Z a i r e Zambia Zimbabwe
_ _ _ _ - _ _ _ _ _ _ _ ~ _
1960s
15
1
85
828 316 448
160
3 4
10 15
200 17
5
11
86
3 1 260
317 840
7 1
5 2212 1104
3
1 6
6
69
460
110
1970s
58 52 1
84 377
1118 157 333
53
212
4 17 16 19
3 1 28
2
11
165 2
412 8
546
310
10
535 257
9 102
2837 1747
175 1
26 152
18

Transnational Urbanward Migration 405
Table 3. Fixed-Effect Models of the Contributions of Foreign and Domestic Migration to Urban Growth by Decade, Controlling for Level of Urbanization, for Five Panels of Countries
D a t a Se ts 1830-1980 1850-1980 1900-1980 1930-1980 1960-1980
V a r i a b l e s C o e f f . ( S t . E r r o r ) : oe f f . (%.Er ro r ) Coef f . ( S t . E r r o r ) : oe f f . ( S t . E r r o r )
0.9803 (0.1091) ___.______
Coef f . ( S t . E r r o r )
0.0217 (0.0032) ___- 0.0188 (0.0038) 1.6837 (0.9186) 2.5078 (1.0428) 0.8364 (0.78411 0.7409 (0.6222) 0.1047 (0.8834) -1.1213 (0.4554) -0.3128 (0.9191) 0.0713 (0.5828) 1.3325 (3.7200) 0.0649 (2.3841) -3.3265 (5.3766) 2.0645 (1.3313) 1.1437 (1.5869) -2.1833 (2.5844) -2.7721 (2.2109) 1.0250 (0.2486) 0.6827 (0.3207) 1.2411 (0.5357) 1.0970 (0.3574) 1.0130 (0.2550) 0.6394 (0.3197) 1.0449 (0.6978) 1.4535 (0.5511) 0.5141 (0.8905) 1.6384 (1.4856) 1.5000 (0.3672) 1.1005 (0.2140) 1.3102 (0.1948) 0.7177 (0.1996) 1.1003 (0.1301) -0.0602 (0.0280) -0.0328 (0.0326) -0.0578 (0.0373) -0.0488 (0.0283) -0,0409 (0.0205) -0,0336 (0.0239) -0,0329 (0.0273) -0,0450 (0.0167) -0,0309 (0.0189) -0.0466 (0.0217) -0.0438 (0.0126) -0,0320 (0.0105) -0,0297 (0.0087) -0.0173 (0.0094) -0.0174 (0.0080)
~
INTERCEPT T1840*TRNMIG
0.0238 (0.0034) 0.0138 (0.0038)
0.7973 (0.7800) 0.4739 (0.6030) -0.2475 (0.7942) -1.0838 (0.4280) 0.7010 (0.3787) 0.1272 (0.5457) 0.5014 (0.5981) 0.6294 (0.1919) 0.9624 (0.6139) 1.5764 (0.6708) 0.6491 (0.6662) 0.4073 (0.8628) -0.5907 (0.1644)
0.7354 (0.5694) 1.0387 (0.3262) -0.1411 (1.00791 1.1165 (1.1394) 1.0324 (0.6253) 0.5232 (0.6375) 1.2797 (0.8590) 0.9816 (0.7647)
0.9019 (0.3649) 0.7527 (0.3077) 0.9149 (0.3092) 1.1320 (0.3146) 0.7819 (0.6220)
1.0332 (0.1188) -0.0676 (0.0186)
1.0768 (0.4485) 1.0011 (0.28791 0.8153 (0.1654) 0.4771 (0.1935) 1.0677 (0.1394) 1.0745 (0.2884) 0.9275 (0.1933) 1.0308 10.1050) 1.1388 (0.0898) 1.1574 (0.1664) 1.3554 (0.1441) 0.9221 (0.1673) 1.1736 (0.1167)
0.6569 (0.1495) 0.8139 (0.1046) 0.9949 (0.1144) 1.0685 (0.2019) 1.1600 (0.1224) 1.1348 (0.1302) 1.3111 (0.1964) 1.1762 (0.1226)
1.1293 (0.0980) 1.0919 (0.1120) 1.0927 (0.1084) 1.2013 (0.1677) 1.1326 (0.1262)
-0,0796 (0.0158) 0.9704 (0.1026)
-0.0562 (0.0248) -0.0474 (0.0170) -0,0390 (0.0115) -0.0346 (0.0112) -0,0369 (0.0095) -0.0404 (0.0084) -0,0398 (0.0079) -0.0416 (0.0069) -0,0399 (0.0065) -0.0353 (0.0071) -0.0352 (0.0063) -0.0291 (0.0055) -0.0300 (0.0050)
N-162 Adj. R-sq- 0.8628
-0.0295 (0.0074) -0,0306 (0.0070) -0,0360 (0.0065) -0.0343 (0.0062) -0,0278 (0.0063) -0.0246 (0.0060) -0.0282 (0.0053) -0.0291 (0.0047)
-0.0124 (0.0052) -0.0057 (0.0052) -0.0074 (0.0047) -0.0112 (0.0045) -0.0128 (0.0041)
1.1099 (0.1330) -0.2043 (0.0515) ~ . _ _ _ _ _ _ _ _ _ _
N-356 Adj. R-sq- 0.7585
# o f obs.& Adj. R - s q
N-85 Adj . R-sq- 0.8648
N-170 Adj. R-sq- 0.8376
N-150 Adj. R-sq- 0.8627
Table 4. Fixed-Effect Models of the Contributions of Foreign and Domestic Migration to Urban Growth, 1960-80, by Level of Economic Development
Data Se ts A1 1 C o u n t r i e s
Low Income C o u n t r i e s
M i d d l e Income C o u n t r i e s
V a r i a b l e s C o e f f . ( S t . E r r o r ) Coe f f . ( S t . E r r o r
INTERCEPT 0.0054 10.01351 -0.0249 1.1116
-0.3825 -1.0718
1.0134 0.9352 0.8411 0.0545 0.0501 0.0437 1 .-
0.0101 (0.0067) 1.0472 10.0904) 1.0134 (0.0861) 1.3142 (0.0943) 1.0998 (0.0248) 1.2826 (0.0341) 1.2597 (0.0234) 0.0981 (0.0285) 0.0596 (0.0250) 0.0451 (0.0192)
Adj . R-sq- 0.9881 N- 148
0.0107 1.1208 0.9319 1.1330 1.8004 1.3051 1.4734 0.0107 0.0221 0.0122
(0.0162) (0.0901) (0.1402) (0.0821) (0.0623) (0.0916) (0.1310) (0.0512) (0.0453) (0.0394)
(0 .0147) (0 .1011) (0 .2689) (0 .1587) (0 .1125) (0 .0381) (0 .1590) ( 0 .O226) (0 .0210) (0 .0204)
TI~~O*?RNM IG T1970*TRNMIG T1980*TRNMI G T1960*OOMMIG T1970*OOMMIG T1980*OOMMIG T1960* LEVU RB T1970'LEVURB T1980*LEVURB
, . . . - . . , i ; 0 7 3 4 (0.0661) 1.1178 (0.0699) 1.1575 (0.05321 1.4293 (0.0396) 1.3628 (0.0413) 1.3865 10.0486) 0.0400 (0.0295) 0.0258 (0.0266) 0.0163 (0.0229)
# o f obs. & Ad j . R-sq
N- 356 Ad j . R-sq- 0.9700
N- 137 N- 7 1 A d j . R-sq-0.9835 I Ad j . R-sq-0.9941
Related Documents