Transmission from the dominant input shapes the stereotypic ratio of photoreceptor inputs onto horizontal cells Takeshi Yoshimatsu 1 , Philip R. Williams 1,2 , Florence D. D’Orazi 1 , Sachihiro C. Suzuki 1 , James M. Fadool 3 , W. Ted Allison 4 , Pamela A. Raymond 5 , and Rachel O. Wong 1,* 1 Department of Biological Structure, University of Washington, 1959 NE Pacific Street, Seattle, Washington 98195, USA 2 Institute of Neuronal Cell Biology, Technische Universität München, Biedersteiner Street 29, D-80802 München, Germany 3 Department of Biological Science and Program in Neuroscience, The Florida State University, 600 W College Avenue, Tallahassee, Florida 32306, USA 4 Departments of Biological Sciences and Medical Genetics, University of Alberta, CW 405, Edmonton, Alberta T6G 2E9, Canada 5 Department of Molecular, Cellular, and Developmental Biology, University of Michigan, 830 N University Avenue, Ann Arbor, Michigan 48109, USA Abstract Many neurons receive synapses in stereotypic proportions from converging but functionally distinct afferents. However, developmental mechanisms regulating synaptic convergence are not well understood. Here we describe a heterotypic mechanism by which one afferent controls synaptogenesis of another afferent, but not vice-versa. Like other CNS circuits, zebrafish retinal H3 horizontal cells undergo an initial period of remodeling, establishing synapses with UV and blue cones while eliminating red and green cone contacts. As development progresses, the horizontal cells selectively synapse with UV cones to generate a 5:1 UV-to-blue cone synapse ratio. Blue cone synaptogenesis increases in mutants lacking UV cones, and when transmitter release or visual stimulation of UV cones is perturbed. Connectivity is unaltered when blue cone transmission is suppressed. Moreover, there is no homotypic regulation of cone synaptogenesis by neurotransmission. Thus, biased connectivity in this circuit is established by an unusual activity- dependent, unidirectional control of synaptogenesis exerted by the dominant input. * Corresponding author, [email protected]. Author contributions T.Y., P.R.W., F.D.D. and R.O.W. conceived the study. T.Y., P.R.W. and F.D.D. performed experiments. T.Y. generated Tg(sws1:TeNT) and Tg(sws2:TeNT) transgenic animals. W.T.A. and P.A.R. provided Tg(sws2:mCherry) transgenic fish and J.M.F. provided lor mutant fish. S.C.S. designed the thrb morpholino. T.Y., P.R.W., F.D.D. and R.O.W. wrote the paper and all authors commented on the manuscript. Competing financial interests The authors declared no competing financial interest NIH Public Access Author Manuscript Nat Commun. Author manuscript; available in PMC 2014 November 15. Published in final edited form as: Nat Commun. ; 5: 3699. doi:10.1038/ncomms4699. NIH-PA Author Manuscript NIH-PA Author Manuscript NIH-PA Author Manuscript

Welcome message from author
This document is posted to help you gain knowledge. Please leave a comment to let me know what you think about it! Share it to your friends and learn new things together.
Transcript
Transmission from the dominant input shapes the stereotypicratio of photoreceptor inputs onto horizontal cells
Takeshi Yoshimatsu1, Philip R. Williams1,2, Florence D. D’Orazi1, Sachihiro C. Suzuki1,James M. Fadool3, W. Ted Allison4, Pamela A. Raymond5, and Rachel O. Wong1,*
1Department of Biological Structure, University of Washington, 1959 NE Pacific Street, Seattle,Washington 98195, USA
2Institute of Neuronal Cell Biology, Technische Universität München, Biedersteiner Street 29,D-80802 München, Germany
3Department of Biological Science and Program in Neuroscience, The Florida State University,600 W College Avenue, Tallahassee, Florida 32306, USA
4Departments of Biological Sciences and Medical Genetics, University of Alberta, CW 405,Edmonton, Alberta T6G 2E9, Canada
5Department of Molecular, Cellular, and Developmental Biology, University of Michigan, 830 NUniversity Avenue, Ann Arbor, Michigan 48109, USA
Abstract
Many neurons receive synapses in stereotypic proportions from converging but functionally
distinct afferents. However, developmental mechanisms regulating synaptic convergence are not
well understood. Here we describe a heterotypic mechanism by which one afferent controls
synaptogenesis of another afferent, but not vice-versa. Like other CNS circuits, zebrafish retinal
H3 horizontal cells undergo an initial period of remodeling, establishing synapses with UV and
blue cones while eliminating red and green cone contacts. As development progresses, the
horizontal cells selectively synapse with UV cones to generate a 5:1 UV-to-blue cone synapse
ratio. Blue cone synaptogenesis increases in mutants lacking UV cones, and when transmitter
release or visual stimulation of UV cones is perturbed. Connectivity is unaltered when blue cone
transmission is suppressed. Moreover, there is no homotypic regulation of cone synaptogenesis by
neurotransmission. Thus, biased connectivity in this circuit is established by an unusual activity-
dependent, unidirectional control of synaptogenesis exerted by the dominant input.
*Corresponding author, [email protected].
Author contributionsT.Y., P.R.W., F.D.D. and R.O.W. conceived the study. T.Y., P.R.W. and F.D.D. performed experiments. T.Y. generatedTg(sws1:TeNT) and Tg(sws2:TeNT) transgenic animals. W.T.A. and P.A.R. provided Tg(sws2:mCherry) transgenic fish and J.M.F.provided lor mutant fish. S.C.S. designed the thrb morpholino. T.Y., P.R.W., F.D.D. and R.O.W. wrote the paper and all authorscommented on the manuscript.
Competing financial interestsThe authors declared no competing financial interest
NIH Public AccessAuthor ManuscriptNat Commun. Author manuscript; available in PMC 2014 November 15.
Published in final edited form as:Nat Commun. ; 5: 3699. doi:10.1038/ncomms4699.
NIH
-PA
Author M
anuscriptN
IH-P
A A
uthor Manuscript
NIH
-PA
Author M
anuscript

INTRODUCTION
The output of a neuron is shaped by many factors, including the properties and stereotypic
patterning of the synaptic connections it receives from a diversity of cell types. Our
understanding of the developmental mechanisms responsible for generating proper wiring
patterns have largely come from circuits where distinct afferent types innervate separate
parts of the dendritic arbor1,2. For example, hippocampal CA3 neurons are contacted by
large mossy fibers on their apical dendrites, proximal to the cell body, whereas entorhinal
cortical projections contact the distal dendrites3. A number of molecules targeting axons to
the appropriate compartment of the postsynaptic cell have now been identified4,5,6. By
contrast, we have a much more limited understanding of the mechanisms that generate
stereotypic patterns of synaptic convergence in circuits where functionally distinct inputs
intermingle on the dendritic arbor7. Here, we investigated the cellular interactions that
control the connectivity of two functionally disparate presynaptic cell types whose
connections overlap on the dendritic arbor of the postsynaptic cell.
Like other parts of the nervous system, circuits in the vertebrate retina demonstrate a great
deal of synaptic convergence and divergence8. Previous ultrastructural reconstructions9,10
and recent light microscopy approaches11,12 suggest that retinal neurons generally make a
stereotypic number of synapses with each of their input types yet the mechanisms generating
these patterns are not known. Complete circuit reconstruction is particularly tractable in the
relatively small zebrafish retina, and many transgenic lines suitable for in vivo
reconstruction are available. We focused on a simple but essential circuit in the outer retina,
comprising cone photoreceptors and horizontal cells (HC), to gain an understanding of the
cellular interactions responsible for setting up the appropriate synapse ratio of converging
inputs.
There are four types of cones in the zebrafish retina13,14, each with a peak sensitivity to
either ultraviolet (UV), short (blue), medium (green) or long (red) wavelength light. In adult
zebrafish, there are three types of cone HCs, classified according to their morphology and
cone connectivity patterns15,16. H1 HCs contact red, green and blue cones whereas H2 HCs
contact blue, green and UV cones. H1 and H2 HCs cannot be readily distinguished by their
morphology. In contrast, H3 HCs can be recognized morphologically, and their circuitry is
relatively simple because they contact only two cone types, UV and blue cones16,17. We
show here that UV and blue cones form a stereotypic synaptic convergence ratio of about
5:1 with the H3 HCs. To determine whether the synaptic convergence ratio is dictated by the
ratio of UV:blue cone number within the dendritic field of the H3 HC, we altered UV cone
numbers prior to synaptogenesis with HCs, using mutant fish and morpholino approaches.
To explore the role of synaptic activity in establishing the UV:blue cone synapse ratio, we
generated transgenic animals in which UV or blue cone transmitter release is selectively
perturbed. Because H3 HCs connect with cones largely after cone opsins are expressed, we
also investigated the role of sensory experience in defining the cone connectivity pattern of
H3 HCs. Together, our observations reveal a previously unknown in vivo cellular
mechanism, by which one input type uses an activity-dependent process to control the
number of synapses the other input type makes with their common postsynaptic partner.
Yoshimatsu et al. Page 2
Nat Commun. Author manuscript; available in PMC 2014 November 15.
NIH
-PA
Author M
anuscriptN
IH-P
A A
uthor Manuscript
NIH
-PA
Author M
anuscript

RESULTS
Morphological identification of H3 HCs during development
HCs in zebrafish larval retina were labeled by expression of fluorescent protein under the
Cx55.5 promoter18 (Fig. 1a–c). As in adult zebrafish15, H1 and H2 (H1/2) cone HCs in
larvae could not be readily distinguished from each other by their dendritic morphology
alone, whereas H1/2 and H3 HCs appeared morphologically distinct (Fig. 1a–c). We found
that shortly after HC genesis, H3 HCs showed lower densities of dendritic tips and larger
dendritic field sizes than H1/2 HCs (Fig. 1d). These morphological differences persisted in
older larvae (Supplementary Fig. 1). As in adult zebrafish, we observed that larval HCs
made invaginating dendritic contacts with cone photoreceptor axonal terminals, or pedicles.
The dendritic tips of the HCs were apposed to presynaptic ribbon structures (Fig. 1e), and
contained ionotropic glutamate receptors (Fig. 1f) as previously demonstrated19. We define
here an HC-cone synapse as the invagination of a single dendritic tip within an individual
cone pedicle.
H3 HCs preferentially contact UV and blue cones
Adult H3 HCs only contact UV and blue cones16, but whether H3 HCs also demonstrate this
wiring specificity during development is not known. In order to obtain the connectivity
patterns of developing H3 HCs, we coinjected pCx55.5:Gal4 and pUAS:MXFP plasmids
into double transgenic fish in which UV cones (sws1:GFP) and blue cones (sws2:mCherry)
express different color fluorescent proteins (FP) under cone type-specific promoters. We
obtained confocal reconstructions of H3 HCs at various larval ages, from 3.5 days
postfertilization (dpf), around the onset of synaptogenesis in the outer plexiform layer
(OPL)20, to 10.5 dpf, when visually guided behavior is well-established21 (Fig. 2a). At all
ages studied, H3 HCs contacted mostly UV and blue cones (Fig. 2b). On average, the
number of UV cones contacted by an H3 HC increased with age (p<0.01; one-way
ANOVA), whereas the number of blue cone synapses remained constant across time points
(p>0.05; one-way ANOVA) (Fig. 2b).
We noticed that some dendritic tips were not apposed to the fluorescently labeled UV cones
or blue cones, especially at 3.5 dpf (Fig. 2, undefined tips). To determine whether
fluorescent protein is not yet expressed by all UV or blue cones at early ages, we performed
immunostaining with anti-UV- or blue-opsin antibodies. We found that at 3.5 dpf, 19 ± 3%
(n=4 eyes) of UV-opsin-positive cones lacked sws1:GFP expression, but by 10 dpf, 99 ±
0.3% (n=4 eyes) were visualized by GFP expression (Supplementary Fig. 2a,b). All blue-
opsin-positive cones showed sws2:mCherry expression at all ages examined (Supplementary
Fig. 2a,b). Because of the incomplete transgene expression at early ages, the number of UV
cones contacted by immature H3 HCs is likely to be greater than that quantified based on
sws1:GFP labeling alone. We adjusted our measurements to account for the fraction of
unlabeled UV cones, and found that the estimated number of unlabeled UV cone contacts
(1.68 ± 0.31) was still less than the average number of ‘undefined’ tips (5.83 ± 0.87) at 3.5
dpf (Supplementary Fig. 2c and Fig. 2b). We wondered whether some of the undefined tips
were contacting red and green cones, and to test this we performed immunostaining with the
Yoshimatsu et al. Page 3
Nat Commun. Author manuscript; available in PMC 2014 November 15.
NIH
-PA
Author M
anuscriptN
IH-P
A A
uthor Manuscript
NIH
-PA
Author M
anuscript

zpr-1 antibody that labels both these cone types22. Indeed we found that H3 HCs transiently
contacted a few red and green cones before 5.5 dpf (Supplementary Fig. 3).
Taken together, our data reveal two key characteristics of the development of cone synaptic
convergence onto H3 HCs. First, elimination of red and green cone contacts contributes to
the H3 HC’s mature connectivity pattern, which comprises synapses with only UV and blue
cones. Second, the UV:blue cone synapse ratio increases with maturation.
Selective synaptogenesis underlies UV cone dominance
The synaptic bias towards UV cones may be a consequence of a greater abundance of UV
cones compared with blue cones in larval zebrafish23. We counted the number of UV cones
and blue cones present within the retina from 3.5 to 10 dpf (Supplementary Fig. 2a,b), and
compared these counts with the ratio of UV:blue cones that the H3 HC contacted (Fig. 3a).
We found that the ratio of UV:blue cone synapses exceeds the relative abundance of UV and
blue cones, suggesting that cone type ‘availability’ does not fully account for the biased
connectivity with UV cones.
How is the bias towards UV cones established over time? The dendritic field size of H3 HCs
increases with age (p<0.02; one-way ANOVA) (Fig. 3b), suggesting that H3 HCs are likely
to add synapses onto the distal dendrites between 3.5 and 10 dpf. To further assess whether
the growing H3 HC arbor preferentially contacts UV cones, we compared the location of
UV and blue cone contacts on the dendritic arbor of H3 HCs at different ages, as illustrated
in Figure 3c. We overlaid a circle with an area equivalent to the average dendritic field area
of H3 HC dendritic arbors at 3.5 dpf, and compared the average number of UV and blue
cone contacts within and outside this circle across ages. This circle approximates the arbor
of the cell at the earliest stage examined (3.5 dpf), whereas dendrites outside the circle are
likely to be added subsequently. H3 HCs added UV cone contacts within the circle up to 5.5
dpf, contacting nearly all of the nearby UV cones. There was no further increase in UV
contacts within this circle up to 10 dpf. However, H3 HCs appeared to add UV cone
contacts continuously to the peripheral arbor from 3.5 to 10 dpf. In contrast to UV cones,
there was no addition of blue cone contacts after 5.5 dpf to the peripheral arbor, suggesting
that H3 HCs only form contacts with blue cones early in circuit formation. In fact, when we
compared the contacts on the same cell a day apart (96 and 120 hpf), we found that UV
contacts were added only to the distal dendrites (n=3; Supplementary Fig. 4). Thus,
preferential addition of UV cones to the peripheral arbor as the dendrites grow during later
stages of development underlies the progressive increase in the UV:blue cone synapse ratio.
The relatively constant number of blue cones contacted across ages may result from H3 HCs
failing to attempt to form new synapses with this cone type after 3.5 dpf. Alternatively, H3
HCs may actively add contacts with blue cones after 3.5 dpf but eliminate these contacts. To
distinguish between these possibilities, we performed timelapse imaging of H3 HCs in the
background of labeled UV cones (Tg(sws1:GFP) or blue cones (Tg(sws2:GFP) for 24 hours,
beginning at 3.5 dpf (Fig. 4). Throughout the period of imaging, UV cone contacts were
both added and eliminated (Fig. 4a and c) but there was a net increase in the number of UV
cones contacted by the end of the recording period (Fig. 4d). In contrast, H3 HCs only
occasionally added or eliminated blue cone contacts (Fig. 4b and c), resulting in almost no
Yoshimatsu et al. Page 4
Nat Commun. Author manuscript; available in PMC 2014 November 15.
NIH
-PA
Author M
anuscriptN
IH-P
A A
uthor Manuscript
NIH
-PA
Author M
anuscript

net change in synapses with blue cones within this time period (Fig. 4d). In summary, within
the 24 hour period of recording starting at 3.5 dpf, H3 HCs gained UV cone synapses, but no
or relatively few blue cone contacts. Therefore, H3 HCs fail to increase their number of
connections with blue cones over time because they do not actively engage blue cones in
synaptogenesis after 3.5 dpf.
H3 HCs increase connections with excess UV cones
To gain insight into the cellular interactions that regulate the balance of inputs amongst
different cone types onto the H3 HC, we first asked whether increasing the density of UV
cones in the retina affects their connectivity with the H3 HC. We therefore analyzed H3 HC
connectivity in animals in which a morpholino directed against thyroid hormone receptor β2
(thrb morphant) causes a doubling in UV cone density without changing blue cone density24
(Fig. 5a–d). Figure 5e–h shows an example of an H3 HC and its connectivity in the thrb
morphant retina at 5.5 dpf. Compared with controls, H3 HCs in the morphant increased their
total number of dendritic tips, without changing their dendritic field size (Fig. 5 i,j). The
increase in total tip number was driven by an increase in synapses with UV cones (Fig. 5k).
By 10 dpf, morphant H3 HCs contacted the majority of the UV cones within their dendritic
fields, as in wildtype animals (Fig. 5l). Thus, the number of UV cones an H3 HC contacts is
dependent on the number of available UV cones within the cell's vicinity. Despite
significantly increasing their contact with UV cones, morphant H3 HCs contacted the same
number of blue cones as morpholino controls (Fig. 5k). Therefore, during normal
development, H3 HCs do not contact blue cones simply because there are insufficient UV
cones available for attaining a desired total synapse number.
UV cone depletion increases H3 connectivity with blue cones
We next asked whether decreasing UV cone density during development would affect the
H3 HC's connectivity pattern. We crossed the lor mutant, in which the total number of UV
cones in the retina is reduced without changing the total number of blue cones25, into the
background of the double transgenic, Tg(sws1:GFP; sws2:mCherry) (Fig. 6a–d). In the lor
mutant, the few remaining UV cones appear in random patches across the retina (Fig. 6c).
An example of an H3 HC and its connectivity pattern in the mutant at 5.5 dpf is provided in
Figure 6e–h. There were no significant differences in H3 HC dendritic field size between the
mutant and wildtype animals (Fig. 6i). However, H3 HCs increased contact with blue cones
(Fig. 6k), resulting in only a small decrease in their total contact number compared with
controls (Fig. 6j, k). H3 HCs thus contacted a significantly higher fraction of blue cones
within their dendritic fields in the lor mutant (Fig. 6l).
Like in wildtype, H3 HCs in lor contacted nearly 100% of the available UV cones, but each
H3 HC in lor experienced variable densities of UV cones within their dendritic field. In
some cells, the dendritic tips that invaginated UV cones were enlarged (Fig. 6e), whereas in
other cases, H3 HCs projected two tips into the same UV cone (Fig. 7a–c). A plot of the
number of UV cone versus blue cone synapses for individual cells in lor at 5.5 dpf (Fig. 7d)
shows that in lor, there is an inverse relationship between the number of UV cones contacted
and the number of blue cones contacted. Thus, H3 HCs respond to a lack of UV cones by
Yoshimatsu et al. Page 5
Nat Commun. Author manuscript; available in PMC 2014 November 15.
NIH
-PA
Author M
anuscriptN
IH-P
A A
uthor Manuscript
NIH
-PA
Author M
anuscript
modifying their dendritic contact area with available UV cones and by increasing their blue
cone synapse number.
UV cone transmission regulates connections with blue cones
Our finding of a compensatory increase in blue cone contacts in the lor mutant suggests that
the H3 HC’s dominant partner type, UV cones, influence connectivity with the secondary
partner type, blue cones. Is this regulation mediated by transmission from cones? To test this
possibility, we generated transgenic fish in which tetanus toxin fused to cyan fluorescent
protein (TeNT-CFP) is expressed in UV, blue, or both cone types, without changing their
densities (Supplementary Fig. 5a). TeNT perturbs exocytosis26 and thus reduces synaptic
transmission. Figure 8a–l shows an example of an H3 HC and its connectivity pattern at 5.5
dpf from each of the TeNT transgenic lines. Reduction in transmission from UV, blue, or
both cone types did not affect the dendritic field size of H3 HCs relative to controls (Fig.
8m).
However, the number of blue cones contacted by an H3 HC significantly increased when
only UV cone transmission was perturbed (Fig. 8n). This resulted in a reduction in the
UV:blue synapse ratio (Supplementary Fig. 6) and a larger percentage of blue cones within
the field being contacted (Fig. 8o), similar to lor mutants (Fig. 6l). In contrast to lor mutants,
H3 HCs maintained the same number of UV cone connections in sws1:TeNT retina as in
control retina. Suppression of blue cone transmission alone did not alter the number of UV
cone or blue cone contacts (Fig. 8n). Together, these manipulations of neurotransmission
demonstrate that UV cone transmission regulates H3 HC connectivity with blue cones, but
not with the UV cones themselves, and that blue cone transmission is not required for
normal circuit formation. Moreover, in the absence of drive from either of the preferred cone
inputs, H3 HCs do not reach out to zpr-1-immunopositive red or green cones (n=8;
sws1:TeNT, n=5; sws2:TeNT), suggesting that partner choice is not dependent on
neurotransmission from photoreceptors. However, when transmission from both UV and
blue cones is suppressed, H3 HCs do show reduced contact with both cone types (Fig. 8n).
To ascertain whether the effects of UV cone transmission are light-dependent, we designed a
morpholino against UV-opsin (Opn1sw1), rendering UV cones insensitive to UV light but
allowing them to release neurotransmitter. Injection of Opn1sw1 morpholino into single-cell
fertilized eggs abolished all Opn1sws1 immunoreactivity but did not affect UV cone density
(Supplementary Fig. 5b). As in Tg(sws1:TeNT) fish, H3 HCs in the Opn1sw1 morphant
demonstrated an increase in blue cone contact number without changing UV cone
connectivity (Fig. 9), indicating that light-dependent transmission from UV cones normally
modulates synapse number with blue cones.
DISCUSSION
It has long been appreciated that heterosynaptic modifications occur in CNS circuits in
which functional changes in one input affects other inputs sharing the same postsynaptic
cell27,28,29. Most of these past studies have focused on functional plasticity of mature
synapses. Here, we show that in a developing retinal circuit, one input type regulates
synaptogenesis of the other input through an activity-dependent, sensory-drive mechanism
Yoshimatsu et al. Page 6
Nat Commun. Author manuscript; available in PMC 2014 November 15.
NIH
-PA
Author M
anuscriptN
IH-P
A A
uthor Manuscript
NIH
-PA
Author M
anuscript

(results summarized in Supplementary Fig. 6). Unlike synaptic plasticity in most circuits, the
regulation of synaptogenesis is unidirectional, i.e. UV cone input on H3 HCs controls HC
connectivity with blue cones, but not vice-versa.
Our analysis suggests that the stereotypic connectivity of H3 HCs is established during
development through two processes. First, early in development, H3 HCs contact
inappropriate partner types (red and green cones) in addition to UV and blue cones, but such
errant contacts are rapidly eliminated. In this regard, H3 HCs establish specificity through an
early phase of circuit refinement, which is also found in other vertebrate retinal circuits30 as
well as in many parts of the nervous system31, 32. The second phase of synaptogenesis
commences at the onset of cone transmission, around 3 dpf33, and during this stage the
synapse ratio of UV:blue cones increases significantly. This bias arises from H3 HCs
selectively forming synapses with UV cones while maintaining synapses with blue cones
that were formed early on. Many other systems establish their mature connectivity patterns
by pruning inappropriate connections and further refine by eliminating some connections
with appropriate partners28,31. In contrast, H3 HCs achieve their biased connectivity towards
UV cones largely by selectively increasing synaptic contact with UV cones, rather than by
pruning excessive blue cone contacts.
The developmental increase in contact with UV cones cannot be accounted for by addition
of newly generated UV cones within the field of HC dendritic arbor because cone genesis is
complete prior to synaptogenesis with H3 HCs20,34. It is also unlikely that the relative
availability of presynaptic cell types alone dictates H3 HCs’ selective synapse formation
with UV cones. Although UV cones outnumber blue cones by 1.5:1 at all larval stages
examined, this ratio is far below the UV:blue cone synapse ratio of 5:1. Thus, H3 HCs
increase synaptogenic preference for one of their two input types in the context of a stable
population of presynaptic partners.
Mutant fish and morpholino approaches allowed us to investigate how the relative numbers
of UV and blue cones prior to synapse formation impact the convergence ratio of the
presynaptic partner types. Normally, an H3 HC connects with almost all of the UV cones
within its dendritic field. However, observations based on the thrb morphants suggest that
H3 HCs can increase the number of synapses they make with UV cones when more UV
cones are available during development. This observation resembles previous findings in nrl
knockout mice in which an excess of cones develop in the absence of rods, and the HCs
increase their density of synaptic contact with cones35. Thus, across species, the number of
available presynaptic partners can set the upper limit of the number of connections they
form with the postsynaptic cell. However, in zebrafish, this does not apply to synapses with
secondary inputs because H3 HCs normally contact only about half of the blue cones within
their dendritic fields.
We found that the availability of the dominant input type can also affect the connectivity of
the secondary input type. Connectivity with blue cones increases above normal levels when
UV cone numbers are decreased, as in the retinas of the lor mutants. Compensatory changes
in one input type when the other type is absent have been previously observed. Notably,
degeneration of parallel fibers results in the expansion of the dendritic territory occupied by
Yoshimatsu et al. Page 7
Nat Commun. Author manuscript; available in PMC 2014 November 15.
NIH
-PA
Author M
anuscriptN
IH-P
A A
uthor Manuscript
NIH
-PA
Author M
anuscript
climbing fibers on Purkinje cell dendrites, and vice versa36,37,38. Is this compensatory
change aimed at reaching a fixed, total number of synapses? We do not find support for this
mechanism in cone-H3 HC circuits, because the total number of synapses in the thrb
morphant exceeds the control number. This suggests that in wildtype animals, the number of
blue cone synapses is not regulated by a mechanism that sets the total number of synapses.
Instead, blue cone synapse numbers are normally maintained at low levels, but can be
increased when there are fewer favored synaptic partners available to H3 HCs. Finally, the
number of blue cone contacts in the thrb morphant may remain unaltered because H3 HCs in
the thrb morphant increase contact with supernumerary UV cones largely after
synaptogenesis with blue cones.
A well-accepted mechanism that shapes neuronal connectivity patterns is activity-dependent
competition39,40,41. Competition results in a ‘winner take-all’ scenario, in which connections
with one input type are eliminated and synaptic territory is taken over by the other input
type. Generally, the input that is relatively less active loses. Here, we showed that perturbing
transmission from UV cones results in an increase in connectivity with blue cones, revealing
an activity-dependent process. But, unlike activity-driven competitive mechanisms, the
suppressed UV cones do not lose connectivity with the postsynaptic cell. This result
resembles that observed when input from parallel fibers to Purkinje cells is blocked: the
number of climbing fibers contacting the Purkinje cell is increased, but synapses with
parallel fibers are maintained42. When climbing fiber input is perturbed instead, parallel
fibers increase their innervation of the proximal dendrites of the Purkinje cells43. Together,
these observations suggest that there is bidirectional influence on connectivity by both input
types. In contrast, connections on H3 HCs are influenced unidirectionally by the activity of
only one input; blocking blue cone transmission does not result in an increase in UV cone
connectivity. Thus, we have uncovered a previously unknown mechanism that regulates the
pattern of synaptic convergence onto an individual neuron, which engages an activity-
dependent process that is dictated by only one afferent type, the dominant input.
Why does UV cone transmission affect blue cone connectivity and not vice versa? An
obvious explanation is that UV cones provide the majority of the net photoreceptor drive
onto H3 HCs. When synaptic drive is diminished, either by loss of UV cones or lack of UV
cone transmission, H3 HCs may seek connections with other active cones as part of a
compensatory response. Thus, loss of drive from the few blue cones would not be sufficient
to trigger a compensatory response. Congruent with this hypothesis, a previous study of
mixed hippocampal neuronal cultures from wildtype and mutant animals lacking the NMDA
receptor subunit GluN1 demonstrated the presence of a threshold (> 50% inactive), only
above which changes in connectivity were detected44. It is not clear, however, that a set
threshold exists for the H3 HC-cone circuit because we find an inverse relationship between
the number of blue cones and UV cones that are contacted by an individual H3 HC (Fig. 7d).
We propose that the most parsimonious explanation is that specific loss of transmission from
UV cones triggers a mechanism to recruit blue cone connections. We also noted that when
all drive to H3 HCs is suppressed, both UV and blue cone connections decline. This is
reminiscent of findings in mammalian retina, where blockade of transmission from all ON
bipolar cells leads to an overall decrease in synaptic contact with ON retinal ganglion
Yoshimatsu et al. Page 8
Nat Commun. Author manuscript; available in PMC 2014 November 15.
NIH
-PA
Author M
anuscriptN
IH-P
A A
uthor Manuscript
NIH
-PA
Author M
anuscript

cells45. Thus, a compensatory increase in connectivity with presynaptic cells may only occur
when there are presynaptic partners that are still able to transmit.
As yet, our experiments do not directly reveal whether or not the postsynaptic cell mediates
the heterotypic regulation of cone connectivity. It is known that photoreceptors are coupled
by gap-junctions46, and thus the relevant signals may be conveyed directly between cones.
However, if the suppressive signal passes between cones via gap junctions, then we would
not expect changes to blue cone connectivity in the sws1:TeNT retina, in which we
interfered with the release of neurotransmitter without preventing the cones from responding
to changes in illumination. Therefore, it is more likely that transmission from UV cones acts
via a mechanism directly involving the H3 HC. Indeed, in cerebellar circuits it has been
shown that Purkinje cells mediate the interactions between climbing fibers and parallel
fibers that establish their respective synaptic territories28. Regardless of the exact
‘postsynaptic’ mechanism, our study clearly shows that synaptic convergence of each
distinct input onto a sensory neuron is not necessarily independently regulated; instead, one
input type can unidirectionally dictate the connectivity of the other.
METHODS
Transgenic and mutant zebrafish
Zebrafish were maintained and experiments conducted in accordance with University of
Washington Institutional Animal Care and Use Committee guidelines. Fish were raised in an
incubator with a transparent door in a room with a normal light cycle, typically lights on
from 9 am to 11 pm. We used a combination of transgenic lines to visualize UV and/or blue
cones by fluorescent protein (FP) expression. Tg(sws1:GFP)47 labels UV cones, and
Tg(sws2:GFP)48 labels blue cones. As an additional method to visualize blue cones, a
transgenic line was engineered to express mCherry in blue cones Tg(sws2:mCherry)49. To
block neurotransmission from cones, we generated transgenic lines in which tetanus toxin
light chain (TeNT) fused to CFP is expressed in UV (Tg(sws1:TeNT), or blue cones
(Tg(sws2:TeNT). Transgenic lines were generated by plasmid injection with or without
transposase RNA into fertilized eggs at the one-cell stage, and subsequent F1 generations
were screened by FP expression.
For in vivo time-lapse imaging of the retina, we used the roy orbison mutant background50
in which iridophores do not form. The cone innervation pattern of H3 HCs in the roy
orbison mutant resembles that of wildtype fish (Supplementary Fig. 7).
The lots-of-rods (lor) mutant was isolated from N-ethyl-N-nitrosourea-induced mutant
fish25. Homozygous lor mutant fish showed no obvious morphological phenotype except a
decreased number of UV cones and an increased number of rod photoreceptors.
Plasmid generation
To visualize individual HCs, we used the pCx55.5:Gal4VP16 plasmid together with
plasmids that express fluorescent protein tagged with membrane localization signal under
the UAS promoter (pUAS:MXFP)51. MXFP represents MtdCerulean, MYFP or
MtdTomato. pUAS:MtdCerulean plasmid was generated by inserting a tandem repeat
Yoshimatsu et al. Page 9
Nat Commun. Author manuscript; available in PMC 2014 November 15.
NIH
-PA
Author M
anuscriptN
IH-P
A A
uthor Manuscript
NIH
-PA
Author M
anuscript

Cerulean coding region tagged with membrane localization signal under the UAS promoter.
pUAS:MtdTomato plasmid was generated by replacing the YFP coding region from
pUAS:MYFP plasmid with tdTomato.
To generate transgenic fish lines, we constructed pSws1:TeNT and pSws2:TeNT plasmids
using the Gateway (Life Technologies) and Tol2 system52. Cone type-specific promoters
were excised from sws1:GFP47 and sws2up3.2kb:EGFP plasmids48, and inserted into p5E
plasmids. TeNT-CFP45 was inserted into pME plasmid. Subsequent plasmids were subjected
to a Gateway reaction together with p3E–polyA and pDestTol2pA.
Morpholinos
Morpholino sequences are 5’-CCTCTTACCTCAGTTACAATTTATA-3’ (Standard
control), 5’-CGAATTGAACGGCCCACGCGTCCAT-3’ (Opn1sw1, Acc#; AF109373.1)
and 5’-TCTAGAACTTGCAATACCTTTCTTA-3’ (thrb, Acc#; AB759513).
Plasmid and morpholino injection
Plasmid and/or morpholino (Gene Tools, LLC) were diluted in 1X Danieau’s solution (58
mM NaCl, 0.7 mM KCl, 0.6 mM Ca(NO3)2, 0.4 mM MgSO4, 5mM HEPES, pH 7.6) with
0.1% phenol red to aid visualization of the injection bolus. Plasmid and/or morpholino
solutions were injected into fertilized eggs at the one-cell stage. A pulled-glass micropipette
loaded with injection solution was attached to a Picospritzer II (Parker) and anchored on a
micromanipulator (Narishige) for small volume microinjections. Injection pressure was set
to 10 psi and durations ranged from 100 to 300 ms. Total concentrations from 20 to 100
ng/µl for plasmids with and without 0.25 mM morpholino were injected. Injected eggs were
maintained in 0.3X Danieau’s in an incubator at 28°C. At 12–24 hpf, the medium was
replaced with 0.3X Danieau’s containing 0.2 mM Phenyl-thiourea (PTU) to prevent melanin
synthesis. Embryos were maintained in this medium up to 5.5 dpf. For the following
incubation, fish were raised without PTU and fed regularly.
In vivo imaging
Embryos at various stages were anesthetized with MS-222 (25–50 mg/l) in 0.3X Danieau's
solution) and mounted in molten 0.5% low-melting-point agarose (type VII, Sigma) in 60
mm organotypic culture dishes (Falcon). After solidification of the agarose, fish were
covered with 0.3X Danieau's solution containing 0.2 mM PTU and MS-222 (25– 50 mg/ml).
Image stacks were acquired on a confocal microscope (FV1000, Olympus) or a custom-built
two-photon microscope consisting a Ti-Sapphire tunable infrared laser (Spectra-Physics) at
850–915 nm. A 1.1 NA 60X water immersion objective lens with a refractive index
correction collar was used (Olympus). Images were typically acquired with an XY
resolution of 0.077 µm/pixel and 0.3 µm-thick Z slices. For time-lapse imaging, zebrafish
embryos were released from agarose after each image acquisition period and returned to fish
water without MS-222, so as to minimize the effects of anesthesia.
Immunohistochemistry and imaging wholemounts
Zebrafish were euthanized by icing, and then fixed in 4% paraformaldehyde (PFA) and 3%
sucrose in 0.1M phosphate buffered saline (PBS), pH 7.4, for 25 min at room temperature.
Yoshimatsu et al. Page 10
Nat Commun. Author manuscript; available in PMC 2014 November 15.
NIH
-PA
Author M
anuscriptN
IH-P
A A
uthor Manuscript
NIH
-PA
Author M
anuscript

For anti-Gria2/3 (GluR2/3) immunohistochemistry, fish were fixed in 3% PFA and 3%
sucrose in PBS for 19 min at room temperature. Samples were washed three times for 5 min
in PBS. Eyes were removed in PBS. Whole eyes were blocked in a solution containing 5%
normal donkey serum and 0.5% TritonX-100 in PBS for 1–24 h and then incubated with
primary antibodies. Primary antibodies included anti-GluR2/3 (rabbit, 1:300, Millipore),
anti-UV-opsin (rabbit, 1:500, kindly provided by David Hyde), anti-UV-ospin (rabbit,
1:5000, kindly provided by Jeremy Nathans), anti-blue-opsin (rabbit, 1:5000, kindly
provided by Jeremy Nathans) and zpr-1 (mouse, 1:100, ZIRC) were diluted in blocking
solution. After incubating in primary antibody for 1–3 days at 4°C, samples were washed
three times, 5 min each in 0.5% TritonX-100 in PBS and incubated for 3 hours with
secondary antibody, DyLight 649 Donkey anti-rabbit or antimouse (1:500, Jackson
ImmunoReseach) diluted in blocking solution. After three, 15 min washes with 0.5 %
TritonX-100 in PBS, whole eyes were mounted in 0.5% agarose and coverslipped with
Vectashield mounting medium (Vector). For H3 HC imaging, the eyes were oriented with
the photoreceptor layer closest to the cover slip. For imaging of H3 HC dendritic tips with
anti-GluR2/3 staining, eyes were hemisected by a scalpel blade (No.11, Feather) and
mounted with the OPL perpendicular to the cover slip.
Confocal image stacks were acquired on a FV1000 (Olympus) microscope using a 1.35 NA
60× oil-immersion or 0.85 NA 20× oil-immersion objective lenses. Images were typically
acquired with an XY resolution of 0.077 µm/pixel and 0.25 µm-thick Z slices for H3 HCs,
and with an XY resolution of 0.462 µm/pixels and 1 µm-thick Z slices for whole eyes.
Image analysis
Stack images were median-filtered in Matlab (Mathwork) and 3D-reconstructed in Amira
(Mercury Computer Systems). To view the H3 HCs dendritic arbors in the ‘top view’, the
3D–reconstructed image was oriented with the OPL parallel to the viewing perspective. The
‘side view’ was generated by orienting the OPL perpendicular to the viewing perspective,
and thinly sliced digitally using the oblique slice function in Amira. Dendritic tip
invaginations into cones were determined by examining side views throughout the dendritic
arbor of the HC.
Connectivity maps were obtained by marking morphologically identified tip invaginations
into cones on the maximum intensity projection of the H3 HC dendritic arbor. Dendritic
field size and synapse distributions were measured from the connectivity maps using Fiji53.
The locations of UV and blue cone terminal were marked on the connectivity maps and the
total numbers of UV and blue cones within dendritic field were counted. The percentages of
cones contacted within the dendritic field were obtained by dividing the number of UV or
blue cones contacted by the total number of UV or blue cones within the dendritic field.
Colabeling of transgenic fluorescent labels and immunofluorescence from anti-UV- or blue-
opsin staining was analyzed using the masking function in Amira. Labeled cones were
counted in Fiji using the maximum intensity projections of cells from Amira 3D
reconstructions of whole eyes. Line-scans of pixel intensity in Figure 4 were obtained from
side views of H3 HCs and cones using the MetaMorph (Universal Imaging) line-scan
Yoshimatsu et al. Page 11
Nat Commun. Author manuscript; available in PMC 2014 November 15.
NIH
-PA
Author M
anuscriptN
IH-P
A A
uthor Manuscript
NIH
-PA
Author M
anuscript

function with 10 pt line thickness. Images in the figures were further processed in Photoshop
(Adobe) by adjusting brightness, contrast and hues.
Statistical analysis
We used the Wilcoxon-Mann-Whitney rank sum test for comparisons of synapse numbers,
dendritic field size, tip density, total tip number, percentage of cones contacted and UV/blue
synapse ratios. (Figures 1d, 3c, 5i–l, 6i–l, 8m–o, 9e–f, Supplementary Fig. 1, Supplementary
Fig. 2b and Supplementary Fig. 6) A one-way ANOVA was used to test for differences in
the number of synapse across ages in Figure 2b and for the dendritic field size in Figure 3b.
The Pearson correlation coefficient was calculated for the regression fit of the data points in
Figure 7d.
Electron microscopy
Briefly, zebrafish larvae were fixed in 4% glutaraldehye in 0.1 M sodium cacodylate buffer,
pH 7.4 for several hours, washed in buffer three times and placed in 1% osmium tetroxide in
buffer. Tissue was dehydrated in a graded series of alcohol, embedded in resin, sectioned
and imaged19
Supplementary Material
Refer to Web version on PubMed Central for supplementary material.
Acknowledgments
We thank S. Kawamura for providing Tg(sws1:GFP) and Tg(sws2:GFP) transgenic fish, and D.R. Hyde and J.Nathans for providing UV- and blue-opsin antibodies. We also thank Wong lab members for helpful discussionsand critical reading of the manuscript. This study is supported by NIH grants EY14358 to R.O.W., EY015509 toP.A.R., the Vision Core Grant EY01730, the Vision Training Grant EY07031 and Developmental Biology GrantHD07183 to F.D.D., Natural Sciences and Engineering Research Council of Canada to W.T.A., Uehara MemorialFoundation to T.Y. and S.C.S.
REFERENCES
1. Williams ME, de Wit J, Ghosh A. Molecular mechanisms of synaptic specificity in developingneural circuits. Neuron. 2010; 68:9–18. [PubMed: 20920787]
2. Sanes JR, Yamagata M. Many paths to synaptic specificity. Annu. Rev. Cell Dev. Biol. 2009;25:161–195. [PubMed: 19575668]
3. Witter MP. Organization of the entorhinal-hippocampal system: a review of current anatomical data.Hippocampus. 1993:33–44. p3 Spec No. [PubMed: 8287110]
4. Shen K, Scheiffele P. Genetics and cell biology of building specific synaptic connectivity. Annu.Rev. Neurosci. 2010; 33:473–507. [PubMed: 20367446]
5. Pasterkamp RJ. Getting neural circuits into shape with semaphorins. Nat. Rev. Neurosci. 2012;13:605–618. [PubMed: 22895477]
6. Hruska M, Dalva MB. Ephrin regulation of synapse formation, function and plasticity. Mol. Cell.Neurosci. 2012; 50:35–44. [PubMed: 22449939]
7. Ding JB, Oh W-J, Sabatini BL, Gu C. Semaphorin 3E–Plexin-D1 signaling controls pathway-specific synapse formation in the striatum. Nat. Neurosci. 2012; 15:215–223. [PubMed: 22179111]
8. Wässle H. Parallel processing in the mammalian retina. Nat. Rev. Neurosci. 2004; 5:747–757.[PubMed: 15378035]
Yoshimatsu et al. Page 12
Nat Commun. Author manuscript; available in PMC 2014 November 15.
NIH
-PA
Author M
anuscriptN
IH-P
A A
uthor Manuscript
NIH
-PA
Author M
anuscript

9. Dacheux RF, Chimento MF, Amthor FR. Synaptic input to the on-off directionally selectiveganglion cell in the rabbit retina. J. Comp. Neurol. 2003; 456:267–278. [PubMed: 12528191]
10. Famiglietti EV. Synaptic organization of complex ganglion cells in rabbit retina: type andarrangement of inputs to directionally selective and local-edge-detector cells. J. Comp. Neurol.2005; 484:357–391. [PubMed: 15770656]
11. Schwartz GW, et al. The spatial structure of a nonlinear receptive field. Nat. Neurosci. 2012;15:1572–1580. [PubMed: 23001060]
12. Li YN, Tsujimura T, Kawamura S, Dowling JE. Bipolar cell-photoreceptor connectivity in thezebrafish (Danio rerio) retina. J. Comp. Neurol. 2012; 520:3786–3802. [PubMed: 22907678]
13. Nawrocki L, BreMiller R, Streisinger G, Kaplan M. Larval and adult visual pigments of thezebrafish, Brachydanio rerio. Vision Res. 1985; 25:1569–1576. [PubMed: 3832580]
14. Robinson J, Schmitt EA, Hárosi FI, Reece RJ, Dowling JE. Zebrafish ultraviolet visual pigment:absorption spectrum, sequence, and localization. Proc. Natl. Acad. Sci. U. S. A. 1993; 90:6009–6012. [PubMed: 8327475]
15. Song PI, Matsui JI, Dowling JE. Morphological types and connectivity of horizontal cells found inthe adult zebrafish (Danio rerio) retina. J. Comp. Neurol. 2008; 506:328–338. [PubMed:18022944]
16. Li YN, Matsui JI, Dowling JE. Specificity of the horizontal cell-photoreceptor connections in thezebrafish (Danio rerio) retina. J. Comp. Neurol. 2009; 516:442–453. [PubMed: 19655401]
17. Connaughton VP, Nelson R. Spectral responses in zebrafish horizontal cells include a tetraphasicresponse and a novel UV-dominated triphasic response. J. Neurophysiol. 2010; 104:2407–2422.[PubMed: 20610786]
18. Shields CR, et al. Retinal horizontal cell-specific promoter activity and protein expression ofzebrafish connexin 52.6 and connexin 55.5. J. Comp. Neurol. 2007; 501:765–779. [PubMed:17299759]
19. Williams PR, et al. In vivo development of outer retinal synapses in the absence of glial contact. J.Neurosci. 2010; 30:11951–11961. [PubMed: 20826659]
20. Biehlmaier O, Neuhauss SCF, Kohler K. Synaptic plasticity and functionality at the cone terminalof the developing zebrafish retina. J. Neurobiol. 2003; 56:222–236. [PubMed: 12884262]
21. Neuhauss SC, et al. Genetic disorders of vision revealed by a behavioral screen of 400 essentialloci in zebrafish. J. Neurosci. 1999; 19:8603–8615. [PubMed: 10493760]
22. Vihtelic TS, Doro CJ, Hyde DR. Cloning and characterization of six zebrafish photoreceptor opsincDNAs and immunolocalization of their corresponding proteins. Vis. Neurosci. 1999; 16:571–585.[PubMed: 10349976]
23. Allison WT, et al. Ontogeny of cone photoreceptor mosaics in zebrafish. J. Comp. Neurol. 2010;518:4182–4195. [PubMed: 20878782]
24. Suzuki SC, et al. Cone photoreceptor types in zebrafish are generated by symmetric terminaldivisions of dedicated precursors. Proc. Natl. Acad. Sci. U. S. A. 2013; 110:15109–15114.[PubMed: 23980162]
25. Alvarez-Delfin K, et al. Tbx2b is required for ultraviolet photoreceptor cell specification duringzebrafish retinal development. Proc. Natl. Acad. Sci. U. S. A. 2009; 106:2023–2028. [PubMed:19179291]
26. Schiavo G, et al. Tetanus and botulinum-B neurotoxins block neurotransmitter release byproteolytic cleavage of synaptobrevin. Nature. 1992; 359:832–835. [PubMed: 1331807]
27. Turrigiano GG, Nelson SB. Homeostatic plasticity in the developing nervous system. Nat. Rev.Neurosci. 2004; 5:97–107. [PubMed: 14735113]
28. Hashimoto K, Kano M. Synapse elimination in the developing cerebellum. Cell. Mol. Life Sci.Cmls. 2013
29. Vitureira N, Letellier M, Goda Y. Homeostatic synaptic plasticity: from single synapses to neuralcircuits. Curr. Opin. Neurobiol. 2012; 22:516–521. [PubMed: 21983330]
30. Morgan JL, Soto F, Wong ROL, Kerschensteiner D. Development of cell type-specificconnectivity patterns of converging excitatory axons in the retina. Neuron. 2011; 71:1014–1021.[PubMed: 21943599]
Yoshimatsu et al. Page 13
Nat Commun. Author manuscript; available in PMC 2014 November 15.
NIH
-PA
Author M
anuscriptN
IH-P
A A
uthor Manuscript
NIH
-PA
Author M
anuscript
31. Guido W. Refinement of the retinogeniculate pathway. J. Physiol. 2008; 586:4357–4362.[PubMed: 18556365]
32. Malun D, Brunjes PC. Development of olfactory glomeruli: temporal and spatial interactionsbetween olfactory receptor axons and mitral cells in opossums and rats. J. Comp. Neurol. 1996;368:1–16. [PubMed: 8725290]
33. Branchek T. The development of photoreceptors in the zebrafish brachydanio rerio. II Function. J.Comp. Neurol. 1984; 224:116–122. [PubMed: 6715575]
34. Hu M, Easter SS. Retinal neurogenesis: the formation of the initial central patch of postmitoticcells. Dev. Biol. 1999; 207:309–321. [PubMed: 10068465]
35. Raven MA, Oh ECT, Swaroop A, Reese BE. Afferent control of horizontal cell morphologyrevealed by genetic respecification of rods and cones. J. Neurosci. 2007; 27:3540–3547. [PubMed:17392470]
36. Crepel F, Delhaye-Bouchaud N, Dupont JL. Fate of the multiple innervation of cerebellar Purkinjecells by climbing fibers in immature control, x-irradiated and hypothyroid rats. Brain Res. 1981;227:59–71. [PubMed: 7470934]
37. Bravin M, Rossi F, Strata P. Different climbing fibres innervate separate dendritic regions of thesame Purkinje cell in hypogranular cerebellum. J. Comp. Neurol. 1995; 357:395–407. [PubMed:7673475]
38. Rossi F, van der Want JJ, Wiklund L, Strata P. Reinnervation of cerebellar Purkinje cells byclimbing fibres surviving a subtotal lesion of the inferior olive in the adult rat. II. Synapticorganization on reinnervated Purkinje cells. J. Comp. Neurol. 1991; 308:536–554. [PubMed:1865016]
39. Sanes JR, Lichtman JW. Development of the vertebrate neuromuscular junction. Annu. Rev.Neurosci. 1999; 22:389–442. [PubMed: 10202544]
40. Katz LC, Crowley JC. Development of cortical circuits: lessons from ocular dominance columns.Nat. Rev. Neurosci. 2002; 3:34–42. [PubMed: 11823803]
41. Cesa R, Strata P. Axonal competition in the synaptic wiring of the cerebellar cortex duringdevelopment and in the mature cerebellum. Neuroscience. 2009; 162:624–632. [PubMed:19272433]
42. Kano M, et al. Persistent multiple climbing fiber innervation of cerebellar Purkinje cells in micelacking mGluR1. Neuron. 1997; 18:71–79. [PubMed: 9010206]
43. Miyazaki T, et al. Cav2.1 in cerebellar Purkinje cells regulates competitive excitatory synapticwiring, cell survival, and cerebellar biochemical compartmentalization. J. Neurosci. 2012;32:1311–1328. [PubMed: 22279216]
44. She K, Craig AM. NMDA receptors mediate synaptic competition in culture. Plos One. 2011;6:e24423. [PubMed: 21935408]
45. Kerschensteiner D, Morgan JL, Parker ED, Lewis RM, Wong ROL. Neurotransmission selectivelyregulates synapse formation in parallel circuits in vivo. Nature. 2009; 460:1016–1020. [PubMed:19693082]
46. Li H, Chuang AZ, O’Brien J. Photoreceptor coupling is controlled by connexin 35 phosphorylationin zebrafish retina. J. Neurosci. 2009; 29:15178–15186. [PubMed: 19955370]
47. Takechi M, Hamaoka T, Kawamura S. Fluorescence visualization of ultraviolet-sensitive conephotoreceptor development in living zebrafish. Febs Lett. 2003; 553:90–94. [PubMed: 14550552]
48. Takechi M, Seno S, Kawamura S. Identification of cis-acting elements repressing blue opsinexpression in zebrafish UV cones and pineal cells. J. Biol. Chem. 2008; 283:31625–31632.[PubMed: 18796431]
49. Salbreux G, Barthel LK, Raymond PA, Lubensky DK. Coupling mechanical deformations andplanar cell polarity to create regular patterns in the zebrafish retina. Plos Comput. Biol. 2012;8:e1002618. [PubMed: 22936893]
50. Ren JQ, McCarthy WR, Zhang H, Adolph AR, Li L. Behavioral visual responses of wild-type andhypopigmented zebrafish. Vision Res. 2002; 42:293–299. [PubMed: 11809482]
51. Godinho L, et al. Nonapical symmetric divisions underlie horizontal cell layer formation in thedeveloping retina in vivo. Neuron. 2007; 56:597–603. [PubMed: 18031679]
Yoshimatsu et al. Page 14
Nat Commun. Author manuscript; available in PMC 2014 November 15.
NIH
-PA
Author M
anuscriptN
IH-P
A A
uthor Manuscript
NIH
-PA
Author M
anuscript

52. Kwan KM, et al. The Tol2kit: a multisite gateway-based construction kit for Tol2 transposontransgenesis constructs. Dev. Dyn. 2007; 236:3088–3099. [PubMed: 17937395]
53. Schindelin J, et al. Fiji: an open-source platform for biological-image analysis. Nat. Methods.2012; 9:676–682. [PubMed: 22743772]
Yoshimatsu et al. Page 15
Nat Commun. Author manuscript; available in PMC 2014 November 15.
NIH
-PA
Author M
anuscriptN
IH-P
A A
uthor Manuscript
NIH
-PA
Author M
anuscript
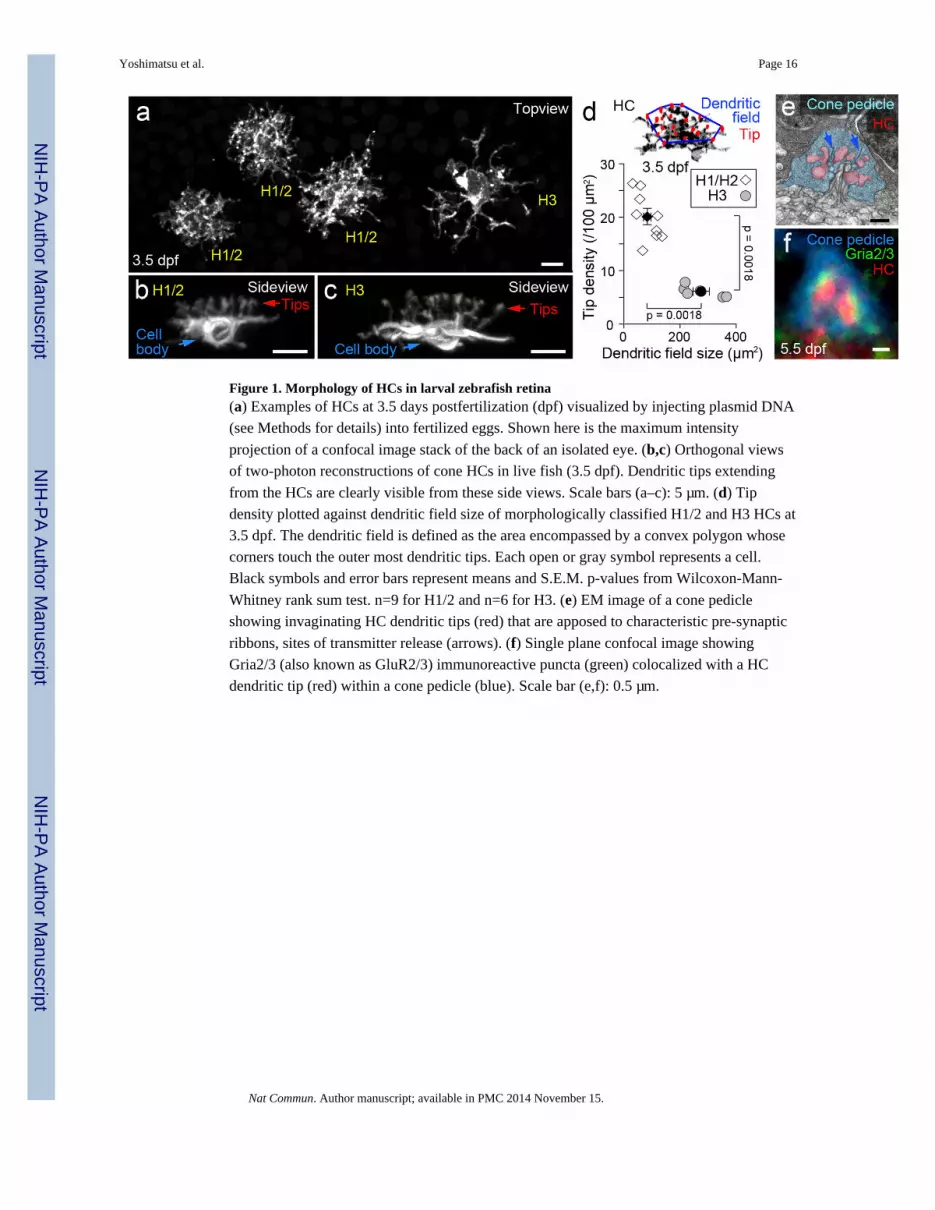
Figure 1. Morphology of HCs in larval zebrafish retina(a) Examples of HCs at 3.5 days postfertilization (dpf) visualized by injecting plasmid DNA
(see Methods for details) into fertilized eggs. Shown here is the maximum intensity
projection of a confocal image stack of the back of an isolated eye. (b,c) Orthogonal views
of two-photon reconstructions of cone HCs in live fish (3.5 dpf). Dendritic tips extending
from the HCs are clearly visible from these side views. Scale bars (a–c): 5 µm. (d) Tip
density plotted against dendritic field size of morphologically classified H1/2 and H3 HCs at
3.5 dpf. The dendritic field is defined as the area encompassed by a convex polygon whose
corners touch the outer most dendritic tips. Each open or gray symbol represents a cell.
Black symbols and error bars represent means and S.E.M. p-values from Wilcoxon-Mann-
Whitney rank sum test. n=9 for H1/2 and n=6 for H3. (e) EM image of a cone pedicle
showing invaginating HC dendritic tips (red) that are apposed to characteristic pre-synaptic
ribbons, sites of transmitter release (arrows). (f) Single plane confocal image showing
Gria2/3 (also known as GluR2/3) immunoreactive puncta (green) colocalized with a HC
dendritic tip (red) within a cone pedicle (blue). Scale bar (e,f): 0.5 µm.
Yoshimatsu et al. Page 16
Nat Commun. Author manuscript; available in PMC 2014 November 15.
NIH
-PA
Author M
anuscriptN
IH-P
A A
uthor Manuscript
NIH
-PA
Author M
anuscript

Figure 2. Connectivity patterns of H3 HCs across development(a) Examples of larval H3 HCs transiently expressing fluorescent protein in the background
of Tg(sws1:GFP; sws2:mCherry). Shown are maximum intensity projections or orthogonal
views through a small part of the arbor. Insets in top view panels show higher
magnifications of dendritic tips invaginating into a cone pedicle. Open circles map the
locations of dendritic tips that contacted UV or blue cones in the double transgenic line
(magenta or blue circles respectively), as judged from 3D reconstructions of the cell and its
surrounding cones. Some tips (orange circles, undefined) could not be assigned to either UV
Yoshimatsu et al. Page 17
Nat Commun. Author manuscript; available in PMC 2014 November 15.
NIH
-PA
Author M
anuscriptN
IH-P
A A
uthor Manuscript
NIH
-PA
Author M
anuscript

or blue cones. Scale bars: 5 µm. (b) Population data showing the mean number of UV or
blue cone-associated tips and undefined tips made by H3 HCs in the background of
Tg(sws1:GFP; sws2:mCherry) fish. Each open circle represents one cell. n=6 for 3.5 dpf,
n=9 for 4.5 dpf, n=12 for 5.5 dpf, n=8 for 10 dpf. Error bars are S.E.M.
Yoshimatsu et al. Page 18
Nat Commun. Author manuscript; available in PMC 2014 November 15.
NIH
-PA
Author M
anuscriptN
IH-P
A A
uthor Manuscript
NIH
-PA
Author M
anuscript

Figure 3. Developmental increase in UV:blue cone synapse ratio occurs by selective addition ofUV cone connections(a) Plots across ages of the mean ratio of the UV:blue cones available (circles) as well as the
adjusted mean ratio of UV:blue cones that are contacted by H3 HCs (triangles). Contacted
(n=6 for 3.5 dpf, n=12 for 5.5 dpf, n=8 for 10 dpf); available (n=4 for all ages). (b) Mean H3
HC dendritic field sizes at different ages. (c) (Upper panel) Connectivity maps of example
H3 HCs at different ages. A circle (yellow) with an area equivalent to the average 3.5 dpf
H3 HC dendritic field size was centered on the center of mass of the dendritic field. (Lower
panel) The mean numbers of UV and blue cone synapses within (In) or outside (Out) the
yellow-filled circle were plotted for cells reconstructed at different ages. In general,
synapses added outside the circle largely represent addition of synapses to the dendrites that
grew after 3.5 dpf. In all panels, UV and blue cone synapse numbers obtained from FP
expression in transgenic fish were adjusted according to the values of % transgenic
expression per opsin expression from Supplementary Fig. 2. All error bars are S.E.M. p-
values from Wilcoxon-Mann- Whitney rank sum test. n=6 for 3.5 dpf, n=9 for 5.5 dpf, n=8
for 10 dpf in (b,c).
Yoshimatsu et al. Page 19
Nat Commun. Author manuscript; available in PMC 2014 November 15.
NIH
-PA
Author M
anuscriptN
IH-P
A A
uthor Manuscript
NIH
-PA
Author M
anuscript

Figure 4. Dynamic H3 HC processes selectively target UV cones(a,b) Multiphoton time-lapse imaging of an H3 HC in the background of (a) Tg(sws1:GFP)
or (b) Tg(sws2:GFP). For each time point, an orthogonal view of the cell and labeled cones
within the boxed region is provided below the connectivity map. A line-scan of this region
showing the relative pixel intensities of the two channels (violet, UV cone signal or cyan,
blue cone signal; yellow, HC signal) is presented below the view of the cell. Asterisks mark
the location where, over time, a dendritic tip emerged and contacted UV or blue cones.
Higher magnification of this location is shown on the right panels. A confocal reconstruction
Yoshimatsu et al. Page 20
Nat Commun. Author manuscript; available in PMC 2014 November 15.
NIH
-PA
Author M
anuscriptN
IH-P
A A
uthor Manuscript
NIH
-PA
Author M
anuscript

of the cell after fixation at the final time-point (104 hpf) clearly identifies the formation of
new synapses. In the connectivity maps, solid circles represent synapses added in-between
time points; open circles are stable contacts and X indicates eliminated contacts. Scale bars:
5 µm. (c) Population data showing the mean number of UV and blue cone synapses added
and eliminated during the time course of multiphoton imaging. (d) Net change in the number
of UV and blue cone synapses (n=5 for UV and n=3 for blue). Error bars are S.E.M.
Yoshimatsu et al. Page 21
Nat Commun. Author manuscript; available in PMC 2014 November 15.
NIH
-PA
Author M
anuscriptN
IH-P
A A
uthor Manuscript
NIH
-PA
Author M
anuscript
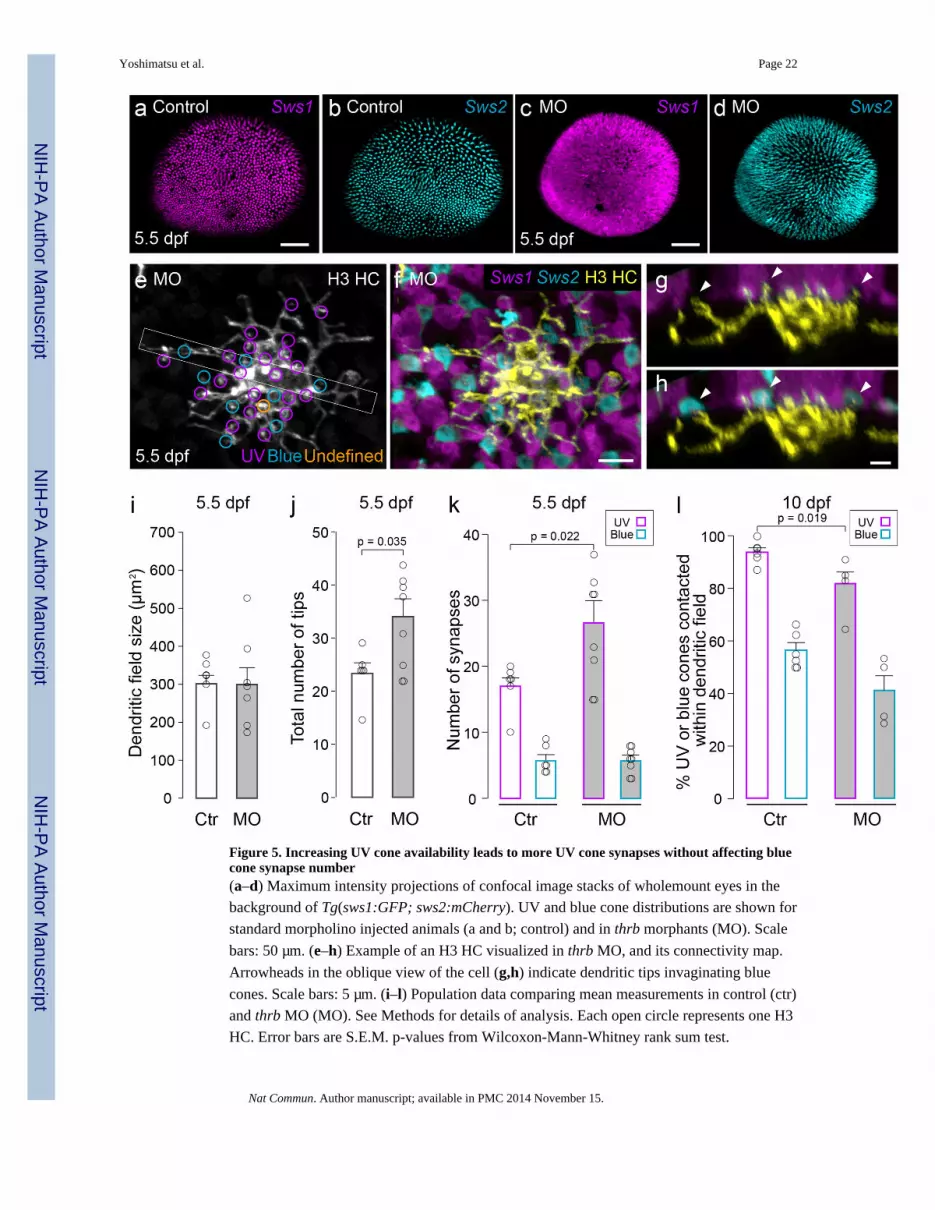
Figure 5. Increasing UV cone availability leads to more UV cone synapses without affecting bluecone synapse number(a–d) Maximum intensity projections of confocal image stacks of wholemount eyes in the
background of Tg(sws1:GFP; sws2:mCherry). UV and blue cone distributions are shown for
standard morpholino injected animals (a and b; control) and in thrb morphants (MO). Scale
bars: 50 µm. (e–h) Example of an H3 HC visualized in thrb MO, and its connectivity map.
Arrowheads in the oblique view of the cell (g,h) indicate dendritic tips invaginating blue
cones. Scale bars: 5 µm. (i–l) Population data comparing mean measurements in control (ctr)
and thrb MO (MO). See Methods for details of analysis. Each open circle represents one H3
HC. Error bars are S.E.M. p-values from Wilcoxon-Mann-Whitney rank sum test.
Yoshimatsu et al. Page 22
Nat Commun. Author manuscript; available in PMC 2014 November 15.
NIH
-PA
Author M
anuscriptN
IH-P
A A
uthor Manuscript
NIH
-PA
Author M
anuscript

Figure 6. H3 HCs increase synaptogenesis with blue cones in the absence of UV cones(a–d) Maximum intensity projections of confocal image stacks of wholemount eyes in the
background of Tg(sws1:GFP; sws2:mCherry). UV and blue cone distributions are shown for
wildtype animals (a and b; control) and in the lor mutant (lor). Scale bars: 50 µm. (e–h)
Example of an H3 HC visualized in lor, and its connectivity map. Inset in (e) shows a higher
magnification view of enlarged dendritic tips within UV cones. Arrowheads in the
orthogonal view of the cell (g,h) indicate dendritic tips invaginating blue cones. Scale bars:
5 µm. Note that in Figure 7, some UV cones in lor receive more than 1 dendritic
invagination from the same HC. We counted these tips as a separate ‘synapse’. (i–l)Summary of mean measurements in control (ctr) and lor. See Methods for details of
Yoshimatsu et al. Page 23
Nat Commun. Author manuscript; available in PMC 2014 November 15.
NIH
-PA
Author M
anuscriptN
IH-P
A A
uthor Manuscript
NIH
-PA
Author M
anuscript

analysis. Each open circle represents one H3 HC. Error bars are S.E.M. p values from
Wilcoxon-Mann-Whitney rank sum test.
Yoshimatsu et al. Page 24
Nat Commun. Author manuscript; available in PMC 2014 November 15.
NIH
-PA
Author M
anuscriptN
IH-P
A A
uthor Manuscript
NIH
-PA
Author M
anuscript

Figure 7. Inverse correlation between the number of UV and blue cones synapsing with H3 HCsin l or mutants(a,b) An example of an H3 HC labeled in Tg(sws1:GFP; sws2:mCherry) crossed in the lor
background. Connectivity map is shown in (a). Arrowhead indicates an unusual invagination
into a UV cone by two dendritic tips from the same HC. Dendritic tips of larval H3 HCs
normally do not show such branching or co-innervation of the same pedicle. Scale bar: 5
µm. An inset shows High-magnification view of the tip indicated by the arrowhead. (c)
Quantification of the mean number of dendritic tips invaginating a single UV cone in
Yoshimatsu et al. Page 25
Nat Commun. Author manuscript; available in PMC 2014 November 15.
NIH
-PA
Author M
anuscriptN
IH-P
A A
uthor Manuscript
NIH
-PA
Author M
anuscript

wildtype (ctr) and lor. Open circles represent the average value for individual H3 HCs. Error
bars are S.E.M. (d) The number of blue and UV cones synapsing a given H3 HC (each
circle) at 5.5 dpf are plotted here for wildtype (ctr) and lor mutants. All control H3 HCs had
a single dendritic invagination into a cone pedicle. In lor, however, some H3 HCs project
two or more dendritic tips into the cone pedicle (multiple tips). R-square and p-value from
Pearson correlation coefficient.
Yoshimatsu et al. Page 26
Nat Commun. Author manuscript; available in PMC 2014 November 15.
NIH
-PA
Author M
anuscriptN
IH-P
A A
uthor Manuscript
NIH
-PA
Author M
anuscript

Figure 8. UV cone transmission regulates blue cone synapse number(a–l) Examples of H3 HCs and their connectivity maps in the background of Tg(sws1:TeNT;
sws2:mCherry) (a-d), Tg(sws1:GFP; sws2:TeNT) (e–h), or Tg(sws1:TeNT; sws2:TeNT;
sws2:mCherry) (i–l). Sideviews of rectangular regions outlined in (a,e,i) are shown in
(c,d,g,h,k,l). Arrowheads indicate blue cone synapses. Scale bars: 5 µm. (m–o) Comparison
of mean measurements across conditions. See Methods for details of analysis. Control
animals (ctr). Each open circle represents one H3 HC. Error bars are S.E.M. p-values from
Wilcoxon-Mann-Whitney rank sum test.
Yoshimatsu et al. Page 27
Nat Commun. Author manuscript; available in PMC 2014 November 15.
NIH
-PA
Author M
anuscriptN
IH-P
A A
uthor Manuscript
NIH
-PA
Author M
anuscript

Figure 9. UV light-driven transmission regulates H3 HC connectivity with blue cones(a–d) An H3 HC and its connectivity map in the background of a Tg(sws1:GFP;
sws2:mCherry) fish that was injected with a morpholino against UV-opsin (Opn1sw1 MO).
Arrows indicate blue cone synapses. Scale bars: 5 µm. Comparison of measurements
between standard morpholino (ctr) and Opn1sw1 morpholino injected animals. Each open
circle represents one H3 HC. (e, f) Comparison of mean measurements across conditions.
Control animals (ctr). See Methods for details of analysis. Each open circle represents one
H3 HC. Error bars are S.E.M. p values from Wilcoxon-Mann-Whitney rank sum test.
Yoshimatsu et al. Page 28
Nat Commun. Author manuscript; available in PMC 2014 November 15.
NIH
-PA
Author M
anuscriptN
IH-P
A A
uthor Manuscript
NIH
-PA
Author M
anuscript
Related Documents