Transmission Flow Methodologies: Approximate DC Flow vs. Pipe Flow along AC Lines Yinong Sun and Wesley Cole Sept. 11, 2017 NREL/PR-6A20-68929

Welcome message from author
This document is posted to help you gain knowledge. Please leave a comment to let me know what you think about it! Share it to your friends and learn new things together.
Transcript

Transmission Flow Methodologies: Approximate DC Flow vs. Pipe Flow along AC Lines
Yinong Sun and Wesley Cole
Sept. 11, 2017 NREL/PR-6A20-68929

2
• Long-term power-sector planning models typically represent transmission along AC lines in one of three ways:
1. Transmission is not represented 2. Transmission is represented using a pipe flow methodology 3. Transmission is represented using linearized AC power flow
approximation based on the fast decoupled load flow method, otherwise known as approximate DC power flow methodology
• The purpose of this deck is to understand and document the impacts of representing transmission using #2 and #3 in the above list
• The comparison is done using the Regional Energy Deployment System (ReEDS) model to do a scenario analysis
• This deck is adapted from a presentation given at the Multi-model Workshop on June 7-8, 2017, in Golden, Colorado, USA.
Introduction
3
Regional Energy Deployment System (ReEDS) model
• Central-planning optimization model of U.S. Electricity Sector
• 134 Balancing Areas • 356 Wind/CSP regions • Explicit consideration of RE integration
issues
• Solves combined capacity expansion and dispatch out to 2050 under different assumptions o Economic o Technology o Policy

4
ReEDS approach: transmission power flow
Pipe Flow: ReEDS chooses route.
Pipe flow: • Power flows from one region
to another without respect to the rest of the network
Approximate DC flow: • Power flow: obeys Kirchhoff's
voltage law, flows are determined by generation, load, and line susceptances
• DC: real power only; ignores reactive power
• Linear: approximation that phase angle differences are small—necessary for use in linear optimization.
Approximate DC Flow: Route is determined by transfers and network.
5
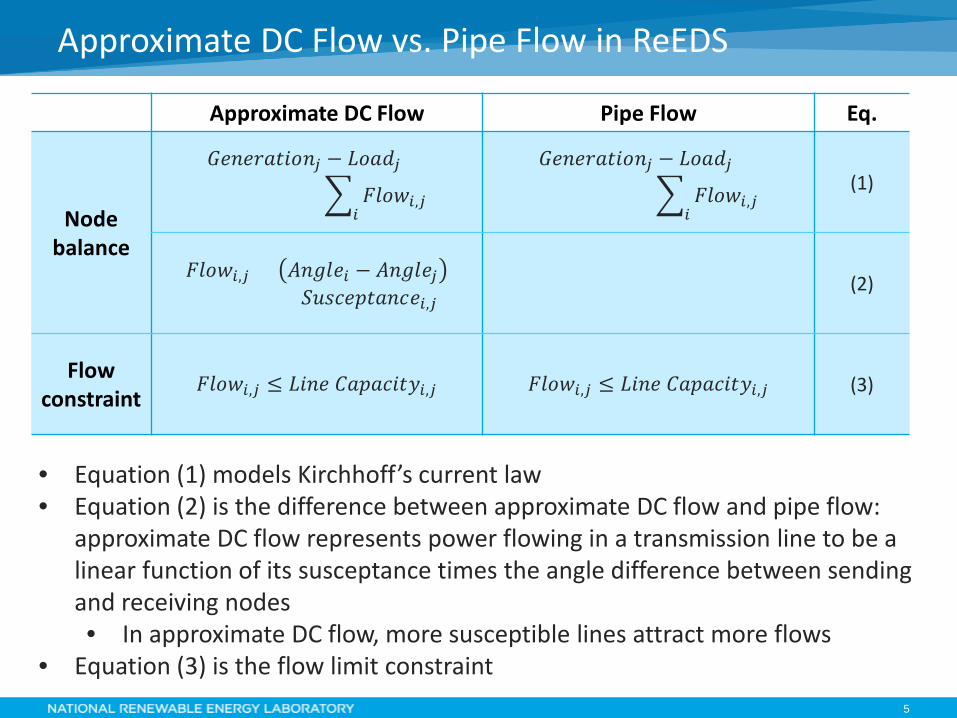
Approximate DC Flow vs. Pipe Flow in ReEDS
Approximate DC Flow Pipe Flow Eq.
Node balance
𝐺𝐺𝐺𝐺𝐺𝐺𝐺𝐺𝐺𝐺𝐺𝐺𝐺𝐺𝐺𝐺𝐺𝐺𝐺𝐺𝑗𝑗 − 𝐿𝐿𝐺𝐺𝐺𝐺𝑑𝑑𝑗𝑗= � 𝐹𝐹𝐹𝐹𝐺𝐺𝑤𝑤𝑖𝑖,𝑗𝑗
𝑖𝑖
𝐺𝐺𝐺𝐺𝐺𝐺𝐺𝐺𝐺𝐺𝐺𝐺𝐺𝐺𝐺𝐺𝐺𝐺𝐺𝐺𝑗𝑗 − 𝐿𝐿𝐺𝐺𝐺𝐺𝑑𝑑𝑗𝑗= � 𝐹𝐹𝐹𝐹𝐺𝐺𝑤𝑤𝑖𝑖,𝑗𝑗
𝑖𝑖
(1)
𝐹𝐹𝐹𝐹𝐺𝐺𝑤𝑤𝑖𝑖,𝑗𝑗 = 𝐴𝐴𝐺𝐺𝐴𝐴𝐹𝐹𝐺𝐺𝑖𝑖 − 𝐴𝐴𝐺𝐺𝐴𝐴𝐹𝐹𝐺𝐺𝑗𝑗× 𝑆𝑆𝑆𝑆𝑆𝑆𝑆𝑆𝐺𝐺𝑆𝑆𝐺𝐺𝐺𝐺𝐺𝐺𝑆𝑆𝐺𝐺𝑖𝑖,𝑗𝑗
(2)
Flow constraint
𝐹𝐹𝐹𝐹𝐺𝐺𝑤𝑤𝑖𝑖,𝑗𝑗 ≤ 𝐿𝐿𝐺𝐺𝐺𝐺𝐺𝐺 𝐶𝐶𝐺𝐺𝑆𝑆𝐺𝐺𝑆𝑆𝐺𝐺𝐺𝐺𝑦𝑦𝑖𝑖,𝑗𝑗 𝐹𝐹𝐹𝐹𝐺𝐺𝑤𝑤𝑖𝑖,𝑗𝑗 ≤ 𝐿𝐿𝐺𝐺𝐺𝐺𝐺𝐺 𝐶𝐶𝐺𝐺𝑆𝑆𝐺𝐺𝑆𝑆𝐺𝐺𝐺𝐺𝑦𝑦𝑖𝑖,𝑗𝑗 (3)
• Equation (1) models Kirchhoff’s current law • Equation (2) is the difference between approximate DC flow and pipe flow:
approximate DC flow represents power flowing in a transmission line to be a linear function of its susceptance times the angle difference between sending and receiving nodes • In approximate DC flow, more susceptible lines attract more flows
• Equation (3) is the flow limit constraint
6
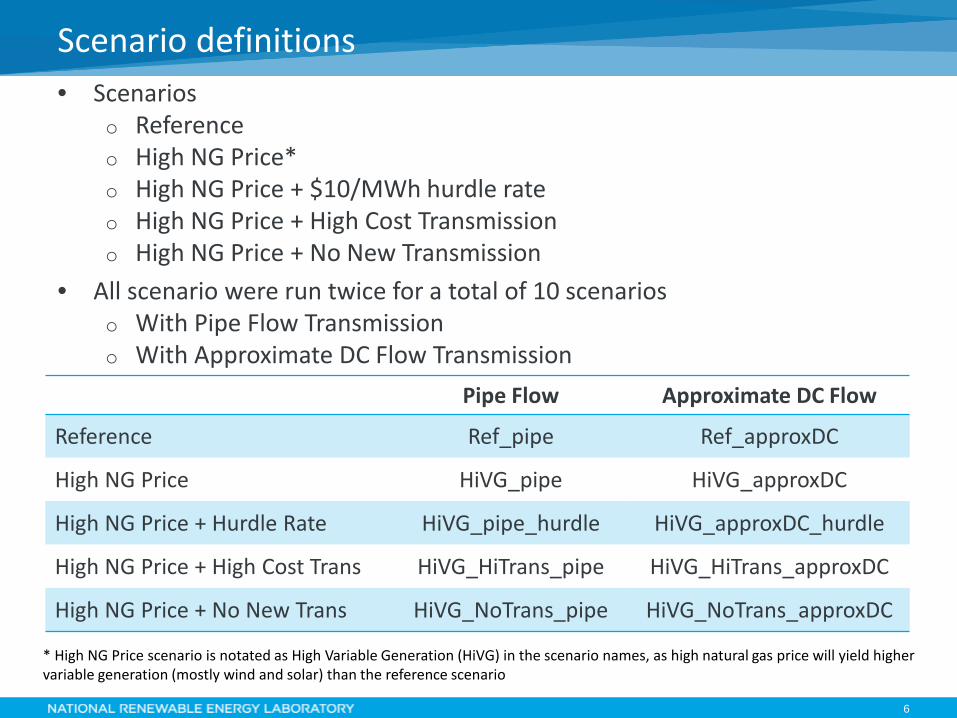
• Scenarios o Reference o High NG Price* o High NG Price + $10/MWh hurdle rate o High NG Price + High Cost Transmission o High NG Price + No New Transmission
• All scenario were run twice for a total of 10 scenarios o With Pipe Flow Transmission o With Approximate DC Flow Transmission
Scenario definitions
Pipe Flow Approximate DC Flow
Reference Ref_pipe Ref_approxDC
High NG Price HiVG_pipe HiVG_approxDC
High NG Price + Hurdle Rate HiVG_pipe_hurdle HiVG_approxDC_hurdle
High NG Price + High Cost Trans HiVG_HiTrans_pipe HiVG_HiTrans_approxDC
High NG Price + No New Trans HiVG_NoTrans_pipe HiVG_NoTrans_approxDC
* High NG Price scenario is notated as High Variable Generation (HiVG) in the scenario names, as high natural gas price will yield higher variable generation (mostly wind and solar) than the reference scenario

7
• All scenarios used the 2016 Annual Technology Baseline for generator cost and performance inputs and the Annual Energy Outlook (AEO) 2017 Reference scenario for demand growth
• The Reference scenario uses the AEO 2017 Reference scenario natural gas prices as inputs
• The High NG Price scenario uses the AEO 2017 Low Oil & Gas Resource & Technology scenario as natural gas price inputs
• The High NG Price scenario was chosen as the primary sensitivity because it spurs significant growth of variable generation (VG)
• The hurdle rates apply a $10/MWh cost to all power moved between any ReEDS balancing areas
• The High Cost Transmission scenario triples the cost of new transmission lines and doubles transmission losses
• The No New Transmission scenario does not allow any new transmission beyond that which has already been announced or that is currently under construction
Scenario notes

Scenario Results

9
Transmission capacity in 2050 (GW-mi)
• Approximate DC flow is more restrictive and generally requires more transmission capacity than pipe flow, especially under the HiVG scenario when more variable generation needs to be exported to serve load centers.
• However, hurdle rates result in fewer transmission capacity investment in approximate DC flow than pipe flow, because pipe flow can always take the most direct path, while approximate DC flow may have to take a more circuitous path and thereby incur more hurdle rate penalties.
10
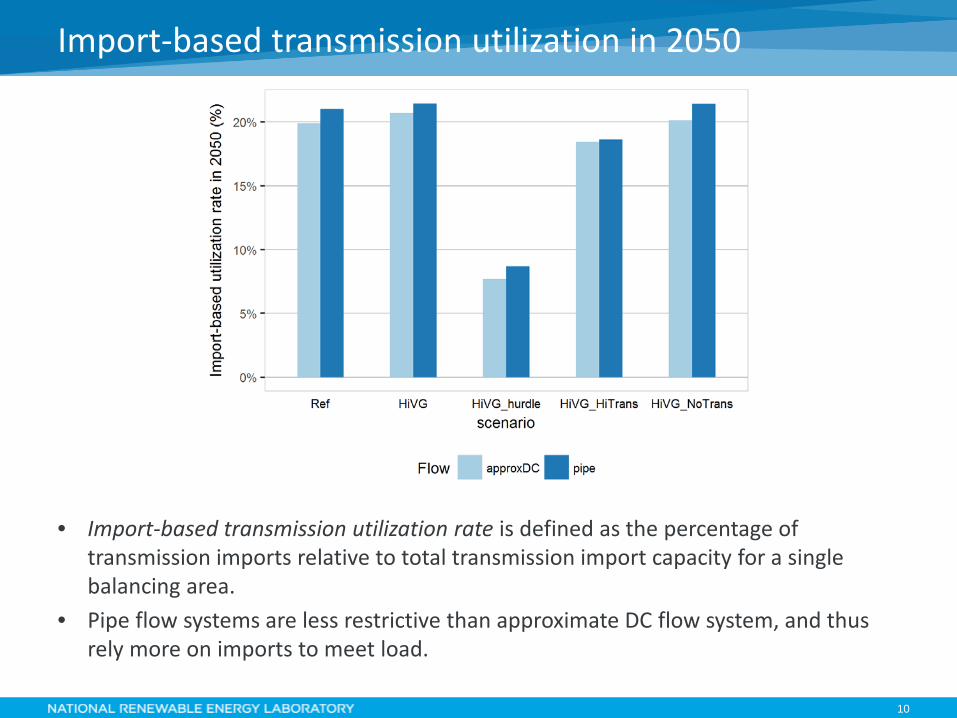
Import-based transmission utilization in 2050
• Import-based transmission utilization rate is defined as the percentage of transmission imports relative to total transmission import capacity for a single balancing area.
• Pipe flow systems are less restrictive than approximate DC flow system, and thus rely more on imports to meet load.

11
HiVG_NoTrans: flow, import & utilization rate
• Flow-based transmission utilization rate is defined as the percentage of overall transmission flows relative to total transmission capacity for a single balancing area.
• For the same transmission system—i.e., no new transmission expansion— the difference between approximate DC vs. pipe flow is fairly significant, demonstrating the impact of the less restrictive power flow when represented using pipe flow.

Capacity and Generation differences

13
Capacity and generation for Ref_approxDC and HiVG_approxDC scenario
• The Reference scenario sees growth in variable generation and natural gas, with declines in coal and nuclear.
• Cumulative capacity under the HiVG scenario is expected to double by 2050 due to relatively low capacity factors of wind and solar.

14
Generation difference from approximate DC flow to pipe flow
• As the transmission becomes more restrictive, there can be less wind, less coal and more gas (especially natural gas combined cycle) capacity on the grid:
• Wind and coal plants are generally remote from load centers and rely more heavily on transmission to be able to export power;
• Natural gas plants and PV capacity can be more easily sited next to load centers thus do not require additional transmission capacity and flows.
System & Transmission Cost

16
Present value of total system cost
• The total system cost in ReEDS is calculated as the present value of total capital, operation and maintenance, fuel cost, transmission, and other investments for the entire system from 2015 to 2050 at a 3% discount rate.
• Systems with approximate DC Flow requires higher costs across all scenario, primarily because approximate DC flow systems have more stringent transmission constraints thus require more expensive local generation.
• The difference between approximate DC vs. pipe flow is more significant within a fixed transmission system (i.e. HiVG_NoTrans).

17
Transmission cost as a percentage of total cost
• Transmission cost is a small portion of total system cost. • No consistent differences in transmission cost between two methods: approximate DC
flow is more restrictive, thus may requires more transmission expansion to move power (resulting in more transmission cost), or may rely more local generation and have lower needs for transmission (resulting in lower transmission cost); therefore the overall effect depends.

18
• Approximate DC flow systems require more transmission capacity than pipe flow systems, and the difference is larger under HiVG scenario
• Hurdle rates impact the transmission capacity and flows in the approximate DC flow system more than the pipe flow system
• Pipe flow systems rely more on transmission imports, whereas approximate DC flow systems encourage more local generation
• For a fixed transmission system, the difference using approximate DC vs. pipe flow can be large, and the transmission representation can be more important
• As the transmission becomes more restrictive, there can be less wind and coal, but more gas (especially natural gas combined cycle) capacity in the system
• Although the impact is very small, the approximate DC flow representation has a higher total system costs than the pipe flow representation
Summary

19
Future work
• Improve approximate DC power flow representation and parameterize line susceptance in large-scale capacity expansion models;
• Further expansion scenarios consider both high voltage, direct current (HVDC) and high voltage, alternate current (HVAC) long-distance lines, accounting for AC power flow effects, to assess the economic feasibility of HVAC vs HVDC


Appendix
22
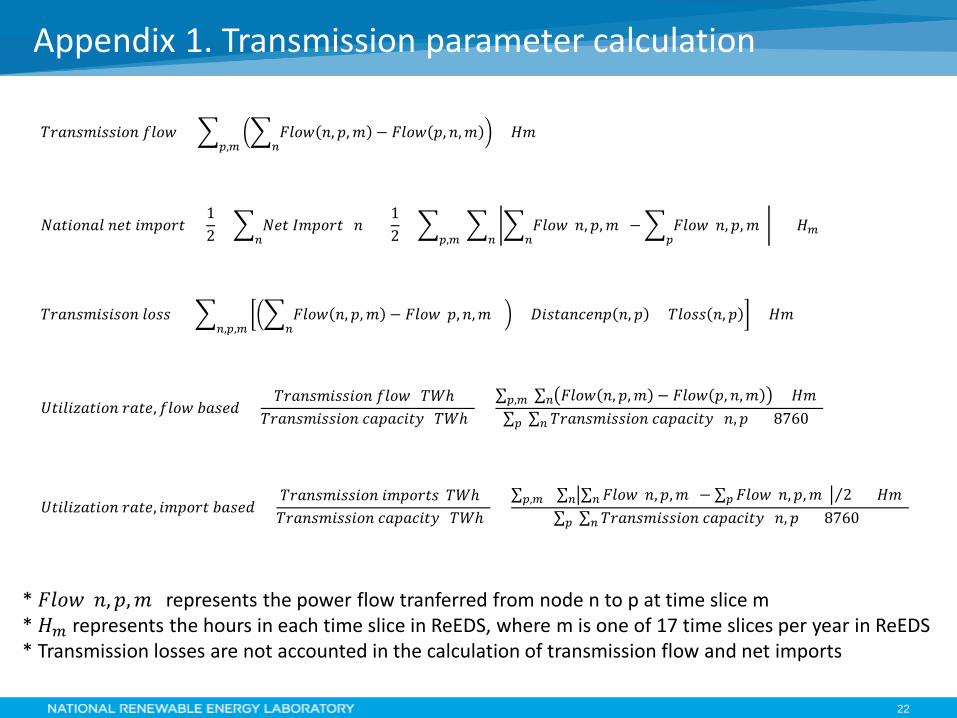
Appendix 1. Transmission parameter calculation
𝑇𝑇𝐺𝐺𝐺𝐺𝐺𝐺𝑆𝑆𝑇𝑇𝐺𝐺𝑆𝑆𝑆𝑆𝐺𝐺𝐺𝐺𝐺𝐺 𝑓𝑓𝐹𝐹𝐺𝐺𝑤𝑤 = � � 𝐹𝐹𝐹𝐹𝐺𝐺𝑤𝑤 𝐺𝐺, 𝑆𝑆,𝑇𝑇 − 𝐹𝐹𝐹𝐹𝐺𝐺𝑤𝑤 𝑆𝑆, 𝐺𝐺,𝑇𝑇𝑛𝑛
× 𝐻𝐻𝑇𝑇𝑝𝑝,𝑚𝑚
𝑁𝑁𝐺𝐺𝐺𝐺𝐺𝐺𝐺𝐺𝐺𝐺𝐺𝐺𝐹𝐹 𝐺𝐺𝐺𝐺𝐺𝐺 𝐺𝐺𝑇𝑇𝑆𝑆𝐺𝐺𝐺𝐺𝐺𝐺 =12
× � 𝑁𝑁𝐺𝐺𝐺𝐺 𝐼𝐼𝑇𝑇𝑆𝑆𝐺𝐺𝐺𝐺𝐺𝐺 (𝐺𝐺)𝑛𝑛
=12
× � (� � 𝐹𝐹𝐹𝐹𝐺𝐺𝑤𝑤(𝐺𝐺, 𝑆𝑆,𝑇𝑇)𝑛𝑛
−� 𝐹𝐹𝐹𝐹𝐺𝐺𝑤𝑤(𝐺𝐺, 𝑆𝑆,𝑇𝑇)𝑝𝑝
) × 𝐻𝐻𝑚𝑚𝑛𝑛𝑝𝑝,𝑚𝑚
𝑇𝑇𝐺𝐺𝐺𝐺𝐺𝐺𝑆𝑆𝑇𝑇𝐺𝐺𝑆𝑆𝐺𝐺𝑆𝑆𝐺𝐺𝐺𝐺 𝐹𝐹𝐺𝐺𝑆𝑆𝑆𝑆 = � � 𝐹𝐹𝐹𝐹𝐺𝐺𝑤𝑤 𝐺𝐺, 𝑆𝑆,𝑇𝑇 − 𝐹𝐹𝐹𝐹𝐺𝐺𝑤𝑤(𝑆𝑆, 𝐺𝐺,𝑇𝑇)𝑛𝑛
× 𝐷𝐷𝐺𝐺𝑆𝑆𝐺𝐺𝐺𝐺𝐺𝐺𝑆𝑆𝐺𝐺𝐺𝐺𝑆𝑆 𝐺𝐺, 𝑆𝑆 × 𝑇𝑇𝐹𝐹𝐺𝐺𝑆𝑆𝑆𝑆 𝐺𝐺, 𝑆𝑆 × 𝐻𝐻𝑇𝑇𝑛𝑛,𝑝𝑝,𝑚𝑚
𝑈𝑈𝐺𝐺𝐺𝐺𝐹𝐹𝐺𝐺𝑈𝑈𝐺𝐺𝐺𝐺𝐺𝐺𝐺𝐺𝐺𝐺 𝐺𝐺𝐺𝐺𝐺𝐺𝐺𝐺,𝑓𝑓𝐹𝐹𝐺𝐺𝑤𝑤 𝑏𝑏𝐺𝐺𝑆𝑆𝐺𝐺𝑑𝑑 =𝑇𝑇𝐺𝐺𝐺𝐺𝐺𝐺𝑆𝑆𝑇𝑇𝐺𝐺𝑆𝑆𝑆𝑆𝐺𝐺𝐺𝐺𝐺𝐺 𝑓𝑓𝐹𝐹𝐺𝐺𝑤𝑤 (𝑇𝑇𝑇𝑇𝑇)
𝑇𝑇𝐺𝐺𝐺𝐺𝐺𝐺𝑆𝑆𝑇𝑇𝐺𝐺𝑆𝑆𝑆𝑆𝐺𝐺𝐺𝐺𝐺𝐺 𝑆𝑆𝐺𝐺𝑆𝑆𝐺𝐺𝑆𝑆𝐺𝐺𝐺𝐺𝑦𝑦 (𝑇𝑇𝑇𝑇𝑇)=∑ (∑ 𝐹𝐹𝐹𝐹𝐺𝐺𝑤𝑤 𝐺𝐺, 𝑆𝑆,𝑇𝑇 − 𝐹𝐹𝐹𝐹𝐺𝐺𝑤𝑤 𝑆𝑆, 𝐺𝐺,𝑇𝑇𝑛𝑛 × 𝐻𝐻𝑇𝑇)𝑝𝑝,𝑚𝑚
∑ (∑ 𝑇𝑇𝐺𝐺𝐺𝐺𝐺𝐺𝑆𝑆𝑇𝑇𝐺𝐺𝑆𝑆𝑆𝑆𝐺𝐺𝐺𝐺𝐺𝐺 𝑆𝑆𝐺𝐺𝑆𝑆𝐺𝐺𝑆𝑆𝐺𝐺𝐺𝐺𝑦𝑦 (𝐺𝐺,𝑆𝑆)𝑛𝑛 × 8760)𝑝𝑝
𝑈𝑈𝐺𝐺𝐺𝐺𝐹𝐹𝐺𝐺𝑈𝑈𝐺𝐺𝐺𝐺𝐺𝐺𝐺𝐺𝐺𝐺 𝐺𝐺𝐺𝐺𝐺𝐺𝐺𝐺, 𝐺𝐺𝑇𝑇𝑆𝑆𝐺𝐺𝐺𝐺𝐺𝐺 𝑏𝑏𝐺𝐺𝑆𝑆𝐺𝐺𝑑𝑑 =𝑇𝑇𝐺𝐺𝐺𝐺𝐺𝐺𝑆𝑆𝑇𝑇𝐺𝐺𝑆𝑆𝑆𝑆𝐺𝐺𝐺𝐺𝐺𝐺 𝐺𝐺𝑇𝑇𝑆𝑆𝐺𝐺𝐺𝐺𝐺𝐺𝑆𝑆(𝑇𝑇𝑇𝑇𝑇)𝑇𝑇𝐺𝐺𝐺𝐺𝐺𝐺𝑆𝑆𝑇𝑇𝐺𝐺𝑆𝑆𝑆𝑆𝐺𝐺𝐺𝐺𝐺𝐺 𝑆𝑆𝐺𝐺𝑆𝑆𝐺𝐺𝑆𝑆𝐺𝐺𝐺𝐺𝑦𝑦 (𝑇𝑇𝑇𝑇𝑇)
=∑ ((∑ ∑ 𝐹𝐹𝐹𝐹𝐺𝐺𝑤𝑤(𝐺𝐺,𝑆𝑆,𝑇𝑇)𝑛𝑛 − ∑ 𝐹𝐹𝐹𝐹𝐺𝐺𝑤𝑤(𝐺𝐺,𝑆𝑆,𝑇𝑇)𝑝𝑝𝑛𝑛 2) × 𝐻𝐻𝑇𝑇)⁄𝑝𝑝,𝑚𝑚
∑ (∑ 𝑇𝑇𝐺𝐺𝐺𝐺𝐺𝐺𝑆𝑆𝑇𝑇𝐺𝐺𝑆𝑆𝑆𝑆𝐺𝐺𝐺𝐺𝐺𝐺 𝑆𝑆𝐺𝐺𝑆𝑆𝐺𝐺𝑆𝑆𝐺𝐺𝐺𝐺𝑦𝑦 (𝐺𝐺, 𝑆𝑆)𝑛𝑛 × 8760)𝑝𝑝
* 𝐹𝐹𝐹𝐹𝐺𝐺𝑤𝑤(𝐺𝐺,𝑆𝑆,𝑇𝑇) represents the power flow tranferred from node n to p at time slice m * 𝐻𝐻𝑚𝑚 represents the hours in each time slice in ReEDS, where m is one of 17 time slices per year in ReEDS * Transmission losses are not accounted in the calculation of transmission flow and net imports

23
Appendix 2. Transmission capacity & Transmission flow
Transmission Capacity by year (GW-mi) Transmission Flow by year (GW)

24
Appendix 3. Transmission losses & Net imports
Transmission losses by year (TWh) Transmission Import by year (GW)

25
Appendix 4. Transmission utilization rate
Utilization Rate based on Transmission Flow Utilization Rate based on Transmission Imports

26
Appendix 5. Transmission flow, import, losses & utilization rate
Transmission Losses in 2050 (TWh)
Transmission Flow in 2050 (GW) Transmission Import in 2050 (GW)
Utilization Rate in 2050 (%)

27
Appendix 6. Final transmission capacity & transmission investment for the Reference scenario
Approximate DC Flow Pipe Flow
Final Transmission
Transmission Investment

28
Appendix 7. Transmission investment for HiVG & HiVG_hurdle
Approximate DC Flow Pipe Flow
HiVG
HiVG_ hurdle

29
Appendix 8. Transmission investment for HiVG_HiTrans & HiVG_NoTrans
Approximate DC Flow Pipe Flow
HiVG_ HiTrans
HiVG_ NoTrans

30
Appendix 9. National generation difference between scenarios

31
Appendix 10: Regional wind capacity differences in 2050
• National Wind capacity is consistently lower as transmission becomes more constrained. • Main decrease occurs Iowa, Illinois and Indiana, whereas Michigan and Ohio generally have
increased wind capacity: a move from higher-quality, more remote wind locations to slightly-lower-quality wind resource locations that are closer to load centers.
32
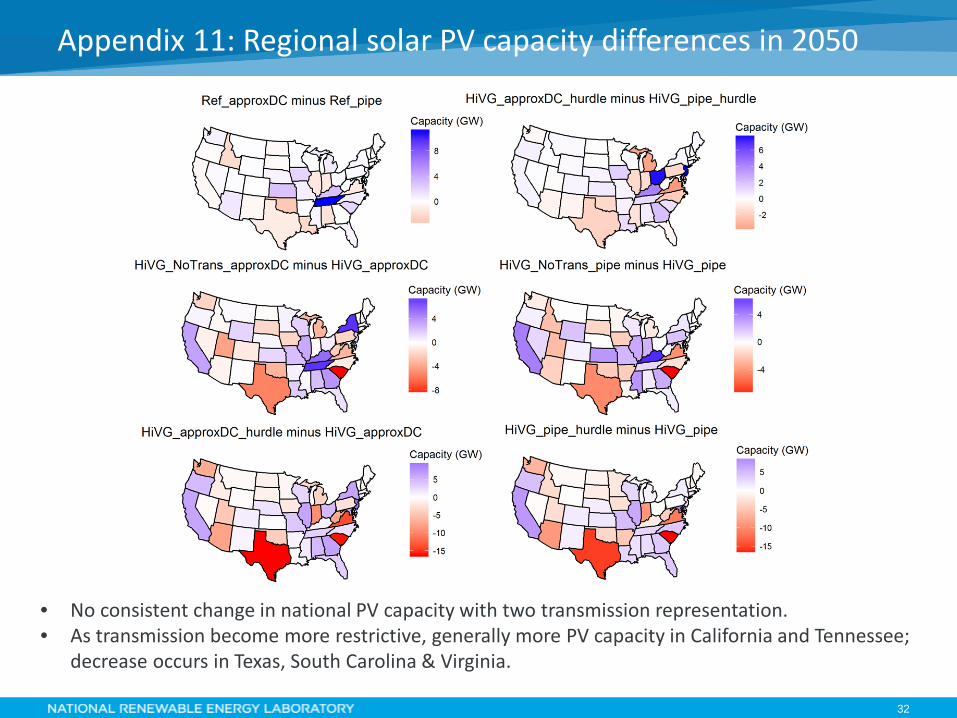
Appendix 11: Regional solar PV capacity differences in 2050
• No consistent change in national PV capacity with two transmission representation. • As transmission become more restrictive, generally more PV capacity in California and Tennessee;
decrease occurs in Texas, South Carolina & Virginia.
Related Documents