General rights Copyright and moral rights for the publications made accessible in the public portal are retained by the authors and/or other copyright owners and it is a condition of accessing publications that users recognise and abide by the legal requirements associated with these rights. Users may download and print one copy of any publication from the public portal for the purpose of private study or research. You may not further distribute the material or use it for any profit-making activity or commercial gain You may freely distribute the URL identifying the publication in the public portal If you believe that this document breaches copyright please contact us providing details, and we will remove access to the work immediately and investigate your claim. Downloaded from orbit.dtu.dk on: Feb 15, 2022 Transmission dynamics of Staphylococcus aureus within two Danish dairy cattle herds Kirkeby, Carsten Thure; Zervens, Lisa Marie-Louise; Toft, N.; Schwarz, D; Farre, M; Hechinger, S; Halasa, Tariq Hisham Beshara Published in: Journal Of Dairy Science Link to article, DOI: 10.3168/jds.2018-15106 Publication date: 2019 Document Version Publisher's PDF, also known as Version of record Link back to DTU Orbit Citation (APA): Kirkeby, C. T., Zervens, L. M-L., Toft, N., Schwarz, D., Farre, M., Hechinger, S., & Halasa, T. H. B. (2019). Transmission dynamics of Staphylococcus aureus within two Danish dairy cattle herds. Journal Of Dairy Science, 102(2), 1428-1442. https://doi.org/10.3168/jds.2018-15106

Welcome message from author
This document is posted to help you gain knowledge. Please leave a comment to let me know what you think about it! Share it to your friends and learn new things together.
Transcript

General rights Copyright and moral rights for the publications made accessible in the public portal are retained by the authors and/or other copyright owners and it is a condition of accessing publications that users recognise and abide by the legal requirements associated with these rights.
Users may download and print one copy of any publication from the public portal for the purpose of private study or research.
You may not further distribute the material or use it for any profit-making activity or commercial gain
You may freely distribute the URL identifying the publication in the public portal If you believe that this document breaches copyright please contact us providing details, and we will remove access to the work immediately and investigate your claim.
Downloaded from orbit.dtu.dk on: Feb 15, 2022
Transmission dynamics of Staphylococcus aureus within two Danish dairy cattle herds
Kirkeby, Carsten Thure; Zervens, Lisa Marie-Louise; Toft, N.; Schwarz, D; Farre, M; Hechinger, S; Halasa,Tariq Hisham Beshara
Published in:Journal Of Dairy Science
Link to article, DOI:10.3168/jds.2018-15106
Publication date:2019
Document VersionPublisher's PDF, also known as Version of record
Link back to DTU Orbit
Citation (APA):Kirkeby, C. T., Zervens, L. M-L., Toft, N., Schwarz, D., Farre, M., Hechinger, S., & Halasa, T. H. B. (2019).Transmission dynamics of Staphylococcus aureus within two Danish dairy cattle herds. Journal Of DairyScience, 102(2), 1428-1442. https://doi.org/10.3168/jds.2018-15106
1428
ABSTRACT
Staphylococcus aureus is a major pathogen causing intramammary infections (IMI) in dairy cattle herds worldwide. Simulation models can be used to investi-gate the epidemiologic and economic outcomes of dif-ferent control strategies against IMI. The transmission rate parameter is one of the most influential parameters on the outcomes of these simulation models. Very few studies have estimated the transmission rate parameter and investigated the transmission dynamics of Staph. aureus IMI in dairy cattle herds. The objective of our study was therefore to analyze the transmission dynam-ics of Staph. aureus in 2 Danish dairy herds participat-ing in a longitudinal study. The 2 herds had 180 and 360 milking cows, and animals were tested at quarter level once per month over a period of 1 yr. We esti-mated the quarter-level prevalence to be 34% for herd 1 and 2.57% for herd 2. The daily quarter-level transmis-sion rate was estimated to be 0.0132 and 0.0077 cases/quarter-day for herds 1 and 2, respectively, and the me-dian duration of infection was estimated to be 91 and 64 d for herds 1 and 2, respectively. We also estimated the reproductive ratio at 1.21 for herd 1 and 0.52 for herd 2. The results can provide valuable information for simulation models to aid decision-making in terms of the prevention and control of Staph. aureus IMI in dairy cattle herds.Key words: dairy cattle, mastitis, transmission dynamics, Staphylococcus aureus
INTRODUCTION
Mastitis is one of the most widespread and costly diseases in dairy herds worldwide (Halasa et al., 2007; Schwarz et al., 2010). Cows with mastitis or IMI can
have an increased SCC, decreased milk quality, and impaired performance. If cows develop clinical signs, they must be treated or culled and the milk must be discarded, with milk loss potentially continuing even after recovery (Gröhn et al., 2004; Hertl et al., 2014).
To prevent the spread of pathogens among cows, con-trol of contagious IMI pathogens in dairy herds requires consistent management actions such as postmilking teat dipping, antibiotic treatment, and culling of in-fected animals (Hillerton et al., 1995). These manage-ment strategies can be simulated in prediction models to investigate the epidemiological and economic effects of the actions against IMI (Lam et al., 1996; Seegers et al., 2003; van den Borne et al., 2010; Halasa, 2012; Gussmann et al., 2018). The spread of pathogens can be simulated based on knowledge of the transmission dynamics in a herd (Kirkeby et al., 2017).
Contagious pathogens that cause IMI (such as Staphylococcus aureus) are believed to be transmit-ted between lactating cows primarily through milking equipment (Harmon, 1994). When modeling the spread of Staph. aureus, the transmission rate, number of infec-tious animals, and total number of lactating cows can be used to estimate the probability of infection (Halasa et al., 2009). The number of new IMI cases is therefore highly dependent on the transmission rate, which can have a considerable influence on the model predictions (Halasa et al., 2009; Down et al., 2013). Furthermore, variation in the estimated transmission rates may affect the cost-effectiveness of simulated control actions. In addition, it is important to estimate the transmission rate under different levels of prevalence to investigate the epidemiological effect and cost-effectiveness of con-trol measures at these levels. A measure that might be cost-effective at a high prevalence level might not be cost effective at a low level simply because the infec-tious pressure would be different.
Transmission rates can be estimated from longitudi-nal studies, in which a population of lactating cows is followed over time and samples are collected and tested
Transmission dynamics of Staphylococcus aureus within two Danish dairy cattle herdsC. Kirkeby,1,2* L. Zervens,1 N. Toft,1 D. Schwarz,3 M. Farre,4 S. Hechinger,5 and T. Halasa1,21Division for Diagnostics and Scientific Advice, National Veterinary Institute, Technical University of Denmark, 2800 Kgs. Lyngby, Denmark2Department of Veterinary and Animal Sciences, Faculty of Health and Medical Sciences, University of Copenhagen, 1870 Frederiksberg, Denmark3Foss Analytical A/S, Foss Allé 1, 3400 Hillerød, Denmark4SEGES Livestock Innovation, 8200 Aarhus, Denmark5Landesbetrieb Hessisches Landeslabor (LHL), Schubertstraße 60, Haus 13 35392, Gießen, Germany
J. Dairy Sci. 102:1428–1442https://doi.org/10.3168/jds.2018-15106© 2019, The Authors. Published by FASS Inc. and Elsevier Inc. on behalf of the American Dairy Science Association®. This is an open access article under the CC BY-NC-ND license (http://creativecommons.org/licenses/by-nc-nd/4.0/).
Received May 23, 2018.Accepted October 19, 2018.*Corresponding author: ckir@ sund .ku .dk
Journal of Dairy Science Vol. 102 No. 2, 2019
TRANSMISSION DYNAMICS OF STAPHYLOCOCCUS AUREUS 1429
regularly (e.g., Lam et al., 1996; Zadoks et al., 2001a; Barlow et al., 2013; Leelahapongsathon et al., 2016). The more sampling points (time points for sampling) available, the more precisely the transmission rate can be estimated. However, such longitudinal studies are costly and difficult to undertake, which is why few stud-ies have been conducted. To the best of our knowledge, only 5 studies have estimated the transmission rate of Staph. aureus within dairy cattle herds (Lam et al., 1996; Zadoks et al., 2002; Barlow et al., 2013; Schukken et al., 2014; van den Borne et al., 2017). Such studies are needed to minimize the uncertainty of predictions of simulation models.
The objective of our study was to investigate the transmission dynamics of Staph. aureus in 2 Danish dairy herds—one with low prevalence and one with high prevalence—from a longitudinal study over 1 yr using monthly sampling intervals. Furthermore, the duration of infection and the basic reproductive ratio (R0) for Staph. aureus were estimated and compared for the 2 studied herds.
MATERIALS AND METHODS
Animals and Farms
Milk samples were collected every month between January 2017 and January 2018 from 2 conventional dairy herds with side-by-side milking parlors located in the central region of Jutland, Denmark (Tables 1 and 2). This sampling interval was chosen as a compromise between sampling often enough to detect new infections before a possible recovery (allowing for estimation of transmission rate and duration of infection), covering all seasons to investigate the transmission throughout the year, and keeping a reasonable budget. The aver-age herd size in Denmark is 180 lactating cows, and
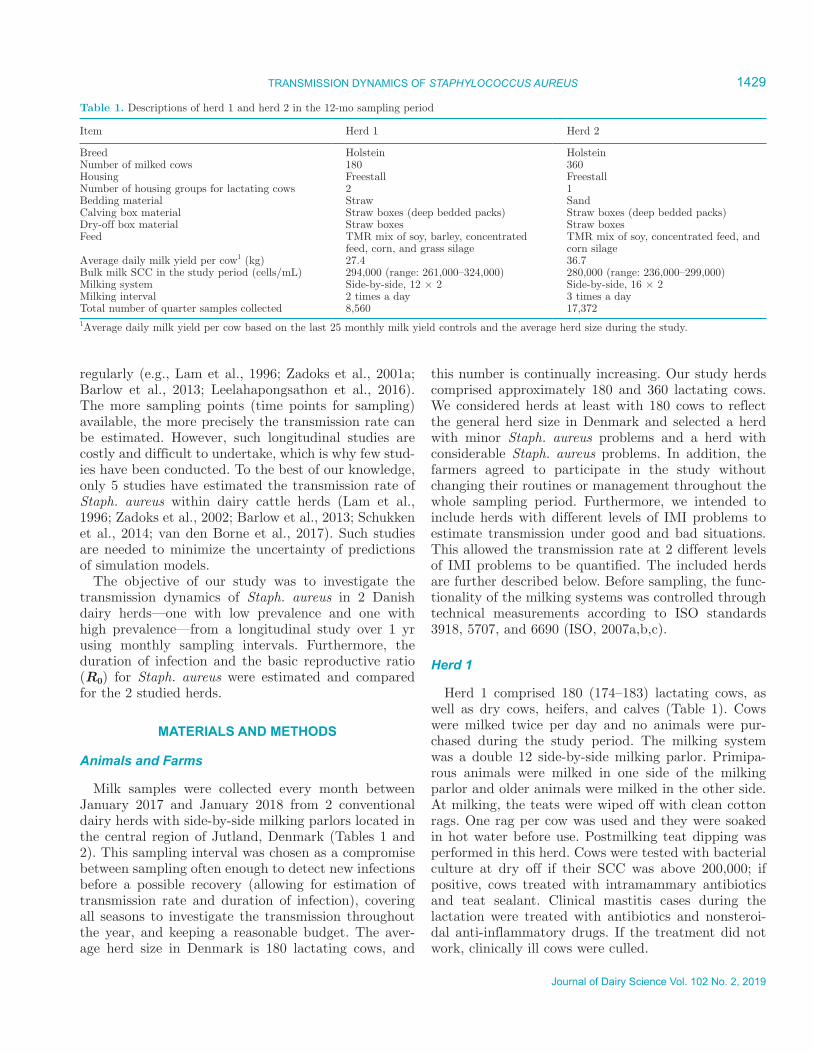
this number is continually increasing. Our study herds comprised approximately 180 and 360 lactating cows. We considered herds at least with 180 cows to reflect the general herd size in Denmark and selected a herd with minor Staph. aureus problems and a herd with considerable Staph. aureus problems. In addition, the farmers agreed to participate in the study without changing their routines or management throughout the whole sampling period. Furthermore, we intended to include herds with different levels of IMI problems to estimate transmission under good and bad situations. This allowed the transmission rate at 2 different levels of IMI problems to be quantified. The included herds are further described below. Before sampling, the func-tionality of the milking systems was controlled through technical measurements according to ISO standards 3918, 5707, and 6690 (ISO, 2007a,b,c).
Herd 1
Herd 1 comprised 180 (174–183) lactating cows, as well as dry cows, heifers, and calves (Table 1). Cows were milked twice per day and no animals were pur-chased during the study period. The milking system was a double 12 side-by-side milking parlor. Primipa-rous animals were milked in one side of the milking parlor and older animals were milked in the other side. At milking, the teats were wiped off with clean cotton rags. One rag per cow was used and they were soaked in hot water before use. Postmilking teat dipping was performed in this herd. Cows were tested with bacterial culture at dry off if their SCC was above 200,000; if positive, cows treated with intramammary antibiotics and teat sealant. Clinical mastitis cases during the lactation were treated with antibiotics and nonsteroi-dal anti-inflammatory drugs. If the treatment did not work, clinically ill cows were culled.
Table 1. Descriptions of herd 1 and herd 2 in the 12-mo sampling period
Item Herd 1 Herd 2
Breed Holstein HolsteinNumber of milked cows 180 360Housing Freestall FreestallNumber of housing groups for lactating cows 2 1Bedding material Straw SandCalving box material Straw boxes (deep bedded packs) Straw boxes (deep bedded packs)Dry-off box material Straw boxes Straw boxesFeed TMR mix of soy, barley, concentrated
feed, corn, and grass silageTMR mix of soy, concentrated feed, and corn silage
Average daily milk yield per cow1 (kg) 27.4 36.7Bulk milk SCC in the study period (cells/mL) 294,000 (range: 261,000–324,000) 280,000 (range: 236,000–299,000)Milking system Side-by-side, 12 × 2 Side-by-side, 16 × 2Milking interval 2 times a day 3 times a dayTotal number of quarter samples collected 8,560 17,3721Average daily milk yield per cow based on the last 25 monthly milk yield controls and the average herd size during the study.

1430 KIRKEBY ET AL.
Journal of Dairy Science Vol. 102 No. 2, 2019
The bedding material in the freestalls was straw and the feed was a TMR consisting of soy, barley, concen-trate, corn, and grass silage. From March to August 2017, a problem with mycotoxins in the feed occurred, and from July on the animals were given an antidote. From August 20, 2017, all silage used on the farm was replaced with a new silage product to avoid toxins in the feed. During the study period, herd 1 had a mean bulk milk SCC of 294,000 (range = 261,000–324,000 cells/mL).
Herd 2
Herd 2 comprised 360 (334–396) lactating cows, as well as dry cows, heifers, and calves (Table 1). The milking system was a double 16 side-by-side milking parlor and sand was used as bedding material. Milking personnel used gloves and the teats were wiped off with clean rags (one per cow); postmilking teat dipping was not performed. Cows were treated with intramammary antibiotics and teat sealant if positive by bacterial culture at dry off. Clinical infections during lactation were treated with antibiotics and nonsteroidal anti-inflammatory drugs. If this treatment did not work,
the clinically ill cow was culled. Cows were milked 3 times per day and the feed was a TMR mix of soy, concentrate, and corn silage. This herd was closed until mid-November 2017, when 30 animals were purchased from another farm. These animals were included in sampling from December 4, 2017. During the study period, herd 2 had a mean bulk milk SCC of 280,000 (range = 236,000–299,000 cells/mL).
Collection of Quarter Milk Samples
Quarter foremilk samples were collected in accor-dance with NMC standards (http: / / www .nmconline .org/ sampling .htm). Specifically, a premilking teat preparation product was used to dissolve dirt and thereby ensure proper cleaning of the quarters. In herd 1, a foaming teat wipe-off product (Viri Foam,Novadan ApS, Kolding, Denmark) was sprayed onto the teats. In herd 2, teats were predipped using milk wash from Trinol (Hobro, Denmark). Teats were then cleaned with cotton towels soaked in water and a minimum of 4 squirts of milk were discarded from each quarter. The teats were then sanitized using single-service wet wipes (MS Lavettes, MS Schipper, Bladel, the Netherlands)
Table 2. Sampling dates, length of sampling intervals, number of quarter samples, and number of cows sampled in the study1
Date2 IntervalNo. of cows
No. of cows with single quarter
infections
No. of cows with multiple quarter
infections
Herd 1 16.01.2017 — 180 45 57 13.02.2017 28 181 52 62 14.03.2017 29 175 45 73 10.04.2017 27 177 48 74 08.05.2017 28 169 42 71 12.06.2017 35 179 39 70 10.07.2017 28 180 42 49 14.08.2017 35 178 56 49 11.09.2017 28 178 42 46 09.10.2017 28 174 42 62 13.11.2017 35 183 45 65 11.12.2017 28 181 48 64Herd 2 06.02.2017 — 347 29 5 06.03.2017 28 358 27 6 03.04.2017 28 360 25 8 01.05.2017 28 360 26 7 06.06.2017 36 344 33 6 03.07.2017 27 334 20 3 07.08.2017 35 354 12 3 04.09.2017 28 359 15 2 02.10.2017 28 364 12 1 06.11.2017 35 371 10 2 04.12.2017 28 396 17 4 08.01.2017 35 392 23 91The positive are separated here in single quarter and multiple quarter infections. The actual numbers of in-fected quarters are described in Appendix Tables A1, A2, A3, and A4.2Date format: day, month, year.

Journal of Dairy Science Vol. 102 No. 2, 2019
TRANSMISSION DYNAMICS OF STAPHYLOCOCCUS AUREUS 1431
soaked in 90% ethanol, using one towel per teat. Clean-ing started with teats on the far side of the udder. Teat ends were cleaned until no more dirt appeared on the wipe. The teats were then sprayed with 90% ethanol and left to air dry for a minimum of 30 s before sampling. Prelabeled sterile sample vials were used for sampling (Sarstedt, 62.554.002, 15 mL, 120 × 17 mm sterile tubes, Nümbrecht, Germany). The sample vial was filled with up to 15 mL of milk and immediately recapped. Sampling started at the nearest teat and progressed to the teats on the far side of the udder. Samples were stored in thermally insulated boxes with cooling elements for shipment to the laboratory and were processed within 36 h of sample collection. Samples were preserved with 0.5% boric acid (Heeschen et al., 1969; International Dairy Federation, 1981) and shipped to another laboratory in thermally insulated boxes with cooling elements for bacteriological analysis and processed within 48 h of collection.
Laboratory Analysis
Culture and identification of isolates were performed at Landesbetrieb Hessisches Landeslabor (LHL), Gießen, Germany, according to the DVG (German Vet-erinary Association, 2009) guidelines for the isolation and identification of IMI-causing pathogens. The DVG guidelines are based on recommendations given by Ho-gan et al. (1999) and Pedersen et al. (1981). A sterile glass loop was used to streak 10 µL of each milk sample per quarter of a plate (1 plate per cow). Milk samples were cultured on cattle blood agar containing 0.1% es-culine (CBA; Oxoid, Wesel, Germany) at 37°C under aerobic conditions for up to 48 h. Plates were read after 24 and 48 h. If a minimum of 1 colony was present in the sample, it was identified as positive. Phenotypic characterization was performed by standard micro-biological procedures on single representative colonies of each morphologically distinct isolate. Hemolytic properties and esculine degradation properties of the bacteria were examined on CBA. Microscopic examina-tions of fixed smears of the isolates were performed using Gram stain. Gram staining was done according to the Hucker method, as described previously (Gerhardt et al., 1994). Cell morphological features were observed under a Leitz Diaplan light microscope at ×1,000, with cells grown for at least 18 h at 37°C on CBA. Bacterial colonies were tested for catalase activity with 3% H2O2 on microscopic slides and for presence of cytochrome oxidase with the BBL DrySlide Oxidase system (Bec-ton Dickinson, Heidelberg, Germany). As Streptococcus agalactiae displays a regular Christie, Atkins, Munch-Petersen (CAMP) phenomenon (Hensler et al., 2008)
when tested with an orthogonally growing Staph. au-reus (ATCC 25923, American Type Culture Collection; Manassas, VA), this test was routinely carried out. Presumptive identification of streptococci was based on the aforementioned criteria as well as on confirmation with Lancefield group antigen-specific Streptococcus antisera (Phadebact, MKL Diagnostics AB, Sollen-tuna, Sweden). Final confirmation of presumptive iden-tification was done by MALDI-TOF (Barreiro et al., 2010). Bacterial isolates representing putative mastitis pathogens as well as concomitant bacterial microbiota were selected from the culture plates and then directly transferred to steel targets according to the manufac-turer’s instructions (BrukerBiotyper, Bruker Daltonik, 2012). Isolates were prepared using the direct smear method and analyzed on a Bruker Microflex LT system by MALDI-TOF MS using Biotyper Version V3.3.1.0 (DB 5989, Bruker Daltonik, 2012). The MALDI Bio-typer real-time classification software considers MAL-DI scores >2.3 and >2.0 as secure species and genus identification levels, respectively. Colony-forming units per milliliter measures were not obtained. Plates were defined as contaminated if 4 or more phenotypically different bacterial species were found.
Statistical Analysis
Data Management. Analyses were carried out in R 3.5.1 “Feather spray” (R Core Team, 2018). We obtained data from the Danish cattle database on the dates of drying off for each cow during the study period. Quarter-level prevalence was calculated per sampling day based on the bacterial culture result. Cow-level prevalence was calculated on the basis that a cow was infected if one of its quarters was positive. A quarter with a positive Staph. aureus result that followed a negative result was considered to be a new IMI case. Cows that had a negative result at the dry off sample and a positive one in the first sample after calving were also considered new IMI cases.
The following assumptions were used to correct missing data points. A missing value between 2 posi-tive samples was considered positive; a missing value between 2 negative samples was considered negative; and, for simplicity, missing values between any nega-tive and positive samples were considered negative. In addition, if a quarter had a negative test between 2 positive samples, we corrected it to positive assuming a false-negative result due to imperfect test sensitivity (e.g., Mahmmod et al., 2013) or the potential intermit-tent shedding pattern known for Staph. aureus (Sears et al., 1990). Infections were regarded as cured when a negative test result occurred after a positive test

1432 KIRKEBY ET AL.
Journal of Dairy Science Vol. 102 No. 2, 2019
and no positive test followed after that. We did not consider that heifers could be infected before introduc-tion to the herd; thus, all infections that were observed were regarded as new infections unless the animal had previously been positive. The cured animals in this analysis comprise both spontaneously cured animals and treated animals. No animals were treated due to subclinical mastitis, but all clinically infected animals were treated with antibiotics for 3 d. For this reason, we were not able to separate the flare-up rate (from subclinical to clinical) from the spontaneously cured animals. For each sampling point, we calculated the number of transient infections. Transient infections were defined as positive test results that were preceded and followed by a negative result. We also calculated the number of new infections in quarters on cows that did not have a previous Staph. aureus infection and the number of infections in quarters on cows that did have a previous Staph. aureus infection. Furthermore, we calculated the number of infections that were cured at each sampling point.
Estimation of Transmission Rates. Poisson re-gression is often used to estimate the transmission rates in studies of mastitis causing pathogens (e.g., Zadoks et al., 2001a; Leelahapongsathon et al., 2016). However, 2 other methods were recently published and tested for precision against the Poisson regression (Kirkeby et al., 2017). The 2 new methods proved better than Poisson regression when the transmission rate was high (above 0.025) and when the sampling intervals were large (about 2 wk). No regimens were found where the Poisson regression performed better than the 2 new methods. We used 3 methods for estimating the transmission rates for Staph. aureus to compare the es-timated rates with those of previous studies and to use the 2 new methods that should perform better in some cases. The first method used was Poisson regression, which assumes that every newly infected individual (we regarded the quarters as individuals) is infected half-way between 2 sampling points. We calculated quarter days at risk between every sampling point. Deviating from the methods of Zadoks et al. (2001a), we did not have farmer-collected samples and clinical mastitis data available to adjust the quarter days at risk and infected quarter days: the number of susceptible quarters was multiplied by the length of the sampling interval, and the number of new infections multiplied by half of the length of the sampling interval was then subtracted. We included data on the dry off period and calving data for each cow to adjust the number of susceptible and infected quarters available, so that a cow would not be included in the analysis if it was not milking. Thus, we excluded all cows during the dry period and the first week postcalving. Likewise, we calculated the number
of infected quarter days for each sampling period. We used the following equation for the Poisson regression:
log( ) log( ) log ,int int
intI
S INN
� = +
β [1]
where log( )IN� is the expected log number of new infec-
tions per sampling interval, β is the transmission rate, Sint is the number of susceptible quarter days at risk, Iint is the number of infectious quarter days, and Nint is the total number of lactating quarter days (see also Lam et al., 1996). Confidence intervals were calculated as mean ±1.96 ∙ SE.
As mentioned above, we also used 2 recently described methods for estimating the transmission rate, named method 1 and method 2 for convenience (Kirkeby et al., 2017). These 2 methods do not make assumptions about the number of days the animals are present in the herd between the samplings. Furthermore, they only use information from the sampling points and are therefore more straightforward than the Poisson regression method. Therefore, it is not necessary to estimate the number of susceptible quarter days at risk or the number of infectious quarter days, and it is not necessary to use regression because a new estimate is calculated for each sampling interval. Because of these reasons, the new methods are simpler than the Poisson regression; however, it is still necessary to calculate the number of new infections for each sampling point. Prac-tically, these methods are used to estimate the trans-mission rate for each sampling interval using equations [2] or [3], giving an estimate for each sampling interval. The overall estimate of the transmission rate for each of the 2 methods is then mean of these estimates. We first used method 1 to estimate the transmission rate for each sampling interval:
β =− −log( / )
/,
1 I ITS N
N [2]
where β is the transmission rate, IN is the number of new infections since the previous sampling, I is the number of infected quarters at each sampling point, T is the length of the sampling interval (days), S is the number of susceptible quarters at each sampling point, and N is the total number of animals at each sampling point. We therefore obtained an estimate of the trans-mission rate for each sampling interval.
Likewise, method 2 is given by
β = − − +
11
1 1T
II SNlog , [3]

Journal of Dairy Science Vol. 102 No. 2, 2019
TRANSMISSION DYNAMICS OF STAPHYLOCOCCUS AUREUS 1433
where the abbreviations are the same as in equation [2]. This method also yields an estimate of the transmission rate for each sampling interval. These 2 methods were derived to perform optimally under equilibrium condi-tions and do not assume that infections occur halfway between sampling points. Method 2 also allows for multiple infection and spontaneous cure events between sampling points. These 2 methods were previously eval-uated on simulated IMI data and were found to perform as well as or better than the Poisson regression method (Kirkeby et al., 2017). To derive confidence intervals for the transmission rate estimated for each sampling period using method 1 and method 2, we subsampled the quarter samples. We did this by sampling 75% of the quarters without replacement and calculating the transmission rate estimate for these quarters for each sampling point. We repeated this procedure 1,000 times to yield a proper estimate of the density distribution of the transmission rate. We then calculated the 95% confidence intervals for this distribution.
In herd 1, the primiparous cows were kept separate from multiparous cows and milked separately, as de-scribed above. This presented the opportunity to subset the data and estimate the transmission rate in both subgroups of herd 1. We tested if the estimated dis-tributions of transmission rates were different using a z-test.
We have included a practical example of the R code for estimating the transmission rates with the 3 dif-ferent methods (Supplemental File; https: / / doi .org/ 10 .3168/ jds .2018 -15106). We have also included the full code for the analyses in this study.
Estimation of the Duration of Infection. We investigated the duration of Staph. aureus infection at quarter level using the survfit function with default ar-guments in the survival package in R (Therneau, 2015). To estimate the duration of infection for subclinical cows, we calculated the duration of all new Staph. au-reus quarter infections in the data. We used the register data with the dry period for all cows, as cows were not sampled during this period, to correct the data for the survival analysis. We assumed that quarters that were positive before and after the dry period were positive during the entire dry period. Quarters that were posi-tive at dry off and negative after calving were consid-ered to be cured at the sample after calving.
To find the duration of infection, we conducted Kaplan-Meier survival analyses, following all new in-fections through the study period in both herds. We obtained the median duration of infection from the Kaplan-Meier analyses, taking into account that the data are right censored (e.g., when cows were culled or the study ended). Each infection was assumed to start halfway between 2 sampling points, and end
halfway between 2 sampling points. After estimating the survival curves for Staph. aureus in each herd, we tested whether the curves were significantly different using a 2-sample log-rank Mantel-Haenszel test as per Harrington and Fleming (1982).
Basic Reproductive Ratio. We estimated the number of new Staph. aureus infections arising from one infectious individual (quarter) in each herd accord-ing to the procedure described by Lam et al. (1996):
R0 = ⋅β τ, [4]
where β is the transmission rate and τ is the duration of infection. For both herds, we extracted the mean and standard error from all 3 methods for estimating the transmission rate and used these to simulate 1,000 estimates of the transmission rate with the rnorm func-tion in R. We then fitted an exponential function to the survival data using the lm function in R, and estimated the standard error around the mean from this func-tion. We used the mean and standard error estimates to simulate 1,000 estimates of the duration of infection with the rnorm function in R. We then multiplied the 1,000 estimates of transmission rates with the 1,000 estimates of the duration of infection, creating a distri-bution of R0. From this distribution, we extracted the mean and 95% confidence interval.
RESULTS
In total, 7,466 milk samples were collected from herd 1 and 15,104 from herd 2 (Tables A1 to A4). In herd 1, a median of 217 quarters (160–252) were found to be infected with Staph. aureus at each sampling point (Table A1) and a median of 50 new quarter infections (9–73) were detected. This corresponds to a mean quarter prevalence of 34.0% (range = 25.6–40.9). In herd 1, only 1 sample on each of the dates 13.11.2017 and 11.12.2017 (date format: day, month, year) was found contaminated and discarded from the analysis. We observed 218 missing samples between 2 negative samples and 58 missing samples between a negative and a positive sample, which we corrected to be negative. The mean number of transient infections was 15.5 per sampling interval (mean = 7% of all infections at each sampling), and the mean number of cured infections was 30 per sampling interval (mean = 14% of all infec-tions at each sampling). At cow level, a median of 110 cows (range = 88–122) were infected at each sampling, corresponding to a mean cow-level prevalence of 69.3% (range = 56.8–84.0).
In herd 2, a median of 34 (14–45) quarters were found to be infected with Staph. aureus at each sampling point

1434 KIRKEBY ET AL.
Journal of Dairy Science Vol. 102 No. 2, 2019
and a median of 5 new quarter infections (0–20) were detected (Table A4). This corresponds to a mean quar-ter prevalence of 2.57% (range = 1–3.4). In herd 2, only 1 sample on each of the dates 06.03.2017, 07.08.2017, and 04.09.2017 was found contaminated and discarded from the analysis. We noted 573 missing samples between 2 negative samples and 12 missing samples between a negative and a positive sample, which we assumed to be negative. The mean number of transient infections was 2.8 per sampling interval (mean = 8% of all infections at each sampling), and the mean number of cured infections was 5.5 per sampling interval (mean = 18% of all infections at each sampling). At cow level, a median of 25.4 cows (range = 12–39) were infected at each sampling, corresponding to a mean cow-level prevalence of 11.4% (range = 3.3–30.6).
In Figure 1, we show the DIM where new infections occur. In herd 1, a peak of new infections occurred be-tween 50 and 150 DIM and then declined. In herd 2, a peak in new infections occurred around 50 to 100 DIM and another peak occurred between 200 and 350 DIM.
Transmission Rates
The estimated transmission rates are shown in Table 3. In herd 1, the transmission rate was estimated to be 0.0128 cases/quarter day for all cows, with 95% confi-dence interval of 0.01019 and 0.0162 cases/quarter day using Poisson regression. All 3 methods yielded similar estimates.
Using all 3 methods, the transmission rates for pri-miparous cows in herd 1 were found to be similar to those for multiparous cows, indicating a similar infec-tion pressure for both groups. This was supported by a z-test performed for each of the 3 estimation methods. All 3 tests showed no significant difference (data not shown).
The mean transmission rate for herd 2 was estimated to be on average 0.0077 cases/quarter day, almost half that of herd 1 (Table 3). All 3 methods yielded simi-lar results: the Poisson regression estimated the rate at 0.0089 cases/quarter day, whereas method 1 and method 2 estimated 0.0071 and 0.0072 cases/quarter
Figure 1. Frequency distributions of new infections during the lactation in herd 1 (A) and herd 2 (B).
Table 3. Estimated transmission rates (95% CI) for Staphylococcus aureus from herds 1 and 2 and the subpopulations in herd 1 (herd 2 was not divided into subpopulations)
Herd Population Poisson regression Method 1 Method 2 Mean
1 All cows 0.0128 (0.01019–0.0162) 0.0128 (0.0042–0.0213) 0.0140 (0.0043–0.0242) 0.0132 Primiparous 0.0129 (0.0102–0.0164) 0.0123 (0.0027–0.0204) 0.0133 (0.0028–0.0230) 0.0128 Multiparous 0.0130 (0.0108–0.0168) 0.0133 (0.0046–0.0247) 0.0149 (0.0048–0.0300) 0.01372 All cows 0.0089 (0.0055–0.0145) 0.0071 (0–0.0175) 0.0072 (0–0.0176) 0.0077

Journal of Dairy Science Vol. 102 No. 2, 2019
TRANSMISSION DYNAMICS OF STAPHYLOCOCCUS AUREUS 1435
day, respectively. The confidence limits for the Poisson regression estimate were narrower than those for the 2 other methods (Table 3).
Using methods 1 and 2, we obtained an estimate of the transmission rate for each sampling interval (Tables A1, A2, A3 and A4) and can therefore explore the variation in the transmission rate over the study period (Figure 2). In herd 1, the estimated transmission rate varied, but decreased and then plateaued from May onwards. This plateau more or less continued until September, when we observed a large decrease. A high peak followed in October, and the rate seemed to in-crease slightly from the low plateau. This pattern was found for both the primiparous and the multiparous cows in herd 1. We noted a similar pattern in herd 2, with a lower transmission rate between May and Octo-ber but with variation and minor peaks. From October, the transmission rate seemed to increase and surpass the level at the beginning of the study.
Survival Analysis
Kaplan-Meier analyses showed that the median duration of infection in herd 1 was 91 d (95% CI = 90–119; Figure 3A). The mean duration of infection was 161.5 with a standard error of 6.9. In herd 2, the median duration of infection was 64 d (95% CI = 36 to not applicable; Figure 3B) and the mean estimate was 112.1 with a standard error of 16.1. We found that the survival curves did not differ significantly using a log-rank test (P = 0.1).
R0
Table 4 shows the estimated R0 for herd 1 and herd 2 using the different estimation methods. Using the Poisson method, R0 was estimated at 1.16 (95% CI = 0.93–1.45) in herd 1. This indicates that, on average, an infected quarter would infect 1.16 other quarters during its entire infectious period within an entirely susceptible population. Similar estimates were observed using the 2 other estimation methods, and the mean of the 3 methods was 1.21 (Table 4). The confidence intervals of the estimates from the 3 methods overlap. In herd 2, the mean R0 was found to be 0.52 (Table 4).
DISCUSSION
The transmission rate of IMI-causing pathogens is an important parameter when using simulation models to predict the cost-effectiveness of strategies to prevent and control these pathogens within dairy cattle herds. However, transmission dynamics are rarely studied in the field, because such studies are time-consuming and
costly. Consequently, few studies have analyzed the transmission dynamics in dairy cattle herds. Therefore, our aim was to investigate these dynamics in 2 fairly large Danish dairy herds with low and high IMI preva-lence (Roberson et al., 1994, Graber et al., 2009).
The quarter-level prevalence in our study was 34 and 2.57% for herds 1 and 2, respectively (Tables A1 and A4). In previous studies of dairy herds, the quarter-level prevalence of Staph. aureus was shown to differ among herds. Sommerhäuser et al. (2003) found a prevalence of 4.2 to 11.9% in herds with moderate or high Staph. aureus problems and 24.2 to 27.1% in herds with high levels of Staph. aureus IMI. Schwarz et al. (2010) described a prevalence of 5.01% across herds in one German federal state. From these results, herd 1 in our study reflects a herd with a high prevalence of Staph. aureus and herd 2 reflects a herd with a low prevalence of Staph. aureus.
The estimated transmission rates indicate that herd 1 had a considerably higher transmission rate than herd 2; the median number of new infections per sampling round was 50 for herd 1 (Table A1) and 5 for herd 2 (Table A4). If we consider the estimate using Poisson regression, as in previous studies, the estimated trans-mission rates were 0.0128 and 0.0089 cases per quarter day for herds 1 and 2, respectively. Using Poisson re-gression, Lam et al. (1996) estimated the transmission rate in a herd to be 0.046 cases/quarter day during an outbreak and 0.0063 cases/quarter day outside the out-break period. The estimated transmission rates in our study are therefore lower than those found by Lam et al. (1996) during an outbreak. Zadoks et al. (2002) es-timated the transmission rate to be 0.007 cases/quarter day and 0.014 cases/quarter day in different herds with a Staph. aureus problem, giving similar results to those presented here, although the herds studied in Zadoks et al. (2002) were considerably smaller (67, 95, and 41 cows) than in our study. This indicates that Staph. aureus can express similar behavior in dairy herds from different countries or regions, even though certain management practices may be different, as blanket dry cow therapy was used in the Netherlands at that time (Zadoks et al., 2002) whereas selective dry cow therapy is used in Denmark.
Barlow et al. (2013) estimated the transmission rate for Staph. aureus at 0.00804 cases/quarter day and 0.00448 cases/quarter day for 2 different herds. Schuk-ken et al. (2014) estimated a monthly quarter-level transmission rate at 0.295, corresponding to 0.009 per quarter day. van den Borne et al. (2017) estimated a cow-level transmission rate at 0.0232. The estimated rates in our study are therefore similar to some of the previous findings. The herds in the studies by Lam et al. (1996) and Barlow et al. (2013) used both blanket

1436 KIRKEBY ET AL.
Journal of Dairy Science Vol. 102 No. 2, 2019
dry cow therapy and premilking teat dipping, whereas the herds in this study used selective dry cow therapy and postdipping was used in herd 1. The environmental and milking hygiene level in herd 1 were quite poor and did not change throughout the study period, which was reflected by the high transmission rate within this
herd. This information is useful when studying the eco-nomic consequences of control actions under different endemic levels of IMI. Nevertheless, herd 1 in our study should start by improving general hygiene, especially at milking, to reduce the infection pressure, before imple-menting actions such as treatment during lactation and
Figure 2. Variation in the estimated transmission rate for Staphylococcus aureus over time for herd 1 (A–F) and herd 2 (G–H) using both method 1 (Eq. 3) and method 2 (Eq. 4). Data from herd 1 is subset into all cows, primiparous cows, and multiparous cows. The thin dashed lines show the 95% CI.

Journal of Dairy Science Vol. 102 No. 2, 2019
TRANSMISSION DYNAMICS OF STAPHYLOCOCCUS AUREUS 1437
culling, as suggested by Barlow et al., (2009) and by van den Borne et al. (2010).
In herd 1, we estimated the transmission rate for both primiparous and multiparous cows and found no significant difference between the 2 subpopulations. It has previously been indicated that parity is a risk fac-tor for IMI and clinical IMI, and that multiparous cows have higher risk of infection than primiparous cows (Steeneveld et al., 2008; Breen et al., 2009). However,
this could also be an effect of older cows simply being exposed for longer time or having a lower probability of cure and therefore being infected more often. The estimated transmission rate is affected by the masti-tis management of the herd, susceptibility of animals, pathogen strain type (which was not included in the present study), and the contact rate between animals, which might differ between farms but should be fairly consistent within each farm (McCallum et al., 2001). Zadoks et al. (2001b) actually found that, at quarter level, the difference in risk of infection with Staph. au-reus between primiparous cows and multiparous cows (here cows with parity >2) was herd-specific. The risk was statistically significant in 1 of the 3 studied herds, which could be a result of the management practices of the herd. This clearly indicates that modeling the spread of Staph. aureus as well as its control and pre-vention should be herd-specific, as differences in man-agement between herds could affect the transmission dynamics and possibly the cost-effectiveness of the control strategies.
The estimated transmission rate showed peaks in the spring and autumn (Figure 2) in both herds included in our study. Transmission therefore seems to be lower during the summer, indicating seasonality in the spread of Staph. aureus (Tables A1 and A4). Earlier surveys are consistent with our findings, and Staph. aureus was not found to be an IMI problem in summer, when Co-rynebacterium pyogenes or Escherichia coli were more often reported (Hillerton, 1987; Waage et al., 1999). Farmers could use this information to focus interven-tion strategies during the winter to reduce the spread of Staph. aureus among animals. Cases of Staph. aureus clinical IMI have been shown to be the most expensive clinical cases due to high milk loss (Cha et al., 2014).
We estimated the median duration of subclinical Staph. aureus infections to be 91 and 64 d in herds 1 and 2, respectively. In the log-rank test, the curve for the duration of infection was not found to differ signifi-cantly (P > 0.05) between the 2 herds. The duration of infection is affected by the strain type of the bacteria (Haveri et al., 2005) and by the ability of the farmer to detect and treat or cull infected animals. Methods for detecting subclinically infected cows include evaluating the milk production and the SCC followed by diagnos-tic testing. The farmer should ideally then follow up on
Figure 3. Kaplan-Meier plot showing the duration of Staphylococcus aureus infections in quarters in herds 1 (A) and 2 (B). Thin dashed lines show the 95% confidence interval.
Table 4. The estimated reproductive ratio (R0) for each herd in the study; mean values with 95% CI are shown in parentheses
Herd Poisson regression Method 1 Method 2 Mean
1 1.16 (0.93–1.45) 1.16 (0.20–2.13) 1.30 (0.18–2.42) 1.212 0.59 (0.35–0.94) 0.48 (0–1.24) 0.48 (0–1.23) 0.52

1438 KIRKEBY ET AL.
Journal of Dairy Science Vol. 102 No. 2, 2019
individual cows with high SCC. In both herds, most of the infections lasted between 1 and 2 mo (Figure 4), showing that the cows are continuously infected in short periods. In herd 1, the proportion of longer-lasting infections was higher, which is reflected in the estimated duration of infection. Lam et al. (1996) es-timated the mean duration of infection to be 136 d. Zadoks et al. (2002) estimated the daily cure rate to be 0.0052, 0.0157, and 0.0119 for each quarter; converting these to duration of infection (1/cure rate) gives 192, 64, and 84 d, respectively. Our findings of duration of infection are clearly consistent with the findings of Lam et al. (1996) and Zadoks et al. (2002).
In Figure 1, the DIM where new infections occur is shown. In both herds, we noted a peak of new infec-tions just after 50 DIM, but in herd 2 we also found a peak in infections between 200 and 350 DIM. This could indicate a difference in transmission dynamics between the 2 herds. Effectively, a larger proportion of the infections in herd 2 appears later in the lactation, and therefore they are more likely to be cured earlier, at dry off, following dry off treatment. This results in a lower probability of transmission between animals in the herd, reducing the prevalence. Moreover, this is also reflected in the estimated duration of infection, which was lower in herd 2 compared with herd 1.
The duration of infection found in this and other studies showed that the sampling interval used in the present study was appropriate. The sampling interval should not exceed the duration of infection because this
could allow for infection and recovery between sam-plings (Kirkeby et al., 2017). However, it is still possible that some infections remain undiscovered because the duration of infection is a distribution and, hence, some infections will be shorter than the average and the sam-pling interval.
We corrected missing samples between a positive and a negative sample to negative; this will underestimate the duration of infection if the missing sample was posi-tive. However, we chose this procedure in order not to inflate the duration of infection. Furthermore, given the limited number of missing values compared with the total number of samples, this was not expected to affect the estimated parameters significantly.
Missing data on the treatment of clinical animals is also a limitation of our study. A complete record of the treatment data would enable the estimation of the spontaneous cure rate, the treatment cure rate, and the flare-up rate from subclinically to clinically infected cases. These parameters are also important in bio-economic models of IMI. Although the farmers were asked repeatedly to register and sample clinical cases and register treatments, this was done only occasion-ally, impeding the chance to estimate these parameters.
As mentioned by Leelahapongsathon et al. (2016), the precision of the results may be improved by ex-amining large herds. The noise of stochastic infection events is lower in large herds, because in the models used to estimate parameters we assume that the in-fection status is basically a binomial process based on
Figure 4. Frequency distributions of the duration of infections for herd 1 (A) and herd 2 (B). These distributions include both censored and uncensored data.

Journal of Dairy Science Vol. 102 No. 2, 2019
TRANSMISSION DYNAMICS OF STAPHYLOCOCCUS AUREUS 1439
underlying probabilities (Kirkeby et al., 2017). The estimated transmission rates and duration of infection presented in our study are valuable for investigating cost-effective measures against IMI caused by Staph. aureus in dairy cattle herds.
CONCLUSIONS
We investigated the transmission dynamics of Staph. aureus IMI at quarter level in 2 Danish dairy herds. We found a quarter-level prevalence of 34 and 2.57% for herd 1 and 2, respectively. Furthermore, we esti-mated the daily quarter-level transmission rate to be 0.0132 and 0.0077 cases/quarter-day for herd 1 and 2, respectively. The duration of infection was estimated to be 91 and 64 d, and we calculated the R0 to be 1.21 and 0.52 for the 2 herds for herd 1 and 2, respectively. These estimates can be used to parameterize models simulating the spread of Staph. aureus, to assess the cost-effectiveness of strategies to prevent and control IMI caused by Staph. aureus within dairy cattle herds.
ACKNOWLEDGMENTS
We thank the participating farmers and the teams from SEGES, Registrerings- og Ydelseskontrol (RYK), Skejby, Denmark, and FOSS for helping with data ac-quisition, Kaare Græsbøll (DTU Compute, Denmark) and Matt Denwood (Department of Veterinary and Animal Sciences, University of Copenhagen, Denmark) for discussion on the analyses, and Karen Schlez and Tobias Eisenberg at LHL laboratories for bacterial culture and identification of pathogens (LHL, Gießen, Germany). This project was funded by the Green De-velopment and Demonstration Program (GUDP) under the Danish Directorate for Food, Fisheries and Agricul-ture (Copenhagen, Denmark), grant no. 34009-15-0918 (EMCo-MAST project).
REFERENCES
Barlow, J. W., L. J. White, R. N. Zadoks, and Y. H. Schukken. 2009. A mathematical model demonstrating indirect and overall effects of lactation therapy targeting subclinical mastitis in dairy herds. Prev. Vet. Med. 90:31–42.
Barlow, J. W., R. N. Zadoks, and Y. H. Schukken. 2013. Effect of lac-tation therapy on Staphylococcus aureus transmission dynamics in two commercial dairy herds. BMC Vet. Res. 9:28.
Barreiro, J. R., C. R. Ferreira, G. B. Sanvido, M. Kostrzewa, T. Maier, B. Wegemann, W. Böttcher, M. N. Eberlin, and M. V. Dos Santos. 2010. Identification of subclinical cow mastitis pathogens in milk by matrix-assisted laser desorption/ionization time-of-flight mass spectrometry. J. Dairy Sci. 93:5661–5667.
Breen, J. E., M. J. Green, and A. J. Bradley. 2009. Quarter and cow risk factors associated with the occurrence of clinical mastitis in dairy cows in the United Kingdom. J. Dairy Sci. 92:2551–2561.
Bruker Daltonik. 2012. MALDI Biotyper 3.1 User Manual—Prepara-tion protocols. Bruker Daltonik GmbH, Bremen, Germany.
Cha, E., A. R. Kristensen, J. A. Hertl, Y. H. Schukken, L. W. Tauer, F. L. Welcome, and Y. T. Gröhn. 2014. Optimal insemination and replacement decisions to minimize the cost of pathogen-specific clinical mastitis in dairy cows. J. Dairy Sci. 97:2101–2117.
Down, P. M., M. J. Green, and C. D. Hudson. 2013. Rate of transmis-sion: A major determinant of the cost of clinical mastitis. J. Dairy Sci. 96:6301–6314.
Gerhardt, P., R. G. E. Murray, W. A. Wood, and N. R. Krieg. 1994. Methods for General and Molecular Bacteriology. American Soci-ety for Microbiology. Washington, DC.
German Veterinary Association. 2009. Leitlinien zur Entnahme von Milchproben unter Antiseptischen Bedingungen und Isolierung und Identifizierung von Mastitiserregern In: Sachverständigenauss-chuss: Subklinische Mastitis”. DVG, Gießen, Germany.
Graber, H. U., J. Naskova, E. Studer, T. Kaufmann, M. Kirchhofer, M. Brechbühl, W. Schaeren, A. Steiner, and C. Fournier. 2009. Masti-tis-related subtypes of bovine Staphylococcus aureus are character-ized by different clinical properties. J. Dairy Sci. 92:1442–1451.
Gröhn, Y. T., D. J. Wilson, R. N. González, J. A. Hertl, H. Schulte, G. Bennett, and Y. H. Schukken. 2004. Effect of pathogen-spe-cific clinical mastitis on milk yield in dairy cows. J. Dairy Sci. 87:3358–3374.
Gussmann, M., C. Kirkeby, K. Græsbøll, M. Farre, and T. Halasa. 2018. A strain-, cow-, and herd-specific bio-economic simulation model of intramammary infections in dairy cattle herds. J. Theor. Biol. 449:83–93. https: / / doi .org/ 10 .1016/ j .jtbi .2018 .04 .022.
Halasa, T., K. Huijps, O. Østerås, and H. Hogeveen. 2007. Economic effects of bovine mastitis and mastitis management: A review. Vet. Q. 29:18–31.
Halasa, T., M. Nielen, R. B. M. Huirne, and H. Hogeveen. 2009. Sto-chastic bio-economic model of bovine intramammary infection. Livest. Sci. 124:295–305.
Halasa, T. 2012. Bioeconomic modeling of intervention against clinical mastitis caused by contagious pathogens. J. Dairy Sci. 95:5740–5749.
Harmon, R. J. 1994. Physiology of mastitis and factors affecting so-matic cell counts. J. Dairy Sci. 77:2103–2112.
Harrington, D. P., and T. R. Fleming. 1982. A class of rank test proce-dures for censored survival data. Biometrika 69:553–566.
Haveri, M., S. Taponen, J. Vuopio-Varkila, S. Salmenlinna, and S. Pyrolala. 2005. Bacterial genotype affects the manifestation and persistence of bovine Staphylococcus aureus intramammary infec-tion. J. Clin. Microbiol. 43:959–961. https: / / doi .org/ 10 .1128/ JCM .43 .2 .959 -961 .2005.
Heeschen, W., J. Reichmuth, A. Tolle, and H. Zeidler. 1969. Die Kon-servierung von Milchproben zur bakteriologischen, zytologischen und Hemmstoff-biologischen Untersuchung. Milchwissenschaft 24:729–733.
Hensler, M. E., D. Quach, C. J. Hsieh, K. S. Doran, and V. Nizet. 2008. CAMP factor is not essential for systemic virulence of group B Streptococcus. Microb. Pathog. 44:84–88.
Hertl, J. A., Y. H. Schukken, F. L. Welcome, L. W. Tauer, and Y. T. Gröhn. 2014. Pathogen-specific effects on milk yield in repeated clinical mastitis episodes in Holstein dairy cows. J. Dairy Sci. 97:1465–1480. https: / / doi .org/ 10 .3168/ jds .2013 -7266.
Hillerton, J. E. 1987. The epidemiology of summer mastitis. Pages 3–9 in Summer Mastitis. Springer, Dordrecht, the Netherlands.
Hillerton, J. E., A. J. Bramley, R. T. Staker, and C. H. McKinnon. 1995. Patterns of intramammary infection and clinical mastitis over a 5 year period in a closely monitored herd applying mastitis control measures. J. Dairy Res. 62:39–50.
Hogan, J. S., R. N. González, R. J. Harmon, S. C. Nickerson, S. P. Oli-ver, J. W. Pankey, and K. L. Smith. 1999. Laboratory Handbook on Bovine Mastitis. Rev. ed. Natl. Mastitis Counc. Inc., Verona, WI.
International Dairy Federation. 1981. Laboratory Methods for use in Mastitis Work. IDF, Brussels, Belgium.
ISO. (International Organization for Standardization). 2007a. ISO Standard No. 3918: Milking machine installations—Vocabulary, ISO, Geneva, Switzerland.

1440 KIRKEBY ET AL.
Journal of Dairy Science Vol. 102 No. 2, 2019
ISO. (International Organization for Standardization). 2007b. ISO Standard No. 3918: Milking machine installations—Construction and performance, ISO, Geneva, Switzerland.
ISO. (International Organization for Standardization). 2007c. ISO Standard No. 3918: Milking machine installations—Mechanical tests, ISO, Geneva, Switzerland.
Kirkeby, C., T. Halasa, M. Gussmann, N. Toft, and K. Græsbøll. 2017. Methods for estimating disease transmission rates: Evaluating the precision of Poisson regression and two novel methods. Sci. Rep. 7. https: / / doi .org/ 10 .1038/ s41598 -017 -09209 -x.
Lam, T. J. G. M., M. C. M. Dejong, Y. H. Schukken, and A. Brand. 1996. Mathematical modeling to estimate efficacy of postmilking teat disinfection in split-udder trials of dairy cows. J. Dairy Sci. 79:62–70.
Leelahapongsathon, K., Y. H. Schukken, T. Pinyopummintr, and W. Suriyasathaporn. 2016. Comparison of transmission dynamics be-tween Streptococcus uberis and Streptococcus agalactiae intramam-mary infections. J. Dairy Sci. 99:1418–1426.
Mahmmod, Y. S., N. Toft, J. Katholm, C. Grønbæk, and I. C. Klaas. 2013. Bayesian estimation of test characteristics of real-time PCR, bacteriological culture and California mastitis test for diagnosis of intramammary infections with Staphylococcus aureus in dairy cattle at routine milk recordings. Prev. Vet. Med. 112:309–317.
McCallum, H., N. Barlow, and J. Hone. 2001. How should pathogen transmission be modelled? Trends Ecol. Evol. 16:295–300.
Pedersen, P. S., J. A. Madsen, W. Haeschen, F. K. Neave, F. H. S. Newbould, W. D. Schultze, and F. H. Dodd. 1981. Laboratory Methods for Use in Mastitis Work. Laboratory Methods for Use in Mastitis Work. 1st ed. International Dairy Federation, Brussels. Belgium.
R Core Team. 2018. A Language and Environment for Statistical Com-puting. R Foundation for Statistical Computing. Vienna, Austria.
Roberson, J. R., L. K. Fox, D. D. Hancock, C. C. Gay, and T. E. Besser. 1994. Coagulase-positive Staphylococcus intramammary in-fections in primiparous dairy cows. J. Dairy Sci. 77:958–969.
Schukken, Y. H., V. Bronzo, C. Locatelli, C. Pollera, N. Rota, A. Ca-sula, and R. Guix. 2014. Efficacy of vaccination on Staphylococcus aureus and coagulase-negative staphylococci intramammary infec-tion dynamics in 2 dairy herds. J. Dairy Sci. 97:5250–5264.
Schwarz, D., U. S. Diesterbeck, K. Failing, S. Konig, K. Brugemann, M. Zschock, W. Wolter, and C.-P. Czerny. 2010. Somatic cell
counts and bacteriological status in quarter foremilk samples of cows in Hesse, Germany—A longitudinal study. J. Dairy Sci. 93:5716–5728.
Sears, P. M., B. S. Smith, P. B. English, P. S. Herer, and R. N. Gon-zalez. 1990. Shedding pattern of Staphylococcus aureus from bovine intramammary infections. J. Dairy Sci. 73:2785–2789.
Seegers, H., C. Fourichon, and F. Beaudeau. 2003. Production effects related to mastitis and mastitis economics in dairy cattle herds. Vet. Res. 34:475–491.
Sommerhäuser, J., B. Kloppert, W. Wolter, M. Zschöck, A. Sobiraj, and K. Failing. 2003. The epidemiology of Staphylococcus aureus infections from subclinical mastitis in dairy cows during a control programme. Vet. Microbiol. 96:91–102.
Steeneveld, W., H. Hogeveen, H. W. Barkema, J. Broek, and R. B. M. van den Huirne. 2008. The influence of cow factors on the inci-dence of clinical mastitis in dairy cows. J. Dairy Sci. 91:1391–1402.
Therneau, T. 2015. A Package for Survival Analysis in S. Version 2.38. Accessed Feb. 2, 2017. https: / / CRAN .R -project .org/ package = survival.
van den Borne, B. H., H. U. Graber, V. Voelk, C. Sartori, A. Stein-er, M. C. Haerdi-Landerer, and M. Bodmer. 2017. A longitudi-nal study on transmission of Staphylococcus aureus genotype B in Swiss communal dairy herds. Prev. Vet. Med. 136:65–68.
van den Borne, B. H. P., T. Halasa, G. van Schaik, H. Hogeveen, and M. Nielen. 2010. Bioeconomic modeling of lactational antimicro-bial treatment of new bovine subclinical intramammary infections caused by contagious pathogens. J. Dairy Sci. 93:4034–4044.
Waage, S., T. Mørk, A. Røros, D. Aasland, A. Hunshamar, and S. A. Ødegaard. 1999. Bacteria associated with clinical mastitis in dairy heifers. J. Dairy Sci. 82:712–719.
Zadoks, R. N., H. G. Allore, H. W. Barkema, O. C. Sampimon, Y. T. Gröhn, and Y. H. Schukken. 2001a. Analysis of an outbreak of Streptococcus uberis mastitis. J. Dairy Sci. 84:590–599.
Zadoks, R. N., H. G. Allore, H. W. Barkema, O. C. Sampimon, G. J. Wellenberg, Y. T. Gröhn, and Y. H. Schukken. 2001b. Cow-and quarter-level risk factors for Streptococcus uberis and Staphylococ-cus aureus mastitis. J. Dairy Sci. 84:2649–2663.
Zadoks, R. N., H. G. Allore, T. J. Hagenaars, H. W. Barkema, and Y. H. Schukken. 2002. A mathematical model of Staphylococcus aureus control in dairy herds. Epidemiol. Infect. 129:397–416.

Journal of Dairy Science Vol. 102 No. 2, 2019
TRANSMISSION DYNAMICS OF STAPHYLOCOCCUS AUREUS 1441A
PPEN
DIX
Tab
le A
1. Q
uart
er-lev
el p
aram
eter
s us
ed t
o es
tim
ate
tran
smis
sion
rat
es o
f St
aphy
loco
ccus
aur
eus
for
herd
11
Dat
eP
rev.
SI
NN
IN
I.pr
evN
I.no
tpre
vC
orre
cted
Day
sS.
glm
I.gl
mN
.glm
Met
hod
1M
etho
d 2
Tra
nsie
ntC
ured
16.0
1.20
1728
.046
318
064
3—
——
——
——
——
——
—13
.02.
2017
32.6
435
210
645
6343
2028
2811
,199
4,87
316
,072
0.01
90.
022
1632
14.0
3.20
1736
.040
923
063
952
3121
1329
11,0
715,
743
16,8
140.
012
0.01
323
2410
.04.
2017
39.1
393
252
645
6444
2012
279,
547
5,77
315
,320
0.01
90.
022
2642
08.0
5.20
1738
.037
422
960
337
2017
2128
10,1
645,
737
15,9
010.
009
0.00
819
3912
.06.
2017
33.8
422
215
637
3925
1412
3512
,166
6,63
4.5
18,8
00.5
0.00
80.
009
1440
10.0
7.20
1729
.141
417
058
426
224
1728
10,6
954,
349
15,0
440.
008
0.00
86
4214
.08.
2017
40.9
279
193
472
4519
261
3512
,924
5,53
918
,463
.50.
0124
0.01
415
911
.09.
2017
25.6
465
160
625
97
227
2811
,007
4,20
6.5
15,2
13.5
0.00
30.
003
128
09.1
0.20
1734
.042
421
864
273
4231
928
11,0
41.5
4,82
115
,862
.50.
019
0.02
120
813
.11.
2017
35.9
427
239
666
5633
2323
3512
,637
.56,
899.
519
,537
0.01
30.
015
1528
11.1
2.20
1734
.943
323
266
550
3416
—28
10,0
885,
540
15,6
280.
015
0.01
7—
351 D
ate
form
at: da
y, m
onth
, ye
ar. P
rev.
= t
he q
uart
er-lev
el p
reva
lenc
e; S
= n
umbe
r of
sus
cept
ible
qua
rter
s; I
= n
umbe
r of
inf
ecte
d qu
arte
rs; N
= t
otal
num
ber
of q
uart
ers
at r
isk
(sam
pled
); N
I =
new
inf
ection
s; N
I.pr
ev =
num
ber
of n
ew inf
ection
s in
qua
rter
s w
ith
prev
ious
Sta
ph. au
reus
inf
ection
; N
I.no
tpre
v =
num
ber
of n
ew inf
ection
s in
qua
rter
s w
itho
ut
prev
ious
Sta
ph. au
reus
inf
ection
; C
orre
cted
= n
umbe
r of
neg
ativ
es (
assu
med
tra
nsie
ntly
inf
ection
s) c
orre
cted
to
posi
tive
; D
ays
= t
he n
umbe
r of
day
s si
nce
the
prev
ious
sam
plin
g;
S.gl
m =
num
ber
of s
usce
ptib
le q
uart
er d
ays
at r
isk
used
for
Poi
sson
reg
ress
ion;
I.g
lm =
num
ber
of i
nfec
ted
quar
ter
days
use
d fo
r Poi
sson
reg
ress
ion;
N.g
lm =
tot
al n
umbe
r of
qu
arte
r da
ys u
sed
for
Poi
sson
reg
ress
ion;
Met
hod
1 an
d M
etho
d 2
indi
cate
the
est
imat
ed t
rans
mis
sion
rat
e pe
r sa
mpl
ing
inte
rval
; T
rans
ient
= t
he n
umbe
r of
tra
nsie
nt inf
ection
s;
Cur
ed =
the
num
ber
of c
ured
inf
ection
s.
Tab
le A
2. Q
uart
er-lev
el p
aram
eter
s us
ed t
o es
tim
ate
the
tran
smis
sion
rat
es o
f St
aphy
loco
ccus
aur
eus
for
prim
ipar
ous
cow
s in
her
d 11
Dat
eP
rev.
SI
NN
ID
ays
S.gl
mI.gl
mN
.glm
Met
hod
1M
etho
d 2
16.0
1.20
1723
.416
450
214
——
——
——
—13
.02.
2017
30.5
146
6421
022
2839
621,
484
5,54
60.
022
0.02
414
.03.
2017
31.2
141
6420
513
2938
52.5
1,63
2.5
5,48
50.
011
0.01
210
.04.
2017
31.2
148
6721
515
2735
161,
498.
55,
014.
50.
014
0.01
508
.05.
2017
32.8
127
6218
913
2835
031,
526
5,02
90.
013
0.01
312
.06.
2017
23.3
178
5423
29
3540
54.5
1,48
7.5
5,54
20.
007
0.00
710
.07.
2017
20.3
153
3919
24
2841
261,
036
5,16
20.
005
0.00
514
.08.
2017
31.9
113
5316
617
3545
681,
487.
56,
055.
50.
016
0.01
811
.09.
2017
20.5
174
4521
92
2835
291,
134
4,66
30.
002
0.00
209
.10.
2017
23.3
174
5322
714
2840
461,
232
5,27
80.
014
0.01
513
.11.
2017
27.7
172
6623
823
3549
701,
750
6,72
00.
017
0.01
911
.12.
2017
26.3
182
6524
717
2839
761,
470
5,44
60.
015
0.01
61 D
ate
form
at: da
y, m
onth
, ye
ar. P
rev.
= t
he q
uart
er-lev
el p
reva
lenc
e; S
= n
umbe
r of
sus
cept
ible
qua
rter
s; I
= n
umbe
r of
inf
ecte
d qu
arte
rs; N
= t
otal
num
ber
of q
uart
ers
at r
isk
(sam
pled
); N
I =
new
inf
ection
s; D
ays
= t
he n
umbe
r of
day
s si
nce
the
prev
ious
sam
plin
g; S
.glm
= n
umbe
r of
sus
cept
ible
qua
rter
day
s at
ris
k us
ed for
Poi
sson
reg
ress
ion;
I.g
lm =
nu
mbe
r of
inf
ecte
d qu
arte
r da
ys u
sed
for
Poi
sson
reg
ress
ion;
N.g
lm =
tot
al n
umbe
r of
qua
rter
day
s us
ed f
or P
oiss
on r
egre
ssio
n; M
etho
d 1
and
Met
hod
2 in
dica
te t
he e
stim
ated
tr
ansm
issi
on r
ate
per
sam
plin
g in
terv
al.

1442 KIRKEBY ET AL.
Journal of Dairy Science Vol. 102 No. 2, 2019
Tab
le A
3. Q
uart
er-lev
el p
aram
eter
s us
ed t
o es
tim
ate
the
tran
smis
sion
rat
es o
f St
aphy
loco
ccus
aur
eus
for
mul
tipa
rous
cow
s in
her
d 11
Dat
eP
rev.
SI
NN
ID
ays
S.gl
mI.gl
mN
.glm
Met
hod
1M
etho
d 2
16.0
1.20
1730
.329
913
042
9—
——
——
——
13.0
2.20
1733
.628
914
643
541
287,
333
3,38
910
,722
0.01
80.
020
14.0
3.20
1738
.226
816
643
439
297,
376
4,10
1.5
11,4
77.5
0.01
50.
017
10.0
4.20
1743
.024
518
543
049
276,
091
4,27
4.5
10,3
65.5
0.02
00.
023
08.0
5.20
1740
.324
716
741
424
286,
606.
54,
211
10,8
17.5
0.00
90.
010
12.0
6.20
1739
.824
416
140
530
358,
252.
55,
135
13,3
87.5
0.01
00.
011
10.0
7.20
1733
.426
113
139
222
286,
571
3,26
69,
837
0.01
00.
010
14.0
8.20
1745
.816
614
030
628
358,
349.
54,
106
12,4
55.5
0.01
20.
013
11.0
9.20
1728
.329
111
540
67
287,
280
3,07
2.5
10,3
52.5
0.00
30.
003
09.1
0.20
1739
.825
016
541
559
286,
795.
53,
609
10,4
04.5
0.02
60.
032
13.1
1.20
1740
.025
917
343
233
357,
667.
55,
149.
512
,817
0.01
00.
011
11.1
2.20
1740
.025
116
741
833
286,
112
4,07
010
,182
0.01
30.
014
1 Dat
e fo
rmat
: da
y, m
onth
, ye
ar. P
rev.
= t
he q
uart
er-lev
el p
reva
lenc
e; S
= n
umbe
r of
sus
cept
ible
qua
rter
s; I
= n
umbe
r of
inf
ecte
d qu
arte
rs; N
= t
otal
num
ber
of q
uart
ers
at r
isk
(sam
pled
); N
I =
new
inf
ection
s; D
ays
= t
he n
umbe
r of
day
s si
nce
the
prev
ious
sam
plin
g; S
.glm
= n
umbe
r of
sus
cept
ible
qua
rter
day
s at
ris
k us
ed for
Poi
sson
reg
ress
ion;
I.g
lm =
nu
mbe
r of
inf
ecte
d qu
arte
r da
ys u
sed
for
Poi
sson
reg
ress
ion;
N.g
lm =
tot
al n
umbe
r of
qua
rter
day
s us
ed f
or P
oiss
on r
egre
ssio
n; M
etho
d 1
and
Met
hod
2 in
dica
te t
he e
stim
ated
tr
ansm
issi
on r
ate
per
sam
plin
g in
terv
al.
Tab
le A
4. Q
uart
er-lev
el p
aram
eter
s us
ed t
o es
tim
ate
the
tran
smis
sion
rat
es o
f St
aphy
loco
ccus
aur
eus
in h
erd
21
Dat
eP
rev.
SI
NN
IN
I.pr
evN
I.no
tpre
vC
orre
cted
Day
sS.
glm
I.gl
mN
.glm
Met
hod
1M
etho
d 2
Tra
nsie
ntC
ured
06.0
2.20
173.
112
9442
1336
——
——
——
——
——
——
06.0
3.20
173.
013
3842
1380
103
76
2834
,323
1,00
835
,331
0.01
00.
010
46
03.0
4.20
173.
113
3743
1380
105
51
2836
,110
1,01
237
,122
0.01
00.
0010
66
01.0
5.20
173.
013
4641
1387
52
34
2835
,907
.51,
011
369,
18.5
0.00
50.
005
36
06.0
6.20
173.
412
7345
1318
111
104
3645
,149
1,33
3.5
46,4
84.5
0.00
80.
008
94
03.0
7.20
172.
012
5626
1282
10
10
2733
,264
.568
8.5
33,9
530.
001
0.00
10
1107
.08.
2017
3.2
544
1856
20
00
035
23,9
9761
924
,616
00
00
04.0
9.20
173.
453
419
553
20
20
2819
,019
476
19,4
950.
004
0.00
411
102
.10.
2017
1.0
1405
1414
190
00
128
21,5
5135
321
,904
00
06
06.1
1.20
171.
014
2914
1443
30
31
3547
,167
.536
7.5
47,5
350.
007
0.00
73
304
.12.
2017
1.8
1509
2715
369
09
128
37,4
9245
437
,946
0.01
50.
0148
24
08.0
1.20
182.
814
6943
1512
204
16—
3548
,059
.584
548
,904
.50.
018
0.01
9—
131 D
ate
form
at: da
y, m
onth
, ye
ar. P
rev.
= t
he q
uart
er-lev
el p
reva
lenc
e; S
= n
umbe
r of
sus
cept
ible
qua
rter
s; I
= n
umbe
r of
inf
ecte
d qu
arte
rs; N
= t
otal
num
ber
of q
uart
ers
at r
isk
(sam
pled
); N
I =
new
inf
ection
s; N
I.pr
ev =
num
ber
of n
ew inf
ection
s in
qua
rter
s w
ith
prev
ious
Sta
ph. au
reus
inf
ection
; N
I.no
tpre
v =
num
ber
of n
ew inf
ection
s in
qua
rter
s w
itho
ut
prev
ious
Sta
ph. au
reus
inf
ection
; C
orre
cted
= n
umbe
r of
neg
ativ
es (
assu
med
tra
nsie
ntly
inf
ection
s) c
orre
cted
to
posi
tive
; D
ays
= t
he n
umbe
r of
day
s si
nce
the
prev
ious
sam
plin
g;
S.gl
m =
num
ber
of s
usce
ptib
le q
uart
er d
ays
at r
isk
used
for
Poi
sson
reg
ress
ion;
I.g
lm =
num
ber
of i
nfec
ted
quar
ter
days
use
d fo
r Poi
sson
reg
ress
ion;
N.g
lm =
tot
al n
umbe
r of
qu
arte
r da
ys u
sed
for
Poi
sson
reg
ress
ion;
Met
hod
1 an
d M
etho
d 2
indi
cate
the
est
imat
ed t
rans
mis
sion
rat
e pe
r sa
mpl
ing
inte
rval
; T
rans
ient
= t
he n
umbe
r of
tra
nsie
nt inf
ection
s;
Cur
ed =
the
num
ber
of c
ured
inf
ection
s.
Related Documents