« •* Report SAM-TR.78-32 @LEVtt ^ \ TRANSMISSION AND ABSORPTION COEFFICIENTS FOR OGVLAR MEDIA OF THE RHESUS MONKEY 30 JO \ Edward F. Maher, Captain, USAF, BSC D D C LEfSEfME FEB 23 1979 nsisEinns f- B December 1978 Final Report for Period 15 September 1974 - 15 September 1976 Approved for public release; distribution unlimited. CL o o USAF SCHOOL OF AEROSPACE MEDICINE LU —1 Aerospace M*dical Division (AFSC) / u. Brooks Air Fore« Baso, Texas 78235 ( J 79 0 2 ] y

Welcome message from author
This document is posted to help you gain knowledge. Please leave a comment to let me know what you think about it! Share it to your friends and learn new things together.
Transcript
« •*
Report SAM-TR.78-32 @LEVtt ^
\
TRANSMISSION AND ABSORPTION COEFFICIENTS FOR OGVLAR MEDIA OF THE RHESUS MONKEY
30
JO
\
Edward F. Maher, Captain, USAF, BSC
D D C LEfSEfME
FEB 23 1979
nsisEinns f- B
December 1978
Final Report for Period 15 September 1974 - 15 September 1976
Approved for public release; distribution unlimited.
CL o o
■
USAF SCHOOL OF AEROSPACE MEDICINE LU —1 Aerospace M*dical Division (AFSC) / u. Brooks Air Fore« Baso, Texas 78235 (
■ J
79 0 2 ] y
NOTICES
This final report was submitted by personnel of the Laser Effects Branch, Radiation Sciences Division, USAF School of Aerospace Medicine, AFSC, Brooks Air Force Base, Texas, under job order 7757-02-52.
When U.S. Government drawings, specifications, or other data are used for any purpose other than a definitely related Government procurement operation, the Government thereby incurs no responsibility nor any obligation whatsoever; and the fact that the Government may have formulated, furnished, or in any way supplied the said drawings, specifications, or other data is not to be regarded by Implication or otherwise, as In any manner licensing the holder or any other person or corporation, or conveying any rights or permission to manufacture, use, or sell any patented invention that may in any way be related thereto.
The animals involved in this study were procured, maintained, and used in accordance with the Animal Welfare Act of 1970 and the "Guide for the Care and Use of Laboratory Animals" prepared by the Institute of Laboratory Animal Resources - National Research Council.
This report has been reviewed by the Information Office (01) and is releasable to the National Technical Information Service (NTIS). At NTIS, It will be available to the general public. Including foreign nations.
This technical report has been reviewed and is approved for publication.
ScU^t/ 9 A*^- EDWARD F. MAHER, Captain, USAF, BSC Project Scientist Supervisor
RALP» G. ALLEN, Ph.D.
(CE J. ENDERS Colonel, USAF, MC Commander

-.* . -
UWCLASS1FIFD •BCUHITV CL ASSIf ICATiON Of THIS PAGE (Whmn Dmlm Enlmrmd)
REPORT DOCUMENTATION PAGE READ INSTRUCTIONS BEFORE COMPLETING KORM
Ji SAM-TR-78-32 '
2 OOVT ACCESSION NO. 3 RECIPIENT'S CATALOG NUMBER
» ^i i Lg iwg juBiiruj'" — TRANSMISSION AND.ABSORPTIONCOEFFICIENTS FOR
J)CULARJ1EDIA OF THE BHESUS MONKEY
5. I il | ||| MhlHWr W PI liriTl i I III I
5" . Final Report ""■"' 15 Sep 74 - 15 Sep 76
6 «HFORMtMO OHG REPORT KUMBE^
AuTMORCf;
Edward F ./Maher/ Capt, USAF, BSC /^ / f
» PERFORMING ORGANIZATION NAME AND ADDRESS
USAF School of Aerospace Medicine (RZL) Aerospace Medical Division (AFSC) Brooks Air Force Base, Texas 78235
-'- 10. PROGRAM ELEMENT. PROJECT, T4SK
AREA A WORK UNIT NUMBERS
|
ORT DA
62202F /7757/-02-52
II. CONTROLLING OFFICE NAME AND ADDRESS
USAF School of Aerospace Medicine (RZL) Aerospace Medical Division (AFSC)
12 REPORT DATE
/ Dec 78
Brnnk«; Air Fnrrp RUCP , T 14 MONITORING AGENCY NAME »' ADI
pxas 7R?3S
1» NUMBER OF PAGES
102 DORESSf// dlHr'»ni from Con(ro//(n< Olllc») IS. SECURITY CLASS, fof Uli« report)
Unclassified 15«. DECLASSIFIC ATI ON'DOWNGRADING
SCHEDULE
I« DISTRIBUTION STATEMENT (ol Mt Rcporn
Approved for public release; distribution unlimited.
D D C EMFTTTEI
FEB 23 10T9
17. DISTRIBUTION STATEMENT (of Ih» «balract »nl»r»d In Black 20, II dllltrml Inm Rtpori)
18. SUPPLEMENTARY NOTES l^UdkUUl^
B
19. KEY WORDS ,Con((nu« on rvvar« «id* II n*c*««ary and Idonllly by block numbmr)
Absorption coefficients Spectral transmissivity Spectral transmission Refractive media Ocular media
wt ABSTRACT (Conllnut on r»vrf »Id» It n«c»««ary and Idtnllty by block number:
Tissue transmissivity and absorption coefficients were calculated for components of the refractive media, distilled water, and physiological saline throughout the wavelength Interval of 0.2-15 ym. All transmission measurements required for these calculations were performed spectrophotometrically using freshly enucleated rhesus monkey eyes and narrow-bandwidth radiation.
Much of the absorption coefficient data presented is from wavelength regions where values have not been previously reported.^
DD 1 JAN 71 1473 EDITION OF t NOV 65 IS OBSOLETE UNCLASSIFIED 3Jt r/ SECURITY CLASSIFICATION OF THIS PAGE flWitn Do« Ent.rodi
■

ItCUWITY CLAUiriCATION OF TMH PAOCCIWiti Dmlm Enffd)
SCCUNIT , CLASSIFICATION Of THIS PAOCnffian Oala Enfrtd)
CONTENTS
INTRODUCTION.
Page
3
THEORY,
Tissue Transmissivlty Calculations ^ Generation of the Indices of Refraction 8
METHODS AND MATERIALS 1°
Aqueous Humor Removal 10 Cornea, Lens, and Vitreous Removal 10 Ocular Sample Cells 12 Instrumentation and Calibration 14 Transmission Measurements 14 Tissue Thickness Measurements 15 Absorption Coefficient Calculations 16
RESULTS 16
DISCUSSION 24
Sampl e Measurements 31 Cornea 31 Aqueous Humor 32 Crystal 1 ine Lens 33 VI treous Humor 34
Transmissivlty Comparisons 35 Entire Ocular Media 35 Distilled Water 35 Physiological Saline 37
REFERENCES 37
APPENDIX A: Tabulated values for cornea, aqueous humor, lens, vitreous humor, distilled water, and physiological sal 1 ne 41
NllS WhitP Section
ODC Bull Section Q
UNANNO'JNCtO Q
JUSTiriOATION
■?'
BY
BismiBüTiDw/Miun ma Wst >VAII and oi SPIC1AL
•. •
TRANSMISSION AND ABSORPTION COEFFICIENTS FOR OCULAR MIDIA OF THE RHESUS MONKEY
INTRODUTION
Levels of Injury and other deleterious effects due to laser radia- tion have been obtained largely by empirical methods (12, 13, 14, 17). Current investigations of this type usually subject animals to various ocular and skin exposures, and the rhesus monkey is the species of choice for ocular studies.
Determining laser safety criteria for the eye usually Involves multiple exposures of the lens, cornea, or retina, with laser power varied so that an EOCQ for a "minimum visible" lesion can be established. In the early stages of studying laser injury, this approach was adequate since there were relatively few laser-exposure conditions to be examined, the cost of experimental animals was rather low, and the number of laser systems to be considered was limited.
Recent advances in laser technology and its wide ranging applications, however, have evolved many laser systems, capable of radiating wavelengths throughout the 0.2- to 15-vim region at pulse durations from 10-^2 $ to continuous wave (CW). When pulse-train coding and the possibility of synerglstic effects are considered, hundreds of new exposure scenarios can easily be expected. Thus, an empirical approach to establishing permissible exposures will not alone accommodate the Increasing demand for safety criteria.
The approach taken by the Laser Effects Branch of the USAF School of Aerospace Medicine to determine safe levels of exposure has been to rely on the Increased use of biomathematical models for predicting various ocular hazards due to lasers.
To predict ocular damage, (xisting models use the thermal diffusion equation and an adjusted Henriques damage integral. Eye models require accurate estimates for the various thermal and morphological properties of the tissues comprising the refractive media and retinal layers; the more Important of these are thermal conductivity, specific heat, and coefficients of reflection and absorption. Ocular-tissue thermal conduc- tivity and specific heat appear to be adequately represented by the values used for water or other biological tissue and are relatively constant over a wide variety of conditions. Other quantities, however, such as the transmission and absorption of the ocular tissues, change greatly with the irradiating wavelength and tissue type. Unfortunately, absorption and transmission data for the ocular media is sparse for much of the spectrum covered by current lasers, particularly In the infrared.
79 < . 0 7

Ocular transmission data for visible wavelengths (0.4-0.Tun) Is abundant, with most of the Information determined because of Interest In the physiology of vision (1, 9, 26-29, 31, 32, 36, 39, 40). Transmission data for the ultraviolet, near-Infrared, and Infrared, however, has been reported by only a few Investigators (4-6, 15, 21, 24); and most of these data are limited to wavelengths less than 2 um. Some of these studies used abnormal human eyes, sometimes severely diseased (1, 5, 16); and more often than not, measurements made were Inadequate to yield statistically reliable data.
The purpose of this study was to obtain statistically valid absorption coefficients for use with predictive models of laser-radiation thermal damage. In these studies absorption values were measured with narrow- bandwidth Instruments and calculated over the wavelength region of 0.2- 15 urn. Careful attention was given to the Integrity of the refractive media, accuracy of corrections for reflective and scattered losses, and reliability of Instrumentation.
Transmission measurements and subsequent calculations of absorption coefficients were performed for the refractive media; I.e.. cornea, aqueous humor, lens, and vitreous humor of the rhesus (Macaca mulatta) monkey eye. The rhesus eye was chosen because of Its similarities to the human eye and to Insure consistency between the model's predictions and empirical studies that have used rhesus monkeys.
Included with the absorption coefficients for the ocular media are similar measurements for physiological saline (0.9%) and distilled water. The purposes for Including these fluids were to: (1) determine the wavelength regions where the spectra for the refractive media and saline or water are similar, (2) obtain absorption coefficients for the tear layer by measuring saline, and (3) provide a means to test the validity of our measurement-system absorption coefficients for saline and water with those determined by other Investigators.
THEORY
Tissue Transmlsslvlty Calculations
Light energy Impinging on a surface can be accounted for by the following relation:
^t^s^a + 'r 0) where IQ, 1^, Is. Ia. and Ir are the incident, transmitted, scattered, absorbed, and reflected intensities, respectively. In spectrophotometry I0, It, and Is can be measured; Ir can be calculated using the Indices of refraction at each boundary; and Ia can be determined once the other quantities are known. Ia, the absorbed intensity, is that portion of the incident light which is absorbed, creating heat or other forms of energy conversion within the sample. For a homogeneous sample, the portion
■
■
absorbed can be quantitlzed by the Lambertlan absorption coefficient,
a = Ln(l/T)/x (2)
where T ■ sample transmissivity, which is the sum of those fractions of
lo that are directly transmitted and scattered after correction for reflective losses, and
X ■ sample thickness.
In general, spectrophotometry does not permit a direct measurement of T; instead, T can be calculated wh-?n given the total transmission (including forward scattering) of:
(1) an optical cell without sample,
(2) an optical cell containing a sample, and
(3) the amount of reflective losses encountered at the interfaces of both of the above cells.
Equations necessary for these calculations can be developed from a simplified diagram (Fig. 1) for the optical tissue-cell "sandwich" used in this investigation.
The transmissivity of the tissue is defined as lb/la» where Ia is the light intensity entering the tissue and lb is the Intensity passing through the tissue (includes that light expected to be reflected at the tissue's posterior side). The light intensity reflected back from the air/first window Interface (surface #1) can be defined (3) as:
lM 3 ^aw (3)
where Raw is the reflectivity coefficient arising from the dissimilar indices of refraction at the air/window interface.
In the same fashion, Rwt 1s the reflectivity coefficient for the window/tissue Interface. (Note that R 3 R and R . - R^.)
aW Wa Wt tw
The intensity on the window side of surface #1 can be written as:
and the intensity just prior to reaching surface #2 (first-window/tissue interface) is
where L. is the transmissivity of the cell window.
■

"•aw
If^s
Figure 1. Schematic of sample cell containing tissue,
I.. Li and I. -- Light intensity incident on sample cell, entering the tissue, and passing through the tissue (includes ligh
n2' n3
<W
expected to be reflected at the tissue's posterior side), respectively.
Indices of refraction for air, optical cell window, and tissue respectively
Light intensity reflected from air/window interface
ght
aw
1.(1.) -- Light Intensity reflected from window/tissue Interface
Vs Light intensity transmitted and scattered by the tissue and the cell
a -- Absorption coefficient
x -- Sample thickness
Ia, the Intensity entering the tissue, is;
^ • IoV1-'W<1-'W (6)
Ib, the intensity Ia attenuated according to the tissue's transmissivity (T), is given by:
h ' IoTWT<1-Raw)<1-|W (7)
Similarly, the intensity on the window side of surface #3 (tissue/ second-window interface) is
,

(8)
and I*+Isi the light Intensity transmitted and scattered by the tissue and cell, Is:
If+Ic " I TJvrO-R )2(1-R J2 t s o W v aw' v wt'
The tissue's transmlsslvlty (T) can now be determined by
-2 T -
(It+Is) (1-R.w>«1-Rwt)TW
(9)
(10)
The quantity (It+Is^ 1s the transmission ratio, measured spectro-
photometrlcally, of the light leaving the optical tissue cell" to "the light Incident to the optical tissue cell." The values of R and R . can be calculated from approximations of the Fresnel reflection equation, given below, for normally incident light and the Indices of refraction for the respective mediums:
(n1-n2)' and R
(n2-n3)'
wt {n2+n3) 7 (11 & 12)
wh and
aw (Vn2)z
ere n,, n-, and n- are the indices of refraction for air, cell window, d tissue, respectively.
The transmlsslvlty of each window can be derived analogous to equation 10.
,2
V (nj-n^)'
(n1+n2) (13)
(i:+i;) where —n is the measured transmission of one cell window.
Replacing equation 10 with the analytical expressions for R , aW
R ., and I., the equation calculating the transmlsslvlty of the tissue Is (assuming "i " 1 for air):
T ■ <W -2
(ii*i;)
K
(l-n2)'
(1^)'
-2 (n2-n3)
,
t
(n2+n3)'
-2
(14)
A computer performed the calculation In equation 14 from the raw transmission data of the blank cell and the cell plus tissue, along with the values generated for n„ and n- as a function of wavelength.
Generation of the Indices of Refraction
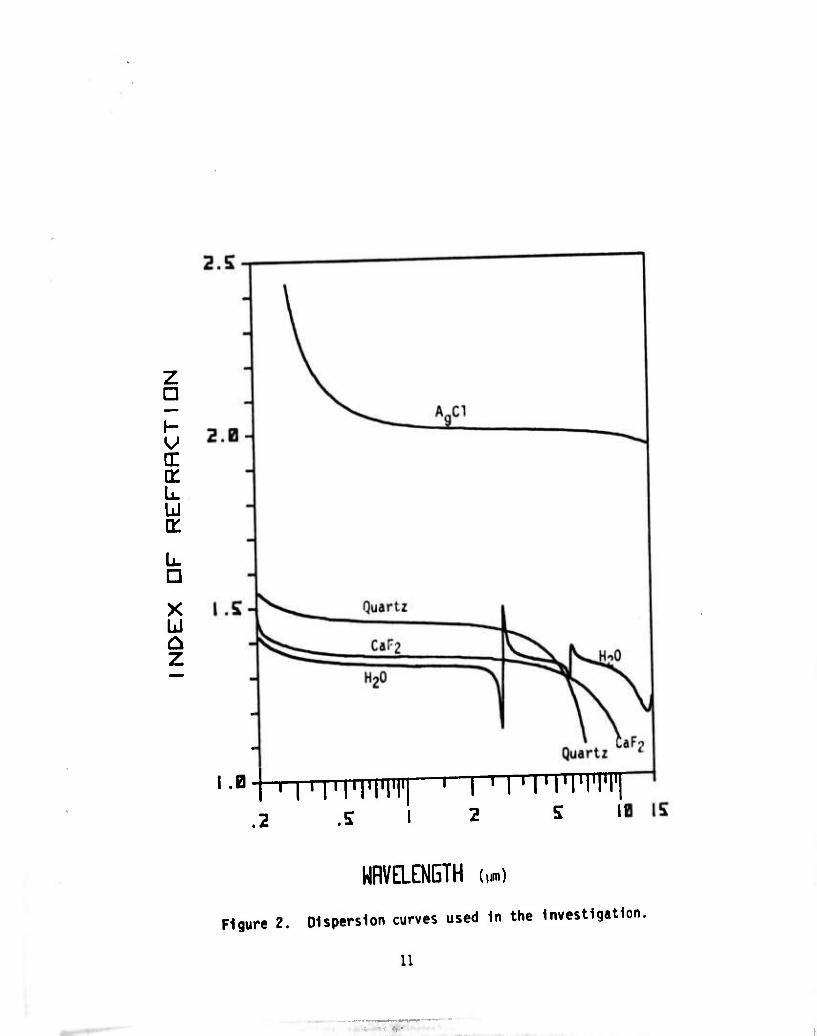
Calculations required In determining the reflection coefficient were accomplished using values for the Indices of refraction, r\2 and n^ at the measured wavelengths. The refractive Index for air, n^, was asssumed equal to 1.000 for all measurement wavelengths. The refractive Indices for the window material and tissue, n? and ni, respectively, were generated from dispersion equations for the mediums.
In this Investigation the window materials used were either quartz (infrasll), calcium fluoride, or silver chloride, depending on the meas- urement wavelength. Analytical expressions yielding 3-decltnal-place accuracy for each dispersion value were obtained from the window's manufacturer (37) and are listed below:
For quartz (Infrasll) _2 2.978645 + 0.0087778 + 84.0622
X2-0.01061 X2-96.0 (15)
For calcium fluoride (CaF-)
n2 ■ 1.00 + 0.5675888X2
X2-0.0502636052
+ 0.4710914X X2-0.10009142
+ 3^8484723X1
X2-34.649042 (16)
For silver chloride (AgCl)
2 4.00804 - 0.00085111X' - 0.00000019762X
+ 0.079086 X2-0.04584
(17)
The dispersion of distilled and delonlzed water was substituted for that of the refractive-media tissues. The substitution was necessary because of the lack of dispersion data on the ocular media. The large water content (75-99%) of the ocular media (11) qualifies this as a good substitution, one that has been used before by various Investigators (6, 26).
Twc analytical expressions for water dispersion were obtained from the data of several studies. The first, used for the wavelength region of 0.2-2.0 van, was taken directly from Klslovskll (23); while the other expression, used in the 1.0-25-un region, was obtained through an analyt- ical curve fitting of the data from several Investigators (7, 10, 19, 22. 30, 33, 35, 41).
The analytical fit was determined for the general form of the Selllmeler dispersion equation shown below.
A + CX?U2- 4) BX2(X2-^)
(Yi + (A2.X2)2) T (Y^(X2-X2)2)
DX^-X2)
(Y2+(X2-X23)2) (18)
Initially, coefficients A, B, C, and D were obtained from four simulta- neous solutions of equation 18, averaged for several different wave- lengths outside the regions of anomalous dispersion. An average value for n was obtained using data from the Investigations listed above. In each of these solutions, YJ, Y2« 3^ Y3 were assumed to be negligible.
The values for YI« Y?» an(l V3 were later determined through a trial and error curve-fitting exercise aided by use of a calculator and plotter, Values for Xj, X2t and X3 were obtained from recent literature (7, 10, 33) or through our own measurements and represent the wavelengths In the center of each anomalous dispersion band.
Both water-dispersion expressions are accurate to the second decimal position and are presented below according to the wavelength regions In which they are valid.
For 0.2 <X <;2.0 um)
^290 + 0^20^+%08Q4
(For 1.00 <X <25.0 yim)
k2,%2 2,.2 2 m 1 759425 + 0.021685X<:(Xc-2.94d) + 0.007297Xfc(X^-6.094^)
0.2^ + (X2-2.942)2
0.183852X2(X2-15.S2)
1.03072 + (^-6.0942)2
S 45.02 + (X2-15.52)2
(19)
(20)
■
■
■ ■

The graph of dispersion relationships for the three window materials and water is seen in Figure 2.
Absorption coefficients in units of cm" were calculated for the ocular media using the transmissivity of the tissue (equation 14); thickness (cm) of the tissue; and the Lambertian absorption coefficient (equation 2) which is repeated below:
a = Ln(l/T)x
METHODS AND MATERIALS
All ocular media components were obtained from freshly enucleated rhesus monkey -»yes (Macaca mulatta). The primates ranged from 2.2 to 5 kg in weight and were approximately 2 to 2.5 years old and of mixed sex. All animals were in good physical health with no observed opacities or lesions of the cornea or lens.
The primates were tcanquilized by a 0.4 cm injection of ketamine hydrochlorlde (100 mg/cm ) administered Intramuscularly. Once the animal was quieted, one leg was catheterlzed for administration of the anesthetic (sodium pentobarbital). The barbiturate was given for effect at a strength of 50 mg/ml. The components of the refractive media were surgically removed after the animal had reached an adequate plane of surgical anesthesia.
Aqueous Mumor Removal
With the proper anesthetic plane achieved, a small-bore (#22) hypo- dermic needle was inserted into the anterior chamber of the eye around the corneoscleral junction. A 0.1- to 0.2-cm sample of aqueous was slowly withdrawn in such a manner that the iris would not prolapse or the cornea or that iris pigment was not drawn Into syringe along with the sample. After sample withdrawal was completed, the animal was returned to the animal care facility for future use. From visual inspection, the lost aqueous humor was usually regenerated in 1-2 weeks following removal.
Cornea, Lens, and Vitreous Removal
When the animal was returned a few wee!.;, later, anesthesia was again administered for surgery. At this time, the remainder of the refractive-media components were extracted.
The cornea was removed by either using a corneal trephine or cutting around the corneoscleral junction with fine tissue scissors. After removal, the cornea was immediately placed in a relatively air- tight tissue cell for measurement. Total time between removal and measurement was usually less than 5 minutes.
10
■
z D
[I ir u K
L. D
X u Z
.2 .S I 2 S II
MRVELENGTH M
Figure 2. Dispersion curves used In the Investigation.
11
The lens was removed through the anterior chamber by blunt dissec- tion, with precautions taken to prevent seepage of blood onto the lens or Into the vitreous body. As with the cornea, the lens was quickly placed in an optical cell for measurement.
The vitreous humor was withdrawn in a similar fashion to the aqueous, using a #12 bore needle. The needle was inserted into the opening vacated by the lens, and approximately 1-2 cm of sample were withdrawn. Care was exercised to insure that the needle did not suc- tion retinal pigment or blood into the syringe.
The animal was maintained under a deep plane of anesthesia through- out the surgical removal of both eyes so as to maintain near-normal ocular tissue metabolism during the accumulative surgical time, or 2 hours. Following the removal of the refractive media from both eyes, the animal was euthanized with a lethal close of Barb-euthol or Lethol and submitted for necropsy.
Ocular Sample Cells
The small volumes of aqueous humor withdrawn required that micro- volume cells be used in measuring spectral transmission. Two types of microcells were used for this study: (1) rectangular cells constructed of NIR quartz (Infrasil) glass, with a useful transmission range of 0.2- 3.5 urn; and (2) oval, disposable cells in which the window material was silver chloride (AgCl), with an 1R transmission cutoff of about 25 vim. The two types of cells allowed transmission measurements over the com- plete region of interest; i.e., 0.2-15.0 \m.
By minimizing cell widths, the quartz microcells could have path- lengths as large as 1, 2, 5, 10, or 20 mm, with corresponding volumes of 0.05-0.4 cm . The use of microcells required the spectrophotometer's slit width to be reduced to less than the coll width. The longer path- lengths were necessary to increase measurement accuracy In spectral regions where the aqueous was transmitting nearly all of the incident energy; I.e., near-UV, visible, and near-IR regions. Pathlengths less than 1 mm were verified by observing interference fringe patterns from the transmission scan of the empty cell and by using appropriate equations to compute pathlength.
Both the rectangular cells described above and a set of cylindri- cal cells were used in the transmission measurements for physiological saline and distilled water. The cylindrical cells were used because their larger pathlengths (10, 20, 50, and 100 mm) increased measure- ment accuracy in the highly transmitting, visible, and near-infrared wavelengths. An ample supply of saline and water permitted using the large-volume cylindrical cells, a situation not possible with aqueous or vitreous samples.
12
In spectral regions where light absorption was near 100* of the incident, extremely small pathlengths were required to provide trans- mission data necessary for calculation of absorption coefficient. To fulfill this requirement, a variable-pathlength optical liquid cell was used that allowed pathlength adjustments from 2 to 2000 yim with a rela- tively high degree of repeatability. The optical cell was used with all liquid specimens except the aqueous, and was fitted with either CaF- or AgCl circular windows. The cell was primarily useful at wavelengths In the far-infrared, where pathlengths less than 25 um were often required.
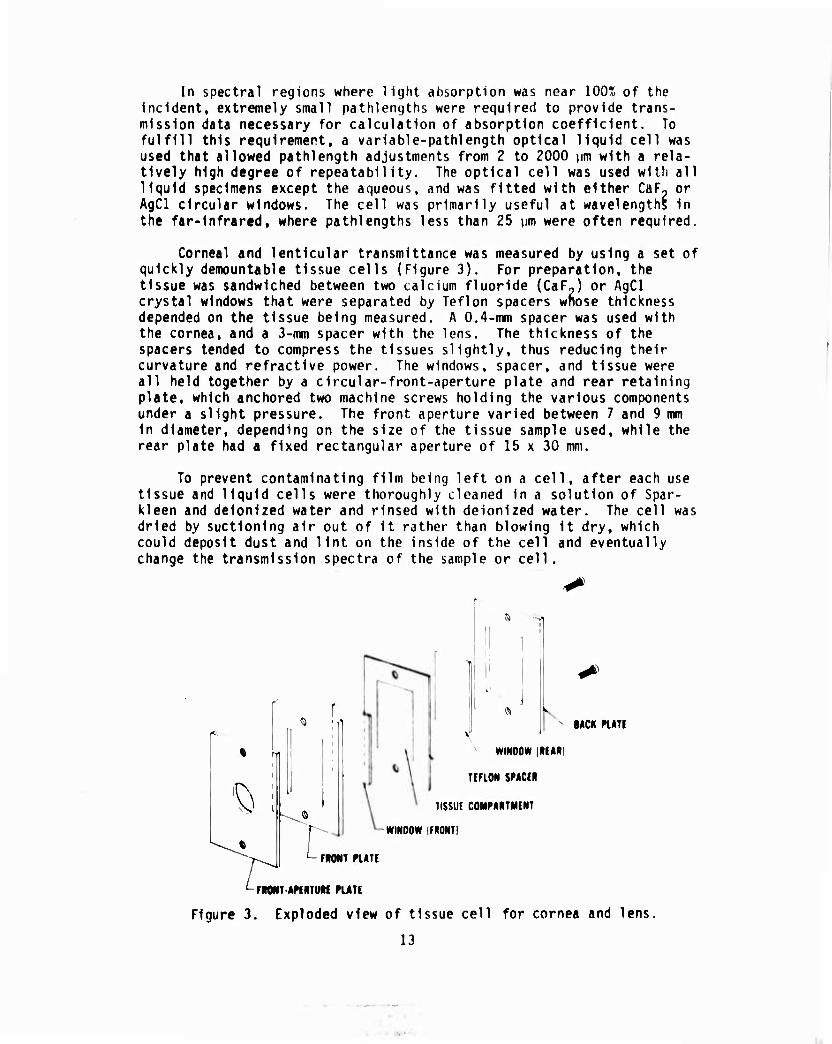
Cornea! and lenticular transmittance was measured by using a set of quickly demountable tissue cells (Figure 3). For preparation, the tissue was sandwiched between two calcium fluoride (CaFp) or AgCl crystal windows that were separated by Teflon spacers wnose thickness depended on the tissue being measured. A 0.4-mm spacer was used with the cornea, and a 3-mm spacer with the lens. The thickness of the spacers tended to compress the tissues slightly, thus reducing their curvature and refractive power. The windows, spacer, and tissue were all held together by a circular-front-aperture plate and rear retaining plate, which anchored two machine screws holding the various components under a slight pressure. The front aperture varied between 7 and 9 mm In diameter, depending on the size of the tissue sample used, while the rear plate had a fixed rectangular aperture of 15 x 30 mm.
To prevent contaminating film being left on a cell, after each use tissue and liquid cells were thoroughly cleaned in a solution of Spar- kleen and delonlzed water and rinsed with deionized water. The cell was dried by suctloning air out of it rather than blowing It dry, which could deposit dust and lint on the inside of the cell and eventually change the transmission spectra of the sample or cell.
^
«
v
v BACK PIATI
WINDOW IIEARI
TEFLON SPACER
TISSUE COMPARTMENT
WINDOW IFRONTI
FRONT PLATE r L FRONT APERTURE PLATE
Figure 3. Exploded view of tissue cell for cornea and lens
13

Instrumentation and Calibration
Total transmission measurements (scattered plus directly transmit- ted intensities) were made in the spectral range of 0.2 to 15 \m for components of the refractive media, physiological saline, and distilled water. Two ratio-recording spectrophotometers were used: Beckman model ACTA MVII and model IR-9.
Prior to the recording sessions, both spectrophotometers were allowed a 2-hour wartnup and stabilizing period, which helped reduce random-noise levels during measurement sessions. The zero and 100% scale limits were calibrated by first scanning with the sample beam blocked and then balancing the sample and reference-light Intensities. Variations in the zero or 100% lines with wavelength were corrected electronically or accounted for in the calculations. In addition, the recording accuracy of both spectrophotometers was periodically checked by measuring fixed-screen filters which ranged in value from 7% to 49%.
In an attempt to obtain absorption coefficients comparable to those that would be found with a laser source, the spectral bandwidth of both Instruments was kept at a minimum. High resolution was maintained throughout the Investigation as long as noise levels were not excessive. Bandwidths were controlled by using minimal slit widths and by scan- ning the spectrum slowly. Table 1 lists the bandwidth constraints followed during our measurements.
TABLE 1. MEASUREMENT BANDWIDTH
Spectral range (um)
Slit width (mm)
Bandwidth (A)
0.2 - 0.7 0.7 - 2.5 2.5 -15.0
0.006 - 0.18 0.006 - 0.25 0.0 - 4.0
< 2.0 < 10.0 < 70.0
Transmission Measurements
To obtain high resolution and wavelength accuracy, the maximum scan rates were.set as follows: 10 nm/s (0.2-0.8 ym); 20 m/s (0.8-2.5 urn), and 80 cm" /min (2.5-15 ym). In regions where the transmission was changing rapidly with wavelength, the scan rate was reduced to prevent exceeding the response of the recording pen.
Each sample and corresponding blank cell was placed in the center of the sample chamber and centered within the beam at normal incidence. In each measurement, a scan of the blank (empty) cell immediately pre- ceded the scan for the same cell containing tissue. Photometric ranges were changed according to the amount of transmission and maximum pen deflection obtainable. In highly absorptive regions, screen filters were placed in the reference beam to raise the analog signal above the
14
■
ambient noise. When reference filters were used, the highest sensitiv- ity, full scale, was zero to 0.56% for both spectrophototneters.
Total transmission was previously defined as the summation of the directly transmitted and forward-scattered light intensities. Direct light Intensities exit the tissue parallel to the measurement beam's axis, while forward-scattered light intensities are transmitted at acute angles to the beam. Back scatter, that light which Is scattered back Into the anterior hemisphere of the tissue, was assumed negligible (4- 6). The amount of forward scatter detected by the Instrument Is a function of the tissue-scattering angles, distance to the collecting mirrors or detector, and size of baffles in the light path.
Boettner's investigation (5) into the forward scatter of human eyes (age 4 weeks to 75 years) determined that approximately 35% of 566-vim incident light is forward scattered outside an angle of 1 . He also found that nearly all scattered energy was contained within a 3 exit angle. Although our study did not repeat his measurements, there was concern to determine if our spectrophotometers were detecting all measurable forward scatter. The geometry of the ACTA's optical design between tissue and convergent detector mirror was such to collect all light scattered within an angle of 15.5 . Detection of the total transmission required that all transmitted energy fall within this collecting angle. The effectiveness of the system to detect all the transmitted light was tested by two methods. The first was to intro- duce a +15-cm focal-length lens directly behind the posterior side of the tissue cell and collimate the transmitted light prior to its reach- ing the collecting mirror. The second method was to place an integrat- ing sphere In the sample compartment behind and adjacent to the tissue cell. The sohere gathered the radiation energy over a cone with an angle of 140 . Cornea 1, vitreous, and lenticular total transmission measurements determined with the two modification schemes showed no significant differences from measurements with the normal Beckman optics. From this comparison we concluded that the instrument's ability to measure scattered light was adequate for total-transmission measure- ment of the ocular media.
Tissue Thickness Measurements
A previous investigator at USAFSAM (14) used ultrasonic techniques to determine tissue thicknesses for the various components of the ocular media. His study determined the in-vivo thickness of the cornea, lens, anterior chamber, and vitreous body for a population of 128 rhesus eyes (Table 2). In-vivo measurements for thicknesses were chosen to elimi- nate measurement errors associated with techniques using enucleated specimens; I.e., tissue shrinkage and distortion. The primates for both his and our studies were from the same animal colony and were approxi- mately the same age and weight. Many of the rhesus Included In our transmission measurement had been subjects for the thickness measurements,
15

Average thickness
(mm) + SD
0.5527 0.0028 2.8564 0.0492 3.4927 0.0428 11.5473 0.6488
Arterior chamber and vitreous body depths were used to calculate the total ocular transmission contained in the Results section of this report.
TABLE 2. THICKNESSES OF THE OCULAR MEDIA (17)
Tissue
Cornea Anterior chamber Crystalline lens Vitreous
Absorption Coefficient Calculations
The raw transmission data from an empty cell and a cell contain- ing the specimen were electronically digitized (Hewlett-Packard model 9864A digitizer) from the spectrophotometric charts and transferred Into the memory of an H-P model 9820 calculator system. The calcula- tor unit performed the various calculations for tissue transmisslvity and compiled the data at uniform wavelength or wavenumber intervals. The Information was then stored on digital magnetic tape cassettes (H-P model 9865A cassette memory) for future use.
RESULTS
A total of 48 rhesus eyes (24 monkeys) were used for these meas- urements, which encompassed nearly 2 years of investigation. Since all animal subjects were approximately the same age and weight, any observed transmittance differences in the data were not attributed to these factors. The previous ultrasonic measurements for in-vivo tissue thick- nesses showed no apparent variations that could be correlated to the right or left eye, weight, or sex of the animal.
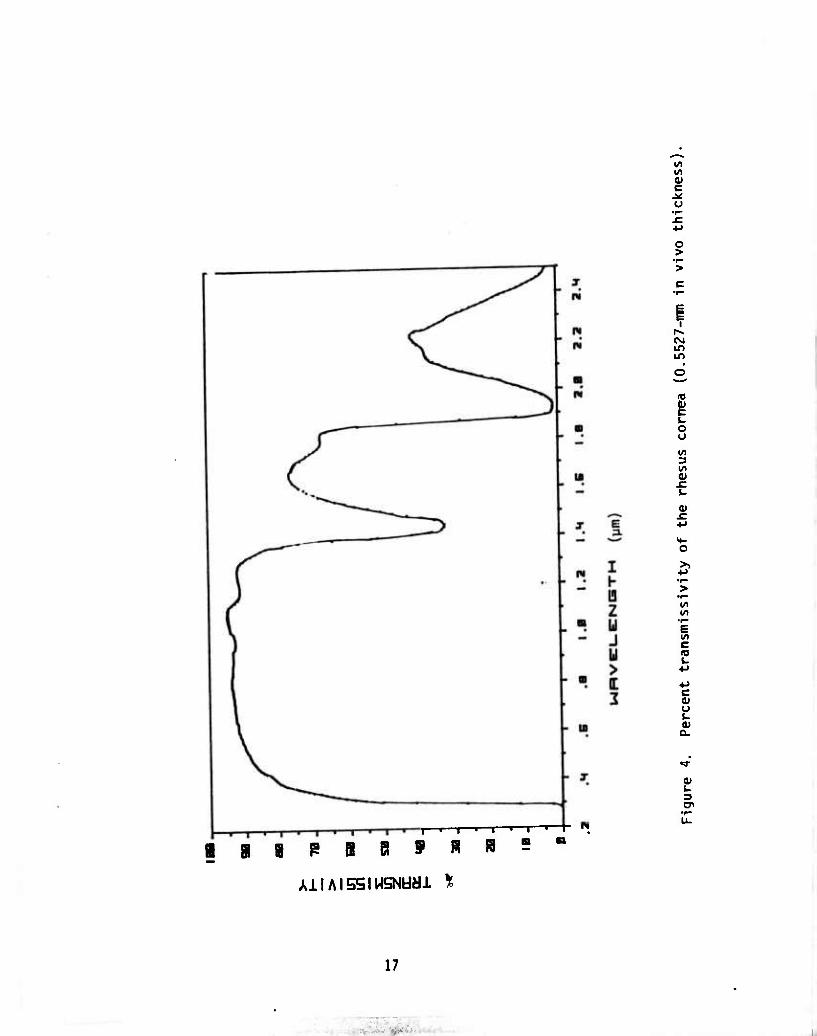
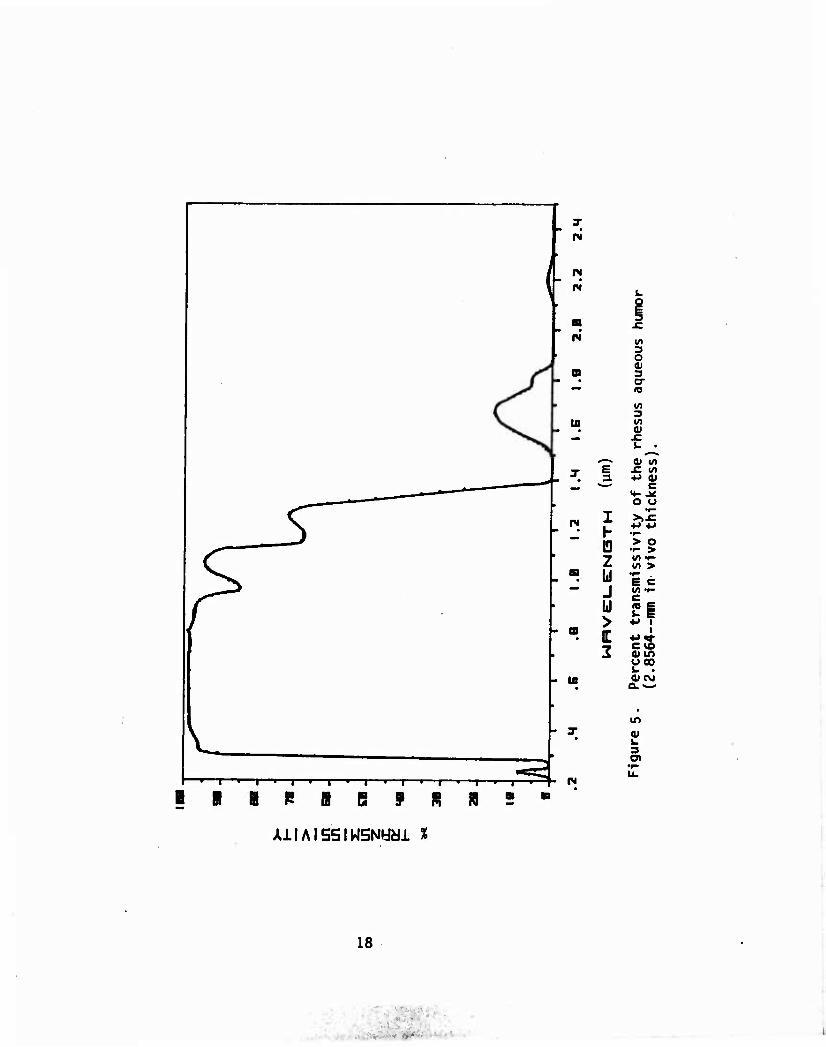
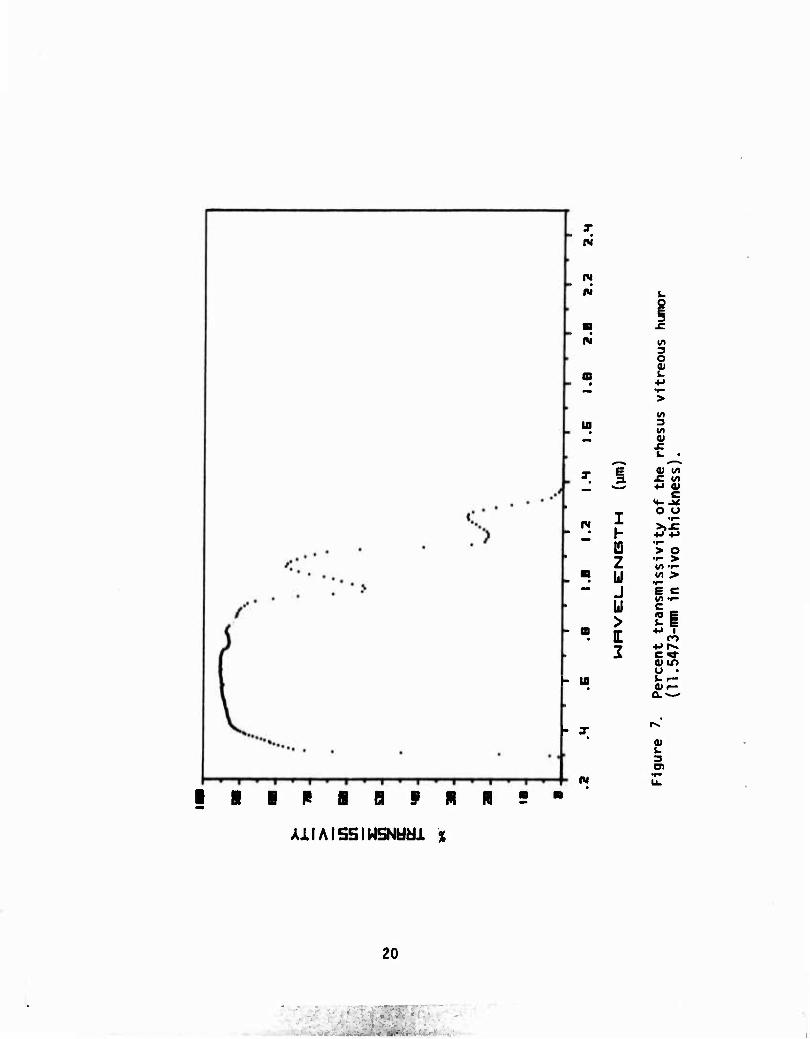
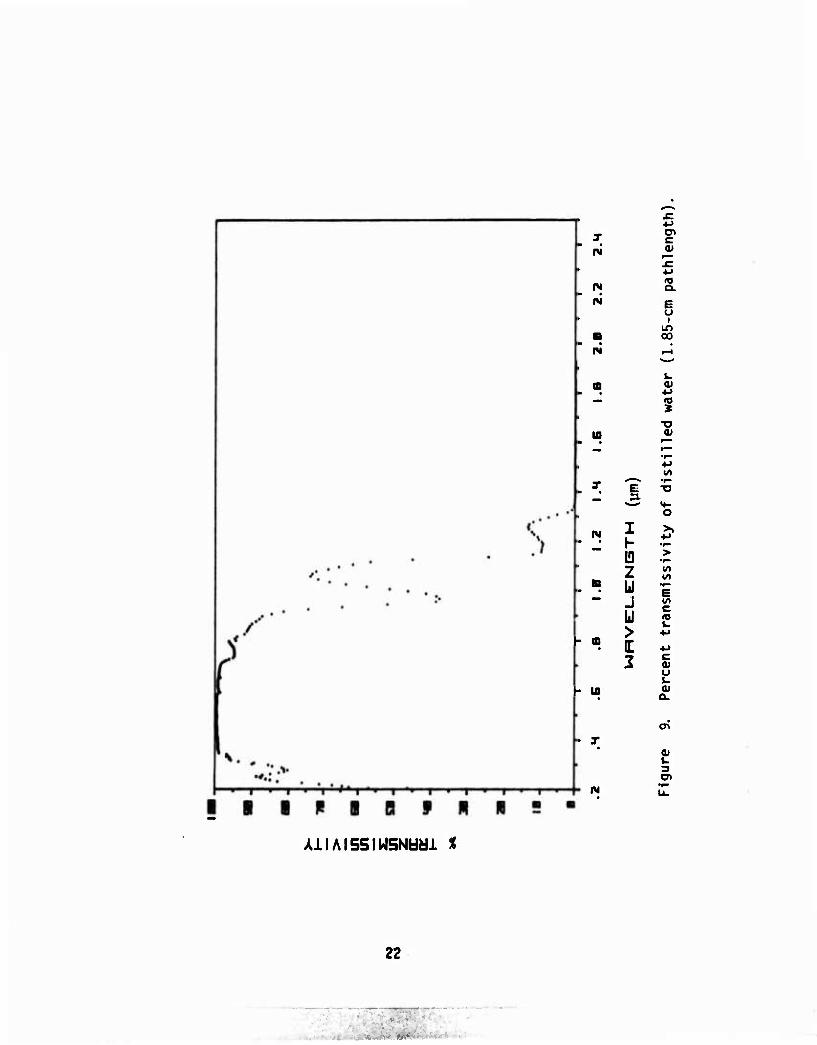
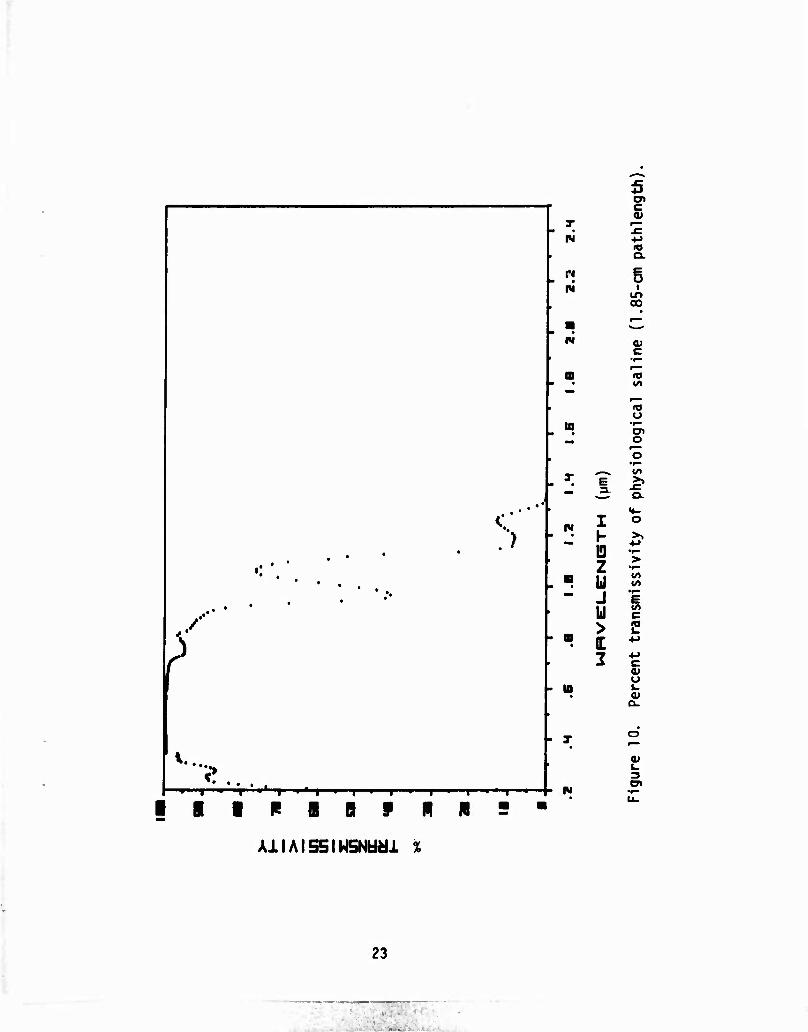
Figures 4-10 represent the transmisslvity of the cornea, aqueous humor, lens, vitreous, entire rhesus ocular media, distilled water, and physiological saline, respectively, in the wavelength region of 0.2- 2.5 ym. This spectral region was chosen because it contains most laser emissions and encompasses nearly all wavelengths of significant tissue transparency. The percent-transmlsslvity curves were plotted for the In-vivo thicknesses of the Individual ocular media components. The 1.85-cm pathlength used in calculating the percent transmisslvity for distilled water and physiological saline is approximately the total thickness of the rhesus monkey ocular media (14).
16
I*
§
f CSJ
in
s 1/1
o
c
c 0) o u 0)
a>
I—■—l—r—I—•—I—»-
AilAISSIWSNUMi %
17
IN
ri
fM
tu
IN
T—I • 1 • 1 > 1 ■ 1 • 1 " 1 ■ 1 > 1 '
I9BPBS9SR
h tn
IN
w 3 O <U 3 cr (0
t/> 3 CO « £ i- •
—. 9) V> E £ (/> 3. +J 0) •^•^ c
f- n o o
I H •r-
ID > O •r- >
Z (il •P-
E c J c u ?! > 4-> 1
IL 2 ti
<uir> uoo OICVJ
ir>
AllAISSIWSNHyi %
18

o >
I I
ro
c
3 in 01 x: C 0)
o
•r- E c <a .
+J </) M
C C «.* o o OIJC
to
AilAISSIMSNUai X
i
19
■- -
T
rv
N
ID
'. I
I«
- U
- T
IV
AilAISSIWSNBdi %
I h 13 z y j y > IE 2
o 0)
> to 3
(V
0) to £ »/I +j ft)
C
o u
> o •f- > «/) ■»- in >
E c u» •»- c 10 g i. E +J i
CO
c ^t- oi in o • i. ^-
3 CT>
20

E 3.
I 10 Z u J bi > IE Z
C
a.
i ID 00
01
OJ 1-
c OJ
O)
o x:
•f— E c
■»->
c OJ u J- 0J a.
OJ
a>
AllAISSmSNUdl %
21
■
• ■
T N
W ri
N
Ifl
N
- a
- u
3-
I h 10 z u J u >
2
c
IT} Q.
E u i
in oo
I. <u
■M <o
a»
o
>>
10
E c
0) u I- 0) a.
en
N
AiiAissiwsNyai «
22
>
/
I... <•?...
5 a> c <u X • £ tu ■»->
(O o. (•4 • 6 IV
N
la
N
- 10
- T
' I ■ I »' I ' ' I ■ I ' I ■ I
iiiieieipn -I ' I ■ I w
oo
<u
<o in
, »o o
•F—
o> o r^ o
•p- ^r-.^ l/> F >» 3. .c
o. «4-
I o
h
z >
u 00
J E u c > £ I ■M
2 ■M C OJ u t. <u Q.
AllAISSmSNUdl %
23
n "11" ■lll^l I ■ ,. ■
Tabulated values for the mean absorption coefficients, standard deviation for the absorption coefficients, optical density, percent transmissivity, and the number of specimens are contained in Appendix A, as a function of wavelength. Since much of the raw transmission data was measured using various pathlengths, the unbiased standard deviation was calculated relative to the absorption coefficient. In nearly all Instances, the absorption coefficients were normally distributed about the mean value and minimally skewed. In all cases, the percent trans- missivity was calculated using the mean value of the absorption co- effl-ient and the in-vivo tissue thickness. All optical density values were calculated from the percent transmissivity. The optical-density and percent-transmissivity values of the appendix were calculated up to 100 CD and 1.0 x 10'"%, respectively. Percent-transmissivity values smaller than this were not tabulated.
The appendix tables display the results at four uniform wavelength Intervals that corresponded with the spectral regions of measurement: (1) 5-nm Intervals for 0.2-0.8 pm; (2) 10-nm intervals for 0.8-2.5 \im; (3) 100 wavenumber steps for 2.5-5.0 ym; and (4) 200 wavenumber steps for 5.0-15 ym.
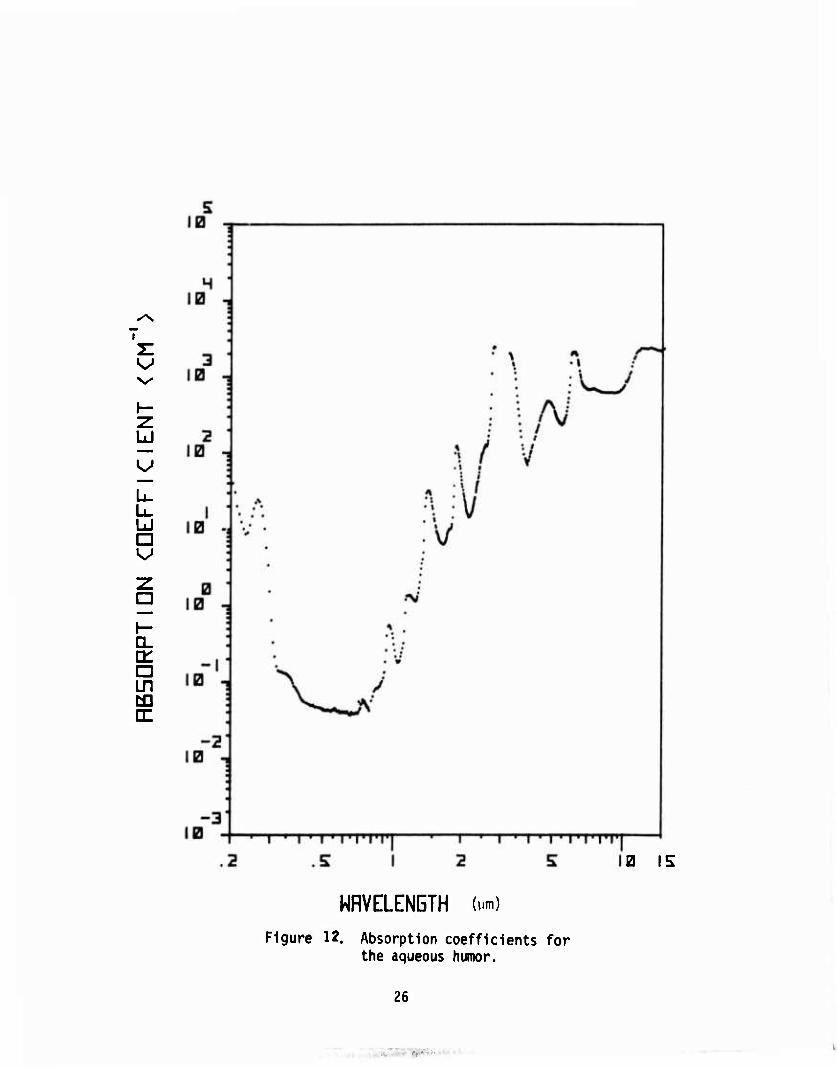
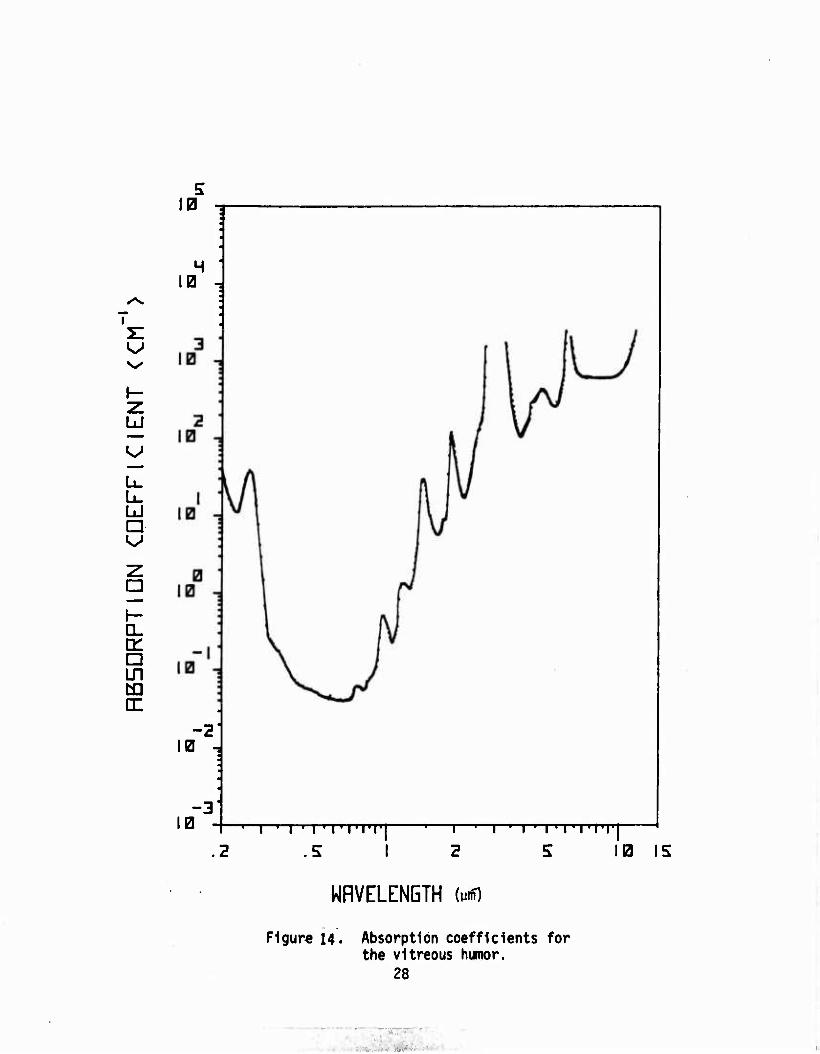
Figures 11-16 are logarithmic plots of the results of absorption coefficient measurements in the wavelength interval of 0.2-15 ym. The gaps in these curves represent wavelengths for which the absorotion coefficient was extremely large (beyond the sensitivity of the detectors; consequently, values could not be obtained.
In a few Instances, some transmissivity data were excluded from the final results because of irregularities or instrument malfunctions. Most frequently, the excluded samples were lenses with opacities or vitreous humor specimens contaminated with blood or fragments of retinal tissue. One aqueous humor sample was excluded because It contained particulates sloughed from a lens afflicted with a severe opacity. All but two of the corneas measured were termed as normal. In total, approx- imately 5t of the total samples measured were excluded from the final results.
DISCUSSION
In most previous investigations, variations in species, measure- ment techniques, and tissue preparations have been too diverse to allow comparisons between their respective results. For example, the reported elapsed times from tissue enucleation to measurement have ranged from 15 minutes to over 8 hours between various studies, with tissue prepara- tion ranging from immersion in a variety of solutions to no immersion at all, thus raising concern about the integrity of some of the measure- ments. Only one study reviewed has attempted to minimize the measure- ment system's bandwidth and provide detailed statistics (6).
24

1
U □
□
0-
□ in
CE
1—' I ' I ' I' I'l'l'l'l
2 S 10 IS
WAVELENGTH W
Figure U. Absorotlon coefficients for the cornea,
25
V
U
U □
CL cr □ m CD
0 IS
WAVELENGTH im) Figure 12. Absorption coefficients for
the aqueous humor.
26
'

I
V >•
Lü
vj
U. LL. LÜ □
a. □ m
!0 IS
NRVELENETH (ym)
Figure 13. Absorption coefficients for the crystalline lens,
27
I
NX
z u
U □
CL
□ m to a:
IB
H IB 4
-2 IB
-3" IB I ' I ' I ' I 'I'lTI
.2 I -I—.—i ' i ' i ' I'l'i'i'i '
2 5 IB 15
WRVELENGTH M
Figur« 14. Absorption coefficients for the vitreous humor.
28
•. •

I z:
ÜJ
U □
I-
□ m
1 u -i • • •
H " IB -, « • • • •
* *. in f \
•
3 ■ IB -,
• • • i i
2 * IB 1
■
1 ■ •
IB 1 ■
■
; v ■
B ' IB •,
* '
■ 4
-1" IB n
• •
V %
• •
• * < . V
-2" IB J
• •
•. •
"3 IB J % -"?■
1 KJ ^1 - i - n i • i • i ■ i • < TTT1 "'
.2 IB IS
WRVELENETH (ym)
Figure 15. Absorption coefficients for distilled water.
29
.-^ ■■■! II—IW» ■ .^
- • - .
1
z Ld
Lu L. LJ □
Q.
□ m to IT
.2 l ' I ' »'I'l'l'l'l
.S I 1—' I ' I ' I' fl'l'l'l
2 S 10 IS
WAVELENGTH (ym)
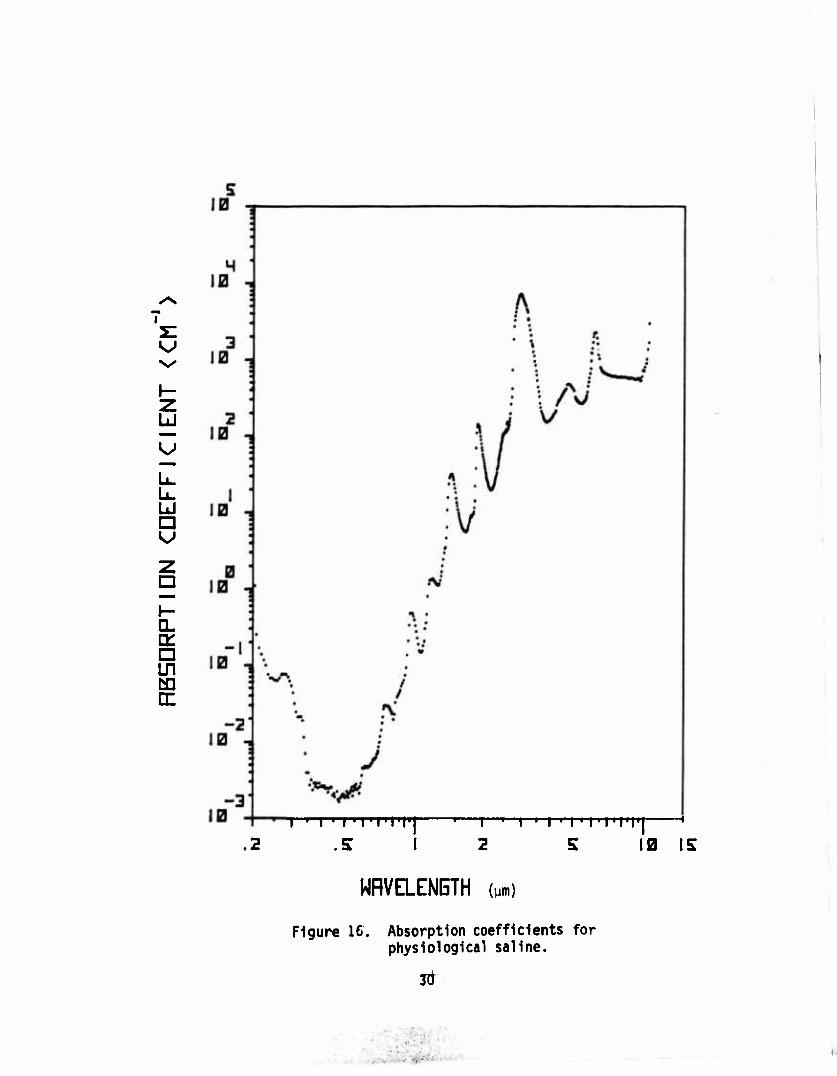
Figure 16. Absorption coefficients for physiological saline.
Jit
■
■
>
Many studies show large transmission differences, particularly at wavelengths where the absorption Is high. Of these discrepancies, many can be attributed to anatomical variations between the rhesus monkey, rabbit, bovine, and human eyes or to lack of or erroneous corrections for reflective and scatter losses. To date, only one study reviewed has recorded tissue thicknesses and calculated absorption coefficients (6).
In contrast, our Investigation was conducted with a comparatively large number of specimens that were measured Immediately after enucle- atlon. The utmost care was exercised throughout the surgical-removal, tissue-mounting, and measurement phases of the study. All specimens were handled In the same fashion so that differences due to various methodologies would not be encountered.
The transmission measurement In all reviewed studies of this sort has been by one of two methods. The first method measures transmission through the total refractive media either by reflecting the Incident beam off the sclera or lens. In vivo, and determining the single-pass percent transmission (1, 36), or by measuring direct transmission through the entire eye Irv vitro (5, 15, 20, 40). The second method, which yields more Information, measures the transmission of the Individ- ual components of the refractive media (4-6, 9, 24, 31, 32). The latter method allows calculation of the various tissue absorption coefficients. Both methods are comparable In determining the transmission through the entire ocular media, as demonstrated by Boettner (5).
The remaining discussion will focus on measurement results for each component of the refractive media and comparing the transmlsslvlty of the refractive media, distilled water, and physiological saline to other studies.
Sample Measurements
Cornea—With wavelengths from 0.200 to 0.255 ym, the cornea Is opaque with optical densities In excess of 4. With wavelengths from 0.300 \m, the transmlsslvlty Increases very rapidly, and a maximum trans- mission of approximately 95% is attained at 1.085 \m. Boettner (6) obtained a value of 97.2% at 1.085 \m; however, he measured a maximum transmlsslvlty of 97.7% at 1.234 ym, whereas this study measured 92.3% at the 1.234-Mm wavelength. These minor discrepancies may partly be the result of Boettner's reporting median rather than mean values. For our measurements, median values were consistently slightly higher than the mean.
Starting from about 0.535 vim and extending Into the near Infrared at 1.310 wn, the cornea has a relatively flat transmission spectra, with transmlsslvltles greater than 90%. Centered at 1.45 and 1.93 ym. however, the cornea demonstrates pronounced absorption bands which are attributed to water absorption. Significant transmlsslvlty windows were found in
31
■
the 1.5- to 1.8-nn and 2.0- to 2.4-Mm wavelength bands where the maximum transmlsslvUles were 76.5% and 41,5% respectively. Throughout the near Infrared, these ir-iasureroents agreed well with other investigations (4-6, 24. 31. 32).
Accurate transmlsslvlty measurements at wavelengths greater than 2.5 ym were not possible because of the very high (nearly 100%) absorp- tion of the cornea. Measurements were attempted, but data reliability was quite poor and often not repeatable. Attempts were made to obtain absorption coefficients by freezing the cornea to reduce the absorbing pathlength and sectioning with a microtome; however, this effort failed to yield reliable values because of the large variability and uncertainty In determining the final pathlength. and the Inability to obtain sections with surface areas large enough to transmit the measuring beam. For wavelengths greater than 2.5 um, reasonable estimates for corneal absorp- tion coefficients would be those of water because of the high water content of the cornea (75-85%).
The change In corneal transmlsslvlty with time after enucleatlon was dramatic. Bathed In Ringer's solution, the cornea would usually cloud over In less than 30 minutes. When enclosed within the cell, the cornea could be maintained up to 2 hours with only a small loss In transmlsslvlty (-5%); for times less than 1 hour, no change In transmls- slvlty was observed.
Absorption coefficients calculated from these corneal transmlsslvlty measurements demonstrated some minor variations from those obtained by Boettner (6). particularly at very high or very low absorbing wavelengths. These discrepancies may be explained in two ways. First. In regions of very high or very low absorption, a small change in transmlsslvlty will have a large effect on the absorption coefficient. For example, a 2% change In corneal transmlsslvlty at 1.08 urn will cause a. 41» change in the absorption coefficient. A similar effect can be demonstrated In spectral regions of low absorption. The second explanation for some of our differences with Boettner's coefficients may He in the fact that he used a smaller corneal thickness (0.0515 cm) In his calculations, based on the human corneal thickness proportionally reduced by the ratio of the diameter of the human eye to the diameter of the monkey eye. In contrast, our corneal thicknesses were measured in vivo by ultrasonic reflections. This difference In thickness Itself can produce up to a 10% Increase In Boettner's absorption coefficients relative to those measured In this study.
Aqueous Humor--The aqueous humor showed a small but significant transmission In the ultraviolet, with a maximum transmlsslvlty of 8.6% at 0.235 urn. The transmlsslvlty Increased rapidly, starting at 0.280 ym, and continuing to 0.310 ym where the rate of change decreased, eventu- ally reaching a maximum transmlsslvlty of almost 99% throughout the visible and near Infrared. A weak absorption band Is noticeable In the wavelength region between 0.900 and 1.03 ym, where the transmlsslvlty
32
makes a slight dip; this absorption region Is associated with water. The aqueous began to absorb appreciably near 1.13 pm and Increased rapidly, peaking in the strong water band at 1.435 pm. A small area of trans- mlsslvlty (<20X) was observed between the two strong absorbing regions at 1.435 and 1.925 urn, and a second smaller window was found centered at approximately 2.2 Mm. Negligible transmlsslvlty Is encountered past a wavelength of 2.3 urn. A comparison with previous literature shows excellent agreement In this wavelength region (4-6, 24, 31, 32).
Aqueous absorption coefficients were obtained throughout the Infra- red to 15 vim, by use of 25-vm pathlength cells. Table A-2 shows that aqueous absorption Is very similar to that of water. Absorption coeffi- cients could not be calculated around the 3- and 6-ijm regions because of the extremely high absorptions.
As long as 48 hours after removal from the eye, aqueous samples were measured without a noticeable decrement In transmlsslvlty. This observation was expected since the aqueous humor Is approximately 99% water by weight.
Crystalline Lens--The rhesus lenses demonstrated no transmlttance In the far ultraviolet up to a wavelength of 0.310vjm. At this point the transmlsslvlty began to Increase, showing a small window In the region of 0.31-0.345 \m, with a maximum transmlsslvlty of 7.45% at 0.320 ym. The lens was highly absorptive at 0.350-0.390 um, with the transmlsslvlty Increasing rapidly Into the visible wavelengths and finally obtaining a maximum value of 95.3% between 0.780 and 0.820 ym. The transmlsslvlty remained high until the water band at 1.45 ym; then. In the region of 1.500-1.870 ym, a window appeared. The remaining spectrum out to 15 ym was void of any appreciable transmlttance (<2%).
Our results were compared with those of Boettner (6) and Weale (39). In the highly transmitting wavelengths, Boettner's values were about 1-2.5% larger than ours; again, the discrepancy possibly arose from his use of the median value. The largest difference In the two sets of data, however, occurs at wavelengths In the near-Infrared water bands, where Boettner reported values of less than 0.2%, the measurement limit of his Instrument, and was unable to obtain absorption coefficients through these regions. In contrast, we showed a transmlsslvlty of approximately 1% through the 1.45-Mm absorption band at 0.2% or less through tne 1.95-ym water band. Because of the high absorption In the 1.95-ym band, we could not calculate with a high degree of certainty the absorption coefficients at a few wavelengths. These differences are perhaps due to the measurement limits of the respective spectrophotometers at the highly absorptive wavelengths. The ACTA MVII, operating in expanded scale, permitted our measurements without reference beam attenu- ation of + 0.2%.
Weale used only two freshly enucleated human lenses and limited his measurements to the visible spectrum. His data appears to be slightly lower throughout the visible wavelength, 0.4-0.7 ym, than either Boettner's or ours.
33
■
% •
Lens transmlssivity in our study was unchanged even after the lens had been In the cell as long as 2 hours. Noticeable lens "yellowing" occurred at 4 hours post enucleatlon and was accelerated after UV Irradia- tion.
Absorption coefficients for the lens were determined at from 0.300 to approximately 4.4-iJn wavelengths. To obtain reasonable values in the highly absorptive wavelengths of 2.5-4.4 ym, a 0.4-mm slice from the anterior side of the lens was used to measure transmittance on three rhesus lense:. Besides reducing the pathlength, we increased the spec- tropliotometer slit width and attenuated the reference beam. The wide slit width seriously lowered the instrument's resolution to greater than 400 A at 2.5 vm; because of this, the actual absorption coefficient In the 2.5- to 4.4-Mm spectrum may be higher than reported here, particu- larly around the 3-pm water band where the absorption is extremely large. Since measurements of this type have not been reported before, we had no reference with which to compare our results. A comparison with the coefficients of water suggests that the lens values could actually be a factor of 2 or more higher at certain wavelengths. Whether or not this difference is real Is not known.
Vitreous Humor--The vitreous humor absorbed nearly all of the far ultraviolet at wavelengths less than 0.300 m. As the wavelength in- creased from 0.300 um, the transmlssivity increased rapidly and remained high until the water absorption band at 1.2 iim. Throughout this region, the maximum transmlssivity was calculated to be 95.9% In the 0.62- to 0.66-um wavelength interval. In addition to the band at 1.2 urn, a moderate water absorption band was observed at approximately 0.98 um. Absorptive regions were also found at 1.45, 1.92, 2.94, and 6.09 urn, with the 2.94- and 6.09-um bands being the strongest. In considering the in-vivo thickness of the vitreous and the amount of absorption measured, a negligible fraction of energy incident upon the cornea will be transmitted to the retina for wavelengths greater than 1.4 urn.
The Infrared absorption spectrum was almost identical to that of water, particularly at wavelengths greater than 2,5 urn. Data could not be measured through the 3-, 6-, and 15-Mm absorption bands because the viscosity of the vitreous prohibited using shorter pathlength optical cells.
The transmlssivity values of Table A-4 are In excellent agree- ment with those of previous studies (4, 31, 32) for the 0.30- to 1.4-wn wavelength Interval. Beyond 1.4 pm, no transmlssivity measurements were available for comparison.
Absorption coefficients were calculated throughout the 0.2- to 15-wn wavelengths, with the exception of the strong 3- and 6-um bands.
34
The results are tabulated in Table A-4. Absorption coefficients at wavelengths greater than 11.7 um could not be determined but were in excess of 2000 cm"1.
Transmissivity Comparisons
Entire Ocular Media--To compare our data and techniques with studies that measured the entire ocular media in vivo or in vitro, we calculated a composite transmissivity curve for the eye, using the data from Figures 4-7 and the following equation:
%Teye" TC x Ta x Tl x Tv x 100 (21)
where
rhesus eye, and
%T » % transmissivity through the entire clear media of the
Tp.T .T,,! = transmissivity of the cornea, aqueous, lens, and
vitreous respectively.
In composite-curve calculation, all inner-reflection losses from the Interfaces of the ocular media have been neglected because, at best, they would total less than 0.3% (6).
Figure 8 shows that the effective wavelength region for signifi- cant transmlttance is from 0.4 to 1.4 um, along with a small interval at 0.3-0.33 um. The maximum percent transmissivity through the eye was calculated to be slightly less than 85% at 0.75-0.8 urn. Our transmis- sivity values agree quite well with Boettner's (4, 5) which had an average value of 83.5% at 0.7 um for nine human eyes and 86.5% at 0.75 um for five rhesus eyes. Pitts (31, 32), measuring the total trans- mlttance through the bovine eye, determined a maximum transmissivity of 85.9% at 0.65 urn, which also compares closely with our measurements. Wiesinger et al. (40) and Geeraets and Berry (15) had the only studies of those reviewed, that measured the transmissivity of the rabbit eye in vitro. Both of their results were 8-10% hiaher than any similar measurements using rhesus. Geeraets* data (which Included monkey, rab- bit, and human eyes) determined that the monkey transmissivity was consistently lower than that of rabbit eyes even though the same meth- ods were used.
Other differences between our values and other investigators occurred near the UV and near-IR transmittance-cutoff wavelengths, where anatomical species variations appear to be important.
Distilled Water--Table A-5 lists the results of measurements performed on doubly distilled water. As mentioned previously, th?«5e results and those for physiological saline were compared to the
35
transmittance spectrums for the refractive media. Transmissivity meas- urements for water and saline were made with a 1.85-cm pathlength, the approximate thickness of the rhesus refractive media (14).
The transmissivity of distilled water was relatively high in the ultraviolet, even at the UV measurement limit of 0.200 vm where the transmissivity was 46.6%. Considerable variability was observed in the far-UV wavelengths, most likely due to the random presence of minute contaminates and trace chemicals introduced through the distillation apparatus which can have a severe effect on the !JV spectra (2). Data variability found i- previous studies for the UV spectra of water could be due partly to the various degrees of purity of the water measured.
The near-UV, visible, and portions of the near-IR spectra had very high transmissivities, approaching 100X. Extremely high transmissivities made It important to check and recheck all instrument parameters and calibrations, because any measurement errors could change the calculated value for the absorption coefficient by several factors. Second-order reflections, which were ignored, could also have a significant effect in this region. A change as small as 0.3% in transmissivity would cause the corresponding absorption coefficient to change by a factor of 2 or 3.
In surveying the literature, a wealth of information for absorp- tion coefficients for water and ice was found, although agreement between studies was sometimes poor. The least information, only a handful of comprehensive papers (18, 25, 38), was found in the UV and visible spectral reoions. The works of Irvine and Pollack (22) and Hale and Querry (19) were used to compare the UV and visible water data. Both papers presented a composite review of nearly all data measured in this region of interest. These reviews present absorption coefficient values in the 0.2- to 0.7-um wavelength region that com- pare very well with our values, except absorption coefficients for the 0.45- to 0.55-um interval. In this region both reviews report absorption coefficients o' 1.0 to 4.0 x 10"4cm-l, while in the same interval, our study produced values of 1.0 to 2.0 x lO'^cnrl. We found no explana- tion for these discrepancies except that variations of this magnitude are common for very low absorptions. At these wavelengths, path- lengths apparently need to be in excess of 100 mm for accurate calcu- lation of the absorption coefficient. Unfortunately, most conmercial spectrophotometers would need modification to accommodate pathlengths of this size.
Absorption coefficients calculated in the near- and far-IR show excellent agreement with the literature (10, 19, 22, 23, 33-35, 41). A region of somewhat minor variation was in the strong absorption band at 2.85-3.10 ym, where our absorption coefficients appear to be 20-30% higher than those reported by Robertson and Williams (34). The differences are probably the result of uncertainties in the sample thicknesses which at times were as small as 2-5 pm. This problem was present in all
36
Investigations that attempted to measure the absorption through the strong 3-in band. At the peak of the absorption, our study calculated an average absorption coefficient of 17,700 cm' with a standard deviation of 12%. Our water absorption coefficients are In good overall agreement with current values in the literature when the various techniques and instrumentations used by previous investigators are considered. In some wavelength regions, ours comprise the only reliable data available.
Physiological $aline--Resu1ts of saline measurements are contained In Figures 10-16 and Table A-6. Since the results are very similar to those for water, a detailed discussion of the saline values is not undertaken. The only differences observed were at the limit of the UV measurements. Although slight, there appeared to be more absorption In saline, starting at 0.25 un and increasing towards the shorter wave- lengths« than for an equal pathlength of water. This small increase In absorption was assumed to be due to the ionic concentration of saline (8).
A comparison of the transmissivity of the refractive media of the eye and an equivalent thickness of water or saline demonstrated the following similarities and differences. In the ultraviolet, the refrac- tive media and water spectrum are quite dissimilar, with the refractive media being opaque in the far-UV wavelengths. These differences are apparently due to UV-absorbing species of aromatic amino acids and nudeotldes found in the cornea, lens, and vitreous (11). As wave- length increases into the near-UV and visible, the spectra become more nearly alike, although the refractive media still absorbs 10-15% more than either water or saline. The three absorption spectra become almost indistinguishable from each other in the near- and far-infrared, and transmissivity is negligible at wavelengths greater than 1.4 ym.
REFERENCES
1. Alpen, M. Spectral transmittance of visible light by the human eye. J Opt Soc Am 55(6):723-727 (1965).
2. Bangham, A. 0., and M. W. Hill. Distillation and storage of water. Nature 237:408 (1972).
3. Benford, F. Reflection and transmission by parallel plates. 0 Opt Soc Am 7(11):1017-1025 (1923).
4. Boettner, E. A., and J. R. Wolter. Transmission of the ocular media. Invest Ophthalmol l(6):776-783 (1962).
5. Boettner, E. A. Spectral transmission of the eye. The University of Michigan Air Force Contract AF41(609)-2966, July 1967.
6. Boettner, E. A., et al. Ocular absorption of laser radiation for calculating personnel hazards. The University of Michigan Air Force Contract F41609-74-C-0008, Nov 1974.
37
"I—*■■• •
i ■
• V
7. Centeno, M. The refractive index of liquid water In the near- Infrared spectrum. J Opt Soc Am 31{3):244-247 (1941).
8. Clark, G. L., and H. R. James. Labontory analysis of the selective absorption of light by sea water. », Opt Soc Am 29:43 (1939).
9. Cooper, F. G., and J. G. Rcoson. The yellow colour of the lens of man and other primates. J Physiol 203:411-417 (1969).
10. Curcio, J. A., and C. C. Petty. The near-infrared absorption spectrum of liquid water. J Opt Soc Am 41:(5):302-304 (1951).
11. Davson, H. The Eye. In Vegetative physiology and biochemistry, Vol 1, 2d ed. New Vorfand London: Academic Press, 1969.
12. Dunsky, I. L., et al. Determination of revised Air Force permis- sible exposure levels for laser radiation. Am Ind Hyg Assoc J 34(l):235-240 (1973).
13. Egbert, D. E. Laser Effects Branch, USAFSAM, Brooks AFB, Tex. Personal communication, 1976.
14. Gallagher, J. T. Laser Effects Branch, USAFSAM, Brooks AFB, Tex. Personal communication, 1975.
15. Geeraets, W. J., and E. R. Berry. Ocular spectral characteristics as related to hazards from lasers and other light sources. Am J Ophthalmol 66(l):15-20 (1968).
16. Geeraets, W. J., et al. The loss of light energy in retina and chorold. Arch Ophthalmol 64:606-615 (I960).
17. Geeraets, W. J. Radiation effects on the eye. Sightsav Rev 39:181-196 (1969).
18. Goody, R. M. Atmospheric radiation 1: Theoretical basis, p 415. London: Oxford V. P., 1964.
19. Hale, G. M., and M. R. Querry. Optical constants of water in the 200 nm to 200 pm wavelength region. Appl Optics 12(3):555-563 (1973).
20. Ham, W. T. Ocular effects of laser radiation on mammals, pp 5-30. Proceedings of the 1st Conference on Laser Safety, Orlando, Fla., May 1966.
21. Hartrldge, H., and A. Hill. The transmission of Infrared by the media of the eye. Proc of the Royal Society of London, Ser. B, 89:58-76 (1917).
22. Irvine, W. M., and J. B. Pollack. Infrared optical properties of water and ice spheres. Icarus 8:324-360 (1968).
38
23. Klslovskll, L. D. Optical characteristics of water and Ice In the Infrared and radlowave regions of the spectrum. Opt Spectrosc 7(3):201-206 (1959).
24. Klnsey, V. E. Spectral transmission of the eye to ultraviolet radiations. Arch Ophthalmol 39:508-513 (1948).
25. Lenoble, J., and B. Salnt-Gullly. Sur 1'absorption due rayonne- ment ultraviolet par I'eau dlstllle'e. Comptes Rendus 240:954 (1955).
26. Ludvlgh, E., and E. F. McCarthy. Absorption of the visible light by the refractive media of the human eye. Arch Ophthalmol 20:37-51 (1938).
27. Mellerlo, J. Light absorption and scatter In the human lens. Vision Res 11:129-141 (1971).
28. Norren, D. V. Literature review of human ocular absorption In the visible. Institute for Perception RV0-TN0, Report No. IZF- 1972-S. Natl Def Res Org INO. Nat! Org Appl Sei Res In the Netherlands, 1972.
29. Norren, D. V., and J. J. Vos. Spectral transmission of the human ocular media. Vision Res 14:1237-1244 (1974).
30. Palmer, K. F., and D. Williams. Optical properties of water in the near Infrared. J Opt Soc Am 64(8):1107-1110 (1974).
31. Pitts, D. G. Transmission of the visible spectrum through the ocular media of the bovine eye. Am J Optom 36:289-298 (1959).
32. Pitts, D. G. Transmittance of the visible spectrum through the components of the bovine ocular media. WAOD Tech Note 60-227, ASD Life Support Systems Lab, Wright-Patterson AFB, Ohio, Project No. 7165, Feb 1961.
33. Querry, M. R., et al. Refractive index of water in the infrared. J Opt Soc Am 59(10):1299-1305 (1969).
34. Robertson, C. W., and D. Williams. Lambert absorption coefficients of water in the infrared. J Opt Soc Am 61(10):1316-1320 (1971).
35. Rusk, A. N., et al. Optical constants of water in the infrared. J Opt Soc Am 61(7):895-903 (1971).
36. Said, F. S., and R. A. Weale. The variation with age of the spec- tral transmissivity of the living human crystalline lens. Gerontologica 3:213-231 (1959).
39
■ ■* ■"• ■"•' '

37. Smakula, A., et al. Harshaw Optical Crystals. Brochure of the Harshaw Chemical Company, Division of Kewahee Oil Co., Crystal and Electronic Products Department, Cleveland, Ohio, 1967.
38. Sullivan, S. A. Experimental study of Ihe absorption In distilled water, artificial sea water and heavy water In the visible region of the spectrum. J Opt Soc Am 53{8):962-968 (1963).
39. Weale, R. A. LVht absorption by the lens of the human eye. Op- tlca Acta 2:107-110 (1954).
40. Wleslnger, H., et al. The transmission of light through the ocular media of the rabbit eye. Am J Ophthalmol 42:907-910 (1956).
41. Zolotarev, V. M., et al. Dispersion and absorption of liquid water in the Infrared and radio regions of the spectrum. Opt Spectrosc 27:430-432 (1969).
40
'
APPENDIX A
TABULATED VALUES FOR CORNEA, AQUEOUS HUMOR. LENS. VITREOUS HUMOR,
DISTILLED WATER. AND PHYSIOLOGICAL SALINE
LAMBDA—Wavelength (um)
ALPHA—Mean absorption coefficients In units of cm"
SD—Standard deviation for absorption coefficients
OD—Optical density
%T—Percent transmlsslvlty
NO.—Number of specimens
41
, ,
■

TABUS A-1. CORNBA
lÄKBDA(pn) ALPHA SD OD #P NO.
.2000 to .2750 .2800 .2850 .2900 .2950 .3000 .3050 .3100 .3150 .3200 .3250 .3300 .3350 .3400 .3450 .3500 .3550 .3600 .3650 .3700 .3750 .3800 .3850 .3900 .3950 .4000 .4050 .4100 .4150 .4200 .4250 .4300 .4350 .4400 .4450 .4500 .4550 .4600 .4650 .4700
>1.67E+02
>1.67E+02 1.34JH-02 1.3115+02 1.09Bf02 7.08Bf01 3.94Bf01 2.39E+01 1.61E+01 1.24E+01 1.06Bf01 9.64E+00 8.87E+00 8.28E+00 7.81E+00 7.32E+00 6.89&f00 6.36E+00 5,99EfOO 5.65EfOO 5.34E+00 5.04E-fOO 4.89E+00 4.54E+00 4.33E+00 4.16E+00 3.99E+00 3.87E+00 3.78B+00 3,7lE+00 3.63E+00 3.54IM-00 3.40E+00 3.l8&fOO 3.00E+00 2.91E+00 2#801>f00 2.71EK)0 2.62E+00 2.55E+00 2.49E+00
3.36H>f01 4.04E4.01 2.15E+01 1.49E+01 7.42E+00 3.38E+00 2.59E+00 1.79E4.00 1.66E+00 1.64F+00 1.58Ef00 1.57E+00 1.54E-fOO 1.54E+00 1.50E+00 1.28E+00 1.24B+00 1.19EX-00 1.18E+00 1.1SE+OO 1.15E+00 1.13E+00 1.11E+00 1.1OE+OO 1.11E+00 1.08E+00 1.11E+00 1.09EX-00 1.06E+00 1.05E+00 1.00E+00 1.00E+00 1.02E+00 1.01E+00 9.85E-01 9.71E-01 9.88E-01 9.73E-01 9.49E-01
>4.000 <1.00E-02
>4.000 <1.00E-02 3.230 5.89E-02 4 3.150 7.11E-02 4 2.613 2.44E-01 q 1.698 2.00E+00 i';1
0.946 1.13EK)1 ?2 0.574 2.66E+01 22 0.387 4.09SH-01 22 0.297 5.04E+-01 22 0.255 5.56B+01 22 0.231 5.87B*-01 22 0.213 6.13E+01 22 0.199 6.33E+01 22 0.187 6.49E+01 22 0.176 6.67E+01 22 0.165 6.83Ef01 22 0.153 7.03E+01 22 0.144 7.l8EfOl 22 0.136 7.32E+01 22 0.128 7.45E+01 22 0.121 7.57E+01 22 0.117 7.63E+01 22 0.109 7.781^01 22 0.104 7.87E+01 22 0.100 7.94E+01 22 0.096 8.02E'f01 22 0.093 8.08JM'01 22 0.091 8.11E+01 22 0.089 8.15B+01 22 0.087 8.18IM-01 22 0.085 8.22E+01 22 0,082 8.28E+01 22 0.076 8,39I>01 22 0.072 8.47IH01 22 0.069 8.5^+01 22 0.067 8.57E+01 22 0.065 8.61E+01 22 0.063 8.65&<-Ol 22 0.061 8.6RE+01 22 0.060 8.71E+01 22
4.'
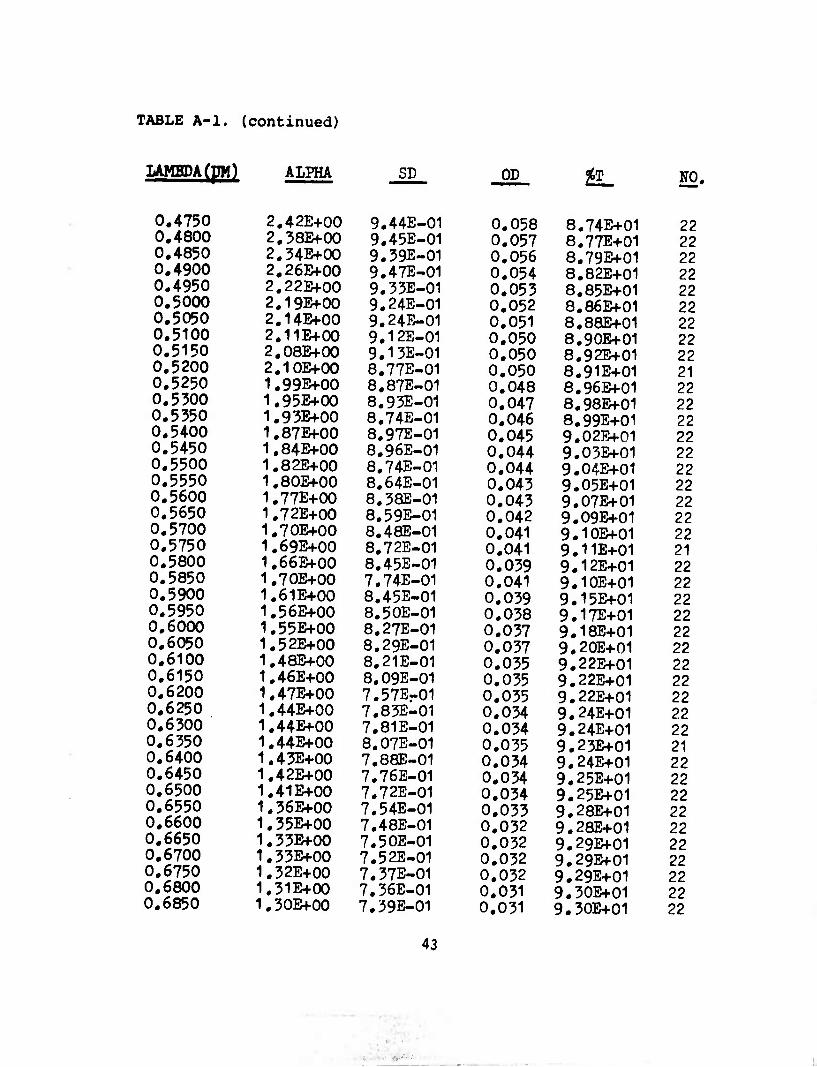
TABLE A-l. (continued)
LAMBDA (pM) ALPHA SD OD ^T NO.
0.4750 0.4800 0.4850 0.4900 0.4950 0.5000 0.5050 0.5100 0.5150 0.5200 0.5250 0.5300 0.5350 0.5400 0.5450 0.5500 0.5550 0.5600 0.5650 0.5700 0.5750 0.5800 0.5850 0.5900 0.5950 0.6000 0.6050 0.6100 0.6150 0.6200 0.6250 0,6300 0.6350 0.6400 0.6450 0.6500 0.6550 0.6600 0.6650 0.6700 0.6750 0.6800 0.6850
2.42E+00 2.38E+00 2.34E+00 2.26EfOO 2.22E+00 2.19E+00 2.14BfOO 2.11E+00 2.08E+00 2.10E+00 1.99E+00 1.95E+00 1.93E+00 1.87Bf00 1.84E+00 1.82E+00 1.80E+00 1.77E+00 1.72E+00 1.70E+00 1.69E+00 1.66EfOO 1.70E+00 1.61E+00 1.56E+00 1.55E+00 1.52E+00 1.48E+00 1.46E+00 1.47E+00 1.44E+00 1.44E+00 1.44E+00 1.43E+00 1.42E+00 1.41E+00 1.36EfOO 1.35E+00 1.33EfOO 1.33E+00 1.32E+00 1.31E+00 1.30E+00
9.44E-01 9.45E-01 9.39E-01 9.47E-01 9.33E-01 9.24E-01 9.24E-01 9.12E-01 9.13E-01 8.77E-01 8.87E-01 8.93E-01 8.74E-01 8.97E-01 8.96E-01 8,74E-01 8.64E-01 8.38E-01 8.59E-01 8.4aE-01 8,72E-01 8.45E-01 7.74E-01 8.45E-01 8.50E-01 8.27E-01 8,29E-01 8.21E-01 8.09E-01 7.57Er01 7.83E-01 7.81E-01 8.07E-01 7.88E-01 7.76E-01 7.72E-01 7.54E-01 7.48E-01 7.50E-01 7.52E-01 7.37E-01 7.36E-01 7.39E-01
0.058 0.057 0.056 0.054 0.053 0.052 0.051 0.050 0.050 0.050 0,048 0.047 0.046 0.045 0.044 0.044 0.043 0.043 0.042 0.041 0.041 0.039 0.041 0.039 0.038 0.037 0.037 0.035 0.035 0.035 0.034 0.034 0.035 0.034 0.034 0.034 0.033 0.032 0.032 0.032 0.032 0.031 0.031
8.74E+01 22 8.77E+01 22 8.79E+01 22 8.82E+01 22 8,85E+01 22 8,86E+01 22 8,88E+01 22 8,90E+01 22 8,92E+01 22 8,91E+01 21 8,96B+01 22 8,98E+01 22 8,99E+01 22 9,02E+01 22 9.05E+01 22 9.04E+01 22 9.05E+01 22 9.07E+01 22 9.09E+01 22 9.10E+01 22 9.11E+01 21 9.12E+01 22 9.10E+01 22 9.15E+01 22 9.17E+01 22 9.18E+01 22 9.20E+01 22 9.22E+01 22 9.22E+01 22 9.22E+01 22 9.24E+01 22 9.24E+01 22 9.23E+01 21 9.24E+01 22 9,25E+01 22 9.25E+01 22 9.28E+01 22 9.28E+01 22 9.29Bf01 22 9.29EfOl 22 9.29E.fOl 22 9.30E+01 22 9.30E+01 22
43

TABLE A-l. (continued)
LAMBDA(IJM) ALPHA
0.6900 0.6950 0.7000 0.7050 0.7100 0.7150 0.7200 0.7250 0.7300 0.7350 0.7400 0.7450 0.7500 0,7550 0.7600 0.7650 0.7700 0.7750 0.7800 0.7850 0.7900 0.7950 0.8000 0.8100 0.8200 0.8300 0.8400 0.8500 0.8600 0.8700 0.8800 0.8900 0.9000 0.9100 0.9200 0.9300 0.9400 0.9500 0.9600 0.9700 0.9800 0.9900 1.0000
1.29E+00 1.28E+00 1.28E+00 1,28E+00 1.28Bf00 1.27E+00 1.26B4-00 1.24E+00 1.24B+00 1,23E+00 1.24E+00 1,23EfOO 1.21E+00 1.20E+00 1.20E+00 1.18E+00 1.18E+00 1J8E+00 1.15E+00 1.16E+00 1 J5E+00 1.13E+00 1.12E+00 1.14E+00 1.16E+00 1.15E+00 1.18E+00 1.18E+00 1.20E+00 1.21E+00 1.20E+00 1.22E+00 1,22E+00 1.24E+00 1.20E+00 1.21E+00 1.23E+00 1.31E+00 1.35E+00 1,35E+00 1.32E+00 1.29E+00 1.25EfOO
SD
7.57E-01 7.38E-01 7.38E-01 7.22E-01 7.12E-01 7.10E-01 6.91E-01 6.88E-01 6.86E-01 6.80E-01 6.77E-01 6.77E-01 6.70E-01 6.54E-01 6.5aE-0l 6.59E-01 6.60E-01 6.64E-01 6.74E-01 6.66E-01 6.48E-01 6.35E-01 6.97E-01 4.10E-01 4,19E-01 4.08E-01 3.99E-01 3.94E-01 3.83E-01 3.89E-01 3.74E-01 3.67E-01 3.64E-01 3.41E-01 3.58E-01 3.56E-01 3.54E-01 3.69E-01 3.76E-01 3.62E-01 3.49E-01 3.67E-01 3.69E-01
CD
0.031 0.031 0.031 0.031 0.031 0.031 0.030 0.030 0.029 0.029 0.030 0.029 0.029 0.029 0.029 0.028 0.028 0.028 0.028 0.028 0.027 0.027 0.027 0.027 0.028 0.028 0.028 0.028 0.029 0.029 0.029 0.029 0.029 0.030 0.029 0.029 0.029 0.031 0.032 0.032 0.032 0.031 0.030
*T
9.31E+01 9.31E+01 9.32E+01 9.32E+01 9,32E+01 9.32E+01 9.33E+01 9.34E+01 q.34E+0l 9.34E+01 9.33E+01 9.34E+01 9.35E+01 9.36E+01 9.36E+01 9.37E+01 9.37E+01 9.37E+01 9.38E+01 9.38E+01 9.39E+01 9.39E+01 9.4OE+01 9.39E+01 9.38E+01 9.38E+01 9.37E+01 9.37E+01 9.36E+01 9.35E+01 9.36E+01 9.35E+01 9.35E+01 9.33E+01 9.36E+01 9.35E+01 9.34E+01 9.30E+01 9.28E+01 9.28Ef01 9.30E+01 9.31E+01 9.33E+01
NO.
22 22 22 22 22 22 22 22 22 22 22 22 22 22 22 22 22 22 22 22 22 22 2? 15 15 15 15 15 15 15 15 15 15 15 15 15 15 15 15 15 15 15 15
44

TABLb ^-1. (continued)
UMBDA (pM) ALPHA SD OD #r NO.
1.0100 1.20E+00 3.84R-01 0.029 9.36E+01 15 1.0200 1.07E+00 3.59E-01 0.026 9.42E+01 15 1.0300 1.04E+00 3.54E-01 0.025 9,44E+01 15 1.0400 1.00E+00 3.44E-01 0.024 9.46E+01 15 1.0500 9.71E-01 3.69E-01 0.023 9.48E+01 15 1.0600 9.47E-01 3.92E-01 0.023 9.49E4-01 15 1.0700 9.32E-01 4.04E-01 0,022 9.50E+01 15 1.0800 9.22E-01 4,08E-01 0,022 9,50E+01 15 1.0900 9,21E-01 4.07E-01 0,022 9,50E+01 15 1.1000 9.29E-01 4.08E-01 0,022 9,50E+01 15 1.1100 9.68E-01 3.84E-01 0,023 9.48E+01 15 1.1200 9.RflE-01 4.10E-01 0,024 9.47E+01 15 1.1300 I.UEfOO 3.69E-01 0,027 9.39Ef01 15 1,1400 1.37E+00 3.86E-01 0,032 9,3QE+01 15 1.1500 1.51E+00 3.50E-01 0.036 9.20E+01 15 1.1600 1.59E+00 3.56E-01 0,038 9.16E+01 15 1.1700 1.63E+00 3.52E-01 0.039 9.14E+01 15 1.1800 1.65E+00 3.64E-01 0.040 9.13E+01 15 1.1900 1.65E+00 3.50E-01 0.040 9.13E+01 15 1.2000 1.61E+00 3.50E-01 0.039 9.15E+01 15 1.2100 1.57E+00 3.50E-01 0.038 9.17E+01 15 1.2200 1.b3E+00 3.48E-01 0.037 9.19E+01 15 1.2300 1.50E+00 3.66E-01 0,036 9.20E+01 15 1.2400 1.48E+00 3.58E-01 0.036 9.21E+01 15 1.2500 1.45E+00 3.56E-01 0.035 9.23E+01 15 1.2600 1.45E+00 3.43E-01 0.035 9,23E+01 15 1.2700 1.46E+00 3.36E-01 0.035 9,22E+01 15 1.2800 1.51E+00 3.34E-01 0.036 9.20E+01 15 1.2900 1.57E+00 3.56E-01 0.038 9,17E+01 15 1.3000 1.65E+00 3.60E-01 0.040 9,13E+01 15 1.3100 1.82E+00 3.77E-01 0.044 9.04E+01 15 1.3200 2.00E4-00 3.90E-01 0.048 8.96Bf0l 15 1.3300 2.2SE+00 4.27E-01 0.055 8.82E+01 15 1.3400 2.59E+00 4.15E-01 0.062 8.b7E+01 15 1.3500 2,87E+00 4.49E-01 0.069 8.53E+01 15 1.3600 3.23E+00 5.31E-01 0,078 8,37E+01 15 1.3700 4.34E+00 1.14E+00 0,104 7.87E+01 15 1.3800 5.49E+00 1.75E+00 0,132 7.38E+01 15 1.3900 7.95E+00 1.4SE+00 0,191 6.44E+01 15 1.4000 1.20E+01 1.57E+00 0,288 5.15E+01 15 1.4100 1.59E+01 1.46E+00 0,381 4.16E+01 15 1.4200 1.83E+01 1.38E+00 0.439 3.64E+01 15 1.4300 1.97E+01 1.46E+00 0.474 3 -^6E+01 15
45
■
TABLE A-l. (continued)
lAMHDA(jTM) ALPHA SI) OD %T NO.
1.4500 1.4600 1.4700 1.4800 1.4900 1,5000 1.5100 1.5200 1.5300 1.5400 1.5500 1.5600 1.5700 1.5800 1.5900 1.6000 1.6100 1.6200 1.6300 1.6400 1.6500 1.6600 1,6700 1.6800 1.6900 1.7000 1,7100 1,7200 1,7300 1,7400 1,7500 1,7600 1,7700 1,7800 1,7900 1,8000 1,8100 1,8200 1,8300 1,8400 1,8500 1,8600 1.8700
2,04E+01 1,99B+01 1,88E+01 1,712+01 1,53E+01 1,38E+01 1,24E+01 1,11E+01 9,88E+00 9,03E+00 8,21E+00 7,59E+00 6,92E+00 6,58E+00 6,08Bf00 5,88E+00 5,55E+00 5,33E+00 5,12E+00 4,98E+00 4,88E+00 4,85E+00 4,90E+00 5,06E+00 5,13E+00 5,22E+00 5,33E+00 5,63E+00 5,84E+00 6,05IkOO 6,31E+00 6,62E+00 6,86E+00 7,03E+00 7,12E+00 7,09E+00 7,04E+00 7,08E+00 7,17E+00 7,53E+00 8,36E+00 1,02E+01 1,44E+01
1,54E+00 1.55E+uO 1,57E+00 1,50E+00 1,41E+00 1,31E+00 1,12E+00 1,04E+00 1,05E+00 9.06E-0 8,05E-0 7,83E-0 9,67E-0 6,76E-0 8,80E-0 6.39E-0 6,49E-0 6,39E-0 6,19E-0 6,11E-0 5,96E-0 6,01E-0 5,94E-0 5,7aE-0 5,89E-0 5,96E-0 5,92E-0 6,22E-0 6,10E-0 6,25E-0 6,42E-0 6,34E-0 6,45E-0 6,79E-0 6,96E-0 6,78E-0 6,98E-0 6,84E-0 6,84E-0 7,07E-0 8,54E-0 1,23E+00 2,53E+00
0,489 0,477 0,451 0,411 0,368 0,330 0,296 0,265 0,237 0,217 0,197 0,182 0,166 0,158 0,146 0,141 0,133 0,128 0,123 0,120 0,117 0,116 0,118 0,121 0,123 0,125 0,128 0.135 0.140 0,145 0,151 0,159 0,165 0.169 0.171 0.170 0.169 0,170 0,172 0,181 0,201 0,245 0,344
3,25E+01 3,33E+01 3,54E+01 3,88E+01 4.29E+01 4,68E+01 5.05E+01 5,43E+01 5.79E+01 6.07E+01 6.35E+01 6,57E+01 6.82E+01 6,95E+01 7,15E+01 7.23E+01 7,36E+01 7,45E+01 7,53E+01 7.59E+01 7,64E+01 7,65E+01 7.63E+01 7.56E+01 7.53E+01 7.49E+01 7.45E+01 7.33E+01 7,24E+01 7,16E+01 7,06E+01 6,94E+01 6,84E+01 6,78E+01 6,75E+01 6,76E+01 6,78E+01 6,76E+01 6,73E+01 6,60E+01 6.30E+01 5.68E+01 4.52E+01
15 15 15 15 15 15 15 15 15 15 15 15 15 15 15 15 15 15 15 15 15 15 15 15 15 15 15 15 15 15 15 15 15 15 15 15 15 15 15 15 15 15 15
46

TABLE A-l. (continued)
AIPHA SD OD #r NO,
2,36B+01 0.5^7 1.8800 5.01E+ÖO 2.71E+01 15 1.8900 3.90E+01 4.79E+00 0.936 1.16E+01 15 1.9000 6.20E+01 5.59E+00 1.488 3.25E+00 15 1.9100 7.53E+01 5.89E+00 1.807 1.56E+00 15 1.9200 7.93E+01 4.02E+00 1.904 1.25E+00 15 1.9300 8.08E+01 3.61E+00 1.939 1.15E+00 15 1.9400 7.84E+01 4.14E+00 1.882 1.31E+00 15 1.9500 7.44E+01 4.74E+00 1.787 1.63E+00 15 1.9600 6.89E+01 4.38E+00 1.655 2.22E+00 15 1.9700 6.29E+01 4.24E+00 1.509 3.10E+00 15 1.9800 5.67E+01 4.19E+00 1.362 4.35E+00 15 1.9900 5.11E+01 4.10E+00 1.226 5.95E+00 15 2.0000 4.59E+01 3.44E+00 1.103 7.aRE+00 15 2.0100 4.17E+01 3.34E+00 1.002 9.96E+00 15 2.0200 3.81E+01 2.79E+0O 0.914 1.22E+01 15 2.0300 3.54E+01 2,54E+0O 0.849 1.42E+01 15 2.0400 3.34E+01 2.35E+00 0.801 1.58E+01 15 2,0500 3.09E+01 2.26E+00 0.741 1.81E+01 15 2.0600 2.82E+01 2.18E+00 0.678 2.10E+01 15 2,0700 2.58E+01 1.92E+00 0.619 2.40E+01 15 2,0800 2.39E+01 1.76E+00 0.573 2.68E+01 15 2,0900 2.22E+01 1.6RE+00 0,533 2.93E+01
5.16E+01 15
2.1000 • 2.09E+01 1.57E+00 0.501 15 2.1100 1.98E+01 1.51E+00 0.475 3.35E+01 15 2.1200 1,89E+01 1.35E+00 0.455 3.51E+01 15 2.1300 1.83E+01 1.28E+00 0.439 3.64E+01 15 2.1400 1.80E+01 1.30E+00 0.431 3.71 E+01 15 2.1500 1.77E+01 1,22E+00 0.425 3.76E+01 15 2.1600 1.76E+01 1.21E+00 0.423 3.7SE+01 15 2.1700 1.75E+01 1.19E+00 0.420 3.81E+01 15 2.1800 1.72E+01 1.21E+00 0.413 3.86E+01 15 2.1900 1,68E+01 1.UE+00 0.402 3.96E+01 15 2,2000 1,64E+01 1,13E+00 0.393 4.04E+01 15 2.2100 1,62E+01 1.05E+00 0.388 4.09B+01 15 2.2200 1.59E+01 1,11E+00 0.382 4.15E+01 15 2.2300 1.60E+01 1,13E+00 0.384 4.13E+01 15 2.2400 1.65E+01 1,16E+00 0.395 4.03E+01 15 2.2500 1.74Ef0l 1,22E+00 0.416 3.83E+01 15 2.2600 1.83E+01 1.24E+00 0.440 3.63E+01 15 2.2700 1.91E+01 1,3YE+00 0.459 3.48E+01 15 2,2800 1.99E+01 1.34E+00 0.478 3.33E+01 15 2,2900 2.05E+01 1.42E+00 0.493 3.21E+01 15 2,3000 2.11E+01 1.34E+00 0.507 3.11E+01 15
47
.

TABLE A-l. (continued)
ALPHA SD OD
2.5TÖÖ 2,19E+01 1,47E+00 0.527 2.3200 2.27E+01 1,46E+00 0.546 2.3300 2.39E+01 1.59E+00 0.573 2.3400 2.53E+01 1.64E+00 0.607 2.3500 2.67E+01 1.72E+00 0.642 2.3600 2.80E+01 1.78E+00 0.673 2.3700 2.96E+01 1.85E+00 0.711 2.3800 3.12E+01 1,88E+00 0.749 2.3900 3.29E+01 1.76E+00 0.790 2.4000 3.49E+01 2.21E+00 0.839 2.4100 3,72E+01 2,25E+00 0.892 2.4200 3.97E+01 2.45E+00 0.954 2.4300 4.25E+01 2.48E+00 1.021 2.4400 4.59E+01 2.79E+00 1.101 2.4500 4.94E+01 3.09E+00 1.185 2.4600 5.30E+01 3.39E+00 1.271 2.4700 5.67E+01 3,31E+00 1.360 2.4800 6.03E+01 3.59E+00 1.448 2.4900 6,28E+01 3,78E+00 1.507 2.5000 6.6GE+01 4.04E+00 1.584
in_ NO.
2.97E+01 15 2.84E+01 15 2.67E+01 15 2,47E+01 15 2.28E+01 15 2.12E+01 15 1.95E+01 15 1.78E+01 15 1.62E+01 15 1.45E+01 15 1.28E+01 15 1.11E+01 15 9.53E+00 15 7.93E+00 15 6.53E+00 15 5.36E+00 15 4.36E+00 15 3.56E+00 14 3.11E+00 15 2,61E+00 15
48
■
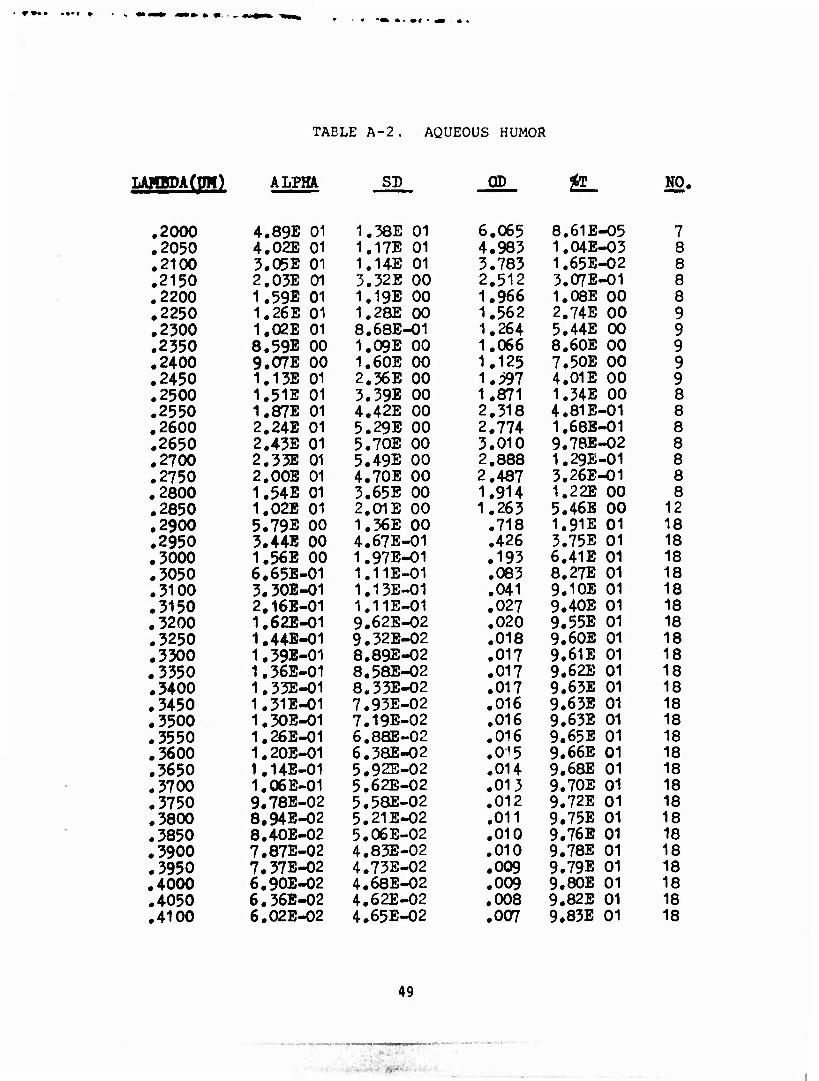
TABLE A-2. AQUEOUS HUMOR
ALPHA SD CD *T_ NO.
.2000 4.89E 01 1.38E 01 6.065 8.61E-05 7
.2050 4.02E 01 1.17E 01 4.983 1.04E-03 8
.2100 3.05E 01 1.14E 01 3.783 1.65E-02 8
.2150 2.03E 01 3.32E 00 2.512 3.07E-01 8
.2200 1.59E 01 1.19E 00 1.966 1.08E 00 8
.2250 1.26E 01 1.?8E 00 1.562 2.74E 00 9
.2300 1.02E 01 8.68E-01 1.264 5.44E 00 9
.2350 8.59E 00 1.09E 00 1.066 8.60E 00 9
.2400 9.07E 00 1.60E 00 1.125 7.50E 00 9
.2450 1.13E 01 2.36E 00 1.597 4.01 E 00 9
.2500 1,51E 01 3.39E 00 1.871 1.34E 00 8
.2550 1.87E 01 4.42E 00 2.318 4.81E-01 8
.2600 2.24E 01 5.29E 00 2.774 1,68B-01 8
.2650 2.43E 01 5.70E 00 3.010 9.78E-02 8
.2700 2.33E 01 5.49E 00 2.888 1.29E-01 8
.2750 2.00E 01 4.70E 00 2.487 3.26E-01 8
.2800 1.54E 01 3.65E 00 1.914 1.22E 00 8 .2850 1.02E 01 2.01E 00 1.263 5.46E 00 12 .2900 5.79E 00 1.36E 00 .718 1,91E 01 18 .2950 3.44E 00 4.67E-01 .426 3.75E 01 18 .3000 1.56B 00 1.97E-01 .193 6.41E 01 18 .3050 6.65B-01 1.11E-01 .083 8,27E 01 18 .3100 3.30E-01 1.13E-01 .041 9.10E 01 18 .3150 2.16E-01 1.11E-01 .027 9.40E 01 18 .3200 1.62E-01 9.62E-02 .020 9.55E 01 18 .3250 1.44E-01 9.32E-02 .018 9.60E 01 18 .3300 1.39E-01 8.89E-02 .017 9.61E 01 18 .3350 1.36E-01 8.58E-02 .017 9.62E 01 18 .3400 1.33E-01 8.33E-02 .017 9.63E 01 18 .3450 1.31E-01 7.93E-02 .016 9.63E 01 18 .3500 1.30E-01 7.19E-02 .016 9.63E 01 18 .3550 1.26E-01 6.8aE-02 .016 9.65E 01 18 .3600 1.20E-01 6.38E-02 .015 9.66E 01 18 .3650 1,14E-01 5.92E-02 .014 9.68E 01 18 .3700 1.06E-01 5.62E-02 .013 9.70E 01 18 .3750 9.78E-02 5.58E-02 .012 9.72E 01 18 .3800 8.94E-02 5.21E-02 .011 9.75E 01 18 .3850 8.40E-02 5.06E-02 .010 9.76E 01 18 .3900 7.87E-02 4.83E-02 .010 9.78E 01 18 .3950 7.37E-02 4.73E-02 .009 9.79E 01 18 .4000 6.90E-02 4.68E-02 .009 9.80E 01 18 .4050 6.36E-02 4.62E-02 .008 9.82E 01 18 .4100 6.02E-02 4.65E-02 .007 9.83E 01 18
49
■
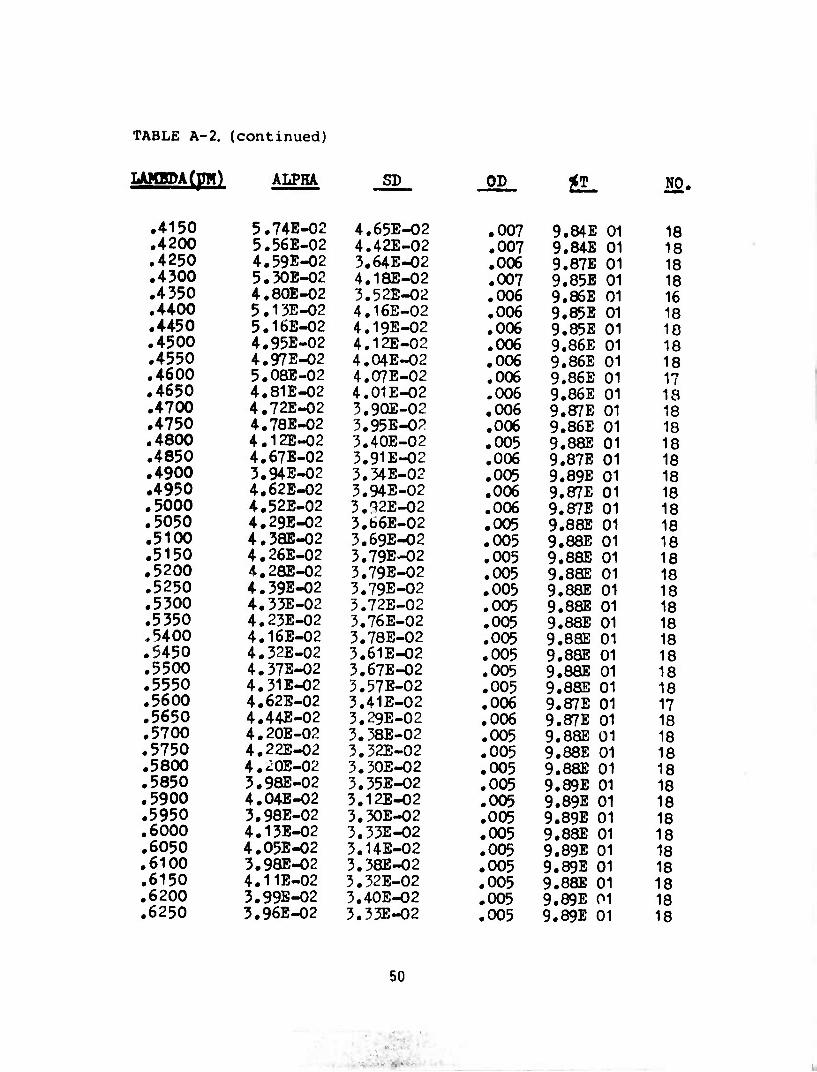
TABLE A-2. (continued)
LAMBDA (pO ALPHA SD OD NO.
.4150
.4200
.4250
.4300
.4350
.4400
.4450
.4500
.4550
.4600
.4650
.4700
.4750
.4800
.4850
.4900
.4950 .5000 .5050 .5100 .5150 .5200 .5250 .5300 .5350 .5400 .5450 .5500 .5550 .5600 .5650 .5700 .5750 .5800 .5850 .5900 .5950 .6000 .6050 ,6100 .6150 .6200 .6250
5.74E-02 5.56E-02 4.59E-02 5.30E-02 4.80E-02 5.13E-02 5.16E-02 4.95E-02 4.97E-02 5.08E-02 4.81E-02 4.72E-02 4.78E-02 4.12E-02 4.67E-02 3.94E-02 4.62E-02 4.52E-02 4.29E-02 4.3aE-02 4.26E-02 4.28E-02 4.39E-02 4.33E-02 4.23E-02 4.16E-02 4.32E-02 4.37E-02 4.31E-02 4.62E-02 4.44E-02 4.20E-02 4.22E-02 4.iQE-02 3.98E-02 4.04E-02 3.98E-02 4.13E-02 4.05E-02 3.98E-02 4.11E-02 3.99E-02 3.96E-02
4.65E-02 4.42E-02 3.64E-02 4.18E-02 3.52E-02 4.16E-02 4.19E-02 4.12E-02 4.04E-02 4.07E-02 4.01E-02 3.90E-02 3.95E-02 3.40E-02 3.91E-02 3.34E-02 3.94E-02 3.^2E-02 3.b6E-02 3.69E-02 3.79E-02 3.79E-02 3.79E-02 3.72E-02 5.76E-02 3.78E-02 3.61E-02 3.67E-02 3.57E-02 3.41E-02 3.29E-02 3.38E-02 3.32E-02 3.30E-02 3.35E-02 3.12E-02 3.30E-02 3.33E-02 3.14E-02 3.38E-02 3.32E-02 3.40E-02 3.33E-02
.007
.007
.006
.007 .006 .006 .006 .006 .006 .006 .006 ,006 ,006 ,005 ,006 ,005 ,006 ,006 .005 .005 .005 .005 .005 .005 .005 .005 .005 .005 .005 ,006 ,006 ,005 ,005 ,005 ,005 ,005 ,005 ,005 ,005 ,005 ,005 ,005 ,005
9,84E 01 9.84E 01 9.87E 01 9.85B 01 9,86E 01 9,85E 01 9.85E 01 9.86E 01 9,86E 01 9.86E 01 9.86E 01 9.87E 01 9.86E 01 9.88E 01 9.87E 01 9.89E 01 9.87E 01 9.87E 01 9.88E 01 9,88E 01 9.88E 01 9.8aE 01 9.88E 01 9.8aE 01 9.88E 01 g.BSE 01 9.BSE 01 9.88E 01 9.8SE 01 9,87E 01 9,87E 01 9.8aE 01 9.88E 01 9,88E 01 9.89E 01 9.89E 01 9.89E 01 9.88E 01 9.89E 01 9.89E 01 9.88E 01 9.89E 01 9.89E 01
18 18 18 18 16 18 18 18 18 17 ia 18 18 18 18 18 18 18 18 18 18 18 18 18 18 18 18 18 18 17 18 18 18 18 18 18 18 18 18 18 18 18 18
50
•
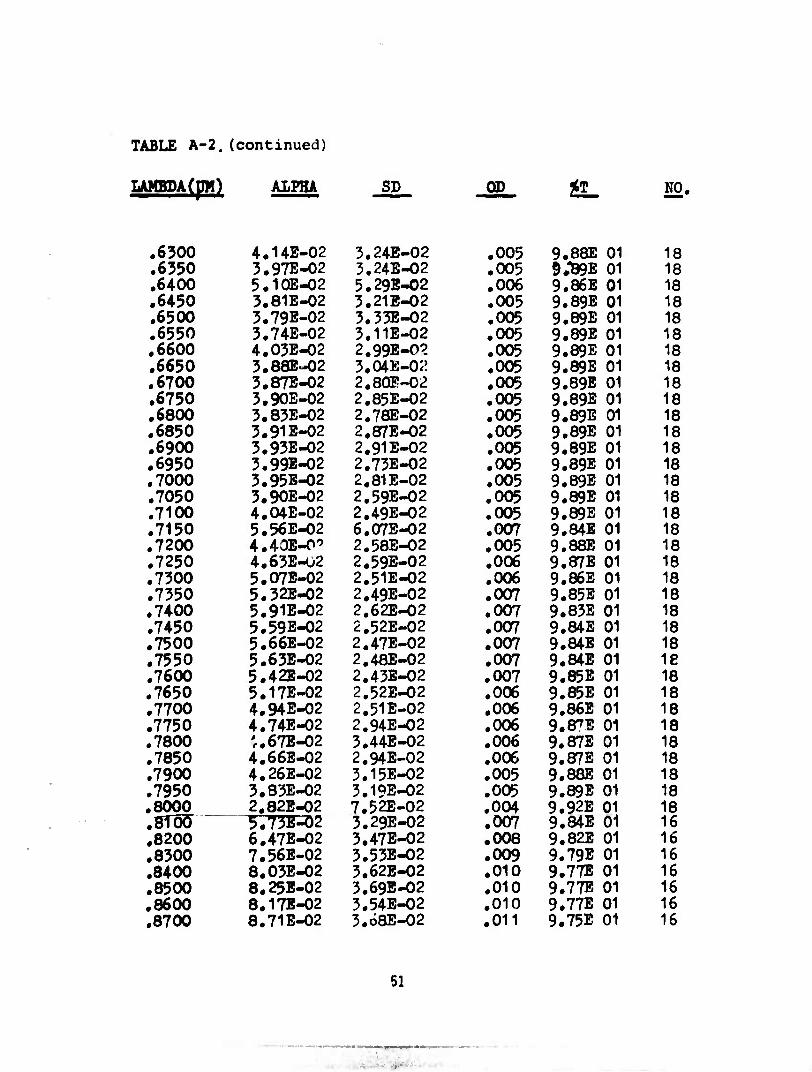
TABLE A-2.(continuedl
ALPHA SD QD NO.
.6300 4.14E-02 3.24E-02 .005 9,88E 01 18
.6350 3.97E-02 3.24E-02 .005 9;ö9E 01 18
.6400 5.1QE-02 5.29E-02 ,006 9.86E 01 18
.6450 3.81E-02 3.21E-02 ,005 9,89E 01 18
.6500 3.79E-02 3.33E-02 ,005 9,89E 01 18
.6550 3.74E-02 3.11E-02 ,005 9,89E 01 18 .6600 4.03E-02 2.99E-02 ,005 9,89E 01 18 .6650 3.8aB-02 3.04E-02 ,005 9.89E 01 18 .6700 3.87E-02 2,8Ul!!-02 ,005 9.89E 01 18 .6750 3.90E-02 2.85E-02 ,005 9.89E 01 18 .6800 3.83E-02 2.78E-02 ,005 9.89E 01 18 .6850 3.91E-02 2#a7E-02 ,005 9.89E 01 18 .6900 3.93E-02 2,91 E-02 ,005 9.89E 01 18 .6950 3.99E-02 2,73E-02 ,005 9.89E 01 18 .7000 3.95B-02 2,81 E-02 ,005 9.89E 01 18 .7050 3.90E-02 2.59E-02 ,005 9.89E 01 18 .7100 4.O4E-02 2,49E-02 ,005 9.89E 01 18 .7150 5.56E-02 6.07E-O2 ,007 9.84E 01 18 .7200 4.40E-0'' 2.58E-02 .005 9.88E 01 18 .7250 4.63E-02 2,59E-02 ,006 9.87E 01 18 .7300 5.O7E-02 2.51E-02 ,006 9.86E 01 18 .7350 5.32E-02 2,49E-02 ,007 9.85E 01 18 .7400 5.91E-02 2,62E-02 ,007 9.83E 01 18 .7450 5.59E-02 2,52E-02 ,007 9.84E 01 18 .7500 5.66E-02 2,47E-02 ,007 9.84E 01 18 .7550 5.63E-02 2,48E-02 ,007 9.84E 01 18 .7600 5.42E-02 2,43E-02 ,007 9.85E 01 18 .7650 5.17E-02 2.52E-02 ,006 9.85E 01 18 .7700 4.94E-02 2,51E-02 ,006 9.86E 01 18 .7750 4.74E-02 2.94E-02 ,006 9.8^E 01 18 .7800 'r.67E-02 3.44E-02 ,006 9.87E 01 18 .7850 4.66E-02 2,94E-02 ,006 9.87E 01 18 .7900 4.26E-02 3.15E-02 ,005 9.88E 01 18 .7950 3.83E-02 3.19E-02 ,005 9.89E 01 18 .8000 2.82E-02 7.52E-02 .004 9.92E 01 18 .8100 T773E-02 3.29E-02 .007 9.84E 01 16 .8200 6,47E-02 3.47E-02 ,008 9.82E 01 16 ,8300 7.56E-02 3.53E-02 ,009 9.79E 01 16 .8400 8.03E-02 3.62E-02 ,010 9.77E 01 16 .8500 8.25B-02 3.69E-02 ,010 9.77E 01 16 .8600 8.17E-02 3.54E-02 ,010 9.77E 01 16 .8700 8.71E-02 3.68E-02 ,011 9.75E 01 16
51
• ■
TABLE A-2. (continued)
LAMBDA (pi) ALPHA SD OD a. NO .8800 3.87E-02 3.44E-02 .011 9.75E 01 16 .8900 9,56E-02 3.32E-02 .012 9.73E 01 16 .9000 1.03E«01 3.47E-02 ,013 9.71E 01 16 .9100 1,12E-01 3.41E-02 .014 9.68E 01 16 .9200 1,34E-01 3.92E-02 .017 9.62E 01 16 .9300 1 .82E-01 4.41E-02 .023 9.49E 01 16 .9400 2.63E-01 5.64E-02 .033 9.28E 01 16 .9500 4,04E-01 7.39E-02 .050 8.91E 01 16 .9600 5.41E-01 7.45E-02 .067 8.57E 01 16 .9700 5.5aE-01 6.99E-02 .069 8.53E 01 16 .9800 5.40E-01 6,34E-02 .067 8.57E 01 16 .9900 4.94E-01 5,9lE-02 .061 8.68E 01 16
1.0000 4.36B-01 4.81E-02 .054 8.83E 01 16 1.0100 3,R2E-01 5.02E-02 .047 8.97E 01 16 1.0200 3.12E-01 4.01 E-02 .039 9.15E 01 16 1.0300 2,59E-01 3.46E-02 .032 9.29E 01 16 1.0400 2,17E-01 3.81 E-02 .027 9.40E 01 16 1.0500 1.94E-01 3.45E-02 .024 9.46E 01 16 1.0600 1,82E-01 3.54E-02 .023 9.49E 01 16 1.0700 1,81E-01 3.54E-02 .022 9.50E 01 16 1.0800 1,90E-01 3.93E-02 ,024 9.47E 01 16 1.0900 2,16E-01 4.59E-02 .027 9.40E 01 14 1.1000 2,41E-01 4.44E-02 .030 9.34E 01 16 1.1100 2.76E-01 4.64E-02 .034 9.24E 01 16 1.1200 3.25E-01 5.44E-02 .040 9.11E 01 16 1.1300 4,58E-01 8.21 E-02 .057 8.77E 01 16 1,1400 8.09E-01 1.37E-01 .100 7.94E 01 16 1.1500 1,?2E 00 1.80E-01 ,152 7.05B 01 17 1,1600 1,34B 00 1.75E-01 .167 6.81 E 01 17 1,1700 1,36B 00 1.73E-01 .169 6.V7E 01 17 1,1800 1,37E 00 1.72E-01 .171 6.75E 01 17 1,1900 1,37E 00 1,55E-01 .170 6.77E 01 17 1.2000 1,36E 00 1.50E-01 .168 6.78E 01 17 1.2100 1,33E 00 1,58E-01 .164 6.85E 01 17 1.2200 1,28E 00 1,51E-01 .159 6.93E 01 17 1.2300 1.24E 00 1,4aE-0l .154 7.01E 01 17 1.2400 1.20E 00 1.43E-01 .149 7.09^ 01 17 1.2500 1.17E 00 1,44B-01 .145 7.16E 01 17 1,2600 1.16E 00 1.51E-01 .144 7.182 01 17 1,2700 1.17E 00 1,54B-01 .145 7.15E 01 17 1.2800 1,22E 00 1,69E-01 .152 7.05E 01 17 1,2900 1.32E 00 1.82B-01 .163 6.87E 01 17 1.3000 1.47E 00 1.90E-01 .183 6.57B 01 17
52

TABLE A-2.(continued)
LAMBDA (pW) ALPHA
1.5100 1,3200 1.3300 1.3400 1.3500 1.3600 1.3700 1.3800 1.3900 1.4000 1.4100 1.4200 1.4500 1.4400 1.4500 1.4600 1.4700 1.4800 1.4900 1.5000 1.5100 1.5200 1.5300 1.5400 1.5500 1.5600 1.5700 1.5800 1.5900 1.6000 1.6100 1.6200 1.6300 1.6400 1.6500 1.6600 1.6700 1.6800 1.6900 1.7000 1.7100 1.7200 1.7300
1.71E 00 2,06E 00 2.54E 00 3.09E 00 5.60E 00 4.1 IE 00 4.95E 00 7.12E 00 1.26E 01 2.01E 01 2.56E 01 2.96E 01 3.19E 01 3.iaE 01 5.16E 01 5.07E 01 2.84E 01 2#56E 01 2.32E 01 2#03E 01 1.87E 01 1.58E 01 1,40E 01 1.28E 01 1.15E 01 1.05E 01 9.58E 00 8.95E 00 8.39E 00 7.87E 00 7.54E 00 7,21E 00 6.93E 00 6.73E 00 6,61E 00 6.46E 00 6#59E 00 6,42E 00 6.45E 00 6.51E 00 6.72E 00 7.05E 00 7.39E 00
SD
2.29E-01 2,80E-01 3.36E-01 3.89E-01 4.34E-01 4.75E-01 6.32E-01 1.01E 00 2,24E 00 3.50E 00 5.70E 00 5.64E 00 5.27E 00 5.64E 00 5.65E 00 5.51E 00 5.36E 00 5.28E 00 4.43E 00 4.06E 00 2.73E 00 2.95E 00 2.75E 00 2.09E 00 1.72E 00 1.54E 00 1.44E 00 1.41E 00 1.41E 00 1.40E 00 1.45E 00 1.44E 00 1.46E 00 1.49E 00 1.48E 00 1,50E 00 1.47E 00 1.52E 00 1.49E 00 1.50E 00 1.53E 00 1.55E 00 1.55E 00
OD
,212 .256 .315 .383 .446 .509 .614 .883
1,561 2,492 3.174 3,668 3.952 3.947 3,922 3,813 3.521 3.171 2.883 2.518 2.322 1.960 1.738 1.586 1.407 1.304 1.188 1.110 1.041
.977
.936 ,894 ,859 .834 ,819 ,801 .793 ,796 ,800 .807 .834 .872 .917
6.13E 01 5.55E 01 4.84E 01 4.14E 01 3.58E 01 3.09E 01 2.43E 01 1.31E 01 2.75E 00 3.22E-01 6.71 E-02 2,l5E-02 1,12E-02 1.13E-02 1.20E-02 1.54E-02 5.01E-02 6.75E-02 1.31E-01 5.05E-01 4.76E-01 1.10E 00 1.85E 00 2.59E 00 5.92E 00 4.97E 00 6.48E 00 7.76E 00 9.10E 00 1.05E 01 1.16E 01 1.28E 01 1.58E 01 1,461 01 1.52E 01 1.58E 01 1.61E 01 1.60E 01 1.58E 01 1.56E 01 1.47E 01 1.54E 01 1.21E 01
NO.
17 17 17 17 17 17 17 17 16 15 14 14 14 14 14 14 14 U 15 15 15 15 15 16 19 19 20 20 20 20 20 20 20 20 20 20 20 20 20 20 20 20 20
53
■-
;.

TABLE A-2. (continued)
1.7400 7,87E 00 1.7500 8,46E 00 1.7600 9,05E 00 1.7700 9,57E 00 1,7800 9.94E 00 1.7900 1,01E 01 1.8000 1,02E 01 1.8100 1.02E 01 1.8200 1,04E 01 1.8300 1,0aE 01 1.8400 1,16E 01 1.8500 1.42E 01 1.8600 1,92E 01 1.8700 2.69E 01 1.8800 3,71E 01 1.8900 6,29E 01 1.9000 9,76E 01 1.9100 1,16E 02 1.9200 1,22E 02 1.9300 1,22E 02 1.9400 1,17E 02 1.9500 1,08E 02 1.9600 9,83B 01 1.9700 8,78E 01 1.9800 7.71E 01 1.9900 6,86E 01 2.0000 6,17E 01 2,0100 5,51E 01 2,0200 4,92E 01 2,0300 4,39E 01 2,0400 3.95E 01 2,0500 3,61E 01 2,0600 3,26E 01 2,0700 2.94E 01 2,0800 2.68E 01 2,0900 2.44E 01 2,1000 2,3oroi 2,1100 2,13E 01 2,1200 1,97E 01 2,1300 1,84E 01 2,1400 1,73E 01 2,1500 1.65E 01 2,1600 1.58E 01
ALPHA SD OP & NO,
1.59E 00 .976 1,62E 00 1,050 1.61E 00 1,122 1.63E 00 1,187 1.60E 00 1.233 1,58E 00 . 1,248 1.58E 00 1.262 1,64E 00 1,262 1.67E 00 1.288 1,74E 00 1,339 2.04E 00 1.445 2,6SE 00 1,760 4,20E 00 2,388 7,56E 00 3,339 9,81E 00 4,601 1.07E 01 7.804 1.72E 01 12,104 1.77E 01 14.418 2.00E 01 15,138 1,87E 01 15,163 1,83E 01 14,535 1.69E 01 13,374 1,58E 01 12,193 1,46E 01 10,890 1,31E 01 9,560 1,17E 01 8,511 1,00E 01 7,660 9.76E 00 6,841 8.77E 00 6,100 8,19E 00 5,449 7,83E 00 4,905 7,65E 00 4,476 7,54E 00 4,042 7,07E 00 3.651 6,94E 00 3,327 6.77E 00 3.026 6.16E 00 2.859 5,90E 00 2,641 5,94E 00 2,448 5.91E 00 2,283 5,96E 00 2,147 6,36E 00 2,044 6.28E 00 1.956
1.06E 01 20 8,91E 00 20 7.54E 00 20 6,50E 00 20 5.85E 00 20 5.65E 00 20 5.47E 00 20 5.47E 00 19 5.16E 00 19 4.58E 00 19 3.59E 00 18 1,74E 00 14 4.09E-01 12 4.58B-02 13 2,51E-03 18 1.57E-06 20 7.88E-11 17 3.82E-13 17 7.28E-14 17 6.87E-14 17 2.92E-13 17 4.23E-12 17 6.41B-11 17 1#29E-09 17 2.75E-08 18 3.08E-07 18 2.19E-06 17 1 .44E-05 17 7,94E-05 17 3,56E-04 17 1.24E-03 17 3,34E-03 16 9.08E-03 16 2.23E-02 16 4.71E-02 16 9,43E-02 16 1.38E-01 15 2.28E-01 15 3,56E-01 15 5.21B-01 15 7,12E-01 15 9,04B-01 15 1,11E 00 15
54
.•
TABLE A-2.(continued)
AIPHA SD OD iT_ NO.
2.1700 1.54E 01 6.09E 00 1.905 1.24E 00 15 2,1800 1.48E 01 6.19E 00 1.837 1.46E 00 15 2.1900 1.47E 01 6,05E 00 1.821 1 .51E 00 15 2.2000 1.44E 01 5.51E 00 1.781 1.65E 00 15 2.2100 1.47E 01 5.76E 00 1.828 1.48E 00 15 2.2200 1.50E 01 5.48E 00 1.860 1.38E 00 15 2.2300 1.53E 01 5.55E 00 1.901 1.26E 00 15 2.2400 1.58E 01 5.31E 00 1.964 1.09E 00 15 2.2500 1.64E 01 5.16E 00 2.035 9.22E-01 15 2.2600 1.69E 01 5.67E 00 2.103 7.90E-01 15 2.2700 1.76E 01 6.02E 00 2.189 6.47E-01 15 2.2800 1.88E 01 5.a6E 00 2.335 4.62E-01 15 2.2900 2.01E 01 5.69E 00 2.493 3.22E-01 15 2.3000 2.19E 01 4.9aE 00 2.722 1.89E-01 15 2.3100 2.37E 01 5.32E 00 2.936 1.16E-01 15 2.3200 2.51E 01 6.27E 00 3.114 7.69E-02 15 2.3300 2,62E 01 7.18E 00 3.255 5.56E-02 16 2.3500 3.06E 01 7.96E 00 3.795 1.60E-02 16 2.3600 3.29E 01 7.38E 00 4.087 8.18E-03 17 2.3700 3.57E 01 7.45E 00 4.431 3.71 E-03 17 2.3800 3.87E 01 7.91E 00 4.803 1.57E-03 17 2.3900 4.19E 01 8.32E 00 5.203 6.26E-04 17 2.4000 4.24E 01 9.90E 00 5.255 5.56E-04 21 2.4100 4.64E 01 1.03E 01 5.753 1.77E-04 21 2.4200 5.07E 01 1.09E 01 6.283 5.21E-05 21 2.4300 5.54E 01 1.12E 01 6.871 1.34E-05 21 2.4400 6.11E 01 1.12E 01 7.582 2.62E-06 21 2.4500 6.57E 01 1.23E 01 8.148 7.11E-07 21 2.4600 7.46E 01 1.09E 01 9.259 5.51E-08 21 2.4700 7.89E 01 1.32E 01 9.793 1.61E-08 22 2.4800 8.49E 01 1.43E 01 10.528 2.97E-09 23 2.4900 9.26E 01 1.35E 01 11.481 3.5OE-10 23 2.5000 9.69E 01 1.35E 01 12.021 9.54E-11 23 2.5126 1.12E 02 1.01E 01 13.940 1.15E-12 8 2.5253 1.2aE 02 1.20E 01 14.858 1.39E-13 8 2.5381 1.25E 02 1.12E 01 15.458 3.48E-14 8 2.5510 1.27E 02 1.20E 01 15.718 1.91E-14 8 2.5641 1.288 02 1.09E 01 15.835 1.46E-14 8 2.5773 1.22E 02 1.25E 01 15.133 7.36E-14 8 2.5907 1.31E 02 1.15E 01 16.194 6.39E-15 8 2.6042 1.44E 02 1.42E 01 17.813 1.54E-16 8 2.6178 1.68E 02 1.60E 01 20.902 1.25E.19 8 2.6316 1,961 02 2.25E 01 24.351 4.46E-23 8
55
■
TABLE A-2.(continued)
LAMEDA (p) ALPHA SP op *j NO. 2.6455 2.37E 02 1.53B01 29.346 4.51E-28 8 2.6596 2.77E 02 1.74E01 34.393 4.04E-33 8 2.6738 3.84E 02 4.86E 01 47.606 2.48E-46 8 2.6882 5.93E 02 9.24E 01 73.544 2.86E-72 8 2.7027 1.10E 03 4.09E 02 >100 8 2.7174 2.07E 03 5.00E 02 >100 8 2.7322 2.36E 03 4.8SE 02 >100 8 2.7473 2.39E 03 4.99E 02 >100 8 2.7624 2.49E 03 6.33E 02 >100 8 2.7778 2.46E 03 5.50E 02 >100 8 2.7933 2.51E 03 6.06E 02 >100 8 2.8090 2.79E 03 6.46E 02 >100 8 2.8249
to Meagurements were not possible in this region 3.2051 3.2258 2.01E 03 2.37E 02 >100 8 3.2468 1.92E 03 2.43E 02 >100 8 3.2680 1.80E 03 2.60E 02 >100 8 3.2895 1.70E 03 2.08E 02 >100 8 3.3113 1.53E 03 2.58E 02 >100 8 3.3333 1.42E 03 2.45E 02 >100 8 3.3557 1.28E 03 1.95E 02 >100 8 3.3784 1.13E 03 1.65B 02 >100 8 3.4014 9.25E 02 6.61E 01 >100 8 3.4247 7.11E 02 7.03E 01 88.161 6.90E-87 8 3.4483 5.67E 02 4.15E 01 70.348 4.49E-69 8 3.4722 4.58E 02 3.85E 01 56.792 1.61B-55 8 3.4965 3.75E 02 3.36E 01 46.552 2.80E-45 8 3.5211 3.08E 02 3.27E 01 38.257 5.54E-37 8 3.5461 2.43E 02 3.26E 01 30.181 6.59E-29 8 3.5714 1.95E 02 2.15E 01 24.215 6.09E-23 8 3,5911 .1^6^02 2.05E 01 20.270 5.37E-19 8 3.6496 1.25E 02 9.80E 00 15.529 2.96E-14 8 3.6765 1.13E 02 1.11E01 14.035 9.23E-13 8 3.7037 9.4aE 01 9.18E 00 11.762 1.73E-10 8 3,7594 8.42E 01 7.95E 00 10.441 3.62E-09 8 3.7879 7.95E 01 9.28E 00 9.858 1.39E-08 8 3.8168 7.38E 01 9.42E 00 9.151 7.06E-oe 8 3.8462 7.07E 01 1.1 IE 01 8.769 1.70B-07 8 3.8760 7.77E 01 1.46E01 9.645 2.27B-08 8 3.9063 8.21E 01 1.46E 01 10.187 6.50E-09 8 3.9370 8.98E 01 1.62E 01 11.146 7.15B-10 8 3.9683 9.89E 01 1.74E 01 12.267 5.41E.11 8
56

TABLE A-2.(continued)
LAMBDA! ALPHA SD OD NO.
4.0000 1.06E 02 1.75E 01 13.110 7.75E-12 8 4.0323 1.16E 02 2.13E 01 14.357 4.39E-13 8 4.0650 1#26E 02 2.31E 01 15.625 2.37E-14 8 4.1322 1.51E 02 2.16E 01 18.791 1.62E-17 8 4.2017 I.SSE 02 2.8813 01 23.332 4.65E-22 8 4.2373 2.01E 02 4.11E 01 24.914 1.22E-23 8 4.2735 2.13E 02 4.63E 01 26.445 3.59E-25 8 4.3103 2.34E 02 3.96E 01 28.983 1.04E-27 8 4.3478 2,65E 02 3.83E 01 32.873 1.34E-31 8 4.3860 2.97B 02 3.20E 01 36.172 6.73E-35 8 4.4248 3.14E 02 3.47E 01 38.898 1.27E-37 8 4.4643 3.44E 02 5.84E 01 42.624 2.37E-41 8 4.5045 3.71E 02 3.73E 01 46.007 9.85E-45 8 4.5455 4.04E 02 3.8SE 01 50.169 6.77E-49 8 4.5872 4.31E 02 3.65E 01 53.504 3.13E-52 8 4.6296 4.56E 02 4.02E 01 56.598 2.52E-55 8 4.6729 4.77E 02 4.04E 01 59.115 7.6aE-58 8 4.7170 4.83E 02 4.05E 01 59.900 1.26E-58 8 4.7619 4.73E 02 3.55E 01 58.695 2.02E-57 8 4.8077 4.63E 02 4.36E 01 57 .439 3.64E-56 8 4.8544 4.42E 02 3.99E 01 5 .366 1.36E-53 8 4.9020 4.16E 02 4.96E 01 51.647 2.25E-50 8 4.9505 3.89E 02 4.79E 01 48.260 5.49E-47 8 5.0000 3.52J; 02 4.51E 01 43.657 2,20E-42 8 5.0251 3.30E 02 3.67E 01 40.897 1.27E-39 8 5.0505 3.iaE 02 3.48E 01 39.397 4.01E-38 8 5.0761 3.00B 02 3.74E 01 37.257 5.53E-36 8 5.1020 2.91E 02 3.54E 01 36.080 8.31E-35 8 5.1282 2.80E 02 5.82E 01 34.707 1.975-33 8 5.1546 2.69E 02 3.85E 01 33.388 4.09E-32 8 5,1813 2.64E 02 3.62E 01 52.755 1.76E-31 8 5.2083 2,52E 02 3.66E 01 31.292 5.11E-30 8 5.2356 2.44E 02 3.68E 01 30.316 4.83E-29 8 5.2632 2.43E 02 3.92E 01 30.176 6.67E-29 8 5.2910 2.45E 02 4.04E 01 30.356 4.41E-29 8 5.3191 2.40E 02 3.91E 01 29.741 1.81E-28 8 5.3476 2.32E 02 3.95E 01 28.828 1.49E-27 8 5.3763 2.40E 02 4.04E 01 29.714 1.93E-28 8 5.4054 2.42E 02 4.1 ?E 01 30.037 9.18E-29 8 5.4348 2.46E 02 3.93E 01 30.554 2.79E-29 8 5.4645 2.46E 02 3.52E 01 30.536 2,91E-29 8 5.4945 2.64E 02 3.73E 01 32.746 1.79E-31 8 5.5249 2.80E 02 3.79E 01 34.782 1.65E-33 8 5.5556 2.93E 02 4.15E 01 36.355 4.42E-35 8
57
TABLE A-2. (continued)
LAIIHPA(pO ALPHA SD OD ^T, NO.
5.5866 3.14B 02 3.95E 01 38.904 1.25E-37 8 5.6180 3.57E 02 5.81E 01 44.275 5.31E-43 8 5.6497 3.99E 02 4.86E 01 49.477 3.33E-48 8 5.6818 4.64E 02 3.09E 01 57.525 2.98E-56 8 5.7U3 5.28E 02 3.72E 01 65.521 3.01E-64 8 5.7471 6.23E 02 3.8PE 01 77.313 4.86E-76 8 5.7803 7.76E 02 6.83E 01 96.283 5.21E-95 8 5.8140 9.7VE 02 8.52E 01 >100 —.» 8 5.8480 1.53E 03 4.60E 02 >100 ....... 8 5.8824 1.94E 03 6.25E 02 >100 ..— 8 5.9172 2.05E 03 6.29E 02 >100 _... 8 5.9524 2,11E 03 5.97E 02 >100 .... 8 5.9880 2.07E 03 5.31E 02 >100 .... 8 6.0241 2.13E 03 5.41E 02 >100 mmmmmt 8 6.0606 2.07E 03 4.76E 02 >100 .... 8 6.0976 2.12E 03 4.81E 02 >100 ..... 8 6.1350 2.03E 03 4.80E 02 >100 .... 8 6.1728 1.94E 03 4.81E 02 >100 .... 8 6.2112 1.91E 03 4.83E 02 >100 .... 8 6.2500 1.67E 03 3.8aE 02 >100 .... 8 6.2893 1.55E 03 3.55E 02 >100 .... 8 6.3291 1.42E 03 3.25E 02 >100 .... 8 6.3694 1.19E 03 1.07E 02 >100 .... 8 6.4103 1.08E 03 1.34E 02 >100 .... 8 6.4516 9.778 02 9.65E 01 >100 .... 8 6.4935 8.82E 02 1.07E 02 >100 .... 8 6.5359 8.29E 02 I.OOE 02 >100 .... 8 6.5789 7.99E 02 7.60E 01 >100 .... 8 6.6225 7.68E 02 8.11E 01 95.229 5.90E-94 8 6.6667 7.47E 02 6.54E 01 92.614 2.43E-91 8 6.7114 7.44E 02 7.70E 01 92.237 5.79E-91 8 6.7568 7.33E 02 6.66E 01 90.955 1.11E-89 8 6.8027 7.12E 02 7.00E 01 88.293 5.09E-87 8 6.8493 6.99E 02 6.46E 01 86.710 1.95E-85 8 6.8966 S.SSE 02 6.62E 01 86.588 2.58E-85 8 6.9444 6.76E 02 6.18E 01 83.864 1.37E-82 8 6.9930 6,78E 02 5.91E 01 84.138 7.27E-83 8 7.0423 6.80E 02 5.85E 01 84.350 4.46E-83 8 7.0922 6.81E 02 5.05E 01 84.488 3.25E-83 8 7.1429 6.85E 02 5.42E 01 84.986 1.03E-83 8 7.1942 6,83E 02 5.81E 01 84.771 1.69E-83 8 7.2464 6.91E 02 5.25E 01 85.724 1.89E-84 8 7.2993 6.97E 02 6.01E 01 86.496 3.19E-85 8 7.3529 7.06E 02 5.40E 01 87.580 2.63E-86 8
58

TABLE A-2«(continued)
LAMBDA (pH) ALPHA J* ST
7.4074 7.4627 7.5188 7.5758 7.6336 7.6923 7.7519 7.8125 7.8740 7.9365 8.0000 8.0645 8.1301 8.1967 8.2645 8.3333 8.4034 8.4746 8.5470 8.6207 8.6957 8.7719 8,8496 3.9286 ..0090 9.0909 9.1743 9.2593 9.3458 9.4340 9.5238 9.6154 9.7087 9.8039 9.9010
10.0000 10.1010 10.2041 10.3093 10.4167 10.5263 10.6383 10.7527 10.8696
6.93E 02 6.BSE 02 6.75E 02 6,72E 02 6.67E 02 6,60E 02 6.53E 02 6.41E 02 6.35E 02 6.31E 02 6.27E 02 6.23E 02 6.23E 02 6.22E 02 6.21E 02 6.21E 02 6,22E 02 6.24E 02 6,22E 02 6.23E 02 6.24E 02 6.23E 02 6,22E 02 6.22E 02 6.16E 02 6.13E 02 6f14E 02 6.20E 02 6.24E 02 6.29E 02 6.37E 02 6.49E 02 6.70E 02 6.87E 02 7,11E 02 7.36E 02 7.74E 02 8.60E 02 8.65E 02 9.23E 02 1.00E 03 1.09E 03 1.18E 03 1.37E 03
5.41Ti. 01 5.30E 01 5.66E 01 5.43E 01 5.32E 01 5.05E 01 5.37B 01 5.16E 01 5.46E 01 5.59E 01 5.43E 01 5.54E 01 5.73E 01 5.70E 01 5.54E 01 5.43E 01 5.54E 01 5,42E 01 5.45E 01 5.12E 01 5.52E 01 5.55E 01 5.37E 01 5.38E 01 5,36E 01 5.49E 01 5-30E 01 5.2ÖE 01 5.52E 01 5.49E 01 5.SIE 01 5.92E 01 5.95E 01 5#84E 01 5.64E 01 5.65E 01 6.22E 01 7.72E 01 7.72E 01 7.05E 01 8.49E 01 8.51E 01 8.94E 01 3.32E 02
OP
85.931 85.315 83.765 83.374 82,718 81.933 81.038 79.535 78.803 78.276 77.745 77.346 77.276 77.216 77.066 77.014 77.112 77.434 77.189 77.223 77.366 77.320 77.138 77.146 76.441 76.104 76.192 76.878 77.351 78.050 79.056 80.563 83.057 85.199 88.214 91.298 95.975 >100 >100 >100 >100 >100 >100 >100
1.17E-84 4.84E-84 1,72E-82 4.23B-82 1.91E-81 1.17E-80 9.152-80 2,92B-78 1.58E-77 5.29E-77 1.80E-76 4.51E-76 5.29E-76 6.07B-76 8.5')E-76 9.68B-76 7.73E-76 3.69E-76 6.46E-76 5.98E-76 4.30E-76 4.79B-76 7.28B-76 7.14E-76 3.62B-75 7.86B-75 6,42E-75 1.32B-75 4.45E-76 8.91B-77 8.79B-78 2.73B-79 8.76B-82 6.32B-84 6.10B-87 5.04B-90 1.06B-94
NO.
8 8 8 8 8 8 8 8 8 8 8 8 8 8 8 8 8 8 8 8 8 8 8 8 8 8 8 8 8 8 8 8 8 8 8 8 8 8 8 8 8 8 8 8
59

TABLE A-2. (continued)
LAKBPA(pC) ALPHA SD OP jtT NO. •
1.57E 03 10,9890 4,71E 02 >100 11,1111 1.77E 03 5,10E 02 >100 11,2360 1.87E 03 4,57E 02 >100 11,3636 2.06E 03 4,70E 02 >100 11,4943 2.14E 03 5,08E 02 >100 11.6279 2.22E 03 4,48E 02 >100 11,7647 2,24E 03 4.26E 02 >100 11,9048 2,36E 03 4.84E 02 >100 12,0482 2,40E 03 5,26E 02 >100 12.1951 2,4aE 03 5,03E 02 >100 12,3457 2,38E 03 3.66E 02 >100 12,5000 2,38E 03 3,19E 02 >100 12,6582 2,37E 03 3.21E 02 >100 12,8205 2.35E 03 3,49E 02 >100 12,9870 2,38E 03 3.58E 02 >100 13,1579 2,44E 03 4,69E 02 >100 13,3333 2,41E 03 4,41E 02 >100 13,5135 2,35E 03 4,05E 02 >100 13,6986 2.35E 03 3.65E 02 >100 13,8889 2,30E 03 3,55B 02 >100 14.0845 2.26E 03 2,98E 02 >100 14,2857 2,22E 03 2,91E 02 >100 14,4928 2,2aE 03 3.40E 02 >100 14.7059 2.19E 03 2,98E 02 >100 14.9254 2,30E 03 3.28E 02 >100 15.1515 2.34E 03 4,16E 02 >100
60
8 8 8 8 8 8 8 8 8 8 8 8 8 8 8 8 8 8 8 8 8 8 8 8 8 8

TABLE A-3. LENS
UMBDA(pM) ALPHA SD OD ^T NO
0.2000 to
0,2950
>2,64E+01 >4.000 <1.00E-02 —
>2.64E+01 >4.000 <1.OOE-02 —
0.3000 2.18E+01 5.84E-01 3.310 4.89E-02 8 0.3050 2.13E+01 1.78E+00 3,228 5.91E-02 16 0,3100 1.37E+01 1.09E+00 2,075 8.41E-01 17 0.3150 8.23Ef00 5.89E-01 1,250 5.64E+00 17 0.3200 7.44E+00 5.65E-01 1,128 7.45E+00 18 0.3250 7.93E+00 5.77E-01 1,203 6.27E+00 18 0.3300 9.01E+00 6.49E-01 1,370 4.30E+00 18 0.3350 1.05E+01 7.46E-01 1.599 2.52EfOO 18 0.3400 1.23Ef01 8.84E-01 1.864 1.37E+00 18 0.3450 1.41E+01 1.02E+00 2.143 7.20E-01 18 0.3500 1.58Bf01 1.25E+00 2.395 4.02E-01 18 0.3550 1.76EK)1 2.24E+00 2.668 2.15E-01 18 0.3600 1.8lEf01 1.68Ef00 2,744 1.80E-01 18 0.3650 1.81E+01 1.38E+00 2,752 1.77E-01 18 0.3700 1.81E+01 1.45Ef00 2,748 1.79E-01 18 0,3750 1.80EfO1 2.45Ef00 2,726 1.88E-01 18 0,3800 1.66EfOl 1.58E4-00 2.516 3.05E-O1 18 0.3850 1.48E+01 1.13E+00 2.242 5.73E-01 18 0,3900 1.28E+01 9.49E-01 1.934 1.16E+00 18 0.3950 1.06E+01 7.68E-01 1.609 2.46EfOO 18 0.4000 8,35E+00 6.64E-01 1.267 5.41Ef00 18 0.4050 6.21E+00 6.18E-01 0,943 1.14E+01 18 0.4100 4.46E+00 5.98E-01 0,677 2.11E+01 18 0.4150 2.92E+00 3.16E-01 0,444 3.60E+O1 18 0.4200 1.92EfOO 2.27E-01 0,291 5.12E+01 18 0.4250 1.18E+00 2.59E-01 0,179 6.62E+01 20 0.4300 7.85E-01 2.05E-01 0,119 7.60E+01 20 0.4350 5.45E-01 1.68E-01 0,083 8.27E+01 20 0.4400 4.16E-01 1.61E-01 0,063 8.65E+01 20 0.4450 3.41E-01 1,54E-01 0,052 8.88E+01 20 0.4500 3.25E-01 1,44E-01 0.049 8.93E+01 18 0.4550 3.01E-01 1,41E-01 0,046 9.00E+01 18 0.4600 2.87E-01 1.41E-01 0,044 9.05E+O1 18 0.4650 2,75E-01 1,40E-01 0,042 9.08B+01 18 0.4700 2,67E-01 1,38E-01 0.040 9.11E+01 18 0.4750 2.59E-01 1,39E-01 0.039 9.13E+01 18 0.4800 2.68E-01 1,39E-01 0.041 9.10E+01 18 0.4850 2.4aE-01 1,38E-01 0,038 9.17E+01 18 0,4900 2,41E-01 1,35E-01 0,037 9.19E+01 18 0,4950 2.37E-01 1,35E-01 0.036 9.21E+01 18
61
TABLE A-3. (continued)
LAMBDA (pM)
0.5000 0.5050 0.5100 0.5150 0.5200 0.5250 0.5300 0.5350 0.5400 0.5450 0.5500 0.5550 0,5600 0.5650 0.5700 0.5750 0.5800 0.5850 0.5900 0.5950 0,6000 0.6050 0.6100 0.6150 0.6200 0.6250 0.6300 0.6350 0.6400 0.6450 0.6500 0.6550 0.6600 0.6650 0.6700 0.6750 0.6800 0.6850 0.6900 0.6950 0.7000 0.7050 0.7100
AIPHA
2.30E-01 2.27E-01 2.21E-01 2.18E-01 2.14E-01 2.12E-01 2.09E-01 2.05E-01 2.03E-01 2.01E-01 1.96E-01 ';,94E-01 1.91E-01 1.90E-01 1.89E-01 1.89E-01 1.89E-01 1.85E-01 1,82E-01 1.77E-01 1.73E-01 1,73E-01 1.712-01 1.68E-01 1.67E-01 1.65E-01 1.62E-01 1.62E-01 1.71E-01 I^OE-O': 1.59E-01 1.59E-01 1.58E-01 1.57E-01 1.55E-01 1.56E-01 1.53E-01 1.52E-01 1.50E-01 1.48E-01 1,49E.01 1.47E-01 1.46E-01
SD
1.34E-01 1.34E-01 1.33E-01 1,33E-01 1.33E-01 1,32E-01 1.31E-01 1.32E-01 1.34E-01 1.35E-01 1,34E-01 1.33E-01 1.31E-01 1,27E-01 1,24E-01 1.22E-01 1.24E-01 1.26E-01 1.30E-01 1.34E-01 1.38E-01 1.41E-01 1.40E-01 1,37E-01 1,31E-01 1,27E-01 1.25E-01 1,20E-01 1,15E-01 1.18E-01 1,18E-01 1.15E-01 1,15E-01 1.15E-01 1.14E-01 1.15E-01 1.14E-01 1.14E-01 1.13E-01 1.13E-01 1.13E-01 1.14E-01 1.13E-01
OD
0.035 0.034 0.034 0.033 0.033 0.032 0.032 0.031 0.031 0,030 0.030 0.029 0.029 0.029 0.029 0.029 0.029 0.028 Ü.028 0.027 0.026 0.026 0.026 0.026 0.025 0.025 0.025 0.025 0,026 0,024 0,024 0,024 0,024 0,024 0.024 0.024 0.023 0.023 0.023 0.023 0,023 0,022 0,022
#T_ NO,
9,23E+01 18 9,24E+01 18 9,26B+01 18 9.27Ef01 18 9,28E+01 18 9,29E+01 18 9,30E+01 18 9.31E+01 18 9.31E+01 18 9,32E+01 18 9,34Ef01 18 9,35Ef01 18 9,35Bf01 18 9.36Ef01 18 9,36Rf01 18 9,36Ef01 18 9.36Rf01 18 9.37Ef01 18 9,38E+01 18 9,40E+01 18 9.41E+01 18 9,42E+01 18 l.',42E+01 18 C,43E+01 18 !U44E+01 18 S.44E+01 18 9.45E+01 18 9,45Ef01 18 9,42Ef01 17 9,45E+01 18 9.46E+01 18 9,46Ef01 18 9.46E+01 18 9.47Ef01 18 9.47Ef01 18 9,47&K)1 18 9,48Bf01 18 9,48BfOl 18 9.49E+01 18 9.49Ef01 18 9,49Bf01 18 9.50E+01 18 9,50Bf01 18
62

TABLE A-3. I [continued)
IAMHDA(pO ALPHA SD
0,7150 1.46E-01 1.15E-01 0.7200 1.48E-01 1.15E-01 0,7250 1.48E-01 1.13E-01 0.7300 1.492-01 1.13E-01 0,7350 1.48E-01 1.14E-01 0,7400 1.48E-01 1.15E-01 0,7450 1.48E-01 1.14E-01 0,7500 1.47E-01 1.15E-01 0,7550 1.46E-01 1.14E-01 0.7600 1.46E-01 1.14E-01 0.7650 1.44E-01 1.17E-01 0.7700 1.42E-01 1.17E-01 0.7750 1.42E-01 1.17E-01 0,7800 1.42E-01 1.16E-01 0.7850 1.41E-01 1.16E-01 0.7900 1.41E-01 1.17E-01 0.7950 1.39E-01 1.17E-01 0.8000 1.46E-01 1.17E-01 0.8100 1.40E-01 1.06E-01 0.8200 1.41E-01 1.062-01 0.8300 1.43E-01 1.06E-01 0,8400 1.452-01 1.05E-01 0,8500 1.47E-01 1,072-01 0.8600 1.51E-01 1.05E-01 0.8700 1.55E-01 1,06E-01 0.8800 1.58E-01 1.04E-01 0.8900 1,62E-01 1.04E-01 0.9000 1.66E-01 1.02E-01 0.9100 1.71E-01 1.032-01 0.9200 1,751-01 1.01E-01 0.9300 1,90E-01 1.05E-01 0.9400 2.22E-01 1,052-01 0.9500 2.70E-01 1,102-01 0.9600 3.23E-01 1.15E-0' 0.9700 3.27E-01 1.11E-0I 0.9800 3.29E-01 1.17E-C1 0.9900 3.15E-01 1.17E-01 1,0000 2.96E-01 1.17E-01 1,0100 2,71E-01 1.13E-01 1,0200 2.48E-01 1.06E-Ö1 1.0300 2,26E-01 1.05E-01 1.0400 2.10E-01 1.03E-01 1.0500 1.97E-01 1.06E-01 1.0600 1.89E-01 1 .03E-01
or
0.022 0.022 0.022 0.023 0.022 0.022 0.022 0.022 0.022 0.022 0.022 0.022 0.022 0.021 0.021 0.021 0.021 0.022 0.021 0.021 0.022 0.022 0.022 0.023 0.023 0.024 0.025 0.025 0.026 0.027 0.029 0.034 0.041 0.049 0.050 0.050 0.048 0.045 0.041 0.038 0.034 0.032 0.030 0.029
^T
9.50E+01 9.50EfOl 9.50E+01 9.49B+01 9.50BfOl 9.50BfOl 9.50E+01 9.50EfOl 9.50Bf0l 9.50E+01 9.51E+01 9.52E+01 9.52E^01 9.52E+01 9.52E+01 9.52Bf0l 9.53E+01 9.50E+01 9.52B^01 9.52EfOl 9,51E+01 9.51E+01 9.50EfOl 9.49E+01 9.47E+01 9.46B4-01 9.45E+01 9.44E+01 9,42B+01 9.41E+01 9.36&1-01 9.25E+01 9.10Ef0l 8.93I>f01 8.92Ef0l 8.91E+01 8.96BK)1 9.02E+01 9.09B^01 9.17E+01 9.24E+01 9.29E+01 9.33E+01 9.36E+01
NO.
18 18 18 18 18 18 18 18 18 18 18 18 18 18 18 18 18 18 18 18 18 18 18 18 18 18 18 18 18 18 18 18 18 18 18 18 18 18 18 18 18 18 18 18
63
• •

TABLE A-3. (continued)
LAMBDA ißMi ALPHA SD QD %1! NO,
1.0700 1.0800 1.0900 1.1000 1.1100 1.1200 1.1300 I.UOO 1.1500 1.1600 1.1700 1.1800 1.1900 1.2000 1.2100 1.2200 1.2300 1.2400 1.2500 1.2600 1.2700 1.2800 1.2900 1.3000 1.3100 1.3200 1.3300 1.3400 1.3500 1.3600 1.3700 1.3800 1.3900 1.4000 1.4100 1.4200 1.4300 1.4400 1.4500 1.4600 1.4700 1.4800 1.4900 1.5000
1.82E-01 1.86E-01 1.94E-01 2.07E-01 2.24E-01 2.53E-01 3.20E-01 4.67E-01 6.23E-.01 6.94E-01 7.42E-01 7.72E-01 7.78E-01 7.56E-01 7.22E-01 6.94E-01 6.75E-01 6.58E-01 6.40E-01 6.35E-01 6.48E-01 6.64E-01 6.97E-01 7.61E-01 8.42E-01 1.00E+00 1.21E+00 1.44E+00 1.67B+00 1.90Ef00 2.25E+00 2#90EfOO 4.49E+00 7.48E+00 1.02Ef01 1.21E+01 1.32E+01 1.38E+01 1.40Ef01 1.38E+01 1.31E+01 1,22E+01 1.11E+01 1.01E+01
1.03E-01 1.03E-01 1.05E-01 1.04E-01 1.03E-01 9.56E-02 9.32E-02 9.38E-02 1.07E-01 1.09E-01 1.07E-01 1.09E-01 1,09E-01 1.12E-01 1.13E-01 1.12E-01 1J2E-01 1.14E-01 1J2E-01 1.13E-01 1.17E-01 1.14E-01 1.18E-01 1.14E-01 1.24E-01 1.56E-01 2.08E-01 2.76E-01 3.47E-01 4.15E-01 5.23E-01 7.51E-01 1.43E+00 9.22E-01 1.37E+00 1.70E4-00 1.97E+00 2,36E+00 2.63E+00 2.20EfOO 1.85E+00 1.63E+00 1.40E+00 1.26EfOO
0.028 0,028 0.029 0.031 0.034 0.038 0.049 0.071 0.095 0.105 0.113 0.117 0.118 0.115 0.109 0.105 0.102 0.100 0.097 0.096 0.098 0.101 0.106 0.115 0.128 0.152 0.183 0.219 0.254 0.288 0.342 0.439 0.682 1.134 1.553 1.829 1.998 2.096 2.120 2.089 1.983 1.844 1.687 1.530
?:
9.38BfOl 9.37Bf01 9.34E+01 9.30E+O1 9.25Ef01 9.l5Ef01 8.94EfOl 8.49B+01 8.04Ef01 7.85E+01 7.72E+01 7.64Bf01 7.62E+01 7.68Bf01 7.77EfOl 7.85E+01
.89E+01
.95E+01 7.99E+01 8.01E+01 7.98E+01 7.93E+01 7.84E+01 7.67E+01 7.45Ef01 7.05Bf01 6.56E+01 6.04E+01 5.57E+01 5.16E+01 4.55E+01 3.64B+01 2.08E+01 7.34E+00 2,80BfOO 1.48E+00 1.00E+00 8.03E-01 7.59E-01 8.15E-01 1.04E+00 1.43E+00 2.06E+00 2.95E+00
18 18 18 18 18 18 18 18 20 20 20 20 20 20 20 20 20 20 20 20 20 20 20 20 20 20 20 20 20 20 20 20 20 20 20 20 20 20 20 20 20 20 20 20
64
TABLE A-3. (continued)
IAMBDA(pO ALPHA SD OD ST. NO.
1.5100 1.5200 1.5300 1.5400 1.5500 1.5600 1.5700 1.5800 1.5900 1.6000 1.6100 1.6200 1.6300 1.6400 1.6500 1.6600 1.6700 1,6800 1.6900 1.7000 1.7100 1.7200 1.7300 1.7400 1.7500 1.7600 1.7700 1.7800 1.7900 1.8000 1.8100 1.8200 1.8300 1.8400 1.8500 1.8600 1.8700 1.8800 1.8900 1.9000 1.9100 1.9200 1.9300 1.9400
9.05B+00 S.IBBfOO 7.38Bf00 6.74Bf00 6.06Bf00 5.56Bf00 5.l8Bf00 4.83E+00 4.56BfOO 4.28E+00 4.05E+00 3.88BfOO 3.73E+00 3.61E+00 3.51E+00 3.50Bf00 3.57B+00 3.71E+00 3.87Bf00 3.90Ef00 3.95EfOO 4.12E+00 4.26EfOO 4.42E+00 4.55&f00 4.71E+00 4.87E+00 5.07E+00 5.10E+00 5.11Bf00 5.08E+00 5.07Ef00 5.12E+00 5.30E+00 5.77E+00, 6.87Bf00 9.76Rf00 1.49©f01 1.89E+01 1.95BfOl 1.93E+01
>2.00E+01 >2.00E+01 >2.00E+01
1.05Bf00 9.53E-0 8.47E-0 8.39E-0 6.67E-0 6.06E-0 5.71E-0 5.29E-0 5.49E-0 4.94E-0 4.63E-0 4.36E-0 4.18E-0 4.03E-0 3.89E-0 3.82E-0 3.70E-0 3.77E-0 4.60E-0 4.33E-0 4.24E-0 4.43E-0 4.38E-0 4.62E-0 4.96E-0 5.31E-0 5.61E-0 5.43E-0 5.85E-0 5.56E-0 5.47E-0 5.47E-0 5.51E-0 5.60E-0 6.24E-0 8.02E-0 1.91E+00 2.46EfOO 2.63E+00 2.91E+00 2.69E+00
1.373 1.241 1.120 1.022 0.919 0.844 0.785 0.732 0.691 0.649 0.614 0.589 0.566 0.547 0.532 0.531 0.542 0.562 0.587 0.591 0.599 0.625 0.646 0.671 0.690 0.714 0.739 0.769 0.774 0.775 0.770 0.769 0.777 0.804 0.875 1.042 1.480 2.264 2.872 2.965 2.933
>3.000 >3.000 >3.000
4.24E+00 5.74EfOO 7.58E+00 9.50E+OO 1.21E+01 1.45EfOl 1,64E+01 1.85B+01 2.03EfOl 2.25E+01 2.43E+01 2,58EfOl 2.72E+01 2.84BfOl 2.94E+01 2.94E+01 2.87E+01 2.74B+01 2.59BfOl 2.56E+01 2.52E+01 2.37E+01 2.26E+01 2.13E+01 2.04E+O1 1.93E+01 1.82E+01 1,70BfOl 1.68E+01 1.68E+01 1.69E+01 1.70E+01 1.67E+01 1.57E+01 1.34BfOl 9.09B+OO 3.31E+00 5.44E-01 1.34E-01 1.08E-01 1.17E-01
<1.00E-01 <1.00E-01 <1.00E-O1
20 20 20 20 20 20 20 20 20 20 20 20 20 20 20 20 20 20 20 20 20 20 20 20 20 20 20 20 20 20 20 20 20
0 0 0 0
19 17 11
5
65
r-
TABLE A-3. (continued)
liAMBM(p) ALPHA SD on ;tT NO
1.9500 > 2.00E+01 >3.000 <1,00B-01 1.9600 > 2.00B+01 >3.000 <1.00E-01 — ^ 1.9700 1.89B+01 vw^oo 2.862 1.37K-01 4 1.9800 1.89B+01 3.02BfOO 2,872 1,34E-01 ■1 1.9900 1.861')+01 2.70BfOO 2.816 1.53E-01 4 P.OOOO 1.87K+01 3.30BfOO 2.841 1,44B-01 '. 2.0100 1.86E+01 3,60&»-OO 2.823 1,50B-01 5 2.0200 !,80Bf0l 3.48B+00 2.728 1,87B-01 5 P.O^OO t.HOKrfOl 3.47K+00 2,723 1,89E-01 5 2.0400 1.91E+01 3.42©fOO 2.801 1.20K-01 8 2.0500 1.92E+01 3,02E+00 2.90f) 1.24E-01 15 2.0600 1#81B+01 2,82E+00 2,738 1,83E-01 17 2.0700 1.73K+01 2,36BfOO 2.6 28 ?,36E-01 18 2.0800 1#65]^01 2,24E+00 2,509 3.09E-01 1,^ 2.0900 l#59Bf01 2,16B4.00 2.410 5,89E-01 18 2.1000 l#51E+01 1,92E+00 2.2«; 4 5.08E-01 18 2.1100 t.4^l'>0l 1,83E+O0 2.195 6.^8K-01 18 2.1200 1.421^01 1,74E+00 2.155 7.00E-01 18 2.noo 1.39B54-01 1.72K+00 2.106 7.84B-01 18 2.1400 1. 3q]<>oi 1.76K+00 2.108 7.80B-01 18 2.1500 I.39E+01 1.771';+00 2.114 7.68B-01 18 2.1600 l,40B+01 1.Y6K+00 2.124 7.,)0E-01 18 2.1700 I,40B+01 1.72K+00 2.110 7.60E-01 18 2.1800 l#37Bf0l 1.81K+00 2.083 8.26E-01 18 '.1900 l,38E+01 1,95E+00 2.004 8.06E-01 ig 2.2000 I.31F,+01 1,69E+00 1.088 1.03E+00 19 2.2100 I.28E+01 1.67K+00 1.038 1.1SR+00 10 2.2200 t,25E+01 1.S7K+00 1.800 1.29E+00 10 2.2100 I.24E+01 1.47E+00 1.880 1.30R+00 19 2.2400 1 1.26^01 1.47K+00 1.018 1.21R+00 10 2.2S00 1 l.^3E+01 1.57B+00 2.011 9.75E-01 19 2.2600 i l#39Bf01 1,67B+00 2.110 7.76E-01 18 2.2700 1 l.46K^01 1.82K+00 2.220 6.03E-01 1}' 2.2800 1 I.52E+01 1.011';+00 2.302 4.00K-01 Id 2.2900 1 l,58E+01 1,98E+00 2.399 ^.OOK-OI 18 2.3000 1 I.60B+01 2,05E+00 2.424 3,77E-01 18 2.1100 1 I.65E+01 2.14E+00 2.408 5,18E-01 18 2.3200 1 I.69E+01 2,65E+00 2.r)60 2.77R-01 17 2.3300 1 I.71E+01 2. S 61.;+00 2.508 2.S2R-01 16 2.3400 1 I.75E+01 3,06BfOO 2.660 2.10E-01 15 2.3500 1 I.75E+01 2.91E+00 2.657 2.2QE-01 1 5 2.3600 1 l.80Ef0l 3.12I';+00 2.730 1.87E-01 12 2.^700 1 i.84E+01 3,21E+00 2.708 1.59E-01 1? 2.3800 1 .89E+01 ^.^oi';+oo 2.862 1.38B-01 10
bb

TABLE A-3. (continued)
LAMBDA (pQ ALPHA SD OP ^T NO.
2i3900 1.80E+01 3.00EfOO 2.724 1.89E-01 3 2.4000 1.94E+01 3.21E+00 2.938 1.15E-01 8
I'M® >J:?8i:8i1 1:-0Z5!20 >?:8J8 <?:88fc8? 2^4900 >2.00E+01 >3.000 <1.00E-01
5
67
TABLE A-4. VITREOUS HUMOR
ALPHA SD OD NO.
,2000 3.83E 01 1.40E 01 19.195 6.39E-18 10 .2050 2.98E 01 8.61E 00 14.932 1.17E-13 10 .2100 2.19E 01 4.81E 00 10.972 1.07E-09 10 .2150 1.69E 01 2.39E 00 8.455 3.51E-07 11 .2200 1.40E 01 1.50E 00 7.010 9.76E-06 11 .2250 1.24E 01 1.07E 00 6.225 5.95E-05 11 .2300 1.12E 01 7.95E-01 5.631 2.34E-04 11 .2350 1.12E 01 2.16E 00 5.612 2.44E-04 11 .2400 1.34E 01 3.69E 00 6.701 1.99E-05 11 .2450 1.73E 01 5.91E 00 8.660 2.19E-07 11 .2500 2.23E 01 9.13E 00 11.194 6.40E-10 11 .2550 2.96E 01 1.30E 01 14.861 1.38E-13 10 .2600 3.48E 01 1.59E 01 17.462 3.45E-16 10 .2650 3.88E 01 1.54E 01 19.456 3.50E-18 9 .2700 3.65E 01 1.42E 01 18.283 5.21E-17 9 .2750 2.88E 01 1.20E 01 14.454 3.52E-13 10 .2800 2.HE 01 8.42E 00 10.729 1.87E-09 11 .2850 1.36E 01 4.44E 00 6.813 1.54E-05 12 .2900 7.80E 00 2.08E 00 3.914 1.22R-02 12 .2950 4.20E 00 4.64E-01 2.106 7.83E-01 11 .3000 2.96E 00 5.57E-01 1.482 3.29E 00 12 .3050 1.50E 00 4.68E-01 .751 1.78E 01 1? .3100 6.92E-01 2.89E-01 .347 4.50E 01 12 .3150 3.90E-01 1.75E-01 .196 6.37E 01 12 .3200 2.88E-01 1.26E-01 .144 7.17E 01 12 .3250 2.50E-01 1.09E-01 .125 7.49E 01 12 .3300 2.53E-01 1.03E-01 .117 7.64E 01 12 .3350 2.16E-01 9.12E-02 .109 7.79E 01 12 .3400 2.01E-01 7.46E-02 .101 7.93E 01 12 .3450 1.88E-01 6.45E-02 .094 8.05E 01 12 .3500 1.76E-01 6.23E-02 .088 8.16E 01 12 .3550 1.73E-01 5.50E-02 .087 8.19E 01 12 .3600 1.60E-01 5.24E-02 .080 8.31E 01 12 .3650 1.49E-01 4.92E-02 .075 8.42E 01 12 .3700 1.38E- 01 4.5OE-02 .069 8.52E 01 12 .3750 1.27E-01 4.40E-02 .064 8.64E 01 12 .3800 1.15E-01 4.22E-02 .058 8.76E 01 1? .3850 1.07E-01 4.03E-02 .053 8.84E 01 12 .3900 1.01E-01 3.92E-02 .050 8.90E 01 12 .3950 9.26E-02 4.07E-02 .046 8.99E 01 12 .4000 «.47E-02 3.9OE-02 .042 9.07B 01 1? .4050 8.00E-02 3.92E-02 .040 9.12E 01 12 .4100 7.56E-02 3.79E-02 .038 9.16E 01 12
68

TABLE A-4. (continued)
ALPHA SD OD ^T NO.
.4150 7.2^-02 3.50E-02 .036 9.20E 01 1?
.4200 6.84E-02 3.38E-02 .034 9.24E 01 12
.4250 6.69E-02 3.56E-02 .034 9.26E 01 12
.4300 6.44E-02 3.15E-02 .032 9.28E 01 12
.4350 6.40E-02 3.16E-02 .032 9.29E 01 12
.4400 6.18E-02 5.24E-02 .031 9.31E 01 12
.4450 6.16B-C2 2.99E-02 .031 9.31E 01 12
.4500 6.20E-Ü2 3.02E-02 .031 9.31 E 01 1?
.4550 5.87E-02 3.10E-02 .029 9.34E 01 12
.4600 5.82E-02 2.89E-02 .029 9.35E 01 12
.4650 5.75E-02 2.858-02 .029 9.36E 01 12 .4700 5.79E-02 2.97E-02 .029 9.35E 01 12 .4750 5.64E-02 2.92E-02 .028 9.37E 01 12 .4800 5.65E-02 2.81E-02 .028 9.37E 01 1? .4850 5.59E-02 2.771S-02 .028 9.38E 01 12 .4900 5.41E-02 2,77E-02 .027 9.39E 01 1? .4950 5.37E-02 2.69E-02 .027 9.40E 01 12 .5000 5.24E-02 2.74E-02 .026 9.41E 01 12 .5050 5.18E-02 2.61E-02 .026 9.42E 01 12 .5100 5.11E-02 2.58E-02 .026 9.43E 01 12 .5150 5.06E-02 2.50E-02 .025 9.43E 01 12 .5200 4.96E-02 2.58E-02 .02S 9.44E 01 12 .5250 4.79E-02 2.53E-02 .024 9.46E 01 1? .5300 4.73E-02 2.50E-02 .024 9.47E 01 12 .5350 4.67E-02 2.54E-02 .023 9.47E 01 12 .5400 4.55E-02 2.41E-02 .023 9.49E 01 12 .5450 4.60E-02 2.35E-02 .023 9.48E 01 1? .5500 4.51E-02 2.39E-02 .023 9.49E 01 12 .5550 4.42E-02 2.40E-02 .022 9.50E 01 12 .5600 4.47E-02 2.30E-02 .022 9.50E 01 12 .5650 4.55E-02 1.92E-02 .023 9.49E 01 12 .5700 4.36E-02 2.15E-02 .022 9.51E 01 12 .5750 4.17E-02 2.09E-02 .021 9.53E 01 12 .5800 4.488-02 2.15E-02 .022 9.50E 01 12 .5850 4,76E-02 2.36E-02 .024 9.47E 01 12 .5900 4.29E-02 2,29E-02 .021 9.52E 01 12 .5950 4.32E-02 2.19E-02 .022 9.51E 01 12 .6000 4.21E-02 2.31E-02 .021 9.53E 01 12 .6050 4.20E-02 2.23E-02 .021 9.53E 01 1° .6100 4.27E-02 2,05E-02 .021 9.52E 01 12 .6150 4.12E-02 2.18E-02 .021 9.54E 01 12 .6200 4.02E-02 2.22E-02 .020 9.55E 01 12 .6250 4.13E-02 2.13E-02 .021 9.53E 01 12 .6300 4.10E-02 2.23B-02 .021 9.54E 01 12
69
■

»
TABLE A-4. (continued)
ALPHA SD
.6350 3.97E-02 2.29E-02
.6400 4.09E-02 2.16E-02
.6450 4.26E-02 2.13E-02
.6500 4.02E-02 2.22E-02
.6550 3.94E-02 2.34E-02
.6600 3.98E-02 2.25E-02
.6650 4.08E-02 2.13E-02
.6700 4.12E-02 1.98^-02
.6750 4.06E-02 2.11E-02
.6800 4.13E-02 1.93E-02
.6850 4.0RK-02 1.97E-02
.6900 4.13E-02 2.02E-02
.6950 4.18E-02 1.98E-02
.7000 4.23E-02 2.06E-02
.7050 4.27E-02 2.07E-02
.7100 4.43E-02 2.08E-02
.7150 4.53E-02 2.13E-02
.7200 4.71E-02 2.16E-02
.7250 4.94E-02 2.16E-02
.7300 5.47E-02 2.18E-02
.7350 5.81E-02 2.13E-02
.7400 6.07E-02 1.89E-02
.7450 6.14E-02 1.69E-02
.7500 6.16E-02 1 .68E-02
.7550 6,26E-02 1.71E-02
.7600 6.10E-02 1.66E-02
.7650 6.04E-02 1.70E-02
.7700 6.07E-02 1.67E-02
.7750 5.96E-02 1.72E-02
.7800 5.88E-02 1.83E-02
.7850 5.74E-02 1.69E-02
.7900 5.55E-02 1.81E-02
.7950 5.44E-02 1.82E-02 .8000 5.44E-02 1.74E-02 .8100 5.68E-02 2.93E-02 .8200 6#14E-02 3.08E-02 .8300 7.12E-02 3.20E-02 .8400 7.43E-02 3.26E-02 .8500 7.79E-02 3.14E-02 .8600 8.07E-02 3.19E-02 .8700 8.34E-02 3.20E-02 .8800 8.76 B-02 3.05E-02 .8900 9,23E-02 2.92E-02 .9000 1.01E-01 3.04E-02
OD 0T NO.
.020 9.55E 01 12
.020 9.54E 01 12
.021 9.52E 01 12
.020 9.55E 01 12
.020 9.55E 01 12
.020 9.55E 01 12
.020 9.54E 01 12
.021 9.53E 01 12
.020 9.54E 01 12
.021 9.53E 01 12
.020 9.54E 01 12
.021 9.53E 01 12
.021 9.53E 01 12
.021 9.52E 01 12
.021 9.52E 01 12
.022 9.50E 01 12
.023 9.49E 01 12
.024 9.47E 01 12
.025 9.45E 01 12
.027 9.39E 01 12
.029 9.35E 01 12
.030 9.32E 01 12
.031 9.32E 01 12
.031 9.31E 01 12
.031 9.30E 01 12
.031 9.52E 01 12
.030 9.33E 01 12
.030 9.32E 01 12
.030 9.34E 01 12
.030 9.34E 01 12
.029 9.36E 01 12
.028 9.38E 01 12
.027 9.39E 01 12
.027 9.39E 01
.029 9.36E 01 17
.031 9.32E 01 17
.036 9.21E 01
.037 9.18E 01
.039 9.14E 01
.040 9.11E 01
.042 9.08E 01
.044 9.04E 01
.046 8.99E 01
.051 8.89E 01 17
70
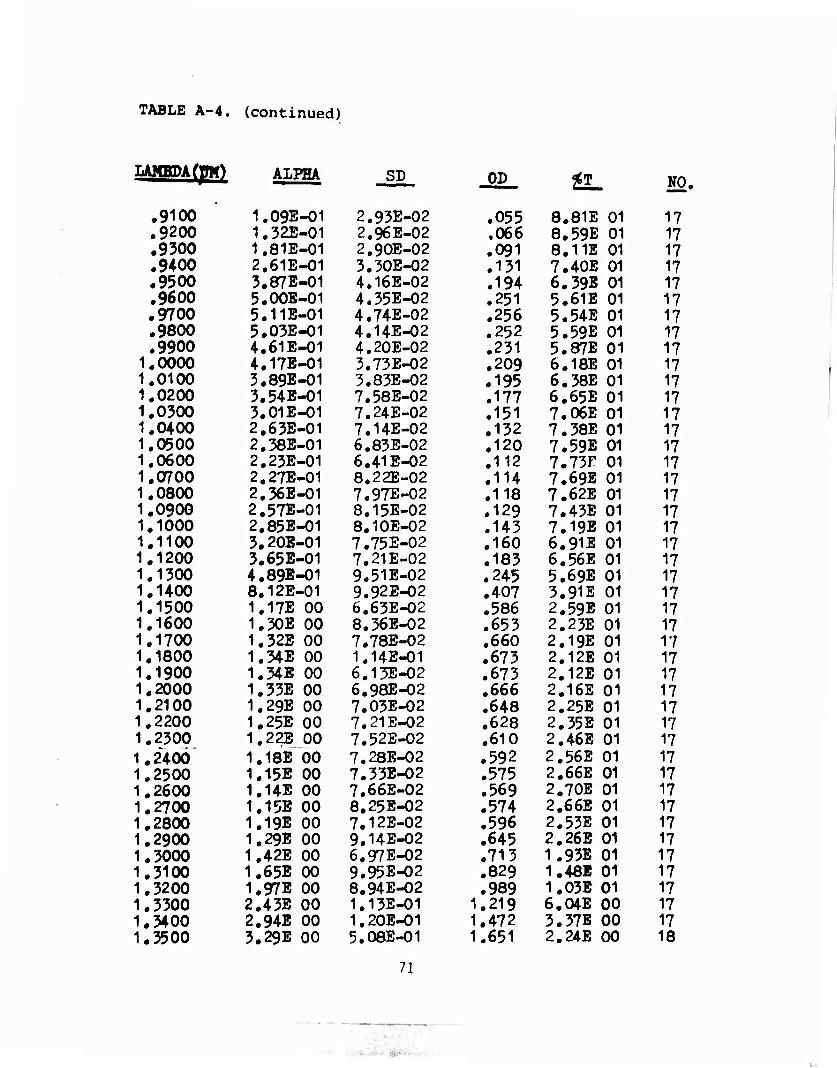
TABLE A-4. (continued)
LAMBDAtpM) ALPHA SD OD ^T S£ .9100 1.09E-01 2.93E-02 .055 8.81E 01 17 .9200 1.32E-01 2.96E-02 .066 8.59E 01 17 .9300 1.81E-01 2.90E-02 .091 8.1 IE 01 17 .9400 2.61E-01 3.30E-02 .131 7.40E 01 17 .9500 3.87E-01 4.16E-02 .194 6.39E 01 17 .9600 5.00E-01 4.35E-02 .251 5.61E 01 17 .9700 5.11E-01 4.74E-02 .256 5.54E 01 17 .9800 5.03E-01 4.14E-02 .252 5.59E 01 17 .9900 4.61E-01 4.20E-02 .231 5.87E 01 17
1.0000 4.17E-01 3.73E-02 .209 6.18E 01 17 1.0100 3.89E-01 3.83E-02 .195 6.38E 01 17 1.0200 3.54E-01 7.58E-02 .177 6,65E 01 17 1.0300 3.01E-01 7.24E-02 .151 7.06E 01 17 1.0400 2.63E-01 7.14E-02 .132 7.38E 01 17 1.0500 2.38E-01 6.83E-02 .120 7.59E 01 17 1.0600 2.23E-01 6.41E-02 .112 7.13T 01 17 1.0700 2.27E-01 8,22E-02 .114 7.69E 01 17 1.0800 2.36E-01 7.97E-02 .118 7.62E 01 17 1.0900 2.57B-01 8.15E-02 .129 7.43E 01 17 1.1000 2.85E-01 8.10E-02 .143 7.19E 01 17 1.1100 3.20E-01 7.75E-02 .160 6.91E 01 17 1.1200 3.65E-01 7.21E-02 .183 6.56E 01 17 1.1300 4.89E-01 9.51E-02 .245 5.69E 01 17 1.1400 8.12E-01 9.92E-02 .407 3.91E 01 17 1.1500 1.17E 00 6.63E-02 .586 2.59E 01 17 1.1600 1.30E 00 8.36E-02 .653 2.23E 01 17 1.1700 1.32E 00 7.78E-02 .660 2.19E 01 17 1.1800 1.34E 00 1.14E-01 .673 2.12E 01 17 1.1900 1.34E 00 6.13E-02 .673 2.12E 01 17 1.2000 1.33E 00 6.9aE-02 .666 2.16E 01 17 1.2100 1.29E 00 7,03E-02 .648 2.25E 01 17 1.2200 1.25E 00 7.21E-02 .628 2.35E 01 17 1.2300 1.22E 00 7.52E-02 .610 2.46E 01 17 1.2400 1.18E 00 7.28E-02 .592 2.56E 01 17 1.2500 1.15E 00 7.33E-02 .575 2.66E 01 17 1.2600 1.14E 00 7.66E-02 .569 2.70E 01 17 1.2700 1.15E 00 8.25E-02 .574 2.66E 01 17 1.2800 1.19E 00 7.12E-02 .596 2.53E 01 17 1.2900 1.29E 00 9.14E-02 .645 2.26E 01 17 1.3000 1.42E 00 6.97E-02 .713 1 .93E 01 17 1.3100 1.65E 00 9.95E-02 .829 1.48E 01 17 1.3200 1.97E 00 8,94E-02 .989 1.03E 01 17 1.3300 2.43E 00 1.13E-01 1.219 6.04E 00 17 1.3400 2.94E 00 1.20E-01 1.472 3.37B 00 17 1.3500 3.29E 00 5.08E-01 1.651 2.24E 00 18
71
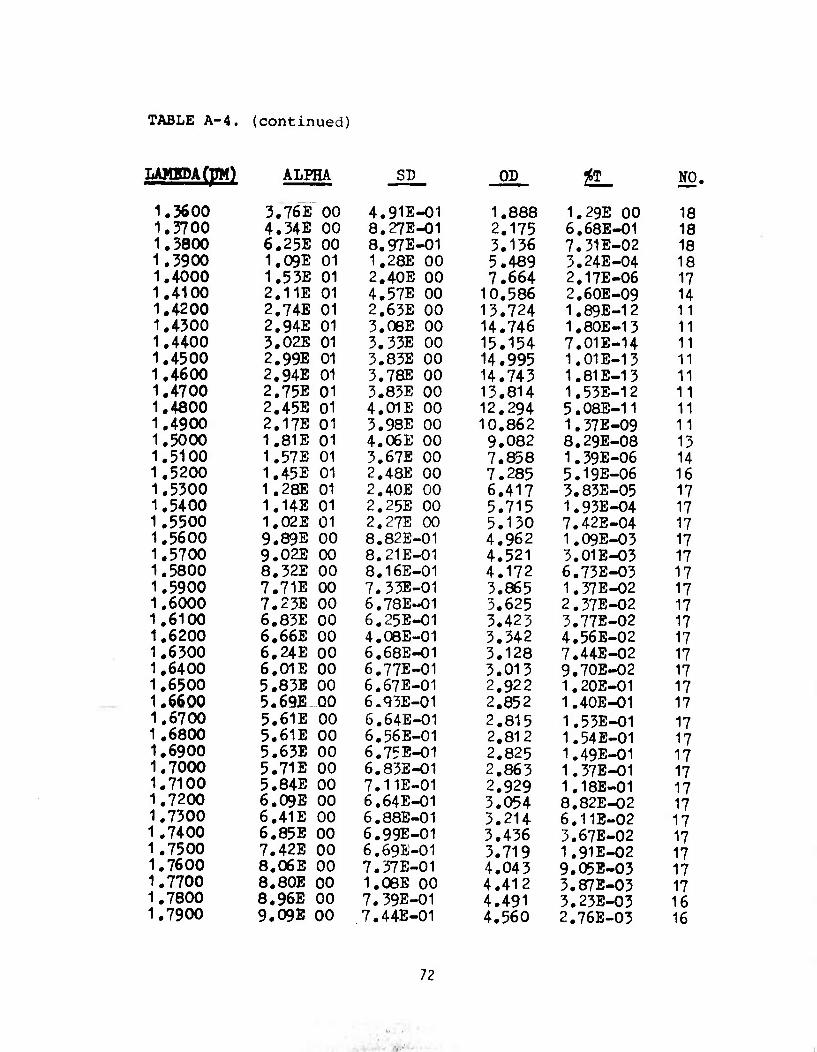
TABLE A-4. (continued)
UMBDkjjm) ALPHA
1.3600 1,3700 1.3800 1.3900 1.4000 1.4100 1.4200 1.4300 1.4400 1.4500 1.4600 1.4700 1.4800 1.4900 1.5000 1.5100 1.5200 1.5300 1.5400 1.5500 1.5600 1.5700 1.5800 1.5900 1.6000 1.6100 1.6200 1.6300 1.6400 1.6500 1.6600 1.6700 1.6800 1.6900 1.7000 1.7100 1.7200 1.7300 1.7400 1.7500 1.7600 1.7700 1.7800 1.7900
3.76E 00 4.34E 00 6.25E 00 1.09E 01 1.53E 01 2.11E 01 2.74E 01 2.94E 01 3.02E 01 2.99E 01 2,94E 01 2.75E 01 2.45E 01 2.17E 01 1.81E 01 1.57E 01 1.45E 01 1.28E 01 1.14E 01 1.02E 01 9.89E 00 9.02E 00 8.32E 00 7.71E 00 7.23E 00 6.83E 00 6#66E 00 6.24E 00 6.01 E 00 5.83E 00 5.69ILQO 5.61E 00 5.61E 00 5.63E 00 5.71E 00 5.84E 00 6.09E 00 6.41E 00 6.85E 00 7.42E 00 8.06E 00 8.80E 00 8.96E 00 9.09E 00
SI)
4.91E-01 8.27E-01 8.97E-01 1.28E 00 2.40E 00 4.57E 00 2.63E 00 3.08E 00 3.33E 00 3.83E 00 3.78E 00 3.83E 00 4.01E 00 3.98E 00 4.06E 00 3.67E 00 2.48E 00 2.40E 00 2.25E 00 2.27E 00 8.82E-01 8.21E-01 8.16E-01 7.33E-01 6.78E-01 6.25E-01 4.08E-01 6.68E-01 6.77E-01 6.67E-01 6.q3E-01 6.64E-01 6.56E-01 6.75E-01 6.83E-01 7.11E-01 6.64E-01 6.88E-01 6.99E-01 6.69E-01 7.37E-01 LOSE 00 7.39E-01 7.44E-OI
OP
1.888 2.175 3.136 5.489 7.664
10.586 13.724 14.746 15.154 14.995 14.743 13.814 12.294 10.862 9.082 7.858 7.285 6.417 5.715 5.130 4.962 4.521 4.172 3.865 3.625 3.423 3.342 3.128 3.013 2.922 2.852 2.815 2.812 2.825 2.863 2.929 3.054 3.214 3.436 3.719 4.043 4.412 4.491 4.560
gT_
1.29E 00 6.68E-01 7.31E-02 3.24E-04 2.17E-06 2.60E-09 1.89E-12 1.80E-13 7.01E-14 1.01E-13 1.81E-13 1.53E-12 5.08E-11 1.37E-09 8.29E-08 1.39E-06 5.19E-06 3.83E-05 1.93E-04 7.42E-04 1.09E-03 3.01E-O3 6.73E-03 1.37E-02 2.37E-02 3.77E-02 4.56E-02 7.44E-02 9.70E-02 1,20E-01 1.40E-O1 1.53E-01 1.54E-01 1.49E-01 1.37E-01 1.18E-01 8.82E-02 6.11E-02 3.67E-02 1,91E-02 9.052-03 3.87E-03 3.23E-03 2.76E-03
NO.
18 18 18 18 17 14 1 1 1 1 1 1 1 1 13 14 16 17 17 17 17 17 17 17 17 17 17 17 17 17 17 17 17 17 17 17 17 17 17 17 17 17 16 16
72
■
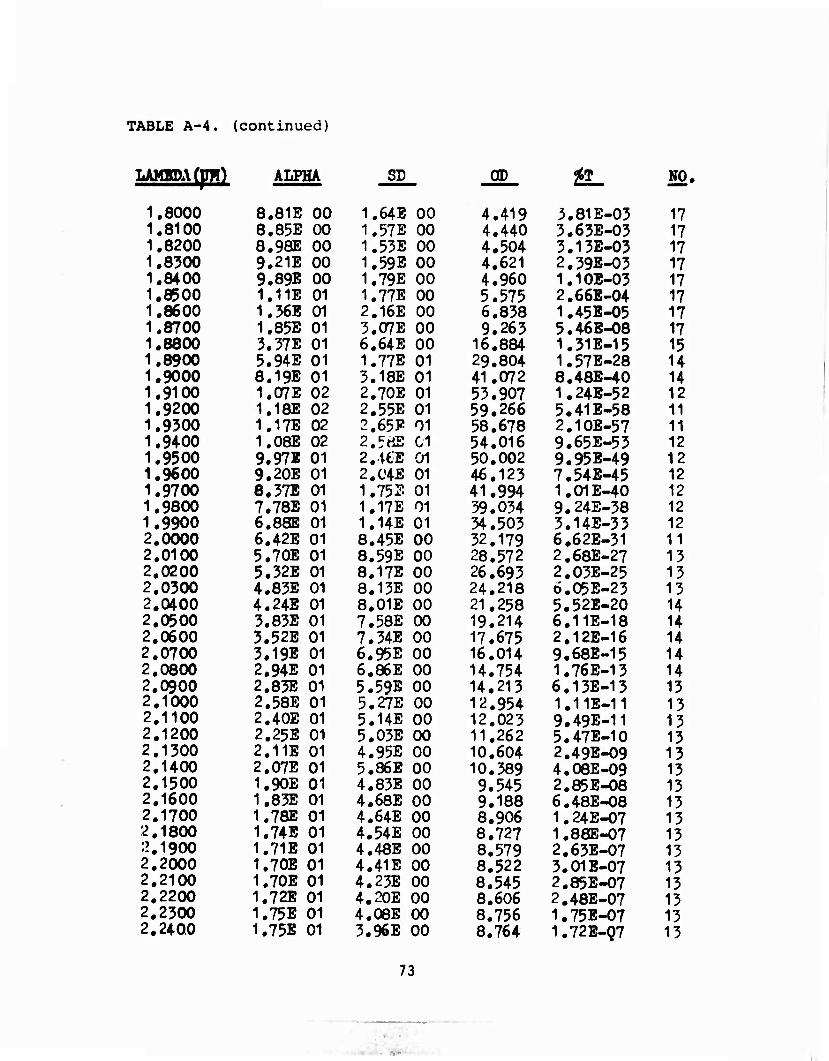
TABLE A-4. (continued)
ALPHA SD QD J*T_ NO.
1,8000 8.81E 00 1.64E 00 4.419 3.81 E-03 17 1.8100 8.85E CO 1,57E 00 4.440 3.63E-03 17 1.8200 8.98E 00 1.55E 00 4,504 3.13E-03 17 1.8300 9.21E 00 1,59E 00 4,621 2.39E-03 17 1.8400 9.89E 00 1,79E 00 4,960 1.10E-03 17 1.8500 1,1 IE 01 1,77E 00 5.575 2.66E-04 17 1.8600 1,36E 01 2.16E 00 6.838 1.45E-05 17 1.8700 1,85E 01 3.07E 00 9,263 5.46E-08 17 1.8800 3.37E 01 6,64E 00 16.884 1.31E-15 15 1.8900 5.94E 01 1.77E 01 29,804 1,57E-28 14 1,9000 8.19E 01 3.18E 01 41.072 8.48E-40 14 1.9100 1.07E 02 2.70E 01 53.907 1,24E-52 12 1.9200 1.18E 02 2,55E 01 59.266 5.41 E-58 11 1.9500 1.17E 02 2,65? 01 58.678 2,10E-57 11 1.9400 1.08E 02 2,5äE C1 54.016 9.65E-53 12 1.9500 9.97E 01 2..ie;E oi 50,002 9.95E-49 12 1.9600 9.20E 01 2.Ü4E 01 46,123 7.54E-45 12 1.9700 8.37E 01 1.75^ 01 41,994 1.01E-40 12 1.9800 7.78E 01 1,17E 01 39.034 9,24E-38 12 1.9900 6.88E 01 1.14E 01 34.503 3.14E-33 12 2.0000 6.42E 01 8.45E 00 32.179 6,62E-31 11 2.0100 5.70E 01 8,59E 00 28.572 2,68E-27 13 2.0200 5.32E 01 8.17E 00 26,693 2,03E-25 13 2.0300 4.83E 01 8,13E 00 24,218 6,05E-23 13 2,0400 4.24E 01 8.01E 00 21,258 5,52E-20 14 2,0500 3.83E 01 7,58E 00 19.214 6,11E-18 14 2,0600 3.52E 01 7.34E 00 17.675 2,12E-16 14 2.0700 3.19E 01 6,95E 00 16.014 9.68E-15 14 2.0800 2.94E 01 6,86E 00 14.754 1.76E-13 14 2,0900 2.83E 01 5,59E 00 14.213 6,13E-13 13 2.1000 2.58E 01 5,27E 00 12.954 1,11E-11 13 2.1100 2.40E 01 5.14E 00 12,023 9.49E-11 13 2,1200 2.25E 01 5,03E 00 11.262 5,47E-10 13 2,1300 2.11E 01 4.95E 00 10.604 2,49E-09 13 2,1400 2,07E 01 5,86E 00 10,389 4.08E-09 13 2,1500 1.90E 01 4,83E 00 9.545 2,85E-08 13 2,1600 1,83E 01 4,68E 00 9.188 6.48E-08 13 2,1700 1.78E 01 4,64E 00 8,906 1.24E-07 13 2,1800 1.74E 01 4,54E 00 8,727 1.88E-07 13 2,1900 1.71E 01 4.48E 00 8,579 2.63E-07 13 2,2000 1.70E 01 4.41E 00 8.522 3.01B-07 13 2,2100 1.70E 01 4,23E 00 8,545 2.85E-07 13 2,2200 1.72E 01 4.20E 00 8.606 2,48E-07 13 2,2300 1.75E 01 4,oeE 00 8,756 1,75E-07 13 2,2400 1.75E 01 3.96E 00 8,764 1.72E-07 13
73

TABLE A-4. (continued)
LAMBDA (pw) ALPHA
2,2500 2,2600 2,2700 2,2800 2,2900 2,3000 2,3100 2,3200 2,3300 2,3400 2.3500 2,3600 2,3700 2.3800 2,3900 2.4000 2.4100 2.4200 2,4300 2.4400 2.4500 2.4600 2.4700 2.4800 2.4900 2.5000 2.5126 2.5253 2.5381 2.5510 2.5641 2.5773 2.5907 2.6042 ?.6178 2.6316 2.6455 2.6596 2.6738 2.6882 2.7027 2.7174 2.7322
to 3.2468
1.85E 01 1.92E 01 2.00B 01 2.12E 01 2,24E 01 2,39E 01 2,53E 01 2.70E 01 2,79E 01 3,02E 01 3.27E 01 3.55E 01 3.85E 01 4.17E 01 4.56E 01 4.80E 01 5.13E 01 5.63E 01 6.00E 01 6.64E 01 7.04E 01 7.42E 01 7.91E 01 8.33E 01 8.88E 01 8.98E 01 1.24E 02 1.28E 02 1.30E 02 1.33E 02 1.52E 02 1.57E 02 1.65E 02 1.75E 02 1.91E 0? 2.141 0? 2.50E 02 3.39E 02 4.83E 02 6.15E 02 9.90E 02 1.57E 03
>2.00E 03
SD
3.88E 00 3,77E 00 3,69E 00 3.54E 00 3.42E 00 2.99E 00 3.39E 00 3.88E 00 5.19E 00 4.98E 00 5.09E 00 5.00E 00 5.07E 00 4.81E 00 5.43E 00 4,63E 00 5.32E 00 4,75E 00 5.15E 00 8,14E 00 6.40E 00 6,98E 00 9.01E 00 1,13E 01 1.30E 01 1,70E 01 2.15E 01 2.14E 01 2.14E 01 2.08E 01 3.19E 01 2.94E 01 2.61E 01 2.48E 01 2.52E 01 2.55E 01 3.2SE 01 6.16E 01 9.78E 01 9.94E 01 2.62E 02 4.28E 02
OD ^
9,262 5.47E-08 9.649 2,24E-08
10,052 8,8/E-09 10,608 2,46E-09 11.236 5,81E-10 11.993 1.02E-10 12.700 2,00E-11 13.557 2.77E-12 13.972 1.07E-12 15.129 7.44E-14 16.397 4.01E-15 17.807 1.56E-16 19.287 5,17E-18 20.922 1.20E-19 22.880 1.32E-21 24.074 8.43E-23 25.715 1.93E-24 28.215 6.10E-27 30.094 8,05E-29 33.293 5.10E-32 35.321 4.78E-34 37.213 6,12E-36 39.683 2,07E-38 41.752 1.77E-40 44.516 3.05E-43 45.024 9,47E-44 62.431 3.70E-61 64.029 9.35E-63 65.106 7.83E-64 66.721 1.90E-65 76.033 9.26E.75 78.771 1.69E-77 82.726 l^ffl^l 87.751 1.78E-86 95.820 1.51E-94 >100 mmmm
>100 -rmmm
>100 —mm
>10O mmmm
>10O mmmm
>100 mmmm
>100 mmmm
>100 mmmm
NO.
13 13 13 13 13 13 13 13 14 14 14 14 13 13 13 13 13 13 13 12 12 12 12 12 12 12 9 9 9 9
12 12 12 12 12 12 12 12 12 10 10
6
>100
74
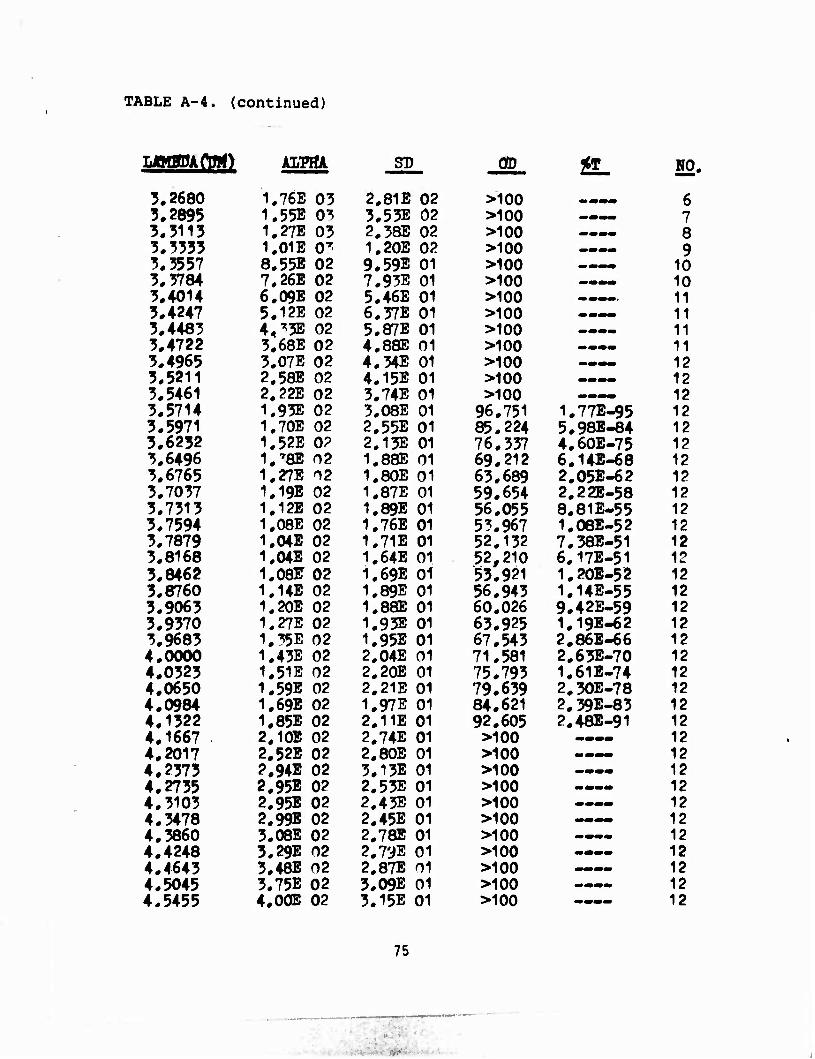
TABLE A-4. (continued)
IMSDSkCOA) ALPHA STD
3,2680 1.76E 03 2.81E 02 5.2895 1.55E 0^ 5.55E 02 3,5113 1.27E 03 2.38E 02 3.3333 1.01E 0' 1.20E 02 3.3557 8.55E 02 9.59E 01 3.3784 7.26E 02 7.93E 01 3.4014 6.09E 02 5.46E 01 3.4247 5.12E 02 6.37E 01 3.4483 4^3E 02 5.87E 01 3.4722 5.68E 02 4,88E 01 3.4965 5.07E 02 4.54E 01 3.5211 2.58E 02 4.15E 01 3.5461 2#22E 02 3.74E 01 3.5714 1.95E 02 3.08E 01 3.5971 1.70E 02 2.55E 01 3.6252 1.52E 0? 2.13E 01 3.6496 I.'SE 02 I.SSE 01 3.6765 1.27E 02 1.80E 01 3.7037 1.19E 02 1.87E 01 3.7513 1.12E 02 1,89E 01 5.7594 1.08E 02 1.76E 01 5.7879 1.04E 02 1.71E 01 5.8168 1.04E 02 1.64E 01 5.8462 1.08E 02 1.69E 01 5.8760 1,14E 02 1.89E 01 5.9065 1.20E 02 1.88E 01 5.9570 1.27E 02 1.93E 01 3.9685 1.35E 02 1.95E 01 4.0000 1.43E 02 2.04E 01 4.0525 1.51E 02 2.20E 01 4.0650 1.59E 02 2,21E 01 4.0984 1.69E 02 1.97E 01 4.1522 1.85E 02 2.11E 01 4.1667 2.1ÖE 02 2.74E 01 4.2017 2.52E 02 2.80E 01 4.2575 2.94E 02 5.15E 01 4.2755 2.95E 02 2.55E 01 4.3103 2.9bE 02 2,43E 01 4.3478 2.99E 02 2.45E 01 4.3860 5.08E 02 2.78E 01 4.4248 5.29E 02 2.7'iE 01 4.4643 5.48E 02 2,87E 01 4.5045 5.75E 02 3.09E 01 4.5455 4.0ÖE 02 5.15E 01
OP
>100 >100 >100 >100 >100 >100 >100 >100 >100 >100 >100 >100 >100
96.751 85.224 76.557 69.212 65.689 59.654 56.055 53.967 52.132 52,210 53.921 56.943 60.026 65.925 67.543 71.581 75.795 79.659 84.621 92.605 >100 >100 >100 >100 >100 >100 >100 >100 >100 >100 >100
1.77E-95 5.98E-84 4.60E-75 6.14E-68 2.05E-62 2.22E-58 8.81E-55 1.08E-52 7.58E-51 6.17E-51 1.20E-52 1.14E-55 9.42E-59 1.19E-62 2.86E-66 2.65E-70 1.61E-74 2.50E-78 2. 39E-83 2.48E-91
NO.
6 7 8 9
10 10 11 11 11 11 12 12 12 12 12 12 12 12 12 12 12 12 12 12 12 12 12 12 12 12 12 12 12 12 12 12 12 12 12 12 12 12 12 12
75
. —
TABLE A-4. (continued)
UMBPA(W) AXTHA SB tfD
4.19E 02 3.39E 01 4.5872 >100 4.6296 4.41E 02 4.20E 01 >100 4.6729 4.43E 02 3.67E 01 >100 4.7170 4.38E 02 3.77E 01 >100 4.7619 4.34E 02 3.85E 01 >100 4.8077 4.17E 02 3,58E 01 >100 4.8544 3.96E 0? 3.46E 01 >100 4.9020 3.70E 02 3.55E 01 >100 4.9505 3.45E 02 3.61E 01 >100 5.0000 3.25E 02 3.67E 01 >100 5.0251 3.09E 02 4.13E -»1 >100 5.0505 3.01E 02 4.05E 01 >100 5.0761 2#92E 02 3.83E 01 >100 5.128? 2.80E 02 3.51E 01 >100 5.1546 2#74E 02 3.27E 01 >100 5.1813 2.71E 02 3.22E 01 >100 5.2083 2.67E 02 3.01E 01 >100 5.2356 2.64E 02 3.oaE 01 >100 5.2632 2#61E 0? 2.91E 01 >100 5.2910 2.60E 0? 2.67E 01 >100 5.3191 2#61E 02 2.65E 01 >100 $.3476 2#63E 02 2.71E 01 >100 5.3763 2.65E 02 2.66E 01 >100 5.4054 2.70E 02 2,56E 01 >100 5.4348 2.77E 02 2,66E 01 >100 5.4645 2.85E 02 2.65E 01 >100 5.4945 2.96E 02 2.63E 01 >100 5.5249 3.13E 02 2,71E 01 >100 5.5556 3.37E 02 2.74E 01 >100 5.5866 3.63E 02 3.09E 01 >100 5.6180 3.94E 02 4.02E 01 >100 5.6497 4.42E 02 4.37E 01 >100 5.6818 4.94E 02 5.10E 01 >100 5.7143 5.72E 02 7.46E 01 >100 5.7471 6.57E 02 6.70E 01 >100 5.7803 7.77E 02 9.94E 01 >100 5.8140 1.07E 03 2.34E 02 >100 5.8480 1.43E 03 3.01E 02 >100 5.8824 1.76E 03 3.36E 02 >100 5.9172 2.39E 03 4.22E 02 >100 5.9880 2.47E 03 4,72E 02 >100 6.0976 2.25E 03 4,07E 02 >100 6,1350 2.06E 03 3.64E 02 >100 6.1728 1.79E 03 2.10E 02 >100
!!_ NO.
12 12 1? 12 12 12 12 12 12 12 12 12 12 12 12 12 12 12 12 12 12 12 12 12 12 12 12 12 12 12 12 12 11 11 10 10 10 9 5 2 2 3 5 5
76
. .
TABLE A-4. (continued)
jjaaoicpn) Asm
6.?112 6.2500 6.289? 6.^291 6.3694 6.4103 6.4516 6.4935 6.5359 6.5789 6.6225 6.6667 6.7114 6.7568 6.8027 6.8493 6.8966 6.9444 6.9930 7.0423 7.0922 7.1429 7.1942 7.2464 7.2993 7.3529 7.4074 7.4627 7.5188 7.5758 7.6336 7.6923 7.7519 7.8125 7.8740 7.9365 8.0000 8.0645 8.1301 8.1967 8.2645 8.3333 8.4034 8.4746 8.5470
1.56E 03 1.47E 03 1.19E 03 1.11E 03 9.14E 02 8.21E 0? 7.79E 02 7.38E 02 7.25E 0? 7.10E 02 7.00E 02 6.90E 0? 6.78E 02 6.67E 02 6.57E 02 6.53E 02 6.47E 02 6.43E 02 6.40E 02 6.42E 02 6.44E 02 6.45E C2 6.46E 02 6.47E 02 6.4'7E 02 6.48E 02 6.39E 02 6.33E 0? 6.30E 0? 6.26E 02 6.20E 02 6.16E 02 6.12E 02 6.10E 02 6.06E 02 6.05E 02 6.05E 02 6.0?E 02 6.02E 02 6.03E 02 6.02E 02 6.01E 02 6.02E 02 6.09E 02 6.07E 02
su
1.82E 02 3.22E 02 1.58E 02 2.32E 02 1.07E 02 7.32E 01 6.70E 01 5.26E 01 5.49E 01 5.86E 01 5.91E 01 5.77E 01 5.61E 01 5.21E 01 4.98E 01 4.99E 01 4.75E 01 4.49E 01 4.58E 01 4.59E 01 4.61E 01 4.56E 01 4.64E 01 4.87E 01 4.92E 01 4.91E 01 5.08E 01 5.26E 01 5.38E 01 5.35E 01 5.57E 01 5.51E 01 5.48E 01 5.37E 01 5,32E 01 4.99E 01 4.84E 01 4.67E 01 4.10E 01 3.88E 01 3.97E 01 3.91E 01 4.12E 01 4.63E 01 4.86E 01
0D
>100 >100 >100 >100 >100 >100 >100 >100 >100 >100 >100 >100 >100 >100 >100 >100 >100 >100 >100
t3L
>1Ö(5~ >100 >100 >100 >100 >100 >100 >100 >100 >100 >100 >100 >100 >100 >100 >100 >100 >100 >100 >100 >100 >100 >100 >100 >100 >100
NO.
6 8 8
10 10 10 10 10 10 10 10 10 10 10 10 10 10 10 10 10 10 10 10 10 10 10 10 10 10 10 10 10 10 10 10 10 10 10 10 10 10 10 10 10 10
77
. •. ■
TABLE A-4. (continued)
zMBBigmi ACTHA
8#6?07 8.6957 8.7719 8.8496 8.9?86 9.0090 9.0909 9,1743 9.2593 9.3458 9.4340 9.5238 9.6154 9.7087 9.8079 9.9010
10.0000 10.1010 10.2041 10.3093 10.4167 10.5263 10.6383 10.7527 10.8696 10.9890 11.1111 11.2360 11.3636 11.4943 11.6279 11.7647
to 15.0000
6.08E 0? 6.09E 02 6.12E 02 6.09E 02 6.11E 02 6.08E 0? 6.08E 02 6.12E 02 6.17E 02 6.22E 0? 6.29E 02 6.^7E 0? 6,4aE 02 6.64E 02 6.83E o? 7.01E 02 7.24E 0? 7.50E 02 7.88E 02 8.39E 02 9.04E 02 9.59E 02 1.03E 03 1.14E 03 1.26E 03 1.41E 03 1.67E 03 1.59E 03 1.83B 03 2.19E 03 2.54E 03
>2.70E 03
SD
5.29E 01 5.40E 01 5.48E 01 5.48E 01 5.77E 01 5.82E 01 5.95E 01 5.90E 01 5.67E 01 5.34E 01 5.10E 01 4.75E 01 4.24E 01 3.67E 01 3.82E 01 4.09E 01 4.05E 01 4.20E 01 6.29E 01 8.74E 01 1.26E 02 1.07E 02 1.19E 02 1.54E 02 1.86E 02 2.47E 02 4.83E 02 1.391 02 1.75E 02 ?.93E 02 1.34E 02
m
>100 >100 >100 >100 >100 >100 >100 >100 >100 >100 >100 >100 >100 >100 >100 >100 >100 >100 >100 >100 >100 >100 >100 >100 >100 >100 >100 >100 >100 >100 >100 >100
>100
a. NO.
10 10 10 10 10 10 10 10 10 10 10 10 10 10 10 10 10 10 10 10 10 9 9 9 9 9 8 6 6 6 4
78

TABLE A-5. DISTILLED WATER
LAKBPAfpH) ALPHA SD OD NO.
.2000 4.13E-01 3.03E-01 .332 4.66E 01 14
.2050 3.04E-01 2,14E-01 .244 5.70E 01 14
.2100 2.53E-01 1.79E-01 .204 6.26B 01 14
.2150 2.36E-01 1.44E-01 .189 6,47E 01 14
.2200 2.12E-01 1.09E-01 .170 6.76E 01 U
.2250 1.83E-01 9.04E~02 .147 7.13E 01 14
.2300 1,47E-01 7.23E-02 .118 7.62E 01 H
.2350 1.0QE-01 5.43E-02 .081 8.31E 01 U
.2400 8.69E-02 4.66E-02 .070 8.52E 01 14
.2450 7.98E-02 4.30E-02 .064 8.63E 01 U
.2500 7.UE-02 4.27E-02 .057 8.76E 01 14
.2550 6.47E-02 3.8aE-^2 .052 8.87E 01 14
.2600 7.34E-02 3.57E-02 .059 8.73E 01 14
.2650 8,67E-02 4.13E-02 .070 8.52E 01 14
.2700 1.02E-01 5.05E-02 .082 8.28E 01 14
.2750 1.12E-01 5.86E-02 .090 8.13E 01 14
.2800 1,18E-01 6.32E-02 .095 8.04E 01 14
.2850 1.12E-01 5.95E-02 .090 8.13E 01 U
.2900 1.07E-01 5.99E-02 .086 8.20E 01 14
.2950 8,98E-02 4,R2E-02 .072 8.47E 01 14
.3000 8,31E-02 4.baE-02 .067 8.57E 01 14
.3050 5.71E-02 2.67B-02 .046 9.0QE 01 U
.3100 6.00E-02 4.80E-02 .048 8.95E 01 14
.3150 3.56E-02 2.62E-02 .029 9.36E 01 14
.3200 2.37E-02 1.82E-02 .019 9.57E 01 U
.3250 2,09E-02 1.81E-02 .017 9.62E 01 14
.3300 2.11E-02 2.17E-02 .017 9.62B 01 14
.3350 1.67E-02 1.76E-02 .013 9.70E 01 14
.3400 1.81E-02 2.16E-02 .015 9.67E 01 14
.3450 1.68E-02 2.10S-02 .015 9.69E 01 U
.3500 5.46E-03 4.53E-03 .004 9.90E 01 U
.3550 4.95E-03 4.13E-03 .004 9.91E 01 U
.3600 3.92E-03 3.50E-03 .003 9.93E 01 U
.3650 3.86E-03 3.42E-03 .003 9.93E 01 14
.3700 3.41E-03 3.22E-03 .003 9.94E 01 U
.3750 3.96E-03 3.53E-03 .003 9.93E 01 14
.3800 3.75E-03 3.45E-03 .003 9.93B 01 14
.3850 3.80E-03 3.52B-03 .003 9.93E 01 14
.3900 3.58E-03 3.39E-03 .003 9.93B 01 14
.3950 3.49E-03 3.35E-03 .003 9.94B 01 14
.4000 3.36E-03 3.23E-03 .003 9.94B 01 14
.4050 3.32E-03 3.27E-03 .003 9.94E 01 U
.4100 3.05E-03 3.13E-03 .002 9.94B 01 14
7Q
■
- .-. ■

TABLE A-5. (continued)
LmBDA'(pW) ALPHA SD OD fiL NO.
.4150
.4200
.4250
.4300
.4350
.4400
.4450
.4500
.4550
.4600
.4650
.4700
.4750
.4800
.4850
.4900
.4950
.5000
.5050
.5100
.5150
.5200
.5250
.5300
.5350
.5400
.5450
.5500
.5550
.5600
.5650
.5700
.5750
.5800
.5850
.5900
.5950
.6000
.6050
.6100
.61 ~0
.6200
.6250
3.09E-03 2.70E-03 2.38E-03 2.09E-03 2.29E-03 1.92B-03 1.97E-03 1.93E-03 1.71E-03 1.42E-03 1.37E-03 1.87E-03 1.33E-03 1.50E-03 1.69E-03 1.69E-03 1.84E-03 1.83E-03 1.52E-03 1.63E-03 1.47E-03 1.44E-03 1.21E-03 1.34E-03 1.48E-03 1.76E-03 1.30E-03 1.68E-0^ 2.20E-03 1.57E-03 1.97E-03 1.74E-03 1.98E-03 1.49E-03 1.89E-03 3.05E-03 7.22E-03 4.31E-G3 4.60E-03 4.23E-03 3.28E-03 3.86E-03 3.66E-03
3.14B-03 2.9aE-03 2.81E-03 2.73E-03 2.84E-03 2.75E-03 2,62E-03 2.59E-03 2.30E-03 2.19E-03 2.07E-03 2.53E-03 2.34E-03 2.29E-03 2.34E-03 2.28E-03 2.42E-03 2.36E-03 2.41E-03 2.16E-03 2.33E-03 2.25E-03 2.19E-03 2.40E-03 2.36E-03 2.70E-03 2.23E-03 2.4>E-03 2.63E-03 2.47E-03 2.61E-03 2.12E-03 2.UE-05 1.81E-03 1.92E-03 2.48E-03 1.41E-02 2.69E-03 2,66E-03 1.83E-03 2.76E-03 2.16E-05 2,16B-03
.002
.002 ,00? .002 .002 .002 .002 .002 .001 .001 .001 .002 .001 .001 .001 .001 .001 .001 .001 .001 .001 .001 .001 .001 .001 .001 .001 .001 .002 .001 .002 • 001 .002 .001 .002 .002 .006 .003 .004 .003 .003 .003 .005
9.94E 01 9.95E 01 9.96E 01 9.96E 01 9.96E 01 9.96E 01 9.96E 01 9.96E 01 9.97E 01 9.97E 01 9.97E 01 9.97E 01 9.98E 01 9.97E 01 9.97E 01 9.97E 01 9.97E 01 9.97E 01 9.97E 01 9.97E 01 9.97E 01 9.97E 01 9.98E 01 9.98E 01 9.97E 01 9.97E 01 9.98E 01 9.97E 01 9.96E 01 9.97E 01 9.96E 01 9.97E 01 9.96E 01 9.97E 01 9.97E 01 9.94E 01 9.87E 01 9.92E 01 9.92E 01 9.92E 01 9.94E 01 9.93E 01 9.93E 01
14 14 14 14 14 14 14 14 14 14 14 14 14 14 14 14 14 14 14 14 14 14 14 14 14 14 14 14 14 14 14 14 14 14 14 14 14 14 14 12 14 14 14
80
TABLE A-5. (continued)
LAMBDA(IJM) ALPHA SD OD jtf NO.
.6300 3.89E-03 2,??E-03 .003 9.93E 01 U
.6350 3.64E-03 1.98E-05 .003 9.93E 01 14
.6400 3.82E-03 1.91E-03 .003 9.93E 01 14
.6450 4.10E-03 2.00E-03 .003 9.92E 01 14
.6500 4.19E-03 2.13E-03 .003 9.92E 01 U
.6550 7.85E-03 1.4ÖE-02 .006 9.86E 01 U
.6600 4.87B-03 1.8SE-03 .004 9.91E 01 14
.6650 5.43E-03 2.11E-03 .004 9.90E 01 14
.6700 5.25E-03 2.10E-03 .004 9.90E 01 14
.6750 5.33E-03 2.01E-03 .004 9.90E 01 14
.6800 5.61E-03 2.05E-03 .005 9.90E 01 14
.6850 5.98E-03 2.05E-03 .005 9.89E 01 U
.6900 6.39E-03 2.07E-03 .005 9.8aE 01 14
.6950 6.43E-03 1.93E-03 .005 9.8aE 01 U
.7000 6.89E-03 1.85E-03 .006 9.87E 01 14
.7050 7.62E-03 1.68E-03 .006 9.86E 01 14
.7100 8.73E-03 1.79B-0? .007 9.84E 01 14
.7150 1.02E-02 1.73E-03 .008 9.81E 01 14
.72C0 1.27E-02 1.64E-03 .010 9.77E 01 14
.7250 1.56E-02 1.64E-03 .013 9.72E 01 14
.7300 2.01E-02 1.06E-03 .016 9.64E 01 14
.7350 2.56E-02 1.28E-03 .021 9.54E 01 14
.7400 2.82E-02 1 .a7E-03 .023 9.49E 01 14
.7450 2.85E-02 1.98E-03 .023 9.49E 01 14
.7500 2,81 E-02 2.08E-03 .023 9.49E 01 14
.7550 2.77E-02 1.81E-03 .022 9.50E 01 14
.7600 2,75B-02 1.99E-03 .022 9.50E 01 14
.7650 2.72E-02 2.11E-03 .022 9.51E 01 14
.7700 2,66E-02 1.8SB-03 .021 9.52E 01 14
.7750 2.6221?-02 2.38E-03 .021 9.53E 01 14
.7800 2.52E-02 1.84E-03 .020 9.54E 01 14
.7850 2,36E-02 1.85E-03 .019 9.57E 01 14
.7900 2.24E-02 1.71E-03 .018 9.59E 01 14
.7950 2.12E-02 1.47E-03 .017 9.62E 01 14
.8000 2.0QE-02 2.49E-03 .016 9.64E 01 14
.8100 2.90B-02 3.63E-03 .023 9.48B 01 19
.8200 3.23E-02 2.93E-03 .026 9.42E 01 19
.8300 4.36B-02 2.76E-03 .035 9.23E 01 19
.8400 4.81 E-02 2,86E-03 .039 9.15E 01 19
.6500 5.03E-02 2.94E-03 .040 9.11E 01 19
.8600 5.24E-02 2.85E-03 .042 9.08E 01 19
.8700 5.64E-02 2.28E-03 .045 9.01E 01 19
.8800 6.21 E-02 2.24B-03 .050 8.91E 01 19
.8900 6.74 E-02 2.31E-Q3 .054 8.83E 01 19
81
wmmfmmmmmm*
TABLE A-5. (continued)
LAMBDA fpW) ALPHA SD OD NO.
.9000 7.20E -02 3.54E-03 .058 8.75E 01 19
.9100 8.75E -02 1.62E-02 .070 8.51E 01 17
.9200 1.09E -01 2.08E-02 .088 8.17E 01 17
.9300 1.57E -01 1.74E-02 .126 7.48E 01 17
.9400 2.33E -01 2.18E-02 .187 6.50E 01 17
.9500 3.52E -01 2,271-02 .283 5.21E 01 17
.9600 5.11E -01 2.24E-02 .411 3.88E 01 17
.9700 5.27E -01 1.76E-02 .424 3.77E 01 17
.9800 5.15E -01 1.75E-02 .414 3.86E 01 17
.9900 4.73E -01 1.82E-02 .380 4.17E 01 17 1.0000 4.13E -01 1.61E-02 .332 4.65E 01 17 1.0100 3.60E. -01 2.30E-02 .289 5.14E 01 17 1.0200 2.96E. -01 1.47E-02 .238 5.78E 01 17 1.0300 2.44E. -01 1.49E-02 .196 6.37E 01 17 1.0400 2.04E. -01 1.81E-02 .164 6.85E 01 17 1.0500 1.79E. -01 1.97E-02 .144 7.18E 01 17 1.0600 1.63E. -01 2.28E-02 ,131 7.40E 01 17 1.0700 1.66E. -01 2.20E-02 .134 7.35E 01 17 1.0800 1.74E. -01 2.10E-02 .140 7.24E 01 17 1.0900 2.01 E. -01 1.94E-02 .161 6.89E 01 17 1.1000 2.26E. -01 2.33E-02 .181 6.59E 01 17 1.1100 2.61E. -01 2.73E-02 .209 6.1^ 01 17 1.1200 3.05E. -01 1.97E-02 .245 5.681? 01 17 1.1300 4.27E. -01 1.15E-02 .343 4.54E 01 17 1.1400 7.57E. -01 1.79E-02 .608 2.47E 01 17 1,1500 1.13E 00 2.68E-02 .910 1.23E 01 17 1.1600 1.25E 00 2.50E-02 1,004 9.91E 00 17 1.1700 1.26E 00 2.61E-02 1.015 9.66E 00 17 1.1800 1.27E 00 2.50E-02 1.023 9.48E 00 17 1.1900 1.28E 00 2.50E-02 1.032 9.29E 00 17 1.2000 1.27E 00 2.86E-02 1.017 9.63E 00 17 1.2100 1.22E 00 1.5RE-02 .977 1.05E 01 13 1.2200 1.19E 00 2.74E-02 .959 1.10E 01 17 1.2300 1.15E 00 2.78E-02 .925 1.19E 01 17 1.2400 1.12E 00 2.41 E-02 .897 1.27E 01 17 1.2500 1.08E 00 2.46E-02 .871 1.35E 01 17 1.26 00 1.07E 00 1.89E-02 .863 1.37E 01 17 1.2700 1.09B 00 1.86E-02 .875 1.34E 01 17 1.2800 1.14E 00 1.91E-02 .912 1.22E 01 17 1.2900 1.23E 00 2.19E-02 .990 1.02E 01 17 1.3000 1.38E 00 2.9^-02 1.108 7.79E 00 17 1.3100 1.59E 00 8.03E-02 1.278 5.2aE 00 17 1.3200 2.03E 00 1.73E-01 1.631 2.34E 00 16 1.3300 2.51E 00 2.13E-01 2.019 9,58E-01 16 1.3400 3.06E 00 2.61E-01 2,462 3-4SE-Q1 16
82
■
TABLE A-5. (continued)
LAKBPAffffO ALPHA SB OB NO.
.3500
.3600
.3700
.3800
.3900
.4000
.4100
.4200
.4300
.4400
.4500
.4600
.4700
.4800
.4900
.5000
.5100
.5200
.5300
.5400
.5500
.5600
.5700
.5800
.5900
.6000
.6100
.6200
.6300
.6400
.6500 ,6600 .6700 .6800 .6900 .7000 .7100 .7200 .7300 .7400 .7500 .7600 .7700 .7800 .7900 .8000
5,4aE 00 4.10E 00 5.46E 00 7.18E 00 1.21E 01 1.91E 01 2,51B 01 2.87E 01 3.03E 01 3.13E 01 3.09E 01 3.04E 01 2.76E 01 2.54E 01 2.24E 01 1.98E 01 1.75E 01 1.56E 01 1.38E 01 1.23E 01 1.12E 01 1.01E 01 9.19E "0 8.41E 00 7.83E 00 7.36E 00 6.99E 00 6.63E 00 6.40E 00 6.17E 00 5.99E 00 5.90E 00 5.83E 00 5.81E 00 5*86E 00 5.97E 00 6.13E 00 6.36E 00 6.72E 00 7.19E 00 7.79E 00 8.44E 00 9.01E 00 9.42E 00 9.58E 00 9.59E 00
4.71E-01 4.35E-01 9.78E-01 8.83E-01 1.66E 00 1.98E 00 2.61 E 00 3.05E 00 3.72E 00 3.21E 00 5.B8E 00 3.09E 00 3.24E 00 2.56E 00 2.28E 00 1.93E 00 1.60E 00 1.41E 00 1#25E 00 1.13R 00 1.32E 00 1.16E 00 1.09E 00 8.71E-01 8.41E-01 8.25E-01 8.65E-01 7.95E-01 8.46E-01 7.90E-01 7.55E-01 7.98E-01 7.91 E-01 7.8aE-01 8.04E-01 8.15E-01 8.33E-01 8.23E-01 8.90E-01 9.16E-01 9.67E-01 9.81E-01 9.96E-01 9.67E-01 9.56E-01 9.55E-01
2.799 3.295 4.388 5.770 9.689
15.345 20.206 23.044 24.347 25.112 24.850 24.401 22.206 20.409 18.033 15.888 14.077 12.549 11.122 9.921 8.979 8.092 7.387 6.758 6.295 5.916 5.614 5.331 5.142 4.956 4.814 4.742 4.681 4.669 4.708 4.794 4.922 5.109 5.402 5.776 6.255 6.781 7.241 7.566 7.693 7.705
1.59E-01 5.07E-02 4.09E-03 1.70E-04 2.05E-08 4.51E-14 6.22E-19 9.03E-22 4.50E-23 7.72E-24 1.41E-25 3.97E-23 6.25E-21 3.90B-19 9.27E-17 1.30E-14 8.37E-15 2.83E-11 7.55E-10 1,20E-08 1.05E-07 8.10E-07 4.10E-06 1.74E-05 5.07E-05 1.21E-04 2.43E-04 4.67E-04 7.22E-04 1.11E-03 1.53E-03 1 .aiE-03 2.09E-03 2.14E-03 1.96B-03 1.61E-03 1.20E-03 7.79E-04 3.97E-04 1.68E-04 5.56E-05 1.66E-05 5.74E-06 2.71E-06 2.03E-06 1.97E-06
17 17 17 12 12 12 1 1 10 1 1 1 1 1 1 1 12 12 12 12 12 12 12 12 12 12 12 12 12 12 12 12 12 1? 12 14 14 14 14 14 14 14 14 14 14 15
■
TABLE A-5. (continued)
LAMBDA (pH) ALPHA
1.8100 1,8200 1.8300 1.8400 1.8500 1.8600 1,8700 1,8800 1,8900 1,9000 1,9100 1,9200 1,9300 1,9400 1,9500 1,9600 1,9700 1,9800 1,9900 2,0000 2,0100 2,0200 2,0300 2,0400 2,0500 2.0600 2,0700 2,0800 2,0900 2,1000 2,1100 2.1200 2,1300 2.1400 2,1500 2,160^ 2,1700 2.1800 2.1900 2.2000 2,2100 2.2200 2.2300 2,2400
9,62E 00 9,75B 00 1,00E 01 1,07E 01 1,22E 01 1,56E 01 2,35E 01 3.82E 01 6,48E 01 1,03E 02 1,1 IE 02 1,16E 02 1.15E 02 1,28E 02 1,05E 02 9,89E 01 9,03E 01 8.68E 01 7,51E 01 6,82E 01 6,19E 01 5.50E 01 5,00E 01 4,59E 01 4.19E 01 4,00E 01 3.69E 01 3,44E 01 3.10E 01 2.86E 01 2.69E 01 2.52E 01 2.38E 01 2.28E 01 2.21E 01 2.12E 01 2.06E 01 2.02E 01 1,99E 01 1.98E 01 1.98E 01 2.00E 01 2.02E 01 2.06E 01
SD 0D gT_ NO,
9.43E-01 7,727 1,8aE-06 15 1,02E 00 7.837 1,45E-06 15 1,04E 00 8,058 8,75E-07 15 1,10E 00 8.616 2.42E-07 15 1,35E 00 9.790 1,62E-08 15 1,50E 00 12,502 3.15E-11 15 2,69E 00 18,899 1,26E-17 15 7.88E 00 30,716 1.92E-29 15 1,50E 01 52,024 9,46E-51 11 1,84E 01 83.073 8.45E-82 8 3.25E 01 89.193 6.42E-88 7 3,27E 01 93,496 3,19E-92 7 3,29E 01 92,576 2.66E-91 7 3,21E 00 >100 5 2.12E 01 84.728 1,87E-83 7 1,52E 01 79.449 3,56E-78 8 1,27E 01 72.588 2.58E-71 8 1,89E00 69.765 1.72E-68 6 5,25E 00 60,345 4,52E-59 8 3,84E 00 54,819 1,52E-53 8 3,00E 00 49,718 1,91E-48 8 3,42E 00 44,152 7.04E-43 9 3,08E 00 40,201 6,30E-39 9 2,72E 00 36,895 1,27E-35 10 2,32E 00 33,691 2.04E-32 10 3,15E 00 32.168 6.7^-31 12 3.75E 00 29.625 2.^7E-28 12 3.10E 00 27.639 2.30E-26 12 3,04E 00 24,879 1,32E-23 16 2.42E 00 22.987 1,032-21 16 2.17E 00 21,642 2,28E-20 16 2,05E 00 20,249 5,64E-19 16 2,01E 00 19.154 7.01E-18 16 1.89E00 18.336 4.61E-17 16 1,70E 00 17,758 1.75E-16 16 1,75E 00 17,006 9,a7E-16 16 1,73E 00 16.525 2.9gE-15 16 1.64E 00 16.224 5.97E-15 16 1.63E 00 15,969 1,a7E-14 16 1,57E 00 15.904 1.25E-14 16 1.63E00 15.871 1.35E-14 16 1.62EC0 16,041 9.10E-15 16 1,71E 00 16,193 6.41E-15 16 1,73E 00 16,516 3,05E-15 16
84
■
TABLE A-5. (continued)
LJtKBPAQm) AIPHA SD OD NO.
2,2500 2,11E 01 1.70E 00 16,988 1,03E-15 16 2.2600 2,19E 01 1.76E 00 17.577 2,65E-16 16 2.2700 2,27E 01 1,57E 00 18,271 5.35E-17 16 2.2800 2,38E 01 I.89E 00 19.126 7.48E-18 16 2.2900 2,48E 01 2.21E 00 19.899 1.26E-18 16 2.3000 2,63E 01 2.28E 00 21.097 8.00E-20 16 2.3100 2,7aE 01 2.48E 00 22.367 4.30E-21 16 2,3200 3,04E 01 2.40E 00 24.428 3.73E-23 16 2.3300 3.21E 01 3.03E 00 25.762 1.73E-24 14 2.3400 3.42E 01 4.50E 00 27.486 3.27E-26 14 2.3500 3.73E 01 3.99E 00 29.993 1.02E-.28 14 2.3600 3.77E 01 4.19E 00 30.272 5.35E-29 13 2.3700 3.96E 01 3.77E 00 31.845 1.43E-30 12 2.3800 4.32E 01 5.27E 00 34.689 2.05E-33 12 2.3900 4.b7E 01 3,90E 00 36.699 2.00E-35 10 2.4000 4.97E 01 4.11E 00 39.908 1.24E-38 10 2.4100 5.42E 01 2,9138 00 43.513 3.07E-42 8 2.4200 5.86E 01 2.57E 00 47.064 8.62E-46 8 2.4300 6,22E 01 4.36E 00 49.946 1.13E-48 8 2.4400 6.97E 01 1.84E 00 55.967 1.08E-54 8 2.4500 7.37E 01 2.15E 00 59.205 6.23E-58 8 2.4600 7.71E 01 6.77E 00 61.924 1.19E-60 8 2.4700 8,39E 01 6.40E 00 67.443 3.60E-66 8 2.4800 8.64E 01 1.19B 01 69.405 5.94E-68 8 2.4900 9.81E 01 2.16E 00 78,805 1.57E-77 6 2.5000 9.79E 01 7.94E 00 78,630 2.34E-77 7 2.5126 1.14E 02 1.09E 01 91.913 1.22B-90 15 2.5253 1.18E 02 1.13E 01 94.799 1.59E-93 15 2.5381 1.20E 02 1.19E 01 96.357 4.39E-95 15 2.5510 1.21E 02 1.18E 01 96.947 1.13B-95 15 2.5641 1.22E 02 1.20E 01 97.878 1.32E-96 15 2.5773 1.25E 02 1.20E 01 >100 .... 15 2.5907 1.32E 02 1.28E 01 >100 .... 15 2.6040 1.41E 02 1.34E 01 >100 .... 15 2.6180 1.54E 02 1.63E 01 >100 .... 15 2.6316 1.72E 02 1.84E 01 >100 .... 15 2.6460 1.94E 02 2.11E 01 >100 .... 15 2.6596 2.35E 02 2.76E 01 >100 .... 15 2.6738 3.17E 02 3.56E 01 >100 .... 15 2.6882 4.13E 02 4.99E 01 >100 .... 15 2.7027 6,10E 02 1.35E 02 >100 .... 15 2.7174 1.05E 03 2.28E 02 >100 .... 15 2.7322 1.99E 03 4.54E 02 >100 .... 12 2.7473 3.22E 03 7.72E 02 >100 .... 10 2.7624 4.8SE 03 2.03E 03 >100 15
85

TABLE A-5. (continued)
ALPHA SD OD
2.7778 5.41E 03 2.31E 03 >100 2.7933 5.65E 03 2.13E 03 >100 2.8090 5.99E 03 1.79E 03 >100 2.8249 6.80E 03 1.13E 03 >100 2.8409 8.07E 03 1.35E 03 >100 2.8571 1.06E 04 4.19E 02 >100 2.8736 1.21E 04 6.41E 02 >100 2.8902 1.48E 04 1.01E 03 >100 2.9070 1.61E 04 1.49E 03 >100 2.9240 1.71E 04 1.66E 03 >100 2.9412 1.77E 04 2.17E 03 >100 2.9586 1.71E 04 2.58E 03 >100 2.9762 1.64E 04 2.55E 03 >100 2.9940 1.492 04 2.09E 03 >100 3.0120 1.31E 04 2.27E 03 >100 3.0303 1.21E 04 2.72E 03 >100 3.0488 1.00E 04 2.38E 03 >100 3.0675 9.00E 03 1.99E 03 >100 3.0864 8.20E 03 2.16E 03 >100 3.1056 6.92E 03 2.08E 03 >100 3.1250 5.83E 03 1.64E 03 >100 3.1447 8.09E 03 2.06E 03 >100 3.1646 6.3aE 03 1.04E 03 >100 3.1847 4.93E 03 4.87E 02 >1C)0 3,2051 4.07E 03 3.66E 02 >100 3.2258 3.46E 03 4.75E 02 >100 3.2468 2.73E 03 3.52E 02 >100 3.2680 2.26E 03 2.03E 02 >100 3.2895 1.89E 03 1.59E 02 >100 3.3113 1.64E 03 1.74E 02 >100 3.3333 1.31E 03 1.04E 02 >100 3.3557 1.06E 03 1.07E 02 >100 3.3784 8.92E 02 6.69E 01 >100 3.4014 7.39E 02 6.64E 01 >100 3.4247 6.20E 02 6.01E 01 >100 3.4483 5.30E 02 5.02E 01 >100 3.4722 4.51E 02 3.90E 01 >100 3.4965 3.79E 02 3.06E 01 >100 3.5211 3.33E 02 5.01E 01 >100 3.5461 2.79E 02 2.56E 01 >100 3.5714 2.3RE 02 1.96E 01 >100 3.5971 2.09E 02 1.85E 01 >100 3.6232 1.82E 02 1.58E 01 >100 3.6496 1.65E 02 1.40E 01 >100
NO.
11 11 11 9 9 9 9 9
11 11 13 13 13 15 13 1 1 1 1 1 1 12 12 10 10 12 12 10 12 15 15 15 15 15 15 15 15 15 15 15 15 15 15 15
86
■•■
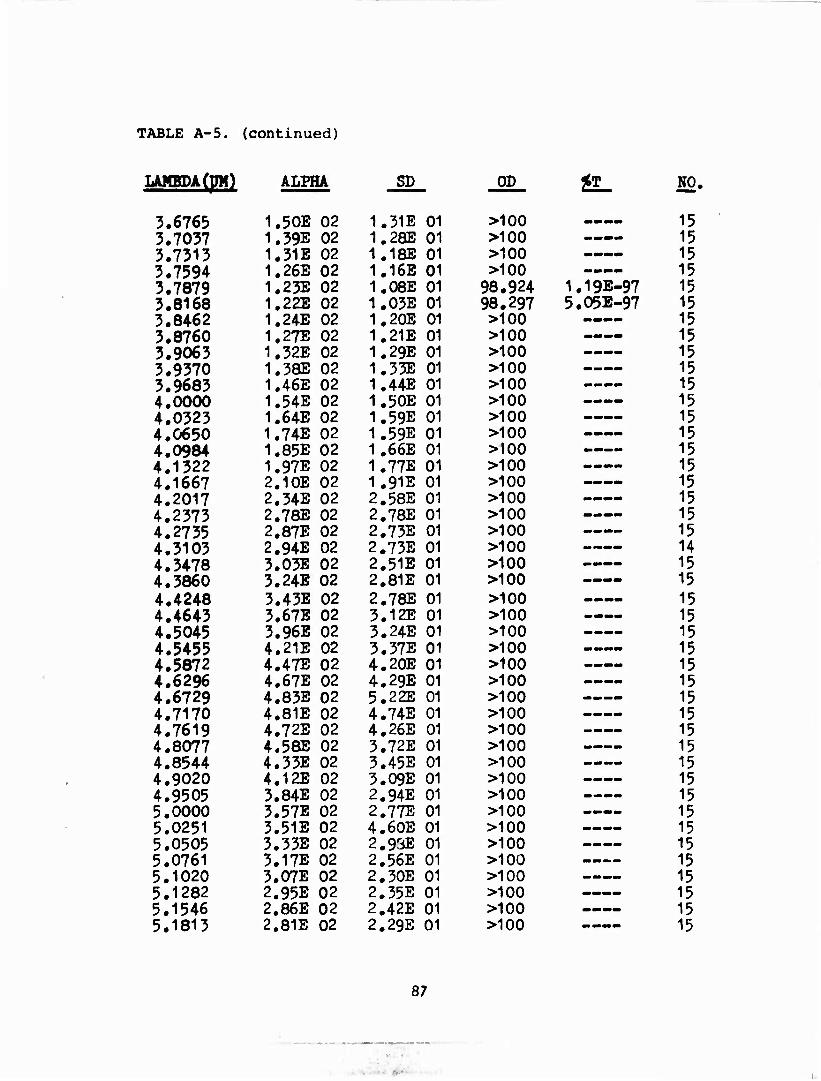
TABLE A-5. (continued)
LAMBDA (pM) ALPHA S3) OD NO.
5.6765 1.50E 02 1.31E 01 >100 15 3.7037 1.39E 02 1.2SE 01 >100 .... 15 3.7313 1.31E 02 1.18E 01 >100 .... 15 3.7594 1.26E 02 1.16E 01 >100 .... 15 3.7879 1,23E 02 1.08E 01 98.924 1.19E-97 15 3.8168 1.22E 02 1.03E 01 98.297 5.05E-97 15 3.8462 1.24E 02 1.20E 01 >100 .... 15 3.8760 1.27E 02 1.21E 01 >100 .... 15 3.9063 1.32E 02 1.29E 01 >100 .... 15 3.9370 1.38B 02 1.33E 01 >100 .... 15 3.9683 1.46E 02 1.44E 01 >100 .... 15 4.0000 1.54E 02 1.50E 01 >100 .... 15 4.0323 1.64E 02 1.59E 01 >100 .... 15 4.0650 1.74E 02 1.59E 01 >100 .... 15 4.0984 1.85E 02 1.66E 01 >I00 .... 15 4.1322 1.97E 02 1.77JS 01 >100 .... 15 4.1667 2.10E 02 1.91E 01 >100 .... 15 4.2017 2.34E 02 2.58E 01 >100 .... 15 4.2373 2.78E 02 2.78E 01 >100 .... 15 4.2735 2.87E 02 2.73E 01 >100 .... 15 4.3103 2.94E 02 2.73E 01 >100 .... 14 4.3478 3.03E 02 2.51E 01 >100 .... 15 4.3860 3.24E 02 2,81E 01 >100 .... 15 4.4248 3.43E 02 2.78E 01 >100 .... 15 4.4643 3.67E 02 3.12E 01 >100 .... 15 4.5045 3.96E 02 3.24E 01 >100 .... 15 4.5455 4.21E 02 3.37E 01 >100 .... 15 4.5872 4.47E 02 4.20E 01 >100 .... 15 4.6296 4.67E 02 4.29E 01 >100 .... 15 4.6729 4.85E 02 5.22E 01 >100 .... 15 4.7170 4.81E 02 4.74E 01 >100 .... 15 4.7619 4.72E 02 4.26E 01 >100 .... 15 4.8077 4.58E 02 3.72E 01 >100 .... 15 4.8544 4.33E 02 3.45E 01 >100 .... 15 4.9020 4.12E 02 3.09E 01 >100 .... 15 4.9505 3.84E 02 2.94E 01 >100 .... 15 5.0000 3.57E 02 2.77E 01 >100 .... 15 5.0251 3.51E 02 4.60E 01 >100 .... 15 5.0505 3.33E 02 2.93E 01 >100 .... 15 5.0761 3.17E 02 2.56E 01 >100 .... 15 5.1020 3.07E 02 2.30E 01 >100 .... 15 5.1282 2.95E 02 2.35E 01 >100 .... 15 5.1546 2.86E 02 2.42E 01 >100 .... 15 5.1813 2,81E 02 2.29E 01 >100 —.. 15
87
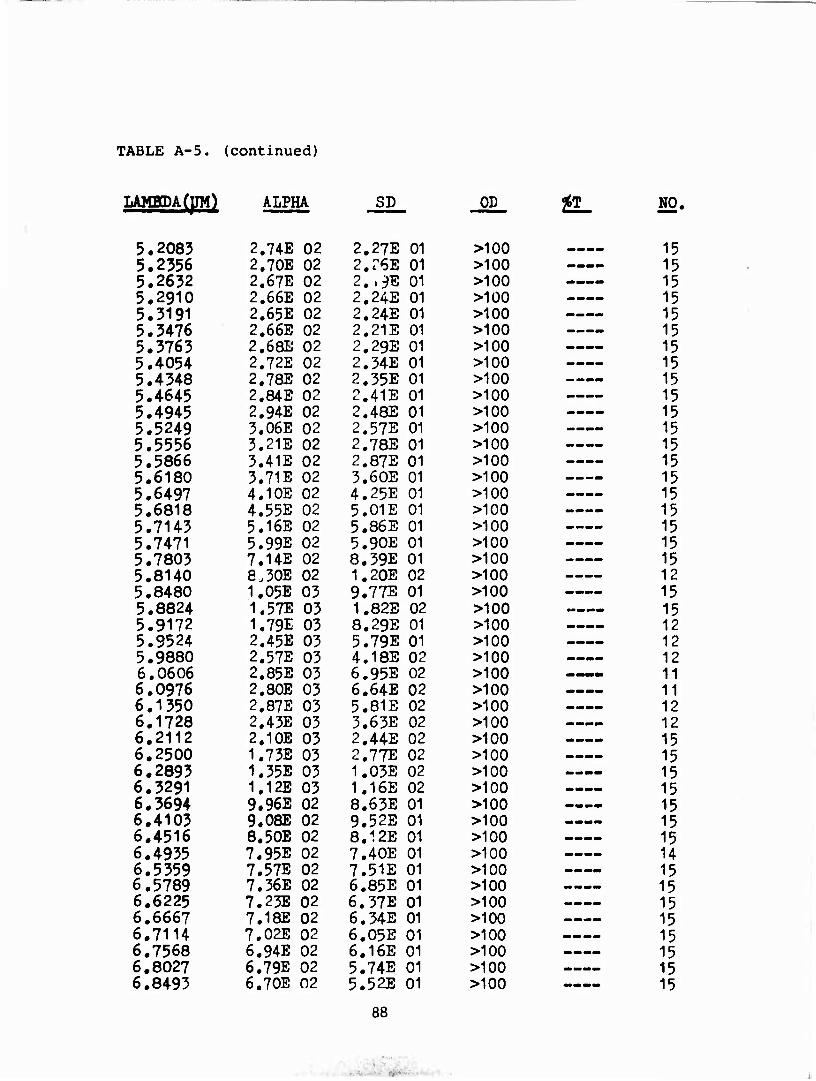
TABLE A-5. (continued)
ALPHA SD OP #P NO.
15 15 15 15 15 15 15 15 15 15 15 15 15 15 15 15 15 15 15 15 12 15 15 12 12 12 11 11 12 12 15 15 15 15 15 15 15 14 15 15 15 15 15 15 15 15
5.2083 2.74E 02 2.27E
■
01 >100 5.2356 2.70E 02 2.r6E 01 >100 5.2632 2.67E 02 2..9E 01 >100 5.2910 2.66E 02 2.24E 01 >100 5.3191 2.65E 02 2.24E 01 >100 5.3476 2.66E 02 2.21E 01 >100 5.3763 2.68E 02 2.29E 01 >100 5.4054 2.72E 02 2.34E 01 >100 5.4348 2.78E 02 2.35E 01 >100 5.4645 2.84E 02 2.41E 01 >100 5.4945 2.94E 02 2.48E 01 >100 5.5249 3.06E 02 2.57E 01 >100 5.5556 3.21E 02 2.78E 01 >100 5.5866 3.41E 02 2.87E 01 >100 5.6180 3.71E 02 3.60E 01 >100 5.6497 4.10E 02 4.25E 01 >100 5.6818 4.55E 02 5.01E 01 >100 5.7143 5.16E 02 5.86E 01 >100 5.7471 5.99E 02 5.90E 01 >100 5.7803 7.14E 02 8.39E 01 >100 5.8140 8.30E 02 1.20E 02 >100 5.8480 1.05E 03 9.77E 01 >100 5.8824 1.57E 03 1.82E 02 >100 5.9172 1.79E 03 8.29E 01 >100 5.9524 2.45E 03 5.79E 01 >100 5.9880 2.57E 03 4.18E 02 >100 6.0606 2.85E 03 6.95E 02 >100 6.0976 2.80E 03 6.64E 02 >100 6.1350 2.87E 03 5.81E 02 >100 6.1728 2.43E 03 3.63E 02 >100 6.2112 2,10E 03 2.44E 02 >100 6,2500 1,73E 03 2.77E 02 >100 6.2893 1.35E 03 1.03E 02 >100 6.3291 1,12B 03 1.16E 02 >100 6.3694 9.96E 02 8.63E 01 >100 6.4103 9.08E 02 9.52E 01 >100 6.4516 8.50E 02 8.12E 01 >100 6.4935 7.95E 02 7.40E 01 >100 6.5359 7.57E 02 7.51E 01 >100 6.5789 7.36E 02 6.85E 01 >100 6.6225 7.23E 02 6.37E 01 >100 6.6667 7.18E 02 6.34E 01 >100 6.7114 7.02E 02 6.05E 01 >100 6.7568 6.94E 02 6.16E 01 >100 6.8027 6.79E 02 5.74E 01 >100 6.8493 6.70E 02 5.52E 01 >100
88
•■ •

TABLE A-5. (continued)
LAMBDA tyM) ALPHA SD OD %T NO.
6.8966 6.65E 02 5.53E 01 >100 15 6.94U 6,60E 02 5.53E 01 >100 15 6.9930 6.57E 02 5.55E 01 >100 15 7.0423 6.50E 02 5.39E 01 >100 15 7.0922 6.46E 02 5.33E 01 >100 15 7.1429 6,41E 02 5.29E 01 >100 —— 15 7.1942 6.38E 02 5.29E 01 >100 15 7.2464 6.36E 02 5.22E 01 >100 15 7.3529 6,31E 02 5.31E 01 >100 15 7.4074 6.32E 02 5.37E 01 >100 15 7.4627 6,30E 02 5.33E 01 >100 15 7.5188 6,28E 02 5.31E 01 >100 15 7.5758 6.25E 02 5.17E 01 >100 15 7.'5336 6,2QE 02 5.00E 01 >100 15 7.6923 6,20E 02 5.15E 01 >100 15 7.7519 6,18E 02 5.19E 01 >100 15 7.8125 6,17E 02 5.?4E 01 >100 15 7.9365 6.13E 02 5.34E 01 >100 - 15 8.0000 6.09E 02 5.23E 01 >100 15 8.0645 6,08E 02 5.00E 01 >100 - 15 8.1301 6.041: 02 5.14E 01 >100 15 8.1967 6.01E 02 5.04E 01 >100 15 8.2645 5.96E 02 4.93E 01 >100 15 8,3333 5.92E 02 4.92E 01 >100 15 8.4034 5.97E 02 4.95E 01 >100 15 8.4746 5.94E 02 4.84E 01 >100 15 8.5470 5.92E 02 4.85E 01 >100 15 8.6207 5.87E 02 4.39E 01 >100 15 8.7719 5.79E 02 4.62E 01 >100 15 8.9286 5.85E 02 5.66E 01 >100 15 9.0090 5.67E 02 4.96E 01 >100 12 9.0909 5.69E 02 4.63E 01 >100 12 9.1743 5.73E 02 4.97E 01 >100 12 9.2593 5.74E 02 5.16E 01 >100 12 9.3458 5.76E 02 5.29E 01 >100 11 9.4340 5.79E 02 5.37E 01 >1G0 11 9.5238 5.82E 02 5.03E 01 >100 10 9.6154 6.04E 02 5.84E 01 >100 10 9.7087 6.31E 02 5.39E 01 >100 8 9.8039 6.37E 02 5.76E 01 >100 7 9.9010 6.41B 02 5.37E 01 >100 6
10.0000 6.42E 02 5.89E 01 >100 6 10.1010 g.69E 02 5.93E 01 >100 4 10.2041 6 82E 02 5.59E 01 >100 4 10.3093 7.27E 02 6.47E 01 >100 4
89
'''.''■ ■ ■

TABLE A-5. (continued)
ALPHA ST OD
10.4167 7.73E 02 6.89E 01 >100 10,5263 8.46S 02 7.67E 01 >100 10.6383 9.24E 02 7.83E 01 >100 10.7527 9.75E 02 8.95E 01 >100 10.8696 9.90E 02 9.03*! 01 >100 10.9890 1.06E 03 9.20B 01 >100 11.1111 1.20E 03 1.02E 02 >100 11,2360 1.351 03 1.13E 02 >100 11.3636 1.49B 03 1.131 02 >100 11.4943 1.50E 03 1.23E 02 >100 11.6279 1.61E 03 1.37E 02 >100 11.7647 1.85E 03 1.43E 02 >100 11.9048 1.91E 03 1.6QE 02 >100 12.0482 2.02E 03 1.85E 02 >100 12.1951 2.31E 03 2.08E 02 >100 12.3457
to 15.0000
>2.50E 03
n
>100
>100 n
a. NO.
90
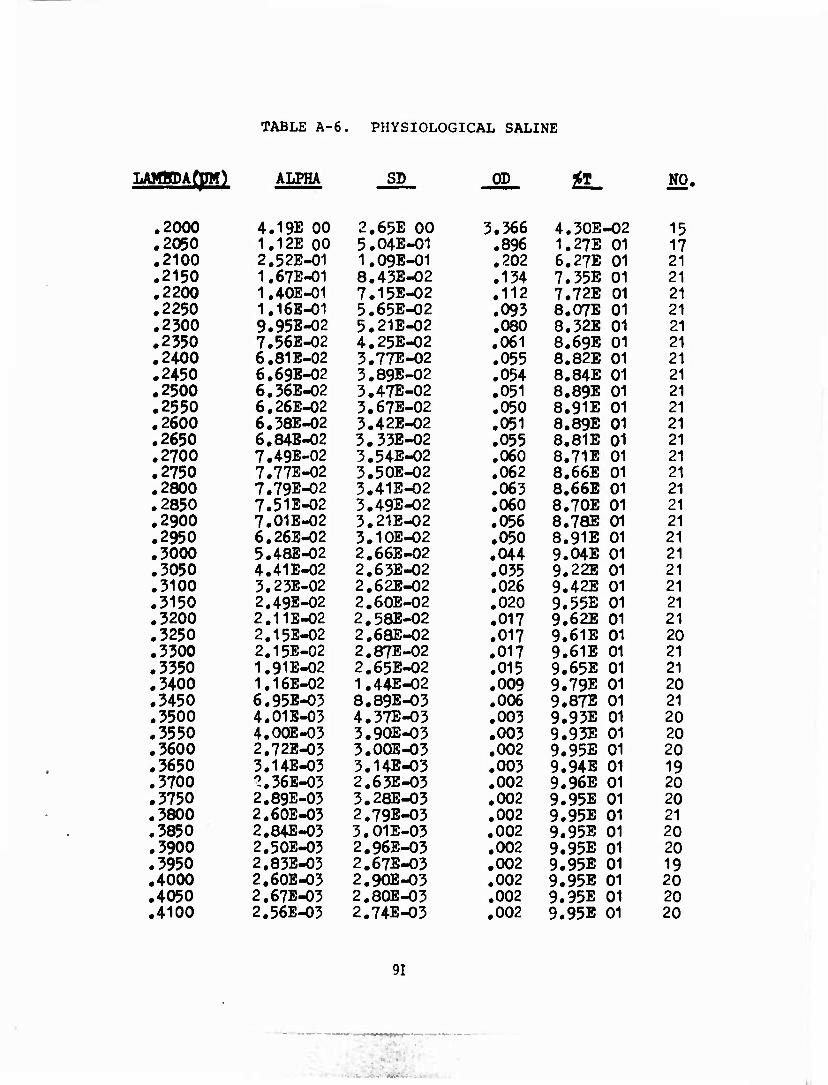
TABLE A-6. PHYSIOLOGICAL SALINE
ALPHA SB ÖD NO.
.2000 4.19E 00 2.65E 00 3.366 4.30E-02 15
.2050 1,12E 00 5.04E-01 .896 1.27E 01 17
.2100 2.52E-01 1.09E-01 .202 6.27E 01 21
.2150 1.67E-01 8.43E-02 .134 7.35E 01 21
.2200 1.40E-01 7.15E-02 .112 7.72E 01 21
.2250 1.16E-01 5.65E-02 .093 8.Ü7E 01 21
.2300 9.95E-02 5.21E-02 .080 8.32E 01 21
.2350 7.56E-02 4.25E-02 .061 8.69E 01 21
.2400 6.81E-02 3.77E-02 .055 8.82E 01 21
.2450 6.69E-02 3.89E-02 .054 8.84E 01 21
.2500 6.36E-02 3.47E-02 .051 8.89E 01 21
.2550 6.26E-02 3.67E-02 .050 8.91E 01 21
.2600 6.38E-02 3.42E-02 .051 8.89E 01 21
.2650 6.846-02 3.33E-02 .055 8.81E 01 21
.2700 7.49E-02 3.54E-02 .060 8.71E 01 21
.2750 7.77E-02 3.50E-02 .062 8.66E 01 21
.2800 7.79E-02 5.41E-02 .063 8.66E 01 21
.2850 7.51E-02 3.49E-02 .060 8.70E 01 21
.2900 7.01E-02 3,21E-02 .056 8.78E 01 21
.2950 6.26E-02 3.10E-02 .050 8.91E 01 21
.3000 5.48E-02 2.66E-02 .044 9.04E 01 21
.3050 4.41E-02 2.63E-02 .035 9.22E 01 21
.3100 3.23E-02 2.62E-02 .026 9.42E 01 21
.3150 2.49E-02 2.60E-02 .020 9.55E 01 21
.3200 2.11E-02 2.58E-02 .017 9.62E 01 21
.3250 2.15E-02 2.68E-02 .017 9.61E 01 20
.3300 2.15E-02 2.87E-02 .017 9.61E 01 21
.3350 1.91E^)2 2.65E-02 .015 9.65E 01 21
.3400 1.16E-02 1.44E-02 .009 9.79E 01 20
.3450 6.95E-03 8.89E-03 .006 9.87E 01 21
.3500 4.01B-03 4.37E-03 .003 9.93E 01 20
.3550 4.00E-03 3.90E-03 .003 9.93E 01 20
.3600 2.72E-03 3.0GE-03 .002 9.95E 01 20
.3650 3.14B-05 3.14E-03 .003 9.94E 01 19
.3700 ',-.36E-03 2.63E-03 .002 9.96E 01 20
.3750 2.89E-03 3.28E-03 .002 9.95E 01 20
.3800 2.60E-03 2.79E-03 .002 9.95E 01 21
.3850 2.84E-03 3.01E-03 .002 9.95E 01 20
.3900 2.50E-03 2.96E-03 .002 9.95E 01 20
.3950 2,83E-03 2.67E-03 .002 9.95E 01 19
.4000 2.60E-03 2.90E-03 .002 9.95E 01 20
.4050 2.67E-03 2.80E-03 .002 9.95E 01 20
.4100 2#56E-03 2.74E-03 .002 9.95E 01 20
91
• ' ■ " " "W i
I
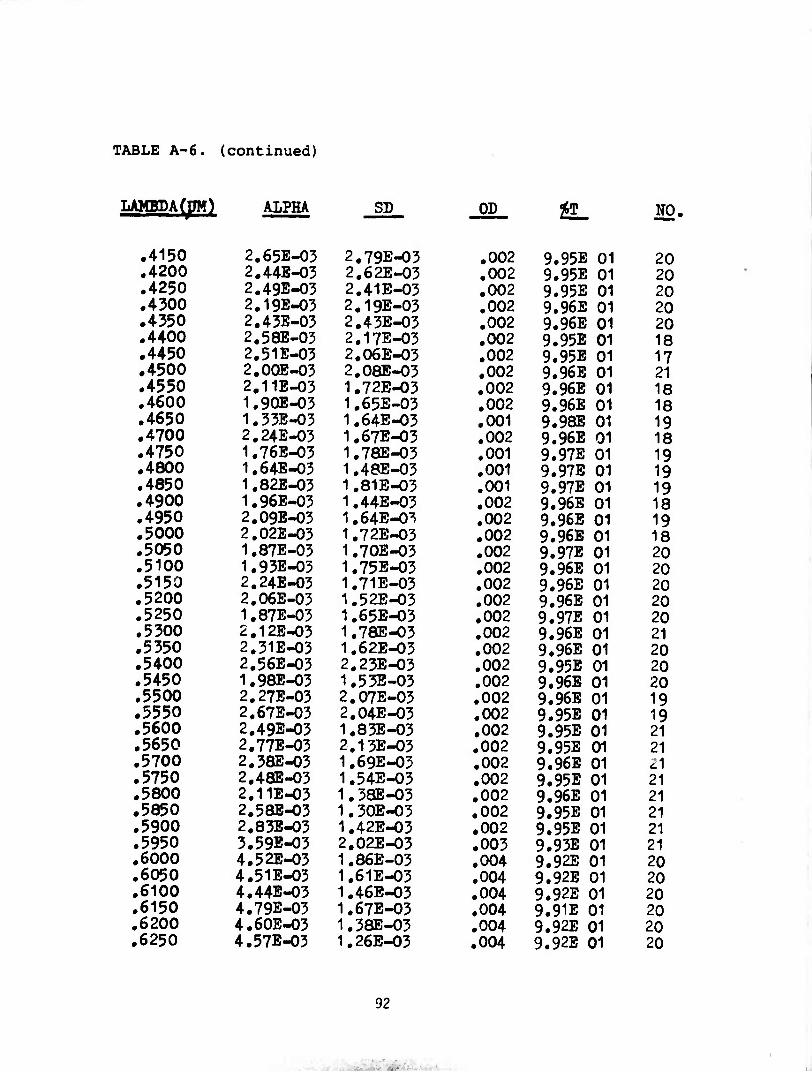
TABLE A-6. (continued)
ALPHA SD OD
.4150 2.65E-03 2,79E-03 ,002
.4200 2.44E-03 2,6?E-03 .002
.4250 2.49E-03 2,41E-03 .002
.4300 2.19E-03 2.19E-03 .002
.4350 2.43E-03 2.43E-03 ,002
.4400 2.58E-03 2.17E-03 .002
.4450 2,51E-03 2,06E-03 ,002
.4500 2.00E-03 2.08E-03 ,002
.4550 2,11E-03 1#72E-03 .002
.4600 1.90E-03 1.65E-03 ,002
.4650 1.33E-03 1.64E-03 .001
.4700 2.24E-03 1.67E-03 .002
.4750 1.76E-03 1.78E-03 .001
.4800 1.64E-03 1.48E-03 .001
.4850 1.82E-03 1.81E-03 .001
.4900 1.96E-03 1.44E-03 .002
.4950 2.09E-03 1,64E-0^ .002
.5000 2.02E-03 1.72E-03 .002
.5050 1.87E-03 1.70E-03 .002
.5100 1.93E-03 1.75E-03 .002
.5150 2.24E-03 1.71E-03 .002
.5200 2.06E-03 1.52E-03 .002
.5250 1.87E-03 1.65E-03 .002
.5300 2.12E-03 1.78E-03 .002
.5350 2.31E-03 1.62E-03 .002
.5400 2,56E-03 2.23E-03 .002
.5450 1.98E-03 1.53E-03 .002
.5500 2.27E-03 2.07E-03 .002
.5550 2.67E-03 2.04E-03 .002
.5600 2,49E-03 1.83E-03 .002
.5650 2,77E-03 2.13E-03 .002
.5700 2,38E-03 1.69E-03 .002
.5750 2.4aB-03 1.54E-03 ,002
.5800 2.11E-03 1.38E-03 ,002
.5850 2.58E-03 1.30E-03 ,002
.5900 2,83E-03 1.42E-03 .002
.5950 3.59E-03 2,0?E-03 .003
.6000 4.52E-03 1.86E-03 .004
.6050 4.51E-03 1.61E-03 .004
.6100 4.44E-03 1.46E-03 .004
.6150 4.79E-03 1.67E-03 .004
.6200 4.60E-03 1.38E-03 .004
.6250 4.57E-03 1.26E-03 .004
4L. 22.
9.95E 01 20 9.95E 01 20 9.95E 01 20 9.96E 01 20 9.96E 01 20 9.95E 01 18 9.95E 01 17 9.96E 01 21 9.96E 01 18 9.96E 01 18 9.98E 01 19 9.96E 01 18 9.97E 01 19 9.97E 01 19 9.97E 01 19 9.96E 01 18 9.96E 01 19 9.96E 01 18 9.97E 01 20 9.96E 01 20 9.96E 01 20 9.96E 01 20 9.97E 01 20 9.96E 01 21 9.96E 01 20 9.95E 01 20 9.96B 01 20 9.96E 01 19 9.95E 01 19 9.95E 01 21 9.95E 01 21 9.96B 01 21 9.95E 01 21 9.96E 01 21 9.95E 01 21 9.95E 01 21 9.93E 01 21 9.92E 01 20 9.92E 01 20 9.92E 01 20 9.91E 01 20 9.92E 01 20 9.92E 01 20
92
■. •

TABLE A-6. (continued)
ALPHA SD OD ÄL JÜ2-
.6300 4.78E-03 1.64E-03 .004 9.91E 01 21
.6350 4.60E-03 1.30E-03 .004 9.92E 01 21
.6400 4.74E-03 1.45E-03 .004 9.91E 01 21
.6450 4.8aE-03 1.40E-03 .004 9.91E 01 21
.6500 4.888-03 1.60E-O3 .004 9.91E 01 18
.6550 5.19E-03 1.32E-03 .004 9.90E 01 21
.6600 5.43E-03 1.3aE-03 .004 9.90E 01 21
.6650 5.80E-03 1.52E-03 .005 9.89E 01 21
.6700 6.05E-03 1.57E-03 .005 9.89E 01 21
.6750 5.99E-03 1.37E-03 .005 9.89E 01 21
.6800 6.23E-03 1.55E-03 .005. 9.89E 01 21
.6850 6.33E-03 1,13E-03 .005 g.SSE 01 .21
.6900 6.83E-03 1.3aE-03 .005 9.87E 01 21
.6950 7.07E-03 1.26E-03 .006 9.87E 01 21
.7000 7.63E-03 1.OaE-03 .006 9.86E 01 21
.7050 8.45E-03 1.34E-03 .007 9.84E 01 21
.7100 9.82E-03 1.64E-03 .008 9.82E 01 21
.7150 1.17E-02 1.45E-03 .009 9.79E 01 21
.7200 1.43E-02 1.18E-03 .011 9.74E 01 21
.7250 1.72E-02 1.06E-03 .014 9.69E 01 21
.7300 2.09E-02 1.42E-03 .017 9.62E 01 21
.7350 2.66E-02 1.33E-03 .021 9.52E 01 21
.7400 2.95E-02 1.45E-03 .024 9.47E 01 21
.7450 3.00E-02 1.53E-03 .024 9.46E 01 21
.7500 2.9SE-02 1.54E-03 .024 9.46E 01 21
.7550 2.96E-02 1,42E-03 .024 9.47E 01 21
.7600 2,95B-02 1.40E-03 .024 9.47E 01 21
.7650 2.93E-02 1.27E-03 .024 9.47E 01 21
.7700 2.BSE-02 1.32E-03 .023 9.48E 01 21
.7750 2.84E-02 1.60B-03 .023 9.49E 01 21
.7800 2.73E-02 1.34E-03 .022 9.51E 01 21
.7850 2.60B-O2 1.47E-03 .021 9.53E 01 21
.7900 2.49E-02 1.44E-03 .020 9.55E 01 21
.7950 2.32E-02 2.04E-03 .019 9.58E 01 21
.8000 2.31E-02 1.55E-03 .019 9.58E 01 21
.8100 1,95E-02 1.16B-02 .016 9.65E 01 14
.8200 2.27E-02 1.25E-02 .018 9.59E 01
.8300 3.27E-02 1.3SB-02 .026 9.41E 01
.8400 3.8QE-02 1.3?J!-02 .031 9t32E 01
.8500 4.08E-02 1.24B-02 .033 9.27E 01
.8600 4.42E-02 1.19E-02 .035 9.22E 01
.8700 4.74E-02 1i30E-02 .038 9.16E 01
.8800 5.35E-02 1.31B-02 .043 9.06E 01
.8900 5.83E-02 1.30B-02 .047 8.98S 01
93

CABLE A-6. (continued)
LAMBDA (jm) ALPHA SD OD foT NO
.9000 6.42E -02 1.:.,8E-02 .052 «.8SE 01 14
.9100 7.32E-02 1.40E-02 .059 8.73E 01 14
.9200 9.-7E-02 1 . :.2E-02 .074 8.42E 01 14
.9300 1.36E -01 1.38E-02 .109 7.78E 01 14
.9400 2.09E-01 1.48E-02 .168 6.79E 01 14
.9500 3.36E-01 1.73E-02 .270 5.37E 01 14
.9600 4.70E -01 1.6^-02 .378 4.19E 01 14
.9700 4.88E -01 1.46E-02 .392 4.06E 01 14
.9800 4.78E. -01 1.49E-02 .384 4.13E 01 14
.9900 4.43E. -01 2.14E-02 .356 4,40E 01 14 1.0000 3.88E -01 1.31E-02 .311 4.88E 01 14 liOlOO 3.31E-01 1.6ffi-02 .266 5.42E 01 14 1.0200 2.77E. -01 1.44E-02 ,222 5.99E 01 14 1.0300 2.26E-01 1.45E-02 .182 6.58E 01 14 1.0400 1.87E. -01 1.51E-02 .150 7.08E 01 14 1.0500 1.55E-01 1.6aE-02 .125 7.51E 01 14 1.0600 1.47E. -o-i 1.5ffE-02 .118 7,63E 01 14 1.0700 1.46E. -01 1,79E-02 .118 7,63E 01 14 1.0800 1.55E. -01 1.75E-02 .125 7,51E 01 14 1.0900 1.76E. -01 1.76E-02 .141 7.23E 01 14 1.1000 2.07E. -01 2.90E-02 .167 6,82E 01 14 1.1100 3.01E-01 8.72E-^2 .242 5,73E 01 12 1.1200 3.52E. -01 9.25E-02 .283 5.21E 01 12 1.1 300 4.65E. -01 7.65E-02 .374 4,23E 01 12 1.1400 7.99E-01 8.01E-O2 .642 2,28E 01 12 1.1500 1.14E 00 6.24E-02 .915 1.22E 01 1 1 1,1600 1.29E 00 7.11E-02 1.039 9.15E 00 8 1.1700 1.31E 00 6.83E-02 1.055 8,82E 00 8 1.1800 1.35E 00 7.S2E-02 1.067 8.57E 00 8 1.1900 1.35E 00 6.97E-C2 1.081 8,2.9E 00 8 1.2000 1.33E 00 6.79E-02 1.067 8,58E 00 8 1.2100 1.30E 00 7.19E-02 1.042 9.08E 00 8 1.2200 1.24E 00 8.03E-02 .994 1.01E 01 10 1.2300 1.19E 00 7.01E-O2 .956 1,11E 01 12 1.2400 1.15E 00 6.00E-02 .921 I.POB 01 12 1.2500 1.12E 00 6,99E-02 .899 1.26E 01 12 1.2600 1.11E 00 7.49E-02 .889 1,29E 01 12 1.2700 1.1 2E 00 7.10E-02 .899 1.26E 01 1? 1.2800 1.17E 00 8.52E-02 .938 1.15E 01 12 1.2900 1.28E 00 8.05E-O2 1.031 9.32E 00 8 1.3000 1.43E 00 8,26E-02 1.153 7,04E 00 8 1.3100 1.66E 00 9.28E-02 1.334 4,63E 00 8 1.3200 1.97E 00 8.49E-02 1.582 2,62E 00 8 1.3300 2.42E 00 9.38E-02 1.945 1,14E 00 8 1.3400 2.92E 00 9.94E-02 2.348 4.49E-01 8
94

^ALJLt; A-6. (continued)
LAMBDA (JIM) ALPHA SI) or ^T NO
1.3500 3.38E 00 7.8;1E-o:, 2.712 1.94E-01 8 1.3600 3.50E 00 8.85E-01 2,813 1.54E-01 9 1 ,'3700 4.56E 00 1.09E-01 •/-.667 2.162-02 8 1.3800 6.41E 00 2.19E-01 5.146 7.14E.04 8 1.3900 1.07E 01 4,34E-01 8.558 2.76E-07 8 1.4000 1.57E 01 2.47E 00 12.643 2.27E-11 8 1.4100 2.36E 01 4.81E-01 18.940 1.15E-17 6 1.4200 ".BOE 01 8.05E-01 22.486 3.27E-21 6 1.4300 3.01E 01 1.32E 00 24.184 6.55E-23 b 1.4400 3.14E 01 1.33E 00 25.224 5.97E-24 u 1.4500 3.14E 01 1.40E 00 25.259 5.51E-24 6 1 .4600 3.10E 01 1.14E 00 24.937 1.16E-23 6 1.4700 2.90E 01 9.95E-01 23.286 5.18E-22 6 1.4800 2.63E 01 b.77E-01 21.115 7.67E-20 6 1.4900 2.34E 01 3.52E-01 18.768 1.71E-17 6 1.5000 ^.05R 01 o.83E-01 16.488 3.25E-15 h 1.5100 1.81E 01 1.96E-01 14.557 2.7aE-13 6 1.5200 1.53E 01 1.89E 00 12.271 5.36E-11 7 1,5300 1.34E 01 1.39E 00 10.740 1.79E-09 8 1.5400 1.20E 01 8.01E-01 9.621 2.39E-08 8 1.5500 1.0SE 01 5.35E-01 8.691 2.04E-07 8 1.5600 9.82E 00 3.54E-01 7.893 1.28E-06 8 1.5700 8.Q4E 00 2.80E-01 7.182 6.58E-06 8 1.5800 8.26E 00 2.21E-01 6.633 2.33E-05 8 1.5900 7.6aE 00 1,61E-01 6.171 6.75E-05 8 1.6000 7.20E 00 1.17E-01 5.782 1.65E-04 8 1.6100 6.80E 00 1.16E-01 5.466 3.42E-04 8 1.6200 6.47E 00 1.05E-01 5.198 6.53E-04 8 1.6300 6,21E 00 9.01E-Ü2 4.990 1.02E-03 8 1.6400 6.00E 00 8.q5E-02 4.818 1.52E-03 8 1.6500 5.82E 00 9.25E-02 4.672 2.13E-03 8
1 .6600 5.69E 00 9.70E-o:: 4-575 2.66E-03 8 1.6700 5.62E 00 1.01E-01 4.518 3.03E-03 8 1.6800 5.^9E 00 1.01E-01 4.489 3.24E-03 8 1.6900 5.63E 00 1.?.0E-01 4.522 3.01E-03 8 1.7000 5.69E 00 1.12E-01 4.571 2.69E-03 3 1.7100 5.84E 00 1.14E-01 4.694 2.02E-03 8 1.7200 6.05E 00 1.23E-01 4.859 1.38E-03 8 1.7300 6.37E 00 1.19E-01 5.115 7.67E-04 8 1.7400 6.80E 00 1.54E-01 5.465 v..43E-04 8 1.7500 7.36E 00 1.48E-01 5.910 1.23E-04 8 1.7600 7.93E 00 1.87E-01 6.375 4.2?^-05 8 1.7700 8.50E 00 2.4SE-01 6.828 1.49E-05 8 1 .7800 8.92E 00 2.51E-01 7.166 6.82E-06 8
95

TABLE A-6. (continued]
LAMBDA (JIM) ALPHA SD OD 2^_ NO.
1.7900 9.11E 00 2.56E-01 7.317 4.82E-06 8 1.8000 8.66E 00 2.06E 00 6.959 1.10E-05 12 1.8100 9.25E 00 3.87E-01 7.436 3.67E-06 12 1.8200 9.33E 00 5,96E-01 7,495 ^.20E-06 12 1.8300 9.56E 00 4.10E-01 7,682 2.ORE-06 12 1.8400 1.02E 01 5.04E -01 8,160 6.92E-07 12 1.8500 1.14E 01 8.27K-01 9,198 6.34E-08 12 1.8600 1.42E 01 1.59E 00 1 1,402 3.96E-10 12 1.8700 2,2QE 01 :1.10E 00 17,693 2.03E-16 10 1.8800 3.76E 01 4.42E 00 30,189 6.47E-29 10 1.8900 6.97E 01 6.62E 00 55.996 1.01E-54 8 1,9000 I.OSE 02 6.96E 00 86,566 2,71E-85 6 1.9100 1.27E 02 9.84E 00 >ioo — ~_ 6 1.9200 1.41E 02 1.83E 01 >100 _——_ 6 1.9300 1.38E 02 1.93E 01 >100 m. 6 1.9400 1.29E 02 1 ,07E 01 >100 mm^mmmm 6 1.9500 1 .19E 02 4.71E 00 95.780 1,b6E-94 6 1.9600 1.08E 02 1 .65E 00 87,086 8.20E-86 0 1.9700 9.81E 01 1.64E 00 78,820 1.52E-77 6 1.9800 8.80E 01 1.83E 00 70.730 1,86E-69 6 1.9900 7.79E 01 3.05E 00 62.586 .'.60E-61 7
i
2.0000 7.02E 01 2.70E 00 56.386 4.11E-55 ry
2.0100 6.35E 01 1.73E 00 51,048 8.95E-50 7 2.0200 5.75E 01 1 .35E 00 46,205 6.23E-45 7 2.0300 5.25E 01 1.34E 00 42.175 6.6RE-41 8 2.0400 4.81E 01 1.43E 00 38.659 ,.19E-37 8 2.0500 4.39E 01 1.1 5E 00 35,257 5.53E-34 8 2.0600 4.01E 01 9.55E-01 32.197 6.35E-31 8 2.0700 3.63E 01 1.41E 00 29,188 6.49E-28 9 2.0800 3.33E 01 1.20E 00 26,759 1.74E-25 10 2.0900 3.09E 01 7.69E-01 24,855 1.40E-23 10 2,1000 2.86E 01 7.00E-01 23.018 9.60E-22 10 2.1100 2.67E 01 6.81E-01 21,439 3.64E-20 10 2.1200 2.52E 01 5.51E-01 20,210 6.17E-19 10 2.1300 2.38E 01 5.50E-01 19,134 7.54E-18 10 2,1400 2.26E 01 5.35E-01 18,183 6.56E-17 10 2.1500 2.17E 01 4.96E-01 17.404 3.94E-16 10 2.1600 2.09E 01 5.13E-01 16.811 1.55E-15 10 2.1700 2.03E 01 4.5aE- 01 16,307 4.94E-15 10 2.1800 1.99E 01 5.41E-01 15,987 1.03E-14 10 2.1900 1.96E 01 5.06E-01 15,727 1.87E-14 10 2.2000 1.95E 01 5.03E-01 15.644 2.27E-14 10 2.2100 1.94E 01 5.14E- 01 15.611 2.45E-14 10 2.2200 1.95E 01 5.27E-01 15.690 2.04E-14 10 2.2300 1.98E 01 5.5RE-01 15.900 1.26E-14 10
06

TABLE A-6. (continued)
LAMBDA (UW) ALPHA
2.02E 01
SD
rj.46E-01
OD
'•..235 5.82E-15
NO
2.2400 10 2.2500 2.08E 01 5.88E-01 16.679 2.09E-15 10 2,2600 2.14E 01 6.52E-01 17.202 6.28E-16 10 2.2700 2.23E 01 6.bOE-01 17.9?o 1.19E-16 10 2.2800 2.33E 01 7.54E-01 18.727 1.87E-17 10 2.2900 2.45E 01 7.77E -01 19.682 2.08E-18 10 2.3000 2.60E 01 7.94E. -01 20.851 1,41E-19 10 2.3100 2.76E 01 9.23E-01 22.149 7.09E-21 10 2.3200 2.93E 01 1.04E 00 23.515 3.06E-22 10 2.3300 3.12E 01 1.14E 00 25.089 8.15E-24 10 2.3400 3.30E 01 1,78E 00 26.486 3,27E-25 10 2.3500 3.61E 01 1.69E 00 29.041 9.09E-28 10 2.3600 3.83E 01 1.83E 00 30.785 1,64E-29 10 2.3700 4.07E 01 2.36E 00 32.716 1,92E-31 9 2.3800 4.40E 01 3.79E 00 35.385 4.12E-34 9 2.3900 4.805) 01 1.73E 00 38.531 2.95E-37 8 2.4000 5.12E 01 1.74E 00 41.153 7.03E-40 8 2.4100 5.45E 01 I.^E 00 43.790 1.62E-42 7 2.4200 5.76E 01 2.53E 00 46.248 5.65E-45 7 2.4300 6.18E 01 2,74E 00 49.684 2.07E-48 7 2.4400 6.65E 01 2.89E 00 53.453 3.52E-52 7 2.4500 7.25E 0^ 3.26E 00 58.218 6.06E-57 7 2.4600 7.76E 01 3.21E 00 62.362 4.34E-61 7 2.4700 8.37E O'1 3.51E 00 67.272 5.34E-66 6 2.4800 8.94E 01 3,1 3E 00 71.818 1.52E-70 b 2.4900 9.50E 01 2.HE 00 76.302 4.99E-75 6 2.5000 9.90E 01 9.17E-01 79.533 2.93E-78 6 2.5126 1.08E 02 7.95E 00 87.089 8.14E-e6 13 2.5253 1.12E 02 9.16E 00 89.828 1.49E-88 13 2.5381 1.11B 02 1 . 20E 01 89.034 9.25E-88 13 2.5510 1.16E 02 9.56E 00 92.871 1.35E-91 13 2.5641 1.17E 02 9.26E 00 93.853 1.40E-92 13 2.5773 1.19E 02 7.77E 00 95.500 3.17E-94 13 2.5907 1.24R 02 8.40E 00 >100 _—_ 13 2.6042 1.31E 02 8.66R 00 >100 —»_. 13 2.6178 1.40E 02 1.00E (11 >100 —..—. 13 2.6316 1.53E 02 1.27E 01 >100 m.m.~mm 13 2.6455 1.69E 02 1.36E 01 >100 —— 13 2.6596 1.99E 02 2.Ü3E 01 >100 — ._ 13 2.6738 2.62E 02 3.72E 01 >100 mt~m,m. 13 2,6882 3.22E 02 6.82E 01 >100 .... 13 2.7027 4.23E 02 5.27E 01 >100 .... 11 2.7174 7.40E 02 8.02E 01 >100 .... 11 2.7320 1.87E 03 2.74E 02 >100 .... 4 2.7470 2.75E 03 3.64E 02 >100 — .. 4 2.7620 3.30E 03 3.75E 02 >100 .... 4
97
— . — . . u
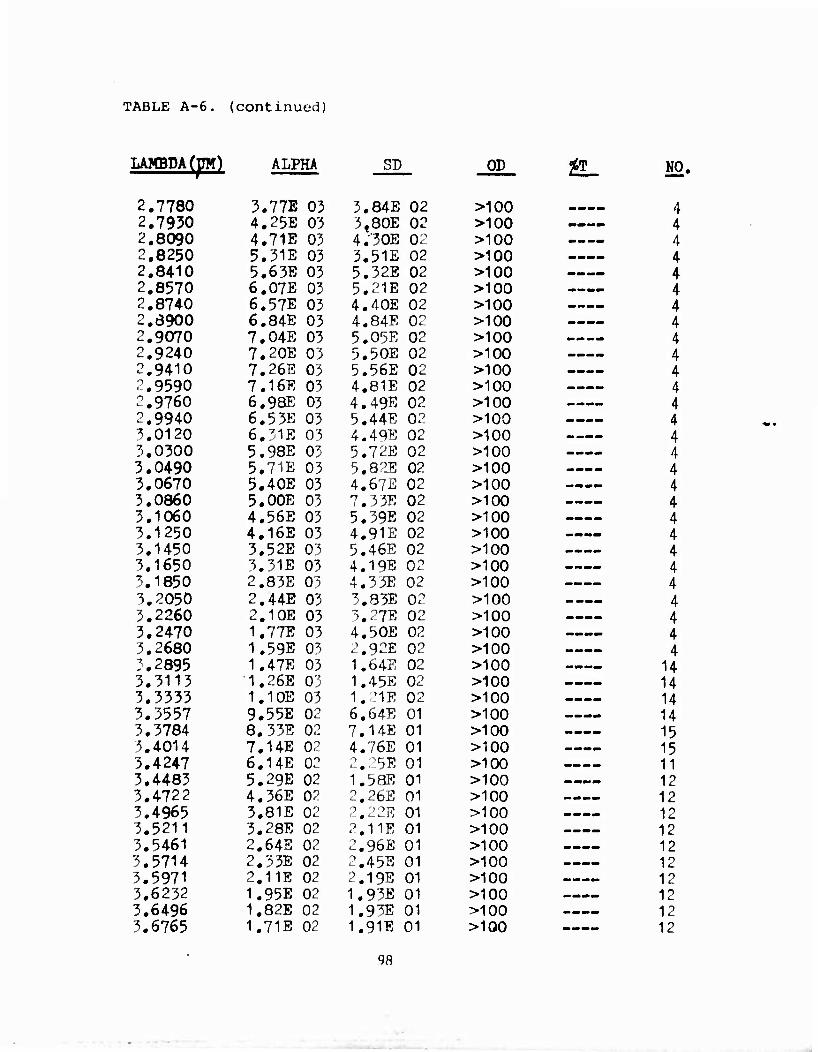
TABLE A-6. (continued)
LAMBDA (jJM) ALPHA SD OP #P NO.
4
1 4
-II- 4 4 4 4 4 4 4 4
4
4 4 4 4
4
4 4
14 14 14 14 15 15 11 12 12 12 12 12 12 12 12 12 12
98
2.7780 3.77E 03 3.84E 02 >100 2.7930 4.25E 03 3.80E 02 >100 2.8090 4.71E 03 4.,30E 02 >100 2.8250 5.31E 03 3.51E 02 >100 2.8410 5.63E 03 5.32E 02 >100 2.8570 6.07E 03 5.21E 02 >100 2.8740 6.57E 03 4.40E 02 >100 2.8900 6.84E 03 4.84E 02 >100 2.9070 7.04E 03 5.05E 02 >100 2.9240 7.20E 03 5.50E 02 >100 2.9410 7.26E 03 5.56E 02 >100 2.9590 7.16R 03 4.81E 02 >100 2.9760 6.98E 03 4.49E 02 >100 2.9940 6.53E 03 5.44E 02 >100 ^5.0120 6.31E 03 4.4^ 02 >100 3.0300 5.98E 03 5.72E 02 >100 3.0490 5.71E 03 ci.82E 02 >100 3.0670 5.40E 03 4.67E 02 >100 3.0860 5.00E 03 7.33E 02 >100 3.1060 4.56E 03 5.39E 02 >100 3.1250 4.16E 03 4.91E 02 >100 3.1450 3.52E 03 5.46E 02 >100 3.1650 3.31E 03 4.19E 02 >100 3.1850 2.83E 03 4.33E 02 >100 3.2050 2.44E 03 3.85E 02 >100 3.2260 2.1 OE 03 3.27E 02 >100 3.2470 1.77E 03 4.50E 02 >100 3.2680 1.59E 03 2.92E 02 >100 3.2895 1.47E 03 1.64E 02 >100 3.3113 1.26E 03 1.45E 02 >100 3.3333 1.10E 03 1.21E 02 >100 3.3557 9.55E 02 6.64E 01 >100 3.3784 8.33E 02 7.14E 01 >100 3.4014 7.HE 02 4.76E 01 >100 3.4247 6.14E 02 2.25E 01 >100 3.4483 5.29E 02 I.SSE 01 >100 3.4722 4.36E 02 2.26E 01 >100 3.4965 3.81E 02 2.22E 01 >100 3.5211 3.28E 02 2.1 IE 01 >100 3.5461 2.64E 02 2.96E 01 >100 3.5714 2.53E 02 2.45E 01 >100 3.5971 2.11E 02 2.19E 01 >100 3.6232 1.95E 02 1.93E 01 >100 3.6496 1.82E 02 1.93E 01 >100 3.6765 1.71E 02 1.91E 01 >100
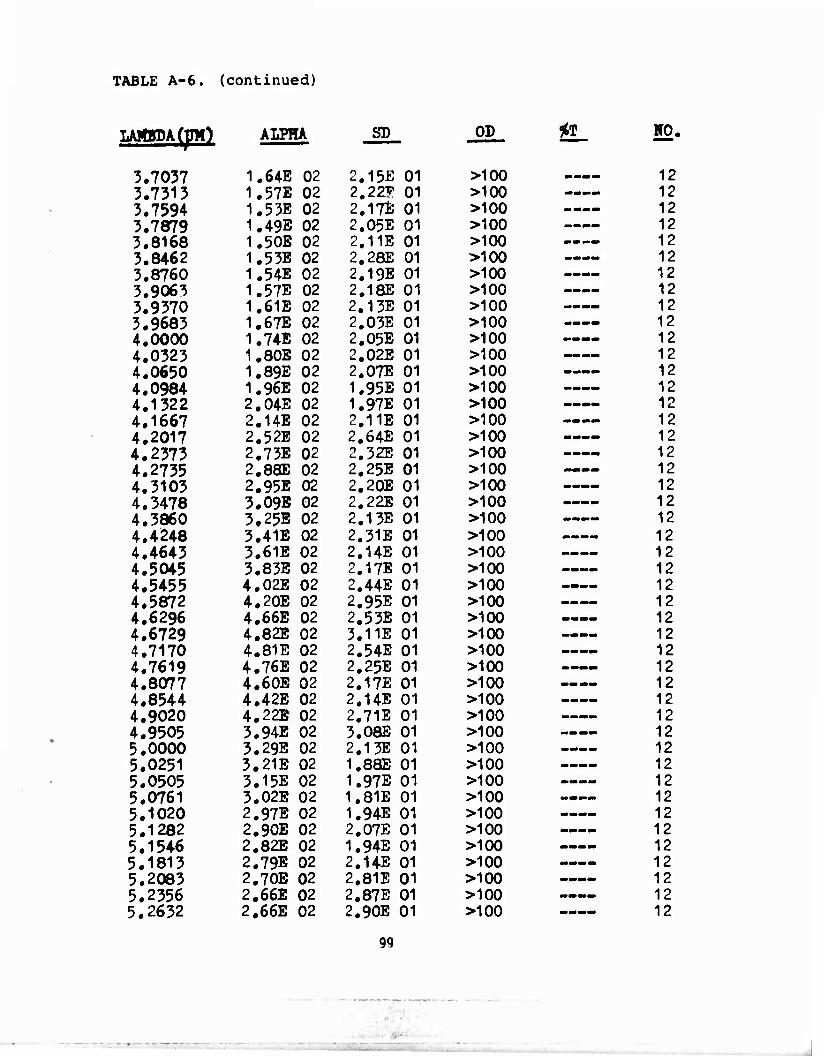
TABLE A-6. (continued)
LAUKDAOJIO ALPHA SD OD JL 52«
12 12 12 12 12 12 12 12 12 12 12 12 12 12 12 12
12 12 12 12 12 12 12 12 12 12 12 12 12 12 12 12 12 12 12 12 12 12 12 12 12 12 12 12 12
99
3.7037 1.641 02 2.15E 01 >100 3.7313 1.57E 02 2.227 01 >100 3.7594 1.53E 02 2.17E 01 >100 3.7879 1.49E 02 2,05E 01 >100 3.8168 1.50E 02 2.1 IE 01 >100 3.8462 1.53E 02 2.2aE 01 >100 3.8760 1.54E 02 2.19E 01 >100 3.9063 1.57E 02 2,iaE 01 >100 3.9370 1.61E 02 2,13E 01 >100 3.9683 1.67E 02 2.Ü5E 01 >100 4.0000 1.74E 02 2,05E 01 >100 4.0323 1.80E 02 2.02E 01 >100 4.0650 1.89E 02 2.07E 01 >100 4.0984 1.96E 02 1.95E 01 >100 4.1322 2.04E 02 1.97E 01 >100 4.1667 2.14E 02 2.11E 01 >100 4.2017 2.52E 02 2,64E 01 >100 4.2373 2.73E 02 2.32E 01 >100 4.2735 2#8aE 02 2.25E 01 >100 4.3103 2.95E 02 2.20E 01 >100 4.3478 3.09E 02 2.22E 01 >100 4.3860 3.25E 02 2.1 3E 01 >100 4.4248 3.41E 02 2.31E 01 >100 4.4643 3.61E 02 2,14E 01 >100 4.5045 3.83E 02 2.17E 01 >100 4.5455 4.02E 02 2.44E 01 >100 4.5872 4.20E 02 2.95E 01 >100 4.6296 4.66E 02 2.53E 01 >100 4.6729 4.82E 02 3.11E 01 >100 4.7170 4.81E 02 2.54E 01 >100 4.7619 4.76E 02 2,25E 01 >100 4.8077 4.60E 02 2.17E 01 >100 4.8544 4.42E 02 2.14E 01 >100 4.9020 4.22E 02 2,711! 01 >100 4.9505 3.94B 02 3.08E 01 >100 5.0000 3.29E 02 2.13E 01 >100 5.0251 3.21E 02 I.SSE 01 >100 5.0505 3.15E 02 1.97E 01 >100 5.0761 3.02E 02 1.81E 01 >100 5.1020 2.97E 02 1.94E 01 >100 5.1282 2.90E 02 2.07E 01 >100 5.1546 2.82E 02 1.94E 01 >100 5.1813 2.79E 02 2.14E 01 >100 5.2083 2.70E 02 2.81E 01 >100 5.2356 2.66E 02 2#87E 01 >100 5.2632 2#66E 02 2.90E 01 >100
I

TABLE A-6. (continued)
LAMBDA (PM) ALPHA SB OD
5.2910 2.6SE 02 2.11E 01 >100 5.3191 2.66E 02 2,06E 01 >100 5.3476 2.65E 02 1.94E 01 >100 5.3763 2.70E 02 2.12E 01 >100 5.4054 2,68E 02 1.83E 01 >100 5.4348 2.77E 02 2.05E 01 >100 5.4645 2.80E 02 1.92E 01 >100 5.4945 2.86E 02 1.75E 01 >100 5.5249 2.93E 02 1.68E 01 >100 5.5556 3.04E 02 1.71E 01 >100 5.5866 3.21E 02 1.87E 01 >100 5.6180 3.41E 02 1.77E 01 >1O0 5.6497 3.72E 02 2.06E 01 >100 5.6818 4.51E 02 3.2aE 01 >100 5.7143 5.10E 02 5.56E 01 >100 5.7471 5.78E 02 2#97E 01 >100 5.7803 6.60E 02 3.29E 01 >100 5.8140 7.67E 02 5.42E 01 >100 5.8480 9.62E 02 4.57E 01 >100 5.8824 1.23E 03 7.32E 01 >100 5.9172 1.40E 03 9.50E 01 >100 5.9524 1.71E 03 1.77E 02 >100 5.9880 1.99E 03 2.89B 02 >100 6.0241 2.19E 03 2.85E 02 >100 6.0606 2.27E 03 2.80E 02 >100 6.0976 2#28E 03 3.36E 02 >100 6.1350 2.27E 03 4.01E 02 >100 6.1728 1.90E 03 2.60E 02 >100 6.2112 1.63E 03 1.95E 02 >100 6.2500 1.32E 03 1.26E 02 >100 6.2893 1.14E 03 1.07E 02 >100 6.3291 1.02E 03 6.1r>E 01 >100 6.3694 8.96E 02 5.44B 01 >100 6.4103 7.99E 02 5.03*) 01 >100 6.4516 7.79E 02 4.57E 01 >100 6.4935 7.27E 02 3.51E 01 >100 6.5359 7.13E 02 3.46E 01 >100 6.5789 6.93E 02 2,64E 01 >100 6.6225 6.79E 02 3.13E 01 >100 6.6667 6.74E 02 3.79E 01 >100 6.7114 6.61E 02 2.55E 01 >100 6.7568 6.64E 02 2.31E 01 >100 6,8027 6.50E 02 2.58E 01 >100 6.8493 6.46E 02 2.04E 01 >100 6.8966 6.38E 02 2.04E 01 >100 6.9444 6.33E 02 2.26E 01 >100
56T NO.
12 12 12 12 12 12 12 12 12 12 12 12 12 12 11 11 10 10 10 10 10 10 10 9 9 9
10 10 10 10 10 10 11 11 11 11 11 11 11 11 11 11 11 11 11 11
100
■

TABLE A-6. (continued)
LAKBDAfpO ALPHA SD OD
6.9930 6.25E 02 2.17E 01 >100 7.0423 6.17B 02 2.30E 01 >100 7.0922 6.23E 02 2.14E 01 >100 7.U29 6.15E 02 2.23E 01 >100 7.1942 6.IDE 02 2.48E 01 >100 7.2464 6.06E 02 2.531^ 01 >100 7.2993 6.03E 02 2.07E 01 >100 7.3529 6,10E 02 2.22E 01 >100 7.4074 Ö.OSE 02 1.91E 01 >100 7.4627 6.02E 02 2,37E 01 >100 7.5188 6.01E 02 2.00E 01 >100 7.5758 5.97E 02 2.03E 01 >100 7.6336 5.95E 02 2.09E 01 >100 7.6923 6.02E 02 1,81E 01 >100 7.7519 5.98E 02 2,10E 01 >100 7.8125 6.00E 02 1.8QE 01 >100 7.8740 5.98E 02 1.83E 01 >100 7.9365 6.00E 02 1.25E 01 >100 8.0000 5.99E 02 1.58E 01 >100 8.0645 5.97E 02 1.72E 01 >100 8.1301 5.96E 02 1.74E 01 >100 8.1967 5.97E 02 2.00E 01 >100 8.2645 5.90E 02 2.09E 01 >100 8.3333 5.84E 02 2,04E 01 >100 8.4034 5.70E 02 2,40E 01 >100 8.4746 5.85E 02 2.45E 01 >100 8.5470 5.75E 02 2.23E 01 >100 8.6207 5.75E 02 2.99E 01 >100 8.6957 5.81E 02 3.12E 01 >100 8.7719 5.81E 02 2.93E 01 >100 8.8496 5.79E 02 3.42E 01 >100 8.9286 5.63E 02 3.29E 01 >100 9.0090 5.64E 02 3.94E 01 >100 9.0909 5.4aE 02 4.35E 01 >100 9.1743 5.79E 02 1.02E 02 >100 9.2593 5.6^E 02 5.91E 01 >100 9.3458 5.68E 02 6.22E 01 >100 9.4340 5.21E 02 6,89E 01 >100 9.5238 5.30E 02 5.39E 01 >100 9.6154 6.05E 02 7.71E 01 >100 9.7087 7.32E 02 7.87E 01 >100 9.8039 7.26E 02 7.66E 01 >100 9.9010 8.05E 02 1.41E 02 >100
äL HO.
10 10 10 10 10 10 10 10 10 10 10 10
101
.....
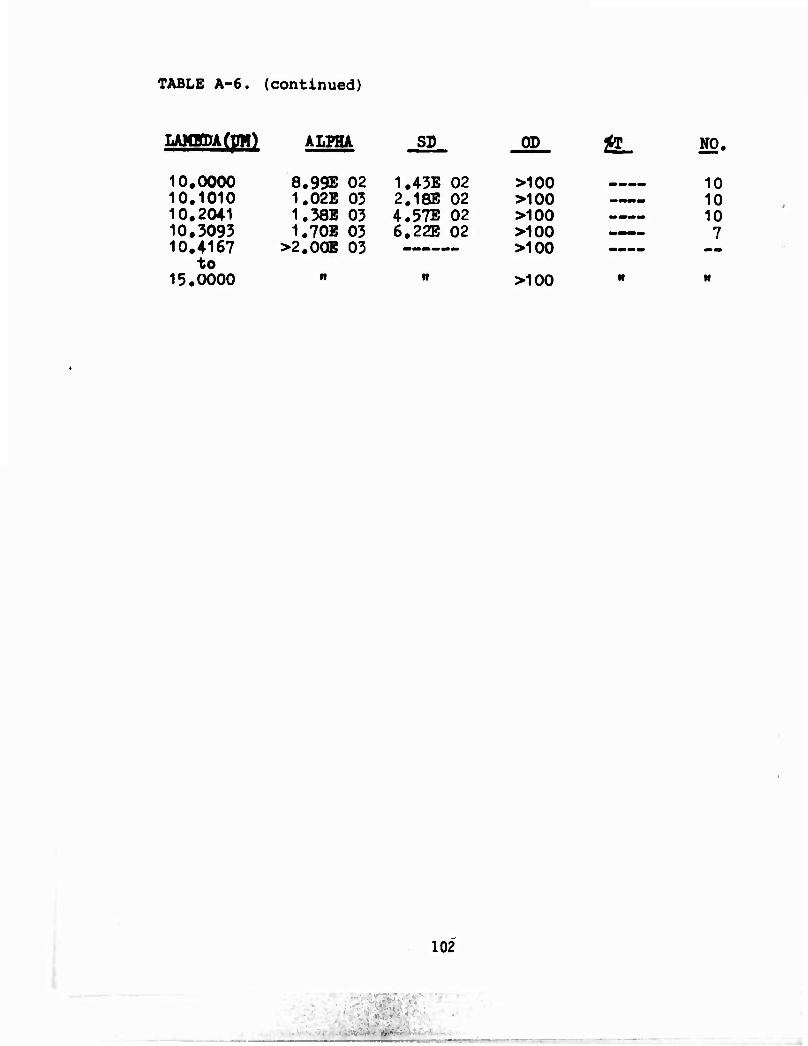
TABLE A-6. (continued)
LAMBPAfpH) ALPHA SD OP *T NO,
10.0000 8.99E 02 1.43E 02 >100 10 10.1010 1.02E 03 2.18E 02 >100 10 10.2041 1.38B 03 4.572 02 >100 10 10,3093 1.70E 03 6.22E 02 >100 7 10.4167 >2.0QE 03 >100
to 15.0000 " " >100 " *
102

4*
I I
8 TI
it SBO
I B O ■
IS Sa t
Si
*
Related Documents