Resource DNA-Binding Speci fi cities of Human Transcription Factors Arttu Jolma, 1,2,8 Jian Yan, 1,8 Thomas Whitington, 1 Jarkko Toivonen, 3 Kazuhiro R. Nitta, 1 Pasi Rastas, 3 Ekaterina Morgunova, 1 Martin Enge, 1 Mikko Taipale, 2 Gonghong Wei, 2 Kimmo Palin, 2 Juan M. Vaquerizas, 4 Renaud Vincentelli, 5 Nicholas M. Luscombe, 4 Timothy R. Hughes, 6 Patrick Lemaire, 7 Esko Ukkonen, 3 Teemu Kivioja, 1,2,3 and Jussi Taipale 1,2, * 1 Science for Life Center, Department of Biosciences and Nutrition, Karolinska Institutet, 141 83 Huddinge, Sweden 2 Genome-Scale Biology Program 3 Department of Computer Science University of Helsinki, 00014 Helsinki, Finland 4 EMBL-European Bioinformatics Institute, Wellcome Trust Genome Campus, Cambridge CB10 1SD, UK 5 Architecture et Fonction des Macromole ´ cules Biologiques, UMR7257 CNRS, Universite ´ Aix-Marseille, 163 Avenue de Luminy, 13288 Marseille Cedex 9, France 6 Donnelly Center, Banting and Best Department of Medical Research and Department of Molecular Genetics, University of Toronto, Ontario M5S 3E1, Canada 7 CRBM, 1919 Route de Mende, 34293 Montpellier, France 8 These authors contributed equally to this work *Correspondence: [email protected] http://dx.doi.org/10.1016/j.cell.2012.12.009 SUMMARY Although the proteins that read the gene regulatory code, transcription factors (TFs), have been largely identified, it is not well known which sequences TFs can reco gni ze. We have analyz ed the sequence- spe ci fic bindin g of human TFs usi ng high-t hroughput SELEX and ChIP sequencing. A total of 830 binding profiles were obt ain ed, des crib ing 239 distin ctl y different binding specificities. The models represent the majority of human TFs, approximately doubling the cover age compare d to existi ng systema ti c stu dies. Our results reve al additi onal speci ficit y determinants for a large number of factors for which a par tial spe ci fic ity was known, including a com- monly observed A- or T-rich stretch that flanks the core motifs. Glo bal analysis of the data revealed tha t homodimer ori ent ation and spacin g prefer- ences, and base-stacking interactions, have a larger role in TF-DNA binding than previously appreciated. We further describe a binding model incorporating these features that is required to understand binding of TFs to DNA. INTRODUCTION Understanding of transcriptional networks that control animal deve lopment as well as phys iolog ical and path olog ical pro- cesses requires the cataloging of target genes of each tran- scription factor (TF) under all possible devel opment al and environmental conditions. Approaches identifying central TFs and their target genes in simple models where environmental conditions are stable, such as early embryonic development of sea urchin, C. elegans, and Drosophila, have been successful ( Davidson andLevine, 2008; Walhout, 2011 ). Similar approaches can als o be applied to analysis of human transc rip tional networks impo rtant for part icular proc esses, using meth ods such as clas sical gene tics, chromatin immu nopre cipit ation followed by sequencing (ChIP-seq), and RNAi (see, for example, Bala skas et al., 2012; Che n et al., 2008; Chi a et al., 2010 ). However, due to the large number of TFs (>1,000; Vaquerizas et al., 2009 ), cell types, and environmental states, exhaustive application of such approaches to understand human transcrip- tional regulation is not feasible. Furthermore, observing where TFs bind in the genome does not explain why they bind there. To understand TF binding, it is necess ary to dev elo p a model tha t is based on biochemical prin- ciplesof affi nit y andmass act ion(e.g. , Hallikaset al., 2006; Segal et al., 2008 ). Such a model would allow reading of the regulatory gene tic code, and predicti on of gene expre ssio n based on seq uen ce. It wouldalso be ver y imp ortantfor per sonalized medi- cine becau seitwouldallowprediction of theeffectsof pre vio usl y unknown variants or mutations on gene expression and disease susceptibility ( Tuupanen et al., 2009 ). The parameters of such a model include the initial concentrations and the quantitative binding specificities of DNA-binding proteins such as histones ( Kaplan et al., 2009 ) and all TFs encoded by the human genome. A binding specificity model for a TF should describe its affinity towa rd all poss ible DNA seque nces. By assuming that each TF-DNA base interaction is independent ( Benos et al., 2002 ; Roulet et al., 2002 ), TF-binding specificity can be expressed as a position weight matrix (PWM), which describes the effect of each base on binding separately. Due to the low resolution of most existing data ( Jolma and Taipale , 2011 ), it is not clear how generally applicable this model is ( Badis et al., 2009; Zhao and Stormo, 2011 ). Despite the central importance of transcriptional regulation in development and disease, very little work has concentrated on Cell 152, 327–339, January 17, 2013 ª2013 Elsevier Inc. 327

Welcome message from author
This document is posted to help you gain knowledge. Please leave a comment to let me know what you think about it! Share it to your friends and learn new things together.
Transcript
8/12/2019 Transkripsi Dna 3
http://slidepdf.com/reader/full/transkripsi-dna-3 1/13
Resource
DNA-Binding Specificities
of Human Transcription Factors Arttu Jolma,1,2,8 Jian Yan,1,8 Thomas Whitington,1 Jarkko Toivonen,3 Kazuhiro R. Nitta,1 Pasi Rastas,3
Ekaterina Morgunova,1 Martin Enge,1 Mikko Taipale,2 Gonghong Wei,2 Kimmo Palin,2 Juan M. Vaquerizas,4
Renaud Vincentelli,5 Nicholas M. Luscombe,4 Timothy R. Hughes,6 Patrick Lemaire,7 Esko Ukkonen,3 Teemu Kivioja,1,2,3
and Jussi Taipale1,2,*1Science for Life Center, Department of Biosciences and Nutrition, Karolinska Institutet, 141 83 Huddinge, Sweden2Genome-Scale Biology Program3Department of Computer Science
University of Helsinki, 00014 Helsinki, Finland4EMBL-European Bioinformatics Institute, Wellcome Trust Genome Campus, Cambridge CB10 1SD, UK5 Architecture et Fonction des Macromole cules Biologiques, UMR7257 CNRS, Universite Aix-Marseille, 163 Avenue de Luminy,
13288 Marseille Cedex 9, France6Donnelly Center, Banting and Best Department of Medical Research and Department of Molecular Genetics, University of Toronto,
Ontario M5S 3E1, Canada7
CRBM, 1919 Route de Mende, 34293 Montpellier, France8These authors contributed equally to this work
*Correspondence: [email protected]
http://dx.doi.org/10.1016/j.cell.2012.12.009
SUMMARY
Although the proteins that read the gene regulatory
code, transcription factors (TFs), have been largely
identified, it is not well known which sequences TFs
can recognize. We have analyzed the sequence-
specific binding of human TFs using high-throughput
SELEX and ChIP sequencing. A total of 830 binding
profiles were obtained, describing 239 distinctlydifferent binding specificities. The models represent
the majority of human TFs, approximately doubling
the coverage compared to existing systematic
studies. Our results reveal additional specificity
determinants for a large number of factors for which
a partial specificity was known, including a com-
monly observed A- or T-rich stretch that flanks the
core motifs. Global analysis of the data revealed
that homodimer orientation and spacing prefer-
ences, and base-stacking interactions, have a larger
role in TF-DNA binding than previously appreciated.
We further describe a binding model incorporating
these features that is required to understand bindingof TFs to DNA.
INTRODUCTION
Understanding of transcriptional networks that control animal
development as well as physiological and pathological pro-
cesses requires the cataloging of target genes of each tran-
scription factor (TF) under all possible developmental and
environmental conditions. Approaches identifying central TFs
and their target genes in simple models where environmental
conditions are stable, such as early embryonic development of
sea urchin, C. elegans, and Drosophila, have been successful
( Davidson and Levine, 2008; Walhout, 2011 ). Similar approaches
can also be applied to analysis of human transcriptional
networks important for particular processes, using methods
such as classical genetics, chromatin immunoprecipitation
followed by sequencing (ChIP-seq), and RNAi (see, for example,
Balaskas et al., 2012; Chen et al., 2008; Chia et al., 2010 ).
However, due to the large number of TFs (>1,000; Vaquerizas
et al., 2009 ), cell types, and environmental states, exhaustive
application of such approaches to understand human transcrip-
tional regulation is not feasible.
Furthermore, observing where TFs bind in the genome does
not explain why they bind there. To understand TF binding, it is
necessary to develop a model that is based on biochemical prin-
ciplesof affinity andmass action(e.g., Hallikaset al., 2006; Segal
et al., 2008 ). Such a model would allow reading of the regulatory
genetic code, and prediction of gene expression based on
sequence. It wouldalso be very importantfor personalized medi-
cine because it would allow prediction of theeffectsof previously
unknown variants or mutations on gene expression and disease
susceptibility ( Tuupanen et al., 2009 ). The parameters of such
a model include the initial concentrations and the quantitative
binding specificities of DNA-binding proteins such as histones( Kaplan et al., 2009 ) and all TFs encoded by the human genome.
A binding specificity model for a TF should describe its affinity
toward all possible DNA sequences. By assuming that each
TF-DNA base interaction is independent ( Benos et al., 2002;
Roulet et al., 2002 ), TF-binding specificity can be expressed as
a position weight matrix (PWM), which describes the effect of
each base on binding separately. Due to the low resolution of
most existing data ( Jolma and Taipale, 2011 ), it is not clear
how generally applicable this model is ( Badis et al., 2009; Zhao
and Stormo, 2011 ).
Despite the central importance of transcriptional regulation in
development and disease, very little work has concentrated on
Cell 152, 327–339, January 17, 2013 ª2013 Elsevier Inc. 327

8/12/2019 Transkripsi Dna 3
http://slidepdf.com/reader/full/transkripsi-dna-3 2/13
analysis of binding specificities of human TFs. Previous system-
atic studies have concentrated on specificities of TFs from
common model organisms, including yeast, C. elegans,
Drosophila, and mouse ( Badis et al., 2009; Berger et al., 2008;
Grove et al., 2009; Noyes et al., 2008 ). In general, they haveanalyzed bacterially expressed TF-DNA-binding domains
(DBDs), with very few studies analyzing full-length TFs.
In this work, we have systematically analyzed specificities of
most human TFs using a high-throughput SELEX (HT-SELEX)
( Jolma et al., 2010; Jolma and Taipale, 2011; Oliphant et al.,
1989; Tuerk and Gold, 1990 ). Comparison of 79 pairs of experi-
ments for full-length TFs and their DBDs revealed that in general,
the DBD defines the primary DNA-binding specificity. Analysis of
the data revealed that the vast majority of interactions that occur
between a TF andindividual DNA bases are independent of each
other. However, strong base interdependencies were observed
in a stretch of three to five A or T residues flanking the core
binding site in multiple TF classes, consistent with proposed
shape-based recognition of DNA ( Rohs et al., 2010 ). Adjacentbases also deviated more from the independent model than
bases that were farther apart, indicating that base-stacking
interactions have a larger role in TF-DNA binding than what
has been previously appreciated. We also commonly observed
formation of dimers, with strong orientation and spacing prefer-
ences. These preferences could be used to further classify TF
subfamilies that had identical primary specificities. We show
that models incorporating adjacent dinucleotides and dimer
spacing and orientation preferences improve modeling of TF
binding to DNA and that the dimer model can be generalized
to analyze large heteromeric TF-DNA complexes.
RESULTS
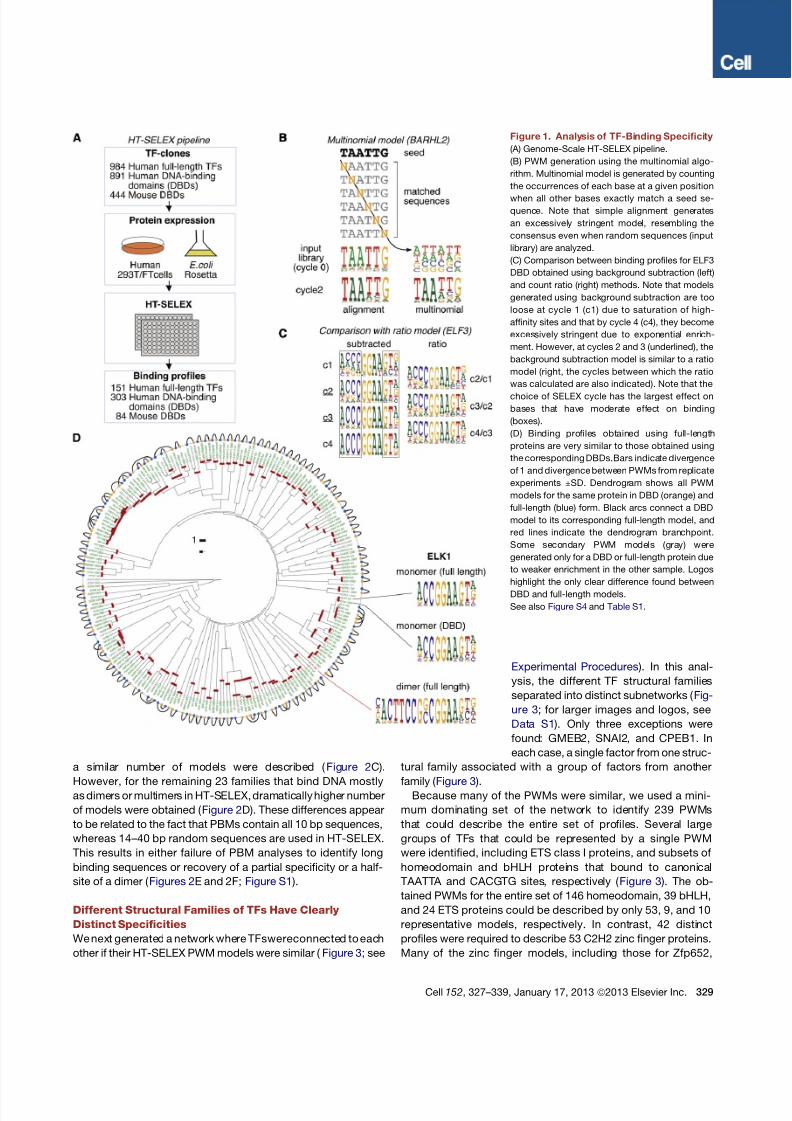
Genome-Scale TF-DNA-Binding Specificity Assay
To determine the binding specificities of mammalian TFs, we
cloned 891 human and 444 mouse DBDs and 984 human full-
length TFs into Gateway recombination vectors and expressed
the corresponding C-terminally tagged proteins in mammalian
cells.As a control, a subsetof these proteins wasalso expressed
in E. coli as N-terminal fusions (see Table S1 available online).
The sequences that the TFs bind to were then determined by
HT-SELEX ( Figure 1 A). Robust enrichment of specific sequences
was observed for 303 human DBDs, 84 mouse DBDs, and 151
human full-length TFs, representing 411 different TFs ( Table
S1 ). In general, a high fraction of experiments was successful
for most TF families ( Table S2 ). Of the large TF familiescomprising more than 30 factors, two had a low success rate:
high-mobility group (HMG), and C2H2 zinc finger proteins. The
results are consistent with many HMG proteins not binding
DNA sequence specifically ( Stros et al., 2007 ) and with earlier
observations that many C2H2 zinc finger proteins do not bind
specific DNA sequences in protein-binding microarray (PBM)
experiments (T.R.H., unpublished data). C2H2 domains are
also known to be used for other purposes than DNA binding,
even in proteins that also contain DNA-binding C2H2 zinc fingers
( Brayer and Segal, 2008; Brown, 2005 ).
To determine primary binding specificities for the factors, we
built a PWM from enriched subsequences using a multinomial
method we have described previously ( Jolma et al., 2010; Fig-
ure 1B; Table S3 ). Matrices were corrected for nonspecific
DNA carryover. The matrices generated using this method
from early SELEX cycles were generally similar to those obtained
by a ratio method, where normalized subsequence countsobserved in a given cycle are divided by normalized counts
observed in the previous cycle ( Figure 1C).
We have previously established that many TFs that bind DNA
as monomers can also bind as homodimers and that the dimers
display strong orientation and spacing preferences ( Jolma et al.,
2010 ). To analyze homodimeric binding globally, we analyzed
the enriched sequences to identify TFs that bound to two
similar sites within a single DNA fragment. The cases where
the dimers displayed clear orientation and spacing preferences
were included in the set of PWMs analyzed further. In total,
we obtained 830 binding profiles for human and mouse TFs
( Table S3 ).
Full-Length TFs and Isolated DBDs Bind SimilarSequences
We next analyzed the similarity between the obtained binding
specificities for full-length proteins and the corresponding
profiles for DBDs using the minimal Kullback-Leibler divergence
(KL) method ( Wei et al., 2010 ). Analysis of profiles for all the 79
human TFs for which both full-length and DBD experiments
were successful revealed that in the vast majority of cases, the
full-length and DBD PWMs were very similar (KL <2). Most differ-
ences between the models were minor ( Figure 1D), being gener-
ally of similar magnitude than those observed between replicate
experiments (KL, 0.51± 0.32). The only clear difference identified
affected a homodimeric site for the ETS factor ELK1 ( Figure 1D).
These results suggest that in most cases, analysis of DBDs is
sufficient for determination of TF-binding specificities.
Analysis of Model Width and Coverage
Analysis of the length and information content of the PWMs re-
vealed that on average, they were 13 bp long and contained
15.6 bits of information ( Figure 2 A; data not shown). There was
a clear correlation between width of the binding profile and its
information content (data not shown), and clear decrease of
information content per base was not observed in longer motifs.
We next determined the fraction of high-confidence human
TFs that are covered by models in our data and in existing data-
bases, including a literature-curated set (JASPAR; Portales-Ca-
samar et al., 2010 ), and a collection based on a high-throughput
approach (PBMs; Badis et al., 2009; Berger et al., 2008 ). Thisanalysis revealed that our data covered approximately two times
larger number of human TFs than PBMs, the largest currently
available systematic data set ( Figure 2B). Because PBM anal-
yses have focused mostly on mouse TFs, we also compared
coverage based on protein similarity, again revealing that our
data set is clearly the largest collection of mouse or human
TFs, covering more than 50% of all high-confidence TFs at
a 90% similarity threshold ( Figure 2B).
To analyze the differences between the PBM and SELEX data
in more detail, we compared separately the number of TFs
(mouse and human) belonging to different structural TF families.
For eight TF families that primarily bind DNA as monomers,
328 Cell 152, 327–339, January 17, 2013 ª2013 Elsevier Inc.
8/12/2019 Transkripsi Dna 3
http://slidepdf.com/reader/full/transkripsi-dna-3 3/13
a similar number of models were described ( Figure 2C).
However, for the remaining 23 families that bind DNA mostlyas dimers or multimers in HT-SELEX, dramatically higher number
of models were obtained ( Figure 2D). These differences appear
to be related to the fact that PBMs contain all 10 bp sequences,
whereas 14–40 bp random sequences are used in HT-SELEX.
This results in either failure of PBM analyses to identify long
binding sequences or recovery of a partial specificity or a half-
site of a dimer ( Figures 2E and 2F; Figure S1 ).
Different Structural Families of TFs Have Clearly
Distinct Specificities
We next generated a network where TFswereconnected to each
other if their HT-SELEX PWM models were similar ( Figure 3; see
Figure 1. Analysis of TF-Binding Specificity
(A) Genome-Scale HT-SELEX pipeline.
(B) PWM generation using the multinomial algo-
rithm. Multinomial model is generated by counting
the occurrences of each base at a given position
when all other bases exactly match a seed se-quence. Note that simple alignment generates
an excessively stringent model, resembling the
consensus even when random sequences (input
library) are analyzed.
(C) Comparison between binding profiles for ELF3
DBD obtained using background subtraction (left)
and count ratio (right) methods. Note that models
generated using background subtraction are too
loose at cycle 1 (c1) due to saturation of high-
affinity sites and that by cycle 4 (c4), they become
excessively stringent due to exponential enrich-
ment. However, at cycles 2 and 3 (underlined), the
background subtraction model is similar to a ratio
model (right, the cycles between which the ratio
was calculated are also indicated). Note that the
choice of SELEX cycle has the largest effect on
bases that have moderate effect on binding
(boxes).
(D) Binding profiles obtained using full-length
proteins are very similar to those obtained using
the corresponding DBDs.Bars indicate divergence
of 1 and divergence between PWMs from replicate
experiments ±SD. Dendrogram shows all PWM
models for the same protein in DBD (orange) and
full-length (blue) form. Black arcs connect a DBD
model to its corresponding full-length model, and
red lines indicate the dendrogram branchpoint.
Some secondary PWM models (gray) were
generated only for a DBD or full-length protein due
to weaker enrichment in the other sample. Logos
highlight the only clear difference found between
DBD and full-length models.
See also Figure S4 and Table S1.
Experimental Procedures ). In this anal-
ysis, the different TF structural families
separated into distinct subnetworks ( Fig-
ure 3; for larger images and logos, see
Data S1 ). Only three exceptions were
found: GMEB2, SNAI2, and CPEB1. In
each case, a single factor from one struc-
tural family associated with a group of factors from another
family ( Figure 3 ).Because many of the PWMs were similar, we used a mini-
mum dominating set of the network to identify 239 PWMs
that could describe the entire set of profiles. Several large
groups of TFs that could be represented by a single PWM
were identified, including ETS class I proteins, and subsets of
homeodomain and bHLH proteins that bound to canonical
TAATTA and CACGTG sites, respectively ( Figure 3 ). The ob-
tained PWMs for the entire set of 146 homeodomain, 39 bHLH,
and 24 ETS proteins could be described by only 53, 9, and 10
representative models, respectively. In contrast, 42 distinct
profiles were required to describe 53 C2H2 zinc finger proteins.
Many of the zinc finger models, including those for Zfp652,
Cell 152, 327–339, January 17, 2013 ª2013 Elsevier Inc. 329

8/12/2019 Transkripsi Dna 3
http://slidepdf.com/reader/full/transkripsi-dna-3 4/13
Figure 2. Comparison of Coverage of TFs
(A) Histogram showing the distribution of PWM model widths. Note that TFs prefer even (blue) over odd (red) widths due to palindromic sites and that a width of
10 bp corresponding to a single turn of a DNA helix is the most common. Note also that the specificity of most TFs extends beyond 10 bp.
(B) Coverage of human high-confidence TFs by JASPAR CORE (left bars), PBM (middle bars), and HT-SELEX (right bars) at indicated thresholds.
(C)Numberof TFsfor whicha model hasbeenderivedusing PBMor HT-SELEX.ColorsindicatedifferentstructuralTF familiesthat bindDNA primarilyas monomers.
(legend continued on next page)
330 Cell 152, 327–339, January 17, 2013 ª2013 Elsevier Inc.

8/12/2019 Transkripsi Dna 3
http://slidepdf.com/reader/full/transkripsi-dna-3 5/13
ZNF410/APA1, ZKSCAN3/ZNF306, ZNF282, ZNF232, ZBTB49/
ZNF509, ZNF524, and ZNF713, that we identify here were
dissimilar to any model described previously ( Data S1 ).
We also generated a similar network that included also exist-
ing literature curated and PBM data on human and mouse TFspecificities ( Figure S2 ). This analysis revealed that our data
were in broad agreement with the more limited information on
TF-binding specificities that had been described before. Most
clear differences could be explained by the lower resolution of
the previously used methods ( Figure S1 A), shorter sequence
length analyzed ( Figure S1B), or issues related to the conversion
of raw PBM data into PWM form ( Figure S1C).
Conservation of Binding Specificities
Analysis of HT-SELEX-derived PWMs revealed that in all tested
cases, the mouse and human ortholog-binding specificities were
similar ( Figure 3, compare triangles and circles). The lack of
differences was not due to our inability to detect them because
we dididentifya difference that was causedby a missense muta-tion in our Egr1 clone. The mutation affects a DNA-contacting
residue but is not found in mouse reference genome or SNPs,
indicating that the mutation is either private or introduced in
cloning ( Data S1; Table S1 ).
Classification of TFs Based on Their DNA-Binding
Specificities
We have previously classified the ETS family of TFs into four
classes based on two independent analyses of their binding
preferences ( Wei et al., 2010 ). Our SELEX analysis of 24 mem-
bers of the 27 ETS family TFs corroborates these four classes
( Figure 4 A). However, even within this well-studied group of
factors, we could identify additional novel specificity determi-
nants for three out of the four classes ( Figure 4 A; Data S1 ).
We could also identify other families that displayed clear one-
to-one relationships between proteins and binding specificity
models. For example, five classes of GLI-like C2H2 zinc fingers,
four main classes of basic-helix-loop-helix (bHLH) proteins, four
classes of PAX proteins, and two classes each of E2Fs, HSFs,
MADS proteins, CUT+homeodomains, and SP/KLF/EGR C2H2
zinc fingers could be clearly identified ( Figure 3; Data S1 ).
Classification of TFs Based on Dimer Spacing and
Orientation
Dimer orientation and spacing preferences could be used to
further classify some factors that showed similar monomer-
binding specificities. For example, the ETS class I factors ERG,ETS1, and ELK1 preferred to bind to different homodimeric sites
( Figure 4 A; see also Babayeva et al., 2010; Jolma et al., 2010;
Lamber et al., 2008 ). Similarly, both T box factors and forkhead
proteins displayed one type of monomer specificity but seven
and three distinct dimeric spacing/orientation preferences,
respectively ( Figure 4B; Data S1 ).
In some cases, both spacing and orientation preferences, and
the monomer sites/half-sites, could vary. For example, RHD
family factors could be classified to NFAT and NF-kB subgroupsbased on half-site specificity, and the NFAT subgroup further
diverged to two distinct orientation and spacing preference
groups ( Data S1 ). Similarly, nuclear receptors could be classified
to 12 groups, based on eight different half-site specificities and
five different spacing groups within factors that specifically
bound one type of half-site ( Data S1 ). Homeodomains could
also be subclassifiedbasedon monomer specificity and spacing
and orientation preferences ( Figure 3; Data S1 ).
For posterior homeodomains ( Data S1 ), POU+homeodomains
( Data S1 ), and bZIP proteins ( Figure 4C; Data S1 ), classifica-
tion was more complex because factors shared partially overlap-
ping sites. For example, many bZIP proteins could bind to two
distinct sites and be classified based on the sets of sites that
they bind to. Their specificities were arranged in a tiled pattern,based on both overlapping half-site and spacing preferences
( Figure 4C).
Independence of DNA Base Positions in TF Binding
To analyze how independently different base pairs bind to TFs,
we compared observed counts of nucleotide pairs to the corre-
sponding nucleotide pair counts expected based on a PWM
( Figure 5 A). Plotting of the observed counts against the expected
counts revealed that the PWM was a good model for the vast
majority of position pairs ( Figure 5B).
Furthermore, calculation of the correlation between the nucle-
otide pair counts observedand predictedfrom thePWM foreach
pair of bases in all TF models revealed that only 0.9% of all pairs
had a correlation coefficient that was lower than 0.9 (data not
shown). PWM was particularly effective at modeling bases sepa-
rated by more than three bases. Bases that were closer together
displayed a somewhat larger deviation from the PWM model,
with the largest difference observed for directly adjacent bases,
with 5% of counts deviating from expected by more than 2-fold
( Figure 5C; data not shown). These results indicate that TFs in
general bind to base pairs independently of each other and
that the strongest deviations from this model affect adjacent
bases.
Deviations from the PWM Model
Although the PWM model explained pairs of bases well in most
cases, some pairs displayed more than 5-fold deviations (ex-pected/observed) from the PWM-based predictions. Such pairs
were identified in several structural TF families.
The most striking case was SOX proteins. All SOX proteins
bound to head-to-head pseudopalindromic sites ( Data S1 ),
(D) Number of TFs for whicha model has been derived using PBM or HT-SELEX. Colors indicate different structural TF families that bind DNA primarily as dimers
or multimers in HT-SELEX.
(E) PBM identifies only partial specificities for TFs with long binding sites. HT-SELEX, PBM primary (PBM 1), PBM secondary (PBM 2), and ChIP-seq models are
shown. Box indicates sequence that is misaligned to generate a palindromic PBM site that is inconsistent with SELEX.
(F) PBM identifies only half-sites for TFs that bind DNA as homodimers.
Insets in (E) and (F) are ROC curves showing enrichment of specific ChIP-seq peaks by the different in vitro PWMs.
See also Figure S1 and Table S2.
Cell 152, 327–339, January 17, 2013 ª2013 Elsevier Inc. 331

8/12/2019 Transkripsi Dna 3
http://slidepdf.com/reader/full/transkripsi-dna-3 6/13
which displayed an extremely strong correlation (>100-fold
difference) between a dinucleotide that was present in one
half-site with the corresponding dinucleotide in the other half-
site, even though they were 9 or 10 bp apart. This effect is prob-
ably not mediated by a protein dimer but by base pairing in
a stem loop formed from single-stranded DNA ( Figure S1D).
We could further identify four different sources of correlations
between bases. Thefirst twotypes were associated with dimeric
binding. The first was characterized by asymmetric binding of
monomersin a tightly packeddimer(e.g., FLI1, MEIS2,PKNOX2)
and could be modeled with a PWM that is nonpalindromic ( Fig-
ure S3 ). The second type was due to the ability of some factors
to bind to twodistinct half-sites (e.g.,HNF4A, many bZIP factors;
data not shown).
Thethird type of base pair interdependency waslinked to DNA
binding by the homeodomain recognition helix. Strong
Figure 3. Network Representation of the Similarity of the Obtained PWMs
Diamonds indicate TF genes, and other nodesindicate individualPWMs; colors indicate TF family (bottom right). Models for human full-length TFs (large circles),
DBDs(small circles),and mouse DBDs (triangles) areshown; representativemodels areindicated byblackoutline.Edgesare drawnbetweena TF andits models,
and between similar models. Subnetworks are named by family; where necessary, subfamilies are indicated with numbers or partial consensus sequences
(orange typeface). Note that TFs cluster almost exclusively with other TFs of the same family (boxes; box in dotted line indicates that only some PAX proteins
contain homeodomain). The three cases where a member of a class is included in a subnetwork composed of members of another class are indicated by redtypeface. Fraction of TFs with models (top left of each box), total number of models (top right, above), and number of representative models (below) are also
shown for each family. The three largest groups of models that are very similar to each other are circled (dotted line). See also Figure S2, Table S3, and Data S1.
332 Cell 152, 327–339, January 17, 2013 ª2013 Elsevier Inc.

8/12/2019 Transkripsi Dna 3
http://slidepdf.com/reader/full/transkripsi-dna-3 7/13
correlations between adjacent bases were observed forBARHL2 ( Figure 5 A). Similarly, all posterior homeodomains
(HOX9–HOX13) displayed strong correlations between bases
located 50 of the shared TAAAA subsequence ( Figure 6 A).
The fourth type of binding poorly explained by a PWM was the
flanking ofmany TFcoresequenceswitha stretch ofthree to five
A or T bases ( Figure 6B). Such sequences are predicted to
narrow the minor groove of DNA, a feature that has been linked
to shape-based DNA recognition ( Rohs et al., 2010 ). Consis-
tently, sequences favoring a narrow minor groove such as TTT
or AAA were enriched much more than combinations of the
same bases that result in much wider minor groove ( Figure 6C;
data not shown). Such A or T stretches also affected TF-DNA
binding in vivo; core sequences enriched in ChIP-seq peaksfor SPI1 ( Wei et al., 2010 ), MAFG, and E2F7 ( Figure 6B) were
flanked with multiple As.
Models that Take into Account Deviations from the PWM
Model
Given that adjacent nucleotides can affect each others’ binding
to a TF, and that many TFs bind to sequences that cannot be
modeled by a standard mononucleotide model (PWM, a zero-
order Markov model), we next tested whether the A stretch
sequences could be explained by a model that takes into
account adjacent bases.We first generated an adjacent dinucle-
otide model (ADM) for E2F3 from dinucleotide pair data. The
Figure 4. Classification of TFs Based on Their Binding Profiles
(A) ETS factors. Network analysis similar to that shown in Figure 3 indicates that HT-SELEX can accurately identify the four known ETS subclasses (indicated by
colored ovals). Additional specificity determinants in classes II, III, and IV are indicated by brown brackets, and a novel dimer in ETV6 (class II) and two novel
putative dimers in SPDEF (class IV) are indicated by brown dotted lines. Box indicates three different homodimeric sites within class I. Logos for representative
PWM models are shown; green and gray arrows indicate GGA(A/T) and AGAA sequences, respectively.
(B) Classification of T box TFs based on dimer orientation and spacing. Left panel shows amino acid similarity dendrogram of T box DBDs. TFs for which models
werenot obtained arein gray. Middlepanel showsheatmapdisplaying spacing and orientation(arrows) preferences of the enriched GGTGTG subsequences (red
indicates max counts; green indicates 0); scale represents distances between the subsequence starting points. Right panel shows PWM describing most en-
riched dimeric binding site for each TF.
(C)A subsetof bZIP TFsrecognizes twotypes of targetsites in a tiled pattern, covering four sitetypes. Arrowsabovethe logos indicate half-sites; black specifies
TTAC, blue designates ATGAC,and redshowsGCCAC. Note that JDP2, CREB3,XBP1,CREB3L1, andCreb3l2eachcan bind to twodifferent sitetypes, forming
a tiled pattern ranging from TRE element (top) to G box. Most TF nodes in (A) and (C) are omitted for clarity; for details, see Data S1.
Cell 152, 327–339, January 17, 2013 ª2013 Elsevier Inc. 333

8/12/2019 Transkripsi Dna 3
http://slidepdf.com/reader/full/transkripsi-dna-3 8/13
ADM is a series of first-order Markov chains that allows scoring
of k-mers that are shorter than the model itself ( Table S4 ). Plot-
ting of the observed 10-mer counts for E2F3 against those ex-
pected from both PWM and ADMs revealed that the ADM was
better at modeling the enrichment of 10-mer subsequences
than a standard PWM ( Figures 7 A and 7B).
We next tested whether orientation and spacing preference
matrix could be used to improve prediction of sequences en-
riched by TBX20, a factor that binds to a dimeric site where
the same monomer is found in multiple different orientation
and spacing configurations. For this purpose, we generated
expected-observed plots for all possible combinations of two
4-mers with gaps of different length between them (gapped
8-mers). A model that incorporated spacing and orientation
preferences ( Table S4 ) described enriched gapped 8-mers
much better (R
2
= 0.67 compared to 0.44) than a simple PWM( Figures 7C and 7D).
DISCUSSION
We report here high-resolution DNA-binding specificity for
a large fraction of human TFs. Given the fact that proteins
related in amino acid sequence generally bind to similar sites,
we estimate that this resource represents the majority of all
human TF-binding specificities. We also identify additional
determinants of specificity for many factors for which a partial
binding specificity was known before. The models described
here are generated from a large number of sequences
(average >7,000) and are of higher resolution than the existing
SELEX-derived PWM models, which are affected by much
higher Poisson error due to the low number of sequences
analyzed (mostly 10–50).
Prior to this work, very few experiments have addressed
binding specificities of human full-length TFs. Out of the 151
human full-length TFs that we obtained profiles for, previous
high-resolution binding data exist only for ETS1 and GABPA
( Wei et al., 2010 ). Of the 303 human DBDs we model here, 22
have been profiled previously ( Portales-Casamar et al., 2010 ).
Previous data for 78 and 311 TFs exist from human or mouse,
respectively ( Badis et al., 2009; Berger et al., 2008; Wei et al.,
2010 ). Of all the 830 PWMs, 406 are similar to 1 or more of the
500 PWMs described before for homologous TFs; the remaining
424 profiles, representing 228 TFs, were different from any
model that has been described before ( Figure S2; SSTAT covari-ance <1.5 3 105 ).
Much of the existing data are derived using PBMs containing
all possible 10 bp subsequences ( Berger et al., 2006 ). Our
results are generally in good agreement with the PBM data
for TFs that bind to short sites. However, we find here that
more than half of all binding models for TFs are >10 bp in length,
suggesting that specificity of many TFs cannot be fully deter-
mined using PBMs. Consistently with this, the coverage of
PBM models is very low for families that bind to DNA as dimers,
and in many cases, the reported PBM model describes partial
specificity or half-site. Many dimeric sites identified by HT-
SELEX in this work had been identified before and/or were
Figure 5. Global Analysis of Base Interdependency
(A) Analysis of interdependence of base positions. Nucleotide pair counts were generated for each pair of bases in such a way that bases that were not counted
exactly matched the seed (left). Observed counts for each pair were then compared to those expected from mononucleotide distribution (bottom). Note that
mononucleotide distribution cannot be used to generate accurate nucleotide pair counts for BARHL2-binding positions 4 and 5 (heatmaps; black is low, and
green is high) due to a preferential binding of BARHL2 to taaACg or taaTTg (red) over taaATg and taaTCg (blue).
(B)In general, basesbind to TFsindependentlyof each other. A densityplot of counts observed versus counts expected from a PWMmodel for allpossible pairs
of base positions within all of the models generated in this study. Density (z axis;indicated both by height and by colors forclarity) of points in the x-y plane (log10counts) is extremely concentrated at the diagonal, indicating that the vast majority of positions do not materially affect binding at other positions. Inset shows
heatmap of the same data.
(C) A boxplot showing log2 fold change of count expected from a PWM model over observed count as a function of distance of the analyzed bases indicates that
adjacent bases have stronger effect on each other than bases that are farther apart. Boxes indicate the middle quartiles, separated by median line. Whiskers
indicate last values within 1.5 times the interquartile range from the box.
334 Cell 152, 327–339, January 17, 2013 ª2013 Elsevier Inc.

8/12/2019 Transkripsi Dna 3
http://slidepdf.com/reader/full/transkripsi-dna-3 9/13
validated by ChIP-seq ( Figure S4 ), indicating that HT-SELEXallows analysis of multimeric binding sites spanning 20 bp or
more, which is beyond the capacity of any unbiased array
technology.
TF-DNA-Binding Specificity Is Determined by the DBD
Some previous studies analyzing individual proteins have
found that a TF and its isolated DBD bind to similar sequences
(see, for example, Badis et al., 2009; Wei et al., 2010 ). On the
other hand, some reports have found differences even
between splicing variants of the same TF ( Gigue ` re et al.,
1995 ). Most in vitro analyses of TF binding to date have
analyzed specificity of isolated DBDs, whereas in vivo methods
Figure 6. Examples of Base Pair Interde-
pendencies in TF-DNA Binding
(A) Posterior homeodomains exhibit strong corre-
lations between bound positions. Diamonds
represent the indicated posterior homeodomain
proteins, and circles represent enriched 9-mersequences(circles,first four basesshown, last five
bases are TAAAA). Edges are drawn between k-
mer nodes if their Hamming distance is 1, and
between a protein and a k-mer node if the k-mer is
enriched by the protein. Edges between protein
and k-mer nodes are colored for clarity, and their
thickness represents the extent of the enrichment.
Logos indicate two different PWM models for
HOXB13 that are built using nonoverlapping
sequences (blue and red).
(B) A stretch of A or T bases (box, red line above
logos) is commonly observed adjacent to core TF-
binding sites (blue line). Models generated using
ChIP-seq (short) followed by motif discovery are
shown below HT-SELEX-generated models (tall).
SPI1 motif is from Wei et al. (2010).
(C) The bases are not independently bound
but, instead, display a preference for a stretch of
either A or T. Expected-observed plot for E2F3
describing 4-mers that precede the sequence
GGCGCC. Note that AAA(T) and TTT(T) are
strongly preferred over combinations such as
AAT(T). The (T) is part of the E2F3 core. Bottom
view shows binding motifs (middle) representing
the three enriched combinations of core and
flanking sequences and their relative frequencies
(right).
See also Figure S3.
such as ChIP-seq have necessarily
studied full-length TFs. Based on these
results, it has not been possible to
determine whether full-length TFs bind
to different sites than isolated DBDs
because observed differences in binding
could be due to the differences in
protein length or experimental method.
Our analysis of 79 pairs of full-length
TFs and DBDs revealed that the primary
binding specificity of TFs is defined by
the DBD. We found only one case,
ELK1, where the specificity of full-length TF and DBD wasclearly different.
Conservation of Binding Specificities
TF-binding specificities evolve very slowly (see, for example,
Amoutzias et al., 2007; Bohmann et al., 1987; Struhl, 1987 ).
Nevertheless, some examples of divergence of specificity exist
in the literature ( Solano et al., 1995 ), and systematic analysis of
the divergence of specificities using current data has been
hampered by the fact that the observed differences could be
due to the different methods used to study orthologous TFs.
Despite the morphological differences between mouse and
human, we did not observe any clear cases where the binding
Cell 152, 327–339, January 17, 2013 ª2013 Elsevier Inc. 335

8/12/2019 Transkripsi Dna 3
http://slidepdf.com/reader/full/transkripsi-dna-3 10/13
specificity has changed between human and mouse. However,
we did observe several cases where dimer orientation and
spacing preferences were divergent between paralogous TFs,
suggesting that dimer orientation and spacing preferences
evolve faster than primary binding specificities.
Classification of TFs Based on Binding Specificities
Clustering of TFs based on their binding specificities classifiedthem to the known structural families. Many TF families could
also be further subclassified based on more subtle differences
in specificity within the families ( Figure 3 ) or on a combination
of monomer specificity and spacing and orientation preferences.
For example, nuclear receptors are known to bind to dimeric
sites that vary in both specificity and spacing of the half-sites
( Pardee et al., 2011 ). Clear classification of nuclear receptors
to different specificity groups has, however, not been accom-
plished. The systematic analysis described here allowed
classification of nuclear receptors to 12 classes based on
a combination of half-site and dimer orientation and spacing
preferences. Similarly, although all T box proteins bound to iden-
Figure 7. Comparison of Models for TF
Binding
(A and B) ADM (B) more accurately describes
enrichment of 10 bp subsequences by E2F3 than
a conventional PWM (A). In adjacent dinucleotide
logo (B), mononucleotide positions that do notexplain dinucleotide counts are separated and
black edges drawn to indicate the preferred dinu-
cleotides.Gray edges represent dinucleotides that
are common but not overrepresented. Thickness
of the edges represents the frequency of the indi-
cated dinucleotide; very thin edges are not drawn
for clarity.
(C and D) A model consisting of a monomer PWM
(canonical monomer target of T box indicated by
red arrow)and a spacing andorientationmatrix (D)
can explain enrichment of gapped 8-mers (4-mer-
gap-4-mer) much better than a simple monomer
PWM model (C). Heatmap indicates preferred
orientations and spacings of the monomers; scale
indicates difference in monomer start positions.
Red lines indicate least-squares fit; correlation
coefficientsare also shown.Plotsin allpanels have
logarithmic axes to facilitate visualization; the R2
values are from the corresponding linear data.
See also Table S4.
tical half-sites, seven different classes
could be identified based on spacing
and orientation preferences ( Figure 4B).
ETS class I proteins also displayed three
distinct dimer orientations and spacings
( Figure 4 A).
A more complex classification of
factors was necessary for bZIP proteins,
which are known to vary in both speci-
ficity and spacing of the half-sites
( Amoutzias et al., 2007; Badis et al.,
2009; Kim and Struhl, 1995 ). We find
here that many bZIP proteins bind to two sites and that the spec-
ificities form a tiled pattern, where in many cases, two factors
shared one site and also each bound to another separate site.
Such a tiled organization of TF specificity allows a complex
control of target genes based on the expression and activity of
the particular bZIP factors present in a given cell.
Multiple Binding ModesThe large number of selected sequences, and the large number
of factors studied, allowed us also to perform a global genome-
wide analysis of common features that are important for recog-
nition of DNA by TFs. It has previously been suggested that
many TFs recognize distinctly different sequences ( Badis et al.,
2009 ), but this view is controversial ( Zhao and Stormo, 2011;
Morris et al., 2011 ). Analysis of our data reveals that multiple
PWM models are not needed to explain high-affinity binding of
most TFs to DNA. However, multiple binding modes exist for
many factors (e.g., bZIP proteins), and most such cases are
due to the ability of a factor to bind to both a monomeric and
a dimeric site, and/or multiple different dimeric configurations.
336 Cell 152, 327–339, January 17, 2013 ª2013 Elsevier Inc.

8/12/2019 Transkripsi Dna 3
http://slidepdf.com/reader/full/transkripsi-dna-3 11/13
Structure-Based DNA Recognition
It is well established that TFs have two primary ways to interact
with DNA: a non-sequence-specific interaction with the back-
bone, and a sequence-specific interaction with the bases ( von
Hippel and Berg, 1989 ). The latter is often linked to directhydrogen bonding between specific DNA bases and DBD amino
acids. Most such interactions occur viathe major grooveof DNA,
which is often expanded by an insertion of a DBD recognition
helix or loop. A third type of binding that depends on DNA minor
groove shape and confers partial sequence specificity has been
suggested based on analysis of crystal structures of protein-
DNA complexes ( Aggarwal et al., 1988; Rohs et al., 2009; Zheng
et al., 1999 ). We find here that such interactions are indeed very
common in different TF families and determine their effects on
DNA-binding specificity for the first time.
The common DNA structure-based-binding motif is character-
ized by a core-binding sequence of a TF being flanked by
a stretch of either A or T bases. Such interactions are potentially
important in formation of consecutive TF-binding sites in regula-tory elements. Because this type of recognition of DNA is based
on DNA shape, it is also likely that the base preferences of TFs in
these regions can be affected by DNA shape changes induced
by binding of multiple TFs in close proximity to each other (see
also Slattery et al., 2011 ). Furthermore, due to the fact that TFs
can read the minor groove without opening the DNA, such inter-
actions may also increase speed by which TFs locatetheir target
sites (see Elf et al., 2007 ).
Posterior Homeodomain Proteins and CDX
We also identifiedanother type of correlation between bases that
was due to recognition of DNA without hydrogen bonding. All
posterior homeodomain proteins (HOX9–HOX13) bound to two
types of sites in a partially overlapping pattern. These sites could
not be adequately described by a single PWM. Specificities
between paralogous HOX proteins (e.g., HOXA13, HOXB13,
HOXC13, and HOXD13) were similar to each other, but clear
differences were observed between each of HOXs 9, 10, 11,
12, and 13. These differences, combined with proposed latent
differences in anterior HOX specificity ( Slattery et al., 2011 ),
potentially explain the differences in target specificity of the
collinear HOX series.
Interestingly, the parahox CDX proteins that are evolutionarily
related to posterior HOX proteins bound to only one type of site
that was shared by HOX9 and HOX10 ( Figure 6 A), suggesting
that a partial overlap between the bound sequences has been
specifically selected for. Such a partial overlap is also observedbetween zinc fingers and other TFs, and many TFs in the bZIP
family (see above), suggesting that such an arrangement is
a common feature of human transcriptional networks.
Role of Base-Stacking Interactions in TF-DNA Binding
In addition to large deviations from the PWM model described
above, the large number of sequences analyzed allowed us to
identify a general tendency of adjacent bases to affect each
other ( Figure 5C). The effect of dinucleotide composition on
DNA structure is well established ( Geggier and Vologodskii,
2010 ), and dinucleotides are commonly used to predict a large
number of properties of DNA, including geometry of the base
pairs and melting temperature ( Zheng et al., 2010 ). No clear
preference toward or away from any given dinucleotide was
found (data not shown), suggesting that TFs do not have
a general preference toward a particular structural feature.
Our results indicate that although the primary interactionsbetween TF andDNA occur between individual bases andamino
acids, and that independent binding of DNA bases by TFs is
generally a good approximation ( Benos et al., 2002; Roulet
et al., 2002 ), adjacent bases deviate from this assumption in
a manner that is important for quantitative analyses of TF-DNA
binding. Thus, in addition to determining base pair geometry
and structural features of DNA, adjacent dinucleotides play
a role in DNA recognition by TFs. Our results also suggest that
systems-biological models of TF-DNA binding based on dinucle-
otides should perform better in prediction of occupied TF sites
than models based on conventional PWMs.
Computational Modeling of Binding
The binding of TFs to DNA is commonly modeled based ona PWM that assumes independence of binding of protein to indi-
vidual bases. Several alternative models that do not make this
independence assumption and, instead, use a larger set of
parameters to describe TF-DNA binding have been developed
(see, for example, Agius et al., 2010; Roulet et al., 2000; Sharon
et al., 2008 ). Based on our observation that adjacent bases
commonly affect each other, and that many TFs bind DNA as
monomers or dimers, we developed here two models for TF
binding that incorporate these features. The first model is
a simple replacement for a PWM that is based on a first-order
Markov chain. This model takes into account the effect of adja-
cent bases and models binding of factors that bind to A or T
stretches significantly better than a conventional PWM.
The second model we developed takes into account the
spacing and orientation preferences of dimeric sites. This
improves models for TFs that bind to DNA both as monomers
and dimers or as multiple different dimers. This model can be
generalized to heterodimers and chains of TFs of arbitrary type.
The advances in modeling TF-DNA interactions, together with
the systematic resource of human TF specificities we describe
here, will enable building of more accurate systems-biological
models of TF-DNA binding and transcription, thus representing
a major step toward decoding of the second, regulatory, genetic
code—the code that determines gene expression based on
genomic sequences.
EXPERIMENTAL PROCEDURES
Cell Culture, Constructs, and Protein Expression
Human LoVo colon carcinoma and human embryonic kidney-derived 293T
(ATCC; CRL-11268) and 293FT cells (Invitrogen; R700-07) were cultured in
DMEM with 10% FBS and antibiotics.
Collection consisting of 984 human full-length TFs and 891 DBDs was
cloned by PCR from Mammalian gene collection, ORFeome, Megaman
cDNA library, or by gene synthesis ( Table S1 ). Another collection composed
of 444 mouse DBDs was generated by PCR from templates described earlier
by Badis et al. (2009) and Berger et al. (2008). Constructs were sequenced
using capillary sequencing (National Public Health Institute, Finland, and
MWG, Germany).
Forproteinproduction, cellsweretransfectedin 6-well plates usingpolyethy-
leneimine (25 kDa; Sigma-Aldrich) with cDNAs in pDEST40-Gau-SBP ( Jolma
Cell 152, 327–339, January 17, 2013 ª2013 Elsevier Inc. 337

8/12/2019 Transkripsi Dna 3
http://slidepdf.com/reader/full/transkripsi-dna-3 12/13
et al., 2010 ) or pcDNA3.1-3xFLAG, followed by culture for 2 days and lysis in
1% TritonX-100, 150mM NaCl, 50mM Tris-Cl (pH7.5)with proteaseinhibitors
(cOmpleteEDTA-free;Roche).Cell lysates wereeitherdeep-frozenat 80C or
used directly. Expression levels of proteins were monitored by luminescence
(Renilla Luc assay, Promega; EnVision, PerkinElmer). A subset of 17 and 2
DBDs was expressed as N-terminal thioredoxin-hexahistidine or GST fusionsusing E. coli , respectively (see Extended Experimental Procedures; Table S1 ).
ChIP-Seq
ChIP-seq for MAFG (antibody: Santa Cruz Biotechnology; sc-22831 X), MAFK
(Abcam; ab50322), GMEB2 (Abcam; ab50592), GRHL1 (Abcam; ab77762),
HNF1A (Santa Cruz Biotechnology; sc-22840 X), p53 (Santa Cruz Biotech-
nology; sc-135773 X), HNF4A (Santa Cruz Biotechnology; sc-8987), and
E2F7 (Santa Cruz Biotechnology; sc-66870 X) was performed essentially as
described in Tuupanenet al.(2009) andJ.Y.,M.E., andJ. Taipale, unpublished
data. After sequencing (Illumina GAIIX or Hiseq2000), 4 bp index sequences
were removed, and the remaining 33 bp sequences were mapped to the
hg18 human reference genome using BWA: mapping quality threshold 20; 30
bases were trimmed (quality score threshold 20). Duplicate reads were
removed to exclude artifactual peaks and to limit PCR bias. Peaks were
called using MACS ( Zhang et al., 2008 ), and the motifs generated using
MEME, using 61 bp sequences centered on the 500 most enriched peaks
(parameters: -revcomp -dna -minw 5 -maxw 20).
HT-SELEX
Detailed SELEX protocol and data analysis are presented in Extended Exper-
imental Procedures. Plate-based HT-SELEX was performed essentially as
described in Jolma et al. (2010), except that 14, 20, 30, or 40 bp randomized
regions were used. For E. coli -produced proteins, a bead-based SELEX
protocol was used. Selection ligands contained a 5–6 and 0–3 bp bar code
before and after the randomized region, respectively ( Table S1 ).
Raw sequencing data (Illumina GAIIX or Hiseq2000) were binned according
to bar codes and analyzed using IniMotif for quality control (see Jolma et al.,
2010 ), identification of the most enriched 6–12 bp subsequences, and gener-
ation of primary and secondary PWM models. Final PWM models were gener-
ated using the multinomial model ( Jolma et al., 2010 ); cycle and seed
sequences are indicated in Table S3.
Nucleotide pairs were counted using the same seed that was used to
generate the matrices. Seed was matched exactly outside of the nucleotide
pair considered, and the instances of each of the 16 nucleotide pairs were
counted. The mononucleotide model describing the nucleotide pairs was
generated from the pair counts, and expected nucleotide pair counts were
then predicted from this model. The adjacent dinucleotide Markov model
( Table S4 ) was generated by normalizing adjacent nucleotide pair frequencies
to generate initial and conditional probabilities.
The connecting matrix model describes the dependence of dimeric binding
affinityon spacing andorientation of thetwo bindingsitesusinga cooperative-
binding(cob) table,which hasa rowfor eachorientationo (Head-to-Tail,Head-
to-Head, andTail-to-Tail) anda columnfor each spacing (distanced = 1, 2,. )
for a previously obtained monomer PWM. The total score for a dimer site is
given as the sum of the PWM scores and the score cob o,d according to the
orientation o and spacing d of the two binding sites of the dimer.
Coverage and Similarities between Binding Specificities
To assess the coverage of the model collection, we retrieved the number of
human high-confidence TFs (category A; Vaquerizas et al., 2009 ) that have
one or more motifs (HT-SELEX, UniProbe, or JASPAR) for the given TF or
a closely related TF (sequence identity = 1 and similarity >0.9, respectively).
The difference between DBD and full-length protein-derived PWMs was
analyzed using KLdistance( Weiet al., 2010 ) and comparedto replicateexper-
imentsfor six DBDs (TFAP2A, HES5, ESRRA, CREB3L1, ELK1, HOXD12) from
different TF families. For comparison between all profiles, we used SSTAT
( Pape et al., 2008 ), which differentiates better between monomers and dimers.
A minimum dominating set, consisting of 239 PWMs, was found by transform-
ing the problem into an integer linear-programming problem, which was then
solved optimally using GLPK LP/MIP solver, v.4.43. Detailed computational
methods are described in Extended Experimental Procedures.
ACCESSION NUMBERS
Sequencing data has been deposited to ENA under accession numbers
ERP001824 and ERP001826.
SUPPLEMENTAL INFORMATION
Supplemental Information includes Extended Experimental Procedures, four
figures, and four tables and one interactive data file can be found with this
article online at http://dx.doi.org/10.1016/j.cell.2012.12.009.
ACKNOWLEDGMENTS
We apologize to the authors of original work not cited. Due to the broad scope
of this work, and editorial limits on citations, we were largely limited to citing
review articles, databases, and more recent original articles not yet reviewed
or incorporated into databases. We thank Drs. M. Taipale, M.O. Lombardia,
and B. Schmierer for critical review of the manuscript, and R. Nurmi,
S. Miettinen, A. Zetterlund, S. Talukder, G. Breard, A. Yang, A. Cote, and
H. Zheng for technical assistance. This project was supported by Academy
of Finland, Knut and Alice Wallenberg Foundation, Vetenskapsra ˚ det, Cancer-
fonden, ERC Advanced Grant GROWTHCONTROL, the EU FP7 project
SYSCOL to J. Taipale, and CIHR Operating Grant MOP-77721 to T.R.H.
Received: May 25, 2012
Revised: August 18, 2012
Accepted: December 3, 2012
Published: January 17, 2013
REFERENCES
Aggarwal, A.K., Rodgers, D.W., Drottar, M., Ptashne, M., and Harrison, S.C.
(1988). Recognition of a DNA operator by the repressor of phage 434: a view
at high resolution. Science 242, 899–907.
Agius, P., Arvey, A., Chang, W., Noble, W.S., and Leslie, C. (2010). High reso-
lution models of transcription factor-DNA affinities improve in vitro and in vivo
binding predictions. PLoS Comput. Biol. 6, e1000916. Amoutzias, G.D., Veron, A.S., Weiner, J., 3rd, Robinson-Rechavi, M., Born-
berg-Bauer, E., Oliver, S.G., and Robertson, D.L. (2007). One billion years of
bZIP transcription factor evolution: conservation and change in dimerization
and DNA-binding site specificity. Mol. Biol. Evol. 24, 827–835.
Babayeva, N.D., Wilder, P.J., Shiina, M., Mino, K., Desler, M., Ogata, K., Riz-
zino, A., and Tahirov, T.H. (2010). Structural basis of Ets1 cooperative binding
to palindromicsequences on stromelysin-1 promoter DNA.Cell Cycle9, 3054–
3062.
Badis, G., Berger, M.F., Philippakis, A.A., Talukder, S., Gehrke, A.R., Jaeger,
S.A., Chan, E.T., Metzler, G., Vedenko, A., Chen, X., et al. (2009). Diversity
and complexity in DNA recognition by transcription factors. Science 324,
1720–1723.
Balaskas, N., Ribeiro, A., Panovska, J., Dessaud, E., Sasai, N., Page, K.M.,
Briscoe, J., and Ribes, V. (2012). Gene regulatory logic for reading the Sonic
Hedgehog signaling gradient in the vertebrate neural tube. Cell 148, 273–284.Benos, P.V., Bulyk, M.L., and Stormo, G.D. (2002). Additivity in protein-DNA
interactions: how good an approximation is it? Nucleic Acids Res. 30, 4442–
4451.
Berger, M.F., Philippakis, A.A., Qureshi, A.M., He, F.S., Estep, P.W., 3rd, and
Bulyk, M.L. (2006). Compact, universal DNA microarrays to comprehensively
determine transcription-factor binding site specificities. Nat. Biotechnol. 24,
1429–1435.
Berger, M.F., Badis, G., Gehrke, A.R., Talukder, S., Philippakis, A.A., Pen ˜ a-
Castillo, L., Alleyne, T.M., Mnaimneh, S., Botvinnik, O.B., Chan, E.T., et al.
(2008). Variation in homeodomain DNA binding revealed by high-resolution
analysis of sequence preferences. Cell 133, 1266–1276.
Bohmann, D., Bos, T.J., Admon, A., Nishimura, T., Vogt, P.K., and Tjian, R.
(1987). Human proto-oncogene c-jun encodes a DNA binding protein with
338 Cell 152, 327–339, January 17, 2013 ª2013 Elsevier Inc.

8/12/2019 Transkripsi Dna 3
http://slidepdf.com/reader/full/transkripsi-dna-3 13/13
structural and functional properties of transcription factor AP-1. Science 238,
1386–1392.
Brayer, K.J., and Segal, D.J. (2008). Keep your fingers off my DNA: protein-
protein interactionsmediatedby C2H2zinc fingerdomains.Cell Biochem.Bio-
phys. 50, 111–131.
Brown, R.S. (2005). Zinc finger proteins: getting a grip on RNA. Curr. Opin.
Struct. Biol. 15, 94–98.
Chen,X., Xu,H., Yuan,P., Fang, F.,Huss, M.,Vega, V.B.,Wong,E., Orlov,Y.L.,
Zhang, W., Jiang, J., et al. (2008). Integration of external signaling pathways
with the core transcriptional network in embryonic stem cells. Cell 133,
1106–1117.
Chia, N.Y., Chan, Y.S., Feng, B., Lu, X., Orlov, Y.L., Moreau, D., Kumar, P.,
Yang, L., Jiang, J., Lau, M.S., et al. (2010). A genome-wide RNAi screen
reveals determinants of human embryonic stem cell identity. Nature 468,
316–320.
Davidson, E.H., and Levine, M.S. (2008). Properties of developmental gene
regulatory networks. Proc. Natl. Acad. Sci. USA 105, 20063–20066.
Elf, J., Li, G.W., and Xie, X.S. (2007). Probing transcription factor dynamics at
the single-molecule level in a living cell. Science 316, 1191–1194.
Geggier, S., and Vologodskii, A. (2010). Sequence dependence of DNA bending rigidity. Proc. Natl. Acad. Sci. USA 107 , 15421–15426.
Gigue ` re,V., McBroom, L.D., andFlock, G. (1995). Determinants of targetgene
specificity for ROR alpha 1: monomeric DNA binding by an orphan nuclear
receptor. Mol. Cell. Biol. 15, 2517–2526.
Grove, C.A., De Masi, F., Barrasa, M.I., Newburger, D.E., Alkema, M.J., Bulyk,
M.L., and Walhout, A.J. (2009). A multiparameter network reveals extensive
divergence between C. elegans bHLHtranscription factors. Cell 138, 314–327.
Hallikas, O., Palin, K., Sinjushina,N., Rautiainen,R., Partanen, J., Ukkonen, E.,
and Taipale, J. (2006). Genome-wide prediction of mammalian enhancers
based on analysis of transcription-factor binding affinity. Cell 124, 47–59.
Jolma, A., and Taipale, J. (2011). Methods for analysis of transcription factor
dna-binding specificity in vitro. Subcell. Biochem. 52, 155–173.
Jolma, A., Kivioja, T., Toivonen, J., Cheng, L., Wei, G., Enge, M., Taipale, M.,
Vaquerizas, J.M., Yan, J., Sillanpa ¨ a ¨ , M.J., et al. (2010). Multiplexed massively
parallel SELEXfor characterization of human transcription factor binding spec-
ificities. Genome Res. 20, 861–873.
Kaplan, N., Moore, I.K., Fondufe-Mittendorf, Y., Gossett, A.J., Tillo, D., Field,
Y., LeProust, E.M., Hughes, T.R., Lieb, J.D., Widom, J., and Segal, E. (2009).
The DNA-encoded nucleosome organization of a eukaryotic genome. Nature
458, 362–366.
Kim, J., and Struhl, K. (1995). Determinants of half-site spacing preferences
that distinguish AP-1 and ATF/CREB bZIP domains. Nucleic Acids Res. 23,
2531–2537.
Lamber, E.P., Vanhille, L., Textor, L.C., Kachalova, G.S., Sieweke, M.H., and
Wilmanns, M. (2008). Regulation of the transcription factor Ets-1 by DNA-
mediated homo-dimerization. EMBO J. 27 , 2006–2017.
Morris, Q., Bulyk, M.L., and Hughes, T.R. (2011). Jury remains out on simple
models of transcription factor specificity. Nat. Biotechnol. 29, 483–484.
Noyes, M.B., Christensen, R.G., Wakabayashi, A., Stormo, G.D., Brodsky,M.H., and Wolfe, S.A. (2008). Analysis of homeodomain specificities allows
the family-wide prediction of preferred recognition sites. Cell 133, 1277–1289.
Oliphant,A.R.,Brandl,C.J.,and Struhl, K. (1989). Defining thesequencespec-
ificity of DNA-binding proteins by selecting binding sites from random-
sequence oligonucleotides: analysis of yeast GCN4 protein. Mol. Cell. Biol.
9, 2944–2949.
Pape, U.J., Rahmann, S., and Vingron, M. (2008). Natural similarity measures
between position frequency matrices with an application to clustering.
Bioinformatics 24, 350–357.
Pardee, K., Necakov, A.S., and Krause, H. (2011). Nuclear receptors: small
molecule sensors that coordinate growth, metabolism and reproduction.
Subcell. Biochem. 52, 123–153.
Portales-Casamar, E., Thongjuea,S., Kwon,A.T., Arenillas,D., Zhao,X., Valen,
E., Yusuf, D., Lenhard, B., Wasserman, W.W., and Sandelin, A. (2010).
JASPAR 2010: the greatly expanded open-access database of transcription
factor binding profiles. Nucleic Acids Res. 38(Database issue), D105–D110.
Rohs, R., West, S.M., Sosinsky, A., Liu, P., Mann, R.S., and Honig, B. (2009).
The role of DNA shape in protein-DNA recognition. Nature 461, 1248–1253.
Rohs, R., Jin, X., West, S.M., Joshi, R., Honig, B., and Mann, R.S. (2010).
Origins of specificity in protein-DNA recognition. Annu. Rev. Biochem. 79,
233–269.
Roulet, E., Bucher, P., Schneider, R., Wingender, E., Dusserre, Y., Werner, T.,
and Mermod, N. (2000). Experimental analysis and computer prediction of
CTF/NFI transcription factor DNA binding sites. J. Mol. Biol. 297 , 833–848.
Roulet, E.,Busso, S.,Camargo, A.A., Simpson, A.J., Mermod, N.,and Bucher,
P. (2002). High-throughput SELEX SAGE method for quantitative modeling of
transcription-factor binding sites. Nat. Biotechnol. 20, 831–835.
Segal, E., Raveh-Sadka, T., Schroeder, M., Unnerstall,U., and Gaul,U. (2008).
Predicting expression patterns from regulatory sequence in Drosophila
segmentation. Nature 451, 535–540.
Sharon, E., Lubliner, S., and Segal, E. (2008). A feature-based approach to
modeling protein-DNA interactions. PLoS Comput. Biol. 4, e1000154.
Slattery, M., Riley, T., Liu, P., Abe, N., Gomez-Alcala, P., Dror, I., Zhou, T.,
Rohs, R., Honig, B., Bussemaker, H.J., and Mann, R.S. (2011). Cofactor
binding evokes latent differences in DNA binding specificity between Hox
proteins. Cell 147 , 1270–1282.
Solano, R., Nieto, C., Avila, J., Canas, L., Diaz,I., and Paz-Ares, J. (1995). Dual
DNA binding specificity of a petal epidermis-specific MYB transcription factor
(MYB.Ph3) from Petunia hybrida. EMBO J. 14, 1773–1784.
Stros, M., Launholt, D., and Grasser, K.D. (2007). The HMG-box: a versatile
protein domain occurring in a wide variety of DNA-binding proteins. Cell.
Mol. Life Sci. 64, 2590–2606.
Struhl, K. (1987). The DNA-binding domains of the jun oncoprotein and the
yeast GCN4 transcriptional activator protein are functionally homologous.
Cell 50, 841–846.
Tuerk, C., and Gold, L. (1990). Systematic evolution of ligands by exponential
enrichment: RNA ligands to bacteriophage T4 DNA polymerase. Science 249,505–510.
Tuupanen, S., Turunen, M., Lehtonen, R., Hallikas, O., Vanharanta, S., Kivioja,
T., Bjo ¨ rklund, M., Wei, G., Yan, J., Niittyma ¨ ki, I., et al. (2009). The common
colorectal cancer predisposition SNP rs6983267 at chromosome 8q24
confers potential to enhanced Wnt signaling. Nat. Genet. 41, 885–890.
Vaquerizas, J.M., Kummerfeld, S.K., Teichmann, S.A., and Luscombe, N.M.
(2009). A census of human transcription factors: function, expression and
evolution. Nat. Rev. Genet. 10, 252–263.
vonHippel, P.H., andBerg, O.G. (1989). Facilitated targetlocationin biological
systems. J. Biol. Chem. 264, 675–678.
Walhout, A.J. (2011). Gene-centered regulatory network mapping. Methods
Cell Biol. 106, 271–288.
Wei, G.H., Badis, G., Berger, M.F., Kivioja, T., Palin, K., Enge, M., Bonke, M.,
Jolma, A., Varjosalo, M., Gehrke, A.R., et al. (2010). Genome-wide analysis of
ETS-family DNA-binding in vitro and in vivo. EMBO J. 29, 2147–2160.Zhang, Y., Liu, T., Meyer, C.A., Eeckhoute, J., Johnson, D.S., Bernstein, B.E.,
Nusbaum, C., Myers, R.M., Brown, M., Li, W., and Liu, X.S. (2008). Model-
based analysis of ChIP-Seq (MACS). Genome Biol. 9, R137.
Zhao, Y., and Stormo, G.D. (2011). Quantitative analysis demonstrates most
transcription factors require only simplemodels of specificity.Nat. Biotechnol.
29, 480–483.
Zheng, G., Colasanti, A.V., Lu, X.J., and Olson, W.K. (2010). 3DNALand-
scapes: a database for exploring the conformational features of DNA. Nucleic
Acids Res. 38(Database issue), D267–D274.
Zheng, N., Fraenkel, E., Pabo, C.O., and Pavletich, N.P. (1999). Structural
basis of DNA recognition by the heterodimeric cell cycle transcription factor
E2F-DP. Genes Dev. 13, 666–674.
Related Documents