Transitway Impacts Research Program (TIRP) Research Brief Key Findings Traffic on nearby roads • In its first two years of operation, the Green Line reduced traffic on nearby roads by 22 percent compared with roads outside its influence area (defined as within a mile from the line). • In the next two years, vehicle traffic on nearby roads bounced back by about 6 percentage points. This rebound was likely due to land-use development spurred by the Green Line and by travelers who switched from other routes and modes. • Overall, the Green Line had a significant influence on nearby road traffic, and this influence keeps evolving over time. Travel behavior and preferences of park-and-ride users • PNR users chose a route with a high proportion of time on transit—not necessarily the shortest overall travel time. On average, they chose a route that takes 17% longer than the shortest route available to them. • Users preferred to minimize driving time and transfers. They viewed travel time in a car as four times more burdensome than the same amount of time traveled by transit. Adding a transfer was seen as equivalent to an additional 17.5 minutes of transit time. • Users thought transitway routes had higher utility than comparable express bus routes. A transitway route was viewed as favorably as an express bus route that was 16.6 minutes faster. • Users favored PNR facilities that were served by transitways and that had more amenities. • Overall, PNR users wanted more of their travel time on transit, less time in a car, and no transfers, even if the total trip takes longer, and they saw higher value in transitways than in express bus routes. “The traffic analysis confirms the benefits of transitways in controlling traffic volume growth, helping transpor- tation agencies make confident decisions about future projects.” – Assistant Professor Alireza Khani Study Needs and Components Transitways—such as dedicated light-rail transit (LRT) and bus rapid transit (BRT) corridors—have the potential to relieve congestion and reduce vehicle-miles traveled by attracting drivers to transit. However, research to validate this effect locally has been limited. This research project aimed to answer two questions: • How does a transitway affect automobile traffic on nearby roadways? • What factors influence which park-and-ride (PNR) facilities people use? University of Minnesota researchers conducted a study with two components: • Roadway Impacts: A study of changes in vehicular traffic volume on nearby roads before and after construction of the Green Line light rail. • Park-and-Ride Facilities: An analysis of factors that influence people’s choices of park-and-ride facilities and the development of a model for future PNR planning. The study was funded by the Minnesota Department of Transportation (MnDOT). Transitway Impacts on Nearby Roads; Park-and-Ride Choices

Welcome message from author
This document is posted to help you gain knowledge. Please leave a comment to let me know what you think about it! Share it to your friends and learn new things together.
Transcript
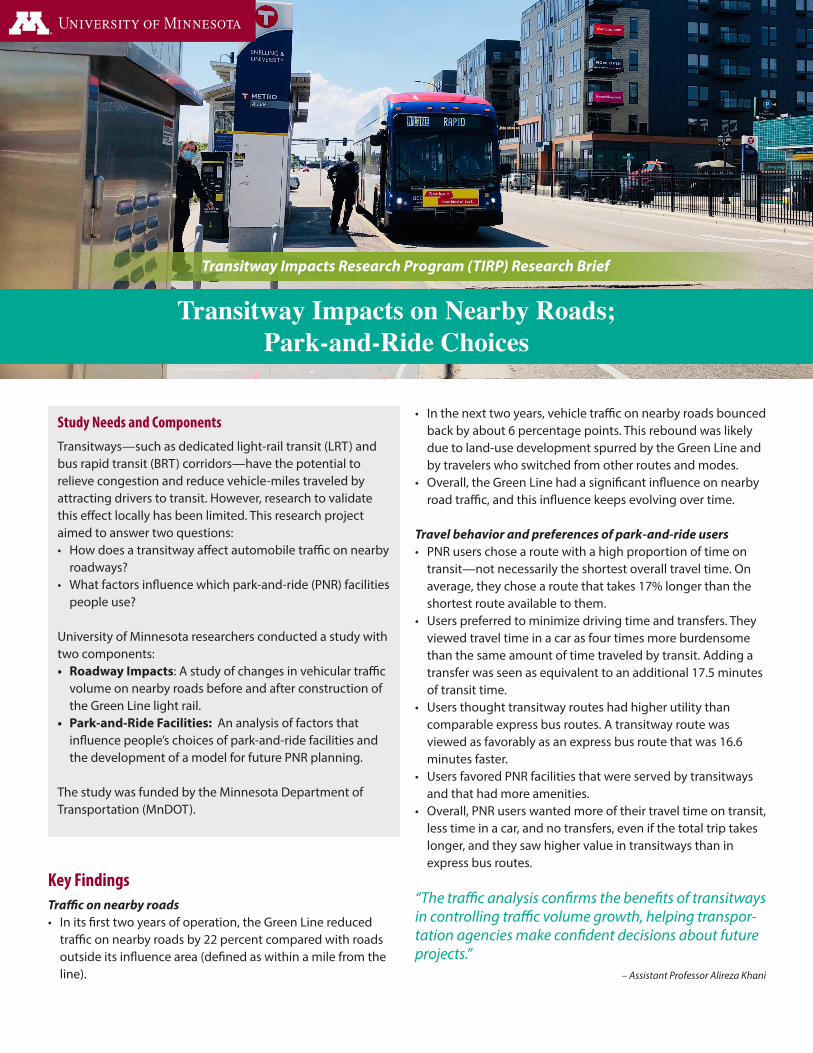
Transitway Impacts Research Program (TIRP) Research Brief
Key FindingsTraffic on nearby roads• In its first two years of operation, the Green Line reduced
traffic on nearby roads by 22 percent compared with roads outside its influence area (defined as within a mile from the line).
• In the next two years, vehicle traffic on nearby roads bounced back by about 6 percentage points. This rebound was likely due to land-use development spurred by the Green Line and by travelers who switched from other routes and modes.
• Overall, the Green Line had a significant influence on nearby road traffic, and this influence keeps evolving over time.
Travel behavior and preferences of park-and-ride users• PNR users chose a route with a high proportion of time on
transit—not necessarily the shortest overall travel time. On average, they chose a route that takes 17% longer than the shortest route available to them.
• Users preferred to minimize driving time and transfers. They viewed travel time in a car as four times more burdensome than the same amount of time traveled by transit. Adding a transfer was seen as equivalent to an additional 17.5 minutes of transit time.
• Users thought transitway routes had higher utility than comparable express bus routes. A transitway route was viewed as favorably as an express bus route that was 16.6 minutes faster.
• Users favored PNR facilities that were served by transitways and that had more amenities.
• Overall, PNR users wanted more of their travel time on transit, less time in a car, and no transfers, even if the total trip takes longer, and they saw higher value in transitways than in express bus routes.
“The traffic analysis confirms the benefits of transitways in controlling traffic volume growth, helping transpor-tation agencies make confident decisions about future projects.”
– Assistant Professor Alireza Khani
Study Needs and ComponentsTransitways—such as dedicated light-rail transit (LRT) and bus rapid transit (BRT) corridors—have the potential to relieve congestion and reduce vehicle-miles traveled by attracting drivers to transit. However, research to validate this effect locally has been limited. This research project aimed to answer two questions:• How does a transitway affect automobile traffic on nearby
roadways? • What factors influence which park-and-ride (PNR) facilities
people use?
University of Minnesota researchers conducted a study with two components:• Roadway Impacts: A study of changes in vehicular traffic
volume on nearby roads before and after construction of the Green Line light rail.
• Park-and-Ride Facilities: An analysis of factors that influence people’s choices of park-and-ride facilities and the development of a model for future PNR planning.
The study was funded by the Minnesota Department of Transportation (MnDOT).
Transitway Impacts on Nearby Roads; Park-and-Ride Choices
CTS Research Brief 2021-04 August 2021
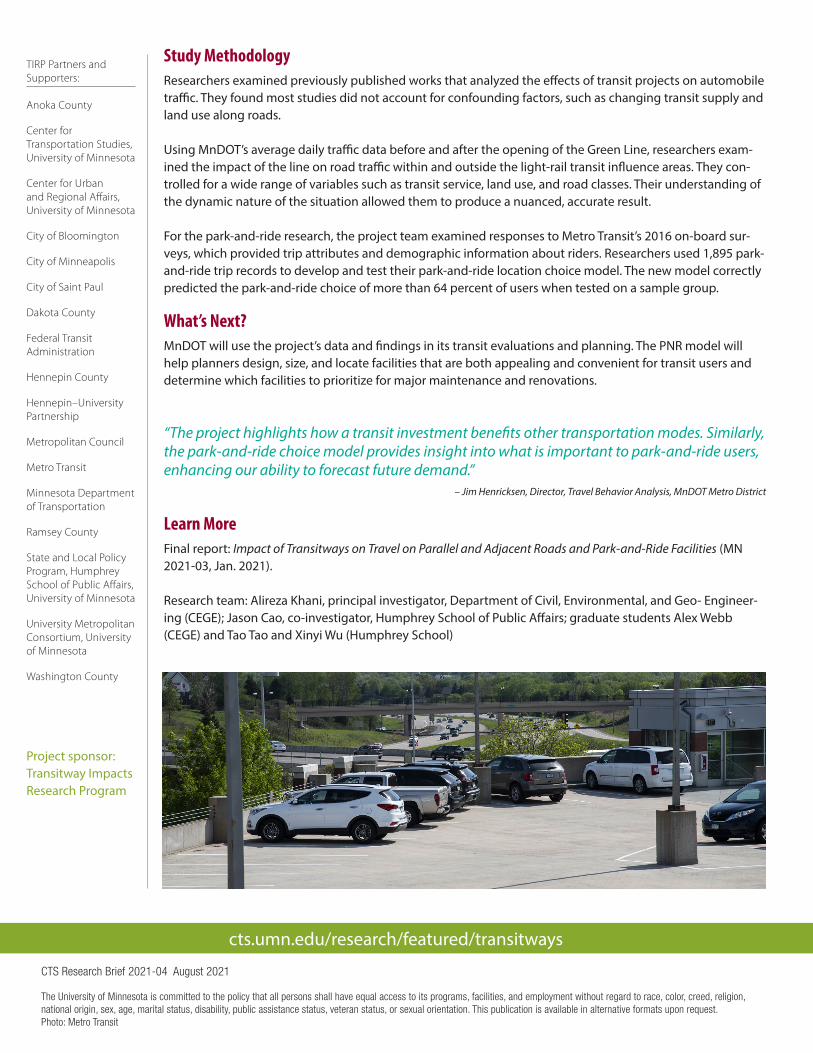
The University of Minnesota is committed to the policy that all persons shall have equal access to its programs, facilities, and employment without regard to race, color, creed, religion, national origin, sex, age, marital status, disability, public assistance status, veteran status, or sexual orientation. This publication is available in alternative formats upon request. Photo: Metro Transit
cts.umn.edu/research/featured/transitways
TIRP Partners and Supporters:
Anoka County
Center for Transportation Studies, University of Minnesota
Center for Urban and Regional Affairs, University of Minnesota
City of Bloomington
City of Minneapolis
City of Saint Paul
Dakota County
Federal Transit Administration
Hennepin County
Hennepin–University Partnership
Metropolitan Council
Metro Transit
Minnesota Department of Transportation
Ramsey County
State and Local Policy Program, Humphrey School of Public Affairs, University of Minnesota
University Metropolitan Consortium, University of Minnesota
Washington County
Project sponsor: Transitway Impacts Research Program
Study MethodologyResearchers examined previously published works that analyzed the effects of transit projects on automobile traffic. They found most studies did not account for confounding factors, such as changing transit supply and land use along roads.
Using MnDOT’s average daily traffic data before and after the opening of the Green Line, researchers exam-ined the impact of the line on road traffic within and outside the light-rail transit influence areas. They con-trolled for a wide range of variables such as transit service, land use, and road classes. Their understanding of the dynamic nature of the situation allowed them to produce a nuanced, accurate result.
For the park-and-ride research, the project team examined responses to Metro Transit’s 2016 on-board sur-veys, which provided trip attributes and demographic information about riders. Researchers used 1,895 park-and-ride trip records to develop and test their park-and-ride location choice model. The new model correctly predicted the park-and-ride choice of more than 64 percent of users when tested on a sample group.
What’s Next?MnDOT will use the project’s data and findings in its transit evaluations and planning. The PNR model will help planners design, size, and locate facilities that are both appealing and convenient for transit users and determine which facilities to prioritize for major maintenance and renovations.
“The project highlights how a transit investment benefits other transportation modes. Similarly, the park-and-ride choice model provides insight into what is important to park-and-ride users, enhancing our ability to forecast future demand.”
– Jim Henricksen, Director, Travel Behavior Analysis, MnDOT Metro District
Learn MoreFinal report: Impact of Transitways on Travel on Parallel and Adjacent Roads and Park-and-Ride Facilities (MN 2021-03, Jan. 2021).
Research team: Alireza Khani, principal investigator, Department of Civil, Environmental, and Geo- Engineer-ing (CEGE); Jason Cao, co-investigator, Humphrey School of Public Affairs; graduate students Alex Webb (CEGE) and Tao Tao and Xinyi Wu (Humphrey School)
Related Documents