TRANSIT RIDERSHIP REPORT American Public Transportation Association 1300 Eye St NW, Suite 1200 E Washington, DC 20005 First Quarter 2016 Contact: Matthew Dickens Policy Analyst Telephone: (202) 496-4817 ESTIMATED UNITED STATES UNLINKED TRANSIT PASSENGER TRIPS Period 2016 2016 JANUARY FEBRUARY MARCH CALENDAR COMPARISON JANUARY FEBRUARY MARCH 2016 2015 2016 2015 2016 2015 Weekdays Saturdays Sundays Holidays First Quarter ESTIMATED UNLINKED TRANSIT PASSENGER TRIPS CURRENT YEAR (a)(b) PRECEDING YEAR (a)(b) % CHANGE (b) 19 5 5 2 20 5 4 2 20 23 4 4 4 4 0 1 4 4 19 1 22 4 5 0 % Change 2015-2016 E-mail: [email protected] 19-May-16 810,594 838,660 920,177 2,569,431 837,671 801,742 920,987 2,560,400 -3.23% 0.35% 4.60% -0.09% * MODE JAN '16 FEB '16 MAR '16 JAN '16- MAR '16 JAN '15 FEB '15 MAR '15 JAN '15 MAR '15 (000's) (000's) (000's) (000's) (000's) (000's) (000's) (000's) 1st Qtr Change Note: Data may differ from that included in Federal Transit Administration reports due to differences in data calculation procedures and in periods of time covered. (a) Transit agencies assigned by urbanized areas or urban places of less than 50,000 population outside urbanized areas based on 2010 U.S. Census Population. (b) Year-to-date ridership adjusted for data received after closing dates of previous issues. (c) Includes aerial tramway, automated guideway, cable car, ferryboat, inclined plane, monorail, and vanpool. Bus Population Group * Preliminary information based on data from reporting systems. Bus Total 413,402 442,754 416,386 401,401 452,478 -1.85% 390,664 1,246,820 1,270,266 United States Total 838,660 920,177 837,671 801,742 920,987 0.35% 810,594 2,569,431 2,560,400 For more information visit http://www.apta.com/resources/statistics/Pages/ridershipreport.aspx Heavy Rail 305,443 344,589 301,473 288,333 338,743 2.49% 301,621 951,652 928,549 Light Rail 42,029 45,727 40,989 38,750 44,901 2.95% 40,563 128,320 124,639 Commuter Rail 38,046 42,246 38,838 35,664 40,837 2.70% 38,163 118,455 115,339 Trolleybus 7,000 7,317 7,282 6,768 7,602 -1.89% 6,927 21,243 21,652 277,679 306,306 282,262 268,797 310,717 -1.44% 265,424 849,409 861,776 2,000,000+ 76,504 80,209 78,276 74,338 83,567 -2.52% 73,524 230,237 236,181 500,000 to 1,999,999 39,477 38,378 38,288 39,242 40,274 -4.45% 34,704 112,559 117,804 100,000 to 499,999 19,742 17,861 17,560 19,024 17,920 0.20% 17,012 54,614 54,505 Below 100,000 Demand Response 19,290 21,207 18,650 17,796 20,588 3.45% 18,508 59,005 57,035 Other (c) 13,452 16,337 14,053 13,030 15,837 2.37% 14,148 43,936 42,921 Canada 173,720 182,766 180,029 172,537 187,088 -0.98% 177,874 534,360 539,654

Welcome message from author
This document is posted to help you gain knowledge. Please leave a comment to let me know what you think about it! Share it to your friends and learn new things together.
Transcript

TRANSIT RIDERSHIP REPORT
American Public Transportation Association1300 Eye St NW, Suite 1200 EWashington, DC 20005
First Quarter 2016
Contact: Matthew DickensPolicy Analyst
Telephone: (202) 496-4817
ESTIMATED UNITED STATES UNLINKED TRANSIT PASSENGER TRIPS
Period 2016 2016
JANUARYFEBRUARYMARCH
CALENDAR COMPARISON
JANUARY FEBRUARY MARCH
2016 2015 2016 2015 2016 2015
WeekdaysSaturdaysSundaysHolidaysFirst Quarter
ESTIMATED UNLINKED TRANSIT PASSENGER TRIPS
CURRENT YEAR (a)(b) PRECEDING YEAR (a)(b) % CHANGE (b)
19552
20542
20 2344
4401
44
19
1
22450
% Change2015-2016
E-mail: [email protected]
19-May-16
810,594838,660920,177
2,569,431
837,671801,742920,987
2,560,400
-3.23%
0.35%
4.60%-0.09%
*
MODE JAN '16 FEB '16 MAR '16JAN '16-MAR '16 JAN '15 FEB '15 MAR '15
JAN '15MAR '15
(000's) (000's) (000's) (000's) (000's) (000's) (000's) (000's)
1st QtrChange
Note: Data may differ from that included in Federal Transit Administration reports due to differences in data calculation procedures and in periods of time covered.
(a) Transit agencies assigned by urbanized areas or urban places of less than 50,000 population outside urbanized areas based on 2010 U.S. Census Population.(b) Year-to-date ridership adjusted for data received after closing dates of previous issues.(c) Includes aerial tramway, automated guideway, cable car, ferryboat, inclined plane, monorail, and vanpool.
Bus Population Group
* Preliminary information based on data from reporting systems.
Bus Total 413,402 442,754 416,386 401,401 452,478 -1.85%390,664 1,246,820 1,270,266
United States Total 838,660 920,177 837,671 801,742 920,987 0.35%810,594 2,569,431 2,560,400
For more information visit http://www.apta.com/resources/statistics/Pages/ridershipreport.aspx
Heavy Rail 305,443 344,589 301,473 288,333 338,743 2.49%301,621 951,652 928,549
Light Rail 42,029 45,727 40,989 38,750 44,901 2.95%40,563 128,320 124,639
Commuter Rail 38,046 42,246 38,838 35,664 40,837 2.70%38,163 118,455 115,339
Trolleybus 7,000 7,317 7,282 6,768 7,602 -1.89%6,927 21,243 21,652
277,679 306,306 282,262 268,797 310,717 -1.44%265,424 849,409 861,7762,000,000+
76,504 80,209 78,276 74,338 83,567 -2.52%73,524 230,237 236,181500,000 to 1,999,999
39,477 38,378 38,288 39,242 40,274 -4.45%34,704 112,559 117,804100,000 to 499,999
19,742 17,861 17,560 19,024 17,920 0.20%17,012 54,614 54,505Below 100,000
Demand Response 19,290 21,207 18,650 17,796 20,588 3.45%18,508 59,005 57,035
Other (c) 13,452 16,337 14,053 13,030 15,837 2.37%14,148 43,936 42,921
Canada 173,720 182,766 180,029 172,537 187,088 -0.98%177,874 534,360 539,654

American Public Transportation Association1300 Eye St NW, Suite 1200 EWashington, DC 20005
Contact: Matthew DickensPolicy Analyst
Telephone: (202) 496-4817
PRECEDING YEAR (a)(b) % CHANGE (b)CURRENT YEAR (a)(b)
2
Email: [email protected] RIDERSHIP REPORT
First Quarter 2016
ESTIMATED UNLINKED TRANSIT PASSENGER TRIPS
HEAVY RAIL
19-May-16
JAN '16 FEB '16 MAR '16 FEB '15 MAR '151st Qtr
Change(000's) (000's) (000's) (000's) (000's) (000's)
JAN '15Transit AgencyState andPrimary City
AVGWKDY(000's)
MAR '16JAN '16-
(000's)MAR '15JAN '15-
(000's)
Los Angeles County MTA 3,770.0 3,671.4 3,961.4 4,041.3 3,658.1 4,009.3 -2.61%CA 142.0Los Angeles 11,402.8 11,708.7
San Francisco Bay Area RTD 10,656.8 11,466.9 11,757.0 10,565.3 10,136.2 11,564.0 5.01%CA 455.4San Francisco 33,880.7 32,265.5
Washington Metro Area TA 16,860.2 19,365.6 22,557.9 20,018.9 18,435.2 22,681.6 -3.85%DC 864.1Washington 58,783.7 61,135.7
Miami-Dade Transit Agency 1,787.5 1,824.3 1,994.8 1,857.5 1,765.2 1,996.2 -0.22%FL 76.4Miami 5,606.6 5,618.9
Metro Atlanta Rapid Tr Auth 5,535.9 5,542.0 6,022.0 5,715.8 5,120.5 5,854.3 2.45%GA 221.1Atlanta 17,099.9 16,690.6
Chicago Transit Authority 18,164.7 18,561.5 20,367.5 17,992.8 17,201.8 20,097.2 3.26%IL 738.4Chicago 57,093.7 55,291.8
Massachusetts Bay Tr Auth 12,901.4 13,318.0 15,090.1 12,734.8 10,648.5 15,097.5 7.35%MA 551.0Boston 41,309.5 38,480.8
Maryland Transit Admin 835.2 931.9 1,028.1 1,089.9 1,000.0 1,152.3 -13.79%MD 31.9Baltimore 2,795.2 3,242.2
Port Authority of NY & NJ 5,752.7 6,007.9 6,908.6 5,467.4 5,410.2 6,342.2 8.42%NJ 258.3Jersey City 18,669.2 17,219.8
Port Authority Transit Corp 814.8 853.8 945.9 792.9 768.1 865.3 7.76%NJ 36.5Lindenwold 2,614.5 2,426.3
MTA New York City Transit 214,908.6 213,964.3 243,333.2 210,813.9 204,706.8 238,345.7 2.80%NY 8,777.7New York 672,206.1 653,866.4
MTA Staten Island Railway 694.9 644.1 786.2 641.4 593.3 747.5 7.21%NY 31.1New York 2,125.2 1,982.2
Greater Cleveland Reg TA 526.3 502.5 473.6 548.8 448.3 557.9 -3.38%OH NACleveland 1,502.4 1,555.0
Southeastern Penn TA 7,754.5 8,057.6 8,670.4 8,450.4 7,687.4 8,631.8 -1.16%PA 334.6Philadelphia 24,482.5 24,769.6
Puerto Rico DOT 657.1 730.7 691.8 741.4 753.4 800.6 -9.40%PR 32.0San Juan 2,079.6 2,295.4
Note: Data may differ from that included in Federal Transit Administration reports due to differences in data calculation procedures and in periods of time covered.(a) Transit agencies assigned by urbanized areas or urban places of less than 50,000 population outside urbanized areas based on 2010 U.S. Census Population.(b) Year-to-date ridership adjusted for data received after closing dates of previous issues.
REPORTED TOTAL 305,442.5 344,588.5 301,472.5 288,333.0 2.49%
PROJECTED TOTAL
338,743.4301,620.612,550.4 951,651.6 928,548.9
305,442.5 344,588.5 301,472.5 288,333.0 338,743.4 2.49%301,620.6 951,651.6 928,548.9

American Public Transportation Association1300 Eye St NW, Suite 1200 EWashington, DC 20005
Contact: Matthew DickensPolicy Analyst
Telephone: (202) 496-4817
PRECEDING YEAR (a)(b) % CHANGE (b)CURRENT YEAR (a)(b)
3
Email: [email protected] RIDERSHIP REPORT
First Quarter 2016
ESTIMATED UNLINKED TRANSIT PASSENGER TRIPS
LIGHT RAIL
19-May-16
JAN '16 FEB '16 MAR '16 FEB '15 MAR '151st Qtr
Change(000's) (000's) (000's) (000's) (000's) (000's)
JAN '15Transit AgencyState andPrimary City
AVGWKDY(000's)
MAR '16JAN '16-
(000's)MAR '15JAN '15-
(000's)
Valley Metro Rail, Inc. 1,314.3 1,290.6 1,398.3 1,445.6 1,195.1 1,255.2 2.75%AZ 49.0Phoenix 4,003.2 3,895.9
Los Angeles County MTA 4,977.8 4,881.2 5,417.2 5,263.8 4,810.0 5,248.3 -0.30%CA 192.0Los Angeles 15,276.2 15,322.1
North County Transit District 195.9 234.1 236.4 222.5 230.2 251.8 -5.41%CA NAOceanside 666.4 704.5
Sacramento Reg Tr Dist 1,007.3 1,144.2 1,120.1 1,007.7 997.6 1,066.3 6.51%CA 45.8Sacramento 3,271.6 3,071.6
San Diego Metrop Transit Syste 3,054.0 3,176.8 3,322.9 3,107.4 3,225.5 3,498.3 -2.82%CA 118.6San Diego 9,553.7 9,831.2
San Francisco Muni Rwy 3,858.3 3,914.7 3,983.8 3,783.3 3,784.6 3,834.2 3.11%CA 157.4San Francisco 11,756.8 11,402.1
Santa Clara Valley Trp Auth 776.5 825.0 862.7 834.9 869.0 976.1 -8.05%CA 30.8San Jose 2,464.2 2,680.0
Regional Trp District 1,949.1 2,071.7 2,103.8 2,120.4 2,057.3 2,245.3 -4.65%CO 79.6Denver 6,124.6 6,423.0
District Dept of Trp (DDOT) 0.0 10.3 67.9 0.0 0.0 0.0 NADC NAWashington 78.2 0.0
Hillsborough Area Reg TA 31.8 24.4 32.8 35.3 23.3 32.6 -2.41%FL 0.7Tampa 89.0 91.2
City of Atlanta 27.2 42.9 30.5 64.5 47.0 63.9 -42.65%GA 0.7Atlanta 100.6 175.4
Regional Transit Auth 548.7 527.7 729.7 609.5 477.8 788.1 -3.70%LA 20.9New Orleans 1,806.1 1,875.4
Massachusetts Bay Tr Auth 4,461.0 4,756.3 5,229.9 4,739.0 4,068.7 5,867.2 -1.55%MA 181.7Boston 14,447.2 14,674.9
Maryland Transit Admin 630.3 674.2 666.6 539.5 501.4 534.3 25.13%MD 22.9Baltimore 1,971.1 1,575.2
Metro Transit 1,640.0 1,785.5 1,900.0 1,603.1 1,567.7 1,796.3 7.22%MN 65.6Minneapolis 5,325.5 4,967.1
Bi-State Dev Agency 1,153.9 1,181.3 1,224.5 1,226.8 1,159.3 1,333.0 -4.29%MO 44.6Saint Louis 3,559.7 3,719.1
Charlotte Area Transit 377.4 395.8 424.3 407.9 356.7 422.1 0.91%NC 14.7Charlotte 1,197.5 1,186.7
New Jersey Transit Corp 1,704.4 1,845.7 2,107.7 1,560.9 1,533.7 1,891.5 13.47%NJ NANewark 5,657.8 4,986.1
Niagara Frontier Trp Auth 378.4 439.9 444.9 384.8 395.6 489.2 -0.50%NY 17.0Buffalo 1,263.2 1,269.6
Greater Cleveland Reg TA 205.0 181.6 175.8 216.2 168.3 213.3 -5.92%OH NACleveland 562.4 597.8
Tri-County Metro Trp Dist 3,240.3 3,234.6 3,486.5 3,024.4 2,891.2 3,217.3 9.07%OR 125.0Portland 9,961.4 9,132.9
Southeastern Penn TA 2,041.5 2,213.3 2,447.2 2,149.9 2,033.6 2,306.7 3.26%PA 91.3Philadelphia 6,702.0 6,490.2
Port Auth of Allegheny Co 602.1 628.6 686.3 579.6 590.9 668.6 4.24%PA NAPittsburgh 1,917.0 1,839.1
Memphis Area Transit Auth 0.0 0.0 0.0 0.0 0.0 0.0 NATN 0.0Memphis 0.0 0.0
Dallas Area Rapid Transit 2,334.0 2,325.5 2,481.9 2,310.2 2,140.8 2,481.0 3.02%TX 93.5Dallas 7,141.4 6,932.0

JAN '16 FEB '16 MAR '16 FEB '15 MAR '151st Qtr
Change(000's) (000's) (000's) (000's) (000's) (000's)
JAN '15Transit AgencyState andPrimary City
AVGWKDY(000's)
MAR '16JAN '16-
(000's)MAR '15JAN '15-
(000's)
Metro Tr Auth of Harris Co 1,467.0 1,557.0 1,966.2 1,069.8 1,116.7 1,584.6 32.33%TX 59.3Houston 4,990.2 3,771.1
Utah Transit Authority 1,489.5 1,553.1 1,662.8 1,604.6 1,520.5 1,658.6 -1.64%UT 62.4Salt Lake City 4,705.4 4,783.7
King County Dept of Trp 15.6 16.3 33.3 50.3 47.2 54.7 -57.16%WA 1.0Seattle 65.2 152.2
Sound Transit 983.5 990.9 1,342.1 909.8 842.3 983.7 21.23%WA 41.5Seattle 3,316.5 2,735.8
Note: Data may differ from that included in Federal Transit Administration reports due to differences in data calculation procedures and in periods of time covered.(a) Transit agencies assigned by urbanized areas or urban places of less than 50,000 population outside urbanized areas based on 2010 U.S. Census Population.(b) Year-to-date ridership adjusted for data received after closing dates of previous issues.
REPORTED TOTAL 41,923.2 45,586.1 40,871.7 38,652.0 2.97%
PROJECTED TOTAL (c)
44,762.240,464.81,516.0 127,974.1 124,285.9
(c) Includes missing agencies (Central Arkansas TA, Hampton Roads Transit). (d) Memphis light rail service suspended starting in June 2014 due to fleet issues.
42,028.9 45,727.4 40,988.8 38,749.5 44,900.9 2.95%40,563.3 128,319.6 124,639.2

American Public Transportation Association1300 Eye St NW, Suite 1200 EWashington, DC 20005
Contact: Matthew DickensPolicy Analyst
Telephone: (202) 496-4817
PRECEDING YEAR (a)(b) % CHANGE (b)CURRENT YEAR (a)(b)
5
Email: [email protected] RIDERSHIP REPORT
First Quarter 2016
ESTIMATED UNLINKED TRANSIT PASSENGER TRIPS
COMMUTER RAIL
19-May-16
JAN '16 FEB '16 MAR '16 FEB '15 MAR '151st Qtr
Change(000's) (000's) (000's) (000's) (000's) (000's)
JAN '15Transit AgencyState andPrimary City
AVGWKDY(000's)
MAR '16JAN '16-
(000's)MAR '15JAN '15-
(000's)
Alaska Railroad CorporationAK Anchorage 0.9 1.3 2.7 0.7 1.0 2.1 28.95%0.1 4.9 3.8
Southern California RRACA Los Angeles 880.6 921.7 967.6 908.2 880.3 1,003.9 -0.81%40.1 2,769.9 2,792.4
Capitol Corridor Joint Powers AuthCA Oakland 117.8 125.2 137.3 112.3 110.7 124.7 9.38%5.0 380.3 347.7
North County Transit DistrictCA Oceanside 100.4 115.3 123.1 116.7 114.9 126.4 -5.36%NA 338.8 358.0
CaltrainCA San Carlos 1,476.2 1,551.8 1,583.9 1,457.0 1,362.6 1,538.7 5.82%58.2 4,611.9 4,358.3
San Joaquin Reg Rail CommCA Stockton 99.9 101.4 109.8 95.5 93.7 106.6 5.17%4.9 311.1 295.8
Connecticut DOTCT New Haven 43.1 44.3 49.2 42.4 41.1 48.3 3.64%1.9 136.6 131.8
SunRailFL Orlando 63.0 73.5 88.3 76.6 71.2 124.4 -17.41%NA 224.8 272.2
South Florida RTA (Tri-Rail)FL Pompano Beach 348.8 356.2 383.8 371.6 344.0 380.0 -0.62%14.2 1,088.8 1,095.6
MetraIL Chicago 5,817.0 5,614.9 6,034.0 5,993.7 5,538.8 5,992.5 -0.34%290.6 17,465.9 17,525.0
Northern IN Commuter TDIN Chesterton 255.0 257.7 295.1 260.7 261.4 300.7 -1.82%11.0 807.8 822.8
Massachusetts Bay Tr AuthMA Boston 2,794.5 2,584.1 3,048.8 2,705.6 1,912.4 2,429.0 19.59%123.5 8,427.4 7,047.0
Maryland Transit AdminMD Baltimore 569.5 694.1 781.9 704.6 659.7 764.9 -3.93%31.3 2,045.5 2,129.2
Northern NE Passenger RAME Portland 31.0 36.0 39.8 34.9 29.3 37.3 5.22%1.1 106.8 101.5
Metro TransitMN Minneapolis 52.2 54.3 56.0 50.7 49.2 53.9 5.66%2.4 162.5 153.8
New Jersey Transit CorpNJ Newark 6,850.7 6,834.0 7,368.8 6,725.0 6,417.3 7,180.7 3.59%NA 21,053.5 20,323.0
New Mexico Dept of TrpNM Albuquerque 65.5 71.2 75.6 73.7 75.5 80.5 -7.58%2.9 212.3 229.7
MTA Long Island Rail RoadNY New York 7,834.4 7,546.6 8,670.3 8,108.7 7,523.1 8,536.4 -0.48%354.8 24,051.3 24,168.2
MTA Metro-North RailroadNY New York 6,455.3 6,431.8 7,513.3 6,292.8 5,962.4 7,148.3 5.14%286.5 20,400.4 19,403.5
Tri-County Metro Trp DistOR Portland 34.7 37.4 41.9 37.7 36.0 40.2 0.09%1.8 114.0 113.9
Penn DOT (Keystone)PA Harris-Phil 102.8 107.7 129.7 101.7 99.7 118.2 6.45%4.2 340.2 319.6
Southeastern Penn TAPA Philadelphia 2,930.2 3,108.1 3,206.8 3,242.1 2,861.3 3,230.2 -0.95%126.6 9,245.1 9,333.6
Regional Transp AuthTN Nashville 19.8 22.3 24.2 20.8 18.5 22.8 6.76%NA 66.3 62.1
Capital Metropolitan Trp AuthTX Austin 42.4 71.1 112.4 66.0 52.5 120.1 -5.32%3.1 225.9 238.6
Trinity Railway ExpressTX Dallas-Ft Worth 159.7 172.6 188.0 171.6 163.1 198.7 -2.46%7.5 520.3 533.4

JAN '16 FEB '16 MAR '16 FEB '15 MAR '151st Qtr
Change(000's) (000's) (000's) (000's) (000's) (000's)
JAN '15Transit AgencyState andPrimary City
AVGWKDY(000's)
MAR '16JAN '16-
(000's)MAR '15JAN '15-
(000's)
Denton County Transportation AutTX Lewisville 40.3 49.0 49.1 41.5 43.8 50.2 2.14%1.9 138.4 135.5
Utah Transit AuthorityUT Salt Lake City 358.8 364.9 390.1 368.5 332.2 382.1 2.86%16.1 1,113.8 1,082.8
Virginia Railway ExpressVA Alexandria 287.6 357.3 409.0 350.6 326.5 386.7 -0.93%17.5 1,053.9 1,063.8
Sound TransitWA Seattle 331.3 340.0 365.5 306.0 281.4 308.5 15.73%16.3 1,036.8 895.9
Note: Data may differ from that included in Federal Transit Administration reports due to differences in data calculation procedures and in periods of time covered.(a) Transit agencies assigned by urbanized areas or urban places of less than 50,000 population outside urbanized areas based on 2010 U.S. Census Population.(b) Year-to-date ridership adjusted for data received after closing dates of previous issues.
REPORTED TOTAL
PROJECTED TOTAL (c)
38,045.8 42,246.0 38,837.9 35,663.6 2.70%40,837.038,163.41,423.6 118,455.2 115,338.5
38,045.8 42,246.0 38,837.9 35,663.6 40,837.0 2.70%38,163.4 118,455.2 115,338.5
American Public Transportation Association1300 Eye St NW, Suite 1200 EWashington, DC 20005
Contact: Matthew DickensPolicy Analyst
Telephone: (202) 496-4817
PRECEDING YEAR (a)(b) % CHANGE (b)CURRENT YEAR (a)(b)
7
Email: [email protected] RIDERSHIP REPORT
First Quarter 2016
ESTIMATED UNLINKED TRANSIT PASSENGER TRIPS
TROLLEY BUS
19-May-16
JAN '16 FEB '16 MAR '16 FEB '15 MAR '151st Qtr
Change(000's) (000's) (000's) (000's) (000's) (000's)
JAN '15Transit AgencyState andPrimary City
AVGWKDY(000's)
MAR '16JAN '16-
(000's)MAR '15JAN '15-
(000's)
San Francisco Muni Rwy 4,626.6 4,713.5 4,725.7 4,768.8 4,438.2 5,030.5 -1.21%CA 172.4San Francisco 14,065.8 14,237.5
Massachusetts Bay Tr Auth 109.9 108.8 124.7 111.4 106.1 128.9 -0.87%MA 4.9Boston 343.4 346.4
Greater Dayton Regional TA 172.4 179.6 184.8 211.1 198.1 232.3 -16.32%OH 6.8Dayton 536.8 641.5
Southeastern Penn TA 500.2 490.5 555.2 559.7 497.4 575.2 -5.29%PA 21.1Philadelphia 1,545.9 1,632.3
King County Dept of Trp 1,517.6 1,507.2 1,726.5 1,630.9 1,528.0 1,635.4 -0.90%WA 72.1Seattle 4,751.3 4,794.3
Note: Data may differ from that included in Federal Transit Administration reports due to differences in data calculation procedures and in periods of time covered.(a) Transit agencies assigned by urbanized areas or urban places of less than 50,000 population outside urbanized areas based on 2010 U.S. Census Population.(b) Year-to-date ridership adjusted for data received after closing dates of previous issues.
REPORTED TOTAL 6,999.6 7,316.9 7,281.9 6,767.8 -1.89%
PROJECTED TOTAL (c)
7,602.36,926.7277.3 21,243.2 21,652.0
(c) Includes missing agencies (Greater Dayton RTA).
6,999.6 7,316.9 7,281.9 6,767.8 7,602.3 -1.89%6,926.7 21,243.2 21,652.0

American Public Transportation Association1300 Eye St NW, Suite 1200 EWashington, DC 20005
Contact: Matthew DickensPolicy Analyst
Telephone: (202) 496-4817
PRECEDING YEAR (a)(b) % CHANGE (b)CURRENT YEAR (a)(b)
8
Email: [email protected] RIDERSHIP REPORT
First Quarter 2016ESTIMATED UNLINKED TRANSIT PASSENGER TRIPS
LARGEST BUS AGENCIES
19-May-16
(Transit Agencies in Urbanized Areas of 1,000,000 or more population that operate 300 or more peak-hour buses, plus a selection of other large bus operators)
JAN '16 FEB '16 MAR '16 FEB '15 MAR '151st Qtr
Change(000's) (000's) (000's) (000's) (000's) (000's)
JAN '15Transit AgencyState andPrimary City
AVGWKDY(000's)
MAR '16JAN '16-
(000's)MAR '15JAN '15-
(000's)
City of Phoenix PTD 2,339.7 2,872.2 2,979.6 3,233.0 3,115.7 3,258.7 -14.74%AZ 110.5Phoenix 8,191.5 9,607.4
Long Beach Transit 2,184.4 2,235.4 2,188.1 2,358.2 2,376.8 2,473.1 -8.33%CA 83.9Long Beach 6,607.9 7,208.1
Los Angeles County MTA 24,664.3 26,233.2 27,402.3 27,674.2 27,170.6 29,892.0 -7.60%CA 986.4Los Angeles 78,299.8 84,736.8
Alameda-Contra Costa TD 4,018.4 4,441.3 4,716.1 4,497.5 4,304.2 4,871.6 -3.64%CA 212.9Oakland 13,175.8 13,673.3
Orange County Transp Auth 3,239.2 3,514.5 3,689.7 3,737.6 3,740.3 4,135.5 -10.07%CA 134.8Orange 10,443.4 11,613.4
San Diego Metrop Transit Syst 4,032.8 4,415.2 4,506.3 4,311.5 4,502.6 4,847.7 -5.18%CA 170.0San Diego 12,954.3 13,661.8
San Francisco Muni Rwy 7,945.5 8,308.6 8,668.6 7,636.0 7,179.4 8,235.4 8.12%CA 322.0San Francisco 24,922.7 23,050.8
Santa Clara Valley Trp Auth 2,461.3 2,577.4 2,777.4 2,658.1 2,594.9 3,003.5 -5.33%CA 102.5San Jose 7,816.1 8,256.5
Santa Monica's Big Blue Bus 1,146.1 1,363.6 1,718.3 1,658.2 1,526.3 1,698.2 -13.41%CA 65.6Santa Monica 4,228.0 4,882.7
Regional Trp District 5,878.6 6,069.9 6,197.0 6,313.7 5,979.6 6,669.2 -4.31%CO 241.5Denver 18,145.5 18,962.5
Washington Metro Area TA 8,256.6 9,780.3 11,165.3 10,178.3 9,335.2 10,969.8 -4.20%DC 410.1Washington 29,202.2 30,483.3
Broward County Transit 2,843.3 2,957.1 3,092.0 3,480.5 3,231.0 3,483.0 -12.77%FL 116.3Fort Lauderdale 8,892.4 10,194.5
Central Florida RTA 2,004.0 2,019.9 2,126.8 2,406.6 2,196.1 2,389.0 -12.03%FL 77.7Orlando 6,150.7 6,991.7
Metro Atlanta Rapid Tr Auth 4,418.7 4,704.3 5,074.6 4,897.1 4,456.4 5,102.2 -1.79%GA 181.1Atlanta 14,197.6 14,455.7
PACE Suburban Bus 2,169.8 2,280.0 2,469.7 2,267.0 2,098.2 2,530.7 0.34%IL 94.8Arlington Heights 6,919.5 6,895.9
Chicago Transit Authority 20,751.1 21,466.8 23,340.9 21,404.1 20,973.9 24,520.1 -2.00%IL 845.0Chicago 65,558.8 66,898.1
Massachusetts Bay Tr Auth 8,964.5 8,888.0 10,196.6 8,585.9 7,329.3 10,285.1 7.06%MA 381.2Boston 28,049.1 26,200.3
Maryland Transit Admin 5,818.2 5,896.9 6,802.1 6,288.0 5,913.1 7,014.1 -3.63%MD 247.8Baltimore 18,517.2 19,215.2
Montgomery County Ride-On 1,699.9 1,863.7 2,092.5 1,987.3 1,822.7 2,123.4 -4.67%MD 76.3Rockville 5,656.1 5,933.4
City of Detroit Dept of Trp 1,958.2 2,050.5 2,115.8 1,767.5 1,411.8 1,940.2 19.63%MI NADetroit 6,124.5 5,119.5
Metro Transit 4,644.3 4,861.4 5,195.1 5,108.6 4,896.7 5,471.1 -5.01%MN 196.4Minneapolis 14,700.8 15,476.4
Bi-State Dev Agency 2,094.9 2,131.0 2,235.8 2,286.3 2,083.4 2,379.4 -4.26%MO 82.6Saint Louis 6,461.7 6,749.1
New Jersey Transit Corp 11,608.3 12,225.1 13,764.1 11,961.3 11,644.0 13,582.2 1.10%NJ NANewark 37,597.5 37,187.5
RTC of Southern Nevada 5,122.3 5,220.4 5,616.6 5,181.8 5,074.3 5,659.9 0.27%NV 189.8Las Vegas 15,959.3 15,916.0
MTA New York City Transit 58,898.7 60,478.6 70,715.5 59,515.7 56,976.7 68,805.6 2.59%NY 2,473.4New York 190,092.8 185,298.0

JAN '16 FEB '16 MAR '16 FEB '15 MAR '151st Qtr
Change(000's) (000's) (000's) (000's) (000's) (000's)
JAN '15Transit AgencyState andPrimary City
AVGWKDY(000's)
MAR '16JAN '16-
(000's)MAR '15JAN '15-
(000's)
Southwest Ohio RTA 1,198.1 1,240.4 1,337.3 1,311.3 1,161.1 1,357.1 -1.40%OH 54.8Cincinnati 3,775.8 3,829.5
Greater Cleveland Reg TA 2,715.2 2,863.0 3,053.8 3,009.5 2,638.0 3,282.1 -3.33%OH NACleveland 8,632.0 8,929.6
Central Ohio Transit Auth 1,426.2 1,516.3 1,576.6 1,465.1 1,378.6 1,579.7 2.16%OH 59.6Columbus 4,519.1 4,423.4
Tri-County Metro Trp Dist 4,908.7 4,928.9 5,164.4 5,284.0 4,982.8 5,391.9 -4.19%OR 195.7Portland 15,002.0 15,658.7
Southeastern Penn TA 12,334.8 12,277.5 14,236.4 13,320.4 12,198.6 13,960.3 -1.60%PA 529.5Philadelphia 38,848.7 39,479.3
Port Auth of Allegheny Co 4,129.6 4,338.5 4,627.3 4,414.7 4,018.6 4,638.7 0.18%PA NAPittsburgh 13,095.4 13,072.0
Dallas Area Rapid Transit 2,690.4 2,823.8 2,821.9 2,892.4 2,637.7 2,905.9 -1.18%TX 112.2Dallas 8,336.1 8,436.0
Metro Tr Auth of Harris Co 5,510.6 5,624.6 5,628.9 5,368.8 5,177.3 5,452.2 4.79%TX 223.8Houston 16,764.1 15,998.3
VIA Metropolitan Transit 3,598.8 3,254.9 3,275.7 3,272.6 3,235.6 3,415.4 2.07%TX 122.3San Antonio 10,129.4 9,923.6
Hampton Roads Transit 982.4 1,000.0 1,099.3 1,103.6 881.4 1,142.0 -1.45%VA 41.1Hampton 3,081.7 3,127.0
King County Dept of Trp 8,484.7 8,426.3 8,969.7 8,424.5 7,936.0 8,710.3 3.23%WA 336.6Seattle 25,880.7 25,070.8
Milwaukee County Tr Sys 2,463.7 2,506.3 2,934.8 2,762.5 2,571.8 3,023.8 -5.42%WI 111.2Milwaukee 7,904.8 8,358.1
Note: Data may differ from that included in Federal Transit Administration reports due to differences in data calculation procedures and in periods of time covered.(a) Transit agencies assigned by urbanized areas or urban places of less than 50,000 population outside urbanized areas based on 2010 U.S. Census Population.(b) Year-to-date ridership adjusted for data received after closing dates of previous issues.
REPORTED TOTAL 259,655.8 285,572.9 264,023.4 250,750.7 -1.26%290,200.1249,606.39,589.2 794,835.0 804,974.2

APTA TRANSIT RIDERSHIP REPORT
State and City Transit Agency ModeAverage
Weekday Jan '16Trips for Trips for
Feb '16Trips forMar '16
Trips ThruMar '16
Trips forJan '15
Trips forFeb '15
Trips forMar '15
Trips ThruMar '15 Quarterly
Change(000's) (000's) (000's) (000's) (000's) (000's) (000's) (000's)(000's)
10First Quarter, 2016
1.3 2.7 0.7 1.0 2.10.1 28.95%4.9 3.80.9AK Anchorage Alaska Railroad Corporation TOTAL0.7CR 1.3 2.7 1.0 2.10.1 28.95%4.9 3.80.9Alaska Railroad CorporationAK Anchorage
250.7 261.4 269.7 229.4 262.510.8 -0.80%755.5 761.6243.4AL Birmingham Birmingham-Jefferson Co TA TOTAL
8.7DR 9.3 10.2 8.4 9.30.4 6.44%28.1 26.48.6Birmingham-Jefferson Co TAAL Birmingham261.0MB 241.4 251.2 221.0 253.210.4 -1.06%727.4 735.2234.8Birmingham-Jefferson Co TAAL Birmingham
NA NA NA NA NANA NANA NANAAR Little Rock Central Arkansas Transit Auth TOTAL
NADR NA NA NA NANA NANA NANACentral Arkansas Transit AuthAR Little Rock4.6LR NA NA 3.7 8.2NA NANA 16.5NACentral Arkansas Transit AuthAR Little Rock
224.3MB 215.0 217.8 179.1 171.88.5 9.49%629.8 575.2197.0Central Arkansas Transit AuthAR Little Rock
198.7 182.2 164.4 176.9 170.9NA 3.18%528.5 512.2147.6AZ Flagstaff N. AZ Intergovernmental Public TA TOTAL
1.7DR 1.7 2.0 1.7 1.8NA 3.85%5.4 5.21.7N. AZ Intergovernmental Public TAAZ Flagstaff162.7MB 197.0 180.2 175.2 169.1NA 3.18%523.1 507.0145.9N. AZ Intergovernmental Public TAAZ Flagstaff
14.0 14.0 16.1 15.2 15.80.6 -11.46%41.7 47.113.7AZ Glendale Glendale Transit TOTAL
7.0DR 6.6 6.7 6.6 7.40.3 -6.19%19.7 21.06.4Glendale TransitAZ Glendale9.1MB 7.4 7.3 8.6 8.40.3 -15.71%22.0 26.17.3Glendale TransitAZ Glendale
2,899.6 3,011.7 3,261.4 3,143.5 3,289.3111.7 -14.57%8,281.6 9,694.22,370.3AZ Phoenix City of Phoenix PTD TOTAL
28.4DR 27.4 32.1 27.8 30.61.2 3.80%90.1 86.830.6City of Phoenix PTDAZ Phoenix3,233.0MB 2,872.2 2,979.6 3,115.7 3,258.7110.5 -14.74%8,191.5 9,607.42,339.7City of Phoenix PTDAZ Phoenix
1,500.4 1,536.4 1,566.7 1,550.9 1,623.6NA -5.77%4,467.7 4,741.21,430.9AZ Phoenix Valley Metro TOTAL
39.0DR 42.3 45.6 39.5 44.21.8 5.13%129.0 122.741.1Valley MetroAZ Phoenix1,445.7MB 1,366.7 1,399.7 1,423.9 1,480.855.4 -6.56%4,064.8 4,350.41,298.4Valley MetroAZ Phoenix
82.0VP 91.4 91.1 87.5 98.6NA 2.16%273.9 268.191.4Valley MetroAZ Phoenix
1,290.6 1,398.3 1,445.6 1,195.1 1,255.249.0 2.75%4,003.2 3,895.91,314.3AZ Phoenix Valley Metro Rail, Inc. TOTAL1,445.6LR 1,290.6 1,398.3 1,195.1 1,255.249.0 2.75%4,003.2 3,895.91,314.3Valley Metro Rail, Inc.AZ Phoenix
83.1 89.7 77.4 86.3 98.53.8 -5.49%247.8 262.275.0AZ Scottsdale City of Scottsdale TOTAL77.4MB 83.1 89.7 86.3 98.53.8 -5.49%247.8 262.275.0City of ScottsdaleAZ Scottsdale
1,487.5 1,493.5 1,610.8 1,615.1 1,673.858.6 -10.42%4,389.0 4,899.71,408.0AZ Tucson City of Tucson MTS TOTAL1,610.8MB 1,487.5 1,493.5 1,615.1 1,673.858.6 -10.42%4,389.0 4,899.71,408.0City of Tucson MTSAZ Tucson
37.7 38.3 38.9 38.3 38.91.6 -5.43%109.8 116.133.8AZ Yuma Yuma County Intergovernmental PT TOTAL
0.4DR 0.5 0.7 0.4 0.50.0 30.77%1.7 1.30.5Yuma County Intergovernmental PTAZ Yuma38.5MB 37.2 37.6 37.9 38.41.6 -5.84%108.1 114.833.3Yuma County Intergovernmental PTAZ Yuma
13.4 14.9 7.0 5.2 9.30.4 94.42%41.8 21.513.5CA Alturas Modoc Transportation Agency TOTAL7.0MB 13.4 14.9 5.2 9.30.4 94.42%41.8 21.513.5Modoc Transportation AgencyCA Alturas
Modes: MB - Bus, DR - Demand Response, CR - Commuter Rail, HR - Heavy Rail, LR - Light Rail, AG - Automated Guideway, CC - Cable Car, FB - Ferry Boat, IP - Inclined Plane, IR - Intermediate Rail, MO - Monorail, TB - Trolleybus, VP - Vanpool

APTA TRANSIT RIDERSHIP REPORT
State and City Transit Agency ModeAverage
Weekday Jan '16Trips for Trips for
Feb '16Trips forMar '16
Trips ThruMar '16
Trips forJan '15
Trips forFeb '15
Trips forMar '15
Trips ThruMar '15 Quarterly
Change(000's) (000's) (000's) (000's) (000's) (000's) (000's) (000's)(000's)
11First Quarter, 2016
629.9 837.0 635.6 533.9 734.820.8 12.50%2,142.4 1,904.3675.5CA Anaheim Anaheim Resort Transportation TOTAL635.6MB 629.9 837.0 533.9 734.820.8 12.50%2,142.4 1,904.3675.5Anaheim Resort TransportationCA Anaheim
218.1 222.0 239.3 231.6 252.27.3 -10.48%647.3 723.1207.2CA Antioch Eastern Contra Costa Tr Auth TOTAL
10.5DR 10.6 11.8 10.0 11.00.5 4.13%32.8 31.510.4Eastern Contra Costa Tr AuthCA Antioch228.8MB 207.5 210.2 221.6 241.26.8 -11.15%614.5 691.6196.8Eastern Contra Costa Tr AuthCA Antioch
470.8 467.3 491.4 490.4 513.718.0 -8.57%1,367.4 1,495.5429.3CA Bakersfield Golden Empire Transit District TOTAL
4.6DR 5.1 5.3 4.7 5.40.2 4.76%15.4 14.75.0Golden Empire Transit DistrictCA Bakersfield486.8MB 465.7 462.0 485.7 508.317.8 -8.70%1,352.0 1,480.8424.3Golden Empire Transit DistrictCA Bakersfield
0.0 0.0 154.9 0.0 0.0NA -100.00%0.0 154.90.0CA Chula Vista Chula Vista Transit TOTAL154.9MB 0.0 0.0 0.0 0.0NA -100.00%0.0 154.90.0Chula Vista TransitCA Chula Vista
325.6 356.8 305.8 298.2 338.214.1 3.39%974.1 942.2291.7CA Concord Central Contra Costa TA TOTAL
12.6DR 12.6 13.9 12.2 13.90.6 0.00%38.7 38.712.2Central Contra Costa TACA Concord293.2MB 313.0 342.9 286.0 324.313.5 3.53%935.4 903.5279.5Central Contra Costa TACA Concord
422.9 468.4 396.5 382.2 431.916.9 7.52%1,301.6 1,210.6410.3CA Culver City Culver CityBus TOTAL396.5MB 422.9 468.4 382.2 431.916.9 7.52%1,301.6 1,210.6410.3Culver CityBusCA Culver City
461.0 401.5 457.2 433.7 357.920.7 7.96%1,348.2 1,248.8485.7CA Davis Unitrans TOTAL457.2MB 461.0 401.5 433.7 357.920.7 7.96%1,348.2 1,248.8485.7UnitransCA Davis
921.6 912.2 837.8 863.0 912.935.5 3.14%2,695.9 2,613.7862.1CA Fresno Fresno Area Express TOTAL
16.6DR 15.9 17.0 16.8 18.50.6 -5.78%48.9 51.916.0Fresno Area ExpressCA Fresno821.2MB 905.7 895.2 846.2 894.434.9 3.33%2,647.0 2,561.8846.1Fresno Area ExpressCA Fresno
304.4 294.2 300.8 308.8 326.712.6 -5.64%883.5 936.3284.9CA Gardena Gardena Municipal Bus Lines TOTAL
2.0DR 1.8 2.0 2.0 2.30.1 -12.70%5.5 6.31.7Gardena Municipal Bus LinesCA Gardena298.8MB 302.6 292.2 306.8 324.412.5 -5.59%878.0 930.0283.2Gardena Municipal Bus LinesCA Gardena
210.8 221.7 202.6 201.5 219.5NA 0.19%624.8 623.6192.3CA Hesperia Victor Valley Transit Authority TOTAL
12.1DR 12.4 13.6 12.2 13.4NA -0.53%37.5 37.711.5Victor Valley Transit AuthorityCA Hesperia148.4MB 156.2 161.9 148.5 161.8NA -0.76%455.2 458.7137.1Victor Valley Transit AuthorityCA Hesperia42.1VP 42.2 46.2 40.8 44.3NA 3.85%132.1 127.243.7Victor Valley Transit AuthorityCA Hesperia
250.8 259.3 268.5 281.4 299.610.2 -13.93%731.2 849.5221.1CA Lancaster Antelope Valley Transit Auth TOTAL
2.0DR 2.6 2.8 2.0 2.20.1 25.81%7.8 6.22.4Antelope Valley Transit AuthCA Lancaster266.5MB 248.2 256.5 279.4 297.410.1 -14.22%723.4 843.3218.7Antelope Valley Transit AuthCA Lancaster
140.2 149.9 138.8 136.2 150.46.0 -0.63%422.7 425.4132.6CA Livermore Livermore/Amador Valley TA TOTAL
4.5DR 4.8 5.0 4.7 5.20.2 -0.69%14.3 14.44.5Livermore/Amador Valley TACA Livermore134.3MB 135.4 144.9 131.5 145.25.8 -0.63%408.4 411.0128.1Livermore/Amador Valley TACA Livermore
Modes: MB - Bus, DR - Demand Response, CR - Commuter Rail, HR - Heavy Rail, LR - Light Rail, AG - Automated Guideway, CC - Cable Car, FB - Ferry Boat, IP - Inclined Plane, IR - Intermediate Rail, MO - Monorail, TB - Trolleybus, VP - Vanpool
APTA TRANSIT RIDERSHIP REPORT
State and City Transit Agency ModeAverage
Weekday Jan '16Trips for Trips for
Feb '16Trips forMar '16
Trips ThruMar '16
Trips forJan '15
Trips forFeb '15
Trips forMar '15
Trips ThruMar '15 Quarterly
Change(000's) (000's) (000's) (000's) (000's) (000's) (000's) (000's)(000's)
12First Quarter, 2016
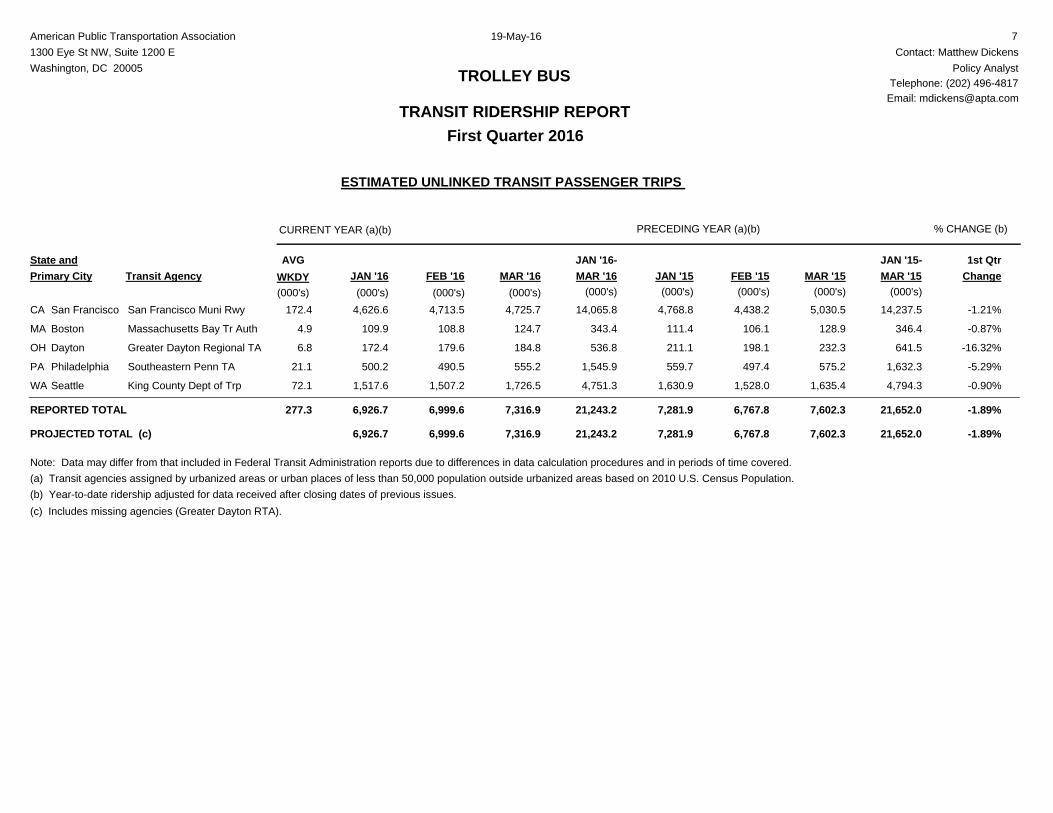
2,239.6 2,192.5 2,362.6 2,381.4 2,478.384.1 -8.33%6,620.7 7,222.32,188.6CA Long Beach Long Beach Transit TOTAL
4.4DR 4.2 4.4 4.6 5.20.2 -9.86%12.8 14.24.2Long Beach TransitCA Long Beach0.0FB 0.0 0.0 0.0 0.00.0 NA0.0 0.00.0Long Beach TransitCA Long Beach
2,358.2MB 2,235.4 2,188.1 2,376.8 2,473.183.9 -8.33%6,607.9 7,208.12,184.4Long Beach TransitCA Long Beach
272.0 295.4 252.4 249.4 277.210.7 6.17%827.1 779.0259.7CA Los Angeles Access Services TOTAL252.4DR 272.0 295.4 249.4 277.210.7 6.17%827.1 779.0259.7Access ServicesCA Los Angeles
34,785.8 36,780.9 36,979.3 35,638.7 39,149.61,320.4 -6.07%104,978.8 111,767.633,412.1CA Los Angeles Los Angeles County MTA TOTAL
4,041.3HR 3,671.4 3,961.4 3,658.1 4,009.3142.0 -2.61%11,402.8 11,708.73,770.0Los Angeles County MTACA Los Angeles5,263.8LR 4,881.2 5,417.2 4,810.0 5,248.3192.0 -0.30%15,276.2 15,322.14,977.8Los Angeles County MTACA Los Angeles
27,674.2MB 26,233.2 27,402.3 27,170.6 29,892.0986.4 -7.60%78,299.8 84,736.824,664.3Los Angeles County MTACA Los Angeles
921.7 967.6 908.2 880.3 1,003.940.1 -0.81%2,769.9 2,792.4880.6CA Los Angeles Southern California RRA TOTAL908.2CR 921.7 967.6 880.3 1,003.940.1 -0.81%2,769.9 2,792.4880.6Southern California RRACA Los Angeles
575.0 597.6 595.0 602.2 657.127.6 -7.70%1,711.6 1,854.3539.0CA Montebello Montebello Bus Lines TOTAL
3.5DR 4.0 4.6 3.9 4.30.1 7.69%12.6 11.74.0Montebello Bus LinesCA Montebello591.5MB 571.0 593.0 598.3 652.827.5 -7.79%1,699.0 1,842.6535.0Montebello Bus LinesCA Montebello
353.7 361.0 319.8 331.1 366.112.9 -0.65%1,010.4 1,017.0295.7CA Monterey Monterey-Salinas Transit TOTAL
15.1DR 14.8 15.8 14.1 15.20.7 -2.48%43.3 44.412.7Monterey-Salinas TransitCA Monterey304.7MB 338.9 345.2 317.0 350.912.2 -0.57%967.1 972.6283.0Monterey-Salinas TransitCA Monterey
96.4 105.0 97.2 97.3 107.94.0 -5.19%286.7 302.485.3CA Napa Napa County Transportation and Pla TOTAL
9.7DR 8.5 9.2 9.4 10.40.4 -11.53%26.1 29.58.4Napa County Transportation and PlaCA Napa87.5MB 87.9 95.8 87.9 97.53.6 -4.51%260.6 272.976.9Napa County Transportation and PlaCA Napa
118.9 120.2 122.3 130.3 138.54.8 -12.50%342.2 391.1103.1CA Norwalk Norwalk Transit System TOTAL
1.8DR 1.8 1.8 1.7 2.10.0 -5.36%5.3 5.61.7Norwalk Transit SystemCA Norwalk120.5MB 117.1 118.4 128.6 136.44.8 -12.61%336.9 385.5101.4Norwalk Transit SystemCA Norwalk
4,500.4 4,781.0 4,555.4 4,360.0 4,934.8215.8 -3.56%13,357.0 13,850.24,075.6CA Oakland Alameda-Contra Costa TD TOTAL
57.9DR 59.1 64.9 55.8 63.23.0 2.43%181.2 176.957.2Alameda-Contra Costa TDCA Oakland4,497.5MB 4,441.3 4,716.1 4,304.2 4,871.6212.9 -3.64%13,175.8 13,673.34,018.4Alameda-Contra Costa TDCA Oakland
125.2 137.3 112.3 110.7 124.75.0 9.38%380.3 347.7117.8CA Oakland Capitol Corridor Joint Powers Auth TOTAL112.3CR 125.2 137.3 110.7 124.75.0 9.38%380.3 347.7117.8Capitol Corridor Joint Powers AuthCA Oakland
996.1 1,027.0 1,005.5 998.2 1,097.9NA -6.19%2,909.6 3,101.6886.5CA Oceanside North County Transit District TOTAL
116.7CR 115.3 123.1 114.9 126.4NA -5.36%338.8 358.0100.4North County Transit DistrictCA Oceanside15.7DR 17.3 19.0 15.8 17.7NA 7.11%52.7 49.216.4North County Transit DistrictCA Oceanside
222.5LR 234.1 236.4 230.2 251.8NA -5.41%666.4 704.5195.9North County Transit DistrictCA Oceanside650.6MB 629.4 648.5 637.3 702.0NA -6.95%1,851.7 1,989.9573.8North County Transit DistrictCA Oceanside
Modes: MB - Bus, DR - Demand Response, CR - Commuter Rail, HR - Heavy Rail, LR - Light Rail, AG - Automated Guideway, CC - Cable Car, FB - Ferry Boat, IP - Inclined Plane, IR - Intermediate Rail, MO - Monorail, TB - Trolleybus, VP - Vanpool
APTA TRANSIT RIDERSHIP REPORT
State and City Transit Agency ModeAverage
Weekday Jan '16Trips for Trips for
Feb '16Trips forMar '16
Trips ThruMar '16
Trips forJan '15
Trips forFeb '15
Trips forMar '15
Trips ThruMar '15 Quarterly
Change(000's) (000's) (000's) (000's) (000's) (000's) (000's) (000's)(000's)
13First Quarter, 2016
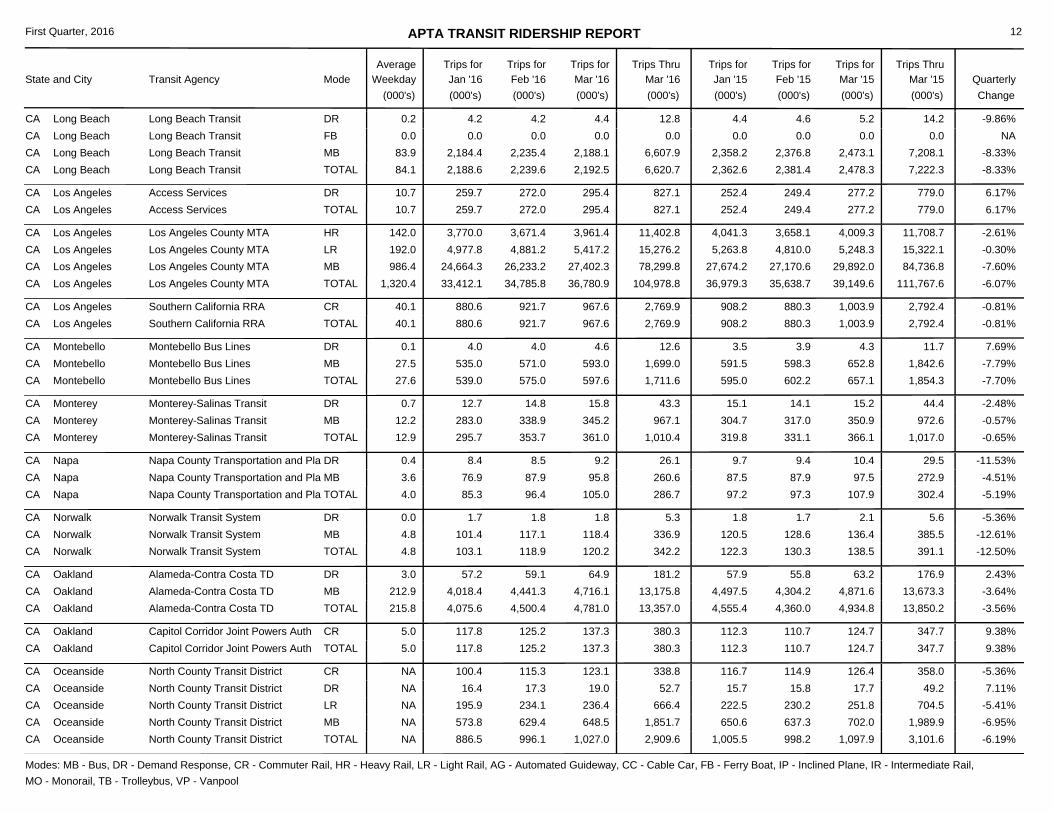
NA NA 3,977.2 3,978.2 4,397.2NA NANA 12,352.6NACA Orange Orange County Transp Auth TOTAL
134.3DR 143.6 147.1 133.8 150.66.7 2.51%429.2 418.7138.5Orange County Transp AuthCA Orange3,737.6MB 3,514.5 3,689.7 3,740.3 4,135.5134.8 -10.07%10,443.4 11,613.43,239.2Orange County Transp AuthCA Orange
105.3VP NA NA 104.1 111.1NA NANA 320.5NAOrange County Transp AuthCA Orange
NA NA 322.8 320.8 356.3NA NANA 999.9NACA Oxnard Gold Coast Transit TOTAL
6.6DR NA NA 6.5 7.4NA NANA 20.5NAGold Coast TransitCA Oxnard316.2MB 314.0 328.2 314.3 348.911.6 -5.77%922.9 979.4280.7Gold Coast TransitCA Oxnard
60.6 62.7 67.2 64.1 65.94.1 -9.89%177.7 197.254.4CA Redding Redding Area Bus Authority TOTAL
4.1DR 4.2 4.7 4.1 4.51.9 0.79%12.8 12.73.9Redding Area Bus AuthorityCA Redding63.1MB 56.4 58.0 60.0 61.42.2 -10.62%164.9 184.550.5Redding Area Bus AuthorityCA Redding
34.6 37.6 34.3 33.7 38.2NA -1.60%104.5 106.232.3CA Redondo Beach City of Redondo Beach TOTAL
1.4DR 1.3 1.3 1.3 1.5NA -9.52%3.8 4.21.2City of Redondo BeachCA Redondo Beach32.9MB 33.3 36.3 32.4 36.7NA -1.27%100.7 102.031.1City of Redondo BeachCA Redondo Beach
774.6 801.8 762.4 789.8 865.230.5 -5.70%2,279.5 2,417.4703.1CA Riverside Riverside Transit Agency TOTAL
33.2DR 34.5 37.6 33.9 37.01.5 0.77%104.9 104.132.8Riverside Transit AgencyCA Riverside729.2MB 740.1 764.2 755.9 828.229.0 -6.00%2,174.6 2,313.3670.3Riverside Transit AgencyCA Riverside
2,210.9 2,182.7 2,126.6 2,139.6 2,287.6NA -3.48%6,325.8 6,553.81,932.2CA Sacramento Sacramento Reg Tr Dist TOTAL
27.2DR 29.2 31.6 26.2 30.0NA 6.12%88.5 83.427.7Sacramento Reg Tr DistCA Sacramento1,007.7LR 1,144.2 1,120.1 997.6 1,066.345.8 6.51%3,271.6 3,071.61,007.3Sacramento Reg Tr DistCA Sacramento1,091.7MB 1,037.5 1,031.0 1,115.8 1,191.341.8 -12.74%2,965.7 3,398.8897.2Sacramento Reg Tr DistCA Sacramento
1,075.7 1,070.9 1,146.6 1,150.7 1,194.141.5 -10.89%3,111.2 3,491.4964.6CA San Bernardino OMNITRANS TOTAL
37.0DR 35.1 38.9 36.1 40.61.6 -5.45%107.5 113.733.5OMNITRANSCA San Bernardino1,109.6MB 1,040.6 1,032.0 1,114.6 1,153.539.9 -11.07%3,003.7 3,377.7931.1OMNITRANSCA San Bernardino
1,551.8 1,583.9 1,457.0 1,362.6 1,538.758.2 5.82%4,611.9 4,358.31,476.2CA San Carlos Caltrain TOTAL1,457.0CR 1,551.8 1,583.9 1,362.6 1,538.758.2 5.82%4,611.9 4,358.31,476.2CaltrainCA San Carlos
1,076.6 1,132.1 1,101.6 1,054.4 1,200.6NA -3.66%3,233.8 3,356.61,025.1CA San Carlos San Mateo County Tran Dist TOTAL
25.9DR 28.5 31.6 24.7 28.8NA 10.58%87.8 79.427.7San Mateo County Tran DistCA San Carlos1,075.7MB 1,048.1 1,100.5 1,029.7 1,171.841.4 -4.00%3,146.0 3,277.2997.4San Mateo County Tran DistCA San Carlos
7,644.2 7,886.8 7,466.1 7,775.5 8,397.9291.0 -4.11%22,667.4 23,639.57,136.4CA San Diego San Diego Metrop Transit System TOTAL
47.2DR 52.2 57.6 47.4 51.92.4 8.81%159.4 146.549.6San Diego Metrop Transit SystemCA San Diego3,107.4LR 3,176.8 3,322.9 3,225.5 3,498.3118.6 -2.82%9,553.7 9,831.23,054.0San Diego Metrop Transit SystemCA San Diego4,311.5MB 4,415.2 4,506.3 4,502.6 4,847.7170.0 -5.18%12,954.3 13,661.84,032.8San Diego Metrop Transit SystemCA San Diego
Modes: MB - Bus, DR - Demand Response, CR - Commuter Rail, HR - Heavy Rail, LR - Light Rail, AG - Automated Guideway, CC - Cable Car, FB - Ferry Boat, IP - Inclined Plane, IR - Intermediate Rail, MO - Monorail, TB - Trolleybus, VP - Vanpool

APTA TRANSIT RIDERSHIP REPORT
State and City Transit Agency ModeAverage
Weekday Jan '16Trips for Trips for
Feb '16Trips forMar '16
Trips ThruMar '16
Trips forJan '15
Trips forFeb '15
Trips forMar '15
Trips ThruMar '15 Quarterly
Change(000's) (000's) (000's) (000's) (000's) (000's) (000's) (000's)(000's)
14First Quarter, 2016
478.4 508.4 485.1 448.6 535.519.0 -2.91%1,426.5 1,469.2439.7CA San Francisco Golden Gate Bridge, Hwy & TD TOTAL
11.4DR 10.6 11.9 11.0 12.50.5 -6.30%32.7 34.910.2Golden Gate Bridge, Hwy & TDCA San Francisco181.6FB 190.5 194.7 165.7 212.47.4 -2.86%543.7 559.7158.5Golden Gate Bridge, Hwy & TDCA San Francisco292.1MB 277.3 301.8 271.9 310.611.2 -2.80%850.1 874.6271.0Golden Gate Bridge, Hwy & TDCA San Francisco
11,539.8 11,841.6 10,633.9 10,202.1 11,645.6458.2 5.02%34,112.6 32,481.610,731.2CA San Francisco San Francisco Bay Area RTD TOTAL
68.6AG 72.9 84.6 65.9 81.62.8 7.31%231.9 216.174.4San Francisco Bay Area RTDCA San Francisco10,565.3HR 11,466.9 11,757.0 10,136.2 11,564.0455.4 5.01%33,880.7 32,265.510,656.8San Francisco Bay Area RTDCA San Francisco
17,328.9 17,931.4 16,630.2 15,786.7 17,642.6667.8 4.16%52,141.7 50,059.516,881.4CA San Francisco San Francisco Muni Rwy TOTAL
442.1CC 392.1 553.3 384.5 542.516.1 1.99%1,396.4 1,369.1451.0San Francisco Muni RwyCA San Francisco3,783.3LR 3,914.7 3,983.8 3,784.6 3,834.2157.4 3.11%11,756.8 11,402.13,858.3San Francisco Muni RwyCA San Francisco7,636.0MB 8,308.6 8,668.6 7,179.4 8,235.4322.0 8.12%24,922.7 23,050.87,945.5San Francisco Muni RwyCA San Francisco4,768.8TB 4,713.5 4,725.7 4,438.2 5,030.5172.4 -1.21%14,065.8 14,237.54,626.6San Francisco Muni RwyCA San Francisco
198.3 197.0 145.4 141.9 176.27.5 20.45%558.3 463.5163.0CA San Francisco Water Emergency Tr Auth TOTAL145.4FB 198.3 197.0 141.9 176.27.5 20.45%558.3 463.5163.0Water Emergency Tr AuthCA San Francisco
3,451.0 3,695.2 3,550.9 3,519.6 4,042.0135.5 -6.13%10,431.7 11,112.53,285.5CA San Jose Santa Clara Valley Trp Auth TOTAL
57.9DR 48.6 55.1 55.7 62.42.2 -13.98%151.4 176.047.7Santa Clara Valley Trp AuthCA San Jose834.9LR 825.0 862.7 869.0 976.130.8 -8.05%2,464.2 2,680.0776.5Santa Clara Valley Trp AuthCA San Jose
2,658.1MB 2,577.4 2,777.4 2,594.9 3,003.5102.5 -5.33%7,816.1 8,256.52,461.3Santa Clara Valley Trp AuthCA San Jose
250.4 269.6 273.8 248.2 305.29.9 -8.17%759.6 827.2239.6CA San Rafael Marin County Transit District TOTAL
11.0DR 10.4 11.4 10.7 12.10.4 -6.21%31.7 33.89.9Marin County Transit DistrictCA San Rafael262.8MB 240.0 258.2 237.5 293.19.5 -8.26%727.9 793.4229.7Marin County Transit DistrictCA San Rafael
618.8 604.8 643.5 640.9 660.824.2 -7.95%1,790.6 1,945.2567.0CA Santa Barbara Santa Barbara MTD TOTAL
4.7DR 4.5 4.8 4.5 5.10.2 -4.90%13.6 14.34.3Santa Barbara MTDCA Santa Barbara638.8MB 614.3 600.0 636.4 655.724.0 -7.97%1,777.0 1,930.9562.7Santa Barbara MTDCA Santa Barbara
265.8 297.1 265.5 275.9 315.79.2 -7.22%795.2 857.1232.3CA Santa Clarita Santa Clarita Transit TOTAL
8.5DR 7.8 9.1 8.5 9.70.4 -9.36%24.2 26.77.3Santa Clarita TransitCA Santa Clarita257.0MB 258.0 288.0 267.4 306.08.8 -7.15%771.0 830.4225.0Santa Clarita TransitCA Santa Clarita
551.9 520.2 549.8 541.9 516.3NA -1.59%1,582.5 1,608.0510.4CA Santa Cruz Santa Cruz Metro Transit Dist TOTAL
7.5DR 7.1 7.4 7.8 9.10.3 -13.93%21.0 24.46.5Santa Cruz Metro Transit DistCA Santa Cruz542.3MB 544.8 512.8 534.1 507.2204.2 -1.40%1,561.5 1,583.6503.9Santa Cruz Metro Transit DistCA Santa Cruz
1,383.5 1,739.1 1,677.7 1,545.7 1,719.566.6 -13.25%4,288.1 4,942.91,165.5CA Santa Monica Santa Monica's Big Blue Bus TOTAL
19.5DR 19.9 20.8 19.4 21.30.9 -0.17%60.1 60.219.4Santa Monica's Big Blue BusCA Santa Monica1,658.2MB 1,363.6 1,718.3 1,526.3 1,698.265.6 -13.41%4,228.0 4,882.71,146.1Santa Monica's Big Blue BusCA Santa Monica
Modes: MB - Bus, DR - Demand Response, CR - Commuter Rail, HR - Heavy Rail, LR - Light Rail, AG - Automated Guideway, CC - Cable Car, FB - Ferry Boat, IP - Inclined Plane, IR - Intermediate Rail, MO - Monorail, TB - Trolleybus, VP - Vanpool

APTA TRANSIT RIDERSHIP REPORT
State and City Transit Agency ModeAverage
Weekday Jan '16Trips for Trips for
Feb '16Trips forMar '16
Trips ThruMar '16
Trips forJan '15
Trips forFeb '15
Trips forMar '15
Trips ThruMar '15 Quarterly
Change(000's) (000's) (000's) (000's) (000's) (000's) (000's) (000's)(000's)
15First Quarter, 2016
101.4 109.8 95.5 93.7 106.64.9 5.17%311.1 295.899.9CA Stockton San Joaquin Reg Rail Comm TOTAL95.5CR 101.4 109.8 93.7 106.64.9 5.17%311.1 295.899.9San Joaquin Reg Rail CommCA Stockton
338.9 341.8 364.1 361.1 401.414.5 -12.15%989.7 1,126.6309.0CA Stockton San Joaquin Reg Trans Dist TOTAL
4.0DR 5.0 5.0 4.0 4.50.2 20.00%15.0 12.55.0San Joaquin Reg Trans DistCA Stockton360.1MB 333.9 336.8 357.1 396.914.3 -12.51%974.7 1,114.1304.0San Joaquin Reg Trans DistCA Stockton
394.5 402.1 406.9 410.7 437.214.8 -7.18%1,164.7 1,254.8368.1CA Thousand Palms SunLine Transit Agency TOTAL
12.7DR 13.4 14.8 12.3 13.80.5 5.93%41.1 38.812.9SunLine Transit AgencyCA Thousand Palms394.2MB 381.1 387.3 398.4 423.414.2 -7.60%1,123.6 1,216.0355.2SunLine Transit AgencyCA Thousand Palms
319.5 329.2 325.4 337.1 363.712.6 -8.46%939.4 1,026.2290.7CA Torrance Torrance Transit System TOTAL
4.7DR 4.1 4.1 4.5 4.80.2 -12.86%12.2 14.04.0Torrance Transit SystemCA Torrance320.7MB 315.4 325.1 332.6 358.912.4 -8.40%927.2 1,012.2286.7Torrance Transit SystemCA Torrance
130.8 132.3 118.4 118.7 133.05.4 3.13%381.7 370.1118.6CA Vallejo Solano County Transit (SolTrans) TOTAL
2.6DR 2.2 2.5 2.4 2.90.1 -12.66%6.9 7.92.2Solano County Transit (SolTrans)CA Vallejo115.8MB 128.6 129.8 116.3 130.15.3 3.48%374.8 362.2116.4Solano County Transit (SolTrans)CA Vallejo
NA NA 74.4 78.3 71.5NA NANA 224.2NACA Ventura Ventura County Transp Comm TOTAL
12.0DR NA NA 12.1 4.2NA NANA 28.3NAVentura County Transp CommCA Ventura62.4MB 70.4 68.3 66.2 67.32.8 -0.46%195.0 195.956.3Ventura County Transp CommCA Ventura
134.3 133.4 138.4 137.1 153.15.3 -9.87%386.3 428.6118.6CA Visalia Visalia City Coach TOTAL
2.8DR 2.7 3.1 2.7 2.90.1 0.00%8.4 8.42.6Visalia City CoachCA Visalia135.6MB 131.6 130.3 134.4 150.25.2 -10.07%377.9 420.2116.0Visalia City CoachCA Visalia
1,112.4 1,179.4 1,190.0 1,137.2 1,282.425.8 -7.01%3,356.7 3,609.61,064.9CA West Covina Foothill Transit TOTAL1,190.0MB 1,112.4 1,179.4 1,137.2 1,282.425.8 -7.01%3,356.7 3,609.61,064.9Foothill TransitCA West Covina
574.0 562.8 627.4 521.6 555.920.2 6.67%1,818.7 1,704.9681.9CO Aspen Roaring Fork Transp Auth TOTAL627.4MB 574.0 562.8 521.6 555.920.2 6.67%1,818.7 1,704.9681.9Roaring Fork Transp AuthCO Aspen
248.4 274.2 250.9 245.5 271.310.8 1.29%777.6 767.7255.0CO Colorado Springs Mountain Metropolitan Transit TOTAL
21.5DR 15.8 19.0 20.4 23.50.7 -21.56%51.3 65.416.5Mountain Metropolitan TransitCO Colorado Springs224.6MB 227.5 250.2 220.4 242.09.9 3.49%711.0 687.0233.3Mountain Metropolitan TransitCO Colorado Springs
4.8VP 5.1 5.0 4.7 5.80.2 0.00%15.3 15.35.2Mountain Metropolitan TransitCO Colorado Springs
8,281.3 8,445.1 8,584.5 8,180.2 9,066.2327.1 -4.42%24,690.3 25,830.97,963.9CO Denver Regional Trp District TOTAL
123.1DR 112.4 113.8 116.5 122.44.8 -7.04%336.5 362.0110.3Regional Trp DistrictCO Denver2,120.4LR 2,071.7 2,103.8 2,057.3 2,245.379.6 -4.65%6,124.6 6,423.01,949.1Regional Trp DistrictCO Denver6,313.7MB 6,069.9 6,197.0 5,979.6 6,669.2241.5 -4.31%18,145.5 18,962.55,878.6Regional Trp DistrictCO Denver
27.3VP 27.3 30.5 26.8 29.31.3 0.36%83.7 83.425.9Regional Trp DistrictCO Denver
Modes: MB - Bus, DR - Demand Response, CR - Commuter Rail, HR - Heavy Rail, LR - Light Rail, AG - Automated Guideway, CC - Cable Car, FB - Ferry Boat, IP - Inclined Plane, IR - Intermediate Rail, MO - Monorail, TB - Trolleybus, VP - Vanpool

APTA TRANSIT RIDERSHIP REPORT
State and City Transit Agency ModeAverage
Weekday Jan '16Trips for Trips for
Feb '16Trips forMar '16
Trips ThruMar '16
Trips forJan '15
Trips forFeb '15
Trips forMar '15
Trips ThruMar '15 Quarterly
Change(000's) (000's) (000's) (000's) (000's) (000's) (000's) (000's)(000's)
16First Quarter, 2016
67.0 69.0 77.5 77.8 78.82.7 -13.33%202.9 234.166.9CO Grand Junction Mesa County Reg Transp Office TOTAL
1.4DR 1.5 1.7 1.3 1.40.0 14.63%4.7 4.11.5Mesa County Reg Transp OfficeCO Grand Junction76.1MB 65.5 67.3 76.5 77.42.7 -13.83%198.2 230.065.4Mesa County Reg Transp OfficeCO Grand Junction
5.3 6.2 5.2 5.0 6.40.2 3.01%17.1 16.65.6CT Hartford Connecticut DOT TOTAL5.2DR 5.3 6.2 5.0 6.40.2 3.01%17.1 16.65.6Connecticut DOTCT Hartford
2,157.1 2,464.2 1,982.9 1,893.6 2,291.188.2 8.69%6,703.7 6,167.62,082.4CT Hartford Connecticut Transit TOTAL1,982.9MB 2,157.1 2,464.2 1,893.6 2,291.188.2 8.69%6,703.7 6,167.62,082.4Connecticut TransitCT Hartford
41.4 46.9 31.6 30.0 38.22.0 30.66%130.4 99.842.1CT Hartford Greater Hartford Tran Dist TOTAL31.6DR 41.4 46.9 30.0 38.22.0 30.66%130.4 99.842.1Greater Hartford Tran DistCT Hartford
44.3 49.2 42.4 41.1 48.31.9 3.64%136.6 131.843.1CT New Haven Connecticut DOT TOTAL42.4CR 44.3 49.2 41.1 48.31.9 3.64%136.6 131.843.1Connecticut DOTCT New Haven
19.8 22.3 20.0 18.4 22.50.8 5.09%64.0 60.921.9CT New Haven Greater New Haven Transit Dist TOTAL20.0DR 19.8 22.3 18.4 22.50.8 5.09%64.0 60.921.9Greater New Haven Transit DistCT New Haven
132.8 152.4 128.6 130.4 156.55.5 -1.13%410.8 415.5125.6CT Norwalk Norwalk Transit District TOTAL
8.0DR 9.3 10.8 7.6 9.40.4 16.40%29.1 25.09.0Norwalk Transit DistrictCT Norwalk120.6MB 123.5 141.6 122.8 147.15.1 -2.25%381.7 390.5116.6Norwalk Transit DistrictCT Norwalk
371.4 537.6 389.1 350.4 408.7NA 7.11%1,229.8 1,148.2320.8DC Washington District Dept of Trp (DDOT) TOTAL
0.0LR 10.3 67.9 0.0 0.0NA NA78.2 0.00.0District Dept of Trp (DDOT)DC Washington389.1MB 361.1 469.7 350.4 408.710.9 0.30%1,151.6 1,148.2320.8District Dept of Trp (DDOT)DC Washington
29,145.9 33,723.2 30,197.2 27,770.4 33,651.41,274.2 -3.97%87,985.9 91,619.025,116.8DC Washington Washington Metro Area TA TOTAL
20,018.9HR 19,365.6 22,557.9 18,435.2 22,681.6864.1 -3.85%58,783.7 61,135.716,860.2Washington Metro Area TADC Washington10,178.3MB 9,780.3 11,165.3 9,335.2 10,969.8410.1 -4.20%29,202.2 30,483.38,256.6Washington Metro Area TADC Washington
712.9 766.5 758.2 699.4 783.830.6 -4.52%2,140.0 2,241.4660.6DE Wilmington Delaware Transit Corp TOTAL
78.8DR 79.9 87.6 73.6 83.43.5 2.04%240.6 235.873.1Delaware Transit CorpDE Wilmington679.4MB 633.0 678.9 625.8 700.427.1 -5.30%1,899.4 2,005.6587.5Delaware Transit CorpDE Wilmington
158.7 173.1 161.4 167.7 189.56.0 -9.74%468.1 518.6136.3FL Bradenton Manatee County Area Transit TOTAL
7.8DR 8.1 8.8 8.1 9.10.4 -1.60%24.6 25.07.7Manatee County Area TransitFL Bradenton153.6MB 150.6 164.3 159.6 180.45.6 -10.15%443.5 493.6128.6Manatee County Area TransitFL Bradenton
3,017.1 3,156.8 3,531.5 3,282.7 3,539.1118.8 -12.36%9,073.8 10,353.32,899.9FL Fort Lauderdale Broward County Transit TOTAL
51.0DR 60.0 64.8 51.7 56.12.5 14.23%181.4 158.856.6Broward County TransitFL Fort Lauderdale3,480.5MB 2,957.1 3,092.0 3,231.0 3,483.0116.3 -12.77%8,892.4 10,194.52,843.3Broward County TransitFL Fort Lauderdale
Modes: MB - Bus, DR - Demand Response, CR - Commuter Rail, HR - Heavy Rail, LR - Light Rail, AG - Automated Guideway, CC - Cable Car, FB - Ferry Boat, IP - Inclined Plane, IR - Intermediate Rail, MO - Monorail, TB - Trolleybus, VP - Vanpool

APTA TRANSIT RIDERSHIP REPORT
State and City Transit Agency ModeAverage
Weekday Jan '16Trips for Trips for
Feb '16Trips forMar '16
Trips ThruMar '16
Trips forJan '15
Trips forFeb '15
Trips forMar '15
Trips ThruMar '15 Quarterly
Change(000's) (000's) (000's) (000's) (000's) (000's) (000's) (000's)(000's)
17First Quarter, 2016
334.9 363.9 353.2 353.1 396.112.6 -10.44%987.3 1,102.4288.5FL Fort Myers Lee Tran TOTAL
9.4DR 10.2 10.9 9.1 10.40.4 6.23%30.7 28.99.6Lee Tran FL Fort Myers339.0MB 321.2 349.4 341.2 382.412.1 -10.97%946.0 1,062.6275.4Lee Tran FL Fort Myers
4.8VP 3.5 3.6 2.8 3.30.1 -2.75%10.6 10.93.5Lee Tran FL Fort Myers
1,066.7 1,130.1 1,101.6 1,006.7 1,108.043.2 0.38%3,228.5 3,216.31,031.7FL Jacksonville Jacksonville Transp Auth TOTAL
100.0AG 86.0 99.1 87.5 107.24.0 -9.20%267.6 294.782.5Jacksonville Transp AuthFL Jacksonville31.0DR 30.9 32.7 29.5 32.31.2 0.86%93.6 92.830.0Jacksonville Transp AuthFL Jacksonville
970.6MB 949.8 998.3 889.7 968.538.0 1.36%2,867.3 2,828.8919.2Jacksonville Transp AuthFL Jacksonville
8,286.5 NA 9,144.6 8,416.4 9,746.1NA NANA 27,307.18,198.9FL Miami Miami-Dade Transit Agency TOTAL
847.9AG 860.6 1,010.1 776.5 980.135.4 5.02%2,735.3 2,604.5864.6Miami-Dade Transit AgencyFL Miami135.3DR 134.0 144.2 129.6 144.05.5 -0.37%407.4 408.9129.2Miami-Dade Transit AgencyFL Miami
1,857.5HR 1,824.3 1,994.8 1,765.2 1,996.276.4 -0.22%5,606.6 5,618.91,787.5Miami-Dade Transit AgencyFL Miami6,303.9MB 5,467.6 NA 5,745.1 6,625.8NA NANA 18,674.85,417.6Miami-Dade Transit AgencyFL Miami
2,111.4 2,223.1 2,494.0 2,281.5 2,477.281.5 -11.39%6,426.3 7,252.72,091.8FL Orlando Central Florida RTA TOTAL
59.8DR 58.8 62.7 56.7 56.82.4 2.77%178.1 173.356.6Central Florida RTAFL Orlando2,406.6MB 2,019.9 2,126.8 2,196.1 2,389.077.7 -12.03%6,150.7 6,991.72,004.0Central Florida RTAFL Orlando
27.6VP 32.7 33.6 28.7 31.41.4 11.17%97.5 87.731.2Central Florida RTAFL Orlando
73.5 88.3 76.6 71.2 124.4NA -17.41%224.8 272.263.0FL Orlando SunRail TOTAL76.6CR 73.5 88.3 71.2 124.4NA -17.41%224.8 272.263.0SunRailFL Orlando
444.7 482.7 462.0 425.8 474.418.0 0.18%1,364.6 1,362.2437.2FL Pompano Beach South Florida RTA (Tri-Rail) TOTAL
371.6CR 356.2 383.8 344.0 380.014.2 -0.62%1,088.8 1,095.6348.8South Florida RTA (Tri-Rail)FL Pompano Beach90.4MB 88.5 98.9 81.8 94.43.8 3.45%275.8 266.688.4South Florida RTA (Tri-Rail)FL Pompano Beach
239.1 251.3 260.0 244.9 267.09.3 -7.85%711.3 771.9220.9FL Sarasota Sarasota County Area Transit TOTAL
14.8DR 15.8 12.7 14.5 12.90.6 -6.64%39.4 42.210.9Sarasota County Area TransitFL Sarasota245.2MB 223.3 238.6 230.4 254.18.7 -7.92%671.9 729.7210.0Sarasota County Area TransitFL Sarasota
1,108.5 1,177.3 1,258.6 1,184.7 1,332.542.7 -10.87%3,365.3 3,775.81,079.5FL St. Petersburg Pinellas Suncoast Tran Auth TOTAL
26.0DR 24.7 26.1 24.8 27.31.0 -4.35%74.7 78.123.9Pinellas Suncoast Tran AuthFL St. Petersburg1,232.6MB 1,083.8 1,151.2 1,159.9 1,305.241.7 -11.01%3,290.6 3,697.71,055.6Pinellas Suncoast Tran AuthFL St. Petersburg
359.5 315.9 364.7 386.3 334.318.5 -6.25%1,017.5 1,085.3342.1FL Tallahassee StarMetro-City of Tallahassee TOTAL
7.3DR 7.9 7.8 7.5 8.00.4 2.63%23.4 22.87.7StarMetro-City of TallahasseeFL Tallahassee357.4MB 351.6 308.1 378.8 326.318.1 -6.44%994.1 1,062.5334.4StarMetro-City of TallahasseeFL Tallahassee
Modes: MB - Bus, DR - Demand Response, CR - Commuter Rail, HR - Heavy Rail, LR - Light Rail, AG - Automated Guideway, CC - Cable Car, FB - Ferry Boat, IP - Inclined Plane, IR - Intermediate Rail, MO - Monorail, TB - Trolleybus, VP - Vanpool

APTA TRANSIT RIDERSHIP REPORT
State and City Transit Agency ModeAverage
Weekday Jan '16Trips for Trips for
Feb '16Trips forMar '16
Trips ThruMar '16
Trips forJan '15
Trips forFeb '15
Trips forMar '15
Trips ThruMar '15 Quarterly
Change(000's) (000's) (000's) (000's) (000's) (000's) (000's) (000's)(000's)
18First Quarter, 2016
1,231.0 1,276.1 1,342.2 1,248.7 1,341.648.5 -5.93%3,699.3 3,932.51,192.2FL Tampa Hillsborough Area Reg TA TOTAL
13.1DR 12.5 13.1 13.0 13.70.6 -4.27%38.1 39.812.5Hillsborough Area Reg TAFL Tampa35.3LR 24.4 32.8 23.3 32.60.7 -2.41%89.0 91.231.8Hillsborough Area Reg TAFL Tampa
1,293.8MB 1,194.1 1,230.2 1,212.4 1,295.347.2 -6.03%3,572.2 3,801.51,147.9Hillsborough Area Reg TAFL Tampa
NA NA NA NA NANA NANA NANAFL West Palm Beach Palm Beach County STD TOTAL
NADR NA NA NA NANA NANA NANAPalm Beach County STDFL West Palm Beach814.0MB 855.0 869.6 795.6 839.834.0 2.31%2,506.1 2,449.4781.5Palm Beach County STDFL West Palm Beach
42.9 30.5 64.5 47.0 63.90.7 -42.65%100.6 175.427.2GA Atlanta City of Atlanta TOTAL64.5LR 42.9 30.5 47.0 63.90.7 -42.65%100.6 175.427.2City of AtlantaGA Atlanta
129.8 141.7 136.4 106.7 145.86.2 0.49%390.8 388.9119.3GA Atlanta Georgia Regional Trp Auth TOTAL136.4MB 129.8 141.7 106.7 145.86.2 0.49%390.8 388.9119.3Georgia Regional Trp AuthGA Atlanta
10,300.9 11,156.2 10,662.9 9,622.1 11,013.7404.4 0.53%31,463.4 31,298.710,006.3GA Atlanta Metro Atlanta Rapid Tr Auth TOTAL
50.0DR 54.6 59.6 45.2 57.22.2 8.86%165.9 152.451.7Metro Atlanta Rapid Tr AuthGA Atlanta5,715.8HR 5,542.0 6,022.0 5,120.5 5,854.3221.1 2.45%17,099.9 16,690.65,535.9Metro Atlanta Rapid Tr AuthGA Atlanta4,897.1MB 4,704.3 5,074.6 4,456.4 5,102.2181.1 -1.79%14,197.6 14,455.74,418.7Metro Atlanta Rapid Tr AuthGA Atlanta
12.4 15.0 12.5 10.6 14.40.5 -3.47%36.2 37.58.8GA Gainesville Hall Area Transit TOTAL
2.0DR 2.1 2.5 1.6 2.30.1 11.86%6.6 5.92.0Hall Area TransitGA Gainesville10.5MB 10.3 12.5 9.0 12.10.4 -6.33%29.6 31.66.8Hall Area TransitGA Gainesville
303.9 307.8 287.5 302.9 307.612.1 -0.82%890.6 898.0278.9GA Savannah Chatham Area Transit Auth TOTAL
7.3DR 8.1 7.8 6.9 7.60.3 6.88%23.3 21.87.4Chatham Area Transit AuthGA Savannah280.2MB 295.8 300.0 296.0 300.011.8 -1.02%867.3 876.2271.5Chatham Area Transit AuthGA Savannah
5,644.4 5,647.5 6,076.7 5,565.7 5,905.0213.3 -3.60%16,916.1 17,547.45,624.2HI Honolulu City & Cnty of Honolulu DOTS TOTAL
82.1DR 88.7 96.7 77.9 87.33.6 10.31%272.8 247.387.4City & Cnty of Honolulu DOTSHI Honolulu5,994.6MB 5,555.7 5,550.8 5,487.8 5,817.7209.8 -3.80%16,643.3 17,300.15,536.8City & Cnty of Honolulu DOTSHI Honolulu
854.2 664.2 625.3 843.8 655.632.1 1.67%2,160.1 2,124.7641.7IA Ames Ames Transit Agency TOTAL
1.0DR 1.1 1.1 1.0 1.00.0 6.67%3.2 3.01.0Ames Transit AgencyIA Ames624.3MB 853.1 663.1 842.8 654.632.1 1.66%2,156.9 2,121.7640.7Ames Transit AgencyIA Ames
377.6 389.1 372.9 364.0 396.817.7 -0.16%1,131.9 1,133.7365.2IA Des Moines Des Moines Area Regional TA TOTAL
11.2DR 10.0 11.0 11.0 12.20.5 -8.14%31.6 34.410.6Des Moines Area Regional TAIA Des Moines341.5MB 350.0 359.0 334.0 363.616.4 0.66%1,046.0 1,039.1337.0Des Moines Area Regional TAIA Des Moines20.2VP 17.6 19.1 19.0 21.00.8 -9.80%54.3 60.217.6Des Moines Area Regional TAIA Des Moines
121.7 128.9 124.8 123.2 128.9NA -3.18%364.9 376.9114.3ID Boise Valley Regional Transit TOTAL
4.3DR 4.2 4.5 5.0 4.8NA -9.22%12.8 14.14.1Valley Regional TransitID Boise120.5MB 117.5 124.4 118.2 124.1NA -2.95%352.1 362.8110.2Valley Regional TransitID Boise
Modes: MB - Bus, DR - Demand Response, CR - Commuter Rail, HR - Heavy Rail, LR - Light Rail, AG - Automated Guideway, CC - Cable Car, FB - Ferry Boat, IP - Inclined Plane, IR - Intermediate Rail, MO - Monorail, TB - Trolleybus, VP - Vanpool

APTA TRANSIT RIDERSHIP REPORT
State and City Transit Agency ModeAverage
Weekday Jan '16Trips for Trips for
Feb '16Trips forMar '16
Trips ThruMar '16
Trips forJan '15
Trips forFeb '15
Trips forMar '15
Trips ThruMar '15 Quarterly
Change(000's) (000's) (000's) (000's) (000's) (000's) (000's) (000's)(000's)
19First Quarter, 2016
72.8 72.4 67.9 66.9 62.2NA 9.14%215.0 197.069.8ID Ketchum Mountain Rides Transportation Auth TOTAL
0.4DR 0.8 0.4 0.7 0.4NA 20.00%1.8 1.50.6Mountain Rides Transportation AuthID Ketchum64.5MB 69.2 69.2 63.5 59.0NA 9.63%205.0 187.066.6Mountain Rides Transportation AuthID Ketchum3.0VP 2.8 2.8 2.7 2.8NA -3.53%8.2 8.52.6Mountain Rides Transportation AuthID Ketchum
2,876.8 3,116.3 2,853.6 2,656.2 3,179.6120.8 0.65%8,745.8 8,689.42,752.7IL Arlington Heights PACE Suburban Bus TOTAL
418.6DR 434.5 471.1 392.8 464.218.2 4.51%1,333.1 1,275.6427.5PACE Suburban BusIL Arlington Heights2,267.0MB 2,280.0 2,469.7 2,098.2 2,530.794.8 0.34%6,919.5 6,895.92,169.8PACE Suburban BusIL Arlington Heights
168.0VP 162.3 175.5 165.2 184.77.7 -4.77%493.2 517.9155.4PACE Suburban BusIL Arlington Heights
40,028.3 43,708.4 39,396.9 38,175.7 44,617.31,583.4 0.38%122,652.5 122,189.938,915.8IL Chicago Chicago Transit Authority TOTAL
0.0DR 0.0 0.0 0.0 0.00.0 NA0.0 0.00.0Chicago Transit AuthorityIL Chicago17,992.8HR 18,561.5 20,367.5 17,201.8 20,097.2738.4 3.26%57,093.7 55,291.818,164.7Chicago Transit AuthorityIL Chicago21,404.1MB 21,466.8 23,340.9 20,973.9 24,520.1845.0 -2.00%65,558.8 66,898.120,751.1Chicago Transit AuthorityIL Chicago
5,614.9 6,034.0 5,993.7 5,538.8 5,992.5290.6 -0.34%17,465.9 17,525.05,817.0IL Chicago Metra TOTAL5,993.7CR 5,614.9 6,034.0 5,538.8 5,992.5290.6 -0.34%17,465.9 17,525.05,817.0MetraIL Chicago
218.9 227.6 225.9 220.3 246.29.1 -5.83%652.0 692.4205.5IL Granite City Madison County Trans Dist TOTAL
5.6DR 4.8 5.3 5.0 5.80.2 -10.37%14.7 16.44.6Madison County Trans DistIL Granite City206.7MB 204.4 212.1 201.7 226.38.5 -4.22%607.9 634.7191.4Madison County Trans DistIL Granite City13.6VP 9.7 10.2 13.6 14.10.5 -28.81%29.4 41.39.5Madison County Trans DistIL Granite City
288.7 294.4 302.7 281.3 302.112.1 -2.29%865.8 886.1282.7IL Moline Rock Island County MMTD TOTAL
5.7DR 6.0 6.1 5.5 6.40.2 1.14%17.8 17.65.7Rock Island County MMTDIL Moline0.0FB 0.0 0.0 0.0 0.00.0 NA0.0 0.00.0Rock Island County MMTDIL Moline
297.0MB 282.7 288.3 275.8 295.711.9 -2.36%848.0 868.5277.0Rock Island County MMTDIL Moline
236.9 225.9 220.3 250.1 237.89.3 -6.11%664.9 708.2202.1IL Normal Bloomington-Normal Public Transit TOTAL
5.8DR 6.5 7.3 6.1 6.50.3 8.15%19.9 18.46.1Bloomington-Normal Public Transit IL Normal214.5MB 230.4 218.6 244.0 231.39.0 -6.49%645.0 689.8196.0Bloomington-Normal Public Transit IL Normal
247.4 255.3 282.4 264.2 288.09.6 -10.42%747.6 834.6244.9IL Peoria Greater Peoria Mass Tr Dist TOTAL
12.0DR 12.1 13.1 12.4 12.40.5 -0.27%36.7 36.811.5Greater Peoria Mass Tr DistIL Peoria270.4MB 235.3 242.2 251.8 275.69.1 -10.89%710.9 797.8233.4Greater Peoria Mass Tr DistIL Peoria
144.5 156.9 147.3 137.5 150.65.9 1.22%440.7 435.4139.3IL Rockford Rockford Mass Transit Dist TOTAL
8.4DR 8.5 8.9 8.0 9.00.4 1.18%25.7 25.48.3Rockford Mass Transit DistIL Rockford138.9MB 136.0 148.0 129.5 141.65.5 1.22%415.0 410.0131.0Rockford Mass Transit DistIL Rockford
1,536.1 1,265.1 994.6 1,574.6 1,304.352.7 -2.49%3,777.0 3,873.5975.8IL Urbana Champaign-Urbana MTD TOTAL
10.3DR 16.1 13.3 16.0 14.20.5 0.00%40.5 40.511.1Champaign-Urbana MTDIL Urbana984.3MB 1,520.0 1,251.8 1,558.6 1,290.152.1 -2.52%3,736.5 3,833.0964.7Champaign-Urbana MTDIL Urbana
Modes: MB - Bus, DR - Demand Response, CR - Commuter Rail, HR - Heavy Rail, LR - Light Rail, AG - Automated Guideway, CC - Cable Car, FB - Ferry Boat, IP - Inclined Plane, IR - Intermediate Rail, MO - Monorail, TB - Trolleybus, VP - Vanpool

APTA TRANSIT RIDERSHIP REPORT
State and City Transit Agency ModeAverage
Weekday Jan '16Trips for Trips for
Feb '16Trips forMar '16
Trips ThruMar '16
Trips forJan '15
Trips forFeb '15
Trips forMar '15
Trips ThruMar '15 Quarterly
Change(000's) (000's) (000's) (000's) (000's) (000's) (000's) (000's)(000's)
20First Quarter, 2016
401.3 340.7 307.9 379.3 329.815.4 3.86%1,056.3 1,017.0314.3IN Bloomington Bloomington Public Trp Corp TOTAL
2.7DR 2.8 3.1 2.4 2.80.1 7.59%8.5 7.92.6Bloomington Public Trp CorpIN Bloomington305.2MB 398.5 337.6 376.9 327.015.3 3.84%1,047.8 1,009.1311.7Bloomington Public Trp CorpIN Bloomington
257.7 295.1 260.7 261.4 300.711.0 -1.82%807.8 822.8255.0IN Chesterton Northern IN Commuter TD TOTAL260.7CR 257.7 295.1 261.4 300.711.0 -1.82%807.8 822.8255.0Northern IN Commuter TDIN Chesterton
158.1 167.2 159.2 152.8 170.2NA -2.16%471.8 482.2146.5IN Fort Wayne Fort Wayne Public Tr Corp TOTAL
5.7DR 6.2 6.6 5.4 6.0NA 6.43%18.2 17.15.4Fort Wayne Public Tr CorpIN Fort Wayne153.5MB 151.9 160.6 147.4 164.26.5 -2.47%453.6 465.1141.1Fort Wayne Public Tr CorpIN Fort Wayne
761.2 805.2 778.5 814.8 820.630.8 -5.03%2,292.5 2,413.9726.1IN Indianapolis Indianapolis Public Trp Corp TOTAL
23.0DR 24.3 26.4 22.1 23.31.1 7.31%73.4 68.422.7Indianapolis Public Trp CorpIN Indianapolis755.5MB 736.9 778.8 792.7 797.329.8 -5.39%2,219.1 2,345.5703.4Indianapolis Public Trp CorpIN Indianapolis
154.7 150.9 163.7 158.6 170.56.5 -9.58%445.6 492.8140.0IN Muncie Muncie Indiana Transit Sys TOTAL
5.1DR 5.5 5.9 5.5 5.80.2 1.22%16.6 16.45.2Muncie Indiana Transit SysIN Muncie158.6MB 149.2 145.0 153.1 164.76.3 -9.95%429.0 476.4134.8Muncie Indiana Transit SysIN Muncie
157.7 163.5 171.9 160.7 180.56.3 -8.93%467.3 513.1146.1IN South Bend South Bend Public Transp TOTAL
5.0DR 5.7 6.5 4.9 5.80.2 12.10%17.6 15.75.4South Bend Public TranspIN South Bend166.9MB 152.0 157.0 155.8 174.76.1 -9.59%449.7 497.4140.7South Bend Public TranspIN South Bend
47.9 48.1 39.8 46.0 48.02.2 0.60%134.6 133.838.6KS Olathe Johnson County Transit TOTAL
5.4DR 5.5 5.9 5.3 5.80.3 0.61%16.6 16.55.2Johnson County Transit KS Olathe34.4MB 42.4 42.2 40.7 42.21.9 0.60%118.0 117.333.4Johnson County Transit KS Olathe
9.2 10.5 8.6 8.3 10.00.4 -1.86%26.4 26.96.7KY Bowling Green Community Action of Southern KY TOTAL
0.8DR 0.7 1.1 0.7 0.90.1 16.67%2.8 2.41.0Community Action of Southern KYKY Bowling Green7.8MB 8.5 9.4 7.6 9.10.4 -3.67%23.6 24.55.7Community Action of Southern KYKY Bowling Green
284.4 299.4 285.6 257.1 293.911.8 3.78%868.2 836.6284.4KY Fort Wright Tr Auth of Northern Kentucky TOTAL
7.4DR 8.0 8.8 6.5 7.70.4 14.81%24.8 21.68.0Tr Auth of Northern KentuckyKY Fort Wright278.2MB 276.4 290.6 250.6 286.211.4 3.48%843.4 815.0276.4Tr Auth of Northern KentuckyKY Fort Wright
330.1 346.7 317.5 278.7 321.6NA 5.10%964.6 917.8287.8KY Lexington Transit Auth Lexington-Fayette TOTAL
15.6DR 16.5 17.7 13.4 16.0NA 10.22%49.6 45.015.4Transit Auth Lexington-FayetteKY Lexington301.9MB 313.6 329.0 265.3 305.6NA 4.84%915.0 872.8272.4Transit Auth Lexington-FayetteKY Lexington
1,150.8 1,181.4 1,171.9 1,017.5 1,194.545.2 0.54%3,402.2 3,383.91,070.0KY Louisville Transit Auth of River City TOTAL
41.7DR 42.7 46.3 36.3 42.51.9 6.31%128.1 120.539.1Transit Auth of River CityKY Louisville1,130.2MB 1,108.1 1,135.1 981.2 1,152.043.3 0.33%3,274.1 3,263.41,030.9Transit Auth of River CityKY Louisville
Modes: MB - Bus, DR - Demand Response, CR - Commuter Rail, HR - Heavy Rail, LR - Light Rail, AG - Automated Guideway, CC - Cable Car, FB - Ferry Boat, IP - Inclined Plane, IR - Intermediate Rail, MO - Monorail, TB - Trolleybus, VP - Vanpool

APTA TRANSIT RIDERSHIP REPORT
State and City Transit Agency ModeAverage
Weekday Jan '16Trips for Trips for
Feb '16Trips forMar '16
Trips ThruMar '16
Trips forJan '15
Trips forFeb '15
Trips forMar '15
Trips ThruMar '15 Quarterly
Change(000's) (000's) (000's) (000's) (000's) (000's) (000's) (000's)(000's)
21First Quarter, 2016
23.8 25.4 23.4 20.5 23.61.1 5.33%71.1 67.521.9KY Owensboro Owensboro Transit System TOTAL
1.4DR 1.5 1.6 1.2 1.50.0 9.76%4.5 4.11.4Owensboro Transit SystemKY Owensboro22.0MB 22.3 23.8 19.3 22.11.1 5.05%66.6 63.420.5Owensboro Transit SystemKY Owensboro
1,415.9 1,623.3 1,503.5 1,342.6 1,730.756.9 -2.79%4,449.1 4,576.81,409.9LA New Orleans Regional Transit Auth TOTAL
17.6DR 17.2 19.1 15.5 18.90.7 3.85%54.0 52.017.7Regional Transit AuthLA New Orleans609.5LR 527.7 729.7 477.8 788.120.9 -3.70%1,806.1 1,875.4548.7Regional Transit AuthLA New Orleans876.4MB 871.0 874.5 849.3 923.735.3 -2.28%2,589.0 2,649.4843.5Regional Transit AuthLA New Orleans
455.7 398.0 229.3 391.1 390.015.6 11.69%1,128.5 1,010.4274.8MA Amherst UMass Transit Service TOTAL229.3MB 455.7 398.0 391.1 390.015.6 11.69%1,128.5 1,010.4274.8UMass Transit ServiceMA Amherst
29,906.9 33,990.0 29,105.2 24,237.3 34,084.01,253.3 6.82%93,387.2 87,426.529,490.3MA Boston Massachusetts Bay Tr Auth TOTAL
2,705.6CR 2,584.1 3,048.8 1,912.4 2,429.0123.5 19.59%8,427.4 7,047.02,794.5Massachusetts Bay Tr AuthMA Boston154.9DR 165.8 194.8 132.6 194.26.9 10.86%534.0 481.7173.4Massachusetts Bay Tr AuthMA Boston73.6FB 85.9 105.1 39.7 82.14.1 41.56%276.6 195.485.6Massachusetts Bay Tr AuthMA Boston
12,734.8HR 13,318.0 15,090.1 10,648.5 15,097.5551.0 7.35%41,309.5 38,480.812,901.4Massachusetts Bay Tr AuthMA Boston4,739.0LR 4,756.3 5,229.9 4,068.7 5,867.2181.7 -1.55%14,447.2 14,674.94,461.0Massachusetts Bay Tr AuthMA Boston8,585.9MB 8,888.0 10,196.6 7,329.3 10,285.1381.2 7.06%28,049.1 26,200.38,964.5Massachusetts Bay Tr AuthMA Boston
111.4TB 108.8 124.7 106.1 128.94.9 -0.87%343.4 346.4109.9Massachusetts Bay Tr AuthMA Boston
8,393.4 9,507.3 8,812.0 8,252.2 9,672.5NA -3.04%25,924.1 26,736.78,023.4MD Baltimore Maryland Transit Admin TOTAL
704.6CR 694.1 781.9 659.7 764.931.3 -3.93%2,045.5 2,129.2569.5Maryland Transit AdminMD Baltimore190.0DR 196.3 228.6 178.0 206.97.8 3.51%595.1 574.9170.2Maryland Transit AdminMD Baltimore
1,089.9HR 931.9 1,028.1 1,000.0 1,152.331.9 -13.79%2,795.2 3,242.2835.2Maryland Transit AdminMD Baltimore539.5LR 674.2 666.6 501.4 534.322.9 25.13%1,971.1 1,575.2630.3Maryland Transit AdminMD Baltimore
6,288.0MB 5,896.9 6,802.1 5,913.1 7,014.1247.8 -3.63%18,517.2 19,215.25,818.2Maryland Transit AdminMD Baltimore
1,863.7 2,092.5 1,987.3 1,822.7 2,123.476.3 -4.67%5,656.1 5,933.41,699.9MD Rockville Montgomery County Ride-On TOTAL1,987.3MB 1,863.7 2,092.5 1,822.7 2,123.476.3 -4.67%5,656.1 5,933.41,699.9Montgomery County Ride-OnMD Rockville
36.0 39.8 34.9 29.3 37.31.1 5.22%106.8 101.531.0ME Portland Northern NE Passenger RA TOTAL34.9CR 36.0 39.8 29.3 37.31.1 5.22%106.8 101.531.0Northern NE Passenger RAME Portland
552.6 596.3 561.4 524.8 595.8NA 0.39%1,688.6 1,682.0539.7MI Ann Arbor Ann Arbor Transportation Auth TOTAL
13.8DR 14.0 14.7 13.0 15.00.1 4.07%43.5 41.814.8Ann Arbor Transportation AuthMI Ann Arbor547.6MB 538.6 581.6 511.8 580.823.3 0.30%1,645.1 1,640.2524.9Ann Arbor Transportation AuthMI Ann Arbor
NA NA 1,791.7 1,432.8 1,963.2NA NANA 5,187.7NAMI Detroit City of Detroit Dept of Trp TOTAL
24.2DR NA NA 21.0 23.0NA NANA 68.2NACity of Detroit Dept of TrpMI Detroit1,767.5MB 2,050.5 2,115.8 1,411.8 1,940.2NA 19.63%6,124.5 5,119.51,958.2City of Detroit Dept of TrpMI Detroit
Modes: MB - Bus, DR - Demand Response, CR - Commuter Rail, HR - Heavy Rail, LR - Light Rail, AG - Automated Guideway, CC - Cable Car, FB - Ferry Boat, IP - Inclined Plane, IR - Intermediate Rail, MO - Monorail, TB - Trolleybus, VP - Vanpool

APTA TRANSIT RIDERSHIP REPORT
State and City Transit Agency ModeAverage
Weekday Jan '16Trips for Trips for
Feb '16Trips forMar '16
Trips ThruMar '16
Trips forJan '15
Trips forFeb '15
Trips forMar '15
Trips ThruMar '15 Quarterly
Change(000's) (000's) (000's) (000's) (000's) (000's) (000's) (000's)(000's)
22First Quarter, 2016
227.5 183.3 334.5 182.1 229.96.7 -1.00%739.0 746.5328.2MI Detroit Detroit Transp Corp/DPM TOTAL334.5AG 227.5 183.3 182.1 229.96.7 -1.00%739.0 746.5328.2Detroit Transp Corp/DPMMI Detroit
423.8 462.7 472.0 397.4 496.418.1 -3.47%1,318.4 1,365.8431.9MI Flint Mass Transportation Authority TOTAL
39.5DR 30.2 31.8 33.2 41.31.2 -19.04%92.3 114.030.3Mass Transportation AuthorityMI Flint432.5MB 393.6 430.9 364.2 455.116.9 -2.05%1,226.1 1,251.8401.6Mass Transportation AuthorityMI Flint
1,152.6 1,079.4 1,130.6 1,087.0 1,109.645.8 -2.93%3,229.7 3,327.2997.7MI Grand Rapids Interurban Transit Partnership TOTAL
31.8DR 31.1 33.7 31.5 36.01.3 -4.43%94.9 99.330.1Interurban Transit PartnershipMI Grand Rapids1,094.2MB 1,117.8 1,041.8 1,050.9 1,068.544.3 -2.81%3,123.4 3,213.6963.8Interurban Transit PartnershipMI Grand Rapids
4.6VP 3.7 3.9 4.6 5.10.2 -20.28%11.4 14.33.8Interurban Transit PartnershipMI Grand Rapids
252.7 257.6 258.4 258.8 269.610.4 -5.73%741.7 786.8231.4MI Kalamazoo Kalamazoo Metro Transit Sys TOTAL
11.8DR 13.7 14.9 12.0 13.90.6 9.81%41.4 37.712.8Kalamazoo Metro Transit SysMI Kalamazoo246.6MB 239.0 242.7 246.8 255.79.8 -6.51%700.3 749.1218.6Kalamazoo Metro Transit SysMI Kalamazoo
1,226.9 1,093.7 1,058.6 1,236.2 1,136.047.4 -3.15%3,322.6 3,430.81,002.0MI Lansing Capital Area Transp Authority TOTAL
42.6DR 41.5 44.2 42.2 48.21.8 -4.81%126.6 133.040.9Capital Area Transp AuthorityMI Lansing1,016.0MB 1,185.4 1,049.5 1,194.0 1,087.845.6 -3.09%3,196.0 3,297.8961.1Capital Area Transp AuthorityMI Lansing
34.1 35.8 33.5 31.0 37.61.5 -1.57%100.5 102.130.6MI Monroe Lake Erie Transp Commission TOTAL
10.1DR 10.0 10.4 8.9 11.60.5 -3.59%29.5 30.69.1Lake Erie Transp CommissionMI Monroe23.4MB 24.1 25.4 22.1 26.01.0 -0.70%71.0 71.521.5Lake Erie Transp CommissionMI Monroe
49.4 50.7 54.8 53.5 58.62.1 -12.16%146.6 166.946.5MI Muskegon Heights Muskegon Area Transit Sys TOTAL
2.3DR 2.5 2.6 2.1 2.60.1 4.29%7.3 7.02.2Muskegon Area Transit SysMI Muskegon Heights52.5MB 46.9 48.1 51.4 56.02.0 -12.88%139.3 159.944.3Muskegon Area Transit SysMI Muskegon Heights
122.3 132.2 125.2 104.7 135.7NA 3.25%377.5 365.6123.0MI Port Huron Blue Water Area Transp Comm TOTAL
50.6DR 45.5 52.2 38.4 55.21.1 2.43%147.7 144.250.0Blue Water Area Transp CommMI Port Huron74.6MB 76.8 80.0 66.3 80.53.0 3.79%229.8 221.473.0Blue Water Area Transp CommMI Port Huron
233.6 248.0 232.8 228.7 250.410.4 -1.55%700.9 711.9219.3MN Burnsville Minnesota Valley Transit Auth TOTAL
2.0DR 1.9 1.9 1.8 1.90.0 -1.75%5.6 5.71.8Minnesota Valley Transit AuthMN Burnsville230.8MB 231.7 246.1 226.9 248.510.4 -1.54%695.3 706.2217.5Minnesota Valley Transit AuthMN Burnsville
86.9 91.5 82.1 83.5 87.14.1 3.17%260.7 252.782.3MN Eden Prairie Southwest Metro Transit TOTAL
0.0DR 4.3 4.8 0.0 0.00.2 NA12.6 0.03.5Southwest Metro TransitMN Eden Prairie82.1MB 82.6 86.7 83.5 87.13.9 -1.82%248.1 252.778.8Southwest Metro TransitMN Eden Prairie
6,701.2 7,151.1 6,762.4 6,513.6 7,321.3264.4 -1.98%20,188.8 20,597.36,336.5MN Minneapolis Metro Transit TOTAL
50.7CR 54.3 56.0 49.2 53.92.4 5.66%162.5 153.852.2Metro TransitMN Minneapolis1,603.1LR 1,785.5 1,900.0 1,567.7 1,796.365.6 7.22%5,325.5 4,967.11,640.0Metro TransitMN Minneapolis5,108.6MB 4,861.4 5,195.1 4,896.7 5,471.1196.4 -5.01%14,700.8 15,476.44,644.3Metro TransitMN Minneapolis
Modes: MB - Bus, DR - Demand Response, CR - Commuter Rail, HR - Heavy Rail, LR - Light Rail, AG - Automated Guideway, CC - Cable Car, FB - Ferry Boat, IP - Inclined Plane, IR - Intermediate Rail, MO - Monorail, TB - Trolleybus, VP - Vanpool

APTA TRANSIT RIDERSHIP REPORT
State and City Transit Agency ModeAverage
Weekday Jan '16Trips for Trips for
Feb '16Trips forMar '16
Trips ThruMar '16
Trips forJan '15
Trips forFeb '15
Trips forMar '15
Trips ThruMar '15 Quarterly
Change(000's) (000's) (000's) (000's) (000's) (000's) (000's) (000's)(000's)
23First Quarter, 2016
42.8 42.4 42.5 40.5 44.12.0 -0.71%126.2 127.141.0MN Plymouth Plymouth Metrolink & DAR TOTAL
3.8DR 2.8 2.7 3.6 3.80.1 -25.00%8.4 11.22.9Plymouth Metrolink & DARMN Plymouth38.7MB 40.0 39.7 36.9 40.31.9 1.64%117.8 115.938.1Plymouth Metrolink & DARMN Plymouth
210.1 211.1 198.1 212.8 205.98.5 -1.64%606.7 616.8185.5MN Saint Cloud St. Cloud Metrop Trans Comm TOTAL
10.8DR 11.8 12.7 10.8 11.80.5 6.89%35.7 33.411.2St. Cloud Metrop Trans CommMN Saint Cloud187.3MB 198.3 198.4 202.0 194.18.0 -2.13%571.0 583.4174.3St. Cloud Metrop Trans CommMN Saint Cloud
1,183.7 1,249.5 1,228.1 1,131.9 1,312.147.6 -3.32%3,550.1 3,672.11,116.9MO Kansas City Kansas City Area Trp Auth TOTAL
31.3DR 34.7 36.7 30.7 33.31.5 9.34%104.2 95.332.8Kansas City Area Trp AuthMO Kansas City1,191.2MB 1,145.0 1,208.5 1,096.0 1,273.146.0 -3.56%3,433.7 3,560.31,080.2Kansas City Area Trp AuthMO Kansas City
5.6VP 4.0 4.3 5.2 5.70.2 -26.06%12.2 16.53.9Kansas City Area Trp AuthMO Kansas City
3,359.2 3,509.9 3,560.9 3,288.1 3,762.7129.1 -4.22%10,163.8 10,611.73,294.7MO Saint Louis Bi-State Dev Agency TOTAL
47.8DR 46.9 49.6 45.4 50.31.9 -0.77%142.4 143.545.9Bi-State Dev AgencyMO Saint Louis1,226.8LR 1,181.3 1,224.5 1,159.3 1,333.044.6 -4.29%3,559.7 3,719.11,153.9Bi-State Dev AgencyMO Saint Louis2,286.3MB 2,131.0 2,235.8 2,083.4 2,379.482.6 -4.26%6,461.7 6,749.12,094.9Bi-State Dev AgencyMO Saint Louis
129.4 133.5 123.4 111.6 127.95.2 4.82%380.4 362.9117.5MO Springfield City Utilities of Springfield TOTAL
1.5DR 1.5 1.6 1.3 1.60.1 0.00%4.4 4.41.3City Utilities of SpringfieldMO Springfield121.9MB 127.9 131.9 110.3 126.35.1 4.88%376.0 358.5116.2City Utilities of SpringfieldMO Springfield
125.4 131.0 98.1 102.0 113.25.5 16.98%366.5 313.3110.1MT Missoula Missoula Urban Transportation Distri TOTAL
1.9DR 2.4 2.6 1.9 2.00.1 25.86%7.3 5.82.3Missoula Urban Transportation DistriMT Missoula96.2MB 123.0 128.4 100.1 111.25.4 16.81%359.2 307.5107.8Missoula Urban Transportation DistriMT Missoula
207.3 166.8 164.0 178.9 181.97.9 0.86%529.3 524.8155.2NC Boone AppalCART TOTAL164.0MB 207.3 166.8 178.9 181.97.9 0.86%529.3 524.8155.2AppalCARTNC Boone
603.9 564.0 602.6 562.1 597.926.2 -7.12%1,637.1 1,762.6469.2NC Chapel Hill Chapel Hill Transit TOTAL
4.2DR 5.3 5.9 3.2 4.90.3 26.02%15.5 12.34.3Chapel Hill TransitNC Chapel Hill598.4MB 598.6 558.1 558.9 593.025.9 -7.35%1,621.6 1,750.3464.9Chapel Hill TransitNC Chapel Hill
1,914.8 2,053.3 2,082.0 1,824.7 2,118.277.4 -3.73%5,800.3 6,024.91,832.2NC Charlotte Charlotte Area Transit TOTAL
29.9DR 26.3 27.3 25.8 33.21.1 -13.27%77.1 88.923.5Charlotte Area TransitNC Charlotte407.9LR 395.8 424.3 356.7 422.114.7 0.91%1,197.5 1,186.7377.4Charlotte Area TransitNC Charlotte
1,626.4MB 1,478.3 1,586.0 1,424.2 1,643.661.0 -4.51%4,482.3 4,694.21,418.0Charlotte Area TransitNC Charlotte17.8VP 14.4 15.7 18.0 19.30.6 -21.23%43.4 55.113.3Charlotte Area TransitNC Charlotte
NA NA NA NA NANA NANA NANANC Durham Durham Area Transit Auth TOTAL
NADR NA NA NA NANA NANA NANADurham Area Transit AuthNC Durham507.3MB 472.3 505.3 413.9 516.918.4 -1.38%1,418.2 1,438.1440.6Durham Area Transit AuthNC Durham
Modes: MB - Bus, DR - Demand Response, CR - Commuter Rail, HR - Heavy Rail, LR - Light Rail, AG - Automated Guideway, CC - Cable Car, FB - Ferry Boat, IP - Inclined Plane, IR - Intermediate Rail, MO - Monorail, TB - Trolleybus, VP - Vanpool
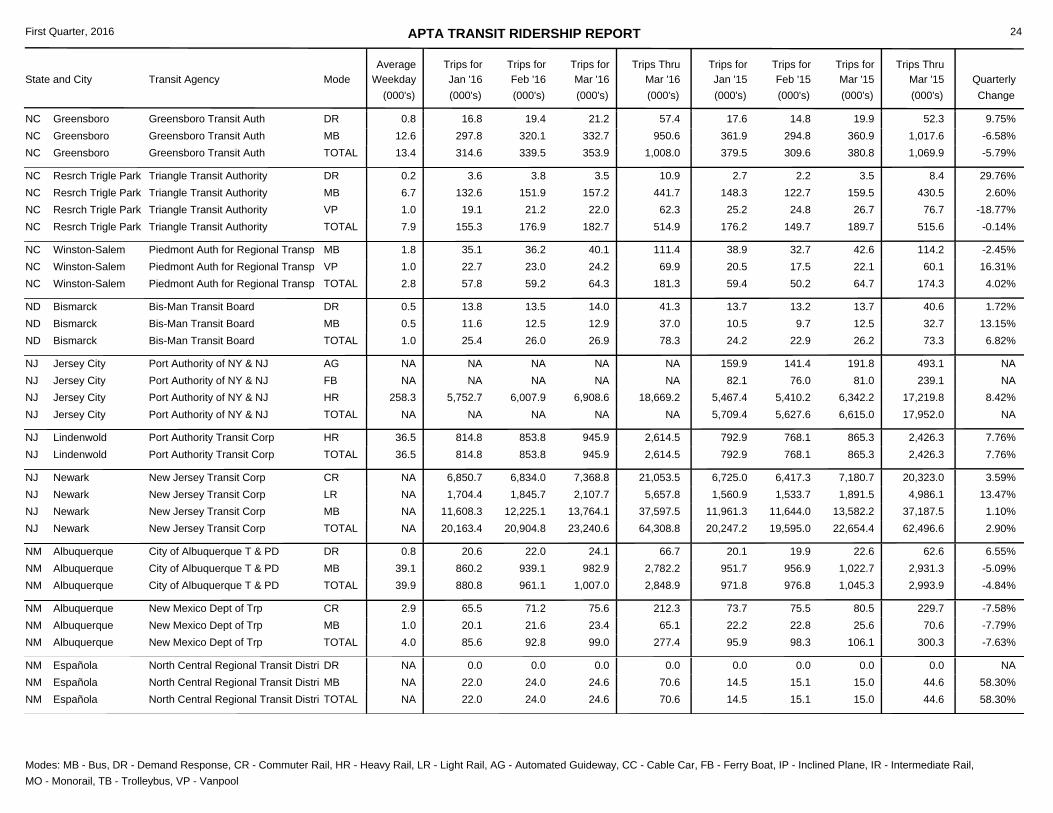
APTA TRANSIT RIDERSHIP REPORT
State and City Transit Agency ModeAverage
Weekday Jan '16Trips for Trips for
Feb '16Trips forMar '16
Trips ThruMar '16
Trips forJan '15
Trips forFeb '15
Trips forMar '15
Trips ThruMar '15 Quarterly
Change(000's) (000's) (000's) (000's) (000's) (000's) (000's) (000's)(000's)
24First Quarter, 2016
339.5 353.9 379.5 309.6 380.813.4 -5.79%1,008.0 1,069.9314.6NC Greensboro Greensboro Transit Auth TOTAL
17.6DR 19.4 21.2 14.8 19.90.8 9.75%57.4 52.316.8Greensboro Transit AuthNC Greensboro361.9MB 320.1 332.7 294.8 360.912.6 -6.58%950.6 1,017.6297.8Greensboro Transit AuthNC Greensboro
176.9 182.7 176.2 149.7 189.77.9 -0.14%514.9 515.6155.3NC Resrch Trigle Park Triangle Transit Authority TOTAL
2.7DR 3.8 3.5 2.2 3.50.2 29.76%10.9 8.43.6Triangle Transit AuthorityNC Resrch Trigle Park148.3MB 151.9 157.2 122.7 159.56.7 2.60%441.7 430.5132.6Triangle Transit AuthorityNC Resrch Trigle Park25.2VP 21.2 22.0 24.8 26.71.0 -18.77%62.3 76.719.1Triangle Transit AuthorityNC Resrch Trigle Park
59.2 64.3 59.4 50.2 64.72.8 4.02%181.3 174.357.8NC Winston-Salem Piedmont Auth for Regional Transp TOTAL
38.9MB 36.2 40.1 32.7 42.61.8 -2.45%111.4 114.235.1Piedmont Auth for Regional TranspNC Winston-Salem20.5VP 23.0 24.2 17.5 22.11.0 16.31%69.9 60.122.7Piedmont Auth for Regional TranspNC Winston-Salem
26.0 26.9 24.2 22.9 26.21.0 6.82%78.3 73.325.4ND Bismarck Bis-Man Transit Board TOTAL
13.7DR 13.5 14.0 13.2 13.70.5 1.72%41.3 40.613.8Bis-Man Transit BoardND Bismarck10.5MB 12.5 12.9 9.7 12.50.5 13.15%37.0 32.711.6Bis-Man Transit BoardND Bismarck
NA NA 5,709.4 5,627.6 6,615.0NA NANA 17,952.0NANJ Jersey City Port Authority of NY & NJ TOTAL
159.9AG NA NA 141.4 191.8NA NANA 493.1NAPort Authority of NY & NJNJ Jersey City82.1FB NA NA 76.0 81.0NA NANA 239.1NAPort Authority of NY & NJNJ Jersey City
5,467.4HR 6,007.9 6,908.6 5,410.2 6,342.2258.3 8.42%18,669.2 17,219.85,752.7Port Authority of NY & NJNJ Jersey City
853.8 945.9 792.9 768.1 865.336.5 7.76%2,614.5 2,426.3814.8NJ Lindenwold Port Authority Transit Corp TOTAL792.9HR 853.8 945.9 768.1 865.336.5 7.76%2,614.5 2,426.3814.8Port Authority Transit CorpNJ Lindenwold
20,904.8 23,240.6 20,247.2 19,595.0 22,654.4NA 2.90%64,308.8 62,496.620,163.4NJ Newark New Jersey Transit Corp TOTAL
6,725.0CR 6,834.0 7,368.8 6,417.3 7,180.7NA 3.59%21,053.5 20,323.06,850.7New Jersey Transit CorpNJ Newark1,560.9LR 1,845.7 2,107.7 1,533.7 1,891.5NA 13.47%5,657.8 4,986.11,704.4New Jersey Transit CorpNJ Newark
11,961.3MB 12,225.1 13,764.1 11,644.0 13,582.2NA 1.10%37,597.5 37,187.511,608.3New Jersey Transit CorpNJ Newark
961.1 1,007.0 971.8 976.8 1,045.339.9 -4.84%2,848.9 2,993.9880.8NM Albuquerque City of Albuquerque T & PD TOTAL
20.1DR 22.0 24.1 19.9 22.60.8 6.55%66.7 62.620.6City of Albuquerque T & PDNM Albuquerque951.7MB 939.1 982.9 956.9 1,022.739.1 -5.09%2,782.2 2,931.3860.2City of Albuquerque T & PDNM Albuquerque
92.8 99.0 95.9 98.3 106.14.0 -7.63%277.4 300.385.6NM Albuquerque New Mexico Dept of Trp TOTAL
73.7CR 71.2 75.6 75.5 80.52.9 -7.58%212.3 229.765.5New Mexico Dept of TrpNM Albuquerque22.2MB 21.6 23.4 22.8 25.61.0 -7.79%65.1 70.620.1New Mexico Dept of TrpNM Albuquerque
24.0 24.6 14.5 15.1 15.0NA 58.30%70.6 44.622.0NM Española North Central Regional Transit Distri TOTAL
0.0DR 0.0 0.0 0.0 0.0NA NA0.0 0.00.0North Central Regional Transit DistriNM Española14.5MB 24.0 24.6 15.1 15.0NA 58.30%70.6 44.622.0North Central Regional Transit DistriNM Española
Modes: MB - Bus, DR - Demand Response, CR - Commuter Rail, HR - Heavy Rail, LR - Light Rail, AG - Automated Guideway, CC - Cable Car, FB - Ferry Boat, IP - Inclined Plane, IR - Intermediate Rail, MO - Monorail, TB - Trolleybus, VP - Vanpool

APTA TRANSIT RIDERSHIP REPORT
State and City Transit Agency ModeAverage
Weekday Jan '16Trips for Trips for
Feb '16Trips forMar '16
Trips ThruMar '16
Trips forJan '15
Trips forFeb '15
Trips forMar '15
Trips ThruMar '15 Quarterly
Change(000's) (000's) (000's) (000's) (000's) (000's) (000's) (000's)(000's)
25First Quarter, 2016
62.4 61.0 61.5 74.1 71.42.3 -14.88%176.2 207.052.8NM Las Cruces City of Las Cruces-RdRUNR Tr TOTAL
4.4DR 5.0 5.2 4.7 5.10.2 5.63%15.0 14.24.8City of Las Cruces-RdRUNR TrNM Las Cruces57.1MB 57.4 55.8 69.4 66.32.1 -16.39%161.2 192.848.0City of Las Cruces-RdRUNR TrNM Las Cruces
25.8 28.9 33.3 34.0 40.31.3 -25.37%80.3 107.625.6NM Los Alamos Los Alamos County, Atomic City Tra TOTAL
0.0DR 0.5 0.6 0.0 0.00.0 NA1.3 0.00.2Los Alamos County, Atomic City TraNM Los Alamos33.3MB 25.3 28.3 34.0 40.31.3 -26.58%79.0 107.625.4Los Alamos County, Atomic City TraNM Los Alamos
NA NA 5,280.4 5,171.1 5,768.1NA NANA 16,219.6NANV Las Vegas RTC of Southern Nevada TOTAL
98.6DR NA NA 96.8 108.2NA NANA 303.6NARTC of Southern NevadaNV Las Vegas5,181.8MB 5,220.4 5,616.6 5,074.3 5,659.9189.8 0.27%15,959.3 15,916.05,122.3RTC of Southern NevadaNV Las Vegas
625.4 646.5 678.3 643.7 705.620.9 -7.23%1,881.0 2,027.6609.1NV Reno RTC of Washoe County TOTAL
18.1DR 17.9 19.7 17.6 19.50.7 -0.18%55.1 55.217.5RTC of Washoe CountyNV Reno660.2MB 607.5 626.8 626.1 686.120.2 -7.43%1,825.9 1,972.4591.6RTC of Washoe CountyNV Reno
1,420.4 1,515.0 1,258.8 1,272.4 1,457.556.8 6.03%4,229.2 3,988.71,293.8NY Albany Capital District Transp Auth TOTAL
24.9DR 25.9 28.6 23.0 28.41.1 4.72%79.9 76.325.4Capital District Transp AuthNY Albany1,233.9MB 1,394.5 1,486.4 1,249.4 1,429.155.7 6.06%4,149.3 3,912.41,268.4Capital District Transp AuthNY Albany
3.8 3.5 3.2 3.3 3.90.2 0.96%10.5 10.43.2NY Albion Orleans Transit Service TOTAL3.2MB 3.8 3.5 3.3 3.90.2 0.96%10.5 10.43.2Orleans Transit ServiceNY Albion
5.6 6.1 5.7 6.1 6.60.3 -13.04%16.0 18.44.3NY Batavia Batavia Bus Service TOTAL5.7MB 5.6 6.1 6.1 6.60.3 -13.04%16.0 18.44.3Batavia Bus ServiceNY Batavia
2,235.1 2,340.2 2,187.2 2,152.7 2,570.392.6 -3.03%6,701.1 6,910.22,125.8NY Buffalo Niagara Frontier Trp Auth TOTAL
13.9DR 15.7 17.7 13.7 16.40.8 8.86%47.9 44.014.5Niagara Frontier Trp AuthNY Buffalo384.8LR 439.9 444.9 395.6 489.217.0 -0.50%1,263.2 1,269.6378.4Niagara Frontier Trp AuthNY Buffalo
1,788.5MB 1,779.5 1,877.6 1,743.4 2,064.774.8 -3.69%5,390.0 5,596.61,732.9Niagara Frontier Trp AuthNY Buffalo
24.8 25.7 23.8 27.4 25.80.8 -5.58%72.7 77.022.2NY Canandaigua Canandiagua Area Transit Service TOTAL23.8MB 24.8 25.7 27.4 25.80.8 -5.58%72.7 77.022.2Canandiagua Area Transit ServiceNY Canandaigua
22.4 17.0 15.1 26.1 19.70.7 -12.64%53.2 60.913.8NY Dansville Livingston Area Transp Svce TOTAL15.1MB 22.4 17.0 26.1 19.70.7 -12.64%53.2 60.913.8Livingston Area Transp SvceNY Dansville
440.2 430.1 305.6 428.4 440.815.0 -5.34%1,112.1 1,174.8241.8NY Ithaca Tompkins Consol Area Transit TOTAL
4.7DR 4.7 5.5 4.3 5.60.2 -2.05%14.3 14.64.1Tompkins Consol Area TransitNY Ithaca300.6MB 435.3 424.4 423.8 434.814.8 -5.35%1,097.2 1,159.2237.5Tompkins Consol Area TransitNY Ithaca
0.3VP 0.2 0.2 0.3 0.40.0 -40.00%0.6 1.00.2Tompkins Consol Area TransitNY Ithaca
16.0 17.0 15.5 14.3 19.40.8 -0.20%49.1 49.216.1NY Lyons Wayne Area Transp Service TOTAL15.5MB 16.0 17.0 14.3 19.40.8 -0.20%49.1 49.216.1Wayne Area Transp ServiceNY Lyons
Modes: MB - Bus, DR - Demand Response, CR - Commuter Rail, HR - Heavy Rail, LR - Light Rail, AG - Automated Guideway, CC - Cable Car, FB - Ferry Boat, IP - Inclined Plane, IR - Intermediate Rail, MO - Monorail, TB - Trolleybus, VP - Vanpool

APTA TRANSIT RIDERSHIP REPORT
State and City Transit Agency ModeAverage
Weekday Jan '16Trips for Trips for
Feb '16Trips forMar '16
Trips ThruMar '16
Trips forJan '15
Trips forFeb '15
Trips forMar '15
Trips ThruMar '15 Quarterly
Change(000's) (000's) (000's) (000's) (000's) (000's) (000's) (000's)(000's)
26First Quarter, 2016
7,546.6 8,670.3 8,108.7 7,523.1 8,536.4354.8 -0.48%24,051.3 24,168.27,834.4NY New York MTA Long Island Rail Road TOTAL8,108.7CR 7,546.6 8,670.3 7,523.1 8,536.4354.8 -0.48%24,051.3 24,168.27,834.4MTA Long Island Rail RoadNY New York
6,475.1 7,565.6 6,331.3 5,993.2 7,188.7288.7 5.27%20,541.5 19,513.26,500.8NY New York MTA Metro-North Railroad TOTAL
6,292.8CR 6,431.8 7,513.3 5,962.4 7,148.3286.5 5.14%20,400.4 19,403.56,455.3MTA Metro-North RailroadNY New York9.2FB 11.4 16.0 0.0 4.30.7 >100%41.8 13.514.4MTA Metro-North RailroadNY New York
29.3MB 31.9 36.3 30.8 36.11.6 3.22%99.3 96.231.1MTA Metro-North RailroadNY New York
275,137.3 314,855.4 270,977.6 262,315.4 307,920.811,278.7 2.76%864,458.0 841,213.8274,465.3NY New York MTA New York City Transit TOTAL
648.0DR 694.4 806.7 631.9 769.527.6 5.35%2,159.1 2,049.4658.0MTA New York City TransitNY New York210,813.9HR 213,964.3 243,333.2 204,706.8 238,345.78,777.7 2.80%672,206.1 653,866.4214,908.6MTA New York City TransitNY New York59,515.7MB 60,478.6 70,715.5 56,976.7 68,805.62,473.4 2.59%190,092.8 185,298.058,898.7MTA New York City TransitNY New York
644.1 786.2 641.4 593.3 747.531.1 7.21%2,125.2 1,982.2694.9NY New York MTA Staten Island Railway TOTAL641.4HR 644.1 786.2 593.3 747.531.1 7.21%2,125.2 1,982.2694.9MTA Staten Island RailwayNY New York
1,306.2 1,972.7 1,426.7 1,415.8 1,741.0NA 4.80%4,803.6 4,583.51,524.7NY New York New York City DOT TOTAL
1,381.2FB 1,258.5 1,919.2 1,369.9 1,687.2NA 4.90%4,655.9 4,438.31,478.2New York City DOTNY New York45.5MB 47.7 53.5 45.9 53.82.3 1.72%147.7 145.246.5New York City DOTNY New York
15.4 17.3 15.5 14.3 17.10.6 2.99%48.3 46.915.6NY Rochester Lift Line TOTAL15.5MB 15.4 17.3 14.3 17.10.6 2.99%48.3 46.915.6Lift LineNY Rochester
1,290.4 1,380.7 1,417.0 1,325.2 1,520.053.1 -6.48%3,986.1 4,262.21,315.0NY Rochester Rochester Genesee RTA TOTAL1,417.0MB 1,290.4 1,380.7 1,325.2 1,520.053.1 -6.48%3,986.1 4,262.21,315.0Rochester Genesee RTANY Rochester
4.2 4.7 4.7 4.4 4.80.2 -7.19%12.9 13.94.0NY Rock Glen Wyoming Transit Service TOTAL4.7MB 4.2 4.7 4.4 4.80.2 -7.19%12.9 13.94.0Wyoming Transit ServiceNY Rock Glen
5.6 6.2 6.2 5.6 7.00.3 -7.45%17.4 18.85.6NY Waterloo Seneca Transit Service TOTAL6.2MB 5.6 6.2 5.6 7.00.3 -7.45%17.4 18.85.6Seneca Transit ServiceNY Waterloo
408.1 432.4 404.9 376.6 452.716.9 -0.78%1,224.6 1,234.2384.1OH Akron METRO Regional Transit Authority TOTAL
20.5DR 22.7 25.0 19.8 23.80.8 7.33%68.8 64.121.1METRO Regional Transit AuthorityOH Akron384.4MB 385.4 407.4 356.8 428.916.1 -1.22%1,155.8 1,170.1363.0METRO Regional Transit AuthorityOH Akron
204.3 217.1 210.7 198.1 218.38.8 -1.07%620.4 627.1199.0OH Canton Stark Area RTA TOTAL
12.2DR 13.8 15.0 11.8 11.20.6 19.89%42.2 35.213.4Stark Area RTAOH Canton198.5MB 190.5 202.1 186.3 207.18.2 -2.31%578.2 591.9185.6Stark Area RTAOH Canton
3.6 4.1 3.2 3.1 3.91.5 5.88%10.8 10.23.1OH Chardon Geauga County Transit TOTAL3.2DR 3.6 4.1 3.1 3.91.5 5.88%10.8 10.23.1Geauga County TransitOH Chardon
Modes: MB - Bus, DR - Demand Response, CR - Commuter Rail, HR - Heavy Rail, LR - Light Rail, AG - Automated Guideway, CC - Cable Car, FB - Ferry Boat, IP - Inclined Plane, IR - Intermediate Rail, MO - Monorail, TB - Trolleybus, VP - Vanpool

APTA TRANSIT RIDERSHIP REPORT
State and City Transit Agency ModeAverage
Weekday Jan '16Trips for Trips for
Feb '16Trips forMar '16
Trips ThruMar '16
Trips forJan '15
Trips forFeb '15
Trips forMar '15
Trips ThruMar '15 Quarterly
Change(000's) (000's) (000's) (000's) (000's) (000's) (000's) (000's)(000's)
27First Quarter, 2016
1,258.2 1,357.2 1,328.2 1,175.8 1,374.955.6 -1.25%3,830.4 3,878.91,215.0OH Cincinnati Southwest Ohio RTA TOTAL
16.9DR 17.8 19.9 14.7 17.80.8 10.53%54.6 49.416.9Southwest Ohio RTAOH Cincinnati1,311.3MB 1,240.4 1,337.3 1,161.1 1,357.154.8 -1.40%3,775.8 3,829.51,198.1Southwest Ohio RTAOH Cincinnati
3,588.2 3,746.8 3,822.2 3,298.2 4,105.3NA -3.60%10,821.1 11,225.73,486.1OH Cleveland Greater Cleveland Reg TA TOTAL
47.7DR 41.1 43.6 43.6 52.0NA -13.26%124.3 143.339.6Greater Cleveland Reg TAOH Cleveland548.8HR 502.5 473.6 448.3 557.9NA -3.38%1,502.4 1,555.0526.3Greater Cleveland Reg TAOH Cleveland216.2LR 181.6 175.8 168.3 213.3NA -5.92%562.4 597.8205.0Greater Cleveland Reg TAOH Cleveland
3,009.5MB 2,863.0 3,053.8 2,638.0 3,282.1NA -3.33%8,632.0 8,929.62,715.2Greater Cleveland Reg TAOH Cleveland
1,537.5 1,599.5 1,486.0 1,398.6 1,602.660.4 2.15%4,583.8 4,487.21,446.8OH Columbus Central Ohio Transit Auth TOTAL
20.9DR 21.2 22.9 20.0 22.90.9 1.41%64.7 63.820.6Central Ohio Transit AuthOH Columbus1,465.1MB 1,516.3 1,576.6 1,378.6 1,579.759.6 2.16%4,519.1 4,423.41,426.2Central Ohio Transit AuthOH Columbus
803.5 828.2 782.9 735.5 863.730.7 0.87%2,402.8 2,382.1771.1OH Dayton Greater Dayton Regional TA TOTAL
15.3DR 17.1 19.3 15.1 18.80.8 6.91%52.6 49.216.2Greater Dayton Regional TAOH Dayton556.5MB 606.8 624.1 522.3 612.623.1 7.21%1,813.4 1,691.4582.5Greater Dayton Regional TAOH Dayton211.1TB 179.6 184.8 198.1 232.36.8 -16.32%536.8 641.5172.4Greater Dayton Regional TAOH Dayton
62.7 67.3 57.6 54.1 65.72.9 4.57%185.5 177.455.5OH Grand River LAKETRAN TOTAL
20.8DR 24.8 26.8 20.5 24.71.1 11.97%73.9 66.022.3LAKETRANOH Grand River36.8MB 37.9 40.5 33.6 41.01.8 0.18%111.6 111.433.2LAKETRANOH Grand River
166.6 128.7 148.6 180.0 161.1NA -19.54%394.0 489.798.7OH Kent Portage Area Reg Trp Auth TOTAL
8.1DR 9.8 10.2 7.9 9.6NA 13.28%29.0 25.69.0Portage Area Reg Trp AuthOH Kent140.5MB 156.8 118.5 172.1 151.5NA -21.35%365.0 464.189.7Portage Area Reg Trp AuthOH Kent
255.2 255.9 234.4 220.5 271.111.3 4.45%758.3 726.0247.2OH Toledo Toledo Area Reg Transit Auth TOTAL
27.6DR 25.4 26.6 25.2 31.01.0 -8.83%76.4 83.824.4Toledo Area Reg Transit AuthOH Toledo206.8MB 229.8 229.3 195.3 240.110.3 6.18%681.9 642.2222.8Toledo Area Reg Transit AuthOH Toledo
33.3 33.6 36.2 34.1 34.11.3 -5.46%98.7 104.431.8OK Lawton Lawton Area Tr System (LATS) TOTAL36.2MB 33.3 33.6 34.1 34.11.3 -5.46%98.7 104.431.8Lawton Area Tr System (LATS)OK Lawton
271.1 278.7 250.2 236.4 262.711.3 6.95%801.4 749.3251.6OK Oklahoma City Central Oklahoma TA TOTAL
4.6DR 5.0 5.3 4.2 5.00.0 8.70%15.0 13.84.7Central Oklahoma TAOK Oklahoma City245.6MB 266.1 273.4 232.2 257.711.3 6.92%786.4 735.5246.9Central Oklahoma TAOK Oklahoma City
8,289.5 8,787.6 8,431.2 7,991.6 8,739.3326.2 0.71%25,341.7 25,162.18,264.6OR Portland Tri-County Metro Trp Dist TOTAL
37.7CR 37.4 41.9 36.0 40.21.8 0.09%114.0 113.934.7Tri-County Metro Trp DistOR Portland85.1DR 88.6 94.8 81.6 89.93.7 3.00%264.3 256.680.9Tri-County Metro Trp DistOR Portland
3,024.4LR 3,234.6 3,486.5 2,891.2 3,217.3125.0 9.07%9,961.4 9,132.93,240.3Tri-County Metro Trp DistOR Portland5,284.0MB 4,928.9 5,164.4 4,982.8 5,391.9195.7 -4.19%15,002.0 15,658.74,908.7Tri-County Metro Trp DistOR Portland
Modes: MB - Bus, DR - Demand Response, CR - Commuter Rail, HR - Heavy Rail, LR - Light Rail, AG - Automated Guideway, CC - Cable Car, FB - Ferry Boat, IP - Inclined Plane, IR - Intermediate Rail, MO - Monorail, TB - Trolleybus, VP - Vanpool

APTA TRANSIT RIDERSHIP REPORT
State and City Transit Agency ModeAverage
Weekday Jan '16Trips for Trips for
Feb '16Trips forMar '16
Trips ThruMar '16
Trips forJan '15
Trips forFeb '15
Trips forMar '15
Trips ThruMar '15 Quarterly
Change(000's) (000's) (000's) (000's) (000's) (000's) (000's) (000's)(000's)
28First Quarter, 2016
429.4 470.3 401.5 375.8 436.320.4 5.12%1,275.7 1,213.6376.0PA Allentown Lehigh & Northampton Trp Auth TOTAL
36.7DR 40.5 45.2 28.9 35.51.9 21.36%122.7 101.137.0Lehigh & Northampton Trp AuthPA Allentown364.8MB 388.9 425.1 346.9 400.818.5 3.64%1,153.0 1,112.5339.0Lehigh & Northampton Trp AuthPA Allentown
245.6 243.1 260.7 234.1 284.2NA -7.97%716.9 779.0228.2PA Erie Erie Metropolitan Transit Authority TOTAL260.7MB 245.6 243.1 234.1 284.2NA -7.97%716.9 779.0228.2Erie Metropolitan Transit AuthorityPA Erie
201.8 225.3 210.9 202.4 224.083.1 -4.42%609.1 637.3182.0PA Harrisburg Cumberland-Dauphin-Harrisburg TA TOTAL
16.0DR 16.6 18.5 15.9 17.30.7 1.83%50.1 49.215.0Cumberland-Dauphin-Harrisburg TAPA Harrisburg194.9MB 185.2 206.8 186.5 206.782.4 -4.95%559.0 588.1167.0Cumberland-Dauphin-Harrisburg TAPA Harrisburg
107.7 129.7 101.7 99.7 118.24.2 6.45%340.2 319.6102.8PA Harris-Phil Penn DOT (Keystone) TOTAL101.7CR 107.7 129.7 99.7 118.24.2 6.45%340.2 319.6102.8Penn DOT (Keystone)PA Harris-Phil
16.2 18.5 15.6 14.8 17.2NA 3.57%49.3 47.614.6PA Hazleton Hazleton Public Transit TOTAL
0.6DR 0.8 0.7 0.5 0.7NA 16.67%2.1 1.80.6Hazleton Public TransitPA Hazleton15.0MB 15.4 17.8 14.3 16.5NA 3.06%47.2 45.814.0Hazleton Public TransitPA Hazleton
39.6 39.7 34.9 40.6 40.7NA -3.79%111.8 116.232.5PA Johnsonburg Area Transp Auth NC PA TOTAL
13.5DR 14.0 15.6 12.4 15.20.7 5.35%43.3 41.113.7Area Transp Auth NC PAPA Johnsonburg20.7MB 24.9 23.3 27.5 24.81.1 -9.32%66.2 73.018.0Area Transp Auth NC PAPA Johnsonburg0.7VP 0.7 0.8 0.7 0.7NA 9.52%2.3 2.10.8Area Transp Auth NC PAPA Johnsonburg
85.3 91.0 81.4 77.3 89.82.9 1.57%252.4 248.576.1PA Johnstown Cambria County Transit Auth TOTAL
0.5DR 0.5 0.5 0.4 0.50.0 7.14%1.5 1.40.5Cambria County Transit AuthPA Johnstown0.0IP 0.0 0.6 0.0 1.50.1 -60.00%0.6 1.50.0Cambria County Transit AuthPA Johnstown
80.9MB 84.8 89.9 76.9 87.82.8 1.91%250.3 245.675.6Cambria County Transit AuthPA Johnstown
178.0 195.3 163.6 170.1 182.97.2 0.97%521.6 516.6148.3PA Lancaster Red Rose Transit Authority TOTAL
23.8DR 21.7 25.3 22.9 25.00.9 -7.53%66.3 71.719.3Red Rose Transit AuthorityPA Lancaster139.8MB 156.3 170.0 147.2 157.96.3 2.34%455.3 444.9129.0Red Rose Transit AuthorityPA Lancaster
29.9 33.7 29.5 29.8 31.71.3 -0.99%90.1 91.026.5PA Lebanon County of Lebanon Tr Auth TOTAL
3.9DR 4.1 4.6 3.9 4.20.2 3.33%12.4 12.03.7County of Lebanon Tr AuthPA Lebanon25.6MB 25.8 29.1 25.9 27.51.1 -1.65%77.7 79.022.8County of Lebanon Tr AuthPA Lebanon
26,271.8 29,292.3 27,850.7 25,407.5 28,875.0NA -1.07%81,250.3 82,133.225,686.2PA Philadelphia Southeastern Penn TA TOTAL
3,242.1CR 3,108.1 3,206.8 2,861.3 3,230.2126.6 -0.95%9,245.1 9,333.62,930.2Southeastern Penn TAPA Philadelphia128.2DR 124.8 176.3 129.2 170.85.8 -0.49%426.1 428.2125.0Southeastern Penn TAPA Philadelphia
8,450.4HR 8,057.6 8,670.4 7,687.4 8,631.8334.6 -1.16%24,482.5 24,769.67,754.5Southeastern Penn TAPA Philadelphia2,149.9LR 2,213.3 2,447.2 2,033.6 2,306.791.3 3.26%6,702.0 6,490.22,041.5Southeastern Penn TAPA Philadelphia
13,320.4MB 12,277.5 14,236.4 12,198.6 13,960.3529.5 -1.60%38,848.7 39,479.312,334.8Southeastern Penn TAPA Philadelphia559.7TB 490.5 555.2 497.4 575.221.1 -5.29%1,545.9 1,632.3500.2Southeastern Penn TAPA Philadelphia
Modes: MB - Bus, DR - Demand Response, CR - Commuter Rail, HR - Heavy Rail, LR - Light Rail, AG - Automated Guideway, CC - Cable Car, FB - Ferry Boat, IP - Inclined Plane, IR - Intermediate Rail, MO - Monorail, TB - Trolleybus, VP - Vanpool

APTA TRANSIT RIDERSHIP REPORT
State and City Transit Agency ModeAverage
Weekday Jan '16Trips for Trips for
Feb '16Trips forMar '16
Trips ThruMar '16
Trips forJan '15
Trips forFeb '15
Trips forMar '15
Trips ThruMar '15 Quarterly
Change(000's) (000's) (000's) (000's) (000's) (000's) (000's) (000's)(000's)
29First Quarter, 2016
5,141.1 5,530.6 5,168.8 4,756.1 5,517.6NA 0.84%15,572.8 15,442.54,901.1PA Pittsburgh Port Auth of Allegheny Co TOTAL
114.2DR 119.9 135.1 105.6 129.9NA 5.75%369.8 349.7114.8Port Auth of Allegheny CoPA Pittsburgh60.3IP 54.1 81.9 41.0 80.4NA 4.90%190.6 181.754.6Port Auth of Allegheny CoPA Pittsburgh
579.6LR 628.6 686.3 590.9 668.6NA 4.24%1,917.0 1,839.1602.1Port Auth of Allegheny CoPA Pittsburgh4,414.7MB 4,338.5 4,627.3 4,018.6 4,638.7NA 0.18%13,095.4 13,072.04,129.6Port Auth of Allegheny CoPA Pittsburgh
250.2 274.0 248.6 240.8 259.710.3 -1.27%739.6 749.1215.4PA Reading Berks Area Reading Trp Auth TOTAL
18.5DR 18.8 20.6 18.8 20.30.9 -4.34%55.1 57.615.7Berks Area Reading Trp AuthPA Reading230.1MB 231.4 253.4 222.0 239.49.4 -1.01%684.5 691.5199.7Berks Area Reading Trp AuthPA Reading
78.5 85.6 74.9 73.3 84.1NA 2.15%237.3 232.373.2PA Rochester Beaver County Transit Authority TOTAL
5.9DR 7.1 7.3 5.8 6.6NA 13.66%20.8 18.36.4Beaver County Transit AuthorityPA Rochester69.0MB 71.4 78.3 67.5 77.5NA 1.17%216.5 214.066.8Beaver County Transit AuthorityPA Rochester
838.6 665.8 723.9 907.7 726.430.0 -9.25%2,139.8 2,358.0635.4PA State College Centre Area Transp Auth TOTAL
2.6DR 2.5 2.5 2.4 2.70.1 -3.90%7.4 7.72.4Centre Area Transp AuthPA State College702.2MB 821.2 647.4 887.2 704.329.1 -9.04%2,086.4 2,293.7617.8Centre Area Transp AuthPA State College19.1VP 14.9 15.9 18.1 19.40.8 -18.73%46.0 56.615.2Centre Area Transp AuthPA State College
104.2 112.2 99.8 95.4 104.24.3 5.14%314.8 299.498.4PA Williamsport Williamsport Bureau of Tr TOTAL
0.1DR 0.1 0.1 0.1 0.10.1 0.00%0.3 0.30.1Williamsport Bureau of TrPA Williamsport99.7MB 104.1 112.1 95.3 104.14.2 5.15%314.5 299.198.3Williamsport Bureau of TrPA Williamsport
794.2 736.6 879.2 883.4 935.034.5 -16.81%2,244.1 2,697.6713.3PR San Juan Puerto Rico DOT TOTAL
741.4HR 730.7 691.8 753.4 800.632.0 -9.40%2,079.6 2,295.4657.1Puerto Rico DOTPR San Juan137.8MB 63.5 44.8 130.0 134.42.5 -59.10%164.5 402.256.2Puerto Rico DOTPR San Juan
330.7 431.1 399.7 372.3 420.913.2 -9.94%1,074.3 1,192.9312.5SC Charleston Charleston Area RTA TOTAL
6.5DR 5.8 6.1 6.0 6.90.2 -8.76%17.7 19.45.8Charleston Area RTASC Charleston393.2MB 324.9 425.0 366.3 414.013.0 -9.96%1,056.6 1,173.5306.7Charleston Area RTASC Charleston
47.0 42.9 41.9 40.7 40.1NA 5.70%129.7 122.739.8SC Clemson Clemson Area Transit TOTAL41.9MB 47.0 42.9 40.7 40.1NA 5.70%129.7 122.739.8Clemson Area TransitSC Clemson
81.2 89.8 86.1 83.5 96.8NA -6.08%250.2 266.479.2SD Sioux Falls Sioux Area Metro TOTAL
9.2DR 9.8 10.0 10.0 10.9NA -1.66%29.6 30.19.8Sioux Area MetroSD Sioux Falls76.9MB 71.4 79.8 73.5 85.9NA -6.64%220.6 236.369.4Sioux Area MetroSD Sioux Falls
56.3 61.4 59.5 50.9 58.62.3 -1.07%167.2 169.049.5TN Clarksville Clarksville Transit System TOTAL
2.5DR 2.6 2.8 1.9 2.30.1 13.43%7.6 6.72.2Clarksville Transit SystemTN Clarksville57.0MB 53.7 58.6 49.0 56.32.2 -1.66%159.6 162.347.3Clarksville Transit SystemTN Clarksville
5.0 5.9 6.2 4.6 6.00.2 -10.12%15.1 16.84.2TN Franklin Franklin Transit Authority TOTAL6.2MB 5.0 5.9 4.6 6.00.2 -10.12%15.1 16.84.2Franklin Transit AuthorityTN Franklin
Modes: MB - Bus, DR - Demand Response, CR - Commuter Rail, HR - Heavy Rail, LR - Light Rail, AG - Automated Guideway, CC - Cable Car, FB - Ferry Boat, IP - Inclined Plane, IR - Intermediate Rail, MO - Monorail, TB - Trolleybus, VP - Vanpool

APTA TRANSIT RIDERSHIP REPORT
State and City Transit Agency ModeAverage
Weekday Jan '16Trips for Trips for
Feb '16Trips forMar '16
Trips ThruMar '16
Trips forJan '15
Trips forFeb '15
Trips forMar '15
Trips ThruMar '15 Quarterly
Change(000's) (000's) (000's) (000's) (000's) (000's) (000's) (000's)(000's)
30First Quarter, 2016
229.9 245.6 241.8 194.3 248.09.5 0.32%686.3 684.1210.8TN Knoxville Knoxville Area Transit TOTAL
4.2DR 4.9 5.4 3.2 4.60.2 22.50%14.7 12.04.4Knoxville Area TransitTN Knoxville237.6MB 225.0 240.2 191.1 243.49.3 -0.07%671.6 672.1206.4Knoxville Area TransitTN Knoxville
625.8 638.9 582.6 630.0 636.923.5 -1.34%1,824.8 1,849.5560.1TN Memphis Memphis Area Transit Auth TOTAL
20.0DR 16.0 16.9 16.9 19.10.7 -12.50%49.0 56.016.1Memphis Area Transit AuthTN Memphis0.0LR 0.0 0.0 0.0 0.00.0 NA0.0 0.00.0Memphis Area Transit AuthTN Memphis
562.6MB 609.8 622.0 613.1 617.822.8 -0.99%1,775.8 1,793.5544.0Memphis Area Transit AuthTN Memphis
752.4 803.1 823.0 661.6 777.7NA -1.11%2,237.3 2,262.3681.8TN Nashville Metropolitan Transit Auth TOTAL
34.2DR 35.5 39.7 29.2 34.6NA 8.57%106.4 98.031.2Metropolitan Transit AuthTN Nashville788.8MB 716.9 763.4 632.4 743.1NA -1.54%2,130.9 2,164.3650.6Metropolitan Transit AuthTN Nashville
48.7 54.4 52.0 45.9 54.1NA -2.63%148.0 152.044.9TN Nashville Regional Transp Auth TOTAL
20.8CR 22.3 24.2 18.5 22.8NA 6.76%66.3 62.119.8Regional Transp AuthTN Nashville17.9MB 15.8 17.4 15.0 18.9NA -8.30%47.5 51.814.3Regional Transp AuthTN Nashville13.3VP 10.6 12.8 12.4 12.4NA -10.24%34.2 38.110.8Regional Transp AuthTN Nashville
2,853.6 2,677.8 2,613.6 2,554.0 3,235.7114.2 -2.42%8,200.1 8,403.32,668.7TX Austin Capital Metropolitan Trp Auth TOTAL
66.0CR 71.1 112.4 52.5 120.13.1 -5.32%225.9 238.642.4Capital Metropolitan Trp AuthTX Austin53.9DR 56.8 60.0 52.6 56.72.3 5.02%171.4 163.254.6Capital Metropolitan Trp AuthTX Austin
2,461.3MB 2,690.3 2,468.2 2,418.6 3,026.1107.1 -2.66%7,695.9 7,906.02,537.4Capital Metropolitan Trp AuthTX Austin32.4VP 35.4 37.2 30.3 32.81.7 11.94%106.9 95.534.3Capital Metropolitan Trp AuthTX Austin
462.1 438.6 461.2 432.1 453.820.7 -0.24%1,343.9 1,347.1443.2TX Corpus Christi Corpus Christi Regional TA TOTAL
15.4DR 17.5 18.0 14.7 16.40.7 11.18%51.7 46.516.2Corpus Christi Regional TATX Corpus Christi0.0FB 0.0 0.0 0.0 4.40.0 -100.00%0.0 4.40.0Corpus Christi Regional TATX Corpus Christi
444.9MB 443.5 419.4 416.7 432.120.0 -0.37%1,288.9 1,293.7426.0Corpus Christi Regional TATX Corpus Christi0.9VP 1.1 1.2 0.7 0.90.0 32.00%3.3 2.51.0Corpus Christi Regional TATX Corpus Christi
5,262.1 5,421.2 5,326.5 4,892.0 5,510.2210.6 0.56%15,817.4 15,728.75,134.1TX Dallas Dallas Area Rapid Transit TOTAL
61.8DR 68.3 71.9 56.6 66.02.8 11.33%205.3 184.465.1Dallas Area Rapid TransitTX Dallas2,310.2LR 2,325.5 2,481.9 2,140.8 2,481.093.5 3.02%7,141.4 6,932.02,334.0Dallas Area Rapid TransitTX Dallas2,892.4MB 2,823.8 2,821.9 2,637.7 2,905.9112.2 -1.18%8,336.1 8,436.02,690.4Dallas Area Rapid TransitTX Dallas
62.1VP 44.5 45.5 56.9 57.32.1 -23.65%134.6 176.344.6Dallas Area Rapid TransitTX Dallas
172.6 188.0 171.6 163.1 198.77.5 -2.46%520.3 533.4159.7TX Dallas-Ft Worth Trinity Railway Express TOTAL171.6CR 172.6 188.0 163.1 198.77.5 -2.46%520.3 533.4159.7Trinity Railway ExpressTX Dallas-Ft Worth
1,233.2 1,277.0 1,242.0 1,279.4 1,357.043.5 -5.05%3,682.7 3,878.41,172.5TX El Paso El Paso Mass Transit Dept TOTAL
18.1DR 19.2 19.8 18.5 20.30.9 1.05%57.5 56.918.5El Paso Mass Transit DeptTX El Paso1,223.9MB 1,214.0 1,257.2 1,260.9 1,336.742.6 -5.14%3,625.2 3,821.51,154.0El Paso Mass Transit DeptTX El Paso
Modes: MB - Bus, DR - Demand Response, CR - Commuter Rail, HR - Heavy Rail, LR - Light Rail, AG - Automated Guideway, CC - Cable Car, FB - Ferry Boat, IP - Inclined Plane, IR - Intermediate Rail, MO - Monorail, TB - Trolleybus, VP - Vanpool
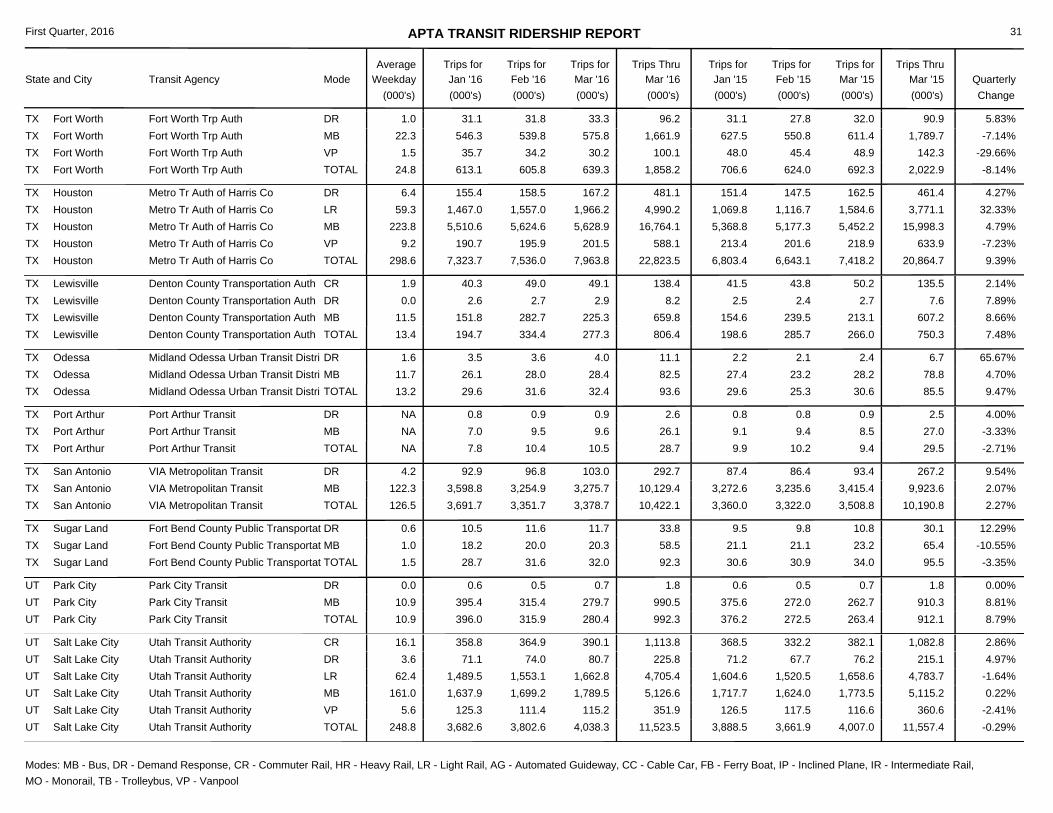
APTA TRANSIT RIDERSHIP REPORT
State and City Transit Agency ModeAverage
Weekday Jan '16Trips for Trips for
Feb '16Trips forMar '16
Trips ThruMar '16
Trips forJan '15
Trips forFeb '15
Trips forMar '15
Trips ThruMar '15 Quarterly
Change(000's) (000's) (000's) (000's) (000's) (000's) (000's) (000's)(000's)
31First Quarter, 2016
605.8 639.3 706.6 624.0 692.324.8 -8.14%1,858.2 2,022.9613.1TX Fort Worth Fort Worth Trp Auth TOTAL
31.1DR 31.8 33.3 27.8 32.01.0 5.83%96.2 90.931.1Fort Worth Trp AuthTX Fort Worth627.5MB 539.8 575.8 550.8 611.422.3 -7.14%1,661.9 1,789.7546.3Fort Worth Trp AuthTX Fort Worth48.0VP 34.2 30.2 45.4 48.91.5 -29.66%100.1 142.335.7Fort Worth Trp AuthTX Fort Worth
7,536.0 7,963.8 6,803.4 6,643.1 7,418.2298.6 9.39%22,823.5 20,864.77,323.7TX Houston Metro Tr Auth of Harris Co TOTAL
151.4DR 158.5 167.2 147.5 162.56.4 4.27%481.1 461.4155.4Metro Tr Auth of Harris CoTX Houston1,069.8LR 1,557.0 1,966.2 1,116.7 1,584.659.3 32.33%4,990.2 3,771.11,467.0Metro Tr Auth of Harris CoTX Houston5,368.8MB 5,624.6 5,628.9 5,177.3 5,452.2223.8 4.79%16,764.1 15,998.35,510.6Metro Tr Auth of Harris CoTX Houston
213.4VP 195.9 201.5 201.6 218.99.2 -7.23%588.1 633.9190.7Metro Tr Auth of Harris CoTX Houston
334.4 277.3 198.6 285.7 266.013.4 7.48%806.4 750.3194.7TX Lewisville Denton County Transportation Auth TOTAL
41.5CR 49.0 49.1 43.8 50.21.9 2.14%138.4 135.540.3Denton County Transportation AuthTX Lewisville2.5DR 2.7 2.9 2.4 2.70.0 7.89%8.2 7.62.6Denton County Transportation AuthTX Lewisville
154.6MB 282.7 225.3 239.5 213.111.5 8.66%659.8 607.2151.8Denton County Transportation AuthTX Lewisville
31.6 32.4 29.6 25.3 30.613.2 9.47%93.6 85.529.6TX Odessa Midland Odessa Urban Transit Distri TOTAL
2.2DR 3.6 4.0 2.1 2.41.6 65.67%11.1 6.73.5Midland Odessa Urban Transit DistriTX Odessa27.4MB 28.0 28.4 23.2 28.211.7 4.70%82.5 78.826.1Midland Odessa Urban Transit DistriTX Odessa
10.4 10.5 9.9 10.2 9.4NA -2.71%28.7 29.57.8TX Port Arthur Port Arthur Transit TOTAL
0.8DR 0.9 0.9 0.8 0.9NA 4.00%2.6 2.50.8Port Arthur TransitTX Port Arthur9.1MB 9.5 9.6 9.4 8.5NA -3.33%26.1 27.07.0Port Arthur TransitTX Port Arthur
3,351.7 3,378.7 3,360.0 3,322.0 3,508.8126.5 2.27%10,422.1 10,190.83,691.7TX San Antonio VIA Metropolitan Transit TOTAL
87.4DR 96.8 103.0 86.4 93.44.2 9.54%292.7 267.292.9VIA Metropolitan TransitTX San Antonio3,272.6MB 3,254.9 3,275.7 3,235.6 3,415.4122.3 2.07%10,129.4 9,923.63,598.8VIA Metropolitan TransitTX San Antonio
31.6 32.0 30.6 30.9 34.01.5 -3.35%92.3 95.528.7TX Sugar Land Fort Bend County Public Transportat TOTAL
9.5DR 11.6 11.7 9.8 10.80.6 12.29%33.8 30.110.5Fort Bend County Public TransportatTX Sugar Land21.1MB 20.0 20.3 21.1 23.21.0 -10.55%58.5 65.418.2Fort Bend County Public TransportatTX Sugar Land
315.9 280.4 376.2 272.5 263.410.9 8.79%992.3 912.1396.0UT Park City Park City Transit TOTAL
0.6DR 0.5 0.7 0.5 0.70.0 0.00%1.8 1.80.6Park City TransitUT Park City375.6MB 315.4 279.7 272.0 262.710.9 8.81%990.5 910.3395.4Park City TransitUT Park City
3,802.6 4,038.3 3,888.5 3,661.9 4,007.0248.8 -0.29%11,523.5 11,557.43,682.6UT Salt Lake City Utah Transit Authority TOTAL
368.5CR 364.9 390.1 332.2 382.116.1 2.86%1,113.8 1,082.8358.8Utah Transit AuthorityUT Salt Lake City71.2DR 74.0 80.7 67.7 76.23.6 4.97%225.8 215.171.1Utah Transit AuthorityUT Salt Lake City
1,604.6LR 1,553.1 1,662.8 1,520.5 1,658.662.4 -1.64%4,705.4 4,783.71,489.5Utah Transit AuthorityUT Salt Lake City1,717.7MB 1,699.2 1,789.5 1,624.0 1,773.5161.0 0.22%5,126.6 5,115.21,637.9Utah Transit AuthorityUT Salt Lake City
126.5VP 111.4 115.2 117.5 116.65.6 -2.41%351.9 360.6125.3Utah Transit AuthorityUT Salt Lake City
Modes: MB - Bus, DR - Demand Response, CR - Commuter Rail, HR - Heavy Rail, LR - Light Rail, AG - Automated Guideway, CC - Cable Car, FB - Ferry Boat, IP - Inclined Plane, IR - Intermediate Rail, MO - Monorail, TB - Trolleybus, VP - Vanpool

APTA TRANSIT RIDERSHIP REPORT
State and City Transit Agency ModeAverage
Weekday Jan '16Trips for Trips for
Feb '16Trips forMar '16
Trips ThruMar '16
Trips forJan '15
Trips forFeb '15
Trips forMar '15
Trips ThruMar '15 Quarterly
Change(000's) (000's) (000's) (000's) (000's) (000's) (000's) (000's)(000's)
32First Quarter, 2016
289.3 354.3 298.8 272.0 345.812.4 -3.70%882.7 916.6239.1VA Alexandria Alexandria Transit Company TOTAL298.8MB 289.3 354.3 272.0 345.812.4 -3.70%882.7 916.6239.1Alexandria Transit CompanyVA Alexandria
357.3 409.0 350.6 326.5 386.717.5 -0.93%1,053.9 1,063.8287.6VA Alexandria Virginia Railway Express TOTAL350.6CR 357.3 409.0 326.5 386.717.5 -0.93%1,053.9 1,063.8287.6Virginia Railway ExpressVA Alexandria
NA NA 223.5 209.5 245.5NA NANA 678.5NAVA Arlington Arlington Transit (ART) TOTAL
7.8DR NA NA 7.6 8.7NA NANA 24.1NAArlington Transit (ART)VA Arlington215.7MB 260.6 300.6 201.9 236.810.6 19.68%783.2 654.4222.0Arlington Transit (ART)VA Arlington
58.0 63.6 58.4 58.0 64.5NA -8.68%165.2 180.943.6VA Fairfax City of Fairfax CUE Bus TOTAL58.4MB 58.0 63.6 58.0 64.5NA -8.68%165.2 180.943.6City of Fairfax CUE BusVA Fairfax
648.7 760.4 713.6 643.2 776.726.2 -8.07%1,961.4 2,133.5552.3VA Fairfax Fairfax County Dept of Transp TOTAL713.6MB 648.7 760.4 643.2 776.726.2 -8.07%1,961.4 2,133.5552.3Fairfax County Dept of TranspVA Fairfax
NA NA 1,261.2 1,010.1 1,319.8NA NANA 3,591.11,117.5VA Hampton Hampton Roads Transit TOTAL
26.8DR 28.4 32.4 20.5 28.41.2 15.98%87.8 75.727.0Hampton Roads TransitVA Hampton11.1FB 9.1 14.3 8.4 13.20.4 -1.22%32.3 32.78.9Hampton Roads TransitVA Hampton
112.0LR NA NA 93.3 127.9NA NANA 333.293.4Hampton Roads TransitVA Hampton1,103.6MB 1,000.0 1,099.3 881.4 1,142.041.1 -1.45%3,081.7 3,127.0982.4Hampton Roads TransitVA Hampton
7.7VP 6.4 7.1 6.5 8.30.3 -14.22%19.3 22.55.8Hampton Roads TransitVA Hampton
226.3 189.2 264.9 260.0 254.5NA -28.92%554.0 779.4138.5VA Lynchburg Greater Lynchburg Transit Co TOTAL
0.0DR 0.0 0.0 0.0 0.0NA NA0.0 0.00.0Greater Lynchburg Transit CoVA Lynchburg264.9MB 226.3 189.2 260.0 254.5NA -28.92%554.0 779.4138.5Greater Lynchburg Transit CoVA Lynchburg
102.8 196.6 92.6 88.3 153.84.3 11.98%374.8 334.775.4VA Williamsburg Williamsburg Area Transport TOTAL
0.6DR 0.7 0.7 0.6 0.70.0 10.53%2.1 1.90.7Williamsburg Area TransportVA Williamsburg92.0MB 102.1 195.9 87.7 153.14.3 11.99%372.7 332.874.7Williamsburg Area TransportVA Williamsburg
215.6 254.7 223.3 209.6 245.7NA -5.16%643.6 678.6173.3VA Woodbridge PRTC Omni-Ride TOTAL223.3MB 215.6 254.7 209.6 245.7NA -5.16%643.6 678.6173.3PRTC Omni-RideVA Woodbridge
207.3 226.9 227.6 219.3 241.59.9 -8.18%632.1 688.4197.9VT Burlington Chittenden County TA TOTAL
4.4DR 3.8 4.1 3.9 4.70.2 -9.23%11.8 13.03.9Chittenden County TAVT Burlington223.2MB 203.5 222.8 215.4 236.89.7 -8.16%620.3 675.4194.0Chittenden County TAVT Burlington
NA NA 313.6 302.7 336.6NA NANA 952.9NAWA Bremerton Kitsap Transit TOTAL
24.9DR 23.4 26.1 24.0 26.91.0 -5.67%71.5 75.822.0Kitsap TransitWA Bremerton35.0FB 39.0 42.2 36.1 40.41.8 6.37%118.6 111.537.4Kitsap TransitWA Bremerton
235.3MB 221.4 242.4 225.4 250.410.3 -4.56%678.7 711.1214.9Kitsap TransitWA Bremerton18.4VP 15.4 17.2 17.2 18.90.7 -11.01%48.5 54.515.9Kitsap TransitWA Bremerton
Modes: MB - Bus, DR - Demand Response, CR - Commuter Rail, HR - Heavy Rail, LR - Light Rail, AG - Automated Guideway, CC - Cable Car, FB - Ferry Boat, IP - Inclined Plane, IR - Intermediate Rail, MO - Monorail, TB - Trolleybus, VP - Vanpool

APTA TRANSIT RIDERSHIP REPORT
State and City Transit Agency ModeAverage
Weekday Jan '16Trips for Trips for
Feb '16Trips forMar '16
Trips ThruMar '16
Trips forJan '15
Trips forFeb '15
Trips forMar '15
Trips ThruMar '15 Quarterly
Change(000's) (000's) (000's) (000's) (000's) (000's) (000's) (000's)(000's)
33First Quarter, 2016
165.3 175.7 170.8 165.9 179.810.3 -2.52%503.5 516.5162.5WA Everett Everett Transit System TOTAL
8.9DR 9.7 10.3 8.4 9.53.9 10.82%29.7 26.89.7Everett Transit SystemWA Everett161.9MB 155.6 165.4 157.5 170.36.4 -3.25%473.8 489.7152.8Everett Transit SystemWA Everett
846.2 903.8 831.4 793.1 841.536.7 4.89%2,586.5 2,466.0836.5WA Everett Snohomish County PTBA TOTAL
15.7DR 15.6 17.3 15.2 16.40.7 1.06%47.8 47.314.9Snohomish County PTBAWA Everett739.3MB 756.5 805.7 704.6 744.532.5 5.63%2,311.7 2,188.4749.5Snohomish County PTBAWA Everett76.4VP 74.1 80.8 73.3 80.63.5 -1.43%227.0 230.372.1Snohomish County PTBAWA Everett
423.7 441.9 452.2 432.3 458.9NA -4.57%1,282.0 1,343.4416.4WA Olympia Intercity Transit TOTAL
13.1DR 14.0 15.1 12.1 14.2NA 7.11%42.2 39.413.1Intercity TransitWA Olympia379.8MB 358.6 369.8 364.6 382.1NA -3.94%1,082.1 1,126.5353.7Intercity TransitWA Olympia59.3VP 51.1 57.0 55.6 62.6NA -11.15%157.7 177.549.6Intercity TransitWA Olympia
328.5 351.0 311.4 316.5 329.515.2 2.84%984.6 957.4305.1WA Richland Ben Franklin Transit TOTAL
37.6DR 40.8 44.2 37.2 39.41.8 9.46%125.0 114.240.0Ben Franklin TransitWA Richland209.3MB 225.8 235.4 215.0 223.29.8 2.55%664.0 647.5202.8Ben Franklin TransitWA Richland64.5VP 61.9 71.4 64.3 66.93.7 -0.05%195.6 195.762.3Ben Franklin TransitWA Richland
10,290.8 11,131.0 10,460.1 9,864.4 10,791.3426.2 2.23%31,809.4 31,115.810,387.6WA Seattle King County Dept of Trp TOTAL
86.5DR 78.9 86.9 82.2 88.53.2 -5.56%242.9 257.277.1King County Dept of TrpWA Seattle50.3LR 16.3 33.3 47.2 54.71.0 -57.16%65.2 152.215.6King County Dept of TrpWA Seattle
8,424.5MB 8,426.3 8,969.7 7,936.0 8,710.3336.6 3.23%25,880.7 25,070.88,484.7King County Dept of TrpWA Seattle1,630.9TB 1,507.2 1,726.5 1,528.0 1,635.472.1 -0.90%4,751.3 4,794.31,517.6King County Dept of TrpWA Seattle
267.9VP 262.1 314.6 271.0 302.413.4 3.33%869.3 841.3292.6King County Dept of TrpWA Seattle
2,785.6 3,282.3 2,679.7 2,524.8 2,882.8120.3 9.05%8,819.3 8,087.32,751.4WA Seattle Sound Transit TOTAL
306.0CR 340.0 365.5 281.4 308.516.3 15.73%1,036.8 895.9331.3Sound TransitWA Seattle4.5DR 3.6 3.8 4.0 4.20.1 -13.39%11.0 12.73.6Sound TransitWA Seattle
909.8LR 990.9 1,342.1 842.3 983.741.5 21.23%3,316.5 2,735.8983.5Sound TransitWA Seattle1,459.4MB 1,451.1 1,570.9 1,397.1 1,586.462.4 0.27%4,455.0 4,442.91,433.0Sound TransitWA Seattle
32.6 33.6 32.9 31.7 33.51.5 -0.31%97.8 98.131.6WA Seattle University of Washington TOTAL32.9MB 32.6 33.6 31.7 33.51.5 -0.31%97.8 98.131.6University of WashingtonWA Seattle
1,611.7 1,843.3 1,592.0 1,539.7 1,794.055.6 2.74%5,060.8 4,925.71,605.8WA Seattle Washington State Ferries TOTAL1,592.0FB 1,611.7 1,843.3 1,539.7 1,794.055.6 2.74%5,060.8 4,925.71,605.8Washington State FerriesWA Seattle
982.8 1,003.4 1,047.4 988.5 1,022.741.6 -3.07%2,964.8 3,058.6978.6WA Spokane Spokane Transit Authority TOTAL
39.0DR 40.1 42.0 37.1 41.12.0 4.35%122.3 117.240.2Spokane Transit AuthorityWA Spokane987.3MB 924.8 941.8 932.5 961.338.7 -3.27%2,786.9 2,881.1920.3Spokane Transit AuthorityWA Spokane21.1VP 17.9 19.6 18.9 20.30.9 -7.79%55.6 60.318.1Spokane Transit AuthorityWA Spokane
Modes: MB - Bus, DR - Demand Response, CR - Commuter Rail, HR - Heavy Rail, LR - Light Rail, AG - Automated Guideway, CC - Cable Car, FB - Ferry Boat, IP - Inclined Plane, IR - Intermediate Rail, MO - Monorail, TB - Trolleybus, VP - Vanpool

APTA TRANSIT RIDERSHIP REPORT
State and City Transit Agency ModeAverage
Weekday Jan '16Trips for Trips for
Feb '16Trips forMar '16
Trips ThruMar '16
Trips forJan '15
Trips forFeb '15
Trips forMar '15
Trips ThruMar '15 Quarterly
Change(000's) (000's) (000's) (000's) (000's) (000's) (000's) (000's)(000's)
34First Quarter, 2016
826.4 863.3 894.9 845.8 897.133.6 -5.23%2,499.9 2,637.8810.2WA Tacoma Pierce Transit TOTAL
29.3DR 28.4 31.4 28.7 31.31.1 -1.68%87.8 89.328.0Pierce TransitWA Tacoma793.0MB 727.1 752.4 747.2 788.729.3 -5.86%2,192.5 2,328.9713.0Pierce TransitWA Tacoma72.6VP 70.9 79.5 69.9 77.13.3 0.00%219.6 219.669.2Pierce TransitWA Tacoma
87.8 92.9 90.9 84.6 94.03.9 -2.41%263.0 269.582.3WA Wenatchee Chelan-Douglas PTBA TOTAL
4.8DR 4.4 4.7 4.1 4.80.2 -2.19%13.4 13.74.3Chelan-Douglas PTBAWA Wenatchee86.1MB 83.4 88.2 80.5 89.23.7 -2.42%249.6 255.878.0Chelan-Douglas PTBAWA Wenatchee
1,422.3 1,280.8 1,225.5 1,509.2 1,503.354.4 -9.13%3,851.2 4,238.01,148.1WI Madison Metro Transit TOTAL
21.6DR 23.8 24.9 22.9 25.21.0 1.43%70.7 69.722.0Metro TransitWI Madison1,203.9MB 1,398.5 1,255.9 1,486.3 1,478.153.4 -9.30%3,780.5 4,168.31,126.1Metro TransitWI Madison
2,549.7 2,981.4 2,804.7 2,613.6 3,070.1112.9 -5.33%8,036.1 8,488.42,505.0WI Milwaukee Milwaukee County Tr Sys TOTAL
42.2DR 43.4 46.6 41.8 46.31.8 0.77%131.3 130.341.3Milwaukee County Tr SysWI Milwaukee2,762.5MB 2,506.3 2,934.8 2,571.8 3,023.8111.2 -5.42%7,904.8 8,358.12,463.7Milwaukee County Tr SysWI Milwaukee
16.4 16.9 15.7 14.9 16.70.7 3.59%49.0 47.315.7WI Port Washington Ozaukee County Transit Services TOTAL
8.9DR 9.6 9.7 8.8 9.80.4 4.36%28.7 27.59.4Ozaukee County Transit ServicesWI Port Washington6.8MB 6.8 7.2 6.1 6.90.3 2.53%20.3 19.86.3Ozaukee County Transit ServicesWI Port Washington
118.6 111.3 115.8 116.9 126.5NA -7.49%332.3 359.2102.4WI Racine Belle Urban System TOTAL
2.1DR 1.8 1.8 2.0 2.2NA -15.87%5.3 6.31.7Belle Urban SystemWI Racine113.7MB 116.8 109.5 114.9 124.3NA -7.34%327.0 352.9100.7Belle Urban SystemWI Racine
113.1 98.3 95.0 111.1 98.04.7 -2.47%296.6 304.185.2WV Morgantown Mountain Line Transit Authority TOTAL
0.3DR 0.3 0.4 0.2 0.20.0 28.57%0.9 0.70.2Mountain Line Transit AuthorityWV Morgantown94.7MB 112.8 97.9 110.9 97.84.7 -2.54%295.7 303.485.0Mountain Line Transit AuthorityWV Morgantown
40.8 45.1 42.5 43.4 45.01.7 -5.35%123.9 130.938.0WV Parkersburg Mid-Ohio Valley Transit Auth TOTAL
0.3DR 0.5 0.5 0.3 0.40.0 50.00%1.5 1.00.5Mid-Ohio Valley Transit AuthWV Parkersburg42.2MB 40.3 44.6 43.1 44.61.7 -5.77%122.4 129.937.5Mid-Ohio Valley Transit AuthWV Parkersburg
Modes: MB - Bus, DR - Demand Response, CR - Commuter Rail, HR - Heavy Rail, LR - Light Rail, AG - Automated Guideway, CC - Cable Car, FB - Ferry Boat, IP - Inclined Plane, IR - Intermediate Rail, MO - Monorail, TB - Trolleybus, VP - Vanpool

APTA TRANSIT RIDERSHIP REPORT
Province and City Transit Agency ModeAverage
Weekday Jan '16Trips for Trips for
Feb '16Trips forMar '16
Trips ThruMar '16
Trips forJan '15
Trips forFeb '15
Trips forMar '15
Trips ThruMar '15 Quarterly
Change(000's) (000's) (000's) (000's) (000's) (000's) (000's) (000's)(000's)
35
CANADA
First Quarter, 2016
13,932.9 14,183.4 13,744.9 14,884.9 15,471.0575.6 -5.10%41,852.0 44,100.813,735.7AB Calgary Calgary Transit TOTAL
LR 7,523.8 7,659.0 7,119.9 7,710.4 8,014.0327.5 -1.07%22,600.1 22,844.37,417.3Calgary TransitAB CalgaryMB 6,409.1 6,524.4 6,625.0 7,174.5 7,457.0248.0 -9.43%19,251.9 21,256.56,318.4Calgary TransitAB Calgary
12,517.0 12,703.3 12,888.5 12,800.5 13,220.6NA -0.99%38,525.1 38,909.613,304.8AB Edmonton Edmonton Transit System TOTAL
LR 3,041.6 3,086.9 3,209.2 3,187.3 3,291.9NA -3.37%9,361.6 9,688.43,233.1Edmonton Transit SystemAB EdmontonMB 9,475.4 9,616.4 9,679.3 9,613.2 9,928.7NA -0.20%29,163.5 29,221.210,071.7Edmonton Transit SystemAB Edmonton
6.4 6.5 6.4 5.7 6.2NA 6.56%19.5 18.36.6AB Leduc City of Leduc, Leduc Transit Service TOTALMB 6.4 6.5 6.4 5.7 6.2NA 6.56%19.5 18.36.6City of Leduc, Leduc Transit ServiceAB Leduc
2,521.9 2,694.5 2,643.1 2,352.7 2,762.7100.8 1.36%7,864.3 7,758.52,647.9BC Victoria BC Transit TOTAL
DR 31.3 33.1 33.1 31.9 35.21.2 -3.69%96.5 100.232.1BC TransitBC VictoriaMB 2,490.6 2,661.4 2,610.0 2,320.8 2,727.599.6 1.43%7,767.8 7,658.32,615.8BC TransitBC Victoria
87.4 91.2 95.6 86.8 95.60.8 -4.75%264.8 278.086.2MB Brandon City of Brandon TOTALMB 87.4 91.2 95.6 86.8 95.60.8 -4.75%264.8 278.086.2City of BrandonMB Brandon
1,729.1 1,871.4 1,603.5 1,469.2 1,743.074.3 10.86%5,338.8 4,815.71,738.3ON Brampton Brampton Transit TOTALMB 1,729.1 1,871.4 1,603.5 1,469.2 1,743.074.3 10.86%5,338.8 4,815.71,738.3Brampton TransitON Brampton
314.6 326.6 321.9 299.8 349.513.6 -1.00%961.5 971.2320.3ON Oakville Oakville Transit TOTAL
DR 9.1 10.0 7.6 7.0 7.90.4 25.78%28.3 22.59.2Oakville TransitON OakvilleMB 305.5 316.6 314.3 292.8 341.613.2 -1.63%933.2 948.7311.1Oakville TransitON Oakville
12,774.1 13,181.5 12,778.2 11,972.0 13,293.2548.4 2.71%39,074.3 38,043.413,118.7ON Ottawa OC Transpo/Para Transpo TOTAL
DR 71.2 78.7 73.7 70.5 80.33.0 1.74%228.4 224.578.5OC Transpo/Para TranspoON OttawaLR 405.5 464.4 307.3 174.2 418.518.8 48.59%1,337.3 900.0467.4OC Transpo/Para TranspoON OttawaMB 12,297.4 12,638.4 12,397.2 11,727.3 12,794.4526.6 1.60%37,508.6 36,918.912,572.8OC Transpo/Para TranspoON Ottawa
1,805.7 1,889.5 1,792.9 1,689.8 1,881.776.9 2.73%5,510.9 5,364.41,815.7ON Richmond Hill York Region Transit TOTALMB 1,805.7 1,889.5 1,792.9 1,689.8 1,881.776.9 2.73%5,510.9 5,364.41,815.7York Region TransitON Richmond Hill
5,480.3 5,985.5 5,761.9 5,157.1 5,957.0253.5 1.02%17,047.9 16,876.05,582.1ON Toronto GO Transit TOTAL
CR 4,168.8 4,513.5 4,327.0 3,916.7 4,554.3196.8 0.69%12,886.7 12,798.04,204.4GO TransitON TorontoMB 1,311.5 1,472.0 1,434.9 1,240.4 1,402.756.7 2.04%4,161.2 4,078.01,377.7GO TransitON Toronto
67,147.0 73,020.6 72,441.8 67,010.4 73,500.32,692.6 -0.82%211,211.4 212,952.571,043.8ON Toronto Toronto Transit Commission TOTAL
DR 288.5 361.0 271.0 246.2 331.812.0 12.16%952.2 849.0302.7Toronto Transit CommissionON TorontoHR 23,666.2 25,271.0 26,771.7 25,010.5 27,061.1939.9 -6.58%73,653.3 78,843.324,716.1Toronto Transit CommissionON TorontoIR 841.2 893.5 937.7 823.0 908.331.4 -1.77%2,621.7 2,669.0887.0Toronto Transit CommissionON TorontoLR 7,757.3 8,279.3 8,473.7 7,622.9 8,169.8306.4 -0.50%24,144.2 24,266.48,107.6Toronto Transit CommissionON TorontoMB 34,593.8 38,215.8 35,987.7 33,307.8 37,029.31,402.9 3.31%109,840.0 106,324.837,030.4Toronto Transit CommissionON Toronto
Modes: MB - Bus, DR - Demand Response, CR - Commuter Rail, HR - Heavy Rail, LR - Light Rail, AG - Automated Guideway, CC - Cable Car, FB - Ferry Boat, IP - Inclined Plane, IR - Intermediate Rail, MO - Monorail, TB - Trolleybus, VP - Vanpool

APTA TRANSIT RIDERSHIP REPORT
Province and City Transit Agency ModeAverage
Weekday Jan '16Trips for Trips for
Feb '16Trips forMar '16
Trips ThruMar '16
Trips forJan '15
Trips forFeb '15
Trips forMar '15
Trips ThruMar '15 Quarterly
Change(000's) (000's) (000's) (000's) (000's) (000's) (000's) (000's)(000's)
36
CANADA
First Quarter, 2016
1,827.0 1,831.2 1,683.7 1,679.8 1,786.084.3 4.64%5,388.5 5,149.51,730.3QC Montreal Agence Metropolitaine de Transport TOTAL
CR 1,707.5 1,709.2 1,560.6 1,556.6 1,654.878.4 5.15%5,017.7 4,772.01,601.0Agence Metropolitaine de TransportQC MontrealMB 119.5 122.0 123.1 123.2 131.25.9 -1.77%370.8 377.5129.3Agence Metropolitaine de TransportQC Montreal
53,576.5 54,980.9 54,266.1 53,128.3 57,021.52,172.4 -1.89%161,300.6 164,415.952,743.2QC Montreal Societe de transport de Montreal TOTAL
DR 304.0 323.8 281.9 285.6 326.612.6 4.26%932.2 894.1304.4Societe de transport de MontrealQC MontrealHR 30,192.2 30,846.6 29,902.3 30,087.6 31,743.91,218.4 -1.75%90,129.1 91,733.829,090.3Societe de transport de MontrealQC MontrealMB 23,080.3 23,810.5 24,081.9 22,755.1 24,951.0941.4 -2.16%70,239.3 71,788.023,348.5Societe de transport de MontrealQC Montreal
Modes: MB - Bus, DR - Demand Response, CR - Commuter Rail, HR - Heavy Rail, LR - Light Rail, AG - Automated Guideway, CC - Cable Car, FB - Ferry Boat, IP - Inclined Plane, IR - Intermediate Rail, MO - Monorail, TB - Trolleybus, VP - Vanpool
Related Documents