Transit Capacity and Quality of Service Manual—2 nd Edition PART 4 BUS TRANSIT CAPACITY CONTENTS CHAPTER 1. BUS CAPACITY FUNDAMENTALS..................................................... 4-1 Overview .......................................................................................................................... 4-1 Capacity Calculation Process ......................................................................................... 4-1 Loading Areas .............................................................................................................. 4-2 Bus Stops....................................................................................................................... 4-2 Bus Facilities ................................................................................................................. 4-3 Person Capacity ........................................................................................................... 4-3 Loading Area Bus Capacity ........................................................................................... 4-3 Dwell Time ................................................................................................................... 4-3 Clearance Time ............................................................................................................ 4-7 Dwell Time Variability................................................................................................ 4-8 Traffic Signal Timing................................................................................................. 4-10 Calculation Procedure............................................................................................... 4-10 Bus Stop Vehicle Capacity............................................................................................ 4-11 Design and Location Considerations ...................................................................... 4-11 Bus Stop Effectiveness............................................................................................... 4-12 Calculation Procedure............................................................................................... 4-15 Bus Facility Concepts .................................................................................................... 4-16 Person Capacity ............................................................................................................. 4-16 Loading Diversity ...................................................................................................... 4-16 Operator Policy .......................................................................................................... 4-17 CHAPTER 2. BUS PREFERENTIAL TREATMENTS ................................................ 4-19 Introduction ................................................................................................................... 4-19 Bus Preferential Treatment Uses ............................................................................. 4-19 Person Delay Concepts ............................................................................................. 4-20 Busways and Freeway HOV Lanes ............................................................................. 4-20 Operational Overview .............................................................................................. 4-21 HOV Lanes ................................................................................................................. 4-23 Freeway Ramp Queue Bypasses.............................................................................. 4-23 Arterial Street Bus Lanes .............................................................................................. 4-24 Traffic Signal Priority .................................................................................................... 4-25 Overview .................................................................................................................... 4-25 Notes on Application ................................................................................................ 4-26 Site-Specific Priority Treatments ................................................................................. 4-27 Queue Jumps .............................................................................................................. 4-27 Part 4/BUS TRANSIT CAPACITY Page 4-i Contents

Welcome message from author
This document is posted to help you gain knowledge. Please leave a comment to let me know what you think about it! Share it to your friends and learn new things together.
Transcript

Transit Capacity and Quality of Service Manual—2nd Edition
PART 4 BUS TRANSIT CAPACITY
CONTENTS
CHAPTER 1. BUS CAPACITY FUNDAMENTALS..................................................... 4-1 Overview .......................................................................................................................... 4-1 Capacity Calculation Process......................................................................................... 4-1
Loading Areas.............................................................................................................. 4-2 Bus Stops....................................................................................................................... 4-2 Bus Facilities................................................................................................................. 4-3 Person Capacity ........................................................................................................... 4-3
Loading Area Bus Capacity ........................................................................................... 4-3 Dwell Time ................................................................................................................... 4-3 Clearance Time ............................................................................................................ 4-7 Dwell Time Variability................................................................................................ 4-8 Traffic Signal Timing................................................................................................. 4-10 Calculation Procedure............................................................................................... 4-10
Bus Stop Vehicle Capacity............................................................................................ 4-11 Design and Location Considerations ...................................................................... 4-11 Bus Stop Effectiveness............................................................................................... 4-12 Calculation Procedure............................................................................................... 4-15
Bus Facility Concepts .................................................................................................... 4-16 Person Capacity ............................................................................................................. 4-16
Loading Diversity...................................................................................................... 4-16 Operator Policy .......................................................................................................... 4-17
CHAPTER 2. BUS PREFERENTIAL TREATMENTS................................................ 4-19 Introduction ................................................................................................................... 4-19
Bus Preferential Treatment Uses ............................................................................. 4-19 Person Delay Concepts ............................................................................................. 4-20
Busways and Freeway HOV Lanes............................................................................. 4-20 Operational Overview .............................................................................................. 4-21 HOV Lanes ................................................................................................................. 4-23 Freeway Ramp Queue Bypasses.............................................................................. 4-23
Arterial Street Bus Lanes .............................................................................................. 4-24 Traffic Signal Priority.................................................................................................... 4-25
Overview .................................................................................................................... 4-25 Notes on Application ................................................................................................ 4-26
Site-Specific Priority Treatments ................................................................................. 4-27 Queue Jumps.............................................................................................................. 4-27
Part 4/BUS TRANSIT CAPACITY Page 4-i Contents

Transit Capacity and Quality of Service Manual—2nd Edition
Boarding Islands ........................................................................................................ 4-28 Curb Extensions......................................................................................................... 4-29 Yield-to-Bus Laws...................................................................................................... 4-30 Parking Restrictions .................................................................................................. 4-31 Turn Restriction Exemptions ................................................................................... 4-31
Transit Operating Measures......................................................................................... 4-31 Bus Stop Relocation................................................................................................... 4-31 Bus Stop Consolidation............................................................................................. 4-32 Skip-Stop Operation.................................................................................................. 4-32 Platooning................................................................................................................... 4-33 Design Standards....................................................................................................... 4-33
Summary ........................................................................................................................ 4-33
CHAPTER 3. PLANNING APPLICATIONS .............................................................. 4-35 Introduction ................................................................................................................... 4-35 Transit Preferential Treatments ................................................................................... 4-35
Uninterrupted Flow Facilities .................................................................................. 4-35 Interrupted Flow Facilities ....................................................................................... 4-37
Bus Stop and Facility Capacity .................................................................................... 4-38 Bus Volume and Capacity Relationships ............................................................... 4-38 Busways ...................................................................................................................... 4-40 Arterial Street Bus Lanes .......................................................................................... 4-40 Mixed Traffic Operations ......................................................................................... 4-41 Bus Stops and Loading Areas .................................................................................. 4-41 Factors Influencing Bus and Person Capacity ....................................................... 4-41
CHAPTER 4. GRADE-SEPARATED FACILITIES .................................................... 4-43 Introduction ................................................................................................................... 4-43 Bus Capacity................................................................................................................... 4-43
Grade-Separated Busways ....................................................................................... 4-43 Freeway HOV Lanes ................................................................................................. 4-45
Bus Speeds...................................................................................................................... 4-46
CHAPTER 5. ARTERIAL STREET BUS LANES........................................................ 4-47 Introduction ................................................................................................................... 4-47 Bus Lane Types .............................................................................................................. 4-47 Bus Capacity................................................................................................................... 4-47
Right-Turning Traffic Delays ................................................................................... 4-48 Skip-Stop Operations ................................................................................................ 4-49 Capacity Calculation Procedure .............................................................................. 4-50
Bus Speeds...................................................................................................................... 4-52 Arterial Streets ........................................................................................................... 4-52
Contents Page 4-ii Part 4/BUS TRANSIT CAPACITY

Transit Capacity and Quality of Service Manual—2nd Edition
CHAPTER 6. MIXED TRAFFIC..................................................................................... 4-57 Introduction ................................................................................................................... 4-57 Types of Bus Operations............................................................................................... 4-57 Bus Capacity................................................................................................................... 4-57 Bus Speeds...................................................................................................................... 4-59
CHAPTER 7. DEMAND-RESPONSIVE TRANSPORTATION.............................. 4-61 Introduction ................................................................................................................... 4-61 Service Characteristics .................................................................................................. 4-61 Vehicle Types ................................................................................................................. 4-62 DRT Capacity ................................................................................................................. 4-62
Capacity Factors......................................................................................................... 4-62 Capacity Calculation Procedure .............................................................................. 4-63
CHAPTER 8. REFERENCES........................................................................................... 4-65
CHAPTER 9. EXAMPLE PROBLEMS .......................................................................... 4-69
APPENDIX A: EXHIBITS IN METRIC UNITS .......................................................... 4-91
APPENDIX B: DWELL TIME DATA COLLECTION PROCEDURE ..................... 4-93
APPENDIX C: BUS EFFECTS ON ADJACENT LANE VEHICLE CAPACITY .... 4-97
APPENDIX D: PLANNING-LEVEL CAPACITY GRAPHS..................................... 4-99
APPENDIX E: EFFECTS OF BUS BUNCHING ON PERSON CAPACITY......... 4-109
LIST OF EXHIBITS
Exhibit 4-1 Bus Loading Areas, Stops, and Facilities ............................................... 4-2 Exhibit 4-2 Passenger Service Times with Single-Channel Passenger
Movement .................................................................................................. 4-5 Exhibit 4-3 Passenger Service Times with Multiple-Channel Passenger
Movement .................................................................................................. 4-6 Exhibit 4-4 On-Line and Off-Line Loading Areas .................................................... 4-7 Exhibit 4-5 Average Bus Re-Entry Delay (Random Vehicle Arrivals) ................... 4-7 Exhibit 4-6 Values of Z Associated with Given Failure Rates................................. 4-9 Exhibit 4-7 Illustrative Relationships Between Failure Rate, Operating Margin,
and Loading Area Bus Capacity ............................................................. 4-9 Exhibit 4-8 Estimated Maximum Capacity of Loading Areas (bus/h) ................ 4-11 Exhibit 4-9 On-Street Bus Stop Locations ................................................................ 4-11 Exhibit 4-10 On-Street Bus Stop Location Comparison ........................................... 4-13 Exhibit 4-11 Bus Stop Design Types ........................................................................... 4-13 Exhibit 4-12 Efficiency of Multiple Linear Loading Areas at Bus Stops ................ 4-14
Part 4/BUS TRANSIT CAPACITY Page 4-iii Contents

Transit Capacity and Quality of Service Manual—2nd Edition
Exhibit 4-13 Relative Contributions of Dwell Time, g/C Ratio, and Number of Loading Areas to Bus Stop Capacity .................................................... 4-15
Exhibit 4-14 Estimated Maximum Capacity of On-Line Linear Bus Stops............ 4-15 Exhibit 4-15 Capacity Factors for Exclusive Bus Lanes............................................ 4-16 Exhibit 4-16 Person Capacity Factors ......................................................................... 4-17 Exhibit 4-17 Characteristics of Common Bus Transit Vehicles—United States
and Canada .............................................................................................. 4-18 Exhibit 4-18 Operating Characteristics of Selected North American Busways
and Freeway HOV Facilities.................................................................. 4-21 Exhibit 4-19 Median Bus Lane Examples................................................................... 4-22 Exhibit 4-20 Bus Tunnel Examples ............................................................................. 4-23 Exhibit 4-21 Houston HOV Lane Examples .............................................................. 4-23 Exhibit 4-22 Freeway Ramp Queue Bypasses ........................................................... 4-24 Exhibit 4-23 Sources of Delay for Buses Operating in Mixed Traffic at
Intersections ............................................................................................. 4-24 Exhibit 4-24 Bus Lane Development via Parking Restrictions................................ 4-25 Exhibit 4-25 Bus Signal Priority Systems ................................................................... 4-26 Exhibit 4-26 Bus Signal Priority Concept—Red Truncation and Green
Extension .................................................................................................. 4-27 Exhibit 4-27 Reported Benefits Associated with Transit Signal Priority ............... 4-27 Exhibit 4-28 Bus Queue Jumps.................................................................................... 4-28 Exhibit 4-29 Boarding Islands...................................................................................... 4-29 Exhibit 4-30 Curb Extensions ...................................................................................... 4-30 Exhibit 4-31 Yield-to-Bus Law Notifications ............................................................. 4-30 Exhibit 4-32 Example Skip-Stop Pattern and Signing .............................................. 4-33 Exhibit 4-33 Bus Preferential Treatments Comparison............................................ 4-34 Exhibit 4-34 Typical Busway and HOV Lane Minimum Operating Thresholds.. 4-35Exhibit 4-35 General Planning Guidelines for Bus Preferential Treatments:
Uninterrupted Flow Facilities................................................................ 4-36 Exhibit 4-36 General Planning Guidelines on the Effects of Bus Preferential
Treatments: Uninterrupted Flow Facilities.......................................... 4-36 Exhibit 4-37 General Planning Guidelines for Bus Preferential Treatments:
Urban Streets ........................................................................................... 4-37 Exhibit 4-38 General Planning Guidelines for Bus Preferential Treatments:
Intersections ............................................................................................. 4-38 Exhibit 4-39 General Planning Guidelines on the Effects of Bus Preferential
Treatments: Intersections ....................................................................... 4-39 Exhibit 4-40 Planning-Level Bus Lane Service Volumes ......................................... 4-39 Exhibit 4-41 Maximum Bus Passenger Service Volumes for Planning Purposes. 4-40Exhibit 4-42 Illustrative Downtown Busway Capacities ......................................... 4-41 Exhibit 4-43 Factors Influencing Bus Capacity and Speed ...................................... 4-42 Exhibit 4-44 Typical Grade-Separated Busway Design Features ........................... 4-43 Exhibit 4-45 Illustrative Capacity Constraints After Exclusive Busway Section .. 4-44
Exhibit 4-46 Freeway HOV Lane with Off-Line Stop (Seattle) ............................... 4-46
Contents Page 4-iv Part 4/BUS TRANSIT CAPACITY

Transit Capacity and Quality of Service Manual—2nd Edition
Exhibit 4-47 Estimated Average Speeds of Buses Operating on Busways and Exclusive Freeway HOV Lanes (mph) ................................................. 4-46
Exhibit 4-48 Exclusive Bus Lane Types...................................................................... 4-47 Exhibit 4-49 Examples of Auto Turning Conflicts with Buses................................ 4-48 Exhibit 4-50 Right-Turn Vehicle Capacities for Planning Applications ................ 4-48 Exhibit 4-51 Bus Stop Location Factors, fl .................................................................. 4-49 Exhibit 4-52 Typical Values of Adjustment Factor, fk, for Availability of Adjacent
Lanes ......................................................................................................... 4-50 Exhibit 4-53 Values of Adjustment Factor, fk, for Type 2 Bus Lanes with Alternate
Two-Block Skip-Stops............................................................................. 4-50 Exhibit 4-54 Illustrative Bus Lane Vehicle Capacity: Non-Skip-Stop Operation.. 4-51Exhibit 4-55 Illustrative Bus Lane Vehicle Capacity: Skip-Stop Operation........... 4-52 Exhibit 4-56 Estimated Base Bus Running Time, tr (min/mi) ................................. 4-53 Exhibit 4-57 Estimated Base Bus Running Time Losses, tl (min/mi)..................... 4-53 Exhibit 4-58 Illustrative Skip-Stop Speed Adjustment Effects ................................ 4-54 Exhibit 4-59 Bus-Bus Interference Factor, fb............................................................... 4-55 Exhibit 4-60 Illustrative Bus-Bus Interference Factor Effects .................................. 4-55 Exhibit 4-61 Types of Mixed Traffic Bus Operations ............................................... 4-57 Exhibit 4-62 Illustrative Mixed Traffic Maximum Bus Vehicle Capacity .............. 4-58 Exhibit 4-63 Sample Passenger Service Time Data Collection Sheet...................... 4-94 Exhibit 4-64 Sample Dwell Time Data Collection Sheet .......................................... 4-95 Exhibit 4-65 Bus Stop Capacity with 400 veh/h in Curb Lane and Off-line
Stops........................................................................................................ 4-100 Exhibit 4-66 Bus Stop Capacity with 800 veh/h in Curb Lane and Off-line
Stops........................................................................................................ 4-101 Exhibit 4-67 Bus Stop Capacity with On-Line Stops .............................................. 4-102 Exhibit 4-68 Exclusive Lane Bus Capacity: Near-side Stops, Type 1 Lane.......... 4-103 Exhibit 4-69 Exclusive Lane Bus Capacity: Near-side Stops, Type 2 Lane.......... 4-104 Exhibit 4-70 Exclusive Lane Bus Capacity: Far-side Stops, Type 1 Lane............. 4-105 Exhibit 4-71 Exclusive Lane Bus Capacity: Far-side Stops, Type 2 Lane............. 4-106 Exhibit 4-72 Exclusive Lane Bus Capacity: Type 3 Lane........................................ 4-107 Exhibit 4-73 Mixed Traffic Bus Capacity: Type 1 Lane .......................................... 4-107 Exhibit 4-74 Mixed Traffic Bus Capacity: Type 2 Lane .......................................... 4-108
Part 4/BUS TRANSIT CAPACITY Page 4-v Contents

Transit Capacity and Quality of Service Manual—2nd Edition
This page is intentionally blank.
Contents Page 4-vi Part 4/BUS TRANSIT CAPACITY

Transit Capacity and Quality of Service Manual—2nd Edition
CHAPTER 1. BUS CAPACITY FUNDAMENTALS
OVERVIEW Bus capacity is a complex topic: it deals with the movement of both people and
vehicles, depends on the size of the buses used and how often they operate, and reflects the interaction between passenger traffic concentrations and vehicle flow. It also depends on the operating policy of the service provider, which normally specifies service frequencies and allowable passenger loadings. Ultimately, the capacities of bus routes, bus lanes, and bus terminals, in terms of persons carried, are generally limited by (1) the ability of stops or loading areas to pick up and discharge passengers, (2) the number of vehicles operated, and (3) the distribution of boardings and alightings along a route.
Part 4 of the Transit Capacity and Quality of Service Manual (TCQSM) presents methods for calculating bus capacity and speed for a variety of facility and operating types.
Organization of Part 4.
• Chapter 1 introduces the basic factors that determine bus capacity.
• Chapter 2 discusses transit preferential treatments and operating measures that influence bus performance.
• Chapter 3 presents planning applications that can be used to determine the effects of transit priority measures.
• Chapters 4 through 6 discuss busways, freeway HOV lanes, arterial street bus lanes, and operations in mixed traffic.
• Chapter 7 presents issues related to demand-responsive transportation.
• Chapter 8 contains the references used within this part of the manual.
• Chapter 9 presents example problems that apply Part 4 procedures to “real world” situations.
• Appendix A provides substitute exhibits in metric units for Part 4 exhibits that use U.S. customary units.
Exhibits also appearing in Appendix A are indicated by a margin note such as this.
• Appendix B provides a standardized procedure for collecting bus dwell time data in the field.
• Appendix C presents information of interest to users of the Highway Capacity Manual on determining bus effects on adjacent lane vehicle capacity.
• Appendix D provides planning-level graphs applying the bus stop and lane capacity procedures presented in this part of the TCQSM.
• Appendix E discusses the effects of bus bunching on bus capacity.
CAPACITY CALCULATION PROCESS Bus capacity is calculated for three key locations:
Loading Area Capacity
Bus Stop Capacity
Bus Facility Capacity
Loading Area Capacity
Bus Stop Capacity
Bus Facility Capacity
1. Bus loading areas (berths) are curbside spaces where a single bus can stop to load and unload passengers.
2. Bus stops are formed from one or more loading areas, depending on how many buses can use the stop simultaneously.
3. Bus facilities are roadways used by buses and may contain multiple bus stops along their length.
Bus stop capacity is dependent on the individual capacities of the loading areas that form the bus stop. Similarly, a bus facility’s capacity will be constrained by the
Part 4/BUS TRANSIT CAPACITY Page 4-1 Chapter 1—Bus Capacity Fundamentals

Transit Capacity and Quality of Service Manual—2nd Edition
capacity of the critical stop along the facility, which is typically the stop with the highest passenger volumes and the longest dwell time. Exhibit 4-1 shows the relationships of loading areas, stops, and facilities.
LL
SF
L = loading area, S = bus stop, F = bus facility
Bus Bus
LL
S
LLLL
SF
L = loading area, S = bus stop, F = bus facility
Bus Bus
LLLL
S
Exhibit 4-1 Bus Loading Areas, Stops, and Facilities
Loading Areas The bus capacity of a loading area is dependent on the following factors:
• Dwell time—the average amount of time a bus is stopped at the curb to serve passenger movements, including the time required to open and close the doors;
Dwell time plus clearance time equals the average time a given bus occupies a loading area.
• Clearance time—the minimum time required for one bus to accelerate out of and clear the loading area and the next bus to pull into the loading area, including any time spent waiting for a gap in traffic;
• Dwell time variability—the consistency (or lack thereof) of dwell times among buses using the loading area; and
Dwell time variability and failure rate account for longer-than-average dwells so that one bus typically does not delay the one behind it.
• Failure rate—the probability that one bus will arrive at a loading area, only to find another bus already occupying it.
The combination of dwell time and clearance time gives the average amount of time an individual bus occupies the loading area. The combination of dwell time variability and a design failure rate provides an additional margin of time to ensure that most buses will be able to immediately use the loading area upon arriving. Adding these two combinations together produces the minimum headway between buses required to avoid interference between buses. Dividing this headway into the number of seconds in an hour gives the number of buses per hour that can use the stop—the loading area capacity.
Bus Stops The bus capacity of a bus stop is based on the following:
• Number of loading areas provided—two loading areas will be able to accommodate more buses than a single loading area, but not necessarily two times as many;
• Loading area design—how the loading areas are designed determines how much extra capacity each additional loading area will provide; and
• Traffic control—traffic signals may constrain the number of buses that can leave (or enter) a stop during a given period of time. If a bus is ready to leave a stop, but a red traffic signal prevents it from doing so, the bus will occupy the stop longer, and the bus stop capacity will be lower as a result.
Traffic signals limit when buses are able to enter or exit stops located nearby, and thus they constrain capacity.
Chapter 1—Bus Capacity Fundamentals Page 4-2 Part 4/BUS TRANSIT CAPACITY

Transit Capacity and Quality of Service Manual—2nd Edition
Bus Facilities The capacity of an on-street bus facility is based on the following:
• Critical bus stop capacity—the bus stop with the lowest capacity along the facility will constrain how many buses can pass through it. This bus stop is usually the stop with the longest dwell time, but heavy right-turning traffic volumes at near-side bus stops or a traffic signal that provides only a short period of green time for the bus facility can also be constraints.
The bus stop with the lowest capacity—the “critical stop”—constrains facility capacity.
• Operational procedures—bus route design that spreads bus stopping activity over a group of stops (skip-stops), rather than having all buses stop at the same set of stops, can greatly increase the capacity of an on-street facility.
The capacity of freeway high-occupancy vehicle (HOV) lanes, where buses do not stop along the lanes, is generally not an issue. The number of buses that can use an HOV lane will be constrained by the capacity of a bus terminal or on-street facility before or after the lane. When an HOV lane is shared with a large number of other vehicles, the Highway Capacity Manual can be used to determine the total number of vehicles or passenger car equivalents that can use the lane before it becomes congested.
The number of buses that can use non-stop facilities such as HOV lanes is usually constrained by on-street facilities or off-street terminals elsewhere.
Person Capacity The maximum number of people that can be transported through the facility
during a given time period can be determined from the following:
• Bus capacity of the facility—the number of buses that can use the facility during a given period of time;
Once the maximum number of buses that can use a facility in a given time is known, the number of people that can be transported by those buses can be readily calculated.
• Maximum schedule load of the buses using the facility—the maximum number of people aboard each bus using the facility; and
• Passenger demand characteristics—not all of the offered capacity will be used, as passengers will arrive at uneven rates, and service should be designed so as not to pass up any passengers. A peak hour factor is used to reduce the theoretical capacity (i.e., the number of buses per hour multiplied by the number of people per bus) to a person capacity that can be achieved on a sustained basis day after day.
LOADING AREA BUS CAPACITY
Dwell Time The capacity of individual loading areas is fundamental to determining the
capacities of bus stops and facilities. In turn, the average dwell times at loading areas are fundamental to determining the capacities of those areas.
Dwell time is the most important component of loading area, bus stop, and facility capacity.
Dwell times may be governed by boarding demand (e.g., in the p.m. peak period when relatively empty buses arrive at a heavily used stop), by alighting demand (e.g., in the a.m. peak period at the same location), or by total interchanging passenger demand (e.g., at a major transfer point). In all cases, dwell time is proportional to the boarding and/or alighting volumes and the amount of time required to serve each passenger.
There are five main factors that influence dwell time. Two of these relate to passenger demand, while the other three relate to passenger service times:
• Passenger Demand and Loading. The number of people passing through the highest-volume door is a key factor in how long it will take for all passengers to be served. The proportion of alighting to boarding passengers through the busiest door also affects how long it takes all passenger movements to occur.
The highest-volume door generally determines how long it takes to serve all boarding or alighting passengers.
Part 4/BUS TRANSIT CAPACITY Page 4-3 Chapter 1—Bus Capacity Fundamentals

Transit Capacity and Quality of Service Manual—2nd Edition
Chapter 1—Bus Capacity Fundamentals Page 4-4 Part 4/BUS TRANSIT CAPACITY
• Bus Stop Spacing. The smaller the number of stops, the greater the number of passengers boarding at a given stop. A balance is required between providing too few stops, each with relatively high dwell times and relatively long passenger walk times, and providing too many stops (which reduce overall travel speeds due to the time lost in accelerating, decelerating, and possibly waiting for a traffic signal every time a stop is made).
• Fare Payment Procedures. The average time to pay a fare is a major influence on the time required to serve each boarding passenger. Some types of fare-payment procedures allow passengers to board through more than one door at busy stops, thus allowing all passengers to be served more quickly.
Fare payment method strongly influences dwell time. Passengers stopping to ask bus operators questions also impacts dwell time, particularly for tourist-oriented services. Providing information at stops about how to ride and places to go can help.
• Vehicle Types. Having to ascend or descend steps while getting on and off the bus increases the amount of time required to serve each passenger.
• In-Vehicle Circulation. When standees are present on a bus, it takes more time for boarding passengers to clear the farebox area, as other passengers must move to the back of the bus.
Dwell time can also be affected by the time required for wheelchair loading and securement and for bicyclists to use bus-mounted bicycle racks. However, unless these activities occur regularly at a given stop, they can be treated as random events that are addressed by dwell time variability (i.e., a wheelchair loading will result in a longer-than-average dwell time when it occurs, but these events happen rarely).
Wheelchair and bicycle boarding times may also need to be considered when calculating dwell time, but are accounted for by dwell time variability when they occur infrequently.
Combinations of these factors can substantially reduce dwell times. In the late 1990s, Denver’s 16th Street Mall shuttle operation maintained 75-second peak headways with scheduled 12.5-second dwell times, despite high peak passenger loads on its 70-passenger buses.1 This was accomplished through a combination of fare-free service, few seats (passenger travel distances are short), low-floor buses, and three double-stream doors on the buses.
A double-stream (two-channel) door is wide enough to allow two passengers to use it at the same time.
Estimating Dwell Time Three methods can be used to estimate bus dwell times: 1. Field measurements—best for evaluating an existing bus route; 2. Default values—suitable for future planning when reliable estimates of future
passenger boarding and alighting volumes are unavailable; and 3. Calculation—suitable for estimating dwell times when passenger boarding
and alighting counts or estimates are available.
Method 1: Field Measurements The most accurate way to determine bus dwell times at a stop is to measure them
directly. An average (mean) dwell time and its standard deviation can be determined from a series of observations. Appendix B presents a standardized methodology for measuring bus dwell times in the field.
Best for evaluating existing bus routes. See Appendix B for details.
Method 2: Default Values If field data or passenger counts are unavailable for a bus stop, the following
representative values can be used to estimate dwell time at the critical (busiest) stop: 60 seconds at a downtown stop, transit center, major on-line transfer point, or major park-and-ride stop; 30 seconds at a major outlying stop; and 15 seconds at a typical outlying stop.(R26)
Suitable for future planning when reliable passenger estimates are unavailable.
1 Denver’s Regional Transit District (RTD) began using 116-passenger hybrid electric/
compressed natural gas buses in 1999 to accommodate growing passenger demand for this service.

Transit Capacity and Quality of Service Manual—2nd Edition
Method 3: Calculation This method requires that passenger counts or estimates be available,
categorized by the number of boarding and alighting passengers. Suitable when passenger counts or estimates are available.
Step 1: Obtain hourly passenger volume estimates. These estimates are required only for the highest-volume stops. When skip-stop operations are used (see Chapter 2), estimates are needed for the highest-volume stops in each skip-stop sequence.
Step 2: Adjust hourly passenger volumes for peak passenger volumes. Equation 4-1 shows the peak hour factor (PHF) calculation method. Typical peak hour factors range from 0.60 to 0.95 for transit lines.(R18,R40) In the absence of other information, 0.75 may be used as a default PHF for bus service where the schedule is not adjusted to accommodate peaks in demand (e.g., when clock headways are used). When headways are adjusted to serve predictable peaks in demand, a PHF of 0.85 may be used as a default. A PHF close to 1.0 may well indicate system overload (underservicing) and reveal the potential for more service. If buses operate at longer than 15-minute headways, the denominator of Equation 4-1 should be adjusted appropriately (e.g., 3P20 for 20-minute headways). Equation 4-2 adjusts hourly passenger volumes to reflect peak-within-the-peak conditions.
Peak hour factors are used (1) to develop equivalent hourly volumes based on peak 15-minute demands, and (2) adjust person capacities to reflect variations in passenger demand over the course of an hour.
15
h
PPPHF
4= Equation 4-1
)(4 PHFPP h
15 = Equation 4-2
where: PHF = peak hour factor; Peak hour factors range from 0.25
(all passenger demand occurs during a single 15-minute period in an hour) to 1.00 (demand is constant throughout the hour).
Ph = passenger volume during the peak hour (p); and P15 = passenger volume during the peak 15 minutes (p). Step 3: Determine the base passenger service time. Exhibit 4-2 can be used to estimate
these times for typical situations where only one direction of passengers uses a door at a time and all passengers board through a single door. When passengers may board through multiple doors (for example, free shuttles, proof-of-payment or pay-on-exit fare collection, or boarding from a fare-paid area), Exhibit 4-3 can be used instead to estimate these times. Note that having two doors available for boarding does not halve the average passenger boarding time, although it provides a significant improvement.
Exhibit 4-2 Passenger Service Times with Single-Channel Passenger Movement
Passenger Service Time (s/p)Situation Observed Range Suggested Default
BOARDING Pre-payment* 2.25-2.75 2.5 Single ticket or token 3.4-3.6 3.5 Exact change 3.6-4.3 4.0 Swipe or dip card 4.2 4.2 Smart card 3.0-3.7 3.5
ALIGHTING Front door 2.6-3.7 3.3 Rear door 1.4-2.7 2.1
Comparing relative service times of different fare payment methods can be used to estimate the dwell time impacts of changing the payment method.
*includes no fare, bus pass, free transfer, and pay-on-exit Add 0.5 s/p to boarding times when standees are present. Subtract 0.5 s/p from boarding times and alighting times on low-floor buses.
Part 4/BUS TRANSIT CAPACITY Page 4-5 Chapter 1—Bus Capacity Fundamentals

Transit Capacity and Quality of Service Manual—2nd Edition
Exhibit 4-3 Passenger Service Times with Multiple-Channel Passenger Movement(R5,R20,R23,R24)
Available Default Passenger Service Time (s/p)Door Channels Boarding* Front Alighting Rear Alighting
1 2.5 3.3 2.1 2 1.5 1.8 1.2 3 1.1 1.5 0.9 4 0.9 1.1 0.7 6 0.6 0.7 0.5
*Assumes no on-board fare payment required Increase boarding times by 20% when standees are present. For low-floor buses, reduce boarding times by
20%, front alighting times by 15%, and rear alighting times by 25%. Step 4: Adjust the passenger service times for heavy two-flow through a single door
channel. When 25 to 50% of the passenger flow through a single door channel is in the opposite direction of the main flow of passengers, increase both the boarding and alighting passenger service times by 20% (0.5 seconds for a single door channel) to account for passenger congestion at the door.(R40)
Passenger service times increase when significant two-way passenger flow occurs through a door.
Step 5: Calculate the dwell time. The dwell time is the time required to serve passengers at the busiest door, plus the time required to open and close the doors. A value of 2 to 5 seconds for door opening and closing is reasonable for normal operations.(R5,R25)
ocbbaad ttPtPt ++= Equation 4-3
where: td = average dwell time (s); Pa = alighting passengers per bus through the busiest door (p); ta = alighting passenger service time (s/p); Pb = boarding passengers per bus through the busiest door (p); tb = boarding passenger service time (s/p); and toc = door opening and closing time (s).
Impact of Wheelchair Movements on Dwell Time All new transit buses in the United States are equipped with wheelchair lifts or
ramps. When a lift is in use, the door is blocked from use by other passengers. Typical wheelchair lift cycle times are 60 to 200 seconds, while the ramps used in low-floor buses reduce the cycle times to 30 to 60 seconds (including the time required to secure the wheelchair inside the bus). The higher cycle times relate to a small minority of inexperienced or severely disadvantaged users. When wheelchair users regularly use a particular bus stop, the wheelchair lift time should be incorporated into the average dwell time. When wheelchair movements are rare, their impact on dwell time is accounted for by dwell time variability, discussed later in this chapter.
Impact of Bicycles on Dwell Time A growing number of transit systems provide folding bicycle racks on buses.
When no bicycles are loaded, the racks typically fold upright against the front of the bus. (Some systems also use rear-mounted racks, and a very few allow bikes on board on certain long-distance routes.) When bicycles are loaded, passengers deploy the bicycle rack and load their bicycles into one of the available loading positions (typically two are provided). The process takes approximately 20 to 30 seconds. When bicycle rack usage at a stop is frequent enough to warrant special treatment, average bus dwell time is determined using the greater of the passenger service time or the bicycle loading/unloading time.
Chapter 1—Bus Capacity Fundamentals Page 4-6 Part 4/BUS TRANSIT CAPACITY
Transit Capacity and Quality of Service Manual—2nd Edition
Clearance Time Once a bus closes its doors and prepares to depart a stop, there is an additional
period of time, known as the clearance time, when the loading area is not yet available for use by the next bus. Part of this time is fixed, consisting of the time for a bus to start up and travel its own length, clearing the stop. When buses stop in the traffic lane (on-line), this is the only component of clearance time.
The time required for a bus to start up and travel its own length is fixed; re-entry delay is dependent on traffic volumes in the curb lane.
When buses stop out of traffic (off-line), there is another component to clearance time: the time required for a suitable gap in traffic to allow the bus to re-enter the street. This re-entry delay depends on the traffic volume in the curb lane and increases as traffic volumes increase. The delay also depends on the influence of upstream traffic signals, which may create long gaps in traffic, followed by periods of time when a constant stream of cars passes the stop. Some states have laws requiring motorists to yield to buses re-entering a roadway; depending on how well motorists comply with these laws, the re-entry delay can be reduced or even eliminated.
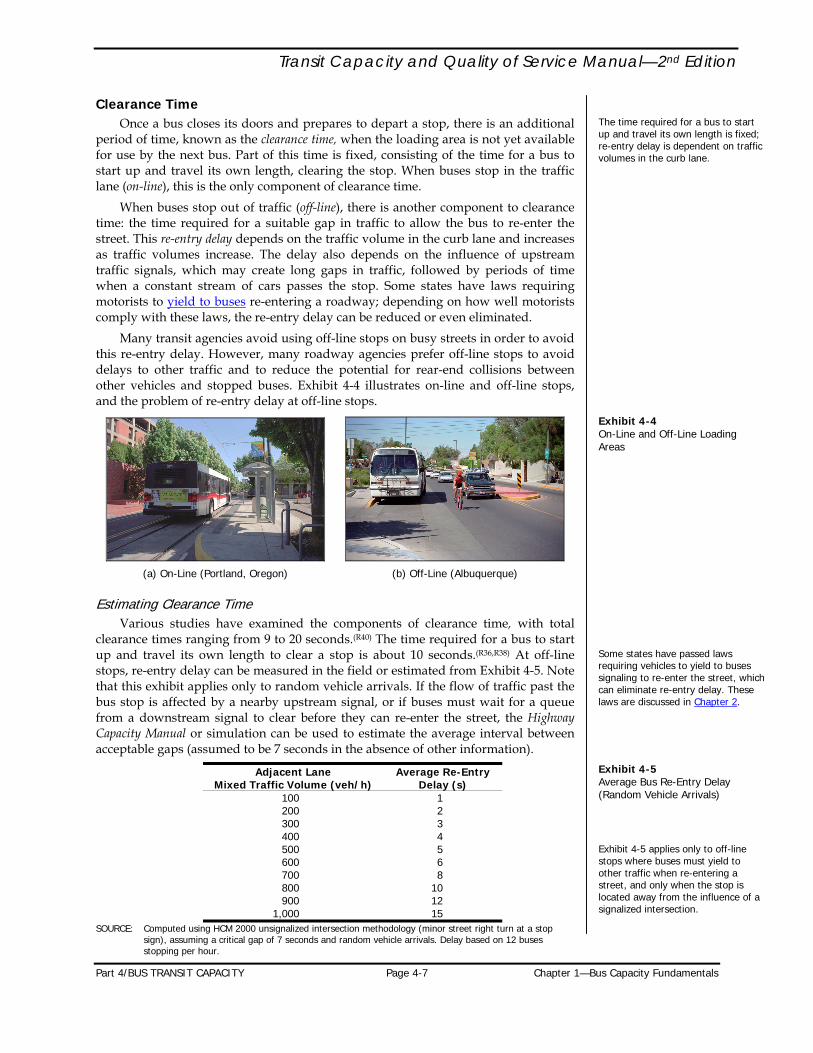
Many transit agencies avoid using off-line stops on busy streets in order to avoid this re-entry delay. However, many roadway agencies prefer off-line stops to avoid delays to other traffic and to reduce the potential for rear-end collisions between other vehicles and stopped buses. Exhibit 4-4 illustrates on-line and off-line stops, and the problem of re-entry delay at off-line stops.
Exhibit 4-4 On-Line and Off-Line Loading Areas
(a) On-Line (Portland, Oregon) (b) Off-Line (Albuquerque)
Estimating Clearance Time Various studies have examined the components of clearance time, with total
clearance times ranging from 9 to 20 seconds.(R40) The time required for a bus to start up and travel its own length to clear a stop is about 10 seconds.(R36,R38) At off-line stops, re-entry delay can be measured in the field or estimated from Exhibit 4-5. Note that this exhibit applies only to random vehicle arrivals. If the flow of traffic past the bus stop is affected by a nearby upstream signal, or if buses must wait for a queue from a downstream signal to clear before they can re-enter the street, the Highway Capacity Manual or simulation can be used to estimate the average interval between acceptable gaps (assumed to be 7 seconds in the absence of other information).
Some states have passed laws requiring vehicles to yield to buses signaling to re-enter the street, which can eliminate re-entry delay. These laws are discussed in Chapter 2.
Exhibit 4-5 Average Bus Re-Entry Delay (Random Vehicle Arrivals)
Adjacent Lane Mixed Traffic Volume (veh/h)
Average Re-Entry Delay (s)
100 1 200 2 300 3 400 4 500 5 600 6 700 8 800 10 900 12
1,000 15
Exhibit 4-5 applies only to off-line stops where buses must yield to other traffic when re-entering a street, and only when the stop is located away from the influence of a signalized intersection.
SOURCE: Computed using HCM 2000 unsignalized intersection methodology (minor street right turn at a stop sign), assuming a critical gap of 7 seconds and random vehicle arrivals. Delay based on 12 buses stopping per hour.
Part 4/BUS TRANSIT CAPACITY Page 4-7 Chapter 1—Bus Capacity Fundamentals

Transit Capacity and Quality of Service Manual—2nd Edition
Dwell Time Variability Not all buses stop for the same amount of time at a stop, depending on
fluctuations in passenger demand between buses and between routes. The effect of variability in bus dwell times on bus capacity is reflected by the coefficient of variation of dwell times (cv), which is the standard deviation of dwell times divided by the average (mean) dwell time. When cv is zero, all dwell times are the same. When cv is 1.0, the standard deviation of dwell times is as large as the mean dwell time, meaning that approximately one in three buses will have a dwell time twice as large as the average dwell time.
Coefficient of variation of dwell times.
Based on field observations of bus dwell times in several U.S. cities,(R36) cv typically ranges from 0.4 to 0.8, with 0.6 recommended as an appropriate value in the absence of field data. Dwell time variability is influenced by the same factors that affect dwell time.
If a series of dwell time observations were to be plotted, they would form a normal distribution similar to the one shown to the left. A narrower distribution with a higher peak would indicate less variability, while a wider distribution with a lower peak would indicate greater variability.
Standard normal distribution.
P(t)
t Z0 Bus loading area capacity is maximized when a bus is available to move into a
loading area as soon as the previous bus vacates it. However, this condition is undesirable for several reasons: (1) bus travel speeds are reduced, due to the time spent waiting for a loading area to become available, (2) bus schedule reliability suffers because of the additional delays, and (3) buses block traffic in the street for longer periods of time. Consequently, bus capacity analysis incorporates the concept of a failure rate that sets how often a bus should arrive at a stop only to find all loading areas occupied.
Failure rate.
The failure rate is used in combination with dwell time variability and the average dwell time to provide an operating margin that is added to the dwell time and the clearance time to make sure that failures do not happen more often than the desired rate. In effect, the operating margin is the maximum amount of time that an individual bus dwell time can exceed the average without creating the likelihood of a bus stop failure when the number of buses scheduled to use the stop approaches its capacity. The lower the desired failure rate, the greater the operating margin and schedule reliability, and the lower the loading area capacity. Conversely, the greater the allowed failure rate, the lower the operating margin and schedule reliability, and the greater the loading area capacity.
Operating margin.
From statistics, the area under and to the right of a given point Z on a normal distribution curve (such as the shaded area in the diagram above) represents the probability that any given bus’s dwell time will be longer than that amount. The dwell time value ti corresponding to Z is incorporated in Equation 4-4:
Standard normal variable Z.
stt
stZ diom −
== Equation 4-4
where: Z = standard normal variable corresponding to a desired failure rate; s = standard deviation of dwell times; tom = operating margin (s); Probability of bus stop failure.
0%
100%
0 Z
0%
100%
0
P(bu
s st
op f
ailu
re)
t
P(t<
t i)
td = average dwell time (s); and ti = dwell time value that will not be exceeded more often than the desired
failure rate.
Rearranging Equation 4-4 provides the operating margin required to achieve a particular design failure rate, when a loading area operates close to capacity:
Chapter 1—Bus Capacity Fundamentals Page 4-8 Part 4/BUS TRANSIT CAPACITY

Transit Capacity and Quality of Service Manual—2nd Edition
ZtcsZt dvom == Equation 4-5
where: cv = coefficient of variation of dwell times. Exhibit 4-6 provides values for Z corresponding to different failure rates.
Exhibit 4-6 Values of Z Associated with Given Failure Rates(R36)
Failure Rate Z 1.0% 2.330 2.5% 1.960 5.0% 1.645 7.5% 1.440
10.0% 1.280 15.0% 1.040 20.0% 0.840 25.0% 0.675 30.0% 0.525 50.0% 0.000
In downtown areas, design failure rates of 7.5 to 15% are recommended for
estimating capacity. This represents a trade-off between maintaining bus travel speeds and achieving the higher capacities required in downtown areas. The upper limit, 15%, represents bus stop failure (queues forming behind the bus stop) for about 10 minutes out of the hour. It also represents the point where bus travel speeds begin to drop rapidly. Simulation indicates that bus speeds at a 15% failure rate are about 20% lower than when scheduled bus volumes are well below capacity.(R36)
Suggested design failure rates.
Bus travel speeds drop rapidly above a 15% failure rate.
Outside downtown areas, a design failure rate of 2.5% is recommended whenever possible, particularly when off-line stops are provided, as queues will block a travel lane whenever a bus stop failure occurs. However, failure rates up to 7.5% are acceptable.(R36)
Capacity is effectively reached at a failure rate of 25%. Mathematically, capacity would be maximized at a 50% failure rate; however, achieving this would require precise control of bus headways, with the only variable being the passenger boarding volumes on a given bus, something not likely to be achieved in practice. More likely, bus interference would be so prevalent that not all of the scheduled buses would be able to serve a given stop during the course of an hour. Further, bus speeds would be extremely low at a 50% failure rate, resulting in poor service quality for passengers.
Capacity is maximized at a 25% failure rate. Lower failure rates are recommended to balance capacity and schedule reliability.
Exhibit 4-7 illustrates the relationships between failure rate, operating margin, and loading area bus capacity.
Exhibit 4-7 Illustrative Relationships Between Failure Rate, Operating Margin, and Loading Area Bus Capacity
0
5
10
15
20
25
30
0% 5% 10% 15% 20% 25%
Failure Rate
Load
ing
Are
a C
apac
ity
(bus
/h)
0
10
20
30
40
50
60
70
80
90
Ope
rati
ng M
argi
n (
s)
Capacity Operating MarginAssumes 60-second dwell time and60% coefficient of variation
Part 4/BUS TRANSIT CAPACITY Page 4-9 Chapter 1—Bus Capacity Fundamentals

Transit Capacity and Quality of Service Manual—2nd Edition
Traffic Signal Timing A traffic signal located in the vicinity of a bus stop and its loading areas will
serve to meter the number of buses that can enter or exit the stop. For example, at a far-side stop (or a mid-block stop downstream from a traffic signal), buses can only enter the stop during the portion of the hour when the signal is green for the street that the stop is located on. The lower the green time provided to the street, the lower the capacity. Similarly, at a near-side stop, a bus may finish loading passengers but have to wait for the signal to turn green before leaving the stop. As a result, the bus occupies the stop longer than if it would have if it could have left immediately, and capacity is lower as a result. Due to the nature of bus operations, shorter cycle lengths offer more opportunities for buses to move through the signal. At unsignalized locations well away from the influence of upstream traffic signals, buses can enter and exit stops immediately, subject to traffic conditions (accounted for by clearance time), with no impact on capacity.
The effect of traffic signals on capacity is accounted for by the green time ratio (g/C ratio), which is the average amount of green time for the traffic movement used by buses, divided by the length of the traffic signal cycle (the time required to serve all movements). For example, if traffic moving parallel to a particular bus stop receives a green signal for an average of 54 seconds, and the total cycle length is 120 seconds, the g/C ratio at that stop is 54 divided by 120, or 0.45. The g/C ratio at unsignalized locations well away from the influence of traffic signals is 1.00, because bus access to the stop or its loading areas is not metered by a signal.
The g/C ratio for a given traffic signal approach will depend mainly on the traffic volumes on that approach, the presence or absence of protected left-turn phasing (i.e., left-turn arrows), and policy decisions on which movements to prioritize. The g/C ratio is 1.00 at unsignalized locations well away from the influence of upstream traffic signals.
As will be seen below, the g/C ratio affects the capacity equation in two ways. First, the equation numerator is adjusted—it becomes 3,600(g/C)—reflecting the portion of the hour when buses can enter far-side or mid-block stops, or leave near-side stops. Second, the dwell time in the equation denominator is adjusted—it becomes td(g/C)—reflecting the portion of dwell occurring during the street’s green phase. Dwell time that occurs during the red phase does not impact capacity, as the bus would not have been able to enter or leave the stop during the red phase. The net effect is that capacity is increased as the amount of green time provided is increased.
Calculation Procedure The capacity of a loading area in buses per hour, Bl, is:(R36)
dvdcomdcl tZcCgtt
CgtCgtt
CgB++
=++
=)/(
)/(600,3)/(
)/(600,3 Equation 4-6
where: Bl = loading area bus capacity (bus/h); 3,600 = number of seconds in 1 hour; g/C = green time ratio (the ratio of effective green time to total traffic signal
cycle length, equals 1.0 for unsignalized streets and bus facilities); tc = clearance time (s); td = average (mean) dwell time (s); tom = operating margin (s); Z = standard normal variable corresponding to a desired failure rate; and cv = coefficient of variation of dwell times. Exhibit 4-8 presents the estimated maximum number of buses that can use a bus
loading area, based on a 25% failure rate, a 60% coefficient of variation of dwell times, no traffic signal in the vicinity, and the combinations of dwell times and clearance times shown. Planning graphs presenting results based on various assumptions are provided in Appendix D.
Chapter 1—Bus Capacity Fundamentals Page 4-10 Part 4/BUS TRANSIT CAPACITY

Transit Capacity and Quality of Service Manual—2nd Edition
Exhibit 4-8 Estimated Maximum Capacity of Loading Areas (bus/h)
Clearance TimeDwell Time (s) 10 s 15 s
15 116 100 30 69 63 45 49 46 60 38 36 75 31 30 90 26 25 105 23 22 120 20 20
These are maximum capacities. The planning graphs in Appendix D show lower design capacities based on the recommended failure rate for different locations. NOTE: Assumes 25% failure rate, 60% coefficient of variation of dwell times, and g/C = 1.0.
BUS STOP VEHICLE CAPACITY
Design and Location Considerations A bus stop is a location where buses stop to load and unload passengers and
consists of one or more loading areas. Bus stop vehicle capacity is related to the vehicle capacity of the individual loading areas at the stop, the number of loading areas provided, and the design of the loading areas. In addition, nearby traffic signals may meter the number of buses into or out of the stop.
The number of loading areas provided should be sufficient to accommodate the number of buses scheduled to use the stop. However, block lengths, driveway locations, and/or the need to maintain on-street parking may constrain the size of the bus stop. In addition, having more than three loading areas at a stop can potentially be confusing to passengers, as they will not know where to wait for a bus, and can lead to longer dwell times, when passengers must walk to the back of the queue of buses to board.
External factors and passenger needs may constrain the size of bus stops.
Off-line bus stops (i.e., where the bus stops out of the flow of traffic) provide a higher bus capacity relative to on-line stops, when four or more loading areas are provided. On-line bus stops provide a higher bus capacity when one or two loading areas are provided. The two types of stops provide similar capacities when three loading areas are provided. Because of the delays incurred when buses try to merge back into traffic and the cumulative effect of those delays on running speeds and travel time, many agencies tend to avoid using off-line stops, except when the speed limit on the street is relatively high (e.g., greater than 40 to 45 mph or 60 to 70 km/h).
Off-line bus stops trade potentially higher capacity for potentially greater delays.
On-street bus stops are typically located curbside in one of three locations: (1) near-side, where the bus stops immediately prior to an intersection, (2) far-side, where the bus stops immediately after an intersection, and (3) mid-block, where the bus stops in the middle of the block between intersections. Under certain circumstances, such as when buses share a stop with streetcars running in the center of the street, or when a median busway exists, a bus stop may be located on a boarding island within the street rather than curbside. Boarding islands are discussed further in Chapter 2. Exhibit 4-9 depicts typical on-street bus stop locations.
The three typical on-street bus stop locations are near-side, far-side, and mid-block.
Near-Side
Bus Bus Bus
Mid-Block Far-SideNear-Side
BusBus BusBus BusBus
Mid-Block Far-Side
Exhibit 4-9 On-Street Bus Stop Locations
Part 4/BUS TRANSIT CAPACITY Page 4-11 Chapter 1—Bus Capacity Fundamentals
Transit Capacity and Quality of Service Manual—2nd Edition
Chapter 1—Bus Capacity Fundamentals Page 4-12 Part 4/BUS TRANSIT CAPACITY
Freeway bus stops. Special bus stops are sometimes located along freeway rights-of-way, usually at
interchanges or on parallel frontage roads. Examples include stops in Marin County, California, and in Seattle, where they are known as “flyer stops.” These stops are used to reduce bus travel times by eliminating delays associated with exiting and re-entering freeways. Freeway stops should be located away from the main travel lanes and adequate acceleration and deceleration lanes should be provided. To be successful, attractive and well-designed pedestrian access to the stop is essential.(R7)
Off-street bus stops, such as transit centers and intermodal terminals, are often designed based on factors other than capacity, including accommodating driver layovers and separating a large number of routes so passengers can easily find their desired buses. Part 7 describes off-street bus stop design in more detail.
Off-street bus stop design is discussed in Part 7.
Bus stop location influences vehicle capacity, particularly when other vehicles can make right turns from the curb lane (which is typical, except for certain kinds of exclusive bus lanes and when a one-way street grid is used). Far-side stops have the least effect on capacity (as long as buses are able to avoid right-turn queues on the approach to the intersection), followed by mid-block stops, and near-side stops.
Far-side stops have the most beneficial effect on bus stop vehicle capacity, but other factors must also be considered when siting bus stops.
However, vehicle capacity is not the only factor which must be considered when selecting a bus stop location. Potential conflicts with other vehicles operating on the street, transfer opportunities, passenger walking distances, locations of passenger generators, signal timing, driveway locations, physical obstructions, and the potential for implementing transit preferential measures must also be considered.
For example, near-side stops are often preferable when curb parking is allowed, since buses may use the intersection area—where cars would not be parking in any event—to re-enter the moving traffic lane. Near-side stops are desirable where buses make a right turn, while far-side stops are desirable where buses make left turns. At intersections with one-way streets, both traffic and transfer opportunities may need to be considered. If traffic on the one-way street moves from left to right, for example, right-turning traffic volumes might suggest a far-side stop, while providing a convenient transfer to routes on the cross street might suggest a near-side stop.
Mid-block stops are typically only used at major passenger generators or where insufficient space exists at adjacent intersections.(R7) How passengers will cross the street to get to or from a mid-block bus stop must be carefully considered.
Exhibit 4-10 compares the advantages and disadvantages of each kind of bus stop location. Additional guidelines for the spacing, location, and geometric design of bus stops are given in TCRP Report 19.(R43) These guidelines must be carefully applied to ensure both good traffic and transit operations.
Bus Stop Effectiveness It seems logical that the more loading areas that are available at a bus stop, the
greater the bus stop’s capacity will be, because more buses will be able to load and unload passengers simultaneously. However, some designs are more efficient than others at adding capacity.
Off-street loading areas fall into the four general categories depicted in Exhibit 4-11: linear, sawtooth, drive-through, and angle. The latter three categories are non-linear loading areas, and their designs allow buses to pull in and out of loading areas independently of each other. Non-linear designs are fully effective: doubling the number of loading areas doubles the stop’s total bus capacity. The full effectiveness results from buses being able to move independently of each other. In addition, buses are typically assigned to a particular loading area when non-linear designs are used, and there is no delay incurred with passengers walking down the line of buses when their bus arrives behind several others. Non-linear designs are rarely seen at on-street locations, except at on-street transit centers.

Transit Capacity and Quality of Service Manual—2nd Edition
Exhibit 4-10 On-Street Bus Stop Location Comparison(R43)
Location Advantages Disadvantages Far-Side • Minimizes conflicts between right-
turning vehicles and buses • Provides additional right-turn
capacity by making curb lane available for traffic.
• Minimizes sight distance problems on intersection approaches
• May encourage pedestrians to cross behind the bus, depending on distance from intersection
• Creates shorter deceleration distances for buses, since the intersection can be used to decelerate
• Buses can take advantage of gaps in traffic flow created at signalized intersections
• Facilitates bus signal priority operation, as buses can pass through intersection before stopping
• Could result in traffic queued into intersection when a bus stops in the travel lane
• May obscure sight distance for crossing vehicles
• May increase sight distance problems for crossing pedestrians
• Can cause a bus to stop far side after stopping for a red light, interfering with both bus operations and all other traffic
• May increase the number of rear-end crashes since drivers may not expect buses to stop again after stopping at a red light
Near-Side • Minimizes interferences when traffic is heavy on the far side of the intersection
• Allows passengers to access buses close to crosswalk
• Intersection width available for bus to pull away from the curb
• Eliminates potential for double stopping
• Allows passengers to board and alight while bus stopped for red light
• Allows driver to look for oncoming traffic, including other buses with potential passengers
• Increases conflicts with right-turning vehicles
• May result in stopped buses obscuring curbside traffic control devices and crossing pedestrians
• May cause sight distance to be obscured for side street vehicles stopped to the right of the bus
• Increases sight distance problems for crossing pedestrians
• Complicates bus signal priority operation, may reduce effectiveness or require a special queue-jump signal if the stop is located in the parking lane or a right-turn lane
Mid-Block • Minimizes sight distance problems for vehicles and pedestrians
• May result in passenger waiting areas experiencing less pedestrian congestion.
• Requires additional distance for no-parking restrictions
• Encourages passengers to cross street mid-block (jaywalking)
• Increases walking distance for passengers crossing at intersections
Advantages and disadvantages of near-side, far-side, and mid-block stops.
Linear
Drive-Through Angle
BusBus Bus
Bus Bus
Sawtooth
BusBus
BusBus
BusBus
Linear
Drive-Through Angle
BusBusBusBus BusBus
BusBus BusBus
Sawtooth
BusBus
BusBus
BusBus
BusBus
BusBus
BusBus
Exhibit 4-11 Bus Stop Design Types
Part 4/BUS TRANSIT CAPACITY Page 4-13 Chapter 1—Bus Capacity Fundamentals

Transit Capacity and Quality of Service Manual—2nd Edition
The vast majority of on-street stops are linear stops, where the first bus to arrive occupies the first loading area, the second bus occupies the second loading area, and so on. Each additional linear loading area provided at a stop will be less effective than the one before it for three reasons:
Linear bus stops are partially effective—each additional loading area adds less capacity than the loading area before it.
1. The rear loading areas will be used less often than the first loading area. 2. Not knowing which loading area their bus will stop at, passengers may have
to walk down the line of buses to get to a bus that stops at one of the rear loading areas. This walking takes more time than if the bus stopped where the passengers were already waiting. As a result, for the same boarding volume, the dwell time of buses using the rear loading areas will be longer than the dwell time of buses using the front loading areas.
3. Depending on how closely buses stop behind the bus in front, and the buses’ ability to pass each other, a bus may not be able to leave its loading area until the bus in front of it departs.
The incremental increase in capacity provided by each additional loading area at a bus stop depends on whether the loading areas are located on-line or off-line, as well as on the arrival characteristics of the buses using the stop. Field observations indicate that linear loading areas are used more efficiently when buses enter and exit them as platoons. These are groups of 2 to 3 buses with similar dwell times (or, at least, dwell times short enough to be completed by the time a traffic signal turns green) that travel down the street together. Platoons can be formed by upstream traffic signals or by intentionally scheduling groups of buses to leave the start of a route together. (This requires a staging area near the locations where most passengers will board.)
Bus platoons.
Exhibit 4-12 provides efficiency factors for off-line loading areas, on-line loading areas used by platooned buses, and on-line loading areas used by randomly arriving buses. The off-line loading area efficiency factors given in Exhibit 4-12 are based on experience at the Port Authority of New York and New Jersey’s Midtown Bus Terminal.(R27) The on-line loading efficiency factors are based on simulation(R37) and European experience.(R22) The exhibit suggests that four or five on-line linear loading areas have the equivalent effectiveness of no more than three loading areas. Note that to provide two “effective” on-line loading areas, three physical loading areas would need to be provided, since partial loading areas are never built. Once again, it should be noted that Exhibit 4-12 applies only to linear loading areas. All other types of multiple loading areas are 100% efficient—the number of effective loading areas equals the number of physical loading areas.
Sawtooth and other non-linear designs are more effective than linear loading areas when four or five loading areas are required.
Exhibit 4-12 Efficiency of Multiple Linear Loading Areas at Bus Stops(R25,R27,R28)
On-Line Loading Areas Off-Line Loading Areas Random Arrivals Platooned Arrivals All Arrivals Cumulative Cumulative Cumulative
Loading Area #
Efficiency %
# of Effective Loading Areas
Efficiency %
# of Effective Loading Areas
Efficiency %
# of Effective Loading Areas
1 100 1.00 100 1.00 100 1.00 2 75 1.75 85 1.85 85 1.85 3 70 2.45 80 2.65 80 2.65 4 20 2.65 25 2.90 65 3.25 5 10 2.75 10 3.00 50 3.75
NOTE: On-line values assume that buses do not overtake each other.
Exhibit 4-13 provides an illustration of the diminishing effect on total bus stop capacity of adding additional linear loading areas. It shows on-line bus stop capacity for selected dwell times and g/C ratios, based on a 10-second clearance time and random arrivals. Increasing the number of linear loading areas has a much smaller effect on changes in capacity than reducing dwell times. Note that for dwell times greater than 60 seconds, the differences between a g/C of 0.5 and 1.0 are small.
Capacity is added more effectively by decreasing average dwell times than by adding linear loading areas.
Chapter 1—Bus Capacity Fundamentals Page 4-14 Part 4/BUS TRANSIT CAPACITY

Transit Capacity and Quality of Service Manual—2nd Edition
0
20
40
60
80
100
120
140
160
180
200
1 2 3 4 5
Number of Linear On-Line Loading Areas
Bu
s S
top
Cap
acit
y (b
us/
h)
30-s dwell, g/C = 1.030-s dwell, g/C = 0.560-s dwell, g/C = 1.060-s dwell, g/C = 0.5120-s dwell, g/C = 1.0120-s dwell, g/C = 0.5
Exhibit 4-13 Relative Contributions of Dwell Time, g/C Ratio, and Number of Loading Areas to Bus Stop Capacity
NOTE: Based on 10-second clearance time, 25% failure rate, 60% coefficient of variation of dwell times, and random bus arrivals at on-line stops.
Calculation Procedure The capacity of a bus stop in buses per hour, Bs, is:(R36)
dvdclels tZcCgtt
CgBNB++
==)/(
)/(600,3 Equation 4-7
where: Bs = bus stop bus capacity (bus/h); Bl = individual loading area bus capacity (bus/h); Nel = number of effective loading areas, from Exhibit 4-12; 3,600 = number of seconds in 1 hour; g/C = green time ratio (the ratio of effective green time to total traffic signal
cycle length, equals 1.0 for unsignalized streets and bus facilities); tc = clearance time (s); td = average (mean) dwell time (s); Z = standard normal variable corresponding to a desired failure rate; and cv = coefficient of variation of dwell times.
Exhibit 4-14 provides estimated maximum capacities of on-line linear bus stops, for various numbers of loading areas, dwell times, and g/C ratios. Planning graphs showing bus stop capacities for other situations are provided in Appendix D.
Number of On-Line Linear Loading AreasDwell 1 2 3 4 5 Time g/C g/C g/C g/C g/C g/C g/C g/C g/C g/C (s) 0.50 1.00 0.50 1.00 0.50 1.00 0.50 1.00 0.50 1.00 30 48 69 84 120 118 169 128 182 133 189 60 27 38 48 66 68 93 74 101 76 104 90 19 26 34 46 48 64 52 69 54 72 120 15 20 26 35 37 49 40 53 41 55
Exhibit 4-14 Estimated Maximum Capacity of On-Line Linear Bus Stops (bus/h)
NOTE: Assumes 10-second clearance time, 25% failure rate, 60% coefficient of variation of dwell times, and random bus arrivals. To obtain the vehicle capacity of non-linear on-line bus stops, multiply the one-loading-area values shown by the number of loading areas provided.
Part 4/BUS TRANSIT CAPACITY Page 4-15 Chapter 1—Bus Capacity Fundamentals

Transit Capacity and Quality of Service Manual—2nd Edition
BUS FACILITY CONCEPTS Bus facility capacity is greatly dependent on the exclusivity of the facility—the
less interference that buses have from other traffic, the greater the capacity. Specific procedures for calculating bus facility capacity are presented in the facility-specific Chapters 4 through 6, covering grade-separated busways and freeway arterial HOV lanes, arterial street bus lanes, and mixed traffic lanes, respectively.
Where buses make no stops along a facility, bus capacity will be constrained by (1) the capacity of other facilities before or after the non-stop section, or (2) the capacity of a terminal or transit center where the buses end up. For all other facility types, the facility capacity is determined largely by the capacity of the critical bus stop—the bus stop that produces the longest headways between buses. Typically, this is the stop with the longest dwell times, but could also be, for example, a far-side stop after a signalized left turn (with relatively low green time provided to the left turn), or a near-side stop with heavy right-turn volumes.
Facility-specific factors will also influence bus facility capacity. For example, Exhibit 4-15 illustrates the factors that ultimately determine the bus capacity of an arterial street bus lane.
Exhibit 4-15 Capacity Factors for Exclusive Bus Lanes
• Passenger Volumes
• Fare Payment Method
• Vehicle Design
• On/Off Line Stops
• Curb Lane Traffic Volumes• Yield-to-Bus Laws
• Passenger Demand Volumes• Design Failure Rate
Operating Margin
Loading Area DesignNumber of Loading Areas
Bus Lane TypeBus Operations
Critical Stop Conflicting Volumes
Loading Area Vehicle Capacity
Bus Stop Vehicle Capacity
Bus Lane Vehicle Capacity
Traffic SignalsClearance TimeDwell Time
• Green Time
• Bus Signal Priority
PERSON CAPACITY Once a facility’s bus capacity is known, it is relatively straightforward to
determine its person capacity. However, as Exhibit 4-16 illustrates, in addition to the factors shown in Exhibit 4-15 relating to bus capacity, there are several other factors that must be considered when calculating person capacity.
Loading Diversity How passenger demand is distributed spatially along a route and how it is
distributed over time during the analysis period affect the number of boarding passengers that can be carried. The spatial aspect of passenger demand, in particular, is why person capacity must be stated for a maximum load section and not for a route or street as a whole.
Chapter 1—Bus Capacity Fundamentals Page 4-16 Part 4/BUS TRANSIT CAPACITY

Transit Capacity and Quality of Service Manual—2nd Edition
Exhibit 4-16 Person Capacity Factors • Passenger Loading
Standard• Bus Frequency
• Peak Hour Factor
• Passenger Trip Lengths• Boarding Volume at Critical Stop
• Loading Area Vehicle Capacity• Bus Stop Vehicle Capacity• Bus Lane Vehicle Capacity
Vehicle Capacity
Person Capacity
Passenger Demand Characteristics
Agency Policy
Over the course of an hour, passenger demand will fluctuate. The peak hour factor,
shown in Equation 4-1, reflects passenger demand volumes over (typically) a 15-minute period during a peak hour. A bus system should be designed to provide sufficient capacity to accommodate this peak passenger demand. However, since this peak demand is not sustained over the entire hour and since not every bus will experience the same peak loadings, the achievable person capacity during the hour will be less than that calculated using peak-within-the-peak demand volumes.
The average passenger trip length affects how many passengers may board a bus as it travels its route. If trip lengths tend to be long (passengers board near the start of the route and alight near the end of the route), buses on that route will not board as many passengers as a route where passengers board and alight at many locations. However, the total number of passengers on board buses on each route at their respective maximum load points may be quite similar.
The distribution of boarding passengers among bus stops affects the dwell time at each stop. If passenger boardings are concentrated at one stop, the facility’s bus capacity will be lower, since that stop’s dwell time will control the bus capacity (and, in turn, the person capacity) of the entire facility. Both the potential bus capacity and person capacity at the maximum load point are greater when passenger boarding volumes are evenly distributed among stops.
Operator Policy Two factors directly under the control of a transit agency are the maximum
schedule passenger load allowed on buses (set by a combination of agency policy and agency vehicle purchasing decisions) and the service frequency. Maximum schedule load is synonymous with “capacity,” assuming a reasonable number of standees. It represents the upper limit for scheduling purposes. Maximum schedule loads are typically 125 to 150% of a bus’s seating capacity, for example 54 to 64 passengers on a typical 40-foot (12-meter) bus.
Increasing the maximum schedule load increases person capacity, but decreases quality of service.
Crush loads, typically loads above 150% of a bus’s seating capacity, subject standees and other passengers to unreasonable discomfort. Such loads are unacceptable to passengers. Crush loads prevent circulation of passengers at intermediate stops and so induce delay and reduce vehicle capacity. Although crush loading represents the theoretically offered capacity, it cannot be sustained on every bus for any given period, and it exceeds the maximum utilized capacity. Therefore, crush loads should not be used for transit capacity calculations. Note, however, that when maximum schedule loads are used, some buses will experience crush loading, due to the peaking characteristics of passenger demand.
Crush loads.
Part 4/BUS TRANSIT CAPACITY Page 4-17 Chapter 1—Bus Capacity Fundamentals

Transit Capacity and Quality of Service Manual—2nd Edition
An agency whose policy requires all passengers to be seated will have a lower potential person capacity for a given number of buses than an agency whose policy allows some standees or an agency that purchases longer buses. The bus frequency determines how many passengers can actually be carried, even though a bus stop or facility may be physically capable of serving more buses than are actually scheduled.
This last point is important when reporting person capacity: is the capacity being referred to the maximum number of people that can be carried under the current schedule, or the maximum number of people that could be carried if all of the buses a facility could accommodate were scheduled? Equation 4-8 illustrates the differences in calculating the two and is applicable to either bus routes or facilities.
Number of people that can be carried vs. number of people that could be carried.
⎩⎨⎧
=)()(
minmax
max
PHFBPPHFfP
P Equation 4-8
where: P = person capacity (p/h); Pmax = maximum schedule load per bus (p/bus); f = scheduled bus frequency (bus/h); B = bus facility capacity, from the appropriate Chapter 4, 5, or 6
procedure; and PHF = peak hour factor. See the discussions under calculating dwell times, earlier in this chapter, for
recommended peak hour factor values. When different sizes of buses are scheduled to use a facility, a weighted average maximum schedule load per bus should be developed to use in Equation 4-8, based on the number of buses of each type and the loading applied to each bus type. Typical bus vehicle types, dimensions, and passenger capacities are given in Exhibit 4-17.
Exhibit 4-17 Characteristics of Common Bus Transit Vehicles—United States and Canada
Typical Passenger CapacityBus Type Length (ft) Width (ft) Seated Standing Total Small Bus/Minibus 18-30 6.5-8.5 8-30 0-10 8-40 Transit Bus (high floor) 35 8.0-8.5 35-40 20-30 50-60 40 8.5 40-45 20-35 65-75 Transit Bus (low floor) 35 8.0-8.5 30-35 20-35 55-70 40 8.5 35-40 25-40 55-70 Articulated (high floor) 60 8.5 65 35-55 100-120 SOURCES: 1985 Highway Capacity Manual,(R40) manufacturer specifications. NOTE: In any transit vehicle, the total passenger capacity can be increased by removing seats and by making
more standing room available; however, this lowers the passengers’ quality of service. The upper ends of the total capacity ranges represent crush capacity and should not be used for transit capacity calculations.
Low-floor buses typically provide 5 or 6 fewer seats than the comparable high-floor bus.
Low-floor buses typically provide five or six fewer seats than a manufacturer’s equivalent 35 to 40 foot (10.7-12.2 meter) high-floor bus, due to the space taken up by the wheel wells that is not used for seating. Low-floor articulated buses have been introduced by some transit agencies.
Chapter 1—Bus Capacity Fundamentals Page 4-18 Part 4/BUS TRANSIT CAPACITY
Transit Capacity and Quality of Service Manual—2nd Edition
CHAPTER 2. BUS PREFERENTIAL TREATMENTS
INTRODUCTION This chapter presents operating issues related to the implementation of bus
preferential treatments. A wide variety of treatments have been developed in urban areas throughout the world to make bus transit more competitive with the private automobile and to provide a higher quality of service for passengers. This chapter provides an overview of measures developed to date that have shown promising operations. Chapter 3 provides a set of planning guidelines to assist users in deciding whether a particular measure may be appropriate for a particular need.
Bus Preferential Treatment Uses A significant amount of delay to transit vehicles in urban areas is caused by
traffic congestion. This congestion results in longer travel times for passengers, and over time, requires transit agencies to add more buses to routes in order to maintain headways, which results in higher agency operating costs.
Bus preferential treatments offer the potential to reduce the delays experienced by buses operating in mixed traffic. These measures are aimed at improving schedule adherence and reducing travel times and delays for transit users. The measures may attract new riders, increase transit capacity, and/or improve the transit quality of service.
Bus preferential treatments seek to offset the delays caused by traffic.
Successful priority measures are usually characterized by(R17)
• An intensively developed downtown area with limited street capacity and high all-day parking costs,
• A long-term reliance on public transportation,
• Highway capacity limitations on the approaches to downtown,
• Major water barriers that limit road access to the downtown and channel bus flows,
• Fast non-stop bus runs for considerable distances, Transportation policies that give priority to transit vehicles because of their efficiency benefits may allow transit agencies to implement transit priority measures.
• Bus priorities on approaches to or across water barriers,
• Special bus distribution within downtown (often off-street terminals), and
• Active traffic management, maintenance, operations, and enforcement programs.
Bus preferential treatments can be generally defined as a range of techniques designed to speed up transit vehicles and improve overall system efficiency. They include physical improvements, operating changes, and regulatory changes. Bus preferential treatments may reduce travel time variability and improve schedule adherence, depending on the application. When considering implementing these treatments, the total change in person-delay (including both passengers in buses and in private vehicles) should be taken into account. Broader transportation policies may limit or expand the potential for application outlined within this manual.
Bus preferential treatments defined.
Where there has been a strong policy directive to improve the role of public transit in accommodating a community’s travel needs, these measures should be implemented with transit agency and traffic engineering agency staff working in a coordinated manner. Measures should be cost-effective and should consider both long-term changes to mode split and the potential for attracting new riders. Both of these factors may be difficult to quantify. In most cases, bus preferential treatments will be more acceptable to roadway users and decision-makers when improvements
Part 4/BUS TRANSIT CAPACITY Page 4-19 Chapter 2—Bus Preferential Treatments

Transit Capacity and Quality of Service Manual—2nd Edition
Chapter 2—Bus Preferential Treatments Page 4-20 Part 4/BUS TRANSIT CAPACITY
to transit operations do not create undue traffic disruptions. However, in a policy environment favoring transit usage over private automobiles, investments in bus preferential treatments rather than expanded roadway capacity may be seen as a means of further improving transit attractiveness and maximizing the person-carrying ability of roadways.
In situations where the policy direction is not as clear, or the inter-agency working relationships are not as strong, an incremental approach to developing preferential treatments may be more successful. This approach could involve demonstration projects that have a good potential for success and could be used to develop support for broader transportation improvement projects in the future.
Bus preferential treatments can provide a cost-effective way of improving transit service based on focused, one-time capital investments as opposed to increased service that requires annual operating funding. They offer the potential for reducing or postponing the need for added service to respond to congestion and can attract new riders to transit, if the treatments provide a noticeable improvement in travel time and/or service reliability.
Person Delay Concepts In many cases, providing bus preferential treatments involves trade-offs among
the various users of a roadway facility. Providing a bus queue jump at a traffic signal, for example, provides a time-savings benefit for bus passengers, while possibly causing additional delay for motorists, their passengers, bicyclists, and some pedestrians. When considering implementing a preferential measure, one factor to consider should be the net change in person delay to all roadway users as a result of the measure. Of course, other factors such as cost, change in transit quality of service, and local policies encouraging greater transit use should also be considered. An example problem in Chapter 9 illustrates how to evaluate the net change in person delay resulting from implementing a transit signal priority measure.
The net change in person delay is an important factor to consider before implementing transit priority measures.
BUSWAYS AND FREEWAY HOV LANES Facilities that provide segregated rights-of-way for buses offer a number of
advantages that can improve service quality. Bus travel times, schedule adherence, and vehicle productivity are improved when buses are able to use higher-speed, uncongested facilities. These improvements, in turn, promote efficiency, improve reliability, and increase the potential to gain new riders.
Busways and freeway HOV lanes are the facility types offering segregated rights-of-way. Transit industry use of the terms busway and transitway is inconsistent, with the two terms often used interchangeably. The term busway has been used to describe facilities ranging from bus lanes in the medians of urban streets, to exclusive bus roads with at-grade intersections, to freeway HOV lanes used exclusively by buses, to Ottawa-style exclusive, grade-separated bus facilities with rail-like infrastructure. The TCQSM uses the terms median busway, at-grade busway, freeway HOV lanes, and grade-separated busway, respectively, to describe these facility types.
Industry usage of the terms transitway and busway is not consistent, and the terms are often used interchangeably.
In North America, busways and freeway HOV lanes are found mainly in larger cities, usually with a large downtown employment and heavy peak-hour bus ridership.2 However, these facilities have found application internationally as a substitute for, or supplement to, rail systems. When facilities are located on exclusive rights-of-way, they may not be easy to walk to. In these cases, most ridership stems
2 A rural HOV lane used by Roaring Fork Transit Authority buses exists along sections of
Colorado Highway 82 between Glenwood Springs and Vail.

Transit Capacity and Quality of Service Manual—2nd Edition
from park-and-ride lots located along the facilities, from transfers from other routes, or from buses using the facilities after circulating through a neighborhood.
Operational Overview Exhibit 4-18 presents operational characteristics of significant grade-separated
busway and freeway HOV lanes. A more complete listing of these treatments can be found in the TRB HOV Systems Manual.(R44)
Length Region # of Lanes (mi) (km) HOV hours1 Eligibility
GRADE-SEPARATED BUSWAYS Ottawa Southeast Transitway 1 each dir. 5.1 8.2 24 hours Buses only West Transitway 1 each dir. 3.0 4.9 24 hours Buses only Southwest Transitway 1 each dir. 2.2 3.5 24 hours Buses only East Transitway 1 each dir. 4.0 6.5 24 hours Buses only Central Transitway 1 each dir. 1.7 2.7 24 hours Buses only Pittsburgh East Busway 1 each dir. 9.1 14.6 24 hours Buses only South Busway 1 each dir. 4.1 6.6 24 hours Buses only West Busway 1 each dir. 5.0 8.0 24 hours Buses only Seattle (Bus Tunnel) 1 each dir. 1.3 2.1 24 hours2 Buses only Minneapolis (Univ. of Minnesota) 1 each dir. 1.1 1.8 24 hours Buses only Boston (South Boston Tunnel) 1 each dir. 1.0 1.6 Scheduled 2004 opening Boston (Harvard Square) 1 each dir. 0.2 0.3 24 hours Buses only Dallas (SW Texas Medical Center) 1 each dir. 0.6 1.0 24 hours Buses only Providence (Bus Tunnel) 1 each dir. 0.4 0.6 24 hours Buses only
AT-GRADE BUSWAYS Miami (South Dade Busway) 1 each dir. 8.2 13.2 24 hours Buses only Seattle (south tunnel access) 1 each dir. 1.6 2.6 24 hours Buses only Vancouver (No. 3 Road) 1 each dir. 1.2 2.0 24 hours Buses only
BARRIER-SEPARATED TWO-WAY HOV LANES Los Angeles (I-10 El Monte) 1 each dir. 4.0 6.4 24 hours 3+ HOVs Seattle (I-90) 1 each dir. 1.6 2.5 24 hours 2+ HOVs
BARRIER-SEPARATED REVERSIBLE FLOW HOV LANES Northern Virginia (I-95/I-395) 2 15 24 24 hours 3+ HOVs Houston I-10 (Katy Freeway) 1 13 21 5-12, 2-93 3+ HOVs I-45 (Gulf Freeway) 1 12.1 19.4 5-12, 2-9 2+ HOVs US 290 (Northwest Freeway) 1 13.5 21.6 5-12, 2-9 2+ HOVs I-45 (North Freeway) 1 13.5 21.6 5-12, 2-9 2+ HOVs US 59 (Southwest Freeway) 1 11.5 18.4 5-12, 2-9 2+ HOVs
CONCURRENT-FLOW HOV LANES Miami (I-95) 1 each dir. 32 52 7-9 am SB, 4-6
pm NB 2+ HOVs
Atlanta (I-75) 1 each dir. 12.0 19.3 24 hours 2+ HOVs Honolulu (H-2) 1 each dir. 8.1 13.1 6-8, 3:30-6 2+ HOVs Montgomery County, MD I-270 1 each dir. 16.0 25.8 peak periods 2+ HOVs US 29 (shoulders) 1 each dir. 3.0 4.8 peak periods Buses only Ottawa Hwy. 417 Kenta 1 EB only 3.0 4.8 7-9 am Buses only Hwy. 17 Orleans 1 WB only 3.0 4.8 7-9 am Buses only
CONTRAFLOW HOV LANES New Jersey (Lincoln Tunnel appr.) 1 EB only 2.5 4.0 6-10 am Buses only Dallas 1 each pk. dir. 5.2 8.3 6-9, 4-7 2+ HOVs Boston 1 each pk. dir. 6.0 9.6 6-10, 3-7 3+ HOVs Montréal 1 4.3 6.9 6:30-9:30 NB,
3:30-7 SB Buses only
HOV QUEUE BYPASSES Oakland (Bay Bridge Toll Plaza) 3 0.9 1.4 5-10, 3-7 3+ HOVs San Diego (“A” Street ramp to I-5) 1 0.4 0.6 24 hours Buses only Los Angeles (250 freeway ramps) 1 0.1 0.2 as demand
warrants 2+ HOVs
Chicago (I-90 toll plaza) 1 EB only 0.5 0.8 peak periods Buses only
Exhibit 4-18 Operating Characteristics of Selected North American Busways and Freeway HOV Facilities(R29,R44)
NB: northbound, SB: southbound, EB: eastbound, WB: westbound 1Part-time periods are weekdays only unless otherwise noted. 2Buses operate through tunnel 5 am-11 pm weekdays, 10 am-6 pm Saturdays; closed other times. 3Also 5 am-5 pm westbound Saturdays, 5 am-9 pm Sundays. NOTE: Emergency and maintenance vehicles may also be allowed on bus-only facilities.
Part 4/BUS TRANSIT CAPACITY Page 4-21 Chapter 2—Bus Preferential Treatments

Transit Capacity and Quality of Service Manual—2nd Edition
At-grade busways in North America include the 8-mile (13-km) South Dade Busway in Miami; the 1.6-mile (2.6 km) at-grade busway south of Seattle’s bus tunnel; and a 1.2-mile (2.0 km) median busway in the Vancouver suburb of Richmond. Median busways are used in a number of South American cities, including Belo Horizonte, Curitiba, Porto Alegre, and São Paulo, Brazil; Bogotá, Colombia; and Quito, Ecuador. Median busways are also planned as part of BRT routes in Cleveland, Los Angeles, and Eugene.
At-grade busways, including median busways.
Exhibit 4-19(a) shows an example of the type of median busway, with high-level, pre-paid stations, pioneered by Curitiba. Dwell times are similar to rail transit, resulting in higher average speeds and higher vehicle utilization, due to high-level boarding from fare-paid stations. Bi-articulated buses capable of carrying up to 270 passengers are operated on Curitiba’s five express bus lanes. Larger terminals located at the ends of the bus lanes, along with smaller terminals located about every 1.25 miles (2 km) along the lanes, provide transfer opportunities to inter-district and local feeder buses. These terminals are fare-paid areas, so passengers do not have to pay a separate fare or show a fare receipt when transferring between buses, similar to transfers at a heavy rail transfer station. Curitiba’s distinctive high-level “tube stations” are equipped with wheelchair lifts, allowing passengers in wheelchairs to roll directly onto the bus when it arrives. Passengers pay an attendant at the tube station when they enter so that no fares need be collected aboard the bus.(R31,R35)
Exhibit 4-19 Median Bus Lane Examples
(a) Curitiba, Brazil (b) Montréal
Separating buses from other traffic reduces the potential for conflicts that result in delays. In some cases, operating speeds may increase significantly with the use of freeway facilities; in others, the savings are less dramatic. After freeway HOV lanes were opened along several routes in Houston, peak hour operating speeds increased from 26 to 51 mph (42 to 83 km/h).(R19)
Effective distribution of buses within downtown areas remains a challenge. Freeway-related treatments generally provide good access to the downtown perimeter, but do not substantially improve service within the downtown core. Furthermore, transit terminals are not always located near major employment locations, and may require secondary distribution. However, other means exist to continue to favor bus movements once buses enter the downtown street network.(R27)
A capital-intensive solution to downtown bus distribution, a 1.3-mile (2.1-km), five-station bus tunnel (Exhibit 4-20a), opened in Seattle in 1991. Bus routes using the tunnel are operated with a special fleet of dual-mode buses that run on overhead electric power in the tunnel and diesel power on the surface portions of their routes. Both ends of the tunnel connect to freeway ramps; the south end via an at-grade busway. Boston’s Silver Line BRT route will open a 1.0-mile (1.6-km), three-station tunnel in 2004, to be used by dual-powered buses, and plans an additional 1.0-mile (1.6-km), two-station extension in the future. Some bus routes in Providence use a former streetcar tunnel that has been converted to bus use, and the South East Busway in Brisbane, Australia includes tunnel sections.
Bus tunnels.
Chapter 2—Bus Preferential Treatments Page 4-22 Part 4/BUS TRANSIT CAPACITY

Transit Capacity and Quality of Service Manual—2nd Edition
Exhibit 4-20 Bus Tunnel Examples
(a) Seattle (b) Providence
Many freeway-related bus preferential treatments have produced important passenger benefits. Some have achieved time savings of 5 to 30 minutes—savings that compare favorably with those resulting from rail transit extensions or new systems. The contraflow bus lane leading to the Lincoln Tunnel in New Jersey, for example, provides a 20-minute time saving for bus passengers.
HOV Lanes An HOV lane is a freeway lane that is restricted to buses and, often, other
vehicles occupied by a given number of people (usually two or three). The lanes can be immediately adjacent to regular traffic lanes, separated from other traffic by a painted median or removable pylons, or completely separate and protected from other traffic by physical barriers.(R41)
Houston’s HOV system, illustrated in Exhibit 4-21, is the most extensive deployment of restricted lanes in North America. Built primarily for buses, but also used by carpools and vanpools, the HOV lanes are located in the center of most major freeways and are separated from general traffic by physical barriers. These HOV lanes serve nearly 110,000 person trips each weekday, the equivalent of about 35,000 vehicle trips that would otherwise continue traveling on the freeway main lanes. The average rush-hour speed on Houston freeways is roughly 24 mph (39 km/h). HOV lanes maintain an operating speed of 50 to 55 mph (80 to 90 km/h), and save the average commuter 12 to 22 minutes per trip.(R19)
Exhibit 4-21 Houston HOV Lane Examples
(a) I-10 Katy Freeway (b) I-45 North Freeway
Freeway Ramp Queue Bypasses Queue bypasses are a form of priority treatment that allow buses to avoid queues
of vehicles (such as those that develop at freeway ramp meters) by providing a short HOV lane that avoids the queue. This form of transit priority often involves considerable innovation to find methods of enabling buses to avoid recurring congestion. Exhibit 4-22 depicts a typical queue bypass design on a freeway on-ramp, along with actual applications.
Queue bypasses.
Part 4/BUS TRANSIT CAPACITY Page 4-23 Chapter 2—Bus Preferential Treatments

Transit Capacity and Quality of Service Manual—2nd Edition
Cars queue at ramp meter
Bypass lane allows bus to avoid queue
BUSONLY
BUSONLY
RIGHTLANE
RIGHTLANE
ONEVEHICLEPERGREEN
ONEVEHICLEPERGREEN
Exhibit 4-22 Freeway Ramp Queue Bypasses
(b) Application (Los Angeles)
(a) Concept (c) Application (Amsterdam)
ARTERIAL STREET BUS LANES Arterial street bus lanes provide segregated rights-of-way for buses. Because
these facilities have interrupted flow (e.g., traffic signals), due to intersections with other streets, they provide a lower level of priority to transit than facilities on exclusive rights-of-way. Nevertheless, arterial street bus lanes offer buses significant advantages over mixed traffic operations. Exhibit 4-23 lists common sources of delays to buses operating in mixed traffic that bus lanes and site-specific preferential treatments help overcome. These delays reduce bus capacity, speed, and reliability, resulting in reduced service quality for passengers and potentially increased operating costs for transit agencies.
Exhibit 4-23 Sources of Delay for Buses Operating in Mixed Traffic at Intersections
Intersection Type Delay Sources Insufficient traffic signal green time for bus approach Poor signal progression for buses Signalized Inadequate vehicle detection at signals Queued vehicles on intersection approach On-street parking maneuvers Inadequate lane width Off-line bus stop re-entry delay Right-turning traffic blocking access to stop
All
Left-turning traffic blocking shared lane
Bus lanes can be created by several means:
• Re-designating an existing travel lane as a bus lane,
• Narrowing existing lanes to provide an additional lane,
• Widening the street to add a new lane, and
• Restricting on-street parking (part-time or full-time) to provide a bus lane. Where there is a relatively high volume of buses operating on a roadway,
coupled with significant bus and automobile congestion, exclusive bus lanes can provide more attractive and reliable bus service. Most bus lanes take the form of reserved lanes on city streets, usually in the same direction as the general traffic flow. However, some cities provide bus-only streets, such as 16th Street in Denver, the Fifth and Sixth Avenue Transit Mall in Portland, Oregon, and the Granville Mall in Vancouver. Contraflow center lanes with center median waiting, such as the part-time Boulevard Pie-IX lane in Montréal, are unusual but have been successful.
Chapter 2—Bus Preferential Treatments Page 4-24 Part 4/BUS TRANSIT CAPACITY

Transit Capacity and Quality of Service Manual—2nd Edition
Exhibit 4-24 shows applications where (a) on-street parking was removed and existing lanes narrowed to create a bus lane, and (b) parking is restricted during peak periods to provide a bus lane.
Exhibit 4-24 Bus Lane Development via Parking Restrictions
(a) Full-time lane (Portland, Oregon) (b) Part-time lane (San Francisco)
TRAFFIC SIGNAL PRIORITY
Overview Traffic signal priority for buses has been used for a number of decades in Europe,
but is a newer concept in North America. Early attempts to provide signal priority were based on signal pre-emption, where buses were given a nearly immediate green signal, regardless of other conditions, in the same manner that emergency vehicles are able to pre-empt traffic signals. Signal pre-emption is not desirable from a traffic signal control system standpoint, and it raises potential pedestrian crossing safety issues, and thus has been dismissed by most roadway agencies. Current practice is to provide signal priority, where providing preferential treatment for buses is balanced against other system needs.
Signal priority is different than pre-emption, which is normally associated with emergency vehicles.
Signal priority measures include passive, active, and real-time priority, in addition to pre-emption. Passive strategies attempt to accommodate transit operations through the use of pre-timed modifications to the signal system that occur whether or not a bus is present to take advantage of the modifications. These adjustments are completed manually to determine the best transit benefit while minimizing the impact to other vehicles. Passive priority can range from simple changes in intersection signal timing to systemwide retiming to address bus operations. Passive strategies can utilize transit operations information, such as bus travel times along street segments, to determine signal timing coordination plans.
Reducing the traffic signal cycle length on an arterial or downtown grid system is a passive priority measure.
Active strategies adjust the signal timing after a bus is detected approaching the intersection. Depending on the application and capabilities of the signal control equipment, active priority may be either conditional or unconditional. Unconditional strategies provide priority whenever a bus arrives. Conditional strategies incorporate information from on-board automatic vehicle location (AVL) equipment (e.g., whether or not the bus is behind schedule, and by how much), and/or automatic passenger counting (APC) equipment (e.g., how many people are on-board), along with signal controller data on how recently priority was given to another bus at the intersection, to decide whether or not to provide priority for a given bus.(R4)
Conditional strategies can incorporate information on bus schedule status, loading, and recent requests for priority to determine whether or not to grant priority to a given bus.
Real-time strategies consider both automobile and bus arrivals at a single intersection or a network of intersections. Applications of real-time control have been limited to date and require specialized equipment that is capable of optimizing signal timings in the field to respond to current traffic conditions and bus locations.
Pre-emption can be classified separately because it results in changes to the normal signal phasing and sequencing of the traffic signal to provide a clear path for the pre-empting vehicle through the intersection. Pre-emption is most commonly associated with emergency vehicles (e.g., ambulances, fire trucks, and police cars),
Part 4/BUS TRANSIT CAPACITY Page 4-25 Chapter 2—Bus Preferential Treatments

Transit Capacity and Quality of Service Manual—2nd Edition
and with trains, when grade crossings are located adjacent to a signalized intersection (to clear vehicles off the grade crossing, and then prevent access to the crossing until the train has cleared the crossing). Because pedestrian crossing phases are also pre-empted, pedestrians can find themselves unexpectedly facing a solid DON’T WALK indication while crossing the street. Because buses do not announce their arrival by sirens and lights, as do emergency vehicles, pre-emption can lead to potentially serious pedestrian safety issues. From a vehicle operations standpoint, pre-emption can disrupt the coordination existing between traffic signals, which may result in significant congestion that also affects subsequent buses.
Exhibit 4-25 summarizes common bus signal priority treatments. Exhibit 4-25 Bus Signal Priority Systems(R1)
Treatment Description Passive Priority
Adjust cycle length Reduce cycle lengths at isolated intersections to benefit buses Split phases Introduce special phases at the intersection for the bus movement
while maintaining the original cycle length Areawide timing plans Preferential progression for buses through signal offsets Bypass metered signals Buses use special reserved lanes, special signal phases, or are
rerouted to non-metered signals Adjust phase length Increased green time for approaches with buses
Active Priority* Green extension Increase phase time for current bus phase Early start (red truncation) Reduce other phase times to return to green for buses earlier Special phase Addition of a bus phase Phase suppression Skipped non-priority phases
Real-Time Priority* Delay-optimizing control Signal timing changes to reduce overall person delay Network control Signal timing changes considering the overall system performance
Pre-emption* Pre-emption Current phase terminated and signal returns to bus phase
*Any of the listed treatments can be unconditional (occur whenever a request is received) or cond tional (priority is granted if other conditions—schedule status, loading, etc.—are met).
i
Notes on Application There are number of reasons to justify transit signal priority. However, signal
priority should only be implemented at intersections whose traffic operations are well understood. Field data collection on both traffic and transit operating conditions allows for informed decisions by both transit and transportation engineering staff on the benefits and impacts of any proposed signal timing changes. In many cases, analyzing changes in person delay is recommended to adequately quantify these benefits and impacts.
The importance of the relationship between transit staff and traffic engineering staff cannot be overemphasized. Coordination between these groups is necessary for effective implementation of transit priority measures.
Signal priority systems vary in complexity. Simple systems that rely on bus operator intervention reduce the amount of on-vehicle technology that is needed. However, automated systems that do not require bus operator intervention are preferable, as operators may not always remember to activate the system at the intersections equipped with signal priority equipment. Furthermore, an automated system, when coupled with two-way data communication and AVL equipment, can be set to activate signal priority only when a bus meets certain conditions of priority (e.g., a bus is behind schedule, on route, within a preset area, doors are closed, etc.). The technology employed for transmitting and detecting priority requests varies considerably. Feasibility studies have identified various workable technologies, but there is not any strong evidence that one method will work best for every situation.
Exhibit 4-26 illustrates both red truncation and green extension associated with an active signal priority implementation. Street-side equipment can detect the bus (for example, using a transponder), or bus-mounted equipment can transmit a request for priority to the signal controller.
Chapter 2—Bus Preferential Treatments Page 4-26 Part 4/BUS TRANSIT CAPACITY

Transit Capacity and Quality of Service Manual—2nd Edition
Bus approaches red signal
RED TRUNCATION GREEN EXTENSION
Bus approaches green signal
Signal controller detects bus;terminates side street green phase early
Signal controller detects bus;extends current green phase
Bus proceeds on green signal Bus proceeds on extended green signal
SIGNAL CONTROLLER SIGNAL CONTROLLER
Exhibit 4-26 Bus Signal Priority Concept—Red Truncation and Green Extension(R4)
The City of Portland, Oregon, conducted operational studies on four different
corridors. The performance measures studied included bus travel time, delay to non-transit vehicles, and person delay. Using an active signal priority system, bus travel time was reduced by 5 to 12 percent, with an insignificant amount of increased delay to other vehicles.(R2) Exhibit 4-27 identifies five recent transit signal priority implementations where improvements have been documented.
Exhibit 4-27 Reported Benefits Associated with Transit Signal Priority(R14)
Location Type of Priority Reported Benefits Los Angeles Extension, Truncation 7% bus travel time reduction
Chicago Priority, Pre-emption 12 to 23% bus travel time reduction
Bremerton, WA Pre-emption Average 10% bus travel time reduction
Portland, OR Extension, Truncation 5 to 12% bus travel time reduction
Anne Arundel County, MD Pre-emption 13 to 18% bus travel time reduction, 4 to 9%
impact on other traffic
SITE-SPECIFIC PRIORITY TREATMENTS
Queue Jumps Queue bypass lanes or queue jump treatments allow buses to avoid long queues
of vehicles at signalized intersections. A short bus lane and other traffic control measures enable buses to travel through congested areas with reduced delay. Right-turn lanes with bus turn exemptions, or long off-line bus stops allow buses to move past much of the queue.
In some cases, a special right-lane signal may provide an advance green indication for the bus before traffic in the adjacent through lanes proceeds. During this time, the bus exits the right lane and merges into the lane to the left ahead of the other traffic that had stopped for the signal. Alternatively, the bus pulls into the right lane on a red signal and proceeds to a far-side off-line bus stop on green, resulting in
Part 4/BUS TRANSIT CAPACITY Page 4-27 Chapter 2—Bus Preferential Treatments

Transit Capacity and Quality of Service Manual—2nd Edition
reduced delay waiting for the queue in the regular lanes to clear the intersection. Exhibit 4-28 illustrates a typical queue jump design and an example application. In the Copenhagen example, a bus lane ends at a near-side bus stop at the intersection, and a special transit signal (the vertical bar indication adjacent to the regular traffic signal) is used to give buses priority into the regular traffic lanes. Edmonton uses a similar system at eight intersections. In many applications, such as the Portland example shown, regular traffic signals (with appropriate signing and shielding) are used for the bus signal, rather than a special transit signal.
Exhibit 4-28 Bus Queue Jumps(R4)
Passengers board during red
Other vehicles proceed a few seconds later
Bus receives green before other vehicles
BUS STOP
BUS STOP
BUS STOP
(b) Near-Side Application (Copenhagen)
(a) Near-Side Concept (c) Far-Side Application (Portland, Oregon)
Boarding Islands Where significant parking activity, stopped delivery vehicles, heavy right-
turning traffic volumes, and other factors slow traffic in the right lane of a multiple-lane street, buses may be able to travel faster in the lane to the left. Boarding islands allow bus stops to be located between travel lanes so that buses can use a faster lane without having to merge into the right lane before every stop. Pedestrian safety issues must be addressed when considering the use of boarding islands. Exhibit 4-29 illustrates the concept and an application of this treatment.
Chapter 2—Bus Preferential Treatments Page 4-28 Part 4/BUS TRANSIT CAPACITY

Transit Capacity and Quality of Service Manual—2nd Edition
Exhibit 4-29 Boarding Islands(R4) Before
After
Traffic congestion in curb lane due toparking and turning maneuvers.
Bus travels in faster lane, passengers loadand unload at boarding island.
(a) Concept
(b) Application (Washington, DC)
(c) Application (San Francisco)
Cur
ensions also serve to reduce the distance ped
-compliant landing area for wheeled mob
rict some right turns, due to the tigh
xhibit 4-30 illustrates the use and application of curb extensions.
b Extensions Curb extensions at transit stops (also known as bus bulbs) are similar to boarding
islands in that they allow transit vehicles to pick-up passengers without moving into the curb lane. Curb extensions may be used where streets have curbside parking and high traffic volumes. In these cases, it may not be desirable for a bus to pull to the curb to stop because of the delays involved in waiting for a sufficiently large gap in traffic that will allow the bus to pull back into the travel lane. In addition, if the bus stop is located at an intersection, curb ext
estrians must travel to cross the street. Other advantages of curb extensions include providing (1) a passenger waiting
area clear of the main sidewalk, (2) an ADAility aid users, and (3) room for a shelter. Curb extensions are typically developed by extending the curb into the parking
lane to allow buses to stop in the travel lane to pick up and discharge passengers. Curb extensions can actually create more on-street parking than would exist with a stop flush with the regular curb line, as the area before or after the bus stop used by buses to pull in or out of the stop can now be used for additional parking. If bicycle lanes exist, they may need to be routed around the curb extension, creating potential pedestrian/bicycle or auto/bicycle conflicts. Curb extensions can change street drainage patterns, and drainage may need to be reworked to prevent water from ponding in the stop vicinity. They may also rest
ter curb radius associated with this treatment. E
Part 4/BUS TRANSIT CAPACITY Page 4-29 Chapter 2—Bus Preferential Treatments

Transit Capacity and Quality of Service Manual—2nd Edition
BeforeBus pulls to curb at bus stop: must wait for gap in traffic to proceed.
Curb extended into parking lane, bus stops in travel lane; more curbside parking available.
After
BUSSTOP
BUSSTOP
P
P
Exhibit 4-30 Curb Extensions(R4)
(b) Application (Vienna, Austria)
(a) Concept (c) Application (Portland, Oregon)
Yield-to-Bus Laws Some jurisdictions, including the states of Florida, Oregon, and Washington, and
the provinces of British Columbia and Québec, have passed laws requiring motorists to yield to buses signaling to re-enter the street from a bus stop. Depending on motorist compliance with the law, the re-entry delay associated with merging back into traffic from an off-line stop can be almost eliminated. Some agencies also view these laws as a way to improve safety for buses and other vehicles. TCRP Synthesis of Transit Practice 49 (R21) addresses the effectiveness of these laws.
Some jurisdictions (e.g., Québec and Washington) remind motorists of the law through the use of stickers mounted to the back of the bus. Some agencies in areas without yield-to-bus laws also use similar stickers appealing to motorist courtesy to let the bus back in. Oregon has developed a flashing electronic YIELD sign that has traffic control device status (i.e., motorists must obey it like they would a traffic signal or regulatory sign). Examples of these approaches are shown in Exhibit 4-31.
Exhibit 4-31 Yield-to-Bus Law Notifications
(a) Montréal (b) Portland, Oregon
Chapter 2—Bus Preferential Treatments Page 4-30 Part 4/BUS TRANSIT CAPACITY

Transit Capacity and Quality of Service Manual—2nd Edition
Parking Restrictions Parking restrictions can be used to implement several of the transit preferential
treatments previously described. Parking restrictions are typically required in the vicinity of a curbside stop to allow buses to pull out of the street and up to the curb to load and unload passengers. In areas where high parking turnover interferes with the flow of traffic on a street, parking restrictions may allow restriping to provide a right-turn-only lane that can also be used by buses as a queue jump lane. Part-time parking restrictions can be used to provide part-time exclusive bus lanes. Whenever parking restrictions are being considered, the impacts to general traffic and adjacent land uses from the loss of on-street parking must also be considered. In some instances, parking restrictions are mitigated through stop consolidation, which can increase the overall number of parking spaces in an area.
Turn Restriction Exemptions The most direct route for a bus may not be possible because of left-turn
restrictions at intersections. These restrictions are often implemented when there is insufficient room to develop left-turn lanes or when traffic volumes preclude good intersection operation when traffic signal cycle time is taken away for left-turning traffic. When left-turn restrictions are a result of traffic congestion, rather than safety, it may be feasible to exempt buses from the restriction without unduly impacting intersection operations, particularly when bus arrivals are relatively infrequent.
TRANSIT OPERATING MEASURES Roadway and traffic signal improvements are not the only means of improving
transit flow. There are a number of options available to transit agencies in the way that transit service is designed and operated that can also provide significant capacity, speed, and quality of service improvements.
Bus Stop Relocation The traffic signal systems used on arterial streets are often designed to progress
the flow of automobile traffic: the signals at a series of intersections are timed to turn green as a platoon of vehicles approaches each intersection from the preceding intersection. When bus stops are consistently placed on one side of an intersection (the near side, for example), buses will often arrive at the intersection while the signal is green. By the time passengers have finished loading and unloading, the signal will have turned red and buses must wait for the other traffic movements to be served.
When signals are spaced relatively close together, buses can take advantage of the existing signal progression when bus stop locations alternate from near side to far side from one intersection to the next. For example, a bus leaves a near-side stop with a platoon of other vehicles when the traffic signal at that stop turns green. The bus proceeds through the next signal with the other vehicles, and arrives at a far-side stop. By the time passenger movements are completed, the signal behind the bus may have turned red and the bus will have an easier time merging back into the street. It can then proceed to a near-side stop at the next signal, arriving and starting its dwell during the red interval, and can continue during the next green interval.
Alternating near-side and far-side stops can allow buses to take advantage of existing signal progression designed to facilitate vehicle flow.
Other factors listed in Exhibit 4-10, such as pedestrian access issues and transfer opportunities, should also be considered before relocating stops. Nevertheless, this is a useful technique for improving bus speeds that does not require any adjustments to the existing traffic signal system.
Part 4/BUS TRANSIT CAPACITY Page 4-31 Chapter 2—Bus Preferential Treatments

Transit Capacity and Quality of Service Manual—2nd Edition
Chapter 2—Bus Preferential Treatments Page 4-32 Part 4/BUS TRANSIT CAPACITY
Bus Stop Consolidation In general, minimizing the number of stops that buses must make will improve
overall bus speeds. However, care must be taken that dwell times at critical stops (those stops with the highest dwell time) are not lengthened when a stop is removed and passengers are required to use a nearby stop that is already well-used.
Consolidating bus stops involves trade-offs between the convenience of the passengers using a particular stop, and those passengers already aboard a bus who are delayed each time the bus stops. Requiring passengers to walk a long distance to another stop may discourage people living or working in the vicinity of a removed stop from using transit. In addition, the pedestrian environment along the street with bus service may not support pedestrian activity (for example, due to a lack of sidewalks). Eliminating a stop can be politically difficult at times when local residents object to having “their” stop removed. However, when stops are located close together (e.g., every block), and a consistent, objective process is used to determine which stops are eliminated, consolidating bus stops can provide benefits to all transit users.
In high-passenger-volume corridors, an alternative to eliminating stops is providing peak-period or all-day limited-stop (minor stops are skipped) or express (only a few very important stops are served) service in conjunction with local service that serves all stops. Passengers traveling long distances can do so more quickly, and it is easier to convey information to passengers about which stops are made when there are fewer stops. Passengers can transfer between services at shared stops or can choose to walk a little farther to get to their destination rather than wait for a local bus. Implementing limited-stop service can be a first step in the development of a bus rapid transit line and is the course of action that AC Transit has chosen for staging the implementation of BRT in the San Pablo Avenue corridor between Oakland, El Cerrito, and San Pablo, California.(R8)
Limited-stop and express services as alternatives to consolidating stops.
In Los Angeles, two pilot BRT lines were developed along the Wilshire-Whittier and Ventura Boulevard corridors. Limited-stop service, with an average stop spacing of 0.85 mile (1.4 km), was implemented on top of the existing local bus service. Traffic signal priority was provided at intersections within the City of Los Angeles, and other service modifications were also made. The initial service provided a 23 to 29% reduction in average running time, two-thirds of which was attributable to the bus stop consolidation.(R39)
Skip-Stop Operation When all buses stop at every bus stop, the available capacity is used up more
quickly than if buses are spread out among several groups of stops. This technique of spreading out stops among two to four alternating patterns, known as skip-stops, offers the ability to substantially improve bus speeds and overall facility bus capacity.
Exhibit 4-32 depicts a portion of the Portland, Oregon, Fifth Avenue bus mall. Buses using the mall are divided into four groups with similar regional destinations. Each group is identified by a particular directional symbol, such as the “W” for “west” shown in the exhibit.3 All buses belonging to that group make all stops designated for that group, and bypass the other groups’ stops. As can be seen, two sets of stops are located in each block, and each group of buses stops every other block. Other signing systems are possible; for instance, Denver uses an “X-Y-Z” lettering system to designate skip-stops located along the downtown portions of 15th and 17th Streets.
3 An older, color-coded symbol used prior to September 2002 is also incorporated into the design, such as the orange deer superimposed on the “W” in the exhibit.

Transit Capacity and Quality of Service Manual—2nd Edition
WASHINGTON ST
ALDER ST
MORRISON ST
WASHINGTON ST
ALDER ST
MORRISON ST
Exhibit 4-32 Example Skip-Stop Pattern and Signing
These block-skipping patterns allow the bus facility capacity to nearly equal the sums of the capacities of the individual stops, thereby providing a nearly three- or four-fold increase in facility capacity, as well as a substantial improvement in average travel speeds. Due to traffic control delays, the irregularity of bus arrivals, and other factors, the actual capacity increase will be somewhat less than the ideal amount. Also, to maximize the capacity and speed benefits, buses must be able to use the adjacent lane to pass other buses. When that lane operates at or close to capacity, buses may not be able to pass other buses easily.
Skip-stops can greatly increase facility capacity.
Platooning Platooning occurs when a set of buses moves along a street as a group, much like
individual cars in a train. Passing activity is minimized, resulting in higher overall travel speeds. Platoons can be deliberately formed, through careful scheduling and field supervision, or can be developed by traffic signals, much as platoons of vehicles form and move down the street together after having been stopped at a traffic signal.
In downtown Ottawa, the city’s busway systems feed into arterial street bus lanes. These lanes are able to accommodate the scheduled volumes of buses, in part because the traffic signal progression on those streets is designed to favor buses (i.e., both bus travel time between stops and dwell times at stops are taken into consideration). The combination of the exclusive lanes and the signal progression naturally forms bus platoons, even though buses may not arrive downtown exactly at their scheduled time.(R37)
Design Standards Developing objective design standards that specify minimum and maximum bus
stop spacing, criteria for diverting a route to serve a particular trip generator, and so on can make it easier for transit agencies to improve or at least maintain transit service quality. Having, and consistently applying, these standards can help overcome objections to individual changes and can make larger-scale changes more politically acceptable. For example, having bus stop spacing standards can make it easier to improve service at a later date by justifying the benefits provided by longer stop spacings. Service diversion standards based on person-delay can make a case for or against changes in routing, depending on the net impact on passengers that would result.
SUMMARY Exhibit 4-33 summarizes the advantages and disadvantages of the transit
preferential treatments presented in this chapter.
Part 4/BUS TRANSIT CAPACITY Page 4-33 Chapter 2—Bus Preferential Treatments

Transit Capacity and Quality of Service Manual—2nd Edition
Exhibit 4-33 Bus Preferential Treatments Comparison(R4,R42)
Treatment Advantages Disadvantages ROADWAY AND TRAFFIC SIGNAL TREATMENTS
Exclusive Bus Lanes
• Increases bus speed by reducing sources of delay
• Improves reliability • Increases transit visibility
• Traffic/parking effects of eliminating an existing travel or parking lane must be carefully considered
• Requires on-going enforcement
Signal Priority • Reduces traffic signal delay • Improves reliability
• Risks interrupting coordinated traffic signal operation
• Risks lowering intersection LOS, if intersection is close to capacity
• Requires inter-jurisdiction coordination • Cross-street buses may experience more delay
than time saved by the favored routes
Queue Bypass • Reduces delay from queues at ramp meters or other locations
• Bus lane must be available and longer than the back of queue
Queue Jump
• Reduces delay from queues at signals
• Buses can leap-frog stopped traffic
• Right lane must be available and longer than the back of queue
• Special transit signal required • Reduces green time available to other traffic • Bus drivers must be alert for the short period of
priority green time
Curb Extensions
• Eliminates re-entry delay • Riding comfort increased when buses
don’t pull in and out of stops • Increases on-street parking by
eliminating need for taper associated with bus pullouts
• More room for bus stop amenities • Reduces ped crossing distance
• Requires at least two travel lanes in bus’s direction of travel to avoid blocking traffic while passengers board and alight
• Bicycle lanes require special consideration
Boarding Islands
• Increases bus speed by allowing buses to use faster-moving left lane
• Requires at least two travel lanes in bus’s direction of travel and a significant speed difference between the two lanes
• Uses more right-of-way than other measures • Pedestrian/ADA accessibility, comfort, and
safety issues must be carefully considered
Parking Restrictions
• Increases bus speed by removing delays caused by automobile parking maneuvers
• Increases street capacity and reduces traffic delays
• May significantly impact adjacent land uses (both business and residential)
• Requires on-going enforcement
Turn Restriction Exemption
• Reduces travel time by eliminating detours to avoid turn restrictions
• Potentially lowers intersection level of service • Safety issues must be carefully considered
BUS OPERATIONS TREATMENTS
Bus Stop Relocation
• Uses existing signal progression to bus’s advantage
• May increase walking distance for passengers transferring to a cross-street bus
Bus Stop Consolidation
• Reduces number of stops, thereby improving average bus speeds
• Increases walking distances for some riders • Pedestrian environment may not support
walking to the next closest stop
Skip-stops • Substantially improves bus speed and capacity
• Unfamiliar riders may be unsure about where to board their bus
• Requires available adjacent lane
Platooning • Reduces bus passing activity • May be difficult to implement
Design Standards
• Service changes to improve operations more easily justified
• Supports consistent transit planning and design
• Too rigid an application of standards can be just as bad as not having standards
Chapter 2—Bus Preferential Treatments Page 4-34 Part 4/BUS TRANSIT CAPACITY

Transit Capacity and Quality of Service Manual—2nd Edition
CHAPTER 3. PLANNING APPLICATIONS
INTRODUCTION This chapter consists of two major sections. The first section presents guidelines
for implementing many of the transit preferential treatments discussed in Chapter 2. The second section, which also includes the material in Appendix D, provides planning-level capacities for various kinds of bus stops and facilities.
The planning guidelines presented in this chapter are based on experiences with specific applications and previous studies on the effectiveness of particular kinds of transit preferential treatments. The guidelines suggest typical ranges of passenger, bus, and/or motor vehicle volumes which may suggest the need for certain kinds of improvements. This level of detail may be used to develop a range of alternatives suitable for planning-level analyses and should only be represented as such. More detailed analysis using the procedures presented in subsequent chapters, as well as Highway Capacity Manual procedures where appropriate, should be conducted prior to selecting or implementing particular treatments.
One of the most critical factors in the success of a transit priority measure is the careful planning and design of particular improvements. The guidelines in this chapter focus on individual types of treatments. However, it is emphasized that one of the ways to maximize the effectiveness of a transit priority program is by implementing a whole series of complementary efforts.
Consider a series of complementary efforts when implementing a transit priority program.
TRANSIT PREFERENTIAL TREATMENTS
Uninterrupted Flow Facilities Policy and cost considerations usually dictate the lower limit for bus volumes
that warrant busway or freeway HOV lane treatments. Lower minimum vehicle thresholds can be expected, and are usually accepted, with busways than with HOV lanes; however, the minimum vehicle threshold may be higher in a heavily congested corridor than in one with lower levels of congestion. Non-users in heavily congested areas may be much more vocal about a facility they feel is under-utilized than commuters in a corridor where congestion is not at serious levels. Whenever considering providing busway or HOV facilities, the perceptions of commuters and the public, as well as any unique local conditions, should be considered when developing minimum operating thresholds.(R44)
Exhibit 4-34 presents typical minimum freeway HOV lane operating thresholds in vehicles per hour per lane, based on U.S. experience. These thresholds balance the number of people using the lane with the cost of constructing the lane.
Exhibit 4-34 Typical Busway and HOV Lane Minimum Operating Thresholds(R44)
Facility Type
Minimum Operating Threshold (veh/h/lane)
Separate right-of-way, HOV 800-1,000 Freeway, exclusive two-directional 400-800 Freeway, exclusive reversible 400-800 Freeway, concurrent flow 400-800 Freeway, contraflow HOV 400-800 HOV queue bypass lanes 100-200 NOTE: Volumes include both buses and private vehicles that are HOVs.
Exhibit 4-35 presents general planning guidelines for busways and bus priority treatments associated with freeways. Exhibit 4-36 provides guidance on the effects of these treatments. For more information on busway and freeway HOV facility planning guidelines, design, and operation, consult the TRB HOV Design Manual.(R44)
Part 4/BUS TRANSIT CAPACITY Page 4-35 Chapter 3—Planning Applications

Transit Capacity and Quality of Service Manual—2nd Edition
Exhibit 4-35 General Planning Guidelines for Bus Preferential Treatments: Uninterrupted Flow Facilities(R27)
Treatment
Minimum One-Way Peak Hour
Bus Volumes
Minimum One-Way Peak Hour Passenger
Volumes
Related Land Use and Transportation Factors
Exclusive busways on special right-of-way
40-60 1,600-2,400 Urban population: 750,000; CBD employment: 50,000; 1.85 million m2 CBD floor space; congestion in corridor; save buses 1 min/mi (0.6 min/km) or more.
Exclusive busways within freeway right-of-way
40-60 1,600-2,400 Freeways in corridor experience peak-hour congestion; save buses 1 min/mi (0.6 min/km) or more.
Busways on railroad right-of-way
40-60 1,600-2,400 Potentially not well located in relation to service area. Stations required.
Freeway bus lanes, normal flow
60-90 2,400-3,600 Applicable upstream from lane drop. Bus passenger time savings should exceed other road user delays. Normally achieved by adding a lane. Save buses 1 min/mi (0.6 min/km) or more.
Freeway bus lanes, contraflow
40-60 1,600-2,400 Freeways with six or more lanes. Imbalance in traffic volumes permits freeway LOS D in off-peak travel direction. Save buses 1 min/mi (0.6 min/km) or more.
Bus lane bypasses at toll plazas
20-30 800-1,200 Adequate queuing area on toll plaza approach, so bus lane access is not blocked.
Exclusive bus access to non-reserved freeway or arterial lane
10-15 400-600
Bus bypass lane at metered freeway ramp
10-15 400-600 Alternate surface street route available for metered traffic. Express buses leave freeways to make intermediate stops.
Bus stops along freeways
5-10 50-100* Generally provided at surface street level in conjunction with metered ramp.
*Boarding or alighting passengers in the peak hour.
Exhibit 4-36 General Planning Guidelines on the Effects of Bus Preferential Treatments: Uninterrupted Flow Facilities(R12,R34,R36)
Treatment
Travel Time Improvements
Person Delay Impacts Additional Considerations
Busways up to 10 percent; varies depending on routing and other design details
Minimal to significant, depending on the project
Applications may include special bus detection technologies that distinguishes buses from general traffic
HOV lanes Up to 20 percent; varies on out of direction travel
Significant, dependent on application
Freeway bus lanes 3-15% of overall travel time, up to 75% of delay
Minimal to significant, highly dependent on the strategy and location
Travel time improvements are a function of the existing delay.
Bus lane bypasses Up to 20%; up to 90% of ramp meter delay
Potentially significant Potential disruptions to queue storage needs on ramps.
Chapter 3—Planning Applications Page 4-36 Part 4/BUS TRANSIT CAPACITY

Transit Capacity and Quality of Service Manual—2nd Edition
Interrupted Flow Facilities
Urban Streets Bus lanes have been provided on urban streets by adding lanes, developing
contraflow lanes, and converting roadway shoulders for bus use. Several studies offer guidance in identifying factors that influence whether bus lanes may be appropriate. These factors include(R36)
• Congestion,
• Travel time savings,
• Person throughput,
• Vehicle throughput,
• Local agency support,
• Enforceability, and
• Physical roadway characteristics. Policy and cost considerations generally set the lower limit for bus volumes that
warrant priority treatments on arterials, while bus vehicle capacity sets the upper limit. A study of bus operations in Manhattan recommended the following desirable maximum a.m. peak hour bus volumes for arterial street bus lanes:(R28)
• Two lanes exclusively for buses: 180 bus/h;
• One lane exclusively for buses, partial use of adjacent lane: 100 bus/h;
• One lane exclusively for buses, no use of adjacent lane: 70 bus/h; and
• Buses in curb lane in mixed traffic: 60 bus/h. Exhibit 4-37 presents general planning guidelines for bus priority treatments on
arterial streets. A comparison of person volumes on buses operating in mixed traffic with person volumes in other vehicles operating on the street can also be used to help decide when to dedicate one or more lanes to exclusive bus use.
Exhibit 4-37 General Planning Guidelines for Bus Preferential Treatments: Urban Streets(R27,R44)
Treatment
Minimum One-Way Peak Hour
Bus Volumes
Minimum One-Way Peak Hour Passenger
Volumes
Related Land Use and Transportation Factors
Bus streets or malls 80-100 3,200-4,000 Commercially oriented frontage.
CBD curb bus lanes, main street
50-80 2,000-3,200 Commercially oriented frontage.
Curb bus lanes, normal flow
30-40 1,200-1,600 At least 2 lanes available for other traffic in same direction.
Median bus lanes 60-90 2,400-3,600 At least 2 lanes available for other traffic in same direction; ability to separate vehicular turn conflicts from buses.
Contraflow bus lanes, short segments
20-30 800-1,200 Allow buses to proceed on normal route, turnaround, or bypass congestion on bridge approach.
Contraflow bus lanes, extended
40-60 1,600-2,400 At least 2 lanes available for other traffic in opposite direction. Signal spacing greater than 500-ft (150-m) intervals.
Part 4/BUS TRANSIT CAPACITY Page 4-37 Chapter 3—Planning Applications

Transit Capacity and Quality of Service Manual—2nd Edition
Intersections The use of bus preferential treatments at intersections should be based on
person-delay studies at the intersection and local jurisdiction policies. In certain jurisdictions, priority of transit vehicles is maximized where possible to improve transit operations and the quality of service. In these instances, one need only evaluate the application and its feasibility from a cost and implementation perspective. Exhibit 4-38 presents general planning guidelines for bus preferential treatments at intersections. A comparison of typical effects on bus travel time and overall person delay is reported in Exhibit 4-39.
Exhibit 4-38 General Planning Guidelines for Bus Preferential Treatments: Intersections
Application Considerations Treatment Primary Secondary
Related Land Use and Transportation Factors
Bus-activated signal phases
Low-volume movement High bus delay on approach
At access points to bus lanes, busways, or terminals; or where bus turning movements experience significant delays.
Bus signal priority Intersections with high bus delay, coordinated signal system
Preferable at intersections with far-side stops
Traffic signal controller software may need to be upgraded.
Bus signal pre-emption
Intersections with high bus delay, uncoordinated signal system
Preferable at intersections without pedestrians
Pedestrian clearance or signal network constraints.
Special bus turn provisions
Route deviations to avoid turn prohibitions
Wherever vehicular turn prohibitions are located along routes.
Queue Jump Intersections with large amounts of control delay (HCM LOS D or worse)
Right turn lane existence, bus routes with sub-15 minute headways
Merge on opposite side of intersection should consider bus operations.
Curb Extensions Areas with high pedestrian traffic
Insufficient sidewalk space for shelter
Impacts to other road users and drainage issues.
Boarding Islands Streets with four or more lanes
Locations where geometric conditions allow
Impacts to other road users, ped access to island may be a concern.
Parking Restrictions Need for additional bus capacity
On-street parking exists Local business and residence parking impacts.
Stop Consolidation (permanent or temporary)
Long routes with high ratio of dwell time to travel time
Pedestrian environment May reduce access to transit routes if stops are too far apart.
BUS STOP AND FACILITY CAPACITY
The capacity analysis for transit facilities presented in the following chapters provides a highly detailed treatment of transit operations. The level of precision inherent in that analysis may exceed the accuracy of the available data. In contrast, for planning purposes, the only requirement is a concept for a potential improvement and a general understanding of how existing service operates.
Bus Volume and Capacity Relationships
The observed peak hour bus movements along freeways and city streets, and to or from bus terminals, provide guidelines for estimating the capacity of similar facilities. They also provide a means of checking or verifying more detailed capacity calculations. General planning guidelines are presented in Exhibit 4-40 that match scheduled bus volumes on downtown streets and arterial streets leading to the city center to qualitative descriptions of bus flow along those streets. Where stops are not heavily patronized, as along outlying arterial streets, bus volumes could be increased by about 25%.
Chapter 3—Planning Applications Page 4-38 Part 4/BUS TRANSIT CAPACITY

Transit Capacity and Quality of Service Manual—2nd Edition
Exhibit 4-39 General Planning Guidelines on the Effects of Bus Preferential Treatments: Intersections
Treatment
Bus Travel Time Improvements
Vehicle Delay Impacts Additional Considerations
Bus-activated signal phases
up to 10%
Minimal Applications may include special bus detection technologies that distinguish buses from general traffic.
Bus signal priority 3-15% of overall travel time, up to 75% of signal delay
Minimal to significant, highly dependent on the strategy and location
Travel time improvements are a function of the existing signal delay.
Bus signal pre-emption
Up to 20%, up to 90% of signal delay
Potentially significant Potential disruptions to signal coordination and transportation capacity.
Special bus turn provisions
Depends on route Minimal Safety concerns may require changes to signalization for bus-only movement.
Queue Jump 5-25% None, if using existing turn lane
Advance green at the intersection may facilitate exit from queue jump lane.
Curb Extensions Not enough data Potentially significant Potential impacts to general traffic.
Boarding Islands Not enough data Potential impacts to general traffic.
Parking Restrictions Not enough data None Auto access to local land uses is reduced.
Stop Consolidation (permanent or temporary)
3-20% of overall run time, up to 75% of dwell time
None Accessibility to transit service is reduced.
Exhibit 4-40 Planning-Level Bus Lane Service Volumes(R17,R46)
Description
Service Volume bus/lane/h
Average bus/lane/h
ARTERIAL STREETS Free Flow 25 or less 15 Stable Flow, Unconstrained 26 to 45 35 Stable Flow, Interference 46 to 75 60 Stable Flow, Some Platooning 76 to 105 90 Unstable Flow, Queuing 106 to 135 120 Forced Flow, Poor Operation over 135* 150*
DOWNTOWN STREETS Free Flow 20 or less 15
These service volumes may be used for planning purposes. More precise values for operations and design purposes should be computed from the capacity relationships and procedures presented later in Part 4.
Stable Flow, Unconstrained 21 to 40 30 Stable Flow, Interference 41 to 60 50 Stable Flow, Some Platooning 61 to 80 70 Unstable Flow, Queuing 81 to 100 90 Forced Flow, Poor Operation over 100* 110*
The values for forced flow conditions should not be used for planning or design. They are merely given for comparative purposes.
*Results in more than one-lane operation.
The number of people per hour that can be served by various bus flow rates and
passenger load factors on exclusive bus lanes are given in Exhibit 4-41. This exhibit provides a broad person-capacity planning guide that assumes that key boarding points are sufficiently dispersed to achieve these bus loads. It suggests maximum person-flow rates of about 6,450 people per hour per lane on downtown streets and 8,700 people per hour per lane on arterial streets. Corresponding maximum values for seated passenger flows are 4,300 and 5,800 people, respectively. Exclusive use of articulated buses would increase these values by 15 to 20%.
Part 4/BUS TRANSIT CAPACITY Page 4-39 Chapter 3—Planning Applications

Transit Capacity and Quality of Service Manual—2nd Edition
Load Factor (p/seat)Buses per Hour 0.00-0.50 0.51-0.75 0.76-1.00 1.01-1.25 1.26-1.50
ARTERIAL STREETS 25 or less 535 805 1,075 1,340 1,610 26 to 45 965 1,450 1,935 2,415 2,900 46 to 75 1,610 2,415 3,225 4,030 4,835 76 to 105 2,255 3,385 4,515 5,640 6,770 106 to 135 2,900 4,350 5,805 7,255 8,705
DOWNTOWN STREETS 20 or less 430 645 860 1,075 1,290 21 to 40 860 1,290 1,720 2,150 2,580 41 to 60 1,290 1,935 2,580 3,225 3,870 61 to 80 1,720 2,580 3,440 4,300 5,160 81 to 100 2,150 3,225 4,300 5,375 6,450
Exhibit 4-41 Maximum Bus Passenger Service Volumes for Planning Purposes
NOTE: Assumes 43 seats per bus and a peak hour factor of 1.00.
The passenger volumes presented in Exhibit 4-41 indicate the number of people that can be carried, assuming uniform flow during the peak hour (i.e., a peak hour factor of 1.00). As uniform flow rarely occurs and indicates underservicing of demand when it does occur, appropriate peak hour factors should be used to reduce these values to design levels to reflect passenger flow variations within the 15-minute peak period.
Busways Illustrative downtown busway bus and person capacities are given in Exhibit 4-
42 for a variety of bus types and service conditions. The key assumptions are:
• Fares are pre-paid at downtown busway stations. This eliminates the time required to pay fares on-board the bus and allows all doors to be used for loading. These measures greatly decrease the service time required per passenger, since several passengers can board at the same time and each individual passenger’s boarding time is minimized.
• Fifty percent of the maximum load point passengers board at the heaviest stop (i.e., boarding volumes at the critical downtown stop, rather than the busway facility itself, constrain capacity). A peak hour factor of 0.67 is used.
• No delays due to signals (grade-separated facility).
• The bus clearance time at stops is 10 seconds. The design failure rate is 7.5%, and a 60% coefficient of variation is assumed.
• Three linear loading areas are provided at each station.
• The maximum load section passenger volume is limited to 40 passengers per bus for standard buses and 60 passengers for articulated buses; this equates to a load factor of approximately 1.00 and provides a seat for all passengers.
Arterial Street Bus Lanes Exhibit 4-68 through Exhibit 4-72 in Appendix D provide graphs of arterial street
bus lane capacities for various situations. These graphs replicate the detailed capacity calculation procedures provided in Chapter 5 for the conditions identified with each graph. Note that these graphs provide capacities based on a single loading area at the critical stop. Multiply these capacities by the appropriate loading area equivalency factor from Exhibit 4-12 to obtain bus capacities for stops with multiple loading areas.
Chapter 3—Planning Applications Page 4-40 Part 4/BUS TRANSIT CAPACITY

Transit Capacity and Quality of Service Manual—2nd Edition
Exhibit 4-42 Illustrative Downtown Busway Capacities
Loading Condition A B C D
Stations: On-Line/Off-Line On Off On Off On Off On Off PASSENGERS BOARDING AT HEAVIEST STATION
Boarding passengers per bus 20 20 20 20 20 20 30 30 Boarding time per passenger (s) 2.0 2.0 1.2 1.2 0.7 0.7 0.5 0.5 Dwell time (s) 40.0 40.0 24.0 24.0 14.0 14.0 15.0 15.0
VEHICLE CAPACITY Loading area capacity (bus/h) 42 42 65 65 100 100 95 95 Effective loading areas 2.45 2.65 2.45 2.65 2.45 2.65 2.45 2.65 Station capacity (bus/h) 103 111 159 172 245 265 233 251
PASSENGERS PER HOUR AT MAXIMUM LOAD POINT Peak—flow rate (15 min x 4) 4,120 4,440 6,360 6,880 9,800 10,600 13,980 15,060Average—peak hour (with PHF) 2,760 2,970 4,260 4,600 6,570 7,100 9,370 10,090Loading condition A: Single-door conventional bus, simultaneous loading and unloading. Loading condition B: Two-door conventional bus, both doors loading or double-stream doors simultaneously
loading and unloading. Loading condition C: Four-door conventional bus, all double-stream doors loading. Loading condition D: Six-door articulated bus, all doors loading.
NOTE: Assumes 10-second clearance time, 7.5% failure rate, 60% coefficient of variation, 3 linear loading areas, g/C = 1.0, random bus arrivals, PHF = 0.67, 50% of passengers board at heaviest downtown station, 40 seats per conventional bus, 60 seats per articulated bus, no standees allowed.
Mixed Traffic Bus Operations Exhibit 4-73 in Appendix D provides graphs of mixed traffic capacities for
various situations. These graphs replicate the detailed capacity calculation procedures provided in Chapter 6 for the conditions identified with each graph. As before, these graphs provide capacities based on a single loading area at the critical stop. Multiply these capacities by the appropriate loading area equivalency factor from Exhibit 4-12 to obtain bus capacities for stops with multiple loading areas.
Bus Stops and Loading Areas Exhibits 4-64 through 4-66 in Appendix D provide graphs of bus capacities for
individual loading areas and bus stops consisting of a single loading area, based on various situations. These graphs replicate the detailed capacity calculation procedures provided in Chapter 1 for the conditions identified with each graph. Once again, multiply the capacities given by these graphs by the appropriate loading area equivalency factor from Exhibit 4-12 to obtain bus capacities for stops with multiple loading areas.
Factors Influencing Bus and Person Capacity Exhibit 4-43 summarizes the factors influencing bus capacity, bus speed, and
person capacity and suggests ways that each can be improved to provide additional capacity. Note that in some cases, increasing capacity or speed requires a trade-off with decreased quality of service.
Part 4/BUS TRANSIT CAPACITY Page 4-41 Chapter 3—Planning Applications

Transit Capacity and Quality of Service Manual—2nd Edition
Exhibit 4-43 Factors Influencing Bus Capacity and Speed
Item Ways To Improve Each Item CAPACITY INPUTS
Dwell Time Greater use of pre-paid fares Use low-floor vehicles (may reduce seating area) Encourage one-way door flows on two-door buses Provide multiple-stream doors for boarding and alighting Increase bus frequency to reduce the number of standees Implement proof-of-payment fare collection
Clearance Time Use on-line stops when only 1-2 loading areas at stop Enact and enforce yield-to-bus laws Implement queue jumps at traffic signals
Coefficient of Variation
Generally constant for a given area
Failure Rate Increase the number of loading areas at a stop Schedule fewer buses per hour using the stop (reduces availability)
CAPACITY OUTPUTS Loading Area Capacity
Reduce dwell time Implement transit priority treatments Increase the accepted failure rate (reduces reliability)
Bus Stop Capacity Increase loading area capacity Use off-line loading areas when 3 or more loading areas at stop Consider non-linear loading area designs Increase the number of loading areas
Bus Lane Capacity Increase the capacity of the critical stop Reserve lanes for buses Implement skip-stop operation Prohibit right turns by automobiles
Bus Speeds Reduce dwell time Implement transit preferential treatments Enforce restrictions on use of bus lane by other vehicles Balance the number of stops with passenger convenience and demand Consider supplementing local service with limited-stop service Implement skip-stop operation
Chapter 3—Planning Applications Page 4-42 Part 4/BUS TRANSIT CAPACITY

Transit Capacity and Quality of Service Manual—2nd Edition
CHAPTER 4. GRADE-SEPARATED FACILITIES
INTRODUCTION This chapter presents methodologies for analyzing bus operations on grade-
separated busways and freeway HOV lanes. Grade-separated busways are characterized by uninterrupted flow (i.e., no traffic signals), exclusive use by buses, and lanes physically separated from other traffic. At-grade busways, such as Miami’s South Dade Busway, have interrupted traffic flow due to traffic signals. These facilities should be analyzed using the arterial street bus lane procedures given in Chapter 5. Freeway HOV lanes also have uninterrupted flow, but may be shared with other passenger vehicles with a designated number of occupants (typically 2 or 3), and are not necessarily physically separated from other traffic.
Grade-separated busways are characterized by at least one separated lane reserved exclusively for buses and uninterrupted flow. At-grade busways (having interrupted flow) are analyzed as arterial street bus lanes and are addressed in Chapter 5.
BUS CAPACITY
Grade-Separated Busways Exhibit 4-44 shows typical design features that influence capacity and quality of
service, using the South East Busway in Brisbane, Australia, as an example. Exhibit 4-44 Typical Grade-Separated Busway Design Features
(a) Exclusive, Grade-Separated Facility (b) Passing Lanes at Stations
(c) Multiple Loading Areas (d) Grade-Separated Pedestrian Crossings
(e) Integration with Adjacent Land Uses (f) Park-and-Ride Lots, Feeder Bus Access
Part 4/BUS TRANSIT CAPACITY Page 4-43 Chapter 4—Grade-Separated Facilities

Transit Capacity and Quality of Service Manual—2nd Edition
• Exclusive, grade-separated, uninterrupted flow facilities eliminate delays due to signals and other non-transit vehicles. This results in higher capacity, higher operating speeds (typically 45 to 50 mph or 70 to 80 km/h), and higher average speeds, when station stops or slowdowns are accounted for. Reliability is improved, as most factors that tend to delay buses are removed.
• Passing lanes at stations allow both express and local service. Express buses can bypass stations, although for safety reasons they often slow to 15 to 30 mph (25 to 50 km/h) within stations. When passing lanes are provided at all stations, express services are not delayed by local buses making stops, and the total number of buses that can use the busway therefore is significantly greater than the capacity of an individual busway station.
Express buses typically slow to 15 to 30 mph (25 to 50 km/h) within stations, with the lower end applying when pedestrians can cross the busway at grade.
• Multiple loading areas allow more buses to stop simultaneously, increasing local bus service capacity and minimizing the possibility of a bus stop failure occurring (a bus arriving to find all loading areas already occupied).
• Pre-payment of fares, or pay-on-exit fare systems allow all doors to be used for boarding at the stops with the highest boarding volumes. This minimizes dwell time and improves both speed and capacity.
• Grade-separated pedestrian crossings improve safety by separating bus and pedestrian traffic. Express buses may be able to operate faster through stations when pedestrian crossings are not allowed, although typical operating practice calls for a reduced speed through stations due to potential conflicts with other buses and pedestrians illegally crossing the busway.
• Busway connections to the local street system allow local neighborhood buses to access the busway after picking up passengers and then continuing as a local or express service to the downtown. This operation provides a one-seat ride to the downtown for passengers, eliminating delays to passengers associated with transferring between buses.
• Park-and-ride lots focus passenger demand to a limited number of stops, allowing each stop to serve a relatively high passenger demand.
• Integrating the busway with major land uses minimizes passenger walking distances to major destinations and may avoid the need for passengers to cross wide or busy streets to get to their destination.
Typically, the maximum number of buses that can use a busway will not be constrained by the busway itself but by conditions before or after the busway—often the surface street system that buses use to get to downtown stops. For example, in Brisbane, the South East Busway exits onto an arterial street bus lane that leads to a bridge into downtown; this street also serves a number of local routes that do not use the busway proper. Presently, a station along this street that has no passing lane (due to limited space) constrains capacity. When this constraint is addressed, then traffic signals along the street will become the capacity constraint.
Exhibit 4-45 Illustrative Capacity Constraints After Exclusive Busway Section
(a) No Passing Lane Available (b) Traffic Signals
Chapter 4—Grade-Separated Facilities Page 4-44 Part 4/BUS TRANSIT CAPACITY
Transit Capacity and Quality of Service Manual—2nd Edition
The capacity of local services using the busway will be constrained by the stop with the highest dwell time along the busway, assuming all stations are designed with a similar number of loading areas. Peak hour factors of 0.67 to 0.75 are reasonable for busways, depending on the location and type of operation.
If the busway extends into the downtown (for example, Seattle’s bus tunnel) and has a limited number of stations in the downtown area, the busway’s passenger distribution characteristics will be similar to those of a rail line. A reasonable design assumption is that 50% of the maximum load point volume will be served at the heaviest downtown busway station—assuming a minimum of three stops in the downtown area. (For comparison, the Washington-State Street subway station in Chicago accounts for about one-half of all boarding passengers at the three downtown stops on the State Street subway line.)(R40)
Grade-separated busways with a limited number of downtown stops have passenger distribution characteristics similar to rail lines.
Equation 4-9 provides the bus capacity of local service (making all stops) using the busway; Equation 4-8 in Chapter 1 provides the corresponding person capacity. Planning-level estimates of busway person capacity can be found in Exhibit 4-42. To determine the total number of local and express buses that can use the busway, and the corresponding person capacity, use the procedures in Chapters 5 and 6 (for arterial street bus lanes and mixed traffic, respectively) and Part 7 (bus stop, station, and terminal capacity) to determine the capacity constraint prior to or following the busway section.
minsBB ,= Equation 4-9
where: B = bus capacity for local busway service (bus/h); and Bs,min = minimum bus stop capacity along the busway (bus/h).
Freeway HOV Lanes Freeway HOV lanes are designed to increase the potential person capacity of a
freeway by reserving one or more lanes, either part-time or full-time, for the use of vehicles with multiple occupants. When the regular freeway lanes experience congestion, vehicles in the HOV lane should still travel freely, so that the HOV lane provides the time-savings benefit that attracts users to the lane and thus results in a more efficient use of the freeway lanes.
In order to maintain this time-savings incentive (and to continue to move more people through the freeway segment than would be possible without the HOV lane), HOV lanes should not operate at or near capacity. The level of service provided to persons traveling in an HOV lane should be better during peak periods than the level of service provided to vehicles traveling in the regular freeway lanes. This level of service can be calculated using the procedures given in the Highway Capacity Manual.
Calculating the theoretical bus capacity, or service volume, for freeway HOV lanes used exclusively by buses is not practical for two reasons. First, with the exception of the New Jersey approach to the Lincoln Tunnel, no North American transit agency schedules so many buses as to come close to the capacity of a basic freeway segment. The Lincoln Tunnel approach, an a.m. peak hour contraflow lane, is used by 735 buses per hour that make no stops along the lane. The buses feed the Port Authority Bus Terminal, which provides 210 berths to accommodate these and other buses.(R30)
Second, the number of buses that can be scheduled along the freeway HOV lane will be constrained by the vehicle capacity of off-line (“freeway flyer”) stops along the HOV lane (see Exhibit 4-46), or by the capacity of on-street sections or a bus terminal following the bus lane. When all buses stop at off-line stops along the HOV lane, the lane’s bus capacity can be calculated using Equation 4-9 above, and its person capacity can be calculated using Equation 4-8 in Chapter 1.
Part 4/BUS TRANSIT CAPACITY Page 4-45 Chapter 4—Grade-Separated Facilities

Transit Capacity and Quality of Service Manual—2nd Edition
Exhibit 4-46 Freeway HOV Lane with Off-Line Stop (Seattle)
(a) Right-Side HOV Lane (b) Off-Line HOV Bus Stop
BUS SPEEDS The average speed of a bus operating on a grade-separated busway or freeway
HOV lane depends on three factors:
• The running speed of the bus in the lane,
• Bus stop or station spacing, and
• Dwell time at bus stops or stations. The running speed of buses operating in a grade-separated busway or an
exclusive freeway HOV lane (not shared with other vehicles) can be assumed to be equivalent to the posted speed limit. For freeway HOV lanes shared with other vehicles, the Highway Capacity Manual may be used to estimate the running speed of vehicles in the lane, given the lane’s free-flow speed, the traffic volume, and the mix of passenger vehicles and buses using the lane. Note that the HCM procedures only apply to lanes operating below capacity. The time required to travel the length of the HOV lane, without stopping, can be calculated from this running speed.
Bus stop spacing affects how often buses must stop or slow. The dwell time and acceleration/deceleration delays associated with each stop reduce overall bus speeds. A rate of 4.0 ft/s2 (1.2 m/s2) may be assumed for acceleration and deceleration, in the absence of local data.(R36) Exhibit 4-47 presents average travel speeds for a selection of running speeds, dwell times, and bus stop spacings. As would be expected, average bus speeds decrease as the stop spacing increases and as the average dwell time per stop increases.
Exhibit 4-47 Estimated Average Speeds of Buses Operating on Busways and Exclusive Freeway HOV Lanes (mph)
Average Stop Average Dwell Time (s)Spacing (mi) 0 15 30 45 60
50 mph Running Speed 0.5 36 26 21 18 16 1.0 42 34 30 27 24 1.5 44 38 35 32 29 2.0 46 41 37 35 32 2.5 46 42 39 37 35
55 mph Running Speed 0.5 37 27 22 18 16 1.0 44 36 31 28 25 1.5 47 40 36 33 30 2.0 49 43 40 37 34 2.5 50 45 42 39 37
60 mph Running Speed 0.5 37 27 22 19 16 1.0 46 37 32 28 25 1.5 50 43 38 34 31 2.0 52 46 42 39 36 2.5 54 48 45 41 39
An alternative exhibit using metric units appears in Appendix A.
NOTE: Assumes constant 4.0 ft/s2 acceleration/deceleration rate. Use the zero dwell time column for express buses slowing, but not stopping at stations (25 mph station speed limit and 325-ft-long speed zone through station assumed).
Chapter 4—Grade-Separated Facilities Page 4-46 Part 4/BUS TRANSIT CAPACITY

Transit Capacity and Quality of Service Manual—2nd Edition
CHAPTER 5. ARTERIAL STREET BUS LANES
INTRODUCTION This chapter presents methodologies for analyzing the operation of buses using
arterial street bus lanes and at-grade busways. The key characteristics of these facilities are at least one lane reserved exclusively for use by buses (except possibly at intersections), and interrupted flow (e.g., traffic signals, stop signs, etc.). Busways that have traffic signals located along them should be analyzed using the procedures in this chapter.
Arterial street bus lanes are characterized by at least one lane exclusively for buses (except possibly at intersections) and interrupted flow.
BUS LANE TYPES Several types of exclusive bus lanes exist. The capacity procedures used in this
chapter define three types of bus lanes, based on the availability of the adjacent lane for buses to pass each other. Exhibit 4-48 illustrates and describes each kind of lane.
Exhibit 4-48 Exclusive Bus Lane Types
Type 1
• Buses have no use of adjacent lane • Contraflow lanes • Physically channelized lanes (a) Denver, (b) Orlando
Type 2
• Buses have partial use of adjacent lane, depending on other traffic
• Right turns by other vehicles may or may not be prohibited
(c) Montréal, (d) Madison
Type 3
• Buses have full use of adjacent lane • Right turns prohibited (except
buses) • Includes at-grade busways with
single lanes, but passing lanes at stops
(e) New York, (f) Miami
BUS CAPACITY The bus capacity of an arterial street bus lane depends on several factors:
• The bus capacity of the critical bus stop(s) along the lane, The critical stop capacity depends on average dwell time at the stop, traffic signal timing, the number of loading areas provided, and other factors discussed in Chapter 1.
• The bus lane type,
• Whether or not skip-stops are used,
• Whether or not buses move along the lane in platoons,
• The volume-to-capacity ratio of the adjacent lane (for Type 2 bus lanes), and
• Bus stop locations and right-turning volumes made from the bus lane. If no special operational procedures, such as skip-stops, are used and if right
turns by non-transit vehicles are prohibited, then the bus lane capacity is simply the bus capacity of the critical bus stop along the bus lane. However, when skip-stops are used or when right turns are allowed, then adjustments must be made to this base capacity, as described in the following sections.
Part 4/BUS TRANSIT CAPACITY Page 4-47 Chapter 5—Arterial Street Bus Lanes

Transit Capacity and Quality of Service Manual—2nd Edition
Right-Turning Traffic Delays Right-turning traffic competes with buses for space at an intersection. This traffic
generally turns from the bus lane, although in some cases (as in Houston) some right turns are made from the adjacent lane. The right turns may queue behind buses at a near-side bus stop to make a right turn. Conversely, right-turning traffic may block buses or pre-empt signal green time from them. The interference of right-turning traffic on bus operations can be further magnified by significant pedestrian crossing volumes that block right-turn movements. The placement of the bus stop at the intersection—near-side, far-side, or mid-block—can also influence the amount of delay induced by, and imposed on, the right-turning traffic.
Capacity adjustment for the effects of right-turning traffic
Exhibit 4-49 Examples of Auto Turning Conflicts with Buses
(a) Los Angeles (right turn) (b) Portland, Oregon (left turn)
The conflicts between buses and right turns are greatest where there is a near-side stop and buses are unable to freely use the bus lane. Automobiles turning right may block access to the bus stop; conversely, buses boarding or discharging passengers on the green signal indication may block right turns. The amount of interference diminishes as the distance between the stop line and bus stop increases. Far-side or mid-block stops therefore minimize the effects of right turns on bus speeds, when buses can use the adjacent lane. Placing stops at locations where there are no right turns can further minimize impacts. Right turns by general traffic are usually prohibited when dual or contraflow bus lanes are used.
Just as right turns across bus lanes delay buses along the arterial, pedestrians using crosswalks parallel to the bus lane delay right-turning vehicles. This, in turn, results in increased delays to buses in the bus lane. The delays introduced by pedestrians are concentrated at the beginning of the signal green interval for bus movement on the arterial, when queued groups of pedestrians step off the curb.
By crossing or utilizing space in the bus lane to execute their turn, right-turning vehicles reduce the bus lane vehicle capacity by using a portion of the green time available to buses. Thus, bus lane vehicle capacity will be approached more quickly when right turns occur. For bus volumes less than one-half of the bus lane capacity, there is generally little impact on bus lane capacity or speed from a moderate volume of right turns, unless pedestrian volumes are very heavy. Detailed procedures for estimating right-turn vehicle capacity are given in the Highway Capacity Manual. A planning-level estimate of right-turn vehicle capacity is provided in Exhibit 4-50.
Exhibit 4-50 Right-Turn Vehicle Capacities for Planning Applications (veh/h)
Conflicting ped g/C Ratio for Bus Lanevolume (ped/h) 0.35 0.40 0.45 0.50 0.55 0.60
0 510 580 650 730 800 870 100 440 510 580 650 730 800 200 360 440 510 580 650 730 400 220 290 360 440 510 580 600 70 150 220 290 360 440 800 0 0 70 150 220 290
1,000 0 0 0 0 70 150 SOURCE: Chapter 16 of the HCM 2000 (R15), based on 1450*(g/C)*(1-((ped. volume)/(g/C))/2000).
NOTE: Values shown are for CBD locations, multiply by 1.1 for other locations. Calculations assume that the
bus lane acts as an exclusive right-turn lane for all vehicles other than buses.
Chapter 5—Arterial Street Bus Lanes Page 4-48 Part 4/BUS TRANSIT CAPACITY

Transit Capacity and Quality of Service Manual—2nd Edition
The effects of right turns on bus lane vehicle capacity can be estimated by multiplying the bus lane vehicle capacity without right turns by an adjustment factor. The values of this adjustment factor, fr, may be estimated from Equation 4-10:(R36)
⎟⎟⎠
⎞⎜⎜⎝
⎛−=
r
rlr c
vff 1 Equation 4-10
where: fr = right-turn adjustment factor; fl = bus stop location factor, from Exhibit 4-51; vr = volume of right turns at specific intersection (veh/h); and cr = capacity of right turns at specific intersection (veh/h).
Values of the bus stop location factor, fl, are shown in Exhibit 4-51. Where right turns are allowed, the factor ranges from 0.5 (for a far-side stop with the adjacent lane available for buses) to 1.0 (for a near-side stop with all buses restricted to a single lane). A factor of 0.0 is used for Type 3 lanes, as right turns are not allowed by non-transit vehicles from this type of bus lane. These factors reflect the likely ability of buses to move around right turns. At critical intersections on some bus lanes, all turns could be prohibited and pedestrian walk signals delayed in order to improve bus capacity.
Exhibit 4-51 Bus Stop Location Factors, fl (R36)
Bus Lane TypeBus Stop Location Type 1 Type 2 Type 3 Near-side 1.0 0.9 0.0 Mid-block 0.9 0.7 0.0 Far-side 0.8 0.5 0.0
NOTE: fl = 0.0 for contraflow bus lanes and median bus lanes, regardless of bus stop location or bus lane type, as right turns are either prohibited or do not interfere with bus operations.
Skip-Stop Operations The total buses per hour that can be served by a series of skip-stops represents
the sum of the capacities of bus routes using each stop, multiplied by an impedance factor, fk, reflecting inefficient arrival patterns and the effects of high volumes of vehicular traffic in the adjacent lane. Equation 4-11 represents the factors that impede buses from fully utilizing the added capacity provided by skip-stop operations.(R36)
ss
ssiak N
Nfff )1(1 −+= Equation 4-11
where: The arrival type factor reflects how efficiently buses arrive at stops: do a clump of buses arrive at once, with a lot of passing activity and delay from other buses, or are buses managed to spread out arrivals over time and minimize bus passing activity? The factor depends on how well buses are scheduled and how well they are able to adhere to the schedule.
fa = arrival type factor, reflecting the ability to fully utilize the bus stops in a skip-stop operation:
= 0.50 for random arrivals (poor scheduling/poor schedule adherence), = 0.75 for typical arrivals (imperfect schedule adherence), and = 1.00 for platooned arrivals (buses travel in groups, like cars of a train); fi = adjacent lane impedance factor, from Equation 4-12; and Nss = number of alternating skip-stops in sequence.
3
8.01 ⎟⎠⎞
⎜⎝⎛−=
cvfi
Equation 4-12
where: v = traffic volumes in the adjacent lane (veh/h); and c = capacity of the adjacent lane (veh/h).
Part 4/BUS TRANSIT CAPACITY Page 4-49 Chapter 5—Arterial Street Bus Lanes
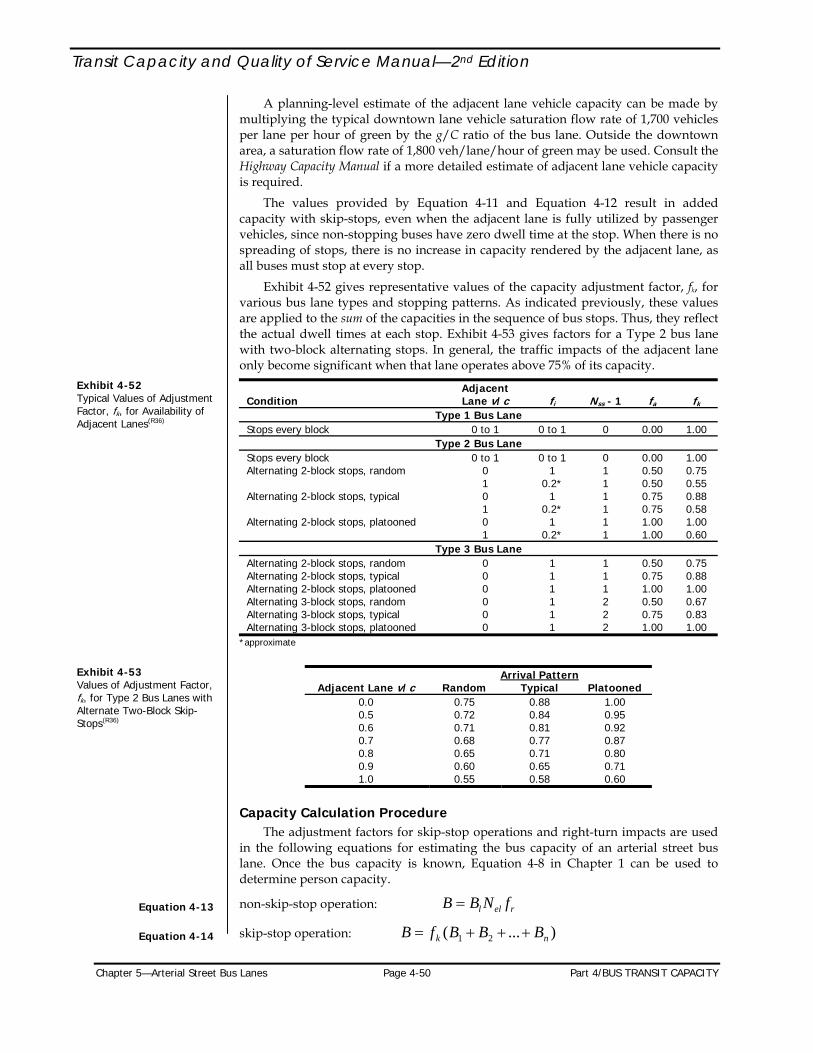
Transit Capacity and Quality of Service Manual—2nd Edition
A planning-level estimate of the adjacent lane vehicle capacity can be made by multiplying the typical downtown lane vehicle saturation flow rate of 1,700 vehicles per lane per hour of green by the g/C ratio of the bus lane. Outside the downtown area, a saturation flow rate of 1,800 veh/lane/hour of green may be used. Consult the Highway Capacity Manual if a more detailed estimate of adjacent lane vehicle capacity is required.
The values provided by Equation 4-11 and Equation 4-12 result in added capacity with skip-stops, even when the adjacent lane is fully utilized by passenger vehicles, since non-stopping buses have zero dwell time at the stop. When there is no spreading of stops, there is no increase in capacity rendered by the adjacent lane, as all buses must stop at every stop.
Exhibit 4-52 gives representative values of the capacity adjustment factor, fk, for various bus lane types and stopping patterns. As indicated previously, these values are applied to the sum of the capacities in the sequence of bus stops. Thus, they reflect the actual dwell times at each stop. Exhibit 4-53 gives factors for a Type 2 bus lane with two-block alternating stops. In general, the traffic impacts of the adjacent lane only become significant when that lane operates above 75% of its capacity.
Exhibit 4-52 Typical Values of Adjustment Factor, fk, for Availability of Adjacent Lanes(R36)
Condition
Adjacent Lane v/c
fi
Nss - 1
fa fk
Type 1 Bus Lane Stops every block 0 to 1 0 to 1 0 0.00 1.00
Type 2 Bus Lane Stops every block 0 to 1 0 to 1 0 0.00 1.00 Alternating 2-block stops, random 0 1 1 0.50 0.75 1 0.2* 1 0.50 0.55 Alternating 2-block stops, typical 0 1 1 0.75 0.88 1 0.2* 1 0.75 0.58 Alternating 2-block stops, platooned 0 1 1 1.00 1.00 1 0.2* 1 1.00 0.60
Type 3 Bus Lane Alternating 2-block stops, random 0 1 1 0.50 0.75 Alternating 2-block stops, typical 0 1 1 0.75 0.88 Alternating 2-block stops, platooned 0 1 1 1.00 1.00 Alternating 3-block stops, random 0 1 2 0.50 0.67 Alternating 3-block stops, typical 0 1 2 0.75 0.83 Alternating 3-block stops, platooned 0 1 2 1.00 1.00
*approximate
Exhibit 4-53 Values of Adjustment Factor, fk, for Type 2 Bus Lanes with Alternate Two-Block Skip-Stops(R36)
Arrival PatternAdjacent Lane v/c Random Typical Platooned
0.0 0.75 0.88 1.00 0.5 0.72 0.84 0.95 0.6 0.71 0.81 0.92 0.7 0.68 0.77 0.87 0.8 0.65 0.71 0.80 0.9 0.60 0.65 0.71 1.0 0.55 0.58 0.60
Capacity Calculation Procedure The adjustment factors for skip-stop operations and right-turn impacts are used
in the following equations for estimating the bus capacity of an arterial street bus lane. Once the bus capacity is known, Equation 4-8 in Chapter 1 can be used to determine person capacity.
non-skip-stop operation: rell fNBB = Equation 4-13
skip-stop operation: )...( 21 nk BBBfB +++= Equation 4-14
Chapter 5—Arterial Street Bus Lanes Page 4-50 Part 4/BUS TRANSIT CAPACITY

Transit Capacity and Quality of Service Manual—2nd Edition
where: B = bus lane capacity (bus/h); Bl = loading area bus capacity at the critical bus stop (bus/h); Nel = number of effective loading areas at the critical bus stop; fr = capacity adjustment factor for right turns at the critical bus stop; fk = capacity adjustment factor for skip-stop operations; and B1…Bn = bus capacities of each set of routes, at their respective critical bus
stops, that use the same alternating skip-stop pattern (bus/h).
The capacities B1, B2, and so forth used in Equation 4-14 are calculated separately for each set of routes using a particular skip-stop pattern. When determining the critical stop(s), several bus stops may have to be tested to determine which one controls the bus lane’s capacity, as one stop may have high dwell times, while another may have severe right-turning traffic interferences. Chapter 3 provides graphs depicting arterial street bus lane capacities based on these equations.
Several bus stops may need to be tested to determine the critical bus stop, as either dwell times or right-turning volume may control.
Exhibit 4-54 illustrates the effects of dwell time, right-turning volume from the bus lane, and conflicting pedestrian volumes on bus lane capacity, based on various dwell times, right-turning volumes, and pedestrian volumes, as well as other assumptions listed in the exhibit.
Exhibit 4-54 Illustrative Bus Lane Vehicle Capacity: Non-Skip-Stop Operation
0
10
20
30
40
50
60
70
80
0 50 100 150 200 250 300 350 400
Right-Turn Volume (veh/h)
Sing
le L
oadi
ng A
rea
Cap
acity
(bus
/h)
30 s, 0 peds 30 s,100 peds 30 s, 200 peds 30 s, 400 peds
60 s, 0 peds 60 s, 100 peds 60 s, 200 peds 60 s, 400 peds NOTE: Exhibit uses the following assumptions: g/C = 0.5, near-side stops, Type 2 bus lane, 2 linear loading areas
per stop, 60% coefficient of variation of dwell times, 25% failure rate, 15-s clearance time, typical bus arrivals, permitted right-turn signal phasing, shared right-turn lane, and bus volumes minimal in relation to right-turn volumes (PRT = 1.0).
It can be seen that at low right-turn and pedestrian volumes, dwell time controls capacity. Conflicting pedestrian volumes under 200 per hour have little effect on bus vehicle capacity, but have substantial effects at higher conflicting volumes, especially as right-turning volumes increase. However, when right-turn conflicts do not exist, conflicting pedestrian volumes have no impact on vehicle capacity, and the lines for a given dwell time converge to a single point. It can also be seen that the lines for a given pedestrian volume converge toward a point where the right-turn capacity is exceeded and the bus lane capacity drops to zero. Between these two extremes, bus vehicle capacity steadily declines as right-turning volumes increase, until a point is reached where the bus demand volumes exceed the lane’s bus capacity.
Exhibit 4-55 illustrates the same situations, except that the buses employ a two-stop skip-stop operation, and the adjacent lane is assumed to have 500 vehicles per hour (resulting in an approximate v/c ratio of 0.6 at a g/C ratio of 0.5). For a given right-turning volume, the corresponding bus lane vehicle capacity is about 63% higher than if skip-stops were not used.
Part 4/BUS TRANSIT CAPACITY Page 4-51 Chapter 5—Arterial Street Bus Lanes

Transit Capacity and Quality of Service Manual—2nd Edition
Chapter 5—Arterial Street Bus Lanes Page 4-52 Part 4/BUS TRANSIT CAPACITY
Exhibit 4-55 Illustrative Bus Lane Vehicle Capacity: Skip-Stop Operation
0
10
20
30
40
50
60
70
80
90
100
110
120
130
0 50 100 150 200 250 300 350 400
Right-Turn Volume (veh/h)
Sing
le L
oadi
ng A
rea
Cap
acity
(bus
/h)
30 s, 0 peds 30 s,100 peds 30 s, 200 peds 30 s, 400 peds
60 s, 0 peds 60 s, 100 peds 60 s, 200 peds 60 s, 400 peds NOTE: Exhibit uses the following assumptions: g/C = 0.5, near-side stops, two-stop pattern, Type 2 bus lane, 2
linear loading areas per stop, 60% coefficient of variation of dwell times, 25% failure rate, 15-s clearance time, typical bus arrivals, permitted right-turn signal phasing, shared right-turn lane, and bus volumes minimal in relation to right-turn volumes (PRT = 1.0).
Comparing the slopes of the lines in Exhibit 4-54 and Exhibit 4-55, the bus lane capacity drops to zero at the same right-turn volume, whether or not skip-stops are used. This suggests that controlling right turns (either through turn restrictions or bus stop location that takes advantage of one-way street grids) should be the first consideration for improving capacity, particularly in areas with relatively high pedestrian volumes. As will be seen shortly, actions that improve bus capacity also have a beneficial effect on bus speeds. When right turns are not a significant capacity factor, skip-stops can be used to further increase capacity and speed.
BUS SPEEDS The best way to determine bus travel speeds is to measure them directly. When
this is not possible (for example, when planning future service), speeds can be estimated by driving the route, making an average number of stops with simulated dwells and making two or three runs during peak and off-peak times; scheduling buses based on similar routes and adjusting running times as needed based on the operating experience; or using the analytical methods described below.
Bus speeds are best measured directly or estimated based on local conditions and operating experience.
Arterial Streets Bus speeds on arterial street bus lanes are influenced by bus stop spacing, dwell
times, delays due to traffic signals and right-turning traffic, skip-stop operations, and interferences caused by other buses. These factors are reflected in Equation 4-15, which can be used to estimate bus travel speeds on arterial streets. A bus running time is determined from Exhibit 4-56 and Exhibit 4-57, accounting for the effects of stop spacing, dwell times, and traffic and signal delays. This running time is then converted into a speed and adjusted to account for the effects of skip-stop operations and the interference of other buses operating in the lane.
bslr
t fftt
S ⎟⎟⎠
⎞⎜⎜⎝
⎛+
=60
Equation 4-15
where: St = travel speed (mph, km/h); tr = base bus running time (min/mi, min/km); tl = bus running time losses (min/mi, min/km); fs = stop pattern adjustment factor, from Equation 4-16; and fb = bus-bus interference adjustment factor, from Exhibit 4-59.

Transit Capacity and Quality of Service Manual—2nd Edition
Bus Travel Time Rates Exhibit 4-56 and Exhibit 4-57 together provide an estimate of bus running times
as a function of stop spacing, average dwell time per stop (not just the critical stop), and operating environment. These values were derived from field observations. First, a base bus running time is determined from Exhibit 4-56. This running time reflects the speed at which buses would travel without any signal or traffic delays. Next, additional running time losses are determined from Exhibit 4-57, accounting for the effects of signals and other traffic sharing the bus lane. If actual observed delays are available, they could be used in lieu of the estimates given in Exhibit 4-57. The two running times are added to each other and divided into 60 to determine a base bus speed for use in Equation 4-15.
Dwell times used for speed analysis are the average of all stops in the study section, not the critical stop average dwell time used for capacity analysis.
Average speeds can be calculated for any distance and series of stop patterns. When examining a corridor, the length of the study area, the number of bus stops, and the dwell times at each stop will affect the speed results. The capacity calculation should be made at the critical stop along the arterial, where the combination of dwell time and dwell variation result in the lowest calculated capacity. Maximum capacity (i.e., a 25% failure rate) should be used for speed calculation purposes. Sections chosen for analysis should have generally homogeneous characteristics in terms of street geometry, bus lane features, stop frequency, and dwell times. The average dwell time and highest v/c ratio in each section should be used in estimating speeds. Sections should be at least 0.25 mile (400 m) and preferably 0.5 mile (800 m) long.
The bus capacity used for speed analysis is based on a 25% failure rate (i.e., maximum capacity) at the critical stop.
When applying Exhibit 4-57, the additional running time loss selected from a possible range of losses should consider both signal timing and enforcement efforts (or the lack thereof) to keep non-authorized vehicles out of a bus lane.
Stops per mileDwell Time (s) 2 4 5 6 7 8 10 12
10 2.40 3.27 3.77 4.30 4.88 5.53 7.00 8.75 20 2.73 3.93 4.60 5.30 6.04 6.87 8.67 10.75
Exhibit 4-56 Estimated Base Bus Running Time, tr (min/mi)(R37)
30 3.07 4.60 5.43 6.30 7.20 8.20 10.33 12.75 40 3.40 5.27 6.26 7.30 8.35 9.53 12.00 14.75 50 3.74 5.92 7.08 8.30 9.52 10.88 13.67 16.75 60 4.07 6.58 7.90 9.30 10.67 12.21 15.33 18.75
An alternative exhibit using metric units appears in Appendix A.
NOTE: Data based on field measurements. Interpolate between dwell time values on a straight-line basis.
Condition
Bus Lane
Bus Lane, No Right
Turns
Bus Lane With Right Turn Delays
Bus Lanes Blocked by
Traffic
Mixed Traffic Flow
CENTRAL BUSINESS DISTRICT Typical 1.2 2.0 2.5-3.0 3.0 Signals Set for Buses 0.6 1.4
Exhibit 4-57 Estimated Base Bus Running Time Losses, tl (min/mi)(R37)
Signals More Frequent Than Bus Stops
1.5-2.0 2.5-3.0 3.0-3.5 3.5-4.0
ARTERIAL ROADWAYS OUTSIDE THE CBD Typical 0.7 1.0 Range 0.5-1.0 0.7-1.5
An alternative exhibit using metric units appears in Appendix A.
NOTE: Data based on field measurements. Traffic delays shown reflect peak conditions.
Adjustmen for Skip-Stop Operation tSkip-stop operations spread buses out among a series of bus stops, allowing for
an increase in speeds. The analytical procedure accounts for the skip-stop operations by considering only the bus stops in the skip-stop pattern. For example, if bus stops are located 400 feet (125 m) apart (say a stop at each intersection), a two-block skip-stop pattern provides 800 feet (250 m) between stops for a bus using that pattern. A bus with a two-block stop pattern would be able to proceed faster than a bus with a one-block stop pattern. However, some of this increase will be offset by increases in dwell times, as each stop will have to accommodate more passengers.
Part 4/BUS TRANSIT CAPACITY Page 4-53 Chapter 5—Arterial Street Bus Lanes

Transit Capacity and Quality of Service Manual—2nd Edition
The ability of buses to leave the curb lane to pass stopped vehicles is another factor in the ability to attain an increase in speed. This ability depends on the availability of an adjacent lane or the provision of an off-line bus stop. Where dual bus lanes or off-line bus stops are provided, the anticipated bus speed can be calculated using the distance between the bus stops served. Where congestion in the adjacent lane results in essentially no passing-lane availability, the buses will progress as if they were stopping at each stop with a zero dwell time at the intermediate stops. When partial use of the adjacent lane is available, the bus speed will be somewhere in between.
Equation 2-17 expresses the speed adjustment factor for skip-stop operation, fs, as a function of both the traffic in the adjacent lane and the buses in the curb lane.(R36) This factor reduces the faster base running time that results from the longer distances between stops used in the skip-stop pattern. If skip-stops are not used, fs = 1.0 and the base running speed is based on the actual stop spacing.
⎟⎟⎠
⎞⎜⎜⎝
⎛⎟⎠⎞
⎜⎝⎛
⎟⎟⎠
⎞⎜⎜⎝
⎛−=
p
ps B
vcv
ddf
2
2
1 1 Equation 4-16
where: fs = stop pattern adjustment factor; d1 = distance for one-block stop pattern (ft, m); d2 = distance for multiple-block stop pattern (ft, m); v = volume in adjacent lane (veh/h); Speed should be estimated
separately for each pattern. Bus capacity should be based on a 25% failure rate.
c = vehicular capacity of adjacent lane (veh/h); vp = bus volume in pattern (bus/h); and Bp = maximum bus capacity of critical bus stop in pattern (bus/h).
Exhibit 4-58 illustrates the effects of increases in the bus v/c ratio and general traffic v/c ratio in the adjacent lane on the stop pattern adjustment factor. The exhibit assumes a two-block stop pattern. It can be seen that until the volume of the adjacent lane becomes more than about 50% of the bus lane capacity, the ability to achieve the two-fold increase in speed is not significantly reduced, regardless of the bus lane v/c ratio. At higher v/c ratios, both the bus lane volumes and the adjacent lane volumes play an important role in determining bus speeds.
Exhibit 4-58 Illustrative Skip-Stop Speed Adjustment Effects
0.50
0.55
0.60
0.65
0.70
0.75
0.80
0.85
0.90
0.95
1.00
0.0 0.1 0.2 0.3 0.4 0.5 0.6 0.7 0.8 0.9 1.0
Adjacent Lane v/c Ratio
Stop
Pat
tern
Adj
ust
men
t Fa
ctor
Bus v/c = 0.1Bus v/c = 0.2Bus v/c = 0.3Bus v/c = 0.4Bus v/c = 0.5Bus v/c = 0.6Bus v/c = 0.7Bus v/c = 0.8Bus v/c = 0.9Bus v/c = 1.0
NOTE: Assumes two-block skip-stop pattern.
Chapter 5—Arterial Street Bus Lanes Page 4-54 Part 4/BUS TRANSIT CAPACITY

Transit Capacity and Quality of Service Manual—2nd Edition
Bus Bus Interference -Bus speeds within a bus lane along an arterial street decline as the lane becomes
saturated with buses. This is because as the number of buses using the lane increases, there is a greater probability that one bus will delay another bus, either by using available loading areas or by requiring passing and weaving maneuvers. Simulation runs reported in TCRP Report 26,(R36) as well as observations of actual bus lane operations(R33) show a sharp drop in bus speeds as bus volumes approach capacity. Exhibit 4-59 presents the speed adjustment factor for bus volumes. These factors were developed through simulation of Type 1 and Type 2 bus lanes, using an 80-second cycle, a g/C ratio of 0.5, 400-foot (125-meter) block spacing, 20- to 50-second dwell times, and a 33% coefficient of dwell time variation.
Speed adjustment factor for bus volumes, fb.
Exhibit 4-59 Bus-Bus Interference Factor, fb(R36)
Bus Lane v/c Ratio Bus-Bus Interference Factor <0.5 1.00 0.5 0.97 0.6 0.94 0.7 0.89 0.8 0.81 0.9 0.69 1.0 0.52 1.1 0.35
NOTE: Capacity should be based on a 25% failure rate (i.e., maximum capacity).
Exhibit 4-60 illustrates the effects of increasing bus lane volumes on bus speeds.
There is little effect on bus speeds until approximately 70% of the bus lane’s capacity is being used.
Exhibit 4-60 Illustrative Bus-Bus Interference Factor Effects
0
2
4
6
8
10
12
14
16
0.0 0.1 0.2 0.3 0.4 0.5 0.6 0.7 0.8 0.9 1.0
Bus Lane v/c Ratio
Ave
rage
Bu
s Sp
eed
(mph
)
2 stops/mi 4 stops/mi 6 stops/mi 8 stops/mi 10 stops/mi
An alternative exhibit using metric units appears in Appendix A.
NOTE: Assumes 30-second dwell times, CBD bus lane with right-turn delays, and typical signal timing.
Part 4/BUS TRANSIT CAPACITY Page 4-55 Chapter 5—Arterial Street Bus Lanes

Transit Capacity and Quality of Service Manual—2nd Edition
This page is intentionally blank.
Chapter 5—Arterial Street Bus Lanes Page 4-56 Part 4/BUS TRANSIT CAPACITY
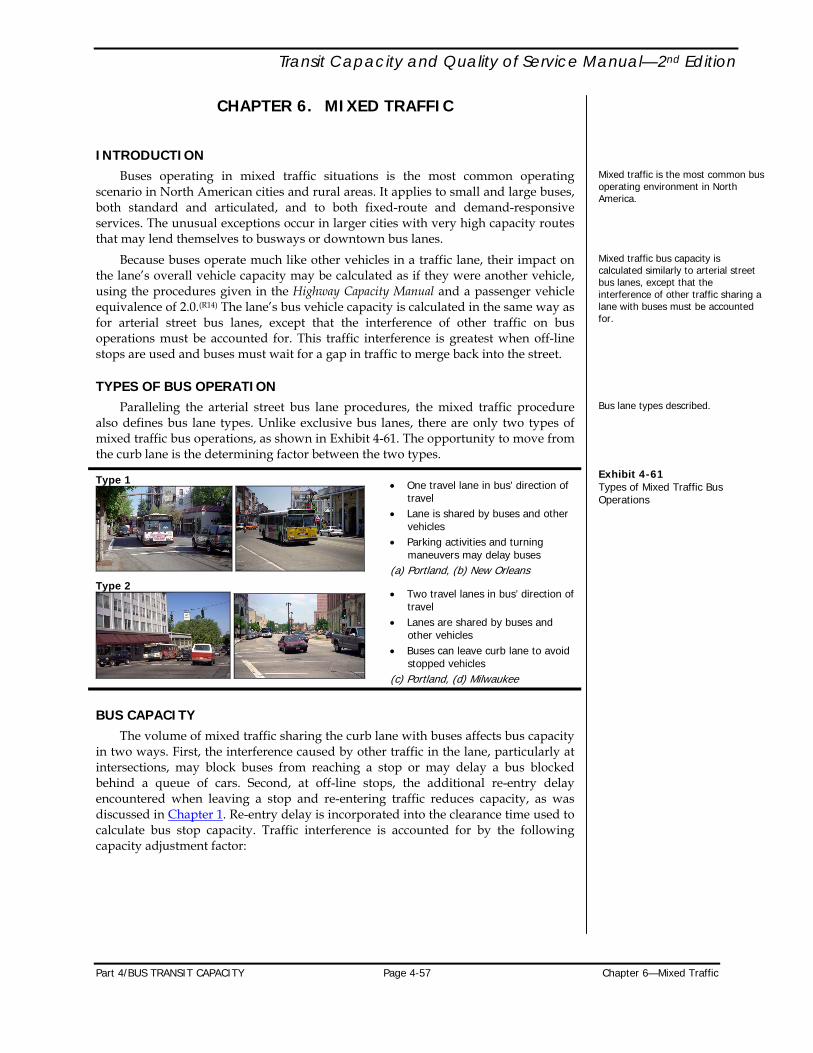
Transit Capacity and Quality of Service Manual—2nd Edition
CHAPTER 6. MIXED TRAFFIC
INTRODUCTION Buses operating in mixed traffic situations is the most common operating
scenario in North American cities and rural areas. It applies to small and large buses, both standard and articulated, and to both fixed-route and demand-responsive services. The unusual exceptions occur in larger cities with very high capacity routes that may lend themselves to busways or downtown bus lanes.
Mixed traffic is the most common bus operating environment in North America.
Because buses operate much like other vehicles in a traffic lane, their impact on the lane’s overall vehicle capacity may be calculated as if they were another vehicle, using the procedures given in the Highway Capacity Manual and a passenger vehicle equivalence of 2.0.(R14) The lane’s bus vehicle capacity is calculated in the same way as for arterial street bus lanes, except that the interference of other traffic on bus operations must be accounted for. This traffic interference is greatest when off-line stops are used and buses must wait for a gap in traffic to merge back into the street.
Mixed traffic bus capacity is calculated similarly to arterial street bus lanes, except that the interference of other traffic sharing a lane with buses must be accounted for.
TYPES OF BUS OPERATION Paralleling the arterial street bus lane procedures, the mixed traffic procedure
also defines bus lane types. Unlike exclusive bus lanes, there are only two types of mixed traffic bus operations, as shown in Exhibit 4-61. The opportunity to move from the curb lane is the determining factor between the two types.
Bus lane types described.
Exhibit 4-61 Types of Mixed Traffic Bus Operations
Type 1
• One travel lane in bus’ direction of travel
• Lane is shared by buses and other vehicles
• Parking activities and turning maneuvers may delay buses
(a) Portland, (b) New Orleans Type 2
• Two travel lanes in bus’ direction of travel
• Lanes are shared by buses and other vehicles
• Buses can leave curb lane to avoid stopped vehicles
(c) Portland, (d) Milwaukee
BUS CAPACITY The volume of mixed traffic sharing the curb lane with buses affects bus capacity
in two ways. First, the interference caused by other traffic in the lane, particularly at intersections, may block buses from reaching a stop or may delay a bus blocked behind a queue of cars. Second, at off-line stops, the additional re-entry delay encountered when leaving a stop and re-entering traffic reduces capacity, as was discussed in Chapter 1. Re-entry delay is incorporated into the clearance time used to calculate bus stop capacity. Traffic interference is accounted for by the following capacity adjustment factor:
Part 4/BUS TRANSIT CAPACITY Page 4-57 Chapter 6—Mixed Traffic

Transit Capacity and Quality of Service Manual—2nd Edition
⎟⎠⎞
⎜⎝⎛−=
cvff lm 1 Equation 4-17
where: This mixed traffic bus capacity procedure is an extension of the exclusive bus lane capacity procedures developed by TCRP Project A-7. The theoretical basis exists for the mixed traffic procedures, but they have not yet been validated in the field.
fm = mixed traffic adjustment factor; fl = bus stop location factor, from Exhibit 4-51; v = curb lane volume at a specific intersection; and c = curb lane capacity at a specific intersection.
The mixed traffic adjustment factor is essentially the same as the right-turn adjustment factor presented in Equation 4-10 for arterial street bus lanes. The difference is that in a mixed traffic situation, the non-transit traffic will be greater and it may not just be turning right—it could also be going straight or even left—and thus bus vehicle capacity will be lower in a mixed traffic situation than in an arterial street bus lane. The most recent version of the Highway Capacity Manual should be used to determine the curb lane’s vehicle capacity.
Equation 4-18 may be used to calculate the bus capacity of a mixed traffic lane in which buses operate. Once the bus capacity is known, Equation 4-8 in Chapter 1 may be used to determine person capacity. The planning graphs in Chapter 3 may be used to estimate capacity, based on Equation 4-18, for a variety of situations.
mell fNBB = Equation 4-18
where: B = mixed traffic bus capacity (bus/h); Bl = bus loading area capacity at the critical bus stop (bus/h); Nel = number of effective loading areas at the critical bus stop; and fm = capacity adjustment factor for mixed traffic interference at the critical
bus stop.
Exhibit 4-62 illustrates how bus vehicle capacity declines as curb lane traffic volumes increase and how bus vehicle capacity varies by bus stop location. It should be noted that in mixed traffic situations, off-line linear stops may provide less bus vehicle capacity than on-line stops for identical dwell times, as the additional fractional effective loading areas provided by off-line stops are outweighed by the additional delay buses encounter when re-entering traffic.
In mixed traffic situations, on-line stops may provide greater capacity than off-line stops, depending on traffic volumes and the number of loading areas provided.
Exhibit 4-62 Illustrative Mixed Traffic Maximum Bus Vehicle Capacity
0
10
20
30
40
50
60
0 100 200 300 400 500 600 700 800
Curb Lane Traffic Volume (veh/h)
Cu
rb L
ane
Bu
s C
apac
ity
(bu
s/h)
Near-side, on line Near-side, off-line Mid-block, on-line Mid-block, off-lineFar-side, on-line Far-side, off-line
NOTE: Assumes a Type 2 lane, one linear loading area per stop, g/C = 0.5, 30-second dwell time, 25% failure rate, and 60% coefficient of variation.
Chapter 6—Mixed Traffic Page 4-58 Part 4/BUS TRANSIT CAPACITY

Transit Capacity and Quality of Service Manual—2nd Edition
BUS SPEEDS As with arterial street bus lanes, the best way to determine bus travel speeds is to
measure them directly. If this is not possible (for example, when planning future service), speeds can be estimated by (1) driving the route, making an average number of stops with simulated dwells and making two or three runs during peak and off-peak times; (2) scheduling buses based on similar routes and adjusting running times as needed based on the operating experience; or (3) using the analytical method described below to estimate speeds.
The speeds of buses operating in mixed traffic are influenced by bus stop spacing, dwell times, delays due to traffic signals, and interferences from other traffic operating in the lane. The method used to estimate bus speeds in mixed traffic is the same as that used for arterial street bus lanes, with the exception that the “mixed traffic flow” column in Exhibit 4-57 should be used to estimate additional running time losses.
Part 4/BUS TRANSIT CAPACITY Page 4-59 Chapter 6—Mixed Traffic

Transit Capacity and Quality of Service Manual—2nd Edition
This page is intentionally blank.
Chapter 6—Mixed Traffic Page 4-60 Part 4/BUS TRANSIT CAPACITY

Transit Capacity and Quality of Service Manual—2nd Edition
CHAPTER 7. DEMAND-RESPONSIVE TRANSPORTATION
INTRODUCTION Demand-responsive transportation (DRT) is variable route service, activated in
response to users’ requests, provided as shared ride (typically door-to-door or curb-to-curb), and operated on a point-to-point basis. DRT point-to-point service can be operated as many origins to many destinations, many origins to few destinations, few origins to many destinations, few origins to few destinations, and many origins to one destination.
Illustrations of these service types can be found in Part 2.
Beyond the type of point-to-point operation, other service parameters impact DRT operations, such as response time (whether the service is immediate response with real time dispatching similar to taxi service, or advance reservation) and the nature of the ridership (whether the service is designed for the general public or a special subset such as the elderly and disabled or only individuals with disabilities certified as ADA eligible). Many of these parameters are policy decisions on the part of the DRT provider. There are also a variety of environmental factors that impact DRT operations, including service area size, street pattern, and, importantly, demand density, defined as riders per hour per square mile or square kilometer of the service area.
SERVICE CHARACTERISTICS DRT is provided in communities throughout the United States and Canada. In
larger urban areas in the United States, such service is often provided as ADA complementary paratransit service. In smaller communities, demand-responsive service may be provided in lieu of fixed-route service or to supplement other transit service, and may be available to the general public rather than a subset such as the elderly and persons with disabilities. In rural areas, demand-responsive service may be the only service available, and it may only be offered on certain days of the week or even month.
Since demand-responsive service can be designed in many different ways (for the general public or a subset; as many-to-many, many-to-few, etc.), many of the service characteristics tend to reflect the operating design and policies of the DRT system. For example, an ADA complementary paratransit system in a large urban area will typically have long travel times, particularly during peak hours, and very low productivity (e.g., typically less than two one-way passenger trips per revenue hour). These same characteristics may be found in a general public demand-responsive program in a rural area, with low productivity due to the lower demand density (as opposed to long wait and dwell times for riders with disabilities), and with long travel times due to the larger service area and longer distances between activity centers (rather than the congestion and traffic of large urban areas). Thus, it is important to understand that many characteristics and differences among DRT operations stem from operating design and policies.
Such differences are particularly true for specialized transportation services, where the DRT system is designed for a subset of the population and policies are structured to provide a higher level of assistance to the riders. ADA complementary paratransit, in particular, is different from other types of specialized transportation service as its operating parameters are so highly prescribed by federal regulations (49 CFR Part 37, Subpart F), which address not only capacity, but service quality as well.
Part 4/BUS TRANSIT CAPACITY Page 4-61 Chapter 7—Demand-Responsive Transportation

Transit Capacity and Quality of Service Manual—2nd Edition
VEHICLE TYPES There are a wide variety of vehicles available for use in demand-responsive
services. DRT vehicles are typically smaller than vehicles used for fixed-route services because of the smaller passenger loads carried and the greater variety of roadways traveled upon. The kinds of vehicles used for DRT services include sedans, taxicabs, vans, and small- and mid-sized buses.
Accessibility for passengers using mobility aids—particularly wheelchairs—is an important issue in the selection of vehicles for DRT service, as DRT systems are often designed to serve persons with mobility limitations. Riders using wheelchairs and certain other mobility devices require a lift or ramp on the vehicle, which is typically a van or a bus. Sedans are not accessible to those using wheelchairs unless the passengers transfer to the sedan seat. Taxicab companies in some areas have added accessible taxi vehicles to their fleets to accommodate riders with wheelchairs. For other mobility-limited riders, such as those who are ambulatory but frail, sedans may be the most accessible type of vehicle due to an easier entry and a smoother ride, compared with a small- or mid-sized bus.
DRT CAPACITY
Capacity Factors Determining capacity for DRT is a different proposition than for fixed-route
transit. The issue for DRT is not how many vehicles a facility can accommodate, but rather how many vehicles and vehicle service hours are required to accommodate a given passenger demand and service area.
For many-to-one and few-to-one types of DRT service, vehicles may be assigned to geographic areas, with the number of vehicles assigned to each area dependent on the number of passengers from that area who need to be accommodated at a given time. Every passenger should be provided a seat in DRT service.
Every passenger is provided a seat in DRT service.
For most types of DRT service with a greater dispersion of origins and destinations, the number of vehicles and vehicle service hours required is dependent on a number of factors, including ridership demand, ridership characteristics, peak-period demand, service area size and characteristics, type of DRT service (i.e., many-to-many, many-to-few, etc.), and service policies that affect DRT operations.
Ridership demand is clearly one of the most important factors. The demand for DRT service in terms of one-way passenger trips should be determined or estimated as one key factor for the calculation of capacity. These data should also be determined on an average weekday basis as well as a peak-period basis. Should the peak-period demand be significantly greater than off-peak demand, the number of vehicles required will be greater. Given that DRT vehicles carry only a limited number of passenger trips each hour, fluctuations in ridership numbers can have a significant effect on the number of vehicles required and the resulting capital and operations costs.
Ridership demand is one of the most important capacity factors, as DRT vehicles carry only a small number of passenger trips each hour.
Passenger characteristics are also important in calculating capacity. Is the DRT service designed for general public users; a specialized group, such as the elderly and persons with disabilities; or just ADA-certified users? A key difference between ridership types in terms of calculating DRT capacity are the amounts of wait time and dwell time required. A general public DRT service will typically have quite short wait times for users at pick-up locations (1 to 2 minutes, for example). Dwell times are also relatively short. Specialized DRT services designed for users with disabilities will have longer wait times (5 to 10 minutes and in some cases longer), and dwell times are also longer. Increased wait and dwell times mean that fewer passenger trips
Wait and dwell times differ depending on the type of DRT service.
Chapter 7—Demand-Responsive Transportation Page 4-62 Part 4/BUS TRANSIT CAPACITY

Transit Capacity and Quality of Service Manual—2nd Edition
can be carried per day, translating to lowered productivities and additional vehicle capacity needed.
Peak-period demand is another important factor. Where DRT systems have peaked ridership demand, additional capacity is required at those peak times. Unlike a fixed-route bus during peak times that is able to accommodate additional passengers at each bus stop until no more standees can fit, a given DRT vehicle generally does not carry more passengers during peak times than off-peak. (An exception is when the operating characteristics change during peak times to become more productive, e.g., from many-to-many during off-peak, to many-to-few or many-to-one during peaks.) DRT system policy for scheduling trips is particularly important in relation to peak-period capacity needs. The extent to which a DRT provider can manage its peak-period demand will affect the amount of capacity that is needed. Some DRT providers are able to “spread” some of the peak-period trips to the shoulders of the peak or to the off peak by encouraging alternative travel times for riders, by using a longer pick-up window for scheduling trip pick-ups, or by only offering trip pick-ups that can be handled.
More DRT vehicles may be needed if demand is strongly peaked.
Service area size and characteristics have a critical influence on DRT capacity. With a larger service area and long distances between residential areas and destination areas, DRT riders will have longer trips, both in miles and time. Where DRT vehicles are serving longer trips, fewer trips are provided by each vehicle, resulting in lowered productivities and additional DRT capacity needed to serve the demand. The service area characteristics also impact capacity. For example, those characteristics that delay travel will have a similar effect as a large service area, resulting in longer travel times, lowered productivity, and the need for additional DRT capacity to serve the demand. Locations of major bridges and railroad crossings and the geographic shape of the service area are some of the travel constraints that may characterize a DRT service area and increase travel times.
Larger service areas and longer trips result in fewer trips being provided by each vehicle.
The type of point-to-point service (i.e., many-to-many, many-to-few, etc.) provided by the DRT system will affect capacity. A DRT service that is able to group more riders through a many-to-one, many-to-few, or few-to-few type of service will have higher productivity, with each DRT vehicle carrying more passenger trips. Conversely, a many-to-many type of DRT service is not able to group as many trips, given the greater dispersion of origins and destinations, and therefore each vehicle carries fewer passenger trips with a resulting need for additional capacity.
The ability to group passenger trips results in more trips being provided by each vehicle.
Service policies may also impact capacity. Those policies that increase the time to serve each passenger trip, such as a ten-minute wait time for riders at a pick-up location, will increase riders’ travel times, with a similar effect as long trip travel times—that is, lowering productivity with a need for additional capacity.
Capacity Calculation Procedure The number of vehicles and vehicle service hours for a DRT system can be
estimated using data from a similar DRT system or several similar DRT systems operating in a similar community or area. This is the analogy method, which, straightforward and simple, can provide useful information to help assess the number of passenger trips per day and per service hour that can be served with a given number of vehicles. These data can then be used to estimate capacity for the community or area where DRT service is being planned.
A second approach is use of the DRT resource estimation model that is being developed through TCRP Project B-23. This model, anticipated to be available in late 2003, will estimate vehicles and vehicle service hours needed to provide DRT service for a given level of ridership demand and service quality in a defined service area. Users of the model will define specific inputs, such as the DRT service area, using
Part 4/BUS TRANSIT CAPACITY Page 4-63 Chapter 7—Demand-Responsive Transportation

Transit Capacity and Quality of Service Manual—2nd Edition
place and county subdivision geographic units from the 2000 Census, average number of weekday trips, type of ridership (e.g., general public, elderly, transportation disadvantaged), and service characteristics. The model will then simulate trip-making with two modeling phases: trip generation and trip distribution. Results of the modeling will then be used by the vehicle resource estimation portion of the software to estimate resource requirements for the DRT system being planned.(R45)
A third approach to estimating the required number of DRT vehicles is Fu’s analytical model. This model is intended to help planners and designers quickly determine the minimum number of vehicles required to achieve a given quality of service, the maximum number of trips that a given fleet can serve, and the quality of service that can be provided by a given fleet.(R11) Unlike the TCRP Project B-23 resource estimation model, Fu’s model assumes that demand is known in advance. The quality of service indicators in Fu’s model do not exactly match those in the TCQSM’s DRT quality of service framework, and the model was calibrated for idealized scenarios, but with refinement it potentially could be incorporated into a future edition of the TCQSM.
Chapter 7—Demand-Responsive Transportation Page 4-64 Part 4/BUS TRANSIT CAPACITY

Transit Capacity and Quality of Service Manual—2nd Edition
CHAPTER 8. REFERENCES
1. Bullard, Diane L. and Lisa G. Nungesser, “Texas Public Transit Reference Manual,” Technical Report 1082-1F, Texas State Department of Highway and Public Transportation, Austin, TX (1985).
2. Callas, Steve, Tri-Met’s Transit Signal Priority System and Evaluation, presented at the 81st Annual Meeting of the Transportation Research Board, Washington, DC (2002). http://signalsystems.tamu.edu/documents/SignalControlWorkshop2002/ TRB_SignalPriority_Callas.pdf
3. Cervero, Robert, Paratransit in America. Redefining Mass Transportation, Praeger Publishers, Westport, CT (1997).
4. City of Portland, Transit Preferential Streets Program Sourcebook: Guidelines for Implementing Transit Preferential Streets Measures, Office of Transportation, Portland, OR (1997). http://www.trans.ci.portland.or.us/Plans/TransitPreference/default.htm
5. Cuntill, M.A., and P.F. Watts, “Bus Boarding and Alighting Times.” Report LR 521, Great Britain Transport and Road Research Laboratory, Crowthorne, England (1973).
6. Dowling, Richard, Wayne Kittelson, John Zegeer, Alexander Skabardonis, and Barton Aschman Associates, NCHRP Report 387: Planning Techniques to Estimate Speeds and Service Volumes for Planning Applications, TRB, National Academy Press, Washington, DC (1997).
7. Edwards, Jr., John D. (editor), Transportation Planning Handbook, Prentice-Hall Inc., Englewood Cliffs, NJ (1992).
8. Federal Transit Administration, Bus Rapid Transit Demonstration Projects, http://www.fta.dot.gov/brt/projects/index.html, accessed April 3, 2002.
9. Florida Department of Transportation, Systems Planning Office, 2002 Quality/ Level of Service Handbook, Tallahassee, FL (2002). http://www.dot.state.fl.us/planning/systems/sm/los/pdfs/QLOS2002Novcd.pdf
10. Fritz, Marshall S. Effect of Crowding on Light Rail Passenger Boarding Times. In Transportation Research Record 908, TRB, National Academy Press, Washington, DC (1983).
11. Fu, Liping, An Analytical Model for Paratransit Capacity and Quality of Service Analysis, Paper 03-2179, presented at the 82nd Annual Meeting of the Transportation Research Board, Washington, DC (2003).
12. Fuhs, Charles A., NCHRP Synthesis of Highway Practice 185: Preferential Lane Treatments for High-Occupancy Vehicles, TRB, National Academy Press, Washington, DC (1993).
13. Guenthner, R.P. and K.C. Sinha. Modeling Bus Delays Due to Passenger Boardings and Alightings. In Transportation Research Record 915, TRB, National Academy Press, Washington, DC (1983).
14. Head, K. Larry, “Improved Traffic Signal Priority for Transit,” TCRP A-16 Interim Report, TRB, Washington, DC (1998).
15. Highway Capacity Manual. TRB, National Research Council, Washington, DC (2000).
Part 4/BUS TRANSIT CAPACITY Page 4-65 Chapter 8—References

Transit Capacity and Quality of Service Manual—2nd Edition
16. Hoel, Lester A. and Larry G. Richards (editors), Planning and Development of Public Transportation Terminals, Report DOT/RSPA/DPB-50/81/19, U.S. Department of Transportation, Washington, DC (1981).
17. Hoey, W.F. and H.S. Levinson. Bus Capacity Analysis. In Transportation Research Record 546, TRB, National Academy Press, Washington, DC (1975).
18. Homburger, W.S. (editor), Transportation and Traffic Engineering Handbook, Second Edition, Prentice-Hall Inc., Englewood Cliffs, NJ (1982).
19. Houston Metro, http://www.ridemetro.org/HOV_Lanes/HOV01.htm, accessed April 2, 2002.
20. King, Rolland D, TCRP Report 41: New Designs and Operating Experiences with Low-Floor Buses, TRB, National Academy Press, Washington, DC (1998). http://gulliver.trb.org/publications/tcrp/tcrp_rpt_41-a.pdf
21. King, Rolland D., TCRP Synthesis of Transit Practice 49: Yield to Bus—State of the Art, TRB, Washington, DC (2003). http://gulliver.trb.org/publications/tcrp/tcrp_syn_49.pdf
22. Kohler, U., “Capacity of Transit Lanes,” Proceedings of the International Symposium on Highway Capacity, Karlsruhe, Germany (1991).
23. Kraft, W.H., An Analysis of the Passenger Vehicle Interface of Street Transit Systems with Applications to Design Optimization, Doctoral Dissertation, New Jersey Institute of Technology, Newark, NJ (1975).
24. Kraft, W.H., and P. Eng-Wong, Passenger Service Time Characteristics of Street Transit Systems, Compendium of Technical Papers, Institute of Transportation Engineers, 47th Annual Meeting, Mexico City, Mexico (1977).
25. Levinson, H.S. Analyzing Transit Travel Time Performance. In Transportation Research Record 915, TRB, National Academy Press, Washington, DC (1983).
26. Levinson, H.S., INET Transit Travel Times Analysis, prepared for the Urban Mass Transit Administration, Washington, DC (April 1982).
27. Levinson, H.S., C.L. Adams, and W.F. Hoey, NCHRP Report 155: Bus Use of Highways—Planning and Design Guidelines, TRB, National Academy Press, Washington, DC (1975).
28. Levinson, H.S., L. Lennon and J. Cherry. Downtown Space for Buses—The Manhattan Experience. In Transportation Research Record 1308, TRB, National Academy Press, Washington, DC (1991).
29. Levinson, Herbert, Samuel Zimmerman, Jennifer Clinger, Scott Rutherford, Rodney L. Smith, John Cracknell, and Richard Soberman, TCRP Report 90: Bus Rapid Transit, Volume 1: Case Studies in Bus Rapid Transit, TRB, Washington, DC (2003). http://gulliver.trb.org/publications/tcrp/tcrp_rpt_90v1.pdf
30. Levinson, Herbert S. and Kevin R. St. Jacques. Bus Lane Capacity Revisited. In Transportation Research Record 1618, TRB, National Academy Press, Washington, DC (1998).
31. Major, Michael J., “Brazil’s Busways: A ‘Subway’ That Runs Above the Ground,” Mass Transit, Vol. XXIII, No. 3 (May/June 1997).
32. Marshall, Leo. F., Herbert S. Levinson, Lawrence C. Lennon and Jerry Cheng. Bus Service Times and Capacities in Manhattan. In Transportation Research Record 1266, TRB, National Academy Press, Washington, DC (1990).
33. Papacostas, C.S., “Capacity Characteristics of Downtown Bus Streets,” Transportation Quarterly, Vol. 36, No. 4 (October 1982).
Chapter 8—References Page 4-66 Part 4/BUS TRANSIT CAPACITY

Transit Capacity and Quality of Service Manual—2nd Edition
34. Pratt, Richard H., Texas Transportation Institute, Cambridge Systematics, Inc., Parsons Brinckerhoff Quade & Douglas, Inc., SG Associates, Inc., and McCollum Management Consulting, Inc., TCRP Web Document 12: Traveler Response to Transportation System Changes: Interim Handbook, TRB, Washington, DC (2000). http://gulliver.trb.org/publications/tcrp/tcrp_webdoc_12.pdf
35. Rabinovitch, Jonas and Josef Leitman, “Urban Planning in Curitiba,” Scientific American, Vol. 274, No. 3 (March 1996).
36. St. Jacques, Kevin and Herbert S. Levinson, TCRP Report 26: Operational Analysis of Bus Lanes on Arterials, TRB, National Academy Press, Washington, DC (1997). http://gulliver.trb.org/publications/tcrp/tcrp_rpt_26-a.pdf
37. St. Jacques, Kevin and Herbert S. Levinson, TCRP Research Results Digest 38: Operational Analysis of Bus Lanes on Arterials: Application and Refinement, TRB, National Research Council, Washington, DC (2000). http://gulliver.trb.org/publications/tcrp/tcrp_rrd_38.pdf
38. Scheel, W. and J.E. Foote, “Bus Operation in Single Lane Platoons and Their Ventilation Needs for Operation in Tunnels,” Research Publication GMR-808, General Motors Research Laboratories, Warren, MI (1962).
39. Skehan, Sean, “Traffic Signal Priority for Metro Rapid Buses: The Los Angeles Experience,” Compendium of Technical Papers, 2001 Institute of Transportation Engineers Annual Meeting, Chicago, IL (2001).
40. Special Report 209: Highway Capacity Manual, TRB, National Research Council, Washington, DC (1985).
41. Stockton, William R., Ginger Daniels, Douglas A. Skowronek, and David W. Fenno, “The ABC’s of HOV: The Texas Experience,” Report 1353-I, Texas Transportation Institute, College Station, TX (September 1999). http://tti.tamu.edu/product/catalog/reports/1353-I.pdf
42. TCRP Web Document 6: Transit Capacity and Quality of Service Manual, First Edition, TRB, Washington, DC (1999). http://gulliver.trb.org/publications/tcrp/tcrp_webdoc_6-a.pdf
43. Texas Transportation Institute, TCRP Report 19: Guidelines for the Location and Design of Bus Stops, TRB, National Academy Press, Washington, DC (1996). http://gulliver.trb.org/publications/tcrp/tcrp_rpt_19-a.pdf
44. Texas Transportation Institute, Parsons Brinckerhoff Quade and Douglas, Inc., and Pacific Rim Resources, Inc., NCHRP Report 414: HOV Systems Manual, TRB, National Academy Press, Washington, DC (1998).
45. The Transportation Center, Northwestern University, Draft Users’ Manual: Resource Requirements for Demand-Responsive Transportation Services, available on loan from the Transit Cooperative Research Program, TRB, Washington, DC (October 2002).
46. Transportation Research Circular 212: Interim Materials in Highway Capacity, TRB, National Academy Press, Washington, DC (1980).
Part 4/BUS TRANSIT CAPACITY Page 4-67 Chapter 8—References

Transit Capacity and Quality of Service Manual—2nd Edition
This page is intentionally blank.
Chapter 8—References Page 4-68 Part 4/BUS TRANSIT CAPACITY

Transit Capacity and Quality of Service Manual—2nd Edition
CHAPTER 9. EXAMPLE PROBLEMS
1. Bus dwell time 2. Number of loading areas required at a stop 3. Bus vehicle capacity and speed with an exclusive bus lane (skip-stop
operation) 4. Bus vehicle capacity in mixed traffic (near-side stops) 5. Bus vehicle capacity in mixed traffic (far-side stops) 6. Bus vehicle capacity in mixed traffic (skip-stop operation) 7. Person capacity 8. Implementing an exclusive bus lane on a CBD street 9. Implementing a bus queue jump at a traffic signal
Part 4/BUS TRANSIT CAPACITY Page 4-69 Chapter 9—Example Problems

Transit Capacity and Quality of Service Manual—2nd Edition
Example Problem 1
The Situation An express route is planned along an arterial from a suburb to the CBD with 10
stops, including one at a transit center midway (stop #5). The route will operate in mixed traffic in the CBD (stops #7 to 10).
The Question What will be the average dwell time at each of the 10 stops, and how might these
dwell times affect how the route is developed?
The Facts • The route will use 40-seat standard buses.
• Exact fare is required upon boarding.
• The door opening and closing time is 4 seconds.
• All passengers board through the front door and alight through the back door.
• The transit agency has estimated potential ridership for the route and predicts the following average number of boarding and alighting passengers per stop:
Stop # 1 2 3 4 5 6 7 8 9 10 Alighting Passengers 0 0 3 2 14 6 16 19 15 11 Boarding Passengers 20 16 11 12 16 8 2 1 0 0
Assumptions
• Assume 3.5 seconds boarding time per passenger (4.0 seconds with standees).
• Assume 2.0 seconds alighting time per passenger.
Outline of SolutionAll input parameters are known. Method 3 (calculation) will be used to
determine dwell times. As there are two doors, one used by boarding passengers and the other by alighting passengers, boarding and alighting times will need to be calculated separately for each stop to determine which governs dwell time. The total number of passengers on board the bus will need to be tracked to determine the stops where standees will be present on the bus.
Steps 1. Determine the stops where the bus
arrives with standees. There will be more than 40 passengers on the bus when it arrives at stops 4 to 8. The last 3 passengers to board at stop #3 will encounter standees.
2. Calculate the boarding time. The boarding time is the number of boarding passengers times 3.5 or 4.0 seconds, depending on whether or not standees are present.
3. Calculate the alighting time. The alighting time is the number of alighting passengers times 2.0 seconds.
4. Determine the dwell time. The dwell time is the larger of the boarding and alighting times at each stop, plus the 4-second door opening and closing time.
Chapter 9—Example Problems Page 4-70 Part 4/BUS TRANSIT CAPACITY

Transit Capacity and Quality of Service Manual—2nd Edition
The Results Estimated dwell times are shown below for each stop:
Stop # 1 2 3 4 5 6 7 8 9 10
Dwell Time (s) 74 60 44 52 68 36 36 42 34 26
Boarding times govern at stops #1 to 6, while alighting times govern at stops #7
to 10. Stop #8 has the longest dwell time within the CBD area. If stop #8 also has the longest dwell time among the other routes using it, the stop will likely be the critical stop for the CBD bus facility.
Comments Because of the long dwell times at stops #1 to 4 in the suburban portion of the
corridor, off-line stops (pullouts) should be considered at these locations to avoid substantial traffic delays to other vehicles in the curb lane. At the same time, to minimize delays to the express buses when re-entering the arterial, transit priority treatments such as queue jumps should also be considered at these locations.
The dwell time at stop #5 required to serve passenger movements is 68 seconds. However, since this stop is located at a transfer center, buses will likely need to occupy the berth for longer periods of time to allow for connections between routes. This extra berth occupancy time needs to be accounted for when sizing the transfer center.
Having standees on a long-distance express bus is undesirable from a quality of service point-of-view. Increasing service frequency so that all riders may have a seat should also be considered.
Part 4/BUS TRANSIT CAPACITY Page 4-71 Chapter 9—Example Problems
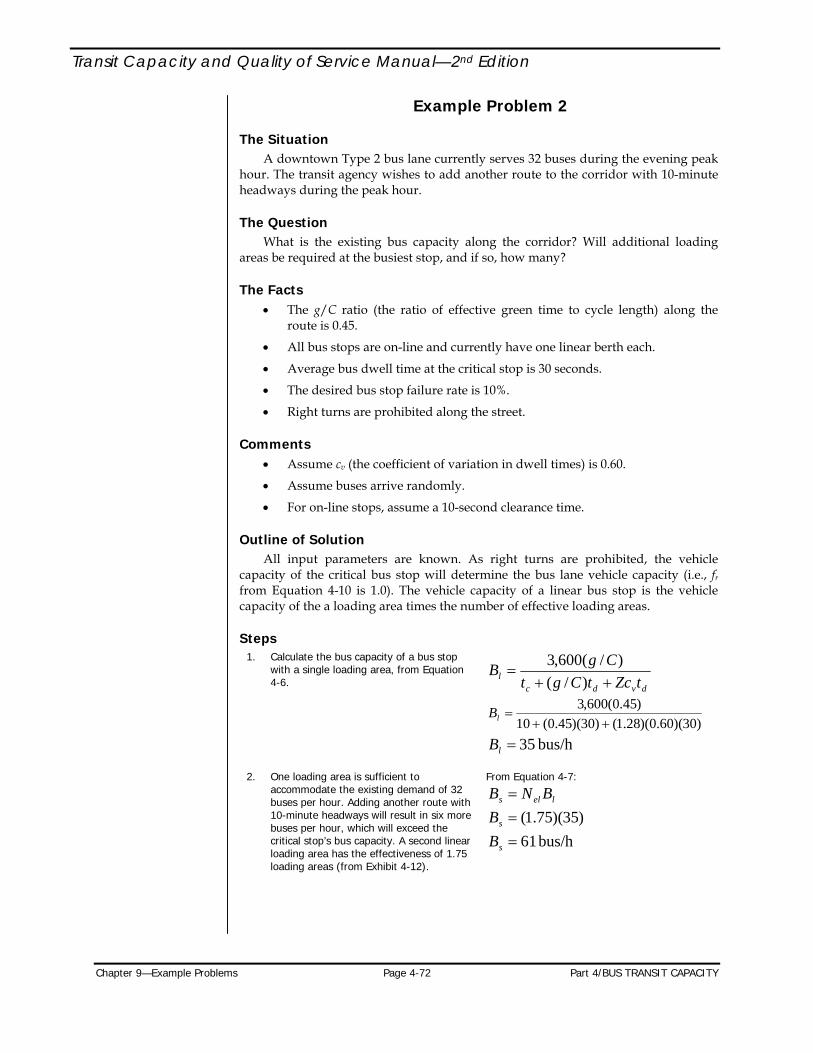
Transit Capacity and Quality of Service Manual—2nd Edition
Example Problem 2
The Situation A downtown Type 2 bus lane currently serves 32 buses during the evening peak
hour. The transit agency wishes to add another route to the corridor with 10-minute headways during the peak hour.
The Question What is the existing bus capacity along the corridor? Will additional loading
areas be required at the busiest stop, and if so, how many?
The Facts • The g/C ratio (the ratio of effective green time to cycle length) along the
route is 0.45.
• All bus stops are on-line and currently have one linear berth each.
• Average bus dwell time at the critical stop is 30 seconds.
• The desired bus stop failure rate is 10%.
• Right turns are prohibited along the street.
Comments
• Assume cv (the coefficient of variation in dwell times) is 0.60.
• Assume buses arrive randomly.
• For on-line stops, assume a 10-second clearance time.
Outline of SolutionAll input parameters are known. As right turns are prohibited, the vehicle
capacity of the critical bus stop will determine the bus lane vehicle capacity (i.e., fr from Equation 4-10 is 1.0). The vehicle capacity of a linear bus stop is the vehicle capacity of the a loading area times the number of effective loading areas.
Steps1. Calculate the bus capacity of a bus stop
with a single loading area, from Equation 4-6. dvdc
l tZctCgtCgB++
=)/(
)/(600,3
)30)(60.0)(28.1()30)(45.0(10)45.0(600,3
++=lB
bus/h 35=lB
2. One loading area is sufficient to
accommodate the existing demand of 32 buses per hour. Adding another route with 10-minute headways will result in six more buses per hour, which will exceed the critical stop’s bus capacity. A second linear loading area has the effectiveness of 1.75 loading areas (from Exhibit 4-12).
From Equation 4-7:
lels BNB =
)35)(75.1(=sB
bus/h 61=sB
Chapter 9—Example Problems Page 4-72 Part 4/BUS TRANSIT CAPACITY

Transit Capacity and Quality of Service Manual—2nd Edition
The Results Adding a second linear loading area to the critical bus stop will give it sufficient
vehicle capacity to accommodate the new route. The new critical bus stop should now be checked to make sure that it, too, can accommodate the proposed additional buses.
As a general rule, most downtown stops in larger cities should have two or three loading areas wherever possible.
Comments The planning-level graphs also could have been used to solve this problem. From
Exhibit 4-68 (Appendix C), the capacity of a single loading area under the stated conditions is 35 buses per hour. (There are no conflicting pedestrians when right turns are prohibited.) Multiplying this result by the number of effective loading areas (1.75) gives the final result of 61 buses per hour.
Part 4/BUS TRANSIT CAPACITY Page 4-73 Chapter 9—Example Problems

Transit Capacity and Quality of Service Manual—2nd Edition
Example Problem 3
The Situation As part of a package of service improvements that include the route
restructuring described in Example Problem 2, the transit agency also wishes to improve overall transit speeds in the downtown area. Options include lengthening bus stops to reduce bus congestion, reducing the number of stops, and/or implementing a skip-stop pattern.
The Question Will each option provide sufficient capacity to accommodate the 38 planned
buses? What is the bus operating speed under each scenario?
The Facts • Same assumptions as Example Problem 2.
• Under a skip-stop scenario, there would be two groups of routes: NE Metro (20 buses) and NW Metro (18 buses). Buses would be scheduled to minimize congestion, but schedule adherence is expected to be imperfect due to traffic signal and other delays.
• 500 veh/h use the adjacent lane.
• Trucks make up 2% of the traffic in the adjacent lane.
• Bus stops are located on the near sides of intersections.
• The average dwell time at their critical stop is 30 seconds. Bus dwell time, averaged for all downtown stops, is 20 seconds. These averages would be the same for both groups under a skip-stop scenario.
• Stops are located every block, 125 meters apart (8 stops/km). If stops are eliminated or a skip-stop pattern is implemented, stops would be located every two blocks.
• The Highway Capacity Manual should be used to determine the capacity of the adjacent lane. The base saturation flow rate, v0, is 1,900 passenger vehicles per hour of green. The heavy vehicle saturation adjustment factor, fHV, is 0.98. The area saturation flow adjustment factor, fA, is 0.90 for CBDs.
Outline of Solution
The bus lane capacity will be determined for each scenario. For scenarios not involving skip-stops, the procedure is the same as in Example Problem 2. For skip-stop scenarios, the bus lane capacity is the sum of the capacity of the individual group capacities, multiplied by an adjustment factor for the effect of random bus arrivals and the impedance of other traffic in the adjacent lane.
If the capacity is greater than the number of scheduled buses, the average bus speed will be calculated. This procedure involves identifying the base bus speed in mixed traffic, from Exhibit 4-56m and Exhibit 4-57m, and modifying this speed by adjustment factors for skip-stop operation and bus-bus interferences.
Steps
1. Calculate the capacity of the adjacent lane, using the procedures given in Chapter 16 of the Highway CapacityManual. This will be the same for all scenarios.
AHV ffCgvc )/(0=
)90.0)(98.0)(45.0( veh/h)900,1(=c veh/h754=c
Chapter 9—Example Problems Page 4-74 Part 4/BUS TRANSIT CAPACITY

Transit Capacity and Quality of Service Manual—2nd Edition
Add a Second Loading Area 2. For the purposes of determining speed,
the critical bus stop capacity should be recalculated using a 25% failure rate. The other inputs are the same as in Example Problem 2.
dvdcl tZctCgt
CgB++
=)/(
)/(600,3
)30)(60.0)(675.0()30)(45.0(10)45.0(600,3
++=lB
bus/h 45=lB
lels BNB =
)45)(75.1(=sB
bus/h 78=sB
3. Bus speeds are calculated from Equation
4-15. In this scenario, fs = 1.0, as there are no skip-stops. The bus-bus interference factor, fb , is determined from Exhibit 4-59: v/c = (38/78) = 0.49 and, therefore, fb is 1.00.
bslr
t fftt
S+
=60
4. The base bus running time, tr , is determined from Exhibit 4-56m (20 second average dwell time and 8 stops per kilometer gives 7.24 min/km. The bus running time loss, tl , is determined from Exhibit 4-57m. For a CBD bus lane with no right turns, under typical conditions, this loss is 0.7 min/km.
)(1.0)(1.00km/h7.024.7
60⎟⎠⎞
⎜⎝⎛
+=tS
km/h 6.7=tS
Stop Every Two Blocks 5. In this scenario, average dwell times are
assumed to double, as each remaining stop must accommodate twice as many passengers as before. Critical stop capacity is calculated from Equation 4-6. Here, the value of Z corresponding to a 10% failure rate is used, because the question of interest is how many buses can use the stop at that desired level of reliability, and not how fast they will travel. The added dwell times reduce the critical stop capacity by too much. Even with a second loading area, capacity would only be 34 bus/h, not enough to accommodate the planned number of buses.
dvdcl tZctCgt
CgB++
=)/(
)/(600,3
)60)(60.0)(28.1()60)(45.0(10)45.0(600,3
++=lB
bus/h 19=lB
Implement Skip-Stops with Two Loading Areas 6. In this scenario, buses would be divided
into two groups. Instead of having 38 buses per hour scheduled to use a stop that has a capacity to accommodate no more than 34 per hour, the largest group would only have 20 buses scheduled per hour. Thus, we know that the 38 scheduled buses can be accommodated. To begin, calculate the adjacent lane impedance factor from Equation 4-12.
3
8.01 ⎟⎠⎞
⎜⎝⎛−=
cvfi
3
7545008.01 ⎟
⎠⎞
⎜⎝⎛−=if
77.0=if
Part 4/BUS TRANSIT CAPACITY Page 4-75 Chapter 9—Example Problems

Transit Capacity and Quality of Service Manual—2nd Edition
Chapter 9—Example Problems Page 4-76 Part 4/BUS TRANSIT CAPACITY
7. Calculate the skip-stop adjustment factor from Equation 4-11. Arrivals are typical; therefore, the fa factor is 0.75. ss
ssiak N
Nfff )1(1 −+=
2)12)(77.0)(75.0(1 −+
=kf
79.0=kf
8. The capacity used for calculating speed
should be based on maximum capacity (25% failure), which is 46 buses/h, rather than the 34 buses/h used previously.
The bus lane vehicle capacity is given by
Equation 4-14 and is equal to the sum of the two patterns’ critical bus stop vehicle capacities, multiplied by the factor calculated in Step 7. Because the two patterns have identical characteristics, their capacities are the same.
)( 21 BBfB k +=
)4646(79.0 +=B
bus/h 72=B
9. The skip-stop speed adjustment factor is calculated from Equation 4-16. The larger of the two patterns’ bus vp /Bp ratios should be used in the calculation; thus, vp /Bp = (20/46) = 0.43.
⎟⎟⎠
⎞⎜⎜⎝
⎛⎟⎠⎞
⎜⎝⎛
⎟⎟⎠
⎞⎜⎜⎝
⎛−=
p
ps B
vcv
ddf
2
2
1 1
⎟⎠⎞
⎜⎝⎛
⎟⎠⎞
⎜⎝⎛
⎟⎠⎞
⎜⎝⎛−=
4620
754500
2501251
2
sf
90.0=sf
10. The bus-bus interference factor, fb , is determined from Exhibit 4-59: v/c = 0.59, and by interpolation, fb is 0.94. The base bus running time, tr , is determined from Exhibit 4-56m (40 second average dwell time and 4 stops per kilometer gives 4.82 min/km. The bus running time loss, tl , is the same as before, 0.7 min/km.
bslr
t fftt
S+
=60
0)(0.90)(1.0km/h 7.082.4
60⎟⎠⎞
⎜⎝⎛
+=tS
km/h 8.9=tS
11. For comparison, the existing bus speeds
on the street (32 buses and single loading areas) are:
bslr
t fftt
S+
=60
)(1.0)(0.88km/h0.724.7
60 ⎟⎠⎞
⎜⎝⎛
+=tS
km/h 6.6=tS
The Results All options, except increasing stop spacing (with or without a second loading
area), provide sufficient bus capacity to accommodate the proposed route modification. Adding a second loading area to each stop will accommodate the additional buses and will result in travel speeds similar to, or slightly greater than, existing speeds.
Implementing a skip-stop pattern, in conjunction with increasing stop spacing and adding a second loading area, will improve speeds by nearly 50%, compared with existing levels. The trade-off is that some passengers will have to walk an extra block to board their bus.

Transit Capacity and Quality of Service Manual—2nd Edition
Example Problem 4
The Situation A transit agency wants to consolidate its outbound downtown bus routes, which
currently use several streets, onto a single three-lane one-way street.
The Question How will the street operate with the added buses from the perspective of bus
operations?
The Facts • g/C = 0.45.
• 40 buses per hour will use the street.
• An average of 1,200 automobiles per hour also use the street. Because of existing bus activity, automobiles tend to avoid the curb lane except to make right turns.
• To reduce walking distances for passengers from the shelter to the bus door and thus minimize dwell times, the transit operator desires to limit the number of loading areas to two per stop.
• Near-side, on-line stops will be located every two blocks.
• Dwell times, curb lane auto right-turn volumes, and conflicting pedestrian volumes are as follows:
Stop #
Average Dwell Time (s)
Right-Turn Volume (veh/h)
Conflicting Ped Volume (ped/h)
1 30 350 100 2 35 200 300 3 40 100 500 4 20 300 200
Assumptions and Derived Values
• The bus stop location factor, fl, is 0.90 (Type 2 lane, near-side stop), from Exhibit 4-51.
• For on-line stops, assume a 10-second clearance time.
• Z = 1.44 for 7.5% failure rate, from Exhibit 4-6.
• Assume 60% coefficient of variation of dwell times.
• For two linear on-line berths, the number of effective loading areas, Nel, is 1.75, from Exhibit 4-12.
Outline of SolutionAll input parameters are known. The critical bus stop will determine the bus lane
capacity. Because of the variety of dwell times, right-turn volumes, and conflicting pedestrian volumes, the critical stop is not immediately obvious. The bus capacity of each stop must be found first, which will then be modified by the number of effective loading areas at each stop and the mixed traffic adjustment factor from Equation 4-17.
Part 4/BUS TRANSIT CAPACITY Page 4-77 Chapter 9—Example Problems
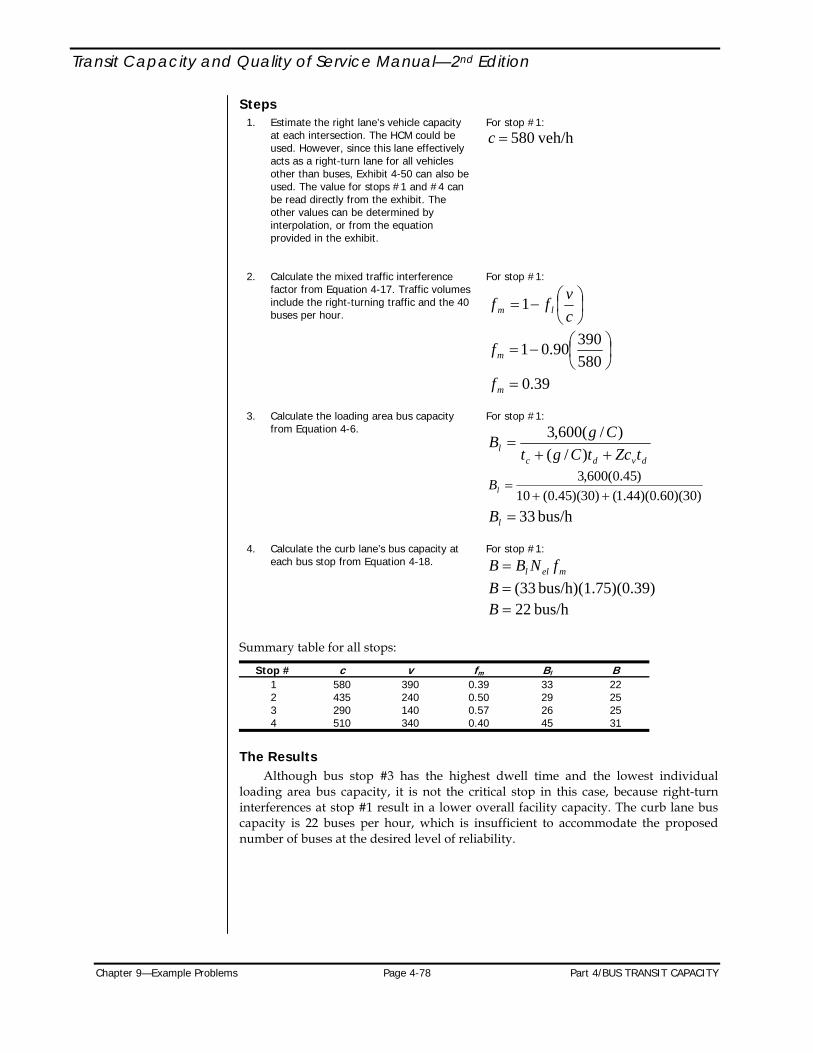
Transit Capacity and Quality of Service Manual—2nd Edition
Steps 1. Estimate the right lane’s vehicle capacity
at each intersection. The HCM could be used. However, since this lane effectively acts as a right-turn lane for all vehicles other than buses, Exhibit 4-50 can also be used. The value for stops #1 and #4 can be read directly from the exhibit. The other values can be determined by interpolation, or from the equation provided in the exhibit.
For stop #1:
veh/h580=c
2. Calculate the mixed traffic interference factor from Equation 4-17. Traffic volumes include the right-turning traffic and the 40 buses per hour.
For stop #1:
⎟⎠⎞
⎜⎝⎛−=
cvff lm 1
⎟⎠⎞
⎜⎝⎛−=
58039090.01mf
39.0=mf
3. Calculate the loading area bus capacity
from Equation 4-6. For stop #1:
dvdcl tZctCgt
CgB++
=)/(
)/(600,3
)30)(60.0)(44.1()30)(45.0(10)45.0(600,3
++=lB
bus/h 33=lB
4. Calculate the curb lane’s bus capacity at
each bus stop from Equation 4-18. For stop #1:
mell fNBB =
5)(0.39)bus/h)(1.7 33(=B
bus/h 22=B
Summary table for all stops:
Stop # c v fm Bl B 1 580 390 0.39 33 22 2 435 240 0.50 29 25 3 290 140 0.57 26 25 4 510 340 0.40 45 31
The Results Although bus stop #3 has the highest dwell time and the lowest individual
loading area bus capacity, it is not the critical stop in this case, because right-turn interferences at stop #1 result in a lower overall facility capacity. The curb lane bus capacity is 22 buses per hour, which is insufficient to accommodate the proposed number of buses at the desired level of reliability.
Chapter 9—Example Problems Page 4-78 Part 4/BUS TRANSIT CAPACITY

Transit Capacity and Quality of Service Manual—2nd Edition
Comments The simplest way, if space permits, to add capacity to bus stop with one or two
loading areas is to add another loading area. However, in this case, the transit operator desires to minimize pedestrian walking distances by limiting the number of loading areas to two. Further, a review of Exhibit 4-12 shows that even five loading areas would not provide enough capacity, because of the decreasing efficiency of each additional loading area.
Another option is to increase the design failure rate. However, doing so decreases schedule and headway reliability and should be avoided when possible. Therefore, other potential solutions will need to be evaluated. These possibilities are the subjects of subsequent example problems.
Part 4/BUS TRANSIT CAPACITY Page 4-79 Chapter 9—Example Problems

Transit Capacity and Quality of Service Manual—2nd Edition
Example Problem 5
The Situation The CBD street from Example Problem 4. Having determined that a mixed traffic
lane with near-side stops will not work, the transit agency would like to try far-side stops to avoid some of the right-turn interferences.
The Question
How will buses operate on this street under this scenario?
The FactsSame assumptions as Example Problem 4, except that stops are now on the far
side.
Outline of SolutionAll input parameters are known and the critical bus stop (known to be stop #1
from Example Problem 4) will determine the bus lane capacity. The only factor that changes is the location factor, fl, which is 0.5 for a Type 2 mixed traffic lane.
Steps 1. Calculate the mixed traffic interference
factor at stop #1 from Equation 4-17. Traffic volumes include the right-turning traffic and the 40 buses per hour.
⎟⎠⎞
⎜⎝⎛−=
cvff lm 1
⎟⎠⎞
⎜⎝⎛−=
58039050.01mf
66.0=mf
2. Calculate the curb lane’s bus capacity at
stop #1, using Equation 4-18. mell fNBB =
5)(0.66)bus/h)(1.7 33(=B
bus/h 38=B
The Results Repeating these steps for the other stops, stop #3 becomes the critical stop once
right-turn interferences are minimized by far-side stopping, with a capacity of 34 buses per hour. The street’s bus capacity improves substantially as a result of using far-side stops, but is still below the 40 buses per hour that will be scheduled to use it.
Comments At this point, the transit agency could reconsider having only two loading areas
at each stop. Adding a third loading area at stop #3 would provide a capacity of 48 buses per hour. Additional loading areas also would be required at stops #1 and #3. Extending bus stops may require the cooperation of the local road authority, particularly in situations when on-street parking is provided.
Another option would be to prohibit right turns at key intersections, to remove the interference of right-turning traffic on the buses. The mixed traffic interference factor would be 1.0 and the capacity of stop #1, for example, would be 57 buses per hour. This action would result in 350 vehicles per hour having to find another route and would require the cooperation of the local road authority.
The next problem looks at a potential bus operations solution to add capacity.
Chapter 9—Example Problems Page 4-80 Part 4/BUS TRANSIT CAPACITY

Transit Capacity and Quality of Service Manual—2nd Edition
Example Problem 6
The Situation The CBD street from Example Problems 4 and 5. The transit agency would next
like to try a skip-stop operation to improve capacity.
The Question Is sufficient bus capacity provided under this scenario?
The Facts
The assumptions used in Example Problems 4 still apply. However, if a skip-stop operation utilizing the existing near-side stops does not provide sufficient capacity, far-side stops will be tried next.
Half of the buses will use “A”-pattern stops, which are the same ones used in Problem 5. The other half will use “B”-pattern stops in the alternate blocks. For this example, the critical “B” stop has the same characteristics as the critical “A” stop.
Assumptions and Derived Values• Buses will be scheduled to spread out bus arrivals, but some service
irregularities are expected as a result of mixed traffic operations.
• Automobile volumes in the left two lanes are assumed to be evenly distributed.
• The adjustment factor, fa, for typical arrivals, from Equation 4-11, is 0.75.
• From the Highway Capacity Manual, the base saturation flow rate (v0) is 1,900 passenger vehicles per hour of green per lane, the heavy vehicle saturation flow adjustment factor (fHV) is 0.97, and the area saturation flow adjustment factor (fA) is 0.90 for a CBD.
Outline of SolutionAll input parameters are known. The critical “A” and “B” bus stops will
determine the bus lane capacity. The v/c ratio of the adjacent lane will need to be calculated to determine how well buses can use that lane to pass other buses. The bus lane capacity will be the sum of the capacities of the “A” and “B” stop patterns, multiplied by an adjustment factor for the effect of random bus arrivals and the impedance of other traffic in the adjacent lane.
Steps1. Calculate the adjacent lane volume and
capacity. At stop #1:
vph4252/)350200,1( =−=v
AHV ffCgvc )/(0=
90))(0.97)(0. vph)(0.45900,1(=c
veh/h746=c
Part 4/BUS TRANSIT CAPACITY Page 4-81 Chapter 9—Example Problems

Transit Capacity and Quality of Service Manual—2nd Edition
2. Calculate the adjacent lane impedance factor, from Equation 4-12.
At stop #1: 3
8.01 ⎟⎠⎞
⎜⎝⎛−=
cvfi
3
7464258.01 ⎟
⎠⎞
⎜⎝⎛−=if
85.0=if
3. Calculate the skip-stop adjustment factor
from Equation 4-11.
ss
ssiak N
Nfff )1(1 −+=
2)12)(85.0)(75.0(1 −+
=kf
82.0=kf
4. The “A” pattern bus lane capacity for
near-side stops, from Example Problem 4, is 22 buses per hour, based on the capacity of the critical stop (stop #1). The “B” pattern’s critical stop has similar characteristics and, thus, similar capacity. Calculate the total bus capacity of the street, using Equation 4-14.
B f B B Bk n= + + +( ... )1 2
)2222)(82.0( +=B
bus/h 36=B
5. As skip-stop operation using near-side stops do not provide enough capacity, far-side stops are tried next. The critical stop capacity was 34 buses per hour, from Example Problem 5.
B f B B Bk n= + + +( ... )1 2
)3434)(82.0( +=B
bus/h 55=B
The Results If skip-stops are implemented and bus stops are placed on the far sides of
intersections, there will be sufficient capacity for the proposed 40 buses per hour, with some excess capacity to accommodate more buses in the future.
Comments The agency now has several options to accommodate the proposed route
restructuring. To help narrow down the choices, additional analysis could be done to determine the effect of each option on bus travel speeds, overall person delay, capital costs (e.g., to move shelters to new stop locations), and so on.
Chapter 9—Example Problems Page 4-82 Part 4/BUS TRANSIT CAPACITY

Transit Capacity and Quality of Service Manual—2nd Edition
Example Problem 7
The Situation The CBD street from Example Problems 4 through 6.
The Question How many people can be carried at the street’s maximum load point if skip-stop
operation is implemented?
The Facts • Same assumptions as Example Problem 6.
• All buses are 43-passenger buses.
• Ten buses are express buses operating on freeways. The agency’s policy is not to allow standees on buses that travel on freeways.
• The remaining local buses allow standees.
Assumptions
• Assume maximum schedule loads for the local buses, equivalent to a load factor of 1.50 for standard buses.
• The peak hour factor is 0.75.
Outline of SolutionThe person capacity at the street’s maximum load point is equal to the street’s
bus capacity, multiplied by the allowed passenger load per bus and the peak hour factor. From Example Problem 6, the street’s bus capacity is 55 buses per hour.
Steps1. Calculate the street’s bus person capacity at its maximum load point, under
the proposed operation. 75.0*)]50.1*43*30()43*10[( +=P
p/h 770,1=P (rounded)
2. Calculate the street’s maximum bus person capacity at its maximum load point, assuming no more than 10 express buses.
75.0*)]50.1*43*45()43*10[( +=P
(rounded) p/h 500,2=P
The Results Under the proposed operation, the street can carry about 1,770 people per hour
in buses at its maximum load point. If the street’s bus capacity of 55 buses per hour were to be scheduled, the street’s person capacity would be about 2,500 people per hour in buses at the maximum load point.
Part 4/BUS TRANSIT CAPACITY Page 4-83 Chapter 9—Example Problems

Transit Capacity and Quality of Service Manual—2nd Edition
Example Problem 8
The Situation A transit agency operates its buses in mixed traffic on a three-lane one-way street
in downtown. The combination of the volume of buses and the volume of traffic on the street is causing operational and reliability problems for the buses. To address these issues, the agency is proposing that one lane of the street be converted to exclusive bus use over an eight-block section, with right turns prohibited from the bus lane. This conversion would also accommodate future growth in bus volumes and help the operator maintain schedules as city streets become more congested. The city traffic engineer is concerned about the additional delay that will be experienced by motorists if the lane is implemented.
The Question Will the proposed bus lane increase or decrease overall peak hour person delay?
The Facts
• 1,050 vehicles (including 3% trucks) and 52 buses use the street during the peak hour. Because this analysis addresses average person delay during the peak hour, rather than the peak 15 minutes of the peak hour, no vehicle PHF is required.
• Far-side, on-line stops with three loading areas are located every two blocks.
• No right turns would be allowed across the bus lane.
• Buses will be able to use the adjacent mixed traffic lane to pass other buses in the bus lane (i.e., the lane will be a Type 2 bus lane).
• Blocks are 440 ft (135 m) long, with traffic signals at the end of each block.
• The buses in use have 40 seats. The average peak hour load per bus is 30 passengers. Average vehicle occupancies are 1.2 persons per automobile.
• With a bus lane, the automobiles currently making right turns from this street will have to divert to a parallel street to make their turns, incurring an extra 60 seconds of delay each. Added delay to vehicles on these parallel streets, as well as the reduced delay to other vehicles that take their place on the bus street, is neglected.
• Average bus dwell times at the critical stop are 45 seconds. An average of 150 vehicles per hour make right turns from the bus street at the critical stop and an average of 650 vehicles per hour make right turns along the entire eight-block section. An average of 400 pedestrians per hour conflict with the right-turn movement at the critical bus stop’s intersection.
• The average dwell time for the four stops located along the proposed bus lane is 35 seconds.
• Pre-timed signals, 60-second cycle, g/C = 0.45, HCM arrival type 5, 25 mph (40 km/h) free-flow speed, no on-street parking, no grades, 12-ft (3.6-m) travel lanes, HCM arterial class IV.
Assumptions and Derived Values• From the Highway Capacity Manual, the base saturation flow rate (v0) is 1,900
passenger vehicles per hour of green per lane and the area saturation flow adjustment factor (fA) is 0.90 for a CBD. Traffic volumes in the left two lanes are assumed to be evenly distributed. The heavy vehicle factor, fHV, is 0.97.
Chapter 9—Example Problems Page 4-84 Part 4/BUS TRANSIT CAPACITY

Transit Capacity and Quality of Service Manual—2nd Edition
The g/C ratio is known. The combination of these factors results in a per-lane capacity of 746 vehicles per hour.
• The bus stop location factor, fl, is 0.50 for a Type 2 bus lane, from Exhibit 4-51.
• For pre-timed signals, the actuated control adjustment factor, k, is 0.50. (This is an input to an HCM procedure in Step 7.)
• For on-line stops, assume a 10-second clearance time.
• When calculating speeds, maximum capacity (i.e., a 25% failure rate) is used; thus, Z = 0.675.
• Assume a 60% coefficient of variation of dwell times.
• Assume buses are scheduled to spread out arrivals. The adjustment factor, fa, for typical bus arrivals, from Equation 4-11, is 0.75.
• For three linear on-line berths, the number of effective berths, Nel, is 2.45, from Exhibit 4-12.
Outline of Solution
(
All of the input parameters are known. Travel speeds will be calculated for passenger vehicles and buses with and without the bus lane. Passenger vehicle speed will be calculated using methodologies from the Highway Capacity Manual 2000. The speeds will be converted to travel times over the length of the 3,520-ft (1,080-m) analysis section. The difference in travel times with and without the bus lane will be calculated for each mode. These time differences will be multiplied by the number of people affected and the results will provide the net change in person delay.
Stepsa) Determine Transit Travel Times
1. Calculate the street’s maximum bus
capacity, using Equation 4-13 and Equation 4-10. The capacity of the right-turn movement is estimated from Exhibit 4-50.
rell fNBB =
dvdcl tZctCgt
CgB++
=)/(
)/(600,3
)45)(60.0)(675.0()45)(45.0(10)45.0( 600,3
++=lB
bus/h 33=lB
⎟⎟⎠
⎞⎜⎜⎝
⎛−=
r
rlr c
vff 1
⎟⎠⎞
⎜⎝⎛−=
3601505.01rf
79.0=rf
)79.0)(45.2)(33(=B
bus/h 63=B
Part 4/BUS TRANSIT CAPACITY Page 4-85 Chapter 9—Example Problems

Transit Capacity and Quality of Service Manual—2nd Edition
2. With 52 buses per hour scheduled and a capacity of 63 buses per hour (a v/c ratio of 0.83), bus speeds will be affected by bus-bus interference. Equation 4-15 is used to calculate bus speed. Interpolating from Exhibit 4-56, base bus running times are 6.80 min/mi for stops every 880 feet (6 per mile). Additional running time losses are 3.75 min/mi for mixed traffic CBD operations, when traffic signals are more frequent than bus stops. There are no skip-stop stop operations, so the skip-stop factor, fs , is 1.0. Exhibit 4-59 gives the bus-bus interference factor fb.
bslr
t fftt
S ⎟⎟⎠
⎞⎜⎜⎝
⎛+
=60
)77.0)(0.1(75.380.6
60⎟⎠⎞
⎜⎝⎛
+=tS
mph 4.4=tS
3. With a bus lane, right-turning traffic interference is removed (fr = 1.0) and the bus facility capacity increases.
rell fNBB =
)0.1)(45.2)(33(=B
bus/h 80=B
4. The increased capacity reduces interference between buses, which increases speeds. The new v/c ratio is 52/80, or 0.65, resulting in a bus-bus interference factor of 0.92. An exclusive bus lane reduces running time losses from the interference of other traffic, which also results in increased speeds. The step #2 calculations are repeated for the “with bus lane” scenario.
bslr
t fftt
S ⎟⎟⎠
⎞⎜⎜⎝
⎛+
=60
)92.0)(0.1(75.180.6
60⎟⎠⎞
⎜⎝⎛
+=tS
mph 5.6=tS
5. Calculate the time to travel the 3,520-foot analysis section with and without the exclusive bus lane.
Without: t = (0.67 mi)/(4.4 mph) = 0.152 h t = 9.1 min With: t = (0.67 mi)/(6.5 mph) = 0.103 h t = 6.2 min
6. Calculate the change in person-minutes of travel time for transit passengers.
∆t = (52 bus*30 p/bus) * (9.1 min – 6.2 min) ∆t = 4,524 person-minute decrease
(b) Determine Automobile Travel Times
7. Using the procedures provided in Chapter 16 of the Highway Capacity Manual 2000, calculate the average travel speeds for automobiles on the street under the present situation (there are several steps to this process, which are not shown here).
mph 6.11=AS
8. With a bus lane, the volume in the remaining two general-purpose lanes increases from 350 veh/lane to 525 veh/lane, resulting in increased traffic delays and lower speeds. Repeat Step 7 for the bus lane scenario.
mph 9.10=AS
Chapter 9—Example Problems Page 4-86 Part 4/BUS TRANSIT CAPACITY

Transit Capacity and Quality of Service Manual—2nd Edition
9. Calculate the time to travel the 3,520-foot analysis section with and without the exclusive bus lane.
Without: t = (0.67 mi)/(11.6 mph) = 0.058 h t = 3.5 min With: t = (0.67 mi)/(10.9 mph) = 0.061 h t = 3.7 min
10. Calculate the change in person-minutes of
travel time for automobile passengers, including the added delay to the 650 diverted right-turning vehicles.
∆t = (1,200 veh*1.2 p/veh)(3.7 min – 3.5 min) + (650 veh*1.2 p/veh)(1 min) ∆t = 1,068 person-minute increase
(c) Determine the Net Change in Person Delay
11. Subtract the increased travel time for automobile passengers from the decreased travel time for bus passengers.
∆t = (4,524 person-min) – (1,068 person-min) ∆t = 3,456 person-minute savings
The Results The proposed arterial street bus lane will reduce peak-hour person delay by over
3,400 person-minutes. Buses will be able to traverse the section nearly three minutes faster than before, through vehicles will be slowed by about 12 seconds, and diverted right-turning vehicles will be slowed by 1.0 minute. Because the proposed bus lane will result in an overall travel time savings to users of the street, the proposal should be viewed favorably from that perspective. (There may be other perspectives, not stated in the problem, that may also need to be considered.)
Part 4/BUS TRANSIT CAPACITY Page 4-87 Chapter 9—Example Problems

Transit Capacity and Quality of Service Manual—2nd Edition
Example Problem 9
The Situation A transit operator would like to implement queue-jump signal priority at a
signalized intersection on a city arterial street. The city traffic engineer is concerned about how automobile traffic will be affected.
The Question Compare the change in person delay as a result of the signal priority measure.
The Facts • Buses arrive at a near-side stop located in a right-turn lane during the green
signal phase for Main Street. Boarding and discharging passengers is completed before the end of the red signal phase for Main Street. The proposed queue jump will give eastbound peak-direction buses a green indication for 3.0 seconds in advance of other traffic moving in the peak direction, allowing these buses to merge back into the travel lane ahead of the other vehicles stopped at the signal. A detector at the bus stop is used to provide a queue jump signal phase only when a bus occupies the stop. The 3.0 seconds is taken from the green time for the peak direction of travel.
• Lane configurations and traffic volumes are given in the figure below. The queue jump operates on the eastbound direction on Main Street.
75150160065
25100
100
65050
40
200
125
ELM
MAIN
BUS STOP
• The traffic signal cycle length is 90 seconds. Protected left-turn phasing (i.e.,
a green arrow) is provided on Main Street and permitted left-turn phasing (i.e., a solid green circle indication) is provided on Elm Street.
• The peak hour factor is 0.94.
• Buses operate at 10-minute headways on Main Street and at 30-minute headways on Elm Street.
Chapter 9—Example Problems Page 4-88 Part 4/BUS TRANSIT CAPACITY

Transit Capacity and Quality of Service Manual—2nd Edition
• During the peak hour, average passenger vehicle occupancy is 1.2, average bus occupancy on Main Street is 40 in the peak direction and 20 in the off-peak direction, and average bus occupancy on Elm Street is 25 in the peak direction and 10 in the off-peak direction.
Assumptions and Derived Values
• Bus re-entry delay cannot be calculated from Exhibit 4-5 in this case because the re-entry delay is caused by waiting for a queue to clear at a signalized intersection, rather than waiting for a gap in a traffic stream of randomly arriving vehicles. Field measurements indicate that it takes 18 seconds on average for the queue to clear before buses are able to re-enter the street. The proposed queue jump would eliminate this delay.
• A capacity analysis using the Highway Capacity Manual finds that the intersection’s volume-to-capacity ratio is sufficiently low that the added 3.0 seconds of delay to peak-direction traffic during a queue jump should not cause cycle failures (i.e., all queued peak-direction traffic will clear the intersection on the next green signal).
Outline of Solution All of the input parameters are known. Because the queue jump only takes green
time away from through traffic in one direction, it is not necessary to calculate delays for all movements. Rather, the average delay for peak-direction automobile traffic is 3.0 seconds longer for those cycles when the queue jump is used. The added delay to persons in automobiles during the queue jump cycles will be compared with the delay savings experienced by persons in peak-direction buses. All other persons in all other vehicles at the intersection experience no net change in person-delay.
Steps1. Calculate the delay savings to persons on
peak-direction buses. p/bus) bus/h)(40 s)(6 18(=∆t
seconds-person 320,4=∆t
decrease minute-person 72≈∆t
2. The average number of peak-direction automobiles traveling through the intersection during a cycle in which a queue jump occurs is (1600/40), or about 40 veh/cycle. At 10-min headways, a queue jump would occur six times an hour. Calculate the added delay to the occupants of these vehicles.
p/veh) )(1.2 veh/cycle0cycle/h)(4 s)(6 3( =∆tseconds-person 864=∆t
increase minute-person 15≈∆t
3. Subtract the increased travel time for automobile passengers from the decreased travel time for bus passengers.
min)-person (15 - min)-person 72(=∆t
savings minute-person 57=∆t
The Results The proposed queue jump will decrease person-delay by approximately 57
person-minutes during the peak hour. Because the proposed queue jump will result in an overall travel time savings to users of the street, the proposal should be viewed favorably from that perspective. (There may be other perspectives, not stated in the problem, that may also need to be considered.)
Part 4/BUS TRANSIT CAPACITY Page 4-89 Chapter 9—Example Problems

Transit Capacity and Quality of Service Manual—2nd Edition
This page is intentionally blank.
Chapter 9—Example Problems Page 4-90 Part 4/BUS TRANSIT CAPACITY
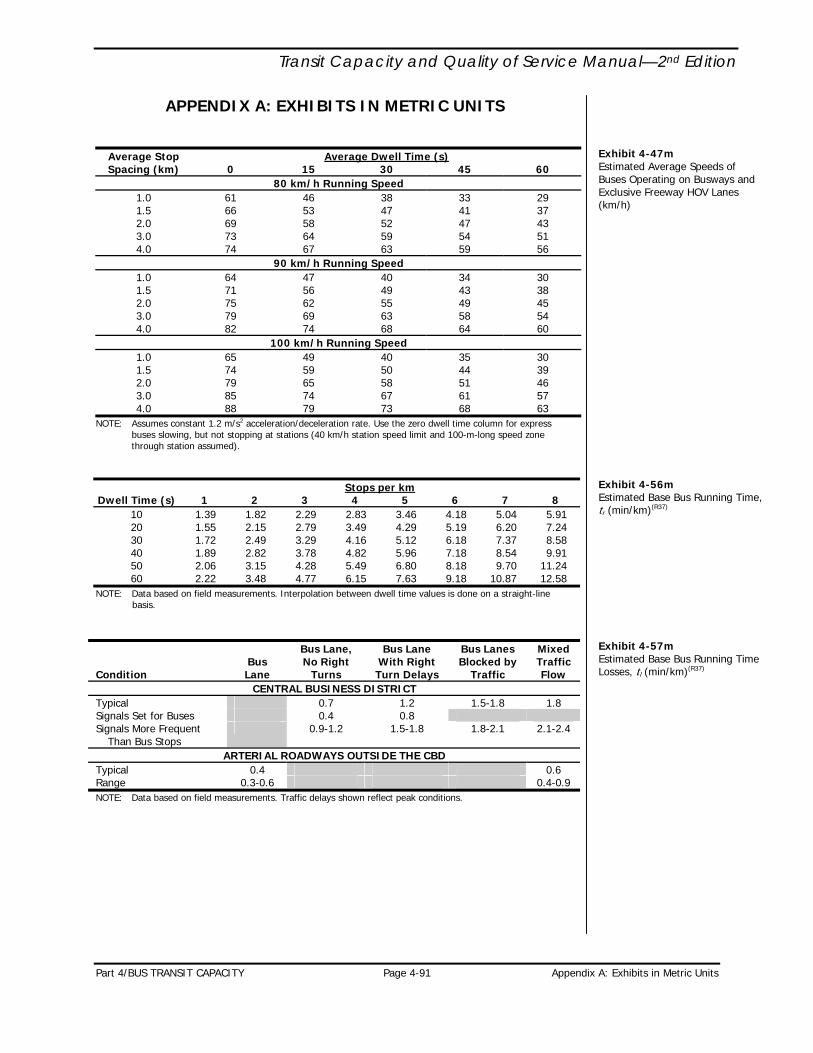
Transit Capacity and Quality of Service Manual—2nd Edition
APPENDIX A: EXHIBITS IN METRIC UNITS
Average Stop Average Dwell Time (s)Spacing (km) 0 15 30 45 60
80 km/h Running Speed 1.0 61 46 38 33 29 1.5 66 53 47 41 37 2.0 69 58 52 47 43 3.0 73 64 59 54 51 4.0 74 67 63 59 56
90 km/h Running Speed 1.0 64 47 40 34 30 1.5 71 56 49 43 38 2.0 75 62 55 49 45 3.0 79 69 63 58 54 4.0 82 74 68 64 60
100 km/h Running Speed 1.0 65 49 40 35 30 1.5 74 59 50 44 39 2.0 79 65 58 51 46 3.0 85 74 67 61 57 4.0 88 79 73 68 63
Exhibit 4-47m Estimated Average Speeds of Buses Operating on Busways and Exclusive Freeway HOV Lanes (km/h)
NOTE: Assumes constant 1.2 m/s2 acceleration/deceleration rate. Use the zero dwell time column for express buses slowing, but not stopping at stations (40 km/h station speed limit and 100-m-long speed zone through station assumed).
Stops per kmDwell Time (s) 1 2 3 4 5 6 7 8
10 1.39 1.82 2.29 2.83 3.46 4.18 5.04 5.91 20 1.55 2.15 2.79 3.49 4.29 5.19 6.20 7.24 30 1.72 2.49 3.29 4.16 5.12 6.18 7.37 8.58 40 1.89 2.82 3.78 4.82 5.96 7.18 8.54 9.91 50 2.06 3.15 4.28 5.49 6.80 8.18 9.70 11.24 60 2.22 3.48 4.77 6.15 7.63 9.18 10.87 12.58
Exhibit 4-56m Estimated Base Bus Running Time, tr (min/km)(R37)
NOTE: Data based on field measurements. Interpolation between dwell time values is done on a straight-line basis.
Condition
Bus Lane
Bus Lane, No Right
Turns
Bus Lane With Right Turn Delays
Bus Lanes Blocked by
Traffic
Mixed Traffic Flow
CENTRAL BUSINESS DISTRICT Typical 0.7 1.2 1.5-1.8 1.8 Signals Set for Buses 0.4 0.8 Signals More Frequent
Than Bus Stops 0.9-1.2 1.5-1.8 1.8-2.1 2.1-2.4
ARTERIAL ROADWAYS OUTSIDE THE CBD Typical 0.4 0.6 Range 0.3-0.6 0.4-0.9
Exhibit 4-57m Estimated Base Bus Running Time Losses, tl (min/km)(R37)
NOTE: Data based on field measurements. Traffic delays shown reflect peak conditions.
Part 4/BUS TRANSIT CAPACITY Page 4-91 Appendix A: Exhibits in Metric Units

Transit Capacity and Quality of Service Manual—2nd Edition
Exhibit 4-60m Illustrative Bus-Bus Interference Factor Effects
0
5
10
15
20
25
0.0 0.1 0.2 0.3 0.4 0.5 0.6 0.7 0.8 0.9 1.0
Bus Lane v/c Ratio
Ave
rage
Bus
Spe
ed (
km/h
)
1 stop/km 2 stops/km 4 stops/km 6 stops/km 8 stops/km NOTE: Assumes 30-second dwell times, CBD bus lane with right-turn delays, and typical signal timing.
Appendix A: Exhibits in Metric Units Page 4-92 Part 4/BUS TRANSIT CAPACITY

Transit Capacity and Quality of Service Manual—2nd Edition
APPENDIX B: DWELL TIME DATA COLLECTION PROCEDURE
INTRODUCTION As discussed in Chapter 1, passenger service times (and dwell times) can vary
greatly depending on many factors. For example, passenger service times reported in the literature range from 1 to 10 seconds per passenger.(R1,R13,R27,R32) For this reason, it is recommended that field data be collected when estimating passenger service times and dwell times for a given system.
Although a transit vehicle’s passenger service time may be affected by many factors, most of these factors are constant for a given system. For this reason, the principal determinants of service time typically include aspects of passenger demand. Therefore, for a given transit system with constant operating characteristics (i.e., fare collection system, number and width of doors, number of steps to board/alight, etc.), the major factors affecting service time will be
• The number of passengers boarding,
• The number of passengers alighting, and
• The number of passengers on board. This appendix presents methodologies for measuring passenger service times
and dwell times in the field for buses and light rail transit (LRT).
PASSENGER SERVICE TIMES Passenger movements at most stops are small, typically one or two passengers
boarding or alighting per stop. In these situations, dwells are relatively independent of passenger service times and it is not possible to collect statistically useful data. To determine passenger service times for use in evaluating the differences between systems (such as single- and dual-stream doors, high- and low-floor buses, or alternate fare collection systems), data collection should be done only at high-volume stops. These stops are typically downtown or at major transfer points. The data collection effort will require one or two persons, depending on the number of passengers.
The following are steps that may be used to collect field data on passenger service times. An example of a data collection sheet is shown in Exhibit 4-63.
1. From a position at the transit stop under study, record the identification number and run number for each arriving vehicle.
2. Record the time that the vehicle comes to a complete stop. 3. Record the time that the doors have fully opened. 4. Count and record the number of passengers alighting and the number of
passengers boarding. 5. Record the time that the major passenger flows end. (Note: This is somewhat
subjective but essential to correlate flows per unit of time. The time for stragglers to board or exit should not be included.)
6. When passenger flows stop, count the number of passengers remaining on board. (Note: If the seating capacity of the transit vehicle is known, the number of passengers on board may be estimated by counting the number of vacant seats or the number of standees).
7. Record the time when the doors have fully closed.
Part 4/BUS TRANSIT CAPACITY Page 4-93 Appendix B: Dwell Time Data Collection Procedure
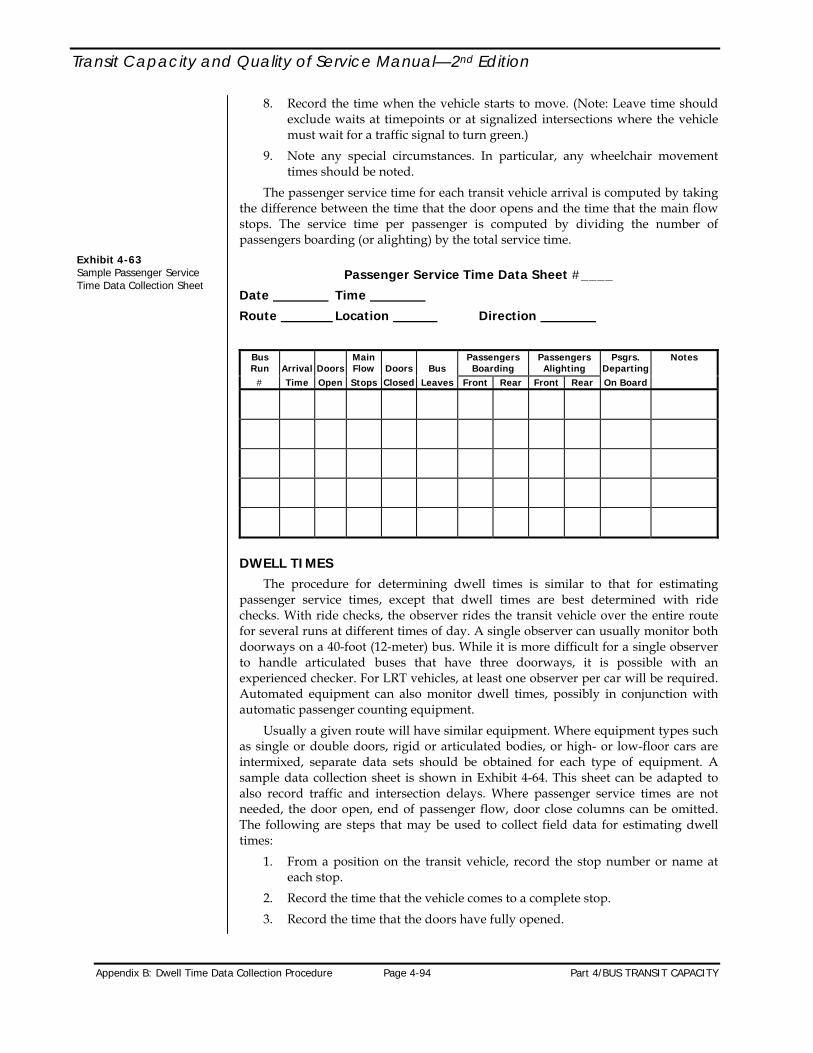
Transit Capacity and Quality of Service Manual—2nd Edition
8. Record the time when the vehicle starts to move. (Note: Leave time should exclude waits at timepoints or at signalized intersections where the vehicle must wait for a traffic signal to turn green.)
9. Note any special circumstances. In particular, any wheelchair movement times should be noted.
The passenger service time for each transit vehicle arrival is computed by taking the difference between the time that the door opens and the time that the main flow stops. The service time per passenger is computed by dividing the number of passengers boarding (or alighting) by the total service time.
Exhibit 4-63 Sample Passenger Service Time Data Collection Sheet
Passenger Service Time Data Sheet #____
Date Time
Route Location Direction
Bus Run
Arrival
Doors
Main Flow
Doors
Bus
Passengers Boarding
Passengers Alighting
Psgrs. Departing
Notes
# Time Open Stops Closed Leaves Front Rear Front Rear On Board
DWELL TIMES The procedure for determining dwell times is similar to that for estimating
passenger service times, except that dwell times are best determined with ride checks. With ride checks, the observer rides the transit vehicle over the entire route for several runs at different times of day. A single observer can usually monitor both doorways on a 40-foot (12-meter) bus. While it is more difficult for a single observer to handle articulated buses that have three doorways, it is possible with an experienced checker. For LRT vehicles, at least one observer per car will be required. Automated equipment can also monitor dwell times, possibly in conjunction with automatic passenger counting equipment.
Usually a given route will have similar equipment. Where equipment types such as single or double doors, rigid or articulated bodies, or high- or low-floor cars are intermixed, separate data sets should be obtained for each type of equipment. A sample data collection sheet is shown in Exhibit 4-64. This sheet can be adapted to also record traffic and intersection delays. Where passenger service times are not needed, the door open, end of passenger flow, door close columns can be omitted. The following are steps that may be used to collect field data for estimating dwell times:
1. From a position on the transit vehicle, record the stop number or name at each stop.
2. Record the time that the vehicle comes to a complete stop.
3. Record the time that the doors have fully opened.
Appendix B: Dwell Time Data Collection Procedure Page 4-94 Part 4/BUS TRANSIT CAPACITY

Transit Capacity and Quality of Service Manual—2nd Edition
4. Count and record the number of passengers alighting and the number of passengers boarding.
5. Record the time that the major passenger flows end. 6. When passenger flows stop, count the number of passengers remaining on
board. (Note: If the seating capacity of the transit vehicle is known, the number of passengers on board may be estimated by counting the number of vacant seats or the number of standees).
7. Record the time when doors have fully closed. 8. Record the time when the vehicle starts to move. (Note: Waits at timepoints
or at signalized intersections where the dwell is extended due to a red traffic signal should be noted but not included in the dwell time. A delay due to a driver responding to a passenger information request is an everyday event and should be included in the dwell time calculation. Time lost dealing with fare disputes, lost property, or other events should not be included.)
9. Note any special circumstances. In particular, any wheelchair movement times should be noted. Whether this is included in the mean dwell time depends on the system. Dwell times due to infrequent wheelchair movements are often not built into the schedule but rely on the recovery time allowance at the end of each run.
The observer must use judgment in certain cases. At near-side stops before signalized intersections, the driver may wait with doors open as a courtesy to any late-arriving passengers. The doors will be closed prior to a green light. This additional waiting time should not be counted as dwell time but as intersection delay time.
Dwell Time Data Sheet #____ Exhibit 4-64 Sample Dwell Time Data Collection Sheet Date Time Bus No. Bus Type_______
Route Run No. Direction
Stop #
and
Arrival
Doors Main Flow
Doors
Bus
Passengers Boarding
Passengers Alighting
Psgrs. Departing
Name Time Open Stops Closed Leaves Front Rear Front Rear On Board Notes
Part 4/BUS TRANSIT CAPACITY Page 4-95 Appendix B: Dwell Time Data Collection Procedure

Transit Capacity and Quality of Service Manual—2nd Edition
This page is intentionally blank.
Appendix B: Dwell Time Data Collection Procedure Page 4-96 Part 4/BUS TRANSIT CAPACITY

Transit Capacity and Quality of Service Manual—2nd Edition
Part 4/BUS TRANSIT CAPACITY Page 4-97 Appendix C: Bus Effects on Adjacent Lane Vehicle Capacity
APPENDIX C: BUS EFFECTS ON ADJACENT LANE VEHICLE CAPACITY
The introduction of single or dual bus lanes reduces a roadway’s vehicle capacity for other traffic. The extent of this reduction is determined by (1) the bus lane type, (2) the number of buses using the bus lane, and (3) whether or not the bus lane replaces a curb parking lane.
The following impacts are associated with the provision of a single or dual bus lane:(R36)
• If the lane is already used primarily by buses, the vehicle capacity loss will be relatively small. However, when the lane is introduced for relatively low existing bus flows (i.e., fewer than 40 buses per hour), the reduction in vehicle capacity could be as much as 30 to 50% of one travel lane.
• Introducing a single dedicated curb lane for buses onto a street with no previous bus operations reduces the street vehicle capacity by one lane if buses stay in the lane (Type 1) and right turns are prohibited or made from the second lane. Allowing right turns from a Type 1 bus lane reduces street vehicle capacity by less than one full lane.
• A dual bus lane (Type 3) reduces arterial vehicle capacity by up to two lanes. Because dual lanes usually would be implemented when buses already pre-empt most of the curb lane, the actual capacity reduction in arterial traffic would be less. The Madison Avenue dual bus lane experience in New York indicates that prohibiting right turns, eliminating weaving movements, and strict enforcement of regulations actually increased general traffic flow and speeds over what was experienced with an existing Type 2 bus lane.
• The effects of a Type 2 bus lane where buses may enter the adjacent lane will be between those of the Type 1 and Type 3 lanes. For low bus volumes, buses entering the mixed traffic lane would have little effect on the capacity of the mixed traffic lane. As bus volumes in a Type 2 lane increase, their impact on the adjacent lane increases to a point where some traffic is discouraged from using the adjacent lane. The passenger vehicle equivalency of a bus traveling without stops is estimated in the Highway Capacity Manual at 1.5 to 2.0 passenger vehicles. However, for Type 2 bus lanes, merging, weaving, and diverging maneuvers could raise this equivalency to 3 to 4 passenger vehicles or more.
The effects of bus lane operations on the adjacent general travel lane can be expressed by multiplying the adjacent lane’s vehicle capacity by the adjustment factor given in Equation 4-19, derived from simulation.(R36) The factor is applied to saturation flow similar to the other saturation flow adjustments, including the factor for bus blockage.
⎟⎟⎠
⎞⎜⎜⎝
⎛−=
360041 p
p
Nf
where: fp = bus-passing activity factor; and Np = number of buses making the maneuver from the curb lane to the
adjacent lane, from Equation 4-20.
See Chapter 5 for a description of exclusive bus lane types.
Saturation flow adjustment factor for bus use of an adjacent lane.
Equation 4-19

Transit Capacity and Quality of Service Manual—2nd Edition
The delay to through traffic in the adjacent lane is minimal unless buses leave the bus lane. Therefore, an adjustment is needed to determine the actual number of buses, Np, that would pass other buses using the curb lane. Simulations and field observations(R36) indicate that when buses operate at less than one-half the vehicle capacity of the bus lane, they have little need to pass each other even in a skip-stop operation because of the low arrival headways relative to capacity. Bus use of the adjacent lane increases at an increasing rate as bus activity approaches capacity. Thus, Np may be approximated by the following relationship:
31⎟⎠⎞
⎜⎝⎛−
=Bvv
NNN b
bss
ssp Equation 4-20
where: Np = number of buses making the maneuver from the curb lane to the
adjacent lane. Nss = number of alternating skip-stops in pattern; vb = volume of buses in the bus lane (bus/h); and B = bus capacity of the bus lane (bus/h). As expressed in this equation, the number of buses in the adjacent lane would be
one-half the total bus flow when an alternating two-block skip-stop operation approaches capacity. Two-thirds of the buses would use the adjacent lane for a three-block pattern. However, these impacts would not take full effect until the bus volumes approached capacity.
Appendix C: Bus Effects on Adjacent Lane Vehicle Capacity Page 4-98 Part 4/BUS TRANSIT CAPACITY

Transit Capacity and Quality of Service Manual—2nd Edition
APPENDIX D: PLANNING-LEVEL CAPACITY GRAPHS
This appendix contains graphs providing bus capacities for bus stops and bus lanes for a number of common situations. Because of the number of variables involved, it is not possible to provide a graph for every conceivable situation, and users are cautioned to review the assumptions used to develop each graph to confirm that the graph applies to their situation. The spreadsheets used to develop these graphs are included on the accompanying CD-ROM and allow users to change the assumptions as required for a given situation.
The spreadsheets used to develop Appendix D exhibits are included on the accompanying CD-ROM.
Exhibits 4-65 through 4-67 provide bus stop capacities for both on-line and off-line stops, for various combinations of dwell time, g/C ratios, and curb lane traffic volumes. Graphs are provided for recommended failure rates corresponding to suburban, downtown, and maximum capacity situations. Note that the capacity values shown are for stops with a single loading area. To obtain the capacity of a stop with multiple loading areas, multiply the value from the graph by the appropriate loading area efficiency factor from Exhibit 4-12, which is reproduced below.
The graphs are based on the capacity of a single loading area. Multiply graphed values by the appropriate loading area efficiency factor.
On-Line Loading Areas Off-Line Loading Areas Random Arrivals Platooned Arrivals All Arrivals Cumulative Cumulative Cumulative
Loading Area #
Efficiency %
# of Effective Loading Areas
Efficiency %
# of Effective Loading Areas
Efficiency %
# of Effective Loading Areas
1 100 1.00 100 1.00 100 1.00 2 75 1.75 85 1.85 85 1.85 3 70 2.45 80 2.65 80 2.65 4 20 2.65 25 2.90 65 3.25 5 10 2.75 10 3.00 50 3.75
Copy of Exhibit 4-12 Efficiency of Multiple Linear Loading Areas at Bus Stops(R25,R27,R28)
NOTE: On-line values assume that buses do not overtake each other.
Exhibits 4-68 through 4-72 provide bus lane capacities based on critical bus stop dwell times of 30 and 60 seconds for combinations of Type 1 and Type 2 lanes, near-side and far-side stops, and various right-turning volumes at the critical stop. These exhibits assume a downtown location, with on-line stops, a 10% failure rate, and a g/C ratio of 0.45 (typical for a one-way downtown grid). Exhibits 4-73 and 4-74 provide similar graphs for mixed traffic situations for various combinations of curb lane volumes. As before, multiply the capacity values shown by the appropriate loading area equivalency factor from Exhibit 4-12.
To obtain person capacities, multiply the bus capacity obtained from the graph by an average maximum schedule load per bus (e.g., 60 passengers for a standard 12-meter or 40-foot bus, or 90 to 100 passengers for an articulated bus) and an appropriate peak hour factor (0.60 to 0.95, with 0.75 recommended as a default in the absence of other information).
If the g/C ratio is not known for a particular roadway, a value of 0.45 may be used as a default for the through movement on the major street where no protected left-turn phase (i.e., left-turn arrow) is present, while 0.40 may be used for the through movement on the major street when protected left-turn phasing is used.(R6) For most other situations, the g/C ratio may range from 0.30 to 0.70 for through movements.(R9) A higher ratio (up to 0.60 or 0.70, if protected left turns are not provided) may be applicable where the major street has much greater traffic volumes per lane than the minor street. A lower ratio (e.g., 0.30) may be appropriate for a minor street through movement, or an even lower one if the two streets’ traffic volumes per lane are substantially different. A g/C ratio of 0.10 can be used as a default for a protected left-turn movement.
Default g/C ratios.
Part 4/BUS TRANSIT CAPACITY Page 4-99 Appendix D: Planning-Level Capacity Graphs
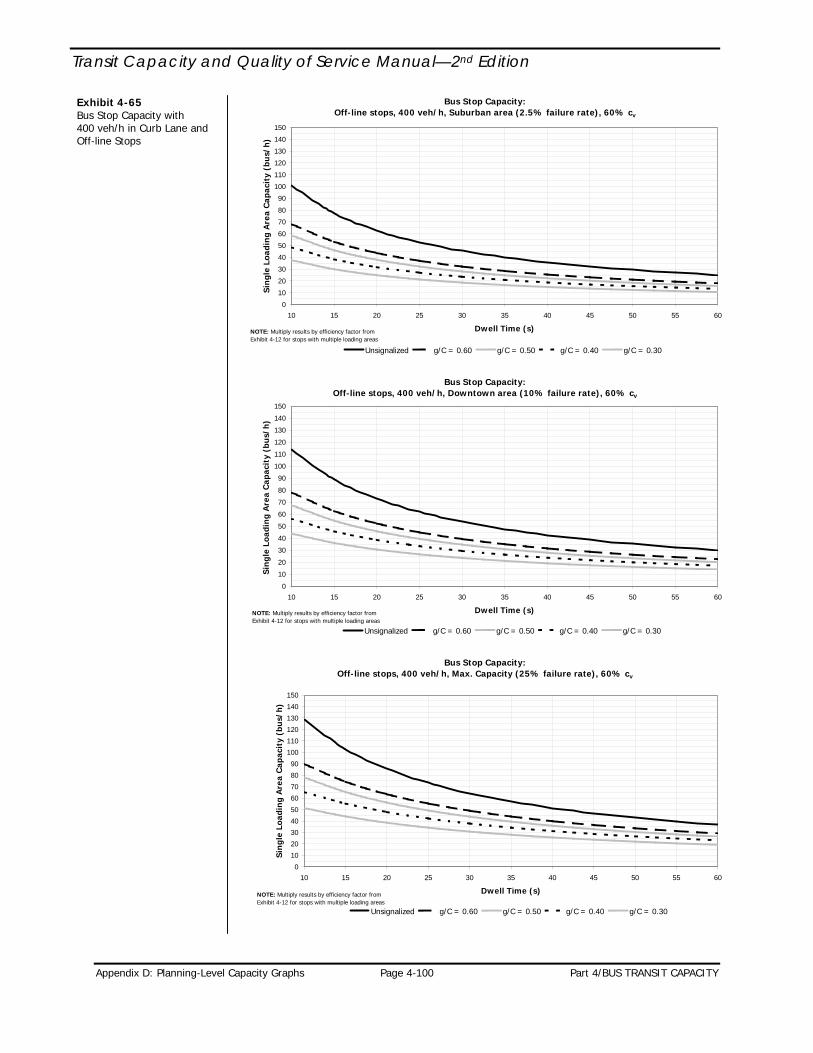
Transit Capacity and Quality of Service Manual—2nd Edition
Exhibit 4-65 Bus Stop Capacity with 400 veh/h in Curb Lane and Off-line Stops
Bus Stop Capacity:Off-line stops, 400 veh/h, Suburban area (2.5% failure rate), 60% cv
0
10
20
30
40
50
60
70
80
90
100
110
120
130
140
150
10 15 20 25 30 35 40 45 50 55 60
Dwell Time (s)
Sin
gle
Load
ing
Are
a C
apac
ity
(bu
s/h
)
Unsignalized g/C = 0.60 g/C = 0.50 g/C = 0.40 g/C = 0.30
NOTE: Multiply results by efficiency factor fromExhibit 4-12 for stops with multiple loading areas
Bus Stop Capacity:Off-line stops, 400 veh/h, Downtown area (10% failure rate), 60% cv
0
10
20
30
40
50
60
70
80
90
100
110
120
130
140
150
10 15 20 25 30 35 40 45 50 55 60
Dwell Time (s)
Sin
gle
Load
ing
Are
a C
apac
ity
(bu
s/h
)
Unsignalized g/C = 0.60 g/C = 0.50 g/C = 0.40 g/C = 0.30
NOTE: Multiply results by efficiency factor fromExhibit 4-12 for stops with multiple loading areas
Bus Stop Capacity:Off-line stops, 400 veh/h, Max. Capacity (25% failure rate), 60% cv
0
10
20
30
40
50
60
70
80
90
100
110
120
130
140
150
10 15 20 25 30 35 40 45 50 55 60
Dwell Time (s)
Sin
gle
Load
ing
Are
a C
apac
ity
(bu
s/h
)
Unsignalized g/C = 0.60 g/C = 0.50 g/C = 0.40 g/C = 0.30
NOTE: Multiply results by efficiency factor fromExhibit 4-12 for stops with multiple loading areas
Appendix D: Planning-Level Capacity Graphs Page 4-100 Part 4/BUS TRANSIT CAPACITY

Transit Capacity and Quality of Service Manual—2nd Edition
Bus Stop Capacity:Off-line stops, 800 veh/h, Suburban area (2.5% failure rate), 60% cv
0
10
20
30
40
50
60
70
80
90
100
110
120
130
140
150
10 15 20 25 30 35 40 45 50 55 60
Dwell Time (s)
Sin
gle
Load
ing
Are
a C
apac
ity
(bu
s/h
)
Unsignalized g/C = 0.60 g/C = 0.50 g/C = 0.40 g/C = 0.30
NOTE: Multiply results by efficiency factor fromExhibit 4-12 for stops with multiple loading areas
Exhibit 4-66 Bus Stop Capacity with 800 veh/h in Curb Lane and Off-line Stops
Bus Stop Capacity:Off-line stops, 800 veh/h, Downtown area (10% failure rate), 60% cv
0
10
20
30
40
50
60
70
80
90
100
110
120
130
140
150
10 15 20 25 30 35 40 45 50 55 60
Dwell Time (s)
Sin
gle
Load
ing
Are
a C
apac
ity
(bu
s/h
)
Unsignalized g/C = 0.60 g/C = 0.50 g/C = 0.40 g/C = 0.30
NOTE: Multiply results by efficiency factor fromExhibit 4-12 for stops with multiple loading areas
Bus Stop Capacity:Off-line stops, 800 veh/h, Max. Capacity (25% failure rate), 60% cv
0
10
20
30
40
50
60
70
80
90
100
110
120
130
140
150
10 15 20 25 30 35 40 45 50 55 60
Dwell Time (s)
Sin
gle
Load
ing
Are
a C
apac
ity
(bu
s/h
)
Unsignalized g/C = 0.60 g/C = 0.50 g/C = 0.40 g/C = 0.30
NOTE: Multiply results by efficiency factor fromExhibit 4-12 for stops with multiple loading areas
Part 4/BUS TRANSIT CAPACITY Page 4-101 Appendix D: Planning-Level Capacity Graphs

Transit Capacity and Quality of Service Manual—2nd Edition
Exhibit 4-67 Bus Stop Capacity with On-Line Stops
Bus Stop Capacity:On-line stops, Suburban area (2.5% failure rate), 60% cv
0
10
20
30
40
50
60
70
80
90
100
110
120
130
140
150
10 15 20 25 30 35 40 45 50 55 60
Dwell Time (s)
Sin
gle
Load
ing
Are
a C
apac
ity
(bu
s/h
)
Unsignalized g/C = 0.60 g/C = 0.50 g/C = 0.40 g/C = 0.30
NOTE: Multiply results by efficiency factor fromExhibit 4-12 for stops with multiple loading areas
Bus Stop Capacity:On-line stops, Downtown area (10% failure rate), 60% cv
0
10
20
30
40
50
60
70
80
90
100
110
120
130
140
150
10 15 20 25 30 35 40 45 50 55 60
Dwell Time (s)
Sin
gle
Load
ing
Are
a C
apac
ity
(bu
s/h
)
Unsignalized g/C = 0.60 g/C = 0.50 g/C = 0.40 g/C = 0.30
NOTE: Multiply results by efficiency factor fromExhibit 4-12 for stops with multiple loading areas
Bus Stop Capacity:On-line stops, Max. Capacity (25% failure rate), 60% cv
0
10
20
30
40
50
60
70
80
90
100
110
120
130
140
150
10 15 20 25 30 35 40 45 50 55 60
Dwell Time (s)
Sin
gle
Load
ing
Are
a C
apac
ity
(bu
s/h
)
Unsignalized g/C = 0.60 g/C = 0.50 g/C = 0.40 g/C = 0.30
NOTE: Multiply results by efficiency factor fromExhibit 4-12 for stops with multiple loading areas
Appendix D: Planning-Level Capacity Graphs Page 4-102 Part 4/BUS TRANSIT CAPACITY

Transit Capacity and Quality of Service Manual—2nd Edition
Exhibit 4-68 Exclusive Lane Bus Capacity: Near-side Stops, Type 1 Lane
Type 1 Exclusive Bus Lane Capacity:On-line, Near-side, 30-s dwell, 60% cv, g/C=0.45, 10% failure
0
10
20
30
40
0 100 200 300 400
Right-Turn Volume (veh/h)
Sin
gle
Load
ing
Are
a C
apac
ity
(bu
s/h
)
0 peds 100 peds 200 peds 400 peds 600 peds 800 peds
NOTE: Multiply results by efficiency factor fromExhibit 4-12 for stops with multiple loading areas
Type 1 Exclusive Bus Lane Capacity:On-line, Near-side, 60-s dwell, 60% cv, g/C=0.45, 10% failure
0
10
20
30
0 100 200 300 400
Right-Turn Volume (veh/h)
Sin
gle
Load
ing
Are
a C
apac
ity
(bu
s/h
)
0 peds 100 peds 200 peds 400 peds 600 peds 800 peds
NOTE: Multiply results by efficiency factor fromExhibit 4-12 for stops with multiple loading areas
Part 4/BUS TRANSIT CAPACITY Page 4-103 Appendix D: Planning-Level Capacity Graphs

Transit Capacity and Quality of Service Manual—2nd Edition
Exhibit 4-69 Exclusive Lane Bus Capacity: Near-side Stops, Type 2 Lane
Type 2 Exclusive Bus Lane Capacity:On-line, Near-side, 30-s dwell, 60% cv, g/C=0.45, 10% failure
0
10
20
30
40
0 100 200 300 400
Right-Turn Volume (veh/h)
Sin
gle
Load
ing
Are
a C
apac
ity
(bu
s/h
)
0 peds 100 peds 200 peds 400 peds 600 peds 800 peds
NOTE: Multiply results by efficiency factor fromExhibit 4-12 for stops with multiple loading areas
Type 2 Exclusive Bus Lane Capacity:On-line, Near-side, 60-s dwell, 60% cv, g/C=0.45, 10% failure
0
10
20
30
0 100 200 300 400
Right-Turn Volume (veh/h)
Sin
gle
Load
ing
Are
a C
apac
ity
(bu
s/h
)
0 peds 100 peds 200 peds 400 peds 600 peds 800 peds
NOTE: Multiply results by efficiency factor fromExhibit 4-12 for stops with multiple loading areas
Appendix D: Planning-Level Capacity Graphs Page 4-104 Part 4/BUS TRANSIT CAPACITY
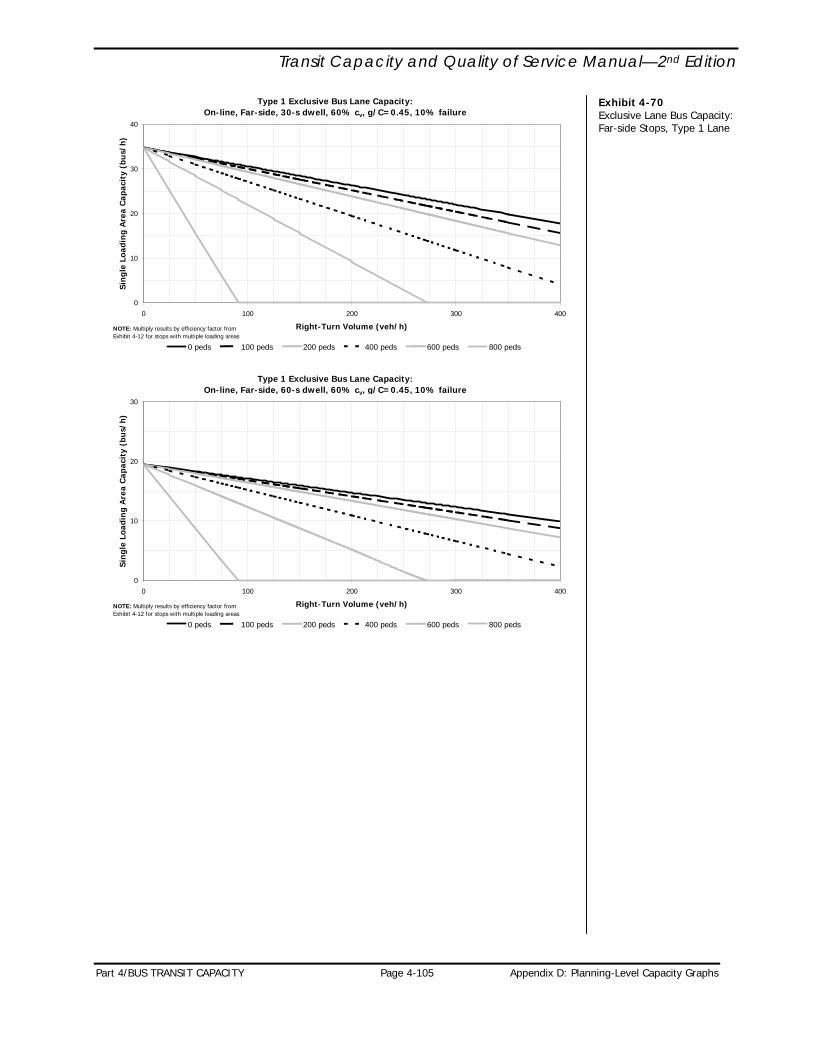
Transit Capacity and Quality of Service Manual—2nd Edition
Exhibit 4-70 Exclusive Lane Bus Capacity: Far-side Stops, Type 1 Lane
Type 1 Exclusive Bus Lane Capacity:On-line, Far-side, 30-s dwell, 60% cv, g/C=0.45, 10% failure
0
10
20
30
40
0 100 200 300 400
Right-Turn Volume (veh/h)
Sin
gle
Load
ing
Are
a C
apac
ity
(bu
s/h
)
0 peds 100 peds 200 peds 400 peds 600 peds 800 peds
NOTE: Multiply results by efficiency factor fromExhibit 4-12 for stops with multiple loading areas
Type 1 Exclusive Bus Lane Capacity:On-line, Far-side, 60-s dwell, 60% cv, g/C=0.45, 10% failure
0
10
20
30
0 100 200 300 400
Right-Turn Volume (veh/h)
Sin
gle
Load
ing
Are
a C
apac
ity
(bu
s/h
)
0 peds 100 peds 200 peds 400 peds 600 peds 800 peds
NOTE: Multiply results by efficiency factor fromExhibit 4-12 for stops with multiple loading areas
Part 4/BUS TRANSIT CAPACITY Page 4-105 Appendix D: Planning-Level Capacity Graphs

Transit Capacity and Quality of Service Manual—2nd Edition
Exhibit 4-71 Exclusive Lane Bus Capacity: Far-side Stops, Type 2 Lane
Type 2 Exclusive Bus Lane Capacity:On-line, Far-side, 30-s dwell, 60% cv, g/C=0.45, 10% failure
0
10
20
30
40
0 100 200 300 400
Right-Turn Volume (veh/h)
Sin
gle
Load
ing
Are
a C
apac
ity
(bu
s/h
)
0 peds 100 peds 200 peds 400 peds 600 peds 800 peds
NOTE: Multiply results by efficiency factor fromExhibit 4-12 for stops with multiple loading areas
Type 2 Exclusive Bus Lane Capacity:On-line, Far-side, 60-s dwell, 60% cv, g/C=0.45, 10% failure
0
10
20
30
0 100 200 300 400
Right-Turn Volume (veh/h)
Sin
gle
Load
ing
Are
a C
apac
ity
(bu
s/h
)
0 peds 100 peds 200 peds 400 peds 600 peds 800 peds
NOTE: Multiply results by efficiency factor fromExhibit 4-12 for stops with multiple loading areas
Appendix D: Planning-Level Capacity Graphs Page 4-106 Part 4/BUS TRANSIT CAPACITY

Transit Capacity and Quality of Service Manual—2nd Edition
Type 3 Exclusive Bus Lane Capacity:On-line, 60% cv, g/C=0.45, 10% failure
0
10
20
30
40
50
60
70
80
10 20 30 40 50 60
Dwell Time (s)
Sin
gle
Load
ing
Are
a C
apac
ity
(bu
s/h
)
NOTE: Multiply results by efficiency factor fromExhibit 4-12 for stops with multiple loading areas
Exhibit 4-72 Exclusive Lane Bus Capacity: Type 3 Lane
Exhibit 4-73 Mixed Traffic Bus Capacity: Type 1 Lane
Type 1 Mixed Traffic Lane Bus Capacity:On-line, Near-side, 30-s dwell, 60% cv, 10% failure
0
10
20
30
40
0 100 200 300 400
Curb Lane Volume (veh/h)
Sin
gle
Load
ing
Are
a C
apac
ity
(bu
s/h
)
g/C = 0.35 g/C = 0.40 g/C = 0.45 g/C = 0.50 g/C = 0.55 g/C = 0.60
NOTE: Multiply results by efficiency factor fromExhibit 4-12 for stops with multiple loading areas
Type 1 Mixed Traffic Lane Bus Capacity:
On-line, Far-side, 30-s dwell, 60% cv, 10% failure
0
10
20
30
40
0 100 200 300 400
Curb Lane Volume (veh/h)
Sin
gle
Load
ing
Are
a C
apac
ity
(bu
s/h
)
g/C = 0.35 g/C = 0.40 g/C = 0.45 g/C = 0.50 g/C = 0.55 g/C = 0.60
NOTE: Multiply results by efficiency factor fromExhibit 4-12 for stops with multiple loading areas
Part 4/BUS TRANSIT CAPACITY Page 4-107 Appendix D: Planning-Level Capacity Graphs

Transit Capacity and Quality of Service Manual—2nd Edition
Exhibit 4-74 Mixed Traffic Bus Capacity: Type 2 Lane
Type 2 Mixed Traffic Lane Bus Capacity:On-line, Near-side, 30-s dwell, 60% cv, 10% failure
0
10
20
30
40
0 100 200 300 400
Curb Lane Volume (veh/h)
Sin
gle
Load
ing
Are
a C
apac
ity
(bu
s/h
)
g/C = 0.35 g/C = 0.40 g/C = 0.45 g/C = 0.50 g/C = 0.55 g/C = 0.60
NOTE: Multiply results by efficiency factor fromExhibit 4-12 for stops with multiple loading areas
Type 2 Mixed Traffic Lane Bus Capacity:
On-line, Far-side, 30-s dwell, 60% cv, 10% failure
0
10
20
30
40
0 100 200 300 400
Curb Lane Volume (veh/h)
Sin
gle
Load
ing
Are
a C
apac
ity
(bu
s/h
)
g/C = 0.35 g/C = 0.40 g/C = 0.45 g/C = 0.50 g/C = 0.55 g/C = 0.60
NOTE: Multiply results by efficiency factor fromExhibit 4-12 for stops with multiple loading areas
Appendix D: Planning-Level Capacity Graphs Page 4-108 Part 4/BUS TRANSIT CAPACITY

Transit Capacity and Quality of Service Manual—2nd Edition
Part 4/BUS TRANSIT CAPACITY Page 4-109 Appendix E: Effects of Bus Bunching on Person Capacity
APPENDIX E: EFFECTS OF BUS BUNCHING ON PERSON CAPACITY
Transit services are typically designed with sufficient buses to ensure that an agency’s maximum schedule load is not exceeded. Agency policies differ on whether this maximum load applies to every bus or to the average load of all buses on a route during a specified time period (e.g., one-half hour), but in any event, no pass-ups should occur.
If passengers arrived evenly throughout the course of an hour, the number of buses per hour required to serve those passengers would be simply the hourly passenger demand divided by the maximum schedule load per bus. More typically, more passengers will arrive for some buses than for others, due to the normal randomness of passengers’ travel from day to day and from predictable surges at certain times (e.g., from a school letting out). If passenger demand requires frequent service and if buses are scheduled as though passengers arrive at an even rate, the result will be that some buses will experience overcrowding. The number of buses per hour required to accommodate typical peak-15-minute loads can be determined by rearranging Equation 4-8 as follows:
)(maxmin PHFP
Pf h=
where: fmin = minimum frequency to accommodate peak-15-minute passenger
demands without overcrowding (bus/h); Ph = hourly passenger volume (p/h); Pmax = maximum schedule load per bus (p/bus); and PHF = peak hour factor. For example, if 600 passengers must be served during the peak hour and if the
maximum schedule load is 60 passengers per bus, 10 buses per hour would be needed if passengers arrived at an even rate (i.e., a peak hour factor of 1.00). If the peak-15-minute passenger demand were 20% higher than the average demand over the peak hour (i.e., a peak hour factor of 0.83), the number of buses required to avoid overcrowding would be 12.
The peak hour factor concept could be extended to address crowding issues on routes experiencing a moderate amount of bunching. If, as a simplified example, buses are scheduled to arrive every 10 minutes, passengers arrive at an even rate, and one bus operates 5 minutes late, that bus will pick up all of its normal passengers at a stop, plus half of the passengers that would normally take the following bus. The late bus will experience overcrowding, carrying more passengers than the schedule assumes, while the following bus will pick up half of its normal load, and some of its offered capacity will go unused.
As an extreme example, imagine that buses are scheduled to arrive every 5 minutes but that actually two arrive in close succession every 10 minutes. The effective frequency of the route in this case is 10 minutes, as that is the average interval between bus arrivals. The effective frequency can be determined from the following:
Predictable surges in demand may be accommodated by adjusting headways or adding an extra bus. Tweaking the schedule is less effective for handling random surges.
Equation 4-21
In practice, the extra passengers would cause dwell times to be longer than normal, the first bus will fall further and further behind schedule, and the following bus will tend to run early.

Transit Capacity and Quality of Service Manual—2nd Edition
)1( vheff c
ff+
= Equation 4-22
where: feff = effective frequency (bus/h); f = scheduled frequency (bus/h); and cvh = coefficient of variation of headways, from Equation 3-7. The coefficient of variation of headways should be calculated using the
population standard deviation; this produces a cvh of 1.0 when two buses always arrive together and a cvh of 0.5 when buses are consistently one-half headway off-headway, as in the previous examples.
The average loading of late buses during the peak 15 minutes can be calculated as shown in Equation 4-23. Dividing the average hourly passenger demand by the peak hour factor gives the average peak 15-minute load; dividing the result by the effective frequency gives the average load per late bus during the peak 15 minutes.
eff
hl fPHF
PP)(
= Equation 4-23
where: Pl = average load per late bus during the peak 15 minutes (p/bus). Research is required to develop procedures to estimate the effects of various
factors (e.g., traffic, transit priority, bus operator experience) on headway adherence. Adding additional buses to address overcrowding may not have an effect on the most crowded buses, if the added buses end up bunched as well. Since the added buses entail added operating costs for an agency, measures to improve reliability could prove to be more cost-effective for relieving overcrowding.
Appendix E: Effects of Bus Bunching on Person Capacity Page 4-110 Part 4/BUS TRANSIT CAPACITY
Related Documents