TCRP Web Document 6 (Project A-15) Contractor’s Final Report Transit Capacity and Quality of Service Manual Prepared for Transit Cooperative Research Program Transportation Research Board National Research Council Submitted by Kittelson & Associates, Inc. In association with Texas Transportation Institute Transport Consulting Limited January 1999

Welcome message from author
This document is posted to help you gain knowledge. Please leave a comment to let me know what you think about it! Share it to your friends and learn new things together.
Transcript

TCRP Web Document 6(Project A-15) Contractor’s Final Report
Transit Capacity and Quality of Service Manual
Prepared forTransit Cooperative Research Program
Transportation Research BoardNational Research Council
Submitted byKittelson & Associates, Inc.
In association withTexas Transportation InstituteTransport Consulting Limited
January 1999
ACKNOWLEDGMENT
This work was sponsored by the FederalTransit Administration (FTA) and was conductedthrough the Transit Cooperative Research Program(TCRP), which is administered by the TransportationResearch Board (TRB) of the National ResearchCouncil.
DISCLAIMER
The opinions and conclusions expressed orimplied in the report are those of the research agency.They are not necessarily those of the TRB, the NationalResearch Council, the FTA, the Transit DevelopmentCorporation, or the U.S. Government.
This report has not been edited by TRB.
Information on this report is available from theTCRP, 2101 Constitution Ave. N.W.,Washington, D.C. 20418Telephone: 202/334-3502 Fax: 202/334-2006

Transit Capacity and Quality of Service Manual
Page i Table of Contents
TABLE OF CONTENTS
Report Organization.........................................................................................................viiiForeword............................................................................................................................ ixAcknowledgments..............................................................................................................xi
PART 1: INTRODUCTION AND CONCEPTS
1. TRANSIT IN NORTH AMERICA ..........................................................................1-1Introduction ................................................................................................................ 1-1The Dominance of Large Systems .............................................................................. 1-2Statistics...................................................................................................................... 1-2Bus Service Types ...................................................................................................... 1-4
Introduction ............................................................................................................ 1-4Segregated Right-of-Way (Busway) ....................................................................... 1-6Exclusive Reserved Lanes (Bus Lanes) .................................................................. 1-7Shared Reserved Lanes (HOV Lanes) .................................................................... 1-8Mixed Traffic.......................................................................................................... 1-9Demand-Responsive ............................................................................................... 1-9Route Deviation .................................................................................................... 1-10Rural and Intercity ................................................................................................ 1-10Observed Bus and Passenger Flows...................................................................... 1-11Bus Priority Treatments ........................................................................................ 1-12
Rail Transit ............................................................................................................... 1-14Introduction .......................................................................................................... 1-14Rail Right-of-Way Types...................................................................................... 1-16Light Rail Transit.................................................................................................. 1-17Heavy Rail Transit ................................................................................................ 1-20Commuter Rail...................................................................................................... 1-23Automated Guideway Transit ............................................................................... 1-26Other Rail ............................................................................................................. 1-28Aerial Tramway .................................................................................................... 1-31Public Elevators .................................................................................................... 1-32
Ferry Services ........................................................................................................... 1-32
2. TRANSIT CAPACITY AND QUALITY OF SERVICE CONCEPTS ...............1-35Introduction .............................................................................................................. 1-35Capacity .................................................................................................................... 1-35
Person Capacity .................................................................................................... 1-35Transit Line Capacity............................................................................................ 1-35Loading Diversity ................................................................................................. 1-37Economic Constraints ........................................................................................... 1-37Agency Policies .................................................................................................... 1-37
Quality of Service ..................................................................................................... 1-38Transit Availability ............................................................................................... 1-38Transit Quality ...................................................................................................... 1-39Quality of Service Framework .............................................................................. 1-39
3. REFERENCES ........................................................................................................1-41
APPENDIX A. RAIL ROUTE CHARACTERISTICS ............................................1-43
Transit Capacity and Quality of Service Manual
Page ii Table of Contents
PART 2: BUS TRANSIT CAPACITY
1. BUS CAPACITY BASICS ....................................................................................... 2-1Overview..................................................................................................................... 2-1
Definitions .............................................................................................................. 2-1Types of Bus Facilities and Service ............................................................................ 2-3Factors Influencing Bus Capacity ............................................................................... 2-5
Vehicle Capacity..................................................................................................... 2-5Person Capacity .................................................................................................... 2-13
Fundamental Capacity Calculations.......................................................................... 2-15Vehicle Capacity................................................................................................... 2-15Person Capacity .................................................................................................... 2-22
Planning Applications ............................................................................................... 2-23
2. OPERATING ISSUES............................................................................................ 2-25Introduction............................................................................................................... 2-25Bus Operations.......................................................................................................... 2-25
Passenger Loads.................................................................................................... 2-25Skip-Stop Operation ............................................................................................. 2-26
Roadway Operations ................................................................................................. 2-28Bus Preferential Treatments at Intersections......................................................... 2-28Bus Preferential Treatments on Roadway Segments............................................. 2-33Person Delay Considerations ................................................................................ 2-37Roadway Operations Summary............................................................................. 2-37
3. BUSWAYS AND FREEWAY HOV LANES........................................................ 2-39Introduction............................................................................................................... 2-39Calculating Vehicle Capacity.................................................................................... 2-40
Freeway HOV Lanes............................................................................................. 2-40Busways ................................................................................................................ 2-40
Calculating Person Capacity ..................................................................................... 2-41Calculating Speed ..................................................................................................... 2-42
4. EXCLUSIVE ARTERIAL STREET BUS LANES.............................................. 2-45Introduction............................................................................................................... 2-45Bus Lane Types ........................................................................................................ 2-45Calculating Vehicle Capacity.................................................................................... 2-47
Effects of Right Turns........................................................................................... 2-47Skip-Stop Adjustment Factor................................................................................ 2-48Vehicle Capacity................................................................................................... 2-50Bus Effects on Passenger Vehicle Capacity in an Adjacent Lane......................... 2-52
Calculating Person Capacity ..................................................................................... 2-53Calculating Speed ..................................................................................................... 2-53
Base Bus Speeds ................................................................................................... 2-54Right Turn Delays................................................................................................. 2-54Skip-Stop Operations ............................................................................................ 2-54Bus-Bus Interference ............................................................................................ 2-57
5. MIXED TRAFFIC.................................................................................................. 2-59Introduction............................................................................................................... 2-59Bus Lane Types ........................................................................................................ 2-59Calculating Vehicle Capacity.................................................................................... 2-60Calculating Person Capacity ..................................................................................... 2-61Calculating Speed ..................................................................................................... 2-62
Transit Capacity and Quality of Service Manual
Page iii Table of Contents
6. DEMAND-RESPONSIVE.......................................................................................2-65Introduction .............................................................................................................. 2-65
Vehicle Types ....................................................................................................... 2-65Operating Scenarios.............................................................................................. 2-66Deviated Fixed-Route Transit............................................................................... 2-66
Calculating Vehicle Capacity.................................................................................... 2-67
7. REFERENCES ........................................................................................................2-69
8. EXAMPLE PROBLEMS........................................................................................2-71
APPENDIX A. DWELL TIME DATA COLLECTION PROCEDURE ................2-89Introduction .............................................................................................................. 2-89Passenger Service Times .......................................................................................... 2-89Dwell Times.............................................................................................................. 2-90
APPENDIX B. EXHIBITS IN U.S. CUSTOMARY UNITS ....................................2-93
PART 3: RAIL TRANSIT CAPACITY
1. RAIL CAPACITY BASICS......................................................................................3-1Introduction ................................................................................................................ 3-1Grouping..................................................................................................................... 3-1The Basics .................................................................................................................. 3-2Design versus Achievable Capacity............................................................................ 3-3
Service Headway .................................................................................................... 3-4Line Capacity.......................................................................................................... 3-5Train Control Throughput....................................................................................... 3-5Commuter Rail Throughput .................................................................................... 3-6Station Dwells......................................................................................................... 3-6
Train/Car Capacity...................................................................................................... 3-7Introduction ............................................................................................................ 3-7Car Capacity ........................................................................................................... 3-7Train Capacity ........................................................................................................ 3-7Station Constraints.................................................................................................. 3-8
2. TRAIN CONTROL AND SIGNALING ..................................................................3-9Introduction ................................................................................................................ 3-9Fixed-Block Systems .................................................................................................. 3-9Cab Signaling............................................................................................................ 3-10Moving-Block Signaling Systems............................................................................. 3-10
Safety Issues ......................................................................................................... 3-11Hybrid Systems......................................................................................................... 3-11Automatic Train Operation ....................................................................................... 3-11Automatic Train Supervision .................................................................................... 3-12Fixed-Block Throughput........................................................................................... 3-12
Station Close-In Time........................................................................................... 3-12Moving-Block Throughput ................................................................................... 3-16
Turn-Back Throughput ............................................................................................. 3-18Junction Throughput ................................................................................................. 3-19Summary................................................................................................................... 3-21

Transit Capacity and Quality of Service Manual
Page iv Table of Contents
3. STATION DWELL TIMES................................................................................... 3-23Introduction............................................................................................................... 3-23
Dwell Time Components ...................................................................................... 3-23Doorway Flow Rates............................................................................................. 3-25Estimating Dwell Times........................................................................................ 3-27
4. PASSENGER LOADING LEVELS ...................................................................... 3-29Introduction............................................................................................................... 3-29Loading Standards .................................................................................................... 3-29Space Requirements.................................................................................................. 3-30
Vehicle Specific Calculations ............................................................................... 3-31Default Method ..................................................................................................... 3-33
Length ....................................................................................................................... 3-33Loading Diversity ..................................................................................................... 3-35
5. OPERATING ISSUES............................................................................................ 3-39Introduction............................................................................................................... 3-39Operating Margins .................................................................................................... 3-39Estimating Margins ................................................................................................... 3-43Skip-Stop Operation ................................................................................................. 3-43Passenger-Actuated Doors ........................................................................................ 3-44Other Station Constraints .......................................................................................... 3-44Wheelchair Accommodations ................................................................................... 3-45
6. GRADE-SEPARATED SYSTEMS CAPACITY ................................................. 3-47Introduction............................................................................................................... 3-47The Weakest Link ..................................................................................................... 3-47Growth and Achievable Capacity ............................................................................. 3-48
Simple Procedure.................................................................................................. 3-48Complete Procedure.............................................................................................. 3-52
7. LIGHT RAIL CAPACITY .................................................................................... 3-63Introduction............................................................................................................... 3-63Selecting the Weakest Link....................................................................................... 3-63
Other Capacity Issues............................................................................................ 3-63Single Track.............................................................................................................. 3-64
Calculating Single-Track Headway Restrictions................................................... 3-64Signaled Sections ...................................................................................................... 3-66On-Street Operation .................................................................................................. 3-66
Determining On-Street Capacity ........................................................................... 3-67Right-of-Way with Grade Crossings ......................................................................... 3-67
Signal Pre-emption................................................................................................ 3-67Grade Crossings and Station Dwell Times............................................................ 3-68
Train Length and Station Limitations ....................................................................... 3-69Street Block Length .............................................................................................. 3-69Station Limitations................................................................................................ 3-69
Wheelchair Accessibility Effects .............................................................................. 3-70Introduction........................................................................................................... 3-70High Platforms...................................................................................................... 3-71Low-Floor Cars..................................................................................................... 3-73
Capacity Determination Summary ............................................................................ 3-74
Transit Capacity and Quality of Service Manual
Page v Table of Contents
8. COMMUTER RAIL CAPACITY..........................................................................3-77Introduction .............................................................................................................. 3-77Train Throughput...................................................................................................... 3-77
Station Constraints................................................................................................ 3-78Station Dwells....................................................................................................... 3-79
Train Capacity .......................................................................................................... 3-80
9. AUTOMATED GUIDEWAY TRANSIT CAPACITY.........................................3-83Introduction .............................................................................................................. 3-83Train Control Separation .......................................................................................... 3-83Passenger Flow Rates and Dwells............................................................................. 3-85Loading Levels ......................................................................................................... 3-85Off-Line Stations ...................................................................................................... 3-86
10. REFERENCES ......................................................................................................3-87
11. EXAMPLE PROBLEMS......................................................................................3-89
APPENDIX A. EXHIBITS IN U.S. CUSTOMARY UNITS ..................................3-101
PART 4: TERMINAL CAPACITY
1. INTRODUCTION .....................................................................................................4-1
2. BUS STOPS................................................................................................................4-3Passenger Waiting Areas ............................................................................................ 4-3
Level of Service Standards ..................................................................................... 4-3Determining Required Passenger Waiting Area ..................................................... 4-3
Impact of Passenger Amenities................................................................................... 4-5
3. RAIL AND BUS STATIONS....................................................................................4-7Outside Transfer Facilities.......................................................................................... 4-7
Bus Berths............................................................................................................... 4-7Park-and-Ride Facilities ....................................................................................... 4-10Kiss-and-Ride Facilities........................................................................................ 4-11
Inside Terminal Elements ......................................................................................... 4-11Pedestrian Capacity Terminology......................................................................... 4-11Pedestrian Level of Service .................................................................................. 4-12Principles of Pedestrian Flow ............................................................................... 4-12Pedestrian System Requirements .......................................................................... 4-12
Walkways ................................................................................................................. 4-13Design Factors ...................................................................................................... 4-13Level of Service Standards ................................................................................... 4-16Evaluation Procedures .......................................................................................... 4-18
Ticket Machines........................................................................................................ 4-18Design Factors ...................................................................................................... 4-18Level of Service Standards ................................................................................... 4-18Evaluation Procedures .......................................................................................... 4-19
Doorways and Fare Gates ......................................................................................... 4-19Design Factors ...................................................................................................... 4-19Level of Service Standards ................................................................................... 4-20

Transit Capacity and Quality of Service Manual
Page vi Table of Contents
Evaluation Procedures .......................................................................................... 4-20Stairways................................................................................................................... 4-21
Design Factors ...................................................................................................... 4-21Level of Service Standards ................................................................................... 4-23Evaluation Procedures .......................................................................................... 4-24
Escalators.................................................................................................................. 4-25Design Factors ...................................................................................................... 4-25Capacity Standards................................................................................................ 4-26Evaluation Procedures .......................................................................................... 4-26
Elevators ................................................................................................................... 4-27Design Factors ...................................................................................................... 4-27Level of Service Standards ................................................................................... 4-28Elevator Capacity.................................................................................................. 4-28
Platforms................................................................................................................... 4-28Design Factors ...................................................................................................... 4-28Level of Service Standards ................................................................................... 4-29Evaluation Procedures .......................................................................................... 4-29
Comprehensive Passenger Processing Analysis........................................................ 4-30Manual Method/Input to Simulation Models ........................................................ 4-31Computer Simulation Models ............................................................................... 4-33Real-Time Passenger Information Systems........................................................... 4-33
4. REFERENCES........................................................................................................ 4-35
5. EXAMPLE PROBLEMS....................................................................................... 4-37
APPENDIX A. EXHIBITS IN U.S. CUSTOMARY UNITS ................................... 4-47
PART 5: QUALITY OF SERVICE
1. INTRODUCTION .................................................................................................... 5-1Overview..................................................................................................................... 5-1
Definitions .............................................................................................................. 5-1Levels of Service..................................................................................................... 5-2
Transit Performance Measures.................................................................................... 5-2
2. QUALITY OF SERVICE FRAMEWORK ............................................................ 5-5Transit Trip Decision-Making Process ....................................................................... 5-5Quality of Service Factors........................................................................................... 5-7
Service Coverage .................................................................................................... 5-7Pedestrian Environment .......................................................................................... 5-7Scheduling .............................................................................................................. 5-7Amenities ................................................................................................................ 5-8Transit Information ................................................................................................. 5-8Transfers ................................................................................................................. 5-8Total Trip Time ...................................................................................................... 5-9Cost ......................................................................................................................... 5-9Safety and Security ................................................................................................. 5-9Passenger Loads...................................................................................................... 5-9Appearance and Comfort ...................................................................................... 5-10
Transit Capacity and Quality of Service Manual
Page vii Table of Contents
Reliability ............................................................................................................. 5-10Customer Satisfaction Surveys ................................................................................. 5-10Transit System Size Considerations.......................................................................... 5-11Framework................................................................................................................ 5-12
Availability ........................................................................................................... 5-12Quality .................................................................................................................. 5-13
3. QUALITY OF SERVICE MEASURES.................................................................5-15Introduction .............................................................................................................. 5-15Measures of Availability........................................................................................... 5-15
Transit Stops ......................................................................................................... 5-15Route Segments .................................................................................................... 5-19System................................................................................................................... 5-20
Measures of Quality.................................................................................................. 5-27Transit Stops ......................................................................................................... 5-27Route Segments .................................................................................................... 5-29System................................................................................................................... 5-31
4. APPLICATIONS .....................................................................................................5-35Introduction .............................................................................................................. 5-35Service Assessment................................................................................................... 5-35Policy and Goal Setting ............................................................................................ 5-37Planning and Design ................................................................................................. 5-37
5. REFERENCES ........................................................................................................5-39
6. EXAMPLE PROBLEMS........................................................................................5-41
PART 6: GLOSSARY
GLOSSARY ...................................................................................................................6-1

Transit Capacity and Quality of Service Manual
Page viii Table of Contents
REPORT ORGANIZATION
This manual treats each Part as a separate document. Therefore, the referencescited in text refer to the Reference List at the end of each part. For example, (R1) in Part 1refers to the references at the end of Part 1 and (R1) in Part 4 refers to those references atthe end of Part 4. In addition, equation numbers, exhibits, and appendixes in text refer tothe specific part they are cited in.

7UDQVLW�&DSDFLW\�DQG�4XDOLW\�RI�6HUYLFH�0DQXDO
Page ix Acknowledgments
FOREWORD
TCRP Web Document 6, Transit Capacity And Quality of Service Manual, FirstEdition
The Transit Capacity and Quality of Service Manual (TCQSM) is intended tobe a fundamental reference document for public transit practitioners and policymakers. The manual contains background, statistics, and graphics providingorientation to the various types of public transportation, and it introduces a newframework for measuring transit availability and quality of service from thepassenger point of view. The manual contains quantitative techniques forcalculating the capacity of bus and rail transit services, terminals, and platforms.Sample problems are included.
The material in this document that is relevant to traffic engineers is alsoincluded in Chapters 12, “Transit Concepts,” and Chapter 27, ”TransitAnalytical Procedures,” of the Highway Capacity Manual 2000, which will beissued by TRB on CD-ROM in the year 2000._________________________________________________________________
Until the publication of TCRP Web Document 6, Transit Capacity and Qualityof Service Manual (TCQSM), First Edition, the transportation profession lacked aconsolidated set of transit-capacity and quality-of-service definitions, principles,practices, and procedures for planning, designing, and operating vehicles andfacilities. This is in contrast to the Highway Capacity Manual (HCM) that definesquality of service and presents fundamental information and computationaltechniques related to quality of service and capacity of highway facilities. TheHCM also provides a focal point and structure for advancing the state ofknowledge. It is anticipated that the TCQSM will provide similar benefits.
The First Edition of the TCQSM is a start toward providing the transportationindustry with a transit companion to the HCM. “Transit capacity” is a multifacetedconcept that deals with the movement of people and vehicles; depends on the sizeof the transit vehicles and how often they operate; and reflects the interactionbetween passenger traffic and vehicle flow. “Quality of service” is an even morecomplex concept that must reflect a transit-user’s perspective and must measurehow a transit route, facility, or system is operating under various demand, supply,and control conditions.
TCRP Project A-15, conducted by a team led by Kittelson & Associates,Inc., was a start toward addressing these issues. The objectives of Project A-15were to (1) define the content of a comprehensive Transit Capacity and Qualityof Service Manual, (2) provide transit input to the Highway Capacity Manual2000, (3) develop a prioritized research agenda for completing the TCQSM, (4)complete those portions of a TCQSM for which information was available andproduce an interim document, and (5) conduct research on one or more high-priority research topics growing out of the research agenda. These objectiveswere accomplished by the project, which produced a first edition TCQSM. Thefirst phase of project A-15 included market research on what potential users
7UDQVLW�&DSDFLW\�DQG�4XDOLW\�RI�6HUYLFH�0DQXDO
Page x Acknowledgments
would like to see in a TCQSM, assembled and edited existing information ontransit capacity, and conducted original research on measuring transit quality ofservice. The TCQSM also introduces an “A” through “F” classificationframework for measuring availability and quality of transit and paratransitservice at the transit stop, on the route segment, and for the system.
The TCRP is initiating a continuation project to conduct research to fill user-identified gaps in the First Edition. The Transportation Research Board hasalso established a Task Force on Trasit Capacity and Quality of Service,A1E53, that will be responsible for the guiding the long term-development andevolution of the manual. The continuation work will be coordinated with theactivities of the Task Force, and a second edition of the TCQSM will bepublished at the conclusion of the continuation. Information on how to submitcomments will be available on the TCRP A-15 website in the fall of 1999.Select “TCRP, All Projects, A-15” from the TCRP website:http://www4.nas.edu/trb/crp.nsf.

Transit Capacity and Quality of Service Manual
Page xi Acknowledgments
ACKNOWLEDGMENTS
This manual was developed as part of the Transit Cooperative Research Program(TCRP) A-15 project. The A-15 project team consisted of Kittelson & Associates, Inc.(prime contractor), assisted by the Texas Transportation Institute and TransportConsulting Limited.
Alan Danaher, P.E., AICP, Principal Engineer, Kittelson & Associates, Inc. was theprincipal investigator and the primary author of Part 4. Co-investigators were TomParkinson, P. Eng., President, Transport Consulting Limited, the primary author of Parts1, 3, and 6; Paul Ryus, P.E., Senior Engineer, Kittelson & Associates, Inc., the primaryauthor of Parts 2 and 5; and Lewis Nowlin, Assistant Research Scientist, TexasTransportation Institute. Wayne Kittelson, P.E., Principal, Kittelson & Associates, Inc.;John Zegeer, P.E., Principal, Kittelson & Associates, Inc.; and Daniel Fambro, Professor,Texas A&M University, provided review.
Material for Part 2 was developed from a number of sources, including Chapter 12(Transit) of the 1985, 1994, and 1997 editions of the Highway Capacity Manual,authored by Herbert S. Levinson. Timothy Lomax and Bill Eisele of the TexasTransportation Institute contributed to Chapter 3 (Busways and Freeway HOV Lanes).Chapter 4 (Exclusive Arterial Street Bus Lanes) is a condensed version of researchdeveloped by Kevin St. Jacques and Herbert S. Levinson and presented in TCRP Report26. Clay Barnett of the Texas Transportation Institute contributed to Chapter 6 (Demand-Responsive). Appendix A was developed by Lewis Nowlin of the Texas TransportationInstitute. The contributions of Peter Haliburton of Kittelson & Associates, Inc. are alsoacknowledged.
Part 3 is a condensed version of TCRP Report 13, Rail Transit Capacity. Thecontributions of Ian Fisher are acknowledged.
Part 6, the Glossary, was compiled from a number of sources. Definitions have beenobtained from numerous sources with acknowledgment and thanks to the manyindividuals and committees involved— in particular, Benita H. Gray, editor of the 1989TRB Urban Public Transportation Glossary from which almost half of the entriesoriginated. The TRB glossary is out of print. Other major sources are: APTA web siteglossary (April 1998); National Transportation Statistics Glossary; Washington StateDOT Glossary; TCRP A-8 Rail Transit Capacity Glossary; and the APTA Glossary ofReliability, Availability, and Maintainability Terminology for Rail Rapid Transit, 1993.The contributions of Ian Fisher in compiling and cross-referencing the glossary areacknowledged.

Transit Capacity and Quality of Service Manual
Page xii Acknowledgments
PHOTO CREDITS
Graham Carey: Exhibit 2-34 (Essen).
Alan Danaher: Exhibits 4-9 (Toronto) and 4-17 (Toronto).
Federal Transit Administration: Exhibit 2-34 (Curitiba).
FHWA/Parsons Brinckerhoff “HOV Interactive 1.0”: Exhibits 1-8, 2-2 (Ottawa), 2-36,2-40 (all but Ottawa), 2-41, 2-45 (Los Angeles), 2-47 (New York), 4-5 (Newark), and4-8.
Ian Fisher: Exhibit 1-12.
Peter Haliburton: Exhibits 1-25 (Miami), 2-47 (Miami), and 4-19 (Miami).
Peter Koonce: Exhibit 1-39 (Seattle), 1-41 (New York), and 1-42 (New York).
Tom Parkinson: Exhibits 1-6 (Vancouver), 1-7, 1-10, 1-11, 1-21 (Calgary and SanFrancisco), 1-25 (New York), 1-30 (Toronto), 1-33 (Newark), 2-5, 2-40 (Ottawa), 2-58,3-19, 3-54 (low-floor), and 3-61.
Lee Rodegerdts: Exhibit 1-21 (Baltimore and Los Angeles) and 1-37 (Johnstown).
Paul Ryus: Exhibits 1-6 (all but Vancouver), 1-9, 1-21 (Denver and Portland), 1-25(Atlanta and Vancouver), 1-30 (San Diego), 1-33 (Miami), 1-36, 1-37 (Switzerland andPrague), 1-39 (Wuppertal), 1-41 (Oregon City), 1-42 (all but New York), 2-2 (Seattle),2-3, 2-4, 2-24, 2-28, 2-30, 2-32, 2-45 (Denver), 2-46, 2-57, 3-54 (all but low-floor), 4-3(all but landscaping), 4-5 (all but Newark), 4-9 (Denver), 4-16, 4-17 (Berkeley), 4-19(Portland), 4-23, 4-25, and 4-26.
Tom Schwab: Exhibit 4-3 (landscaping).
Chris Stanley: Exhibit 1-37 (Ketchikan).

Transit Capacity and Quality of Service Manual
Part 1/INTRODUCTION AND CONCEPTS Page 1-i Contents
PART 1INTRODUCTION AND CONCEPTS
CONTENTS
1. TRANSIT IN NORTH AMERICA ................................ ................................ ..........1-1Introduction ................................ ................................ ................................ ................ 1-1The Dominance of Large Systems................................ ................................ .............. 1-2Statistics................................ ................................ ................................ ...................... 1-2Bus Service Types ................................ ................................ ................................ ...... 1-4
Introduction ................................ ................................ ................................ ............ 1-4Segregated Right-of-Way (Busway)................................ ................................ ....... 1-6Exclusive Reserved Lanes (Bus Lanes) ................................ ................................ .. 1-7Shared Reserved Lanes (HOV Lanes) ................................ ................................ .... 1-8Mixed Traffic................................ ................................ ................................ .......... 1-9Demand-Responsive ................................ ................................ ............................... 1-9Route Deviation ................................ ................................ ................................ .... 1-10Rural and Intercity ................................ ................................ ................................ 1-10Observed Bus and Passenger Flows................................ ................................ ...... 1-11Bus Priority Treatments ................................ ................................ ........................ 1-12
Rail Transit ................................ ................................ ................................ ............... 1-14Introduction ................................ ................................ ................................ .......... 1-14Rail Right-of-Way Types................................ ................................ ...................... 1-16Light Rail Transit................................ ................................ ................................ .. 1-17Heavy Rail Transit ................................ ................................ ................................ 1-20Commuter Rail................................ ................................ ................................ ...... 1-23Automated Guideway Transit ................................ ................................ ............... 1-26Other Rail ................................ ................................ ................................ ............. 1-28Aerial Tramway................................ ................................ ................................ .... 1-31Public Elevators ................................ ................................ ................................ .... 1-32
Ferry Services ................................ ................................ ................................ ........... 1-32
2. TRANSIT CAPACITY AND QUALITY OF SERVICE CONCEPTS...............1-35Introduction ................................ ................................ ................................ .............. 1-35Capacity ................................ ................................ ................................ .................... 1-35
Person Capacity ................................ ................................ ................................ .... 1-35Transit Line Capacity................................ ................................ ............................ 1-35Loading Diversity ................................ ................................ ................................ . 1-37Economic Constraints ................................ ................................ ........................... 1-37Agency Policies ................................ ................................ ................................ .... 1-37
Quality of Service ................................ ................................ ................................ ..... 1-38Transit Availability................................ ................................ ............................... 1-38Transit Quality ................................ ................................ ................................ ...... 1-39Quality of Service Framework................................ ................................ .............. 1-39
3. REFERENCES ................................ ................................ ................................ ........1-41
APPENDIX A. RAIL ROUTE CHARACTERISTICS ................................ ............1-43

Transit Capacity and Quality of Service Manual
Part 1/INTRODUCTION AND CONCEPTS Page 1-ii Contents
LIST OF EXHIBITS
Exhibit 1-1 U.S. Transit Systems by Size Grouping (1997) ................................ ........... 1-3Exhibit 1-2 U.S. Public Transit Systems by Mode (1998) ................................ .............. 1-3Exhibit 1-3 Transit Ridership in the United States by Mode (1996)............................... 1-4Exhibit 1-4 Top 10 U.S. and Top 5 Canadian Bus Systems Based on Annual Ridership
(Including Trolleybus and Contracted Services)................................ ..................... 1-4Exhibit 1-5 Non-Rail Vehicles in Active Transit Service in the U.S. (1996).................. 1-5Exhibit 1-6 Transit Bus Vehicle Types................................ ................................ ........... 1-6Exhibit 1-7 OC Transpo Busway (Ottawa, Ontario) ................................ ....................... 1-7Exhibit 1-8 Lincoln Tunnel Contraflow Bus Lane................................ .......................... 1-8Exhibit 1-9 Denver 16th Street Bus Mall................................ ................................ ......... 1-8Exhibit 1-10 Mixed Traffic Operation (Los Angeles)................................ ..................... 1-9Exhibit 1-11 Demand-Responsive Small Bus................................ ............................... 1-10Exhibit 1-12 Typical Rural Bus Service (Maple Ridge, BC)................................ ........ 1-10Exhibit 1-13 Observed Peak Direction Peak Hour Passenger Volumes on U.S. and
Canadian Bus Transit Routes (1995-97) ................................ ............................... 1-11Exhibit 1-14 Operating Characteristics of Selected North American Busways and
Freeway HOV Facilities (January 1998)................................ ............................... 1-13Exhibit 1-15 North American Rail Ridership by Mode (1995)................................ ..... 1-14Exhibit 1-16 Transit Ridership Summary (millions) (1995) ................................ ......... 1-14Exhibit 1-17 Comparison of Key North American Rail Mode Statistics (1995)........... 1-15Exhibit 1-18 U.S. Rail Transit Annual Unlinked Passenger Trips by Mode (1996) ..... 1-15Exhibit 1-19 U.S. “Other Rail” Annual Unlinked Passenger Trips by Mode (1996) .... 1-15Exhibit 1-20 U.S. Rail Transit Annual Passenger Kilometers (Miles) by Mode (1996)
................................ ................................ ................................ .............................. 1-16Exhibit 1-21 Light Rail Examples................................ ................................ ................. 1-17Exhibit 1-22 U.S. and Canadian Light Rail Transit Systems (1998)............................. 1-18Exhibit 1-23 Observed U.S. and Canadian LRT Passenger Volumes: Peak Hour at the
Peak Point for Selected Lines (1993-96 Data) ................................ ...................... 1-19Exhibit 1-24 Peak Hour and Peak 15-Minute Directional Flows for Selected U.S. and
Canadian Light Rail Transit Trunks (1995) ................................ .......................... 1-19Exhibit 1-25 Heavy Rail Examples................................ ................................ ............... 1-20Exhibit 1-26 U.S. and Canadian Heavy Rail Transit Systems (1998)........................... 1-21Exhibit 1-27 Concentration of Heavy Rail Transit Ridership (1995) ........................... 1-21Exhibit 1-28 MTA-NYCT Subway Tracks in Midtown Manhattan.............................. 1-22Exhibit 1-29 Peak Hour and Peak 15-minute Flows for the Busiest 15 U.S. and Canadian
Heavy Rail Transit Trunk Lines (1995) ................................ ................................ 1-23Exhibit 1-30 Commuter Rail Examples ................................ ................................ ........ 1-23Exhibit 1-31 U.S. and Canadian Commuter Rail Systems (1998)................................ . 1-25Exhibit 1-32 Peak Hour and Peak 15-minute Flows for the Busiest 15 U.S. and Canadian
Commuter Rail Trunk Lines (1995)................................ ................................ ...... 1-26Exhibit 1-33 Automated Guideway Transit Examples................................ .................. 1-27Exhibit 1-34 North American AGT Systems Used For Public Transit (1998).............. 1-27Exhibit 1-35 Daily Ridership for North American Non-Transit AGT Systems (1995). 1-28Exhibit 1-36 Cable Car (San Francisco) ................................ ................................ ....... 1-29Exhibit 1-37 Inclined Plane Examples................................ ................................ .......... 1-30Exhibit 1-38 U.S. and Canadian Inclined Planes (1998)................................ ............... 1-30Exhibit 1-39 Monorail Examples ................................ ................................ .................. 1-31Exhibit 1-40 U.S. Public Transit Monorails (1996) ................................ ...................... 1-31Exhibit 1-41 Aerial Tramway and Public Elevator Examples................................ ....... 1-32Exhibit 1-42 Ferry Service Examples ................................ ................................ ........... 1-33Exhibit 1-43 U.S. and Canadian Public Transit Ferry Systems (1998) ......................... 1-33Exhibit 1-44 Factors That Influence Transit Capacity ................................ ................. 1-36Exhibit 1-45 1995 Light Rail Route Characteristics and Ridership .............................. 1-43Exhibit 1-46 1995 Heavy Rail Route Characteristics and Ridership ............................ 1-44Exhibit 1-47 1995 Commuter Rail Route Characteristics and Ridership...................... 1-45

Transit Capacity and Quality of Service Manual
Part 1/INTRODUCTION AND CONCEPTS Page 1-1 Chapter 1— Transit in North America
1. TRANSIT IN NORTH AMERICA
INTRODUCTION
Transit plays two major roles in North America. The first is to accommodate choiceriders – or those riders who choose to use transit for their trip-making even though theyhave other means of travel, in particular a motor vehicle. Many commuters choose transitover other modes due to an unwillingness to deal with traffic congestion in their motorvehicle during peak periods. Use of transit also provides times for productive reading orwork time on the transit vehicle, as well. Accommodation of choice riders on transit isdominant in the peak periods for work trips. As such, transit increases the number ofpeople that can be carried by urban transportation systems and helps reduce, or at leastconstrain, the growth of the more than 4.36 billion person-hours(R4) lost to urban trafficcongestion annually in the United States. In this role, transit is essential for mobility in thecentral business districts (CBDs) of some major cities, which could not survive without it.Accommodating choice riders is especially noteworthy in those cities where centralbusiness district densities are high and parking is costly and limited in supply.
The other major role of transit is to provide basic mobility for those segments of thepopulation too young, too old, or otherwise unable to drive due to physical, mental orfinancial disadvantages. About 35% of the population in the United States and Canada donot possess a driving license(R4) and must depend on others to transport them, in autos, ontransit, or on other modes— walking, cycling, taxis, etc. This is the principal role for thosetransit services provided specifically for people with disabilities and the dominant role inmany smaller transit systems. Such transit users have been called captive riders.
In the major cities in North America, transit services serve higher numbers of bothchoice and captive riders. The variation in transit modal share among urban areas reflectsdifferences in population, CBD employment, extent of bus and rail transit services, andgeographic characteristics.
Transit trips can be both time and cost competitive to the auto under certain operatingconditions, where exclusive right-of-way operation, or on-street transit lanes or signalpriority can be provided. With the trend towards Transportation System Managementsolutions to urban transport problems, there has been increased the focus on movingpersons and not simply vehicles on transportation systems. This has increased awarenesson the part of local jurisdictions on the benefits transit priority treatments can play inattracting transit ridership and reducing overall traffic congestion. With the higher transitridership levels in larger cities, transit can provide more efficient use of energy andimprove air quality.
Transit service can be provided in several operating configurations. Fixed-routeservice occurs where there is sufficient population and/or employment density to supporthigher transit volumes. Paratransit service occurs where transit trips are served on demandwith regular routing and scheduling of service, typically in lower density areas and toaccommodate elderly or disabled riders. New service concepts combining characteristicsof both fixed-route and paratransit, such as deviated-route service, are being tested toprovide some regularity of service and to improve transit accessibility for all riders.
Other traditional forms of transportation provide an important component of overallpublic transit. Taxis can serve as short feeders to transit and an emergency role forcommuters who must return home outside the hours of commute service. They also serveas an effective alternative, particularly when trips are subsidized, for elderly and disabledpersons. School buses in the United States provided 152 billion passenger-kilometers (94billion passenger-miles) of service in 1993,(R4) over four times the amount provided by alltransit buses. The fleet of 550,000 school, church, and institutional buses in the U.S. isnine times larger than the 61,000 transit bus fleet. In Europe, most large Canadian cities,
Choice riders typicallyaccommodated for work trips,particularly in larger cities.
Transit serves captive riders aswell.
Increased emphasis on movingpersons in addition to vehicles onurban transportation systems.
Different transit serviceconfigurations.
Other forms of publictransportation.
Transit Capacity and Quality of Service Manual
Part 1/INTRODUCTION AND CONCEPTS Page 1-2 Chapter 1— Transit in North America
and a few United States cities, school trips are combined with transit, providingconsiderable savings for the school boards and additional revenues and economies ofscale for the transit agency.
Transit passengers must of necessity be pedestrians at one, or usually, both ends oftheir trips. Thus it is important that land uses surrounding transit stops incorporate goodpedestrian linkages. In recent years there has been an emergence of neo-traditionaldevelopments that provide for higher urban densities, thus promoting transit ridership aswell as improving local pedestrian connections to transit. Streets also must be able to betraversed safely to facilitate pedestrian access to and from transit stops.
THE DOMINANCE OF LARGE SYSTEMS
North American transit systems carry a majority of all peak-hour travelers to thedowntown areas in many of the older major cities, but in other metropolitan areas handlea smaller proportion of CBD trips. Transit systems carry more than two-thirds of all peak-hour travelers to or from the New York, Chicago, and Toronto CBD areas, and more thanone-third of all peak-hour travelers entering or leaving most other CBDs of major NorthAmerican cities. At the very high end, in the densely occupied core of lower Manhattan inNew York City, 84% of morning commuters arrive by public transportation.(R14)
Buses carry 86 percent of all peak-hour person-trips through the Lincoln Tunnel intoNew York City,(R16) about half of all peak-hour travelers on the Long Island and GowanusExpressways in New York City, and for more than a quarter of all passengers on radialfreeways approaching or leaving other large-city CBDs. Buses carry an even higherproportion of peak-hour travelers on many city streets. More than 80 percent of all peak-hour travelers are carried by buses on Hillside Avenue and Madison Avenue in New YorkCity, Market Street in Philadelphia, and Main Street in Dallas. Buses accommodate morethan one-half of all peak-hour person-trips on downtown streets in many other cities.(R11)
Sixty percent of morning peak hour trips into lower Manhattan on Fifth Avenue tookplace by bus in 1992.(R8)
These observations do not necessarily represent maximum possible bus volumes ortotal traffic volumes. They do, however, clearly indicate that while buses account for arelatively small proportion of the vehicles in a traffic stream, they carry a sizable part ofthe total person flow. Rail rapid transit offers higher capacities and its fixed-route naturemakes it more visible and attractive in dense areas. Light rail is gaining broader use inNorth America: Boston, Calgary, Philadelphia, Portland, Sacramento, St. Louis, SanDiego, San Francisco, and Toronto are examples of cities with successful light rail lines.
STATISTICS
The U.S. Federal Transit Administration (FTA) maintains an extensive database ofstatistics covering the larger agencies it funds. In 1995 the National Transit Databaseincluded statistics on 392 bus operators, 367 demand responsive service agencies, and arange of less numerous modes.(R7) However, the database does not include many smallerbus systems that are exempted from its reporting requirements. Thus, the American PublicTransit Association (APTA) reports a much larger total number of bus systems−2,250.(R1)
Statistics on Canadian transit systems are collected by the Canadian Urban TransitAssociation (CUTA) from its member systems. These data indicate that there were 89transit systems in Canada in 1995,(R5) although many of the smaller systems are omitted.1
Most Canadian ridership figures are reported as linked trips, meaning that each transit tripis counted only once even if transfers are required. In contrast, FTA data counts unlinkedtrips, meaning that a passenger is counted every time they step aboard a transit vehicle 1 As an example of under-reporting, in the Province of British Columbia, BC Transit provides conventional
transit service in a total of 26 service areas. However, only the two largest systems, in Vancouver andVictoria, are accounted for in CUTA’s data.
Importance of goodpedestrian connections totransit.
North American transitexperience.
National Transit Database.
Canadian Urban TransitAssociation data.

Transit Capacity and Quality of Service Manual
Part 1/INTRODUCTION AND CONCEPTS Page 1-3 Chapter 1— Transit in North America
even if they are making a continuous trip. As a result, U.S. passenger trip counts overstatethe number of actual person trips by transit between origins and destinations, compared tothe linked trips used in transportation planning models. Canadian systems are also notrequired to report passenger kilometers and so generally do not do so.
The FTA, for the purposes of the National Transit Database, categorizes transitsystems by urbanized area population and by the number of vehicles operated inmaximum service. Population is used below for comparison purposes. Exhibit 1-1illustrates the number of transit systems, transit vehicles, and passenger trips in each ofthe three FTA population categories (under 200,000 population, 200,000 to 1 million, andover 1 million).
Exhibit 1-1U.S. Transit Systems by Size Grouping (1997)(R5,R7)
Population# of
Agencies*# of
Vehicles% of
TotalPassenger
Trips% of
TotalUnder 200,000 460 6,308 8.6% 237,204,800 3.1%200,000 to 1 million 86 11,370 15.4% 685,709,800 8.9%Over 1 million 65 55,970 76.0% 6,778,716,800 88.0%National Total 611 73,648 100.0% 7,701,631,400 100.0%
*Sum of agencies reporting to FTA. Most smaller agencies are not required to report to the FTA;APTA reports the number of U.S. public transit systems in 1998 as 5,973.
As can be seen, a small number of systems carry 88% of the total U.S. transitridership. This group, in turn, is dominated by the New York region, which accounts fornearly 63% of the total U.S. ridership. Taken from a different point of view, however, itcan also be seen that the majority of U.S. transit agencies operate in areas under 200,000population. This fact is reinforced by Exhibit 1-2, which lists the number of U.S. publictransit agencies operating various transit modes. The greatest number of agencies by farare the demand response and fixed route bus modes, both of which are suited for areaswith smaller populations that have no need for high-capacity transit modes, yet stillrequire basic transportation services.
Exhibit 1-2U.S. Public Transit Systems by Mode (1998)(R1)
Mode # of AgenciesAerial tramway 1Automated guideway transit 5Fixed route bus 2,250Cable car 1Commuter rail 16Demand response bus 5,214Ferryboat* 25Heavy rail 14Inclined plane 5Light rail 22Monorail 2Trolleybus 5Vanpool 55TOTAL** 5,973
*Excludes international, rural, rural interstate, island, and urban park ferries.**Total is not sum of all modes since many agencies operate more than one mode.
Exhibit 1-3 summarizes United States transit ridership by transit mode along with theaverage trip length for each mode. Of note are the long average trip lengths for passengersusing the commuter rail and demand responsive modes, and the short trips thatcharacterize electric trolleybus and other rail services.
Concentration of transit ridership.
Modal ridership and trip lengths.

Transit Capacity and Quality of Service Manual
Part 1/INTRODUCTION AND CONCEPTS Page 1-4 Chapter 1— Transit in North America
Exhibit 1-3Transit Ridership in the United States by Mode (1996)(R7)
Annual Unlinked Millions of Avg. Trip LengthMode Pass. Trips (millions) pass-km pass-mi (km) (mi)Bus 4,505.6 27,040 16,802 6.0 3.7Heavy rail 2,156.9 18,556 11,530 8.6 5.3Commuter rail 352.2 13,438 8,350 38.2 23.7Light rail 258.7 1,537 955 5.9 3.7Electric trolleybus 117.2 296 184 2.5 1.6Demand responsive 54.5 629 391 11.5 7.2Ferry 43.4 410 255 9.4 5.9Other rail* 20.6 34 21 1.7 1.0Total 7,509.1 61,940 38,488 8.2 5.1
*Includes automated guideway transit (AGT), cable cars, inclined planes, and monorails.
BUS SERVICE TYPES
Introduction
The bus is the most commonly used form of public transport in North America,accounting for 63 percent of all passenger trips by transit in the U.S., and 55 percent oftransit trips on the five largest Canadian transit systems. There were an estimated 2,250bus systems in the U.S. in 1998.(R1) Exhibit 1-4 provides a list of the most-utilized bussystems in the U.S. and Canada, ranked by 1997 annual ridership. The figures shown areconsolidated for all bus modes operated by each agency and thus include trolleybuses andcontracted services. Note the very high ridership for the San Francisco Municipal Railwayrelative to its fleet size. This can be ascribed to the compactness of the service area and ahigh number of transfers resulting from the grid nature of the route structure.
Exhibit 1-4Top 10 U.S. and Top 5 Canadian Bus Systems Based on Annual Ridership
(Including Trolleybus and Contracted Services)(R1,R7)
Transit Agency
1997 Annual UnlinkedPassenger Trips
(millions)
1996Buses Operated inMaximum Service
UNITED STATES
MTA-New York City Transit 542,624 3,078Los Angeles County MTA 337,870 1,794Chicago Transit Authority 288,217 1,589MUNI (San Francisco) 169,919* 636*SEPTA (Philadelphia) 147,725 1,141New Jersey Transit 142,547 1,734WMATA (Washington, DC) 139,929 1,178MBTA (Boston) 102,922 880MTA of Harris County (Houston) 88,144 994MARTA (Atlanta) 78,169 564
CANADAToronto Transit Commission 354,742 NAMUCTC (Montréal) 346,560 NABC Transit (Vancouver) 176,034 NAOttawa-Carleton RTC 98,660 NACalgary Transit 57,077 NA
*1995 data. NA: not available
Top ten U.S. and top fiveCanadian bus systems.

Transit Capacity and Quality of Service Manual
Part 1/INTRODUCTION AND CONCEPTS Page 1-5 Chapter 1— Transit in North America
Bus services fall into three major operating categories. Local services provide serviceto all stops along a route and consequently provide relatively slow service and are best forshort-distance trips. Limited-stop services are frequently overlaid over a local route orroutes and provide a higher speed service by stopping only at major destinations, such askey transfer points and major activity centers. Express services tend to be used for longerdistance trips and provide local service near the end points of the route, with theintervening distance covered without passenger stops. Local passengers are oftenprohibited from riding the local portions of express services in core areas of the citywhere other local services are available.
Bus services can be operated on a variety of types of roadway, ranging from streetswith mixed traffic to exclusive bus-only highways known as busways. Greater degrees ofseparation from other traffic provide transit vehicles and their riders with faster, morepredictable journeys as the interference with other road users is reduced or eliminated.Providing special lanes or roads for buses also serves a marketing function as it indicatesan institutional preference given to buses over the private automobile. Bus operation ondedicated right-of-way, however, is not very common relative to mixed traffic operation.In the U.S. in 1995, there were about 830 km (515 mi) of roadway lanes with full-timeoccupancy restrictions favoring buses. Another 930 km (575 mi) of lanes offeredpreferential access for buses during at least part of the day. In contrast, about 250,000 km(150,000 mi) of roadway used by buses are shared with mixed traffic.(R1)
Bus services can be provided by a number of vehicle types ranging from minibuses toarticulated and double-deck buses. The composition of the U.S. transit bus fleet is shownin Exhibit 1-5.
Exhibit 1-5Non-Rail Vehicles in Active Transit Service in the U.S. (1996)(R7)
Vehicle Type Bus Demand ResponsiveClass A Bus (>35 seats) 47,803 95Class B Bus (25-35 seats) 4,317 117Class C Bus (<25 seats) 2,020 4,238Articulated Bus 1,648 4Trolleybus 897 0School Bus 3 129Van 552 8,109Automobile 6 5,633TOTAL 57,246 18,325
NOTE: Class A, B, and C bus totals do not include the specialized bus types listed separately.
Standard 12-meter (40-foot) buses with over 35 seats are by far the dominant form ofbus operated by United States transit systems and comprise over 80 percent of thenational transit bus fleet. Articulated buses of 18 meters (60 feet) in length have beenembraced by a smaller number of transit agencies, but their use is growing as agenciesseek to improve capacity and comfort with relatively low increases in operating costs.Double-deck buses have been employed for trial applications but have not foundwidespread transit use in either the United States or Canada.
The requirements of the Americans with Disabilities Act, and parallel policies inCanada, have resulted in most new transit vehicles being designed to accommodatepassengers in wheelchairs and scooters, and those who have difficulty with stairs. In1996, 67.6% of the U.S. transit bus fleet was accessible to wheelchairs. While providingwheelchair lifts has been the most common means to meeting these obligations, a recenttrend is the move towards low-floor buses which allow easier boarding for all passengersby eliminating the need for steps and wheelchair lifts. Separate transit systems— often runby volunteers— have been developed to meet the transportation needs of the elderly andpersons with disabilities in areas where no regular transit service is available.
Local, limited-stop, and expressbus service.
Bus use of roadways.
Transit Capacity and Quality of Service Manual
Part 1/INTRODUCTION AND CONCEPTS Page 1-6 Chapter 1— Transit in North America
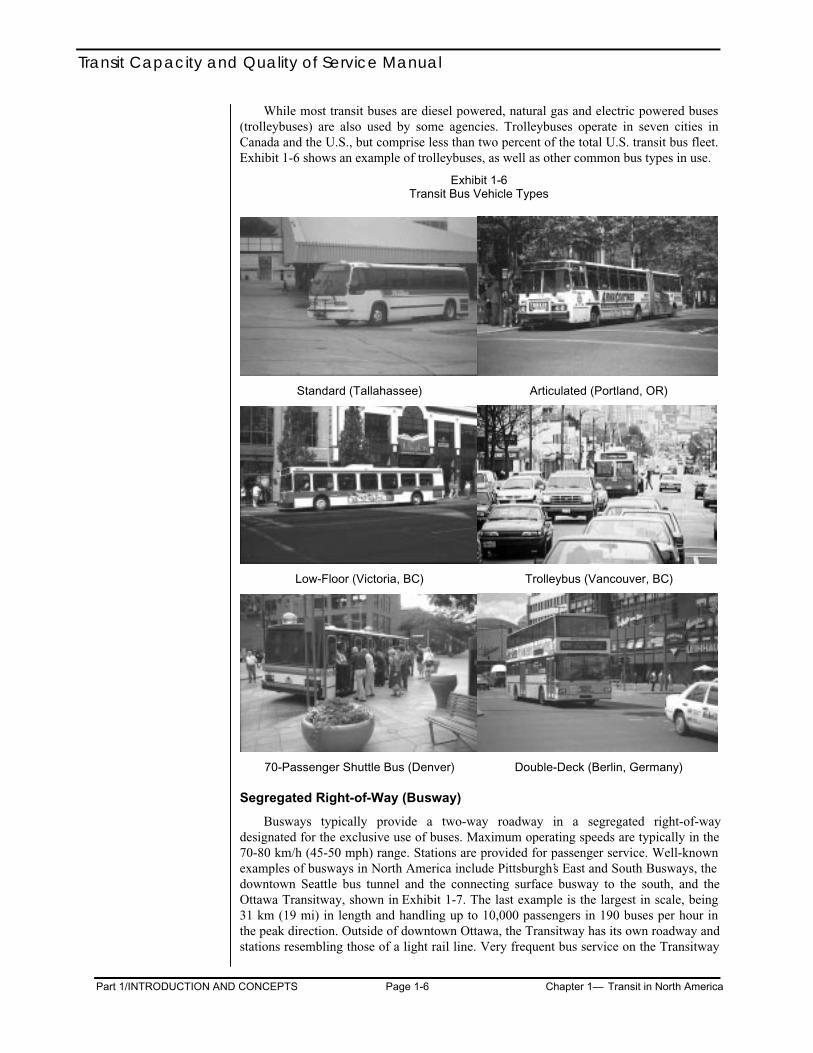
While most transit buses are diesel powered, natural gas and electric powered buses(trolleybuses) are also used by some agencies. Trolleybuses operate in seven cities inCanada and the U.S., but comprise less than two percent of the total U.S. transit bus fleet.Exhibit 1-6 shows an example of trolleybuses, as well as other common bus types in use.
Exhibit 1-6Transit Bus Vehicle Types
Standard (Tallahassee) Articulated (Portland, OR)
Low-Floor (Victoria, BC) Trolleybus (Vancouver, BC)
70-Passenger Shuttle Bus (Denver) Double-Deck (Berlin, Germany)
Segregated Right-of-Way (Busway)
Busways typically provide a two-way roadway in a segregated right-of-waydesignated for the exclusive use of buses. Maximum operating speeds are typically in the70-80 km/h (45-50 mph) range. Stations are provided for passenger service. Well-knownexamples of busways in North America include Pittsburgh’s East and South Busways, thedowntown Seattle bus tunnel and the connecting surface busway to the south, and theOttawa Transitway, shown in Exhibit 1-7. The last example is the largest in scale, being31 km (19 mi) in length and handling up to 10,000 passengers in 190 buses per hour inthe peak direction. Outside of downtown Ottawa, the Transitway has its own roadway andstations resembling those of a light rail line. Very frequent bus service on the Transitway

Transit Capacity and Quality of Service Manual
Part 1/INTRODUCTION AND CONCEPTS Page 1-7 Chapter 1— Transit in North America
is accommodated by dividing the bus routes between a number of stops at each station.While most of the Transitway is fully segregated from other traffic, the downtownsegment consists of reserved lanes on a one-way couplet. This section tends to be slowand congested. Plans for a tunnel through downtown have been canceled due to cost.
Exhibit 1-7OC Transpo Busway (Ottawa, Ontario)
Metro-Dade Transit in Miami opened a 13.2-km (8.2-mi) busway in early 1997. Thebusway has its own right-of-way; however, as signalized intersections are used where thebusway intersects major streets, this facility is treated as an exclusive arterial street buslane for capacity analysis purposes.
Guided busways represent another form of segregated right-of-way. A combinationof curbs on the side of the guideway and an extra set of wheels on the bus that roll againstthese curbs provide lateral guidance for buses and require less right-of-way. As of 1998,no facilities of this type existed in North America, although one was under considerationin Eugene, Oregon. International applications exist in Australia, England, and Germany.
Exclusive Reserved Lanes (Bus Lanes)
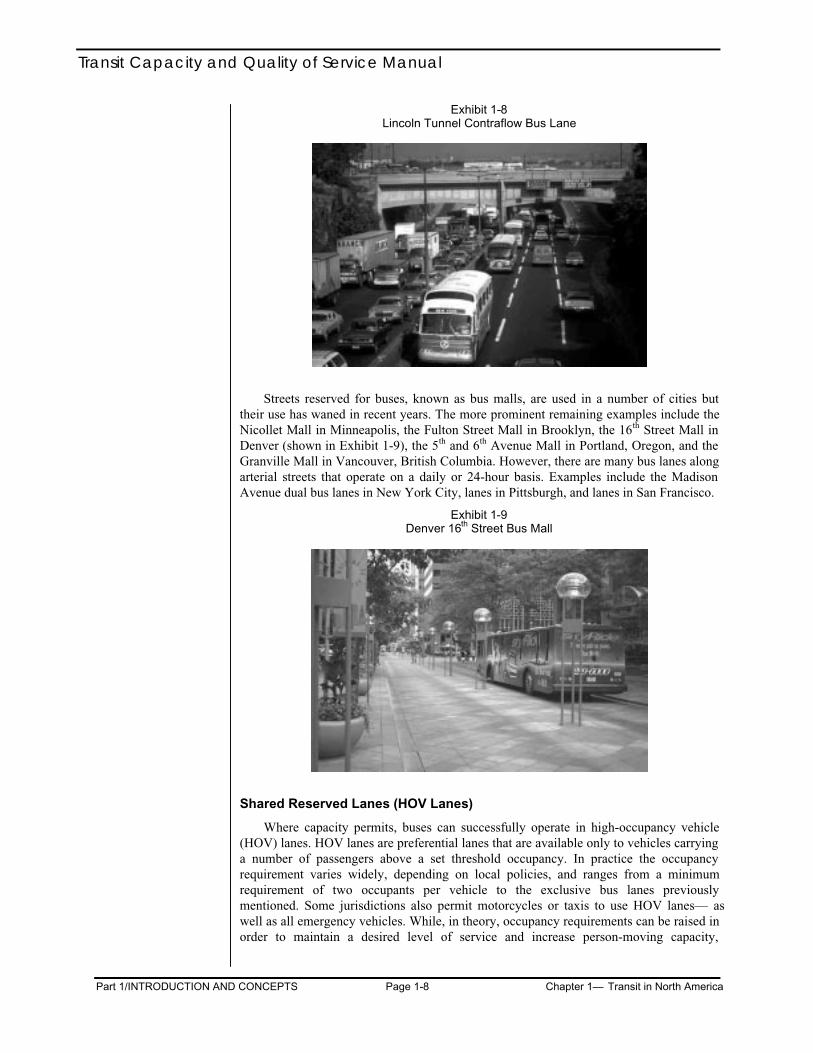
Roadway lanes— either on arterial streets or freeways— reserved for the exclusive useof buses are a form of high-occupancy vehicle (HOV) lane distinguished by a highlyrestrictive occupancy policy. Exclusive lanes can be provided in the same direction asgeneral traffic (concurrent flow) or in the opposite direction as a contraflow lane. Bothtypes are used in North America. A well-known contraflow facility is the Lincoln Tunnelbus lane from New Jersey to Manhattan in New York City (Exhibit 1-8). In many casesbus lanes are in effect during peak periods only and are available to general traffic atother times of the day. Short reserved lane segments, known as queue bypasses or queuejumpers, are commonly used to allow buses, and sometimes other HOVs, to bypasscongestion points such as congested intersections and metered freeway ramps. In 1990there were over 950 HOV ramp bypasses in North America.(R8)
Transit Capacity and Quality of Service Manual
Part 1/INTRODUCTION AND CONCEPTS Page 1-8 Chapter 1— Transit in North America
Exhibit 1-8Lincoln Tunnel Contraflow Bus Lane
Streets reserved for buses, known as bus malls, are used in a number of cities buttheir use has waned in recent years. The more prominent remaining examples include theNicollet Mall in Minneapolis, the Fulton Street Mall in Brooklyn, the 16th Street Mall inDenver (shown in Exhibit 1-9), the 5th and 6th Avenue Mall in Portland, Oregon, and theGranville Mall in Vancouver, British Columbia. However, there are many bus lanes alongarterial streets that operate on a daily or 24-hour basis. Examples include the MadisonAvenue dual bus lanes in New York City, lanes in Pittsburgh, and lanes in San Francisco.
Exhibit 1-9Denver 16th Street Bus Mall
Shared Reserved Lanes (HOV Lanes)
Where capacity permits, buses can successfully operate in high-occupancy vehicle(HOV) lanes. HOV lanes are preferential lanes that are available only to vehicles carryinga number of passengers above a set threshold occupancy. In practice the occupancyrequirement varies widely, depending on local policies, and ranges from a minimumrequirement of two occupants per vehicle to the exclusive bus lanes previouslymentioned. Some jurisdictions also permit motorcycles or taxis to use HOV lanes— aswell as all emergency vehicles. While, in theory, occupancy requirements can be raised inorder to maintain a desired level of service and increase person-moving capacity,

Transit Capacity and Quality of Service Manual
Part 1/INTRODUCTION AND CONCEPTS Page 1-9 Chapter 1— Transit in North America
reductions in occupancy requirements have been much more common in order to reducethe negative public perception caused by “empty-lane syndrome.”(R8)
Mixed Traffic
Mixed traffic bus operation (Exhibit 1-10) accounts for over 99 percent of total busroute distance in North America. While operating buses in general traffic lanes isstraightforward for planning and political purposes, it does result in buses being subject todelays caused by traffic. Mixed traffic operation complicates capacity calculations forboth bus and automobile flow since it exposes buses to automobile traffic congestion andslows automobiles as buses stop and start to serve passengers.
Exhibit 1-10Mixed Traffic Operation (Los Angeles)
Demand-Responsive
Demand-responsive transit service is typically operated by vehicles seating fewerthan 25 passengers, such as the one shown in Exhibit 1-11, that are dispatched in responseto passenger request. In general, operation is not according to a fixed route or schedule.Vehicles are normally dispatched to pick up a number of passengers at various locationsand take them to their respective destinations, possibly picking up additional passengersalong the way. Demand-responsive service is most commonly employed to serve thetravel needs of persons who, through physical inability, are not able to use theconventional transit system. The operation of complementary demand-responsivesystems, which supplement fixed route accessible bus services, is mandated by theAmericans with Disabilities Act. This type of service is also often used in low-densitysuburban and rural areas where there is insufficient demand to justify the operation ofconventional transit service. Demand-responsive service is highly vehicle intensive. Anaverage demand-responsive vehicle operating in the U.S. in 1995 provided 4,125passenger trips per year. By comparison, buses and trolleybuses together carried 106,620passenger trips per vehicle in 1995 in the U.S.

Transit Capacity and Quality of Service Manual
Part 1/INTRODUCTION AND CONCEPTS Page 1-10 Chapter 1— Transit in North America
Exhibit 1-11Demand-Responsive Small Bus
Route Deviation
A variant of demand responsive service, route deviation service can use a wide rangeof equipment from full-sized buses to small vans. The service operates on fixed routeswith rules that permit deviation on demand— usually limited to deviation within aboutfour blocks and no more than two deviations per trip. Deviations are usually expected notto add more than five minutes to the scheduled one-way trip time and may be limited tosections of the route and/or to specific times of day or certain days of the week.
Rural and Intercity
Transit services outside urban areas are often provided by private bus services(Exhibit 1-12). However, in some areas of the U.S., public transit agencies provideservice in rural areas and between regional population centers. Such is the case in NewJersey where the state transit operator (New Jersey Transit) provides service throughoutthe state. Heavy-duty highway-type coaches or minibuses are often used for such services,depending on demand, rather than regular transit buses. Service to outlying areas is ofteninfrequent and is designed to accommodate persons traveling for medical, shopping andother personal business needs rather than commuting. It is not uncommon for rural busservice to operate fewer than five days a week with schedules designed to allow for asame-day return trip on those days that service is provided.
Exhibit 1-12Typical Rural Bus Service (Maple Ridge, BC)
Rural services are oftencontracted or privately run.

Transit Capacity and Quality of Service Manual
Part 1/INTRODUCTION AND CONCEPTS Page 1-11 Chapter 1— Transit in North America
Observed Bus and Passenger Flows
Streets and Highways
Observed bus volumes on urban freeways, city streets, and bus-only streets clearlyshow the reductive effects of bus stops on bus vehicle capacity. The highest bus volumesexperienced in a transit corridor in North America, 735 buses per hour through theLincoln Tunnel and on the Port Authority Midtown Bus Terminal access ramps, in theNew York metropolitan area, are achieved on exclusive rights-of-way where buses makeno stops (and where an 210-berth bus terminal is provided to receive these and otherbuses).(R13) Where bus stops or layovers are involved, reported bus volumes are muchlower. Exhibit 1-13 shows bus flow experience for a number of North American cities.
Exhibit 1-13Observed Peak Direction Peak Hour Passenger Volumes on U.S. and Canadian Bus
Transit Routes (1995-97)(R6,R13,R17)
Location FacilityPeak Hour PeakDirection Buses
Peak Hour PeakDirection
Passengers
AveragePassengers
per BusNew Jersey Lincoln Tunnel 735* 32,600 44Ottawa West Transitway 225 11,100 49New York City Madison Avenue 180 10,000 55Portland, OR 6th Avenue 175 8,500 50New York City Long Island Expy. 165 7,840 48New York City Gowanus Expy. 150 7,500 35Newark Broad Street 150 6,000 40Pittsburgh East Busway 105 5,400 51Northern Virginia Shirley Highway 160 5,000 35San Francisco Bay Bridge 135 5,000 37Denver I-25 85 2,775 33Denver Broadway/Lincoln 89 2,325 26Boston South/High Streets 50 2,000 40Vancouver, BC Granville Mall 70 1,800 26Vancouver, BC Highway 99 29 1,450 50*no stops
When intermediate stops are made, bus volumes rarely exceed 120 buses per hour.However, volumes of 180 to 200 buses per hour are feasible where buses may use two ormore lanes to allow bus passing, especially where stops are short. An example is HillsideAvenue in New York City. Two parallel bus lanes in the same direction, such as alongMadison Avenue in New York, and the 5th and 6th Avenue Transit Mall in Portland,Oregon, also achieve this flow rate. Up to 45 buses one-way in a single lane in 15 minutes(a flow rate of 180 buses per hour) were observed on Chicago’s former State Street Mall;however, this flow rate was achieved by advance marshaling of buses into 3-bus platoonsand by auxiliary rear-door fare collection during the evening peak hours to expeditepassenger loading.
Several downtown streets carry bus volumes of 80 to 100 buses per hour, where thereare two or three boarding positions per stop, and where passenger boarding is notconcentrated at a single stop. (This frequency corresponds to about 5,000 to 7,500passengers per hour, depending on passenger loads.)
These bus volumes provide initial capacity ranges that are suitable for generalplanning purposes. They compare with maximum streetcar volumes on city streets in the1920s which approached 150 cars per track per hour, under conditions of extensivequeuing and platoon loading at heavy stops.(R3) However, the streetcars had two operatorsand large rear platforms where boarding passengers could assemble.
Exclusive busways.
Bus malls.
Historic streetcar volumes.
Transit Capacity and Quality of Service Manual
Part 1/INTRODUCTION AND CONCEPTS Page 1-12 Chapter 1— Transit in North America
Terminals
Peak-hour bus flows observed at 13 major bus terminals in the United States andCanada range from 2.5 buses per berth at the George Washington Bridge Terminal inNew York to 19 buses per berth at the Eglinton Station, Toronto.(R9)
The high berth productivity in Toronto reflects the special design of the terminal(with multiple positions in each berthing area); the wide doors on the buses using theterminal, and the free transfer between bus and subway, which allows use of all doors, andseparate boarding and alighting areas. The relatively low productivity at the New Yorkterminals reflects the substantial number of intercity buses that use the terminals (whichoccupy berths for longer periods of time) and the single-entrance doors provided on manysuburban buses.
This experience suggests an average of 8-10 buses per berth per hour for commuteroperations. Intercity berths typically can accommodate 1-2 buses per hour.
Bus Priority Treatments
Much attention has been paid to expediting transit flow by providing various forms ofpriority treatment. Such treatments are aimed at improving schedule adherence andreducing travel times and delays for transit users. They may attract new riders, increasetransit capacity, and/or improve the transit quality of service.
A growing number of cities have established exclusive bus lanes and other buspriority measures to improve person-flow over city streets and highways. Bus prioritymeasures are an essential part of transportation system management (TSM) programs thatattempt to maximize transport system efficiency consistent with social, economic, andenvironmental objectives.
Because buses may stop within priority lanes to pick up and discharge passengers,the ability of these lanes to carry people will be affected by loading and unloading timerequirements set forth earlier. Guidelines presented in Part 2 can be used to estimatecapacities. The following sections summarize the pertinent operational features, planningconsiderations, and guidelines for specific freeway and arterial treatments.
Operational Overview
Exhibit 1-14 presents operational characteristics of significant busway and freewayHOV lanes. A complete listing of these treatments can be found in the TRB HOV SystemsManual.(R19)
Effective distribution of buses in CBD areas remains an important challenge, andcommunities are giving this issue increased attention. Freeway-related treatmentsgenerally provide good access to the CBD perimeter, but do not substantially improveservice within the downtown core. Terminals are not always located near majoremployment concentrations and may require secondary distribution. Because curb buslanes are not always effective, there have been several efforts to install contraflow buslanes in downtown areas. Signal pre-emption for buses is another measure effectivelyused to minimize bus delay and increase level of service. As a capital-intensive solution toCBD bus distribution, a 2.1-km (1.3-mi), five-station bus tunnel opened in downtownSeattle in 1991. Bus routes using the tunnel are operated with a special fleet of dual-modebuses which run on electric power in the tunnel and diesel power on the surface portionsof their routes. Both ends of the tunnel connect to freeway ramps.
Many bus priority measures have produced important passenger benefits, especiallythose relating to freeways. Some have achieved time savings of 5 to 30 minutes— savingsthat compare favorably with those resulting from rail transit extensions or new systems.The contraflow bus lane leading to the Lincoln Tunnel in New Jersey, for example,provides a 20-minute time saving for bus passengers.
Buses occupy loading areasat bus terminals for muchlonger periods of time thanthey occupy loading areas aton-street bus stops.

Transit Capacity and Quality of Service Manual
Part 1/INTRODUCTION AND CONCEPTS Page 1-13 Chapter 1— Transit in North America
Exhibit 1-14Operating Characteristics of Selected North American Busways and Freeway HOV
Facilities (January 1998) (R19)
Facility # of LanesLength inkm (mi) HOV hours1 Eligibility
BUSWAYSOttawa, Ontario (5 busways)
Southeast Transitway 1 each dir. 10 (6.2) 24 hours Buses onlyWest Transitway 1 each dir. 8.5 (5.3) 24 hours Buses onlySouthwest Transitway 1 each dir. 3.6 (2.2) 24 hours Buses onlyEast Transitway 1 each dir. 6.6 (4.1) 24 hours Buses onlyCentral Transitway 1 each dir. 3.5 (2.2) 24 hours Buses only
Pittsburgh, PA (2 busways)East Patway 1 each dir. 9.9 (6.2) 24 hours Buses onlyWest Patway 1 each dir. 6.6 (4.1) 24 hours Buses only
Seattle, WA (Bus Tunnel) 1 each dir. 2.1 (1.3) 24 hours2 Buses onlyMinneapolis, MN (Univ. of Minnesota) 1 each dir. 1.8 (1.1) 24 hours Buses onlyDallas, TX (SW Texas Medical Center) 1 each dir. 1.0 (0.6) 24 hours Buses only
BARRIER-SEPARATED TWO-WAY HOV LANESLos Angeles, CA (I-10 El Monte) 1 each dir. 6.4 (4.0) 24 hours 3+ HOVsSeattle, WA (I-90) 1 each dir. 2.5 (1.6) 24 hours 2+ HOVs
BARRIER-SEPARATED REVERSIBLE FLOW HOV LANESNorthern Virginia (I-95/I-395 Shirley Hwy) 2 24 (15) 24 hours 3+ HOVsHouston, TX
I-10 (Katy Freeway) 1 21 (13) 5-12, 2-93 3+ HOVsI-45 (Gulf Freeway) 1 21 (13) 5-12, 2-9 2+ HOVsUS 290 (Northwest Freeway) 1 21.6 (13.4) 5-12, 2-9 2+ HOVsI-45 (North Freeway) 1 21.6 (13.4) 5-12, 2-9 2+ HOVsUS 59 (Southwest Freeway) 1 20 (12) 5-12, 2-9 2+ HOVs
CONCURRENT-FLOW HOV LANESMiami, FL (I-95) 1 each dir. 52 (32) 7-9 am SB,
4-6 pm NB2+ HOVs
Atlanta, GA (I-75) 1 each dir. 19.3 (12.0) 24 hours 2+ HOVsHonolulu, HI (H-2) 1 each dir. 13.1 (8.1) 6-8, 3:30-6 2+ HOVsMontgomery County, MD
I-270 1 each dir. 25.8 (16.0) peak periods 2+ HOVsUS 29 (shoulders) 1 each dir. 4.8 (3.0) peak periods Buses only
Ottawa, OntarioHwy. 417 Kenta 1 EB only 4.8 (3.0) 7-9 am Buses onlyHwy. 17 Orleans 1 WB only 4.8 (3.0) 7-9 am Buses only
CONTRAFLOW HOV LANESNew Jersey, Hwy. 495 (to Lincoln Tunnel) 1 EB only 4 (2.5) 6-10 am Buses onlyDallas, TX 1 each pk. dir. 8.3 (5.2) 6-9, 4-7 2+ HOVsBoston, MA 1 each pk. dir. 9.6 (6.0) 6-10, 3-7 3+ HOVsMontreal, Quebec 1 6.9 (4.3) 6:30-9:30 NB,
3:30-7 SBBuses only
HOV QUEUE BYPASSESOakland, CA (Bay Bridge Toll Plaza) 3 1.4 (0.9) 5-10, 3-7 3+ HOVsSan Diego, CA (“A” Street ramp to I-5) 1 0.6 (0.4) 24 hours Buses onlyLos Angeles, CA (250 freeway ramps) 1 0.2 (0.1) when demand
warrants2+ HOVs
Chicago, IL (I-90 toll plaza) 1 EB only 0.8 (0.5) peak periods Buses onlyNB: northbound, SB: southbound, EB: eastbound, WB: westbound1Part-time periods are weekdays only unless otherwise noted.2Buses operate through tunnel 5 am-11 pm weekdays, 10 am-6 pm Saturdays; closed other times.3Also 5 am-5 pm westbound Saturdays, 5 am-9 pm Sundays.
Successful priority treatments are usually characterized by one or more of thefollowing: (a) an intensively developed downtown area with limited street capacity andhigh all-day parking costs, (b) a long-term reliance on public transport, (c) highwaycapacity limitations on approaches to downtown, (d) major water barriers that limit roadaccess to the CBD and channel bus flows, (e) fast nonstop bus runs for considerabledistances, (f) bus priorities on approaches to or across water barriers, (g) special busdistribution within the CBD (often off-street terminals), and (h) active traffic
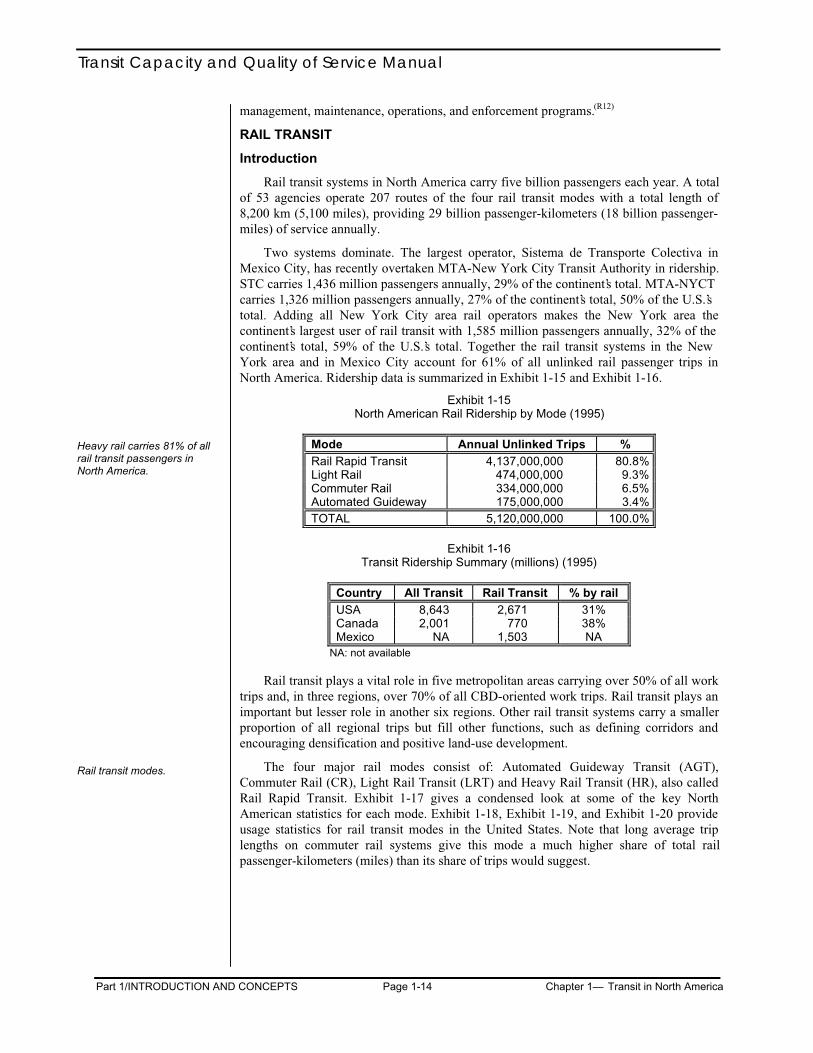
Transit Capacity and Quality of Service Manual
Part 1/INTRODUCTION AND CONCEPTS Page 1-14 Chapter 1— Transit in North America
management, maintenance, operations, and enforcement programs.(R12)
RAIL TRANSIT
Introduction
Rail transit systems in North America carry five billion passengers each year. A totalof 53 agencies operate 207 routes of the four rail transit modes with a total length of8,200 km (5,100 miles), providing 29 billion passenger-kilometers (18 billion passenger-miles) of service annually.
Two systems dominate. The largest operator, Sistema de Transporte Colectiva inMexico City, has recently overtaken MTA-New York City Transit Authority in ridership.STC carries 1,436 million passengers annually, 29% of the continent’s total. MTA-NYCTcarries 1,326 million passengers annually, 27% of the continent’s total, 50% of the U.S.’stotal. Adding all New York City area rail operators makes the New York area thecontinent’s largest user of rail transit with 1,585 million passengers annually, 32% of thecontinent’s total, 59% of the U.S.’s total. Together the rail transit systems in the NewYork area and in Mexico City account for 61% of all unlinked rail passenger trips inNorth America. Ridership data is summarized in Exhibit 1-15 and Exhibit 1-16.
Exhibit 1-15North American Rail Ridership by Mode (1995)
Mode Annual Unlinked Trips %Rail Rapid Transit 4,137,000,000 80.8%Light Rail 474,000,000 9.3%Commuter Rail 334,000,000 6.5%Automated Guideway 175,000,000 3.4%TOTAL 5,120,000,000 100.0%
Exhibit 1-16Transit Ridership Summary (millions) (1995)
Country All Transit Rail Transit % by railUSA 8,643 2,671 31%Canada 2,001 770 38%Mexico NA 1,503 NA
NA: not available
Rail transit plays a vital role in five metropolitan areas carrying over 50% of all worktrips and, in three regions, over 70% of all CBD-oriented work trips. Rail transit plays animportant but lesser role in another six regions. Other rail transit systems carry a smallerproportion of all regional trips but fill other functions, such as defining corridors andencouraging densification and positive land-use development.
The four major rail modes consist of: Automated Guideway Transit (AGT),Commuter Rail (CR), Light Rail Transit (LRT) and Heavy Rail Transit (HR), also calledRail Rapid Transit. Exhibit 1-17 gives a condensed look at some of the key NorthAmerican statistics for each mode. Exhibit 1-18, Exhibit 1-19, and Exhibit 1-20 provideusage statistics for rail transit modes in the United States. Note that long average triplengths on commuter rail systems give this mode a much higher share of total railpassenger-kilometers (miles) than its share of trips would suggest.
Heavy rail carries 81% of allrail transit passengers inNorth America.
Rail transit modes.

Transit Capacity and Quality of Service Manual
Part 1/INTRODUCTION AND CONCEPTS Page 1-15 Chapter 1— Transit in North America
Exhibit 1-17Comparison of Key North American Rail Mode Statistics (1995)(R15)
Type RoutesAverage LineLength (km)
Total Length(km)
Average StationSpacing (km)
Average LineSpeed (km/h)
AGT 3 6.3 19.0 0.70 24.3CR 77 73.7 5672.1 5.71 52.7LRT 51 13.9 708.5 0.83 22.1HR 76 25.3 1868.6 1.47 36.2
Type RoutesAverage LineLength (mi)
Total Length(mi)
Average StationSpacing (mi)
Average LineSpeed (mph)
AGT 3 3.9 11.8 0.43 15.1CR 77 45.8 3524.5 3.55 32.7LRT 51 8.6 440.2 0.52 13.7HR 76 15.7 1161.1 0.91 22.5
AGT: automated guideway transit, CR: commuter rail, LRT: light rail transit, HR: heavy rail
Exhibit 1-18U.S. Rail Transit Annual Unlinked Passenger Trips by Mode (1996)(R7)
0.0 0.5 1.0 1.5 2.0 2.5
Other rail
Light rail
Commuter rail
Heavy rail
Billions of Annual Passenger Boardings
Exhibit 1-19U.S. “Other Rail” Annual Unlinked Passenger Trips by Mode (1996) (R7)
0 2 4 6 8 10 12
Inclined plane
Monorail
Automated guideway
Cable car
Millions of Annual Passenger Boardings

Transit Capacity and Quality of Service Manual
Part 1/INTRODUCTION AND CONCEPTS Page 1-16 Chapter 1— Transit in North America
Exhibit 1-20U.S. Rail Transit Annual Passenger Kilometers (Miles) by Mode (1996)(R7)
0 5 10 15 20
Other rail
Light rail
Commuter rail
Heavy rail
Billions of Annual Passenger-Kilometers
0 2 4 6 8 10 12 14
Other rail
Light rail
Commuter rail
Heavy rail
Billions of Annual Passenger-Miles
Rail Right-of-Way Types
While the rail mode employed on a rail transit line has some bearing on capacity, thetype of right-of-way (ROW) used by the line is of vital importance. The three major typesof rights-of-way are described below. Similar divisions can be applied to bus systems.
Exclusive right-of-way: The right-of-way is reserved for the exclusive use of transitvehicles. There is no interaction with other vehicle types. Intersections with other modesare grade-separated to avoid the potential for conflict. Exclusive rights-of-way providemaximum capacity and the fastest and most reliable service, although at higher capitalcosts than other right-of-way types. Automated guideway transit systems must bydefinition operate on this type of right-of-way as their automated operation precludes anymixing with other modes. This right-of-way type is also most common for heavy railsystems, many commuter rail systems, and at least portions of many light rail systems.
Segregated right-of-way: Segregated rights-of-way provide many of the samebenefits of exclusive rights-of-way but permit other modes to cross the right-of-way atdefined locations such as grade crossings. Segregated rights-of-way are most commonlyemployed with commuter rail and light rail transit systems. The use of this right-of-waytype for heavy rail transit systems has largely been eliminated.
Shared right-of-way: A shared right-of-way permits other traffic to mix with railtransit vehicles, as is the case with most streetcar and bus lines. While this right-of-waytype is the least capital intensive, it does not provide the benefits in capacity, operatingspeed, and reliability that are provided by the other right-of-way types.

Transit Capacity and Quality of Service Manual
Part 1/INTRODUCTION AND CONCEPTS Page 1-17 Chapter 1— Transit in North America
Light Rail Transit
Light rail transit, often known simply as LRT, began as a development of thestreetcar to allow higher speeds and increased capacity. Light rail transit is characterizedby its versatility of operation, as it can operate separated from other traffic below grade,at-grade, on an elevated structure, or together with motor vehicles on the surface (Exhibit1-21). Service can be operated with single cars or multiple-car trains. Electric tractionpower is obtained from an overhead wire, thus eliminating the restrictions imposed byhaving a live third-rail at ground level. This flexibility helps to keep construction costslow and explains the popularity this mode has experienced since 1978 when the first of 14new North American light rail transit systems was opened in Edmonton. These newerlight rail transit systems have adopted a much higher level of segregation from othertraffic than earlier systems enjoyed. A recent trend is the introduction of diesel light railcars by European manufacturers. Although not yet in regular service in North America,trials of such cars have generated considerable interest in some areas, given the ease withwhich diesel light rail service can be established on existing rail lines.
Exhibit 1-21Light Rail Examples
Segregated ROW (Calgary) Transit Mall (Baltimore)
Median (Los Angeles) Contraflow (Denver)
Streetcar (San Francisco) Tunnel (Portland, OR)
Light rail transit described.
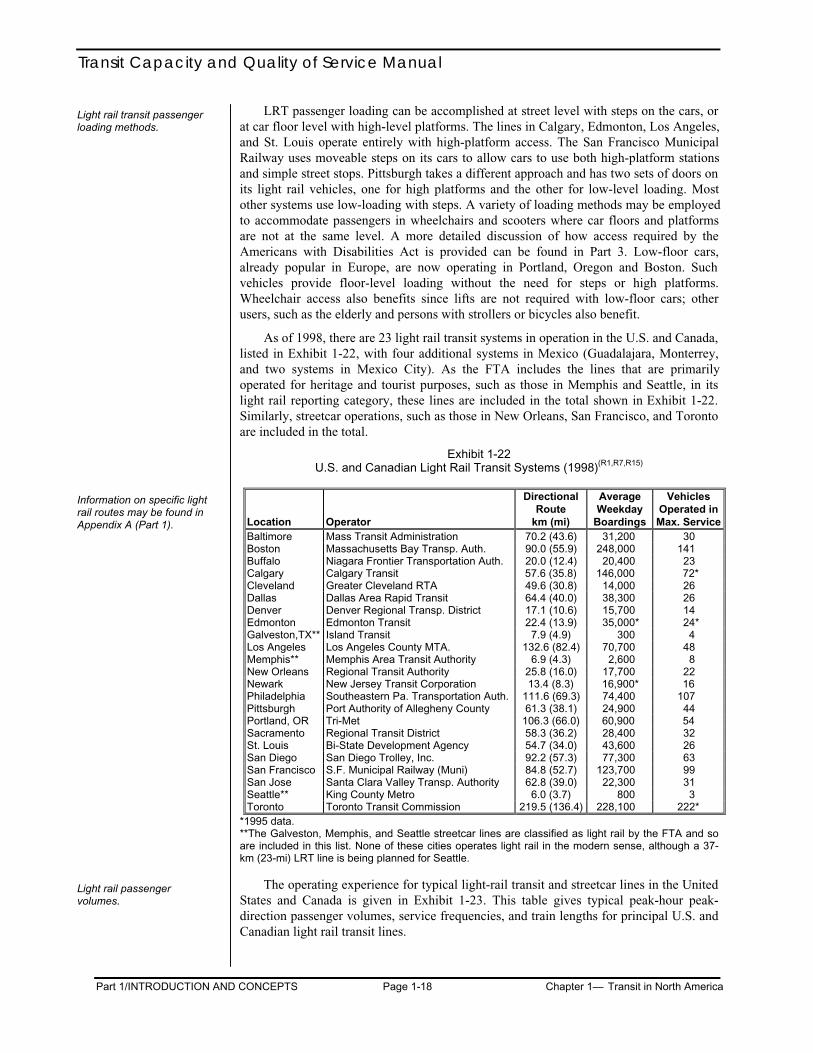
Transit Capacity and Quality of Service Manual
Part 1/INTRODUCTION AND CONCEPTS Page 1-18 Chapter 1— Transit in North America
LRT passenger loading can be accomplished at street level with steps on the cars, orat car floor level with high-level platforms. The lines in Calgary, Edmonton, Los Angeles,and St. Louis operate entirely with high-platform access. The San Francisco MunicipalRailway uses moveable steps on its cars to allow cars to use both high-platform stationsand simple street stops. Pittsburgh takes a different approach and has two sets of doors onits light rail vehicles, one for high platforms and the other for low-level loading. Mostother systems use low-loading with steps. A variety of loading methods may be employedto accommodate passengers in wheelchairs and scooters where car floors and platformsare not at the same level. A more detailed discussion of how access required by theAmericans with Disabilities Act is provided can be found in Part 3. Low-floor cars,already popular in Europe, are now operating in Portland, Oregon and Boston. Suchvehicles provide floor-level loading without the need for steps or high platforms.Wheelchair access also benefits since lifts are not required with low-floor cars; otherusers, such as the elderly and persons with strollers or bicycles also benefit.
As of 1998, there are 23 light rail transit systems in operation in the U.S. and Canada,listed in Exhibit 1-22, with four additional systems in Mexico (Guadalajara, Monterrey,and two systems in Mexico City). As the FTA includes the lines that are primarilyoperated for heritage and tourist purposes, such as those in Memphis and Seattle, in itslight rail reporting category, these lines are included in the total shown in Exhibit 1-22.Similarly, streetcar operations, such as those in New Orleans, San Francisco, and Torontoare included in the total.
Exhibit 1-22U.S. and Canadian Light Rail Transit Systems (1998)(R1,R7,R15)
Location Operator
DirectionalRoute
km (mi)
AverageWeekday
Boardings
VehiclesOperated inMax. Service
Baltimore Mass Transit Administration 70.2 (43.6) 31,200 30Boston Massachusetts Bay Transp. Auth. 90.0 (55.9) 248,000 141Buffalo Niagara Frontier Transportation Auth. 20.0 (12.4) 20,400 23Calgary Calgary Transit 57.6 (35.8) 146,000 72*Cleveland Greater Cleveland RTA 49.6 (30.8) 14,000 26Dallas Dallas Area Rapid Transit 64.4 (40.0) 38,300 26Denver Denver Regional Transp. District 17.1 (10.6) 15,700 14Edmonton Edmonton Transit 22.4 (13.9) 35,000* 24*Galveston,TX** Island Transit 7.9 (4.9) 300 4Los Angeles Los Angeles County MTA. 132.6 (82.4) 70,700 48Memphis** Memphis Area Transit Authority 6.9 (4.3) 2,600 8New Orleans Regional Transit Authority 25.8 (16.0) 17,700 22Newark New Jersey Transit Corporation 13.4 (8.3) 16,900* 16Philadelphia Southeastern Pa. Transportation Auth. 111.6 (69.3) 74,400 107Pittsburgh Port Authority of Allegheny County 61.3 (38.1) 24,900 44Portland, OR Tri-Met 106.3 (66.0) 60,900 54Sacramento Regional Transit District 58.3 (36.2) 28,400 32St. Louis Bi-State Development Agency 54.7 (34.0) 43,600 26San Diego San Diego Trolley, Inc. 92.2 (57.3) 77,300 63San Francisco S.F. Municipal Railway (Muni) 84.8 (52.7) 123,700 99San Jose Santa Clara Valley Transp. Authority 62.8 (39.0) 22,300 31Seattle** King County Metro 6.0 (3.7) 800 3Toronto Toronto Transit Commission 219.5 (136.4) 228,100 222*
*1995 data.**The Galveston, Memphis, and Seattle streetcar lines are classified as light rail by the FTA and soare included in this list. None of these cities operates light rail in the modern sense, although a 37-km (23-mi) LRT line is being planned for Seattle.
The operating experience for typical light-rail transit and streetcar lines in the UnitedStates and Canada is given in Exhibit 1-23. This table gives typical peak-hour peak-direction passenger volumes, service frequencies, and train lengths for principal U.S. andCanadian light rail transit lines.
Light rail transit passengerloading methods.
Information on specific lightrail routes may be found inAppendix A (Part 1).
Light rail passengervolumes.
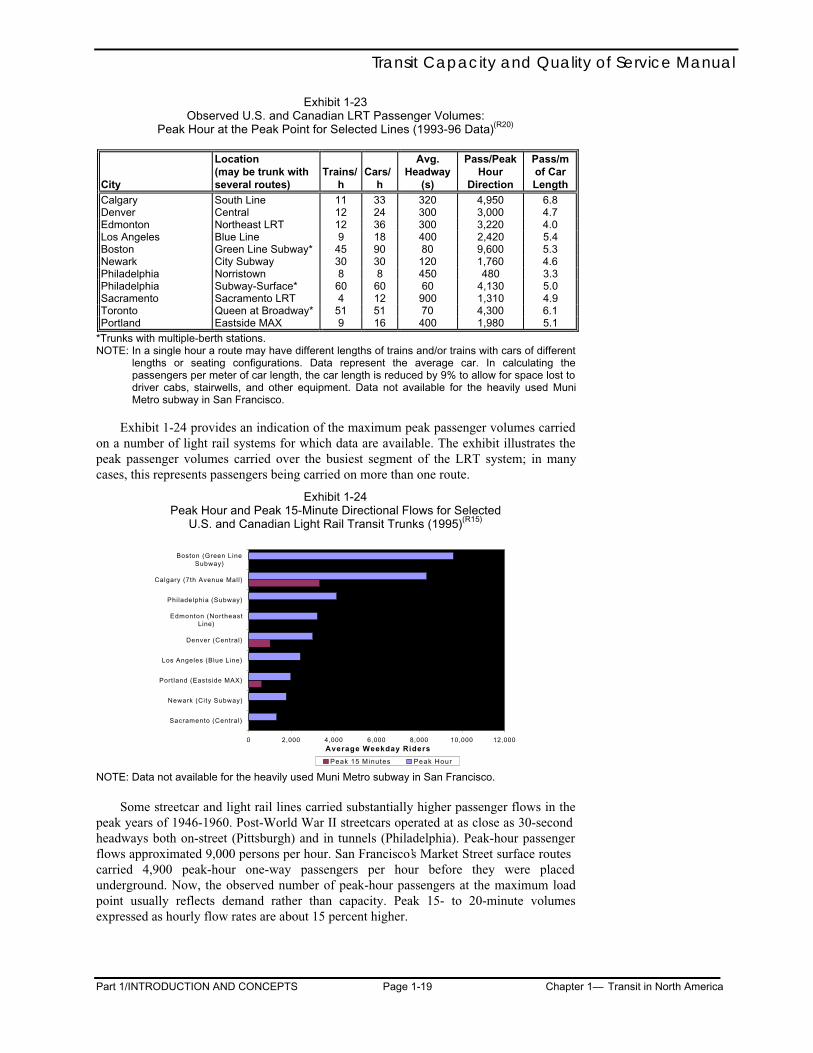
Transit Capacity and Quality of Service Manual
Part 1/INTRODUCTION AND CONCEPTS Page 1-19 Chapter 1— Transit in North America
Exhibit 1-23Observed U.S. and Canadian LRT Passenger Volumes:
Peak Hour at the Peak Point for Selected Lines (1993-96 Data)(R20)
City
Location(may be trunk withseveral routes)
Trains/h
Cars/h
Avg.Headway
(s)
Pass/PeakHour
Direction
Pass/mof CarLength
Calgary South Line 11 33 320 4,950 6.8Denver Central 12 24 300 3,000 4.7Edmonton Northeast LRT 12 36 300 3,220 4.0Los Angeles Blue Line 9 18 400 2,420 5.4Boston Green Line Subway* 45 90 80 9,600 5.3Newark City Subway 30 30 120 1,760 4.6Philadelphia Norristown 8 8 450 480 3.3Philadelphia Subway-Surface* 60 60 60 4,130 5.0Sacramento Sacramento LRT 4 12 900 1,310 4.9Toronto Queen at Broadway* 51 51 70 4,300 6.1Portland Eastside MAX 9 16 400 1,980 5.1
*Trunks with multiple-berth stations.NOTE: In a single hour a route may have different lengths of trains and/or trains with cars of different
lengths or seating configurations. Data represent the average car. In calculating thepassengers per meter of car length, the car length is reduced by 9% to allow for space lost todriver cabs, stairwells, and other equipment. Data not available for the heavily used MuniMetro subway in San Francisco.
Exhibit 1-24 provides an indication of the maximum peak passenger volumes carriedon a number of light rail systems for which data are available. The exhibit illustrates thepeak passenger volumes carried over the busiest segment of the LRT system; in manycases, this represents passengers being carried on more than one route.
Exhibit 1-24Peak Hour and Peak 15-Minute Directional Flows for Selected
U.S. and Canadian Light Rail Transit Trunks (1995)(R15)
0 2,000 4,000 6,000 8,000 10,000 12,000
Sacramento (Central)
Newark (City Subway)
Portland (Eastside MAX)
Los Angeles (Blue Line)
Denver (Central)
Edmonton (NortheastLine)
Philadelphia (Subway)
Calgary (7th Avenue Mall)
Boston (Green LineSubway)
Average Weekday Riders
Peak 15 Minutes Peak Hour
NOTE: Data not available for the heavily used Muni Metro subway in San Francisco.
Some streetcar and light rail lines carried substantially higher passenger flows in thepeak years of 1946-1960. Post-World War II streetcars operated at as close as 30-secondheadways both on-street (Pittsburgh) and in tunnels (Philadelphia). Peak-hour passengerflows approximated 9,000 persons per hour. San Francisco’s Market Street surface routescarried 4,900 peak-hour one-way passengers per hour before they were placedunderground. Now, the observed number of peak-hour passengers at the maximum loadpoint usually reflects demand rather than capacity. Peak 15- to 20-minute volumesexpressed as hourly flow rates are about 15 percent higher.

Transit Capacity and Quality of Service Manual
Part 1/INTRODUCTION AND CONCEPTS Page 1-20 Chapter 1— Transit in North America
Heavy Rail Transit
Heavy rail transit (Exhibit 1-25) is by far the predominant urban rail travel mode inNorth America, in terms of system size and utilization. Exhibit 1-18 and Exhibit 1-20illustrate the lead heavy rail transit in the U.S. has over the other rail modes in bothannual passenger trips and annual passenger kilometers (miles). Heavy rail transit ischaracterized by fully grade-separated rights-of-way, high level platforms and high-speed,electric multiple-unit cars.
Exhibit 1-25Heavy Rail Examples
New York Atlanta
Miami Vancouver, BC
The expeditious handling of passengers is enabled through the use of long trains ofup to 11 cars running a frequent service. Loading and unloading of passengers at stationsis rapid due to level access and multiple double-stream doors.
Power is generally collected from a third rail but can also be received from overheadwires as in Cleveland, the Skokie Swift in Chicago, and a portion of one line in Boston.Third-rail power collection, frequent service, and high operating speeds generallynecessitate the use of grade-separated pedestrian and vehicular crossings. A small numberof grade crossings are an exceptional feature of the Chicago system.
U.S. and Canadian heavy rail systems generally fall into two groups according totheir time of initial construction. Pre-war systems are often characterized by highpassenger densities and closely spaced stations, although the postwar systems in Torontoand Montréal also fall into this category. The newer United States systems tend to place ahigher value on passenger comfort and operating speed, as expressed by less crowdedtrains and a more distant spacing of stations, especially in suburban areas. Newer systemsalso tend to provide extensive suburban park-and-ride facilities.
BART in the San Francisco Bay area is a prime example of the latter category withits fast trains and provision of upholstered seats. BART station spacing outside downtownSan Francisco and Oakland is great enough to allow the high overall speed required to
Introduction andcharacteristics.
Status of heavy rail systems.

Transit Capacity and Quality of Service Manual
Part 1/INTRODUCTION AND CONCEPTS Page 1-21 Chapter 1— Transit in North America
compete with the automobile. Vancouver’s SkyTrain can be included in the heavy railcategory rather than the light rail or automated guideway categories since it most closelyresembles heavy rail transit system in operating practices and right-of-way characteristics.
The high costs of constructing fully grade-separated rights-of-way (subway orelevated) for heavy rail transit have limited expansion in recent decades. Exhibit 1-26identifies the 17 existing heavy rail transit systems in the U.S. and Canada; Mexico City’sSistema de Transporte Colectiva has the greatest ridership in North America.
Exhibit 1-26U.S. and Canadian Heavy Rail Transit Systems (1998)(R1,R7,R15)
Location Operator
DirectionalRoute
km (mi)
AverageWeekday
Boardings
VehiclesOperated inMax. Service
Atlanta Metro. Atlanta Rapid Transit Auth. 148.4 (92.2) 248,700 165*Baltimore Mass Transit Administration 47.3 (29.4) 46,400 54Boston Massachusetts Bay Transp. Auth. 122.0 (75.8) 405,400 332Camden, NJ Port Authority Transit Corporation 50.7 (31.5) 38,300 96Chicago Chicago Transit Authority 334.4 (207.8) 447,500 865Cleveland Greater Cleveland RTA 61.5 (38.2) 18,900 35Los Angeles Los Angeles County MTA 9.7 (6.0) 34,400 16Miami Metro-Dade Transit Agency 67.9 (42.2) 44,800 80Montréal Société de transport de la
Communauté urbaine de Montréal122.3 (76.0) 700,000* 555*
New York MTA-New York City Transit 793.2 (492.9) 5,602,500 4,852New York MTA-Staten Island Railway 46.0 (28.6) 17,600 36Newark Port Authority Trans-Hudson Corp. 46.0 (28.6) 235,500 282Philadelphia Southeastern Pa. Transp. Authority 122.5 (76.1) 315,300 277San Francisco Bay Area Rapid Transit 299.3 (186.0) 280,300 453*Toronto Toronto Transit Commission 128.2 (79.7) 780,800 510*Vancouver BC Transit 56.0 (34.8) 132,300 114*Washington Washington Metro. Area Transit Auth. 286.8 (178.2) 732,300 586
*1995 data.
Of the 17 heavy rail transit systems operating in the U.S. and Canada, the three NewYork City area systems carry two-thirds of all riders using this mode. Exhibit 1-27 showsthe dominance of the New York metro area relative to the rest of the U.S. and Canada.Heavy rail transit’s efficiency in moving large volumes of passengers in denselypopulated areas is evident in this, the largest metropolitan area in the U.S. Heavy railtransit plays a key role in enabling such dense urban areas to exist. In 1995, 51.9% ofbusiness day travel into Lower Manhattan was by heavy rail transit. During the 7-10 a.m.time period, this share increased to 62.2%.(R14)
Exhibit 1-27Concentration of Heavy Rail Transit Ridership (1995)(R7)
0 0.2 0.4 0.6 0.8 1 1.2 1.4
Rest of U.S. andCanada (14systems)
New York (3systems)
Billions of Annual Riders
The New York City subway system is one of the largest and most complex in theworld. This extensive subway system carries almost twice as many riders as does the localbus system. Most lines are triple or quadruple tracked to allow the operation of express
Information on specific heavy railroutes may be found in AppendixA.
Ridership.
Complexity of the New Yorksubway.

Transit Capacity and Quality of Service Manual
Part 1/INTRODUCTION AND CONCEPTS Page 1-22 Chapter 1— Transit in North America
services. A large number of junctions permit trains to be operated on a variety ofcombinations of line segments to provide an extensive network of service. Exhibit 1-28shows a diagram of the subway tracks in midtown Manhattan.
Exhibit 1-28MTA-NYCT Subway Tracks in Midtown Manhattan
SOURCE: From New York Railway Map, courtesy John Yonge, © 1993 Quail Map Company, 31Lincoln Road, Exeter, England
Exhibit 1-29 illustrates the peak hour and peak 15-minute passenger flow rates for the15 busiest heavy rail transit trunk lines in the U.S. and Canada. The graph uses trunksrather than routes in order to group those services sharing tracks together. All the trunkslisted are double tracked and have at least one station used by all routes.
When four-track lines in New York are taken into consideration the maximum load isa combination of the Lexington Avenue Express and Local at 63,200 passengers per peakhour direction with almost comparable volumes on the combined Queens Boulevard linesat Queens Plaza. In comparison, the busiest two-track heavy rail line in the world is inHong Kong, with 84,000 passengers per peak hour direction.

Transit Capacity and Quality of Service Manual
Part 1/INTRODUCTION AND CONCEPTS Page 1-23 Chapter 1— Transit in North America
Exhibit 1-29Peak Hour and Peak 15-minute Flows for the Busiest 15
U.S. and Canadian Heavy Rail Transit Trunk Lines (1995)(R15)
0 10,000 20,000 30,000 40,000 50,000 60,000
New York-PATH (World Trade Center)
Toronto (Bloor-Danforth)
New York-NYCTA (A,D--8th Ave. Ex.)
Montréal (Green)
New York-NYCTA (N,R--60th St.)
New York-NYCTA (7--Steinway)
New York-NYCTA (2,3--Broadway Exp.)
Montréal (Orange)
New York-NYCTA (4,5--Joralemon St.)
Toronto (Yonge Subway)
New York-NYCTA (A,C--Cranberry St.)
New York-NYCTA (6--Lexington Local)
New York-NYCTA (B,D,Q--Manhattan Br.)
New York-NYCTA (4,5--Lexington Exp.)
New York-NYCTA (E,F--53rd St.)
Average Weekday Riders
Peak 15 Minutes Peak Hour
NOTE: Data could not be obtained for Philadelphia’s SEPTA. However, it is unlikely that either ofthe SEPTA rapid transit lines would feature in this chart if data were available. Peak 15-minute flow data were not available for all lines for which peak hour data were available.
Commuter Rail
Commuter rail (Exhibit 1-30) is generally a long distance transit mode using trackagethat is a part of the general railroad system but which may be used exclusively forpassenger movement. Track may be owned by the transit system or access may be byagreement with a freight railroad. Similarly, train operation may be by the transit agency,the track owner, or a third-party contractor.
Exhibit 1-30Commuter Rail Examples
Toronto San Diego
Service is heavily oriented towards the peak commuting hours, particularly on thesmaller systems. All-day service is operated on many of the mainlines of the largercommuter rail systems and the term regional rail is more appropriate in these cases.
Introduction.

Transit Capacity and Quality of Service Manual
Part 1/INTRODUCTION AND CONCEPTS Page 1-24 Chapter 1— Transit in North America
Commuter rail scheduling is often tailored to the peak travel demand rather thanoperating a consistent service throughout the peak period. Where track arrangements andsignaling permit, operations can be complex with the use of local trains, limited stopexpress trains and zoned express trains. Zoned express trains are commonly used on busylines with many stations where express trains serve a group of stations then run non-stopto the major destination station(s).
Commuter Rail Propulsion and Equipment
Diesel and electric power are both used for traction on commuter rail lines. Electrictraction is capital intensive but permits faster acceleration while reducing noise and airpollution. It is used mainly on busy routes, particularly where stops are spaced closelytogether or where long tunnels are encountered. Both power sources can be used forlocomotive or multiple-unit operation. All cars in a multiple-unit train can be powered orsome can be unpowered “trailer” cars which must be operated in combination withpowered cars. Electric multiple-unit cars are used extensively in the New York,Philadelphia, and Chicago regions with the entire SEPTA regional rail system inPhiladelphia being electrified. Dallas is currently the only city operating diesel multiple-unit cars in commuter rail service.
Locomotive-hauled commuter trains are standard for diesel operation and arebecoming more common on electrified lines as a way to avoid the high costs of multiple-unit cars. New Jersey Transit and SEPTA have both purchased electric locomotives as aneconomical alternative to buying multiple-unit cars. Other systems value the flexibility ofmultiple-unit cars in varying train length. The STCUM commuter rail system in Montréalhas replaced a mixed fleet with a standard new electric multiple-unit design.
Commuter rail train length can be tailored to demand with cars added and removed asridership dictates. This is particularly easy with multiple-unit equipment and can result intrains of anywhere from two to twelve cars in length. Where train length is constant allday, unneeded cars can be closed to passengers to reduce staffing needs and the risk ofequipment damage.
Commuter rail is unique among the transit modes in that a high priority is placed onpassenger comfort as journeys are often long and the main source of competition is theautomobile. All lines operate with a goal of a seat for every passenger except for the busyinner portions of routes where many lines funnel together and a frequent service isprovided. Such is the case for the 20-minute journey on the Long Island Rail Roadbetween Jamaica and Penn Stations. Service between these points is very frequent (trainson this four-track corridor operate as close as one minute apart in the peak hours) as trainsfrom multiple branches converge at Jamaica to continue to Manhattan.
Commuter rail cars are generally designed with the maximum number of seatspossible, although this tradition is changing somewhat where persons in wheelchairs andbicycles are accommodated. A number of common approaches are taken to achievemaximum seating over the car length. The simplest is the use of “2+3” seating where fiveseats are placed in each row as opposed to the usual four. This can be done quite easily inwide railroad-type cars and brings the number of seats per car to around 120. It is notespecially popular with passengers. “2+3” seating is used by many operators including theLong Island Rail Road and the MBTA in Boston, but it places a constraint on aisle widththat may make the provision of wheelchair access difficult.
The other main approach to increasing car capacity is to add additional seating levelsto the car, subject to any height restrictions, such as tunnels and underpasses, on the raillines. The gallery type car is one example and adds an upper seating level to the car withan open well to the lower level. The well serves to permit ticket collection and inspectionfrom the lower level but does limit the upper level to single seats on each side. Gallerycars can typically seat 150-160 passengers and are used most extensively by Chicago’s
Commuter rail scheduling.
Passenger comfort and cardesign.

Transit Capacity and Quality of Service Manual
Part 1/INTRODUCTION AND CONCEPTS Page 1-25 Chapter 1— Transit in North America
Metra commuter rail system. A more recent development is the bi-level car2 which hasupper and lower levels over the center of the car with an intermediate level at each end ofthe vehicle. Toronto’s GO Transit popularized this design with relatively spacious seatingfor 160. It is now also being used by Metrolink in Los Angeles, the Coaster in San Diego,Tri-Rail in Florida, and the West Coast Express in Vancouver. This style of car hasbecome common on many European commuter rail (suburban) services.
Passenger access to commuter rail trains can be from platform or ground level, withthe former commonly used on busy lines or at major stations to speed passengermovements. Standard railway type “traps” in the stepwells allow cars to use both types ofplatform but require the train crew to raise and lower the trap door above the steps. Theelectric multiple unit cars used by the Northern Indiana Commuter Transportation Districton the South Shore line out of Chicago employ an extra set of doors at the center of thecars that are used exclusively at high platform stations while the car end doors are fittedwith traps in the conventional manner for use at high and low platform stations. Thisarrangement is also used on the new electric multiple-unit cars used on Montréal’s MountRoyal tunnel line.
Commuter rail services operate in 15 North American metropolitan regions,including the recently opened Coaster service between San Diego and Oceanside,California; and new lines in Dallas, Texas and Vancouver, British Columbia. There hasbeen rapid growth in this mode as a result of the availability of government funding andthe relatively low capital costs of the mode. This is offset by higher operating costs perpassenger trip — particularly for lower-volume commuter rail services.
Exhibit 1-31U.S. and Canadian Commuter Rail Systems (1998)(R1,R7,R15)
Location Operator
DirectionalRoute
km (mi)
AverageWeekday
Boardings
VehiclesOperated inMax. Service
Baltimore Mass Transit Administration 600.9 (373.4) 19,400 109Boston Massachusetts Bay Transp. Auth. 924.2 (574.3) 118,900 308Chicago Metropolitan Rail (Metra) 1,511.8 (939.4) 277,600 927Chicago Northern Indiana Commuter T.D. 243.0 (151.0) 12,100 53Dallas Dallas Area Rapid Transit 32.2 (20.0) 1,900 NALos Angeles Southern Calif. Regional Rail Auth. 1,171.0 (727.6) 26,300 113Miami Tri-Rail 213.7 (132.8) 8,300 25Montréal Agence Métropolitaine de Transp. 188.0 (116.8) NA NANew Haven,CT Connecticut DOT 162.9 (101.2) 1,100 12New Jersey New Jersey Transit 1,919.6 (1,192.8) 191,300 706New York MTA-Long Island Rail Road 1,027.1 (638.2) 343,300 981New York MTA-Metro North Railroad 861.6 (535.4) 233,000 725Philadelphia Pennsylvania DOT 231.7 (144.0) 700 9Philadelphia Southeastern Pa. Transp. Authority 712.6 (442.8) 93,200 279San Diego North County T.D. (Coaster) 132.2 (82.2) 3,900 20San Francisco Peninsula Corridor JPB (CalTrain) 247.1 (153.6) 26,900 82San Jose Altamont Commuter Express JPA 276.9 (172.0) NA NAToronto GO Transit 426.1 (264.8) 103,800 259*Vancouver West Coast Express 134.3 (83.5) 7,100 NAWashington Virginia Railway Express 281.6 (175.0) 6,900 46
*1995 data.NA: not available
2 Less commonly known as tri-level cars as there are technically three floor levels.
Commuter rail platform height.
Commuter rail status.

Transit Capacity and Quality of Service Manual
Part 1/INTRODUCTION AND CONCEPTS Page 1-26 Chapter 1— Transit in North America
Extensions and expansions are planned on other systems to enlarge the service areaand provide additional parking for patrons. With many commuter rail lines serving low-density suburban areas, the provision of adequate customer parking is a key tomaximizing ridership. To meet this need, “cornfield” stations are built to allow parkingcapacity to be expanded at low cost in relatively undeveloped areas.
Commuter rail ridership is highly concentrated— the New York and Chicagometropolitan systems are the four busiest on the continent, as shown in Exhibit 1-31. GOTransit in Toronto, one of the first of the new generation of commuter rail systems, ranksfifth. Boston’s MBTA has had ridership double over the last decade thanks to extensivenew service and capital investment. Exhibit 1-32 illustrates the peak hour and peak 15-minute flows handled on the busier commuter rail lines in North America.
Exhibit 1-32Peak Hour and Peak 15-minute Flows for the Busiest 15
U.S. and Canadian Commuter Rail Trunk Lines (1995)(R15)
0 5,000 10,000 15,000 20,000 25,000 30,000 35,000 40,000 45,000
New York-LIRR (Jamaica-Flatbush)
Chicago-Metra (Rock Island)
Boston (North Station)
Philadelphia (Penn-30th St.)
Toronto (Lakeshore East)
Boston (South Station)
Chicago-Metra (Union Sta. North)
New Jersey (Hoboken Terminal)
Chicago-Metra/NICTD (Electric)
Chicago-Metra (Union Sta. South)
New Jersey (Newark Penn Sta.)
Toronto (Lakeshore West)
Chicago-Metra (C&NW)
New York-Metro North (Park Ave.)
New York-LIRR (Jamaica-Penn. Sta.)
Average Weekday Riders
Peak 15 Minutes Peak Hour
Automated Guideway Transit
Automated guideway transit (Exhibit 1-33) is the newest of the rail transit modes andhas played a relatively minor role in North American transit. As the name indicates, theoperation of these systems is completely automated (vehicles without drivers), withpersonnel limited to a supervisory role. Inherent in the definition of this mode is the needfor guideways to be fully separated from other traffic. Cars are generally small andservice is frequent— the name “people mover” is often applied to these systems which cantake on the role of horizontal elevators.
Over 40 automated guideway transit systems are operated in the U.S. today. Thereare no such systems in Canada. These systems operate in four types of environments:
• airports,• institutions (universities, shopping malls, government buildings),• leisure and amusement parks (e.g., Disneyland), and• public transit systems.
Introduction to AGT.
AGT status.

Transit Capacity and Quality of Service Manual
Part 1/INTRODUCTION AND CONCEPTS Page 1-27 Chapter 1— Transit in North America
Most of these systems are operated by airports or by private entities, especially asamusement park circulation systems.
Exhibit 1-33Automated Guideway Transit Examples
Newark Airport Miami
There are four public transit AGT systems operating in the United States. Of these,three operate in regular transit service in the downtown areas of Detroit, Jacksonville, andMiami. The Detroit People Mover line has remained unchanged from opening in 1987while the Miami MetroMover added two extensions in 1994. Jacksonville opened the first1.1-km (0.7-mi) section of its Automated Skyway Express in 1989, with new extensionsopening from 1997-1999 to serve both sides of the St. Johns River.
A relatively large institutional system is the automated guideway transit system at theWest Virginia University campus in Morgantown, WV. This 5-km (3-mile) line featuresoff-line stations which enable close headways, down to 15 seconds, and permit cars tobypass intermediate stations. The cars are small, accommodating only 21 passengers, andare operated singly. On-demand service is possible at off-peak hours.
The SkyTrain in Vancouver, British Columbia, and the Scarborough RT in Toronto,while sharing the same basic technology that is used on the Detroit People Mover, havemore in common with heavy rail systems than AGT lines in their service characteristics,ridership patterns, and operating practices and so are included in the heavy rail listings.Exhibit 1-34 lists ridership and other statistics for North American AGT systems used forpublic transit.
Exhibit 1-34North American AGT Systems Used For Public Transit (1998)(R1,R7,R15)
Location Operator
DirectionalRoute
km (mi)
AverageWeekday
Boardings
VehiclesOperated inMax. Service
Detroit Detroit Transportation Corporation 4.7 (2.9) 9,700* 8Jacksonville Jacksonville Transportation Authority 8.0 (5.0) 1,000 10Miami Miami-Dade Transit Agency 6.3 (3.9) 12,900 16Tampa Hartline 1.4 (0.9) 400 1*1995 data.
Daily ridership data for other North American AGT systems are shown in Exhibit1-35. Caution should be exercised with many of these figures as the non-transit systemsare not required to provide the reporting accuracy mandated by the FTA. Ridership onmany systems is also likely affected by seasonal patterns and less pronounced peakingthan occurs on transit systems. Regardless of these qualifications, the total daily ridershipon the 38 non-transit systems amounts to over 660,000, compared to about 24,000 on thetransit AGT lines.
AGT transit services.

Transit Capacity and Quality of Service Manual
Part 1/INTRODUCTION AND CONCEPTS Page 1-28 Chapter 1— Transit in North America
Exhibit 1-35Daily Ridership for North American Non-Transit AGT Systems (1995)
Category LocationAvg. DailyRidership
Airport Atlanta, GA 109,000Airport Chicago-O’Hare, IL 12,000Airport Cincinnati, OH 30,000Airport Dallas-Fort Worth, TX 50,000Airport Denver, CO 50,000Airport Houston, TX 8,500Airport Las Vegas, NV 15,000Airport Miami, FL 15,000Airport Orlando, FL 49,000Airport Pittsburgh, PA 50,000Airport Seattle-Tacoma, WA 43,000Airport Tampa, FL 71,000Airport Tampa-parking, FL 8,000Institutional Duke Univ. Hospital, NC 2,000Institutional J. Paul Getty Ctr., Los Angeles, CA NAInstitutional Los Colinas, Dallas, TX NAInstitutional Pearlridge Mall, HI 4,000Institutional Senate Subway, DC 10,000Institutional University of West Va., Morgantown 16,000Leisure Bronx Zoo, NY 2,000Leisure Busch Garden, VA 6,000Leisure CalExpo, CA 4,000Leisure Carowinds, NC 7,000Leisure Circus-Circus, Las Vegas, NV 11,000Leisure Circus-Circus, Reno, NV 6,000Leisure Circus-Water Park, Las Vegas, NV 2,000Leisure Disneyland, CA 15,000Leisure Disneyworld, FL 20,000Leisure Hersheypark, PA 8,000Leisure Kings Dominion, VA 5,000Leisure Kings Island, OH 7,000Leisure Lux-Excal, Las Vegas, NV 10,000Leisure Magic Mountain, CA 8,000Leisure Memphis/Mudd Is., TN 2,000Leisure Miami Zoo, FL 1,200Leisure Minnesota Zoo, MN 1,000Leisure Mirage, Treasure Is., Las Vegas, NV 8,000Leisure Toronto Zoo, ON 2,000All Total 667,700
SOURCE: Transit Pulse, P.O. Box 249, Fields Corner Station, Boston, MA 02122
Other Rail
Cable Car
Cable cars (Exhibit 1-36) are operated only in San Francisco, where the first lineopened in 1873. Although now associated with San Francisco’s steep hills, more than twodozen other U.S. cities, including relatively flat cities such as Chicago and New York,briefly employed this transit mode as a faster, more economical alternative to the horse-drawn streetcar. Most cable lines were converted to electric streetcar lines in the 1890sdue to lower operating costs and greater reliability, but lines in San Francisco, Seattle,and Tacoma that were too steep for streetcars continued well into the 20th century.(R10)
Three cable car routes remain in San Francisco as a National Historic Landmark andcarry 9.6 million riders a year. The cars are pulled along by endless underground cablesthat move at a constant speed of 15 km/h (9 mph). A grip on the car allows the cable to bepicked up through a slot between the tracks and released as required for passenger stops,curves, avoiding other cables that cross the line, and so on. Cable car systems are not veryefficient, as 55-75% of the energy used is lost to friction.
Cable cars are now onlyfound in San Francisco, butwere once used brieflythroughout the UnitedStates.
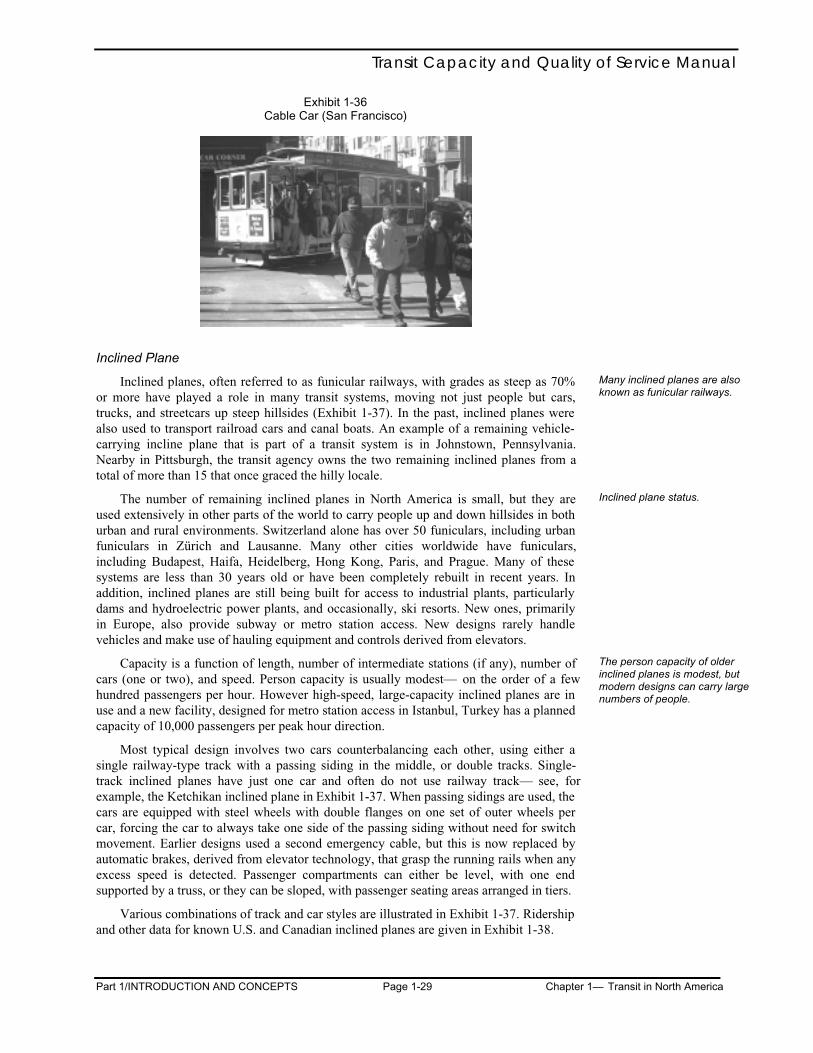
Transit Capacity and Quality of Service Manual
Part 1/INTRODUCTION AND CONCEPTS Page 1-29 Chapter 1— Transit in North America
Exhibit 1-36Cable Car (San Francisco)
Inclined Plane
Inclined planes, often referred to as funicular railways, with grades as steep as 70%or more have played a role in many transit systems, moving not just people but cars,trucks, and streetcars up steep hillsides (Exhibit 1-37). In the past, inclined planes werealso used to transport railroad cars and canal boats. An example of a remaining vehicle-carrying incline plane that is part of a transit system is in Johnstown, Pennsylvania.Nearby in Pittsburgh, the transit agency owns the two remaining inclined planes from atotal of more than 15 that once graced the hilly locale.
The number of remaining inclined planes in North America is small, but they areused extensively in other parts of the world to carry people up and down hillsides in bothurban and rural environments. Switzerland alone has over 50 funiculars, including urbanfuniculars in Zürich and Lausanne. Many other cities worldwide have funiculars,including Budapest, Haifa, Heidelberg, Hong Kong, Paris, and Prague. Many of thesesystems are less than 30 years old or have been completely rebuilt in recent years. Inaddition, inclined planes are still being built for access to industrial plants, particularlydams and hydroelectric power plants, and occasionally, ski resorts. New ones, primarilyin Europe, also provide subway or metro station access. New designs rarely handlevehicles and make use of hauling equipment and controls derived from elevators.
Capacity is a function of length, number of intermediate stations (if any), number ofcars (one or two), and speed. Person capacity is usually modest— on the order of a fewhundred passengers per hour. However high-speed, large-capacity inclined planes are inuse and a new facility, designed for metro station access in Istanbul, Turkey has a plannedcapacity of 10,000 passengers per peak hour direction.
Most typical design involves two cars counterbalancing each other, using either asingle railway-type track with a passing siding in the middle, or double tracks. Single-track inclined planes have just one car and often do not use railway track— see, forexample, the Ketchikan inclined plane in Exhibit 1-37. When passing sidings are used, thecars are equipped with steel wheels with double flanges on one set of outer wheels percar, forcing the car to always take one side of the passing siding without need for switchmovement. Earlier designs used a second emergency cable, but this is now replaced byautomatic brakes, derived from elevator technology, that grasp the running rails when anyexcess speed is detected. Passenger compartments can either be level, with one endsupported by a truss, or they can be sloped, with passenger seating areas arranged in tiers.
Various combinations of track and car styles are illustrated in Exhibit 1-37. Ridershipand other data for known U.S. and Canadian inclined planes are given in Exhibit 1-38.
Many inclined planes are alsoknown as funicular railways.
Inclined plane status.
The person capacity of olderinclined planes is modest, butmodern designs can carry largenumbers of people.

Transit Capacity and Quality of Service Manual
Part 1/INTRODUCTION AND CONCEPTS Page 1-30 Chapter 1— Transit in North America
Exhibit 1-37Inclined Plane Examples
Single Track (Ketchikan, AK) Single Track, Passing Siding (Switzerland)
Single Track, Intermediate Station (Prague) Double Track (Johnstown, PA)
Exhibit 1-38U.S. and Canadian Inclined Planes (1998)(R1,R7)
Location Operator
AverageWeekday
Boardings Track TypeMaximumGrade (%)
PUBLIC TRANSITChattanooga, TN Chattanooga Area RTA 1,100 ST/DT 73Johnstown, PA Cambria County Transit Authority 400 DT 72Pittsburgh, PA Soc. Pres. Duquesne Hts. Incline 1,200 DT 50Pittsburgh, PA Port Authority (Monongahela Incline) 2,400 DT 58
OTHER INCLINED PLANESAltoona, PA Horseshoe Curve Nat’l. Hist. Ldmk. NA SP 37Cañon City, CO Royal Gorge Incline Railway NA NA NACapitola, CA Shadowbrook Restaurant NA ST 57Diablo, WA Seattle City Light NA TR 56Dubuque, IA Fenelon Place Elevator NA DP 64Industry, CA Industry Hills Resort NA SP NAKetchikan, AK Cape Fox Lodge NA ST NALos Angeles, CA Angels Flight Railway Foundation NA DP 33Montréal, QC Funiculaire de la Tour de Montréal NA ST 100Niagara Falls, ON Niagara Parks Commission NA DT 73Québec, QC Funiculaire du Vieux-Québec NA DT 100
Additional sources: Funimag by Michael Azéma, private operator data.NA: not available, ST: single track, SP: single track with passing siding, DT: double track, DP: doubletrack with passing siding, TR: two pairs of tracks, with transverse car. A 100% grade is a 45° slope.

Transit Capacity and Quality of Service Manual
Part 1/INTRODUCTION AND CONCEPTS Page 1-31 Chapter 1— Transit in North America
Monorail
Although often thought of as being relatively modern technology, monorails haveexisted for nearly 100 years. Vehicles either straddle or are suspended from a single rail.Driverless monorails fall into the category of automated guideway transit, but those usedas parts of public transit systems often have drivers and thus form their own category.Exhibit 1-39 illustrates two different kinds of monorails, while Exhibit 1-40 presentsridership and other data for the two U.S. monorails that are part of public transportationsystems.
Exhibit 1-39Monorail Examples
Straddle (Seattle) Suspended (Wuppertal, Germany)
Exhibit 1-40U.S. Public Transit Monorails (1996)(R1,R7)
Location Operator
DirectionalRoute
km (mi)
AverageWeekday
Boardings
VehiclesOperated inMax. Service
Las Vegas RTC of Clark County 2.4 (1.5) NA NASeattle City of Seattle 2.9 (1.8) 8,700 8NA: not available
Aerial Tramway
Aerial tramways (Exhibit 1-41) suspend the car from one aerial cable and pull the carby a separate cable attached to the vehicle suspension system. Aerial tramways aretypically associated with ski resorts, but are also used to carry passengers across obstaclessuch as rivers or narrow canyons, and as aerial rides over zoos and amusement parks. Thelone aerial tramway in the United States used for public transit is in New York City,running from Manhattan to Roosevelt Island. The calculation of the vehicle capacity ofaerial tramways is beyond the scope of this manual (depending greatly on the technologychosen). However, once the vehicle capacity has been determined for a particularapplication, the person capacity procedures presented in this manual are applicable.
When operated by a driver,monorails are not AGT, but theirown category.
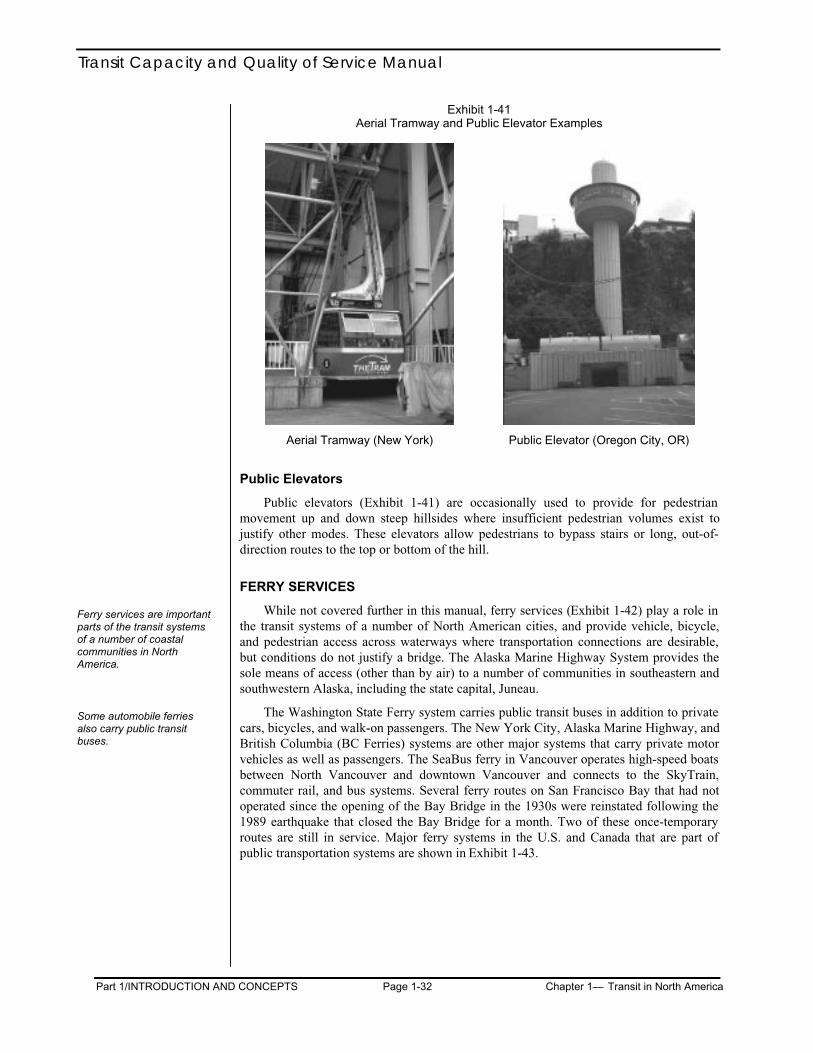
Transit Capacity and Quality of Service Manual
Part 1/INTRODUCTION AND CONCEPTS Page 1-32 Chapter 1— Transit in North America
Exhibit 1-41Aerial Tramway and Public Elevator Examples
Aerial Tramway (New York) Public Elevator (Oregon City, OR)
Public Elevators
Public elevators (Exhibit 1-41) are occasionally used to provide for pedestrianmovement up and down steep hillsides where insufficient pedestrian volumes exist tojustify other modes. These elevators allow pedestrians to bypass stairs or long, out-of-direction routes to the top or bottom of the hill.
FERRY SERVICES
While not covered further in this manual, ferry services (Exhibit 1-42) play a role inthe transit systems of a number of North American cities, and provide vehicle, bicycle,and pedestrian access across waterways where transportation connections are desirable,but conditions do not justify a bridge. The Alaska Marine Highway System provides thesole means of access (other than by air) to a number of communities in southeastern andsouthwestern Alaska, including the state capital, Juneau.
The Washington State Ferry system carries public transit buses in addition to privatecars, bicycles, and walk-on passengers. The New York City, Alaska Marine Highway, andBritish Columbia (BC Ferries) systems are other major systems that carry private motorvehicles as well as passengers. The SeaBus ferry in Vancouver operates high-speed boatsbetween North Vancouver and downtown Vancouver and connects to the SkyTrain,commuter rail, and bus systems. Several ferry routes on San Francisco Bay that had notoperated since the opening of the Bay Bridge in the 1930s were reinstated following the1989 earthquake that closed the Bay Bridge for a month. Two of these once-temporaryroutes are still in service. Major ferry systems in the U.S. and Canada that are part ofpublic transportation systems are shown in Exhibit 1-43.
Ferry services are importantparts of the transit systemsof a number of coastalcommunities in NorthAmerica.
Some automobile ferriesalso carry public transitbuses.
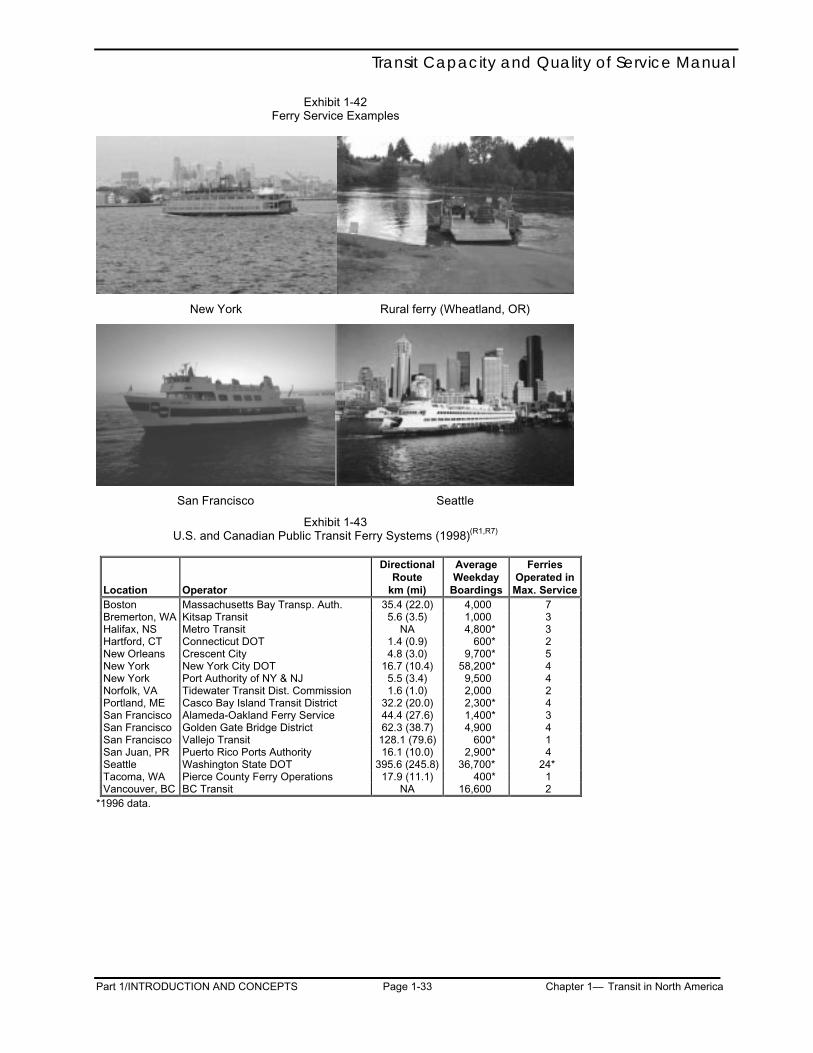
Transit Capacity and Quality of Service Manual
Part 1/INTRODUCTION AND CONCEPTS Page 1-33 Chapter 1— Transit in North America
Exhibit 1-42Ferry Service Examples
New York Rural ferry (Wheatland, OR)
San Francisco Seattle
Exhibit 1-43U.S. and Canadian Public Transit Ferry Systems (1998)(R1,R7)
Location Operator
DirectionalRoute
km (mi)
AverageWeekday
Boardings
FerriesOperated inMax. Service
Boston Massachusetts Bay Transp. Auth. 35.4 (22.0) 4,000 7Bremerton, WA Kitsap Transit 5.6 (3.5) 1,000 3Halifax, NS Metro Transit NA 4,800* 3Hartford, CT Connecticut DOT 1.4 (0.9) 600* 2New Orleans Crescent City 4.8 (3.0) 9,700* 5New York New York City DOT 16.7 (10.4) 58,200* 4New York Port Authority of NY & NJ 5.5 (3.4) 9,500 4Norfolk, VA Tidewater Transit Dist. Commission 1.6 (1.0) 2,000 2Portland, ME Casco Bay Island Transit District 32.2 (20.0) 2,300* 4San Francisco Alameda-Oakland Ferry Service 44.4 (27.6) 1,400* 3San Francisco Golden Gate Bridge District 62.3 (38.7) 4,900 4San Francisco Vallejo Transit 128.1 (79.6) 600* 1San Juan, PR Puerto Rico Ports Authority 16.1 (10.0) 2,900* 4Seattle Washington State DOT 395.6 (245.8) 36,700* 24*Tacoma, WA Pierce County Ferry Operations 17.9 (11.1) 400* 1Vancouver, BC BC Transit NA 16,600 2
*1996 data.

Transit Capacity and Quality of Service Manual
Part 1/INTRODUCTION AND CONCEPTS Page 1-34 Chapter 1— Transit in North America
This page intentionally blank.

Transit Capacity and Quality of Service Manual
Part 1/INTRODUCTION AND CONCEPTS Page 1-35 Chapter 2— General Transit Capacity Concepts
2. TRANSIT CAPACITY AND QUALITY OF SERVICE CONCEPTS
INTRODUCTION
Transit capacity is different than highway capacity: it deals with the movement ofboth people and vehicles; depends on the size of the transit vehicles and how often theyoperate; and reflects the interaction between passenger traffic concentrations and vehicleflow. It depends on the operating policy of the transit agency, which normally specifiesservice frequencies and allowable passenger loadings. Accordingly the traditionalconcepts applied to highway capacity must be adapted and broadened.
While transit capacity issues are mainly concentrated in larger cities, transit quality ofservice— the overall measured or perceived performance of transit service from thepassenger’s point of view— is important to all communities. Transit quality of servicemeasures reflect two important aspects of transit service: (1) the degree to which transitservice is available to given locations, and (2) the comfort and convenience, or quality, ofthe service provided to passengers. Quality of service measures differ from bothtraditional highway service quality measures, which are more vehicle-oriented thanperson-oriented, and from the numerous utilization and economic performance measuresroutinely collected by the transit industry, which tend to reflect the transit operator’spoint-of-view.
CAPACITY
Person Capacity
At the simplest level, transit capacity is determined by the product of transit vehiclecapacity and the maximum frequency with which transit vehicles can pass a givenlocation. The person capacity or passenger-carrying capability for any given transit routecan be defined as “the maximum number of people that can be carried past a givenlocation during a given time period under specified operating conditions withoutunreasonable delay, hazard, or restriction, and with reasonable certainty.” Morespecifically, person capacity depends on the mix of vehicles in the traffic stream,including the number and occupancy of each type of vehicle that can reasonably beexpected to pass a point on a transit route. It is a function of vehicle size, type,occupancy, and headway. The number of transit vehicles along a route reflects the degreeof scheduled service.
Transit Line Capacity
The passenger capacity of a transit line is the product of the number of vehicles perhour (usually past the busiest stop) and the number of passengers that each vehicle cancarry. Four basic factors determine the maximum passenger capacity:
1. the maximum number of vehicles per transit unit (bus, car, train);
2. the passenger capacity of the individual transit vehicles;
3. the minimum possible headway or time spacing between individual vehicles ortrains; and,
4. the number of lanes or passenger loading positions available.
The factors which influence transit capacity are given in Exhibit 1-44. Some of thesefactors affect the number of passengers per unit, while others affect the number of unitsthat can pass a given location within a specified time period.
Capacity basics.
Quality of service measurescontrasted with other transitperformance measures.
Maximum number of people past apoint.

Transit Capacity and Quality of Service Manual
Part 1/INTRODUCTION AND CONCEPTS Page 1-36 Chapter 2— General Transit Capacity Concepts
Exhibit 1-44 Factors That Influence Transit Capacity(R5)
1. Vehicle Characteristics• Allowable number of vehicles per transit unit (i.e., single unit bus, or several
units-cars per train)• Vehicle dimensions• Seating configuration and capacity• Number, location, width of doors• Number and height of steps• Maximum speed• Acceleration and deceleration rates• Type of door actuation control
2. Right-of-Way Characteristics• Cross-section design (i.e., number of lanes or tracks)• Degree of separation from other traffic• Intersection design (at- grade or grade-separated, type of traffic controls)• Horizontal and vertical alignment
3. Stop Characteristics• Spacing (frequency) and duration• Design (on-line or off-line)• Platform height (high level or low level loading)• Number and length of loading positions• Method of fare collection (prepayment, pay when entering vehicle; pay when
leaving vehicle)• Type of fare (single-coin, penny, exact)• Common or separate areas for passenger boarding and alighting• Passenger accessibility to stops
4. Operating Characteristics• Intercity versus suburban operations at terminals• Layover and schedule adjustment practices• Time losses to obtain clock headways or provide driver relief• Regularity of arrivals at a given stop
5. Passenger Traffic Characteristics• Passenger concentrations and distribution at major stops• Peaking of ridership (i.e., peak-hour factor)
6. Street Traffic Characteristics• Volume and nature of other traffic (in shared right-of-way)• Cross traffic at intersections if at-grade
7. Method of Headway Control• Automatic or by driver/trainman• Policy spacing between vehicles
The capacity of a transit line varies along the route. Limitations may occur (a)between stops (i.e., way capacity), (b) at stops or stations (i.e., station capacity), (c) atmajor intersections with cross traffic, or (d) at terminals (station capacity).
Transit line capacity is generally governed by the critical stops where majorpassenger boarding or alighting takes place, or where vehicles terminate or turn around.This is similar to estimating arterial street capacity based on critical intersections along aroute. Sometimes, however, outlying rail transit terminals limit system capacity due toheavy passenger boardings, and track configurations or operating practices that limit trainturnarounds.
In many cases the design capacity of a transit route will not be achieved in actualoperation. Frequently this is a result of resource limitations which mean that not enoughtransit vehicles are available to provide the maximum possible design capacity. In manycases there simply might not be sufficient passenger demand to justify operation at thedesign capacity. The net result either way is that the service frequency operated is belowthat which is theoretically possible.
Transit Capacity and Quality of Service Manual
Part 1/INTRODUCTION AND CONCEPTS Page 1-37 Chapter 2— General Transit Capacity Concepts
The following considerations are important:
1. The maximum rate of passenger flow is usually constrained by such factors asacceptable levels of passenger comfort, the presence of other traffic sharing thesame right-of-way, and safety considerations. Therefore, transit operatorsgenerally are more concerned with the realistic rates of flow that can be achievedby different modes, rather than with physical capacity in the theoretical sense.
2. Operations at “capacity” tend to strain transit systems, and do not representdesirable operating conditions. Moreover, most North American transit systemsoperate at capacity for a relatively short period of time, if at all.
3. Capacity relates closely to system performance and service quality in terms ofspeed, comfort, and service reliability. A single fixed number often can bemisleading. The concept of “productive capacity,” the product of passenger flowand speed, provides an important index of system efficiency.(R20)
4. Capacities obtained by analytical methods must be cross-checked against actualoperating experience for reasonableness.
Loading Diversity
The temporal and spatial distribution of transit passengers often prevents transitcapacity from being fully utilized for the duration of the peak period. In the temporalsense, peaks within the peak period occur at major work start and finish times and canresult in brief periods of operation at capacity followed by under capacity operation.Short-term fluctuations in ridership demand must be considered to avoid unacceptablepassenger queuing or overcrowding. Variations in arrival patterns and dwell times at stopswill tend to reduce capacity. Temporal diversity can be accommodated in capacitycalculations through the use of a peak hour factor, as will be described later.
Spatial diversity can be manifested in a number of ways, from boarding and alightinglocations at the macro scale to the distribution of passengers within the vehicle at themicro scale. A transit line with a relatively uniform distribution of boarding passengersamong stops will usually have a higher capacity than one where passenger boarding isconcentrated at a single stop. Loading is often uneven between cars in a single train orbetween buses operating together on a single route.
Economic Constraints
Economic factors often constrain capacity at a level below what is technicallyfeasible and suggested by passenger demand. Typically, this takes the form of a shortageof vehicles to supply service on a given route, resulting in passengers being left behindand crowding conditions which deter would-be riders. A survey of rail transit systems(R15)
found that the passing up of waiting passengers was relatively rare except on somesubway lines in New York City and Toronto, and occasionally on the SkyTrain inVancouver. However, in the New York and Toronto cases trains were being operated atclose to the minimum headway so the constraint was not so much economic, barring theconstruction of new subway lines or extending platforms, but technical. In the Vancouvercase, passengers would voluntarily wait for a less crowded train, indicating that crowdingconditions were at least partially avoidable. Systems in other cities, such as Portland,Oregon, indicated that their available capacity was constrained by a shortage of cars andthat this capacity shortfall was discouraging new ridership on the light rail line.
Agency Policies
Transit agency policies can influence capacity levels by dictating policy headwaysand vehicle loading standards. Policies are often set to ensure that scheduled serviceoperates below capacity in order to provide a higher degree of passenger comfort. Thiscan be manifested in the form of more frequent service or the use of larger vehicles than
Passenger demand is uneven,spread out over both time andspace.
Transit operators’ economicrealities can constrain capacity to alevel below that suggested bypassenger demand.

Transit Capacity and Quality of Service Manual
Part 1/INTRODUCTION AND CONCEPTS Page 1-38 Chapter 2— General Transit Capacity Concepts
would be the case with lighter loading standards. Such policies can be the result of safetydecisions, such as the banning of standees on buses operating on freeways, or a desire toensure that the transit system remains attractive to new riders. The latter justification isespecially important where transit is unable to provide a large travel time saving to thecommuter and so must compete more directly with the automobile in comfort.
QUALITY OF SERVICE
Quality of service reflects the kinds of decisions a potential passenger makes,consciously or not, when deciding to whether to use transit or another mode, usually theprivate automobile. There are two parts to this decision process: (1) assessing whethertransit is even an option for the trip, and if so, (2) comparing the comfort and convenienceof transit to competing modes.
Transit Availability
Unlike the automobile mode, which has near-universal access to locations, and (forthose who own an automobile) provides the ability to be used for trips at any desired time,transit service is limited to specific areas and specific times. Further, transit service isusually not available to one’s door, so a potential transit passenger must find a way to getto a location served by transit. As a result, the availability of transit service is a criticalissue in one’s decision to use transit.
There are a number of conditions that affect transit availability, all of which need tobe met for transit to be an option for a particular trip:
• Transit must be provided near one’s trip origin. If demand-responsive service isnot provided to one’s door, a transit stop must be located within walkingdistance and the pedestrian environment in the area should not discouragewalking (e.g., due to lack of sidewalks, steep grades, or wide or busy streets).Alternatively, one may be able to ride a bicycle to a transit stop if bicycle storagefacilities are available at the stop or if bicycles can be carried on transit vehicles.One may also be able to drive to a park-and-ride facility if one is provided alongthe way and space is available in the parking lot.
• Transit must be provided near one’s destination. The same kinds of factorsdiscussed for the trip origin apply to the trip destination as well, except thatbicycles or automobiles left behind at the boarding transit stop will not beavailable to passengers at their destination.
• Transit must be provided at or near the times required. In most cases, servicemust be available for both halves of a round trip— from one’s origin to one’sdestination, as well as for the return trip. If passengers perceive a risk of missingthe final return trip of the day, or if transit is available for only one of the twohalves of passengers’ round trip, transit is not likely to be an option for thosepassengers.
• Passengers must be able to find information on when and where transit serviceis provided and how to use transit. If passengers are unable to find out where togo to board transit, where they need to transfer, etc., transit will again not be anoption.
• Sufficient capacity must be provided. If a transit vehicle must pass up passengerswaiting at a stop, transit service was not available to those waiting passengers atthat time.
If all of these conditions are met, transit is an option for a particular trip. Whether ornot a passenger will decide to use transit will depend on the quality of the service relativeto competing modes.

Transit Capacity and Quality of Service Manual
Part 1/INTRODUCTION AND CONCEPTS Page 1-39 Chapter 2— General Transit Capacity Concepts
Transit Quality
Unlike transit availability, the kinds of questions weighed by potential passengerswhen assessing the comfort and convenience of transit service are not necessarily all-or-nothing. Each person assesses the factors that enter into transit quality differently,depending on their own needs and situation. A passenger’s decision to use transit ratherthan a competing mode (when transit is an option) will depend on how well transit servicequality compares with that of competing modes.
Some of the more important factors that affect transit quality are the following:
• Passenger loads on-board transit vehicles. It is more uncomfortable to stand forlong periods of time and the time spent standing cannot be used for moreproductive or relaxing purposes, such as reading.
• The kinds of passenger amenities provided at transit stops.
• The reliability of transit service. Are passengers assured of getting to theirdestinations at the promised time, or must they allow extra time for frequentschedule irregularities?
• Door-to-door travel times, relative to other modes.
• The out-of-pocket cost of using transit, relative to other modes.
• Passengers’ perceptions of safety and security at transit stops, on-board vehicles,and walking to and from transit stops.
• Whether transfers are required to complete a trip.
• The appearance and comfort of transit facilities.
Quality of Service Framework
This manual presents six measures of transit quality of service: three measures of thespatial and temporal availability of transit and three measures of passenger comfort andconvenience. Depending on the application, these service measures can be usedindividually to assess transit quality of service for a transit stop, route segment, or system,or they can be combined into a transit “report card” to provide a broader perspective. Asnot every factor that affects transit quality of service can be accounted for by these sixservice measures, it is important for planners and analysts not to lose sight of the broaderissues that influence transit quality of service by concentrating solely on calculations oflevel of service.
Transit Capacity and Quality of Service Manual
Part 1/INTRODUCTION AND CONCEPTS Page 1-40 Chapter 2— General Transit Capacity Concepts
This page intentionally blank.

Transit Capacity and Quality of Service Manual
Part 1/INTRODUCTION AND CONCEPTS Page 1-41 Appendix A—Rail Route Characteristics
3. REFERENCES
1. American Public Transit Association, Transit Fact Book, APTA, Washington, DC(1998).
2. Barton Aschman Associates, Milwaukee Central Area Distribution System, Chicago,IL.
3. Blake, H.W. and W. Jackson, Electric Railway Transportation, McGraw-Hill BookCompany, New York, NY (1924).
4. Bureau of Transportation Statistics, National Transportation Statistics, 1996, U.S.Department of Transportation, Washington, DC (1996).
5. Canadian Urban Transit Association, Summary of Canadian Transit Statistics—1995Data, CUTA, Toronto, Ontario (1996).
6. Danaher, Alan, Tom Parkinson, Paul Ryus, and Lewis Nowlin, “TCRP A-15Development of Transit Capacity and Quality of Service Principles, Practices, andProcedures,” Interim Report, available on loan from the Transit CooperativeResearch Program, Transportation Research Board, Washington, DC (1997).
7. Federal Transit Administration, National Transit Database, U.S. Department ofTransportation, Washington, DC (1998).
8. Fuhs, Charles H., “Preferential Lane Treatments for High-Occupancy Vehicles,”NCHRP Synthesis of Highway Practice 185, Transportation Research Board,Washington, DC (1993).
9. “Highway Capacity Manual,” Special Report 209, Transportation Research Board,Washington, DC (1985).
10. Hilton, George W., The Cable Car in America, Revised Edition, Stanford UniversityPress, Stanford, CA (1997).
11. Levinson, H.S., et al., “Bus Use of Highways—State of the Art,” NCHRP Report143, Transportation Research Board, Washington, DC (1973).
12. Levinson, H.S., C.L. Adams, and W.F. Hoey, “Bus Use of Highways—Planning andDesign Guidelines,” NCHRP Report 155 (1975).
13. Levinson, Herbert S. and Kevin R. St. Jacques, “Bus Capacity Revisited,” Preprint100, presented at the Transportation Research Board 1998 Annual Meeting.
14. New York Metropolitan Transportation Council, Hub-Bound Travel 1995, NewYork, NY (1997).
15. Parkinson, Tom and Ian Fisher, “Rail Transit Capacity,” TCRP Report 13,Transportation Research Board (1996).
16. Reyes, Joseph, Hub-Bound Travel 1992, New York Metropolitan TransportationCouncil, New York, NY (1993).
17. St. Jacques, Kevin and Herbert S. Levinson, “Operational Analysis of Bus Lanes onArterials,” TCRP Report 26, Transportation Research Board, Washington, DC(1997).
18. Soberman, R.M. and H.A. Hazard (editors), Canadian Transit Handbook, Universityof Toronto and York University, Joint Program in Transportation, Toronto, Ontario(1980).

7UDQVLW�&DSDFLW\�DQG�4XDOLW\�RI�6HUYLFH�0DQXDO
Part 1/INTRODUCTION AND CONCEPTS Page 1-42 Appendix A—Rail Route Characteristics
19. Texas Transportation Institute, Parsons Brinckerhoff Quade and Douglas, Inc., andPacific Rim Resources, Inc., “HOV Systems Manual,” NCHRP Report 414,Transportation Research Board, Washington, DC (1998).
20. Vuchic, V.R., Urban Public Transportation: Systems and Technology, Prentice-Hall,Inc., Englewood Cliffs, NJ (1981).

7UDQVLW�&DSDFLW\�DQG�4XDOLW\�RI�6HUYLFH�0DQXDO
Part 1/INTRODUCTION AND CONCEPTS Page 1-43 Appendix A—Rail Route Characteristics
APPENDIX A. RAIL ROUTE CHARACTERISTICS
Exhibit 1-451995 Light Rail Route Characteristics and Ridership(R15)
/HQJWK�LQ 5LGHUVKLS 3HDN�+RXU
6\VWHP 5RXWH NP��PL� 6WDWLRQV �$YJ��ZHHNGD\� 3DVV� 7UDLQV &DUV
%L�6WDWH 0HWUR/LQN ����������� �� ������&76 �����1:�6RXWK� ����������� �� ������ ����� �� ��&76 �����1RUWKHDVW� ���������� �� ������ ����� �� ��'HQY��57' ��� ��������� �� ������ �����(76 ��� ���������� �� ������ �����*&57$ ��$;��6KDNHU� ��*&57$ ��;��9DQ�$NHQ� ��/$&07$ %OXH�/LQH ����������� �� ������ ����� � ��0%7$ %�%RVWRQ�&ROOHJH ���������� �� ������0%7$ &�&OHYHODQG�&LUF� ��������� �� ������0%7$ '�5LYHUVLGH ����������� �� ������0%7$ (�+HDWK�6W� ��������� �� ������0%7$ 0DWWDSDQ ��������� � �����0HWURUUH\ 0HWURUUH\ ����������� ��07$ /LJKW�5DLO ������������ �� ������1)7$ 0HWUR�5DLO ���������� �� ������1-7 ��&LW\�6XEZD\ �������� �� ������ �����3$7 ��/�/LEUDU\ ���������� �� �����3$7 ��6�6RXWK�+LOOV ����������� �� ������57$���1�2� ���6W��&KDUOHV ����������57$���1�2� 5LYHUIURQW ��������� ��6&&7$ /LJKW�5DLO ����������� �� ������6'7 (DVW ����������� �� ������6'7 6RXWK ����������� �� ������6'7(2 ��1RUWK�6RXWK ���������� �� ������6'7(2 ��(DVW�:HVW ��������� ��6(37$ ���2YHUEURRN ��������� ������ ���6(37$ ���'DUE\ ���������� ������ ���6(37$ ���'DUE\��<HDGRQ ���������� ������ �����6(37$ ���$QJRUD ��������� ������ �����6(37$ ���(DVWZLFN ���������� ������ ���6(37$ ����1RUULVWRZQ ����������� �� ����� ��� �6(37$ ����0HGLD ���������� �� ����� ��� �� ��6(37$ ����6KDURQ�+LOO ���������� �� ����� ��� � �6)�0XQL -�&KXUFK ���������� ������6)�0XQL .�,QJOHVLGH ���������� ������6)�0XQL /�7DUDYDO ���������� ������6)�0XQL 0�2FHDQ�9LHZ ���������� ������6)�0XQL 1�-XGDK ���������� ������657' 57 ����������� �� ������ �����7UL�0HW (DVWVLGH�0$; ����������� �� ������ ����� � ��77& ����4XHHQ ����������� ������ �����77& ����'RZQWRZQHU ��������� ����� ���77& ����.LQJVWRQ�5G� ��������� ����� ���77& ����.LQJ ���������� ������ �����77& ����'XQGDV ���������� ������ ���77& ����&DUOWRQ ���������� ������ �����77& ����/RQJ�%UDQFK ��������� ����� ���77& ����%DWKXUVW ��������� ������ ���77& ����6W��&ODLU ��������� ������ �����77& ����+DUERXUIURQW ��������� � ����� ���
NOTES: Bi-State = St. Louis, MO; CTS = Calgary Transit; ETS = Edmonton Transit; GCRTA =Cleveland, OH; LACMTA = Los Angeles; MBTA = Boston; Metrorrey = Monterrey, Mexico;MTA = Baltimore; NFTA = Buffalo; NJT = Newark, NJ; PAT = Pittsburgh; RTA-N.O. = NewOrleans; SCCTA = San Jose, CA; SDT = San Diego; SDTEO = Guadalajara, Mexico;SEPTA = Philadelphia; SF Muni = San Francisco; SRTD = Sacramento; Tri-Met =Portland, Oregon; TTC = Toronto.
Most Toronto streetcar lines serve subway stations at their outer ends and run throughdowntown, giving them effectively four peak points per line. They also serve many shorttrips and have high off-peak use. This accounts for the exceptionally low ratio of peak hourto daily ridership.
Between the time the table was compiled and this manual was published, Portland, SanDiego, and San Francisco opened new light rail extensions. Therefore, data may notalways match Exhibit 1-22.

7UDQVLW�&DSDFLW\�DQG�4XDOLW\�RI�6HUYLFH�0DQXDO
Part 1/INTRODUCTION AND CONCEPTS Page 1-44 Appendix A—Rail Route Characteristics
Exhibit 1-461995 Heavy Rail Route Characteristics and Ridership(R15)
/HQJWK�LQ 5LGHUVKLS 3HDN�+RXU
6\VWHP 5RXWH NP��PL� 6WDWLRQV ��$YJ��ZHHNGD\� 3DVV� 7UDLQV &DUV
%$57 &RQFRUG�'DO\�&LW\ ����������� �� ����� � ��%$57 )UHPRQW�'DO\�&LW\ ���������� �� ����� � ��%$57 )UHPRQW�5LFK� ����������� �� ����� � ��%$57 5LFKPRQG�'DO\�&� ����������� �� ����� � ��%&7 6N\7UDLQ ����������� �� ������� ����� �� ���&7$ %OXH ����������� �� ������� �����&7$ %URZQ ����������� �� ������ �����&7$ *UHHQ ����������� �� ������ �����&7$ 2UDQJH ����������� �� ������ �����&7$ 3XUSOH ����������� �� ������ �����&7$ 5HG ����������� �� ������� ������&7$ <HOORZ ��������� � �����*&57$ ��; ����������� ��/$&07$ 5HG ��������� � ������0$57$ (DVW�:HVW ����������� �� ������ ����� � ��0$57$ 1RUWK�6RXWK ����������� �� ������� ����� � ��0%7$ %OXH ��������� �� ������ �����0%7$ 2UDQJH ����������� �� ������� �����0%7$ 5HG ����������� �� ������� �����0'7$ 0HWURUDLO ����������� �� ������ �����07$ 0HWUR ����������� �� ������1<&7 ���� ����������� �� ������ �� ���1<&7 � ����������� �� ������ �� ���1<&7 � ������������ �� ������ �� ��1<&7 � ����������� �� ������ �� ���1<&7 � ����������� �� ������ �� ���1<&7 � ����������� �� ������ �� ���1<&7 � ���������� �� ������ �� ���1<&7 $ ����������� �� ������ �� ���1<&7 % ����������� �� ������ � ��1<&7 & ����������� �� ����� � ��1<&7 ' ����������� �� ������ �� ��1<&7 ( ����������� �� ������ �� ���1<&7 ) ����������� �� ������ �� ���1<&7 )UDQNOLQ�6KXWWOH ��������� �1<&7 * ����������� �� ����� � ��1<&7 ��QG�6W��6KXWWOH ��������� � ����� ���1<&7 + ����������1<&7 -��= ����������� �� ������ �� ���1<&7 / ����������� �� ������ �� ���1<&7 0 ����������� �� ����� � ��1<&7 1 ����������� �� ������ �� ���1<&7 4 ����������� �� ������ � ��1<&7 5 ����������� �� ������ �� ��3$7&2 3$7&2 ����������� �� ������ �����3$7+ +RERNHQ�����UG ��������� � ������ ����� �� ��3$7+ +RERNHQ���:7& ��������� � ������ ����� �� ��3$7+ -RXUQDO�6T������UG ��������� � ������ ����� � ��3$7+ 1HZDUN���:7& ���������� � ������ ������ �� ���6(37$ %OXH��0NW���)UDQN� ����������� �� �������6(37$ 2UDQJH��%URDG� ����������� �� �������6,5 6WDWHQ�,VODQG�5O\� ����������� �� ������67& � ����������� �� ��������� ������ �� ���67& � ����������� �� ��������� ������ �� ���67& � ����������� �� ������� ������ �� ���67& � ���������� �� ������� ������ �� ���67& � ���������� �� ������� ������ �� ���67& � ����������� �� ������� ������ �� ���67& � ���������� �� ������� ������ �� ���67& $ ����������� �� ������� ������ �� ���67&80 ���*UHHQ� ����������� �� ������� ������67&80 ���2UDQJH� ����������� �� ������� ������67&80 ���<HOORZ� ��������� � ������ ������67&80 ���%OXH� ��������� �� ������ �����77& ����%�' ����������� �� ������� ������77& ����<�8�6 ����������� �� ������� ������ �� ���77& ����657 ��������� � ������ �����
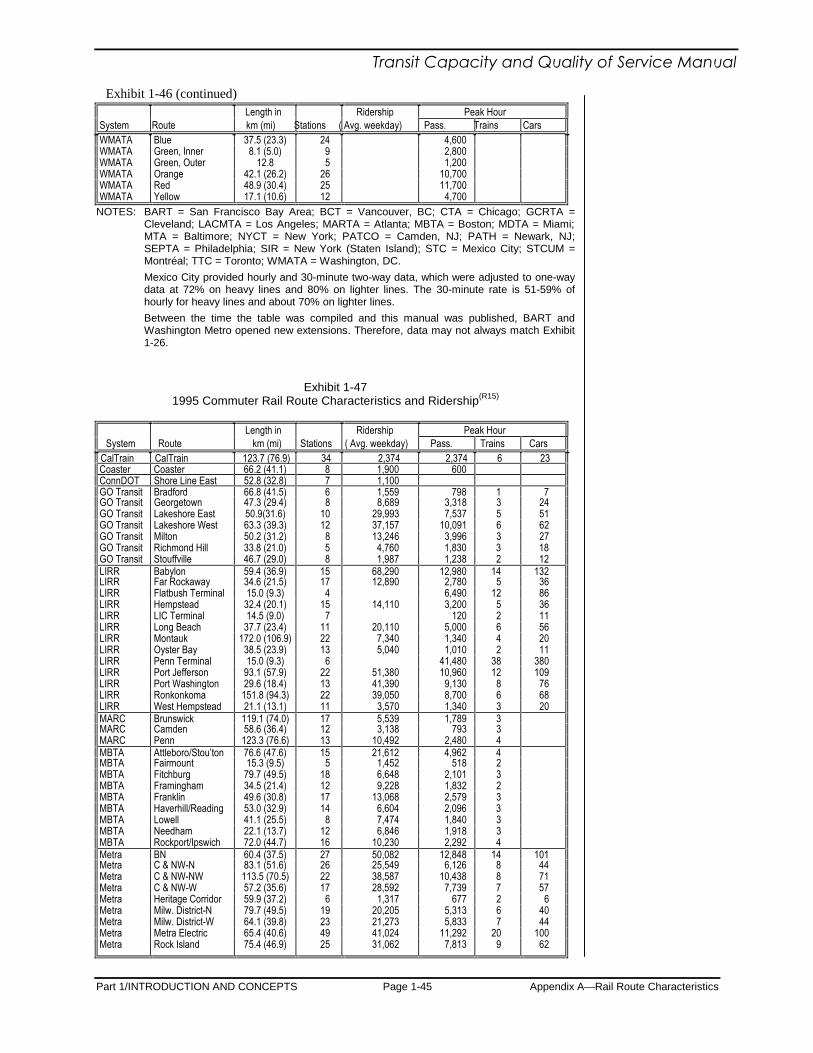
Transit Capacity and Quality of Service Manual
Part 1/INTRODUCTION AND CONCEPTS Page 1-45 Appendix A—Rail Route Characteristics
Length in Ridership Peak HourSystem Route km (mi) Stations ( Avg. weekday) Pass. Trains CarsWMATA Blue 37.5 (23.3) 24 4,600WMATA Green, Inner 8.1 (5.0) 9 2,800WMATA Green, Outer 12.8 5 1,200WMATA Orange 42.1 (26.2) 26 10,700WMATA Red 48.9 (30.4) 25 11,700WMATA Yellow 17.1 (10.6) 12 4,700
NOTES: BART = San Francisco Bay Area; BCT = Vancouver, BC; CTA = Chicago; GCRTA =Cleveland; LACMTA = Los Angeles; MARTA = Atlanta; MBTA = Boston; MDTA = Miami;MTA = Baltimore; NYCT = New York; PATCO = Camden, NJ; PATH = Newark, NJ;SEPTA = Philadelphia; SIR = New York (Staten Island); STC = Mexico City; STCUM =Montréal; TTC = Toronto; WMATA = Washington, DC.
Mexico City provided hourly and 30-minute two-way data, which were adjusted to one-waydata at 72% on heavy lines and 80% on lighter lines. The 30-minute rate is 51-59% ofhourly for heavy lines and about 70% on lighter lines.
Between the time the table was compiled and this manual was published, BART andWashington Metro opened new extensions. Therefore, data may not always match Exhibit1-26.
Exhibit 1-471995 Commuter Rail Route Characteristics and Ridership(R15)
Length in Ridership Peak HourSystem Route km (mi) Stations ( Avg. weekday) Pass. Trains Cars
CalTrain CalTrain 123.7 (76.9) 34 2,374 2,374 6 23Coaster Coaster 66.2 (41.1) 8 1,900 600ConnDOT Shore Line East 52.8 (32.8) 7 1,100GO Transit Bradford 66.8 (41.5) 6 1,559 798 1 7GO Transit Georgetown 47.3 (29.4) 8 8,689 3,318 3 24GO Transit Lakeshore East 50.9(31.6) 10 29,993 7,537 5 51GO Transit Lakeshore West 63.3 (39.3) 12 37,157 10,091 6 62GO Transit Milton 50.2 (31.2) 8 13,246 3,996 3 27GO Transit Richmond Hill 33.8 (21.0) 5 4,760 1,830 3 18GO Transit Stouffville 46.7 (29.0) 8 1,987 1,238 2 12LIRR Babylon 59.4 (36.9) 15 68,290 12,980 14 132LIRR Far Rockaway 34.6 (21.5) 17 12,890 2,780 5 36LIRR Flatbush Terminal 15.0 (9.3) 4 6,490 12 86LIRR Hempstead 32.4 (20.1) 15 14,110 3,200 5 36LIRR LIC Terminal 14.5 (9.0) 7 120 2 11LIRR Long Beach 37.7 (23.4) 11 20,110 5,000 6 56LIRR Montauk 172.0 (106.9) 22 7,340 1,340 4 20LIRR Oyster Bay 38.5 (23.9) 13 5,040 1,010 2 11LIRR Penn Terminal 15.0 (9.3) 6 41,480 38 380LIRR Port Jefferson 93.1 (57.9) 22 51,380 10,960 12 109LIRR Port Washington 29.6 (18.4) 13 41,390 9,130 8 76LIRR Ronkonkoma 151.8 (94.3) 22 39,050 8,700 6 68LIRR West Hempstead 21.1 (13.1) 11 3,570 1,340 3 20MARC Brunswick 119.1 (74.0) 17 5,539 1,789 3MARC Camden 58.6 (36.4) 12 3,138 793 3MARC Penn 123.3 (76.6) 13 10,492 2,480 4MBTA Attleboro/Stou’ton 76.6 (47.6) 15 21,612 4,962 4MBTA Fairmount 15.3 (9.5) 5 1,452 518 2MBTA Fitchburg 79.7 (49.5) 18 6,648 2,101 3MBTA Framingham 34.5 (21.4) 12 9,228 1,832 2MBTA Franklin 49.6 (30.8) 17 13,068 2,579 3MBTA Haverhill/Reading 53.0 (32.9) 14 6,604 2,096 3MBTA Lowell 41.1 (25.5) 8 7,474 1,840 3MBTA Needham 22.1 (13.7) 12 6,846 1,918 3MBTA Rockport/Ipswich 72.0 (44.7) 16 10,230 2,292 4Metra BN 60.4 (37.5) 27 50,082 12,848 14 101Metra C & NW-N 83.1 (51.6) 26 25,549 6,126 8 44Metra C & NW-NW 113.5 (70.5) 22 38,587 10,438 8 71Metra C & NW-W 57.2 (35.6) 17 28,592 7,739 7 57Metra Heritage Corridor 59.9 (37.2) 6 1,317 677 2 6Metra Milw. District-N 79.7 (49.5) 19 20,205 5,313 6 40Metra Milw. District-W 64.1 (39.8) 23 21,273 5,833 7 44Metra Metra Electric 65.4 (40.6) 49 41,024 11,292 20 100Metra Rock Island 75.4 (46.9) 25 31,062 7,813 9 62
Exhibit 1-46 (continued)

7UDQVLW�&DSDFLW\�DQG�4XDOLW\�RI�6HUYLFH�0DQXDO
Part 1/INTRODUCTION AND CONCEPTS Page 1-46 Appendix A—Rail Route Characteristics
/HQJWK�LQ 5LGHUVKLS 3HDN�+RXU
6\VWHP 5RXWH NP��PL� 6WDWLRQV ��$YJ��ZHHNGD\� 3DVV� 7UDLQV &DUV
0HWUD 6RXWK 6KRUH ����� ������ �� ������ ����� � ��0HWUD 6RXWKZHVW�6HUYLFH ����������� � ����� ����� � ��0HWUR�1RUWK +DUOHP ������������ �� ������ ������ �� ���0HWUR�1RUWK +XGVRQ ������������ �� ������ ����� �� ��0HWUR�1RUWK 1HZ�+DYHQ ������������� �� ������ ������ �� ���0HWUR�1RUWK :DWHUEXU\�%UDQFK ����������� � ���1,&7' 6RXWK�6KRUH ������������ �� ������ ����� � ��1-7 $WODQWLF�&LW\ ������������ � ����� ��� �1-7 %RRQWRQ�/LQH ����������� �� ����� ����� �1-7 0DLQ�%HUJHQ�/LQH ������������ �� ������ ����� ��1-7 0RQWFODLU ����������� � ����� ��� �1-7 0RUULV��(VVH[ ����������� �� ������ ����� ��1-7 1��-HUVH\�&RDVW ������������ �� ������ ����� �1-7 1RUWKHDVW�&RUULGRU ����������� �� ������ ����� �1-7 3DVFDFN�9DOOH\ ����������� �� ����� ����� �1-7 5DULWDQ�9DOOH\ ����������� �� ������ ����� �6&55$ 2UDQJH�&RXQW\ ������������ � ����� ��� �6&55$ 5LYHUVLGH ����������� � ����� ��� �6&55$ 6DQ�%HUQDUGLQR ����������� �� ����� ����� �6&55$ 6DQWD�&ODULWD ������������ � ����� ��� �6&55$ 9HQWXUD�&RXQW\ ������������ �� ����� ��� �6(37$ 5� ����������� �� ����� ��� �6(37$ 5� ����������� �� ������ ����� �6(37$ 5� ����������� �� ������ ����� �6(37$ 5� ������������ �� ������ ����� �6(37$ 5� ����������� �� ����� ��� �6(37$ 5� ����������� �� ������ ����� �6(37$ 5� ����������� �� ����� ��� �67&80 'HX[�0RQWDJQHV ����������� �� ������ �����67&80 'RULRQ�5LJDXG ����������� �� ������ �����7UL�5DLO 7UL�5DLO ������������ �� ����� ��� �95( )UHGULFNVEXUJ ����������� �� ����� ����� �95( 0DQDVVDV ����������� �� ����� ��� �
NOTES: CalTrain = San Francisco/San Jose; Coaster = San Diego; Conn DOT = New Haven, CT;GO Transit = Toronto; LIRR = New York (Long Island Rail Road); MARC = Baltimore;MBTA = Boston; Metra = Chicago; Metro-North = New York (Metro North Railroad); NICTD= Chicago; NJT = New Jersey Transit; SCRRA = Los Angeles; SEPTA = Philadelphia;STCUM = Montréal; Tri-Rail = Miami; VRE = Washington, DC.
Between the time the table was compiled and this manual was published, AltamontCommuter Express (San Jose) commenced operations.
Exhibit 1-47 (continued)
Related Documents