Transit and Bus Committee Meeting January 2021 At a special ceremony on December 21, NYCT Interim President Sarah Feinberg announced how the MTA will pay tribute to the late Garrett Goble, the train operator who was tragically killed during an arson attack while operating a 2 line train on March 27. Goble will be honored at the station he grew up using, Flatbush Av-Brooklyn College, with plans for a memorial plaque and the commissioning of artwork inside the station. H. Mihaltses (Chair) V. Calise (Vice Chair) A. Albert J. Barbas N. Brown L. Cortès-Vàzquez R. Glucksman Committee Members D. Jones L. Lacewell R. Linn D. Mack R. Mujica J. Samuelsen L. Schwartz

Welcome message from author
This document is posted to help you gain knowledge. Please leave a comment to let me know what you think about it! Share it to your friends and learn new things together.
Transcript
Transit and Bus Committee Meeting
January 2021
At a special ceremony on December 21, NYCT Interim President Sarah Feinberg announced how the MTA will pay tribute to the late Garrett Goble, the train operator who was tragically killed during an arson attack while operating a 2 line train on March 27. Goble will be honored at the station he grew up using, Flatbush Av-Brooklyn College, with plans for a memorial plaque and the commissioning of artwork inside the station.
H. Mihaltses (Chair)
V. Calise (Vice Chair)
A. AlbertJ. BarbasN. Brown
L. Cortès-VàzquezR. Glucksman
Committee Members D. Jones
L. LacewellR. LinnD. MackR. Mujica
J. SamuelsenL. Schwartz
New York City Transit and Bus Committee Meeting 2 Broadway, 20th Floor Board Room
New York, NY 10004 Thursday, 1/21/2021
10:00 AM - 5:00 PM ET
1. PUBLIC COMMENT PERIOD
2. Summary of ActionsSummary of Actions - Page 4
3. APPROVAL OF MINUTES – December 16, 2020Meeting Minutes - December 16, 2020 - Page 5
4. APPROVAL OF WORK PLANProposed 2021 Work Plan - Page 6
5. PRESIDENT'S REPORT
a. Customer Service Report
i. Subway ReportSubway Report - Page 14
ii. NYCT, MTA Bus ReportBus Report - Page 41
iii. Paratransit ReportParatransit Report - Page 63
iv. Accessibility UpdateAccessibility Update - Page 77
v. Strategy and Customer Experience ReportStrategy & Customer Experience Report - Page 79
b. Safety ReportSafety Report - Page 85
c. Crime ReportCrime Report - Page 90
d. NYCT, SIR, MTA Bus Financial and Ridership ReportsNYCT, SIR and MTA Bus Financial and Ridership Report (December Data) - Page 98 NYCT, SIR and MTA Bus Financial and Ridership Report (November Data) - Page 150
e. Capital Program Status ReportCapital Program Status Report - Page 205
6. PROCUREMENTS
Procurement Cover, Staff Summary and Resolution - Page 211
a. Non-Competitive Non-Competitive - Page 216
b. Competitive Competitive - Page 219
c. Ratifications (none)
d. C&D ProcurementsC&D Procurements - Page 222
7. OUTSTANDING BUSINESS (No Materials)
8. EXECUTIVE OFFICE CONTACT INFORMATIONContact Page - Page 228
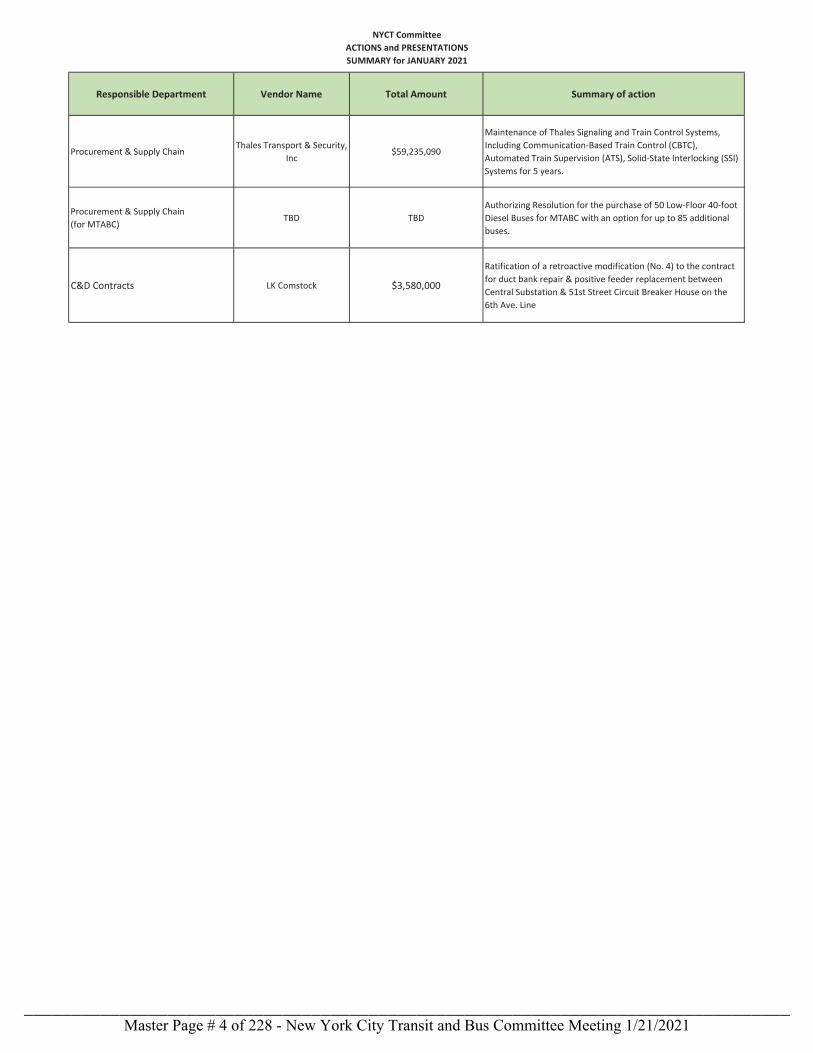
NYCT CommitteeACTIONS and PRESENTATIONS SUMMARY for JANUARY 2021
Responsible Department Vendor Name Total Amount Summary of action
Procurement & Supply Chain Thales Transport & Security, Inc
$59,235,090
Maintenance of Thales Signaling and Train Control Systems, Including Communication-Based Train Control (CBTC), Automated Train Supervision (ATS), Solid-State Interlocking (SSI) Systems for 5 years.
Procurement & Supply Chain(for MTABC) TBD TBD
Authorizing Resolution for the purchase of 50 Low-Floor 40-foot Diesel Buses for MTABC with an option for up to 85 additional buses.
C&D Contracts LK Comstock $3,580,000
Ratification of a retroactive modification (No. 4) to the contract for duct bank repair & positive feeder replacement between Central Substation & 51st Street Circuit Breaker House on the 6th Ave. Line
Master Page # 4 of 228 - New York City Transit and Bus Committee Meeting 1/21/2021________________________________________________________________________________
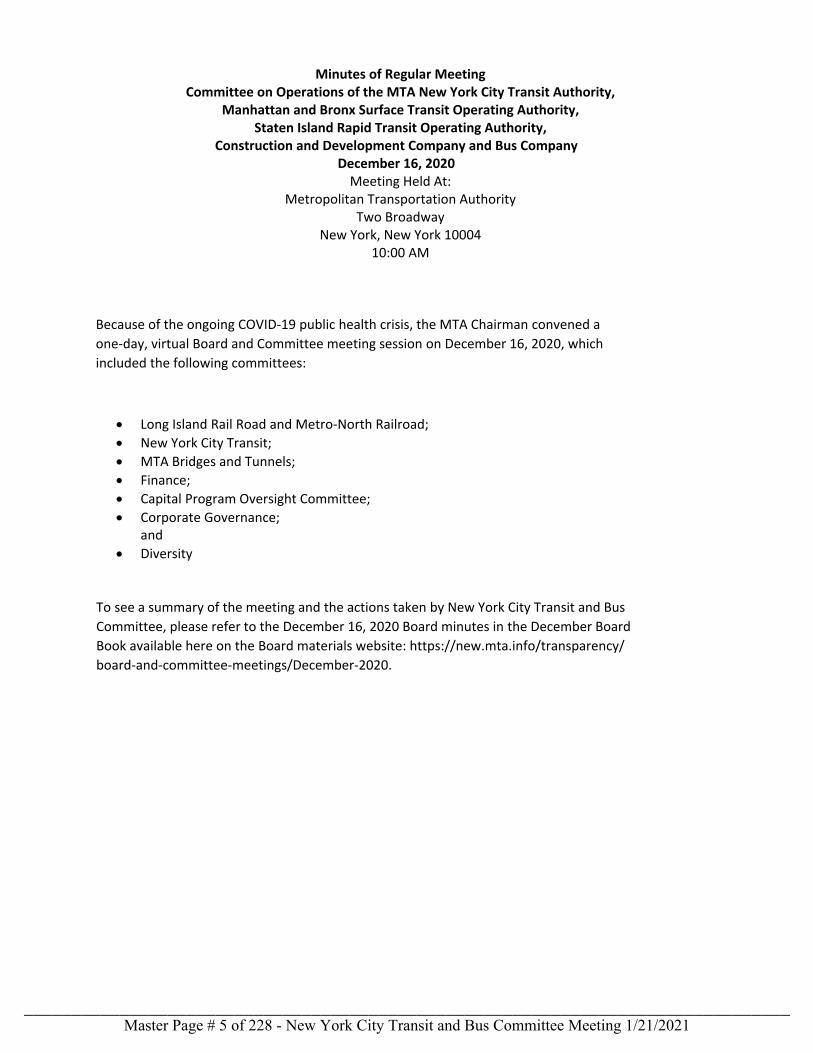
Minutes of Regular Meeting Committee on Operations of the MTA New York City Transit Authority,
Manhattan and Bronx Surface Transit Operating Authority, Staten Island Rapid Transit Operating Authority,
Construction and Development Company and Bus Company December 16, 2020
Meeting Held At: Metropolitan Transportation Authority
Two Broadway New York, New York 10004
10:00 AM
Because of the ongoing COVID-19 public health crisis, the MTA Chairman convened a one-day, virtual Board and Committee meeting session on December 16, 2020, which included the following committees:
• Long Island Rail Road and Metro-North Railroad;• New York City Transit;• MTA Bridges and Tunnels;• Finance;• Capital Program Oversight Committee;• Corporate Governance;
and• Diversity
To see a summary of the meeting and the actions taken by New York City Transit and Bus Committee, please refer to the December 16, 2020 Board minutes in the December Board Book available here on the Board materials website: https://new.mta.info/transparency/board-and-committee-meetings/December-2020.
Master Page # 5 of 228 - New York City Transit and Bus Committee Meeting 1/21/2021________________________________________________________________________________
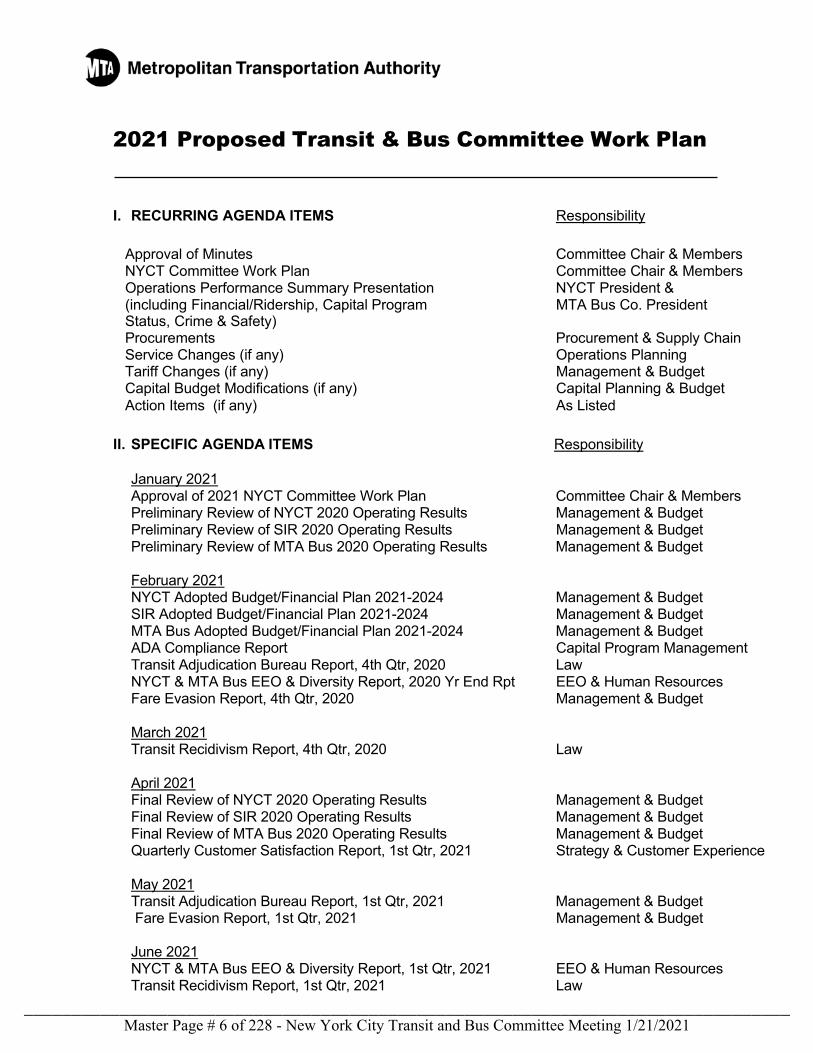
2021 Proposed Transit & Bus Committee Work Plan
I. RECURRING AGENDA ITEMS Responsibility
Approval of Minutes Committee Chair & Members NYCT Committee Work Plan Committee Chair & Members Operations Performance Summary Presentation NYCT President & (including Financial/Ridership, Capital Program MTA Bus Co. President
Status, Crime & Safety) Procurements Procurement & Supply Chain Service Changes (if any) Operations Planning Tariff Changes (if any) Management & Budget Capital Budget Modifications (if any) Capital Planning & Budget Action Items (if any) As Listed
II. SPECIFIC AGENDA ITEMS Responsibility
January 2021 Approval of 2021 NYCT Committee Work Plan Committee Chair & Members Preliminary Review of NYCT 2020 Operating Results Management & Budget Preliminary Review of SIR 2020 Operating Results Management & Budget Preliminary Review of MTA Bus 2020 Operating Results Management & Budget
February 2021 NYCT Adopted Budget/Financial Plan 2021-2024 Management & Budget SIR Adopted Budget/Financial Plan 2021-2024 Management & Budget MTA Bus Adopted Budget/Financial Plan 2021-2024 Management & Budget ADA Compliance Report Capital Program Management Transit Adjudication Bureau Report, 4th Qtr, 2020 Law NYCT & MTA Bus EEO & Diversity Report, 2020 Yr End Rpt EEO & Human Resources Fare Evasion Report, 4th Qtr, 2020 Management & Budget March 2021 Transit Recidivism Report, 4th Qtr, 2020 Law April 2021
Final Review of NYCT 2020 Operating Results Management & Budget Final Review of SIR 2020 Operating Results Management & Budget Final Review of MTA Bus 2020 Operating Results Management & Budget Quarterly Customer Satisfaction Report, 1st Qtr, 2021 Strategy & Customer Experience May 2021 Transit Adjudication Bureau Report, 1st Qtr, 2021 Management & Budget Fare Evasion Report, 1st Qtr, 2021 Management & Budget June 2021 NYCT & MTA Bus EEO & Diversity Report, 1st Qtr, 2021 EEO & Human Resources Transit Recidivism Report, 1st Qtr, 2021 Law
Master Page # 6 of 228 - New York City Transit and Bus Committee Meeting 1/21/2021________________________________________________________________________________
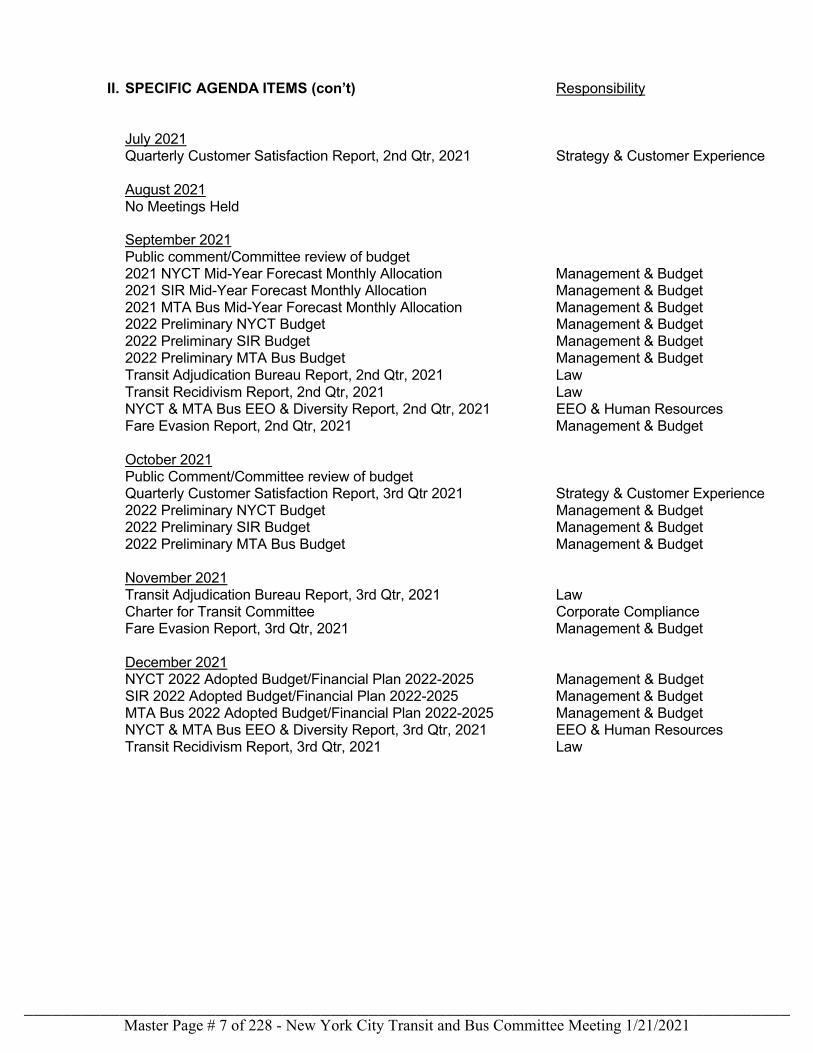
II. SPECIFIC AGENDA ITEMS (con’t) Responsibility
July 2021 Quarterly Customer Satisfaction Report, 2nd Qtr, 2021 Strategy & Customer Experience August 2021 No Meetings Held September 2021 Public comment/Committee review of budget 2021 NYCT Mid-Year Forecast Monthly Allocation Management & Budget 2021 SIR Mid-Year Forecast Monthly Allocation Management & Budget 2021 MTA Bus Mid-Year Forecast Monthly Allocation Management & Budget 2022 Preliminary NYCT Budget Management & Budget 2022 Preliminary SIR Budget Management & Budget 2022 Preliminary MTA Bus Budget Management & Budget Transit Adjudication Bureau Report, 2nd Qtr, 2021 Law Transit Recidivism Report, 2nd Qtr, 2021 Law NYCT & MTA Bus EEO & Diversity Report, 2nd Qtr, 2021 EEO & Human Resources
Fare Evasion Report, 2nd Qtr, 2021 Management & Budget
October 2021 Public Comment/Committee review of budget Quarterly Customer Satisfaction Report, 3rd Qtr 2021 Strategy & Customer Experience 2022 Preliminary NYCT Budget Management & Budget 2022 Preliminary SIR Budget Management & Budget 2022 Preliminary MTA Bus Budget Management & Budget November 2021 Transit Adjudication Bureau Report, 3rd Qtr, 2021 Law Charter for Transit Committee Corporate Compliance Fare Evasion Report, 3rd Qtr, 2021 Management & Budget
December 2021 NYCT 2022 Adopted Budget/Financial Plan 2022-2025 Management & Budget SIR 2022 Adopted Budget/Financial Plan 2022-2025 Management & Budget MTA Bus 2022 Adopted Budget/Financial Plan 2022-2025 Management & Budget NYCT & MTA Bus EEO & Diversity Report, 3rd Qtr, 2021 EEO & Human Resources Transit Recidivism Report, 3rd Qtr, 2021 Law
Master Page # 7 of 228 - New York City Transit and Bus Committee Meeting 1/21/2021________________________________________________________________________________
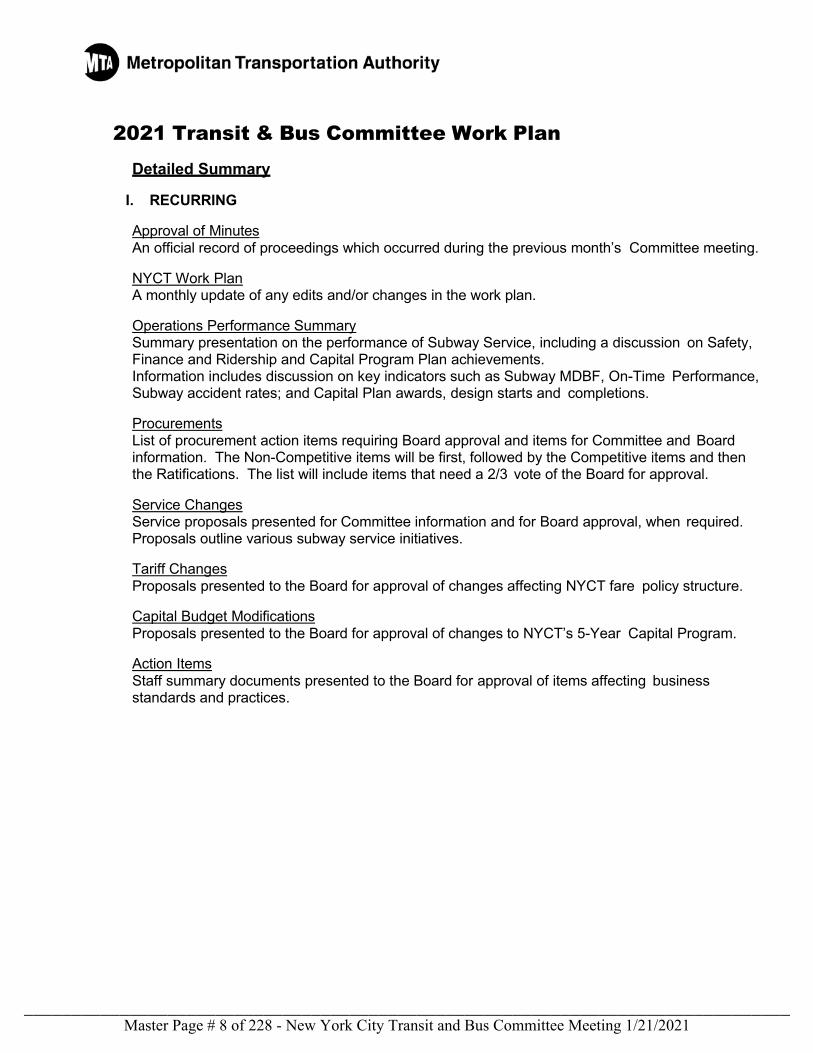
2021 Transit & Bus Committee Work Plan Detailed Summary
I. RECURRING
Approval of Minutes An official record of proceedings which occurred during the previous month’s Committee meeting.
NYCT Work Plan A monthly update of any edits and/or changes in the work plan.
Operations Performance Summary Summary presentation on the performance of Subway Service, including a discussion on Safety, Finance and Ridership and Capital Program Plan achievements. Information includes discussion on key indicators such as Subway MDBF, On-Time Performance, Subway accident rates; and Capital Plan awards, design starts and completions.
Procurements List of procurement action items requiring Board approval and items for Committee and Board information. The Non-Competitive items will be first, followed by the Competitive items and then the Ratifications. The list will include items that need a 2/3 vote of the Board for approval.
Service Changes Service proposals presented for Committee information and for Board approval, when required. Proposals outline various subway service initiatives.
Tariff Changes Proposals presented to the Board for approval of changes affecting NYCT fare policy structure.
Capital Budget Modifications Proposals presented to the Board for approval of changes to NYCT’s 5-Year Capital Program.
Action Items Staff summary documents presented to the Board for approval of items affecting business standards and practices.
Master Page # 8 of 228 - New York City Transit and Bus Committee Meeting 1/21/2021________________________________________________________________________________
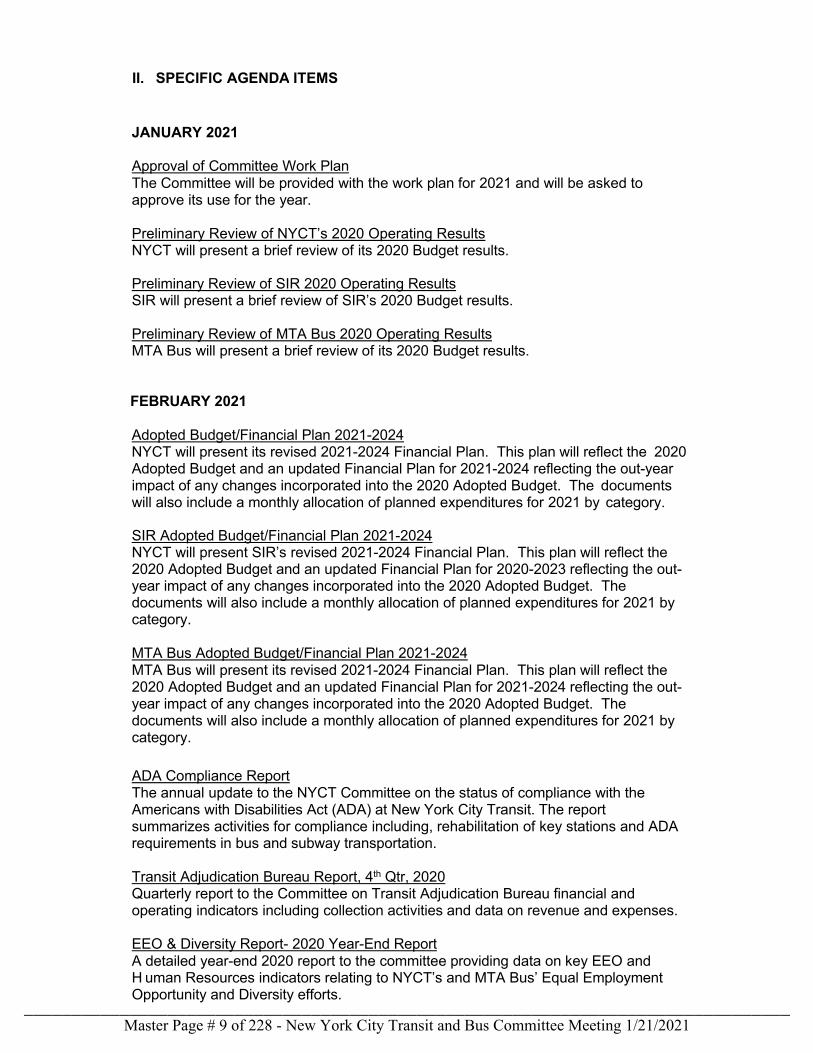
II. SPECIFIC AGENDA ITEMS
JANUARY 2021
Approval of Committee Work Plan The Committee will be provided with the work plan for 2021 and will be asked to approve its use for the year. Preliminary Review of NYCT’s 2020 Operating Results NYCT will present a brief review of its 2020 Budget results. Preliminary Review of SIR 2020 Operating Results SIR will present a brief review of SIR’s 2020 Budget results. Preliminary Review of MTA Bus 2020 Operating Results MTA Bus will present a brief review of its 2020 Budget results.
FEBRUARY 2021
Adopted Budget/Financial Plan 2021-2024 NYCT will present its revised 2021-2024 Financial Plan. This plan will reflect the 2020 Adopted Budget and an updated Financial Plan for 2021-2024 reflecting the out-year impact of any changes incorporated into the 2020 Adopted Budget. The documents will also include a monthly allocation of planned expenditures for 2021 by category. SIR Adopted Budget/Financial Plan 2021-2024 NYCT will present SIR’s revised 2021-2024 Financial Plan. This plan will reflect the 2020 Adopted Budget and an updated Financial Plan for 2020-2023 reflecting the out-year impact of any changes incorporated into the 2020 Adopted Budget. The documents will also include a monthly allocation of planned expenditures for 2021 by category.
MTA Bus Adopted Budget/Financial Plan 2021-2024 MTA Bus will present its revised 2021-2024 Financial Plan. This plan will reflect the 2020 Adopted Budget and an updated Financial Plan for 2021-2024 reflecting the out- year impact of any changes incorporated into the 2020 Adopted Budget. The documents will also include a monthly allocation of planned expenditures for 2021 by category.
ADA Compliance Report The annual update to the NYCT Committee on the status of compliance with the Americans with Disabilities Act (ADA) at New York City Transit. The report summarizes activities for compliance including, rehabilitation of key stations and ADA requirements in bus and subway transportation.
Transit Adjudication Bureau Report, 4th Qtr, 2020 Quarterly report to the Committee on Transit Adjudication Bureau financial and operating indicators including collection activities and data on revenue and expenses.
EEO & Diversity Report- 2020 Year-End Report A detailed year-end 2020 report to the committee providing data on key EEO and H uman Resources indicators relating to NYCT’s and MTA Bus’ Equal Employment Opportunity and Diversity efforts.
Master Page # 9 of 228 - New York City Transit and Bus Committee Meeting 1/21/2021________________________________________________________________________________
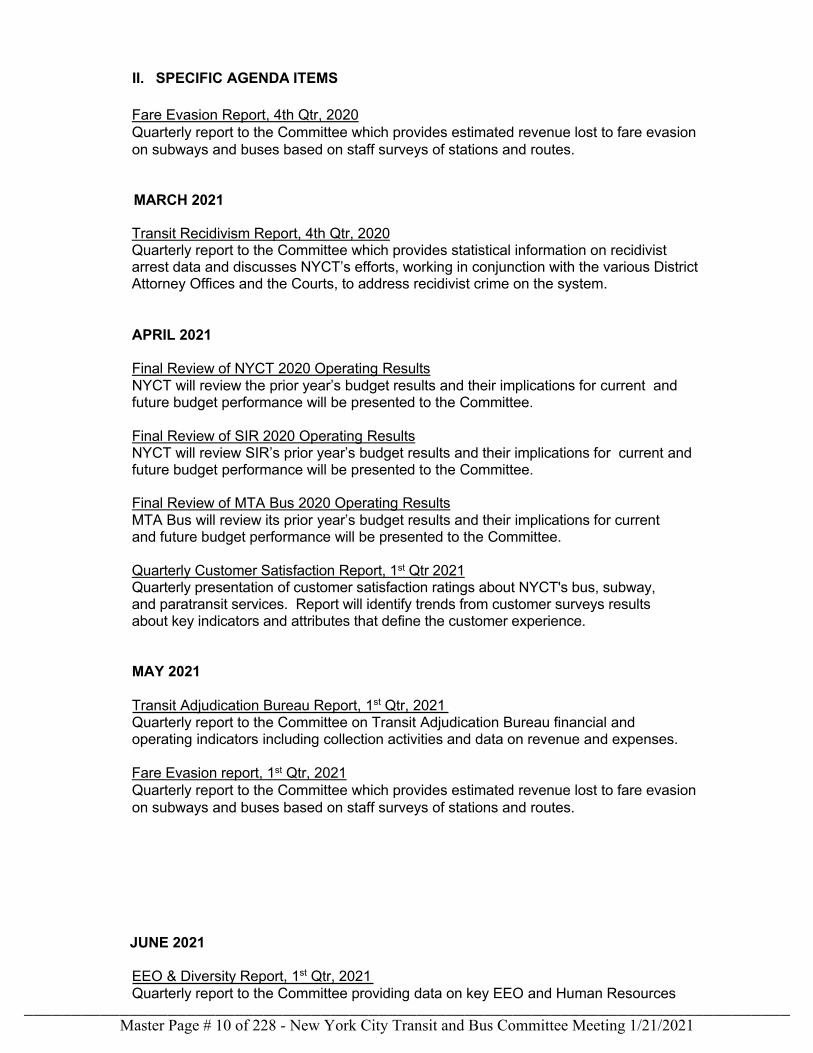
II. SPECIFIC AGENDA ITEMS Fare Evasion Report, 4th Qtr, 2020 Quarterly report to the Committee which provides estimated revenue lost to fare evasion on subways and buses based on staff surveys of stations and routes.
MARCH 2021 Transit Recidivism Report, 4th Qtr, 2020 Quarterly report to the Committee which provides statistical information on recidivist arrest data and discusses NYCT’s efforts, working in conjunction with the various District Attorney Offices and the Courts, to address recidivist crime on the system. APRIL 2021
Final Review of NYCT 2020 Operating Results NYCT will review the prior year’s budget results and their implications for current and future budget performance will be presented to the Committee.
Final Review of SIR 2020 Operating Results NYCT will review SIR’s prior year’s budget results and their implications for current and future budget performance will be presented to the Committee. Final Review of MTA Bus 2020 Operating Results MTA Bus will review its prior year’s budget results and their implications for current and future budget performance will be presented to the Committee.
Quarterly Customer Satisfaction Report, 1st Qtr 2021 Quarterly presentation of customer satisfaction ratings about NYCT's bus, subway, and paratransit services. Report will identify trends from customer surveys results about key indicators and attributes that define the customer experience. MAY 2021
Transit Adjudication Bureau Report, 1st Qtr, 2021 Quarterly report to the Committee on Transit Adjudication Bureau financial and operating indicators including collection activities and data on revenue and expenses. Fare Evasion report, 1st Qtr, 2021 Quarterly report to the Committee which provides estimated revenue lost to fare evasion on subways and buses based on staff surveys of stations and routes.
JUNE 2021
EEO & Diversity Report, 1st Qtr, 2021 Quarterly report to the Committee providing data on key EEO and Human Resources
Master Page # 10 of 228 - New York City Transit and Bus Committee Meeting 1/21/2021________________________________________________________________________________
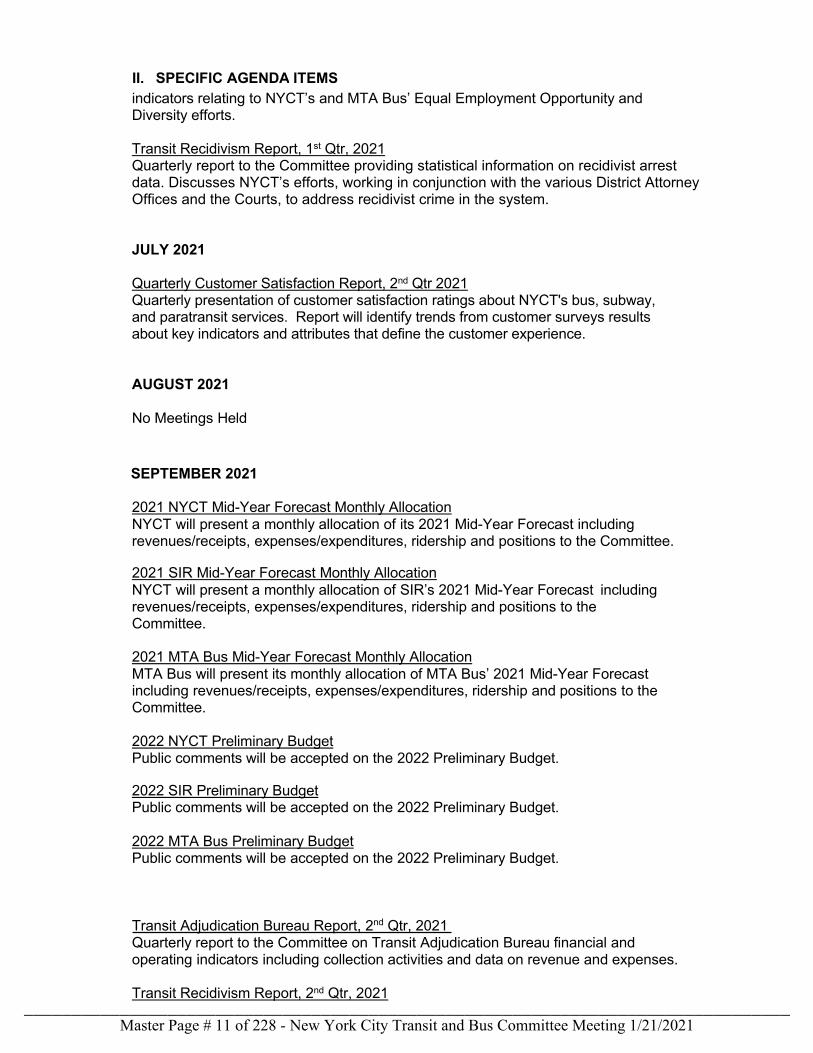
II. SPECIFIC AGENDA ITEMS indicators relating to NYCT’s and MTA Bus’ Equal Employment Opportunity and Diversity efforts. Transit Recidivism Report, 1st Qtr, 2021 Quarterly report to the Committee providing statistical information on recidivist arrest data. Discusses NYCT’s efforts, working in conjunction with the various District Attorney Offices and the Courts, to address recidivist crime in the system.
JULY 2021 Quarterly Customer Satisfaction Report, 2nd Qtr 2021 Quarterly presentation of customer satisfaction ratings about NYCT's bus, subway, and paratransit services. Report will identify trends from customer surveys results about key indicators and attributes that define the customer experience.
AUGUST 2021 No Meetings Held
SEPTEMBER 2021 2021 NYCT Mid-Year Forecast Monthly Allocation NYCT will present a monthly allocation of its 2021 Mid-Year Forecast including revenues/receipts, expenses/expenditures, ridership and positions to the Committee. 2021 SIR Mid-Year Forecast Monthly Allocation NYCT will present a monthly allocation of SIR’s 2021 Mid-Year Forecast including revenues/receipts, expenses/expenditures, ridership and positions to the Committee.
2021 MTA Bus Mid-Year Forecast Monthly Allocation MTA Bus will present its monthly allocation of MTA Bus’ 2021 Mid-Year Forecast including revenues/receipts, expenses/expenditures, ridership and positions to the Committee. 2022 NYCT Preliminary Budget Public comments will be accepted on the 2022 Preliminary Budget. 2022 SIR Preliminary Budget Public comments will be accepted on the 2022 Preliminary Budget. 2022 MTA Bus Preliminary Budget Public comments will be accepted on the 2022 Preliminary Budget. Transit Adjudication Bureau Report, 2nd Qtr, 2021 Quarterly report to the Committee on Transit Adjudication Bureau financial and operating indicators including collection activities and data on revenue and expenses. Transit Recidivism Report, 2nd Qtr, 2021
Master Page # 11 of 228 - New York City Transit and Bus Committee Meeting 1/21/2021________________________________________________________________________________
II. SPECIFIC AGENDA ITEMS Quarterly report to the Committee which provides statistical information on recidivist arrest data and discusses NYCT’s efforts, working in conjunction with the various District Attorney Offices and the Courts, to address recidivist crime on the system. Fare Evasion report, 2nd Qtr, 2021 Quarterly report to the Committee which provides estimated revenue lost to fare evasion on subways and buses based on staff surveys of stations and routes. EEO & Diversity Report, 2nd Qtr, 2021 Quarterly report to the Committee providing data on key EEO and Human Resources indicators relating to NYCT’s and MTA Bus’ Equal Employment Opportunity and Diversity efforts. OCTOBER 2021 2022 NYCT Preliminary Budget Public comments will be accepted on the 2022 Preliminary Budget.
2022 SIR Preliminary Budget
Public comments will be accepted on the SIR 2022 Preliminary Budget. 2022 MTA Bus Preliminary Budget Public comments will be accepted on the MTA Bus 2022 Preliminary Budget.
Customer Satisfaction Report, 3rd Qtr, 2021 Recurring presentation of customer satisfaction ratings about NYCT's bus, subway, and paratransit services. Report will identify trends from customer surveys results about key indicators and attributes that define the customer experience. NOVEMBER 2021 Transit Adjudication Bureau Report, 3rd Qtr, 2021 Quarterly report to the Committee on Transit Adjudication Bureau financial and operating indicators including collection activities and data on revenue and expenses. Fare Evasion Report, 3rd Qtr, 2021 Quarterly report to the Committee which provides estimated revenue lost to fare evasion on subways and buses based on staff surveys of stations and routes. Charter for Transit Committee Once annually, the NYC Transit Committee will be presented with the Committee Charter and will be asked to formally adopt it for use.
DECEMBER 2021
NYCT 2022 Adopted Budget/Financial Plan 2022-2025 NYCT will present its revised 2022-2025 Financial Plan. This plan will reflect the 2021
Master Page # 12 of 228 - New York City Transit and Bus Committee Meeting 1/21/2021________________________________________________________________________________
II. SPECIFIC AGENDA ITEMS Adopted Budget and an updated Financial Plan for 2022-2025 reflecting the out-year impact of any changes incorporated into the 2021 Adopted Budget. The documents will also include a monthly allocation of planned expenditures for 2021 by category. SIR 2022 Adopted Budget/Financial Plan 2022-2025 SIR will present its revised 2022-2025 Financial Plan. This plan will reflect the 2021 Adopted Budget and an updated Financial Plan for 2021-2025 reflecting the out-year impact of any changes incorporated into the 2021 Adopted Budget. The documents will also include a monthly allocation of planned expenditures for 2021 by category.
MTA Bus 2021 Adopted Budget/Financial Plan 2022-2025 MTA Bus will present its revised 2022-2025 Financial Plan. This plan will reflect the 2021 Adopted Budget and an updated Financial Plan for 2022-2025 reflecting the out- year impact of any changes incorporated into the 2022 Adopted Budget. The documents will also include a monthly allocation of planned expenditures for 2021 by category.
EEO & Diversity Report, 3rd Qtr, 2021
Quarterly report to the Committee providing data on key EEO and Human Resources indicators relating to NYCT’s and MTA Bus’ Equal Employment Opportunity and Diversity efforts. Transit Recidivism Report, 3rd Qtr, 2021 Quarterly report to the Committee which provides statistical information on recidivist
arrest data and discusses NYCT’s efforts, working in conjunction with the various District Attorney Offices and the Courts, to address recidivist crime on the system.
Master Page # 13 of 228 - New York City Transit and Bus Committee Meeting 1/21/2021________________________________________________________________________________
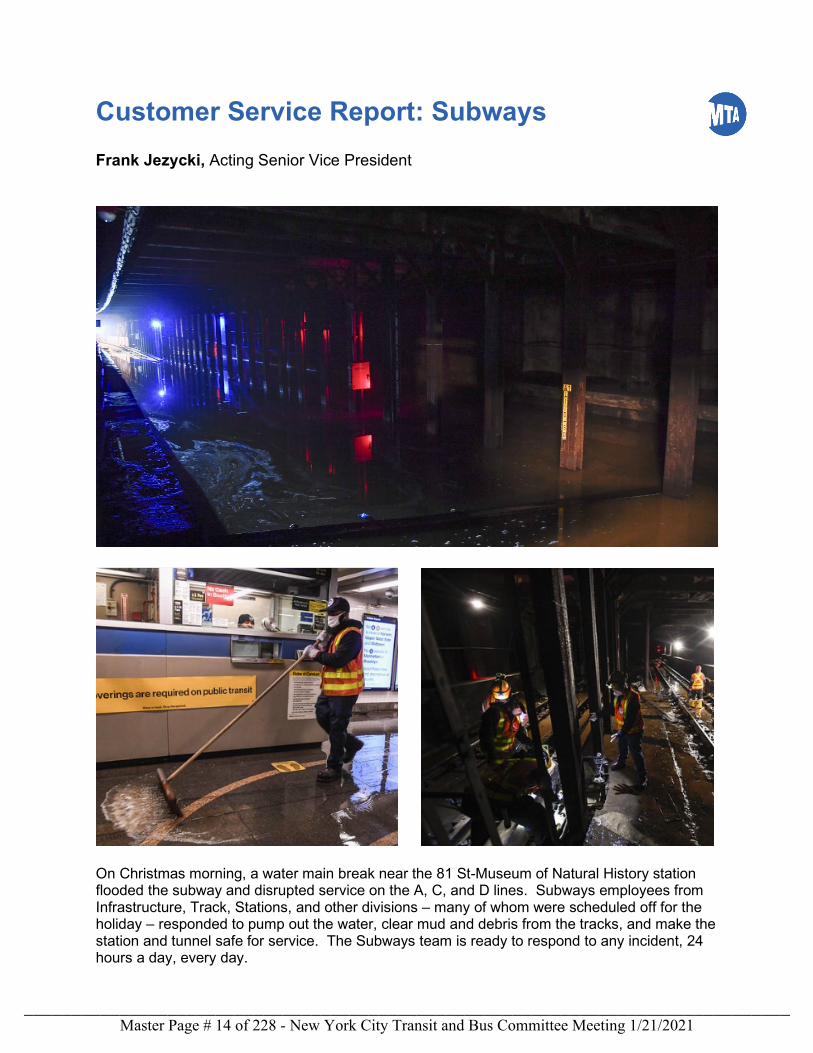
Customer Service Report: Subways Frank Jezycki, Acting Senior Vice President
On Christmas morning, a water main break near the 81 St-Museum of Natural History station flooded the subway and disrupted service on the A, C, and D lines. Subways employees from Infrastructure, Track, Stations, and other divisions – many of whom were scheduled off for the holiday – responded to pump out the water, clear mud and debris from the tracks, and make the station and tunnel safe for service. The Subways team is ready to respond to any incident, 24 hours a day, every day.
Master Page # 14 of 228 - New York City Transit and Bus Committee Meeting 1/21/2021________________________________________________________________________________
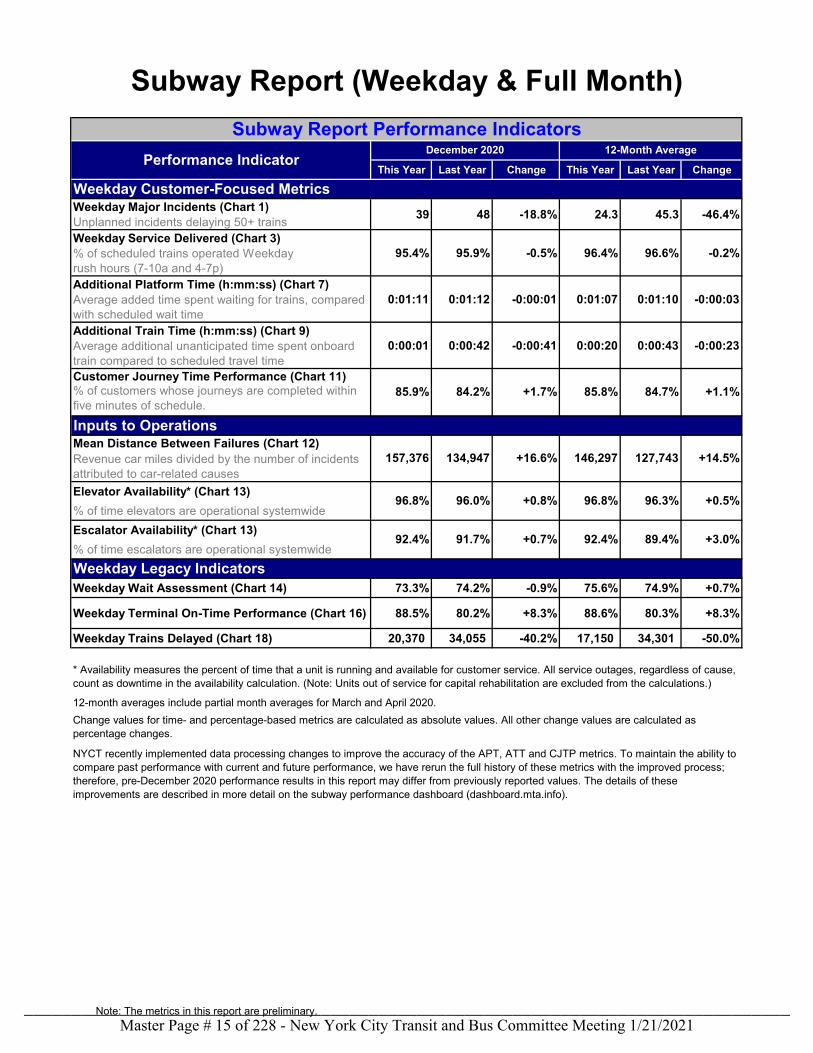
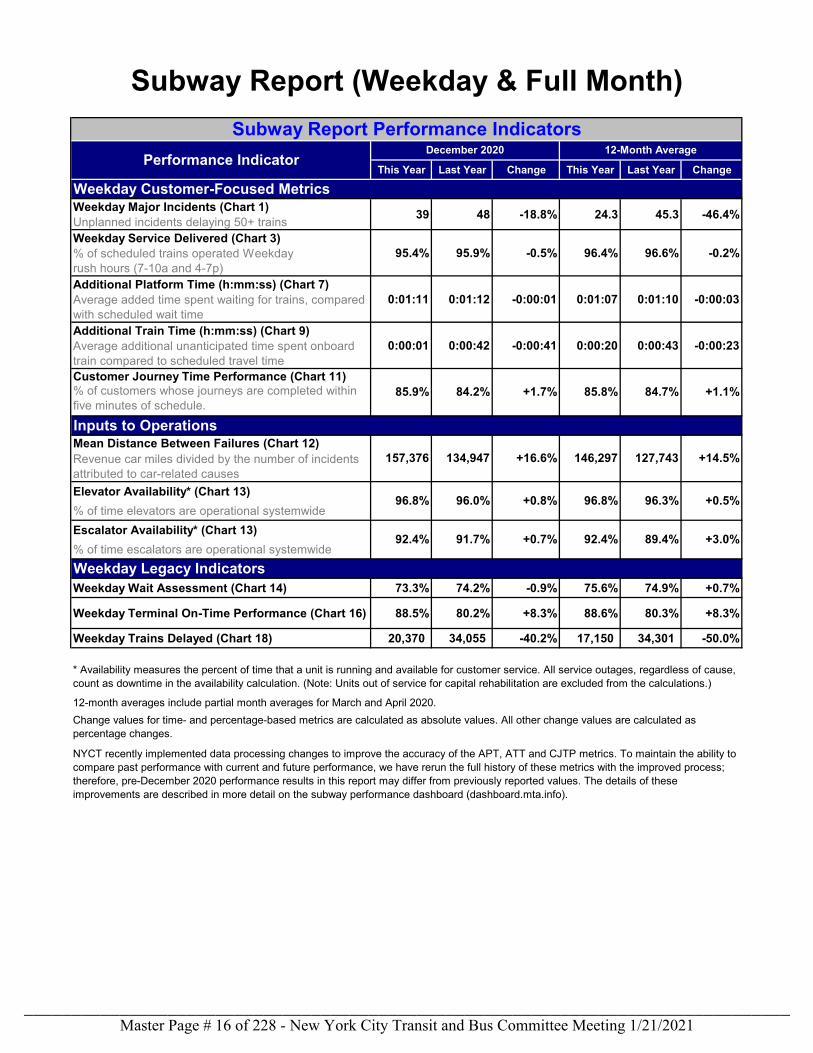
This Year Last Year Change This Year Last Year Change
Weekday Major Incidents (Chart 1)Unplanned incidents delaying 50+ trains 39 48 -18.8% 24.3 45.3 -46.4%
Weekday Service Delivered (Chart 3)% of scheduled trains operated Weekday rush hours (7-10a and 4-7p)
95.4% 95.9% -0.5% 96.4% 96.6% -0.2%
Additional Platform Time (h:mm:ss) (Chart 7)Average added time spent waiting for trains, compared with scheduled wait time
0:01:11 0:01:12 -0:00:01 0:01:07 0:01:10 -0:00:03
Additional Train Time (h:mm:ss) (Chart 9)Average additional unanticipated time spent onboard train compared to scheduled travel time
0:00:01 0:00:42 -0:00:41 0:00:20 0:00:43 -0:00:23
Customer Journey Time Performance (Chart 11)% of customers whose journeys are completed within five minutes of schedule.
Mean Distance Between Failures (Chart 12)Revenue car miles divided by the number of incidents attributed to car-related causesElevator Availability* (Chart 13)% of time elevators are operational systemwideEscalator Availability* (Chart 13)% of time escalators are operational systemwide
Weekday Wait Assessment (Chart 14) 73.3% 74.2% -0.9% 75.6% 74.9% +0.7%
Weekday Terminal On-Time Performance (Chart 16) 88.5% 80.2% +8.3% 88.6% 80.3% +8.3%
Weekday Trains Delayed (Chart 18) 20,370 34,055 -40.2% 17,150 34,301 -50.0%
Inputs to Operations
157,376
+1.1%
Subway Report (Weekday & Full Month)Subway Report Performance Indicators
Performance IndicatorDecember 2020 12-Month Average
Weekday Customer-Focused Metrics
85.9% 84.2% +1.7% 85.8% 84.7%
134,947 +16.6% 146,297 127,743 +14.5%
+3.0%
+0.5%96.8% 96.0% +0.8% 96.8% 96.3%
92.4% 91.7% +0.7% 92.4% 89.4%
Weekday Legacy Indicators
* Availability measures the percent of time that a unit is running and available for customer service. All service outages, regardless of cause,count as downtime in the availability calculation. (Note: Units out of service for capital rehabilitation are excluded from the calculations.)
12-month averages include partial month averages for March and April 2020.Change values for time- and percentage-based metrics are calculated as absolute values. All other change values are calculated as percentage changes.
NYCT recently implemented data processing changes to improve the accuracy of the APT, ATT and CJTP metrics. To maintain the ability to compare past performance with current and future performance, we have rerun the full history of these metrics with the improved process; therefore, pre-December 2020 performance results in this report may differ from previously reported values. The details of these improvements are described in more detail on the subway performance dashboard (dashboard.mta.info).
Note: The metrics in this report are preliminary.Master Page # 15 of 228 - New York City Transit and Bus Committee Meeting 1/21/2021
________________________________________________________________________________
This Year Last Year Change This Year Last Year Change
Weekday Major Incidents (Chart 1)Unplanned incidents delaying 50+ trains 39 48 -18.8% 24.3 45.3 -46.4%
Weekday Service Delivered (Chart 3)% of scheduled trains operated Weekday rush hours (7-10a and 4-7p)
95.4% 95.9% -0.5% 96.4% 96.6% -0.2%
Additional Platform Time (h:mm:ss) (Chart 7)Average added time spent waiting for trains, compared with scheduled wait time
0:01:11 0:01:12 -0:00:01 0:01:07 0:01:10 -0:00:03
Additional Train Time (h:mm:ss) (Chart 9)Average additional unanticipated time spent onboard train compared to scheduled travel time
0:00:01 0:00:42 -0:00:41 0:00:20 0:00:43 -0:00:23
Customer Journey Time Performance (Chart 11)% of customers whose journeys are completed within five minutes of schedule.
Mean Distance Between Failures (Chart 12)Revenue car miles divided by the number of incidents attributed to car-related causesElevator Availability* (Chart 13)% of time elevators are operational systemwideEscalator Availability* (Chart 13)% of time escalators are operational systemwide
Weekday Wait Assessment (Chart 14) 73.3% 74.2% -0.9% 75.6% 74.9% +0.7%
Weekday Terminal On-Time Performance (Chart 16) 88.5% 80.2% +8.3% 88.6% 80.3% +8.3%
Weekday Trains Delayed (Chart 18) 20,370 34,055 -40.2% 17,150 34,301 -50.0%
NYCT recently implemented data processing changes to improve the accuracy of the APT, ATT and CJTP metrics. To maintain the ability to compare past performance with current and future performance, we have rerun the full history of these metrics with the improved process; therefore, pre-December 2020 performance results in this report may differ from previously reported values. The details of these improvements are described in more detail on the subway performance dashboard (dashboard.mta.info).
Weekday Legacy Indicators
* Availability measures the percent of time that a unit is running and available for customer service. All service outages, regardless of cause, count as downtime in the availability calculation. (Note: Units out of service for capital rehabilitation are excluded from the calculations.)
12-month averages include partial month averages for March and April 2020.Change values for time- and percentage-based metrics are calculated as absolute values. All other change values are calculated as percentage changes.
92.4% 91.7% +0.7% 92.4% 89.4%
96.8% 96.0% +0.8% 96.8% 96.3%
+16.6% 146,297 127,743 +14.5%
+3.0%
+0.5%
Inputs to Operations
157,376
+1.1%
Subway Report (Weekday & Full Month)Subway Report Performance Indicators
Performance IndicatorDecember 2020 12-Month Average
Weekday Customer-Focused Metrics
85.9% 84.2% +1.7% 85.8% 84.7%
134,947
Master Page # 16 of 228 - New York City Transit and Bus Committee Meeting 1/21/2021________________________________________________________________________________
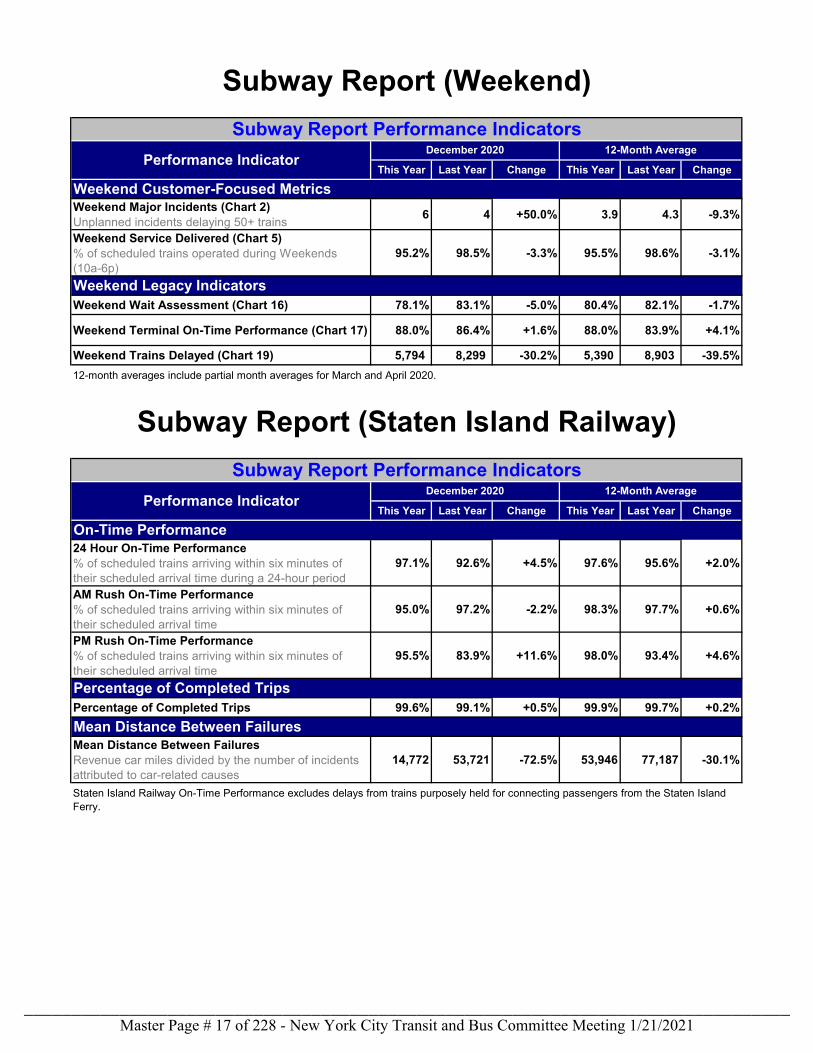
This Year Last Year Change This Year Last Year Change
Weekend Major Incidents (Chart 2)Unplanned incidents delaying 50+ trains 6 4 +50.0% 3.9 4.3 -9.3%
Weekend Service Delivered (Chart 5)% of scheduled trains operated during Weekends (10a-6p)
95.2% 98.5% -3.3% 95.5% 98.6% -3.1%
Weekend Legacy IndicatorsWeekend Wait Assessment (Chart 16) 78.1% 83.1% -5.0% 80.4% 82.1% -1.7%
Weekend Terminal On-Time Performance (Chart 17) 88.0% 86.4% +1.6% 88.0% 83.9% +4.1%
Weekend Trains Delayed (Chart 19) 5,794 8,299 -30.2% 5,390 8,903 -39.5%
This Year Last Year Change This Year Last Year Change
24 Hour On-Time Performance% of scheduled trains arriving within six minutes of their scheduled arrival time during a 24-hour period
97.1% 92.6% +4.5% 97.6% 95.6% +2.0%
AM Rush On-Time Performance% of scheduled trains arriving within six minutes of their scheduled arrival time
95.0% 97.2% -2.2% 98.3% 97.7% +0.6%
PM Rush On-Time Performance% of scheduled trains arriving within six minutes of their scheduled arrival time
95.5% 83.9% +11.6% 98.0% 93.4% +4.6%
Percentage of Completed Trips 99.6% 99.1% +0.5% 99.9% 99.7% +0.2%
Mean Distance Between FailuresRevenue car miles divided by the number of incidents attributed to car-related causes
14,772 53,721 -72.5% 53,946 77,187 -30.1%
Staten Island Railway On-Time Performance excludes delays from trains purposely held for connecting passengers from the Staten Island Ferry.
On-Time Performance
Percentage of Completed Trips
Weekend Customer-Focused Metrics
Subway Report (Staten Island Railway)Subway Report Performance Indicators
Performance IndicatorDecember 2020 12-Month Average
12-month averages include partial month averages for March and April 2020.
Mean Distance Between Failures
Performance IndicatorDecember 2020 12-Month Average
Subway Report (Weekend)Subway Report Performance Indicators
Master Page # 17 of 228 - New York City Transit and Bus Committee Meeting 1/21/2021________________________________________________________________________________
Section 1: Customer-Focused Metrics
The metrics in this section measure subway performance as it affects our passengers. By focusing on how many disruptive incidents have occurred in the subway, how closely actual service matches schedules, and how much longer passengers must wait and ride compared to schedules, these measures collectively reflect the customer experience. Performance Indicator Definitions
Major Incidents (Weekday and Weekend)An unplanned incident that delays 50 or more trains. Major incidents are separated into six categories: Track, Signals, Persons on Trackbed/Police/Medical, Stations & Structures, Subway Car and Other.
Service Delivered (Weekday and Weekend)Measures NYCT’s ability to deliver the service that’s scheduled. Service Delivered is measured along the busiest part of the line, which reflects service across the entire line, and is reported as the percentage of scheduled trains that are provided from 7 a.m. to 10 a.m. and 4 p.m. to 7 p.m. on weekdays and from 10 a.m. to 6 p.m. on weekends.
Additional Platform Time (APT)The estimated average extra time that customers spend waiting on the platform for a train, compared with their scheduled wait time. This estimate is for each individual train a customer uses in their journey (i.e., unlinked trip), not all trains in their journey combined.
Additional Train Time (ATT)The estimated average extra time that customers spend onboard a train, compared to the time they would have spent onboard a train if trains were running according to schedule. This estimate is for each individual train a customer uses in their journey (i.e., unlinked trip), not all trains in their journey combined.
Customer Journey Time Performance (CJTP)The percentage of customer trips with total travel times within 5 minutes of the scheduled time. It is equivalent to the percentage of customer trips with APT plus ATT of 5 minutes or less. Like APT and ATT, CJTP is estimated for each individual train a customer uses in their journey (i.e., unlinked trip), not all trains in their journey combined.
APT, ATT, and CJTP are measured using MetroCard/OMNY entry data, subway schedules (including adjustments for planned work), and actual train arrival and departure times. These metrics are considered to be in beta and are expected to be refined as data sources and methodologies change, especially with the integration of new more precise train-tracking technologies and the re-calibration of existing data sources. They are reported for trips starting from 6 a.m. to 11 p.m. on weekdays. For more detail, see http://dashboard.mta.info/Help
Master Page # 18 of 228 - New York City Transit and Bus Committee Meeting 1/21/2021________________________________________________________________________________
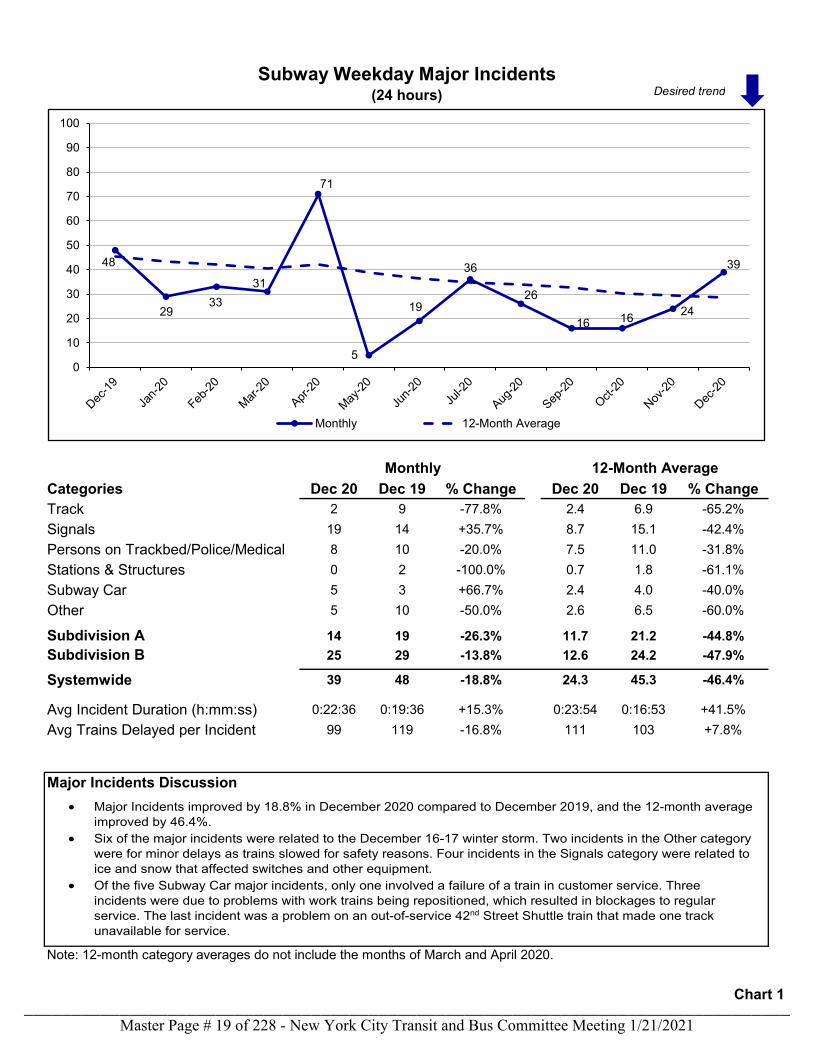
Categories Dec 20 Dec 19 % Change Dec 20 Dec 19 % ChangeTrack 2 9 -77.8% 2.4 6.9 -65.2%Signals 19 14 +35.7% 8.7 15.1 -42.4%Persons on Trackbed/Police/Medical 8 10 -20.0% 7.5 11.0 -31.8%Stations & Structures 0 2 -100.0% 0.7 1.8 -61.1%Subway Car 5 3 +66.7% 2.4 4.0 -40.0%Other 5 10 -50.0% 2.6 6.5 -60.0%
Subdivision A 14 19 -26.3% 11.7 21.2 -44.8%Subdivision B 25 29 -13.8% 12.6 24.2 -47.9%
Systemwide 39 48 -18.8% 24.3 45.3 -46.4%
Avg Incident Duration (h:mm:ss) 0:22:36 0:19:36 +15.3% 0:23:54 0:16:53 +41.5%Avg Trains Delayed per Incident 99 119 -16.8% 111 103 +7.8%
Major Incidents Discussion
Subway Weekday Major Incidents(24 hours)
12-Month AverageMonthly
Note: 12-month category averages do not include the months of March and April 2020.
48
2933
31
71
5
19
36
26
16 16 24
39
0
10
20
30
40
50
60
70
80
90
100
Monthly 12-Month Average
Desired trend
• Major Incidents improved by 18.8% in December 2020 compared to December 2019, and the 12-month average improved by 46.4%.
• Six of the major incidents were related to the December 16-17 winter storm. Two incidents in the Other category were for minor delays as trains slowed for safety reasons. Four incidents in the Signals category were related to ice and snow that affected switches and other equipment.
• Of the five Subway Car major incidents, only one involved a failure of a train in customer service. Three incidents were due to problems with work trains being repositioned, which resulted in blockages to regular service. The last incident was a problem on an out-of-service 42nd Street Shuttle train that made one track unavailable for service.
Chart 1
Master Page # 19 of 228 - New York City Transit and Bus Committee Meeting 1/21/2021________________________________________________________________________________
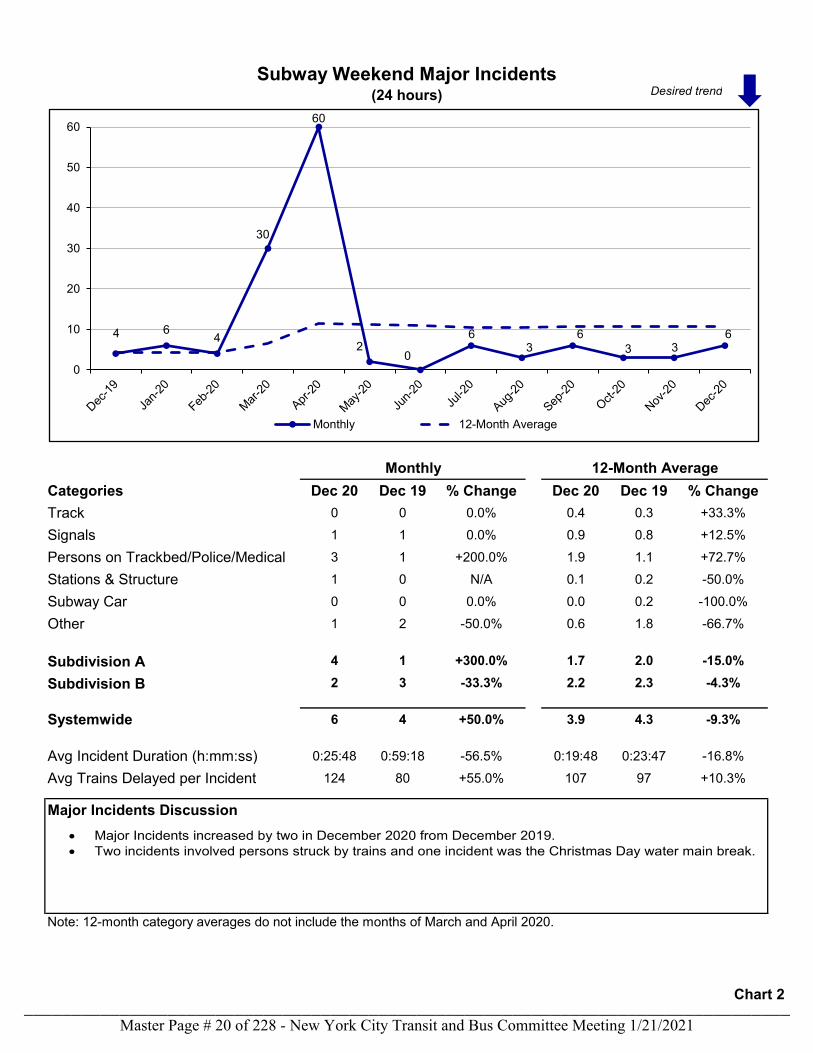
Categories Dec 20 Dec 19 % Change Dec 20 Dec 19 % ChangeTrack 0 0 0.0% 0.4 0.3 +33.3%
Signals 1 1 0.0% 0.9 0.8 +12.5%
Persons on Trackbed/Police/Medical 3 1 +200.0% 1.9 1.1 +72.7%
Stations & Structure 1 0 N/A 0.1 0.2 -50.0%
Subway Car 0 0 0.0% 0.0 0.2 -100.0%
Other 1 2 -50.0% 0.6 1.8 -66.7%
Subdivision A 4 1 +300.0% 1.7 2.0 -15.0%Subdivision B 2 3 -33.3% 2.2 2.3 -4.3%
Systemwide 6 4 +50.0% 3.9 4.3 -9.3%
Avg Incident Duration (h:mm:ss) 0:25:48 0:59:18 -56.5% 0:19:48 0:23:47 -16.8%
Avg Trains Delayed per Incident 124 80 +55.0% 107 97 +10.3%
Major Incidents Discussion
Subway Weekend Major Incidents(24 hours)
Monthly 12-Month Average
Note: 12-month category averages do not include the months of March and April 2020.
4 6 4
30
60
20
63
63 3
6
0
10
20
30
40
50
60
Monthly 12-Month Average
• Major Incidents increased by two in December 2020 from December 2019. • Two incidents involved persons struck by trains and one incident was the Christmas Day water main break.
Desired trend
Chart 2
Master Page # 20 of 228 - New York City Transit and Bus Committee Meeting 1/21/2021________________________________________________________________________________
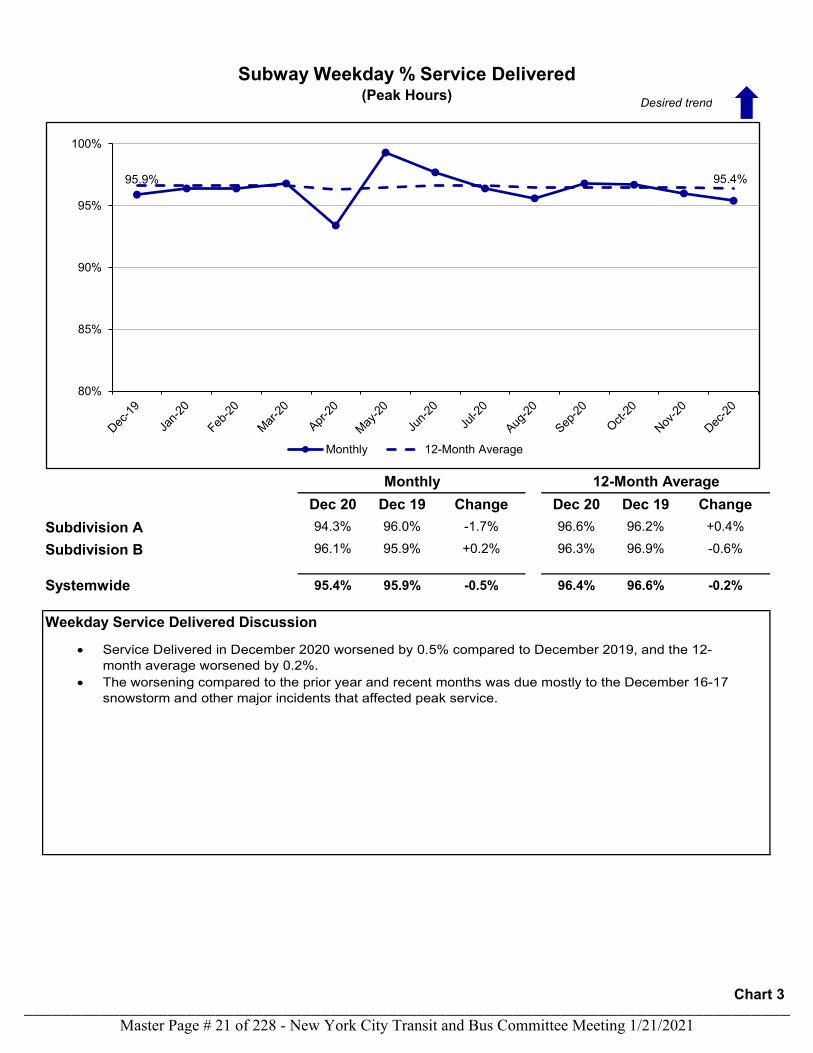
Dec 20 Dec 19 Change Dec 20 Dec 19 ChangeSubdivision A 94.3% 96.0% -1.7% 96.6% 96.2% +0.4%
Subdivision B 96.1% 95.9% +0.2% 96.3% 96.9% -0.6%
Systemwide 95.4% 95.9% -0.5% 96.4% 96.6% -0.2%
Weekday Service Delivered Discussion
Subway Weekday % Service Delivered(Peak Hours)
Monthly 12-Month Average
95.9% 95.4%
80%
85%
90%
95%
100%
Monthly 12-Month Average
Desired trend
• Service Delivered in December 2020 worsened by 0.5% compared to December 2019, and the 12-month average worsened by 0.2%.
• The worsening compared to the prior year and recent months was due mostly to the December 16-17 snowstorm and other major incidents that affected peak service.
Chart 3
Master Page # 21 of 228 - New York City Transit and Bus Committee Meeting 1/21/2021________________________________________________________________________________
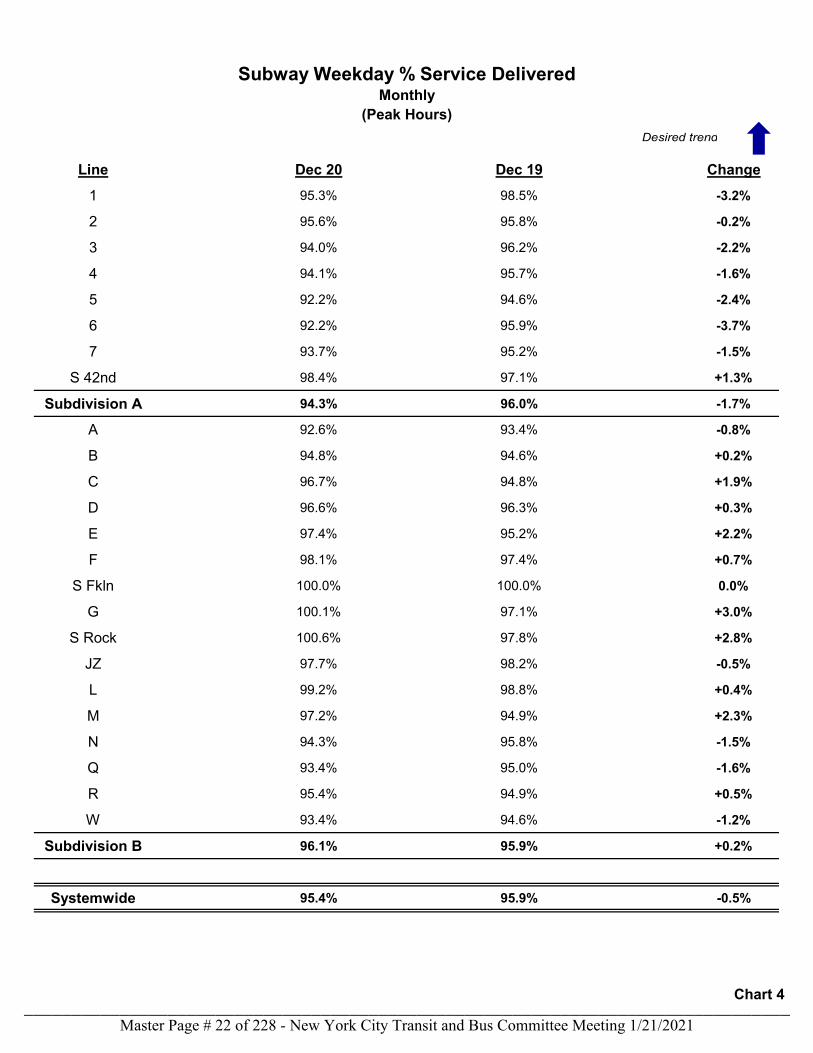
Line Dec 20 Dec 19 Change1 95.3% 98.5% -3.2%
2 95.6% 95.8% -0.2%
3 94.0% 96.2% -2.2%
4 94.1% 95.7% -1.6%
5 92.2% 94.6% -2.4%
6 92.2% 95.9% -3.7%
7 93.7% 95.2% -1.5%
S 42nd 98.4% 97.1% +1.3%
Subdivision A 94.3% 96.0% -1.7%
A 92.6% 93.4% -0.8%
B 94.8% 94.6% +0.2%
C 96.7% 94.8% +1.9%
D 96.6% 96.3% +0.3%
E 97.4% 95.2% +2.2%
F 98.1% 97.4% +0.7%
S Fkln 100.0% 100.0% 0.0%
G 100.1% 97.1% +3.0%
S Rock 100.6% 97.8% +2.8%
JZ 97.7% 98.2% -0.5%
L 99.2% 98.8% +0.4%
M 97.2% 94.9% +2.3%
N 94.3% 95.8% -1.5%
Q 93.4% 95.0% -1.6%
R 95.4% 94.9% +0.5%
W 93.4% 94.6% -1.2%
Subdivision B 96.1% 95.9% +0.2%
Systemwide 95.4% 95.9% -0.5%
Subway Weekday % Service DeliveredMonthly
(Peak Hours)Desired trend
Chart 4
Master Page # 22 of 228 - New York City Transit and Bus Committee Meeting 1/21/2021________________________________________________________________________________
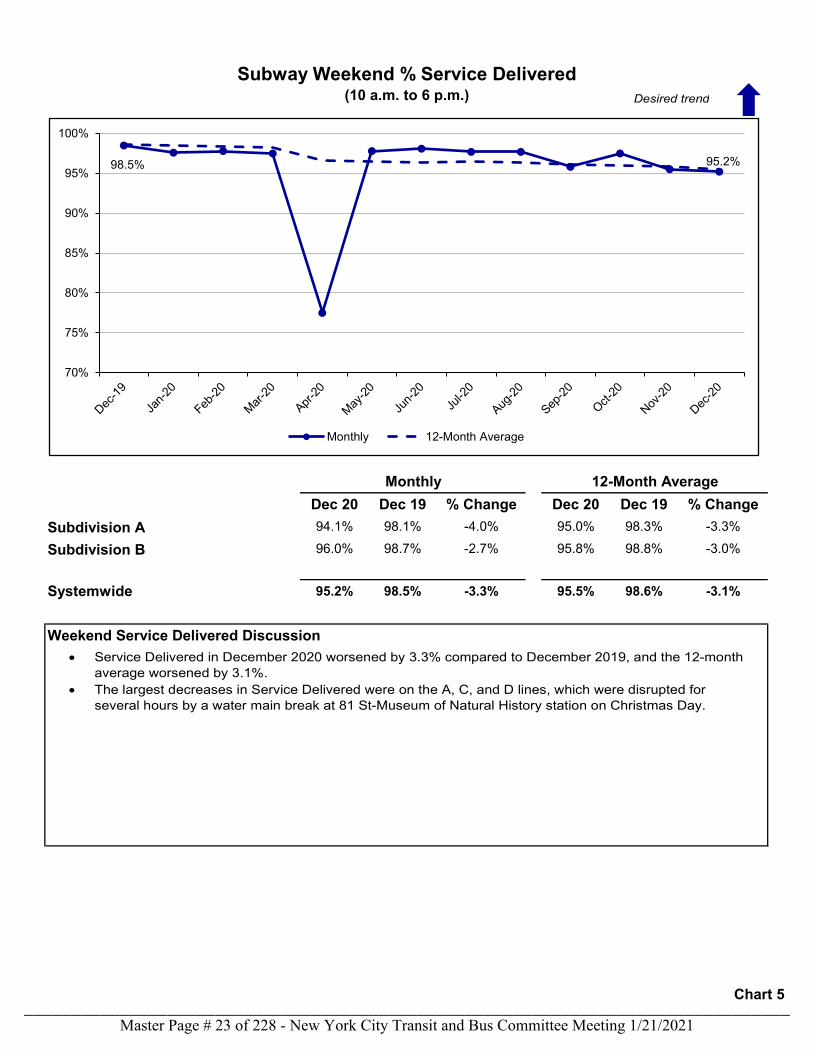
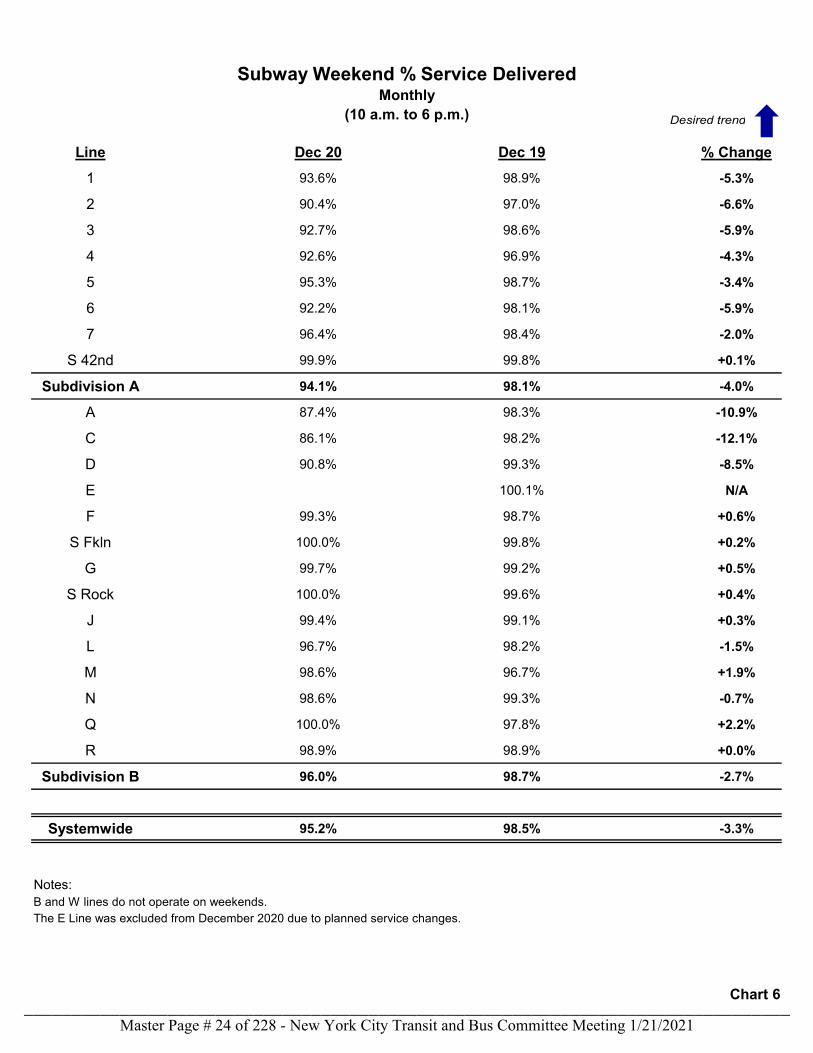
Dec 20 Dec 19 % Change Dec 20 Dec 19 % ChangeSubdivision A 94.1% 98.1% -4.0% 95.0% 98.3% -3.3%
Subdivision B 96.0% 98.7% -2.7% 95.8% 98.8% -3.0%
Systemwide 95.2% 98.5% -3.3% 95.5% 98.6% -3.1%
Weekend Service Delivered Discussion
Subway Weekend % Service Delivered(10 a.m. to 6 p.m.)
Monthly 12-Month Average
Add 12 month rolling data
98.5% 95.2%
70%
75%
80%
85%
90%
95%
100%
Monthly 12-Month Average
Desired trend
• Service Delivered in December 2020 worsened by 3.3% compared to December 2019, and the 12-month average worsened by 3.1%.
• The largest decreases in Service Delivered were on the A, C, and D lines, which were disrupted for several hours by a water main break at 81 St-Museum of Natural History station on Christmas Day.
Chart 5
Master Page # 23 of 228 - New York City Transit and Bus Committee Meeting 1/21/2021________________________________________________________________________________
Line Dec 20 Dec 19 % Change1 93.6% 98.9% -5.3%
2 90.4% 97.0% -6.6%
3 92.7% 98.6% -5.9%
4 92.6% 96.9% -4.3%
5 95.3% 98.7% -3.4%
6 92.2% 98.1% -5.9%
7 96.4% 98.4% -2.0%
S 42nd 99.9% 99.8% +0.1%
Subdivision A 94.1% 98.1% -4.0%
A 87.4% 98.3% -10.9%
C 86.1% 98.2% -12.1%
D 90.8% 99.3% -8.5%
E 100.1% N/A
F 99.3% 98.7% +0.6%
S Fkln 100.0% 99.8% +0.2%
G 99.7% 99.2% +0.5%
S Rock 100.0% 99.6% +0.4%
J 99.4% 99.1% +0.3%
L 96.7% 98.2% -1.5%
M 98.6% 96.7% +1.9%
N 98.6% 99.3% -0.7%
Q 100.0% 97.8% +2.2%
R 98.9% 98.9% +0.0%
Subdivision B 96.0% 98.7% -2.7%
Systemwide 95.2% 98.5% -3.3%
Notes:
Subway Weekend % Service DeliveredMonthly
(10 a.m. to 6 p.m.)
B and W lines do not operate on weekends.The E Line was excluded from December 2020 due to planned service changes.
Desired trend
Chart 6
Master Page # 24 of 228 - New York City Transit and Bus Committee Meeting 1/21/2021________________________________________________________________________________
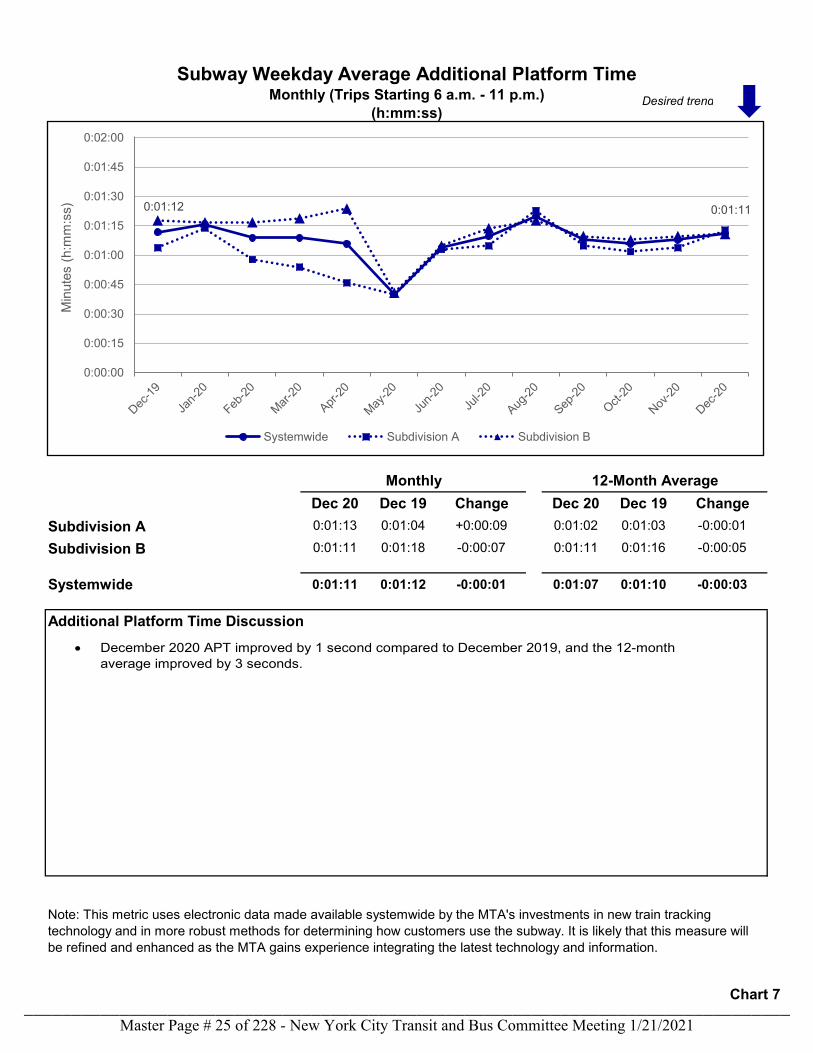
Dec 20 Dec 19 Change Dec 20 Dec 19 ChangeSubdivision A 0:01:13 0:01:04 +0:00:09 0:01:02 0:01:03 -0:00:01
Subdivision B 0:01:11 0:01:18 -0:00:07 0:01:11 0:01:16 -0:00:05
Systemwide 0:01:11 0:01:12 -0:00:01 0:01:07 0:01:10 -0:00:03
Additional Platform Time Discussion
Note: This metric uses electronic data made available systemwide by the MTA's investments in new train tracking technology and in more robust methods for determining how customers use the subway. It is likely that this measure will be refined and enhanced as the MTA gains experience integrating the latest technology and information.
Subway Weekday Average Additional Platform Time
(h:mm:ss)
Monthly 12-Month Average
Monthly (Trips Starting 6 a.m. - 11 p.m.)
0:01:12 0:01:11
0:00:00
0:00:15
0:00:30
0:00:45
0:01:00
0:01:15
0:01:30
0:01:45
0:02:00
Min
utes
(h:m
m:s
s)
Systemwide Subdivision A Subdivision B
• December 2020 APT improved by 1 second compared to December 2019, and the 12-month average improved by 3 seconds.
Desired trend
Chart 7
Master Page # 25 of 228 - New York City Transit and Bus Committee Meeting 1/21/2021________________________________________________________________________________

Line Dec 20 Dec 19 Change1 0:00:57 0:00:59 -0:00:02
2 0:01:26 0:01:22 +0:00:04
3 0:01:17 0:01:06 +0:00:11
4 0:01:14 0:00:59 +0:00:15
5 0:01:15 0:01:03 +0:00:12
6 0:01:12 0:01:00 +0:00:12
7 0:01:16 0:01:06 +0:00:10
S 42nd 0:00:34 0:00:54 -0:00:20
Subdivision A 0:01:13 0:01:04 +0:00:09
A 0:01:13 0:01:20 -0:00:07
B 0:01:36 0:01:45 -0:00:09
C 0:00:47 0:01:41 -0:00:54
D 0:01:26 0:01:29 -0:00:03
E 0:00:57 0:01:09 -0:00:12
F 0:00:43 0:01:22 -0:00:39
S Fkln 0:00:33 0:00:26 +0:00:07
G 0:00:58 0:01:22 -0:00:24
S Rock 0:00:46 0:00:42 +0:00:04
JZ 0:01:08 0:01:11 -0:00:03
L 0:00:43 0:00:47 -0:00:04
M 0:01:23 0:01:17 +0:00:06
N 0:01:22 0:01:10 +0:00:12
Q 0:01:27 0:01:19 +0:00:08
R 0:01:32 0:01:16 +0:00:16
W 0:01:03 0:00:56 +0:00:07
Subdivision B 0:01:11 0:01:18 -0:00:07
Systemwide 0:01:11 0:01:12 -0:00:01
Subway Weekday Average Additional Platform TimeMonthly (Trips Starting 6 a.m. - 11 p.m.)
(h:mm:ss)Desired trend
Chart 8
Master Page # 26 of 228 - New York City Transit and Bus Committee Meeting 1/21/2021________________________________________________________________________________
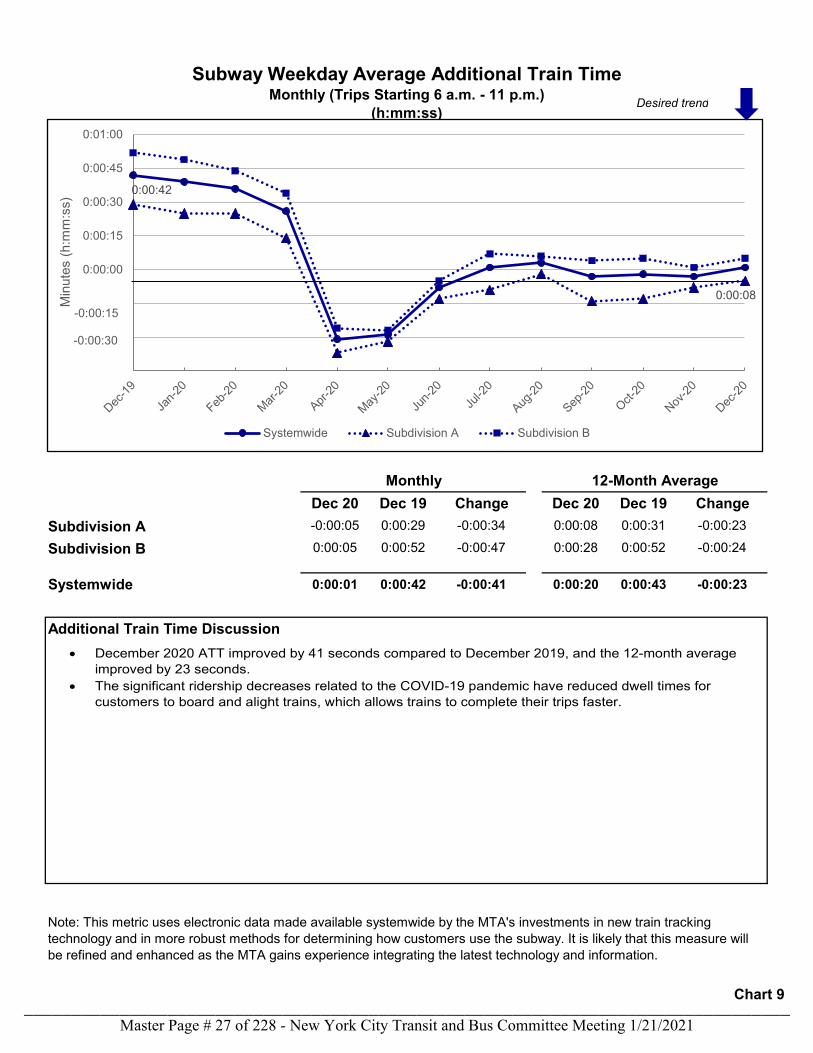
Dec 20 Dec 19 Change Dec 20 Dec 19 ChangeSubdivision A -0:00:05 0:00:29 -0:00:34 0:00:08 0:00:31 -0:00:23
Subdivision B 0:00:05 0:00:52 -0:00:47 0:00:28 0:00:52 -0:00:24
Systemwide 0:00:01 0:00:42 -0:00:41 0:00:20 0:00:43 -0:00:23
Additional Train Time Discussion
Note: This metric uses electronic data made available systemwide by the MTA's investments in new train tracking technology and in more robust methods for determining how customers use the subway. It is likely that this measure will be refined and enhanced as the MTA gains experience integrating the latest technology and information.
Monthly (Trips Starting 6 a.m. - 11 p.m.)Subway Weekday Average Additional Train Time
(h:mm:ss)
Monthly 12-Month Average
0:00:42
0:00:08
0:00:00
0:00:15
0:00:30
0:00:45
0:01:00
Min
utes
(h:m
m:s
s)
Systemwide Subdivision A Subdivision B
-0:00:15
-0:00:30
• December 2020 ATT improved by 41 seconds compared to December 2019, and the 12-month average improved by 23 seconds.
• The significant ridership decreases related to the COVID-19 pandemic have reduced dwell times for customers to board and alight trains, which allows trains to complete their trips faster.
Desired trend
Chart 9
Master Page # 27 of 228 - New York City Transit and Bus Committee Meeting 1/21/2021________________________________________________________________________________
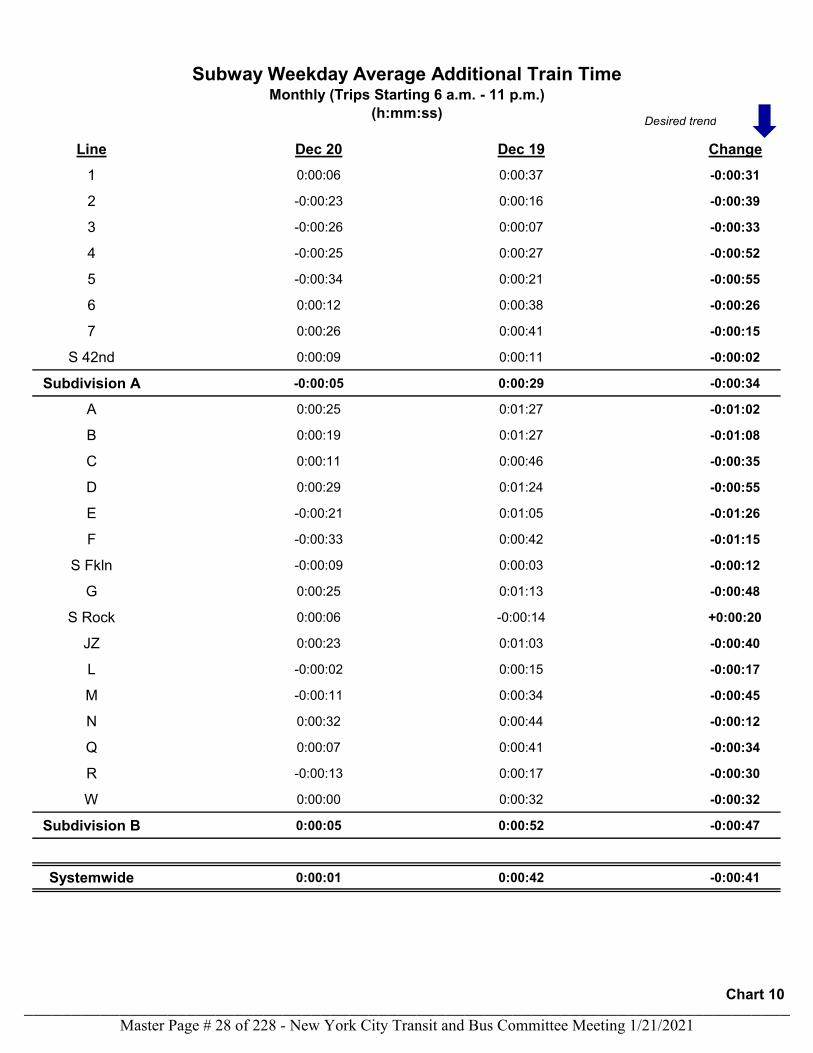
Line Dec 20 Dec 19 Change1 0:00:06 0:00:37 -0:00:31
2 -0:00:23 0:00:16 -0:00:39
3 -0:00:26 0:00:07 -0:00:33
4 -0:00:25 0:00:27 -0:00:52
5 -0:00:34 0:00:21 -0:00:55
6 0:00:12 0:00:38 -0:00:26
7 0:00:26 0:00:41 -0:00:15
S 42nd 0:00:09 0:00:11 -0:00:02
Subdivision A -0:00:05 0:00:29 -0:00:34
A 0:00:25 0:01:27 -0:01:02
B 0:00:19 0:01:27 -0:01:08
C 0:00:11 0:00:46 -0:00:35
D 0:00:29 0:01:24 -0:00:55
E -0:00:21 0:01:05 -0:01:26
F -0:00:33 0:00:42 -0:01:15
S Fkln -0:00:09 0:00:03 -0:00:12
G 0:00:25 0:01:13 -0:00:48
S Rock 0:00:06 -0:00:14 +0:00:20
JZ 0:00:23 0:01:03 -0:00:40
L -0:00:02 0:00:15 -0:00:17
M -0:00:11 0:00:34 -0:00:45
N 0:00:32 0:00:44 -0:00:12
Q 0:00:07 0:00:41 -0:00:34
R -0:00:13 0:00:17 -0:00:30
W 0:00:00 0:00:32 -0:00:32
Subdivision B 0:00:05 0:00:52 -0:00:47
Systemwide 0:00:01 0:00:42 -0:00:41
Subway Weekday Average Additional Train TimeMonthly (Trips Starting 6 a.m. - 11 p.m.)
(h:mm:ss) Desired trend
Chart 10
Master Page # 28 of 228 - New York City Transit and Bus Committee Meeting 1/21/2021________________________________________________________________________________
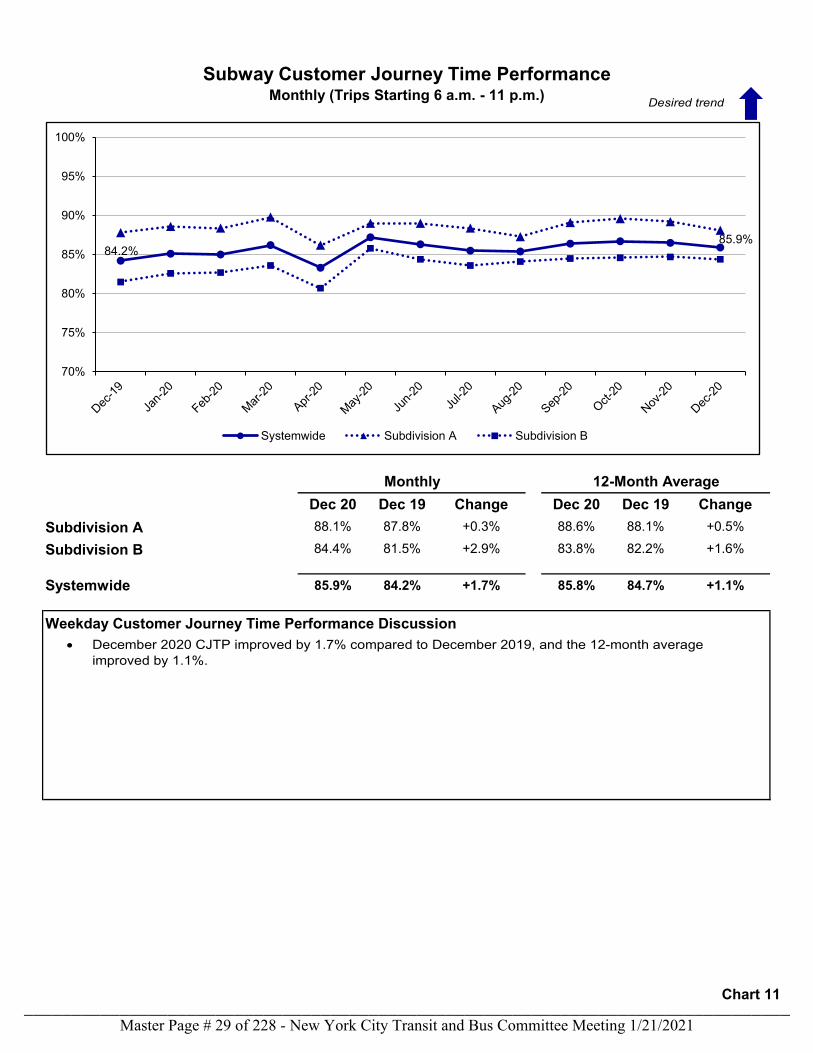
Dec 20 Dec 19 Change Dec 20 Dec 19 ChangeSubdivision A 88.1% 87.8% +0.3% 88.6% 88.1% +0.5%
Subdivision B 84.4% 81.5% +2.9% 83.8% 82.2% +1.6%
Systemwide 85.9% 84.2% +1.7% 85.8% 84.7% +1.1%
Weekday Customer Journey Time Performance Discussion
Subway Customer Journey Time PerformanceMonthly (Trips Starting 6 a.m. - 11 p.m.)
Monthly 12-Month Average
84.2%85.9%
70%
75%
80%
85%
90%
95%
100%
Systemwide Subdivision A Subdivision B
• December 2020 CJTP improved by 1.7% compared to December 2019, and the 12-month average improved by 1.1%.
Desired trend
Chart 11
Master Page # 29 of 228 - New York City Transit and Bus Committee Meeting 1/21/2021________________________________________________________________________________

Line Dec 20 Dec 19 Change1 89.5% 88.6% +0.9%
2 86.5% 85.7% +0.8%
3 88.8% 89.4% -0.6%
4 87.0% 86.0% +1.0%
5 87.8% 86.5% +1.3%
6 88.6% 88.3% +0.3%
7 87.6% 88.4% -0.8%
S 42nd 96.1% 95.2% +0.9%
Subdivision A 88.1% 87.8% +0.3%
A 82.6% 78.8% +3.8%
B 79.9% 75.0% +4.9%
C 87.5% 80.8% +6.7%
D 80.2% 75.7% +4.5%
E 89.7% 82.1% +7.6%
F 86.4% 81.4% +5.0%
S Fkln 95.1% 96.8% -1.7%
G 85.7% 79.9% +5.8%
S Rock 91.0% 91.4% -0.4%
JZ 84.4% 80.1% +4.3%
L 93.9% 91.9% +2.0%
M 83.7% 82.2% +1.5%
N 80.7% 83.8% -3.1%
Q 80.9% 80.2% +0.7%
R 81.9% 83.2% -1.3%
W 88.6% 88.0% +0.6%
Subdivision B 84.4% 81.5% +2.9%
Systemwide 85.9% 84.2% 1.7%
Subway Customer Journey Time PerformanceMonthly
(Trips Starting 6 a.m. - 11 p.m.)Desired trend
Chart 12
Master Page # 30 of 228 - New York City Transit and Bus Committee Meeting 1/21/2021________________________________________________________________________________
Performance Indicator Definitions
Mean Distance Between Failures (MDBF)
Elevator and Escalator Availability
The metrics in this section address how NYCT provides service to its customers, by measuring the reliability of key assets, reflecting the effectiveness of maintenance practices, as well as age and condition. Historically, the only such measures that NYCT has provided to the Transit Committee and to the public are car fleet and elevator and escalator measures, defined below. NYCT is examining additional such measures to bring forward in coming months.
Subway MDBF is a measure of car fleet reliability. It is calculated as revenue car miles divided by the number of delay incidents attributed to car-related causes.
The percent of time that elevators or escalators are operational system wide. Most elevators and escalators in the subway are maintained by New York City Transit and are electronically monitored 24-hours a day. Some elevators and escalators in the subway are owned and maintained by outside parties; these are inspected by NYCT personnel multiple times daily.
Section 2: Inputs to Operations
Master Page # 31 of 228 - New York City Transit and Bus Committee Meeting 1/21/2021________________________________________________________________________________
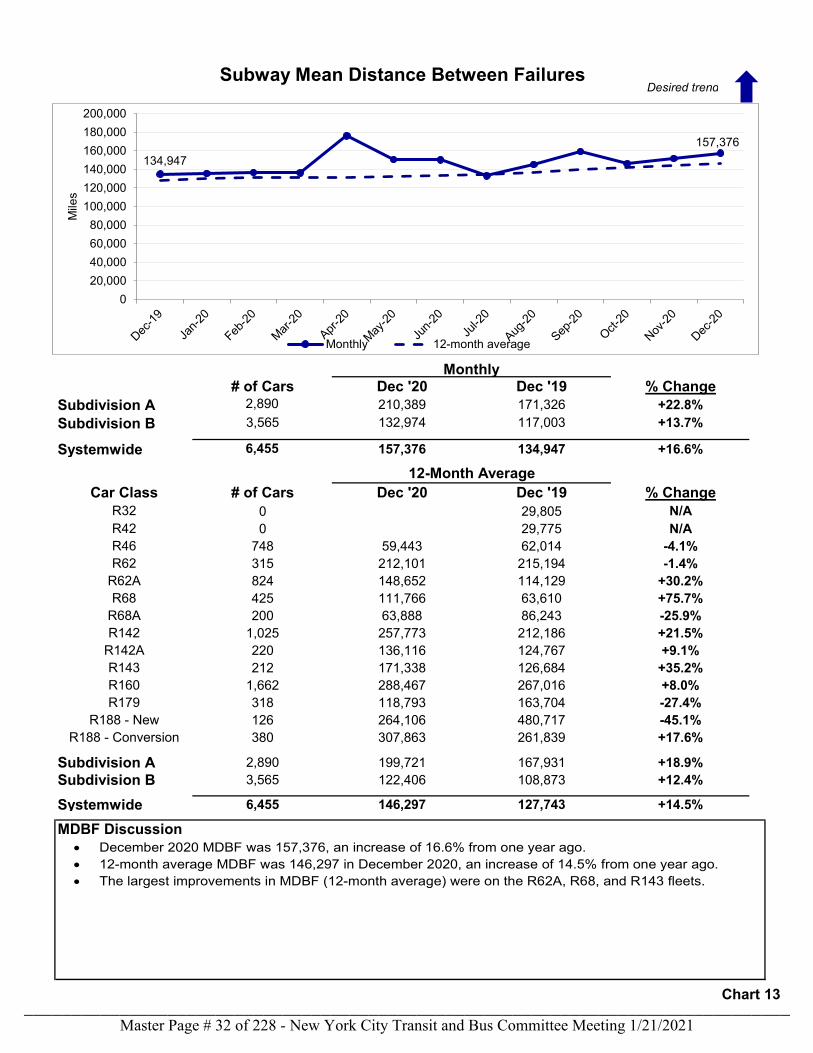
# of Cars Dec '20 Dec '19 % ChangeSubdivision A 2,890 210,389 171,326 +22.8%Subdivision B 3,565 132,974 117,003 +13.7%
Systemwide 6,455 157,376 134,947 +16.6%
Car Class # of Cars Dec '20 Dec '19 % ChangeR32 0 29,805 N/AR42 0 29,775 N/AR46 748 59,443 62,014 -4.1%R62 315 212,101 215,194 -1.4%
R62A 824 148,652 114,129 +30.2%R68 425 111,766 63,610 +75.7%
R68A 200 63,888 86,243 -25.9%R142 1,025 257,773 212,186 +21.5%
R142A 220 136,116 124,767 +9.1%R143 212 171,338 126,684 +35.2%R160 1,662 288,467 267,016 +8.0%R179 318 118,793 163,704 -27.4%
R188 - New 126 264,106 480,717 -45.1%R188 - Conversion 380 307,863 261,839 +17.6%
Subdivision A 2,890 199,721 167,931 +18.9%Subdivision B 3,565 122,406 108,873 +12.4%
Systemwide 6,455 146,297 127,743 +14.5%
MDBF Discussion
Subway Mean Distance Between Failures
Monthly
12-Month Average
134,947157,376
020,00040,00060,00080,000
100,000120,000140,000160,000180,000200,000
Mile
s
Monthly 12-month average
Desired trend
• December 2020 MDBF was 157,376, an increase of 16.6% from one year ago. • 12-month average MDBF was 146,297 in December 2020, an increase of 14.5% from one year ago. • The largest improvements in MDBF (12-month average) were on the R62A, R68, and R143 fleets.
Chart 13
Master Page # 32 of 228 - New York City Transit and Bus Committee Meeting 1/21/2021________________________________________________________________________________
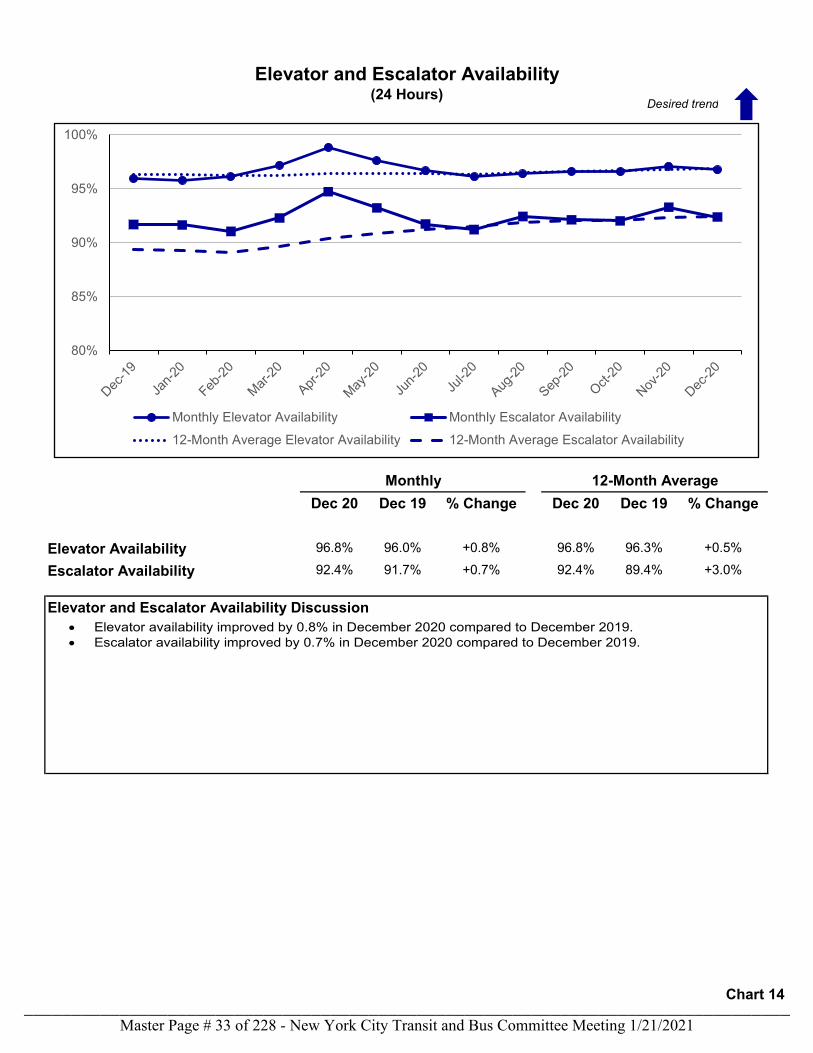
Dec 20 Dec 19 % Change Dec 20 Dec 19 % Change
Elevator Availability 96.8% 96.0% +0.8% 96.8% 96.3% +0.5%
Escalator Availability 92.4% 91.7% +0.7% 92.4% 89.4% +3.0%
Elevator and Escalator Availability Discussion
Elevator and Escalator Availability(24 Hours)
Monthly 12-Month Average
80%
85%
90%
95%
100%
Monthly Elevator Availability Monthly Escalator Availability
12-Month Average Elevator Availability 12-Month Average Escalator Availability
Desired trend
• Elevator availability improved by 0.8% in December 2020 compared to December 2019. • Escalator availability improved by 0.7% in December 2020 compared to December 2019.
Chart 14
Master Page # 33 of 228 - New York City Transit and Bus Committee Meeting 1/21/2021________________________________________________________________________________
Section 3: Legacy Indicators
The metrics in this section have been shared with the public for many years. While less reflective of the customer experience, they are included here for continuity purposes.
Performance Indicator Definitions
Wait Assessment (Weekday and Weekend)Wait Assessment (WA) measures how regularly the trains are spaced at selected timepoints on each line. To meet the standard, the headway (time between trains) can be no greater than 25% more than the scheduled headway. Minor gaps are more than 25% to 50% over the scheduled headway, medium gaps are more than 50% to 100% over the scheduled headway, and major gaps are more than 100% over the scheduled headway, or missed intervals. WA is reported from 6 a.m. to midnight.
Terminal On-Time Performance (Weekday and Weekend)Terminal On-Time Performance is the percentage of scheduled trains arriving at the terminal locations within five minutes of their scheduled arrival time during a 24-hour period. An on-time train is defined as a train arriving at its destination terminal on time, early, or no more than five minutes late, and that has not skipped any planned station stops.
Train Delays (Weekday and Weekend)Train delays are the number of trains that arrived at terminal locations more than five minutes late, or that have skipped any planned station stops during a 24-hour period.
Master Page # 34 of 228 - New York City Transit and Bus Committee Meeting 1/21/2021________________________________________________________________________________
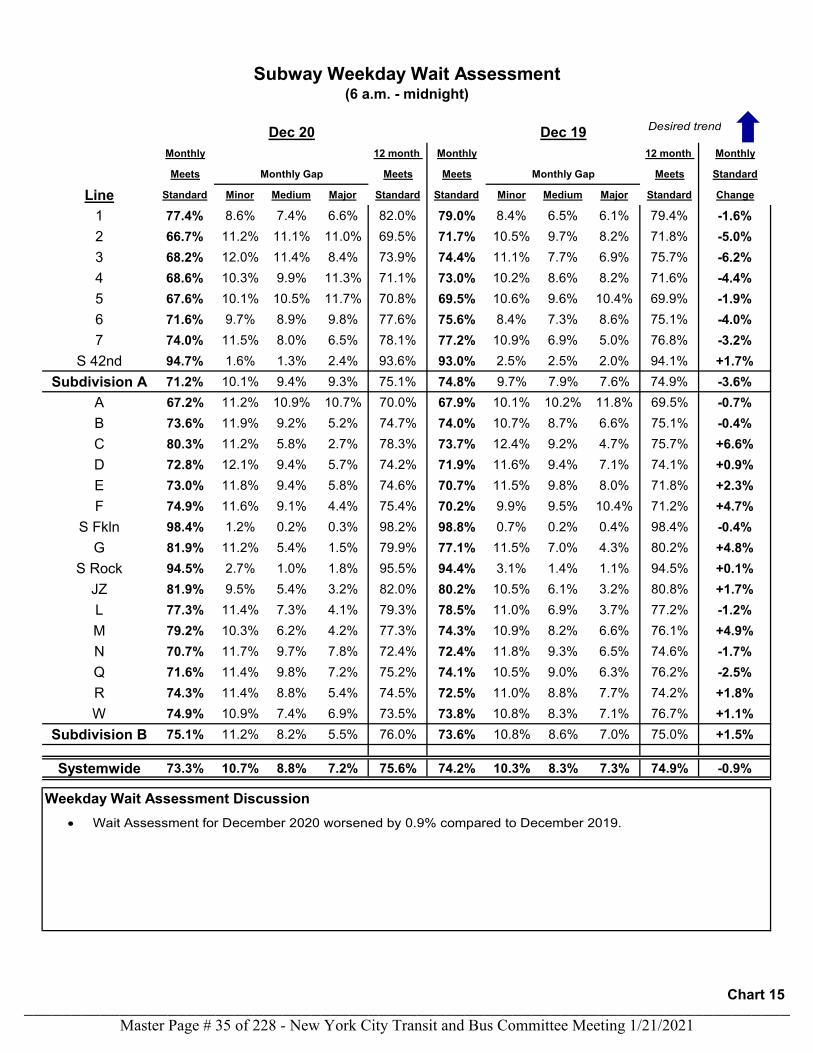
Monthly 12 month Monthly 12 month Monthly
Meets Monthly Gap Meets Meets Monthly Gap Meets Standard
Line Standard Minor Medium Major Standard Standard Minor Medium Major Standard Change
1 77.4% 8.6% 7.4% 6.6% 82.0% 79.0% 8.4% 6.5% 6.1% 79.4% -1.6%2 66.7% 11.2% 11.1% 11.0% 69.5% 71.7% 10.5% 9.7% 8.2% 71.8% -5.0%3 68.2% 12.0% 11.4% 8.4% 73.9% 74.4% 11.1% 7.7% 6.9% 75.7% -6.2%4 68.6% 10.3% 9.9% 11.3% 71.1% 73.0% 10.2% 8.6% 8.2% 71.6% -4.4%5 67.6% 10.1% 10.5% 11.7% 70.8% 69.5% 10.6% 9.6% 10.4% 69.9% -1.9%6 71.6% 9.7% 8.9% 9.8% 77.6% 75.6% 8.4% 7.3% 8.6% 75.1% -4.0%7 74.0% 11.5% 8.0% 6.5% 78.1% 77.2% 10.9% 6.9% 5.0% 76.8% -3.2%
S 42nd 94.7% 1.6% 1.3% 2.4% 93.6% 93.0% 2.5% 2.5% 2.0% 94.1% +1.7%Subdivision A 71.2% 10.1% 9.4% 9.3% 75.1% 74.8% 9.7% 7.9% 7.6% 74.9% -3.6%
A 67.2% 11.2% 10.9% 10.7% 70.0% 67.9% 10.1% 10.2% 11.8% 69.5% -0.7%B 73.6% 11.9% 9.2% 5.2% 74.7% 74.0% 10.7% 8.7% 6.6% 75.1% -0.4%C 80.3% 11.2% 5.8% 2.7% 78.3% 73.7% 12.4% 9.2% 4.7% 75.7% +6.6%D 72.8% 12.1% 9.4% 5.7% 74.2% 71.9% 11.6% 9.4% 7.1% 74.1% +0.9%E 73.0% 11.8% 9.4% 5.8% 74.6% 70.7% 11.5% 9.8% 8.0% 71.8% +2.3%F 74.9% 11.6% 9.1% 4.4% 75.4% 70.2% 9.9% 9.5% 10.4% 71.2% +4.7%
S Fkln 98.4% 1.2% 0.2% 0.3% 98.2% 98.8% 0.7% 0.2% 0.4% 98.4% -0.4%G 81.9% 11.2% 5.4% 1.5% 79.9% 77.1% 11.5% 7.0% 4.3% 80.2% +4.8%
S Rock 94.5% 2.7% 1.0% 1.8% 95.5% 94.4% 3.1% 1.4% 1.1% 94.5% +0.1%JZ 81.9% 9.5% 5.4% 3.2% 82.0% 80.2% 10.5% 6.1% 3.2% 80.8% +1.7%L 77.3% 11.4% 7.3% 4.1% 79.3% 78.5% 11.0% 6.9% 3.7% 77.2% -1.2%M 79.2% 10.3% 6.2% 4.2% 77.3% 74.3% 10.9% 8.2% 6.6% 76.1% +4.9%N 70.7% 11.7% 9.7% 7.8% 72.4% 72.4% 11.8% 9.3% 6.5% 74.6% -1.7%Q 71.6% 11.4% 9.8% 7.2% 75.2% 74.1% 10.5% 9.0% 6.3% 76.2% -2.5%R 74.3% 11.4% 8.8% 5.4% 74.5% 72.5% 11.0% 8.8% 7.7% 74.2% +1.8%W 74.9% 10.9% 7.4% 6.9% 73.5% 73.8% 10.8% 8.3% 7.1% 76.7% +1.1%
Subdivision B 75.1% 11.2% 8.2% 5.5% 76.0% 73.6% 10.8% 8.6% 7.0% 75.0% +1.5%
Systemwide 73.3% 10.7% 8.8% 7.2% 75.6% 74.2% 10.3% 8.3% 7.3% 74.9% -0.9%
Weekday Wait Assessment Discussion
Subway Weekday Wait Assessment(6 a.m. - midnight)
Dec 20 Dec 19 Desired trend
• Wait Assessment for December 2020 worsened by 0.9% compared to December 2019.
Chart 15
Master Page # 35 of 228 - New York City Transit and Bus Committee Meeting 1/21/2021________________________________________________________________________________
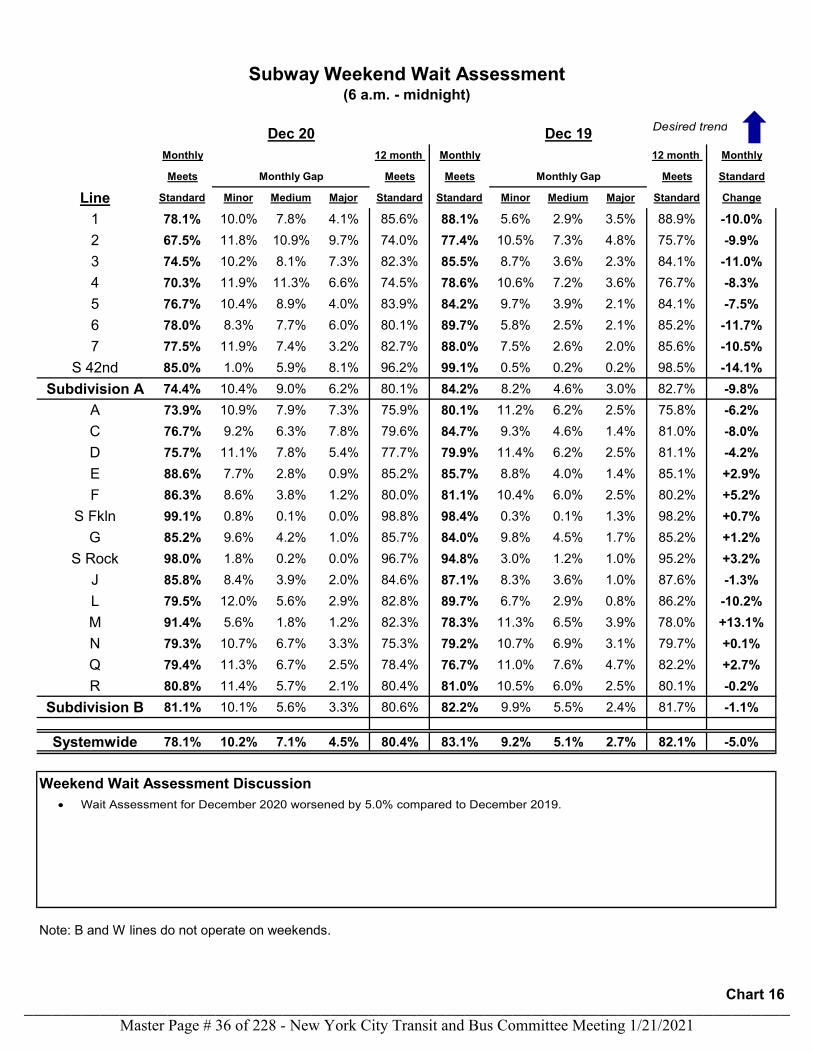
Monthly 12 month Monthly 12 month Monthly
Meets Monthly Gap Meets Meets Monthly Gap Meets Standard
Line Standard Minor Medium Major Standard Standard Minor Medium Major Standard Change
1 78.1% 10.0% 7.8% 4.1% 85.6% 88.1% 5.6% 2.9% 3.5% 88.9% -10.0%2 67.5% 11.8% 10.9% 9.7% 74.0% 77.4% 10.5% 7.3% 4.8% 75.7% -9.9%3 74.5% 10.2% 8.1% 7.3% 82.3% 85.5% 8.7% 3.6% 2.3% 84.1% -11.0%4 70.3% 11.9% 11.3% 6.6% 74.5% 78.6% 10.6% 7.2% 3.6% 76.7% -8.3%5 76.7% 10.4% 8.9% 4.0% 83.9% 84.2% 9.7% 3.9% 2.1% 84.1% -7.5%6 78.0% 8.3% 7.7% 6.0% 80.1% 89.7% 5.8% 2.5% 2.1% 85.2% -11.7%7 77.5% 11.9% 7.4% 3.2% 82.7% 88.0% 7.5% 2.6% 2.0% 85.6% -10.5%
S 42nd 85.0% 1.0% 5.9% 8.1% 96.2% 99.1% 0.5% 0.2% 0.2% 98.5% -14.1%Subdivision A 74.4% 10.4% 9.0% 6.2% 80.1% 84.2% 8.2% 4.6% 3.0% 82.7% -9.8%
A 73.9% 10.9% 7.9% 7.3% 75.9% 80.1% 11.2% 6.2% 2.5% 75.8% -6.2%C 76.7% 9.2% 6.3% 7.8% 79.6% 84.7% 9.3% 4.6% 1.4% 81.0% -8.0%D 75.7% 11.1% 7.8% 5.4% 77.7% 79.9% 11.4% 6.2% 2.5% 81.1% -4.2%E 88.6% 7.7% 2.8% 0.9% 85.2% 85.7% 8.8% 4.0% 1.4% 85.1% +2.9%F 86.3% 8.6% 3.8% 1.2% 80.0% 81.1% 10.4% 6.0% 2.5% 80.2% +5.2%
S Fkln 99.1% 0.8% 0.1% 0.0% 98.8% 98.4% 0.3% 0.1% 1.3% 98.2% +0.7%G 85.2% 9.6% 4.2% 1.0% 85.7% 84.0% 9.8% 4.5% 1.7% 85.2% +1.2%
S Rock 98.0% 1.8% 0.2% 0.0% 96.7% 94.8% 3.0% 1.2% 1.0% 95.2% +3.2%J 85.8% 8.4% 3.9% 2.0% 84.6% 87.1% 8.3% 3.6% 1.0% 87.6% -1.3%L 79.5% 12.0% 5.6% 2.9% 82.8% 89.7% 6.7% 2.9% 0.8% 86.2% -10.2%M 91.4% 5.6% 1.8% 1.2% 82.3% 78.3% 11.3% 6.5% 3.9% 78.0% +13.1%N 79.3% 10.7% 6.7% 3.3% 75.3% 79.2% 10.7% 6.9% 3.1% 79.7% +0.1%Q 79.4% 11.3% 6.7% 2.5% 78.4% 76.7% 11.0% 7.6% 4.7% 82.2% +2.7%R 80.8% 11.4% 5.7% 2.1% 80.4% 81.0% 10.5% 6.0% 2.5% 80.1% -0.2%
Subdivision B 81.1% 10.1% 5.6% 3.3% 80.6% 82.2% 9.9% 5.5% 2.4% 81.7% -1.1%
Systemwide 78.1% 10.2% 7.1% 4.5% 80.4% 83.1% 9.2% 5.1% 2.7% 82.1% -5.0%
Weekend Wait Assessment Discussion
Subway Weekend Wait Assessment(6 a.m. - midnight)
Dec 20 Dec 19
Note: B and W lines do not operate on weekends.
• Wait Assessment for December 2020 worsened by 5.0% compared to December 2019.
Desired trend
Chart 16
Master Page # 36 of 228 - New York City Transit and Bus Committee Meeting 1/21/2021________________________________________________________________________________
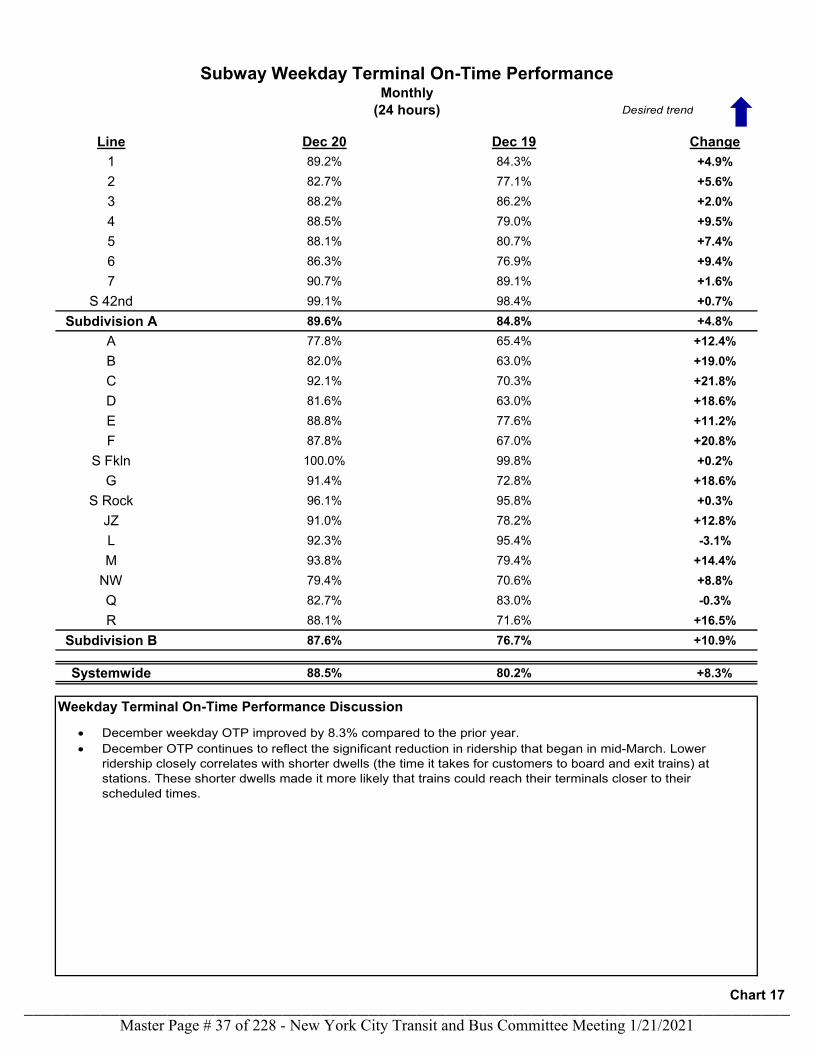
Line Dec 20 Dec 19 Change1 89.2% 84.3% +4.9%2 82.7% 77.1% +5.6%3 88.2% 86.2% +2.0%4 88.5% 79.0% +9.5%5 88.1% 80.7% +7.4%6 86.3% 76.9% +9.4%7 90.7% 89.1% +1.6%
S 42nd 99.1% 98.4% +0.7%Subdivision A 89.6% 84.8% +4.8%
A 77.8% 65.4% +12.4%B 82.0% 63.0% +19.0%C 92.1% 70.3% +21.8%D 81.6% 63.0% +18.6%E 88.8% 77.6% +11.2%F 87.8% 67.0% +20.8%
S Fkln 100.0% 99.8% +0.2%G 91.4% 72.8% +18.6%
S Rock 96.1% 95.8% +0.3%JZ 91.0% 78.2% +12.8%L 92.3% 95.4% -3.1%M 93.8% 79.4% +14.4%
NW 79.4% 70.6% +8.8%Q 82.7% 83.0% -0.3%R 88.1% 71.6% +16.5%
Subdivision B 87.6% 76.7% +10.9%
Systemwide 88.5% 80.2% +8.3%
Weekday Terminal On-Time Performance Discussion
(24 hours)
Subway Weekday Terminal On-Time PerformanceMonthly
Desired trend
• December weekday OTP improved by 8.3% compared to the prior year. • December OTP continues to reflect the significant reduction in ridership that began in mid-March. Lower
ridership closely correlates with shorter dwells (the time it takes for customers to board and exit trains) at stations. These shorter dwells made it more likely that trains could reach their terminals closer to their scheduled times.
Chart 17
Master Page # 37 of 228 - New York City Transit and Bus Committee Meeting 1/21/2021________________________________________________________________________________
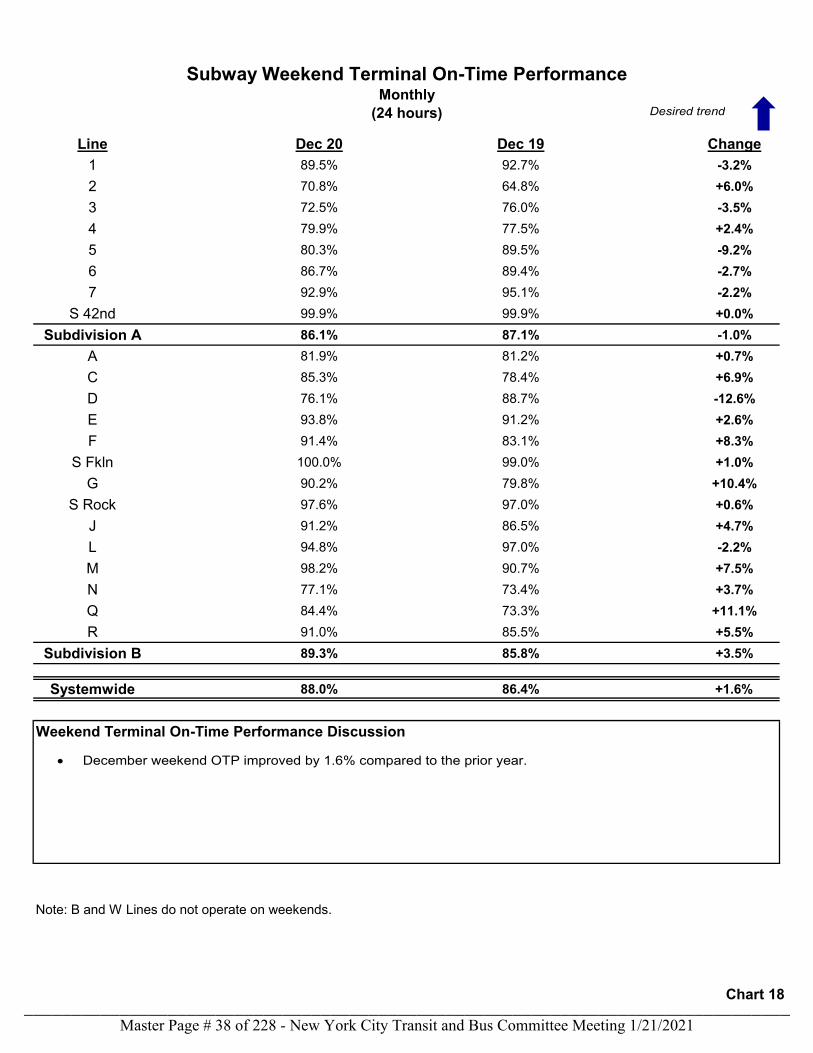
Line Dec 20 Dec 19 Change1 89.5% 92.7% -3.2%2 70.8% 64.8% +6.0%3 72.5% 76.0% -3.5%4 79.9% 77.5% +2.4%5 80.3% 89.5% -9.2%6 86.7% 89.4% -2.7%7 92.9% 95.1% -2.2%
S 42nd 99.9% 99.9% +0.0%Subdivision A 86.1% 87.1% -1.0%
A 81.9% 81.2% +0.7%C 85.3% 78.4% +6.9%D 76.1% 88.7% -12.6%E 93.8% 91.2% +2.6%F 91.4% 83.1% +8.3%
S Fkln 100.0% 99.0% +1.0%G 90.2% 79.8% +10.4%
S Rock 97.6% 97.0% +0.6%J 91.2% 86.5% +4.7%L 94.8% 97.0% -2.2%M 98.2% 90.7% +7.5%N 77.1% 73.4% +3.7%Q 84.4% 73.3% +11.1%R 91.0% 85.5% +5.5%
Subdivision B 89.3% 85.8% +3.5%
Systemwide 88.0% 86.4% +1.6%
Weekend Terminal On-Time Performance Discussion
Note: B and W Lines do not operate on weekends.
(24 hours)
Subway Weekend Terminal On-Time PerformanceMonthly
Desired trend
• December weekend OTP improved by 1.6% compared to the prior year.
Chart 18
Master Page # 38 of 228 - New York City Transit and Bus Committee Meeting 1/21/2021________________________________________________________________________________
Delay Categories Trains
Delayed
Delayed Trains Per
Day (22)% of Delayed
Trains
Track Failures and Emergency Remediation 972 44 4.8%Rail and Roadbed 596 27 2.9%Fire, Smoke, Debris 376 17 1.8%
Signal Failures and Emergency Remediation 3,925 178 19.2%
Subway Car 1,106 50 5.4%Door-Related 248 11 1.2%Propulsion 335 15 1.6%Braking 307 14 1.5%Other 216 10 1.1%
Stations and Structure 132 6 0.6%
Other Internal 4,399 200 21.6%Service Delivery (e.g. crew performance) 4,214 192 20.7%
Train Brake Activation - cause unknown 124 6 0.6%
Other Internal Disruptions (e.g. IT system failure) 61 3 0.3%
External 5,294 241 26.0%Public Conduct, Crime, Police Response 1,820 83 9.0%Sick/Injured Customer 617 28 3.0%Persons on Roadbed (including persons struck by train) 1,134 52 5.6%External Debris on Roadbed (e.g., trees, shopping cart) 164 7 0.8%Inclement Weather 1,343 61 6.6%External Agency or Utility 216 10 1.1%
Operating Environment 1,748 79 8.5%
Planned Right-of-Way Work 2,794 127 13.7%
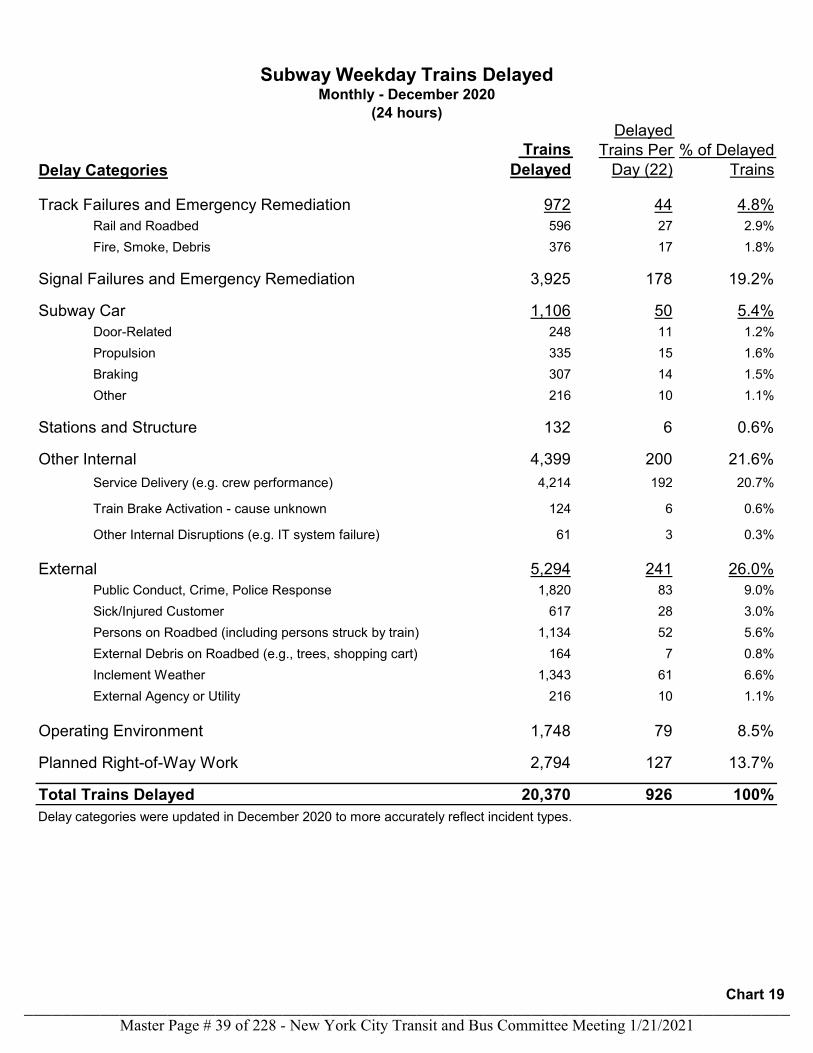
Total Trains Delayed 20,370 926 100%Delay categories were updated in December 2020 to more accurately reflect incident types.
Subway Weekday Trains DelayedMonthly - December 2020
(24 hours)
Chart 19
Master Page # 39 of 228 - New York City Transit and Bus Committee Meeting 1/21/2021________________________________________________________________________________
Delay Categories Trains
Delayed
Delayed Trains Per
Day (9)
% of Delayed
Trains
Track Failures and Emergency Remediation 144 16 2.5%Rail and Roadbed 106 12 1.8%Fire, Smoke, Debris 38 4 0.7%
Signal Failures and Emergency Remediation 698 78 12.0%
Subway Car 186 21 3.2%Door-Related 70 8 1.2%Propulsion 21 2 0.4%Braking 32 4 0.6%Other 63 7 1.1%
Stations and Structure 125 14 2.2%
Other Internal 902 100 15.6%Service Delivery (e.g. crew performance) 882 98 15.2%Train Brake Activation - cause unknown 18 2 0.3%Other Internal Disruptions (e.g. IT system failure) 2 0 0.0%
External 1,636 182 28.2%Public Conduct, Crime, Police Response 677 75 11.7%Sick/Injured Customer 121 13 2.1%Persons on Roadbed (including persons struck by train) 344 38 5.9%External Debris on Roadbed (e.g., trees, shopping cart) 38 4 0.7%Inclement Weather 101 11 1.7%External Agency or Utility 355 39 6.1%
Operating Environment 868 96 15.0%
Planned Right-of-Way Work 1,235 137 21.3%
Total Trains Delayed 5,794 644 100%Delay categories were updated in December 2020 to more accurately reflect incident types.
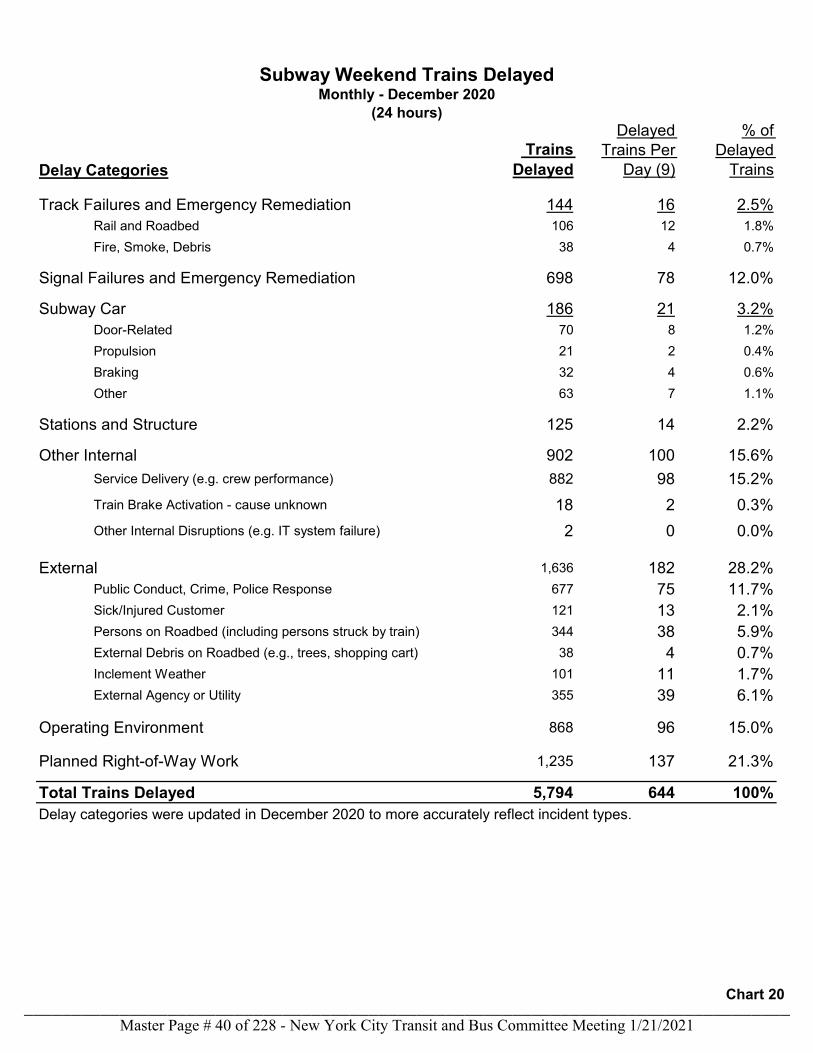
Subway Weekend Trains DelayedMonthly - December 2020
(24 hours)
Chart 20
Master Page # 40 of 228 - New York City Transit and Bus Committee Meeting 1/21/2021________________________________________________________________________________
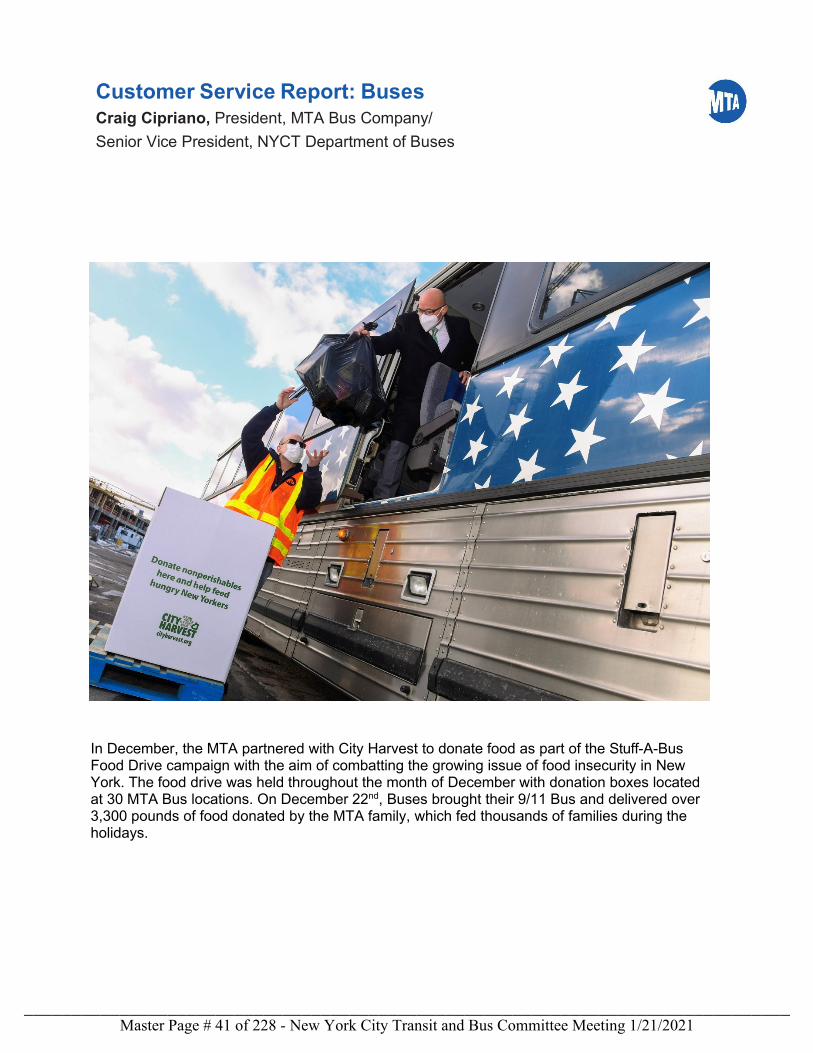
Customer Service Report: Buses Craig Cipriano, President, MTA Bus Company/ Senior Vice President, NYCT Department of Buses
In December, the MTA partnered with City Harvest to donate food as part of the Stuff-A-Bus Food Drive campaign with the aim of combatting the growing issue of food insecurity in New York. The food drive was held throughout the month of December with donation boxes located at 30 MTA Bus locations. On December 22nd, Buses brought their 9/11 Bus and delivered over 3,300 pounds of food donated by the MTA family, which fed thousands of families during the holidays.
Master Page # 41 of 228 - New York City Transit and Bus Committee Meeting 1/21/2021________________________________________________________________________________
January 2021 Highlights: Buses On behalf of the Buses team I want to wish everyone a happy New Year. As we kick off 2021, we are filled with a sense of hope and optimism after what has arguably been one of the most difficult years in our history. Despite everything, ridership during the pandemic reached up to 60% of pre-pandemic levels, demonstrating what a critical lifeline our bus system is for essential workers and many other New Yorkers across all five boroughs. This year we will continue to push for bus priority and are committed to the recovery of this great City, serving our customers every day to keep this region moving.
As we begin the year, we are reminded to stay vigilant as COVID-19 cases continue to surge in the City as well as across the country. We continue our historic cleaning and disinfection campaign, as well as the distribution of masks. This month we completed the installation of permanent polycarbonate barriers around the bus operator compartment on 4,800 local buses. The new barriers are part of our commitment to continuously protect our heroic bus operators while they keep the City moving. The barriers were developed jointly with our vendors and installed in record time using our own in-house forces. In addition, this month marks the beginning of the vaccine rollout to the next group of New Yorkers, including transit workers. Along with our COVID-19 testing program, vaccination is the best way to protect ourselves and each other so that we can continue to lead New York’s recovery.
Also, I want to thank my team for successfully navigating the first snowstorm of the season last month. With the accumulation of 12 inches of snow in parts of the City, we saw more snowfall than all of the prior winter. Buses was well prepared. All local buses had tire chains and articulated buses were replaced by standard 40-foot buses. In addition, 35 snow fighters were available to operate in trafficked areas such as terminals, lay-over locations, facilities and known hotspots.
Finally, in December, the MTA also came together with City Harvest to sponsor a “Stuff-a-Bus” food drive. Our aim was to help New Yorkers struggling with food insecurity, a bigger concern than ever during the pandemic. Donation boxes were set up to collect food from 30 locations across the MTA. A total of over 3,300 pounds of generous employee food donations were delivered to City Harvest’s headquarters in Long Island City. The MTA was one of the biggest donors to City Harvest, helping feed thousands of families through the holidays. It was truly symbolic to be able to deliver the food using our 9/11 bus. This bus was covered in dust, ash and falling debris on the morning of September 11, 2001. We decided to rebuild her as a symbol of NYC’s resiliency and the dedication of our heroic employees.
This year we will continue to prove our resilience and the power of our heroic employees. Stay safe, and please remember to wear your mask.
Craig Cipriano President, MTA Bus Company/ Senior Vice President, NYCT Department of Buses
Master Page # 42 of 228 - New York City Transit and Bus Committee Meeting 1/21/2021________________________________________________________________________________
Current Month: December 2020 12-Month Average
This Year Last Year Change This Year Last Year Change
Service Delivered (Chart 1) 94.3% 96.8% -2.5% 96.1% 97.3% -1.2%
Additional Bus Stop Time (h:mm:ss) (Chart 3)* 0:01:50 0:01:48 0:00:02 0:01:34 0:01:44 -0:00:10
Additional Travel Time (h:mm:ss) (Chart 5)* -0:00:27 0:00:49 -0:01:16 0:00:01 0:00:47 -0:00:46
Customer Journey Time Performance (Chart 7)* 78.1% 71.4% +6.7% +77.4% +72.3% +5.1%
Mean Distance Between Failures (Chart 9) 8,478 7,791 +8.8% 8,263 7,749 +6.6%
Speed (MPH) (Chart 11) 8.3 7.9 +4.9% 8.4 8.0 +5.3%
Wait Assessment (Chart 13) 77.3% 76.9% +0.4% 80.0% 77.8% +2.2%
System MDBSI (Chart 16) 3,286 2,792 +17.7% 3,592 3,029 +18.6%
NYCT Bus 3,155 2,653 +18.9% 3,411 2,879 +18.5%
MTA Bus 3,779 3,345 +13.0% 4,296 3,644 +17.9%
System Trips Completed (Chart 17)* 96.7% 99.1% -2.4% 98.0% 99.2% -1.2%
NYCT Bus 97.0% 99.2% -2.2% 98.1% 99.3% -1.2%
MTA Bus 95.4% 98.8% -3.4% 97.4% 98.9% -1.5%
System AM Pull Out (Chart 18)* 96.3% 99.5% -3.2% 98.2% 99.8% -1.6%
NYCT Bus 96.5% 99.7% -3.2% 98.4% 99.8% -1.4%
MTA Bus 95.3% 99.2% -3.9% 97.6% 99.5% -1.9%
System PM Pull Out (Chart 19)* 97.3% 99.7% -2.4% 98.6% 99.8% -1.2%
NYCT Bus 97.6% 99.8% -2.2% 98.8% 99.9% -1.1%
MTA Bus 96.0% 99.3% -3.3% 98.0% 99.5% -1.5%
System Buses>=12 years 20.4% 19.0%
NYCT Bus 9.2% 6.8%
MTA Bus 60.0% 62.0%
System Fleet Age 8.0 7.2
NYCT Bus 7.0 6.1
MTA Bus 11.8 11.1
*NOTE: Due to severe disruptions in bus ridership and service associated with the COVID-19 pandemic, this report includes the following adjustments:- 12-month averages for ABST, ATT, and CJTP metrics exclude April - August 2020- 12-month averages for Trips Completed, AM Pull Out, and PM Pull Out metrics exclude April and May 2020
System refers to the combined results of NYCT Bus and MTA Bus. Change values for time- and percentage-based metrics are calculated as absolute values. All other change values are calculated as percentage changes.
Legacy Indicators
Bus Report
Performance Indicator
Bus Report Performance Indicators
Category
Customer Focused Metrics
Inputs To Operations
Note: The metrics in this report are preliminary
Master Page # 43 of 228 - New York City Transit and Bus Committee Meeting 1/21/2021________________________________________________________________________________
Performance Indicator Definitions
Service Delivered
Additional Bus Stop Time (ABST)
Additional Travel Time (ATT)
Customer Journey Time Performance (CJTP)
Section 1: Customer Focused Metrics
Customer Journey Time Performance (CJTP) estimates the percentage of customers who complete their journey (ABST + ATT) within 5 minutes of the scheduled time. This is a new indicator for the MTA, but is used by other transit agencies to measure service. CJTP is measured using customers’ MetroCard swipes and OMNY taps on buses combined with GPS tracking data from Bus Time. This indicator is likely to be refined and enhanced over time as the MTA gains experience integrating the latest technology. CJTP is reported for trips starting between 4am to 11pm on weekdays.
Additional Bus Stop Time (ABST) is the estimated average extra time that customers wait at a stop for a bus, compared with their scheduled wait time. The measure assumes customers arrive at the bus stop at a uniform rate, except for routes with longer headways, where customers arrive more closely aligned to the schedule. ABST (sometimes referred to as Excess Wait Time) is a new indicator for the MTA, and is considered an industry best practice worldwide. ABST is estimated using customers’ MetroCard swipes and OMNY taps on buses combined with GPS tracking data from Bus Time. This indicator is likely to be refined and enhanced over time as the MTA gains experience integrating the latest technology. ABST is reported for trips starting between 4am to 11pm on weekdays.
The metrics in this section measure bus performance as it affects our passengers. By focusing on how closely actual service matches schedules and how much longer passengers must wait and ride compared to schedules, these measures collectively reflect customer experience.
Additional Travel Time (ATT) is the estimated average extra time customers are onboard the bus compared to their scheduled onboard time. ATT (sometimes referred to as Excess In-Vehicle Travel Time) is a new indicator for the MTA, and is considered an industry best practice worldwide. ATT is estimated using customers’ MetroCard swipes and OMNY taps on buses combined with GPS tracking data from Bus Time. This indicator is likely to be refined and enhanced over time as the MTA gains experience integrating the latest technology. ATT is reported for trips starting between 4am to 11pm on weekdays.
Service Delivered (sometimes referred to as throughput) measures our ability to deliver the scheduled service. It is calculated as the percentage of scheduled bus trips that are actually provided during peak hours (7-9am and 4-7pm on weekdays). Service Delivered is measured at the peak load point, which is the stop on the route where the bus is most crowded, using GPS tracking data from buses as well as bus depot operations records.
Note: The metrics in this report are preliminary
Master Page # 44 of 228 - New York City Transit and Bus Committee Meeting 1/21/2021________________________________________________________________________________
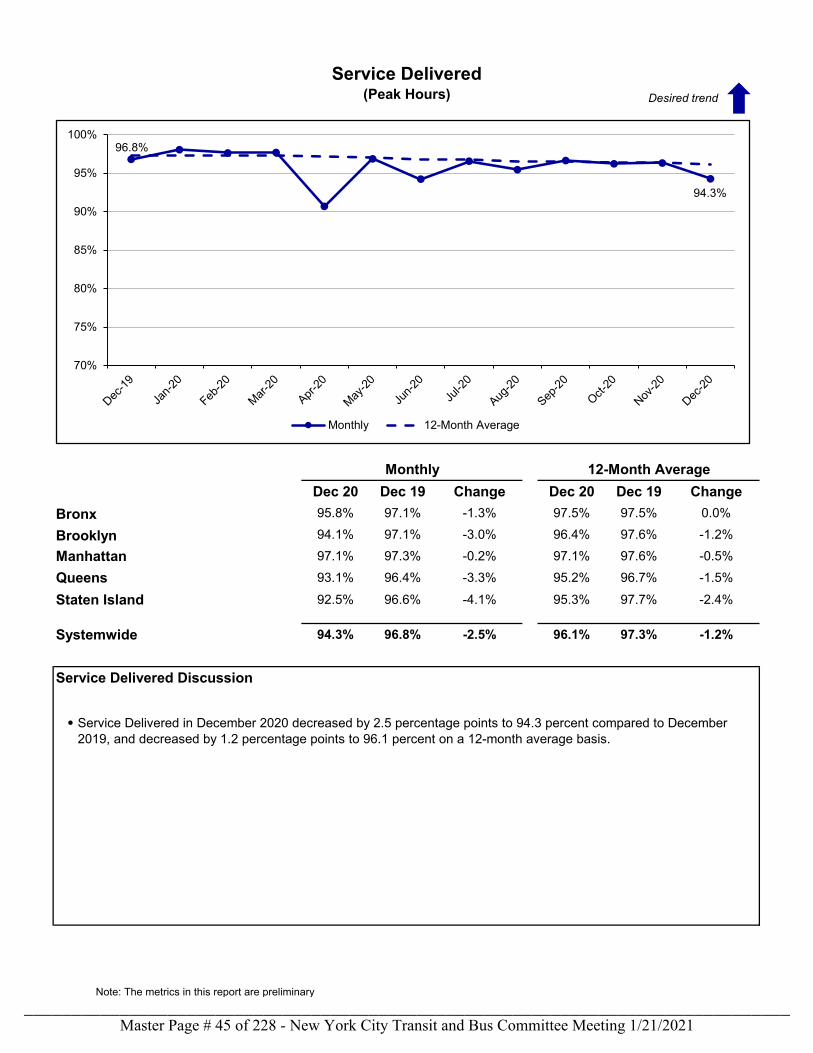
Dec 20 Dec 19 Change Dec 20 Dec 19 ChangeBronx 95.8% 97.1% -1.3% 97.5% 97.5% 0.0%
Brooklyn 94.1% 97.1% -3.0% 96.4% 97.6% -1.2%
Manhattan 97.1% 97.3% -0.2% 97.1% 97.6% -0.5%
Queens 93.1% 96.4% -3.3% 95.2% 96.7% -1.5%
Staten Island 92.5% 96.6% -4.1% 95.3% 97.7% -2.4%
Systemwide 94.3% 96.8% -2.5% 96.1% 97.3% -1.2%
Service Delivered Discussion
Service Delivered in December 2020 decreased by 2.5 percentage points to 94.3 percent compared to December 2019, and decreased by 1.2 percentage points to 96.1 percent on a 12-month average basis.
Monthly 12-Month Average
Service Delivered(Peak Hours)
96.8%
94.3%
70%
75%
80%
85%
90%
95%
100%
Monthly 12-Month Average
Desired trend
•
Note: The metrics in this report are preliminary
Master Page # 45 of 228 - New York City Transit and Bus Committee Meeting 1/21/2021________________________________________________________________________________
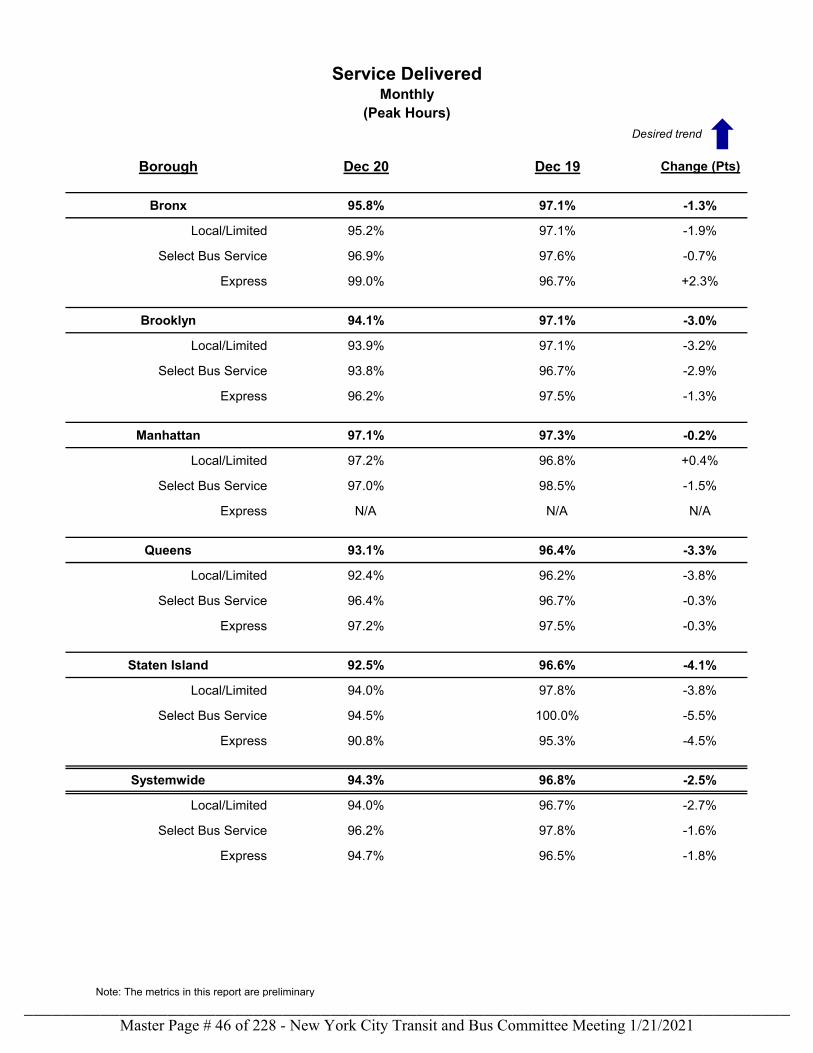
Borough Dec 20 Dec 19 Change (Pts)
Bronx 95.8% 97.1% -1.3%
Bronx Local/Limited 95.2% 97.1% -1.9%
Bronx Select Bus Service 96.9% 97.6% -0.7%
Bronx Express 99.0% 96.7% +2.3%
Brooklyn 94.1% 97.1% -3.0%
Brooklyn Local/Limited 93.9% 97.1% -3.2%
Brooklyn Select Bus Service 93.8% 96.7% -2.9%
Brooklyn Express 96.2% 97.5% -1.3%
Manhattan 97.1% 97.3% -0.2%
Manhattan Local/Limited 97.2% 96.8% +0.4%
Manhattan Select Bus Service 97.0% 98.5% -1.5%
Manhattan Express N/A N/A N/A
Queens 93.1% 96.4% -3.3%
Queens Local/Limited 92.4% 96.2% -3.8%
Queens Select Bus Service 96.4% 96.7% -0.3%
Queens Express 97.2% 97.5% -0.3%
Staten Island 92.5% 96.6% -4.1%
Staten Island Local/Limited 94.0% 97.8% -3.8%
Staten Island Select Bus Service 94.5% 100.0% -5.5%
Staten Island Express 90.8% 95.3% -4.5%
Systemwide 94.3% 96.8% -2.5%
Systemwide Local/Limited 94.0% 96.7% -2.7%
Systemwide Select Bus Service 96.2% 97.8% -1.6%
Systemwide Express 94.7% 96.5% -1.8%
Service DeliveredMonthly
(Peak Hours)Desired trend
Note: The metrics in this report are preliminary
Master Page # 46 of 228 - New York City Transit and Bus Committee Meeting 1/21/2021________________________________________________________________________________
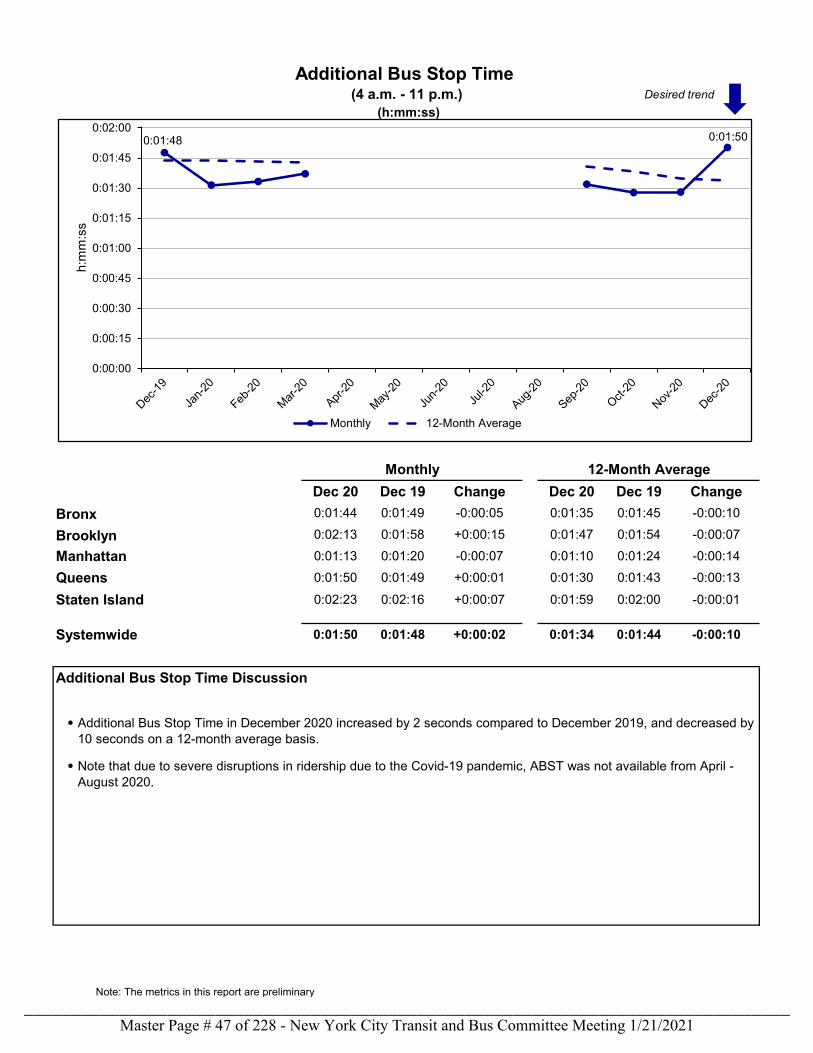
Dec 20 Dec 19 Change Dec 20 Dec 19 ChangeBronx 0:01:44 0:01:49 -0:00:05 0:01:35 0:01:45 -0:00:10
Brooklyn 0:02:13 0:01:58 +0:00:15 0:01:47 0:01:54 -0:00:07
Manhattan 0:01:13 0:01:20 -0:00:07 0:01:10 0:01:24 -0:00:14
Queens 0:01:50 0:01:49 +0:00:01 0:01:30 0:01:43 -0:00:13
Staten Island 0:02:23 0:02:16 +0:00:07 0:01:59 0:02:00 -0:00:01
Systemwide 0:01:50 0:01:48 +0:00:02 0:01:34 0:01:44 -0:00:10
Additional Bus Stop Time Discussion
(h:mm:ss)
Monthly 12-Month Average
Additional Bus Stop Time in December 2020 increased by 2 seconds compared to December 2019, and decreased by 10 seconds on a 12-month average basis.
Note that due to severe disruptions in ridership due to the Covid-19 pandemic, ABST was not available from April - August 2020.
Additional Bus Stop Time (4 a.m. - 11 p.m.)
0:01:48 0:01:50
0:00:00
0:00:15
0:00:30
0:00:45
0:01:00
0:01:15
0:01:30
0:01:45
0:02:00
h:m
m:s
s
Monthly 12-Month Average
Desired trend
•
•
Note: The metrics in this report are preliminary
Master Page # 47 of 228 - New York City Transit and Bus Committee Meeting 1/21/2021________________________________________________________________________________
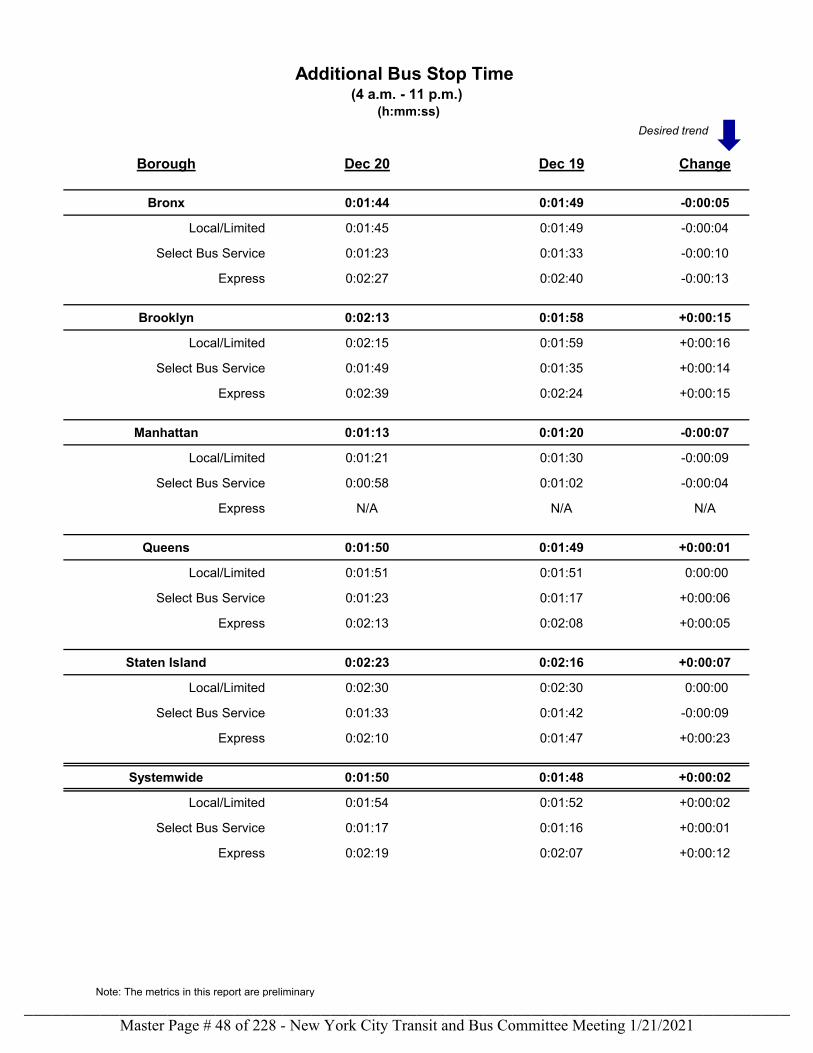
Borough Dec 20 Dec 19 Change
Bronx 0:01:44 0:01:49 -0:00:05
Bronx Local/Limited 0:01:45 0:01:49 -0:00:04
Bronx Select Bus Service 0:01:23 0:01:33 -0:00:10
Bronx Express 0:02:27 0:02:40 -0:00:13
Brooklyn 0:02:13 0:01:58 +0:00:15
Brooklyn Local/Limited 0:02:15 0:01:59 +0:00:16
Brooklyn Select Bus Service 0:01:49 0:01:35 +0:00:14
Brooklyn Express 0:02:39 0:02:24 +0:00:15
Manhattan 0:01:13 0:01:20 -0:00:07
Manhattan Local/Limited 0:01:21 0:01:30 -0:00:09
Manhattan Select Bus Service 0:00:58 0:01:02 -0:00:04
Manhattan Express N/A N/A N/A
Queens 0:01:50 0:01:49 +0:00:01
Queens Local/Limited 0:01:51 0:01:51 0:00:00
Queens Select Bus Service 0:01:23 0:01:17 +0:00:06
Queens Express 0:02:13 0:02:08 +0:00:05
Staten Island 0:02:23 0:02:16 +0:00:07
Staten Island Local/Limited 0:02:30 0:02:30 0:00:00
Staten Island Select Bus Service 0:01:33 0:01:42 -0:00:09
Staten Island Express 0:02:10 0:01:47 +0:00:23
Systemwide 0:01:50 0:01:48 +0:00:02
Systemwide Local/Limited 0:01:54 0:01:52 +0:00:02
Systemwide Select Bus Service 0:01:17 0:01:16 +0:00:01
Systemwide Express 0:02:19 0:02:07 +0:00:12
Additional Bus Stop Time (4 a.m. - 11 p.m.)
(h:mm:ss)Desired trend
Note: The metrics in this report are preliminary
Master Page # 48 of 228 - New York City Transit and Bus Committee Meeting 1/21/2021________________________________________________________________________________
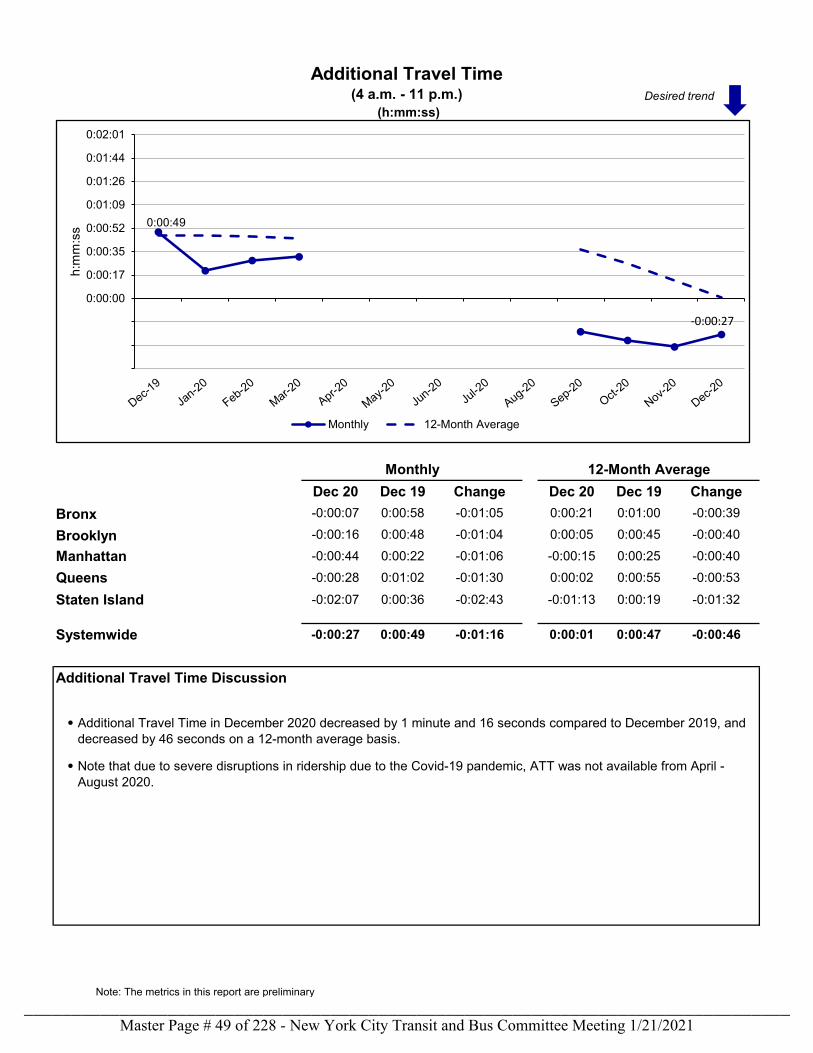
Dec 20 Dec 19 Change Dec 20 Dec 19 ChangeBronx -0:00:07 0:00:58 -0:01:05 0:00:21 0:01:00 -0:00:39
Brooklyn -0:00:16 0:00:48 -0:01:04 0:00:05 0:00:45 -0:00:40
Manhattan -0:00:44 0:00:22 -0:01:06 -0:00:15 0:00:25 -0:00:40
Queens -0:00:28 0:01:02 -0:01:30 0:00:02 0:00:55 -0:00:53
Staten Island -0:02:07 0:00:36 -0:02:43 -0:01:13 0:00:19 -0:01:32
Systemwide -0:00:27 0:00:49 -0:01:16 0:00:01 0:00:47 -0:00:46
Additional Travel Time Discussion
Additional Travel Time(4 a.m. - 11 p.m.)
Additional Travel Time in December 2020 decreased by 1 minute and 16 seconds compared to December 2019, and decreased by 46 seconds on a 12-month average basis.
(h:mm:ss)
Monthly 12-Month Average
Note that due to severe disruptions in ridership due to the Covid-19 pandemic, ATT was not available from April - August 2020.
0:00:49
0:00:00
0:00:17
0:00:35
0:00:52
0:01:09
0:01:26
0:01:44
0:02:01
h:m
m:s
s
Monthly 12-Month Average
-0:00:27
Desired trend
•
•
Note: The metrics in this report are preliminary
Master Page # 49 of 228 - New York City Transit and Bus Committee Meeting 1/21/2021________________________________________________________________________________
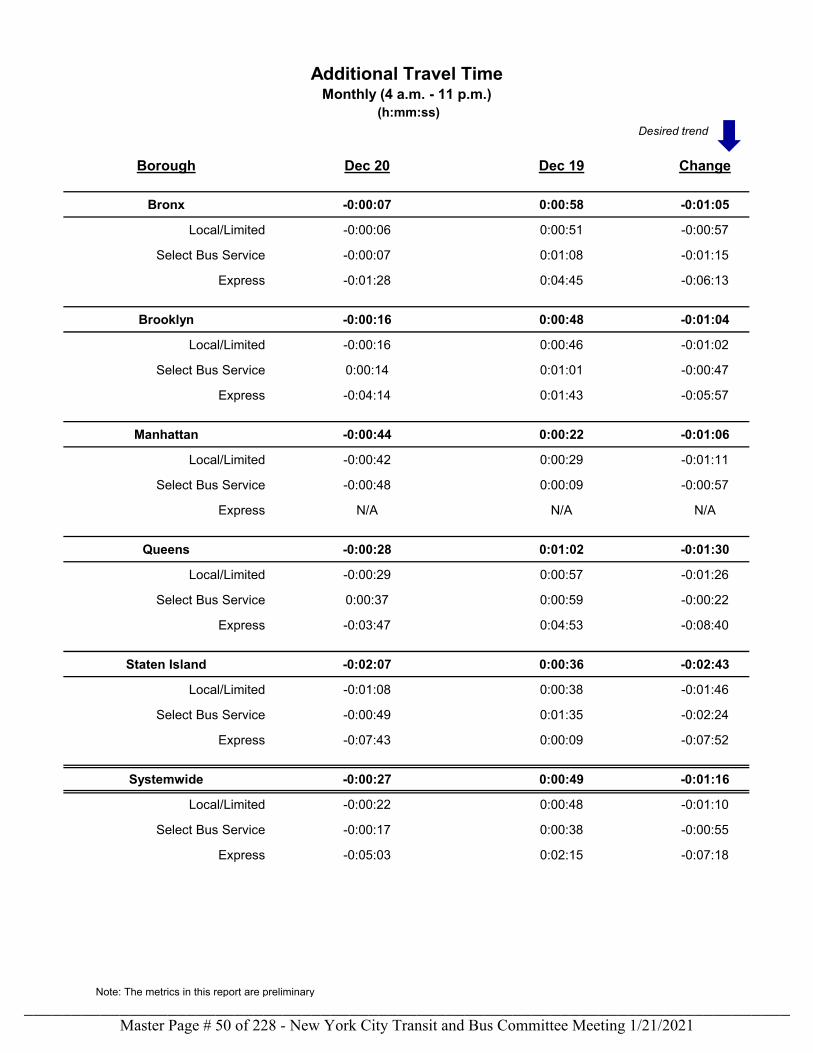
Borough Dec 20 Dec 19 Change
Bronx -0:00:07 0:00:58 -0:01:05
Bronx Local/Limited -0:00:06 0:00:51 -0:00:57
Bronx Select Bus Service -0:00:07 0:01:08 -0:01:15
Bronx Express -0:01:28 0:04:45 -0:06:13
Brooklyn -0:00:16 0:00:48 -0:01:04
Brooklyn Local/Limited -0:00:16 0:00:46 -0:01:02
Brooklyn Select Bus Service 0:00:14 0:01:01 -0:00:47
Brooklyn Express -0:04:14 0:01:43 -0:05:57
Manhattan -0:00:44 0:00:22 -0:01:06
Manhattan Local/Limited -0:00:42 0:00:29 -0:01:11
Manhattan Select Bus Service -0:00:48 0:00:09 -0:00:57
Manhattan Express N/A N/A N/A
Queens -0:00:28 0:01:02 -0:01:30
Queens Local/Limited -0:00:29 0:00:57 -0:01:26
Queens Select Bus Service 0:00:37 0:00:59 -0:00:22
Queens Express -0:03:47 0:04:53 -0:08:40
Staten Island -0:02:07 0:00:36 -0:02:43
Staten Island Local/Limited -0:01:08 0:00:38 -0:01:46
Staten Island Select Bus Service -0:00:49 0:01:35 -0:02:24
Staten Island Express -0:07:43 0:00:09 -0:07:52
Systemwide -0:00:27 0:00:49 -0:01:16
Systemwide Local/Limited -0:00:22 0:00:48 -0:01:10
Systemwide Select Bus Service -0:00:17 0:00:38 -0:00:55
Systemwide Express -0:05:03 0:02:15 -0:07:18
Additional Travel TimeMonthly (4 a.m. - 11 p.m.)
(h:mm:ss)Desired trend
Note: The metrics in this report are preliminary
Master Page # 50 of 228 - New York City Transit and Bus Committee Meeting 1/21/2021________________________________________________________________________________
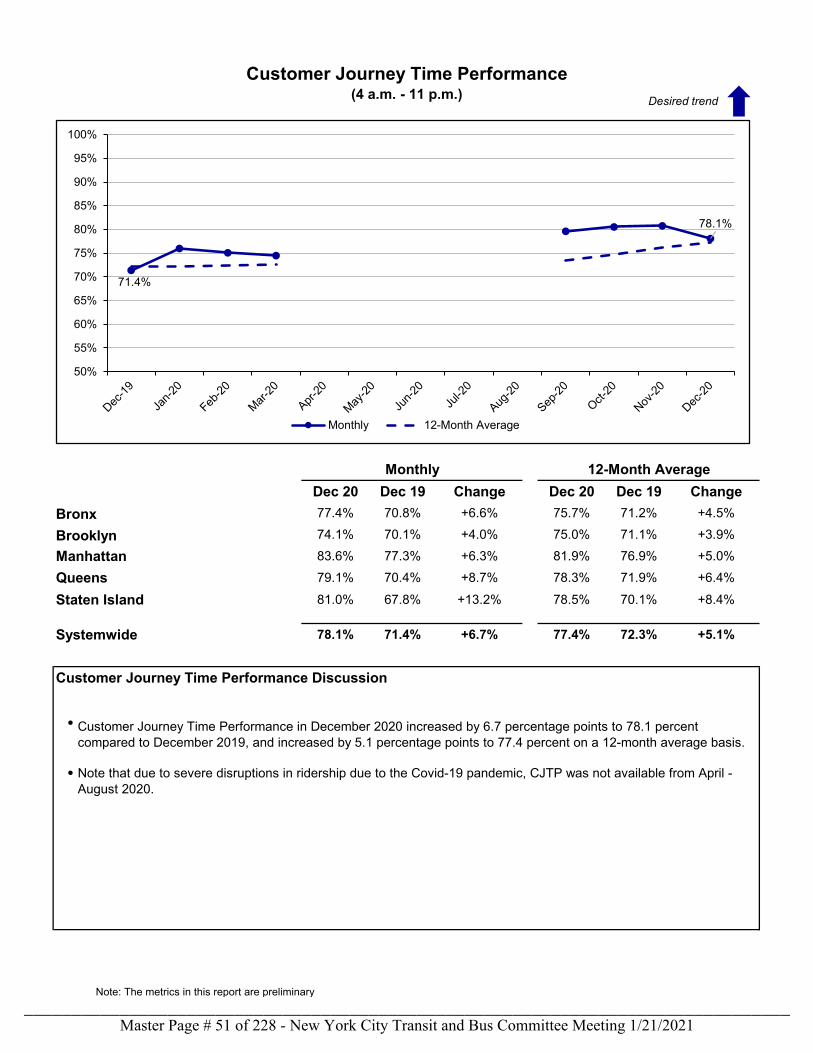
Dec 20 Dec 19 Change Dec 20 Dec 19 ChangeBronx 77.4% 70.8% +6.6% 75.7% 71.2% +4.5%
Brooklyn 74.1% 70.1% +4.0% 75.0% 71.1% +3.9%
Manhattan 83.6% 77.3% +6.3% 81.9% 76.9% +5.0%
Queens 79.1% 70.4% +8.7% 78.3% 71.9% +6.4%
Staten Island 81.0% 67.8% +13.2% 78.5% 70.1% +8.4%
Systemwide 78.1% 71.4% +6.7% 77.4% 72.3% +5.1%
Customer Journey Time Performance Discussion
Note that due to severe disruptions in ridership due to the Covid-19 pandemic, CJTP was not available from April - August 2020.
Customer Journey Time Performance(4 a.m. - 11 p.m.)
Customer Journey Time Performance in December 2020 increased by 6.7 percentage points to 78.1 percent compared to December 2019, and increased by 5.1 percentage points to 77.4 percent on a 12-month average basis.
Monthly 12-Month Average
71.4%
78.1%
50%
55%
60%
65%
70%
75%
80%
85%
90%
95%
100%
Monthly 12-Month Average
Desired trend
•
•
Note: The metrics in this report are preliminary
Master Page # 51 of 228 - New York City Transit and Bus Committee Meeting 1/21/2021________________________________________________________________________________
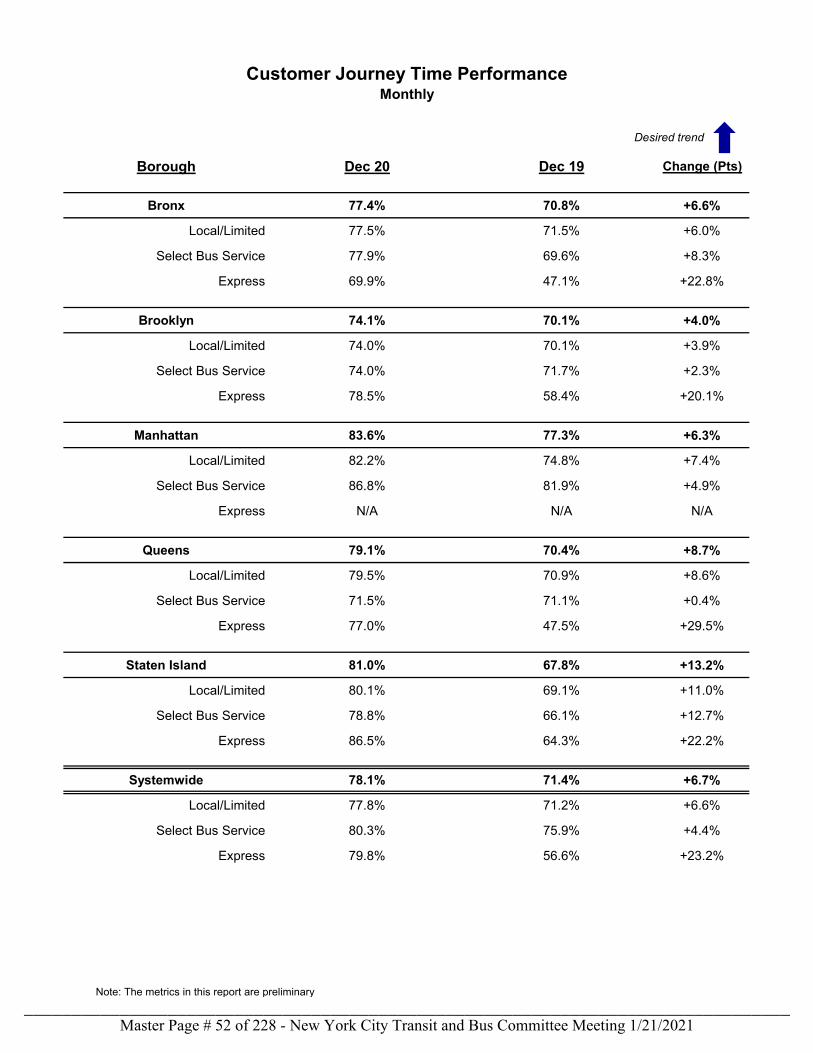
Borough Dec 20 Dec 19 Change (Pts)
Bronx 77.4% 70.8% +6.6%
Bronx Local/Limited 77.5% 71.5% +6.0%
Bronx Select Bus Service 77.9% 69.6% +8.3%
Bronx Express 69.9% 47.1% +22.8%
Brooklyn 74.1% 70.1% +4.0%
Brooklyn Local/Limited 74.0% 70.1% +3.9%
Brooklyn Select Bus Service 74.0% 71.7% +2.3%
Brooklyn Express 78.5% 58.4% +20.1%
Manhattan 83.6% 77.3% +6.3%
Manhattan Local/Limited 82.2% 74.8% +7.4%
Manhattan Select Bus Service 86.8% 81.9% +4.9%
Manhattan Express N/A N/A N/A
Queens 79.1% 70.4% +8.7%
Queens Local/Limited 79.5% 70.9% +8.6%
Queens Select Bus Service 71.5% 71.1% +0.4%
Queens Express 77.0% 47.5% +29.5%
Staten Island 81.0% 67.8% +13.2%
Staten Island Local/Limited 80.1% 69.1% +11.0%
Staten Island Select Bus Service 78.8% 66.1% +12.7%
Staten Island Express 86.5% 64.3% +22.2%
Systemwide 78.1% 71.4% +6.7%
Systemwide Local/Limited 77.8% 71.2% +6.6%
Systemwide Select Bus Service 80.3% 75.9% +4.4%
Systemwide Express 79.8% 56.6% +23.2%
Customer Journey Time PerformanceMonthly
Desired trend
Note: The metrics in this report are preliminary
Master Page # 52 of 228 - New York City Transit and Bus Committee Meeting 1/21/2021________________________________________________________________________________
Performance Indicator Definitions
Mean Distance Between Failures (MDBF)
Bus SpeedsBus speeds measure how quickly buses travel along their routes. The average end-to-end speed is the total distance traveled along a route divided by the total time, using bus GPS data.
Mean Distance Between Failures (MDBF) reports how frequently mechanical problems such as engine failures or electrical malfunctions cause delays. It is calculated by dividing the number of miles buses run in service by the number of incidents due to mechanical problems.
MDBF numbers include weekdays and weekends. This borough and trip-type combinations (Chart 10) are reported as a 12-month average.
Section 2: Inputs to Operations
The metrics in this section address how NYCT provides service to its customers by measuring the reliability of bus performance and the impact of bus speed on operations.
Note: The metrics in this report are preliminary
Master Page # 53 of 228 - New York City Transit and Bus Committee Meeting 1/21/2021________________________________________________________________________________
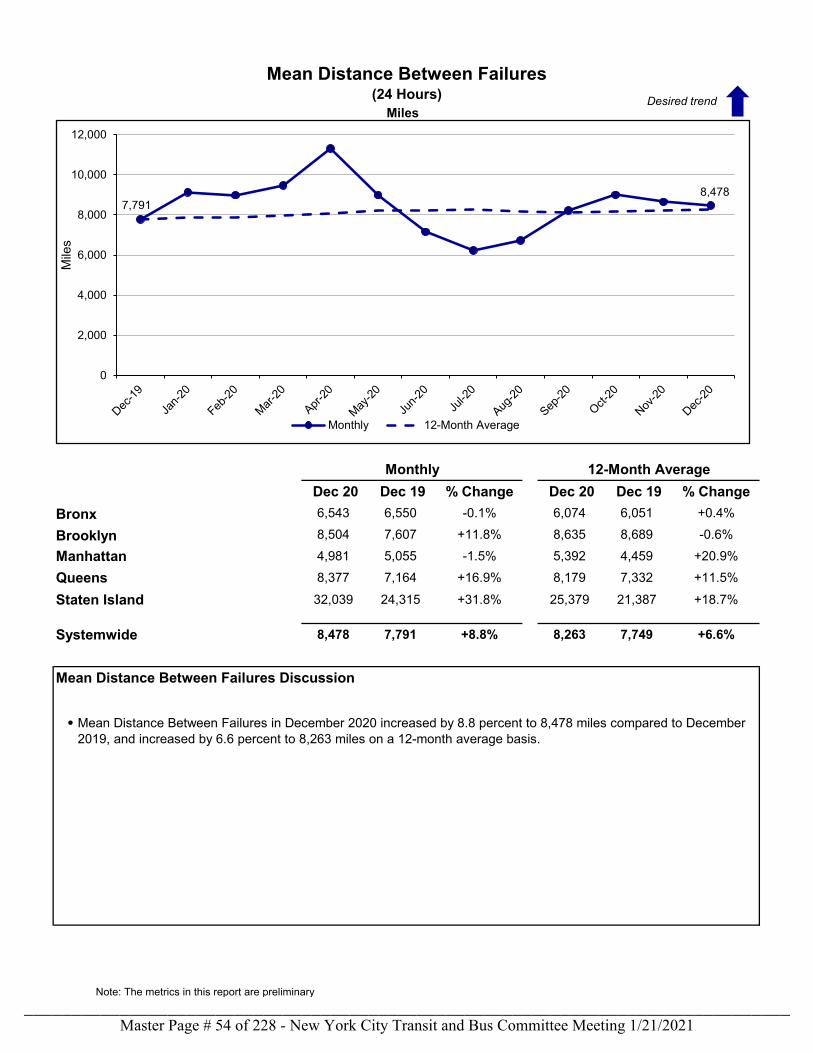
Miles
Dec 20 Dec 19 % Change Dec 20 Dec 19 % ChangeBronx 6,543 6,550 -0.1% 6,074 6,051 +0.4%
Brooklyn 8,504 7,607 +11.8% 8,635 8,689 -0.6%
Manhattan 4,981 5,055 -1.5% 5,392 4,459 +20.9%
Queens 8,377 7,164 +16.9% 8,179 7,332 +11.5%
Staten Island 32,039 24,315 +31.8% 25,379 21,387 +18.7%
Systemwide 8,478 7,791 +8.8% 8,263 7,749 +6.6%
Mean Distance Between Failures Discussion
Mean Distance Between Failures in December 2020 increased by 8.8 percent to 8,478 miles compared to December 2019, and increased by 6.6 percent to 8,263 miles on a 12-month average basis.
Monthly 12-Month Average
Mean Distance Between Failures(24 Hours)
7,7918,478
0
2,000
4,000
6,000
8,000
10,000
12,000
Mile
s
Monthly 12-Month Average
Desired trend
•
Note: The metrics in this report are preliminary
Master Page # 54 of 228 - New York City Transit and Bus Committee Meeting 1/21/2021________________________________________________________________________________
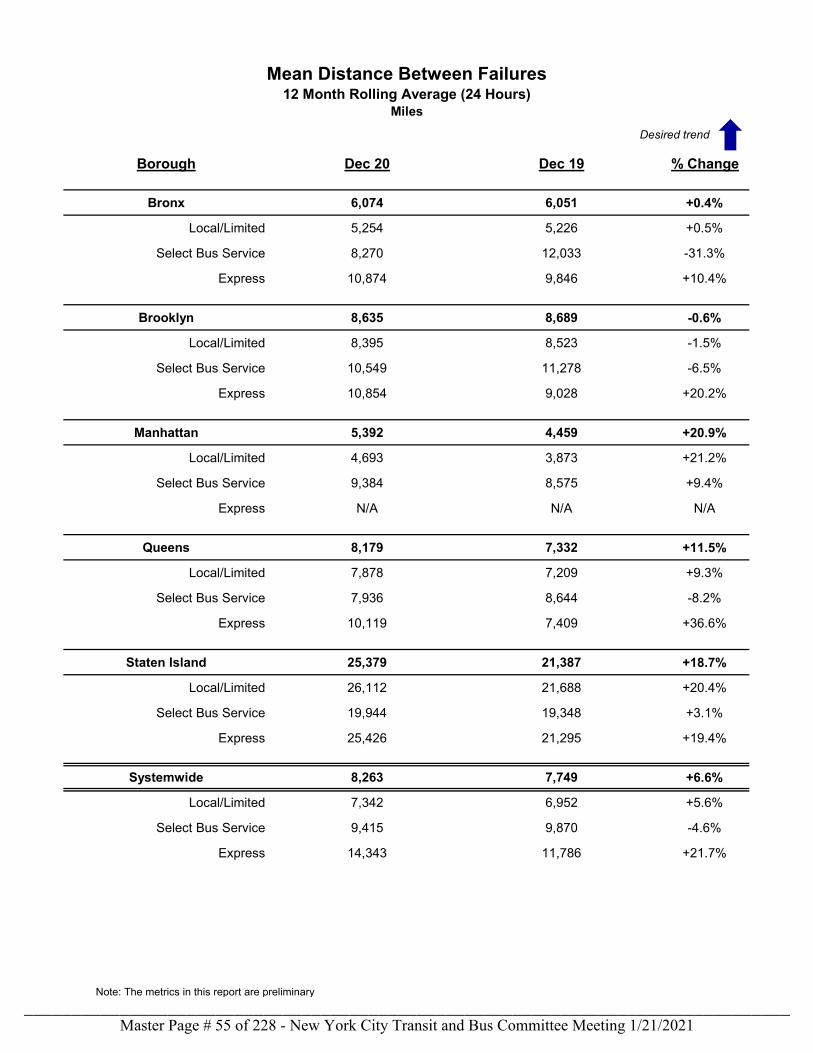
Borough Dec 20 Dec 19 % Change
Bronx 6,074 6,051 +0.4%
Bronx Local/Limited 5,254 5,226 +0.5%
Bronx Select Bus Service 8,270 12,033 -31.3%
Bronx Express 10,874 9,846 +10.4%
Brooklyn 8,635 8,689 -0.6%
Brooklyn Local/Limited 8,395 8,523 -1.5%
Brooklyn Select Bus Service 10,549 11,278 -6.5%
Brooklyn Express 10,854 9,028 +20.2%
Manhattan 5,392 4,459 +20.9%
Manhattan Local/Limited 4,693 3,873 +21.2%
Manhattan Select Bus Service 9,384 8,575 +9.4%
Manhattan Express N/A N/A N/A
Queens 8,179 7,332 +11.5%
Queens Local/Limited 7,878 7,209 +9.3%
Queens Select Bus Service 7,936 8,644 -8.2%
Queens Express 10,119 7,409 +36.6%
Staten Island 25,379 21,387 +18.7%
Staten Island Local/Limited 26,112 21,688 +20.4%
Staten Island Select Bus Service 19,944 19,348 +3.1%
Staten Island Express 25,426 21,295 +19.4%
Systemwide 8,263 7,749 +6.6%
Systemwide Local/Limited 7,342 6,952 +5.6%
Systemwide Select Bus Service 9,415 9,870 -4.6%
Systemwide Express 14,343 11,786 +21.7%
Mean Distance Between Failures12 Month Rolling Average (24 Hours)
MilesDesired trend
Note: The metrics in this report are preliminary
Master Page # 55 of 228 - New York City Transit and Bus Committee Meeting 1/21/2021________________________________________________________________________________
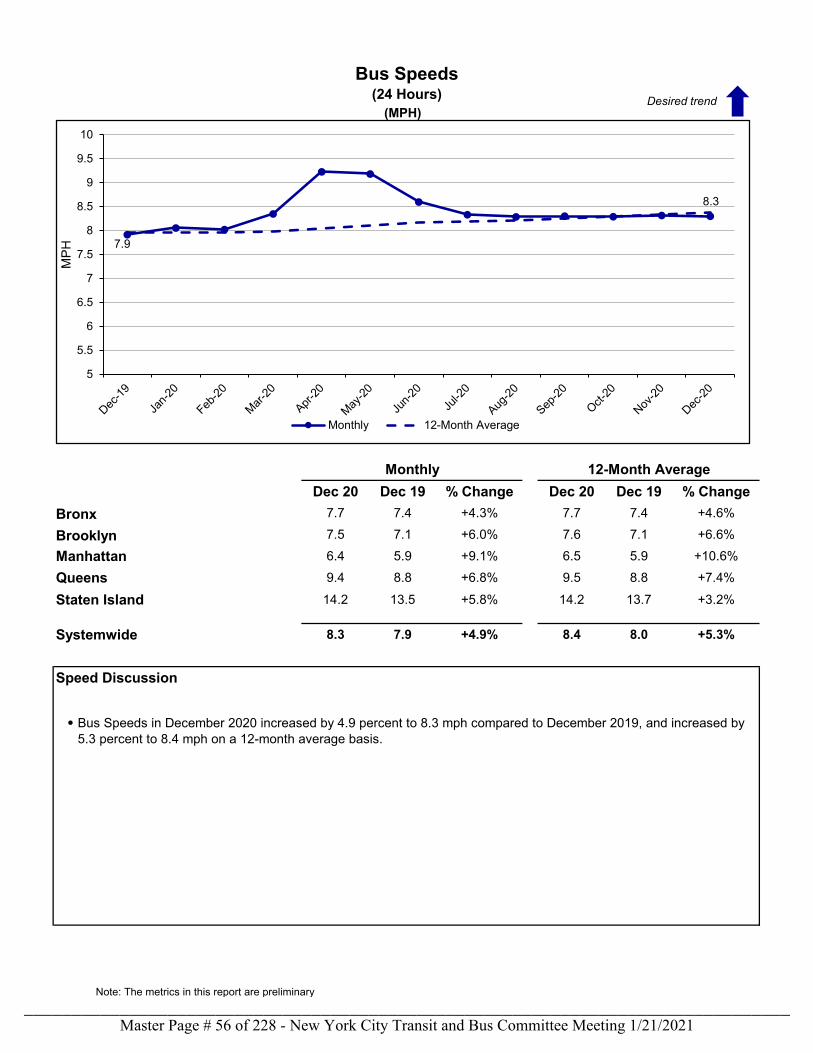
(MPH)
Dec 20 Dec 19 % Change Dec 20 Dec 19 % ChangeBronx 7.7 7.4 +4.3% 7.7 7.4 +4.6%
Brooklyn 7.5 7.1 +6.0% 7.6 7.1 +6.6%
Manhattan 6.4 5.9 +9.1% 6.5 5.9 +10.6%
Queens 9.4 8.8 +6.8% 9.5 8.8 +7.4%
Staten Island 14.2 13.5 +5.8% 14.2 13.7 +3.2%
Systemwide 8.3 7.9 +4.9% 8.4 8.0 +5.3%
Speed Discussion
Bus Speeds in December 2020 increased by 4.9 percent to 8.3 mph compared to December 2019, and increased by 5.3 percent to 8.4 mph on a 12-month average basis.
Monthly 12-Month Average
Bus Speeds(24 Hours)
7.9
8.3
5
5.5
6
6.5
7
7.5
8
8.5
9
9.5
10
MPH
Monthly 12-Month Average
Desired trend
•
Note: The metrics in this report are preliminary
Master Page # 56 of 228 - New York City Transit and Bus Committee Meeting 1/21/2021________________________________________________________________________________
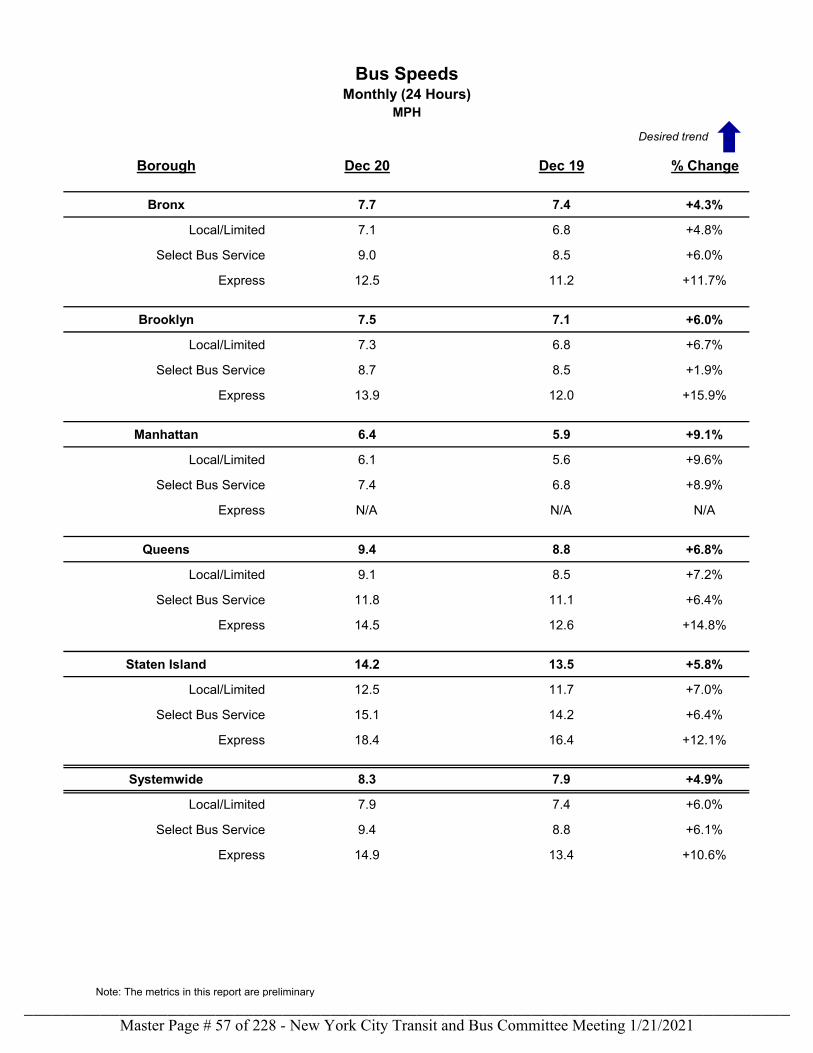
Borough Dec 20 Dec 19 % Change
Bronx 7.7 7.4 +4.3%
Bronx Local/Limited 7.1 6.8 +4.8%
Bronx Select Bus Service 9.0 8.5 +6.0%
Bronx Express 12.5 11.2 +11.7%
Brooklyn 7.5 7.1 +6.0%
Brooklyn Local/Limited 7.3 6.8 +6.7%
Brooklyn Select Bus Service 8.7 8.5 +1.9%
Brooklyn Express 13.9 12.0 +15.9%
Manhattan 6.4 5.9 +9.1%
Manhattan Local/Limited 6.1 5.6 +9.6%
Manhattan Select Bus Service 7.4 6.8 +8.9%
Manhattan Express N/A N/A N/A
Queens 9.4 8.8 +6.8%
Queens Local/Limited 9.1 8.5 +7.2%
Queens Select Bus Service 11.8 11.1 +6.4%
Queens Express 14.5 12.6 +14.8%
Staten Island 14.2 13.5 +5.8%
Staten Island Local/Limited 12.5 11.7 +7.0%
Staten Island Select Bus Service 15.1 14.2 +6.4%
Staten Island Express 18.4 16.4 +12.1%
Systemwide 8.3 7.9 +4.9%
Systemwide Local/Limited 7.9 7.4 +6.0%
Systemwide Select Bus Service 9.4 8.8 +6.1%
Systemwide Express 14.9 13.4 +10.6%
Bus SpeedsMonthly (24 Hours)
MPH
Desired trend
Note: The metrics in this report are preliminary
Master Page # 57 of 228 - New York City Transit and Bus Committee Meeting 1/21/2021________________________________________________________________________________
Performance Indicator Definitions
Wait Assessment
Bus Mean Distance Between Service Interruptions
Bus Percentage of Completed Trips
Bus AM Weekday Pull Out Performance
Bus PM Weekday Pull Out Performance
Bus Percentage of Completed Trips is the percent of trips completed system wide for the 12-month period. The sytemwide metric is the combined results of NYCT Bus and MTA Bus.
Bus AM Weekday Pull Out Performance is the percent of required buses and operators available in the AM peak period. The sytemwide metric is the combined results of NYCT Bus and MTA Bus.
Bus PM Weekday Pull Out Performance is the percent of required buses and operators available in the PM peak period. The sytemwide metric is the combined results of NYCT Bus and MTA Bus.
Section 3: Legacy Indicators
Wait Assessment (WA) measures how evenly buses are spaced at selected timepoints along each route. It is defined as the percentage of actual intervals between buses that are no more than three minutes over the scheduled interval for the morning (7-9am) and afternoon (4-7pm) peak periods and no more than five minutes over the scheduled interval for the rest of the day. This measure provides a percentage of buses passing the standard, but it does not account for extra service operated, it is not weighted to how many customers are waiting for buses at different stops, it does not distinguish between relatively minor gaps in service and major delays, and it is not a true measurement of time customers spend waiting at stops.
Bus Mean Distance Between Service Interruptions is the average distance traveled by a bus between all delays and/or inconveniences to customers within a 12-month period. All road calls caused by both mechanical and non-mechanical failures are included.
The metrics in this section have been shared with the public for many years. While less reflective of the customer experience, they are included here for continuity purposes.
Note: The metrics in this report are preliminary
Master Page # 58 of 228 - New York City Transit and Bus Committee Meeting 1/21/2021________________________________________________________________________________
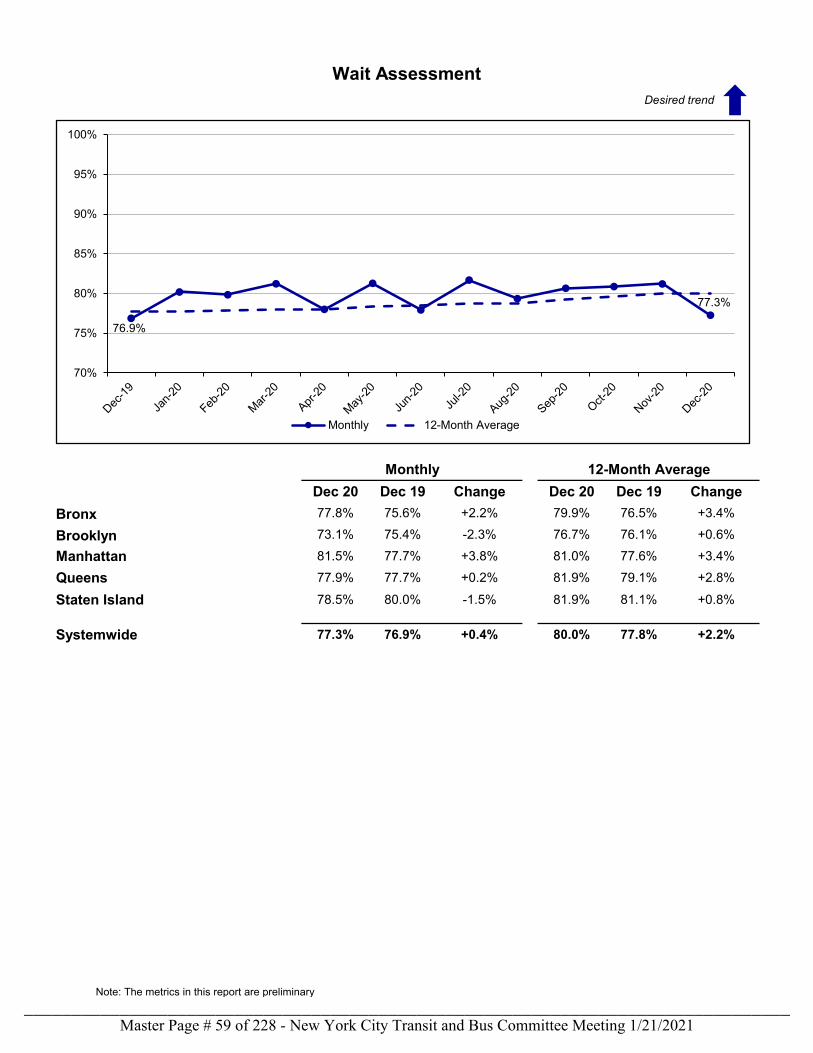
Dec 20 Dec 19 Change Dec 20 Dec 19 ChangeBronx 77.8% 75.6% +2.2% 79.9% 76.5% +3.4%
Brooklyn 73.1% 75.4% -2.3% 76.7% 76.1% +0.6%
Manhattan 81.5% 77.7% +3.8% 81.0% 77.6% +3.4%
Queens 77.9% 77.7% +0.2% 81.9% 79.1% +2.8%
Staten Island 78.5% 80.0% -1.5% 81.9% 81.1% +0.8%
Systemwide 77.3% 76.9% +0.4% 80.0% 77.8% +2.2%
Wait Assessment
Monthly 12-Month Average
76.9%
77.3%
70%
75%
80%
85%
90%
95%
100%
Monthly 12-Month Average
Desired trend
Note: The metrics in this report are preliminary
Master Page # 59 of 228 - New York City Transit and Bus Committee Meeting 1/21/2021________________________________________________________________________________
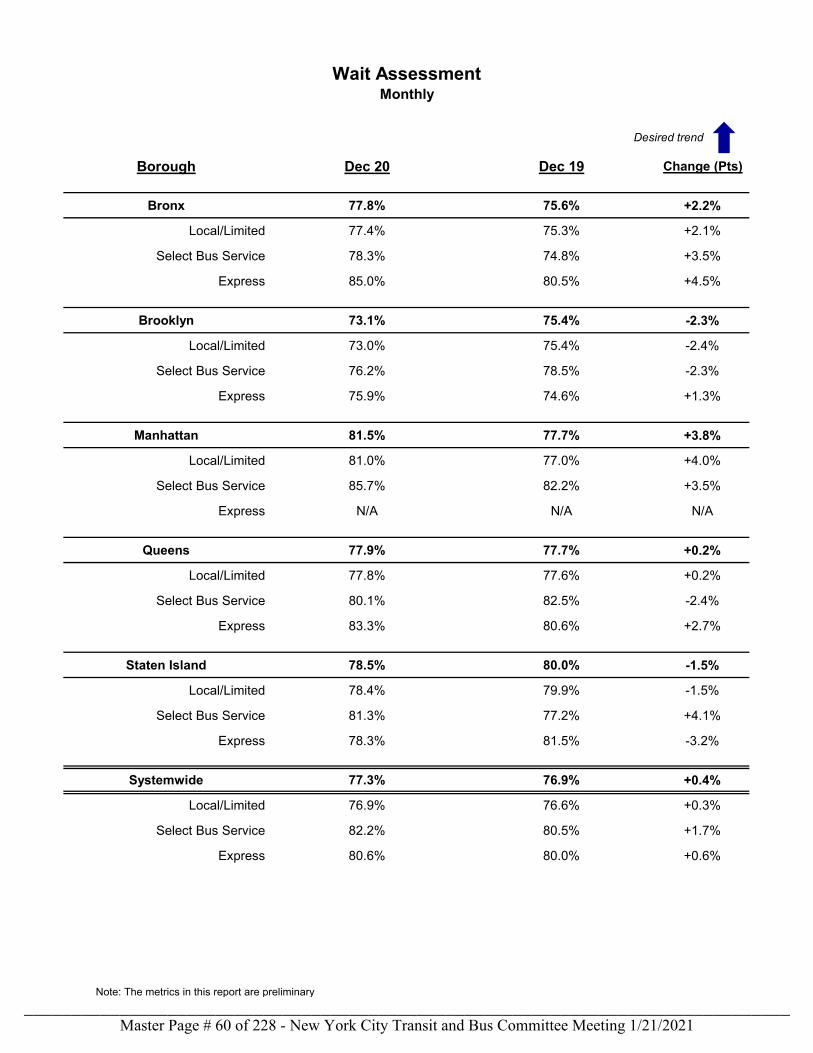
Borough Dec 20 Dec 19 Change (Pts)
Bronx 77.8% 75.6% +2.2%
Bronx Local/Limited 77.4% 75.3% +2.1%
Bronx Select Bus Service 78.3% 74.8% +3.5%
Bronx Express 85.0% 80.5% +4.5%
Brooklyn 73.1% 75.4% -2.3%
Brooklyn Local/Limited 73.0% 75.4% -2.4%
Brooklyn Select Bus Service 76.2% 78.5% -2.3%
Brooklyn Express 75.9% 74.6% +1.3%
Manhattan 81.5% 77.7% +3.8%
Manhattan Local/Limited 81.0% 77.0% +4.0%
Manhattan Select Bus Service 85.7% 82.2% +3.5%
Manhattan Express N/A N/A N/A
Queens 77.9% 77.7% +0.2%
Queens Local/Limited 77.8% 77.6% +0.2%
Queens Select Bus Service 80.1% 82.5% -2.4%
Queens Express 83.3% 80.6% +2.7%
Staten Island 78.5% 80.0% -1.5%
Staten Island Local/Limited 78.4% 79.9% -1.5%
Staten Island Select Bus Service 81.3% 77.2% +4.1%
Staten Island Express 78.3% 81.5% -3.2%
Systemwide 77.3% 76.9% +0.4%
Systemwide Local/Limited 76.9% 76.6% +0.3%
Systemwide Select Bus Service 82.2% 80.5% +1.7%
Systemwide Express 80.6% 80.0% +0.6%
Wait AssessmentMonthly
Desired trend
Note: The metrics in this report are preliminary
Master Page # 60 of 228 - New York City Transit and Bus Committee Meeting 1/21/2021________________________________________________________________________________
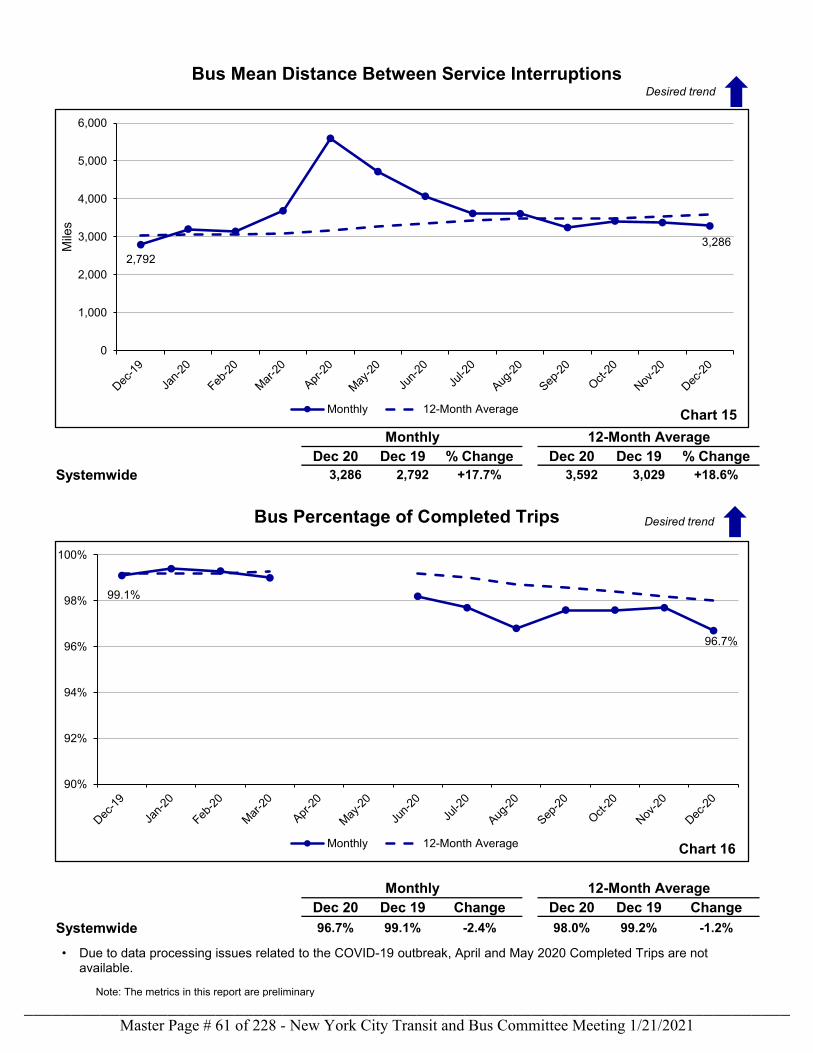
Dec 20 Dec 19 % Change Dec 20 Dec 19 % ChangeSystemwide 3,286 2,792 +17.7% 3,592 3,029 +18.6%
Dec 20 Dec 19 Change Dec 20 Dec 19 ChangeSystemwide 96.7% 99.1% -2.4% 98.0% 99.2% -1.2%
Monthly 12-Month Average
Bus Mean Distance Between Service Interruptions
Monthly 12-Month Average
Bus Percentage of Completed Trips
2,7923,286
0
1,000
2,000
3,000
4,000
5,000
6,000
Mile
s
Chart 15Monthly 12-Month Average
99.1%
96.7%
90%
92%
94%
96%
98%
100%
Chart 16Monthly 12-Month Average
• Due to data processing issues related to the COVID-19 outbreak, April and May 2020 Completed Trips are notavailable.
Desired trend
Desired trend
Note: The metrics in this report are preliminary
Master Page # 61 of 228 - New York City Transit and Bus Committee Meeting 1/21/2021________________________________________________________________________________
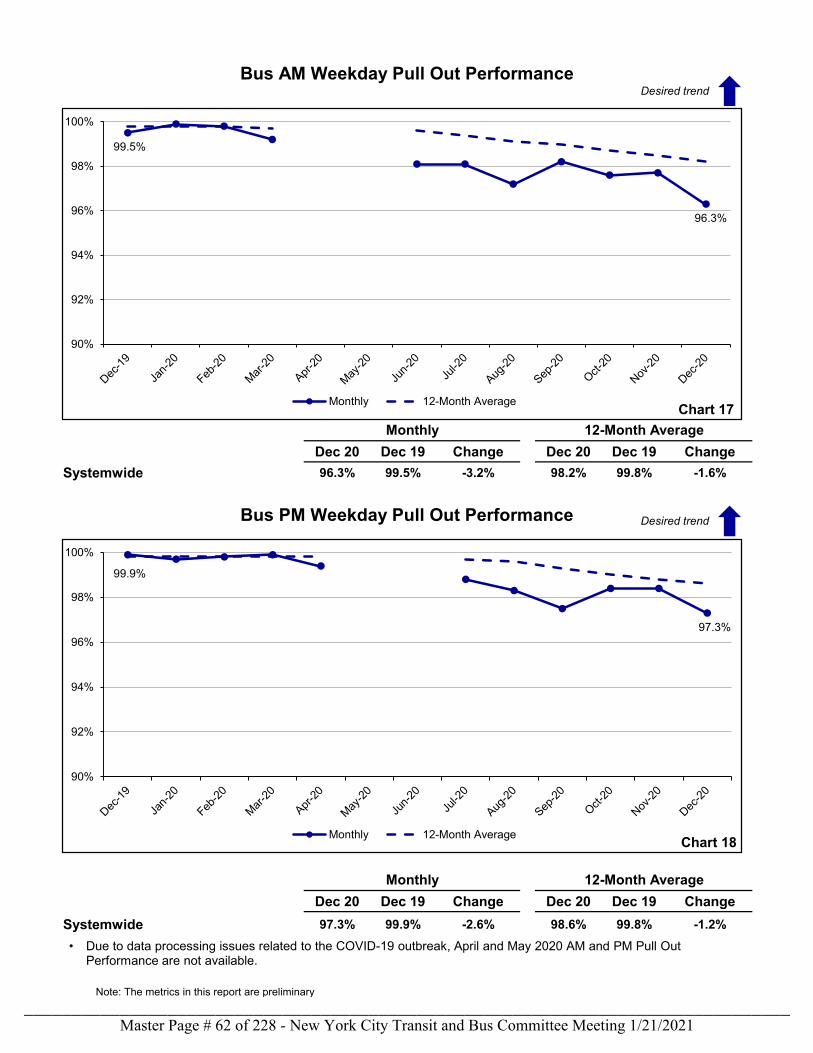
Dec 20 Dec 19 Change Dec 20 Dec 19 ChangeSystemwide 96.3% 99.5% -3.2% 98.2% 99.8% -1.6%
Dec 20 Dec 19 Change Dec 20 Dec 19 ChangeSystemwide 97.3% 99.9% -2.6% 98.6% 99.8% -1.2%
Bus AM Weekday Pull Out Performance
Monthly 12-Month Average
Bus PM Weekday Pull Out Performance
Monthly 12-Month Average
99.5%
96.3%
90%
92%
94%
96%
98%
100%
Chart 17Monthly 12-Month Average
99.9%
97.3%
90%
92%
94%
96%
98%
100%
Chart 18Monthly 12-Month Average
• Due to data processing issues related to the COVID-19 outbreak, April and May 2020 AM and PM Pull Out Performance are not available.
Desired trend
Desired trend
Note: The metrics in this report are preliminary
Master Page # 62 of 228 - New York City Transit and Bus Committee Meeting 1/21/2021________________________________________________________________________________
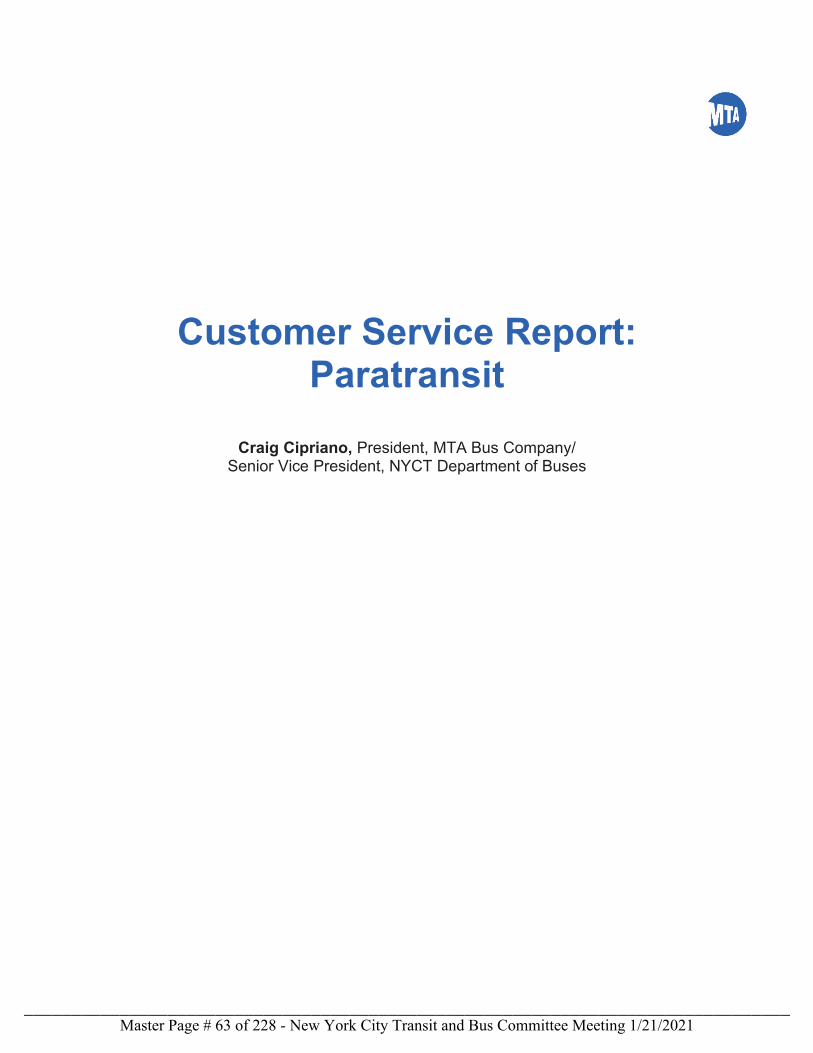
Customer Service Report:Paratransit
Craig Cipriano, President, MTA Bus Company/Senior Vice President, NYCT Department of Buses
Master Page # 63 of 228 - New York City Transit and Bus Committee Meeting 1/21/2021________________________________________________________________________________
January 2021 Highlights: Paratransit Paratransit weekday trips remain steady at 70% of pre-pandemic levels, even as COVID-19 numbers continue to grow. As service has increased, performance has remained stable. On-Time Performance has exceeded the goals for both the 30-Minute and 15-Minute windows. Average trip duration or ride time continues to remain low (29 minutes) in November. Max ride time performance for both Primary and Broker remain at 99%.
Last month Paratransit reopened a third assessment center in the Bronx to support the return to a more regular eligibility process. Like the centers in Manhattan and Staten Island, the Bronx assessment center is operating at 25% (pre-pandemic) capacity to maintain proper social distancing.
Last month Paratransit reopened a third assessment center in the Bronx to support the return to a more regular eligibility process. Like the centers in Manhattan and Staten Island, the Bronx assessment center is operating at 25% (pre-pandemic) capacity to maintain proper social distancing.
On January 19, 2021, we resumed fare collection on all Paratransit vehicles. The cash fare had been suspended since March 2020 due to the pandemic. We notified our Paratransit customers of this change through email, text alert, automated announcements on the Paratransit phone line, social media, and outreach events, along with posters on Paratransit vehicles.
I also want to thank our Paratransit team for their efforts during the December snowstorm, ensuring our customers were always kept informed of conditions and traveled safely and comfortably during the storm. The Winter 2020/2021 “On The Move” newsletter has been published and can be accessed online at https://new.mta.info/document/25971.
We look forward to another year of working together to promote accessibility.
Craig Cipriano President, MTA Bus Company/ Senior Vice President, NYCT Department of Buses
Master Page # 64 of 228 - New York City Transit and Bus Committee Meeting 1/21/2021________________________________________________________________________________
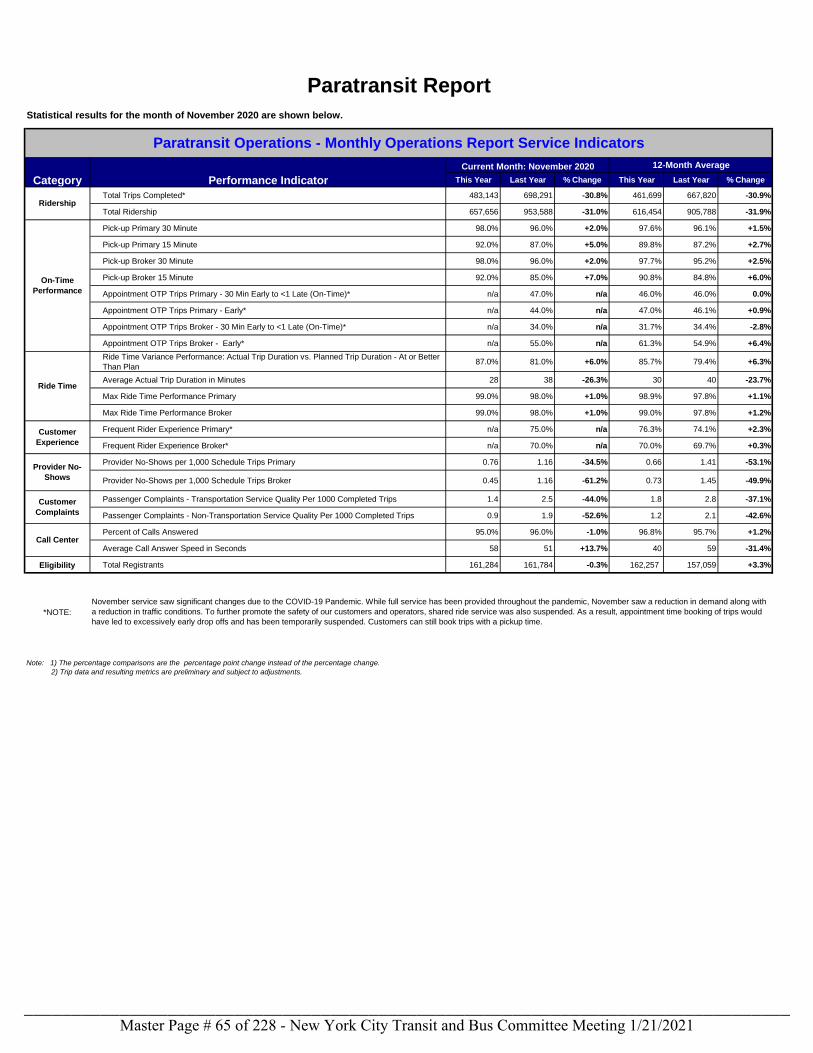
Statistical results for the month of November 2020 are shown below.
12-Month Average
This Year Last Year % Change This Year Last Year % Change
Total Trips Completed* 483,143 698,291 -30.8% 461,699 667,820 -30.9%
Total Ridership 657,656 953,588 -31.0% 616,454 905,788 -31.9%
Pick-up Primary 30 Minute 98.0% 96.0% +2.0% 97.6% 96.1% +1.5%
Pick-up Primary 15 Minute 92.0% 87.0% +5.0% 89.8% 87.2% +2.7%
Pick-up Broker 30 Minute 98.0% 96.0% +2.0% 97.7% 95.2% +2.5%
Pick-up Broker 15 Minute 92.0% 85.0% +7.0% 90.8% 84.8% +6.0%
Appointment OTP Trips Primary - 30 Min Early to <1 Late (On-Time)* n/a 47.0% n/a 46.0% 46.0% 0.0%
Appointment OTP Trips Primary - Early* n/a 44.0% n/a 47.0% 46.1% +0.9%
Appointment OTP Trips Broker - 30 Min Early to <1 Late (On-Time)* n/a 34.0% n/a 31.7% 34.4% -2.8%
Appointment OTP Trips Broker - Early* n/a 55.0% n/a 61.3% 54.9% +6.4%
Ride Time Variance Performance: Actual Trip Duration vs. Planned Trip Duration - At or Better
Than Plan87.0% 81.0% +6.0% 85.7% 79.4% +6.3%
Average Actual Trip Duration in Minutes 28 38 -26.3% 30 40 -23.7%
Max Ride Time Performance Primary 99.0% 98.0% +1.0% 98.9% 97.8% +1.1%
Max Ride Time Performance Broker 99.0% 98.0% +1.0% 99.0% 97.8% +1.2%
Frequent Rider Experience Primary* n/a 75.0% n/a 76.3% 74.1% +2.3%
Frequent Rider Experience Broker* n/a 70.0% n/a 70.0% 69.7% +0.3%
Provider No-Shows per 1,000 Schedule Trips Primary 0.76 1.16 -34.5% 0.66 1.41 -53.1%
Provider No-Shows per 1,000 Schedule Trips Broker 0.45 1.16 -61.2% 0.73 1.45 -49.9%
Passenger Complaints - Transportation Service Quality Per 1000 Completed Trips 1.4 2.5 -44.0% 1.8 2.8 -37.1%
Passenger Complaints - Non-Transportation Service Quality Per 1000 Completed Trips 0.9 1.9 -52.6% 1.2 2.1 -42.6%
Percent of Calls Answered 95.0% 96.0% -1.0% 96.8% 95.7% +1.2%
Average Call Answer Speed in Seconds 58 51 +13.7% 40 59 -31.4%
Eligibility Total Registrants 161,284 161,784 -0.3% 162,257 157,059 +3.3%
*NOTE:
Ridership
Paratransit Report
Paratransit Operations - Monthly Operations Report Service Indicators
Category Performance Indicator
Current Month: November 2020
Ride Time
On-Time
Performance
Note: 1) The percentage comparisons are the percentage point change instead of the percentage change.
2) Trip data and resulting metrics are preliminary and subject to adjustments.
Customer
Complaints
Call Center
Provider No-
Shows
Customer
Experience
November service saw significant changes due to the COVID-19 Pandemic. While full service has been provided throughout the pandemic, November saw a reduction in demand along with
a reduction in traffic conditions. To further promote the safety of our customers and operators, shared ride service was also suspended. As a result, appointment time booking of trips would
have led to excessively early drop offs and has been temporarily suspended. Customers can still book trips with a pickup time.
Master Page # 65 of 228 - New York City Transit and Bus Committee Meeting 1/21/2021________________________________________________________________________________
PARATRANSIT PERFORMANCE INDICATOR DEFINITIONS
Ridership by Provider Type
On-Time Performance for Primary and Broker Providers
Provider No-Shows Per 1,000 Scheduled Trips for Primary and Broker Providers
Ride Time Performance for Primary and Broker Providers
>3 up to 6 miles: max ride time is 65 minutes
>6 up to 9 miles: max ride time is 95 minutes
>9 up to 12 miles: max ride time is 115 minutes
>12 up to 14 miles: max ride time is 135 minutes
>14 miles: max ride time is 155 minutes
0 up to 3 miles: max ride time is 50 minutes
Total Trips is the count of trips provided to registered Access-A-Ride clients in a given month. Total
Ridership includes the count of personal care attendants (PCAs) and guests who join clients on the
trips. Ridership is presented by the type of provider:
1) Primary providers are the blue and white Access-A-Ride branded vehicles, operated by
contractors. They provide service with lift and ramp-equipped vans.
2) Brokers provide for-hire vehicles (FHVs), metered taxis, and some wheelchair accessible
vehicles.
3) E-Hails provide web or app-based trip booking and furnish FHVs and metered taxis,
including wheelchair accessible vehicles (WAVs).
4) Street Hails are services provided by the traditional FHVs, or yellow or green taxis for
customers that Access-A-Ride authorized for customer reimbursement.
5) All Others are mostly services provided by local car services or livery providers in Staten
Island, otherwise known as the Voucher Program. This service has been replaced by
Enhanced Broker Service since November 2019.
Pick-up OTP compares actual to promised pick-up time. It is measured on both 15-minute and 30-
minute windows. Access-A-Ride’s goal is that no less than 94% of all trips arrive at the pick-up
location no more than 30 minutes after the promised time, and that no less than 85% of all trips arrive
at the pick-up location no more than 15 minutes after the promised time.
Drop-off OTP compares actual to customer-requested drop-off time for trips scheduled with an
appointment time. Such trips comprise about half of Access-A-Ride’s service plan. An on-time trip is
one that arrives at the drop-off location no more than 30 minutes early, and no later than the
appointment time.
The Provider No-Show rate measures the frequency with which primary providers do not arrive at the
pick-up location within 30 minutes of the promised time and the trip is not provided. For broker
providers, customers can call for replacement service after 15 minutes.
Ride Time measures customer trip duration in three different ways:
Actual vs Scheduled presents travel time variance.
Average Travel Time presents the average actual trip duration by trip distance category.
Max Ride Time Performance presents the percentage of trips performed within Access-A-Ride’s
established max ride time standards.
Master Page # 66 of 228 - New York City Transit and Bus Committee Meeting 1/21/2021________________________________________________________________________________
PARATRANSIT PERFORMANCE INDICATOR DEFINITIONS
Customer Experience
Customer Complaints Per 1,000 Completed Trips
Call Center
Customers can comment on Access-A-Ride service quality by phone, writing, and website. The
number of complaints is measured as a rate per 1,000 completed trips.
Transportation Service Quality measures service delivery, which covers complaints about no-shows,
lateness, long ride durations, drivers and vehicles. Access-A-Ride’s goal is 3.0 or fewer
Transportation Service Quality complaints per 1,000 trips.
Non-Transportation Service Quality measures complaints about the reservation process, eligibility
certification experience, customer service agent helpfulness and politeness, and all other complaints.
Access-A-Ride’s goal is 1.0 or fewer Non-Transportation Service Quality complaints per 1,000 trips.
The phone number customers call to make complaints and other comments is the same familiar
number they use for reservations. Access-A-Ride reviews all complaints received and works to
resolve all specific customer concerns.
Access-A-Ride Call Center performance is measured as the percent of calls that are answered and
the average speed with which those calls are answered. The call center handles reservation and day-
of service status calls from customers.
The goal for percent of calls answered is 95% and the goal for average answer speed is 60 seconds.
Customer Experience measures trip results against multiple standards. Trip experience is counted as
positive if all of the following standards are met:
• Pick-up OTP: actual pick-up time is 30 minutes or less past the promise time.
• Drop-off OTP: for trips scheduled with a specific drop-off time, drop-off is no more than 30
minutes early and no later than the requested time.
• Max Ride Time: actual trip duration is within max ride time standards established by
Access-A-Ride.
• Provider No-Show: trip does not result in a provider no-show.
Master Page # 67 of 228 - New York City Transit and Bus Committee Meeting 1/21/2021________________________________________________________________________________
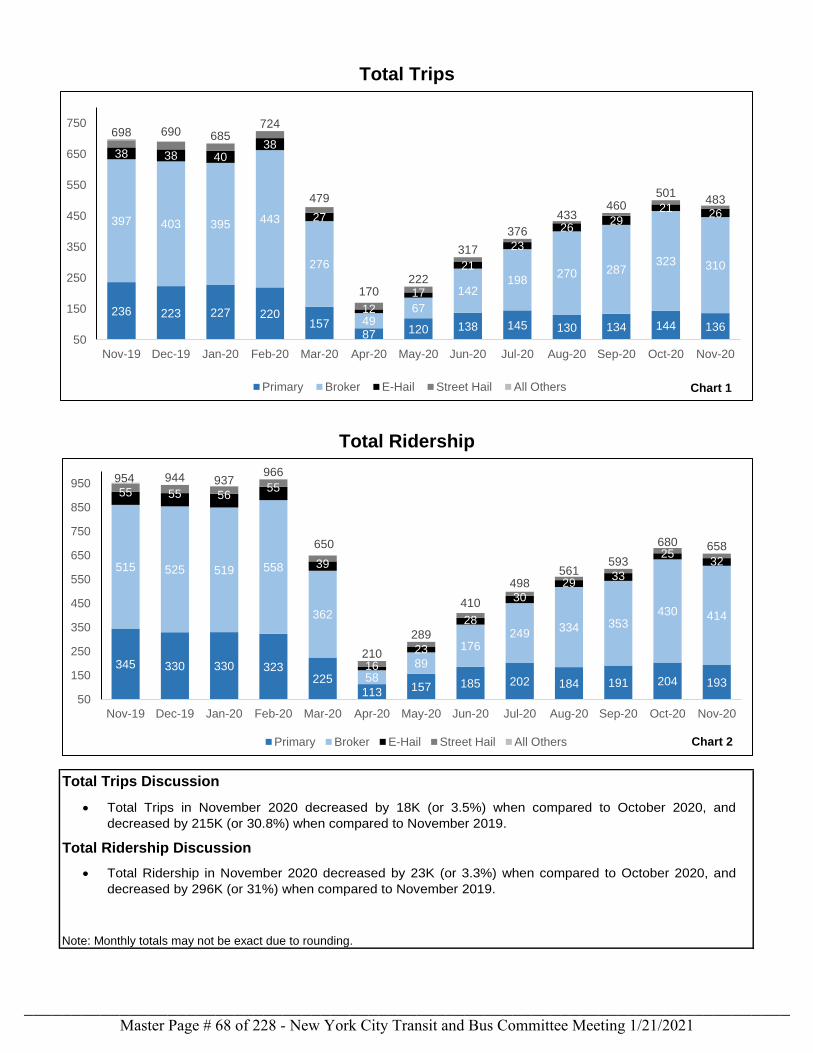
Total Trips Discussion
Total Ridership Discussion
Note: Monthly totals may not be exact due to rounding.
Total Trips
Total Ridership
236 223 227 220157
87 120 138 145 130 134 144 136
397 403 395 443
276
4967
142198
270 287323 310
38 38 4038
27
12
17
21
23
2629
21 26
698 690 685724
479
170222
317
376
433460
501483
50
150
250
350
450
550
650
750
Nov-19 Dec-19 Jan-20 Feb-20 Mar-20 Apr-20 May-20 Jun-20 Jul-20 Aug-20 Sep-20 Oct-20 Nov-20
Chart 1Primary Broker E-Hail Street Hail All Others
345 330 330 323225
113 157 185 202 184 191 204 193
515 525 519 558
362
58
89
176249
334 353430 414
55 55 5655
39
16
23
28
30
2933
2532
954 944 937966
650
210
289
410
498561
593
680 658
50
150
250
350
450
550
650
750
850
950
Nov-19 Dec-19 Jan-20 Feb-20 Mar-20 Apr-20 May-20 Jun-20 Jul-20 Aug-20 Sep-20 Oct-20 Nov-20
Chart 2Primary Broker E-Hail Street Hail All Others
• Total Ridership in November 2020 decreased by 23K (or 3.3%) when compared to October 2020, and
decreased by 296K (or 31%) when compared to November 2019.
• Total Trips in November 2020 decreased by 18K (or 3.5%) when compared to October 2020, and
decreased by 215K (or 30.8%) when compared to November 2019.
Master Page # 68 of 228 - New York City Transit and Bus Committee Meeting 1/21/2021________________________________________________________________________________
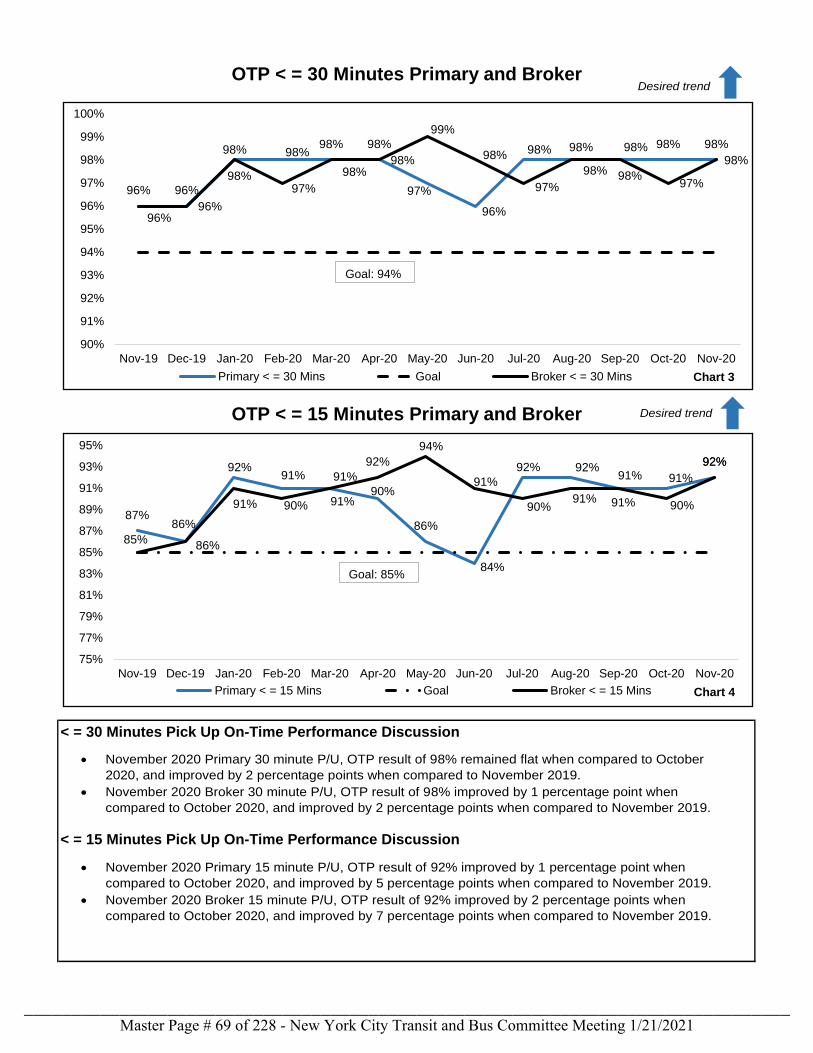
< = 30 Minutes Pick Up On-Time Performance Discussion
< = 15 Minutes Pick Up On-Time Performance Discussion
OTP < = 30 Minutes Primary and Broker
OTP < = 15 Minutes Primary and Broker
96% 96%
98% 98%98% 98%
97%
96%
98% 98% 98% 98% 98%
96%96%
98%97%
98%98%
99%
98%
97%
98% 98%97%
98%
90%
91%
92%
93%
94%
95%
96%
97%
98%
99%
100%
Nov-19 Dec-19 Jan-20 Feb-20 Mar-20 Apr-20 May-20 Jun-20 Jul-20 Aug-20 Sep-20 Oct-20 Nov-20
Chart 3Primary < = 30 Mins Goal Broker < = 30 Mins
Desired trend
87%86%
92%91% 91%
90%
86%
84%
92% 92%91% 91%
92%
85%86%
91% 90% 91%
92%
94%
91%
90%91% 91% 90%
92%
75%
77%
79%
81%
83%
85%
87%
89%
91%
93%
95%
Nov-19 Dec-19 Jan-20 Feb-20 Mar-20 Apr-20 May-20 Jun-20 Jul-20 Aug-20 Sep-20 Oct-20 Nov-20
Chart 4Primary < = 15 Mins Goal Broker < = 15 Mins
Goal: 94%
Goal: 85%
Desired trend
• November 2020 Primary 30 minute P/U, OTP result of 98% remained flat when compared to October
2020, and improved by 2 percentage points when compared to November 2019.
• November 2020 Broker 30 minute P/U, OTP result of 98% improved by 1 percentage point when
compared to October 2020, and improved by 2 percentage points when compared to November 2019.
• November 2020 Primary 15 minute P/U, OTP result of 92% improved by 1 percentage point when
compared to October 2020, and improved by 5 percentage points when compared to November 2019.
• November 2020 Broker 15 minute P/U, OTP result of 92% improved by 2 percentage points when
compared to October 2020, and improved by 7 percentage points when compared to November 2019.
Master Page # 69 of 228 - New York City Transit and Bus Committee Meeting 1/21/2021________________________________________________________________________________
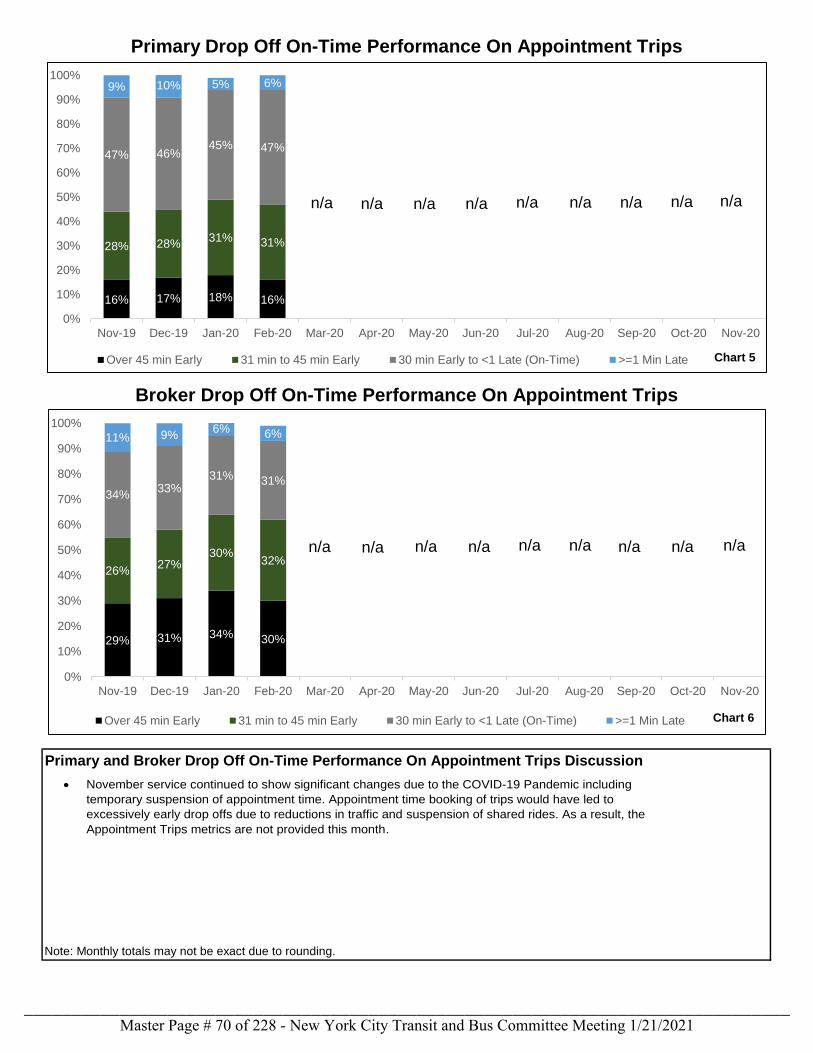
Primary and Broker Drop Off On-Time Performance On Appointment Trips Discussion
Note: Monthly totals may not be exact due to rounding.
Primary Drop Off On-Time Performance On Appointment Trips
Broker Drop Off On-Time Performance On Appointment Trips
16% 17% 18% 16%
28% 28%31% 31%
47% 46%45% 47%
n/a n/a n/a n/a n/a n/a n/a n/a n/a
9% 10% 5% 6%
0%
10%
20%
30%
40%
50%
60%
70%
80%
90%
100%
Nov-19 Dec-19 Jan-20 Feb-20 Mar-20 Apr-20 May-20 Jun-20 Jul-20 Aug-20 Sep-20 Oct-20 Nov-20
Chart 5Over 45 min Early 31 min to 45 min Early 30 min Early to <1 Late (On-Time) >=1 Min Late
• November service continued to show significant changes due to the COVID-19 Pandemic including
temporary suspension of appointment time. Appointment time booking of trips would have led to
excessively early drop offs due to reductions in traffic and suspension of shared rides. As a result, the
Appointment Trips metrics are not provided this month.
29% 31% 34% 30%
26%27%
30%32%
34%33%
31% 31%
n/a n/a n/a n/a n/a n/a n/a n/a n/a
11% 9%6% 6%
0%
10%
20%
30%
40%
50%
60%
70%
80%
90%
100%
Nov-19 Dec-19 Jan-20 Feb-20 Mar-20 Apr-20 May-20 Jun-20 Jul-20 Aug-20 Sep-20 Oct-20 Nov-20
Chart 6Over 45 min Early 31 min to 45 min Early 30 min Early to <1 Late (On-Time) >=1 Min Late
Master Page # 70 of 228 - New York City Transit and Bus Committee Meeting 1/21/2021________________________________________________________________________________
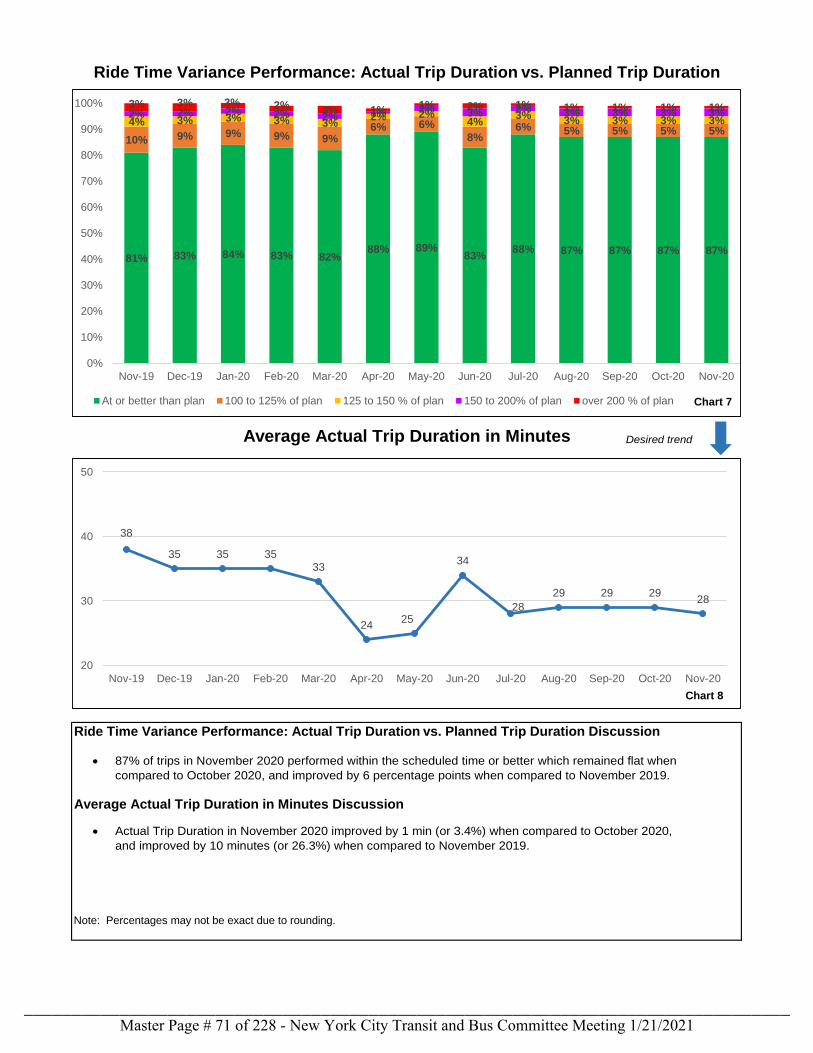
Average Actual Trip Duration in Minutes Discussion
Note: Percentages may not be exact due to rounding.
Ride Time Variance Performance: Actual Trip Duration vs. Planned Trip Duration
Ride Time Variance Performance: Actual Trip Duration vs. Planned Trip Duration Discussion
Average Actual Trip Duration in Minutes
81% 83% 84% 83% 82%88% 89%
83%88% 87% 87% 87% 87%
10% 9% 9% 9% 9%6% 6%
8%6% 5% 5% 5% 5%
4% 3% 3% 3% 3%2% 2%
4%3%
3% 3% 3% 3%2% 2% 2% 2% 2% 1% 2% 3% 2% 3% 3% 3% 3%3% 3% 3% 2% 3% 1%
1% 2% 1% 1% 1% 1% 1%
0%
10%
20%
30%
40%
50%
60%
70%
80%
90%
100%
Nov-19 Dec-19 Jan-20 Feb-20 Mar-20 Apr-20 May-20 Jun-20 Jul-20 Aug-20 Sep-20 Oct-20 Nov-20
Chart 7At or better than plan 100 to 125% of plan 125 to 150 % of plan 150 to 200% of plan over 200 % of plan
38
35 35 3533
2425
34
28
29 29 2928
20
30
40
50
Nov-19 Dec-19 Jan-20 Feb-20 Mar-20 Apr-20 May-20 Jun-20 Jul-20 Aug-20 Sep-20 Oct-20 Nov-20
Chart 8
• 87% of trips in November 2020 performed within the scheduled time or better which remained flat when
compared to October 2020, and improved by 6 percentage points when compared to November 2019.
Desired trend
• Actual Trip Duration in November 2020 improved by 1 min (or 3.4%) when compared to October 2020,
and improved by 10 minutes (or 26.3%) when compared to November 2019.
Master Page # 71 of 228 - New York City Transit and Bus Committee Meeting 1/21/2021________________________________________________________________________________
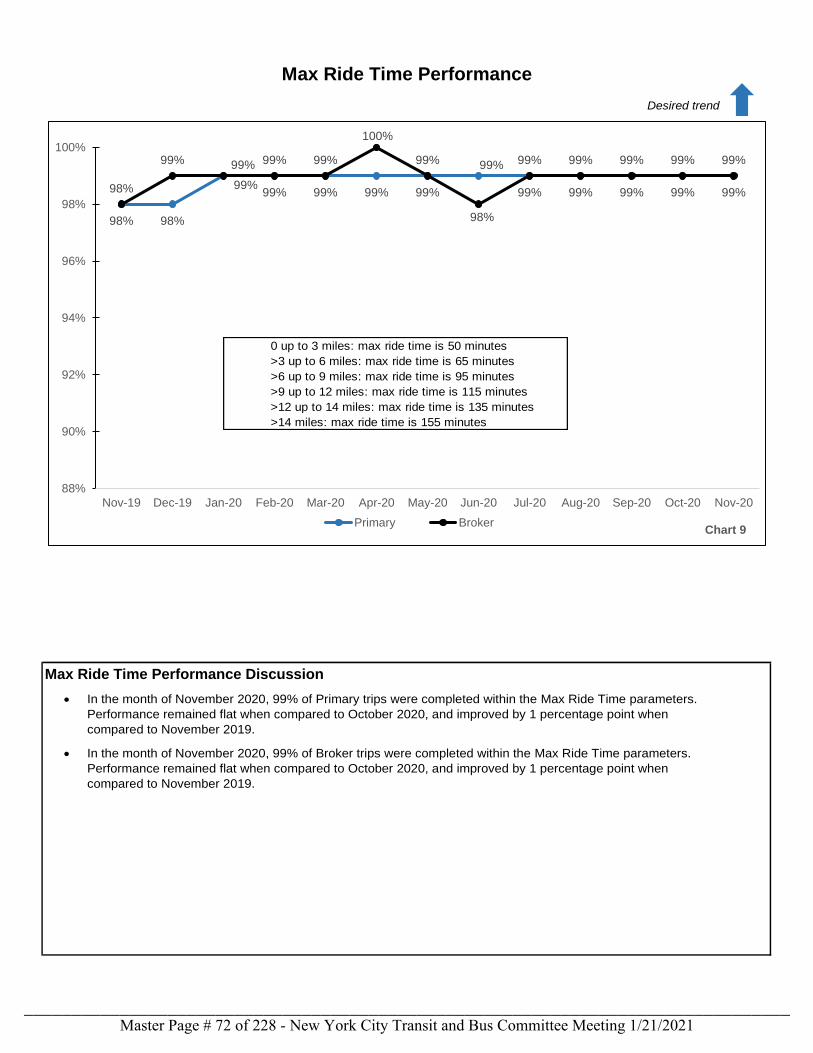
Max Ride Time Performance Discussion
Max Ride Time Performance
98% 98%
99%
99% 99% 99% 99%
99%
99% 99% 99% 99% 99%98%
99%
99%
99% 99%
100%
99%
98%
99% 99% 99% 99% 99%
88%
90%
92%
94%
96%
98%
100%
Nov-19 Dec-19 Jan-20 Feb-20 Mar-20 Apr-20 May-20 Jun-20 Jul-20 Aug-20 Sep-20 Oct-20 Nov-20
Chart 9Primary Broker
0 up to 3 miles: max ride time is 50 minutes
>3 up to 6 miles: max ride time is 65 minutes
>6 up to 9 miles: max ride time is 95 minutes
>9 up to 12 miles: max ride time is 115 minutes
>12 up to 14 miles: max ride time is 135 minutes
>14 miles: max ride time is 155 minutes
Desired trend
• In the month of November 2020, 99% of Primary trips were completed within the Max Ride Time parameters.
Performance remained flat when compared to October 2020, and improved by 1 percentage point when
compared to November 2019.
• In the month of November 2020, 99% of Broker trips were completed within the Max Ride Time parameters.
Performance remained flat when compared to October 2020, and improved by 1 percentage point when
compared to November 2019.
Master Page # 72 of 228 - New York City Transit and Bus Committee Meeting 1/21/2021________________________________________________________________________________
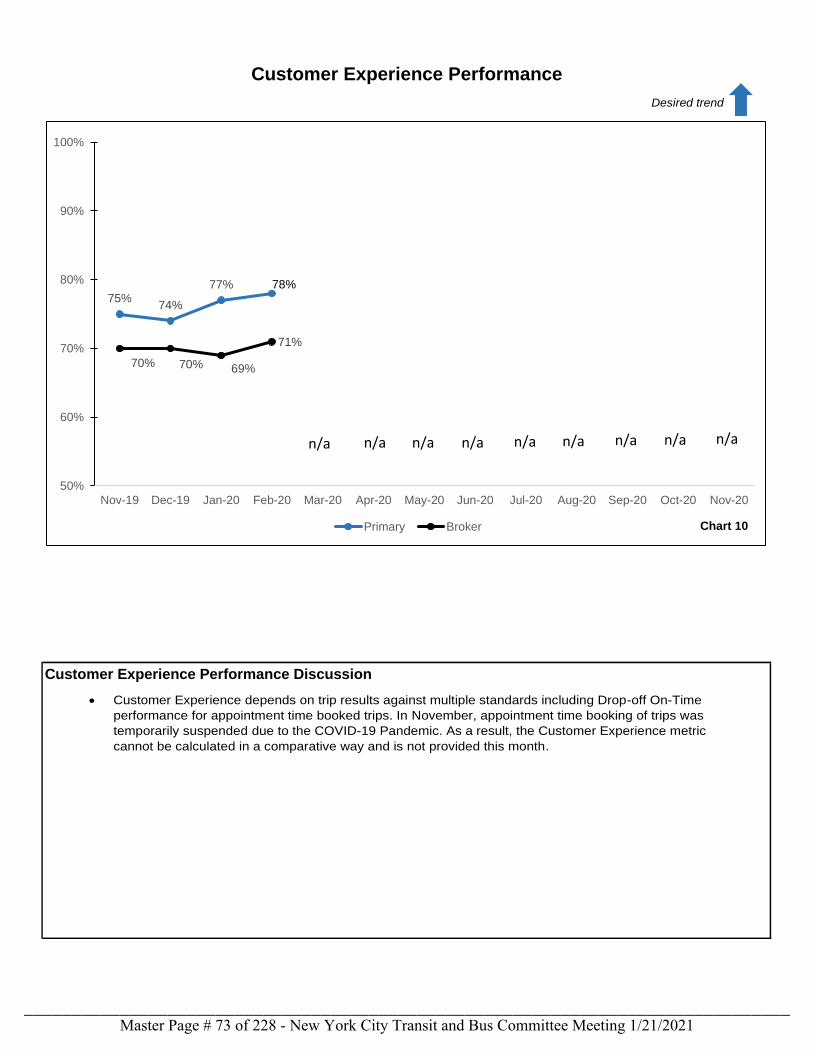
Customer Experience Performance Discussion
Customer Experience Performance
75%74%
77% 78%
70% 70% 69%
71%
50%
60%
70%
80%
90%
100%
Nov-19 Dec-19 Jan-20 Feb-20 Mar-20 Apr-20 May-20 Jun-20 Jul-20 Aug-20 Sep-20 Oct-20 Nov-20
Chart 10Primary Broker
n/a
Desired trend
• Customer Experience depends on trip results against multiple standards including Drop-off On-Time
performance for appointment time booked trips. In November, appointment time booking of trips was
temporarily suspended due to the COVID-19 Pandemic. As a result, the Customer Experience metric
cannot be calculated in a comparative way and is not provided this month.
n/an/an/an/an/an/an/an/a
Master Page # 73 of 228 - New York City Transit and Bus Committee Meeting 1/21/2021________________________________________________________________________________
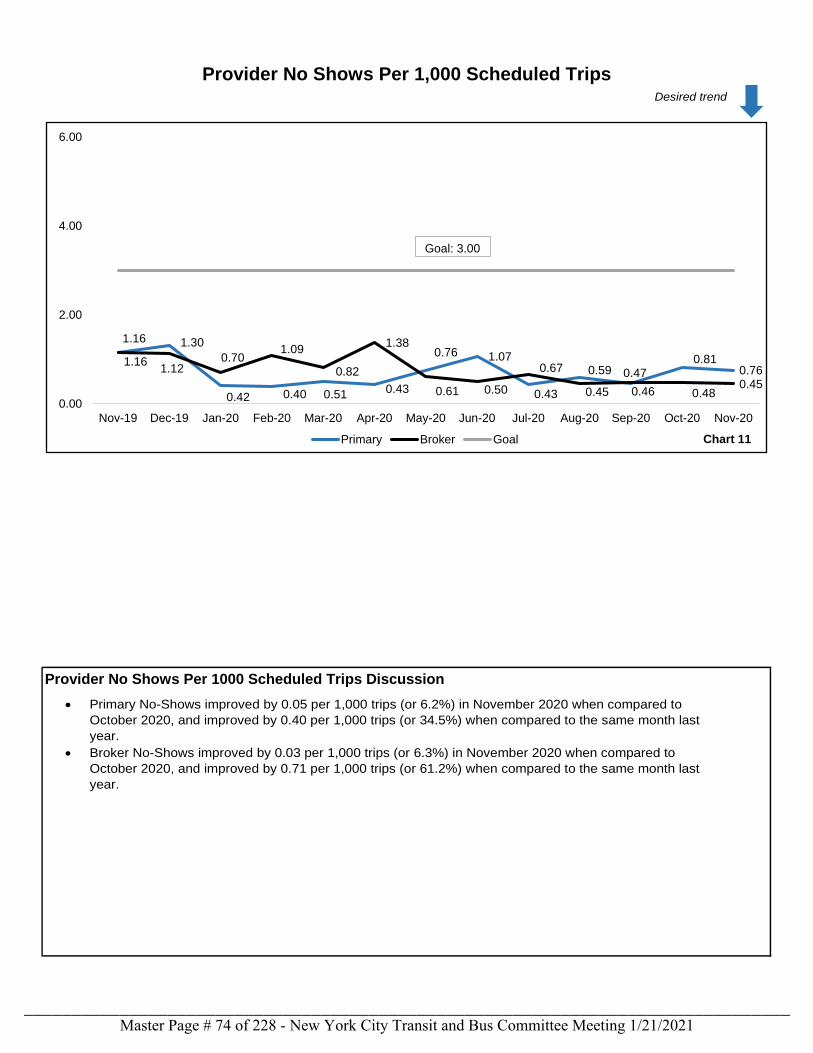
Provider No Shows Per 1000 Scheduled Trips Discussion
Provider No Shows Per 1,000 Scheduled Trips
1.16 1.30
0.42 0.40 0.51 0.43
0.76 1.07
0.43
0.59
0.46
0.810.76
1.161.12
0.701.09
0.82
1.38
0.61 0.50
0.67
0.45
0.47
0.480.45
0.00
2.00
4.00
6.00
Nov-19 Dec-19 Jan-20 Feb-20 Mar-20 Apr-20 May-20 Jun-20 Jul-20 Aug-20 Sep-20 Oct-20 Nov-20
Chart 11Primary Broker Goal
Goal: 3.00
Desired trend
• Primary No-Shows improved by 0.05 per 1,000 trips (or 6.2%) in November 2020 when compared to
October 2020, and improved by 0.40 per 1,000 trips (or 34.5%) when compared to the same month last
year.
• Broker No-Shows improved by 0.03 per 1,000 trips (or 6.3%) in November 2020 when compared to
October 2020, and improved by 0.71 per 1,000 trips (or 61.2%) when compared to the same month last
year.
Master Page # 74 of 228 - New York City Transit and Bus Committee Meeting 1/21/2021________________________________________________________________________________
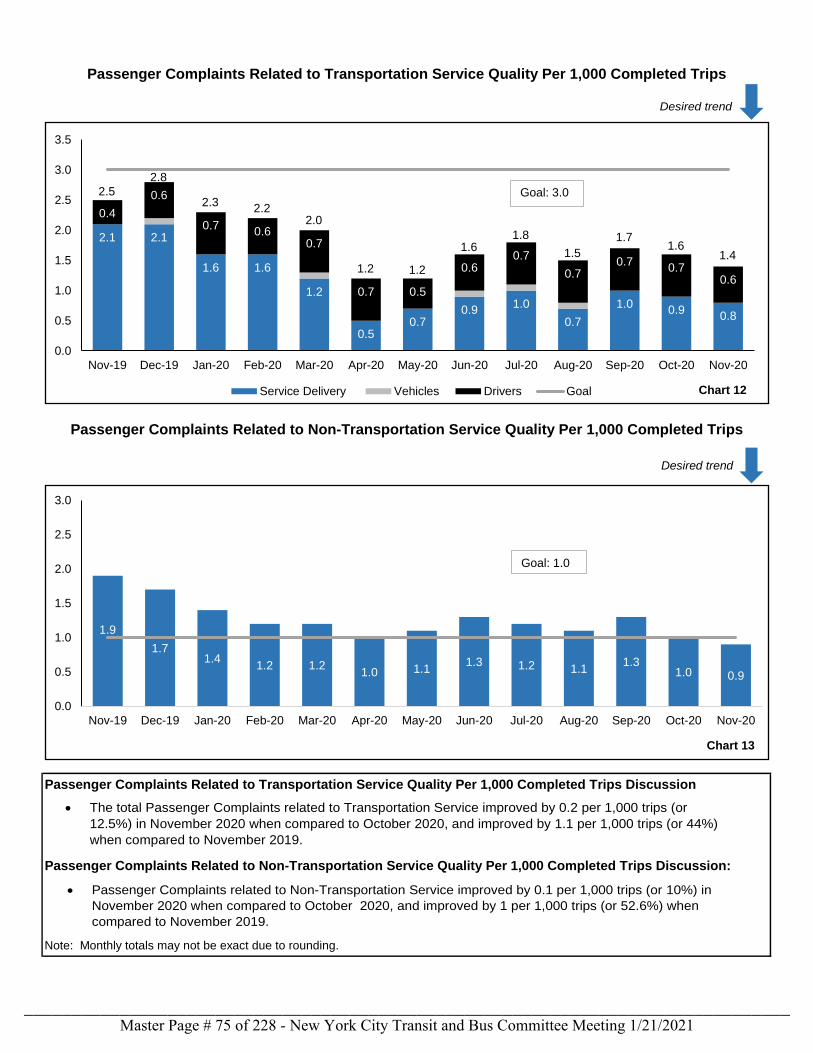
Passenger Complaints Related to Non-Transportation Service Quality Per 1,000 Completed Trips Discussion:
Note: Monthly totals may not be exact due to rounding.
Passenger Complaints Related to Transportation Service Quality Per 1,000 Completed Trips Discussion
Passenger Complaints Related to Transportation Service Quality Per 1,000 Completed Trips
Passenger Complaints Related to Non-Transportation Service Quality Per 1,000 Completed Trips
Desired trend
2.1 2.1
1.6 1.6
1.2
0.50.7
0.91.0
0.7
1.00.9
0.8
0.4
0.6
0.70.6
0.7
0.7 0.5
0.60.7
0.70.7
0.70.6
2.5
2.8
2.32.2
2.0
1.2 1.2
1.61.8
1.5
1.71.6
1.4
0.0
0.5
1.0
1.5
2.0
2.5
3.0
3.5
Nov-19 Dec-19 Jan-20 Feb-20 Mar-20 Apr-20 May-20 Jun-20 Jul-20 Aug-20 Sep-20 Oct-20 Nov-20
Chart 12Service Delivery Vehicles Drivers Goal
Goal: 3.0
1.9
1.71.4
1.2 1.21.0 1.1
1.3 1.2 1.11.3
1.0 0.9
0.0
0.5
1.0
1.5
2.0
2.5
3.0
Nov-19 Dec-19 Jan-20 Feb-20 Mar-20 Apr-20 May-20 Jun-20 Jul-20 Aug-20 Sep-20 Oct-20 Nov-20
Chart 13
Goal: 1.0
Desired trend
• The total Passenger Complaints related to Transportation Service improved by 0.2 per 1,000 trips (or
12.5%) in November 2020 when compared to October 2020, and improved by 1.1 per 1,000 trips (or 44%)
when compared to November 2019.
• Passenger Complaints related to Non-Transportation Service improved by 0.1 per 1,000 trips (or 10%) in
November 2020 when compared to October 2020, and improved by 1 per 1,000 trips (or 52.6%) when
compared to November 2019.
Master Page # 75 of 228 - New York City Transit and Bus Committee Meeting 1/21/2021________________________________________________________________________________
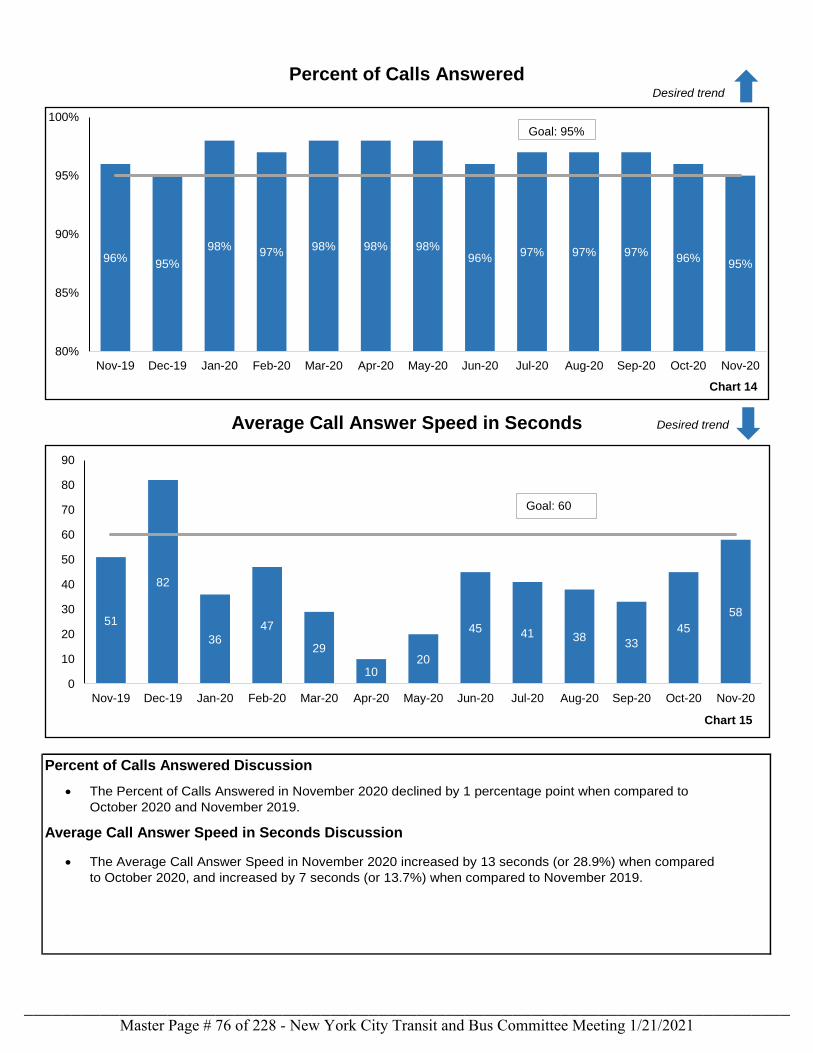
Average Call Answer Speed in Seconds Discussion
Percent of Calls Answered Discussion
Average Call Answer Speed in Seconds
Percent of Calls AnsweredDesired trend
96%95%
98%97%
98% 98% 98%96%
97% 97% 97%96%
95%
80%
85%
90%
95%
100%
Nov-19 Dec-19 Jan-20 Feb-20 Mar-20 Apr-20 May-20 Jun-20 Jul-20 Aug-20 Sep-20 Oct-20 Nov-20
Chart 14
Goal: 95%
Desired trend
51
82
3647
29
1020
45 41 3833
45
58
0
10
20
30
40
50
60
70
80
90
Nov-19 Dec-19 Jan-20 Feb-20 Mar-20 Apr-20 May-20 Jun-20 Jul-20 Aug-20 Sep-20 Oct-20 Nov-20
Chart 15
• The Average Call Answer Speed in November 2020 increased by 13 seconds (or 28.9%) when compared
to October 2020, and increased by 7 seconds (or 13.7%) when compared to November 2019.
Goal: 60
• The Percent of Calls Answered in November 2020 declined by 1 percentage point when compared to
October 2020 and November 2019.
Master Page # 76 of 228 - New York City Transit and Bus Committee Meeting 1/21/2021________________________________________________________________________________
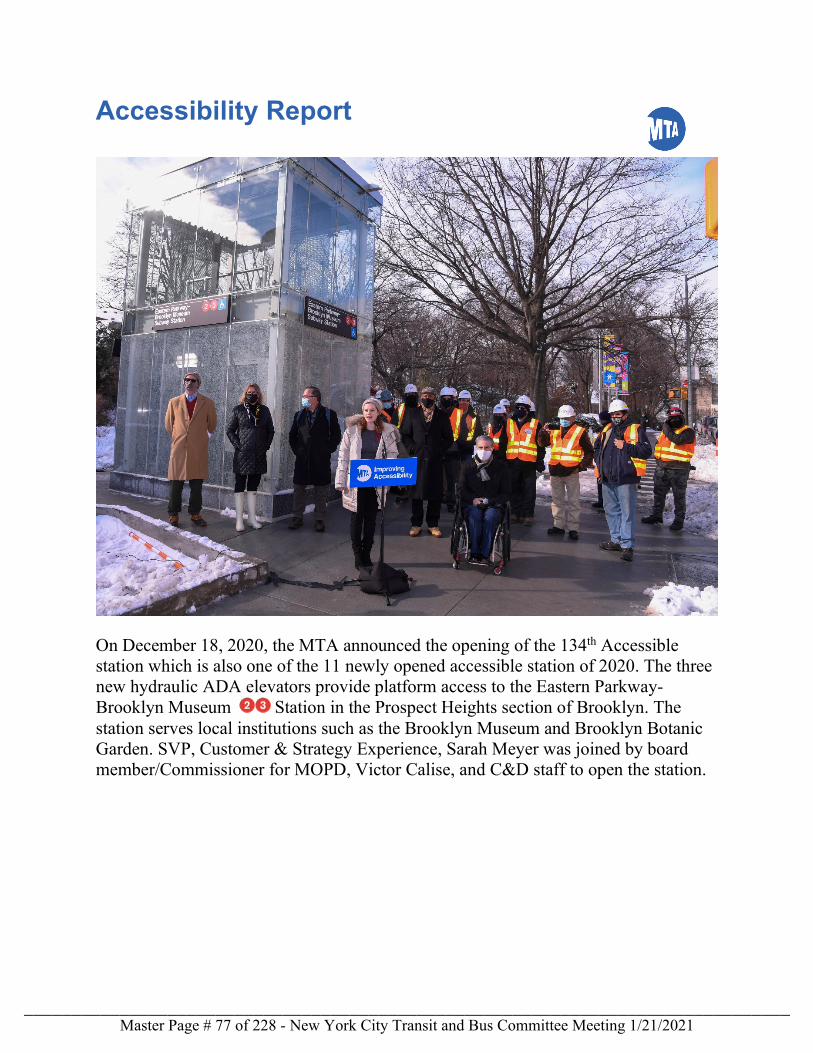
Accessibility Report
On December 18, 2020, the MTA announced the opening of the 134th Accessible station which is also one of the 11 newly opened accessible station of 2020. The three new hydraulic ADA elevators provide platform access to the Eastern Parkway-Brooklyn Museum Station in the Prospect Heights section of Brooklyn. The station serves local institutions such as the Brooklyn Museum and Brooklyn Botanic Garden. SVP, Customer & Strategy Experience, Sarah Meyer was joined by board member/Commissioner for MOPD, Victor Calise, and C&D staff to open the station.
Master Page # 77 of 228 - New York City Transit and Bus Committee Meeting 1/21/2021________________________________________________________________________________
January Accessibility Update
We are happy to be entering 2021 with significant momentum in continuing to move accessibility projects forward. We were able to leverage reduced ridership this year to accelerate multiple ADA accessible station projects to completion. On December 31, 2020, three new elevators at Gun Hill Road on the Dyre Avenue line in The Bronx were placed into service, which was announced at a press conference earlier this month. The other stations that became accessible in 2020 include Astoria Blvd on the N and W lines in Queens; 1 Ave on the L line and Chambers St on the J and Z lines in Manhattan; 59 St on the N and R lines, 86 St on the R line, Greenpoint Ave on the G line, and Eastern Pkwy-Brooklyn Museum on the 2 and 3 lines in Brooklyn; and Bedford Park Blvd on the B and D lines in The Bronx. These stations provide critical access points in some of the fastest growing neighborhoods in the city and bring the MTA to 135 accessible stations systemwide. Visit mta.info/accessibility/stations for a full list of accessible stations and the locations of accessible entrances at street-level.
In December, we shared that we would reach substantial completion of the alternate accessible route project by the end of the year, and we are excited to share that this goal has been met. We have been actively working with the Marketing and Station Signage teams to post Alternate Accessible Route signage at all elevators at accessible stations in the system. These signs provide alternate travel instructions in the event that an elevator is out of service. The instructions on the signs vary depending on the station, the elevator’s location within the station, and the adjacent bus and subway service. These signs may include information about other elevators at the same station that a customer can use to get to the same level; elevators at the same station that may be taken to other levels and lines, and the identification of connecting bus service near the subway station. Over the course of 2019 and 2020, we collected customer feedback on the design of these signs and made multiple updates to improve them. As additional stations become accessible, signs will also be added at all new elevators, and updates will be made to routes on MTA.info that can integrate new accessible stations.
We remind all customers to wear masks, observe social distancing, and check the most recent service information when planning trips. We are excited to build on 2020’s accessibility accomplishments and look forward to continuing accessibility improvements in 2021.
Rachel Cohen Director, Systemwide Accessibility
Master Page # 78 of 228 - New York City Transit and Bus Committee Meeting 1/21/2021________________________________________________________________________________
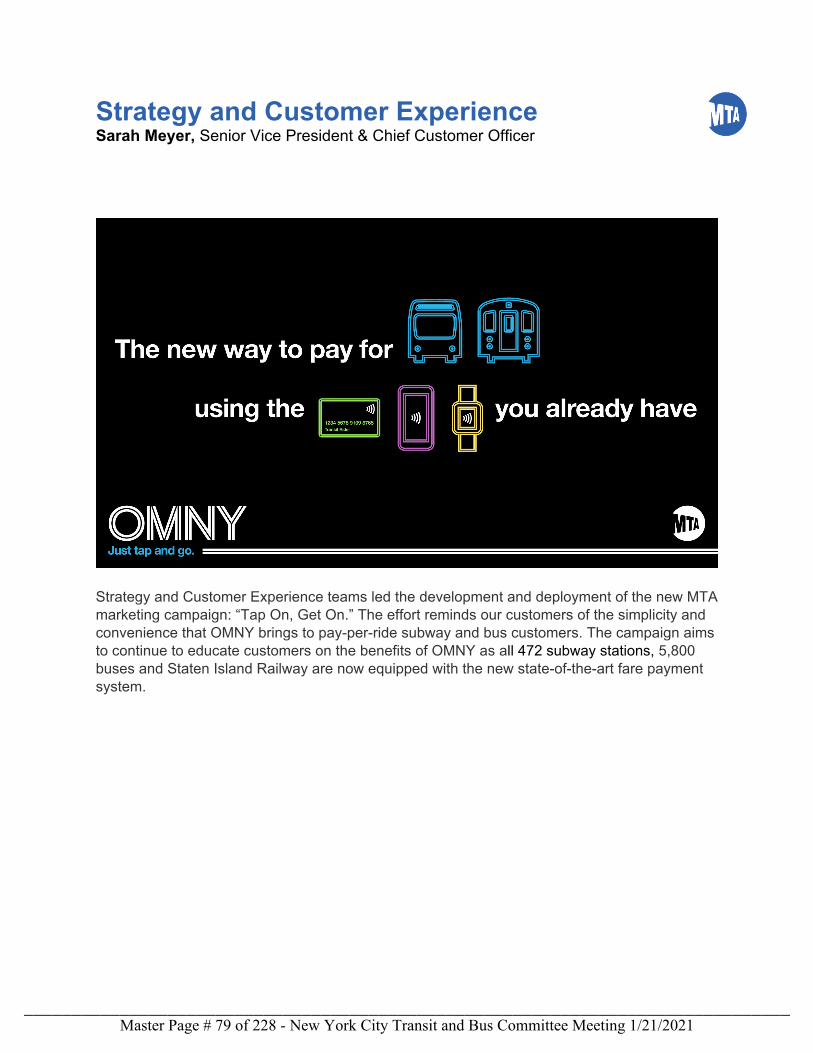
Strategy and Customer Experience Sarah Meyer, Senior Vice President & Chief Customer Officer
Strategy and Customer Experience teams led the development and deployment of the new MTA marketing campaign: “Tap On, Get On.” The effort reminds our customers of the simplicity and convenience that OMNY brings to pay-per-ride subway and bus customers. The campaign aims to continue to educate customers on the benefits of OMNY as all 472 subway stations, 5,800 buses and Staten Island Railway are now equipped with the new state-of-the-art fare payment system.
Master Page # 79 of 228 - New York City Transit and Bus Committee Meeting 1/21/2021________________________________________________________________________________
January 2021 Highlights: Strategy and Customer Experience
We kicked off 2021 announcing three new accessible stations—Greenpoint Av Station and Eastern Parkway-Brooklyn Museum Station in Brooklyn and Gun Hill Road in the Bronx. Maps, digital signage and in-station signage were updated accordingly.
We also designed, produced and executed a new digital and print campaign to market the system-wide availability of OMNY, entirely in-house.
On January 1st, SCE introduced a new design to some of our bus schedules. These new timetables read better on mobile devices and print better on home printers. More importantly, the production of the timetables was automated. We no longer need teams of individuals manually typing these numbers into design files. The new timetables are still a work in progress, so send us your feedback. Soon, we'll also have an online timetable viewer with better ways to view timetables.
Last month, riders at stations throughout the subway system began hearing announcements in both English and Spanish from local TV news, weather and sports anchors and reporters reminding customers that masks are required on public transit and that free masks are available at all station booths.
Featured in the announcements were:
• Maurice DuBois, WCBS-2 Anchor• Kristine Johnson, WCBS-2 Anchor• Marcia Kramer, WCBS-2 Reporter• Janice Huff, WNBC-4 Chief Meteorologist• Chuck Scarborough, WNBC-4 Anchor• David Ushery, WNBC-4 Anchor• Bruce Beck, WNBC-4 Lead Sports Anchor• Dave Price, WNBC-4 Weather Anchor• Sade Baderinwa, WABC-7 Anchor• Bill Ritter, WABC-7 Anchor• Liz Cho, WABC-7 Anchor• Lee Goldberg, WABC-7 Chief Meteorologist• Joe Torres, WABC-7 Anchor• Sandra Bookman, WABC-7 Anchor• David Novarro, WABC-7 Anchor• Marysol Castro, WPIX11 Features Reporter• Dan Mannarino, WPIX11 Anchor• Stacy-Ann Gooden, WPIX11 Meteorologist• Irv Gikofsky AKA ‘Mr. G’, WPIX11 Weatherman
The multi-pronged operation also includes public service announcements by actor and activist Rosie Perez and New York Mets legend John Franco, as well as the systemwide signage from the MTA’s “Operation Respect” campaign.
Mask Force teams will be out again on January 27th. Please join us!
Sarah Meyer Chief Customer Officer
Master Page # 80 of 228 - New York City Transit and Bus Committee Meeting 1/21/2021________________________________________________________________________________
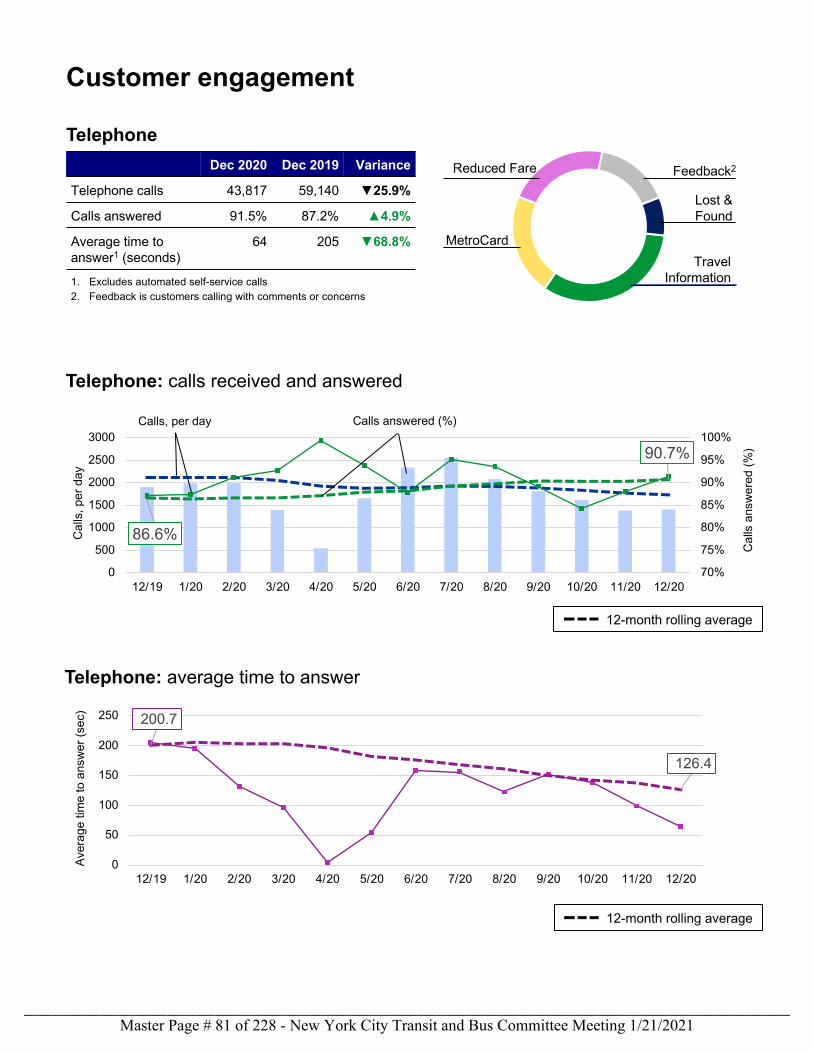
Customer engagement
Reduced Fare
MetroCard
86.6%
90.7%
70%
75%
80%
85%
90%
95%
100%
0
500
1000
1500
2000
2500
3000
12/19 1/20 2/20 3/20 4/20 5/20 6/20 7/20 8/20 9/20 10/20 11/20 12/20
Cal
ls a
nsw
ered
(%)
Cal
ls, p
er d
ay
200.7
126.4
0
50
100
150
200
250
12/19 1/20 2/20 3/20 4/20 5/20 6/20 7/20 8/20 9/20 10/20 11/20 12/20
Aver
age
time
to a
nsw
er (s
ec)
Telephone: calls received and answered
Telephone: average time to answer
Calls answered (%)Calls, per day
12-month rolling average
12-month rolling average
Travel Information1. Excludes automated self-service calls
2. Feedback is customers calling with comments or concerns
TelephoneDec 2020 Dec 2019 Variance
Telephone calls 43,817 59,140 ▼25.9%
Calls answered 91.5% 87.2% ▲4.9%
Average time to answer1 (seconds)
64 205 ▼68.8%
Feedback2
Lost &Found
Master Page # 81 of 228 - New York City Transit and Bus Committee Meeting 1/21/2021________________________________________________________________________________
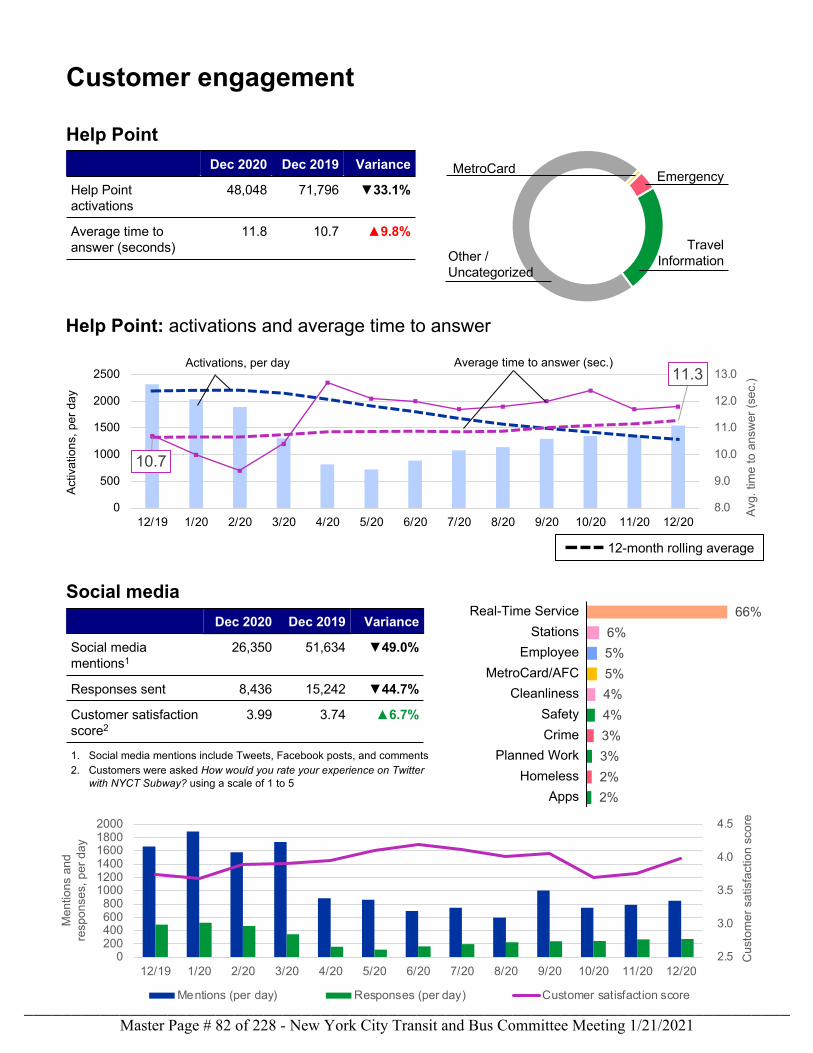
Customer engagement
Help PointDec 2020 Dec 2019 Variance
Help Point activations
48,048 71,796 ▼33.1%
Average time to answer (seconds)
11.8 10.7 ▲9.8%
Social mediaDec 2020 Dec 2019 Variance
Social mediamentions1
26,350 51,634 ▼49.0%
Responses sent 8,436 15,242 ▼44.7%
Customer satisfaction score2
3.99 3.74 ▲6.7%
1. Social media mentions include Tweets, Facebook posts, and comments2. Customers were asked How would you rate your experience on Twitter
with NYCT Subway? using a scale of 1 to 5
66%6%5%5%4%4%3%3%2%2%
Real-Time ServiceStations
EmployeeMetroCard/AFC
CleanlinessSafetyCrime
Planned WorkHomeless
Apps
2.5
3.0
3.5
4.0
4.5
0200400600800
100012001400160018002000
12/19 1/20 2/20 3/20 4/20 5/20 6/20 7/20 8/20 9/20 10/20 11/20 12/20
Cus
tom
er s
atis
fact
ion
scor
e
Men
tions
and
re
spon
ses,
per
day
Mentions (per day) Responses (per day) Customer satisfaction score
10.7
11.3
8.0
9.0
10.0
11.0
12.0
13.0
0
500
1000
1500
2000
2500
12/19 1/20 2/20 3/20 4/20 5/20 6/20 7/20 8/20 9/20 10/20 11/20 12/20
Avg.
tim
e to
ans
wer
(sec
.)
Activ
atio
ns, p
er d
ay
Help Point: activations and average time to answer
12-month rolling average
Activations, per day Average time to answer (sec.)
MetroCard Emergency
Travel InformationOther /
Uncategorized
Master Page # 82 of 228 - New York City Transit and Bus Committee Meeting 1/21/2021________________________________________________________________________________
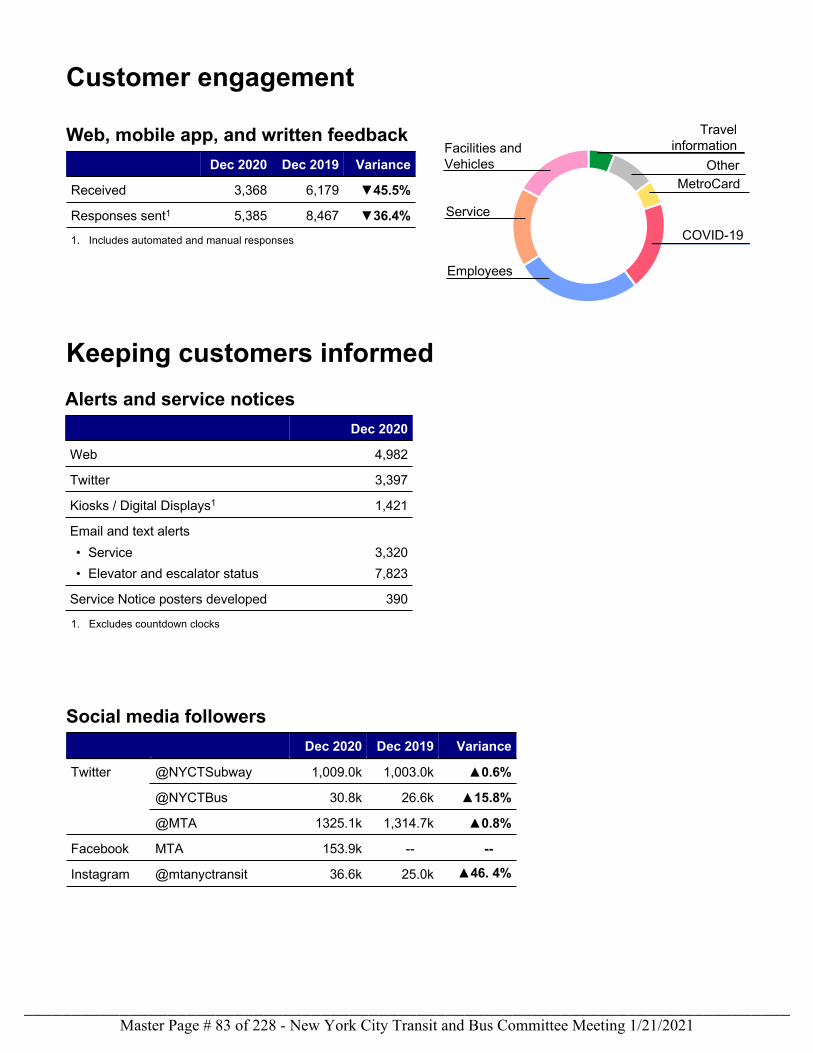
Service
Other
Travel informationWeb, mobile app, and written feedback
Dec 2020 Dec 2019 Variance
Received 3,368 6,179 ▼45.5%
Responses sent1 5,385 8,467 ▼36.4%1. Includes automated and manual responses
Customer engagement
Alerts and service noticesDec 2020
Web 4,982
Twitter 3,397
Kiosks / Digital Displays1 1,421
Email and text alerts• Service • Elevator and escalator status
3,3207,823
Service Notice posters developed 390
Keeping customers informed
Social media followersDec 2020 Dec 2019 Variance
Twitter @NYCTSubway 1,009.0k 1,003.0k ▲0.6%
@NYCTBus 30.8k 26.6k ▲15.8%
@MTA 1325.1k 1,314.7k ▲0.8%
Facebook MTA 153.9k -- --
Instagram @mtanyctransit 36.6k 25.0k ▲46. 4%
1. Excludes countdown clocks
COVID-19
MetroCard
Facilities and Vehicles
Employees
Master Page # 83 of 228 - New York City Transit and Bus Committee Meeting 1/21/2021________________________________________________________________________________
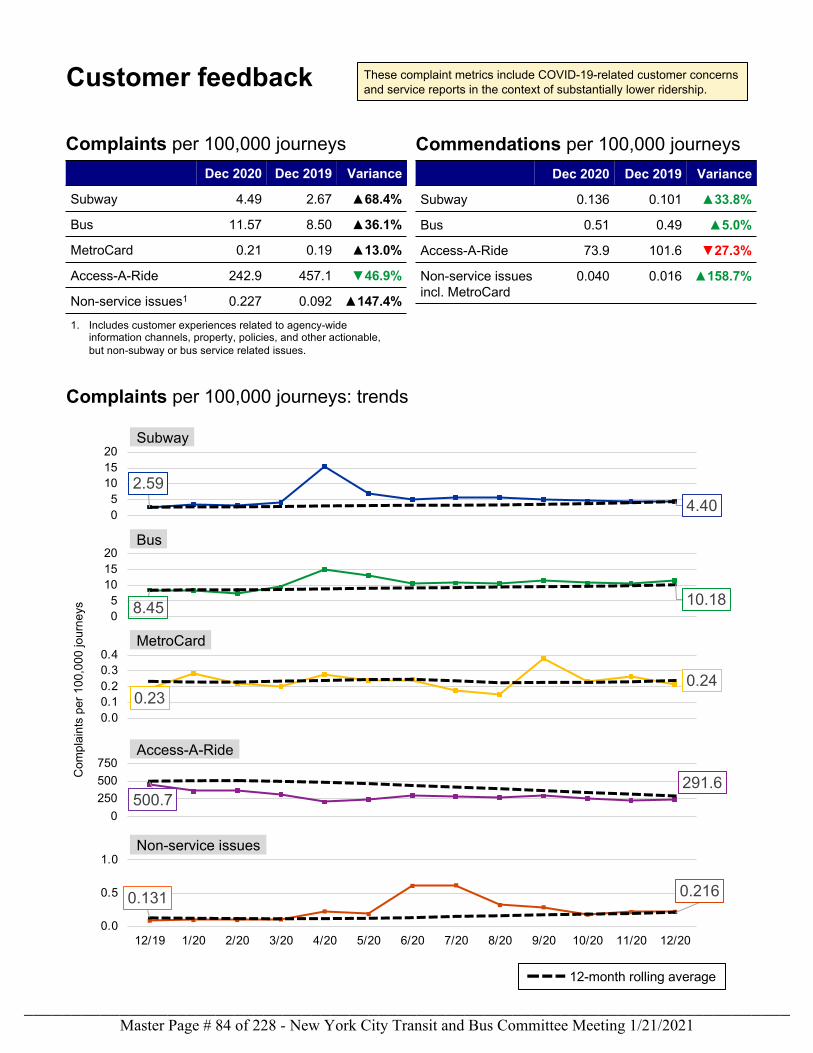
Complaints per 100,000 journeysDec 2020 Dec 2019 Variance
Subway 4.49 2.67 ▲68.4%
Bus 11.57 8.50 ▲36.1%
MetroCard 0.21 0.19 ▲13.0%
Access-A-Ride 242.9 457.1 ▼46.9%
Non-service issues1 0.227 0.092 ▲147.4%
Commendations per 100,000 journeysDec 2020 Dec 2019 Variance
Subway 0.136 0.101 ▲33.8%
Bus 0.51 0.49 ▲5.0%
Access-A-Ride 73.9 101.6 ▼27.3%
Non-service issues incl. MetroCard
0.040 0.016 ▲158.7%
2.594.400
5101520
500.7291.6
0250500750
8.45 10.1805
101520
0.230.24
0.00.10.20.30.4
Com
plai
nts
per 1
00,0
00 jo
urne
ys
Subway
Bus
MetroCard
Access-A-Ride
Customer feedback
12-month rolling average
0.131 0.216
0.0
0.5
1.0
12/19 1/20 2/20 3/20 4/20 5/20 6/20 7/20 8/20 9/20 10/20 11/20 12/20
Non-service issues
1. Includes customer experiences related to agency-wide information channels, property, policies, and other actionable, but non-subway or bus service related issues.
Complaints per 100,000 journeys: trends
These complaint metrics include COVID-19-related customer concerns and service reports in the context of substantially lower ridership.
Master Page # 84 of 228 - New York City Transit and Bus Committee Meeting 1/21/2021________________________________________________________________________________
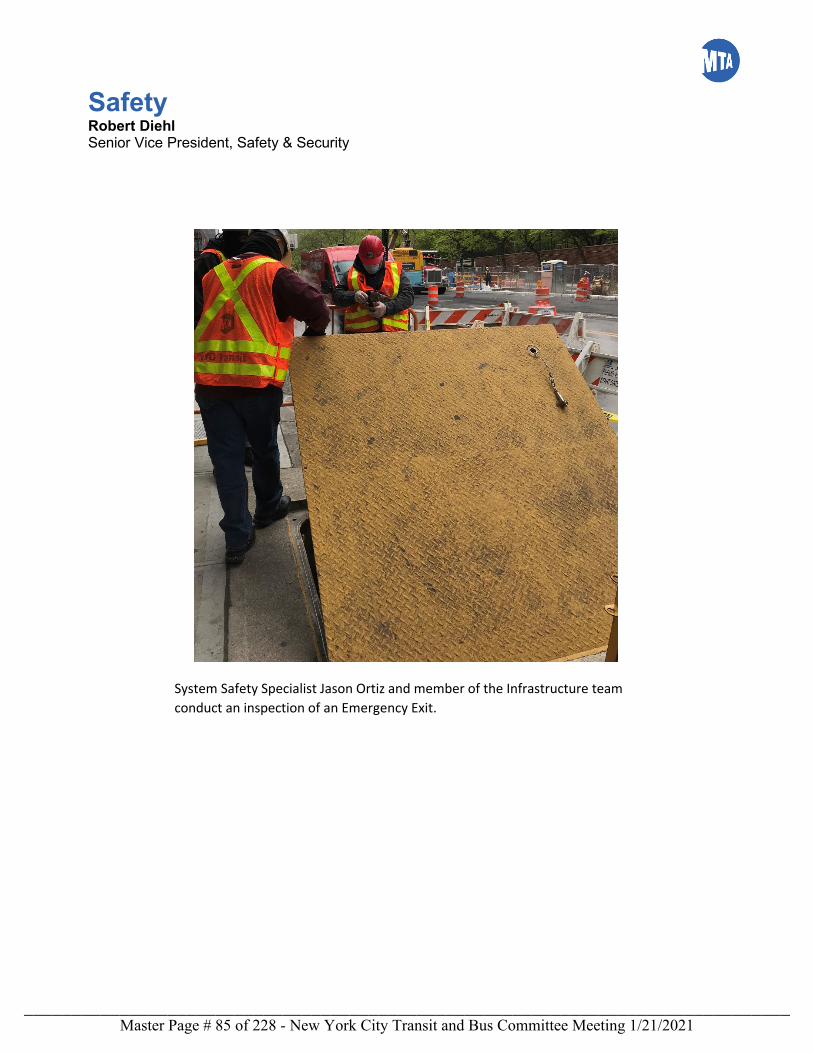
Safety Robert Diehl Senior Vice President, Safety & Security
System Safety Specialist Jason Ortiz and member of the Infrastructure team conduct an inspection of an Emergency Exit.
Master Page # 85 of 228 - New York City Transit and Bus Committee Meeting 1/21/2021________________________________________________________________________________
December 2020 Highlights: Safety
Subway Customer Accident Rates increased by 43.4% when comparing the most recent 12-month period to the previous one. It is worth noting that, nominally, accidents are down 37.9%.
Bus Collisions declined by 24.5% and Collision Injuries declined by 26.4% while Customer Accidents increased when comparing the most-recent 12-month period to the previous one.
Employee Lost Time Accidents have shown an increase when comparing the most recent 12-month period to the previous one.
Lastly, when comparing figures from the two (2) most-recent 12-month periods, Subway Fires show an increase.
Robert Diehl Senior Vice President, Safety and Security
*Except for Fires, all numbers reported refer to rates.
Master Page # 86 of 228 - New York City Transit and Bus Committee Meeting 1/21/2021________________________________________________________________________________
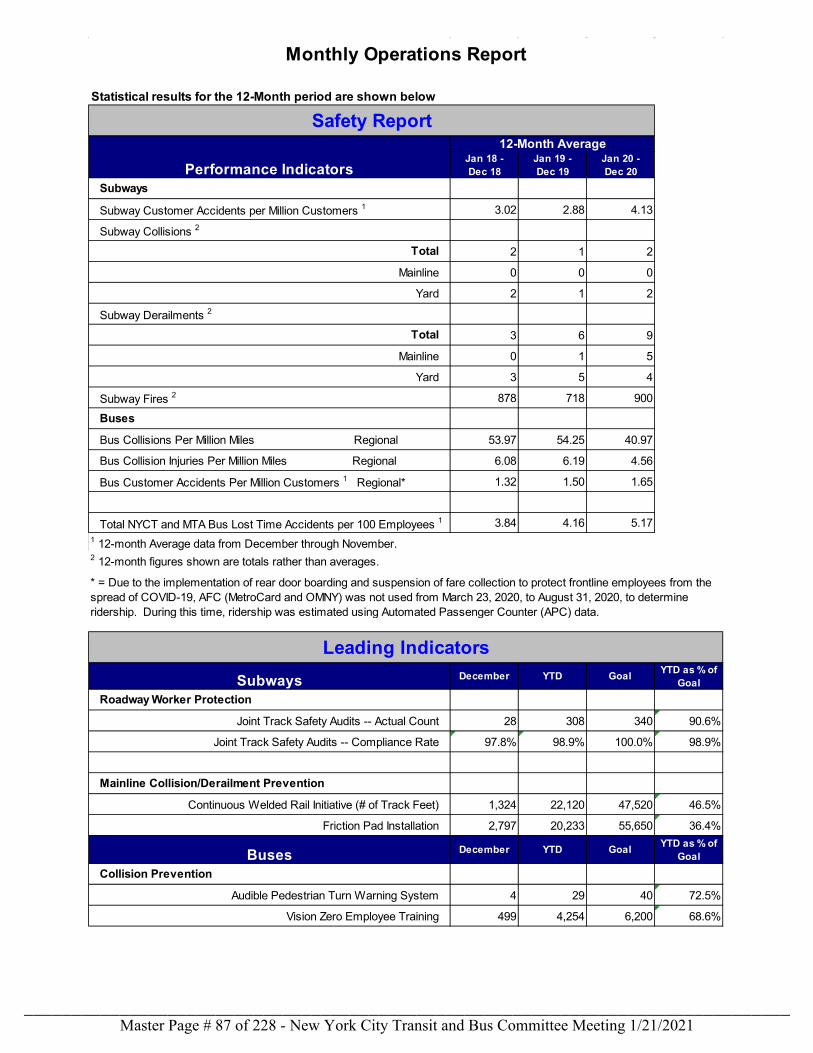
Statistical results for the 12-Month period are shown below
Jan 18 - Dec 18
Jan 19 - Dec 19
Jan 20 - Dec 20
Subways
Subway Customer Accidents per Million Customers 1 3.02 2.88 4.13
Subway Collisions 2
Total 2 1 2
Mainline 0 0 0
Yard 2 1 2
Subway Derailments 2
Total 3 6 9
Mainline 0 1 5
Yard 3 5 4
Subway Fires 2 878 718 900
Buses
Bus Collisions Per Million Miles Regional 53.97 54.25 40.97
Bus Collision Injuries Per Million Miles Regional 6.08 6.19 4.56
Bus Customer Accidents Per Million Customers 1 Regional* 1.32 1.50 1.65
Total NYCT and MTA Bus Lost Time Accidents per 100 Employees 1 3.84 4.16 5.171 12-month Average data from December through November.2 12-month figures shown are totals rather than averages.
Subways December YTD Goal YTD as % of Goal
Roadway Worker Protection
Joint Track Safety Audits -- Actual Count 28 308 340 90.6%
Joint Track Safety Audits -- Compliance Rate 97.8% 98.9% 100.0% 98.9%
Mainline Collision/Derailment Prevention
Continuous Welded Rail Initiative (# of Track Feet) 1,324 22,120 47,520 46.5%
Friction Pad Installation 2,797 20,233 55,650 36.4%
Buses December YTD Goal YTD as % of Goal
Collision Prevention
Audible Pedestrian Turn Warning System 4 29 40 72.5%
Vision Zero Employee Training 499 4,254 6,200 68.6%
Monthly Operations Report
12-Month Average
Leading Indicators
Safety Report
Performance Indicators
* = Due to the implementation of rear door boarding and suspension of fare collection to protect frontline employees from thespread of COVID-19, AFC (MetroCard and OMNY) was not used from March 23, 2020, to August 31, 2020, to determineridership. During this time, ridership was estimated using Automated Passenger Counter (APC) data.
Master Page # 87 of 228 - New York City Transit and Bus Committee Meeting 1/21/2021________________________________________________________________________________
Monthly Operations Report
Safety Report Definitions:
Joint Track Safety Audits are conducted by a joint team of personnel from the Office of System Safety, the Transport Workers Union, and the Subway Surface Supervisors Association (SSSA). The teams look at critical items for on-track safety such as flagging, third rail safety and lighting. These reviews are conducted at various Department of Subways, Capital Program Management and MTA Capital Construction work sites along the right of way to assess compliance with the rules and procedures, identify deficiencies in training and equipment, and improve on-track safety.
Continuous Welded Rail (CWR) significantly reduces the number of rail joints, which lessens the occurrence of broken rails while also providing a smoother ride. Track Engineering analyzed system-wide broken rail data and set forth a CWR installation plan to help reduce broken rails and improve track conditions. We anticipate expanded use of the Critter Rail Stringer and "E" Clip installer to help us achieve this goal.
Friction Pad Installations will increase resiliency of the rail, resulting in reduced broken rail incidents and, overall, will reduce the potential for development of rail defects.
Audible Pedestrian Warning System technology produces an audible voice alert to pedestrians when a bus is making a left- or a right-hand turn. The system turns on automatically without a bus operator’s intervention and alerts pedestrians with a street- and curb-side speaker. Volume automatically adjusts based on outside ambient noise.
Vision Zero Training provides focused Safety Awareness Training to all Bus Operators, which engages them on all aspects of Pedestrian Safety issues, emphasizing the current challenges of managing their buses in an environment with distracted pedestrians, motorists and cyclists. The program incorporates testimonial videos from “Families for Safer Streets” along with a series of videos of serious bus and pedestrian accidents secured from onboard bus cameras as well as external traffic and security cameras. The training, which will be delivered over two years, is in the midst of a new cycle that began in April 2019 and will run through March 2021.
Master Page # 88 of 228 - New York City Transit and Bus Committee Meeting 1/21/2021________________________________________________________________________________
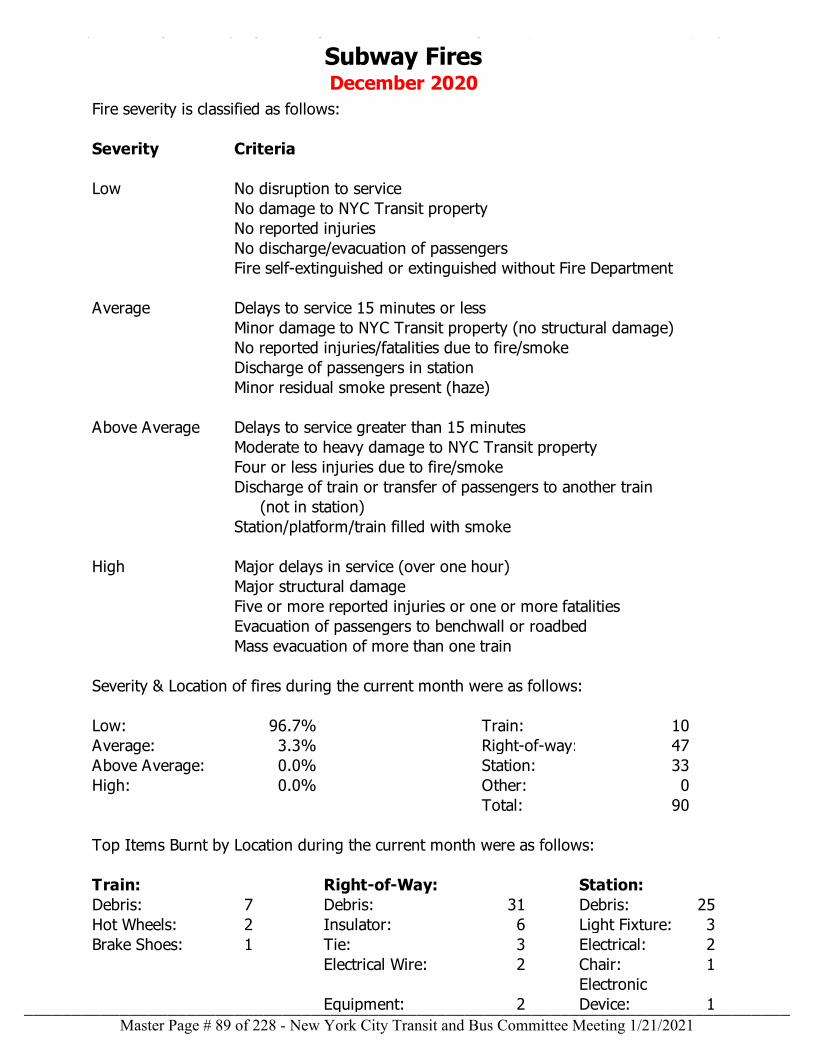
Fire severity is classified as follows:
Severity Criteria
Low No disruption to service No damage to NYC Transit property No reported injuries No discharge/evacuation of passengers Fire self-extinguished or extinguished without Fire Department
Average Delays to service 15 minutes or less Minor damage to NYC Transit property (no structural damage) No reported injuries/fatalities due to fire/smoke Discharge of passengers in station Minor residual smoke present (haze)
Above Average Delays to service greater than 15 minutes Moderate to heavy damage to NYC Transit property Four or less injuries due to fire/smoke Discharge of train or transfer of passengers to another train
(not in station) Station/platform/train filled with smoke
High Major delays in service (over one hour) Major structural damage Five or more reported injuries or one or more fatalities Evacuation of passengers to benchwall or roadbed Mass evacuation of more than one train
Severity & Location of fires during the current month were as follows:
Low: 96.7% Train: 10Average: 3.3% Right-of-way: 47Above Average: 0.0% Station: 33High: 0.0% Other: 0
Total: 90
Top Items Burnt by Location during the current month were as follows:
Train: Right-of-Way: Station: Debris: 7 Debris: 31 Debris: 25Hot Wheels: 2 Insulator: 6 Light Fixture: 3Brake Shoes: 1 Tie: 3 Electrical: 2
Electrical Wire: 2 Chair: 1
Equipment: 2Electronic Device: 1
Subway FiresDecember 2020
Master Page # 89 of 228 - New York City Transit and Bus Committee Meeting 1/21/2021________________________________________________________________________________
January 2021 Crime Report
The purpose of this report is to provide Committee Members with statistical information regarding the number of major felonies including: homicide, robbery, assault, rape in addition to hate crime incidents occurring on the NYCT Subway and Staten Island Railway systems. The report is submitted by NYPD’s Transit Division on a monthly basis for the month ending prior to the reporting period.
Master Page # 90 of 228 - New York City Transit and Bus Committee Meeting 1/21/2021________________________________________________________________________________
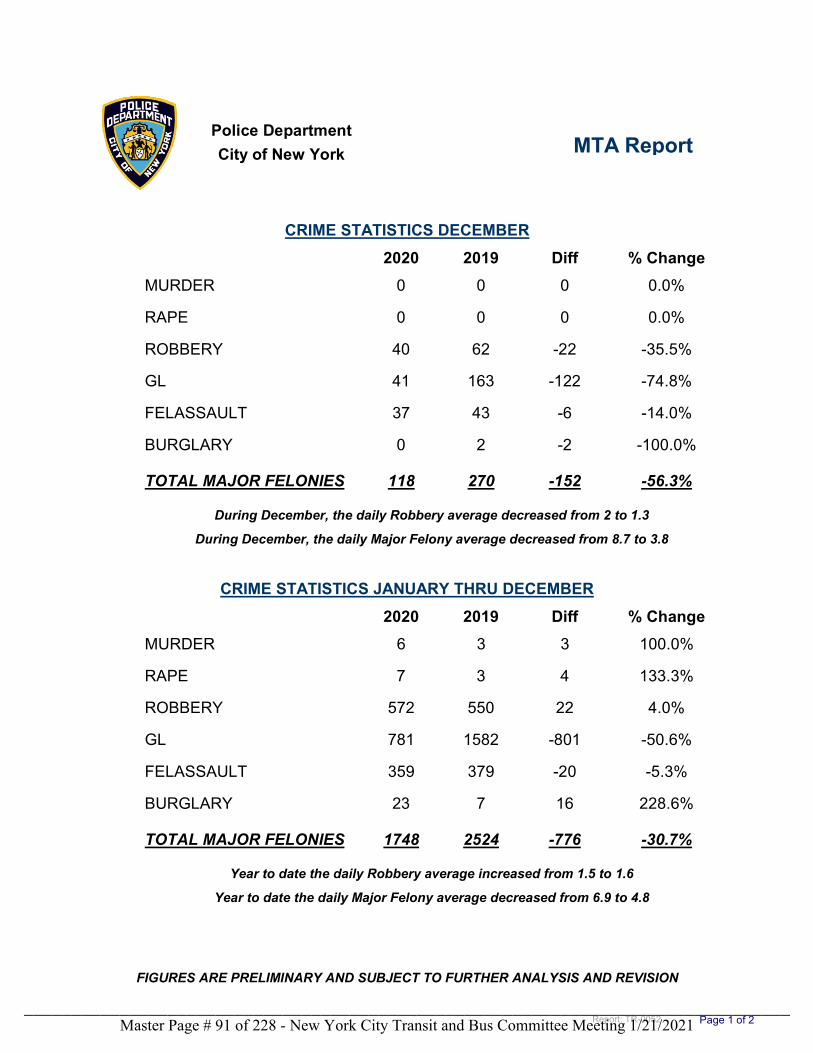
Police Department
City of New York MTA Report
CRIME STATISTICS DECEMBER
2020 2019 Diff % Change
MURDER 0 0 0 0.0%
RAPE 0 0 0 0.0%
ROBBERY 40 62 -22 -35.5%
GL 41 163 -122 -74.8%
FELASSAULT 37 43 -6 -14.0%
BURGLARY 0 2 -2 -100.0%
TOTAL MAJOR FELONIES 118 270 -152 -56.3%
During December, the daily Robbery average decreased from 2 to 1.3
During December, the daily Major Felony average decreased from 8.7 to 3.8
CRIME STATISTICS JANUARY THRU DECEMBER
2020 2019 Diff % Change
MURDER 6 3 3 100.0%
RAPE 7 3 4 133.3%
ROBBERY 572 550 22 4.0%
GL 781 1582 -801 -50.6%
FELASSAULT 359 379 -20 -5.3%
BURGLARY 23 7 16 228.6%
TOTAL MAJOR FELONIES 1748 2524 -776 -30.7%
Year to date the daily Robbery average increased from 1.5 to 1.6
Year to date the daily Major Felony average decreased from 6.9 to 4.8
FIGURES ARE PRELIMINARY AND SUBJECT TO FURTHER ANALYSIS AND REVISION
Page 1 of 2Report: TR-0052Master Page # 91 of 228 - New York City Transit and Bus Committee Meeting 1/21/2021________________________________________________________________________________
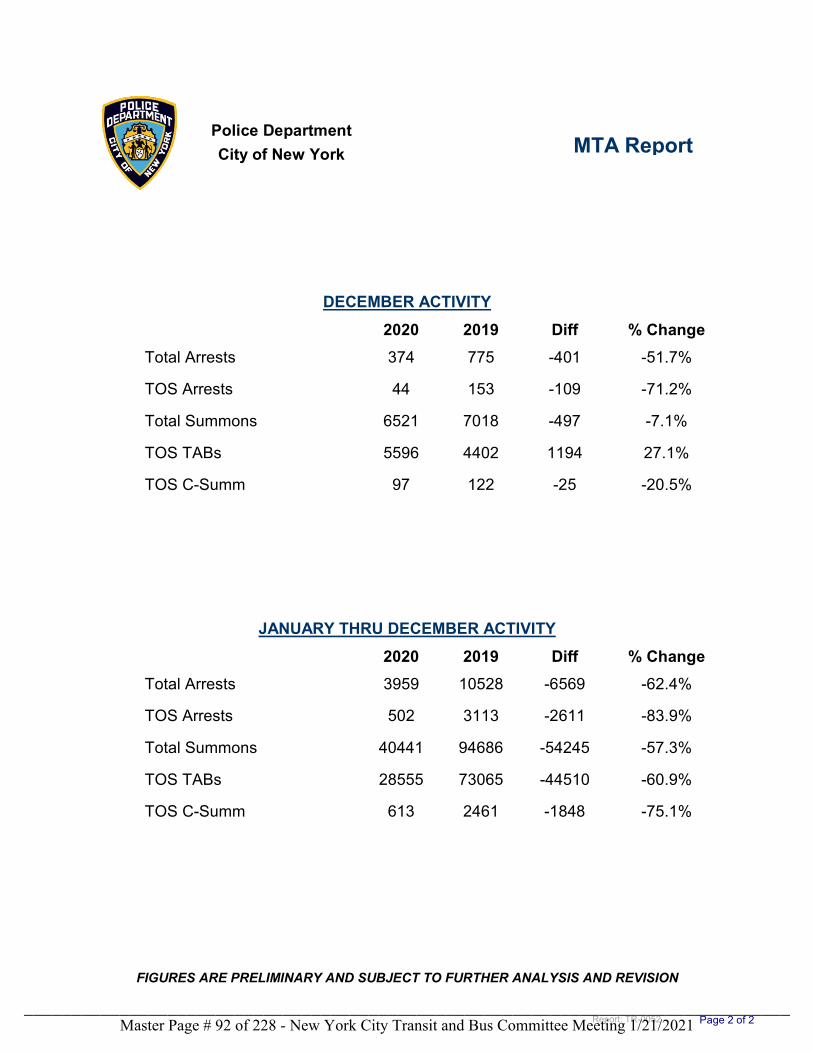
Police Department
City of New York MTA Report
DECEMBER ACTIVITY
2020 2019 Diff % Change
Total Arrests 374 775 -401 -51.7%
TOS Arrests 44 153 -109 -71.2%
Total Summons 6521 7018 -497 -7.1%
TOS TABs 5596 4402 1194 27.1%
TOS C-Summ 97 122 -25 -20.5%
JANUARY THRU DECEMBER ACTIVITY
2020 2019 Diff % Change
Total Arrests 3959 10528 -6569 -62.4%
TOS Arrests 502 3113 -2611 -83.9%
Total Summons 40441 94686 -54245 -57.3%
TOS TABs 28555 73065 -44510 -60.9%
TOS C-Summ 613 2461 -1848 -75.1%
FIGURES ARE PRELIMINARY AND SUBJECT TO FURTHER ANALYSIS AND REVISION
Page 2 of 2Report: TR-0052Master Page # 92 of 228 - New York City Transit and Bus Committee Meeting 1/21/2021________________________________________________________________________________
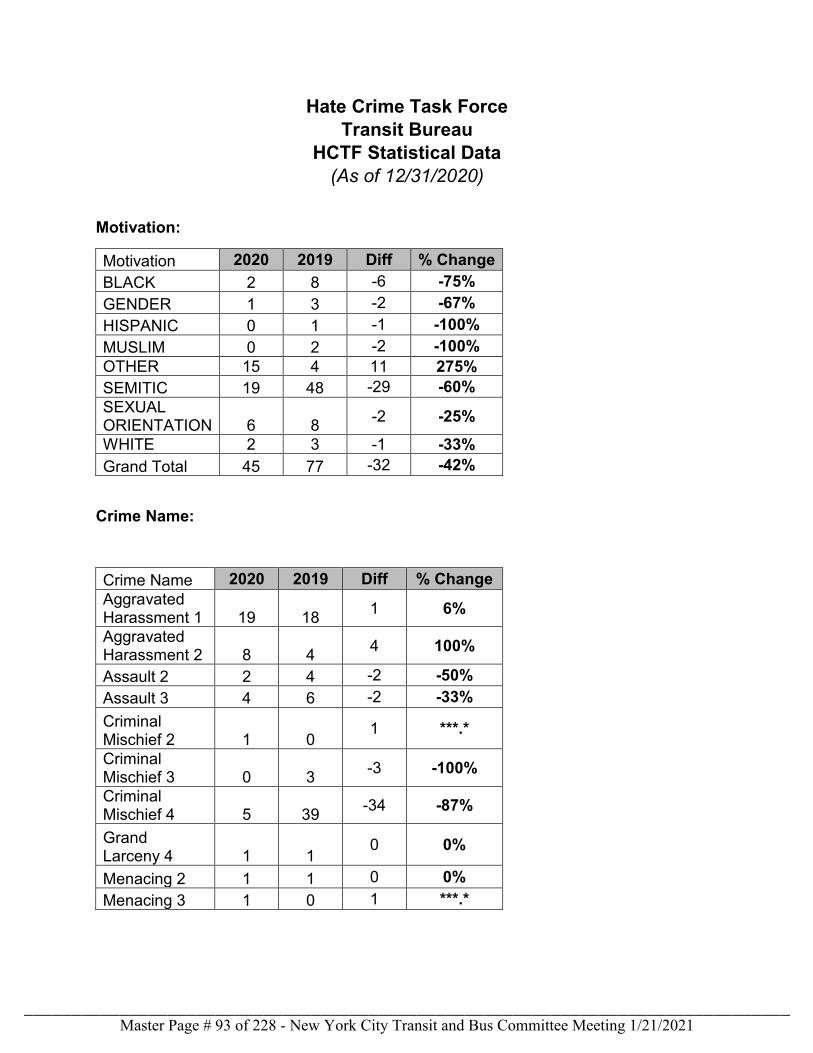
Hate Crime Task Force Transit Bureau
HCTF Statistical Data (As of 12/31/2020)
Motivation:
Motivation 2020 2019 Diff % Change BLACK 2 8 -6 -75% GENDER 1 3 -2 -67% HISPANIC 0 1 -1 -100% MUSLIM 0 2 -2 -100% OTHER 15 4 11 275% SEMITIC 19 48 -29 -60% SEXUAL ORIENTATION 6 8 -2 -25% WHITE 2 3 -1 -33% Grand Total 45 77 -32 -42%
Crime Name:
Crime Name 2020 2019 Diff % Change Aggravated Harassment 1 19 18 1 6% Aggravated Harassment 2 8 4 4 100%
Assault 2 2 4 -2 -50% Assault 3 4 6 -2 -33% Criminal Mischief 2 1 0
1 ***.*
Criminal Mischief 3 0 3 -3 -100% Criminal Mischief 4 5 39 -34 -87%
Grand Larceny 4 1 1
0 0%
Menacing 2 1 1 0 0% Menacing 3 1 0 1 ***.*
Master Page # 93 of 228 - New York City Transit and Bus Committee Meeting 1/21/2021________________________________________________________________________________
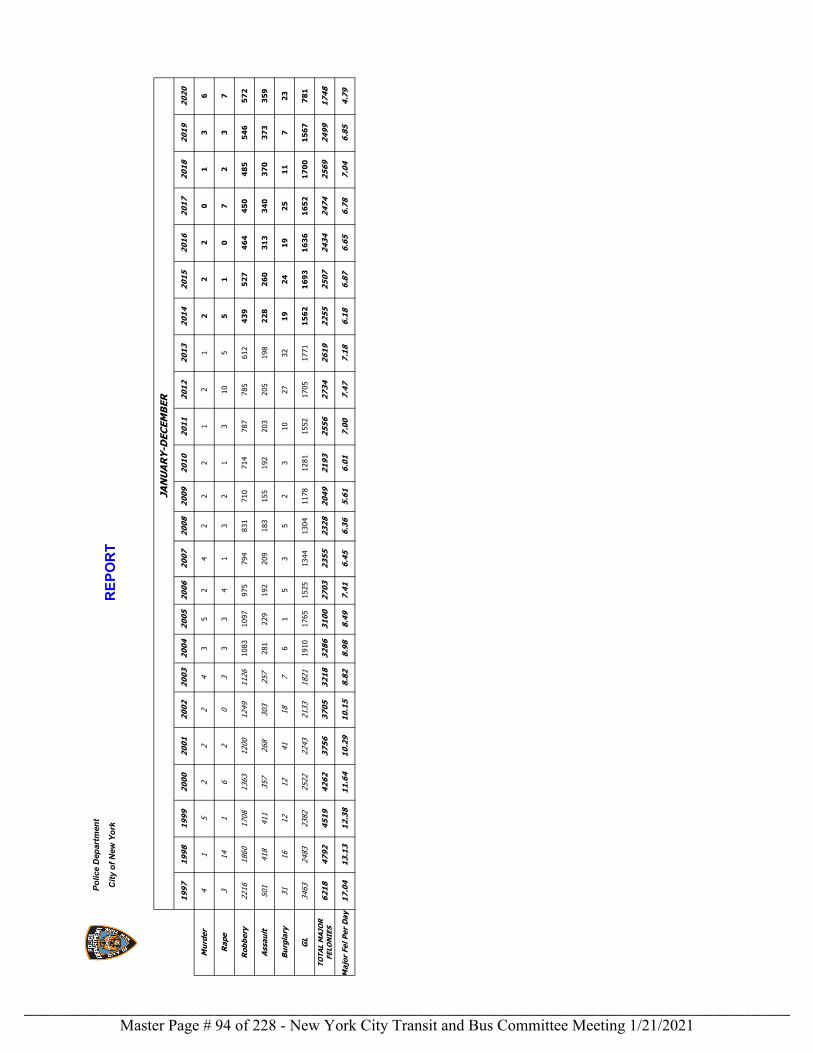
1997
1998
1999
2000
2001
2002
2003
2004
2005
2006
2007
2008
2009
2010
2011
2012
2013
2014
2015
2016
2017
2018
2019
2020
Mur
der
41
52
22
43
52
42
22
12
12
22
01
36
Rape
314
16
20
33
34
13
21
310
55
10
72
37
Robb
ery
2216
1860
1708
1363
1200
1249
1126
1083
1097
975
794
831
710
714
787
785
612
439
527
464
450
485
546
572
Assa
ult
501
418
411
357
268
303
257
281
229
192
209
183
155
192
203
205
198
228
260
313
340
370
373
359
Burg
lary
3116
1212
4118
76
15
35
23
1027
3219
2419
2511
723
GL3463
2483
2382
2522
2243
2133
1821
1910
1765
1525
1344
1304
1178
1281
1552
1705
1771
1562
1693
1636
1652
1700
1567
781
TOTA
L M
AJOR
FE
LONI
ES62
1847
9245
1942
6237
5637
0532
1832
8631
0027
0323
5523
2820
4921
9325
5627
3426
1922
5525
0724
3424
7425
6924
9917
48
Maj
or F
el P
er D
ay
17.0
413
.13
12.3
811
.64
10.2
910
.15
8.82
8.98
8.49
7.41
6.45
6.36
5.61
6.01
7.00
7.47
7.18
6.18
6.87
6.65
6.78
7.04
6.85
4.79
RE
PO
RT
Polic
e D
epar
tmen
t
City
of N
ew Y
ork
J
ANUA
RY-D
ECEM
BER
Master Page # 94 of 228 - New York City Transit and Bus Committee Meeting 1/21/2021________________________________________________________________________________
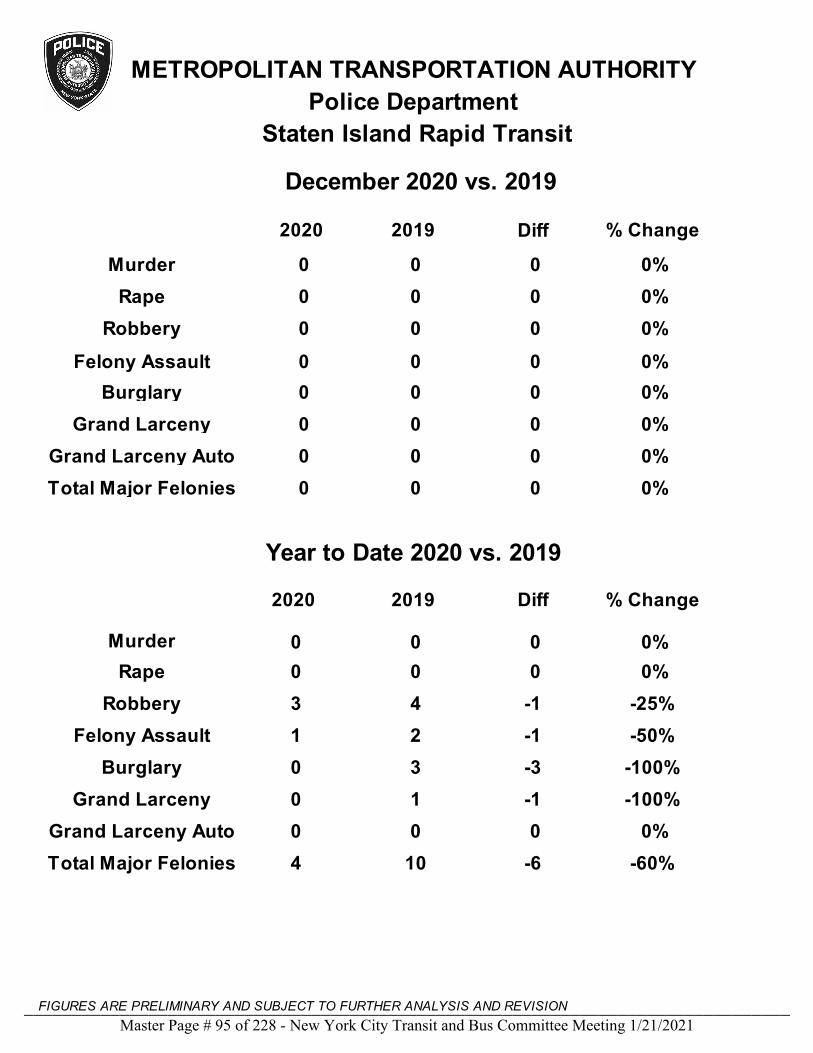
METROPOLITAN TRANSPORTATION AUTHORITY
Police Department
Murder
Rape
Robbery
Felony Assault
Burglary
Grand Larceny
Grand Larceny Auto
Total Major Felonies
0
0
0
0
0
0
0
0
0
0
0
0
0
0
0
0
0
0
0
0
0
0
0
0
0%
Murder
Rape
Robbery
Felony Assault
Burglary
Grand Larceny
Grand Larceny Auto
Total Major Felonies
0 1
0
0
1
3
0
0
4 10
0
3
2
4
0
0
-1
0
-3
-1
-1
0
0
-6
0%
0%
0%
0%
0%
0%
0%
0%
0%
-25%
-50%
-100%
-100%
0%
-60%
2020 2019 Diff % Change
December 2020 vs. 2019
Staten Island Rapid Transit
FIGURES ARE PRELIMINARY AND SUBJECT TO FURTHER ANALYSIS AND REVISION
2020 2019 Diff % Change
Year to Date 2020 vs. 2019
Master Page # 95 of 228 - New York City Transit and Bus Committee Meeting 1/21/2021________________________________________________________________________________
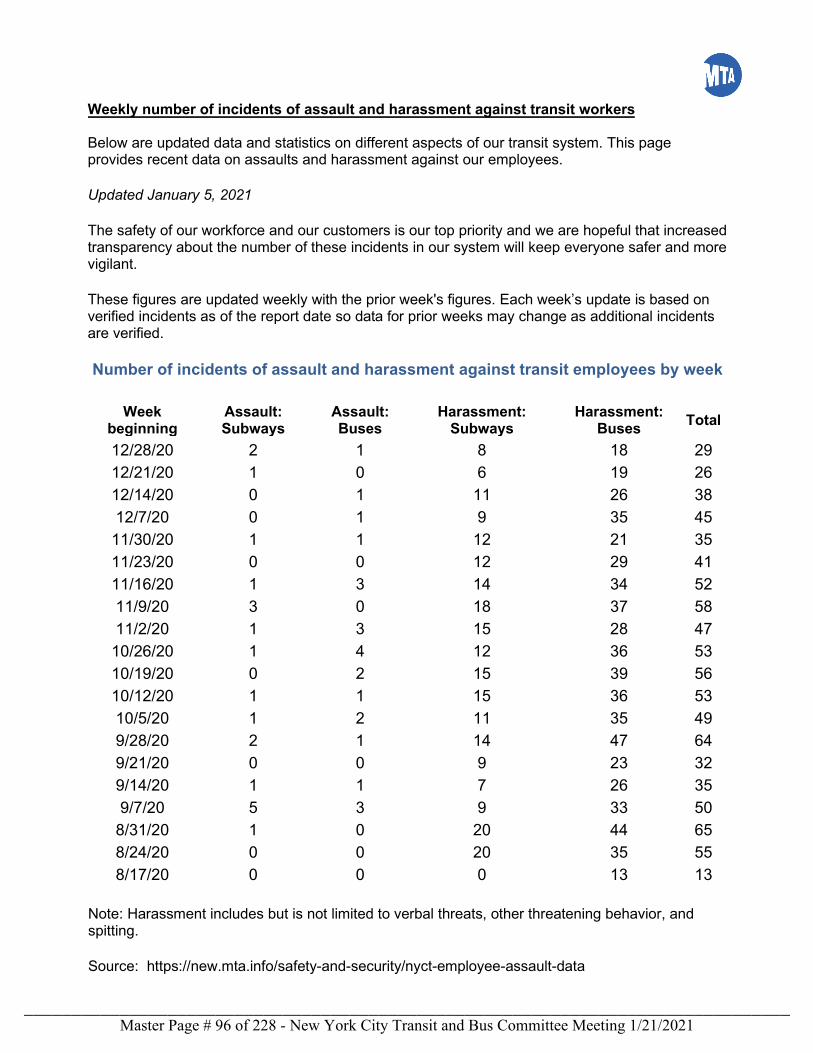
Weekly number of incidents of assault and harassment against transit workers
Below are updated data and statistics on different aspects of our transit system. This page provides recent data on assaults and harassment against our employees.
Updated January 5, 2021
The safety of our workforce and our customers is our top priority and we are hopeful that increased transparency about the number of these incidents in our system will keep everyone safer and more vigilant.
These figures are updated weekly with the prior week's figures. Each week’s update is based on verified incidents as of the report date so data for prior weeks may change as additional incidents are verified.
Number of incidents of assault and harassment against transit employees by week
Week beginning
Assault: Subways
Assault: Buses
Harassment: Subways
Harassment: Buses Total
12/28/20 2 1 8 18 29 12/21/20 1 0 6 19 26 12/14/20 0 1 11 26 38 12/7/20 0 1 9 35 45 11/30/20 1 1 12 21 35 11/23/20 0 0 12 29 41 11/16/20 1 3 14 34 52 11/9/20 3 0 18 37 58 11/2/20 1 3 15 28 47 10/26/20 1 4 12 36 53 10/19/20 0 2 15 39 56 10/12/20 1 1 15 36 53 10/5/20 1 2 11 35 49 9/28/20 2 1 14 47 64 9/21/20 0 0 9 23 32 9/14/20 1 1 7 26 35 9/7/20 5 3 9 33 50
8/31/20 1 0 20 44 65 8/24/20 0 0 20 35 55 8/17/20 0 0 0 13 13
Note: Harassment includes but is not limited to verbal threats, other threatening behavior, and spitting.
Source: https://new.mta.info/safety-and-security/nyct-employee-assault-data
Master Page # 96 of 228 - New York City Transit and Bus Committee Meeting 1/21/2021________________________________________________________________________________
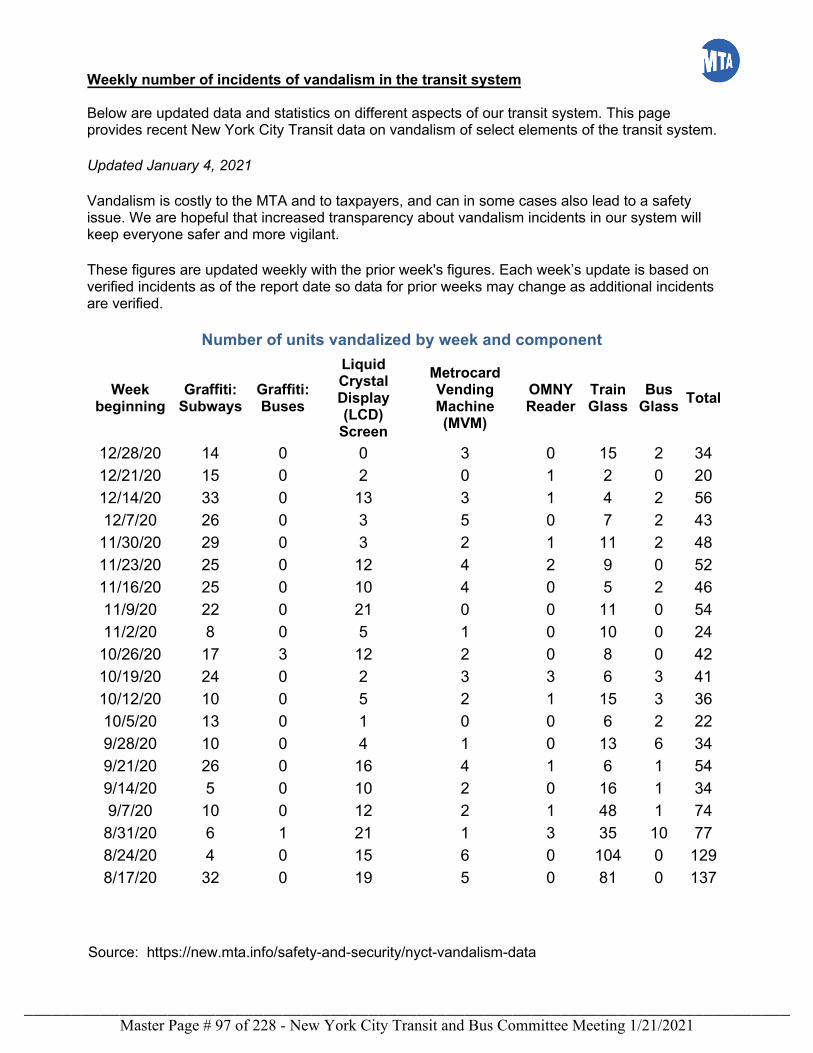
Weekly number of incidents of vandalism in the transit system
Below are updated data and statistics on different aspects of our transit system. This page provides recent New York City Transit data on vandalism of select elements of the transit system.
Updated January 4, 2021
Vandalism is costly to the MTA and to taxpayers, and can in some cases also lead to a safety issue. We are hopeful that increased transparency about vandalism incidents in our system will keep everyone safer and more vigilant.
These figures are updated weekly with the prior week's figures. Each week’s update is based on verified incidents as of the report date so data for prior weeks may change as additional incidents are verified.
Number of units vandalized by week and component
Week beginning
Graffiti: Subways
Graffiti: Buses
Liquid Crystal Display (LCD)
Screen
Metrocard Vending Machine (MVM)
OMNY Reader
Train Glass
BusGlass Total
12/28/20 14 0 0 3 0 15 2 34 12/21/20 15 0 2 0 1 2 0 20 12/14/20 33 0 13 3 1 4 2 56 12/7/20 26 0 3 5 0 7 2 43
11/30/20 29 0 3 2 1 11 2 48 11/23/20 25 0 12 4 2 9 0 52 11/16/20 25 0 10 4 0 5 2 46 11/9/20 22 0 21 0 0 11 0 54 11/2/20 8 0 5 1 0 10 0 24
10/26/20 17 3 12 2 0 8 0 42 10/19/20 24 0 2 3 3 6 3 41 10/12/20 10 0 5 2 1 15 3 36 10/5/20 13 0 1 0 0 6 2 22 9/28/20 10 0 4 1 0 13 6 34 9/21/20 26 0 16 4 1 6 1 54 9/14/20 5 0 10 2 0 16 1 34 9/7/20 10 0 12 2 1 48 1 74
8/31/20 6 1 21 1 3 35 10 77 8/24/20 4 0 15 6 0 104 0 129 8/17/20 32 0 19 5 0 81 0 137
Source: https://new.mta.info/safety-and-security/nyct-vandalism-data
Master Page # 97 of 228 - New York City Transit and Bus Committee Meeting 1/21/2021________________________________________________________________________________
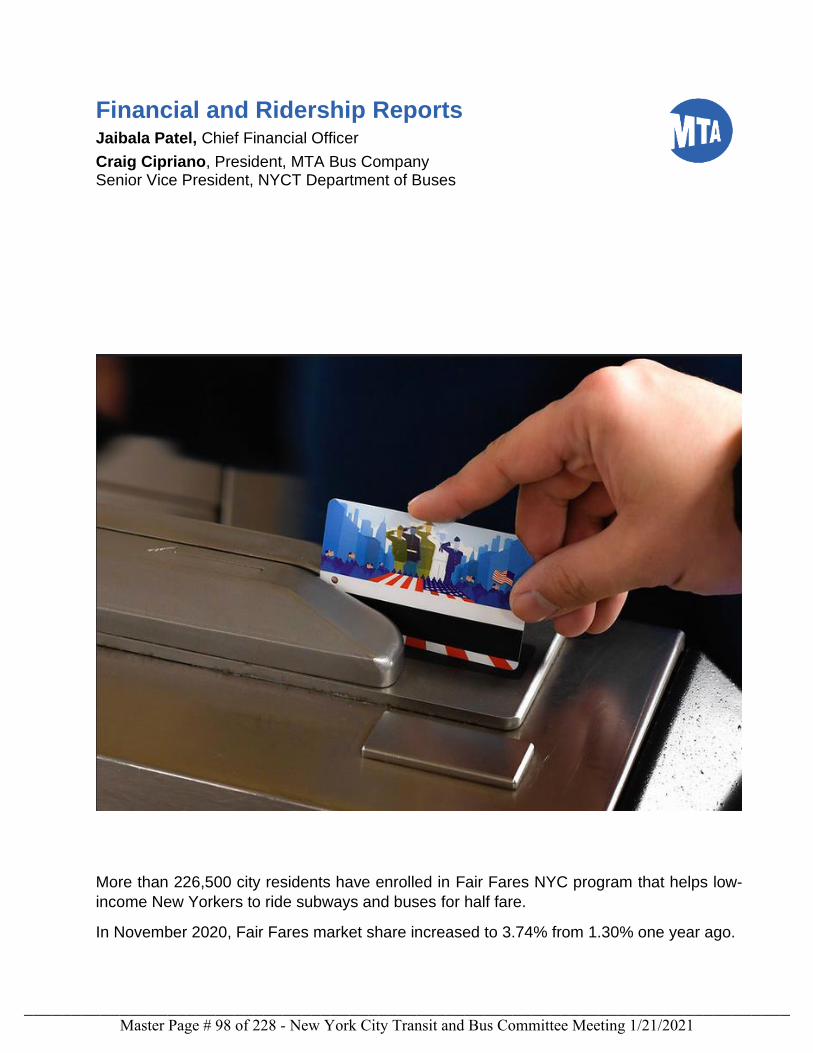
Financial and Ridership Reports Jaibala Patel, Chief Financial Officer
Craig Cipriano, President, MTA Bus Company Senior Vice President, NYCT Department of Buses
More than 226,500 city residents have enrolled in Fair Fares NYC program that helps low-
income New Yorkers to ride subways and buses for half fare.
In November 2020, Fair Fares market share increased to 3.74% from 1.30% one year ago.
Master Page # 98 of 228 - New York City Transit and Bus Committee Meeting 1/21/2021________________________________________________________________________________
Preliminary December 2020 Year-End Report:
New York City Transit The purpose of this report is to provide the preliminary 2020 financial results, on an accrual basis. The accrual basis is presented on a non-reimbursable and reimbursable account basis. Results are compared to the Adopted Budget (budget) and the November Forecast (forecast). Summary of Preliminary Financial Results Preliminary ridership and accrual results, versus forecast are summarized as follows:
• 2020 annual New York City Transit ridership of 855.5 million was 67.9 million (8.6 percent), higher than forecast. Subway ridership of 639.5 million was over by 25.1 million (4.1 percent), bus ridership of 208.8 million was higher by 43.0 million (25.9 percent), and paratransit ridership of 7.1 million was lower by 0.2 million (2.8 percent).
• 2020 farebox revenue of $1,941.6 million was $164.9 million (9.3 percent) above forecast mainly due to higher ridership.
• Other revenue of $3,198.5 million was lower than forecast by $32.4 million (1.0 percent), due to underruns in paratransit reimbursement of $15.4 million (8.2 percent), and a MetroCard surcharge shortfall of $14.0 million (63.2 percent).
• Operating expenses of $8,587.0 million underran forecast by $412.0 million (4.6 percent), of which labor expenses were favorable by $213.6 million (3.0 percent) and non-labor expenses were below the forecast by $198.4 million (10.3 percent).
Preliminary ridership and accrual results versus budget are summarized as follows:
• 2020 annual New York City Transit ridership of 855.5 million was 1,414.8 million (62.3 percent) below budget. Subway ridership of 639.5 million was under by 1,062.2 million (62.4 percent), bus ridership of 208.8 million was lower by 348.1 million (62.5 percent), and paratransit ridership of 7.1 million was 4.4 million (38.3 percent) below budget.
• 2020 farebox revenue was $2,755.6 million (58.7 percent), below budget due to the collapse of ridership resulting from the public health pandemic.
• Other revenue was higher than budget by $2,729.7 million, mainly due to the Federal aid from the CARES Act.
• Operating expenses were below budget $362.7 million (4.1 percent), of which labor expenses were favorable $21.1 million (0.3 percent) and non-labor expenses were lower $341.6 million (16.5 percent).
Master Page # 99 of 228 - New York City Transit and Bus Committee Meeting 1/21/2021________________________________________________________________________________
Preliminary financial results for 2020 are presented in the table below.
Preliminary Actual Results Compared to the November Forecast (forecast) 2020 farebox revenue of $1,941.6 million was $164.9 million (9.3 percent), above forecast. Subway revenue of $1,513.9 was $79.8 million (5.6 percent) over forecast, and bus revenue of $381.1 million overran by $85.1 million (28.8 percent). Paratransit revenue of $5.7 million was equal to forecast, and accrued fare media liability was also on forecast. The 2020 non-student average fare of $2.32 increased by 22.9¢ from $2.09 in 2019; subway fare increased by 26.3¢; local bus fare increased by 11.6¢; express bus fare increased by 28.4¢. Total ridership in 2020 of 855.5 million was 67.9 million (8.6 percent), over forecast. Average weekday ridership in 2020 was 4,578 million (62.7 percent), lower than 2019. Non-reimbursable expenses, before depreciation, GASB 75 OPEB, and GASB 68 Pension Adjustment were below forecast by $412.0 million (4.6 percent). Labor expenses were under forecast by $213.6 million (3.0 percent), due largely to favorable health & welfare/OPEB current expenses of $117.4 million (7.9 percent), payroll expenses $37.9 million (1.1 percent), overtime expenses $29.2 million (4.7 percent), other fringe benefits $11.3 million (1.9 percent), reimbursable overhead credits favorable $9.5 million (4.7 percent), and lower pension expenses of $8.5 million (0.8 percent). Non-labor expenses were below forecast by a net $198.4 million (10.3 percent), including underruns in maintenance contract expenses of $50.3 million (13.5 percent), other business expenses $42.4 million (46.7 percent), materials & supplies $37.3 million (11.3 percent), paratransit service contract expenses $31.1 million (8.7 percent), professional service contract expenses $22.7 million (13.0 percent), electric power $8.9 million (3.6 percent), and lower fuel expenses $6.2 million of (8.5 percent). The net cash deficit for December 2020 year-to-date was $2,989.7 million, favorable to the forecast by a net $652.7 million (17.9 percent).
Category
($ in millions) Budget Forecast
Prelim
Actual
Amount
$
Percent
%
Amount
$
Percent
%
Total Farebox Revenue 4,697.2 1,776.7 1,941.6 (2,755.6) (58.7) 164.9 9.3
Nonreimb. Exp. before Dep./OPEB (8,949.7) (8,999.1) (8,587.0) 362.7 4.1 412.0 4.6
Net Cash Deficit* (3,636.3) (3,642.4) (2,989.7) 646.6 17.8 652.7 17.9
*Excludes Subsidies and Debt Service
Preliminary Financial Results Compared to Budget and Forecast
2020 Favorable (Unfavorable)
Budget Forecast
Master Page # 100 of 228 - New York City Transit and Bus Committee Meeting 1/21/2021________________________________________________________________________________
Preliminary Actual Results Compared to Adopted Budget (budget)
Farebox revenue of $1,941.6 million was $2,755.6 million (58.7 percent), below budget, reflecting the drastic decline in ridership following onset of the COVID-19 pandemic in February. Social distancing and NY State restrictions to reduce the spread of the virus, and the ensuing economic slowdown because of the pandemic weighed heavily upon farebox results throughout the year when compared to the budget. Subway revenue of $1,513.9 million was $2,124.7 million (58.4 percent) below budget, bus revenue of $381.1 was lower by $574.8 million (60.1 percent), and paratransit revenue of $5.7 million was under by $18.5 million (76.5 percent). Accrued fare media liability of $40.9 million was $37.6 million (47.9 percent) lower than budget. Total ridership in 2020 of 855.5 million was 1,414.8 million (62.3 percent) below budget. Average weekday ridership in 2020 was 4,578 million (62.7 percent) lower than in 2019. Other revenue was $2,729.7 million over budget due primarily to Aid from the federal CARES Act,
which covered a portion of 2020 net operating costs.
Non-reimbursable expenses, before depreciation, GASB 75 OPEB Accrual, and GASB 68
Pension Adjustment, were below budget by a net $362.7 million (4.1 percent).
Labor expense underruns of $21.1 million (0.3 percent), were comprised mostly of lower health &
welfare/OPEB current expenses $175.9 million (11.4 percent), due to additional prescription drug
rebates, lower medical utilization, and vacancies. Payroll expenses were also lower by $65.6 million
(1.8 percent), due to vacancy savings. Vacancy coverage backfill and preventative measures to
safely maintain essential transit service contributed significantly to overtime overruns of $83.6
million (16.5 percent). Reduced reimbursable work requirements compared to the budget led to
unfavorable results in other fringe benefits of $70.7 million (13.7 percent), and reimbursable OH of
$65.7 million (23.7 percent).
Non-labor expenses were below budget by a net $341.6 million (16.5 percent), due largely to paratransit service contract expenses lower by $160.4 million (32.8 percent), resulting from lower cost per trip and reduced support costs. Energy was also lower with underruns in both electric power $54.2 million (18.4 percent), and fuel $36.2 million (35.3 percent), due to lower rates and lower consumption resulting from reduced service levels during the pandemic. Materials & supplies were lower by $40.0 million (12.0 percent), reflecting reduced maintenance activity and timing of vehicle materials expense. Underruns in other business expenses of $39.1 million (44.7 percent), were due to lower card fees from lower ridership, and likewise claims expenses were favorable $33.5 million (14.6 percent), due to lower ridership volume. Professional service contracts were under by $31.0 million (16.9 percent), due to underruns in outside services and IT service. Maintenance and operating contract overruns provided a partial offset in non-labor expenses of $48.0 million (17.5 percent), due to COVID-19 prevention measures.
Master Page # 101 of 228 - New York City Transit and Bus Committee Meeting 1/21/2021________________________________________________________________________________
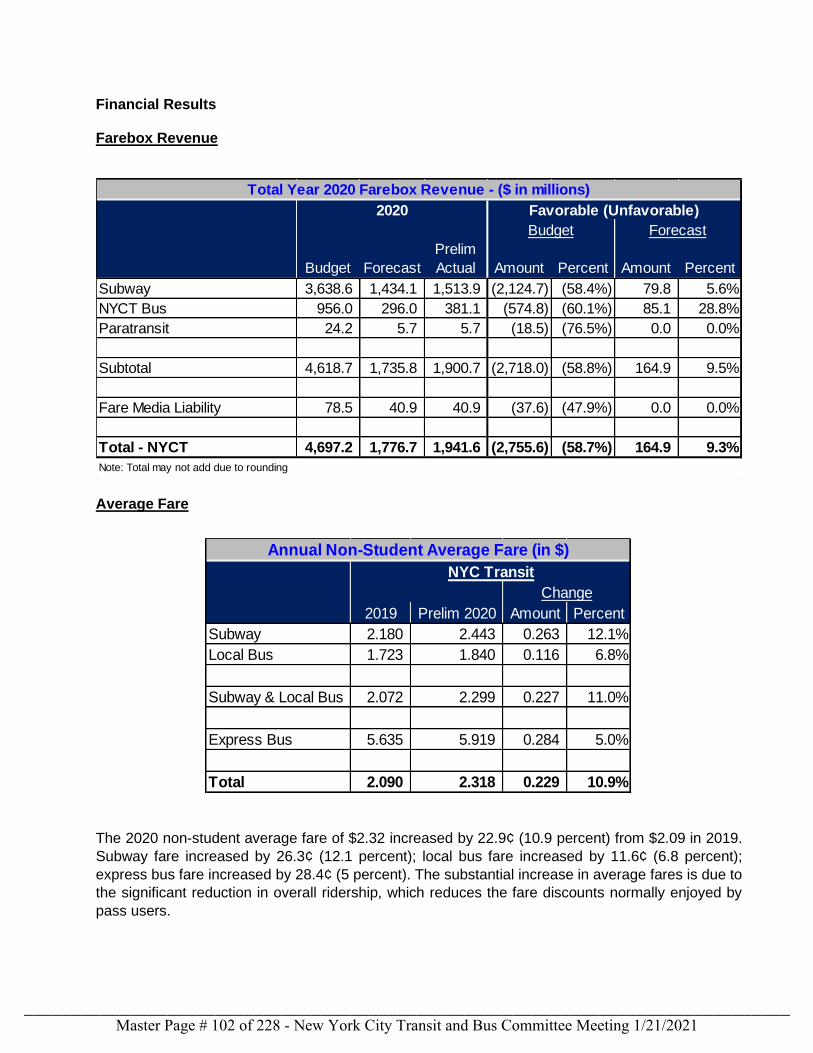
Financial Results Farebox Revenue
Average Fare
The 2020 non-student average fare of $2.32 increased by 22.9¢ (10.9 percent) from $2.09 in 2019.
Subway fare increased by 26.3¢ (12.1 percent); local bus fare increased by 11.6¢ (6.8 percent);
express bus fare increased by 28.4¢ (5 percent). The substantial increase in average fares is due to
the significant reduction in overall ridership, which reduces the fare discounts normally enjoyed by
pass users.
Budget Forecast
Prelim
Actual Amount Percent Amount Percent
Subway 3,638.6 1,434.1 1,513.9 (2,124.7) (58.4%) 79.8 5.6%
NYCT Bus 956.0 296.0 381.1 (574.8) (60.1%) 85.1 28.8%
Paratransit 24.2 5.7 5.7 (18.5) (76.5%) 0.0 0.0%
Subtotal 4,618.7 1,735.8 1,900.7 (2,718.0) (58.8%) 164.9 9.5%
Fare Media Liability 78.5 40.9 40.9 (37.6) (47.9%) 0.0 0.0%
Total - NYCT 4,697.2 1,776.7 1,941.6 (2,755.6) (58.7%) 164.9 9.3%
Note: Total may not add due to rounding
Total Year 2020 Farebox Revenue - ($ in millions)
2020 Favorable (Unfavorable)
ForecastBudget
NYC Transit
Change
2019 Prelim 2020 Amount Percent
Subway 2.180 2.443 0.263 12.1%
Local Bus 1.723 1.840 0.116 6.8%
Subway & Local Bus 2.072 2.299 0.227 11.0%
Express Bus 5.635 5.919 0.284 5.0%
Total 2.090 2.318 0.229 10.9%
Annual Non-Student Average Fare (in $)
Master Page # 102 of 228 - New York City Transit and Bus Committee Meeting 1/21/2021________________________________________________________________________________
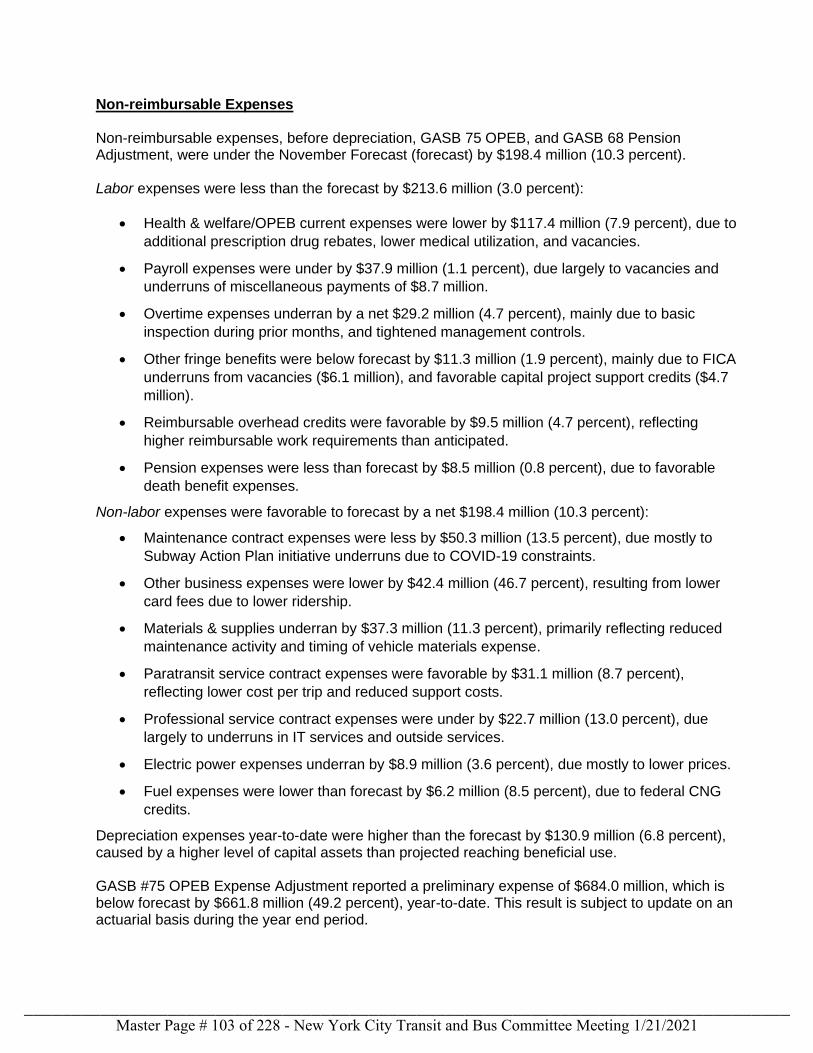
Non-reimbursable Expenses Non-reimbursable expenses, before depreciation, GASB 75 OPEB, and GASB 68 Pension Adjustment, were under the November Forecast (forecast) by $198.4 million (10.3 percent). Labor expenses were less than the forecast by $213.6 million (3.0 percent):
• Health & welfare/OPEB current expenses were lower by $117.4 million (7.9 percent), due to
additional prescription drug rebates, lower medical utilization, and vacancies.
• Payroll expenses were under by $37.9 million (1.1 percent), due largely to vacancies and
underruns of miscellaneous payments of $8.7 million.
• Overtime expenses underran by a net $29.2 million (4.7 percent), mainly due to basic
inspection during prior months, and tightened management controls.
• Other fringe benefits were below forecast by $11.3 million (1.9 percent), mainly due to FICA
underruns from vacancies ($6.1 million), and favorable capital project support credits ($4.7
million).
• Reimbursable overhead credits were favorable by $9.5 million (4.7 percent), reflecting
higher reimbursable work requirements than anticipated.
• Pension expenses were less than forecast by $8.5 million (0.8 percent), due to favorable
death benefit expenses.
Non-labor expenses were favorable to forecast by a net $198.4 million (10.3 percent):
• Maintenance contract expenses were less by $50.3 million (13.5 percent), due mostly to
Subway Action Plan initiative underruns due to COVID-19 constraints.
• Other business expenses were lower by $42.4 million (46.7 percent), resulting from lower
card fees due to lower ridership.
• Materials & supplies underran by $37.3 million (11.3 percent), primarily reflecting reduced
maintenance activity and timing of vehicle materials expense.
• Paratransit service contract expenses were favorable by $31.1 million (8.7 percent),
reflecting lower cost per trip and reduced support costs.
• Professional service contract expenses were under by $22.7 million (13.0 percent), due
largely to underruns in IT services and outside services.
• Electric power expenses underran by $8.9 million (3.6 percent), due mostly to lower prices.
• Fuel expenses were lower than forecast by $6.2 million (8.5 percent), due to federal CNG
credits.
Depreciation expenses year-to-date were higher than the forecast by $130.9 million (6.8 percent), caused by a higher level of capital assets than projected reaching beneficial use. GASB #75 OPEB Expense Adjustment reported a preliminary expense of $684.0 million, which is below forecast by $661.8 million (49.2 percent), year-to-date. This result is subject to update on an actuarial basis during the year end period.
Master Page # 103 of 228 - New York City Transit and Bus Committee Meeting 1/21/2021________________________________________________________________________________
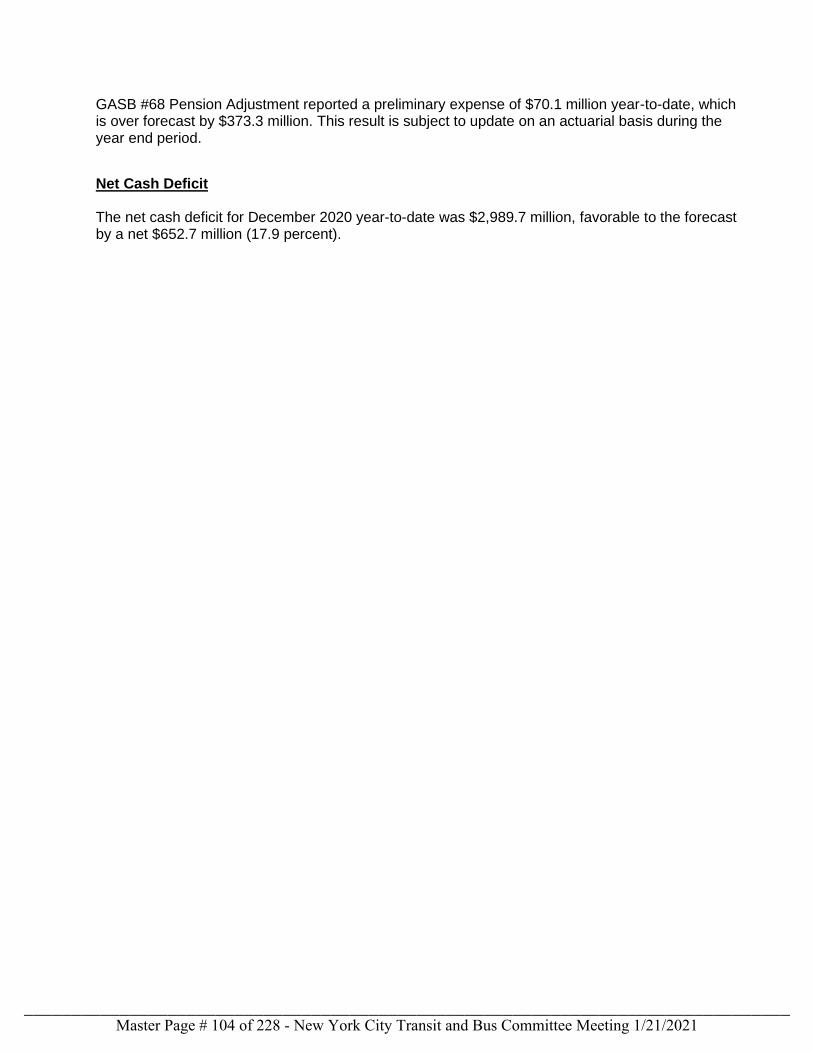
GASB #68 Pension Adjustment reported a preliminary expense of $70.1 million year-to-date, which is over forecast by $373.3 million. This result is subject to update on an actuarial basis during the year end period.
Net Cash Deficit The net cash deficit for December 2020 year-to-date was $2,989.7 million, favorable to the forecast by a net $652.7 million (17.9 percent).
Master Page # 104 of 228 - New York City Transit and Bus Committee Meeting 1/21/2021________________________________________________________________________________
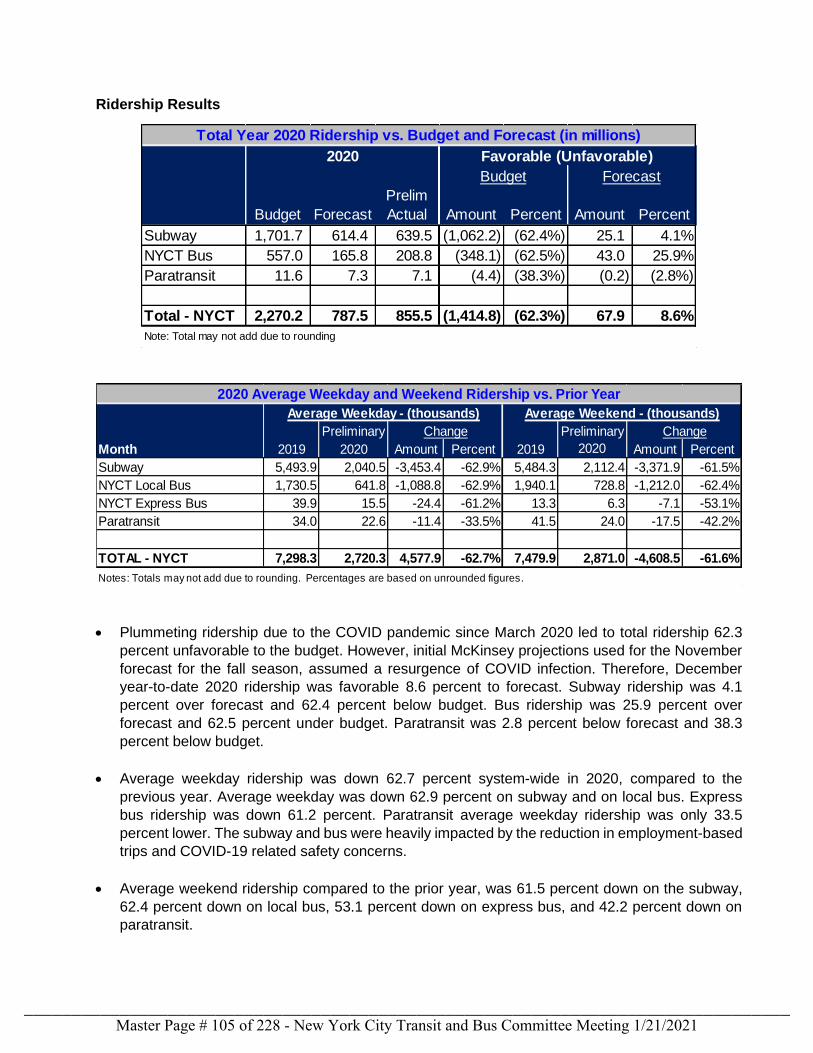
Ridership Results
• Plummeting ridership due to the COVID pandemic since March 2020 led to total ridership 62.3
percent unfavorable to the budget. However, initial McKinsey projections used for the November
forecast for the fall season, assumed a resurgence of COVID infection. Therefore, December
year-to-date 2020 ridership was favorable 8.6 percent to forecast. Subway ridership was 4.1
percent over forecast and 62.4 percent below budget. Bus ridership was 25.9 percent over
forecast and 62.5 percent under budget. Paratransit was 2.8 percent below forecast and 38.3
percent below budget.
• Average weekday ridership was down 62.7 percent system-wide in 2020, compared to the
previous year. Average weekday was down 62.9 percent on subway and on local bus. Express
bus ridership was down 61.2 percent. Paratransit average weekday ridership was only 33.5
percent lower. The subway and bus were heavily impacted by the reduction in employment-based
trips and COVID-19 related safety concerns.
• Average weekend ridership compared to the prior year, was 61.5 percent down on the subway,
62.4 percent down on local bus, 53.1 percent down on express bus, and 42.2 percent down on
paratransit.
Budget Forecast
Prelim
Actual Amount Percent Amount Percent
Subway 1,701.7 614.4 639.5 (1,062.2) (62.4%) 25.1 4.1%
NYCT Bus 557.0 165.8 208.8 (348.1) (62.5%) 43.0 25.9%
Paratransit 11.6 7.3 7.1 (4.4) (38.3%) (0.2) (2.8%)
Total - NYCT 2,270.2 787.5 855.5 (1,414.8) (62.3%) 67.9 8.6%
Note: Total may not add due to rounding
Total Year 2020 Ridership vs. Budget and Forecast (in millions)
2020 Favorable (Unfavorable)
Budget Forecast
Average Weekday - (thousands) Average Weekend - (thousands)
Preliminary Preliminary
Month 2019 2020 Amount Percent 2019 2020 Amount Percent
Subway 5,493.9 2,040.5 -3,453.4 -62.9% 5,484.3 2,112.4 -3,371.9 -61.5%
NYCT Local Bus 1,730.5 641.8 -1,088.8 -62.9% 1,940.1 728.8 -1,212.0 -62.4%
NYCT Express Bus 39.9 15.5 -24.4 -61.2% 13.3 6.3 -7.1 -53.1%
Paratransit 34.0 22.6 -11.4 -33.5% 41.5 24.0 -17.5 -42.2%
TOTAL - NYCT 7,298.3 2,720.3 4,577.9 -62.7% 7,479.9 2,871.0 -4,608.5 -61.6%
2020 Average Weekday and Weekend Ridership vs. Prior Year
Change Change
Notes: Totals may not add due to rounding. Percentages are based on unrounded figures.
Master Page # 105 of 228 - New York City Transit and Bus Committee Meeting 1/21/2021________________________________________________________________________________
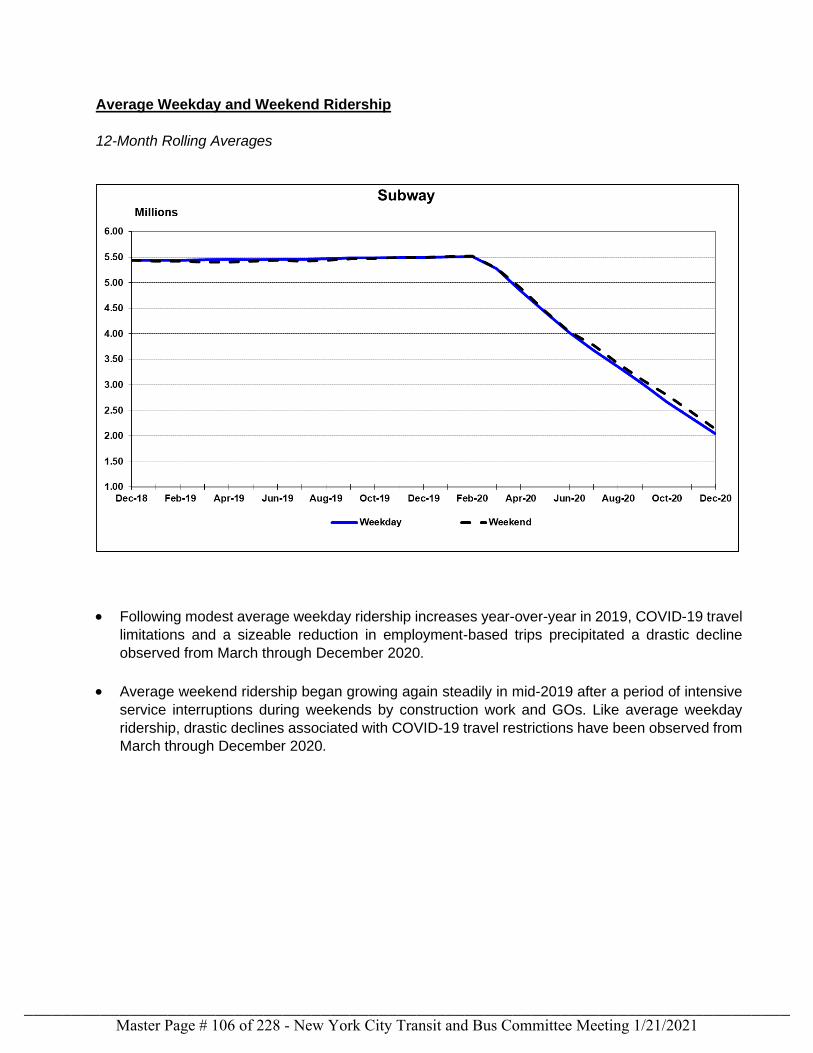
Average Weekday and Weekend Ridership
12-Month Rolling Averages
• Following modest average weekday ridership increases year-over-year in 2019, COVID-19 travel
limitations and a sizeable reduction in employment-based trips precipitated a drastic decline
observed from March through December 2020.
• Average weekend ridership began growing again steadily in mid-2019 after a period of intensive
service interruptions during weekends by construction work and GOs. Like average weekday
ridership, drastic declines associated with COVID-19 travel restrictions have been observed from
March through December 2020.
Master Page # 106 of 228 - New York City Transit and Bus Committee Meeting 1/21/2021________________________________________________________________________________
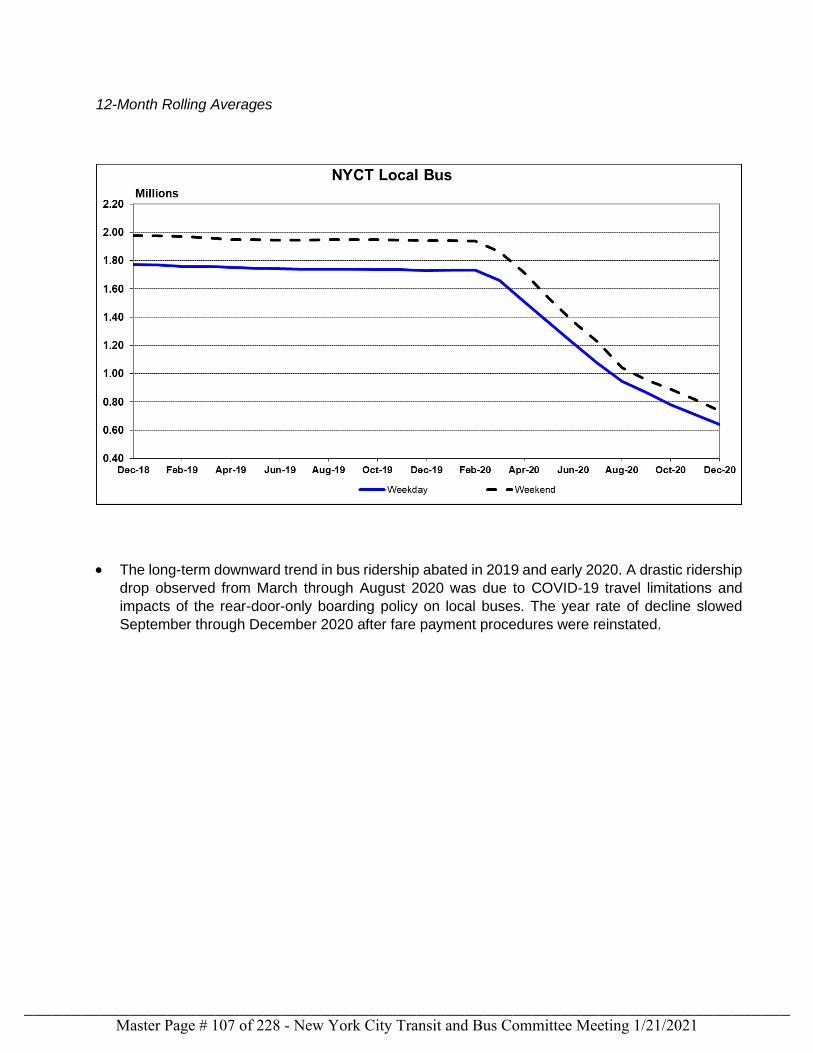
12-Month Rolling Averages
• The long-term downward trend in bus ridership abated in 2019 and early 2020. A drastic ridership
drop observed from March through August 2020 was due to COVID-19 travel limitations and
impacts of the rear-door-only boarding policy on local buses. The year rate of decline slowed
September through December 2020 after fare payment procedures were reinstated.
Master Page # 107 of 228 - New York City Transit and Bus Committee Meeting 1/21/2021________________________________________________________________________________
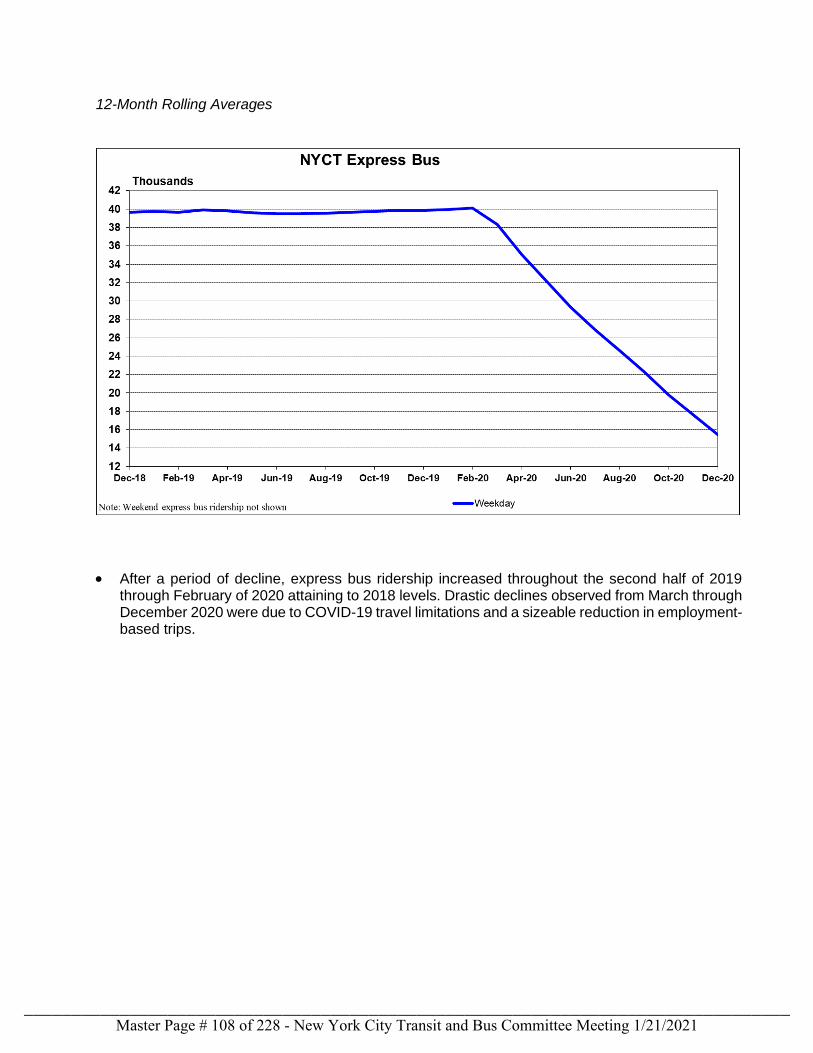
12-Month Rolling Averages
• After a period of decline, express bus ridership increased throughout the second half of 2019 through February of 2020 attaining to 2018 levels. Drastic declines observed from March through December 2020 were due to COVID-19 travel limitations and a sizeable reduction in employment-based trips.
Master Page # 108 of 228 - New York City Transit and Bus Committee Meeting 1/21/2021________________________________________________________________________________
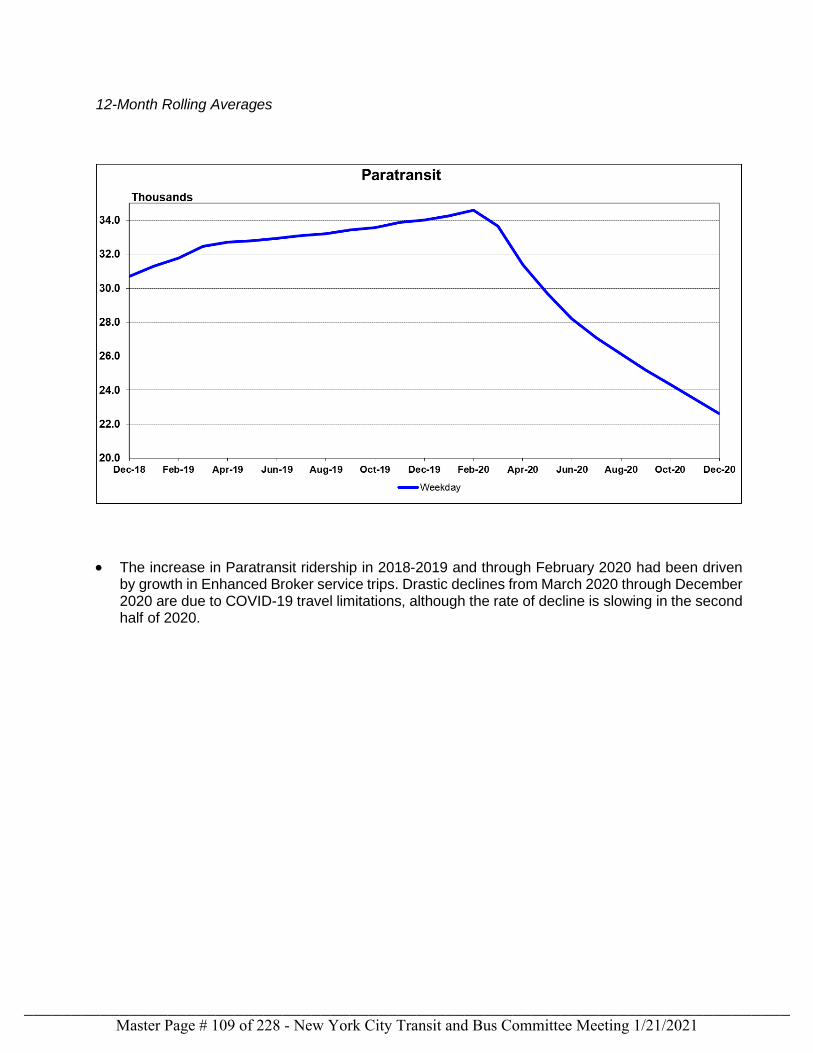
12-Month Rolling Averages
• The increase in Paratransit ridership in 2018-2019 and through February 2020 had been driven by growth in Enhanced Broker service trips. Drastic declines from March 2020 through December 2020 are due to COVID-19 travel limitations, although the rate of decline is slowing in the second half of 2020.
Master Page # 109 of 228 - New York City Transit and Bus Committee Meeting 1/21/2021________________________________________________________________________________
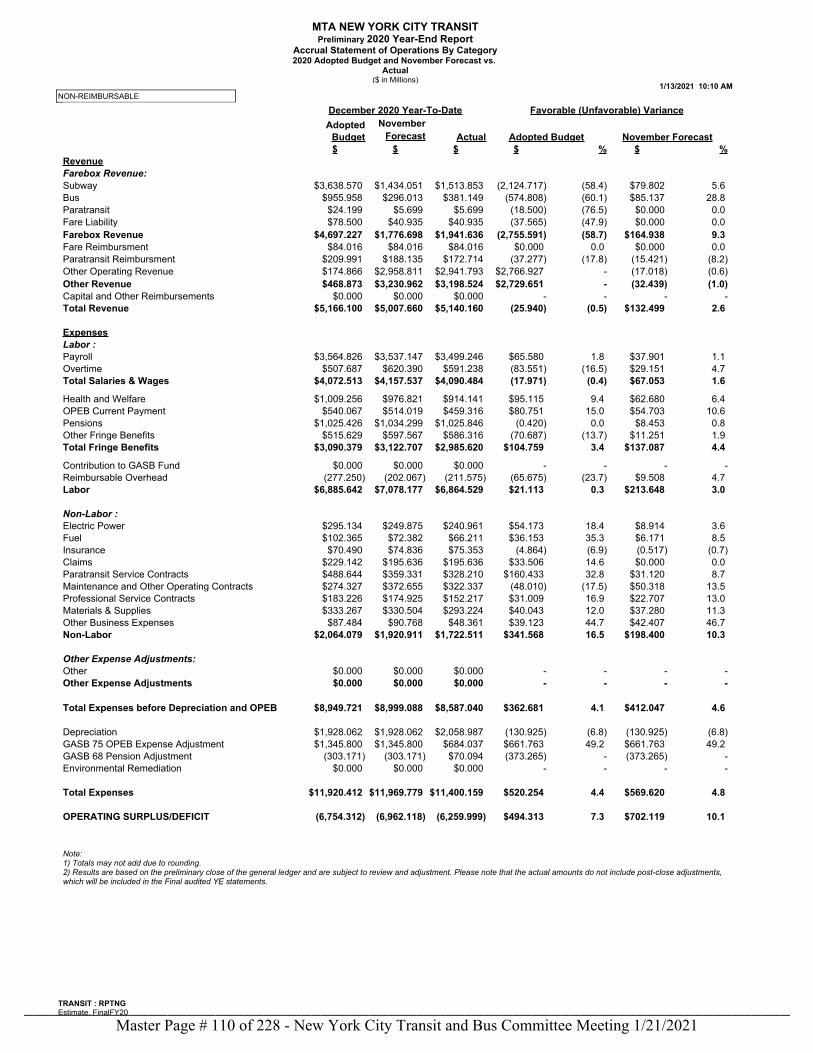
MTA NEW YORK CITY TRANSITPreliminary 2020 Year-End Report
Accrual Statement of Operations By Category2020 Adopted Budget and November Forecast vs.
Actual($ in Millions)
1/13/2021 10:10 AMNON-REIMBURSABLE
TRANSIT : RPTNGEstimate. FinalFY20
December 2020 Year-To-Date Favorable (Unfavorable) VarianceAdopted November
Budget Forecast Actual Adopted Budget November Forecast$ $ $ $ % $ %
RevenueFarebox Revenue:Subway $3,638.570 $1,434.051 $1,513.853 (2,124.717) (58.4) $79.802 5.6 Bus $955.958 $296.013 $381.149 (574.808) (60.1) $85.137 28.8 Paratransit $24.199 $5.699 $5.699 (18.500) (76.5) $0.000 0.0 Fare Liability $78.500 $40.935 $40.935 (37.565) (47.9) $0.000 0.0 Farebox Revenue $4,697.227 $1,776.698 $1,941.636 (2,755.591) (58.7) $164.938 9.3 Fare Reimbursment $84.016 $84.016 $84.016 $0.000 0.0 $0.000 0.0 Paratransit Reimbursment $209.991 $188.135 $172.714 (37.277) (17.8) (15.421) (8.2)Other Operating Revenue $174.866 $2,958.811 $2,941.793 $2,766.927 - (17.018) (0.6)Other Revenue $468.873 $3,230.962 $3,198.524 $2,729.651 - (32.439) (1.0)Capital and Other Reimbursements $0.000 $0.000 $0.000 - - - -Total Revenue $5,166.100 $5,007.660 $5,140.160 (25.940) (0.5) $132.499 2.6
ExpensesLabor :Payroll $3,564.826 $3,537.147 $3,499.246 $65.580 1.8 $37.901 1.1 Overtime $507.687 $620.390 $591.238 (83.551) (16.5) $29.151 4.7 Total Salaries & Wages $4,072.513 $4,157.537 $4,090.484 (17.971) (0.4) $67.053 1.6
Health and Welfare $1,009.256 $976.821 $914.141 $95.115 9.4 $62.680 6.4 OPEB Current Payment $540.067 $514.019 $459.316 $80.751 15.0 $54.703 10.6 Pensions $1,025.426 $1,034.299 $1,025.846 (0.420) 0.0 $8.453 0.8 Other Fringe Benefits $515.629 $597.567 $586.316 (70.687) (13.7) $11.251 1.9 Total Fringe Benefits $3,090.379 $3,122.707 $2,985.620 $104.759 3.4 $137.087 4.4
Contribution to GASB Fund $0.000 $0.000 $0.000 - - - -Reimbursable Overhead (277.250) (202.067) (211.575) (65.675) (23.7) $9.508 4.7 Labor $6,885.642 $7,078.177 $6,864.529 $21.113 0.3 $213.648 3.0
Non-Labor :Electric Power $295.134 $249.875 $240.961 $54.173 18.4 $8.914 3.6 Fuel $102.365 $72.382 $66.211 $36.153 35.3 $6.171 8.5 Insurance $70.490 $74.836 $75.353 (4.864) (6.9) (0.517) (0.7)Claims $229.142 $195.636 $195.636 $33.506 14.6 $0.000 0.0 Paratransit Service Contracts $488.644 $359.331 $328.210 $160.433 32.8 $31.120 8.7 Maintenance and Other Operating Contracts $274.327 $372.655 $322.337 (48.010) (17.5) $50.318 13.5 Professional Service Contracts $183.226 $174.925 $152.217 $31.009 16.9 $22.707 13.0 Materials & Supplies $333.267 $330.504 $293.224 $40.043 12.0 $37.280 11.3 Other Business Expenses $87.484 $90.768 $48.361 $39.123 44.7 $42.407 46.7 Non-Labor $2,064.079 $1,920.911 $1,722.511 $341.568 16.5 $198.400 10.3
Other Expense Adjustments:Other $0.000 $0.000 $0.000 - - - -Other Expense Adjustments $0.000 $0.000 $0.000 - - - -
Total Expenses before Depreciation and OPEB $8,949.721 $8,999.088 $8,587.040 $362.681 4.1 $412.047 4.6
Depreciation $1,928.062 $1,928.062 $2,058.987 (130.925) (6.8) (130.925) (6.8)GASB 75 OPEB Expense Adjustment $1,345.800 $1,345.800 $684.037 $661.763 49.2 $661.763 49.2 GASB 68 Pension Adjustment (303.171) (303.171) $70.094 (373.265) - (373.265) -Environmental Remediation $0.000 $0.000 $0.000 - - - -
Total Expenses $11,920.412 $11,969.779 $11,400.159 $520.254 4.4 $569.620 4.8
OPERATING SURPLUS/DEFICIT (6,754.312) (6,962.118) (6,259.999) $494.313 7.3 $702.119 10.1
Note: 1) Totals may not add due to rounding.2) Results are based on the preliminary close of the general ledger and are subject to review and adjustment. Please note that the actual amounts do not include post-close adjustments, which will be included in the Final audited YE statements.
Master Page # 110 of 228 - New York City Transit and Bus Committee Meeting 1/21/2021________________________________________________________________________________
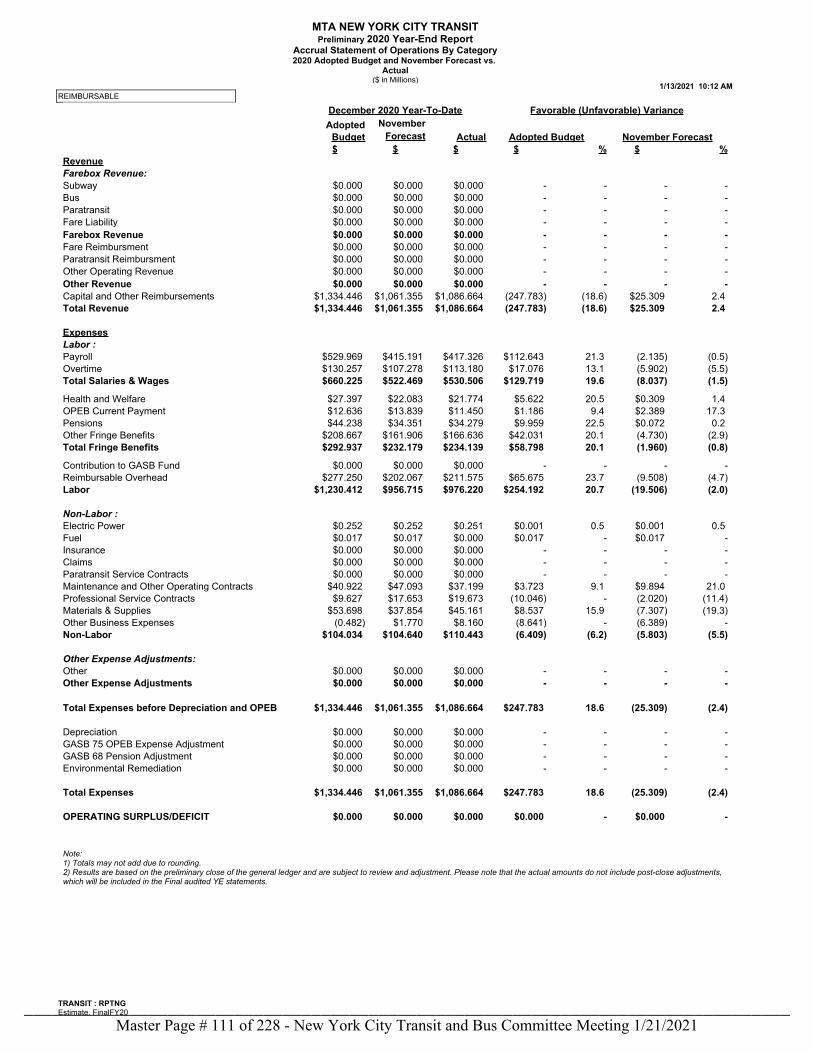
MTA NEW YORK CITY TRANSITPreliminary 2020 Year-End Report
Accrual Statement of Operations By Category2020 Adopted Budget and November Forecast vs.
Actual($ in Millions)
1/13/2021 10:12 AMREIMBURSABLE
TRANSIT : RPTNGEstimate. FinalFY20
December 2020 Year-To-Date Favorable (Unfavorable) VarianceAdopted November
Budget Forecast Actual Adopted Budget November Forecast$ $ $ $ % $ %
RevenueFarebox Revenue:Subway $0.000 $0.000 $0.000 - - - -Bus $0.000 $0.000 $0.000 - - - -Paratransit $0.000 $0.000 $0.000 - - - -Fare Liability $0.000 $0.000 $0.000 - - - -Farebox Revenue $0.000 $0.000 $0.000 - - - -Fare Reimbursment $0.000 $0.000 $0.000 - - - -Paratransit Reimbursment $0.000 $0.000 $0.000 - - - -Other Operating Revenue $0.000 $0.000 $0.000 - - - -Other Revenue $0.000 $0.000 $0.000 - - - -Capital and Other Reimbursements $1,334.446 $1,061.355 $1,086.664 (247.783) (18.6) $25.309 2.4 Total Revenue $1,334.446 $1,061.355 $1,086.664 (247.783) (18.6) $25.309 2.4
ExpensesLabor :Payroll $529.969 $415.191 $417.326 $112.643 21.3 (2.135) (0.5)Overtime $130.257 $107.278 $113.180 $17.076 13.1 (5.902) (5.5)Total Salaries & Wages $660.225 $522.469 $530.506 $129.719 19.6 (8.037) (1.5)
Health and Welfare $27.397 $22.083 $21.774 $5.622 20.5 $0.309 1.4 OPEB Current Payment $12.636 $13.839 $11.450 $1.186 9.4 $2.389 17.3 Pensions $44.238 $34.351 $34.279 $9.959 22.5 $0.072 0.2 Other Fringe Benefits $208.667 $161.906 $166.636 $42.031 20.1 (4.730) (2.9)Total Fringe Benefits $292.937 $232.179 $234.139 $58.798 20.1 (1.960) (0.8)
Contribution to GASB Fund $0.000 $0.000 $0.000 - - - -Reimbursable Overhead $277.250 $202.067 $211.575 $65.675 23.7 (9.508) (4.7)Labor $1,230.412 $956.715 $976.220 $254.192 20.7 (19.506) (2.0)
Non-Labor :Electric Power $0.252 $0.252 $0.251 $0.001 0.5 $0.001 0.5 Fuel $0.017 $0.017 $0.000 $0.017 - $0.017 -Insurance $0.000 $0.000 $0.000 - - - -Claims $0.000 $0.000 $0.000 - - - -Paratransit Service Contracts $0.000 $0.000 $0.000 - - - -Maintenance and Other Operating Contracts $40.922 $47.093 $37.199 $3.723 9.1 $9.894 21.0 Professional Service Contracts $9.627 $17.653 $19.673 (10.046) - (2.020) (11.4)Materials & Supplies $53.698 $37.854 $45.161 $8.537 15.9 (7.307) (19.3)Other Business Expenses (0.482) $1.770 $8.160 (8.641) - (6.389) -Non-Labor $104.034 $104.640 $110.443 (6.409) (6.2) (5.803) (5.5)
Other Expense Adjustments:Other $0.000 $0.000 $0.000 - - - -Other Expense Adjustments $0.000 $0.000 $0.000 - - - -
Total Expenses before Depreciation and OPEB $1,334.446 $1,061.355 $1,086.664 $247.783 18.6 (25.309) (2.4)
Depreciation $0.000 $0.000 $0.000 - - - -GASB 75 OPEB Expense Adjustment $0.000 $0.000 $0.000 - - - -GASB 68 Pension Adjustment $0.000 $0.000 $0.000 - - - -Environmental Remediation $0.000 $0.000 $0.000 - - - -
Total Expenses $1,334.446 $1,061.355 $1,086.664 $247.783 18.6 (25.309) (2.4)
OPERATING SURPLUS/DEFICIT $0.000 $0.000 $0.000 $0.000 - $0.000 -
Note: 1) Totals may not add due to rounding.2) Results are based on the preliminary close of the general ledger and are subject to review and adjustment. Please note that the actual amounts do not include post-close adjustments, which will be included in the Final audited YE statements.
Master Page # 111 of 228 - New York City Transit and Bus Committee Meeting 1/21/2021________________________________________________________________________________
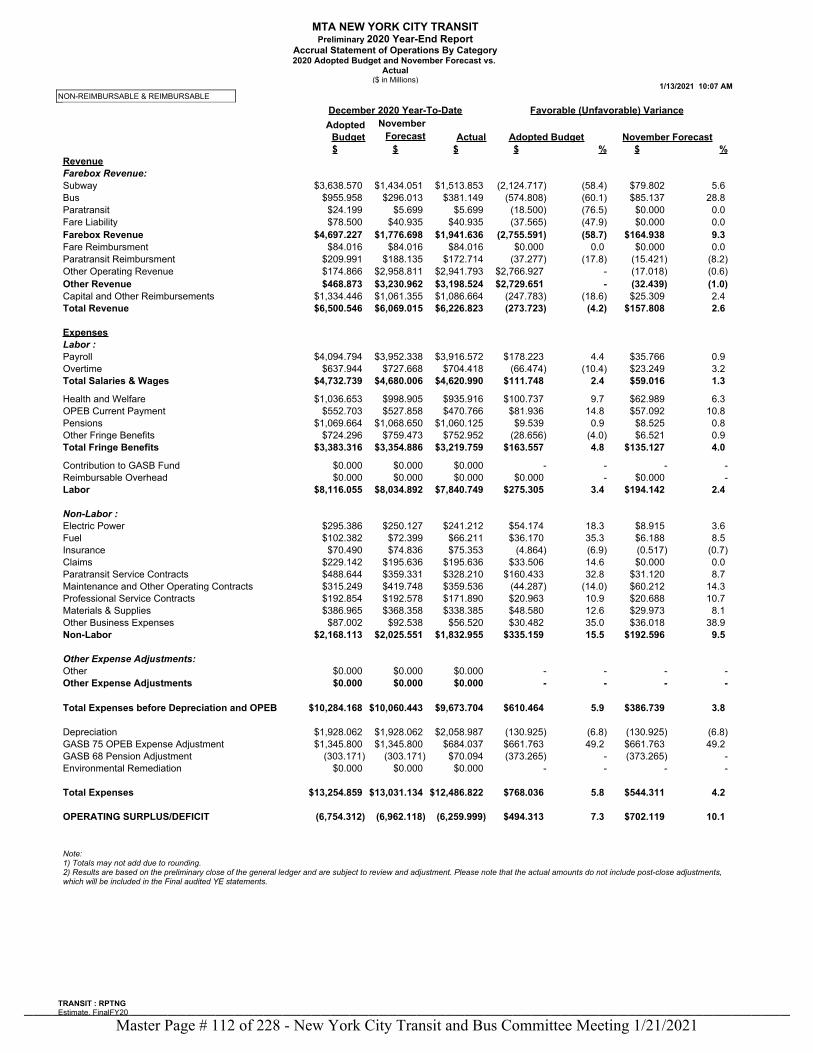
MTA NEW YORK CITY TRANSITPreliminary 2020 Year-End Report
Accrual Statement of Operations By Category2020 Adopted Budget and November Forecast vs.
Actual($ in Millions)
1/13/2021 10:07 AMNON-REIMBURSABLE & REIMBURSABLE
TRANSIT : RPTNGEstimate. FinalFY20
December 2020 Year-To-Date Favorable (Unfavorable) VarianceAdopted November
Budget Forecast Actual Adopted Budget November Forecast$ $ $ $ % $ %
RevenueFarebox Revenue:Subway $3,638.570 $1,434.051 $1,513.853 (2,124.717) (58.4) $79.802 5.6 Bus $955.958 $296.013 $381.149 (574.808) (60.1) $85.137 28.8 Paratransit $24.199 $5.699 $5.699 (18.500) (76.5) $0.000 0.0 Fare Liability $78.500 $40.935 $40.935 (37.565) (47.9) $0.000 0.0 Farebox Revenue $4,697.227 $1,776.698 $1,941.636 (2,755.591) (58.7) $164.938 9.3 Fare Reimbursment $84.016 $84.016 $84.016 $0.000 0.0 $0.000 0.0 Paratransit Reimbursment $209.991 $188.135 $172.714 (37.277) (17.8) (15.421) (8.2)Other Operating Revenue $174.866 $2,958.811 $2,941.793 $2,766.927 - (17.018) (0.6)Other Revenue $468.873 $3,230.962 $3,198.524 $2,729.651 - (32.439) (1.0)Capital and Other Reimbursements $1,334.446 $1,061.355 $1,086.664 (247.783) (18.6) $25.309 2.4 Total Revenue $6,500.546 $6,069.015 $6,226.823 (273.723) (4.2) $157.808 2.6
ExpensesLabor :Payroll $4,094.794 $3,952.338 $3,916.572 $178.223 4.4 $35.766 0.9 Overtime $637.944 $727.668 $704.418 (66.474) (10.4) $23.249 3.2 Total Salaries & Wages $4,732.739 $4,680.006 $4,620.990 $111.748 2.4 $59.016 1.3
Health and Welfare $1,036.653 $998.905 $935.916 $100.737 9.7 $62.989 6.3 OPEB Current Payment $552.703 $527.858 $470.766 $81.936 14.8 $57.092 10.8 Pensions $1,069.664 $1,068.650 $1,060.125 $9.539 0.9 $8.525 0.8 Other Fringe Benefits $724.296 $759.473 $752.952 (28.656) (4.0) $6.521 0.9 Total Fringe Benefits $3,383.316 $3,354.886 $3,219.759 $163.557 4.8 $135.127 4.0
Contribution to GASB Fund $0.000 $0.000 $0.000 - - - -Reimbursable Overhead $0.000 $0.000 $0.000 $0.000 - $0.000 -Labor $8,116.055 $8,034.892 $7,840.749 $275.305 3.4 $194.142 2.4
Non-Labor :Electric Power $295.386 $250.127 $241.212 $54.174 18.3 $8.915 3.6 Fuel $102.382 $72.399 $66.211 $36.170 35.3 $6.188 8.5 Insurance $70.490 $74.836 $75.353 (4.864) (6.9) (0.517) (0.7)Claims $229.142 $195.636 $195.636 $33.506 14.6 $0.000 0.0 Paratransit Service Contracts $488.644 $359.331 $328.210 $160.433 32.8 $31.120 8.7 Maintenance and Other Operating Contracts $315.249 $419.748 $359.536 (44.287) (14.0) $60.212 14.3 Professional Service Contracts $192.854 $192.578 $171.890 $20.963 10.9 $20.688 10.7 Materials & Supplies $386.965 $368.358 $338.385 $48.580 12.6 $29.973 8.1 Other Business Expenses $87.002 $92.538 $56.520 $30.482 35.0 $36.018 38.9 Non-Labor $2,168.113 $2,025.551 $1,832.955 $335.159 15.5 $192.596 9.5
Other Expense Adjustments:Other $0.000 $0.000 $0.000 - - - -Other Expense Adjustments $0.000 $0.000 $0.000 - - - -
Total Expenses before Depreciation and OPEB $10,284.168 $10,060.443 $9,673.704 $610.464 5.9 $386.739 3.8
Depreciation $1,928.062 $1,928.062 $2,058.987 (130.925) (6.8) (130.925) (6.8)GASB 75 OPEB Expense Adjustment $1,345.800 $1,345.800 $684.037 $661.763 49.2 $661.763 49.2 GASB 68 Pension Adjustment (303.171) (303.171) $70.094 (373.265) - (373.265) -Environmental Remediation $0.000 $0.000 $0.000 - - - -
Total Expenses $13,254.859 $13,031.134 $12,486.822 $768.036 5.8 $544.311 4.2
OPERATING SURPLUS/DEFICIT (6,754.312) (6,962.118) (6,259.999) $494.313 7.3 $702.119 10.1
Note: 1) Totals may not add due to rounding.2) Results are based on the preliminary close of the general ledger and are subject to review and adjustment. Please note that the actual amounts do not include post-close adjustments, which will be included in the Final audited YE statements.
Master Page # 112 of 228 - New York City Transit and Bus Committee Meeting 1/21/2021________________________________________________________________________________
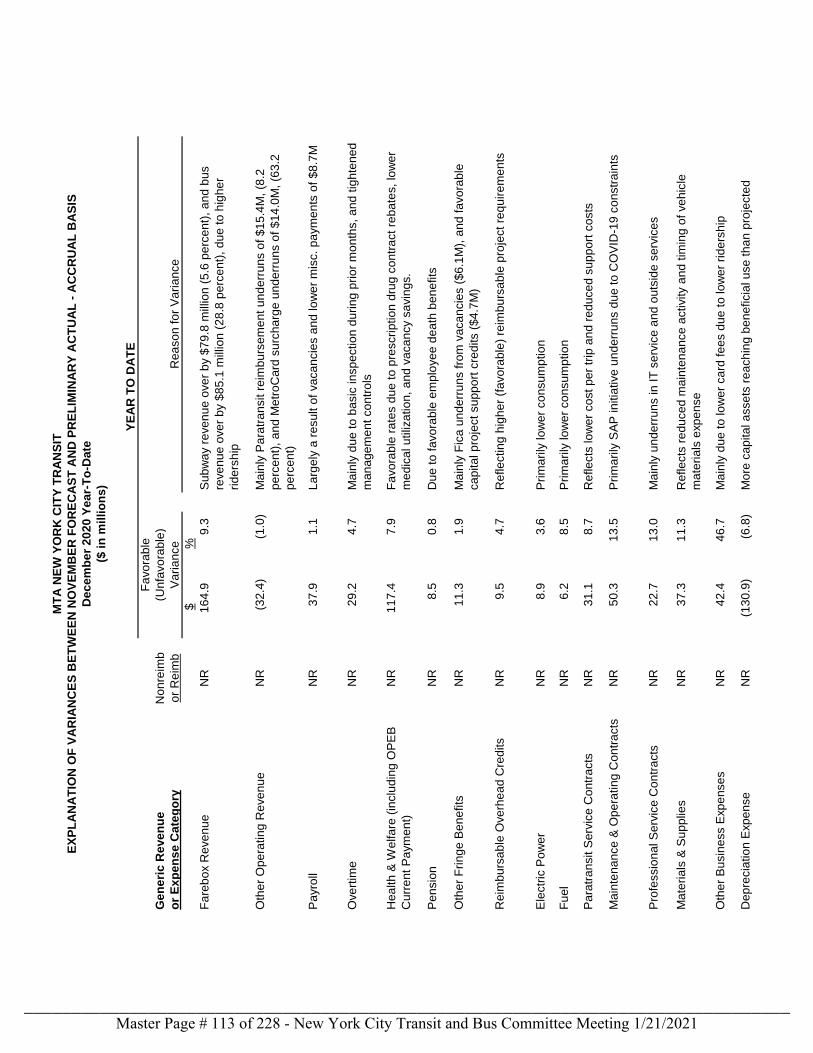
MT
A N
EW
YO
RK
CIT
Y T
RA
NS
IT
EX
PL
AN
AT
ION
OF
VA
RIA
NC
ES
BE
TW
EE
N N
OV
EM
BE
R F
OR
EC
AS
T A
ND
PR
EL
IMIN
AR
Y A
CT
UA
L -
AC
CR
UA
L B
AS
IS
Dec
em
be
r 2
02
0 Y
ea
r-T
o-D
ate
($ i
n m
illi
on
s)
YE
AR
TO
DA
TE
Fa
vo
rab
le
Ge
ne
ric
Re
ve
nu
eN
on
reim
b(U
nfa
vo
rab
le)
or
Ex
pe
ns
e C
ate
go
ryo
r R
eim
bV
ari
an
ce
Re
aso
n f
or
Va
ria
nce
$%
Fa
reb
ox R
eve
nu
eN
R1
64
.99
.3S
ub
wa
y r
eve
nu
e o
ve
r b
y $
79
.8 m
illio
n (
5.6
pe
rce
nt)
, a
nd
bu
s
reve
nu
e o
ve
r b
y $
85
.1 m
illio
n (
28
.8 p
erc
en
t),
du
e t
o h
igh
er
rid
ers
hip
Oth
er
Ope
ratin
g R
eve
nu
eN
R(3
2.4
)(1
.0)
Ma
inly
Pa
ratr
an
sit r
eim
bu
rse
me
nt
un
de
rru
ns o
f $
15
.4M
, (8
.2
pe
rce
nt)
, a
nd
Me
tro
Card
su
rch
arg
e u
nd
err
un
s o
f $
14
.0M
, (6
3.2
pe
rce
nt)
Pa
yro
llN
R3
7.9
1.1
La
rge
ly a
re
su
lt o
f va
ca
ncie
s a
nd
lo
we
r m
isc.
pa
ym
en
ts o
f $
8.7
M
Ove
rtim
eN
R2
9.2
4.7
Ma
inly
du
e t
o b
asic
in
sp
ectio
n d
uri
ng
pri
or
mo
nth
s,
an
d t
igh
ten
ed
ma
na
ge
me
nt
co
ntr
ols
Hea
lth
& W
elfa
re (
inclu
din
g O
PE
B
Curr
en
t P
aym
en
t)
NR
11
7.4
7.9
Fa
vo
rab
le r
ate
s d
ue
to
pre
scri
ptio
n d
rug
co
ntr
act
reb
ate
s,
low
er
me
dic
al u
tiliz
atio
n,
an
d v
aca
ncy s
avin
gs.
Pe
nsio
nN
R8
.50
.8D
ue
to
fa
vo
rab
le e
mp
loye
e d
ea
th b
en
efits
Oth
er
Fri
ng
e B
en
efits
NR
11
.31
.9M
ain
ly F
ica
un
de
rru
ns f
rom
va
ca
ncie
s (
$6
.1M
), a
nd
fa
vo
rab
le
ca
pita
l p
roje
ct
su
pp
ort
cre
dits (
$4
.7M
)
Reim
bu
rsa
ble
Ove
rhe
ad
Cre
dits
NR
9.5
4.7
Refle
ctin
g h
igh
er
(fa
vo
rab
le)
reim
bu
rsa
ble
pro
ject
req
uir
em
en
ts
Ele
ctr
ic P
ow
er
NR
8.9
3.6
Pri
ma
rily
lo
we
r co
nsu
mp
tio
n
Fu
el
NR
6.2
8.5
Pri
ma
rily
lo
we
r co
nsu
mp
tio
n
Pa
ratr
an
sit S
erv
ice
Co
ntr
acts
NR
31
.18
.7R
efle
cts
lo
we
r co
st
pe
r tr
ip a
nd
re
du
ce
d s
up
po
rt c
osts
Ma
inte
na
nce
& O
pe
ratin
g C
on
tra
cts
NR
50
.31
3.5
Pri
ma
rily
SA
P in
itia
tive
un
de
rru
ns d
ue
to
CO
VID
-19
co
nstr
ain
ts
Pro
fessio
na
l S
erv
ice
Co
ntr
acts
NR
22
.71
3.0
Ma
inly
un
de
rru
ns in
IT
se
rvic
e a
nd
ou
tsid
e s
erv
ice
s
Ma
teri
als
& S
up
plie
sN
R3
7.3
11
.3R
efle
cts
re
du
ce
d m
ain
ten
an
ce
activity a
nd
tim
ing
of
ve
hic
le
ma
teri
als
exp
en
se
Oth
er
Bu
sin
ess E
xp
en
se
sN
R4
2.4
46
.7M
ain
ly d
ue
to
lo
we
r ca
rd f
ee
s d
ue
to
lo
we
r ri
de
rsh
ip
Dep
recia
tio
n E
xp
en
se
NR
(13
0.9
)(6
.8)
Mo
re c
ap
ita
l a
sse
ts r
ea
ch
ing
be
ne
ficia
l u
se
th
an
pro
jecte
d
Master Page # 113 of 228 - New York City Transit and Bus Committee Meeting 1/21/2021________________________________________________________________________________

MTA NEW YORK CITY TRANSITPreliminary 2020 Year-End Report
Cash Receipts and ExpendituresFY20 Adopted Budget and November Forecast vs. Actual
($ in Millions)
1/12/2021 03:29 PM
Estimate. FinalFY20
December 2020 Year-To-Date Favorable (Unfavorable) VarianceAdopted November
Budget Forecast Actual Adopted Budget November Forecast$ $ $ $ % $ %
ReceiptsFarebox Revenue $4,697.427 $1,776.898 $1,957.421 (2,740.006) (58.3) $180.523 10.2 Fare Reimbursment $54.016 $54.016 $20.201 (33.815) (62.6) (33.815) (62.6)Paratransit Reimbursment $210.125 $234.021 $213.473 $3.348 1.6 (20.548) (8.8)Other Operating Revenue $67.352 $2,892.860 $2,876.466 $2,809.114 - (16.394) (0.6)Other Revenue $331.493 $3,180.897 $3,110.140 $2,778.647 - (70.757) (2.2)Capital and Other Reimbursements $1,344.038 $1,114.649 $1,013.941 (330.097) (24.6) (100.708) (9.0)Total Revenue $6,372.958 $6,072.444 $6,081.502 (291.456) (4.6) $9.058 0.1
ExpendituresLabor :Payroll $4,100.642 $3,925.645 $3,885.884 $214.759 5.2 $39.761 1.0 Overtime $637.944 $727.668 $704.418 (66.474) (10.4) $23.249 3.2 Total Salaries & Wages $4,738.587 $4,653.313 $4,590.302 $148.285 3.1 $63.011 1.4
Health and Welfare $1,025.155 $990.406 $925.536 $99.619 9.7 $64.870 6.5 OPEB Current Payment $552.703 $527.858 $470.766 $81.936 14.8 $57.092 10.8 Pensions $1,069.664 $1,068.650 $1,027.120 $42.544 4.0 $41.530 3.9 Other Fringe Benefits $536.542 $518.824 $320.305 $216.237 40.3 $198.519 38.3 Total Fringe Benefits $3,184.063 $3,105.739 $2,743.727 $440.336 13.8 $362.012 11.7
Contribution to GASB Fund $0.000 $0.000 $0.000 $0.000 - $0.000 -Reimbursable Overhead $0.000 $0.000 $0.000 - - - -Labor $7,922.650 $7,759.051 $7,334.029 $588.621 7.4 $425.022 5.5
Non-Labor :Electric Power $306.308 $261.049 $254.196 $52.112 17.0 $6.853 2.6 Fuel $102.382 $72.399 $69.296 $33.086 32.3 $3.103 4.3 Insurance $71.205 $81.109 $89.018 (17.813) (25.0) (7.909) (9.8)Claims $143.867 $110.361 $94.141 $49.726 34.6 $16.220 14.7 Paratransit Service Contracts $486.644 $357.331 $329.796 $156.848 32.2 $27.535 7.7 Maintenance and Other Operating Contracts $319.918 $423.680 $341.360 (21.442) (6.7) $82.320 19.4 Professional Service Contracts $183.854 $193.472 $174.139 $9.715 5.3 $19.333 10.0 Materials & Supplies $385.465 $363.858 $325.338 $60.127 15.6 $38.520 10.6 Other Business Expenses $87.002 $92.538 $59.938 $27.064 31.1 $32.600 35.2 Non-Labor $2,086.644 $1,955.797 $1,737.222 $349.422 16.7 $218.575 11.2
Other Expense Adjustments:Other $0.000 $0.000 $0.000 - - - -Other Expense Adjustments $0.000 $0.000 $0.000 - - - -
Total Expenditures before Depreciation and OPEB $10,009.294 $9,714.848 $9,071.251 $938.043 9.4 $643.597 6.6
Depreciation $0.000 $0.000 $0.000 $0.000 - $0.000 -GASB 75 OPEB Expense Adjustment $0.000 $0.000 $0.000 - - $0.000 -GASB 68 Pension Adjustment $0.000 $0.000 $0.000 $0.000 - $0.000 -Environmental Remediation $0.000 $0.000 $0.000 - - $0.000 -
Total Expenditures $10,009.294 $9,714.848 $9,071.251 $938.043 9.4 $643.597 6.6
Net Surplus/(Deficit) (3,636.335) (3,642.404) (2,989.749) $646.586 17.8 $652.655 17.9
Note:1) Totals may not add due to rounding
Master Page # 114 of 228 - New York City Transit and Bus Committee Meeting 1/21/2021________________________________________________________________________________
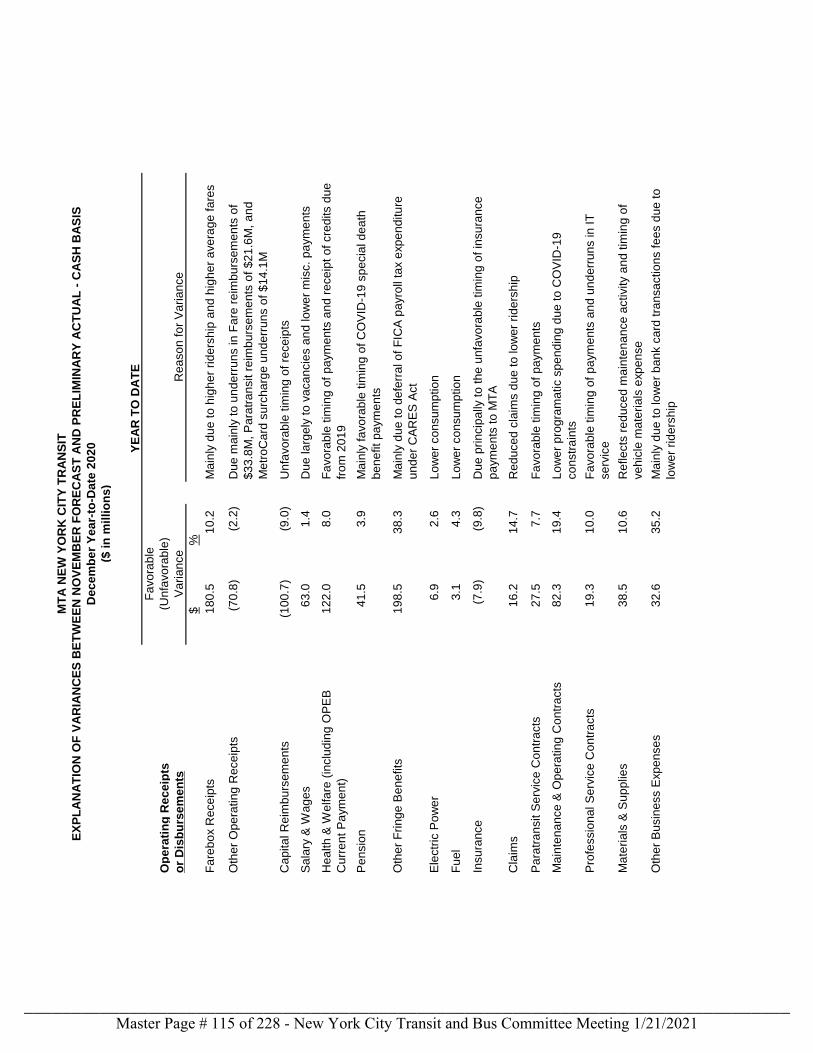
MT
A N
EW
YO
RK
CIT
Y T
RA
NS
IT
EX
PL
AN
AT
ION
OF
VA
RIA
NC
ES
BE
TW
EE
N N
OV
EM
BE
R F
OR
EC
AS
T A
ND
PR
EL
IMIN
AR
Y A
CT
UA
L -
CA
SH
BA
SIS
Dec
em
be
r Y
ea
r-to
-Date
20
20
($ i
n m
illi
on
s)
YE
AR
TO
DA
TE
Fa
vo
rab
le
Op
era
tin
g R
ec
eip
ts(U
nfa
vo
rab
le)
or
Dis
bu
rse
me
nts
Va
ria
nce
Rea
so
n f
or
Va
ria
nce
$%
Fa
reb
ox R
ece
ipts
18
0.5
10
.2M
ain
ly d
ue
to
hig
he
r ri
de
rsh
ip a
nd
hig
he
r a
ve
rag
e f
are
s
Oth
er
Ope
ratin
g R
ece
ipts
(70
.8)
(2.2
)D
ue
ma
inly
to
un
de
rru
ns in
Fa
re r
eim
bu
rse
me
nts
of
$3
3.8
M,
Pa
ratr
an
sit r
eim
bu
rse
me
nts
of
$2
1.6
M,
an
d
Me
tro
Card
su
rch
arg
e u
nd
err
un
s o
f $
14
.1M
Cap
ita
l R
eim
bu
rse
me
nts
(10
0.7
)(9
.0)
Unfa
vo
rab
le t
imin
g o
f re
ce
ipts
Sa
lary
& W
ag
es
63
.01
.4D
ue
la
rge
ly t
o v
aca
ncie
s a
nd
lo
we
r m
isc.
pa
ym
en
ts
Hea
lth
& W
elfa
re (
inclu
din
g O
PE
B
Curr
en
t P
aym
en
t)
12
2.0
8.0
Fa
vo
rab
le t
imin
g o
f p
aym
en
ts a
nd
re
ce
ipt
of
cre
dits d
ue
fro
m 2
01
9
Pe
nsio
n4
1.5
3.9
Ma
inly
fa
vo
rab
le t
imin
g o
f C
OV
ID-1
9 s
pe
cia
l d
ea
th
be
ne
fit
pa
ym
en
ts
Oth
er
Fri
ng
e B
en
efits
19
8.5
38
.3M
ain
ly d
ue
to
de
ferr
al o
f F
ICA
pa
yro
ll ta
x e
xp
en
ditu
re
un
de
r C
AR
ES
Act
Ele
ctr
ic P
ow
er
6.9
2.6
Lo
we
r co
nsu
mp
tio
n
Fu
el
3.1
4.3
Lo
we
r co
nsu
mp
tio
n
Insu
ran
ce
(7.9
)(9
.8)
Due
pri
ncip
ally
to
th
e u
nfa
vo
rab
le t
imin
g o
f in
su
ran
ce
pa
ym
en
ts t
o M
TA
Cla
ims
16
.21
4.7
Red
uce
d c
laim
s d
ue
to
lo
we
r ri
de
rsh
ip
Pa
ratr
an
sit S
erv
ice
Co
ntr
acts
27
.57
.7F
avo
rab
le t
imin
g o
f p
aym
en
ts
Ma
inte
na
nce
& O
pe
ratin
g C
on
tra
cts
82
.31
9.4
Lo
we
r p
rog
ram
atic s
pe
nd
ing
du
e t
o C
OV
ID-1
9
co
nstr
ain
ts
Pro
fessio
na
l S
erv
ice
Co
ntr
acts
19
.31
0.0
Fa
vo
rab
le t
imin
g o
f p
aym
en
ts a
nd
un
de
rru
ns in
IT
se
rvic
e
Ma
teri
als
& S
up
plie
s3
8.5
10
.6R
efle
cts
re
du
ce
d m
ain
ten
an
ce
activity a
nd
tim
ing
of
ve
hic
le m
ate
ria
ls e
xp
en
se
Oth
er
Bu
sin
ess E
xp
en
se
s3
2.6
35
.2M
ain
ly d
ue
to
lo
we
r b
an
k c
ard
tra
nsa
ctio
ns f
ee
s d
ue
to
low
er
rid
ers
hip
Master Page # 115 of 228 - New York City Transit and Bus Committee Meeting 1/21/2021________________________________________________________________________________
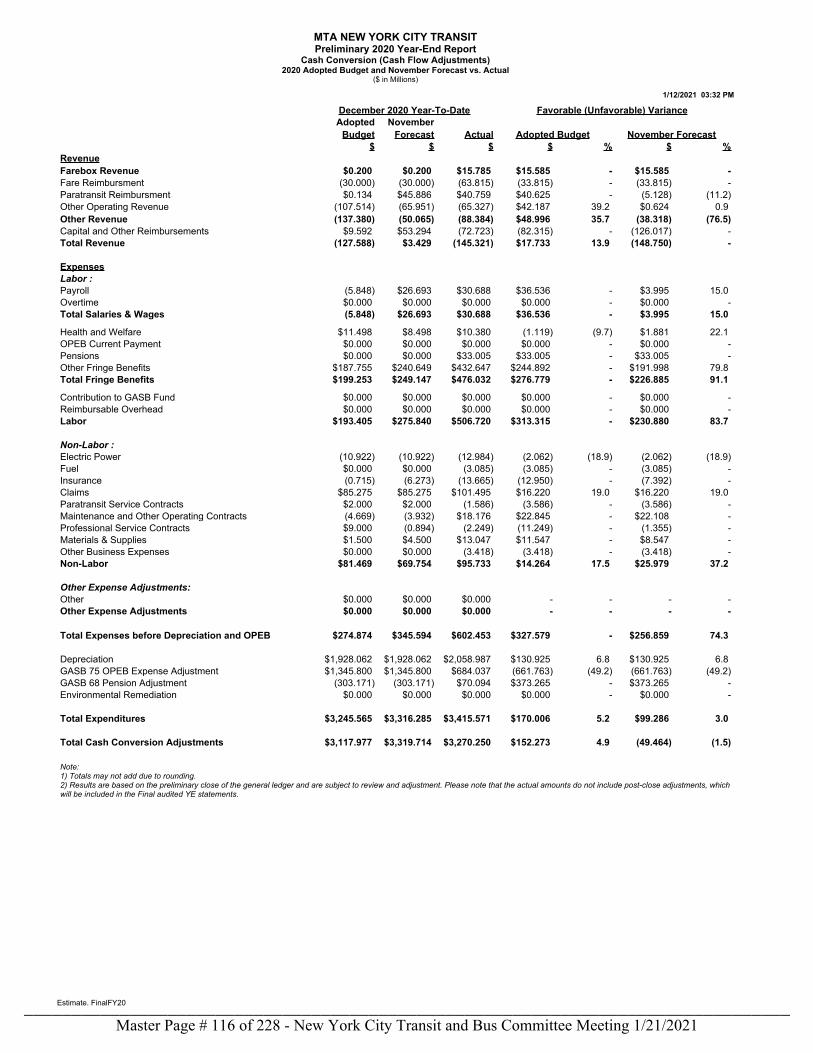
MTA NEW YORK CITY TRANSITPreliminary 2020 Year-End Report
Cash Conversion (Cash Flow Adjustments)2020 Adopted Budget and November Forecast vs. Actual
($ in Millions)
1/12/2021 03:32 PM
Estimate. FinalFY20
December 2020 Year-To-Date Favorable (Unfavorable) VarianceAdopted November
Budget Forecast Actual Adopted Budget November Forecast$ $ $ $ % $ %
RevenueFarebox Revenue $0.200 $0.200 $15.785 $15.585 - $15.585 -Fare Reimbursment (30.000) (30.000) (63.815) (33.815) - (33.815) -Paratransit Reimbursment $0.134 $45.886 $40.759 $40.625 - (5.128) (11.2)Other Operating Revenue (107.514) (65.951) (65.327) $42.187 39.2 $0.624 0.9 Other Revenue (137.380) (50.065) (88.384) $48.996 35.7 (38.318) (76.5)Capital and Other Reimbursements $9.592 $53.294 (72.723) (82.315) - (126.017) -Total Revenue (127.588) $3.429 (145.321) $17.733 13.9 (148.750) -
ExpensesLabor :Payroll (5.848) $26.693 $30.688 $36.536 - $3.995 15.0 Overtime $0.000 $0.000 $0.000 $0.000 - $0.000 -Total Salaries & Wages (5.848) $26.693 $30.688 $36.536 - $3.995 15.0
Health and Welfare $11.498 $8.498 $10.380 (1.119) (9.7) $1.881 22.1 OPEB Current Payment $0.000 $0.000 $0.000 $0.000 - $0.000 -Pensions $0.000 $0.000 $33.005 $33.005 - $33.005 -Other Fringe Benefits $187.755 $240.649 $432.647 $244.892 - $191.998 79.8 Total Fringe Benefits $199.253 $249.147 $476.032 $276.779 - $226.885 91.1
Contribution to GASB Fund $0.000 $0.000 $0.000 $0.000 - $0.000 -Reimbursable Overhead $0.000 $0.000 $0.000 $0.000 - $0.000 -Labor $193.405 $275.840 $506.720 $313.315 - $230.880 83.7
Non-Labor :Electric Power (10.922) (10.922) (12.984) (2.062) (18.9) (2.062) (18.9)Fuel $0.000 $0.000 (3.085) (3.085) - (3.085) -Insurance (0.715) (6.273) (13.665) (12.950) - (7.392) -Claims $85.275 $85.275 $101.495 $16.220 19.0 $16.220 19.0 Paratransit Service Contracts $2.000 $2.000 (1.586) (3.586) - (3.586) -Maintenance and Other Operating Contracts (4.669) (3.932) $18.176 $22.845 - $22.108 -Professional Service Contracts $9.000 (0.894) (2.249) (11.249) - (1.355) -Materials & Supplies $1.500 $4.500 $13.047 $11.547 - $8.547 -Other Business Expenses $0.000 $0.000 (3.418) (3.418) - (3.418) -Non-Labor $81.469 $69.754 $95.733 $14.264 17.5 $25.979 37.2
Other Expense Adjustments:Other $0.000 $0.000 $0.000 - - - -Other Expense Adjustments $0.000 $0.000 $0.000 - - - -
Total Expenses before Depreciation and OPEB $274.874 $345.594 $602.453 $327.579 - $256.859 74.3
Depreciation $1,928.062 $1,928.062 $2,058.987 $130.925 6.8 $130.925 6.8 GASB 75 OPEB Expense Adjustment $1,345.800 $1,345.800 $684.037 (661.763) (49.2) (661.763) (49.2)GASB 68 Pension Adjustment (303.171) (303.171) $70.094 $373.265 - $373.265 -Environmental Remediation $0.000 $0.000 $0.000 $0.000 - $0.000 -
Total Expenditures $3,245.565 $3,316.285 $3,415.571 $170.006 5.2 $99.286 3.0
Total Cash Conversion Adjustments $3,117.977 $3,319.714 $3,270.250 $152.273 4.9 (49.464) (1.5)
Note: 1) Totals may not add due to rounding.2) Results are based on the preliminary close of the general ledger and are subject to review and adjustment. Please note that the actual amounts do not include post-close adjustments, whichwill be included in the Final audited YE statements.
Master Page # 116 of 228 - New York City Transit and Bus Committee Meeting 1/21/2021________________________________________________________________________________
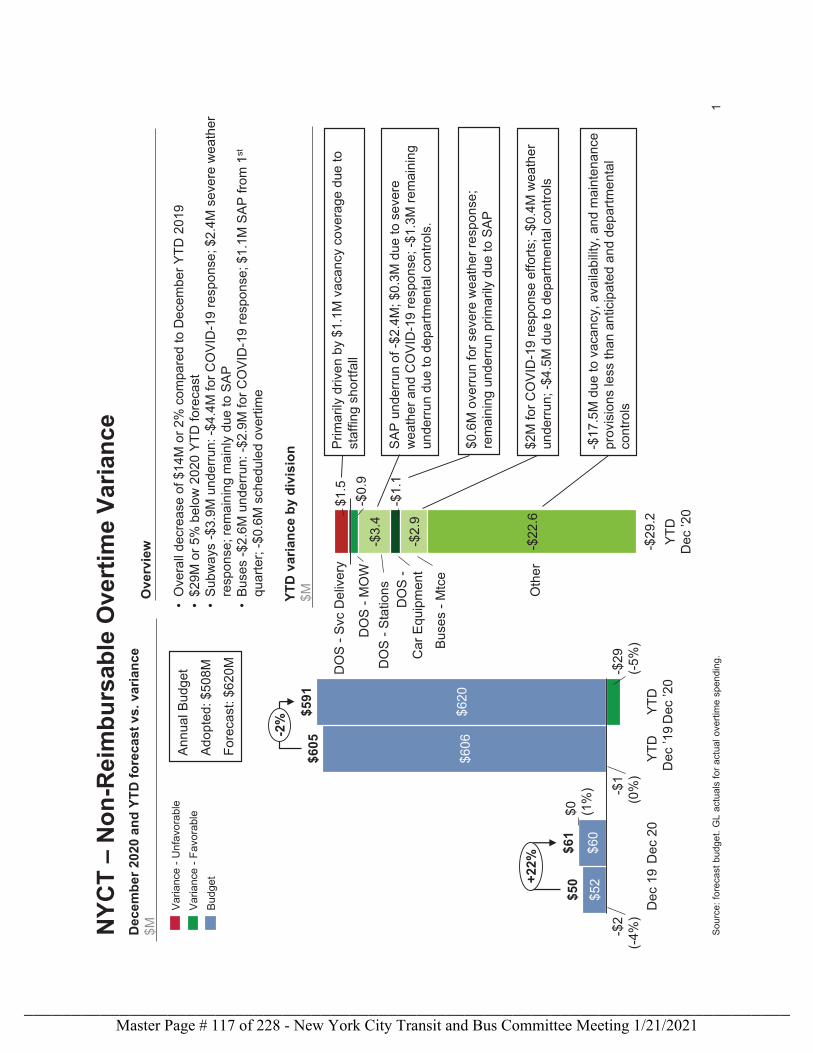
1
NY
CT
–N
on
-Rei
mb
urs
able
Ove
rtim
e V
aria
nce
Sou
rce:
for
ecas
t bu
dget
. G
L ac
tual
s fo
r ac
tual
ove
rtim
e sp
endi
ng.
Dec
emb
er 2
020
and
YT
D f
ore
cast
vs.
var
ian
ce$M
YT
D v
aria
nce
by
div
isio
n
$M
SA
P u
nder
run
of -
$2.4
M; $
0.3M
due
to s
ever
e w
eath
er a
nd C
OV
ID-1
9 re
spon
se; -
$1.3
M r
emai
ning
un
derr
un d
ue t
o de
part
men
tal c
ontr
ols.
-$17
.5M
due
to v
acan
cy, a
vaila
bilit
y, a
nd m
aint
enan
ce
prov
isio
ns le
ss th
an a
ntic
ipat
ed a
nd d
epar
tmen
tal
cont
rols
•O
vera
ll de
crea
se o
f $14
M o
r 2%
com
pare
d to
Dec
embe
r Y
TD
201
9•
$29M
or
5% b
elow
202
0 Y
TD
for
ecas
t•
Sub
way
s -$
3.9M
und
erru
n: -
$4.4
M fo
r C
OV
ID-1
9 re
spon
se; $
2.4M
sev
ere
wea
ther
re
spon
se; r
emai
ning
mai
nly
due
to S
AP
•B
uses
-$2
.6M
und
erru
n: -
$2.9
M fo
r C
OV
ID-1
9 re
spon
se; $
1.1M
SA
P f
rom
1st
quar
ter;
-$0
.6M
sch
edul
ed o
vert
ime
Ove
rvie
w
$52
$60
$606
$620
-$29
(-5%
)
Dec
19
Dec
20
$0 (1%
)
YT
D
Dec
’19
-$1
(0%
)
YT
D
Dec
’20
$50
$61
$605
$591
-$2
(-4%
)
+22
%
-2%
Var
ianc
e -
Fav
orab
le
Var
ianc
e -
Unf
avor
able
Bud
get
$1.5
-$0.
9-$
3.4
-$1.
1
-$2.
9
-$22
.6
-$29
.2
DO
S -
Svc
Del
iver
y
DO
S -
Sta
tions
DO
S -
MO
W
YT
D
Dec
’20
Bus
es -
Mtc
e
DO
S -
Car
Equ
ipm
ent
Oth
er
Ann
ual B
udge
t
Ado
pted
: $50
8M
For
ecas
t: $
620M
$2M
for
CO
VID
-19
resp
onse
effo
rts;
-$0
.4M
wea
ther
un
derr
un; -
$4.5
M d
ue to
dep
artm
enta
l con
trol
s
Prim
arily
driv
en b
y $1
.1M
vac
ancy
cov
erag
e du
e to
st
affin
g sh
ortf
all
$0.6
M o
verr
un fo
r se
vere
wea
ther
res
pons
e;
rem
aini
ng u
nder
run
prim
arily
due
to S
AP
Master Page # 117 of 228 - New York City Transit and Bus Committee Meeting 1/21/2021________________________________________________________________________________
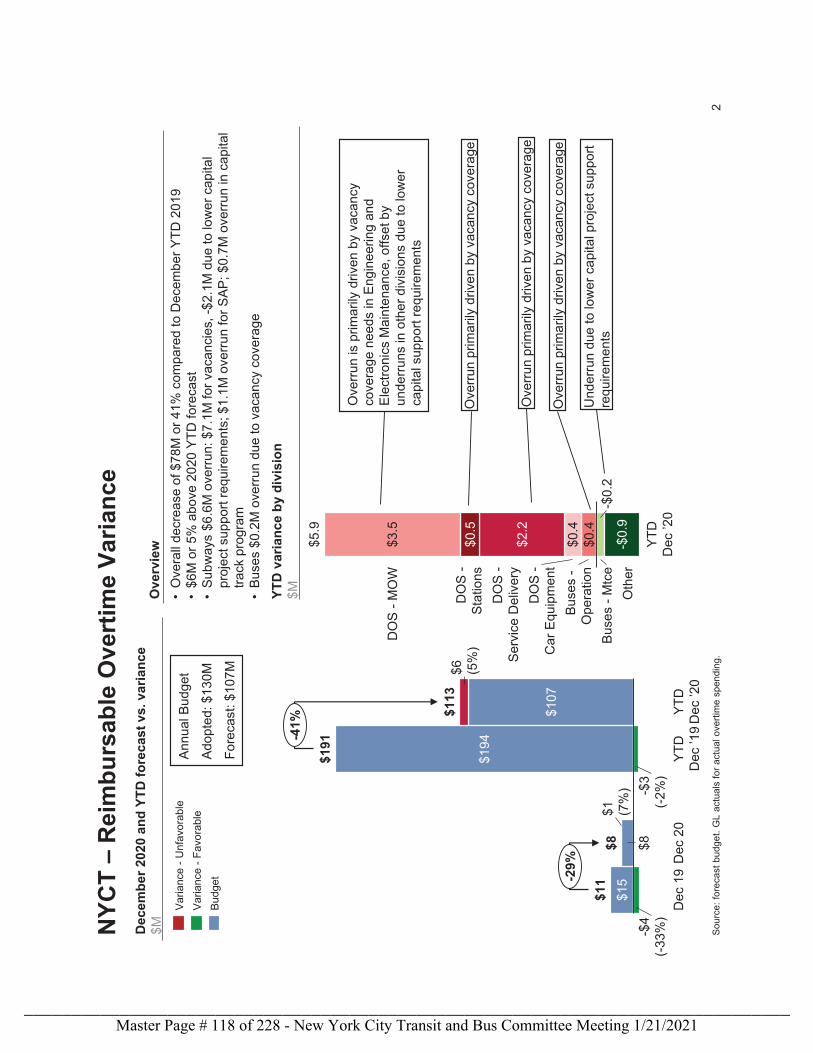
2
NY
CT
–R
eim
bu
rsab
le O
vert
ime
Var
ian
ce
Sou
rce:
for
ecas
t bu
dget
. G
L ac
tual
s fo
r ac
tual
ove
rtim
e sp
endi
ng.
Dec
emb
er 2
020
and
YT
D f
ore
cast
vs.
var
ian
ce$M
YT
D v
aria
nce
by
div
isio
n$M•
Ove
rall
decr
ease
of $
78M
or
41%
com
pare
d to
Dec
embe
r Y
TD
201
9•
$6M
or
5% a
bove
202
0 Y
TD
for
ecas
t•
Sub
way
s $6
.6M
ove
rrun
: $7.
1M fo
r va
canc
ies,
-$2
.1M
due
to lo
wer
cap
ital
proj
ect s
uppo
rt r
equi
rem
ents
; $1.
1M o
verr
un fo
r S
AP
; $0
.7M
ove
rrun
in c
apita
l tr
ack
prog
ram
•B
uses
$0.
2M o
verr
un d
ue to
vac
ancy
cov
erag
e
Ove
rvie
w
$15
$8
$194
$107
$1 (7%
)
-$4
(-33
%)
Dec
19
-$3
(-2%
)
Dec
20
YT
D
Dec
’19
$6 (5%
)
YT
D
Dec
’20
$11
$113
$8
$191
-29%
-41%
Bud
get
Var
ianc
e -
Unf
avor
able
Var
ianc
e -
Fav
orab
le
$0.4
$0.4
$2.2
$0.5
$3.5
-$0.
2-$
0.9
DO
S -
MO
W
YT
D
Dec
’20
DO
S -
Sta
tions
Bus
es -
Mtc
e
DO
S -
Ser
vice
Del
iver
y
DO
S -
Car
Equ
ipm
ent
Bus
es -
Ope
ratio
n
Oth
er
$5.9
Ann
ual B
udge
t
Ado
pted
: $13
0M
For
ecas
t: $
107M
Ove
rrun
prim
arily
driv
en b
y va
canc
y co
vera
ge
Ove
rrun
prim
arily
driv
en b
y va
canc
y co
vera
ge
Ove
rrun
is p
rimar
ily d
riven
by
vaca
ncy
cove
rage
nee
ds in
Eng
inee
ring
and
Ele
ctro
nics
Mai
nten
ance
, off
set b
y un
derr
uns
in o
ther
div
isio
ns d
ue to
low
er
capi
tal s
uppo
rt r
equi
rem
ents
Und
erru
n du
e to
low
er c
apita
l pro
ject
sup
port
re
quire
men
ts
Ove
rrun
prim
arily
driv
en b
y va
canc
y co
vera
ge
Master Page # 118 of 228 - New York City Transit and Bus Committee Meeting 1/21/2021________________________________________________________________________________
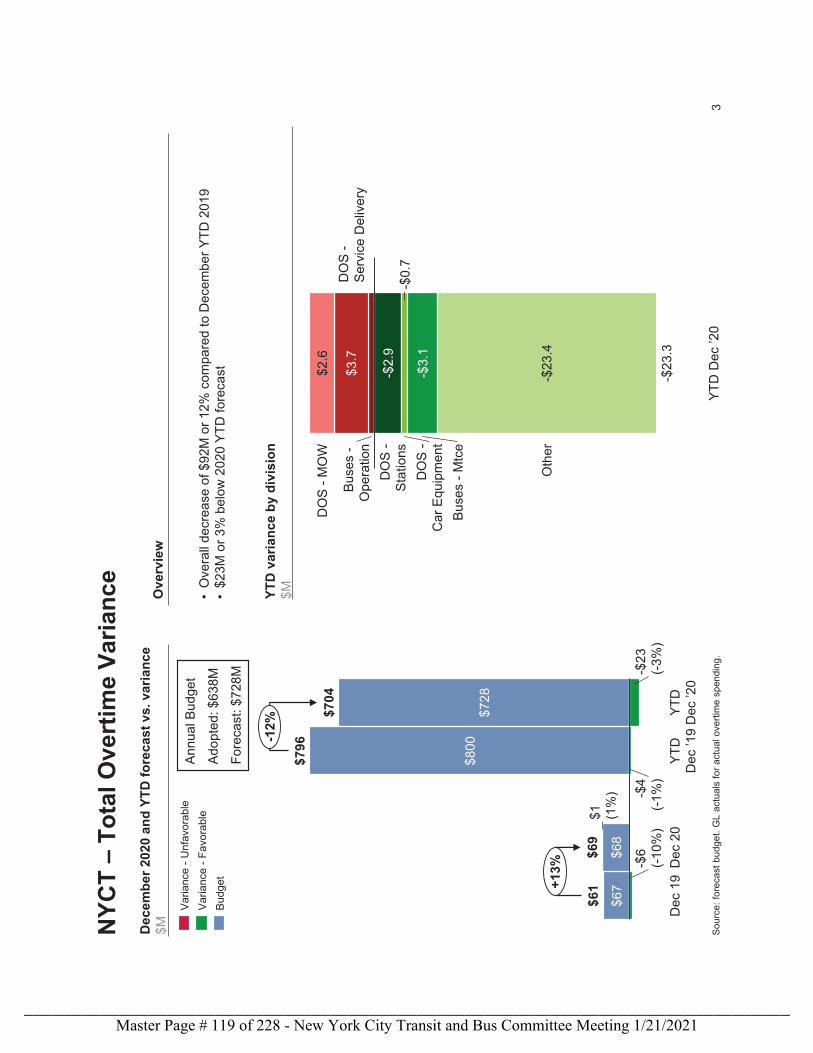
3
NY
CT
–T
ota
l Ove
rtim
e V
aria
nce
Sou
rce:
for
ecas
t bu
dget
. G
L ac
tual
s fo
r ac
tual
ove
rtim
e sp
endi
ng.
Dec
emb
er 2
020
and
YT
D f
ore
cast
vs.
var
ian
ce$M
YT
D v
aria
nce
by
div
isio
n$M•
Ove
rall
decr
ease
of $
92M
or
12%
com
pare
d to
Dec
embe
r Y
TD
201
9•
$23M
or
3% b
elow
202
0 Y
TD
for
ecas
t
Ove
rvie
w
$67
$68
$800
$728
Dec
20
$1 (1%
)
-$6
(-10
%)
$796
-$4
(-1%
)
Dec
19
YT
D
Dec
’19
-$23
(-3%
)
YT
D
Dec
’20
$61
$69
$704
+13
%
-12%
Var
ianc
e -
Unf
avor
able
Var
ianc
e -
Fav
orab
le
Bud
get
$3.7
$2.6
-$2.
9-$
0.7
-$3.
1
-$23
.4
Bus
es -
Mtc
e
YT
D D
ec ’2
0
DO
S -
MO
W
DO
S -
Sta
tions
DO
S -
Car
Equ
ipm
ent
DO
S -
Ser
vice
Del
iver
yB
uses
-O
pera
tion
Oth
er
-$23
.3
Ann
ual B
udge
t
Ado
pted
: $63
8M
For
ecas
t: $
728M
Master Page # 119 of 228 - New York City Transit and Bus Committee Meeting 1/21/2021________________________________________________________________________________
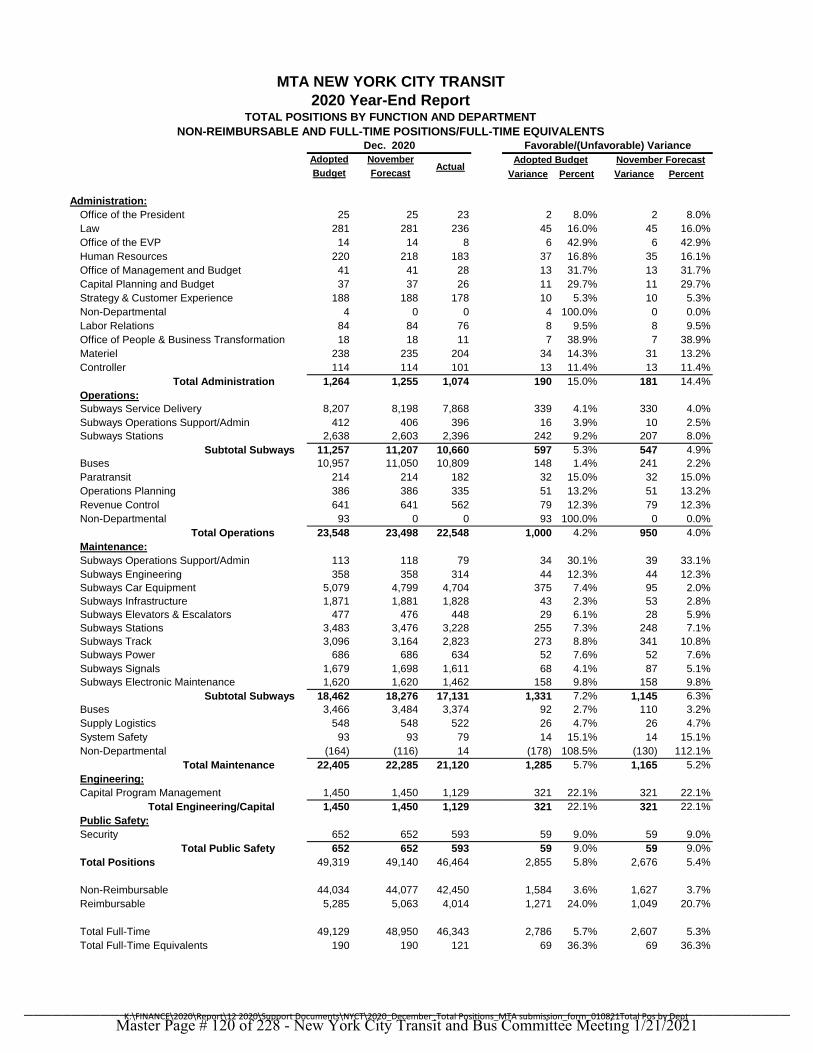
Adopted November
Budget Forecast Variance Percent Variance Percent
Administration:
Office of the President 25 25 23 2 8.0% 2 8.0%
Law 281 281 236 45 16.0% 45 16.0%
Office of the EVP 14 14 8 6 42.9% 6 42.9%
Human Resources 220 218 183 37 16.8% 35 16.1%
Office of Management and Budget 41 41 28 13 31.7% 13 31.7%
Capital Planning and Budget 37 37 26 11 29.7% 11 29.7%
Strategy & Customer Experience 188 188 178 10 5.3% 10 5.3%
Non-Departmental 4 0 0 4 100.0% 0 0.0%
Labor Relations 84 84 76 8 9.5% 8 9.5%
Office of People & Business Transformation 18 18 11 7 38.9% 7 38.9%
Materiel 238 235 204 34 14.3% 31 13.2%
Controller 114 114 101 13 11.4% 13 11.4%
Total Administration 1,264 1,255 1,074 190 15.0% 181 14.4%
Operations:
Subways Service Delivery 8,207 8,198 7,868 339 4.1% 330 4.0%
Subways Operations Support/Admin 412 406 396 16 3.9% 10 2.5%
Subways Stations 2,638 2,603 2,396 242 9.2% 207 8.0%
Subtotal Subways 11,257 11,207 10,660 597 5.3% 547 4.9%
Buses 10,957 11,050 10,809 148 1.4% 241 2.2%
Paratransit 214 214 182 32 15.0% 32 15.0%
Operations Planning 386 386 335 51 13.2% 51 13.2%
Revenue Control 641 641 562 79 12.3% 79 12.3%
Non-Departmental 93 0 0 93 100.0% 0 0.0%
Total Operations 23,548 23,498 22,548 1,000 4.2% 950 4.0%
Maintenance:
Subways Operations Support/Admin 113 118 79 34 30.1% 39 33.1%
Subways Engineering 358 358 314 44 12.3% 44 12.3%
Subways Car Equipment 5,079 4,799 4,704 375 7.4% 95 2.0%
Subways Infrastructure 1,871 1,881 1,828 43 2.3% 53 2.8%
Subways Elevators & Escalators 477 476 448 29 6.1% 28 5.9%
Subways Stations 3,483 3,476 3,228 255 7.3% 248 7.1%
Subways Track 3,096 3,164 2,823 273 8.8% 341 10.8%
Subways Power 686 686 634 52 7.6% 52 7.6%
Subways Signals 1,679 1,698 1,611 68 4.1% 87 5.1%
Subways Electronic Maintenance 1,620 1,620 1,462 158 9.8% 158 9.8%
Subtotal Subways 18,462 18,276 17,131 1,331 7.2% 1,145 6.3%
Buses 3,466 3,484 3,374 92 2.7% 110 3.2%
Supply Logistics 548 548 522 26 4.7% 26 4.7%
System Safety 93 93 79 14 15.1% 14 15.1%
Non-Departmental (164) (116) 14 (178) 108.5% (130) 112.1%
Total Maintenance 22,405 22,285 21,120 1,285 5.7% 1,165 5.2%
Engineering:
Capital Program Management 1,450 1,450 1,129 321 22.1% 321 22.1%
Total Engineering/Capital 1,450 1,450 1,129 321 22.1% 321 22.1%
Public Safety:
Security 652 652 593 59 9.0% 59 9.0%
Total Public Safety 652 652 593 59 9.0% 59 9.0%
Total Positions 49,319 49,140 46,464 2,855 5.8% 2,676 5.4%
Non-Reimbursable 44,034 44,077 42,450 1,584 3.6% 1,627 3.7%
Reimbursable 5,285 5,063 4,014 1,271 24.0% 1,049 20.7%
Total Full-Time 49,129 48,950 46,343 2,786 5.7% 2,607 5.3%
Total Full-Time Equivalents 190 190 121 69 36.3% 69 36.3%
ActualAdopted Budget November Forecast
Dec. 2020 Favorable/(Unfavorable) Variance
2020 Year-End Report
MTA NEW YORK CITY TRANSIT
NON-REIMBURSABLE AND FULL-TIME POSITIONS/FULL-TIME EQUIVALENTS
TOTAL POSITIONS BY FUNCTION AND DEPARTMENT
K:\FINANCE\2020\Report\12 2020\Support Documents\NYCT\2020_December_Total Positions_MTA submission_form_010821Total Pos by DeptMaster Page # 120 of 228 - New York City Transit and Bus Committee Meeting 1/21/2021
________________________________________________________________________________
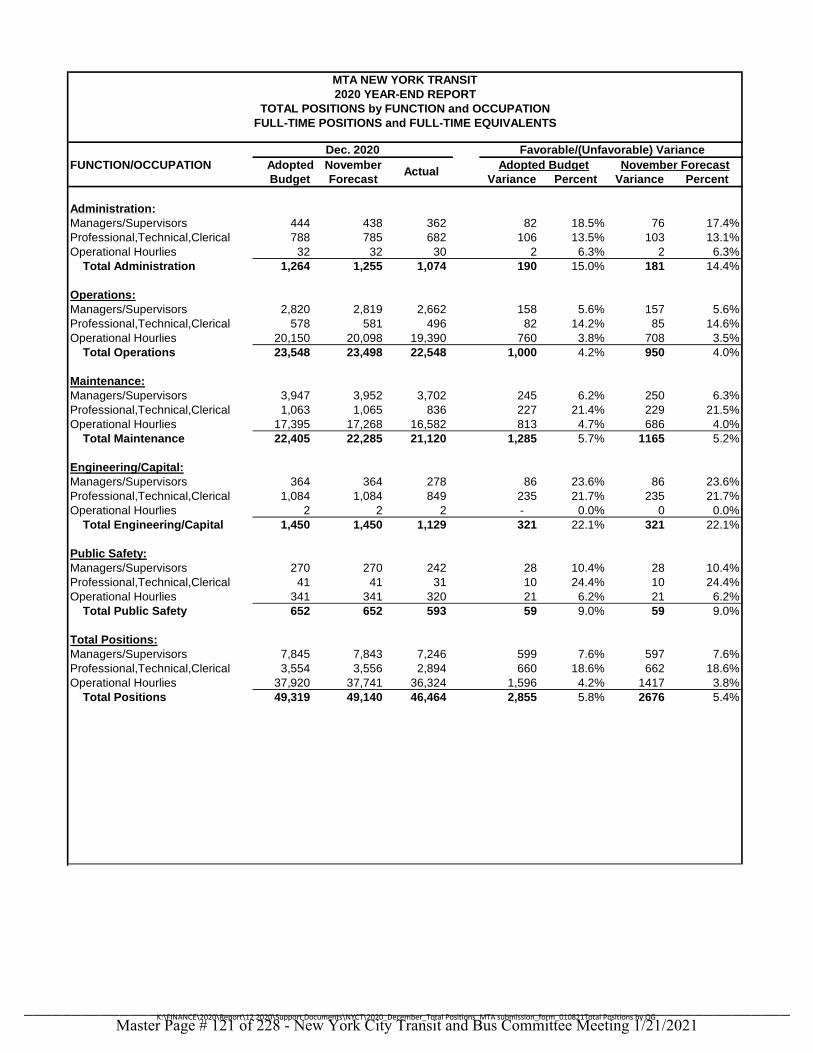
FUNCTION/OCCUPATION Adopted November
Budget Forecast Variance Percent Variance Percent
Administration:
Managers/Supervisors 444 438 362 82 18.5% 76 17.4%
Professional,Technical,Clerical 788 785 682 106 13.5% 103 13.1%
Operational Hourlies 32 32 30 2 6.3% 2 6.3%
Total Administration 1,264 1,255 1,074 190 15.0% 181 14.4%
Operations:
Managers/Supervisors 2,820 2,819 2,662 158 5.6% 157 5.6%
Professional,Technical,Clerical 578 581 496 82 14.2% 85 14.6%
Operational Hourlies 20,150 20,098 19,390 760 3.8% 708 3.5%
Total Operations 23,548 23,498 22,548 1,000 4.2% 950 4.0%
Maintenance:
Managers/Supervisors 3,947 3,952 3,702 245 6.2% 250 6.3%
Professional,Technical,Clerical 1,063 1,065 836 227 21.4% 229 21.5%
Operational Hourlies 17,395 17,268 16,582 813 4.7% 686 4.0%
Total Maintenance 22,405 22,285 21,120 1,285 5.7% 1165 5.2%
Engineering/Capital:
Managers/Supervisors 364 364 278 86 23.6% 86 23.6%
Professional,Technical,Clerical 1,084 1,084 849 235 21.7% 235 21.7%
Operational Hourlies 2 2 2 - 0.0% 0 0.0%
Total Engineering/Capital 1,450 1,450 1,129 321 22.1% 321 22.1%
Public Safety:
Managers/Supervisors 270 270 242 28 10.4% 28 10.4%
Professional,Technical,Clerical 41 41 31 10 24.4% 10 24.4%
Operational Hourlies 341 341 320 21 6.2% 21 6.2%
Total Public Safety 652 652 593 59 9.0% 59 9.0%
Total Positions:
Managers/Supervisors 7,845 7,843 7,246 599 7.6% 597 7.6%
Professional,Technical,Clerical 3,554 3,556 2,894 660 18.6% 662 18.6%
Operational Hourlies 37,920 37,741 36,324 1,596 4.2% 1417 3.8%
Total Positions 49,319 49,140 46,464 2,855 5.8% 2676 5.4%
Dec. 2020 Favorable/(Unfavorable) Variance
Adopted Budget November Forecast
MTA NEW YORK TRANSIT
2020 YEAR-END REPORT
TOTAL POSITIONS by FUNCTION and OCCUPATION
FULL-TIME POSITIONS and FULL-TIME EQUIVALENTS
Actual
K:\FINANCE\2020\Report\12 2020\Support Documents\NYCT\2020_December_Total Positions_MTA submission_form_010821Total Positions by OG
Master Page # 121 of 228 - New York City Transit and Bus Committee Meeting 1/21/2021________________________________________________________________________________
Preliminary December 2020 Year-End Report: Staten Island Railway The purpose of this report is to provide the preliminary 2020 financial results on an accrual basis. The accrual basis is presented on both a non-reimbursable and reimbursable account basis. These results are compared to the Adopted Budget (budget) and November Forecast (forecast). Summary of Preliminary Financial Results Preliminary ridership and accrual results, versus forecast, are summarized as follows:
• 2020 Staten Island Railway ridership of 1.43 million was 54,344 rides (3.66 percent) below forecast. 2020 average weekday ridership was 5,332 rides, 10,540 rides (66.4 percent) lower than 2019.
• 2020 farebox revenue of $2.3 million was $0.04 million (1.6 percent) below forecast.
• Operating expenses of $55.6 million were below forecast by $12.5 million (18.3 percent).
o Labor expenses were below forecast by $7.1 million (13.6 percent).
o Non-labor expenses were less than forecast by $5.4 million (33.8 percent).
Preliminary ridership and accrual results, versus budget, are summarized as follows:
• 2020 Staten Island Railway ridership of 1.43 million was 2,844,714 rides (66.6 percent) below budget.
• 2020 farebox revenue of $2.3 million was $4.3 million (65.1 percent) below budget.
• Operating expenses were below budget by $6.4 million (10.3 percent).
o Labor expenses were less than budget by $5.2 million (10.4 percent).
o Non-labor expenses were less than budget by $1.2 million (9.8 percent).
Master Page # 122 of 228 - New York City Transit and Bus Committee Meeting 1/21/2021________________________________________________________________________________
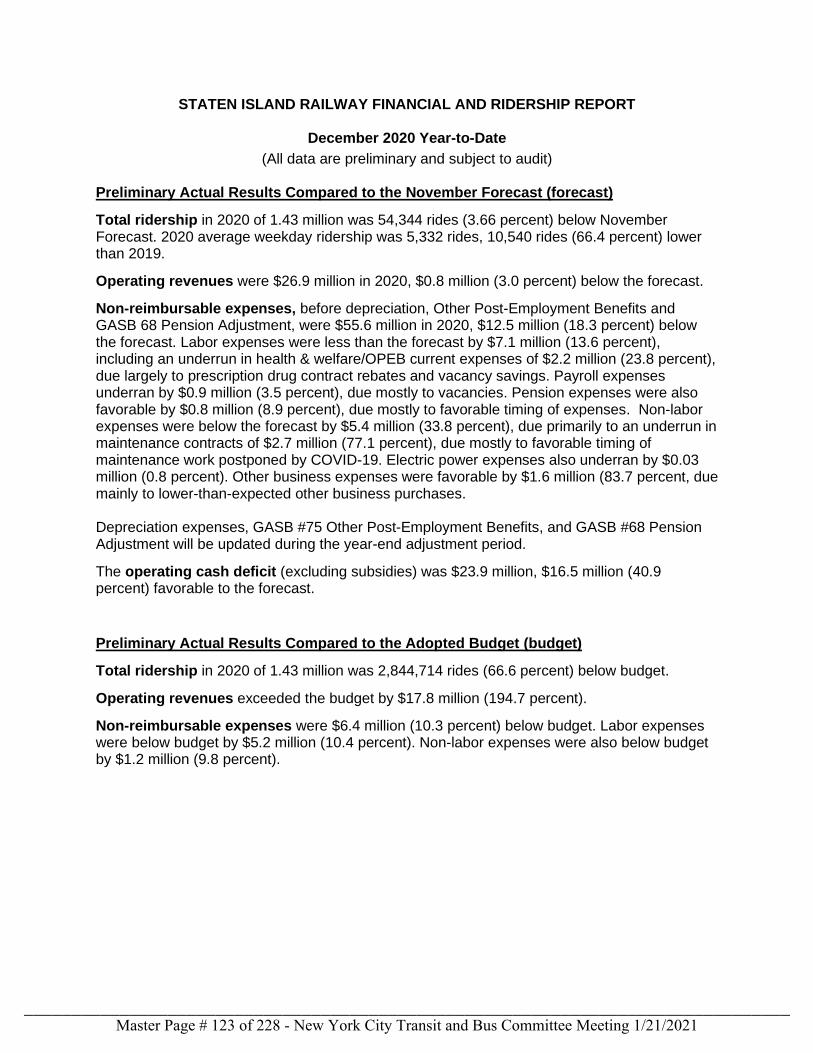
STATEN ISLAND RAILWAY FINANCIAL AND RIDERSHIP REPORT
December 2020 Year-to-Date
(All data are preliminary and subject to audit)
Preliminary Actual Results Compared to the November Forecast (forecast)
Total ridership in 2020 of 1.43 million was 54,344 rides (3.66 percent) below November Forecast. 2020 average weekday ridership was 5,332 rides, 10,540 rides (66.4 percent) lower than 2019.
Operating revenues were $26.9 million in 2020, $0.8 million (3.0 percent) below the forecast.
Non-reimbursable expenses, before depreciation, Other Post-Employment Benefits and GASB 68 Pension Adjustment, were $55.6 million in 2020, $12.5 million (18.3 percent) below the forecast. Labor expenses were less than the forecast by $7.1 million (13.6 percent), including an underrun in health & welfare/OPEB current expenses of $2.2 million (23.8 percent), due largely to prescription drug contract rebates and vacancy savings. Payroll expenses underran by $0.9 million (3.5 percent), due mostly to vacancies. Pension expenses were also favorable by $0.8 million (8.9 percent), due mostly to favorable timing of expenses. Non-labor expenses were below the forecast by $5.4 million (33.8 percent), due primarily to an underrun in maintenance contracts of $2.7 million (77.1 percent), due mostly to favorable timing of maintenance work postponed by COVID-19. Electric power expenses also underran by $0.03 million (0.8 percent). Other business expenses were favorable by $1.6 million (83.7 percent, due mainly to lower-than-expected other business purchases.
Depreciation expenses, GASB #75 Other Post-Employment Benefits, and GASB #68 Pension Adjustment will be updated during the year-end adjustment period.
The operating cash deficit (excluding subsidies) was $23.9 million, $16.5 million (40.9 percent) favorable to the forecast.
Preliminary Actual Results Compared to the Adopted Budget (budget)
Total ridership in 2020 of 1.43 million was 2,844,714 rides (66.6 percent) below budget.
Operating revenues exceeded the budget by $17.8 million (194.7 percent).
Non-reimbursable expenses were $6.4 million (10.3 percent) below budget. Labor expenses were below budget by $5.2 million (10.4 percent). Non-labor expenses were also below budget by $1.2 million (9.8 percent).
Master Page # 123 of 228 - New York City Transit and Bus Committee Meeting 1/21/2021________________________________________________________________________________

MTA STATEN ISLAND RAILWAYPreliminary 2020 Year-End Report
Accrual Statement of Operations By Category2020 Adopted Budget and November Forecast vs.
Actual($ in Millions)
1/13/2021 04:28 PMNON-REIMBURSABLE
TRANSIT : RPTNGEstimate. FinalFY20
December 2020 Year-To-Date Favorable (Unfavorable) VarianceAdopted November
Budget Forecast Actual Adopted Budget November Forecast$ $ $ $ % $ %
RevenueFarebox Revenue:Farebox Revenue $6.669 $2.362 $2.325 (4.344) (65.1) (0.037) (1.6)Other Revenue $2.468 $25.412 $24.603 $22.135 - (0.809) (3.2)Capital and Other Reimbursements $0.000 $0.000 $0.000 - - - -Total Revenue $9.137 $27.775 $26.928 $17.791 - (0.846) (3.0)
ExpensesLabor :Payroll $26.081 $26.545 $25.623 $0.458 1.8 $0.921 3.5 Overtime $2.387 $3.238 $2.117 $0.270 11.3 $1.122 34.6 Total Salaries & Wages $28.468 $29.783 $27.740 $0.728 2.6 $2.043 6.9
Health and Welfare $7.376 $6.587 $4.886 $2.490 33.8 $1.701 25.8 OPEB Current Payment $2.723 $2.723 $2.208 $0.515 18.9 $0.515 18.9 Pensions $7.738 $8.838 $8.055 (0.317) (4.1) $0.783 8.9 Other Fringe Benefits $4.820 $5.049 $4.867 (0.047) (1.0) $0.181 3.6 Total Fringe Benefits $22.657 $23.197 $20.016 $2.641 11.7 $3.181 13.7
Contribution to GASB Fund $0.000 $0.000 $0.000 - - - -Reimbursable Overhead (0.903) (0.903) (2.749) $1.846 - $1.846 -Labor $50.221 $52.076 $45.007 $5.214 10.4 $7.069 13.6
Non-Labor :Electric Power $3.904 $3.292 $3.265 $0.639 16.4 $0.027 0.8 Fuel $0.279 $0.225 $0.212 $0.067 23.9 $0.013 5.7 Insurance $1.205 $1.012 $0.966 $0.239 19.8 $0.045 4.5 Claims $0.090 $0.990 $0.960 (0.870) - $0.030 3.0 Paratransit Service Contracts $0.000 $0.000 $0.000 - - - -Maintenance and Other Operating Contracts $2.375 $3.565 $0.816 $1.559 65.7 $2.749 77.1 Professional Service Contracts $1.059 $1.742 $1.566 (0.507) (47.9) $0.176 10.1 Materials & Supplies $2.146 $3.271 $2.529 (0.383) (17.9) $0.742 22.7 Other Business Expenses $0.730 $1.955 $0.318 $0.412 56.4 $1.637 83.7 Non-Labor $11.788 $16.051 $10.633 $1.155 9.8 $5.418 33.8
Other Expense Adjustments:Other $0.000 $0.000 $0.000 - - - -Other Expense Adjustments $0.000 $0.000 $0.000 - - - -
Total Expenses before Depreciation and OPEB $62.010 $68.127 $55.640 $6.370 10.3 $12.487 18.3
Depreciation $12.000 $12.000 $10.808 $1.192 9.9 $1.192 9.9 GASB 75 OPEB Expense Adjustment $7.500 $5.500 $4.862 $2.638 35.2 $0.638 11.6 GASB 68 Pension Adjustment (0.100) (0.100) (0.811) $0.711 - $0.711 -Environmental Remediation $0.000 $0.000 $0.000 - - - -
Total Expenses $81.410 $85.528 $70.499 $10.911 13.4 $15.029 17.6
OPERATING SURPLUS/DEFICIT (72.272) (57.753) (43.571) $28.702 39.7 $14.182 24.6
Note: 1) Totals may not add due to rounding.2) Results are based on the preliminary close of the general ledger and are subject to review and adjustment. Please note that the actual amounts do not include post-close adjustments, which will be included in the Final audited YE statements.
Master Page # 124 of 228 - New York City Transit and Bus Committee Meeting 1/21/2021________________________________________________________________________________
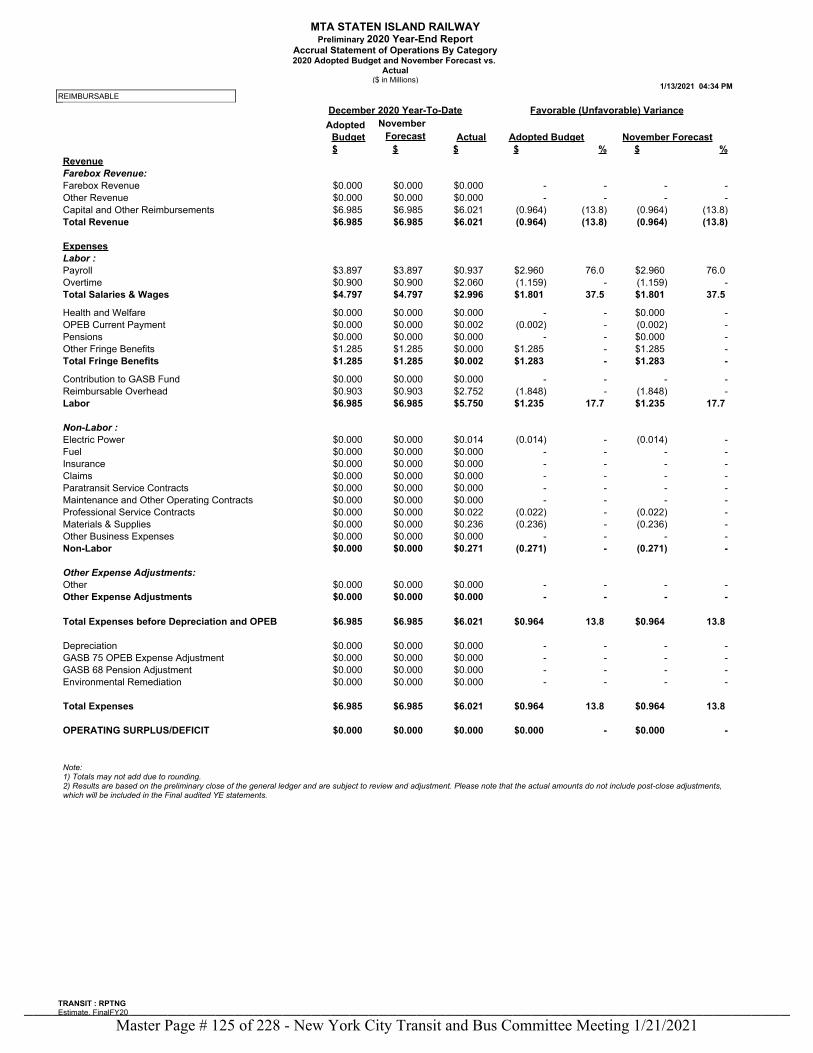
MTA STATEN ISLAND RAILWAYPreliminary 2020 Year-End Report
Accrual Statement of Operations By Category2020 Adopted Budget and November Forecast vs.
Actual($ in Millions)
1/13/2021 04:34 PMREIMBURSABLE
TRANSIT : RPTNGEstimate. FinalFY20
December 2020 Year-To-Date Favorable (Unfavorable) VarianceAdopted November
Budget Forecast Actual Adopted Budget November Forecast$ $ $ $ % $ %
RevenueFarebox Revenue:Farebox Revenue $0.000 $0.000 $0.000 - - - -Other Revenue $0.000 $0.000 $0.000 - - - -Capital and Other Reimbursements $6.985 $6.985 $6.021 (0.964) (13.8) (0.964) (13.8)Total Revenue $6.985 $6.985 $6.021 (0.964) (13.8) (0.964) (13.8)
ExpensesLabor :Payroll $3.897 $3.897 $0.937 $2.960 76.0 $2.960 76.0 Overtime $0.900 $0.900 $2.060 (1.159) - (1.159) -Total Salaries & Wages $4.797 $4.797 $2.996 $1.801 37.5 $1.801 37.5
Health and Welfare $0.000 $0.000 $0.000 - - $0.000 -OPEB Current Payment $0.000 $0.000 $0.002 (0.002) - (0.002) -Pensions $0.000 $0.000 $0.000 - - $0.000 -Other Fringe Benefits $1.285 $1.285 $0.000 $1.285 - $1.285 -Total Fringe Benefits $1.285 $1.285 $0.002 $1.283 - $1.283 -
Contribution to GASB Fund $0.000 $0.000 $0.000 - - - -Reimbursable Overhead $0.903 $0.903 $2.752 (1.848) - (1.848) -Labor $6.985 $6.985 $5.750 $1.235 17.7 $1.235 17.7
Non-Labor :Electric Power $0.000 $0.000 $0.014 (0.014) - (0.014) -Fuel $0.000 $0.000 $0.000 - - - -Insurance $0.000 $0.000 $0.000 - - - -Claims $0.000 $0.000 $0.000 - - - -Paratransit Service Contracts $0.000 $0.000 $0.000 - - - -Maintenance and Other Operating Contracts $0.000 $0.000 $0.000 - - - -Professional Service Contracts $0.000 $0.000 $0.022 (0.022) - (0.022) -Materials & Supplies $0.000 $0.000 $0.236 (0.236) - (0.236) -Other Business Expenses $0.000 $0.000 $0.000 - - - -Non-Labor $0.000 $0.000 $0.271 (0.271) - (0.271) -
Other Expense Adjustments:Other $0.000 $0.000 $0.000 - - - -Other Expense Adjustments $0.000 $0.000 $0.000 - - - -
Total Expenses before Depreciation and OPEB $6.985 $6.985 $6.021 $0.964 13.8 $0.964 13.8
Depreciation $0.000 $0.000 $0.000 - - - -GASB 75 OPEB Expense Adjustment $0.000 $0.000 $0.000 - - - -GASB 68 Pension Adjustment $0.000 $0.000 $0.000 - - - -Environmental Remediation $0.000 $0.000 $0.000 - - - -
Total Expenses $6.985 $6.985 $6.021 $0.964 13.8 $0.964 13.8
OPERATING SURPLUS/DEFICIT $0.000 $0.000 $0.000 $0.000 - $0.000 -
Note: 1) Totals may not add due to rounding.2) Results are based on the preliminary close of the general ledger and are subject to review and adjustment. Please note that the actual amounts do not include post-close adjustments, which will be included in the Final audited YE statements.
Master Page # 125 of 228 - New York City Transit and Bus Committee Meeting 1/21/2021________________________________________________________________________________

MTA STATEN ISLAND RAILWAYPreliminary 2020 Year-End Report
Accrual Statement of Operations By Category2020 Adopted Budget and November Forecast vs.
Actual($ in Millions)
1/12/2021 05:15 PMNON-REIMBURSABLE & REIMBURSABLE
TRANSIT : RPTNGEstimate. FinalFY20
December 2020 Year-To-Date Favorable (Unfavorable) VarianceAdopted November
Budget Forecast Actual Adopted Budget November Forecast$ $ $ $ % $ %
RevenueFarebox Revenue:Farebox Revenue $6.669 $2.362 $2.325 (4.344) (65.1) (0.037) (1.6)Other Revenue $2.468 $25.412 $24.603 $22.135 - (0.809) (3.2)Capital and Other Reimbursements $6.985 $6.985 $6.021 (0.964) (13.8) (0.964) (13.8)Total Revenue $16.123 $34.760 $32.949 $16.827 - (1.810) (5.2)
ExpensesLabor :Payroll $29.978 $30.441 $26.560 $3.418 11.4 $3.881 12.7 Overtime $3.287 $4.139 $4.176 (0.889) (27.0) (0.038) (0.9)Total Salaries & Wages $33.265 $34.580 $30.737 $2.529 7.6 $3.843 11.1
Health and Welfare $7.376 $6.587 $4.886 $2.490 33.8 $1.701 25.8 OPEB Current Payment $2.723 $2.723 $2.210 $0.513 18.9 $0.513 18.8 Pensions $7.738 $8.838 $8.055 (0.317) (4.1) $0.783 8.9 Other Fringe Benefits $6.105 $6.333 $4.867 $1.237 20.3 $1.466 23.1 Total Fringe Benefits $23.942 $24.482 $20.018 $3.924 16.4 $4.464 18.2
Contribution to GASB Fund $0.000 $0.000 $0.000 - - - -Reimbursable Overhead $0.000 $0.000 $0.002 (0.002) - (0.002) -Labor $57.207 $59.061 $50.757 $6.450 11.3 $8.305 14.1
Non-Labor :Electric Power $3.904 $3.292 $3.279 $0.625 16.0 $0.013 0.4 Fuel $0.279 $0.225 $0.212 $0.067 23.9 $0.013 5.7 Insurance $1.205 $1.012 $0.966 $0.239 19.8 $0.045 4.5 Claims $0.090 $0.990 $0.960 (0.870) - $0.030 3.0 Paratransit Service Contracts $0.000 $0.000 $0.000 - - - -Maintenance and Other Operating Contracts $2.375 $3.565 $0.816 $1.559 65.7 $2.749 77.1 Professional Service Contracts $1.059 $1.742 $1.588 (0.529) (50.0) $0.154 8.8 Materials & Supplies $2.146 $3.271 $2.765 (0.619) (28.8) $0.506 15.5 Other Business Expenses $0.730 $1.955 $0.318 $0.412 56.4 $1.637 83.7 Non-Labor $11.788 $16.051 $10.904 $0.884 7.5 $5.147 32.1
Other Expense Adjustments:Other $0.000 $0.000 $0.000 - - - -Other Expense Adjustments $0.000 $0.000 $0.000 - - - -
Total Expenses before Depreciation and OPEB $68.995 $75.113 $61.661 $7.334 10.6 $13.451 17.9
Depreciation $12.000 $12.000 $10.808 $1.192 9.9 $1.192 9.9 GASB 75 OPEB Expense Adjustment $7.500 $5.500 $4.862 $2.638 35.2 $0.638 11.6 GASB 68 Pension Adjustment (0.100) (0.100) (0.811) $0.711 - $0.711 -Environmental Remediation $0.000 $0.000 $0.000 - - - -
Total Expenses $88.395 $92.513 $76.520 $11.875 13.4 $15.993 17.3
OPERATING SURPLUS/DEFICIT (72.272) (57.753) (43.571) $28.702 39.7 $14.182 24.6
Note: 1) Totals may not add due to rounding.2) Results are based on the preliminary close of the general ledger and are subject to review and adjustment. Please note that the actual amounts do not include post-close adjustments, which will be included in the Final audited YE statements.
Master Page # 126 of 228 - New York City Transit and Bus Committee Meeting 1/21/2021________________________________________________________________________________
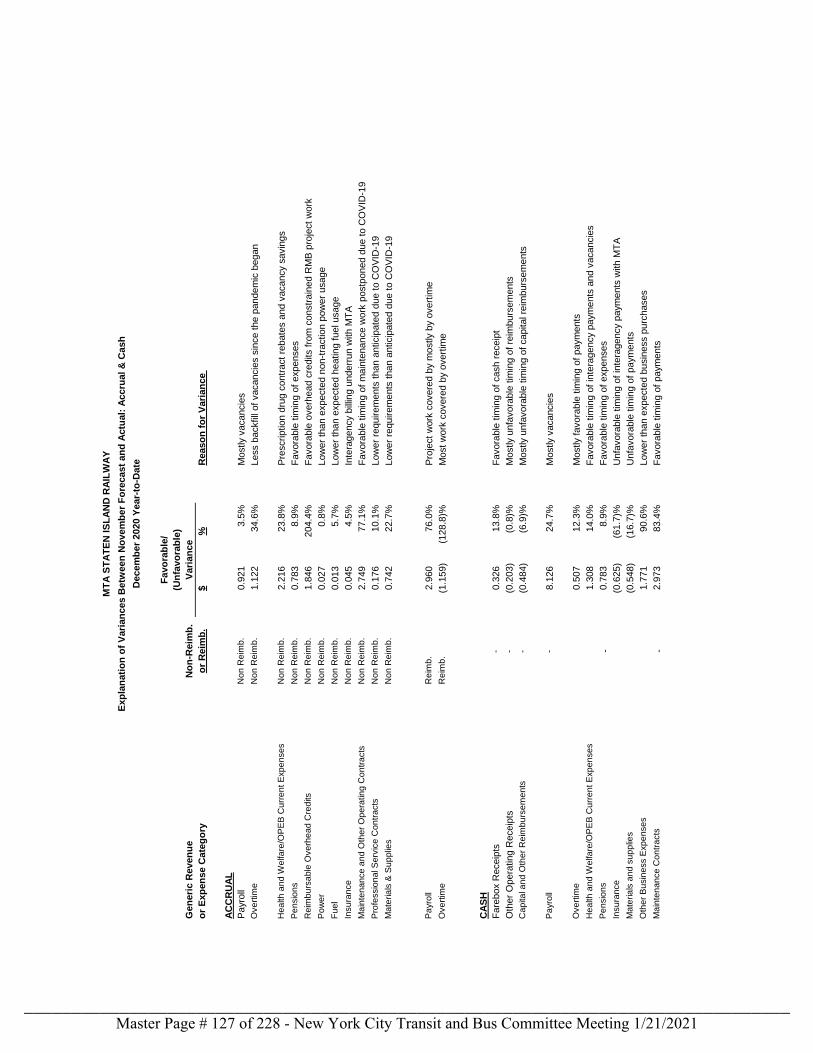
Gen
eri
c R
even
ue
No
n-R
eim
b.
or
Exp
en
se C
ate
go
ry
or
Reim
b.
$%
Reaso
n f
or
Vari
an
ce
AC
CR
UA
L
Payro
llN
on
Re
imb
.0.9
21
3.5
%M
ostly v
acancie
s
Ove
rtim
eN
on
Re
imb
.1.1
22
34.6
%Less b
ackfill
of
vacancie
s s
ince t
he p
andem
ic b
egan
He
alth
an
d W
elfa
re/O
PE
B C
urr
en
t E
xp
en
se
sN
on
Re
imb
.2.2
16
23.8
%P
rescription d
rug c
ontr
act
rebate
s a
nd v
acancy s
avin
gs
Pe
nsio
ns
No
n R
eim
b.
0.7
83
8.9
%F
avora
ble
tim
ing o
f expenses
Re
imb
urs
ab
le O
ve
rhe
ad
Cre
dits
No
n R
eim
b.
1.8
46
204.4
%F
avora
ble
overh
ead c
redits f
rom
constr
ain
ed R
MB
pro
ject
work
Po
we
rN
on
Re
imb
.0.0
27
0.8
%Low
er
than e
xpecte
d n
on-t
raction p
ow
er
usage
Fu
el
No
n R
eim
b.
0.0
13
5.7
%Low
er
than e
xpecte
d h
eating f
uel usage
Insu
ran
ce
No
n R
eim
b.
0.0
45
4.5
%In
tera
gency b
illin
g u
nderr
un w
ith M
TA
Ma
inte
na
nce
an
d O
the
r O
pe
ratin
g C
on
tra
cts
No
n R
eim
b.
2.7
49
77.1
%F
avora
ble
tim
ing o
f m
ain
tenance w
ork
postp
oned d
ue t
o C
OV
ID-1
9
Pro
fessio
na
l S
erv
ice
Co
ntr
acts
No
n R
eim
b.
0.1
76
10.1
%Low
er
requirem
ents
than a
nticip
ate
d d
ue t
o C
OV
ID-1
9
Ma
teria
ls &
Su
pp
lies
No
n R
eim
b.
0.7
42
22.7
%Low
er
requirem
ents
than a
nticip
ate
d d
ue t
o C
OV
ID-1
9
Pa
yro
llR
eim
b.
2.9
60
76.0
%P
roje
ct
work
covere
d b
y m
ostly b
y o
vert
ime
Ove
rtim
eR
eim
b.
(1.1
59)
(128.8
)%M
ost
work
covere
d b
y o
vert
ime
CA
SH
Fare
box R
eceip
ts-
0.3
26
13.8
%F
avora
ble
tim
ing o
f cash r
eceip
t
Oth
er
Opera
ting R
eceip
ts-
(0.2
03)
(0.8
)%M
ostly u
nfa
vora
ble
tim
ing o
f re
imburs
em
ents
Ca
pita
l a
nd
Oth
er
Re
imb
urs
em
en
ts-
(0.4
84)
(6.9
)%M
ostly u
nfa
vora
ble
tim
ing o
f capital re
imburs
em
ents
Pa
yro
ll-
8.1
26
24.7
%M
ostly v
acancie
s
Ove
rtim
e0.5
07
12.3
%M
ostly f
avora
ble
tim
ing o
f paym
ents
He
alth
an
d W
elfa
re/O
PE
B C
urr
en
t E
xp
en
se
s1.3
08
14.0
%F
avora
ble
tim
ing o
f in
tera
gency p
aym
ents
and v
acancie
s
Pe
nsio
ns
-0.7
83
8.9
%F
avora
ble
tim
ing o
f expenses
Insu
ran
ce
(0.6
25)
(61.7
)%U
nfa
vora
ble
tim
ing o
f in
tera
gency p
aym
ents
with M
TA
Ma
teria
ls a
nd
su
pp
lies
(0.5
48)
(16.7
)%U
nfa
vora
ble
tim
ing o
f paym
ents
Oth
er
Bu
sin
ess E
xp
en
se
s1.7
71
90.6
%Low
er
than e
xpecte
d b
usin
ess p
urc
hases
Ma
inte
na
nce
Co
ntr
acts
-2.9
73
83.4
%F
avora
ble
tim
ing o
f paym
ents
MT
A S
TA
TE
N I
SL
AN
D R
AIL
WA
Y
Exp
lan
ati
on
of
Vari
an
ces B
etw
een
No
vem
ber
Fo
recast
an
d A
ctu
al:
Accru
al
& C
ash
Decem
ber
2020 Y
ear-
to-D
ate
Favo
rab
le/
(Un
favo
rab
le)
Vari
an
ce
Master Page # 127 of 228 - New York City Transit and Bus Committee Meeting 1/21/2021________________________________________________________________________________
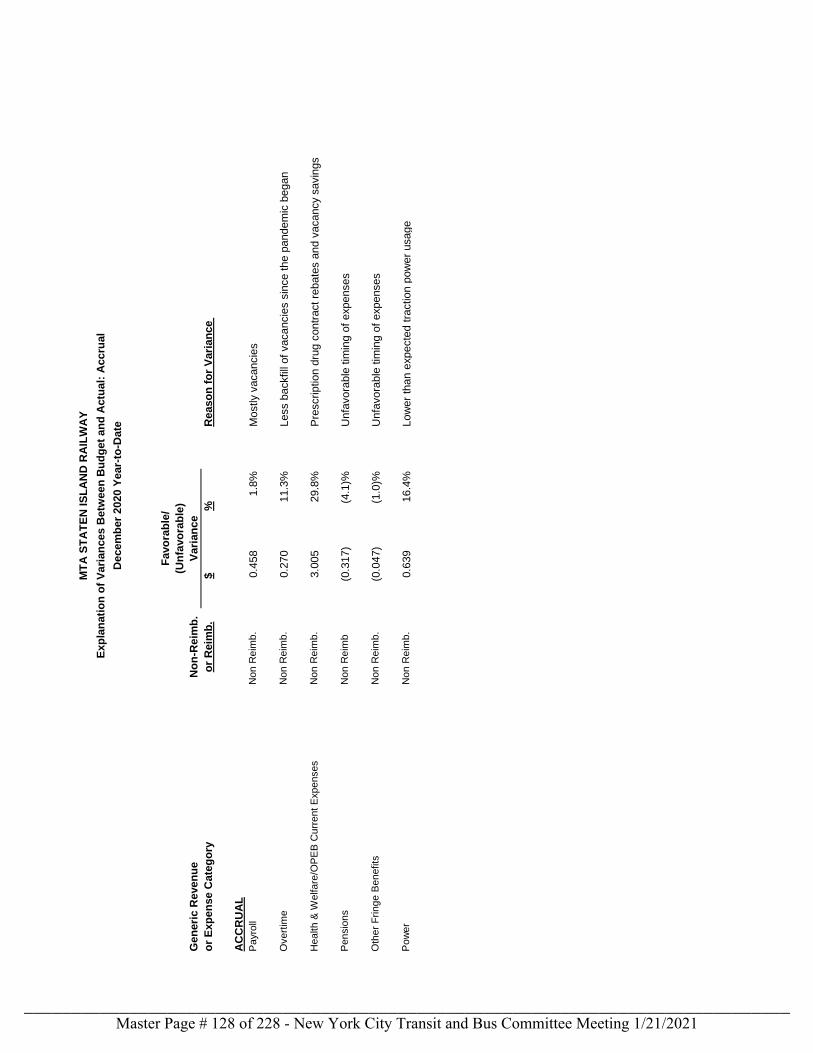
Gen
eri
c R
even
ue
No
n-R
eim
b.
or
Exp
en
se C
ate
go
ry
or
Reim
b.
$%
Reaso
n f
or
Vari
an
ce
AC
CR
UA
L
Pa
yro
llN
on
Re
imb
.0.4
58
1.8
%M
ostly v
acancie
s
Ove
rtim
eN
on
Re
imb
.0.2
70
11.3
%Less b
ackfill
of
vacancie
s s
ince the p
andem
ic b
egan
He
alth
& W
elfa
re/O
PE
B C
urr
en
t E
xp
en
se
sN
on
Re
imb
.3.0
05
29.8
%P
rescription d
rug c
ontr
act re
bate
s a
nd v
acancy s
avin
gs
Pe
nsio
ns
No
n R
eim
b(0
.317)
(4.1
)%U
nfa
vora
ble
tim
ing o
f expenses
Oth
er
Frin
ge
Be
ne
fits
No
n R
eim
b.
(0.0
47)
(1.0
)%U
nfa
vora
ble
tim
ing o
f expenses
Po
we
rN
on
Re
imb
.0.6
39
16.4
%Low
er
than e
xpecte
d tra
ction p
ow
er
usage
MT
A S
TA
TE
N IS
LA
ND
RA
ILW
AY
Exp
lan
ati
on
of
Vari
an
ces B
etw
een
Bu
dg
et
an
d A
ctu
al:
Accru
al
Decem
ber
2020 Y
ear-
to-D
ate
Favo
rab
le/
(Un
favo
rab
le)
Vari
an
ce
Master Page # 128 of 228 - New York City Transit and Bus Committee Meeting 1/21/2021________________________________________________________________________________
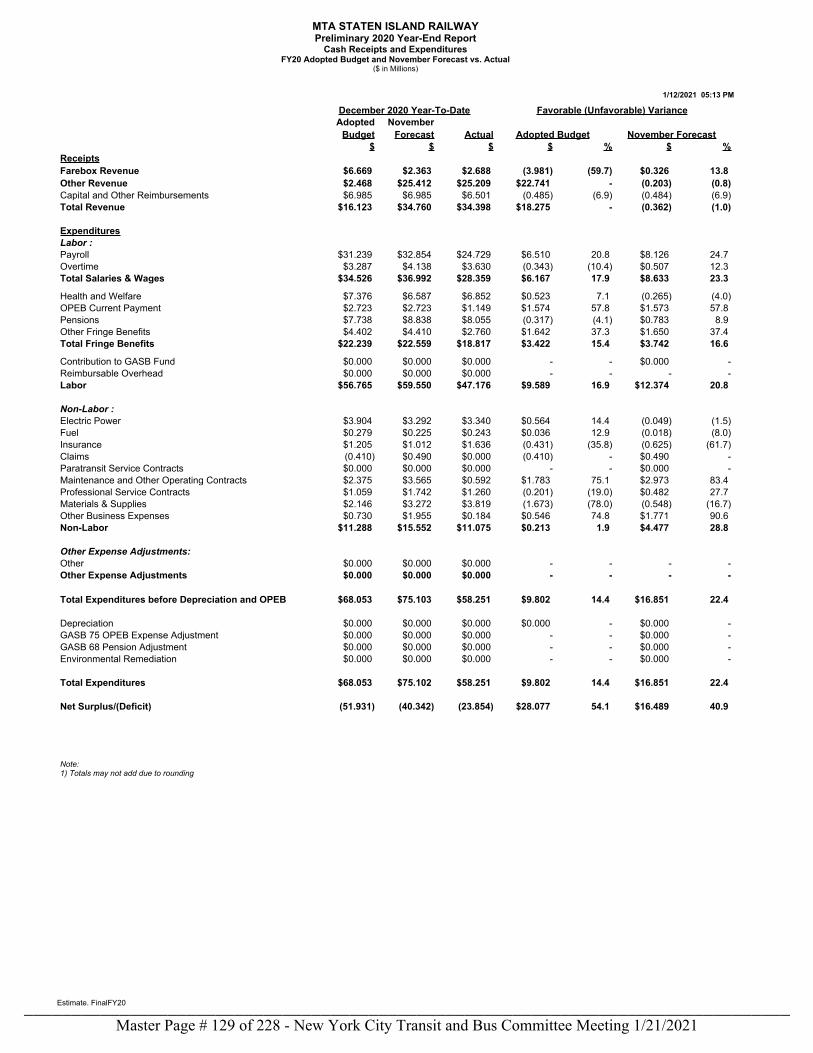
MTA STATEN ISLAND RAILWAYPreliminary 2020 Year-End Report
Cash Receipts and ExpendituresFY20 Adopted Budget and November Forecast vs. Actual
($ in Millions)
1/12/2021 05:13 PM
Estimate. FinalFY20
December 2020 Year-To-Date Favorable (Unfavorable) VarianceAdopted November
Budget Forecast Actual Adopted Budget November Forecast$ $ $ $ % $ %
ReceiptsFarebox Revenue $6.669 $2.363 $2.688 (3.981) (59.7) $0.326 13.8 Other Revenue $2.468 $25.412 $25.209 $22.741 - (0.203) (0.8)Capital and Other Reimbursements $6.985 $6.985 $6.501 (0.485) (6.9) (0.484) (6.9)Total Revenue $16.123 $34.760 $34.398 $18.275 - (0.362) (1.0)
ExpendituresLabor :Payroll $31.239 $32.854 $24.729 $6.510 20.8 $8.126 24.7 Overtime $3.287 $4.138 $3.630 (0.343) (10.4) $0.507 12.3 Total Salaries & Wages $34.526 $36.992 $28.359 $6.167 17.9 $8.633 23.3
Health and Welfare $7.376 $6.587 $6.852 $0.523 7.1 (0.265) (4.0)OPEB Current Payment $2.723 $2.723 $1.149 $1.574 57.8 $1.573 57.8 Pensions $7.738 $8.838 $8.055 (0.317) (4.1) $0.783 8.9 Other Fringe Benefits $4.402 $4.410 $2.760 $1.642 37.3 $1.650 37.4 Total Fringe Benefits $22.239 $22.559 $18.817 $3.422 15.4 $3.742 16.6
Contribution to GASB Fund $0.000 $0.000 $0.000 - - $0.000 -Reimbursable Overhead $0.000 $0.000 $0.000 - - - -Labor $56.765 $59.550 $47.176 $9.589 16.9 $12.374 20.8
Non-Labor :Electric Power $3.904 $3.292 $3.340 $0.564 14.4 (0.049) (1.5)Fuel $0.279 $0.225 $0.243 $0.036 12.9 (0.018) (8.0)Insurance $1.205 $1.012 $1.636 (0.431) (35.8) (0.625) (61.7)Claims (0.410) $0.490 $0.000 (0.410) - $0.490 -Paratransit Service Contracts $0.000 $0.000 $0.000 - - $0.000 -Maintenance and Other Operating Contracts $2.375 $3.565 $0.592 $1.783 75.1 $2.973 83.4 Professional Service Contracts $1.059 $1.742 $1.260 (0.201) (19.0) $0.482 27.7 Materials & Supplies $2.146 $3.272 $3.819 (1.673) (78.0) (0.548) (16.7)Other Business Expenses $0.730 $1.955 $0.184 $0.546 74.8 $1.771 90.6 Non-Labor $11.288 $15.552 $11.075 $0.213 1.9 $4.477 28.8
Other Expense Adjustments:Other $0.000 $0.000 $0.000 - - - -Other Expense Adjustments $0.000 $0.000 $0.000 - - - -
Total Expenditures before Depreciation and OPEB $68.053 $75.103 $58.251 $9.802 14.4 $16.851 22.4
Depreciation $0.000 $0.000 $0.000 $0.000 - $0.000 -GASB 75 OPEB Expense Adjustment $0.000 $0.000 $0.000 - - $0.000 -GASB 68 Pension Adjustment $0.000 $0.000 $0.000 - - $0.000 -Environmental Remediation $0.000 $0.000 $0.000 - - $0.000 -
Total Expenditures $68.053 $75.102 $58.251 $9.802 14.4 $16.851 22.4
Net Surplus/(Deficit) (51.931) (40.342) (23.854) $28.077 54.1 $16.489 40.9
Note:1) Totals may not add due to rounding
Master Page # 129 of 228 - New York City Transit and Bus Committee Meeting 1/21/2021________________________________________________________________________________
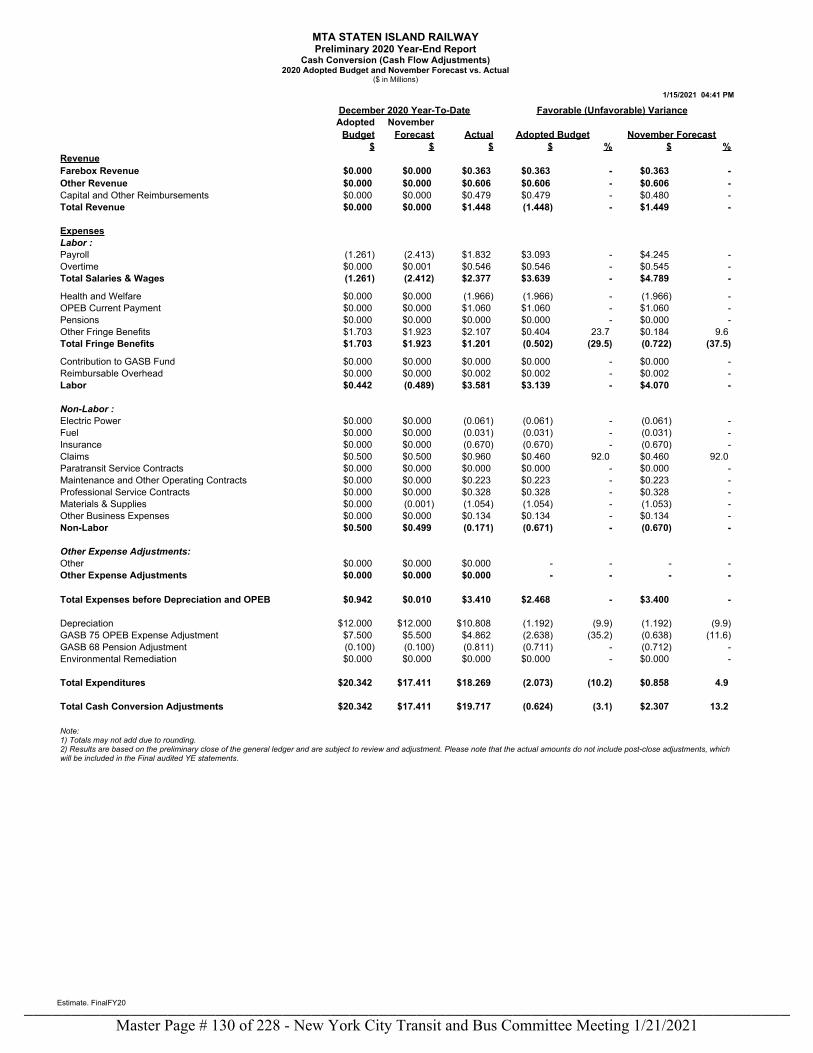
MTA STATEN ISLAND RAILWAYPreliminary 2020 Year-End Report
Cash Conversion (Cash Flow Adjustments)2020 Adopted Budget and November Forecast vs. Actual
($ in Millions)
1/15/2021 04:41 PM
Estimate. FinalFY20
December 2020 Year-To-Date Favorable (Unfavorable) VarianceAdopted November
Budget Forecast Actual Adopted Budget November Forecast$ $ $ $ % $ %
RevenueFarebox Revenue $0.000 $0.000 $0.363 $0.363 - $0.363 -Other Revenue $0.000 $0.000 $0.606 $0.606 - $0.606 -Capital and Other Reimbursements $0.000 $0.000 $0.479 $0.479 - $0.480 -Total Revenue $0.000 $0.000 $1.448 (1.448) - $1.449 -
ExpensesLabor :Payroll (1.261) (2.413) $1.832 $3.093 - $4.245 -Overtime $0.000 $0.001 $0.546 $0.546 - $0.545 -Total Salaries & Wages (1.261) (2.412) $2.377 $3.639 - $4.789 -
Health and Welfare $0.000 $0.000 (1.966) (1.966) - (1.966) -OPEB Current Payment $0.000 $0.000 $1.060 $1.060 - $1.060 -Pensions $0.000 $0.000 $0.000 $0.000 - $0.000 -Other Fringe Benefits $1.703 $1.923 $2.107 $0.404 23.7 $0.184 9.6 Total Fringe Benefits $1.703 $1.923 $1.201 (0.502) (29.5) (0.722) (37.5)
Contribution to GASB Fund $0.000 $0.000 $0.000 $0.000 - $0.000 -Reimbursable Overhead $0.000 $0.000 $0.002 $0.002 - $0.002 -Labor $0.442 (0.489) $3.581 $3.139 - $4.070 -
Non-Labor :Electric Power $0.000 $0.000 (0.061) (0.061) - (0.061) -Fuel $0.000 $0.000 (0.031) (0.031) - (0.031) -Insurance $0.000 $0.000 (0.670) (0.670) - (0.670) -Claims $0.500 $0.500 $0.960 $0.460 92.0 $0.460 92.0 Paratransit Service Contracts $0.000 $0.000 $0.000 $0.000 - $0.000 -Maintenance and Other Operating Contracts $0.000 $0.000 $0.223 $0.223 - $0.223 -Professional Service Contracts $0.000 $0.000 $0.328 $0.328 - $0.328 -Materials & Supplies $0.000 (0.001) (1.054) (1.054) - (1.053) -Other Business Expenses $0.000 $0.000 $0.134 $0.134 - $0.134 -Non-Labor $0.500 $0.499 (0.171) (0.671) - (0.670) -
Other Expense Adjustments:Other $0.000 $0.000 $0.000 - - - -Other Expense Adjustments $0.000 $0.000 $0.000 - - - -
Total Expenses before Depreciation and OPEB $0.942 $0.010 $3.410 $2.468 - $3.400 -
Depreciation $12.000 $12.000 $10.808 (1.192) (9.9) (1.192) (9.9)GASB 75 OPEB Expense Adjustment $7.500 $5.500 $4.862 (2.638) (35.2) (0.638) (11.6)GASB 68 Pension Adjustment (0.100) (0.100) (0.811) (0.711) - (0.712) -Environmental Remediation $0.000 $0.000 $0.000 $0.000 - $0.000 -
Total Expenditures $20.342 $17.411 $18.269 (2.073) (10.2) $0.858 4.9
Total Cash Conversion Adjustments $20.342 $17.411 $19.717 (0.624) (3.1) $2.307 13.2
Note: 1) Totals may not add due to rounding.2) Results are based on the preliminary close of the general ledger and are subject to review and adjustment. Please note that the actual amounts do not include post-close adjustments, whichwill be included in the Final audited YE statements.
Master Page # 130 of 228 - New York City Transit and Bus Committee Meeting 1/21/2021________________________________________________________________________________
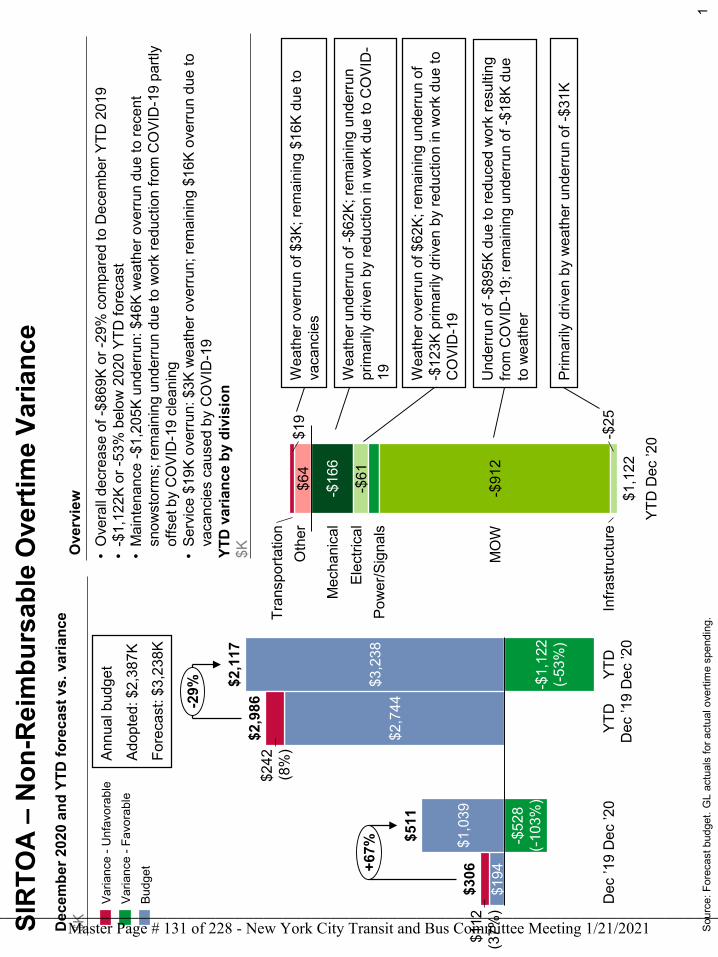
1
SIR
TOA
–N
on-R
eim
burs
able
Ove
rtim
e Va
rianc
e
Sour
ce: F
orec
ast b
udge
t. G
L ac
tual
s fo
r act
ual o
verti
me
spen
ding
.
YTD
var
ianc
e by
div
isio
n$K
Wea
ther
und
erru
n of
-$62
K; re
mai
ning
und
erru
n pr
imar
ily d
riven
by
redu
ctio
n in
wor
k du
e to
CO
VID
-19 Pr
imar
ily d
riven
by
wea
ther
und
erru
n of
-$31
K
Ove
rvie
w
$194
$1,0
39
$2,7
44$3
,238
$242
(8%
)
$112
(37%
)
YTD
D
ec ’1
9
$306
Dec
’19
-$52
8(-1
03%
)
Dec
’20
$2,1
17
YTD
D
ec ’2
0
-$1,
122
(-53%
)
$511
$2,9
86
+67%
-29%
Varia
nce
-Unf
avor
able
Budg
etVa
rianc
e -F
avor
able
$64
$19
-$16
6
-$61
-$91
2
-$25
Pow
er/S
igna
ls
Mec
hani
cal YT
D D
ec ’2
0
Infra
stru
ctur
e
Tran
spor
tatio
n
Elec
trica
l
MO
W
Oth
er
$1,1
22
Annu
al b
udge
t
Adop
ted:
$2,
387K
Fore
cast
: $3,
238K
•O
vera
ll de
crea
se o
f -$8
69K
or -2
9% c
ompa
red
to D
ecem
ber Y
TD 2
019
•-$
1,12
2K o
r -53
% b
elow
202
0 YT
D fo
reca
st
•M
aint
enan
ce -$
1,20
5K u
nder
run:
$46
K w
eath
er o
verru
n du
e to
rece
nt
snow
stor
ms;
rem
aini
ng u
nder
run
due
to w
ork
redu
ctio
n fro
m C
OVI
D-1
9 pa
rtly
offs
et b
y C
OVI
D-1
9 cl
eani
ng•
Serv
ice
$19K
ove
rrun:
$3K
wea
ther
ove
rrun;
rem
aini
ng $
16K
over
run
due
to
vaca
ncie
s ca
used
by
CO
VID
-19
Dec
embe
r 202
0 an
d YT
D fo
reca
st v
s. v
aria
nce
$K
Wea
ther
ove
rrun
of $
3K; r
emai
ning
$16
K du
e to
va
canc
ies
Wea
ther
ove
rrun
of $
62K;
rem
aini
ng u
nder
run
of
-$
123K
prim
arily
driv
en b
y re
duct
ion
in w
ork
due
to
CO
VID
-19
Und
erru
n of
-$89
5K d
ue to
redu
ced
wor
k re
sulti
ng
from
CO
VID
-19;
rem
aini
ng u
nder
run
of -$
18K
due
to w
eath
er
Master Page # 131 of 228 - New York City Transit and Bus Committee Meeting 1/21/2021________________________________________________________________________________
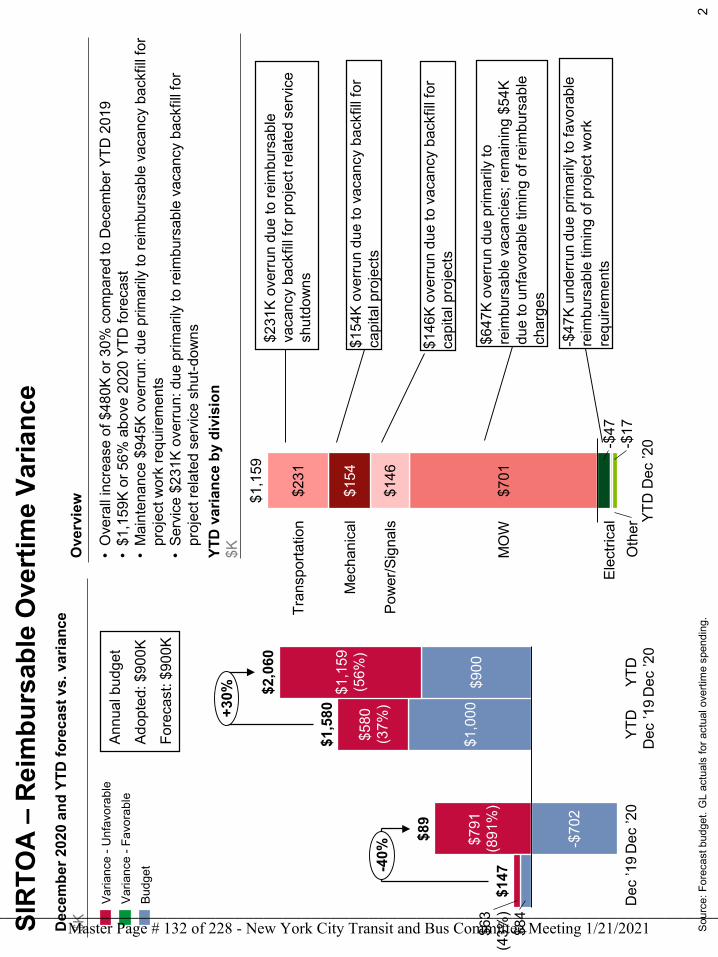
2
SIR
TOA
–R
eim
burs
able
Ove
rtim
e Va
rianc
e
Sour
ce: F
orec
ast b
udge
t. G
L ac
tual
s fo
r act
ual o
verti
me
spen
ding
.
Dec
embe
r 202
0 an
d YT
D fo
reca
st v
s. v
aria
nce
$K
YTD
var
ianc
e by
div
isio
n$KO
verv
iew
$84
$1,0
00$9
00
-$70
2
YTD
D
ec ’2
0
$63
(43%
)
YTD
D
ec ’1
9
$580
(37%
)
Dec
’19
$791
(891
%)
Dec
’20
$1,1
59(5
6%)
$2,0
60
$147
$89
$1,5
80
-40%
+30%
Varia
nce
-Unf
avor
able
Budg
etVa
rianc
e -F
avor
able
$701
$146
$154
$231
-$47
-$17
Elec
trica
l
Tran
spor
tatio
n YTD
Dec
’20
Mec
hani
cal
Pow
er/S
igna
ls
MO
W
Oth
er
$1,1
59
Annu
al b
udge
t
Adop
ted:
$90
0K
Fore
cast
: $90
0K
$146
K ov
erru
n du
e to
vac
ancy
bac
kfill
for
capi
tal p
roje
cts
$647
K ov
erru
n du
e pr
imar
ily to
re
imbu
rsab
le v
acan
cies
; rem
aini
ng $
54K
due
to u
nfav
orab
le ti
min
g of
reim
burs
able
ch
arge
s
-$47
K un
derru
n du
e pr
imar
ily to
favo
rabl
e re
imbu
rsab
le ti
min
g of
pro
ject
wor
k re
quire
men
ts
$231
K ov
erru
n du
e to
reim
burs
able
va
canc
y ba
ckfil
l for
pro
ject
rela
ted
serv
ice
shut
dow
ns
•O
vera
ll in
crea
se o
f $48
0K o
r 30%
com
pare
d to
Dec
embe
r YTD
201
9•
$1,1
59K
or 5
6% a
bove
202
0 YT
D fo
reca
st•
Mai
nten
ance
$94
5K o
verru
n:du
e pr
imar
ily to
reim
burs
able
vac
ancy
bac
kfill
for
proj
ect w
ork
requ
irem
ents
•
Serv
ice
$231
K ov
erru
n:du
e pr
imar
ily to
reim
burs
able
vac
ancy
bac
kfill
for
proj
ect r
elat
ed s
ervi
ce s
hut-d
owns $154
K ov
erru
n du
e to
vac
ancy
bac
kfill
for
capi
tal p
roje
cts
Master Page # 132 of 228 - New York City Transit and Bus Committee Meeting 1/21/2021________________________________________________________________________________
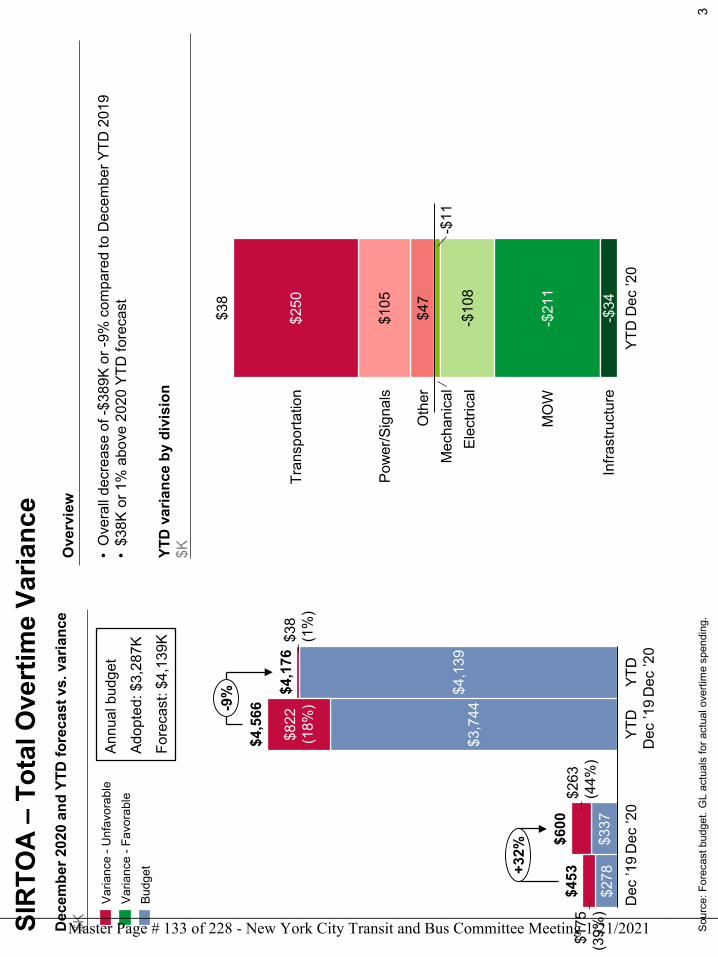
3
SIR
TOA
–To
tal O
vert
ime
Varia
nce
Sour
ce: F
orec
ast b
udge
t. G
L ac
tual
s fo
r act
ual o
verti
me
spen
ding
.
YTD
var
ianc
e by
div
isio
n$K•
Ove
rall
decr
ease
of -
$389
K or
-9%
com
pare
d to
Dec
embe
r YTD
201
9•
$38K
or 1
% a
bove
202
0 YT
D fo
reca
st
Ove
rvie
w
$278
$337
$3,7
44$4
,139
$600
$175
(39%
)
Dec
’20
$4,5
66
Dec
’19
$263
(44%
)
$822
(18%
)
YTD
D
ec ’1
9
$38
(1%
)
YTD
D
ec ’2
0
$453
$4,1
76
+32%
-9%
$47
$105
$250
-$11
-$10
8
-$21
1
-$34
YTD
Dec
’20
Tran
spor
tatio
n
Mec
hani
cal
Pow
er/S
igna
ls
Elec
trica
l
MO
W
Infra
stru
ctur
e
Oth
er
$38
Budg
et
Annu
al b
udge
t
Adop
ted:
$3,
287K
Fore
cast
: $4,
139K
Dec
embe
r 202
0 an
d YT
D fo
reca
st v
s. v
aria
nce
$K
Varia
nce
-Unf
avor
able
Varia
nce
-Fav
orab
le
Master Page # 133 of 228 - New York City Transit and Bus Committee Meeting 1/21/2021________________________________________________________________________________
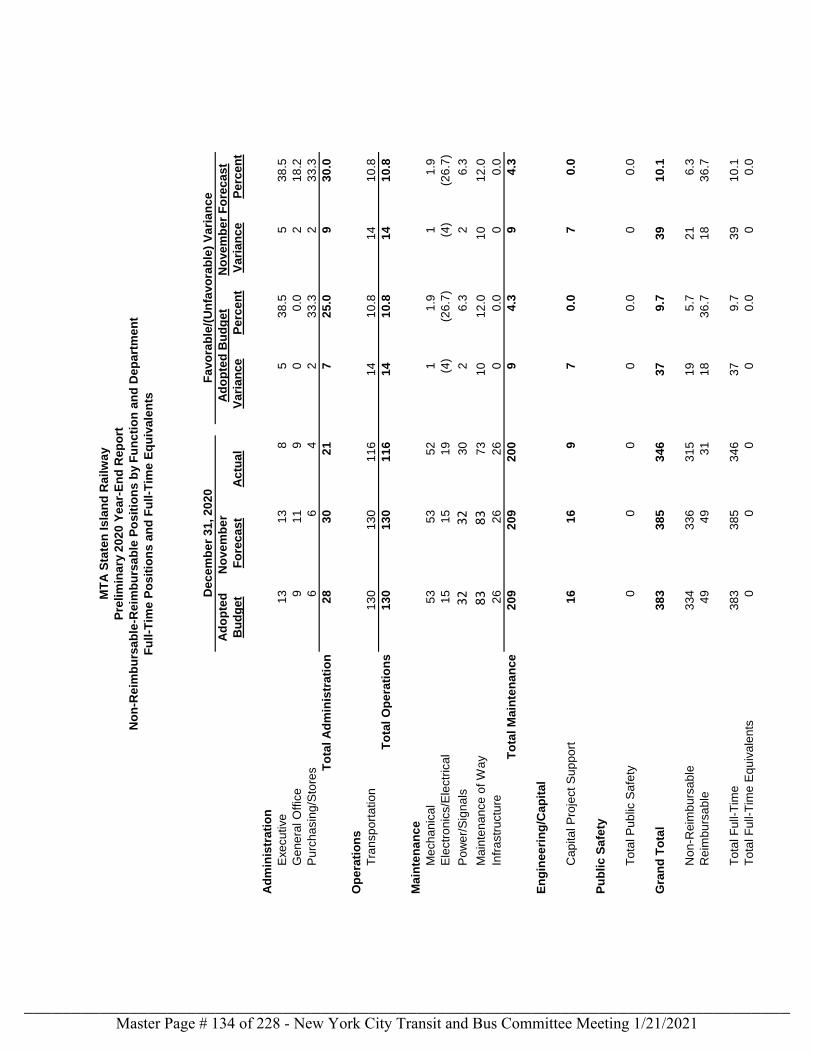
MT
A S
tate
n I
sla
nd
Ra
ilw
ay
Pre
lim
ina
ry 2
02
0 Y
ea
r-E
nd
Rep
ort
No
n-R
eim
bu
rsa
ble
-Reim
bu
rsa
ble
Po
sit
ion
s b
y F
un
cti
on
an
d D
ep
art
me
nt
Fu
ll-T
ime
Po
sit
ion
s a
nd
Fu
ll-T
ime
Eq
uiv
ale
nts
Fa
vo
rab
le/(
Un
favo
rab
le)
Va
ria
nc
e
Ad
op
ted
No
ve
mb
er
A
do
pte
d B
ud
ge
tN
ove
mb
er
Fo
rec
as
t
Bu
dg
et
Fo
rec
as
tA
ctu
al
Va
ria
nc
eP
erc
en
tV
ari
an
ce
Pe
rce
nt
Ad
min
istr
ati
on
Exe
cu
tive
13
1
3
85
38
.55
38
.5
Ge
ne
ral O
ffic
e9
11
9
00
.02
18
.2
Pu
rch
asin
g/S
tore
s6
6
4
23
3.3
23
3.3
To
tal
Ad
min
istr
ati
on
28
30
21
72
5.0
93
0.0
Op
era
tio
ns
Tra
nsp
ort
atio
n1
30
13
01
16
14
10
.81
41
0.8
To
tal
Op
era
tio
ns
13
01
30
11
61
41
0.8
14
10
.8
Ma
inte
na
nc
e
Me
ch
an
ica
l5
3
53
5
2
11
.91
1.9
Ele
ctr
on
ics/E
lectr
ica
l1
5
15
1
9
(4)
(26
.7)
(4)
(26
.7)
Po
we
r/S
ign
als
32
3
2
3
0
26
.32
6.3
Ma
inte
na
nce
of
Wa
y8
3
83
73
1
01
2.0
10
12
.0
Infr
astr
uctu
re2
6
26
2
6
00
.00
0.0
To
tal
Ma
inte
na
nc
e2
09
20
92
00
94
.39
4.3
En
gin
ee
rin
g/C
ap
ita
l
Cap
ita
l P
roje
ct
Su
pp
ort
16
16
97
0.0
70
.0
Pu
bli
c S
afe
ty
To
tal P
ub
lic S
afe
ty0
00
00
.00
0.0
Gra
nd
To
tal
38
33
85
34
63
79
.73
91
0.1
Non
-Reim
bu
rsa
ble
33
43
36
31
51
95
.72
16
.3
Reim
bu
rsa
ble
49
49
31
18
36
.71
83
6.7
To
tal F
ull-
Tim
e3
83
38
53
46
37
9.7
39
10
.1
To
tal F
ull-
Tim
e E
qu
iva
len
ts0
00
00
.00
0.0
Dec
em
be
r 3
1,
20
20
Master Page # 134 of 228 - New York City Transit and Bus Committee Meeting 1/21/2021________________________________________________________________________________
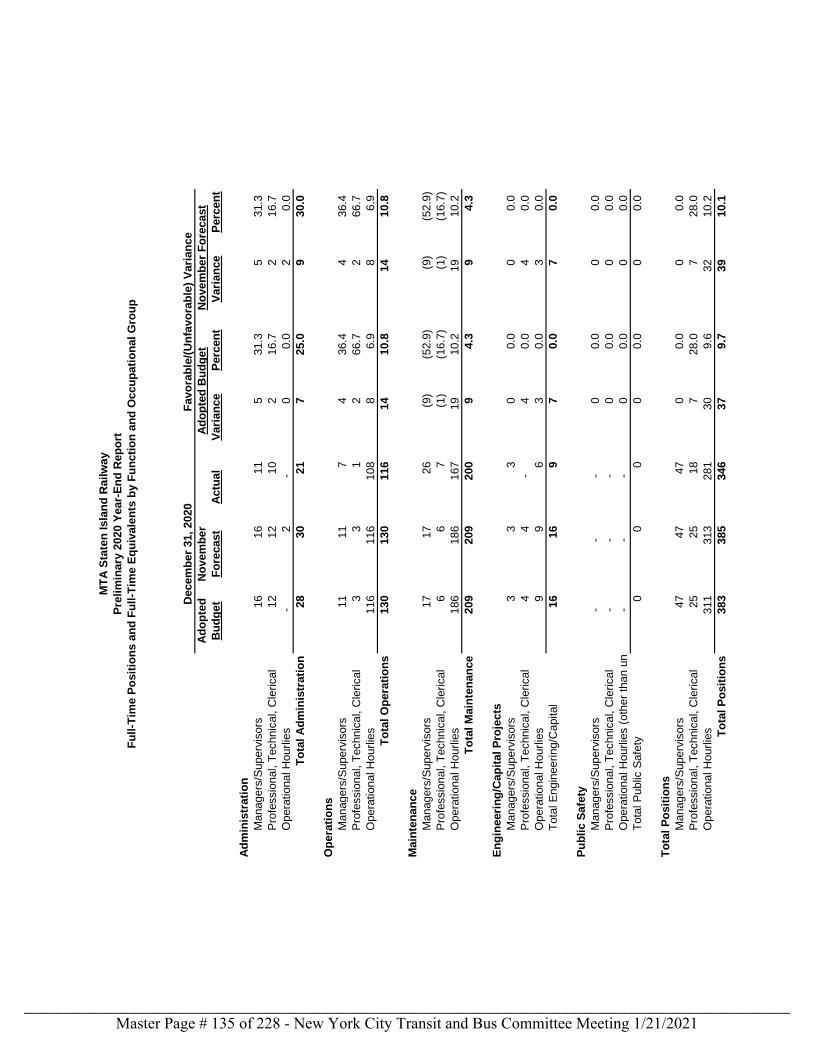
MT
A S
tate
n I
sla
nd
Rail
way
Pre
lim
inary
2020 Y
ear-
En
d R
ep
ort
Fu
ll-T
ime P
osit
ion
s a
nd
Fu
ll-T
ime E
qu
ivale
nts
by F
un
cti
on
an
d O
ccu
pati
on
al
Gro
up
Favo
rab
le/(
Un
favo
rab
le)
Vari
an
ce
Ad
op
ted
No
vem
ber
Ad
op
ted
Bu
dg
et
No
vem
ber
Fo
recast
Bu
dg
et
Fo
recast
Actu
al
Vari
an
ce
Perc
en
tV
ari
an
ce
Perc
en
t
Ad
min
istr
ati
on
Managers
/Superv
isors
16
16
11
5
31.3
531.3
Pro
fessio
nal, T
echnic
al, C
leri
cal
12
12
10
2
16.7
216.7
Opera
tional H
ourl
ies
-
2
-
00.0
20.0
To
tal
Ad
min
istr
ati
on
28
30
21
725.0
930.0
Op
era
tio
ns
Managers
/Superv
isors
11
11
7
4
36.4
436.4
Pro
fessio
nal, T
echnic
al, C
leri
cal
3
3
1
266.7
266.7
Opera
tional H
ourl
ies
116
116
108
86.9
86.9
To
tal
Op
era
tio
ns
130
130
116
14
10.8
14
10.8
Main
ten
an
ce
Managers
/Superv
isors
17
17
26
(9
)(5
2.9
)(9
)(5
2.9
)
Pro
fessio
nal, T
echnic
al, C
leri
cal
6
6
7
(1)
(16.7
)(1
)(1
6.7
)
Opera
tional H
ourl
ies
186
186
167
19
10.2
19
10.2
To
tal
Main
ten
an
ce
209
209
200
94.3
94.3
En
gin
eeri
ng
/Cap
ital
Pro
jects
Managers
/Superv
isors
3
3
3
00.0
00.0
Pro
fessio
nal, T
echnic
al, C
leri
cal
4
4
-
40.0
40.0
Opera
tional H
ourl
ies
9
9
6
30.0
30.0
Tota
l E
ngin
eeri
ng/C
apital
16
16
97
0.0
70.0
Pu
bli
c S
afe
ty
Managers
/Superv
isors
-
-
-
00.0
00.0
Pro
fessio
nal, T
echnic
al, C
leri
cal
-
-
-
00.0
00.0
Opera
tional H
ourl
ies (
oth
er
than u
niform
ed) -
-
-
0
0.0
00.0
Tota
l P
ublic
Safe
ty0
00
00.0
00.0
To
tal
Po
sit
ion
s
Managers
/Superv
isors
47
47
47
00.0
00.0
Pro
fessio
nal, T
echnic
al, C
leri
cal
25
25
18
728.0
728.0
Opera
tional H
ourl
ies
311
313
281
30
9.6
32
10.2
To
tal
Po
sit
ion
s383
385
346
37
9.7
39
10.1
Decem
ber
31,
2020
Master Page # 135 of 228 - New York City Transit and Bus Committee Meeting 1/21/2021________________________________________________________________________________
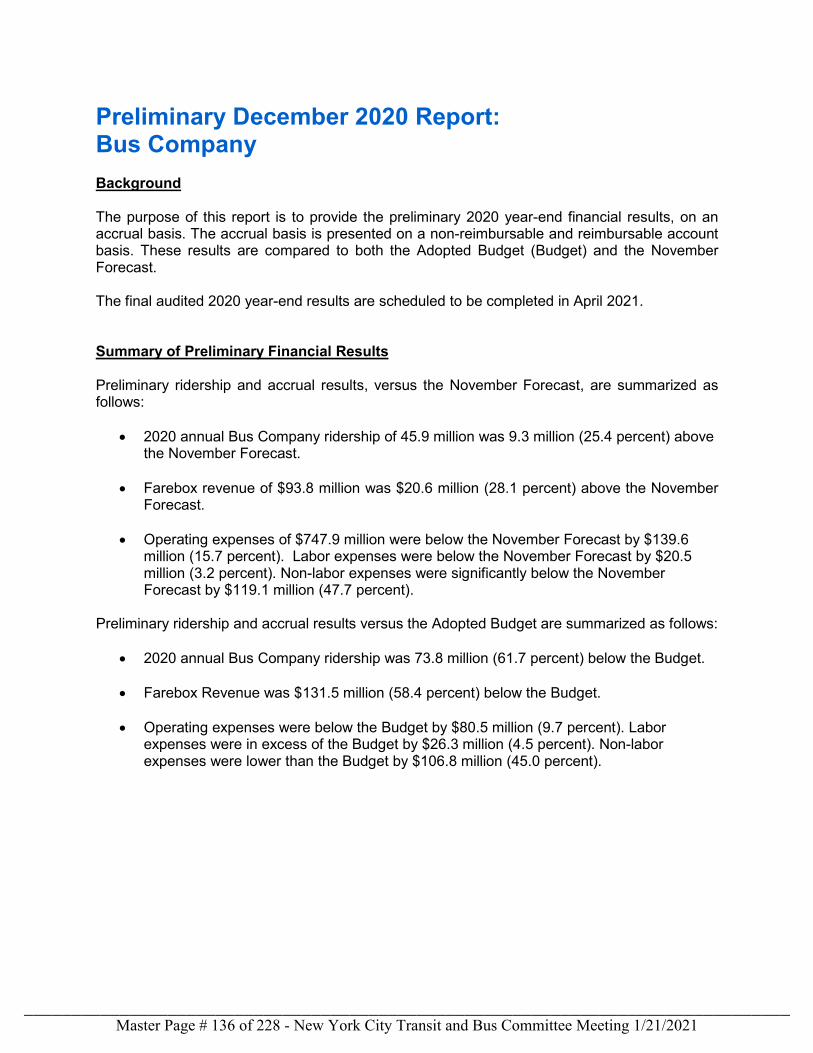
Preliminary December 2020 Report: Bus Company Background The purpose of this report is to provide the preliminary 2020 year-end financial results, on an accrual basis. The accrual basis is presented on a non-reimbursable and reimbursable account basis. These results are compared to both the Adopted Budget (Budget) and the November Forecast. The final audited 2020 year-end results are scheduled to be completed in April 2021. Summary of Preliminary Financial Results Preliminary ridership and accrual results, versus the November Forecast, are summarized as follows:
• 2020 annual Bus Company ridership of 45.9 million was 9.3 million (25.4 percent) above the November Forecast.
• Farebox revenue of $93.8 million was $20.6 million (28.1 percent) above the November Forecast.
• Operating expenses of $747.9 million were below the November Forecast by $139.6 million (15.7 percent). Labor expenses were below the November Forecast by $20.5 million (3.2 percent). Non-labor expenses were significantly below the November Forecast by $119.1 million (47.7 percent).
Preliminary ridership and accrual results versus the Adopted Budget are summarized as follows:
• 2020 annual Bus Company ridership was 73.8 million (61.7 percent) below the Budget.
• Farebox Revenue was $131.5 million (58.4 percent) below the Budget. • Operating expenses were below the Budget by $80.5 million (9.7 percent). Labor
expenses were in excess of the Budget by $26.3 million (4.5 percent). Non-labor expenses were lower than the Budget by $106.8 million (45.0 percent).
Master Page # 136 of 228 - New York City Transit and Bus Committee Meeting 1/21/2021________________________________________________________________________________
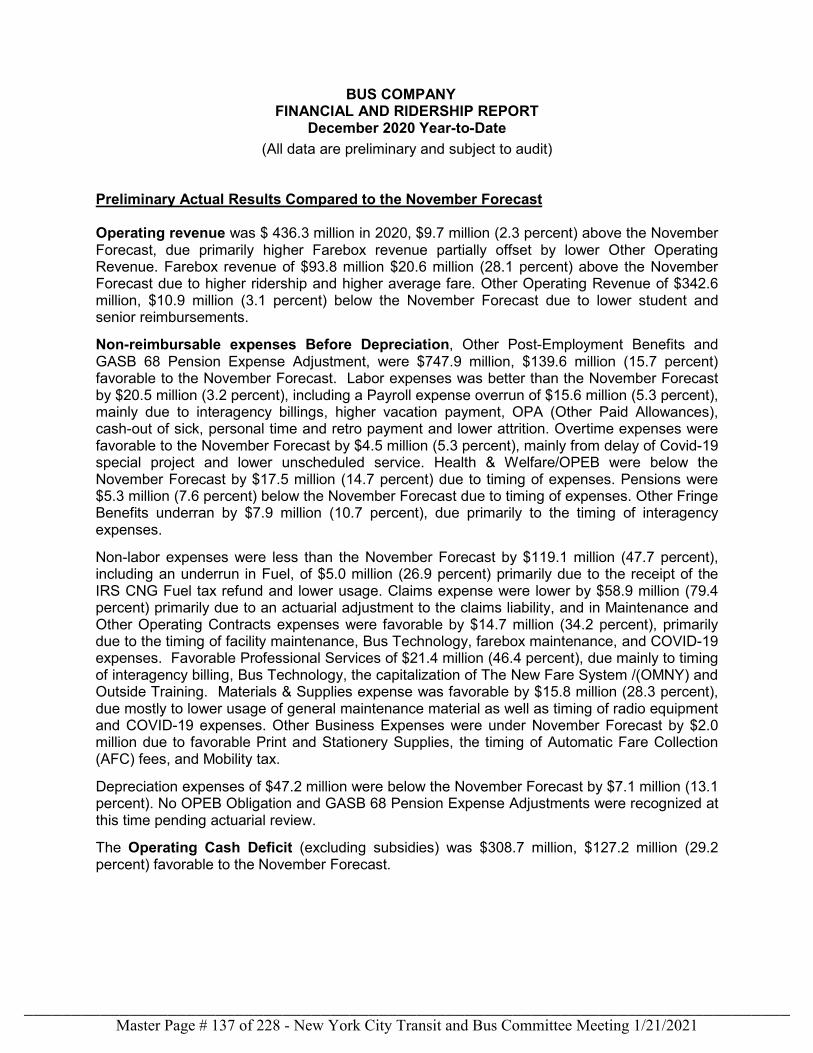
BUS COMPANY FINANCIAL AND RIDERSHIP REPORT
December 2020 Year-to-Date (All data are preliminary and subject to audit)
Preliminary Actual Results Compared to the November Forecast Operating revenue was $ 436.3 million in 2020, $9.7 million (2.3 percent) above the November Forecast, due primarily higher Farebox revenue partially offset by lower Other Operating Revenue. Farebox revenue of $93.8 million $20.6 million (28.1 percent) above the November Forecast due to higher ridership and higher average fare. Other Operating Revenue of $342.6 million, $10.9 million (3.1 percent) below the November Forecast due to lower student and senior reimbursements.
Non-reimbursable expenses Before Depreciation, Other Post-Employment Benefits and GASB 68 Pension Expense Adjustment, were $747.9 million, $139.6 million (15.7 percent) favorable to the November Forecast. Labor expenses was better than the November Forecast by $20.5 million (3.2 percent), including a Payroll expense overrun of $15.6 million (5.3 percent), mainly due to interagency billings, higher vacation payment, OPA (Other Paid Allowances), cash-out of sick, personal time and retro payment and lower attrition. Overtime expenses were favorable to the November Forecast by $4.5 million (5.3 percent), mainly from delay of Covid-19 special project and lower unscheduled service. Health & Welfare/OPEB were below the November Forecast by $17.5 million (14.7 percent) due to timing of expenses. Pensions were $5.3 million (7.6 percent) below the November Forecast due to timing of expenses. Other Fringe Benefits underran by $7.9 million (10.7 percent), due primarily to the timing of interagency expenses.
Non-labor expenses were less than the November Forecast by $119.1 million (47.7 percent), including an underrun in Fuel, of $5.0 million (26.9 percent) primarily due to the receipt of the IRS CNG Fuel tax refund and lower usage. Claims expense were lower by $58.9 million (79.4 percent) primarily due to an actuarial adjustment to the claims liability, and in Maintenance and Other Operating Contracts expenses were favorable by $14.7 million (34.2 percent), primarily due to the timing of facility maintenance, Bus Technology, farebox maintenance, and COVID-19 expenses. Favorable Professional Services of $21.4 million (46.4 percent), due mainly to timing of interagency billing, Bus Technology, the capitalization of The New Fare System /(OMNY) and Outside Training. Materials & Supplies expense was favorable by $15.8 million (28.3 percent), due mostly to lower usage of general maintenance material as well as timing of radio equipment and COVID-19 expenses. Other Business Expenses were under November Forecast by $2.0 million due to favorable Print and Stationery Supplies, the timing of Automatic Fare Collection (AFC) fees, and Mobility tax.
Depreciation expenses of $47.2 million were below the November Forecast by $7.1 million (13.1 percent). No OPEB Obligation and GASB 68 Pension Expense Adjustments were recognized at this time pending actuarial review.
The Operating Cash Deficit (excluding subsidies) was $308.7 million, $127.2 million (29.2 percent) favorable to the November Forecast.
Master Page # 137 of 228 - New York City Transit and Bus Committee Meeting 1/21/2021________________________________________________________________________________
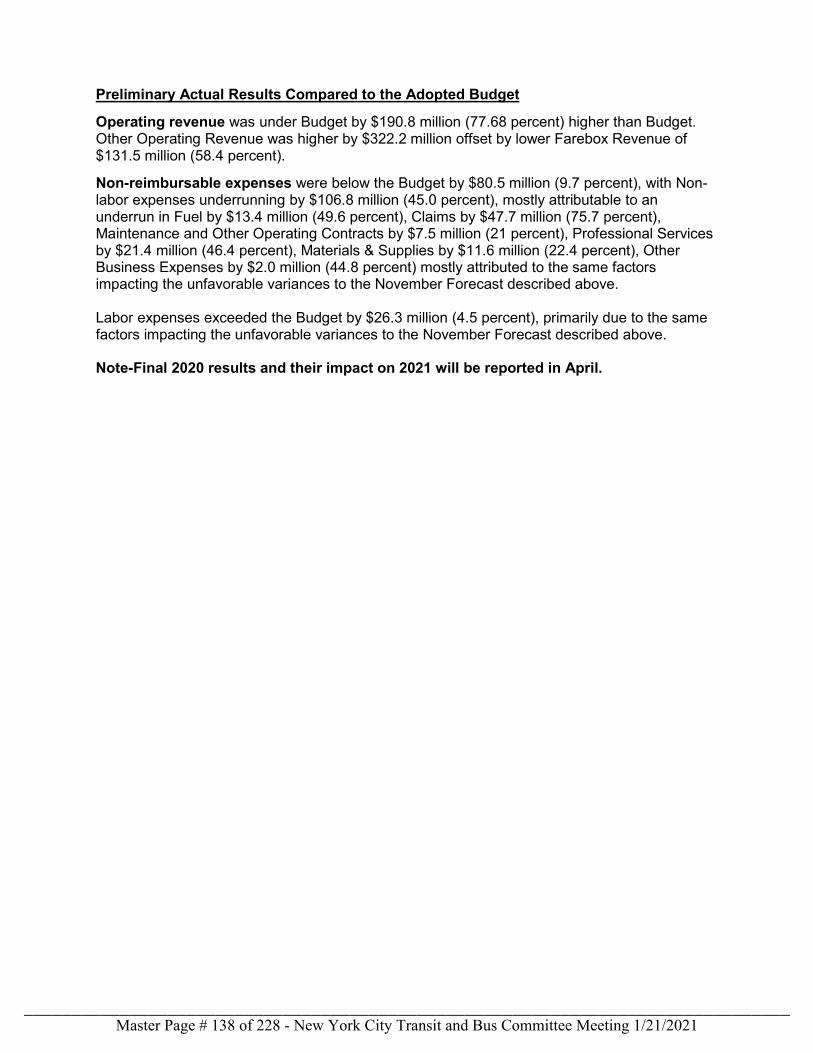
Preliminary Actual Results Compared to the Adopted Budget
Operating revenue was under Budget by $190.8 million (77.68 percent) higher than Budget. Other Operating Revenue was higher by $322.2 million offset by lower Farebox Revenue of $131.5 million (58.4 percent).
Non-reimbursable expenses were below the Budget by $80.5 million (9.7 percent), with Non-labor expenses underrunning by $106.8 million (45.0 percent), mostly attributable to an underrun in Fuel by $13.4 million (49.6 percent), Claims by $47.7 million (75.7 percent), Maintenance and Other Operating Contracts by $7.5 million (21 percent), Professional Services by $21.4 million (46.4 percent), Materials & Supplies by $11.6 million (22.4 percent), Other Business Expenses by $2.0 million (44.8 percent) mostly attributed to the same factors impacting the unfavorable variances to the November Forecast described above. Labor expenses exceeded the Budget by $26.3 million (4.5 percent), primarily due to the same factors impacting the unfavorable variances to the November Forecast described above. Note-Final 2020 results and their impact on 2021 will be reported in April.
Master Page # 138 of 228 - New York City Transit and Bus Committee Meeting 1/21/2021________________________________________________________________________________
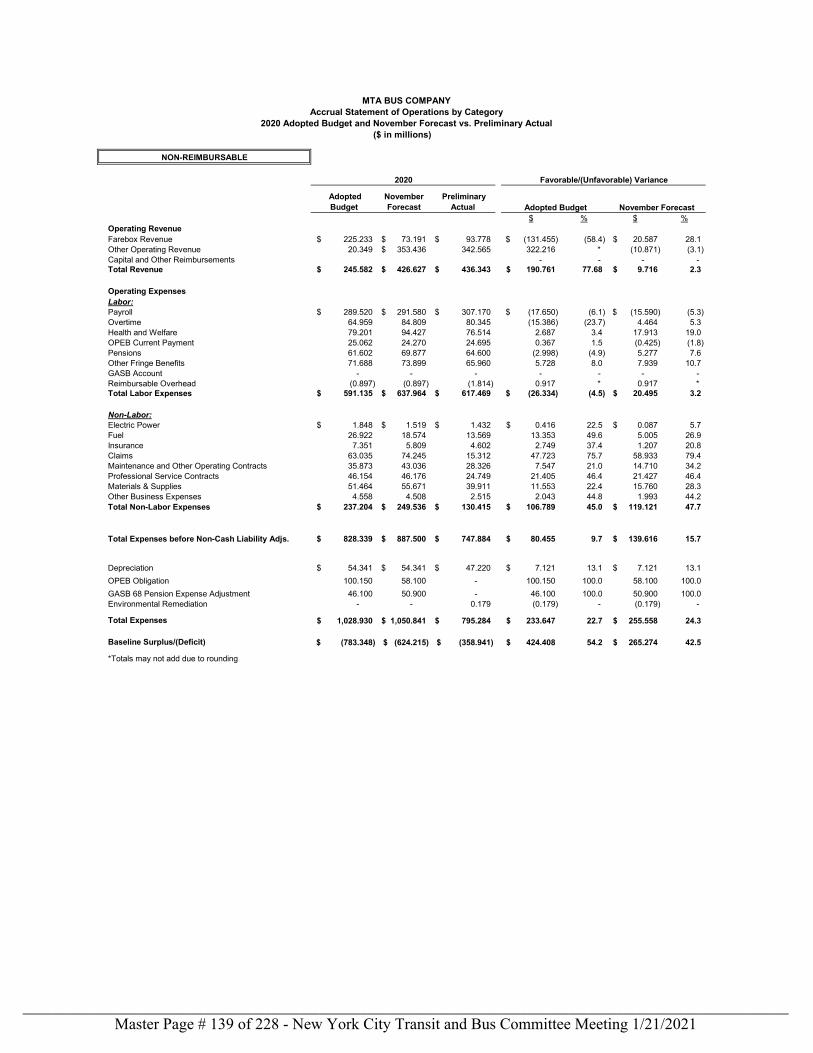
Adopted Budget
November Forecast
Preliminary Actual
$ % $ %Operating RevenueFarebox Revenue 225.233$ 73.191$ 93.778$ (131.455)$ (58.4) 20.587$ 28.1Other Operating Revenue 20.349 353.436$ 342.565 322.216 * (10.871) (3.1)Capital and Other Reimbursements - - - - Total Revenue 245.582$ 426.627$ 436.343$ 190.761$ 77.68 9.716$ 2.3
Operating ExpensesLabor:Payroll 289.520$ 291.580$ 307.170$ (17.650)$ (6.1) (15.590)$ (5.3)Overtime 64.959 84.809 80.345 (15.386) (23.7) 4.464 5.3Health and Welfare 79.201 94.427 76.514 2.687 3.4 17.913 19.0OPEB Current Payment 25.062 24.270 24.695 0.367 1.5 (0.425) (1.8)Pensions 61.602 69.877 64.600 (2.998) (4.9) 5.277 7.6Other Fringe Benefits 71.688 73.899 65.960 5.728 8.0 7.939 10.7GASB Account - - - - - - - Reimbursable Overhead (0.897) (0.897) (1.814) 0.917 * 0.917 * Total Labor Expenses 591.135$ 637.964$ 617.469$ (26.334)$ (4.5) 20.495$ 3.2
Non-Labor:Electric Power 1.848$ 1.519$ 1.432$ 0.416$ 22.5 0.087$ 5.7Fuel 26.922 18.574 13.569 13.353 49.6 5.005 26.9Insurance 7.351 5.809 4.602 2.749 37.4 1.207 20.8Claims 63.035 74.245 15.312 47.723 75.7 58.933 79.4Maintenance and Other Operating Contracts 35.873 43.036 28.326 7.547 21.0 14.710 34.2Professional Service Contracts 46.154 46.176 24.749 21.405 46.4 21.427 46.4Materials & Supplies 51.464 55.671 39.911 11.553 22.4 15.760 28.3Other Business Expenses 4.558 4.508 2.515 2.043 44.8 1.993 44.2Total Non-Labor Expenses 237.204$ 249.536$ 130.415$ 106.789$ 45.0 119.121$ 47.7
Total Expenses before Non-Cash Liability Adjs. 828.339$ 887.500$ 747.884$ 80.455$ 9.7 139.616$ 15.7
Depreciation 54.341$ 54.341$ 47.220$ 7.121$ 13.1 7.121$ 13.1OPEB Obligation 100.150 58.100 - 100.150 100.0 58.100 100.0GASB 68 Pension Expense Adjustment 46.100 50.900 - 46.100 100.0 50.900 100.0Environmental Remediation - - 0.179 (0.179) - (0.179) -
Total Expenses 1,028.930$ 1,050.841$ 795.284$ 233.647$ 22.7 255.558$ 24.3
Baseline Surplus/(Deficit) (783.348)$ (624.215)$ (358.941)$ 424.408$ 54.2 265.274$ 42.5
*Totals may not add due to rounding $ 424.407 $ 265.274
($ in millions)
Accrual Statement of Operations by Category2020 Adopted Budget and November Forecast vs. Preliminary Actual
MTA BUS COMPANY
November Forecast
Favorable/(Unfavorable) Variance
Adopted Budget
NON-REIMBURSABLE
2020
Master Page # 139 of 228 - New York City Transit and Bus Committee Meeting 1/21/2021________________________________________________________________________________
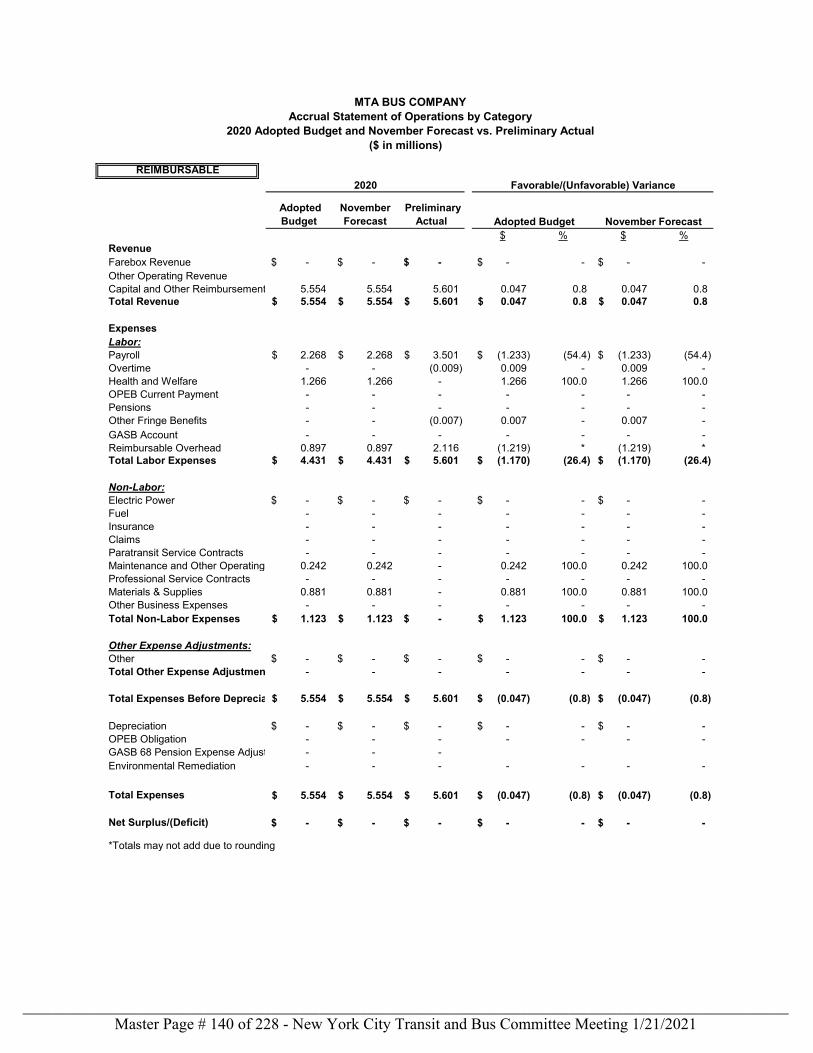
Adopted Budget
November Forecast
Preliminary Actual
$ % $ %RevenueFarebox Revenue -$ -$ -$ -$ - -$ - Other Operating RevenueCapital and Other Reimbursement 5.554 5.554 5.601 0.047 0.8 0.047 0.8Total Revenue 5.554$ 5.554$ 5.601$ 0.047$ 0.8 0.047$ 0.8
ExpensesLabor:Payroll 2.268$ 2.268$ 3.501$ (1.233)$ (54.4) (1.233)$ (54.4)Overtime - - (0.009) 0.009 - 0.009 - Health and Welfare 1.266 1.266 - 1.266 100.0 1.266 100.0OPEB Current Payment - - - - - - - Pensions - - - - - - - Other Fringe Benefits - - (0.007) 0.007 - 0.007 - GASB Account - - - - - - - Reimbursable Overhead 0.897 0.897 2.116 (1.219) * (1.219) * Total Labor Expenses 4.431$ 4.431$ 5.601$ (1.170)$ (26.4) (1.170)$ (26.4)
Non-Labor:Electric Power -$ -$ -$ -$ - -$ - Fuel - - - - - - - Insurance - - - - - - - Claims - - - - - - - Paratransit Service Contracts - - - - - - - Maintenance and Other Operating 0.242 0.242 - 0.242 100.0 0.242 100.0Professional Service Contracts - - - - - - - Materials & Supplies 0.881 0.881 - 0.881 100.0 0.881 100.0Other Business Expenses - - - - - - - Total Non-Labor Expenses 1.123$ 1.123$ -$ 1.123$ 100.0 1.123$ 100.0
Other Expense Adjustments:Other -$ -$ -$ -$ - -$ - Total Other Expense Adjustmen - - - - - - -
Total Expenses Before Deprecia 5.554$ 5.554$ 5.601$ (0.047)$ (0.8) (0.047)$ (0.8)
Depreciation -$ -$ -$ -$ - -$ - OPEB Obligation - - - - - - - GASB 68 Pension Expense Adjust - - - Environmental Remediation - - - - - - -
Total Expenses 5.554$ 5.554$ 5.601$ (0.047)$ (0.8) (0.047)$ (0.8)
Net Surplus/(Deficit) -$ -$ -$ -$ - -$ -
*Totals may not add due to rounding
MTA BUS COMPANY
Adopted Budget
REIMBURSABLE
November Forecast
Favorable/(Unfavorable) Variance2020
($ in millions)
Accrual Statement of Operations by Category2020 Adopted Budget and November Forecast vs. Preliminary Actual
Master Page # 140 of 228 - New York City Transit and Bus Committee Meeting 1/21/2021________________________________________________________________________________
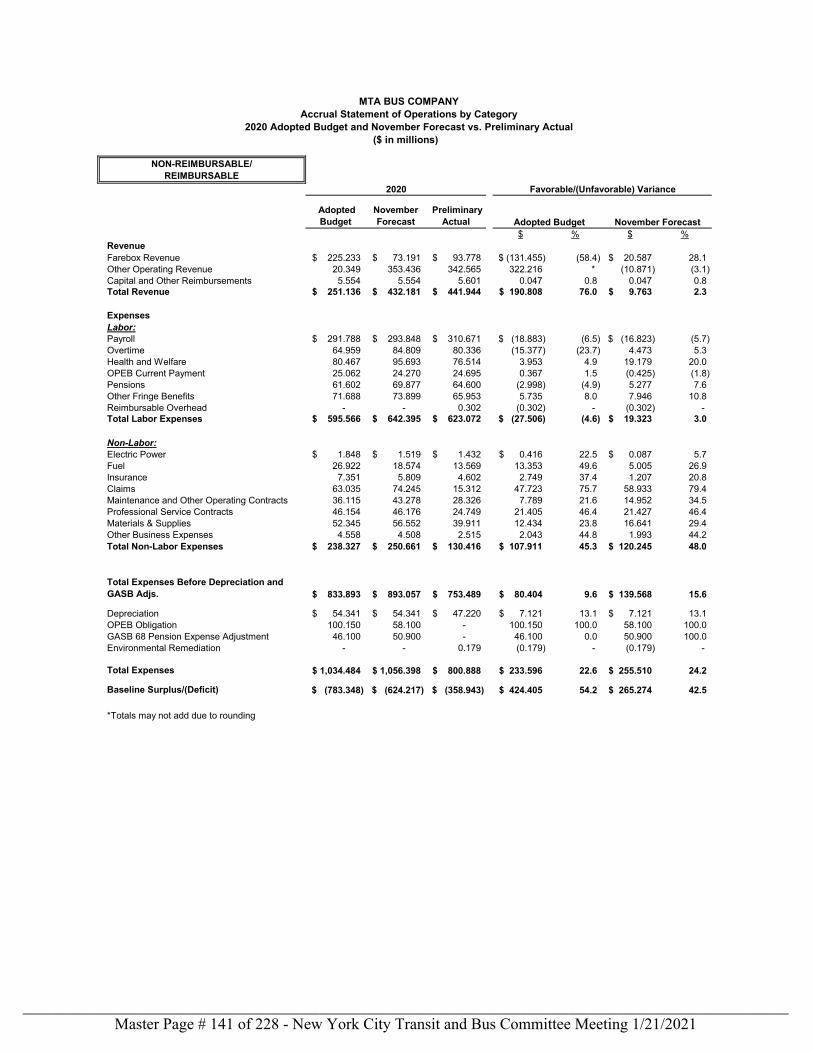
Adopted Budget
November Forecast
Preliminary Actual
$ % $ %RevenueFarebox Revenue 225.233$ 73.191$ 93.778$ (131.455)$ (58.4) 20.587$ 28.1Other Operating Revenue 20.349 353.436 342.565 322.216 * (10.871) (3.1)Capital and Other Reimbursements 5.554 5.554 5.601 0.047 0.8 0.047 0.8Total Revenue 251.136$ 432.181$ 441.944$ 190.808$ 76.0 9.763$ 2.3
ExpensesLabor:Payroll 291.788$ 293.848$ 310.671$ (18.883)$ (6.5) (16.823)$ (5.7)Overtime 64.959 84.809 80.336 (15.377) (23.7) 4.473 5.3Health and Welfare 80.467 95.693 76.514 3.953 4.9 19.179 20.0OPEB Current Payment 25.062 24.270 24.695 0.367 1.5 (0.425) (1.8)Pensions 61.602 69.877 64.600 (2.998) (4.9) 5.277 7.6Other Fringe Benefits 71.688 73.899 65.953 5.735 8.0 7.946 10.8Reimbursable Overhead - - 0.302 (0.302) - (0.302) - Total Labor Expenses 595.566$ 642.395$ 623.072$ (27.506)$ (4.6) 19.323$ 3.0
Non-Labor:Electric Power 1.848$ 1.519$ 1.432$ 0.416$ 22.5 0.087$ 5.7Fuel 26.922 18.574 13.569 13.353 49.6 5.005 26.9Insurance 7.351 5.809 4.602 2.749 37.4 1.207 20.8Claims 63.035 74.245 15.312 47.723 75.7 58.933 79.4Maintenance and Other Operating Contracts 36.115 43.278 28.326 7.789 21.6 14.952 34.5Professional Service Contracts 46.154 46.176 24.749 21.405 46.4 21.427 46.4Materials & Supplies 52.345 56.552 39.911 12.434 23.8 16.641 29.4Other Business Expenses 4.558 4.508 2.515 2.043 44.8 1.993 44.2Total Non-Labor Expenses 238.327$ 250.661$ 130.416$ 107.911$ 45.3 120.245$ 48.0
Total Expenses Before Depreciation and GASB Adjs. 833.893$ 893.057$ 753.489$ 80.404$ 9.6 139.568$ 15.6
Depreciation 54.341$ 54.341$ 47.220$ 7.121$ 13.1 7.121$ 13.1OPEB Obligation 100.150 58.100 - 100.150 100.0 58.100 100.0GASB 68 Pension Expense Adjustment 46.100 50.900 - 46.100 0.0 50.900 100.0Environmental Remediation - - 0.179 (0.179) - (0.179) -
Total Expenses 1,034.484$ 1,056.398$ 800.888$ 233.596$ 22.6 255.510$ 24.2
Baseline Surplus/(Deficit) (783.348)$ (624.217)$ (358.943)$ 424.405$ 54.2 265.274$ 42.5
*Totals may not add due to rounding(783.348) (624.215) (358.941) 424.408 $54.2 265.274 $42.5
MTA BUS COMPANY
November Forecast Adopted Budget
NON-REIMBURSABLE/REIMBURSABLE
2020 Favorable/(Unfavorable) Variance
($ in millions)
Accrual Statement of Operations by Category2020 Adopted Budget and November Forecast vs. Preliminary Actual
Master Page # 141 of 228 - New York City Transit and Bus Committee Meeting 1/21/2021________________________________________________________________________________
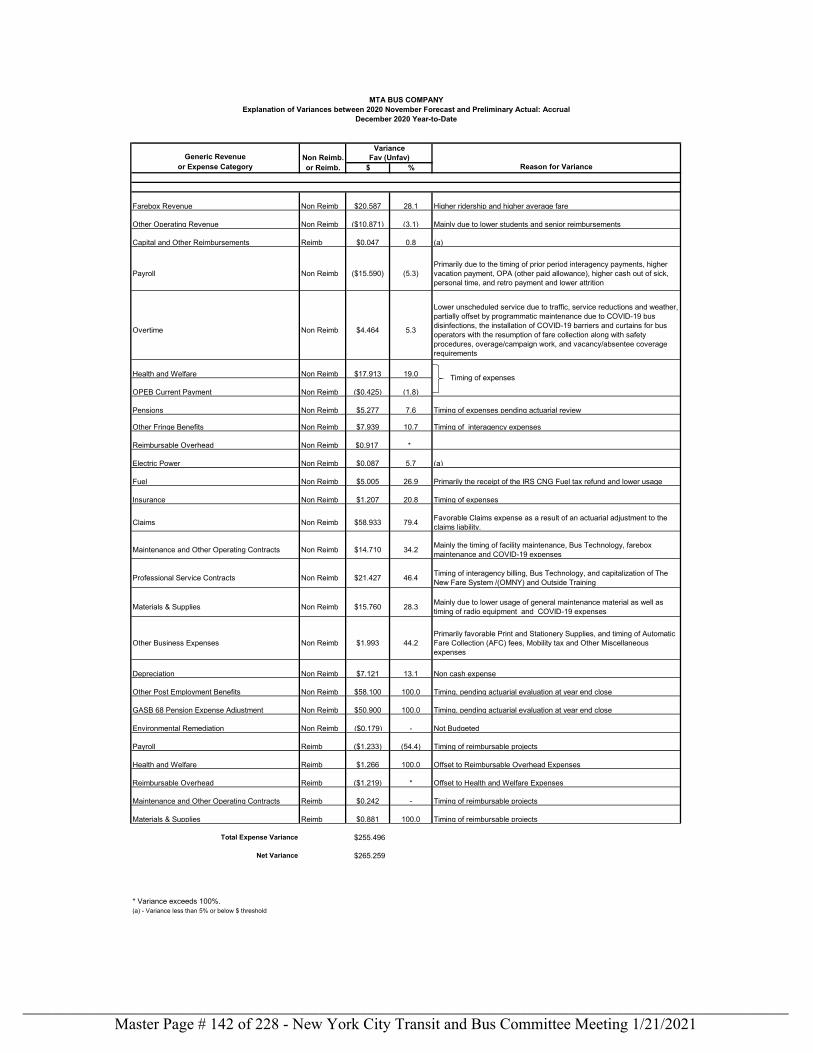
Generic Revenue Non Reimb.or Expense Category or Reimb. $ % Reason for Variance
Farebox Revenue Non Reimb $20.587 28.1 Higher ridership and higher average fare
Other Operating Revenue Non Reimb ($10.871) (3.1) Mainly due to lower students and senior reimbursements
Capital and Other Reimbursements Reimb $0.047 0.8 (a)
Payroll Non Reimb ($15.590) (5.3)Primarily due to the timing of prior period interagency payments, higher vacation payment, OPA (other paid allowance), higher cash out of sick, personal time, and retro payment and lower attrition
Overtime Non Reimb $4.464 5.3
Lower unscheduled service due to traffic, service reductions and weather, partially offset by programmatic maintenance due to COVID-19 bus disinfections, the installation of COVID-19 barriers and curtains for bus operators with the resumption of fare collection along with safety procedures, overage/campaign work, and vacancy/absentee coverage requirements
Health and Welfare Non Reimb $17.913 19.0
OPEB Current Payment Non Reimb ($0.425) (1.8)
Pensions Non Reimb $5.277 7.6 Timing of expenses pending actuarial review
Other Fringe Benefits Non Reimb $7.939 10.7 Timing of interagency expenses
Reimbursable Overhead Non Reimb $0.917 *
Electric Power Non Reimb $0.087 5.7 (a)
Fuel Non Reimb $5.005 26.9 Primarily the receipt of the IRS CNG Fuel tax refund and lower usage
Insurance Non Reimb $1.207 20.8 Timing of expenses
Claims Non Reimb $58.933 79.4 Favorable Claims expense as a result of an actuarial adjustment to the claims liability.
Maintenance and Other Operating Contracts Non Reimb $14.710 34.2 Mainly the timing of facility maintenance, Bus Technology, farebox maintenance and COVID-19 expenses
Professional Service Contracts Non Reimb $21.427 46.4 Timing of interagency billing, Bus Technology, and capitalization of The New Fare System /(OMNY) and Outside Training
Materials & Supplies Non Reimb $15.760 28.3 Mainly due to lower usage of general maintenance material as well as timing of radio equipment and COVID-19 expenses
Other Business Expenses Non Reimb $1.993 44.2 Primarily favorable Print and Stationery Supplies, and timing of Automatic Fare Collection (AFC) fees, Mobility tax and Other Miscellaneous expenses
Depreciation Non Reimb $7.121 13.1 Non cash expense
Other Post Employment Benefits Non Reimb $58.100 100.0 Timing, pending actuarial evaluation at year end close
GASB 68 Pension Expense Adjustment Non Reimb $50.900 100.0 Timing, pending actuarial evaluation at year end close
Environmental Remediation Non Reimb ($0.179) - Not Budgeted
Payroll Reimb ($1.233) (54.4) Timing of reimbursable projects
Health and Welfare Reimb $1.266 100.0 Offset to Reimbursable Overhead Expenses
Reimbursable Overhead Reimb ($1.219) * Offset to Health and Welfare Expenses
Maintenance and Other Operating Contracts Reimb $0.242 - Timing of reimbursable projects
Materials & Supplies Reimb $0.881 100.0 Timing of reimbursable projects
Total Expense Variance $255.496
Net Variance $265.259
* Variance exceeds 100%.(a) - Variance less than 5% or below $ threshold
Timing of expenses
MTA BUS COMPANYExplanation of Variances between 2020 November Forecast and Preliminary Actual: Accrual
VarianceFav (Unfav)
December 2020 Year-to-Date
Master Page # 142 of 228 - New York City Transit and Bus Committee Meeting 1/21/2021________________________________________________________________________________
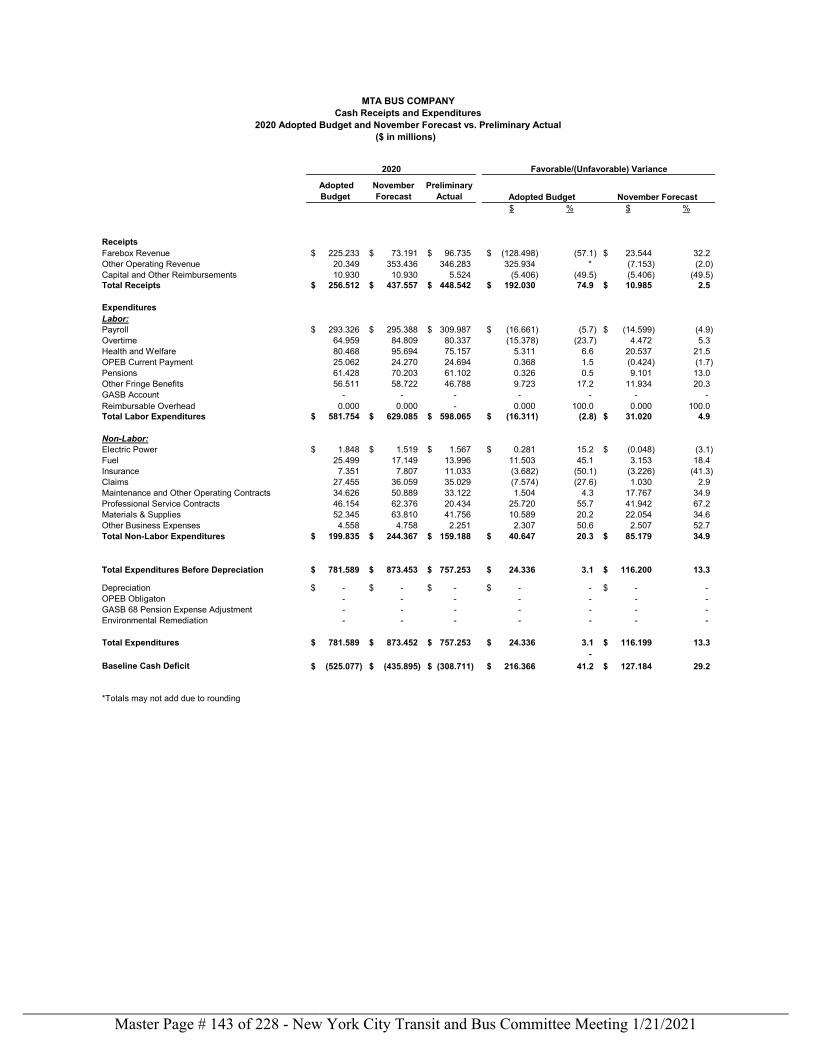
Adopted Budget
November Forecast
Preliminary Actual
$ % $ %
ReceiptsFarebox Revenue 225.233$ 73.191$ 96.735$ (128.498)$ (57.1) 23.544$ 32.2Other Operating Revenue 20.349 353.436 346.283 325.934 * (7.153) (2.0)Capital and Other Reimbursements 10.930 10.930 5.524 (5.406) (49.5) (5.406) (49.5)Total Receipts 256.512$ 437.557$ 448.542$ 192.030$ 74.9 10.985$ 2.5
ExpendituresLabor:Payroll 293.326$ 295.388$ 309.987$ (16.661)$ (5.7) (14.599)$ (4.9)Overtime 64.959 84.809 80.337 (15.378) (23.7) 4.472 5.3Health and Welfare 80.468 95.694 75.157 5.311 6.6 20.537 21.5OPEB Current Payment 25.062 24.270 24.694 0.368 1.5 (0.424) (1.7)Pensions 61.428 70.203 61.102 0.326 0.5 9.101 13.0Other Fringe Benefits 56.511 58.722 46.788 9.723 17.2 11.934 20.3GASB Account - - - - - - - Reimbursable Overhead 0.000 0.000 - 0.000 100.0 0.000 100.0Total Labor Expenditures 581.754$ 629.085$ 598.065$ (16.311)$ (2.8) 31.020$ 4.9
Non-Labor:Electric Power 1.848$ 1.519$ 1.567$ 0.281$ 15.2 (0.048)$ (3.1)Fuel 25.499 17.149 13.996 11.503 45.1 3.153 18.4Insurance 7.351 7.807 11.033 (3.682) (50.1) (3.226) (41.3)Claims 27.455 36.059 35.029 (7.574) (27.6) 1.030 2.9Maintenance and Other Operating Contracts 34.626 50.889 33.122 1.504 4.3 17.767 34.9Professional Service Contracts 46.154 62.376 20.434 25.720 55.7 41.942 67.2Materials & Supplies 52.345 63.810 41.756 10.589 20.2 22.054 34.6Other Business Expenses 4.558 4.758 2.251 2.307 50.6 2.507 52.7Total Non-Labor Expenditures 199.835$ 244.367$ 159.188$ 40.647$ 20.3 85.179$ 34.9
Total Expenditures Before Depreciation 781.589$ 873.453$ 757.253$ 24.336$ 3.1 116.200$ 13.3
Depreciation -$ -$ -$ -$ - -$ - OPEB Obligaton - - - - - - - GASB 68 Pension Expense Adjustment - - - - - - - Environmental Remediation - - - - - - -
Total Expenditures 781.589$ 873.452$ 757.253$ 24.336$ 3.1 116.199$ 13.3-
Baseline Cash Deficit (525.077)$ (435.895)$ (308.711)$ 216.366$ 41.2 127.184$ 29.2
*Totals may not add due to rounding
Cash Receipts and Expenditures2020 Adopted Budget and November Forecast vs. Preliminary Actual
MTA BUS COMPANY
Adopted Budget November Forecast
($ in millions)
2020 Favorable/(Unfavorable) Variance
Master Page # 143 of 228 - New York City Transit and Bus Committee Meeting 1/21/2021________________________________________________________________________________
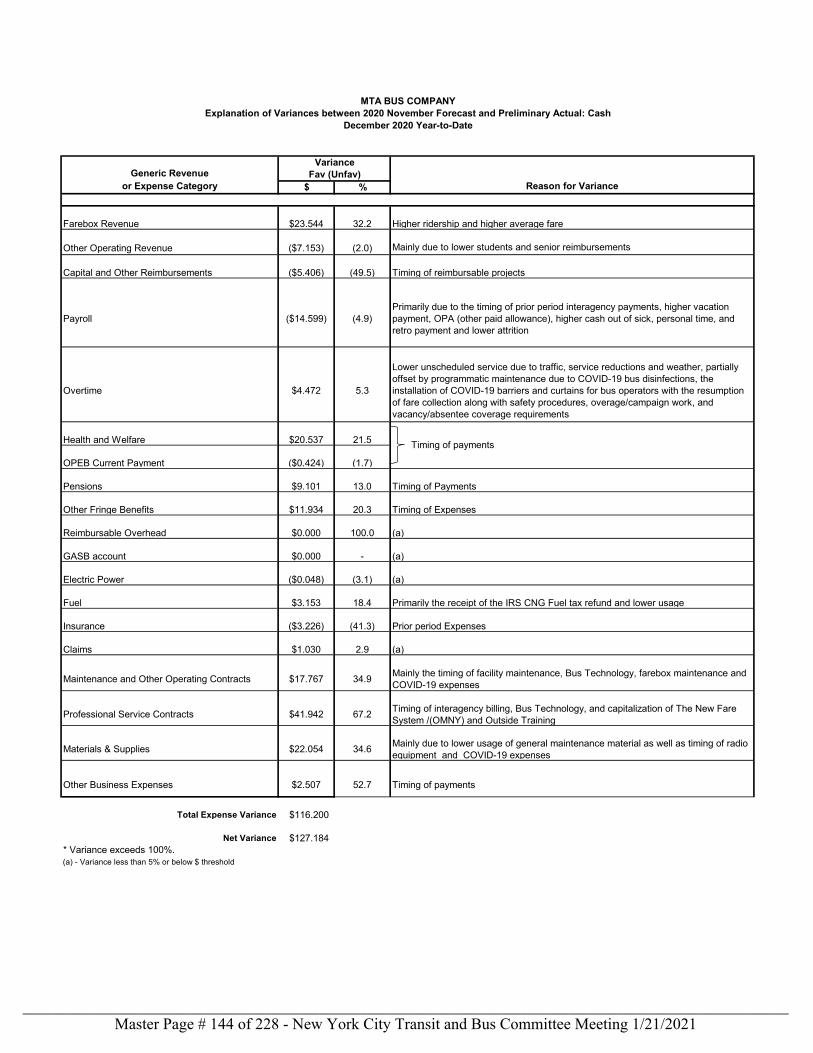
Generic Revenueor Expense Category $ % Reason for Variance
Farebox Revenue $23.544 32.2 Higher ridership and higher average fare
Other Operating Revenue ($7.153) (2.0) Mainly due to lower students and senior reimbursements
Capital and Other Reimbursements ($5.406) (49.5) Timing of reimbursable projects
Payroll ($14.599) (4.9)Primarily due to the timing of prior period interagency payments, higher vacation payment, OPA (other paid allowance), higher cash out of sick, personal time, and retro payment and lower attrition
Overtime $4.472 5.3
Lower unscheduled service due to traffic, service reductions and weather, partially offset by programmatic maintenance due to COVID-19 bus disinfections, the installation of COVID-19 barriers and curtains for bus operators with the resumption of fare collection along with safety procedures, overage/campaign work, and vacancy/absentee coverage requirements
Health and Welfare $20.537 21.5
OPEB Current Payment ($0.424) (1.7)
Pensions $9.101 13.0 Timing of Payments
Other Fringe Benefits $11.934 20.3 Timing of Expenses
Reimbursable Overhead $0.000 100.0 (a)
GASB account $0.000 - (a)
Electric Power ($0.048) (3.1) (a)
Fuel $3.153 18.4 Primarily the receipt of the IRS CNG Fuel tax refund and lower usage
Insurance ($3.226) (41.3) Prior period Expenses
Claims $1.030 2.9 (a)
Maintenance and Other Operating Contracts $17.767 34.9 Mainly the timing of facility maintenance, Bus Technology, farebox maintenance and COVID-19 expenses
Professional Service Contracts $41.942 67.2 Timing of interagency billing, Bus Technology, and capitalization of The New Fare System /(OMNY) and Outside Training
Materials & Supplies $22.054 34.6 Mainly due to lower usage of general maintenance material as well as timing of radio equipment and COVID-19 expenses
Other Business Expenses $2.507 52.7 Timing of payments
Total Expense Variance $116.200
Net Variance $127.184* Variance exceeds 100%.(a) - Variance less than 5% or below $ threshold
Timing of payments
MTA BUS COMPANY
December 2020 Year-to-Date
VarianceFav (Unfav)
Explanation of Variances between 2020 November Forecast and Preliminary Actual: Cash
Master Page # 144 of 228 - New York City Transit and Bus Committee Meeting 1/21/2021________________________________________________________________________________
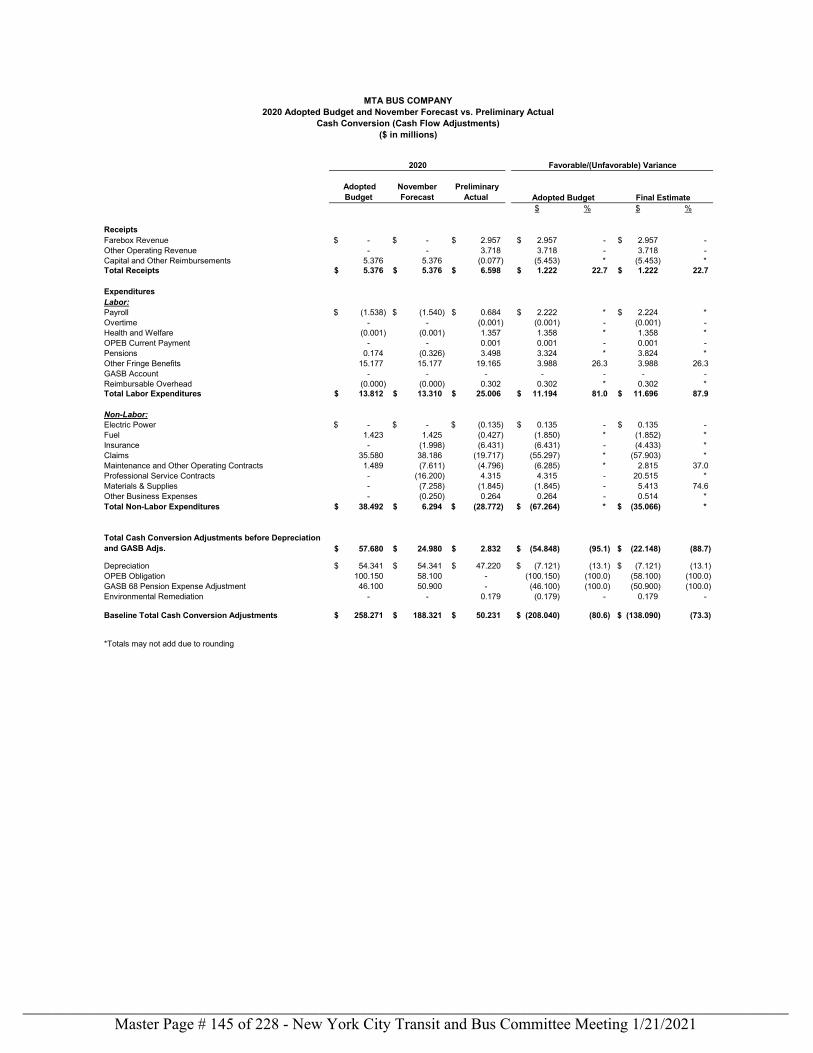
Adopted Budget
November Forecast
Preliminary Actual
$ % $ %
ReceiptsFarebox Revenue -$ -$ 2.957$ 2.957$ - 2.957$ - Other Operating Revenue - - 3.718 3.718 - 3.718 - Capital and Other Reimbursements 5.376 5.376 (0.077) (5.453) * (5.453) * Total Receipts 5.376$ 5.376$ 6.598$ 1.222$ 22.7 1.222$ 22.7
ExpendituresLabor:Payroll (1.538)$ (1.540)$ 0.684$ 2.222$ * 2.224$ * Overtime - - (0.001) (0.001) - (0.001) - Health and Welfare (0.001) (0.001) 1.357 1.358 * 1.358 * OPEB Current Payment - - 0.001 0.001 - 0.001 - Pensions 0.174 (0.326) 3.498 3.324 * 3.824 * Other Fringe Benefits 15.177 15.177 19.165 3.988 26.3 3.988 26.3GASB Account - - - - - - - Reimbursable Overhead (0.000) (0.000) 0.302 0.302 * 0.302 * Total Labor Expenditures 13.812$ 13.310$ 25.006$ 11.194$ 81.0 11.696$ 87.9
Non-Labor:Electric Power -$ -$ (0.135)$ 0.135$ - 0.135$ - Fuel 1.423 1.425 (0.427) (1.850) * (1.852) * Insurance - (1.998) (6.431) (6.431) - (4.433) * Claims 35.580 38.186 (19.717) (55.297) * (57.903) * Maintenance and Other Operating Contracts 1.489 (7.611) (4.796) (6.285) * 2.815 37.0Professional Service Contracts - (16.200) 4.315 4.315 - 20.515 * Materials & Supplies - (7.258) (1.845) (1.845) - 5.413 74.6Other Business Expenses - (0.250) 0.264 0.264 - 0.514 * Total Non-Labor Expenditures 38.492$ 6.294$ (28.772)$ (67.264)$ * (35.066)$ *
Total Cash Conversion Adjustments before Depreciation and GASB Adjs. 57.680$ 24.980$ 2.832$ (54.848)$ (95.1) (22.148)$ (88.7)
Depreciation 54.341$ 54.341$ 47.220$ (7.121)$ (13.1) (7.121)$ (13.1)OPEB Obligation 100.150 58.100 - (100.150) (100.0) (58.100) (100.0)GASB 68 Pension Expense Adjustment 46.100 50.900 - (46.100) (100.0) (50.900) (100.0)Environmental Remediation - - 0.179 (0.179) - 0.179 -
Baseline Total Cash Conversion Adjustments 258.271$ 188.321$ 50.231$ (208.040)$ (80.6) (138.090)$ (73.3)
*Totals may not add due to rounding
MTA BUS COMPANY
($ in millions)
Adopted Budget Final Estimate
2020 Favorable/(Unfavorable) Variance
2020 Adopted Budget and November Forecast vs. Preliminary ActualCash Conversion (Cash Flow Adjustments)
Master Page # 145 of 228 - New York City Transit and Bus Committee Meeting 1/21/2021________________________________________________________________________________
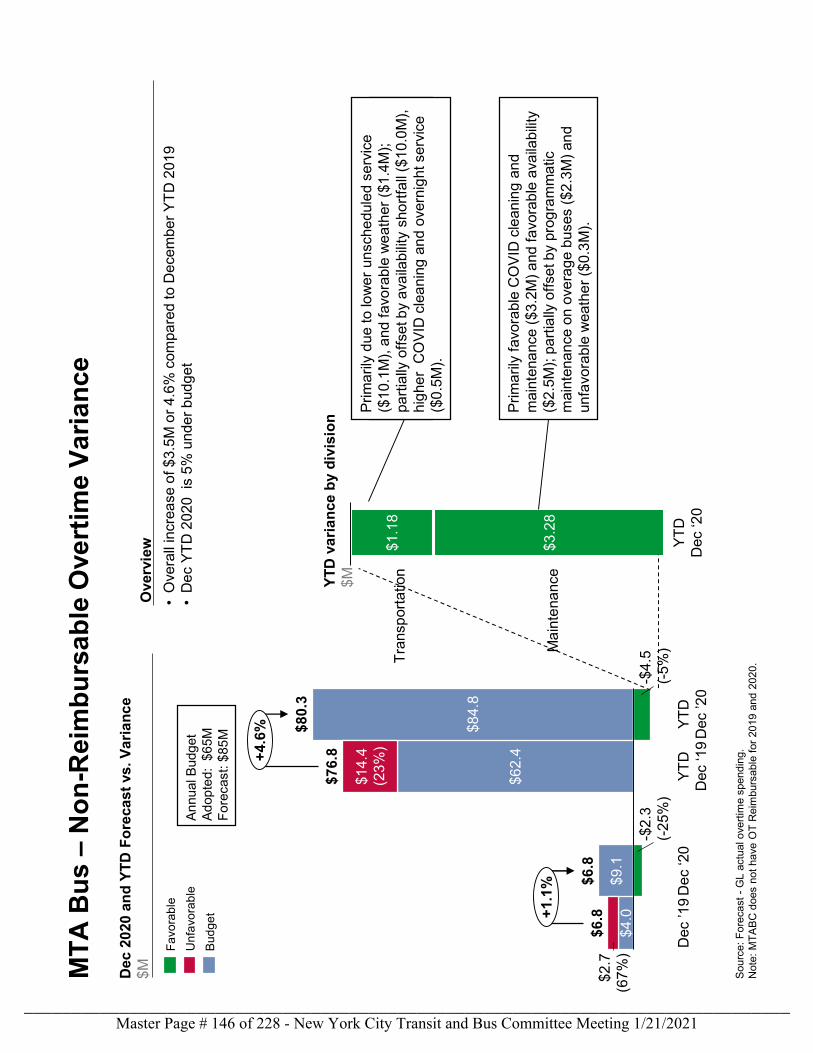
MT
A B
us
–N
on
-Rei
mb
urs
ab
le O
vert
ime
Va
ria
nce
Sou
rce:
Fo
reca
st -
GL
act
ual
ove
rtim
e sp
end
ing.
Not
e: M
TA
BC
doe
s no
t ha
ve O
T R
eim
burs
able
for
20
19 a
nd 2
020.
. Dec
20
20 a
nd
YT
D F
ore
cast
vs. V
ari
an
ce
$M
YT
D v
ari
an
ce b
y d
ivis
ion
$M
Pri
ma
rily
favo
rabl
e u
nsch
edu
led
over
time
($7
.1M
), lo
wer
Bu
s O
per
ator
s h
ired
for
CO
VID
-19
•O
vera
ll in
crea
se o
f $3.
5M
or
4.6
% c
ompa
red
to D
ece
mbe
r Y
TD
201
9•
De
c Y
TD
202
0 i
s 5
% u
nde
r b
udg
et
Ove
rvie
w
$4.0
$9.1
$62.
4
$84.
8
$6.8
-$2
.3(-
25%
)
$2.7
(67
%)
$76.
8
YT
D
Dec
‘19
YT
D
Dec
’20
$14.
4(2
3%
)
Dec
’19
De
c ‘2
0
-$4
.5(-
5%
)
$6.8
$80.
3
+1.
1%
+4.
6%
Fa
vora
ble
Un
favo
rab
le
Bu
dg
et
$3.2
8
$1.1
8
YT
D
Dec
‘20
Ma
inte
nanc
e
Tra
nsp
orta
tion
An
nual
Bud
get
Ad
opte
d: $
65M
F
ore
cast
: $85
M
Pri
ma
rily
favo
rabl
e C
OV
ID c
lean
ing
an
d m
aint
ena
nce
($3
.2M
) a
nd f
avo
rab
le a
vaila
bilit
y ($
2.5
M);
pa
rtia
lly o
ffse
t by
prog
ram
ma
tic
mai
nten
anc
e o
n o
vera
ge
bu
ses
($2
.3M
) an
d un
favo
rab
le w
eath
er
($0.
3M
).
Pri
ma
rily
due
to lo
we
r un
sche
dule
d se
rvic
e
($1
0.1
M),
and
fav
ora
ble
we
ath
er (
$1.4
M);
pa
rtia
lly o
ffse
t by
ava
ilabi
lity
sho
rtfa
ll ($
10.
0M
),
hig
her
CO
VID
cle
ani
ng a
nd
over
nig
ht s
erv
ice
($
0.5
M).
Master Page # 146 of 228 - New York City Transit and Bus Committee Meeting 1/21/2021________________________________________________________________________________
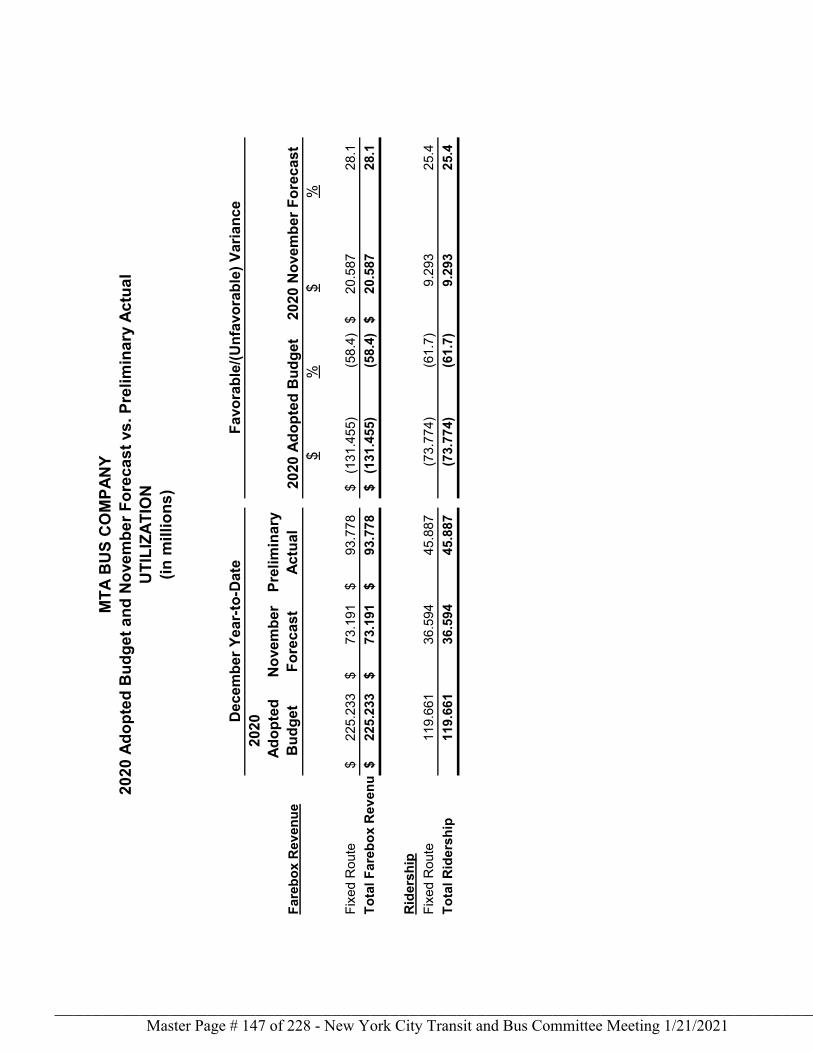
Fare
box
Rev
enue
2020
Ado
pted
B
udge
tN
ovem
ber
Fore
cast
Prel
imin
ary
Actu
al$
%$
%
Fixe
d R
oute
225.
233
$
73
.191
$
93.7
78$
(1
31.4
55)
$
(58.
4)20
.587
$
28
.1To
tal F
areb
ox R
even
u22
5.23
3$
73.1
91$
93
.778
$
(131
.455
)$
(5
8.4)
20.5
87$
28.1
Rid
ersh
ipFi
xed
Rou
te11
9.66
136
.594
45.8
87(7
3.77
4)(6
1.7)
9.29
325
.4To
tal R
ider
ship
119.
661
36.5
9445
.887
(73.
774)
(61.
7)9.
293
25.4
MTA
BU
S C
OM
PAN
Y20
20 A
dopt
ed B
udge
t and
Nov
embe
r For
ecas
t vs.
Pre
limin
ary
Actu
alU
TILI
ZATI
ON
(in m
illio
ns) 20
20 A
dopt
ed B
udge
t20
20 N
ovem
ber F
orec
ast
Dec
embe
r Yea
r-to
-Dat
eFa
vora
ble/
(Unf
avor
able
) Var
ianc
e
Master Page # 147 of 228 - New York City Transit and Bus Committee Meeting 1/21/2021________________________________________________________________________________
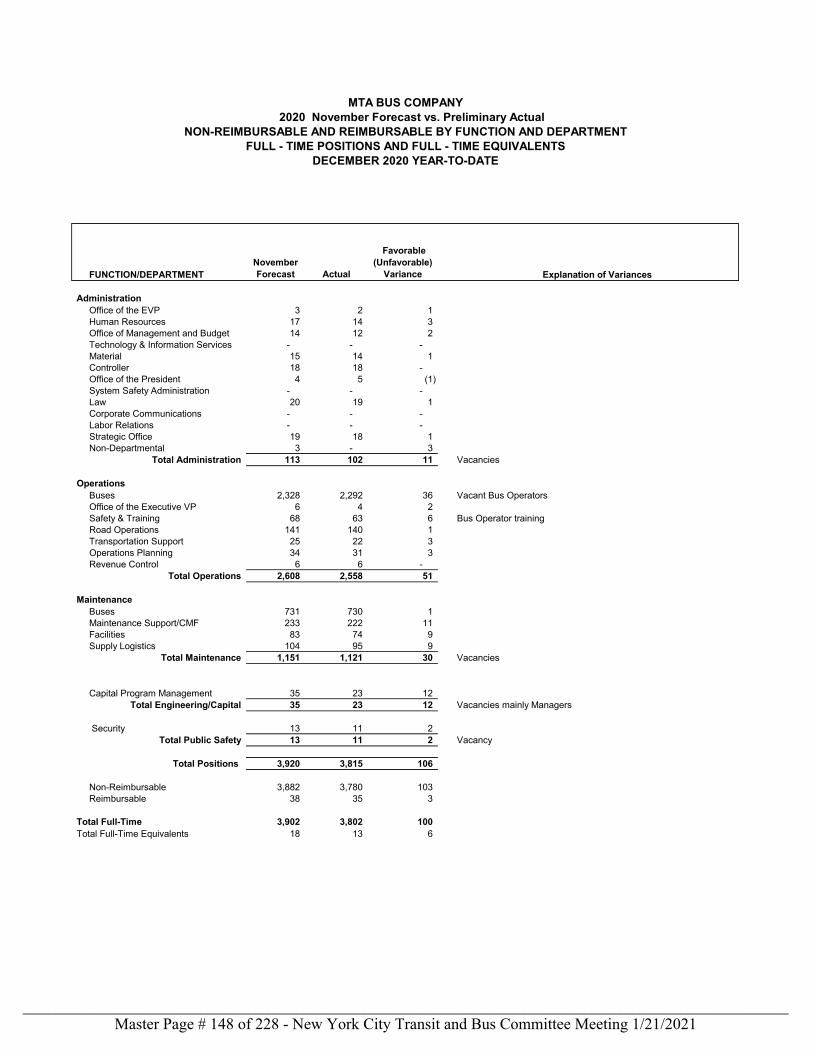
FUNCTION/DEPARTMENTNovember Forecast Actual
Favorable (Unfavorable)
Variance Explanation of Variances
AdministrationOffice of the EVP 3 2 1 Human Resources 17 14 3 Office of Management and Budget 14 12 2 Technology & Information Services - - - Material 15 14 1 Controller 18 18 - Office of the President 4 5 (1) System Safety Administration - - - Law 20 19 1 Corporate Communications - - - Labor Relations - - - Strategic Office 19 18 1 Non-Departmental 3 - 3
Total Administration 113 102 11 Vacancies
OperationsBuses 2,328 2,292 36 Vacant Bus OperatorsOffice of the Executive VP 6 4 2 Safety & Training 68 63 6 Bus Operator training Road Operations 141 140 1 Transportation Support 25 22 3 Operations Planning 34 31 3 Revenue Control 6 6 -
Total Operations 2,608 2,558 51
MaintenanceBuses 731 730 1 Maintenance Support/CMF 233 222 11 Facilities 83 74 9 Supply Logistics 104 95 9
Total Maintenance 1,151 1,121 30 Vacancies
Capital Program Management 35 23 12 Total Engineering/Capital 35 23 12 Vacancies mainly Managers
Security 13 11 2 Total Public Safety 13 11 2 Vacancy
Total Positions 3,920 3,815 106
Non-Reimbursable 3,882 3,780 103 Reimbursable 38 35 3
Total Full-Time 3,902 3,802 100 Total Full-Time Equivalents 18 13 6
MTA BUS COMPANY
NON-REIMBURSABLE AND REIMBURSABLE BY FUNCTION AND DEPARTMENTFULL - TIME POSITIONS AND FULL - TIME EQUIVALENTS
DECEMBER 2020 YEAR-TO-DATE
2020 November Forecast vs. Preliminary Actual
Master Page # 148 of 228 - New York City Transit and Bus Committee Meeting 1/21/2021________________________________________________________________________________
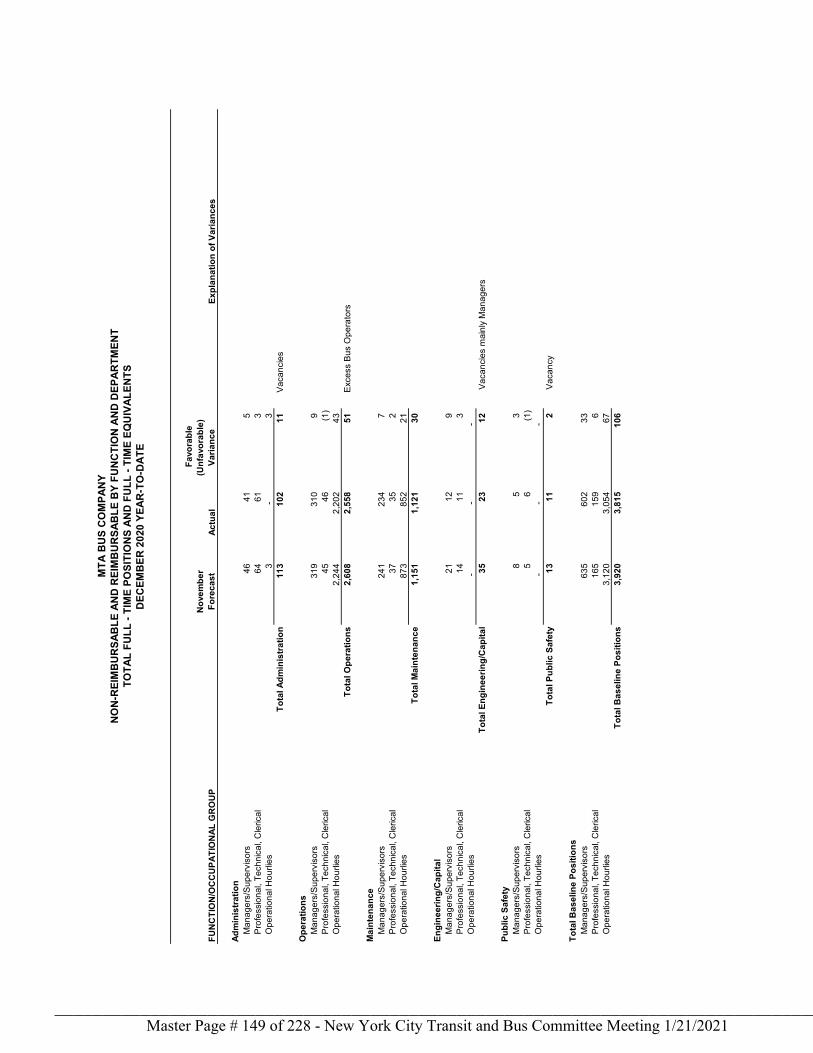
FUN
CTI
ON
/OC
CU
PATI
ON
AL G
RO
UP
Nov
embe
r Fo
reca
stAc
tual
Fav
orab
le
(Unf
avor
able
) Va
rianc
e Ex
plan
atio
n of
Var
ianc
es
Adm
inis
tratio
nM
anag
ers/
Supe
rvis
ors
46
415
Pr
ofes
sion
al, T
echn
ical
, Cle
rical
64
613
O
pera
tiona
l Hou
rlies
3
-
3
To
tal A
dmin
istra
tion
113
102
11
Vaca
ncie
s
Ope
ratio
nsM
anag
ers/
Supe
rvis
ors
319
310
9
Prof
essi
onal
, Tec
hnic
al, C
leric
al45
46(1
)
Ope
ratio
nal H
ourli
es2,
244
2,20
243
To
tal O
pera
tions
2,60
82,
558
51
Exce
ss B
us O
pera
tors
Mai
nten
ance
Man
ager
s/Su
perv
isor
s24
123
47
Pr
ofes
sion
al, T
echn
ical
, Cle
rical
3735
2
Ope
ratio
nal H
ourli
es87
385
221
To
tal M
aint
enan
ce1,
151
1,12
130
Engi
neer
ing/
Cap
ital
Man
ager
s/Su
perv
isor
s21
129
Pr
ofes
sion
al, T
echn
ical
, Cle
rical
1411
3
Ope
ratio
nal H
ourli
es-
-
-
Tota
l Eng
inee
ring/
Cap
ital
3523
12
Vaca
ncie
s m
ainl
y M
anag
ers
Publ
ic S
afet
yM
anag
ers/
Supe
rvis
ors
85
3
Prof
essi
onal
, Tec
hnic
al, C
leric
al5
6(1
)
Ope
ratio
nal H
ourli
es-
-
-
Tota
l Pub
lic S
afet
y13
112
Va
canc
y
Tota
l Bas
elin
e Po
sitio
nsM
anag
ers/
Supe
rvis
ors
635
602
33
Prof
essi
onal
, Tec
hnic
al, C
leric
al16
515
96
O
pera
tiona
l Hou
rlies
3,12
03,
054
67
Tota
l Bas
elin
e Po
sitio
ns3,
920
3,81
510
6
MTA
BU
S C
OM
PAN
YN
ON
-REI
MB
UR
SAB
LE A
ND
REI
MB
UR
SAB
LE B
Y FU
NC
TIO
N A
ND
DEP
ARTM
ENT
TOTA
L FU
LL -
TIM
E PO
SITI
ON
S AN
D F
ULL
- TI
ME
EQU
IVAL
ENTS
DEC
EMB
ER 2
020
YEAR
-TO
-DAT
E
Master Page # 149 of 228 - New York City Transit and Bus Committee Meeting 1/21/2021________________________________________________________________________________
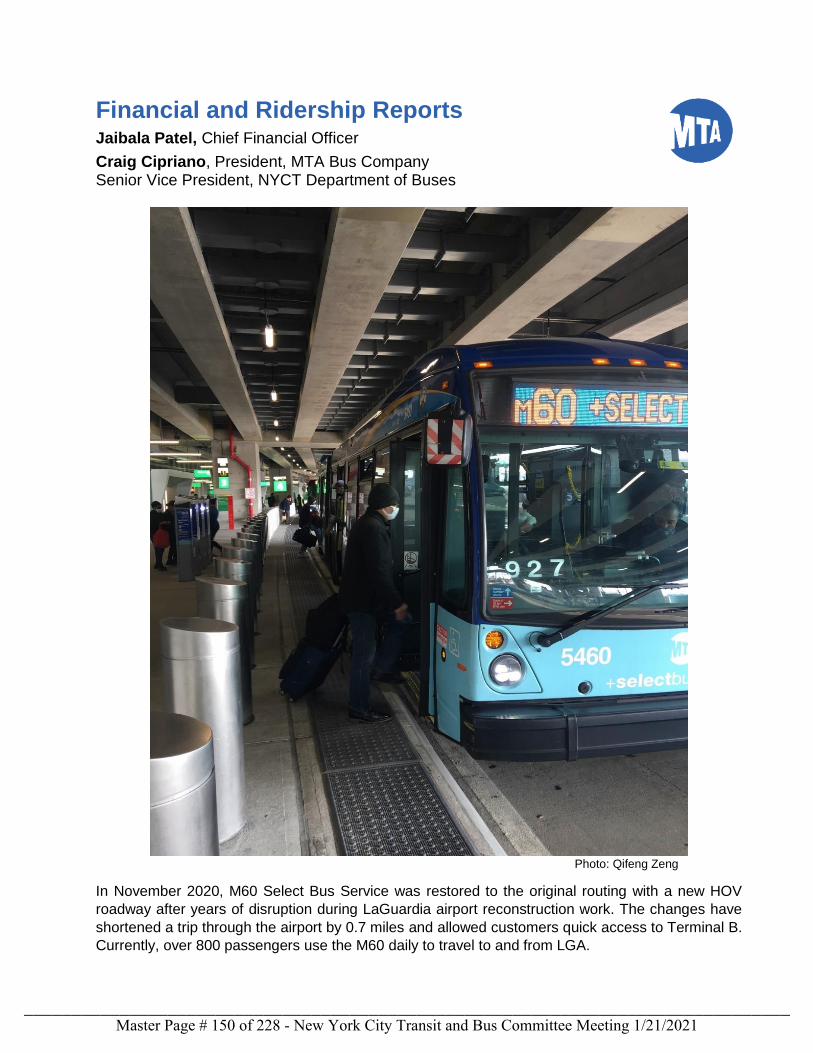
Financial and Ridership Reports Jaibala Patel, Chief Financial Officer
Craig Cipriano, President, MTA Bus Company Senior Vice President, NYCT Department of Buses
Photo: Qifeng Zeng
In November 2020, M60 Select Bus Service was restored to the original routing with a new HOV
roadway after years of disruption during LaGuardia airport reconstruction work. The changes have
shortened a trip through the airport by 0.7 miles and allowed customers quick access to Terminal B.
Currently, over 800 passengers use the M60 daily to travel to and from LGA.
Master Page # 150 of 228 - New York City Transit and Bus Committee Meeting 1/21/2021________________________________________________________________________________
Preliminary November 2020 Monthly Report:
New York City Transit
The purpose of this report is to provide the preliminary November 2020 financial results, on an accrual basis. The accrual basis is presented on a non-reimbursable and reimbursable account basis. These results reflect the new accelerated accounting close and are compared to the Mid-Year Forecast (forecast).
Summary of Preliminary Financial Results
Preliminary ridership and accrual results, versus forecast, are summarized as follows:
• November 2020 New York City Transit ridership of 66.5 million was 24.9 million (59.9 percent)above forecast, of which subway ridership of 43.7 million was 12.3 million (39.5 percent)above forecast, and bus ridership of 22.2 million was 12.5 million (129.3 percent) aboveforecast.
• November 2020 farebox revenue of $141.1 million was $63.5 million (81.9 percent) aboveforecast.
• Other revenue was higher than forecast in November by $4.2 million (12.5 percent), primarilybecause fare reimbursements were over by $1.8 million.
November 2020 operating expenses of $722.2 million were $69.2 million (8.7 percent) less than forecast.
• Labor expenses were under forecast by $12.8 million (2.1 percent), due largely to Payrollexpenses that were favorable by $14.9 million (4.7 percent), and Pension expenses lower by$10.3 million (12.0 percent), partly offset by other fringe benefits that were over forecast by$8.7 million (18.0 percent), and overtime that overran by $4.7 million (8.7 percent).
• Non-labor expenses were favorable to the forecast by $56.4 million (31.9 percent), due mostlyto maintenance and other operating contract expenses favorable by $15.0 million (37.3percent), materials and supplies under by $14.3 million (42.1 percent), professional servicecontracts lower by $11.3 million (77.4 percent), and Paratransit Service Contracts thatunderran by $6.5 million (20.3 percent).
Master Page # 151 of 228 - New York City Transit and Bus Committee Meeting 1/21/2021________________________________________________________________________________
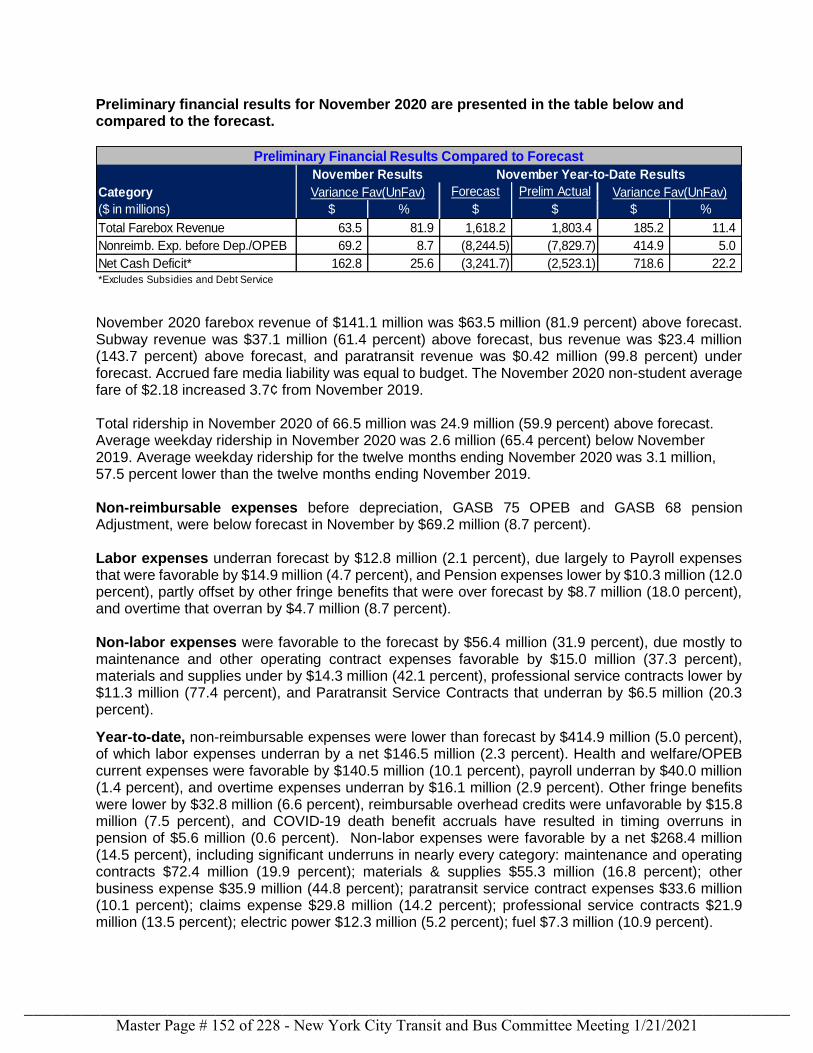
Preliminary financial results for November 2020 are presented in the table below and compared to the forecast.
November 2020 farebox revenue of $141.1 million was $63.5 million (81.9 percent) above forecast. Subway revenue was $37.1 million (61.4 percent) above forecast, bus revenue was $23.4 million (143.7 percent) above forecast, and paratransit revenue was $0.42 million (99.8 percent) under forecast. Accrued fare media liability was equal to budget. The November 2020 non-student average fare of $2.18 increased 3.7¢ from November 2019.
Total ridership in November 2020 of 66.5 million was 24.9 million (59.9 percent) above forecast. Average weekday ridership in November 2020 was 2.6 million (65.4 percent) below November 2019. Average weekday ridership for the twelve months ending November 2020 was 3.1 million, 57.5 percent lower than the twelve months ending November 2019.
Non-reimbursable expenses before depreciation, GASB 75 OPEB and GASB 68 pension Adjustment, were below forecast in November by $69.2 million (8.7 percent).
Labor expenses underran forecast by $12.8 million (2.1 percent), due largely to Payroll expenses that were favorable by $14.9 million (4.7 percent), and Pension expenses lower by $10.3 million (12.0 percent), partly offset by other fringe benefits that were over forecast by $8.7 million (18.0 percent), and overtime that overran by $4.7 million (8.7 percent).
Non-labor expenses were favorable to the forecast by $56.4 million (31.9 percent), due mostly to maintenance and other operating contract expenses favorable by $15.0 million (37.3 percent), materials and supplies under by $14.3 million (42.1 percent), professional service contracts lower by $11.3 million (77.4 percent), and Paratransit Service Contracts that underran by $6.5 million (20.3 percent).
Year-to-date, non-reimbursable expenses were lower than forecast by $414.9 million (5.0 percent), of which labor expenses underran by a net $146.5 million (2.3 percent). Health and welfare/OPEB current expenses were favorable by $140.5 million (10.1 percent), payroll underran by $40.0 million (1.4 percent), and overtime expenses underran by $16.1 million (2.9 percent). Other fringe benefits were lower by $32.8 million (6.6 percent), reimbursable overhead credits were unfavorable by $15.8 million (7.5 percent), and COVID-19 death benefit accruals have resulted in timing overruns in pension of $5.6 million (0.6 percent). Non-labor expenses were favorable by a net $268.4 million (14.5 percent), including significant underruns in nearly every category: maintenance and operating contracts $72.4 million (19.9 percent); materials & supplies $55.3 million (16.8 percent); other business expense $35.9 million (44.8 percent); paratransit service contract expenses $33.6 million (10.1 percent); claims expense $29.8 million (14.2 percent); professional service contracts $21.9 million (13.5 percent); electric power $12.3 million (5.2 percent); fuel $7.3 million (10.9 percent).
Category Forecast Prelim Actual
($ in millions) $ % $ $ $ %
Total Farebox Revenue 63.5 81.9 1,618.2 1,803.4 185.2 11.4
Nonreimb. Exp. before Dep./OPEB 69.2 8.7 (8,244.5) (7,829.7) 414.9 5.0
Net Cash Deficit* 162.8 25.6 (3,241.7) (2,523.1) 718.6 22.2*Excludes Subsidies and Debt Service
November Results
Variance Fav(UnFav)
Preliminary Financial Results Compared to Forecast
November Year-to-Date Results
Variance Fav(UnFav)
Master Page # 152 of 228 - New York City Transit and Bus Committee Meeting 1/21/2021________________________________________________________________________________
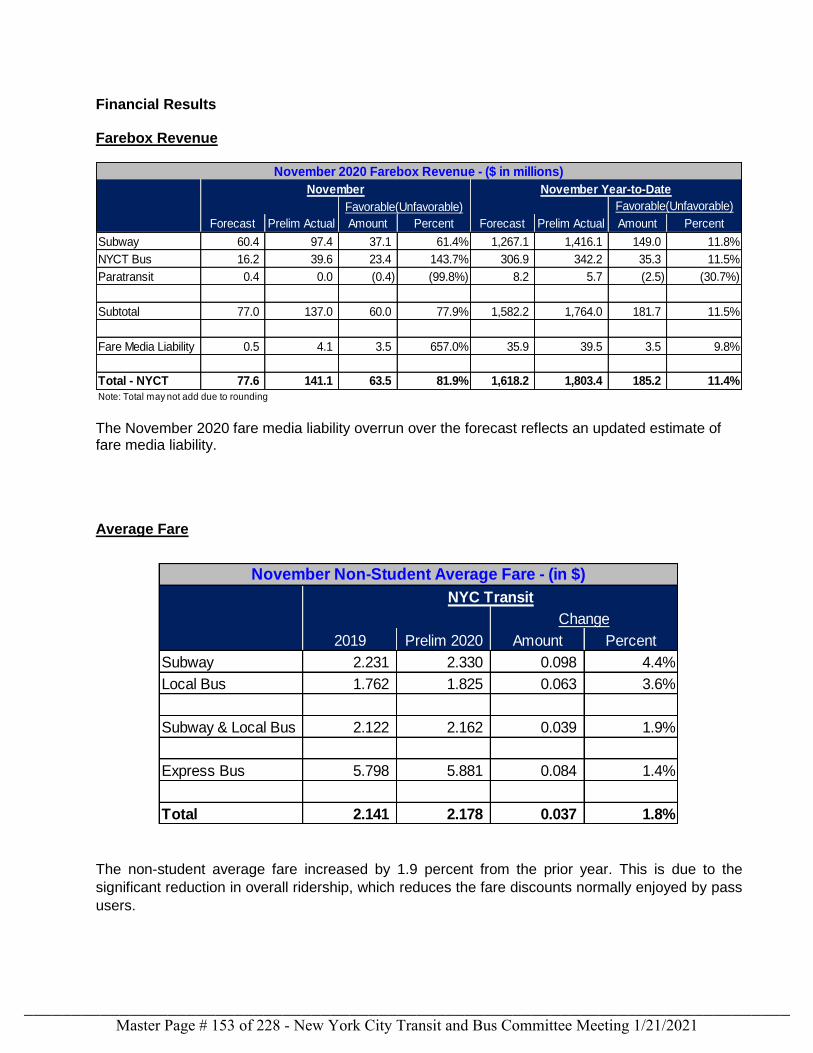
Financial Results Farebox Revenue
The November 2020 fare media liability overrun over the forecast reflects an updated estimate of fare media liability. Average Fare
The non-student average fare increased by 1.9 percent from the prior year. This is due to the
significant reduction in overall ridership, which reduces the fare discounts normally enjoyed by pass
users.
Forecast Prelim Actual Amount Percent Forecast Prelim Actual Amount Percent
Subway 60.4 97.4 37.1 61.4% 1,267.1 1,416.1 149.0 11.8%
NYCT Bus 16.2 39.6 23.4 143.7% 306.9 342.2 35.3 11.5%
Paratransit 0.4 0.0 (0.4) (99.8%) 8.2 5.7 (2.5) (30.7%)
Subtotal 77.0 137.0 60.0 77.9% 1,582.2 1,764.0 181.7 11.5%
Fare Media Liability 0.5 4.1 3.5 657.0% 35.9 39.5 3.5 9.8%
Total - NYCT 77.6 141.1 63.5 81.9% 1,618.2 1,803.4 185.2 11.4%
Note: Total may not add due to rounding
November 2020 Farebox Revenue - ($ in millions)
November November Year-to-Date
Favorable(Unfavorable) Favorable(Unfavorable)
NYC Transit
Change
2019 Prelim 2020 Amount Percent
Subway 2.231 2.330 0.098 4.4%
Local Bus 1.762 1.825 0.063 3.6%
Subway & Local Bus 2.122 2.162 0.039 1.9%
Express Bus 5.798 5.881 0.084 1.4%
Total 2.141 2.178 0.037 1.8%
November Non-Student Average Fare - (in $)
Master Page # 153 of 228 - New York City Transit and Bus Committee Meeting 1/21/2021________________________________________________________________________________
Non-reimbursable Expenses
Non-reimbursable expenses, before depreciation, GASB 75 OPEB and GASB 68 Pension Adjustment, were under forecast in the month of November by $69.2 million (8.7 percent).
Labor expenses underran forecast by a net $12.8 million (2.1 percent):
• Payroll expenses were lower than forecast by $14.9 million (4.7 percent), reflecting vacancies
and favorable timing of miscellaneous payments
• Pension was favorable to forecast by $10.3 million (12.0 percent), resulting from favorable
timing of COVID-19 death benefit charges
• Other fringe benefits were unfavorable by $8.7 million (18.0 percent), mainly due to an
increased workers compensation liability accrual estimate
• Overtime expenses exceeded forecast by a net $4.7 million (8.7 percent), primarily due tobackfill of increasing employee vacancies and unavailability
Non-labor expenses were below forecast by $56.4 million (31.9 percent):
• Maintenance and other operating contract expenses were lower by $15.0 million (37.3
percent), primarily resulting from SAP initiative underruns due to COVID-19 constraints
• Materials and supplies were favorable by $13.3 million (42.1 percent), resulting from reduced
maintenance activity due to COVID-19 rescheduling of SMS program work
• Professional service contracts were favorable by $11.3 million (77.4 percent), primarily due to
MTA services accrual correction
• Paratransit service contracts underran by $6.5 million (20.3 percent), largely due to reduced
trips
Year to date, non-reimbursable expenses before depreciation, GASB 75 OPEB and GASB 68 Pension Adjustment were lower than forecast by $414.9 million (5.0 percent).
Labor expenses were lower than forecast by a net $146.5 million (2.3 percent):
• Health and welfare/OPEB current expenses underran by $140.5 million (10.1 percent),
resulting from favorable rates due to prescription drug contract rebates, lower medical
utilization, and vacancy savings
• Payroll was favorable by $44.0 million (1.4 percent), primarily due to vacancy underruns and
favorable timing of miscellaneous payments, partly offset by RMB project underruns and an
unbudgeted holiday
• Overtime expenses underran by $16.1 million (2.9 percent), mainly due to backfill of
increasing employee vacancies and unavailability
• Other fringe benefits were unfavorable by $32.8 million (6.6 percent), due primarily to a major
reduction in capital project support requirements and higher workers compensation expense
• Reimbursable overhead credits were unfavorable by $15.8 million (7.5 percent), due primarily
to a major reduction in capital project support requirements
• Pension expenses were higher by $5.6 million (0.6 percent), due mainly to unfavorable timing
of COVID-19 death benefit accruals
Master Page # 154 of 228 - New York City Transit and Bus Committee Meeting 1/21/2021________________________________________________________________________________
Non-labor expenses were favorable by a net $268.4 million (14.5 percent):
• Maintenance and other operating contract expenses were lower by $72.4 million (19.9
percent), primarily due to deferral of the station deep cleaning and other SAP initiatives due
to COVID-19 constraints
• Materials and supplies underran by $55.3 million (16.8 percent), largely due to reduced
maintenance activity resulting from COVID-19 and rescheduling of SMS program work
• Other business expenses were lower by $35.9 million (44.8 percent), due to Capital
Engineering fringe overhead adjustment credit and reduced MetroCard transaction fees
from lower ridership
• Paratransit service contract expenses were favorable by $33.7 million (10.1 percent), largely
due to reduced trips
• Claims expenses underran the forecast $29.8 million (14.2 percent), reflecting lower claims
due to lower ridership
• Professional Services expenses were favorable by $21.9 million (13.5 percent), due to
underruns in IT service, outside services.
Depreciation expenses year-to-date were higher than forecast by $118.0 million (6.7 percent).
GASB #75 OPEB Expense Adjustment reported an unfavorable variance to forecast of $54.4 million.
GASB 68 Pension Adjustment was unfavorable to the forecast by $38.2 million.
Master Page # 155 of 228 - New York City Transit and Bus Committee Meeting 1/21/2021________________________________________________________________________________
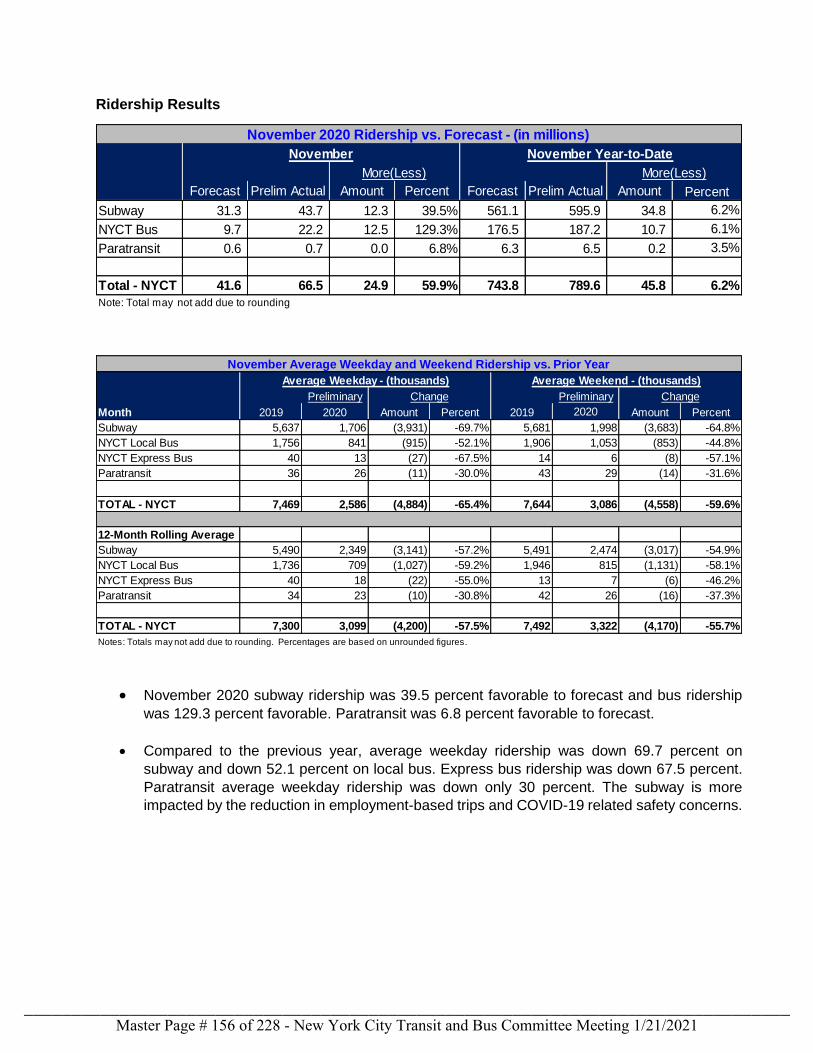
Ridership Results
• November 2020 subway ridership was 39.5 percent favorable to forecast and bus ridership
was 129.3 percent favorable. Paratransit was 6.8 percent favorable to forecast.
• Compared to the previous year, average weekday ridership was down 69.7 percent on
subway and down 52.1 percent on local bus. Express bus ridership was down 67.5 percent.
Paratransit average weekday ridership was down only 30 percent. The subway is more
impacted by the reduction in employment-based trips and COVID-19 related safety concerns.
Forecast Prelim Actual Amount Percent Forecast Prelim Actual Amount
Subway 31.3 43.7 12.3 39.5% 561.1 595.9 34.8
NYCT Bus 9.7 22.2 12.5 129.3% 176.5 187.2 10.7
Paratransit 0.6 0.7 0.0 6.8% 6.3 6.5 0.2
Total - NYCT 41.6 66.5 24.9 59.9% 743.8 789.6 45.8
Note: Total may not add due to rounding
November 2020 Ridership vs. Forecast - (in millions)
November November Year-to-Date
More(Less) More(Less)
Percent
6.2%
6.1%
3.5%
6.2%
Average Weekday - (thousands) Average Weekend - (thousands)
Preliminary Preliminary
Month 2019 2020 Amount Percent 2019 2020 Amount Percent
Subway 5,637 1,706 (3,931) -69.7% 5,681 1,998 (3,683) -64.8%
NYCT Local Bus 1,756 841 (915) -52.1% 1,906 1,053 (853) -44.8%
NYCT Express Bus 40 13 (27) -67.5% 14 6 (8) -57.1%
Paratransit 36 26 (11) -30.0% 43 29 (14) -31.6%
TOTAL - NYCT 7,469 2,586 (4,884) -65.4% 7,644 3,086 (4,558) -59.6%
12-Month Rolling Average
Subway 5,490 2,349 (3,141) -57.2% 5,491 2,474 (3,017) -54.9%
NYCT Local Bus 1,736 709 (1,027) -59.2% 1,946 815 (1,131) -58.1%
NYCT Express Bus 40 18 (22) -55.0% 13 7 (6) -46.2%
Paratransit 34 23 (10) -30.8% 42 26 (16) -37.3%
TOTAL - NYCT 7,300 3,099 (4,200) -57.5% 7,492 3,322 (4,170) -55.7%
November Average Weekday and Weekend Ridership vs. Prior Year
Change Change
Notes: Totals may not add due to rounding. Percentages are based on unrounded figures.
Master Page # 156 of 228 - New York City Transit and Bus Committee Meeting 1/21/2021________________________________________________________________________________
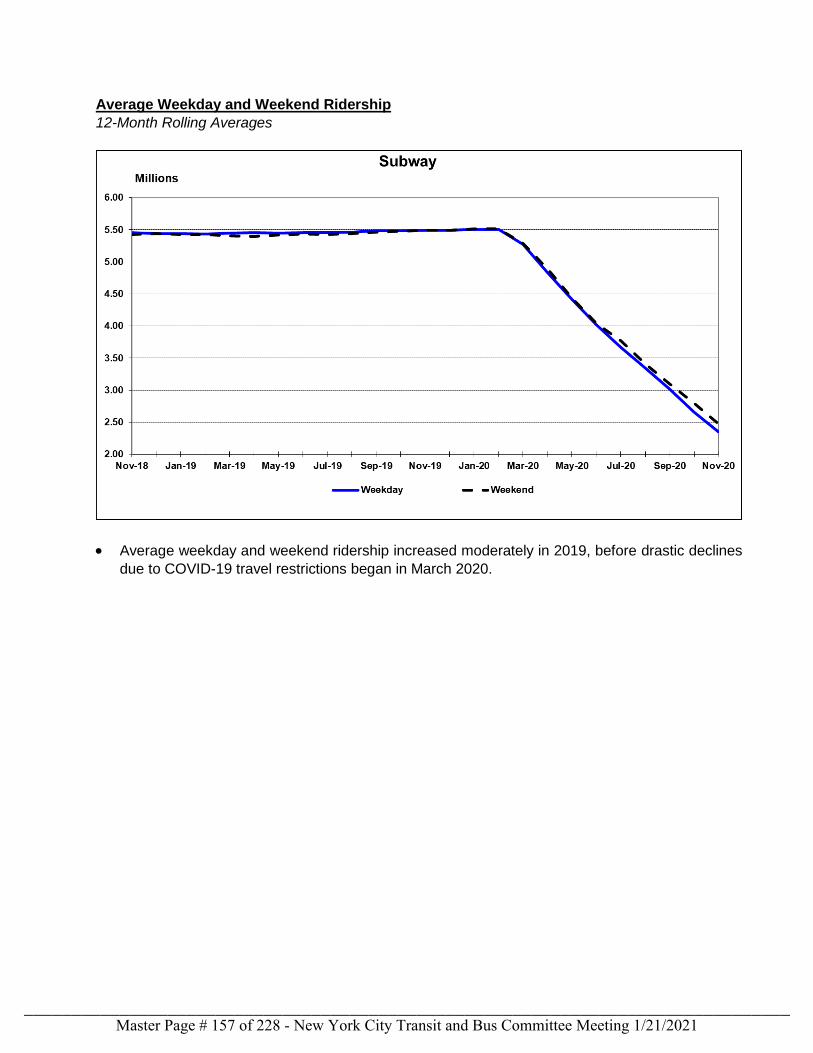
Average Weekday and Weekend Ridership
12-Month Rolling Averages
• Average weekday and weekend ridership increased moderately in 2019, before drastic declines
due to COVID-19 travel restrictions began in March 2020.
Master Page # 157 of 228 - New York City Transit and Bus Committee Meeting 1/21/2021________________________________________________________________________________
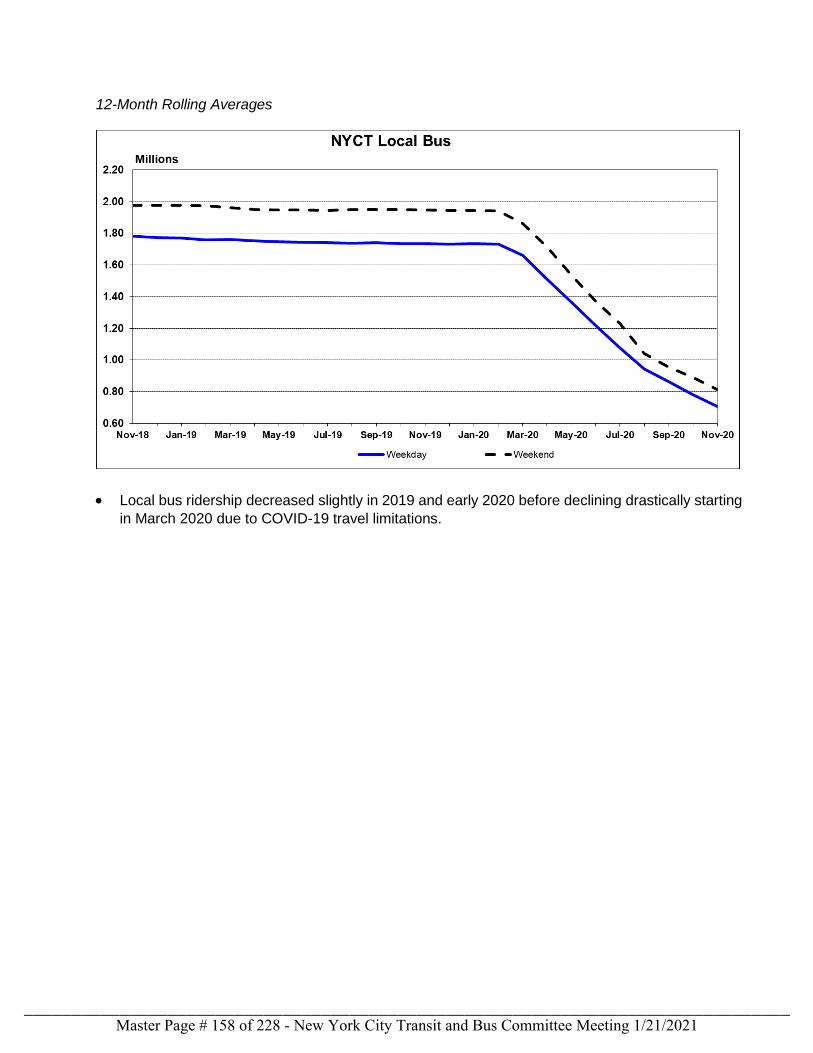
12-Month Rolling Averages
• Local bus ridership decreased slightly in 2019 and early 2020 before declining drastically starting
in March 2020 due to COVID-19 travel limitations.
Master Page # 158 of 228 - New York City Transit and Bus Committee Meeting 1/21/2021________________________________________________________________________________
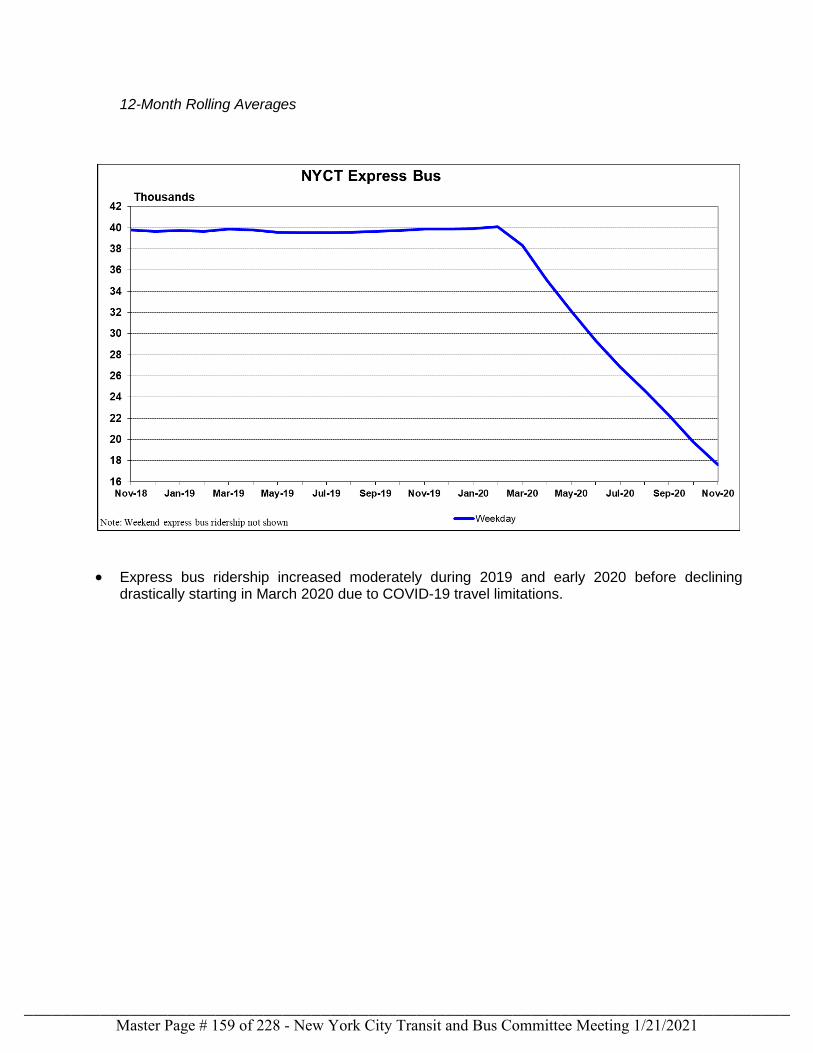
12-Month Rolling Averages
• Express bus ridership increased moderately during 2019 and early 2020 before decliningdrastically starting in March 2020 due to COVID-19 travel limitations.
Master Page # 159 of 228 - New York City Transit and Bus Committee Meeting 1/21/2021________________________________________________________________________________
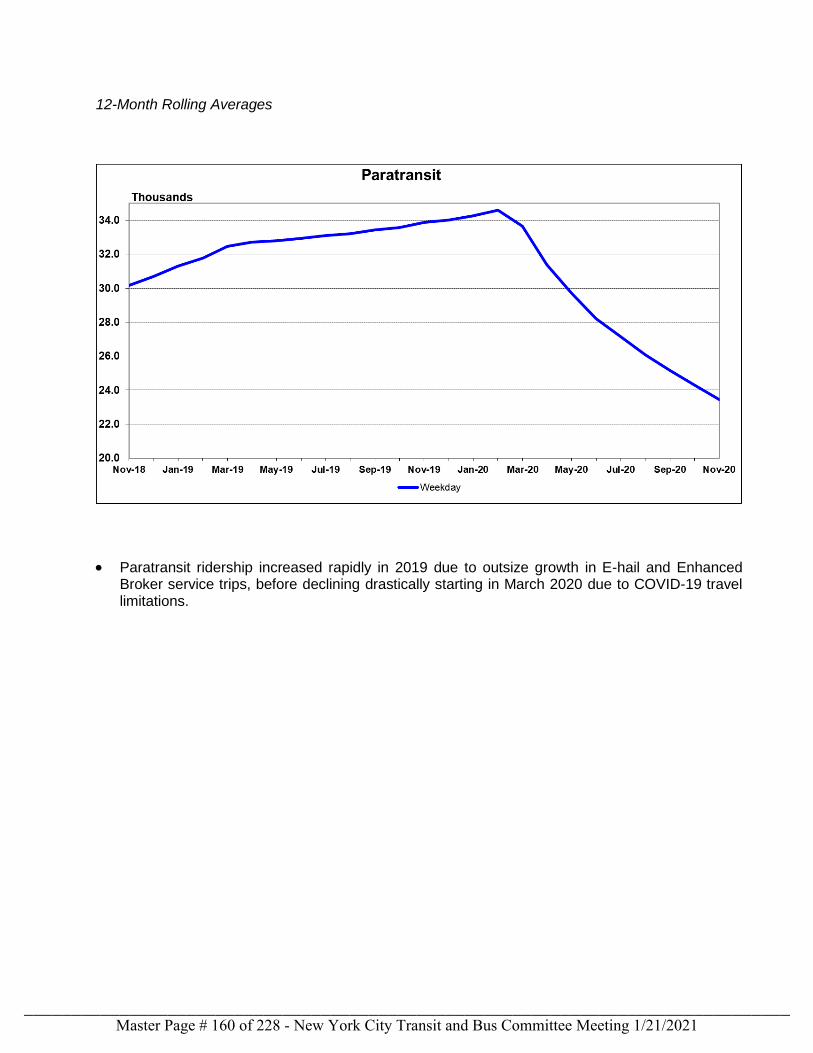
12-Month Rolling Averages
• Paratransit ridership increased rapidly in 2019 due to outsize growth in E-hail and EnhancedBroker service trips, before declining drastically starting in March 2020 due to COVID-19 travellimitations.
Master Page # 160 of 228 - New York City Transit and Bus Committee Meeting 1/21/2021________________________________________________________________________________
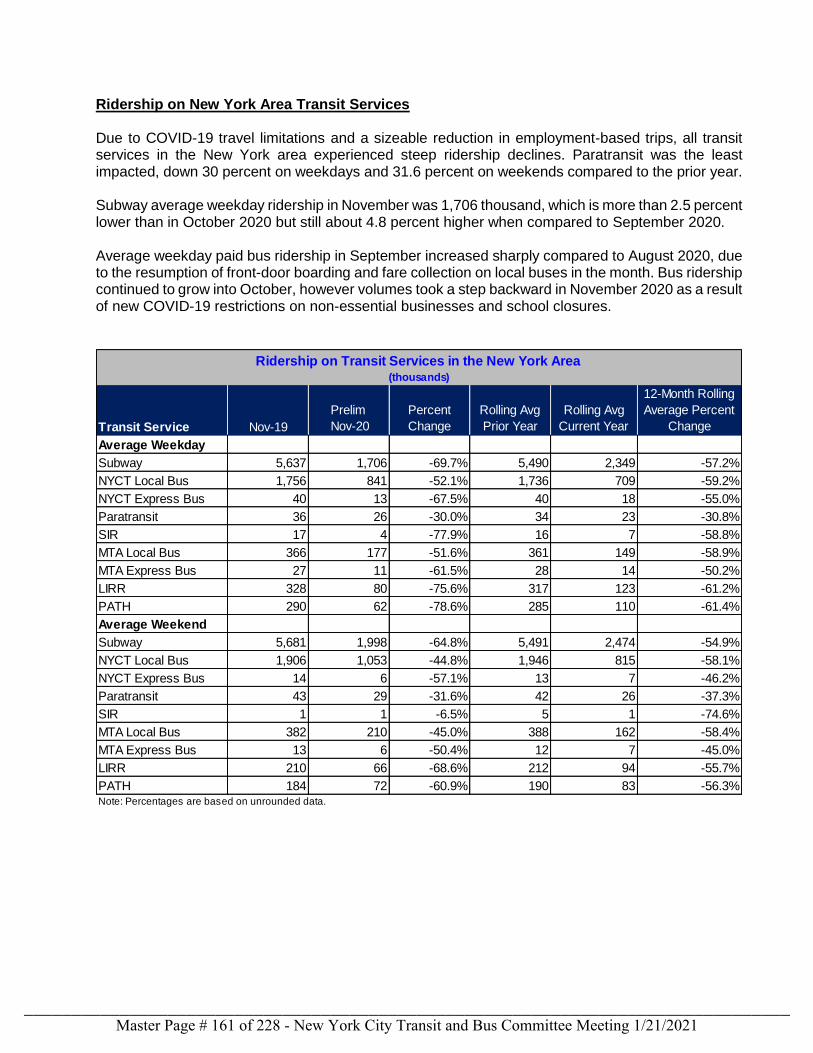
Ridership on New York Area Transit Services Due to COVID-19 travel limitations and a sizeable reduction in employment-based trips, all transit services in the New York area experienced steep ridership declines. Paratransit was the least impacted, down 30 percent on weekdays and 31.6 percent on weekends compared to the prior year. Subway average weekday ridership in November was 1,706 thousand, which is more than 2.5 percent lower than in October 2020 but still about 4.8 percent higher when compared to September 2020. Average weekday paid bus ridership in September increased sharply compared to August 2020, due to the resumption of front-door boarding and fare collection on local buses in the month. Bus ridership continued to grow into October, however volumes took a step backward in November 2020 as a result of new COVID-19 restrictions on non-essential businesses and school closures.
Ridership on Transit Services in the New York Area(thousands)
Transit Service Nov-19
Prelim
Nov-20
Percent
Change
Rolling Avg
Prior Year
Rolling Avg
Current Year
12-Month Rolling
Average Percent
Change
Average Weekday
Subway 5,637 1,706 -69.7% 5,490 2,349 -57.2%
NYCT Local Bus 1,756 841 -52.1% 1,736 709 -59.2%
NYCT Express Bus 40 13 -67.5% 40 18 -55.0%
Paratransit 36 26 -30.0% 34 23 -30.8%
SIR 17 4 -77.9% 16 7 -58.8%
MTA Local Bus 366 177 -51.6% 361 149 -58.9%
MTA Express Bus 27 11 -61.5% 28 14 -50.2%
LIRR 328 80 -75.6% 317 123 -61.2%
PATH 290 62 -78.6% 285 110 -61.4%
Average Weekend
Subway 5,681 1,998 -64.8% 5,491 2,474 -54.9%
NYCT Local Bus 1,906 1,053 -44.8% 1,946 815 -58.1%
NYCT Express Bus 14 6 -57.1% 13 7 -46.2%
Paratransit 43 29 -31.6% 42 26 -37.3%
SIR 1 1 -6.5% 5 1 -74.6%
MTA Local Bus 382 210 -45.0% 388 162 -58.4%
MTA Express Bus 13 6 -50.4% 12 7 -45.0%
LIRR 210 66 -68.6% 212 94 -55.7%
PATH 184 72 -60.9% 190 83 -56.3%Note: Percentages are based on unrounded data.
Master Page # 161 of 228 - New York City Transit and Bus Committee Meeting 1/21/2021________________________________________________________________________________
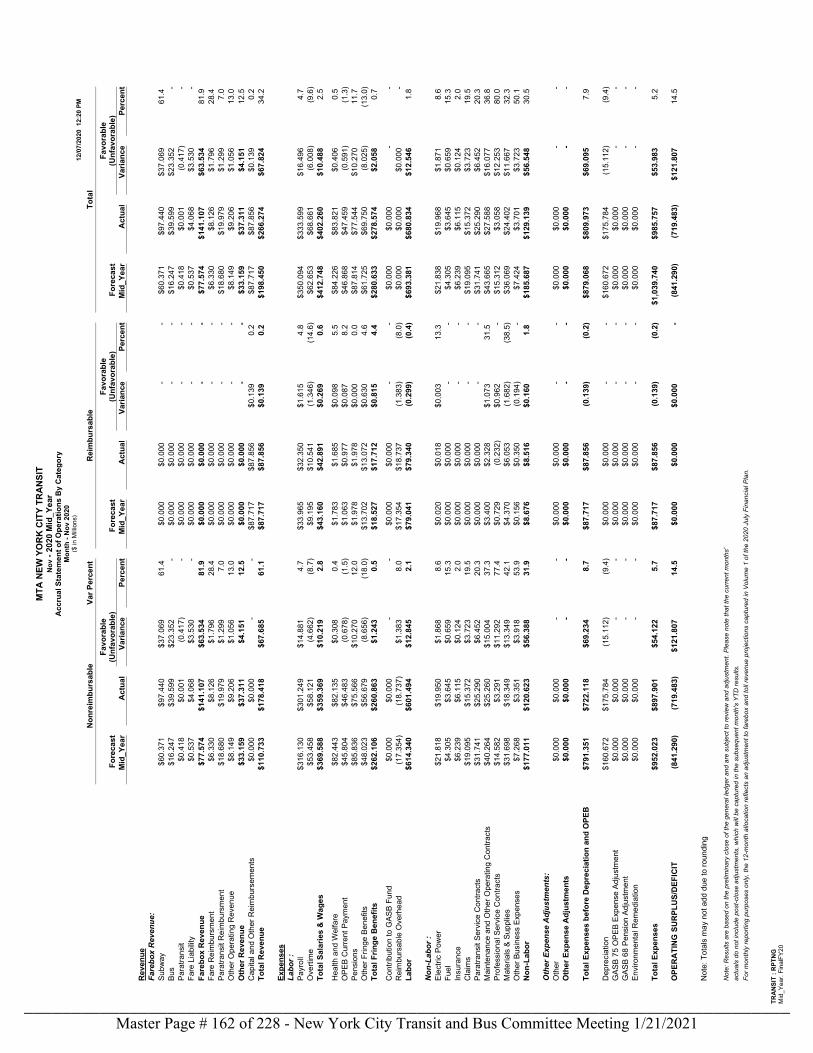
MTA
NEW
YO
RK
CIT
Y TR
AN
SIT
Nov
- 20
20 M
id_Y
ear
Acc
rual
Sta
tem
ent o
f Ope
ratio
ns B
y C
ateg
ory
Mon
th -
Nov
202
0($
in M
illion
s)12
/07/
2020
12:
20 P
M
TRA
NSI
T : R
PTN
GM
id_Y
ear.
Fina
lFY2
0
Non
reim
burs
able
Var P
erce
ntR
eim
burs
able
Tota
l
Fore
cast
Favo
rabl
e(U
nfav
orab
le)
Fore
cast
Favo
rabl
e(U
nfav
orab
le)
Fore
cast
Favo
rabl
e(U
nfav
orab
le)
Mid
_Yea
rA
ctua
lVa
rianc
ePe
rcen
tM
id_Y
ear
Act
ual
Varia
nce
Perc
ent
Mid
_Yea
rA
ctua
lVa
rianc
ePe
rcen
t
Rev
enue
Fare
box
Rev
enue
:Su
bway
$60.
371
$97.
440
$37.
069
61.4
$0
.000
$0
.000
-
-$6
0.37
1 $9
7.44
0 $3
7.06
9 61
.4
Bus
$16.
247
$39.
599
$23.
352
-$0
.000
$0
.000
-
-$1
6.24
7 $3
9.59
9 $2
3.35
2 -
Para
trans
it$0
.418
$0
.001
(0
.417
)-
$0.0
00
$0.0
00
- -
$0.4
18
$0.0
01
(0.4
17)
-Fa
re L
iabi
lity
$0.5
37
$4.0
68
$3.5
30
-$0
.000
$0
.000
-
-$0
.537
$4
.068
$3
.530
-
Fare
box
Rev
enue
$77.
574
$141
.107
$6
3.53
4 81
.9
$0.0
00
$0.0
00
- -
$77.
574
$141
.107
$6
3.53
4 81
.9
Fare
Rei
mbu
rsm
ent
$6.3
30
$8.1
26
$1.7
96
28.4
$0
.000
$0
.000
-
-$6
.330
$8
.126
$1
.796
28
.4
Para
trans
it R
eim
burs
men
t$1
8.68
0 $1
9.97
9 $1
.299
7.
0 $0
.000
$0
.000
-
-$1
8.68
0 $1
9.97
9 $1
.299
7.
0 O
ther
Ope
ratin
g R
even
ue$8
.149
$9
.206
$1
.056
13
.0
$0.0
00
$0.0
00
- -
$8.1
49
$9.2
06
$1.0
56
13.0
O
ther
Rev
enue
$33.
159
$37.
311
$4.1
51
12.5
$0
.000
$0
.000
-
-$3
3.15
9 $3
7.31
1 $4
.151
12
.5
Cap
ital a
nd O
ther
Rei
mbu
rsem
ents
$0.0
00
$0.0
00
- -
$87.
717
$87.
856
$0.1
39
0.2
$87.
717
$87.
856
$0.1
39
0.2
Tota
l Rev
enue
$110
.733
$1
78.4
18
$67.
685
61.1
$8
7.71
7 $8
7.85
6 $0
.139
0.
2 $1
98.4
50
$266
.274
$6
7.82
4 34
.2
Expe
nses
Labo
r :Pa
yrol
l$3
16.1
30
$301
.249
$1
4.88
1 4.
7 $3
3.96
5 $3
2.35
0 $1
.615
4.
8 $3
50.0
94
$333
.599
$1
6.49
6 4.
7 O
verti
me
$53.
458
$58.
121
(4.6
62)
(8.7
)$9
.195
$1
0.54
1 (1
.346
)(1
4.6)
$62.
653
$68.
661
(6.0
08)
(9.6
)To
tal S
alar
ies
& W
ages
$369
.588
$3
59.3
69
$10.
219
2.8
$43.
160
$42.
891
$0.2
69
0.6
$412
.748
$4
02.2
60
$10.
488
2.5
Hea
lth a
nd W
elfa
re$8
2.44
3 $8
2.13
5 $0
.308
0.
4 $1
.783
$1
.685
$0
.098
5.
5 $8
4.22
6 $8
3.82
1 $0
.406
0.
5 O
PEB
Cur
rent
Pay
men
t$4
5.80
4 $4
6.48
3 (0
.678
)(1
.5)
$1.0
63
$0.9
77
$0.0
87
8.2
$46.
868
$47.
459
(0.5
91)
(1.3
)Pe
nsio
ns$8
5.83
6 $7
5.56
6 $1
0.27
0 12
.0
$1.9
78
$1.9
78
$0.0
00
0.0
$87.
814
$77.
544
$10.
270
11.7
O
ther
Frin
ge B
enef
its$4
8.02
3 $5
6.67
9 (8
.656
)(1
8.0)
$13.
702
$13.
072
$0.6
30
4.6
$61.
725
$69.
750
(8.0
25)
(13.
0)To
tal F
ringe
Ben
efits
$262
.106
$2
60.8
63
$1.2
43
0.5
$18.
527
$17.
712
$0.8
15
4.4
$280
.633
$2
78.5
74
$2.0
58
0.7
Con
tribu
tion
to G
ASB
Fund
$0.0
00
$0.0
00
- -
$0.0
00
$0.0
00
- -
$0.0
00
$0.0
00
- -
Rei
mbu
rsab
le O
verh
ead
(17.
354)
(18.
737)
$1.3
83
8.0
$17.
354
$18.
737
(1.3
83)
(8.0
)$0
.000
$0
.000
$0
.000
-
Labo
r$6
14.3
40
$601
.494
$1
2.84
5 2.
1 $7
9.04
1 $7
9.34
0 (0
.299
)(0
.4)
$693
.381
$6
80.8
34
$12.
546
1.8
Non
-Lab
or :
Elec
tric
Pow
er$2
1.81
8 $1
9.95
0 $1
.868
8.
6 $0
.020
$0
.018
$0
.003
13
.3
$21.
838
$19.
968
$1.8
71
8.6
Fuel
$4.3
05
$3.6
45
$0.6
59
15.3
$0
.000
$0
.000
-
-$4
.305
$3
.645
$0
.659
15
.3
Insu
ranc
e$6
.239
$6
.115
$0
.124
2.
0 $0
.000
$0
.000
-
-$6
.239
$6
.115
$0
.124
2.
0 C
laim
s$1
9.09
5 $1
5.37
2 $3
.723
19
.5
$0.0
00
$0.0
00
- -
$19.
095
$15.
372
$3.7
23
19.5
Pa
ratra
nsit
Serv
ice
Con
tract
s$3
1.74
1 $2
5.29
0 $6
.452
20
.3
$0.0
00
$0.0
00
- -
$31.
741
$25.
290
$6.4
52
20.3
M
aint
enan
ce a
nd O
ther
Ope
ratin
g C
ontra
cts
$40.
264
$25.
260
$15.
004
37.3
$3
.400
$2
.328
$1
.073
31
.5
$43.
665
$27.
588
$16.
077
36.8
Pr
ofes
sion
al S
ervi
ce C
ontra
cts
$14.
582
$3.2
91
$11.
292
77.4
$0
.729
(0
.232
)$0
.962
-
$15.
312
$3.0
58
$12.
253
80.0
M
ater
ials
& S
uppl
ies
$31.
698
$18.
349
$13.
349
42.1
$4
.370
$6
.053
(1
.682
)(3
8.5)
$36.
069
$24.
402
$11.
667
32.3
O
ther
Bus
ines
s Ex
pens
es$7
.268
$3
.351
$3
.918
53
.9
$0.1
56
$0.3
50
(0.1
94)
-$7
.424
$3
.701
$3
.723
50
.1
Non
-Lab
or$1
77.0
11
$120
.623
$5
6.38
8 31
.9
$8.6
76
$8.5
16
$0.1
60
1.8
$185
.687
$1
29.1
39
$56.
548
30.5
Oth
er E
xpen
se A
djus
tmen
ts:
Oth
er$0
.000
$0
.000
-
-$0
.000
$0
.000
-
-$0
.000
$0
.000
-
-O
ther
Exp
ense
Adj
ustm
ents
$0.0
00
$0.0
00
- -
$0.0
00
$0.0
00
- -
$0.0
00
$0.0
00
- -
Tota
l Exp
ense
s be
fore
Dep
reci
atio
n an
d O
PEB
$791
.351
$7
22.1
18
$69.
234
8.7
$87.
717
$87.
856
(0.1
39)
(0.2
)$8
79.0
68
$809
.973
$6
9.09
5 7.
9
Dep
reci
atio
n$1
60.6
72
$175
.784
(1
5.11
2)(9
.4)
$0.0
00
$0.0
00
- -
$160
.672
$1
75.7
84
(15.
112)
(9.4
)G
ASB
75 O
PEB
Expe
nse
Adju
stm
ent
$0.0
00
$0.0
00
- -
$0.0
00
$0.0
00
- -
$0.0
00
$0.0
00
- -
GAS
B 68
Pen
sion
Adj
ustm
ent
$0.0
00
$0.0
00
- -
$0.0
00
$0.0
00
- -
$0.0
00
$0.0
00
- -
Envi
ronm
enta
l Rem
edia
tion
$0.0
00
$0.0
00
- -
$0.0
00
$0.0
00
- -
$0.0
00
$0.0
00
- -
Tota
l Exp
ense
s$9
52.0
23
$897
.901
$5
4.12
2 5.
7 $8
7.71
7 $8
7.85
6 (0
.139
)(0
.2)
$1,0
39.7
40
$985
.757
$5
3.98
3 5.
2
OPE
RA
TIN
G S
UR
PLU
S/D
EFIC
IT(8
41.2
90)
(719
.483
)$1
21.8
07
14.5
$0
.000
$0
.000
$0
.000
-
(841
.290
)(7
19.4
83)
$121
.807
14
.5
Not
e: T
otal
s m
ay n
ot a
dd d
ue to
roun
ding
Not
e: R
esul
ts a
re b
ased
on
the
prel
imin
ary
clos
e of
the
gene
ral l
edge
r and
are
sub
ject
to re
view
and
adj
ustm
ent.
Ple
ase
note
that
the
curr
ent m
onth
s'ac
tual
s do
not
incl
ude
post
-clo
se a
djus
tmen
ts, w
hich
will
be
capt
ured
in th
e su
bseq
uent
mon
th's
YTD
resu
lts.
For m
onth
ly re
porti
ng p
urpo
ses
only
, the
12-
mon
th a
lloca
tion
refle
cts
an a
djus
tmen
t to
fare
box
and
toll
reve
nue
proj
ectio
ns c
aptu
red
in V
olum
e 1
of th
e 20
20 J
uly
Fina
ncia
l Pla
n.
Master Page # 162 of 228 - New York City Transit and Bus Committee Meeting 1/21/2021________________________________________________________________________________
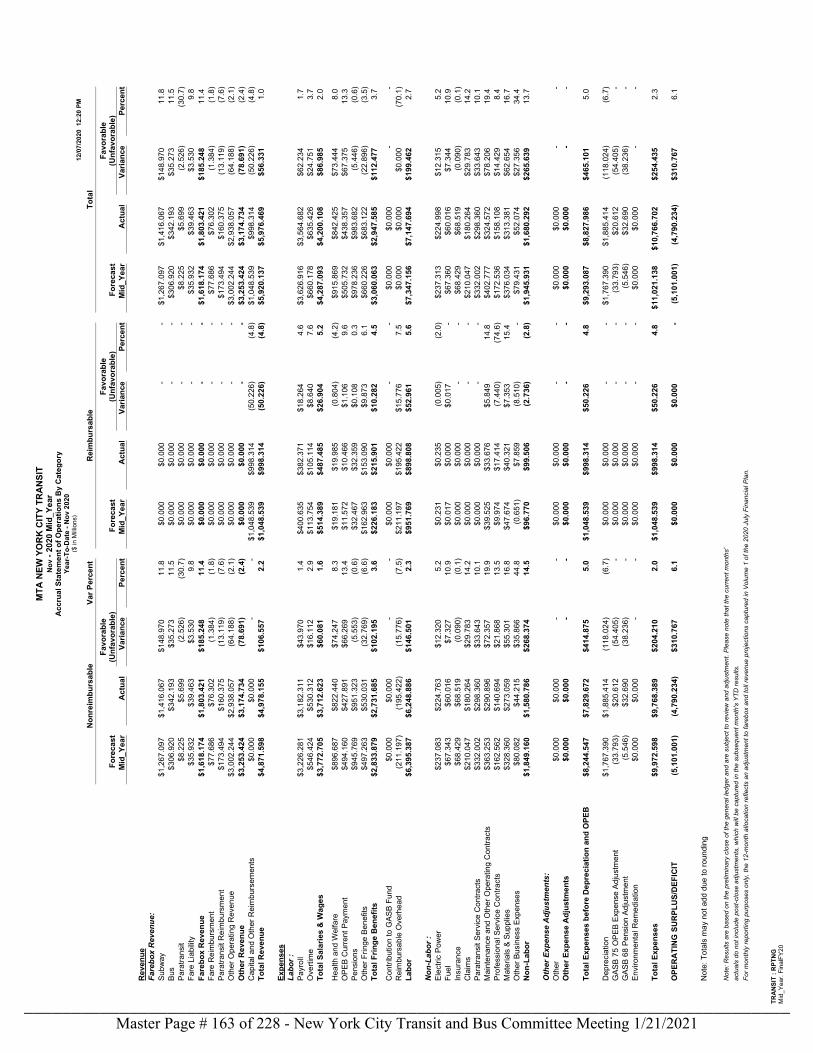
MTA
NEW
YO
RK
CIT
Y TR
AN
SIT
Nov
- 20
20 M
id_Y
ear
Acc
rual
Sta
tem
ent o
f Ope
ratio
ns B
y C
ateg
ory
Year
-To-
Dat
e - N
ov 2
020
($ in
Milli
ons)
12/0
7/20
20 1
2:20
PM
TRA
NSI
T : R
PTN
GM
id_Y
ear.
Fina
lFY2
0
Non
reim
burs
able
Var P
erce
ntR
eim
burs
able
Tota
l
Fore
cast
Favo
rabl
e(U
nfav
orab
le)
Fore
cast
Favo
rabl
e(U
nfav
orab
le)
Fore
cast
Favo
rabl
e(U
nfav
orab
le)
Mid
_Yea
rA
ctua
lVa
rianc
ePe
rcen
tM
id_Y
ear
Act
ual
Varia
nce
Perc
ent
Mid
_Yea
rA
ctua
lVa
rianc
ePe
rcen
t
Rev
enue
Fare
box
Rev
enue
:Su
bway
$1,2
67.0
97
$1,4
16.0
67
$148
.970
11
.8
$0.0
00
$0.0
00
- -
$1,2
67.0
97
$1,4
16.0
67
$148
.970
11
.8
Bus
$306
.920
$3
42.1
93
$35.
273
11.5
$0
.000
$0
.000
-
-$3
06.9
20
$342
.193
$3
5.27
3 11
.5
Para
trans
it$8
.225
$5
.699
(2
.526
)(3
0.7)
$0.0
00
$0.0
00
- -
$8.2
25
$5.6
99
(2.5
26)
(30.
7)Fa
re L
iabi
lity
$35.
932
$39.
463
$3.5
30
9.8
$0.0
00
$0.0
00
- -
$35.
932
$39.
463
$3.5
30
9.8
Fare
box
Rev
enue
$1,6
18.1
74
$1,8
03.4
21
$185
.248
11
.4
$0.0
00
$0.0
00
- -
$1,6
18.1
74
$1,8
03.4
21
$185
.248
11
.4
Fare
Rei
mbu
rsm
ent
$77.
686
$76.
302
(1.3
84)
(1.8
)$0
.000
$0
.000
-
-$7
7.68
6 $7
6.30
2 (1
.384
)(1
.8)
Para
trans
it R
eim
burs
men
t$1
73.4
94
$160
.375
(1
3.11
9)(7
.6)
$0.0
00
$0.0
00
- -
$173
.494
$1
60.3
75
(13.
119)
(7.6
)O
ther
Ope
ratin
g R
even
ue$3
,002
.244
$2
,938
.057
(6
4.18
8)(2
.1)
$0.0
00
$0.0
00
- -
$3,0
02.2
44
$2,9
38.0
57
(64.
188)
(2.1
)O
ther
Rev
enue
$3,2
53.4
24
$3,1
74.7
34
(78.
691)
(2.4
)$0
.000
$0
.000
-
-$3
,253
.424
$3
,174
.734
(7
8.69
1)(2
.4)
Cap
ital a
nd O
ther
Rei
mbu
rsem
ents
$0.0
00
$0.0
00
- -
$1,0
48.5
39
$998
.314
(5
0.22
6)(4
.8)
$1,0
48.5
39
$998
.314
(5
0.22
6)(4
.8)
Tota
l Rev
enue
$4,8
71.5
98
$4,9
78.1
55
$106
.557
2.
2 $1
,048
.539
$9
98.3
14
(50.
226)
(4.8
)$5
,920
.137
$5
,976
.469
$5
6.33
1 1.
0
Expe
nses
Labo
r :Pa
yrol
l$3
,226
.281
$3
,182
.311
$4
3.97
0 1.
4 $4
00.6
35
$382
.371
$1
8.26
4 4.
6 $3
,626
.916
$3
,564
.682
$6
2.23
4 1.
7 O
verti
me
$546
.424
$5
30.3
12
$16.
112
2.9
$113
.754
$1
05.1
14
$8.6
40
7.6
$660
.178
$6
35.4
26
$24.
751
3.7
Tota
l Sal
arie
s &
Wag
es$3
,772
.705
$3
,712
.623
$6
0.08
1 1.
6 $5
14.3
89
$487
.485
$2
6.90
4 5.
2 $4
,287
.093
$4
,200
.108
$8
6.98
5 2.
0
Hea
lth a
nd W
elfa
re$8
96.6
87
$822
.440
$7
4.24
7 8.
3 $1
9.18
1 $1
9.98
5 (0
.804
)(4
.2)
$915
.869
$8
42.4
25
$73.
444
8.0
OPE
B C
urre
nt P
aym
ent
$494
.160
$4
27.8
91
$66.
269
13.4
$1
1.57
2 $1
0.46
6 $1
.106
9.
6 $5
05.7
32
$438
.357
$6
7.37
5 13
.3
Pens
ions
$945
.769
$9
51.3
23
(5.5
53)
(0.6
)$3
2.46
7 $3
2.35
9 $0
.108
0.
3 $9
78.2
36
$983
.682
(5
.446
)(0
.6)
Oth
er F
ringe
Ben
efits
$497
.263
$5
30.0
31
(32.
769)
(6.6
)$1
62.9
63
$153
.090
$9
.873
6.
1 $6
60.2
26
$683
.122
(2
2.89
6)(3
.5)
Tota
l Frin
ge B
enef
its$2
,833
.879
$2
,731
.685
$1
02.1
95
3.6
$226
.183
$2
15.9
01
$10.
282
4.5
$3,0
60.0
63
$2,9
47.5
85
$112
.477
3.
7
Con
tribu
tion
to G
ASB
Fund
$0.0
00
$0.0
00
- -
$0.0
00
$0.0
00
- -
$0.0
00
$0.0
00
- -
Rei
mbu
rsab
le O
verh
ead
(211
.197
)(1
95.4
22)
(15.
776)
(7.5
)$2
11.1
97
$195
.422
$1
5.77
6 7.
5 $0
.000
$0
.000
$0
.000
(7
0.1)
Labo
r$6
,395
.387
$6
,248
.886
$1
46.5
01
2.3
$951
.769
$8
98.8
08
$52.
961
5.6
$7,3
47.1
56
$7,1
47.6
94
$199
.462
2.
7
Non
-Lab
or :
Elec
tric
Pow
er$2
37.0
83
$224
.763
$1
2.32
0 5.
2 $0
.231
$0
.235
(0
.005
)(2
.0)
$237
.313
$2
24.9
98
$12.
315
5.2
Fuel
$67.
343
$60.
016
$7.3
27
10.9
$0
.017
$0
.000
$0
.017
-
$67.
360
$60.
016
$7.3
44
10.9
In
sura
nce
$68.
429
$68.
519
(0.0
90)
(0.1
)$0
.000
$0
.000
-
-$6
8.42
9 $6
8.51
9 (0
.090
)(0
.1)
Cla
ims
$210
.047
$1
80.2
64
$29.
783
14.2
$0
.000
$0
.000
-
-$2
10.0
47
$180
.264
$2
9.78
3 14
.2
Para
trans
it Se
rvic
e C
ontra
cts
$332
.002
$2
98.3
60
$33.
643
10.1
$0
.000
$0
.000
-
-$3
32.0
02
$298
.360
$3
3.64
3 10
.1
Mai
nten
ance
and
Oth
er O
pera
ting
Con
tract
s$3
63.2
53
$290
.896
$7
2.35
7 19
.9
$39.
525
$33.
676
$5.8
49
14.8
$4
02.7
77
$324
.572
$7
8.20
6 19
.4
Prof
essi
onal
Ser
vice
Con
tract
s$1
62.5
62
$140
.694
$2
1.86
8 13
.5
$9.9
74
$17.
414
(7.4
40)
(74.
6)$1
72.5
36
$158
.108
$1
4.42
9 8.
4 M
ater
ials
& S
uppl
ies
$328
.360
$2
73.0
59
$55.
301
16.8
$4
7.67
4 $4
0.32
1 $7
.353
15
.4
$376
.034
$3
13.3
81
$62.
654
16.7
O
ther
Bus
ines
s Ex
pens
es$8
0.08
2 $4
4.21
5 $3
5.86
6 44
.8
(0.6
51)
$7.8
59
(8.5
10)
-$7
9.43
1 $5
2.07
4 $2
7.35
6 34
.4
Non
-Lab
or$1
,849
.160
$1
,580
.786
$2
68.3
74
14.5
$9
6.77
0 $9
9.50
6 (2
.736
)(2
.8)
$1,9
45.9
31
$1,6
80.2
92
$265
.639
13
.7
Oth
er E
xpen
se A
djus
tmen
ts:
Oth
er$0
.000
$0
.000
-
-$0
.000
$0
.000
-
-$0
.000
$0
.000
-
-O
ther
Exp
ense
Adj
ustm
ents
$0.0
00
$0.0
00
- -
$0.0
00
$0.0
00
- -
$0.0
00
$0.0
00
- -
Tota
l Exp
ense
s be
fore
Dep
reci
atio
n an
d O
PEB
$8,2
44.5
47
$7,8
29.6
72
$414
.875
5.
0 $1
,048
.539
$9
98.3
14
$50.
226
4.8
$9,2
93.0
87
$8,8
27.9
86
$465
.101
5.
0
Dep
reci
atio
n$1
,767
.390
$1
,885
.414
(1
18.0
24)
(6.7
)$0
.000
$0
.000
-
-$1
,767
.390
$1
,885
.414
(1
18.0
24)
(6.7
)G
ASB
75 O
PEB
Expe
nse
Adju
stm
ent
(33.
793)
$20.
612
(54.
405)
-$0
.000
$0
.000
-
-(3
3.79
3)$2
0.61
2 (5
4.40
5)-
GAS
B 68
Pen
sion
Adj
ustm
ent
(5.5
46)
$32.
690
(38.
236)
-$0
.000
$0
.000
-
-(5
.546
)$3
2.69
0 (3
8.23
6)-
Envi
ronm
enta
l Rem
edia
tion
$0.0
00
$0.0
00
- -
$0.0
00
$0.0
00
- -
$0.0
00
$0.0
00
- -
Tota
l Exp
ense
s$9
,972
.598
$9
,768
.389
$2
04.2
10
2.0
$1,0
48.5
39
$998
.314
$5
0.22
6 4.
8 $1
1,02
1.13
8 $1
0,76
6.70
2 $2
54.4
35
2.3
OPE
RA
TIN
G S
UR
PLU
S/D
EFIC
IT(5
,101
.001
)(4
,790
.234
)$3
10.7
67
6.1
$0.0
00
$0.0
00
$0.0
00
-(5
,101
.001
)(4
,790
.234
)$3
10.7
67
6.1
Not
e: T
otal
s m
ay n
ot a
dd d
ue to
roun
ding
Not
e: R
esul
ts a
re b
ased
on
the
prel
imin
ary
clos
e of
the
gene
ral l
edge
r and
are
sub
ject
to re
view
and
adj
ustm
ent.
Ple
ase
note
that
the
curr
ent m
onth
s'ac
tual
s do
not
incl
ude
post
-clo
se a
djus
tmen
ts, w
hich
will
be
capt
ured
in th
e su
bseq
uent
mon
th's
YTD
resu
lts.
For m
onth
ly re
porti
ng p
urpo
ses
only
, the
12-
mon
th a
lloca
tion
refle
cts
an a
djus
tmen
t to
fare
box
and
toll
reve
nue
proj
ectio
ns c
aptu
red
in V
olum
e 1
of th
e 20
20 J
uly
Fina
ncia
l Pla
n.
Master Page # 163 of 228 - New York City Transit and Bus Committee Meeting 1/21/2021________________________________________________________________________________
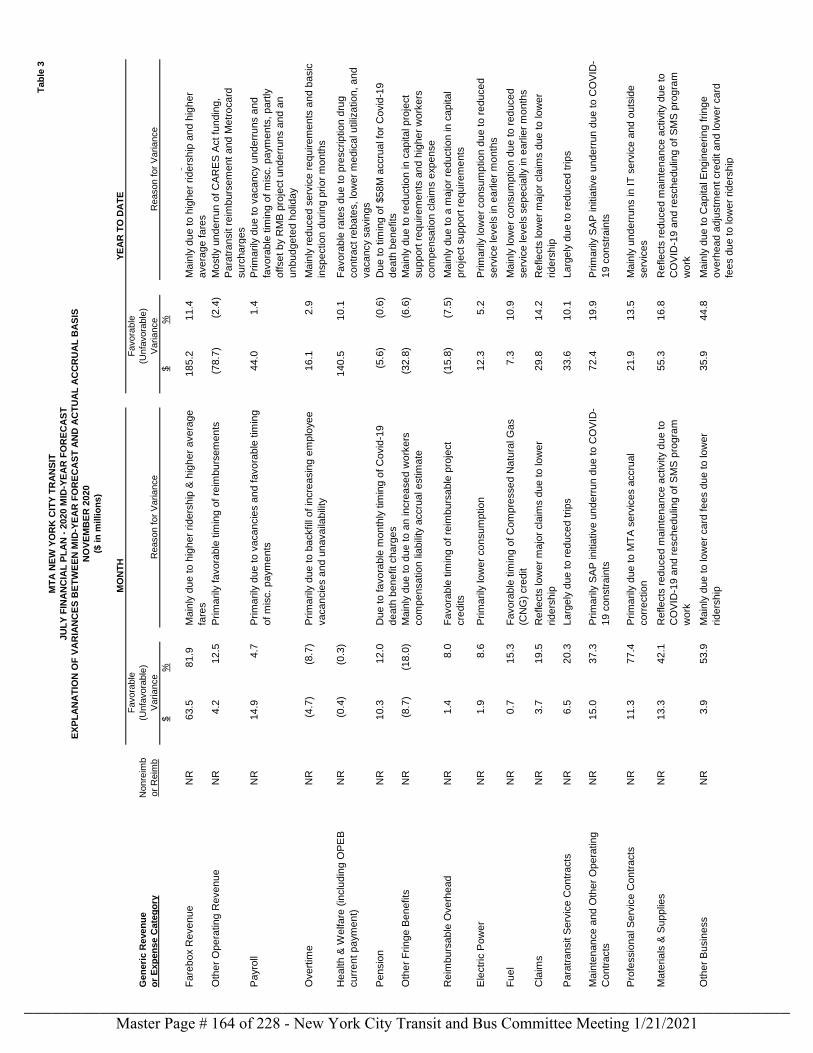
Tab
le 3
MT
A N
EW
YO
RK
CIT
Y T
RA
NS
IT
JU
LY
FIN
AN
CIA
L P
LA
N -
2020 M
ID-Y
EA
R F
OR
EC
AS
T
EX
PL
AN
AT
ION
OF
VA
RIA
NC
ES
BE
TW
EE
N M
ID-Y
EA
R F
OR
EC
AS
T A
ND
AC
TU
AL
AC
CR
UA
L B
AS
IS
NO
VE
MB
ER
2020
($ in
millio
ns)
MO
NT
HY
EA
R T
O D
AT
E
Favora
ble
Favora
ble
Gen
eri
c R
even
ue
Nonre
imb
(Unfa
vora
ble
)(U
nfa
vora
ble
)
or
Exp
en
se C
ate
go
ryor
Reim
bV
ariance
Reason for
Variance
Variance
Reason for
Variance
$%
$%
Fa
reb
ox R
eve
nu
eN
R6
3.5
81
.9M
ain
ly d
ue
to
hig
he
r rid
ers
hip
& h
igh
er
ave
rag
e
fare
s
18
5.2
11
.4M
ain
ly d
ue
to
hig
he
r rid
ers
hip
an
d h
igh
er
ave
rag
e f
are
s
Oth
er
Op
era
tin
g R
eve
nu
e
NR
4.2
12
.5
Prim
arily
fa
vo
rab
le t
imin
g o
f re
imb
urs
em
en
ts(7
8.7
)(2
.4)
Mo
stly u
nd
err
un
of
CA
RE
S A
ct
fun
din
g,
Pa
ratr
an
sit r
eim
bu
rse
me
nt
an
d M
etr
oca
rd
su
rch
arg
es
Pa
yro
llN
R1
4.9
4.7
P
rim
arily
du
e t
o v
aca
ncie
s a
nd
fa
vo
rab
le t
imin
g
of
mis
c.
pa
ym
en
ts
44
.01
.4P
rim
arily
du
e t
o v
aca
ncy u
nd
err
un
s a
nd
favo
rab
le t
imin
g o
f m
isc.
pa
ym
en
ts,
pa
rtly
off
se
t b
y R
MB
pro
ject
un
de
rru
ns a
nd
an
un
bu
dg
ete
d h
olid
ay
Ove
rtim
eN
R(4
.7)
(8.7
)P
rim
arily
du
e t
o b
ackfill
of
incre
asin
g e
mp
loye
e
va
ca
ncie
s a
nd
un
ava
ilab
ility
16
.12
.9M
ain
ly r
ed
uce
d s
erv
ice
re
qu
ire
me
nts
an
d b
asic
insp
ectio
n d
urin
g p
rio
r m
on
ths
He
alth
& W
elfa
re (
inclu
din
g O
PE
B
cu
rre
nt
pa
ym
en
t)
NR
(0.4
)(0
.3)
14
0.5
10
.1F
avo
rab
le r
ate
s d
ue
to
pre
scrip
tio
n d
rug
co
ntr
act
reb
ate
s,
low
er
me
dic
al u
tiliz
atio
n,
an
d
va
ca
ncy s
avin
gs
Pe
nsio
nN
R1
0.3
12
.0
Du
e t
o f
avo
rab
le m
on
thly
tim
ing
of
Co
vid
-19
de
ath
be
ne
fit
ch
arg
es
(5.6
)(0
.6)
Du
e t
o t
imin
g o
f $
58
M a
ccru
al fo
r C
ovid
-19
de
ath
be
ne
fits
Oth
er
Frin
ge
Be
ne
fits
NR
(8.7
)(1
8.0
)M
ain
ly d
ue
to
du
e t
o a
n in
cre
ase
d w
ork
ers
co
mp
en
sa
tio
n lia
bili
ty a
ccru
al e
stim
ate
(32
.8)
(6.6
)M
ain
ly d
ue
to
re
du
ctio
n in
ca
pita
l p
roje
ct
su
pp
ort
re
qu
ire
me
nts
an
d h
igh
er
wo
rke
rs
co
mp
en
sa
tio
n c
laim
s e
xp
en
se
Re
imb
urs
ab
le O
ve
rhe
ad
NR
1.4
8.0
F
avo
rab
le t
imin
g o
f re
imb
urs
ab
le p
roje
ct
cre
dits
(15
.8)
(7.5
)M
ain
ly d
ue
to
a m
ajo
r re
du
ctio
n in
ca
pita
l
pro
ject
su
pp
ort
re
qu
ire
me
nts
Ele
ctr
ic P
ow
er
NR
1.9
8.6
P
rim
arily
lo
we
r co
nsu
mp
tio
n1
2.3
5.2
Prim
arily
lo
we
r co
nsu
mp
tio
n d
ue
to
re
du
ce
d
se
rvic
e le
ve
ls in
ea
rlie
r m
on
ths
Fu
el
NR
0.7
15
.3
Fa
vo
rab
le t
imin
g o
f C
om
pre
sse
d N
atu
ral G
as
(CN
G)
cre
dit
7.3
10
.9M
ain
ly lo
we
r co
nsu
mp
tio
n d
ue
to
re
du
ce
d
se
rvic
e le
ve
ls s
ep
ecia
lly in
ea
rlie
r m
on
ths
Cla
ims
NR
3.7
19
.5
Re
fle
cts
lo
we
r m
ajo
r cla
ims d
ue
to
lo
we
r
rid
ers
hip
29
.81
4.2
Re
fle
cts
lo
we
r m
ajo
r cla
ims d
ue
to
lo
we
r
rid
ers
hip
Pa
ratr
an
sit S
erv
ice
Co
ntr
acts
NR
6.5
20
.3
La
rge
ly d
ue
to
re
du
ce
d t
rip
s3
3.6
10
.1L
arg
ely
du
e t
o r
ed
uce
d t
rip
s
Ma
inte
na
nce
an
d O
the
r O
pe
ratin
g
Co
ntr
acts
NR
15
.03
7.3
P
rim
arily
SA
P in
itia
tive
un
de
rru
n d
ue
to
CO
VID
-
19
co
nstr
ain
ts
72
.41
9.9
Prim
arily
SA
P in
itia
tive
un
de
rru
n d
ue
to
CO
VID
-
19
co
nstr
ain
ts
Pro
fessio
na
l S
erv
ice
Co
ntr
acts
N
R1
1.3
77
.4
Prim
arily
du
e t
o M
TA
se
rvic
es a
ccru
al
co
rre
ctio
n
21
.91
3.5
Ma
inly
un
de
rru
ns in
IT
se
rvic
e a
nd
ou
tsid
e
se
rvic
es
Ma
teria
ls &
Su
pp
lies
NR
13
.34
2.1
R
efle
cts
re
du
ce
d m
ain
ten
an
ce
activity d
ue
to
CO
VID
-19
an
d r
esch
ed
ulin
g o
f S
MS
pro
gra
m
wo
rk
55
.31
6.8
Re
fle
cts
re
du
ce
d m
ain
ten
an
ce
activity d
ue
to
CO
VID
-19
an
d r
esch
ed
ulin
g o
f S
MS
pro
gra
m
wo
rk
Oth
er
Bu
sin
ess
NR
3.9
53
.9
Ma
inly
du
e t
o lo
we
r ca
rd f
ee
s d
ue
to
lo
we
r
rid
ers
hip
35
.94
4.8
Ma
inly
du
e t
o C
ap
ita
l E
ng
ine
erin
g f
rin
ge
ove
rhe
ad
ad
justm
en
t cre
dit a
nd
lo
we
r ca
rd
fee
s d
ue
to
lo
we
r rid
ers
hip
Master Page # 164 of 228 - New York City Transit and Bus Committee Meeting 1/21/2021________________________________________________________________________________
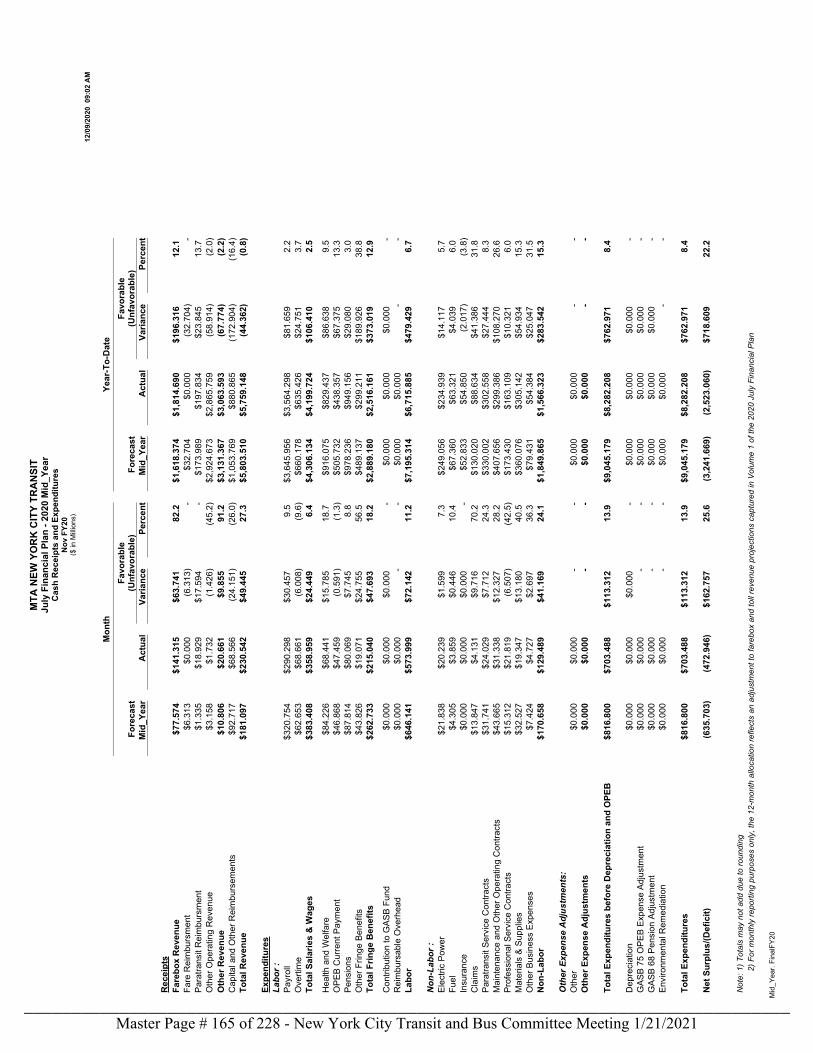
MTA
NEW
YO
RK
CIT
Y TR
AN
SIT
July
Fin
anci
al P
lan
- 202
0 M
id_Y
ear
Cas
h R
ecei
pts
and
Expe
nditu
res
Nov
FY2
0($
in M
illion
s)
12/0
9/20
20 0
9:02
AM
Mid
_Yea
r. Fi
nalF
Y20
Mon
thYe
ar-T
o-D
ate
Fore
cast
Favo
rabl
e(U
nfav
orab
le)
Fore
cast
Favo
rabl
e(U
nfav
orab
le)
Mid
_Yea
rA
ctua
lVa
rianc
ePe
rcen
tM
id_Y
ear
Act
ual
Varia
nce
Perc
ent
Rec
eipt
sFa
rebo
x R
even
ue$7
7.57
4 $1
41.3
15
$63.
741
82.2
$1
,618
.374
$1
,814
.690
$1
96.3
16
12.1
Fa
re R
eim
burs
men
t$6
.313
$0
.000
(6
.313
)-
$32.
704
$0.0
00
(32.
704)
-Pa
ratra
nsit
Rei
mbu
rsm
ent
$1.3
35
$18.
929
$17.
594
-$1
73.9
89
$197
.834
$2
3.84
5 13
.7
Oth
er O
pera
ting
Rev
enue
$3.1
58
$1.7
32
(1.4
26)
(45.
2)$2
,924
.673
$2
,865
.759
(5
8.91
4)(2
.0)
Oth
er R
even
ue$1
0.80
6 $2
0.66
1 $9
.855
91
.2
$3,1
31.3
67
$3,0
63.5
93
(67.
774)
(2.2
)C
apita
l and
Oth
er R
eim
burs
emen
ts$9
2.71
7 $6
8.56
6 (2
4.15
1)(2
6.0)
$1,0
53.7
69
$880
.865
(1
72.9
04)
(16.
4)To
tal R
even
ue$1
81.0
97
$230
.542
$4
9.44
5 27
.3
$5,8
03.5
10
$5,7
59.1
48
(44.
362)
(0.8
)
Expe
nditu
res
Labo
r :Pa
yrol
l$3
20.7
54
$290
.298
$3
0.45
7 9.
5 $3
,645
.956
$3
,564
.298
$8
1.65
9 2.
2 O
verti
me
$62.
653
$68.
661
(6.0
08)
(9.6
)$6
60.1
78
$635
.426
$2
4.75
1 3.
7 To
tal S
alar
ies
& W
ages
$383
.408
$3
58.9
59
$24.
449
6.4
$4,3
06.1
34
$4,1
99.7
24
$106
.410
2.
5
Hea
lth a
nd W
elfa
re$8
4.22
6 $6
8.44
1 $1
5.78
5 18
.7
$916
.075
$8
29.4
37
$86.
638
9.5
OPE
B C
urre
nt P
aym
ent
$46.
868
$47.
459
(0.5
91)
(1.3
)$5
05.7
32
$438
.357
$6
7.37
5 13
.3
Pens
ions
$87.
814
$80.
069
$7.7
45
8.8
$978
.236
$9
49.1
56
$29.
080
3.0
Oth
er F
ringe
Ben
efits
$43.
826
$19.
071
$24.
755
56.5
$4
89.1
37
$299
.211
$1
89.9
26
38.8
To
tal F
ringe
Ben
efits
$262
.733
$2
15.0
40
$47.
693
18.2
$2
,889
.180
$2
,516
.161
$3
73.0
19
12.9
Con
tribu
tion
to G
ASB
Fund
$0.0
00
$0.0
00
$0.0
00
-$0
.000
$0
.000
$0
.000
-
Rei
mbu
rsab
le O
verh
ead
$0.0
00
$0.0
00
- -
$0.0
00
$0.0
00
- -
Labo
r$6
46.1
41
$573
.999
$7
2.14
2 11
.2
$7,1
95.3
14
$6,7
15.8
85
$479
.429
6.
7
Non
-Lab
or :
Elec
tric
Pow
er$2
1.83
8 $2
0.23
9 $1
.599
7.
3 $2
49.0
56
$234
.939
$1
4.11
7 5.
7 Fu
el$4
.305
$3
.859
$0
.446
10
.4
$67.
360
$63.
321
$4.0
39
6.0
Insu
ranc
e$0
.000
$0
.000
$0
.000
-
$52.
833
$54.
850
(2.0
17)
(3.8
)C
laim
s$1
3.84
7 $4
.131
$9
.716
70
.2
$130
.020
$8
8.63
4 $4
1.38
6 31
.8
Para
trans
it Se
rvic
e C
ontra
cts
$31.
741
$24.
029
$7.7
12
24.3
$3
30.0
02
$302
.558
$2
7.44
4 8.
3 M
aint
enan
ce a
nd O
ther
Ope
ratin
g C
ontra
cts
$43.
665
$31.
338
$12.
327
28.2
$4
07.6
56
$299
.386
$1
08.2
70
26.6
Pr
ofes
sion
al S
ervi
ce C
ontra
cts
$15.
312
$21.
819
(6.5
07)
(42.
5)$1
73.4
30
$163
.109
$1
0.32
1 6.
0 M
ater
ials
& S
uppl
ies
$32.
527
$19.
347
$13.
180
40.5
$3
60.0
76
$305
.142
$5
4.93
4 15
.3
Oth
er B
usin
ess
Expe
nses
$7.4
24
$4.7
27
$2.6
97
36.3
$7
9.43
1 $5
4.38
4 $2
5.04
7 31
.5
Non
-Lab
or$1
70.6
58
$129
.489
$4
1.16
9 24
.1
$1,8
49.8
65
$1,5
66.3
23
$283
.542
15
.3
Oth
er E
xpen
se A
djus
tmen
ts:
Oth
er$0
.000
$0
.000
-
-$0
.000
$0
.000
-
-O
ther
Exp
ense
Adj
ustm
ents
$0.0
00
$0.0
00
- -
$0.0
00
$0.0
00
- -
Tota
l Exp
endi
ture
s be
fore
Dep
reci
atio
n an
d O
PEB
$816
.800
$7
03.4
88
$113
.312
13
.9
$9,0
45.1
79
$8,2
82.2
08
$762
.971
8.
4
Dep
reci
atio
n$0
.000
$0
.000
$0
.000
-
$0.0
00
$0.0
00
$0.0
00
-G
ASB
75 O
PEB
Expe
nse
Adju
stm
ent
$0.0
00
$0.0
00
- -
$0.0
00
$0.0
00
$0.0
00
-G
ASB
68 P
ensi
on A
djus
tmen
t$0
.000
$0
.000
-
-$0
.000
$0
.000
$0
.000
-
Envi
ronm
enta
l Rem
edia
tion
$0.0
00
$0.0
00
- -
$0.0
00
$0.0
00
- -
Tota
l Exp
endi
ture
s$8
16.8
00
$703
.488
$1
13.3
12
13.9
$9
,045
.179
$8
,282
.208
$7
62.9
71
8.4
Net
Sur
plus
/(Def
icit)
(635
.703
)(4
72.9
46)
$162
.757
25
.6
(3,2
41.6
69)
(2,5
23.0
60)
$718
.609
22
.2
Not
e: 1
) Tot
als
may
not
add
due
to ro
undi
ng2)
For
mon
thly
repo
rting
pur
pose
s on
ly, t
he 1
2-m
onth
allo
catio
n re
flect
s an
adj
ustm
ent t
o fa
rebo
x an
d to
ll re
venu
e pr
ojec
tions
cap
ture
d in
Vol
ume
1 of
the
2020
Jul
y Fi
nanc
ial P
lan
Master Page # 165 of 228 - New York City Transit and Bus Committee Meeting 1/21/2021________________________________________________________________________________
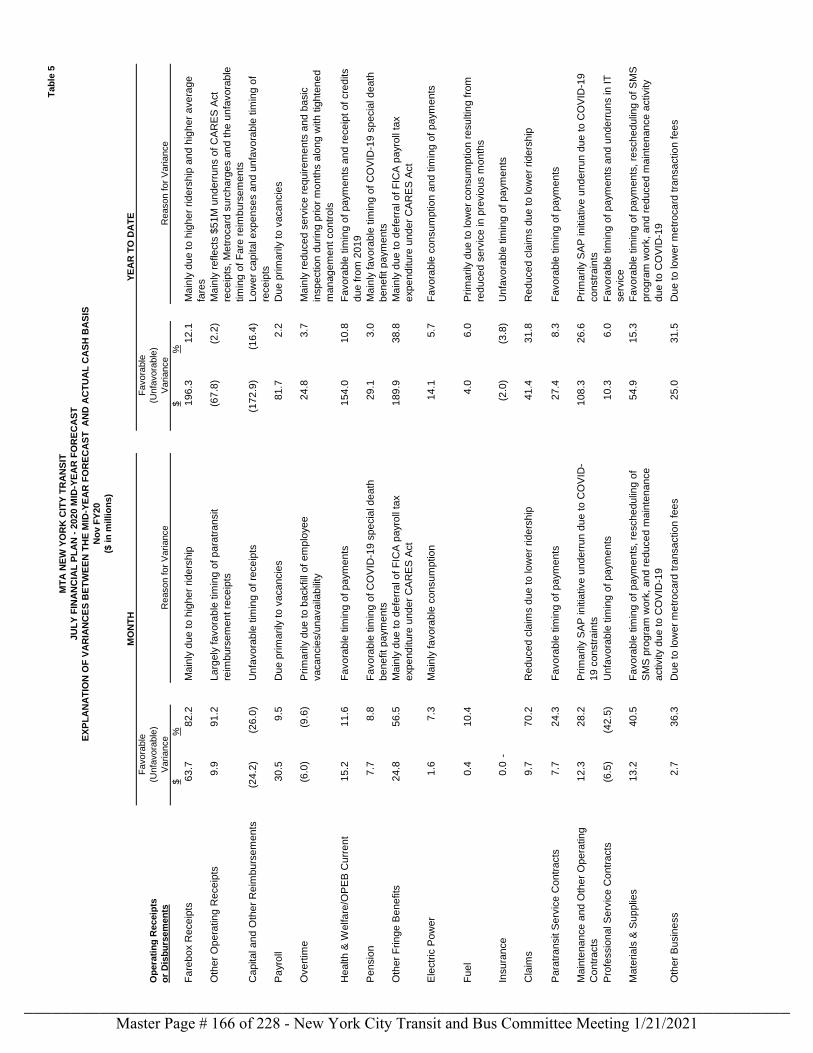
Tab
le 5
MT
A N
EW
YO
RK
CIT
Y T
RA
NS
IT
JU
LY
FIN
AN
CIA
L P
LA
N -
2020 M
ID-Y
EA
R F
OR
EC
AS
T
EX
PL
AN
AT
ION
OF
VA
RIA
NC
ES
BE
TW
EE
N T
HE
MID
-YE
AR
FO
RE
CA
ST
A
ND
AC
TU
AL
CA
SH
BA
SIS
No
v F
Y20
($ in
millio
ns)
MO
NT
HY
EA
R T
O D
AT
E
Favora
ble
Favora
ble
Op
era
tin
g R
eceip
ts(U
nfa
vora
ble
)(U
nfa
vora
ble
)
or
Dis
bu
rsem
en
tsV
ariance
Reason for
Variance
Variance
Reason for
Variance
$%
$%
Fa
reb
ox R
ece
ipts
63
.7
82
.2
Ma
inly
du
e t
o h
igh
er
rid
ers
hip
1
96
.3
12
.1
Ma
inly
du
e t
o h
igh
er
rid
ers
hip
an
d h
igh
er
ave
rag
e
fare
s
Oth
er
Op
era
tin
g R
ece
ipts
9.9
9
1.2
L
arg
ely
fa
vo
rab
le t
imin
g o
f p
ara
tra
nsit
reim
bu
rse
me
nt
rece
ipts
(67
.8)
(2.2
)M
ain
ly r
efle
cts
$5
1M
un
de
rru
ns o
f C
AR
ES
Act
rece
ipts
, M
etr
oca
rd s
urc
ha
rge
s a
nd
th
e u
nfa
vo
rab
le
tim
ing
of
Fa
re r
eim
bu
rse
me
nts
Ca
pita
l a
nd
Oth
er
Re
imb
urs
em
en
ts(2
4.2
)(2
6.0
)U
nfa
vo
rab
le t
imin
g o
f re
ce
ipts
(17
2.9
)(1
6.4
)L
ow
er
ca
pita
l e
xp
en
se
s a
nd
un
favo
rab
le t
imin
g o
f
rece
ipts
Pa
yro
ll3
0.5
9
.5
Du
e p
rim
arily
to
va
ca
ncie
s8
1.7
2
.2
Du
e p
rim
arily
to
va
ca
ncie
s
Ove
rtim
e(6
.0)
(9.6
)P
rim
arily
du
e t
o b
ackfill
of
em
plo
ye
e
va
ca
ncie
s/u
na
va
ilab
ility
24
.8
3.7
M
ain
ly r
ed
uce
d s
erv
ice
re
qu
ire
me
nts
an
d b
asic
insp
ectio
n d
urin
g p
rio
r m
on
ths a
lon
g w
ith
tig
hte
ne
d
ma
na
ge
me
nt
co
ntr
ols
He
alth
& W
elfa
re/O
PE
B C
urr
en
t1
5.2
1
1.6
F
avo
rab
le t
imin
g o
f p
aym
en
ts1
54
.0
10
.8
Fa
vo
rab
le t
imin
g o
f p
aym
en
ts a
nd
re
ce
ipt
of
cre
dits
du
e f
rom
20
19
Pe
nsio
n7
.7
8.8
F
avo
rab
le t
imin
g o
f C
OV
ID-1
9 s
pe
cia
l d
ea
th
be
ne
fit
pa
ym
en
ts
29
.1
3.0
M
ain
ly f
avo
rab
le t
imin
g o
f C
OV
ID-1
9 s
pe
cia
l d
ea
th
be
ne
fit
pa
ym
en
ts
Oth
er
Frin
ge
Be
ne
fits
24
.8
56
.5
Ma
inly
du
e t
o d
efe
rra
l o
f F
ICA
pa
yro
ll ta
x
exp
en
ditu
re u
nd
er
CA
RE
S A
ct
18
9.9
3
8.8
M
ain
ly d
ue
to
de
ferr
al o
f F
ICA
pa
yro
ll ta
x
exp
en
ditu
re u
nd
er
CA
RE
S A
ct
Ele
ctr
ic P
ow
er
1.6
7
.3
Ma
inly
fa
vo
rab
le c
on
su
mp
tio
n1
4.1
5
.7
Fa
vo
rab
le c
on
su
mp
tio
n a
nd
tim
ing
of
pa
ym
en
ts
Fu
el
0.4
1
0.4
4
.0
6.0
P
rim
arily
du
e t
o lo
we
r co
nsu
mp
tio
n r
esu
ltin
g f
rom
red
uce
d s
erv
ice
in
pre
vio
us m
on
ths
Insu
ran
ce
0.0
-(2
.0)
(3.8
)U
nfa
vo
rab
le t
imin
g o
f p
aym
en
ts
Cla
ims
9.7
7
0.2
R
ed
uce
d c
laim
s d
ue
to
lo
we
r rid
ers
hip
41
.4
31
.8
Re
du
ce
d c
laim
s d
ue
to
lo
we
r rid
ers
hip
Pa
ratr
an
sit S
erv
ice
Co
ntr
acts
7.7
2
4.3
F
avo
rab
le t
imin
g o
f p
aym
en
ts2
7.4
8
.3
Fa
vo
rab
le t
imin
g o
f p
aym
en
ts
Ma
inte
na
nce
an
d O
the
r O
pe
ratin
g
Co
ntr
acts
12
.3
28
.2
Prim
arily
SA
P in
itia
tive
un
de
rru
n d
ue
to
CO
VID
-
19
co
nstr
ain
ts
10
8.3
2
6.6
P
rim
arily
SA
P in
itia
tive
un
de
rru
n d
ue
to
CO
VID
-19
co
nstr
ain
ts
Pro
fessio
na
l S
erv
ice
Co
ntr
acts
(6.5
)(4
2.5
)U
nfa
vo
rab
le t
imin
g o
f p
aym
en
ts1
0.3
6
.0
Fa
vo
rab
le t
imin
g o
f p
aym
en
ts a
nd
un
de
rru
ns in
IT
se
rvic
e
Ma
teria
ls &
Su
pp
lies
13
.2
40
.5
Fa
vo
rab
le t
imin
g o
f p
aym
en
ts,
resch
ed
ulin
g o
f
SM
S p
rog
ram
wo
rk,
an
d r
ed
uce
d m
ain
ten
an
ce
activity d
ue
to
CO
VID
-19
54
.9
15
.3
Fa
vo
rab
le t
imin
g o
f p
aym
en
ts,
resch
ed
ulin
g o
f S
MS
pro
gra
m w
ork
, a
nd
re
du
ce
d m
ain
ten
an
ce
activity
du
e t
o C
OV
ID-1
9
Oth
er
Bu
sin
ess
2.7
3
6.3
D
ue
to
lo
we
r m
etr
oca
rd t
ran
sa
ctio
n f
ee
s2
5.0
3
1.5
D
ue
to
lo
we
r m
etr
oca
rd t
ran
sa
ctio
n f
ee
s
Master Page # 166 of 228 - New York City Transit and Bus Committee Meeting 1/21/2021________________________________________________________________________________
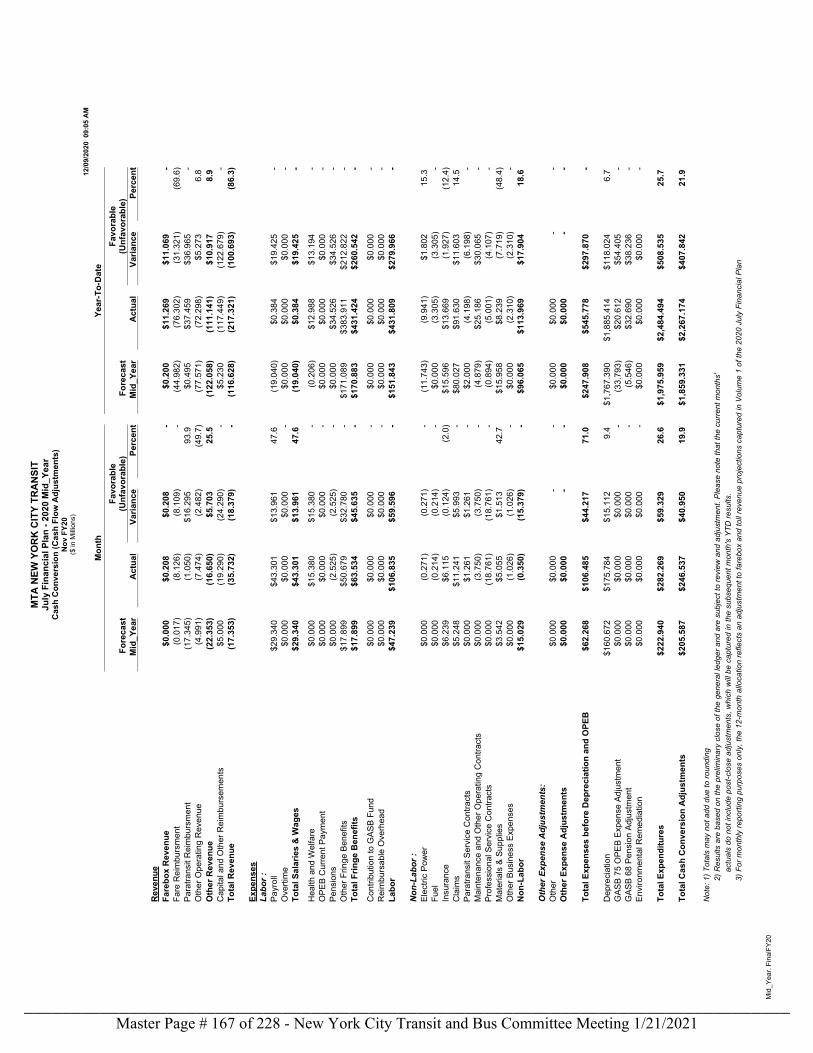
MTA
NEW
YO
RK
CIT
Y TR
AN
SIT
July
Fin
anci
al P
lan
- 202
0 M
id_Y
ear
Cas
h C
onve
rsio
n (C
ash
Flow
Adj
ustm
ents
)N
ov F
Y20
($ in
Milli
ons)
12/0
9/20
20 0
9:05
AM
Mid
_Yea
r. Fi
nalF
Y20
Mon
thYe
ar-T
o-D
ate
Fore
cast
Favo
rabl
e(U
nfav
orab
le)
Fore
cast
Favo
rabl
e(U
nfav
orab
le)
Mid
_Yea
rA
ctua
lVa
rianc
ePe
rcen
tM
id_Y
ear
Act
ual
Varia
nce
Perc
ent
Rev
enue
Fare
box
Rev
enue
$0.0
00
$0.2
08
$0.2
08
-$0
.200
$1
1.26
9 $1
1.06
9 -
Fare
Rei
mbu
rsm
ent
(0.0
17)
(8.1
26)
(8.1
09)
-(4
4.98
2)(7
6.30
2)(3
1.32
1)(6
9.6)
Para
trans
it R
eim
burs
men
t(1
7.34
5)(1
.050
)$1
6.29
5 93
.9
$0.4
95
$37.
459
$36.
965
-O
ther
Ope
ratin
g R
even
ue(4
.991
)(7
.474
)(2
.482
)(4
9.7)
(77.
571)
(72.
298)
$5.2
73
6.8
Oth
er R
even
ue(2
2.35
3)(1
6.65
0)$5
.703
25
.5
(122
.058
)(1
11.1
41)
$10.
917
8.9
Cap
ital a
nd O
ther
Rei
mbu
rsem
ents
$5.0
00
(19.
290)
(24.
290)
-$5
.230
(1
17.4
49)
(122
.679
)-
Tota
l Rev
enue
(17.
353)
(35.
732)
(18.
379)
-(1
16.6
28)
(217
.321
)(1
00.6
93)
(86.
3)
Expe
nses
Labo
r :Pa
yrol
l$2
9.34
0 $4
3.30
1 $1
3.96
1 47
.6
(19.
040)
$0.3
84
$19.
425
-O
verti
me
$0.0
00
$0.0
00
$0.0
00
-$0
.000
$0
.000
$0
.000
-
Tota
l Sal
arie
s &
Wag
es$2
9.34
0 $4
3.30
1 $1
3.96
1 47
.6
(19.
040)
$0.3
84
$19.
425
-
Hea
lth a
nd W
elfa
re$0
.000
$1
5.38
0 $1
5.38
0 -
(0.2
06)
$12.
988
$13.
194
-O
PEB
Cur
rent
Pay
men
t$0
.000
$0
.000
$0
.000
-
$0.0
00
$0.0
00
$0.0
00
-Pe
nsio
ns$0
.000
(2
.525
)(2
.525
) -
$0.0
00
$34.
526
$34.
526
-O
ther
Frin
ge B
enef
its$1
7.89
9 $5
0.67
9 $3
2.78
0 -
$171
.089
$3
83.9
11
$212
.822
-
Tota
l Frin
ge B
enef
its$1
7.89
9 $6
3.53
4 $4
5.63
5 -
$170
.883
$4
31.4
24
$260
.542
-
Con
tribu
tion
to G
ASB
Fund
$0.0
00
$0.0
00
$0.0
00
-$0
.000
$0
.000
$0
.000
-
Rei
mbu
rsab
le O
verh
ead
$0.0
00
$0.0
00
$0.0
00
-$0
.000
$0
.000
$0
.000
-
Labo
r$4
7.23
9 $1
06.8
35
$59.
596
-$1
51.8
43
$431
.809
$2
79.9
66
-
Non
-Lab
or :
Elec
tric
Pow
er$0
.000
(0
.271
)(0
.271
) -
(11.
743)
(9.9
41)
$1.8
02
15.3
Fu
el$0
.000
(0
.214
)(0
.214
) -
$0.0
00
(3.3
05)
(3.3
05)
-In
sura
nce
$6.2
39
$6.1
15
(0.1
24)
(2.0
)$1
5.59
6 $1
3.66
9 (1
.927
)(1
2.4)
Cla
ims
$5.2
48
$11.
241
$5.9
93
-$8
0.02
7 $9
1.63
0 $1
1.60
3 14
.5
Para
trans
it Se
rvic
e C
ontra
cts
$0.0
00
$1.2
61
$1.2
61
-$2
.000
(4
.198
)(6
.198
)-
Mai
nten
ance
and
Oth
er O
pera
ting
Con
tract
s$0
.000
(3
.750
)(3
.750
) -
(4.8
79)
$25.
186
$30.
065
-Pr
ofes
sion
al S
ervi
ce C
ontra
cts
$0.0
00
(18.
761)
(18.
761)
-(0
.894
)(5
.001
)(4
.107
)-
Mat
eria
ls &
Sup
plie
s$3
.542
$5
.055
$1
.513
42
.7
$15.
958
$8.2
39
(7.7
19)
(48.
4)O
ther
Bus
ines
s Ex
pens
es$0
.000
(1
.026
)(1
.026
) -
$0.0
00
(2.3
10)
(2.3
10)
-N
on-L
abor
$15.
029
(0.3
50)
(15.
379)
-$9
6.06
5 $1
13.9
69
$17.
904
18.6
Oth
er E
xpen
se A
djus
tmen
ts:
Oth
er$0
.000
$0
.000
-
-$0
.000
$0
.000
-
-O
ther
Exp
ense
Adj
ustm
ents
$0.0
00
$0.0
00
- -
$0.0
00
$0.0
00
- -
Tota
l Exp
ense
s be
fore
Dep
reci
atio
n an
d O
PEB
$62.
268
$106
.485
$4
4.21
7 71
.0
$247
.908
$5
45.7
78
$297
.870
-
Dep
reci
atio
n$1
60.6
72
$175
.784
$1
5.11
2 9.
4 $1
,767
.390
$1
,885
.414
$1
18.0
24
6.7
GAS
B 75
OPE
B Ex
pens
e Ad
just
men
t$0
.000
$0
.000
$0
.000
-
(33.
793)
$20.
612
$54.
405
-G
ASB
68 P
ensi
on A
djus
tmen
t$0
.000
$0
.000
$0
.000
-
(5.5
46)
$32.
690
$38.
236
-En
viro
nmen
tal R
emed
iatio
n$0
.000
$0
.000
$0
.000
-
$0.0
00
$0.0
00
$0.0
00
-
Tota
l Exp
endi
ture
s$2
22.9
40
$282
.269
$5
9.32
9 26
.6
$1,9
75.9
59
$2,4
84.4
94
$508
.535
25
.7
Tota
l Cas
h C
onve
rsio
n A
djus
tmen
ts$2
05.5
87
$246
.537
$4
0.95
0 19
.9
$1,8
59.3
31
$2,2
67.1
74
$407
.842
21
.9
Not
e: 1
) Tot
als
may
not
add
due
to ro
undi
ng2)
Res
ults
are
bas
ed o
n th
e pr
elim
inar
y cl
ose
of th
e ge
nera
l led
ger a
nd a
re s
ubje
ct to
revi
ew a
nd a
djus
tmen
t. P
leas
e no
te th
at th
e cu
rren
t mon
ths'
actu
als
do n
ot in
clud
e po
st-c
lose
adj
ustm
ents
, whi
ch w
ill b
e ca
ptur
ed in
the
subs
eque
nt m
onth
's Y
TD re
sults
.3)
For
mon
thly
repo
rting
pur
pose
s on
ly, t
he 1
2-m
onth
allo
catio
n re
flect
s an
adj
ustm
ent t
o fa
rebo
x an
d to
ll re
venu
e pr
ojec
tions
cap
ture
d in
Vol
ume
1 of
the
2020
Jul
y Fi
nanc
ial P
lan
Master Page # 167 of 228 - New York City Transit and Bus Committee Meeting 1/21/2021________________________________________________________________________________
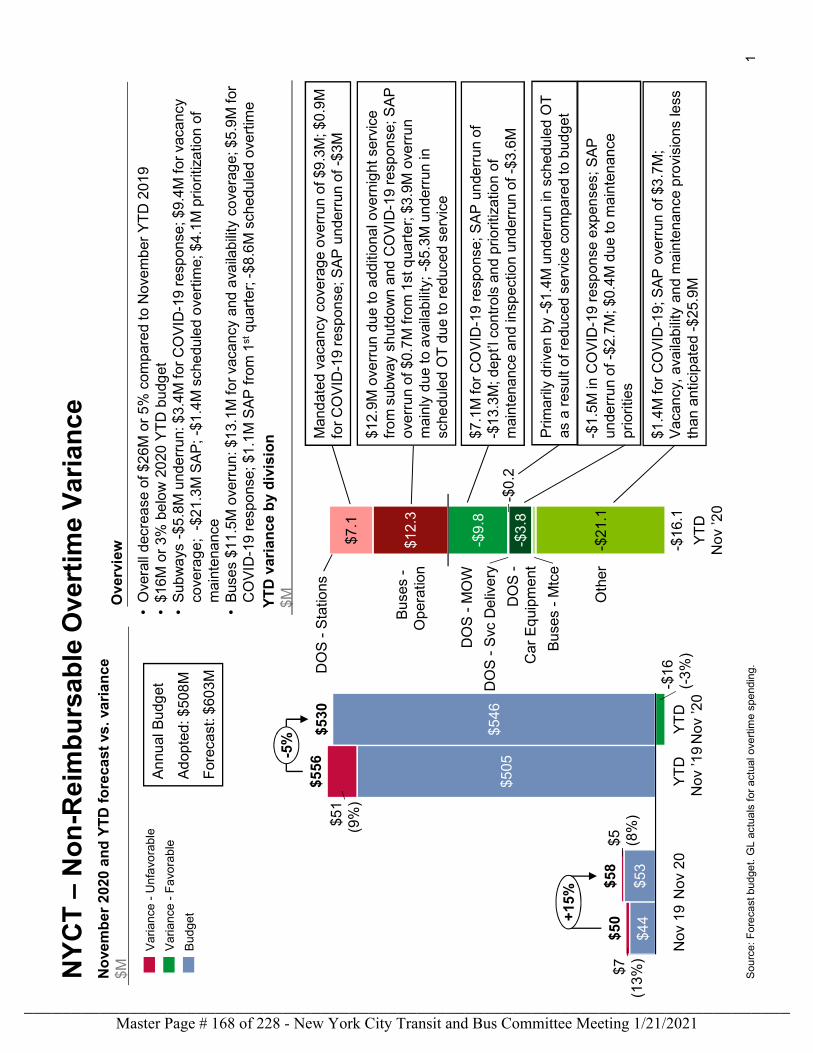
1
NY
CT
–N
on
-Re
imb
urs
ab
le O
vert
ime
Va
rian
ce
Sou
rce:
Fo
reca
st b
udge
t. G
L a
ctua
ls f
or a
ctua
l ove
rtim
e s
pend
ing.
No
vem
be
r 2
020
an
d Y
TD
fo
reca
st v
s. v
ari
an
ce$M
YT
D v
aria
nce
by
div
isio
n
$M
$12.
9M o
verr
un d
ue
to a
dditi
ona
l ove
rnig
ht s
ervi
ce
fro
m s
ubw
ay s
hut
dow
n an
d C
OV
ID-1
9 re
spon
se; S
AP
ov
err
un
of $
0.7
M f
rom
1st
qua
rte
r; $
3.9M
ove
rru
n m
ainl
y d
ue to
ava
ilab
ility
; -$
5.3M
un
derr
un in
sc
hedu
led
OT
du
e to
red
uce
d se
rvic
e
-$1
.5M
in C
OV
ID-1
9 re
spon
se e
xpen
ses;
SA
P
unde
rru
n o
f -$2
.7M
; $0
.4M
due
to m
ain
ten
ance
pr
iori
ties
$1.4
M f
or C
OV
ID-1
9; S
AP
ove
rru
n o
f $3
.7M
; V
aca
ncy
, av
aila
bilit
y an
d m
ain
tena
nce
pro
visi
ons
less
th
an a
ntic
ipat
ed
-$25
.9M
•O
vera
ll d
ecre
ase
of $
26M
or
5%
com
pare
d to
Nov
em
ber
YT
D 2
019
•$1
6M
or
3% b
elo
w 2
020
YT
D b
udg
et•
Sub
wa
ys -
$5.8
M u
nde
rru
n: $
3.4
M f
or C
OV
ID-1
9 r
esp
onse
; $9.
4M
for
vac
anc
yco
vera
ge
; -$
21.
3M S
AP
; -$
1.4
M s
che
dule
d o
vert
ime;
$4.
1M
prio
ritiz
atio
n o
fm
aint
ena
nce
•B
use
s $1
1.5M
ove
rrun
: $1
3.1M
fo
r va
canc
y an
d a
vaila
bilit
y co
vera
ge;
$5.
9M
for
CO
VID
-19
res
pons
e; $
1.1
M S
AP
fro
m 1
stq
uar
ter;
-$
8.6
M s
ched
uled
ove
rtim
e
Ove
rvie
w
$44
$53
$505
$546
$51
(9%
)
YT
D
Nov
’19
-$1
6(-
3%
)
$7(1
3%
)
Nov
20
Nov
19
$58
YT
D
Nov
’20
$5 (8%
)$5
0
$556
$530
+15
%
-5%
Bu
dg
et
Va
ria
nce
-F
avo
rab
le
Va
ria
nce
-U
nfa
vora
ble
$12.
3
$7.1
-$9
.8
-$0
.2-$
3.8
-$2
1.1
Bu
ses
-M
tce
YT
D
Nov
’20
DO
S -
Car
Eq
uipm
ent
DO
S -
MO
W
DO
S -
Svc
De
live
ry
Bu
ses
-O
per
atio
n
Oth
er
-$1
6.1
An
nual
Bu
dget
Ad
opte
d: $
508
M
For
eca
st: $
603M
$7.1
M f
or C
OV
ID-1
9 r
esp
ons
e; S
AP
un
derr
un
of
-$1
3.3
M; d
ept’l
con
trol
s an
d p
riorit
izat
ion
of
mai
nten
anc
e a
nd
insp
ectio
n u
nder
run
of -
$3.6
M
DO
S -
Sta
tions
Man
dat
ed v
aca
ncy
cov
era
ge
ove
rru
n o
f $9
.3M
; $0.
9M
fo
r C
OV
ID-1
9 re
spon
se; S
AP
un
derr
un o
f -$
3M
Pri
ma
rily
driv
en b
y -$
1.4M
un
derr
un in
sch
edu
led
OT
as
a r
esu
lt of
re
duce
d se
rvic
e c
omp
ared
to b
udg
et
Master Page # 168 of 228 - New York City Transit and Bus Committee Meeting 1/21/2021________________________________________________________________________________
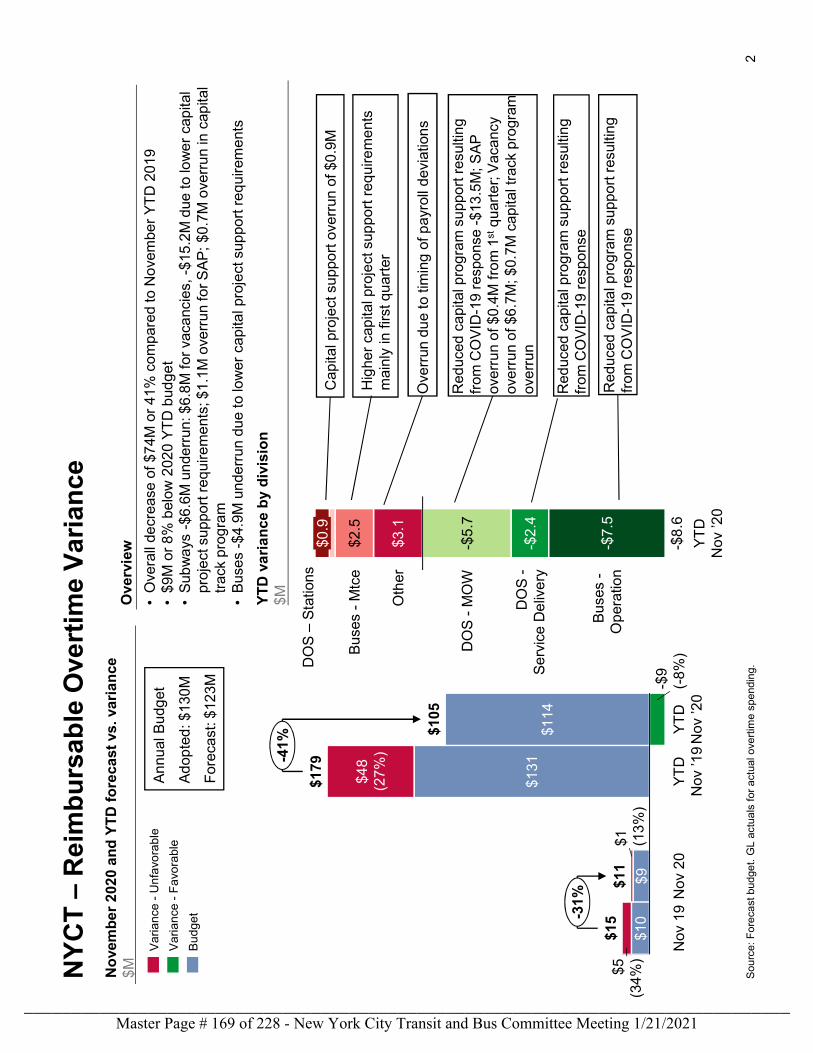
2
NY
CT
–R
eim
bu
rsa
ble
Ove
rtim
e V
ari
an
ce
Sou
rce:
Fo
reca
st b
udge
t. G
L a
ctua
ls f
or a
ctua
l ove
rtim
e s
pend
ing.
No
vem
be
r 2
020
an
d Y
TD
fo
reca
st v
s. v
ari
an
ce$M
YT
D v
ari
an
ce b
y d
ivis
ion
$M•O
vera
ll de
crea
se o
f $7
4M o
r 4
1% c
om
par
ed to
No
vem
ber
YT
D 2
019
•$9
M o
r 8
% b
elow
202
0 Y
TD
bud
ge
t•
Sub
wa
ys -
$6.6
M u
nde
rru
n: $
6.8
M f
or v
aca
ncie
s, -
$15
.2M
due
to
low
er
cap
ital
pro
ject
su
ppo
rt r
equ
irem
ent
s; $
1.1
M o
verr
un
for
SA
P;
$0.7
M o
verr
un
in c
apita
ltr
ack
pro
gra
m•
Bus
es
-$4.
9M u
nde
rrun
du
e to
low
er c
api
tal p
roje
ct s
uppo
rt r
eq
uire
me
nts
Ove
rvie
w
$10
$9
$131
$114
-$9
(-8
%)
$5(3
4%
)
Nov
19
$1 (13
%)
Nov
20
$48
(27
%)
$11
YT
D
Nov
’19
YT
D
Nov
’20
$105
$15
$179
-31
%
-41
%
Bu
dg
et
Va
ria
nce
-U
nfa
vora
ble
Va
ria
nce
-F
avo
rab
le
$3.1
$2.5
-$5
.7
-$2
.4
-$7
.5
$0.9
Bu
ses
-O
per
atio
n
Oth
er
DO
S -
Se
rvic
e D
eliv
ery
YT
D
Nov
’20
-$8
.6
DO
S -
MO
W
Bu
ses
-M
tce
An
nual
Bu
dget
Ad
opte
d: $
130
M
For
eca
st: $
123M
Ove
rrun
du
e to
tim
ing
of p
ayro
ll d
evia
tion
s
Red
uced
ca
pita
l pro
gra
m s
upp
ort
res
ultin
g
from
CO
VID
-19
res
pons
e -
$13
.5M
; SA
P
ove
rru
n o
f $0
.4M
fro
m 1
stq
uar
ter;
Vac
anc
y ov
err
un
of $
6.7
M; $
0.7M
cap
ital t
rack
pro
gram
ov
err
un
Red
uced
ca
pita
l pro
gra
m s
upp
ort
res
ultin
g
from
CO
VID
-19
res
pons
e
Hig
her
cap
ital p
roje
ct s
uppo
rt r
eq
uire
me
nts
mai
nly
in f
irst q
uar
ter
Cap
ital p
roje
ct s
upp
ort
ove
rrun
of $
0.9
M
Red
uced
ca
pita
l pro
gra
m s
upp
ort
res
ultin
g
from
CO
VID
-19
res
pons
e
DO
S –
Sta
tion
s
Master Page # 169 of 228 - New York City Transit and Bus Committee Meeting 1/21/2021________________________________________________________________________________
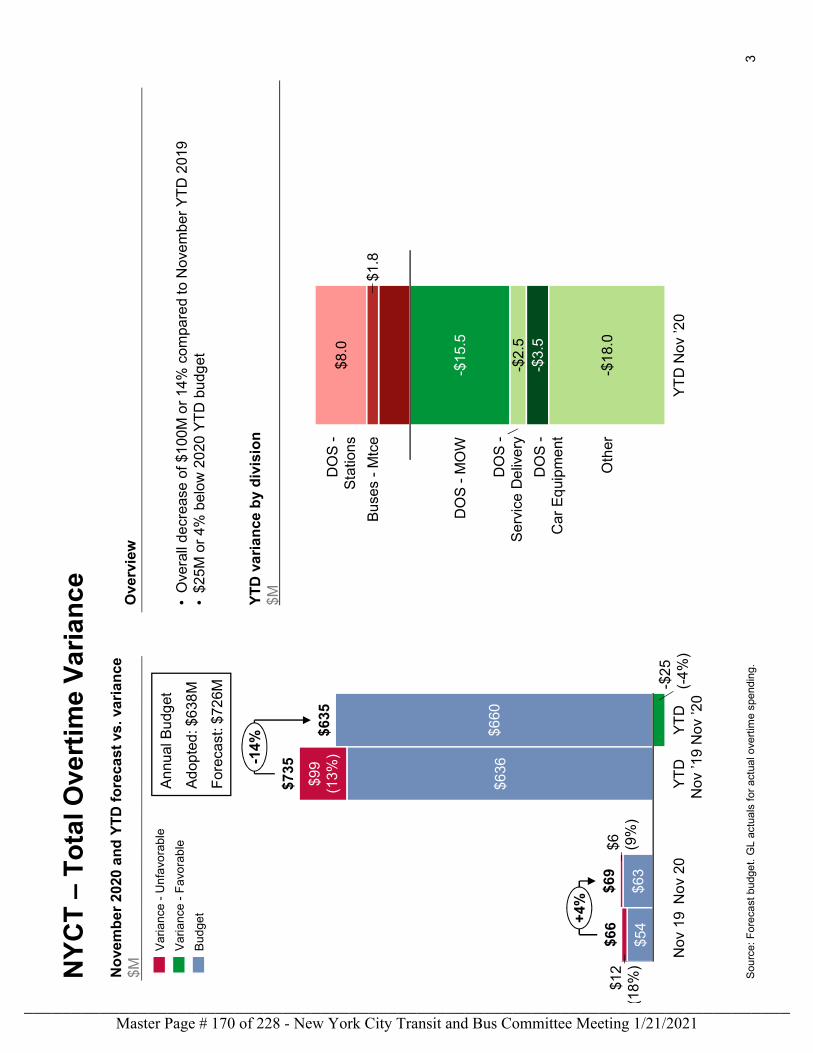
3
NY
CT
–T
ota
l Ove
rtim
e V
ari
an
ce
Sou
rce:
Fo
reca
st b
udge
t. G
L a
ctua
ls f
or a
ctua
l ove
rtim
e s
pend
ing.
No
vem
be
r 2
020
an
d Y
TD
fo
reca
st v
s. v
ari
an
ce$M
YT
D v
ari
an
ce b
y d
ivis
ion
$M•O
vera
ll de
crea
se o
f $1
00M
or
14%
com
pare
d to
Nov
em
ber
YT
D 2
019
•$2
5M
or
4% b
elo
w 2
020
YT
D b
udg
et
Ove
rvie
w
$54
$63
$636
$660
-$2
5(-
4%
)
$12
( 18
%)
YT
D
Nov
’19
Nov
19
No
v 20
$6 (9%
)
$99
(13
%)
YT
D
Nov
’20
$69
$66
$735
$635
+4%
-14
%
Va
ria
nce
-U
nfa
vora
ble
Bu
dg
et
Va
ria
nce
-F
avo
rab
le
$1.8
$8.0
-$1
5.5
-$2
.5-$
3.5
-$1
8.0
DO
S -
Car
Eq
uip
me
nt
YT
D N
ov ’2
0
DO
S -
MO
W
DO
S -
Se
rvic
e D
eliv
ery
DO
S -
Sta
tion
s
Bu
ses
-M
tce
Oth
er
An
nual
Bu
dget
Ad
opte
d: $
638
M
For
eca
st: $
726M
Master Page # 170 of 228 - New York City Transit and Bus Committee Meeting 1/21/2021________________________________________________________________________________
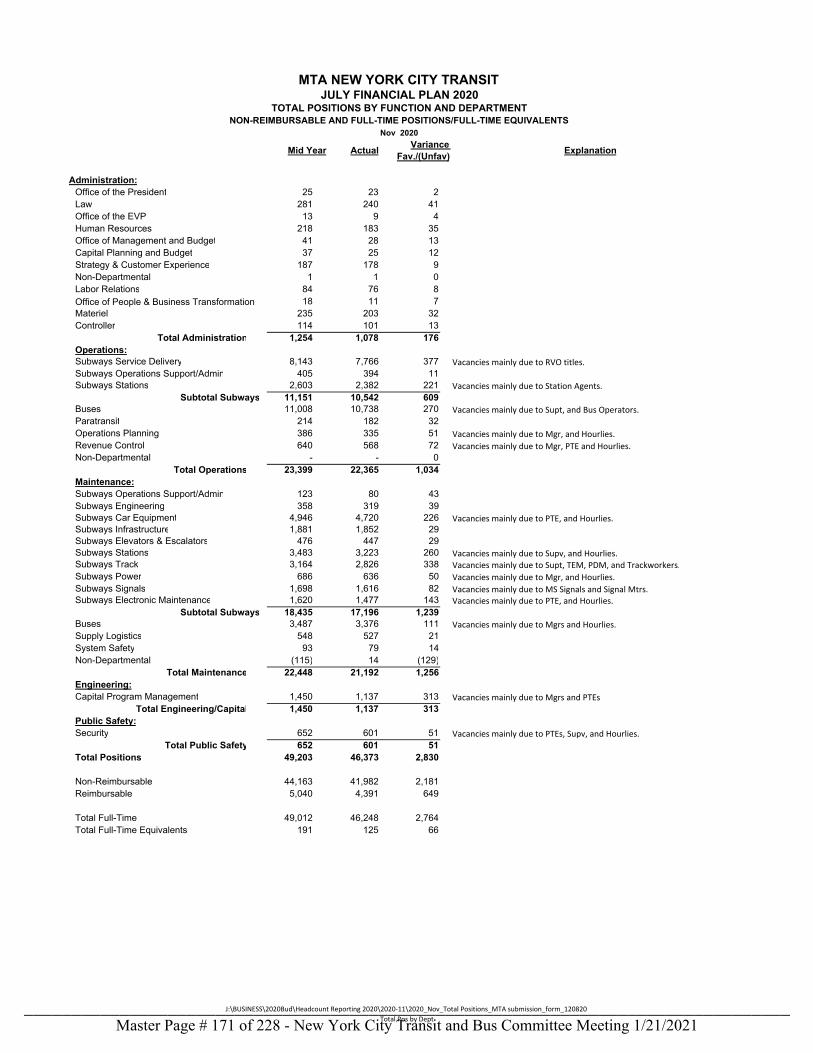
Administration:Office of the President 25 23 2 Law 281 240 41 Office of the EVP 13 9 4 Human Resources 218 183 35 Office of Management and Budget 41 28 13 Capital Planning and Budget 37 25 12 Strategy & Customer Experience 187 178 9 Non-Departmental 1 1 0 Labor Relations 84 76 8 Office of People & Business Transformation 18 11 7 Materiel 235 203 32 Controller 114 101 13
Total Administration 1,254 1,078 176 Operations:Subways Service Delivery 8,143 7,766 377 Subways Operations Support/Admin 405 394 11 Subways Stations 2,603 2,382 221
Subtotal Subways 11,151 10,542 609 Buses 11,008 10,738 270 Paratransit 214 182 32 Operations Planning 386 335 51 Revenue Control 640 568 72 Non-Departmental - - 0
Total Operations 23,399 22,365 1,034 Maintenance:Subways Operations Support/Admin 123 80 43 Subways Engineering 358 319 39 Subways Car Equipment 4,946 4,720 226 Subways Infrastructure 1,881 1,852 29 Subways Elevators & Escalators 476 447 29 Subways Stations 3,483 3,223 260 Subways Track 3,164 2,826 338 Subways Power 686 636 50 Subways Signals 1,698 1,616 82 Subways Electronic Maintenance 1,620 1,477 143
Subtotal Subways 18,435 17,196 1,239 Buses 3,487 3,376 111 Supply Logistics 548 527 21 System Safety 93 79 14 Non-Departmental (115) 14 (129)
Total Maintenance 22,448 21,192 1,256 Engineering:Capital Program Management 1,450 1,137 313
Total Engineering/Capital 1,450 1,137 313 Public Safety:Security 652 601 51
Total Public Safety 652 601 51 Total Positions 49,203 46,373 2,830
Non-Reimbursable 44,163 41,982 2,181 Reimbursable 5,040 4,391 649
Total Full-Time 49,012 46,248 2,764 Total Full-Time Equivalents 191 125 66
Vacancies mainly due to PTEs, Supv, and Hourlies.
Vacancies mainly due to PTE, and Hourlies.
Vacancies mainly due to PTE, and Hourlies.
Vacancies mainly due to Mgrs and Hourlies.
Vacancies mainly due to Supv, and Hourlies.Vacancies mainly due to Supt, TEM, PDM, and Trackworkers.
Vacancies mainly due to Mgrs and PTEs
Vacancies mainly due to MS Signals and Signal Mtrs.
Vacancies mainly due to RVO titles.
Vacancies mainly due to Station Agents.
Vacancies mainly due to Supt, and Bus Operators.
Vacancies mainly due to Mgr, PTE and Hourlies.Vacancies mainly due to Mgr, and Hourlies.
Nov 2020
NON-REIMBURSABLE AND FULL-TIME POSITIONS/FULL-TIME EQUIVALENTSTOTAL POSITIONS BY FUNCTION AND DEPARTMENT
JULY FINANCIAL PLAN 2020MTA NEW YORK CITY TRANSIT
ExplanationMid Year ActualVariance
Fav./(Unfav)
Vacancies mainly due to Mgr, and Hourlies.
J:\BUSINESS\2020Bud\Headcount Reporting 2020\2020‐11\2020_Nov_Total Positions_MTA submission_form_120820
Total Pos by DeptMaster Page # 171 of 228 - New York City Transit and Bus Committee Meeting 1/21/2021________________________________________________________________________________
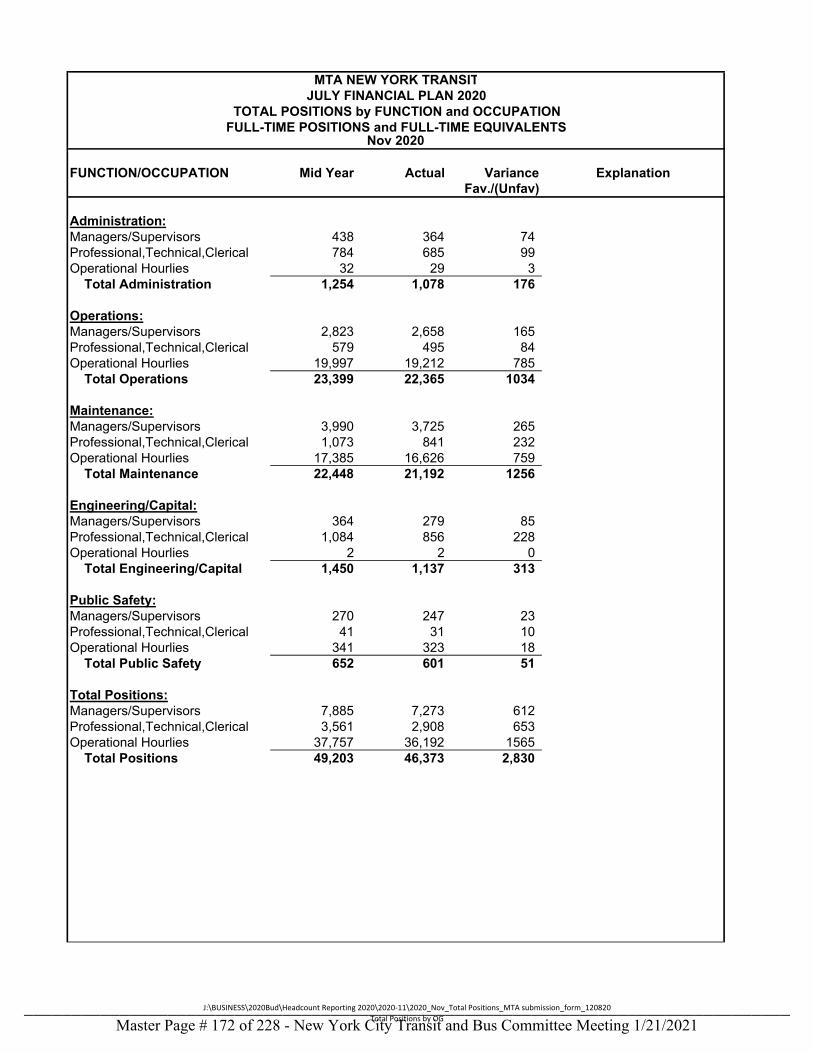
FUNCTION/OCCUPATION Mid Year Actual Variance ExplanationFav./(Unfav)
Administration:Managers/Supervisors 438 364 74Professional,Technical,Clerical 784 685 99Operational Hourlies 32 29 3 Total Administration 1,254 1,078 176
Operations:Managers/Supervisors 2,823 2,658 165Professional,Technical,Clerical 579 495 84Operational Hourlies 19,997 19,212 785 Total Operations 23,399 22,365 1034
Maintenance:Managers/Supervisors 3,990 3,725 265Professional,Technical,Clerical 1,073 841 232Operational Hourlies 17,385 16,626 759 Total Maintenance 22,448 21,192 1256
Engineering/Capital:Managers/Supervisors 364 279 85Professional,Technical,Clerical 1,084 856 228Operational Hourlies 2 2 0 Total Engineering/Capital 1,450 1,137 313
Public Safety:Managers/Supervisors 270 247 23Professional,Technical,Clerical 41 31 10Operational Hourlies 341 323 18 Total Public Safety 652 601 51
Total Positions:Managers/Supervisors 7,885 7,273 612Professional,Technical,Clerical 3,561 2,908 653Operational Hourlies 37,757 36,192 1565 Total Positions 49,203 46,373 2,830
MTA NEW YORK TRANSITJULY FINANCIAL PLAN 2020
TOTAL POSITIONS by FUNCTION and OCCUPATIONFULL-TIME POSITIONS and FULL-TIME EQUIVALENTS
Nov 2020
J:\BUSINESS\2020Bud\Headcount Reporting 2020\2020‐11\2020_Nov_Total Positions_MTA submission_form_120820
Total Positions by OGMaster Page # 172 of 228 - New York City Transit and Bus Committee Meeting 1/21/2021________________________________________________________________________________
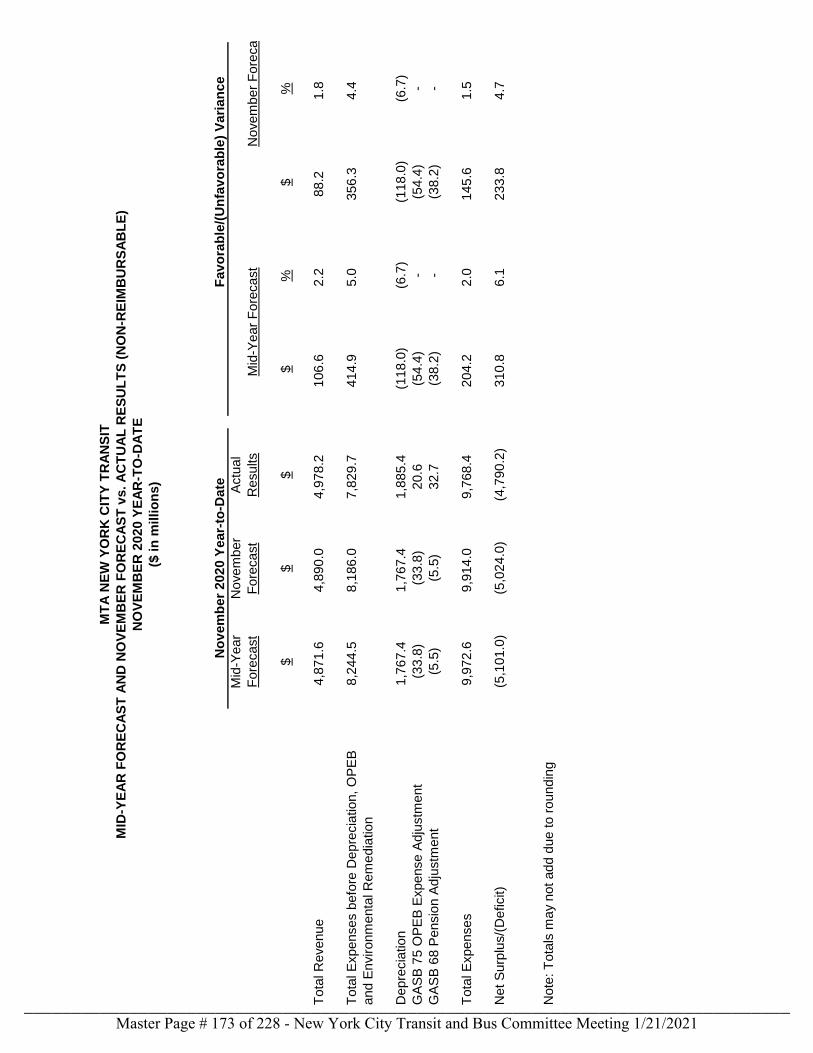
Fav
ora
ble
/(U
nfa
vo
rab
le)
Vari
an
ce
Mid
-Year
Fore
cast
Novem
ber
Fore
cast
Actu
al
Results
Mid
-Year
Fore
cast
Novem
ber
Fore
cast
$$
$$
%$
%
Tota
l R
evenue
4,8
71.6
4,8
90.0
4,9
78.2
106.6
2.2
88.2
1.8
Tota
l E
xpenses b
efo
re D
epre
cia
tion, O
PE
B8,2
44.5
8,1
86.0
7,8
29.7
414.9
5.0
356.3
4.4
and E
nvironm
enta
l R
em
edia
tion
Depre
cia
tion
1,7
67.4
1,7
67.4
1,8
85.4
(118.0
)(6
.7)
(118.0
)(6
.7)
GA
SB
75 O
PE
B E
xpense A
dju
stm
ent
(33.8
)(3
3.8
)20.6
(54.4
)-
(54.4
)-
GA
SB
68 P
ensio
n A
dju
stm
ent
(5.5
)(5
.5)
32.7
(38.2
)-
(38.2
)-
Tota
l E
xpenses
9,9
72.6
9,9
14.0
9,7
68.4
204.2
2.0
145.6
1.5
Net S
urp
lus/(
Deficit)
(5,1
01.0
)(5
,024.0
)(4
,790.2
)310.8
6.1
233.8
4.7
Note
: T
ota
ls m
ay
not add d
ue to r
oundin
g
No
vem
ber
2020 Y
ear-
to-D
ate
MT
A N
EW
YO
RK
CIT
Y T
RA
NS
IT
MID
-YE
AR
FO
RE
CA
ST
AN
D N
OV
EM
BE
R F
OR
EC
AS
T v
s. A
CT
UA
L R
ES
UL
TS
(N
ON
-RE
IMB
UR
SA
BL
E)
NO
VE
MB
ER
2020 Y
EA
R-T
O-D
AT
E
($ in
millio
ns)
Master Page # 173 of 228 - New York City Transit and Bus Committee Meeting 1/21/2021________________________________________________________________________________
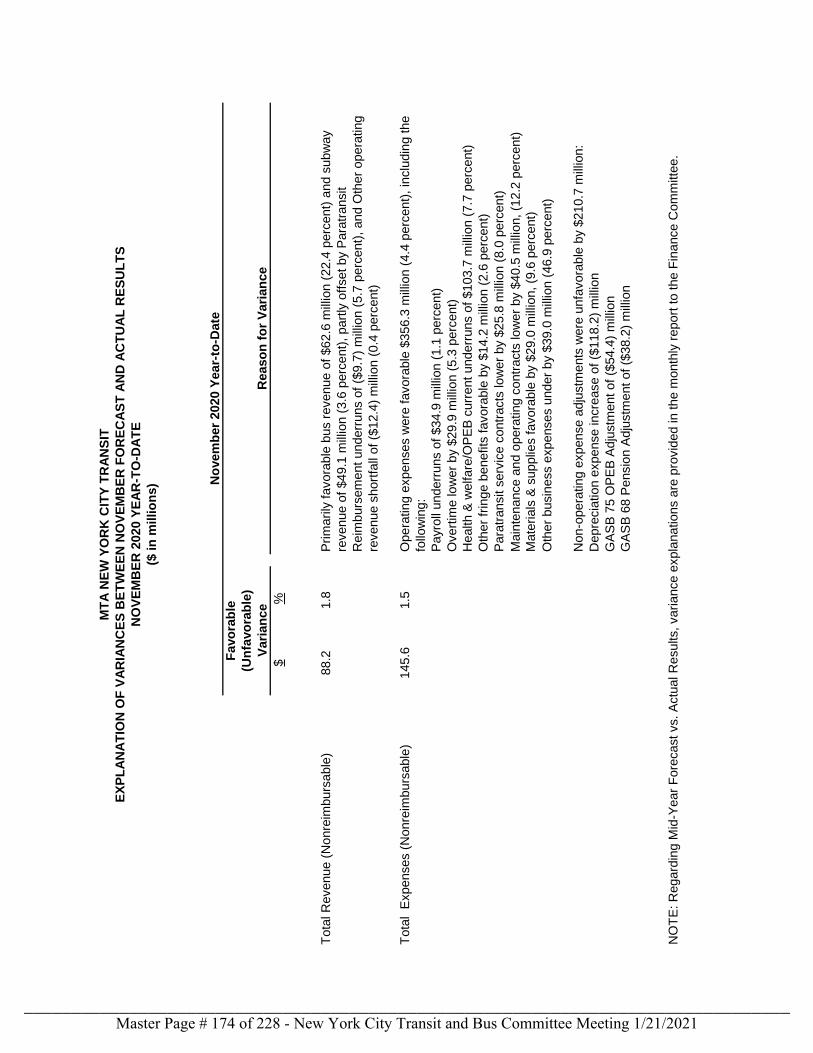
No
vem
ber
2020 Y
ear-
to-D
ate
$%
Tota
l R
evenue (
Nonre
imburs
able
)88.2
1.8
Tota
l E
xpenses (
Nonre
imburs
able
)145.6
1.5
Payro
ll underr
uns o
f $34.9
mill
ion (
1.1
perc
ent)
Overt
ime low
er
by $
29.9
mill
ion (
5.3
perc
ent)
Main
tenance a
nd o
pera
ting c
ontr
acts
low
er
by $
40.5
mill
ion, (1
2.2
perc
ent)
Non-o
pera
ting e
xpense a
dju
stm
ents
were
unfa
vora
ble
by $
210.7
mill
ion:
Depre
cia
tion e
xpense incre
ase o
f ($
118.2
) m
illio
n
GA
SB
75 O
PE
B A
dju
stm
ent of
($54.4
) m
illio
n
NO
TE
: R
egard
ing M
id-Y
ear
Fore
cast vs. A
ctu
al R
esults, vari
ance e
xpla
nations a
re p
rovid
ed in the m
onth
ly r
eport
to the F
inance C
om
mitte
e.
Health &
welfare
/OP
EB
curr
ent underr
uns o
f $103.7
mill
ion (
7.7
perc
ent)
Mate
rials
& s
upplie
s f
avora
ble
by $
29.0
mill
ion, (9
.6 p
erc
ent)
Oth
er
busin
ess e
xpenses u
nder
by $
39.0
mill
ion (
46.9
perc
ent)
Oth
er
frin
ge b
enefits
favora
ble
by $
14.2
mill
ion (
2.6
perc
ent)
Para
transit s
erv
ice c
ontr
acts
low
er
by $
25.8
mill
ion (
8.0
perc
ent)
(Un
favo
rab
le)
Vari
an
ce
Reaso
n f
or
Vari
an
ce
Pri
mari
ly f
avora
ble
bus r
evenue o
f $62.6
mill
ion (
22.4
perc
ent)
and s
ubw
ay
revenue o
f $49.1
mill
ion (
3.6
perc
ent)
, part
ly o
ffset by P
ara
transit
Reim
burs
em
ent underr
uns o
f ($
9.7
) m
illio
n (
5.7
perc
ent)
, and O
ther
opera
ting
revenue s
hort
fall
of
($12.4
) m
illio
n (
0.4
perc
ent)
GA
SB
68 P
ensio
n A
dju
stm
ent of
($38.2
) m
illio
n
Opera
ting e
xpenses w
ere
favora
ble
$356.3
mill
ion (
4.4
perc
ent)
, in
clu
din
g the
follo
win
g:
MT
A N
EW
YO
RK
CIT
Y T
RA
NS
IT
EX
PL
AN
AT
ION
OF
VA
RIA
NC
ES
BE
TW
EE
N N
OV
EM
BE
R F
OR
EC
AS
T A
ND
AC
TU
AL
RE
SU
LT
S
NO
VE
MB
ER
2020 Y
EA
R-T
O-D
AT
E
($ in
millio
ns)
Favo
rab
le
Master Page # 174 of 228 - New York City Transit and Bus Committee Meeting 1/21/2021________________________________________________________________________________
Preliminary November 2020 Report: Staten Island Railway
The purpose of this report is to provide the preliminary November 2020 financial results on an accrual basis. The accrual basis is presented on both a non-reimbursable and reimbursable account basis. These results are compared to the Mid-Year Forecast (forecast).
Summary of Preliminary Financial Results
Preliminary ridership and accrual results, versus forecast, are summarized as follows:
• November 2020 Staten Island Railway ridership of 77,844 was 2,919 rides (3.9 percent) aboveforecast. Average weekday ridership of 3,660 was 12,920 rides (77.9 percent) lower thanNovember 2019.
• Farebox revenue of $0.127 million was $0.015 million (13.6 percent) above forecast. Theoverrun was due to higher than expected ridership.
• Other revenue was below forecast in November by $0.174 million (89.7 percent), primarily dueto minimal reimbursement for school fares.
• Operating expenses were under forecast by $1.979 million (27.8 percent).
o Labor expenses were less than forecast by $0.892 million (17.5 percent).
o Non-labor expenses in total were less than forecast by $1.087 million (53.8 percent).
Master Page # 175 of 228 - New York City Transit and Bus Committee Meeting 1/21/2021________________________________________________________________________________
STATEN ISLAND RAILWAY FINANCIAL AND RIDERSHIP REPORT
November 2020
Preliminary Actual Results Compared to the Mid-Year Forecast
November 2020 Staten Island Railway ridership of 77,844 was 2,919 rides (3.9 percent) above forecast. Average weekday ridership of 3,660 was 12,920 rides (77.9 percent) lower than November 2019. Average weekday ridership for the twelve months ending November 2020 was 6,563, which is 9,350 rides (58.8 percent) lower than the twelve months ending November 2019.
Farebox revenue of $0.127 million was $0.015 million (13.6 percent) above forecast. The overrun was due to higher than expected ridership.
Operating revenue of $0.15 million was below forecast by $0.16 million (51.8 percent) due to minimal reimbursement for school fares.
Non-reimbursable expenses in November, before depreciation, GASB 75 OPEB Expense Adjustment and GASB 68 Pension Adjustment, were under forecast by $2.0 million (27.8 percent).
• Labor expenses were less than forecast by $0.9 million (17.5 percent). Health and welfareand OPEB current expenses together underran the forecast by $0.1 million (14.2 percent),due mostly to favorable rates for prescription drug contract rebates and vacancy savings.Payroll and overtime came in under forecast mainly due to vacancies and less backfill sincethe pandemic.
• Non-labor expenses in total were less than forecast by $1.1 million (53.8 percent), of whichProfessional Services overran the forecast by $0.02 million due unbudgeted IT expenses.Maintenance contract expenses were favorable by $0.5 million (93.2 percent), resulting fromfavorable timing of maintenance expenses due to COVID-19. Electric power underran by$0.1 million (37.7 percent), mainly due to less than expected non-traction power usage infacilities.
Year-to-date expenses were below forecast by $12.0 million (19.4 percent), including underruns in labor expenses of $7.4 million (15.5 percent), which were driven by several account underruns, primarily health and welfare expenses of $2.6 million (28.3 percent), pensions expenses of $1.0 million (12.7 percent) and overtime expenses of $1.6 million (50.4 percent). Non-labor expenses were also below forecast by $4.6 million (32.5 percent), due primarily to favorable results in maintenance contract expenses of $2.3 million (77.4 percent) and other business expense underruns of $1.4 million (82.9percent).
Depreciation expenses of $9.9 million year-to-date were below forecast by $1.0 million (9.3 percent). GASB #75 OPEB Expense Adjustment entries of $0.2 million resulted in favorable timing variance of $0.2 million.
The operating cash deficit (excluding subsidies) reported through November year-to-date was $18.3 million, $11.1 million (37.7 percent) favorable to forecast.
Master Page # 176 of 228 - New York City Transit and Bus Committee Meeting 1/21/2021________________________________________________________________________________
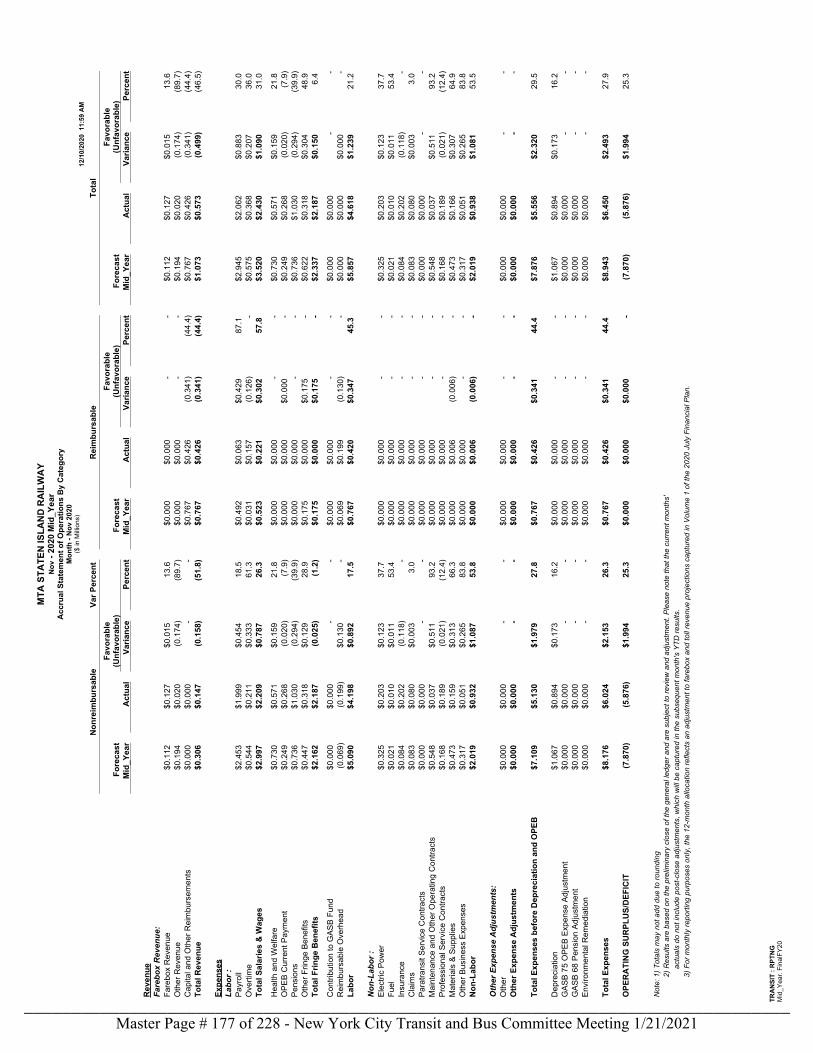
MTA
STA
TEN
ISLA
ND
RA
ILW
AY
Nov
- 20
20 M
id_Y
ear
Acc
rual
Sta
tem
ent o
f Ope
ratio
ns B
y C
ateg
ory
Mon
th -
Nov
202
0($
in M
illion
s)12
/10/
2020
11:
59 A
M
TRA
NSI
T : R
PTN
GM
id_Y
ear.
Fina
lFY2
0
Non
reim
burs
able
Var P
erce
ntR
eim
burs
able
Tota
l
Fore
cast
Favo
rabl
e(U
nfav
orab
le)
Fore
cast
Favo
rabl
e(U
nfav
orab
le)
Fore
cast
Favo
rabl
e(U
nfav
orab
le)
Mid
_Yea
rA
ctua
lVa
rianc
ePe
rcen
tM
id_Y
ear
Act
ual
Varia
nce
Perc
ent
Mid
_Yea
rA
ctua
lVa
rianc
ePe
rcen
t
Rev
enue
Fare
box
Rev
enue
:Fa
rebo
x R
even
ue$0
.112
$0
.127
$0
.015
13
.6
$0.0
00
$0.0
00
- -
$0.1
12
$0.1
27
$0.0
15
13.6
O
ther
Rev
enue
$0.1
94
$0.0
20
(0.1
74)
(89.
7)$0
.000
$0
.000
-
-$0
.194
$0
.020
(0
.174
)(8
9.7)
Cap
ital a
nd O
ther
Rei
mbu
rsem
ents
$0.0
00
$0.0
00
- -
$0.7
67
$0.4
26
(0.3
41)
(44.
4)$0
.767
$0
.426
(0
.341
)(4
4.4)
Tota
l Rev
enue
$0.3
06
$0.1
47
(0.1
58)
(51.
8)$0
.767
$0
.426
(0
.341
)(4
4.4)
$1.0
73
$0.5
73
(0.4
99)
(46.
5)
Expe
nses
Labo
r :Pa
yrol
l$2
.453
$1
.999
$0
.454
18
.5
$0.4
92
$0.0
63
$0.4
29
87.1
$2
.945
$2
.062
$0
.883
30
.0
Ove
rtim
e$0
.544
$0
.211
$0
.333
61
.3
$0.0
31
$0.1
57
(0.1
26)
-$0
.575
$0
.368
$0
.207
36
.0
Tota
l Sal
arie
s &
Wag
es$2
.997
$2
.209
$0
.787
26
.3
$0.5
23
$0.2
21
$0.3
02
57.8
$3
.520
$2
.430
$1
.090
31
.0
Hea
lth a
nd W
elfa
re$0
.730
$0
.571
$0
.159
21
.8
$0.0
00
$0.0
00
- -
$0.7
30
$0.5
71
$0.1
59
21.8
O
PEB
Cur
rent
Pay
men
t$0
.249
$0
.268
(0
.020
)(7
.9)
$0.0
00
$0.0
00
$0.0
00
-$0
.249
$0
.268
(0
.020
)(7
.9)
Pens
ions
$0.7
36
$1.0
30
(0.2
94)
(39.
9)$0
.000
$0
.000
-
-$0
.736
$1
.030
(0
.294
)(3
9.9)
Oth
er F
ringe
Ben
efits
$0.4
47
$0.3
18
$0.1
29
28.9
$0
.175
$0
.000
$0
.175
-
$0.6
22
$0.3
18
$0.3
04
48.9
To
tal F
ringe
Ben
efits
$2.1
62
$2.1
87
(0.0
25)
(1.2
)$0
.175
$0
.000
$0
.175
-
$2.3
37
$2.1
87
$0.1
50
6.4
Con
tribu
tion
to G
ASB
Fund
$0.0
00
$0.0
00
- -
$0.0
00
$0.0
00
- -
$0.0
00
$0.0
00
- -
Rei
mbu
rsab
le O
verh
ead
(0.0
69)
(0.1
99)
$0.1
30
-$0
.069
$0
.199
(0
.130
)-
$0.0
00
$0.0
00
$0.0
00
-La
bor
$5.0
90
$4.1
98
$0.8
92
17.5
$0
.767
$0
.420
$0
.347
45
.3
$5.8
57
$4.6
18
$1.2
39
21.2
Non
-Lab
or :
Elec
tric
Pow
er$0
.325
$0
.203
$0
.123
37
.7
$0.0
00
$0.0
00
- -
$0.3
25
$0.2
03
$0.1
23
37.7
Fu
el$0
.021
$0
.010
$0
.011
53
.4
$0.0
00
$0.0
00
- -
$0.0
21
$0.0
10
$0.0
11
53.4
In
sura
nce
$0.0
84
$0.2
02
(0.1
18)
-$0
.000
$0
.000
-
-$0
.084
$0
.202
(0
.118
)-
Cla
ims
$0.0
83
$0.0
80
$0.0
03
3.0
$0.0
00
$0.0
00
- -
$0.0
83
$0.0
80
$0.0
03
3.0
Para
trans
it Se
rvic
e C
ontra
cts
$0.0
00
$0.0
00
- -
$0.0
00
$0.0
00
- -
$0.0
00
$0.0
00
- -
Mai
nten
ance
and
Oth
er O
pera
ting
Con
tract
s$0
.548
$0
.037
$0
.511
93
.2
$0.0
00
$0.0
00
- -
$0.5
48
$0.0
37
$0.5
11
93.2
Pr
ofes
sion
al S
ervi
ce C
ontra
cts
$0.1
68
$0.1
89
(0.0
21)
(12.
4)$0
.000
$0
.000
-
-$0
.168
$0
.189
(0
.021
)(1
2.4)
Mat
eria
ls &
Sup
plie
s$0
.473
$0
.159
$0
.313
66
.3
$0.0
00
$0.0
06
(0.0
06)
-$0
.473
$0
.166
$0
.307
64
.9
Oth
er B
usin
ess
Expe
nses
$0.3
17
$0.0
51
$0.2
65
83.8
$0
.000
$0
.000
-
-$0
.317
$0
.051
$0
.265
83
.8
Non
-Lab
or$2
.019
$0
.932
$1
.087
53
.8
$0.0
00
$0.0
06
(0.0
06)
-$2
.019
$0
.938
$1
.081
53
.5
Oth
er E
xpen
se A
djus
tmen
ts:
Oth
er$0
.000
$0
.000
-
-$0
.000
$0
.000
-
-$0
.000
$0
.000
-
-O
ther
Exp
ense
Adj
ustm
ents
$0.0
00
$0.0
00
- -
$0.0
00
$0.0
00
- -
$0.0
00
$0.0
00
- -
Tota
l Exp
ense
s be
fore
Dep
reci
atio
n an
d O
PEB
$7.1
09
$5.1
30
$1.9
79
27.8
$0
.767
$0
.426
$0
.341
44
.4
$7.8
76
$5.5
56
$2.3
20
29.5
Dep
reci
atio
n$1
.067
$0
.894
$0
.173
16
.2
$0.0
00
$0.0
00
- -
$1.0
67
$0.8
94
$0.1
73
16.2
G
ASB
75 O
PEB
Expe
nse
Adju
stm
ent
$0.0
00
$0.0
00
- -
$0.0
00
$0.0
00
- -
$0.0
00
$0.0
00
- -
GAS
B 68
Pen
sion
Adj
ustm
ent
$0.0
00
$0.0
00
- -
$0.0
00
$0.0
00
- -
$0.0
00
$0.0
00
- -
Envi
ronm
enta
l Rem
edia
tion
$0.0
00
$0.0
00
- -
$0.0
00
$0.0
00
- -
$0.0
00
$0.0
00
- -
Tota
l Exp
ense
s$8
.176
$6
.024
$2
.153
26
.3
$0.7
67
$0.4
26
$0.3
41
44.4
$8
.943
$6
.450
$2
.493
27
.9
OPE
RA
TIN
G S
UR
PLU
S/D
EFIC
IT(7
.870
)(5
.876
)$1
.994
25
.3
$0.0
00
$0.0
00
$0.0
00
-(7
.870
)(5
.876
)$1
.994
25
.3
Not
e: 1
) Tot
als
may
not
add
due
to ro
undi
ng2)
Res
ults
are
bas
ed o
n th
e pr
elim
inar
y cl
ose
of th
e ge
nera
l led
ger a
nd a
re s
ubje
ct to
revi
ew a
nd a
djus
tmen
t. P
leas
e no
te th
at th
e cu
rren
t mon
ths'
actu
als
do n
ot in
clud
e po
st-c
lose
adj
ustm
ents
, whi
ch w
ill b
e ca
ptur
ed in
the
subs
eque
nt m
onth
's Y
TD re
sults
.3)
For
mon
thly
repo
rting
pur
pose
s on
ly, t
he 1
2-m
onth
allo
catio
n re
flect
s an
adj
ustm
ent t
o fa
rebo
x an
d to
ll re
venu
e pr
ojec
tions
cap
ture
d in
Vol
ume
1 of
the
2020
Jul
y Fi
nanc
ial P
lan.
Master Page # 177 of 228 - New York City Transit and Bus Committee Meeting 1/21/2021________________________________________________________________________________
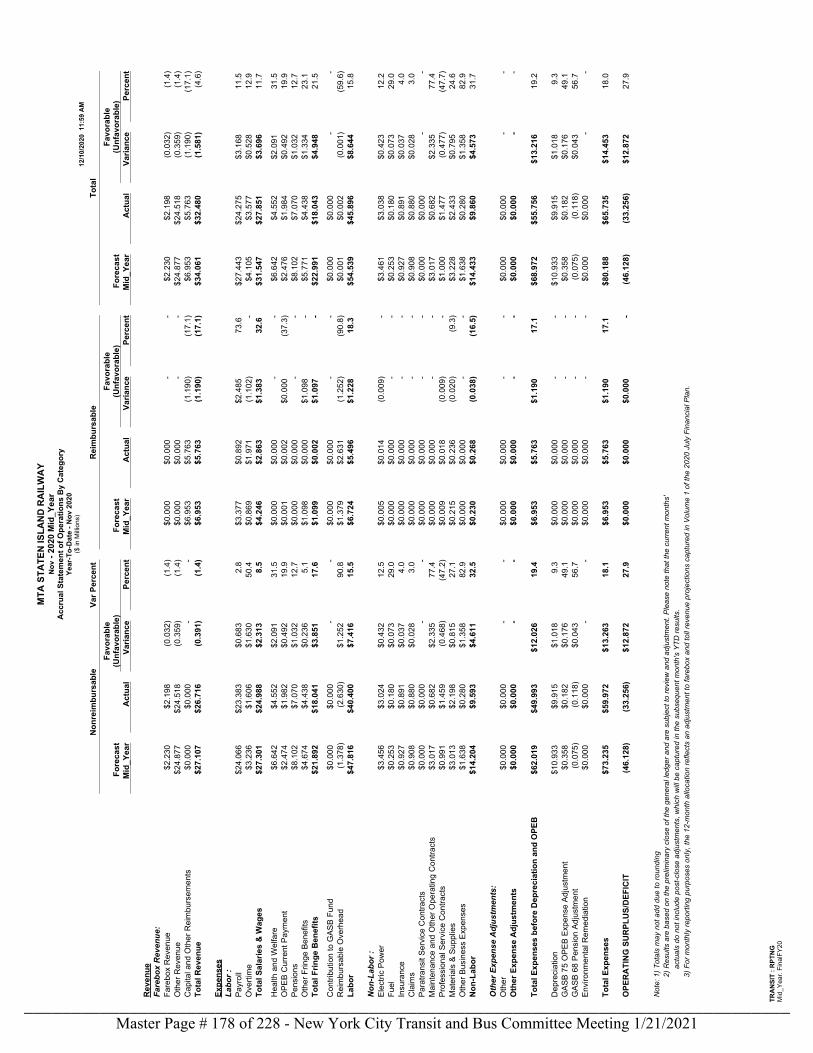
MTA
STA
TEN
ISLA
ND
RA
ILW
AY
Nov
- 20
20 M
id_Y
ear
Acc
rual
Sta
tem
ent o
f Ope
ratio
ns B
y C
ateg
ory
Year
-To-
Dat
e - N
ov 2
020
($ in
Milli
ons)
12/1
0/20
20 1
1:59
AM
TRA
NSI
T : R
PTN
GM
id_Y
ear.
Fina
lFY2
0
Non
reim
burs
able
Var P
erce
ntR
eim
burs
able
Tota
l
Fore
cast
Favo
rabl
e(U
nfav
orab
le)
Fore
cast
Favo
rabl
e(U
nfav
orab
le)
Fore
cast
Favo
rabl
e(U
nfav
orab
le)
Mid
_Yea
rA
ctua
lVa
rianc
ePe
rcen
tM
id_Y
ear
Act
ual
Varia
nce
Perc
ent
Mid
_Yea
rA
ctua
lVa
rianc
ePe
rcen
t
Rev
enue
Fare
box
Rev
enue
:Fa
rebo
x R
even
ue$2
.230
$2
.198
(0
.032
)(1
.4)
$0.0
00
$0.0
00
- -
$2.2
30
$2.1
98
(0.0
32)
(1.4
)O
ther
Rev
enue
$24.
877
$24.
518
(0.3
59)
(1.4
)$0
.000
$0
.000
-
-$2
4.87
7 $2
4.51
8 (0
.359
)(1
.4)
Cap
ital a
nd O
ther
Rei
mbu
rsem
ents
$0.0
00
$0.0
00
- -
$6.9
53
$5.7
63
(1.1
90)
(17.
1)$6
.953
$5
.763
(1
.190
)(1
7.1)
Tota
l Rev
enue
$27.
107
$26.
716
(0.3
91)
(1.4
)$6
.953
$5
.763
(1
.190
)(1
7.1)
$34.
061
$32.
480
(1.5
81)
(4.6
)
Expe
nses
Labo
r :Pa
yrol
l$2
4.06
6 $2
3.38
3 $0
.683
2.
8 $3
.377
$0
.892
$2
.485
73
.6
$27.
443
$24.
275
$3.1
68
11.5
O
verti
me
$3.2
36
$1.6
06
$1.6
30
50.4
$0
.869
$1
.971
(1
.102
)-
$4.1
05
$3.5
77
$0.5
28
12.9
To
tal S
alar
ies
& W
ages
$27.
301
$24.
988
$2.3
13
8.5
$4.2
46
$2.8
63
$1.3
83
32.6
$3
1.54
7 $2
7.85
1 $3
.696
11
.7
Hea
lth a
nd W
elfa
re$6
.642
$4
.552
$2
.091
31
.5
$0.0
00
$0.0
00
- -
$6.6
42
$4.5
52
$2.0
91
31.5
O
PEB
Cur
rent
Pay
men
t$2
.474
$1
.982
$0
.492
19
.9
$0.0
01
$0.0
02
$0.0
00
(37.
3)$2
.476
$1
.984
$0
.492
19
.9
Pens
ions
$8.1
02
$7.0
70
$1.0
32
12.7
$0
.000
$0
.000
-
-$8
.102
$7
.070
$1
.032
12
.7
Oth
er F
ringe
Ben
efits
$4.6
74
$4.4
38
$0.2
36
5.1
$1.0
98
$0.0
00
$1.0
98
-$5
.771
$4
.438
$1
.334
23
.1
Tota
l Frin
ge B
enef
its$2
1.89
2 $1
8.04
1 $3
.851
17
.6
$1.0
99
$0.0
02
$1.0
97
-$2
2.99
1 $1
8.04
3 $4
.948
21
.5
Con
tribu
tion
to G
ASB
Fund
$0.0
00
$0.0
00
- -
$0.0
00
$0.0
00
- -
$0.0
00
$0.0
00
- -
Rei
mbu
rsab
le O
verh
ead
(1.3
78)
(2.6
30)
$1.2
52
90.8
$1
.379
$2
.631
(1
.252
)(9
0.8)
$0.0
01
$0.0
02
(0.0
01)
(59.
6)La
bor
$47.
816
$40.
400
$7.4
16
15.5
$6
.724
$5
.496
$1
.228
18
.3
$54.
539
$45.
896
$8.6
44
15.8
Non
-Lab
or :
Elec
tric
Pow
er$3
.456
$3
.024
$0
.432
12
.5
$0.0
05
$0.0
14
(0.0
09)
-$3
.461
$3
.038
$0
.423
12
.2
Fuel
$0.2
53
$0.1
80
$0.0
73
29.0
$0
.000
$0
.000
-
-$0
.253
$0
.180
$0
.073
29
.0
Insu
ranc
e$0
.927
$0
.891
$0
.037
4.
0 $0
.000
$0
.000
-
-$0
.927
$0
.891
$0
.037
4.
0 C
laim
s$0
.908
$0
.880
$0
.028
3.
0 $0
.000
$0
.000
-
-$0
.908
$0
.880
$0
.028
3.
0 Pa
ratra
nsit
Serv
ice
Con
tract
s$0
.000
$0
.000
-
-$0
.000
$0
.000
-
-$0
.000
$0
.000
-
-M
aint
enan
ce a
nd O
ther
Ope
ratin
g C
ontra
cts
$3.0
17
$0.6
82
$2.3
35
77.4
$0
.000
$0
.000
-
-$3
.017
$0
.682
$2
.335
77
.4
Prof
essi
onal
Ser
vice
Con
tract
s$0
.991
$1
.459
(0
.468
)(4
7.2)
$0.0
09
$0.0
18
(0.0
09)
-$1
.000
$1
.477
(0
.477
)(4
7.7)
Mat
eria
ls &
Sup
plie
s$3
.013
$2
.198
$0
.815
27
.1
$0.2
15
$0.2
36
(0.0
20)
(9.3
)$3
.228
$2
.433
$0
.795
24
.6
Oth
er B
usin
ess
Expe
nses
$1.6
38
$0.2
80
$1.3
58
82.9
$0
.000
$0
.000
-
-$1
.638
$0
.280
$1
.358
82
.9
Non
-Lab
or$1
4.20
4 $9
.593
$4
.611
32
.5
$0.2
30
$0.2
68
(0.0
38)
(16.
5)$1
4.43
3 $9
.860
$4
.573
31
.7
Oth
er E
xpen
se A
djus
tmen
ts:
Oth
er$0
.000
$0
.000
-
-$0
.000
$0
.000
-
-$0
.000
$0
.000
-
-O
ther
Exp
ense
Adj
ustm
ents
$0.0
00
$0.0
00
- -
$0.0
00
$0.0
00
- -
$0.0
00
$0.0
00
- -
Tota
l Exp
ense
s be
fore
Dep
reci
atio
n an
d O
PEB
$62.
019
$49.
993
$12.
026
19.4
$6
.953
$5
.763
$1
.190
17
.1
$68.
972
$55.
756
$13.
216
19.2
Dep
reci
atio
n$1
0.93
3 $9
.915
$1
.018
9.
3 $0
.000
$0
.000
-
-$1
0.93
3 $9
.915
$1
.018
9.
3 G
ASB
75 O
PEB
Expe
nse
Adju
stm
ent
$0.3
58
$0.1
82
$0.1
76
49.1
$0
.000
$0
.000
-
-$0
.358
$0
.182
$0
.176
49
.1
GAS
B 68
Pen
sion
Adj
ustm
ent
(0.0
75)
(0.1
18)
$0.0
43
56.7
$0
.000
$0
.000
-
-(0
.075
)(0
.118
)$0
.043
56
.7
Envi
ronm
enta
l Rem
edia
tion
$0.0
00
$0.0
00
- -
$0.0
00
$0.0
00
- -
$0.0
00
$0.0
00
- -
Tota
l Exp
ense
s$7
3.23
5 $5
9.97
2 $1
3.26
3 18
.1
$6.9
53
$5.7
63
$1.1
90
17.1
$8
0.18
8 $6
5.73
5 $1
4.45
3 18
.0
OPE
RA
TIN
G S
UR
PLU
S/D
EFIC
IT(4
6.12
8)(3
3.25
6)$1
2.87
2 27
.9
$0.0
00
$0.0
00
$0.0
00
-(4
6.12
8)(3
3.25
6)$1
2.87
2 27
.9
Not
e: 1
) Tot
als
may
not
add
due
to ro
undi
ng2)
Res
ults
are
bas
ed o
n th
e pr
elim
inar
y cl
ose
of th
e ge
nera
l led
ger a
nd a
re s
ubje
ct to
revi
ew a
nd a
djus
tmen
t. P
leas
e no
te th
at th
e cu
rren
t mon
ths'
actu
als
do n
ot in
clud
e po
st-c
lose
adj
ustm
ents
, whi
ch w
ill b
e ca
ptur
ed in
the
subs
eque
nt m
onth
's Y
TD re
sults
.3)
For
mon
thly
repo
rting
pur
pose
s on
ly, t
he 1
2-m
onth
allo
catio
n re
flect
s an
adj
ustm
ent t
o fa
rebo
x an
d to
ll re
venu
e pr
ojec
tions
cap
ture
d in
Vol
ume
1 of
the
2020
Jul
y Fi
nanc
ial P
lan.
Master Page # 178 of 228 - New York City Transit and Bus Committee Meeting 1/21/2021________________________________________________________________________________
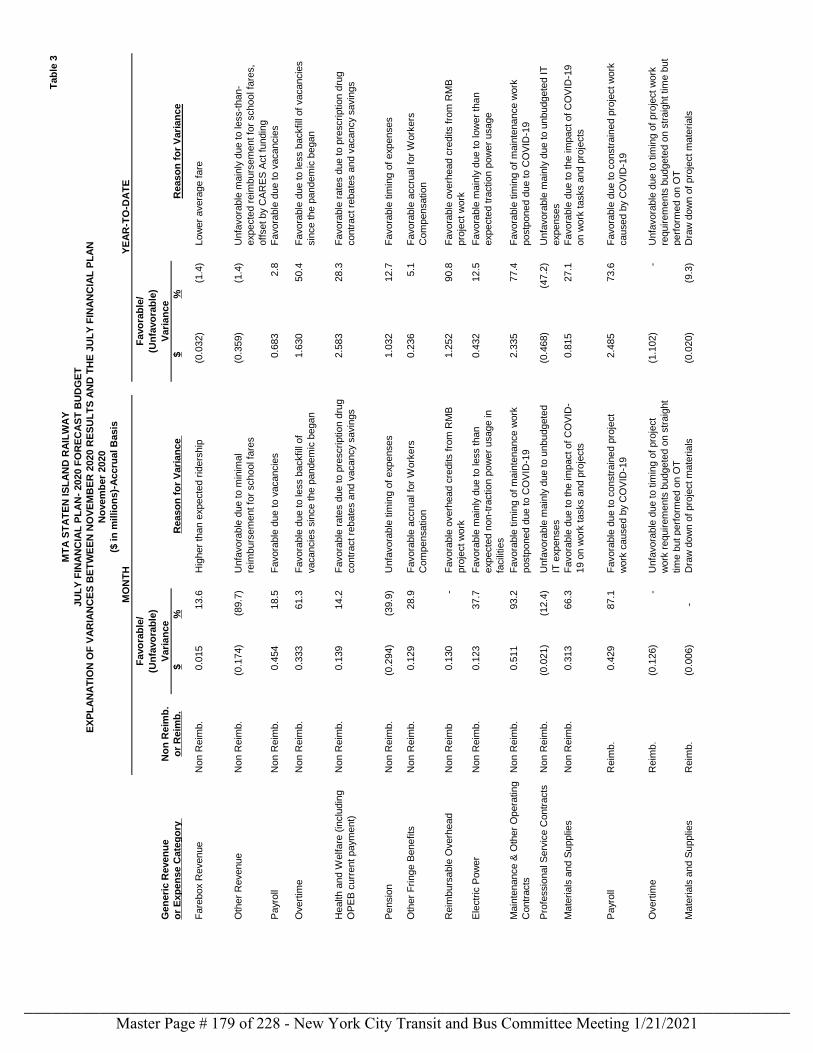
Tab
le 3
Gen
eri
c R
even
ue
No
n R
eim
b.
or
Exp
en
se C
ate
go
ry
or
Reim
b.
$%
Reaso
n f
or
Vari
an
ce
$%
Fare
box R
evenue
Non R
eim
b.
0.0
15
13.6
H
igher
than e
xpecte
d r
iders
hip
(0.0
32)
(1.4
)
Oth
er
Revenue
Non R
eim
b.
(0.1
74)
(89.7
)U
nfa
vora
ble
due to m
inim
al
reim
burs
em
ent fo
r school fa
res
(0.3
59)
(1.4
)
Payr
oll
Non R
eim
b.
0.4
54
18.5
F
avora
ble
due to v
acancie
s 0.6
83
2.8
Overt
ime
Non R
eim
b.
0.3
33
61.3
F
avora
ble
due to less b
ackfill
of
vacancie
s s
ince the p
andem
ic b
egan
1.6
30
50.4
Health a
nd W
elfare
(in
clu
din
g
OP
EB
curr
ent paym
ent)
Non R
eim
b.
0.1
39
14.2
F
avora
ble
rate
s d
ue to p
rescri
ption d
rug
contr
act re
bate
s a
nd v
acancy
savin
gs
2.5
83
28.3
Pensio
nN
on R
eim
b.
(0.2
94)
(39.9
)U
nfa
vora
ble
tim
ing o
f expenses
1.0
32
12.7
Oth
er
Fri
nge B
enefits
Non R
eim
b.
0.1
29
28.9
F
avora
ble
accru
al fo
r W
ork
ers
Com
pensation
0.2
36
5.1
Reim
burs
able
Overh
ead
Non R
eim
b 0.1
30
-F
avora
ble
overh
ead c
redits f
rom
RM
B
pro
ject w
ork
1.2
52
90.8
Ele
ctr
ic P
ow
er
Non R
eim
b.
0.1
23
37.7
F
avora
ble
main
ly d
ue to less than
expecte
d n
on-t
raction p
ow
er
usage in
facili
ties
0.4
32
12.5
Main
tenance &
Oth
er
Opera
ting
Contr
acts
Non R
eim
b.
0.5
11
93.2
F
avora
ble
tim
ing o
f m
ain
tenance w
ork
postp
oned d
ue to C
OV
ID-1
9
2.3
35
77.4
Pro
fessio
nal S
erv
ice C
ontr
acts
Non R
eim
b.
(0.0
21)
(12.4
)U
nfa
vora
ble
main
ly d
ue to u
nbudgete
d
IT e
xpenses
(0.4
68)
(47.2
)
Mate
rials
and S
upplie
sN
on R
eim
b.
0.3
13
66.3
F
avora
ble
due to the im
pact of
CO
VID
-
19 o
n w
ork
tasks a
nd p
roje
cts
0.8
15
27.1
Payr
oll
Reim
b.
0.4
29
87.1
F
avora
ble
due to c
onstr
ain
ed p
roje
ct
work
caused b
y C
OV
ID-1
9
2.4
85
73.6
Reaso
n f
or
Vari
an
ce
Low
er
avera
ge fare
Unfa
vora
ble
main
ly d
ue to less-t
han-
expecte
d r
eim
burs
em
ent fo
r school fa
res,
off
set by C
AR
ES
Act fu
ndin
g
Favora
ble
due to v
acancie
s
Favora
ble
due to less b
ackfill
of
vacancie
s
sin
ce the p
andem
ic b
egan
Favora
ble
rate
s d
ue to p
rescri
ption d
rug
contr
act re
bate
s a
nd v
acancy s
avin
gs
Favora
ble
tim
ing o
f expenses
Favora
ble
accru
al fo
r W
ork
ers
Com
pensation
Favora
ble
overh
ead c
redits f
rom
RM
B
pro
ject w
ork
Favora
ble
main
ly d
ue to low
er
than
expecte
d tra
ction p
ow
er
usage
Favora
ble
tim
ing o
f m
ain
tenance w
ork
postp
oned d
ue to C
OV
ID-1
9
Unfa
vora
ble
main
ly d
ue to u
nbudgete
d IT
expenses
Favora
ble
due to the im
pact of
CO
VID
-19
on w
ork
tasks a
nd p
roje
cts
Favora
ble
due to c
onstr
ain
ed p
roje
ct w
ork
caused b
y C
OV
ID-1
9
Overt
ime
Reim
b.
(0.1
26)
-U
nfa
vora
ble
due to tim
ing o
f pro
ject
work
requir
em
ents
budgete
d o
n s
traig
ht
tim
e b
ut perf
orm
ed o
n O
T
(1.1
02)
-U
nfa
vora
ble
due to tim
ing o
f pro
ject w
ork
requir
em
ents
budgete
d o
n s
traig
ht tim
e b
ut
perf
orm
ed o
n O
T
Mate
rials
and S
upplie
sR
eim
b.
(0.0
06)
-D
raw
dow
n o
f pro
ject m
ate
rials
(0.0
20)
(9.3
)D
raw
dow
n o
f pro
ject m
ate
rials
Favo
rab
le/
(Un
favo
rab
le)
Vari
an
ce
Favo
rab
le/
(Un
favo
rab
le)
Vari
an
ce
($ in
millio
ns)-
Accru
al B
asis
MO
NT
H
MT
A S
TA
TE
N IS
LA
ND
RA
ILW
AY
JU
LY
FIN
AN
CIA
L P
LA
N-
2020 F
OR
EC
AS
T B
UD
GE
T
EX
PL
AN
AT
ION
OF
VA
RIA
NC
ES
BE
TW
EE
N N
OV
EM
BE
R 2
020 R
ES
UL
TS
AN
D T
HE
JU
LY
FIN
AN
CIA
L P
LA
N
No
vem
ber
2020
YE
AR
-TO
-DA
TE
Master Page # 179 of 228 - New York City Transit and Bus Committee Meeting 1/21/2021________________________________________________________________________________
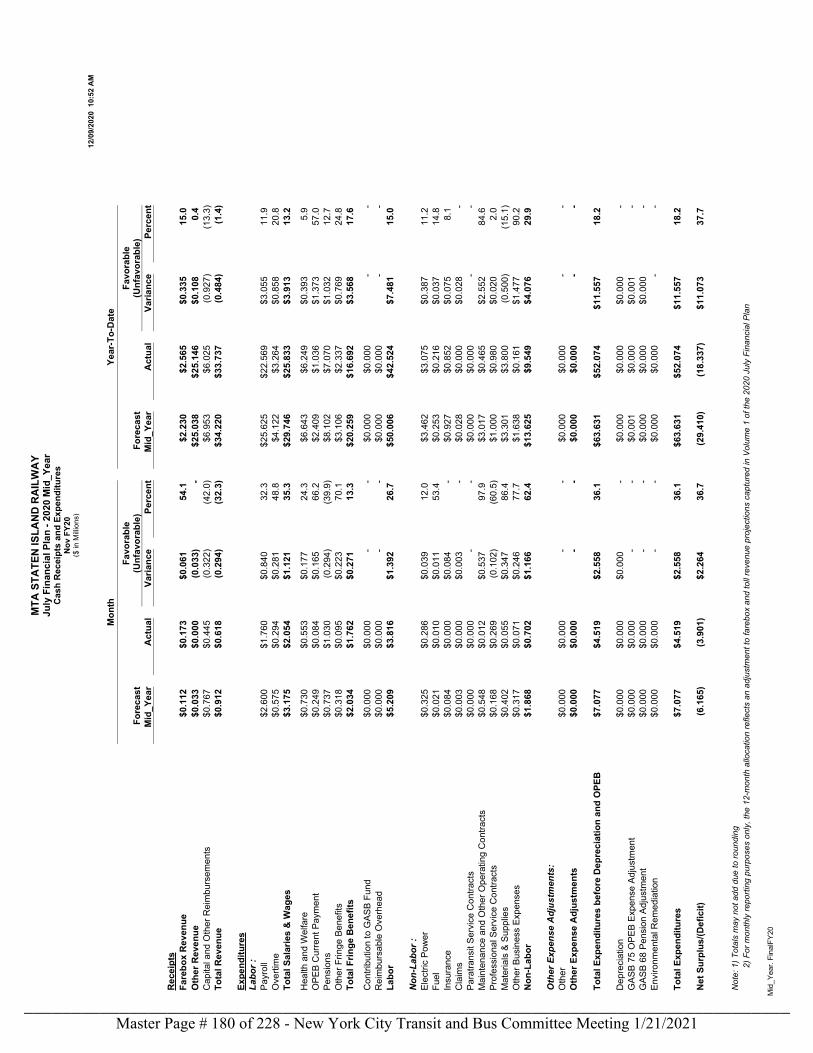
MTA
STA
TEN
ISLA
ND
RA
ILW
AY
July
Fin
anci
al P
lan
- 202
0 M
id_Y
ear
Cas
h R
ecei
pts
and
Expe
nditu
res
Nov
FY2
0($
in M
illion
s)
12/0
9/20
20 1
0:52
AM
Mid
_Yea
r. Fi
nalF
Y20
Mon
thYe
ar-T
o-D
ate
Fore
cast
Favo
rabl
e(U
nfav
orab
le)
Fore
cast
Favo
rabl
e(U
nfav
orab
le)
Mid
_Yea
rA
ctua
lVa
rianc
ePe
rcen
tM
id_Y
ear
Act
ual
Varia
nce
Perc
ent
Rec
eipt
sFa
rebo
x R
even
ue$0
.112
$0
.173
$0
.061
54
.1
$2.2
30
$2.5
65
$0.3
35
15.0
O
ther
Rev
enue
$0.0
33
$0.0
00
(0.0
33)
-$2
5.03
8 $2
5.14
6 $0
.108
0.
4 C
apita
l and
Oth
er R
eim
burs
emen
ts$0
.767
$0
.445
(0
.322
)(4
2.0)
$6.9
53
$6.0
25
(0.9
27)
(13.
3)To
tal R
even
ue$0
.912
$0
.618
(0
.294
)(3
2.3)
$34.
220
$33.
737
(0.4
84)
(1.4
)
Expe
nditu
res
Labo
r :Pa
yrol
l$2
.600
$1
.760
$0
.840
32
.3
$25.
625
$22.
569
$3.0
55
11.9
O
verti
me
$0.5
75
$0.2
94
$0.2
81
48.8
$4
.122
$3
.264
$0
.858
20
.8
Tota
l Sal
arie
s &
Wag
es$3
.175
$2
.054
$1
.121
35
.3
$29.
746
$25.
833
$3.9
13
13.2
Hea
lth a
nd W
elfa
re$0
.730
$0
.553
$0
.177
24
.3
$6.6
43
$6.2
49
$0.3
93
5.9
OPE
B C
urre
nt P
aym
ent
$0.2
49
$0.0
84
$0.1
65
66.2
$2
.409
$1
.036
$1
.373
57
.0
Pens
ions
$0.7
37
$1.0
30
(0.2
94)
(39.
9)$8
.102
$7
.070
$1
.032
12
.7
Oth
er F
ringe
Ben
efits
$0.3
18
$0.0
95
$0.2
23
70.1
$3
.106
$2
.337
$0
.769
24
.8
Tota
l Frin
ge B
enef
its$2
.034
$1
.762
$0
.271
13
.3
$20.
259
$16.
692
$3.5
68
17.6
Con
tribu
tion
to G
ASB
Fund
$0.0
00
$0.0
00
- -
$0.0
00
$0.0
00
- -
Rei
mbu
rsab
le O
verh
ead
$0.0
00
$0.0
00
- -
$0.0
00
$0.0
00
- -
Labo
r$5
.209
$3
.816
$1
.392
26
.7
$50.
006
$42.
524
$7.4
81
15.0
Non
-Lab
or :
Elec
tric
Pow
er$0
.325
$0
.286
$0
.039
12
.0
$3.4
62
$3.0
75
$0.3
87
11.2
Fu
el$0
.021
$0
.010
$0
.011
53
.4
$0.2
53
$0.2
16
$0.0
37
14.8
In
sura
nce
$0.0
84
$0.0
00
$0.0
84
-$0
.927
$0
.852
$0
.075
8.
1 C
laim
s$0
.003
$0
.000
$0
.003
-
$0.0
28
$0.0
00
$0.0
28
-Pa
ratra
nsit
Serv
ice
Con
tract
s$0
.000
$0
.000
-
-$0
.000
$0
.000
-
-M
aint
enan
ce a
nd O
ther
Ope
ratin
g C
ontra
cts
$0.5
48
$0.0
12
$0.5
37
97.9
$3
.017
$0
.465
$2
.552
84
.6
Prof
essi
onal
Ser
vice
Con
tract
s$0
.168
$0
.269
(0
.102
)(6
0.5)
$1.0
00
$0.9
80
$0.0
20
2.0
Mat
eria
ls &
Sup
plie
s$0
.402
$0
.055
$0
.347
86
.4
$3.3
01
$3.8
00
(0.5
00)
(15.
1)O
ther
Bus
ines
s Ex
pens
es$0
.317
$0
.071
$0
.246
77
.7
$1.6
38
$0.1
61
$1.4
77
90.2
N
on-L
abor
$1.8
68
$0.7
02
$1.1
66
62.4
$1
3.62
5 $9
.549
$4
.076
29
.9
Oth
er E
xpen
se A
djus
tmen
ts:
Oth
er$0
.000
$0
.000
-
-$0
.000
$0
.000
-
-O
ther
Exp
ense
Adj
ustm
ents
$0.0
00
$0.0
00
- -
$0.0
00
$0.0
00
- -
Tota
l Exp
endi
ture
s be
fore
Dep
reci
atio
n an
d O
PEB
$7.0
77
$4.5
19
$2.5
58
36.1
$6
3.63
1 $5
2.07
4 $1
1.55
7 18
.2
Dep
reci
atio
n$0
.000
$0
.000
$0
.000
-
$0.0
00
$0.0
00
$0.0
00
-G
ASB
75 O
PEB
Expe
nse
Adju
stm
ent
$0.0
00
$0.0
00
- -
$0.0
01
$0.0
00
$0.0
01
-G
ASB
68 P
ensi
on A
djus
tmen
t$0
.000
$0
.000
-
-$0
.000
$0
.000
$0
.000
-
Envi
ronm
enta
l Rem
edia
tion
$0.0
00
$0.0
00
- -
$0.0
00
$0.0
00
- -
Tota
l Exp
endi
ture
s$7
.077
$4
.519
$2
.558
36
.1
$63.
631
$52.
074
$11.
557
18.2
Net
Sur
plus
/(Def
icit)
(6.1
65)
(3.9
01)
$2.2
64
36.7
(2
9.41
0)(1
8.33
7)$1
1.07
3 37
.7
Not
e: 1
) Tot
als
may
not
add
due
to ro
undi
ng2)
For
mon
thly
repo
rting
pur
pose
s on
ly, t
he 1
2-m
onth
allo
catio
n re
flect
s an
adj
ustm
ent t
o fa
rebo
x an
d to
ll re
venu
e pr
ojec
tions
cap
ture
d in
Vol
ume
1 of
the
2020
Jul
y Fi
nanc
ial P
lan
Master Page # 180 of 228 - New York City Transit and Bus Committee Meeting 1/21/2021________________________________________________________________________________
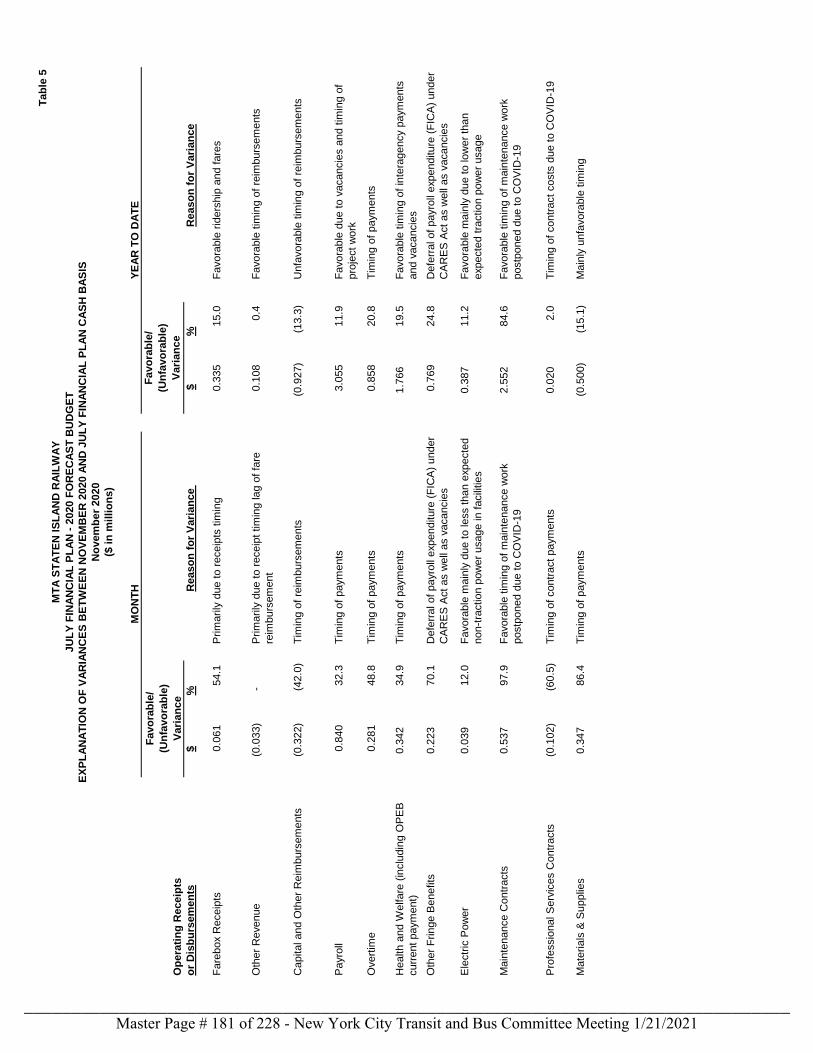
Tab
le 5
MO
NT
H
Op
era
tin
g R
eceip
ts
Fa
vo
rab
le/
(Un
favo
rab
le)
Vari
an
ce
or
Dis
bu
rsem
en
ts$
%R
easo
n f
or
Vari
an
ce
$%
Fa
rebox R
eceip
ts
0.0
61
54.1
P
rim
arily
due t
o r
eceip
ts t
imin
g 0
.335
15.0
Oth
er
Revenue
(0.0
33)
-P
rim
arily
due t
o r
eceip
t tim
ing la
g o
f fa
re
reim
burs
em
ent
0.1
08
0.4
Capital and O
ther
Reim
burs
em
ents
(0.3
22)
(42.0
)T
imin
g o
f re
imburs
em
ents
(0.9
27)
(13.3
)
Payro
ll
0.8
40
32.3
T
imin
g o
f paym
ents
3.0
55
11.9
Overt
ime
0
.281
48.8
T
imin
g o
f paym
ents
0.8
58
20.8
Health a
nd W
elfare
(in
clu
din
g O
PE
B
curr
ent
paym
ent)
0
.342
34.9
T
imin
g o
f paym
ents
1.7
66
19.5
Oth
er
Frin
ge B
enefits
0
.223
70.1
D
efe
rral of
payro
ll expenditure
(F
ICA
) under
CA
RE
S A
ct
as w
ell
as v
acancie
s
0.7
69
24.8
Ele
ctr
ic P
ow
er
0
.039
12.0
F
avora
ble
main
ly d
ue t
o le
ss t
han e
xpecte
d
non-t
ractio
n p
ow
er
usage in
facili
tie
s
0.3
87
11.2
Main
tenance C
ontr
acts
0
.537
97.9
F
avora
ble
tim
ing o
f m
ain
tenance w
ork
postp
oned d
ue t
o C
OV
ID-1
9
2.5
52
84.6
Pro
fessio
nal S
erv
ices C
ontr
acts
(0.1
02)
(60.5
)T
imin
g o
f contr
act
paym
ents
0.0
20
2.0
Mate
ria
ls &
Supplie
s
0.3
47
86.4
T
imin
g o
f paym
ents
(0.5
00)
(15.1
)
Reaso
n f
or
Vari
an
ce
Fa
vora
ble
rid
ers
hip
and
fare
s
Fa
vora
ble
tim
ing
of
reim
burs
em
ents
Unfa
vora
ble
tim
ing
of
reim
burs
em
ents
Fa
vora
ble
due
to
vacancie
s a
nd
tim
ing
of
pro
ject
work
Tim
ing
of
paym
ents
Fa
vora
ble
tim
ing
of
inte
ragency p
aym
ents
and
vacancie
s
Defe
rral of
payro
ll expenditure
(F
ICA
) under
CA
RE
S A
ct
as w
ell
as v
aca
ncie
s
Fa
vo
rab
le m
ain
ly d
ue
to
lo
we
r th
an
expecte
d t
ractio
n p
ow
er
usage
Fa
vora
ble
tim
ing
of
main
tenance
work
postp
oned
due
to
CO
VID
-19
Tim
ing
of
contr
act
costs
due
to
CO
VID
-19
Main
ly u
nfa
vora
ble
tim
ing
Fa
vo
rab
le/
(Un
favo
rab
le)
Vari
an
ce
MT
A S
TA
TE
N I
SL
AN
D R
AIL
WA
Y
JU
LY
FIN
AN
CIA
L P
LA
N -
2020 F
OR
EC
AS
T B
UD
GE
T
EX
PL
AN
AT
ION
OF
VA
RIA
NC
ES
BE
TW
EE
N N
OV
EM
BE
R 2
020 A
ND
JU
LY
FIN
AN
CIA
L P
LA
N C
AS
H B
AS
IS
No
vem
be
r 2020
($ i
n m
illi
on
s)
YE
AR
TO
DA
TE
Master Page # 181 of 228 - New York City Transit and Bus Committee Meeting 1/21/2021________________________________________________________________________________
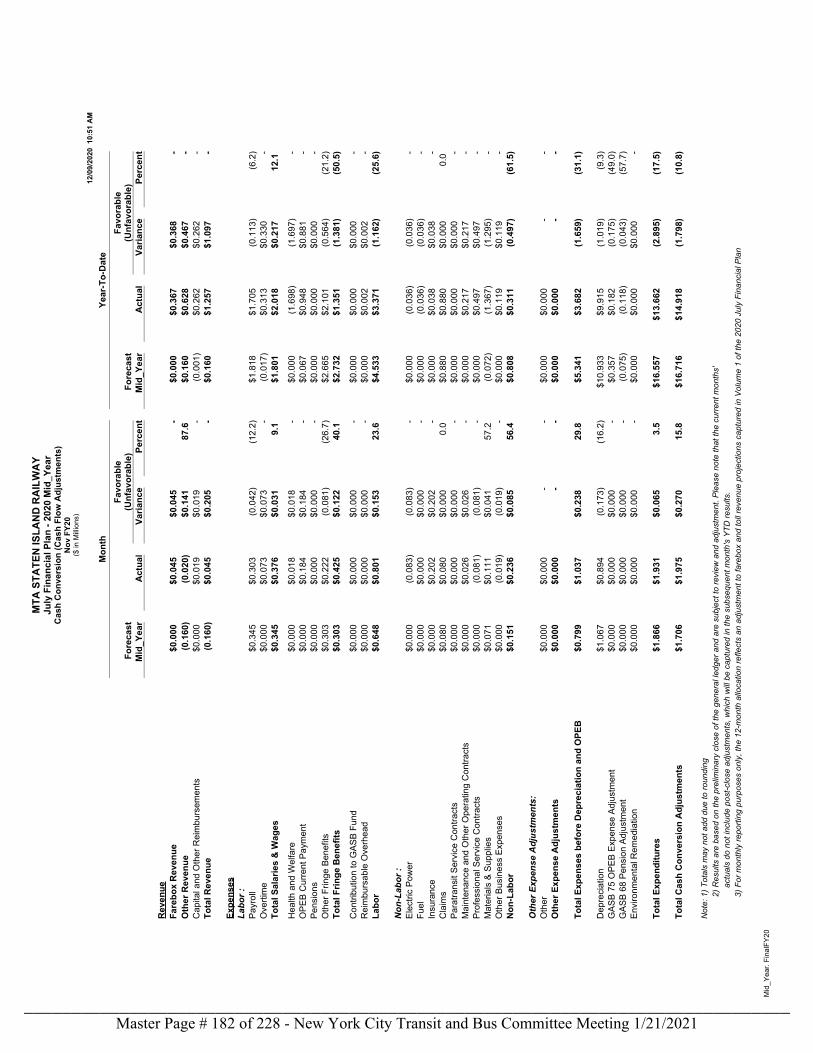
MTA
STA
TEN
ISLA
ND
RA
ILW
AY
July
Fin
anci
al P
lan
- 202
0 M
id_Y
ear
Cas
h C
onve
rsio
n (C
ash
Flow
Adj
ustm
ents
)N
ov F
Y20
($ in
Milli
ons)
12/0
9/20
20 1
0:51
AM
Mid
_Yea
r. Fi
nalF
Y20
Mon
thYe
ar-T
o-D
ate
Fore
cast
Favo
rabl
e(U
nfav
orab
le)
Fore
cast
Favo
rabl
e(U
nfav
orab
le)
Mid
_Yea
rA
ctua
lVa
rianc
ePe
rcen
tM
id_Y
ear
Act
ual
Varia
nce
Perc
ent
Rev
enue
Fare
box
Rev
enue
$0.0
00
$0.0
45
$0.0
45
-$0
.000
$0
.367
$0
.368
-
Oth
er R
even
ue(0
.160
)(0
.020
)$0
.141
87
.6
$0.1
60
$0.6
28
$0.4
67
-C
apita
l and
Oth
er R
eim
burs
emen
ts$0
.000
$0
.019
$0
.019
-
(0.0
01)
$0.2
62
$0.2
62
-To
tal R
even
ue(0
.160
)$0
.045
$0
.205
-
$0.1
60
$1.2
57
$1.0
97
-
Expe
nses
Labo
r :Pa
yrol
l$0
.345
$0
.303
(0
.042
)(1
2.2)
$1.8
18
$1.7
05
(0.1
13)
(6.2
)O
verti
me
$0.0
00
$0.0
73
$0.0
73
-(0
.017
)$0
.313
$0
.330
-
Tota
l Sal
arie
s &
Wag
es$0
.345
$0
.376
$0
.031
9.
1 $1
.801
$2
.018
$0
.217
12
.1
Hea
lth a
nd W
elfa
re$0
.000
$0
.018
$0
.018
-
$0.0
00
(1.6
98)
(1.6
97)
-O
PEB
Cur
rent
Pay
men
t$0
.000
$0
.184
$0
.184
-
$0.0
67
$0.9
48
$0.8
81
-Pe
nsio
ns$0
.000
$0
.000
$0
.000
-
$0.0
00
$0.0
00
$0.0
00
-O
ther
Frin
ge B
enef
its$0
.303
$0
.222
(0
.081
)(2
6.7)
$2.6
65
$2.1
01
(0.5
64)
(21.
2)To
tal F
ringe
Ben
efits
$0.3
03
$0.4
25
$0.1
22
40.1
$2
.732
$1
.351
(1
.381
)(5
0.5)
Con
tribu
tion
to G
ASB
Fund
$0.0
00
$0.0
00
$0.0
00
-$0
.000
$0
.000
$0
.000
-
Rei
mbu
rsab
le O
verh
ead
$0.0
00
$0.0
00
$0.0
00
-$0
.000
$0
.002
$0
.002
-
Labo
r$0
.648
$0
.801
$0
.153
23
.6
$4.5
33
$3.3
71
(1.1
62)
(25.
6)
Non
-Lab
or :
Elec
tric
Pow
er$0
.000
(0
.083
)(0
.083
) -
$0.0
00
(0.0
36)
(0.0
36)
-Fu
el$0
.000
$0
.000
$0
.000
-
$0.0
00
(0.0
36)
(0.0
36)
-In
sura
nce
$0.0
00
$0.2
02
$0.2
02
-$0
.000
$0
.038
$0
.038
-
Cla
ims
$0.0
80
$0.0
80
$0.0
00
0.0
$0.8
80
$0.8
80
$0.0
00
0.0
Para
trans
it Se
rvic
e C
ontra
cts
$0.0
00
$0.0
00
$0.0
00
-$0
.000
$0
.000
$0
.000
-
Mai
nten
ance
and
Oth
er O
pera
ting
Con
tract
s$0
.000
$0
.026
$0
.026
-
$0.0
00
$0.2
17
$0.2
17
-Pr
ofes
sion
al S
ervi
ce C
ontra
cts
$0.0
00
(0.0
81)
(0.0
81)
-$0
.000
$0
.497
$0
.497
-
Mat
eria
ls &
Sup
plie
s$0
.071
$0
.111
$0
.041
57
.2
(0.0
72)
(1.3
67)
(1.2
95)
-O
ther
Bus
ines
s Ex
pens
es$0
.000
(0
.019
)(0
.019
) -
$0.0
00
$0.1
19
$0.1
19
-N
on-L
abor
$0.1
51
$0.2
36
$0.0
85
56.4
$0
.808
$0
.311
(0
.497
)(6
1.5)
Oth
er E
xpen
se A
djus
tmen
ts:
Oth
er$0
.000
$0
.000
-
-$0
.000
$0
.000
-
-O
ther
Exp
ense
Adj
ustm
ents
$0.0
00
$0.0
00
- -
$0.0
00
$0.0
00
- -
Tota
l Exp
ense
s be
fore
Dep
reci
atio
n an
d O
PEB
$0.7
99
$1.0
37
$0.2
38
29.8
$5
.341
$3
.682
(1
.659
)(3
1.1)
Dep
reci
atio
n$1
.067
$0
.894
(0
.173
)(1
6.2)
$10.
933
$9.9
15
(1.0
19)
(9.3
)G
ASB
75 O
PEB
Expe
nse
Adju
stm
ent
$0.0
00
$0.0
00
$0.0
00
-$0
.357
$0
.182
(0
.175
)(4
9.0)
GAS
B 68
Pen
sion
Adj
ustm
ent
$0.0
00
$0.0
00
$0.0
00
-(0
.075
)(0
.118
)(0
.043
)(5
7.7)
Envi
ronm
enta
l Rem
edia
tion
$0.0
00
$0.0
00
$0.0
00
-$0
.000
$0
.000
$0
.000
-
Tota
l Exp
endi
ture
s$1
.866
$1
.931
$0
.065
3.
5 $1
6.55
7 $1
3.66
2 (2
.895
)(1
7.5)
Tota
l Cas
h C
onve
rsio
n A
djus
tmen
ts$1
.706
$1
.975
$0
.270
15
.8
$16.
716
$14.
918
(1.7
98)
(10.
8)
Not
e: 1
) Tot
als
may
not
add
due
to ro
undi
ng2)
Res
ults
are
bas
ed o
n th
e pr
elim
inar
y cl
ose
of th
e ge
nera
l led
ger a
nd a
re s
ubje
ct to
revi
ew a
nd a
djus
tmen
t. P
leas
e no
te th
at th
e cu
rren
t mon
ths'
actu
als
do n
ot in
clud
e po
st-c
lose
adj
ustm
ents
, whi
ch w
ill b
e ca
ptur
ed in
the
subs
eque
nt m
onth
's Y
TD re
sults
.3)
For
mon
thly
repo
rting
pur
pose
s on
ly, t
he 1
2-m
onth
allo
catio
n re
flect
s an
adj
ustm
ent t
o fa
rebo
x an
d to
ll re
venu
e pr
ojec
tions
cap
ture
d in
Vol
ume
1 of
the
2020
Jul
y Fi
nanc
ial P
lan
Master Page # 182 of 228 - New York City Transit and Bus Committee Meeting 1/21/2021________________________________________________________________________________
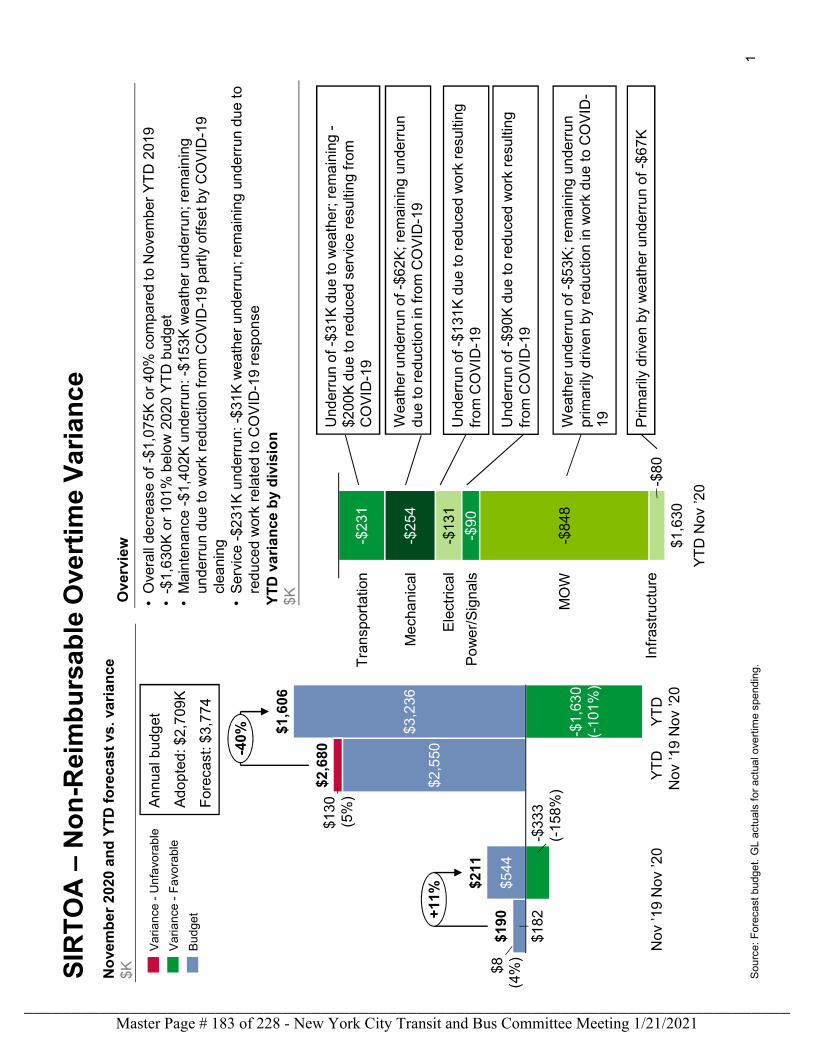
1
SIR
TO
A –
No
n-R
eim
bu
rsa
ble
Ove
rtim
e V
ari
an
ce
Sou
rce:
Fo
reca
st b
udge
t. G
L a
ctua
ls f
or a
ctua
l ove
rtim
e s
pend
ing.
YT
D v
ari
an
ce b
y d
ivis
ion
$K
Und
erru
n o
f -$3
1K d
ue
to w
eath
er;
re
ma
inin
g -
$200
K d
ue to
re
duce
d se
rvic
e r
esu
ltin
g f
rom
C
OV
ID-1
9
Wea
the
r u
nder
run
of -
$53K
; re
mai
ning
un
derr
un
prim
arily
driv
en
by
redu
ctio
n in
wor
k d
ue t
o C
OV
ID-
19 Pri
ma
rily
driv
en b
y w
eat
her
und
erru
n o
f -$6
7K
Ove
rvie
w
$182
$544
$2,5
50
$3,2
36
Nov
’19
$130
(5%
)
Nov
’20
YT
D
Nov
’19
-$1
,63
0(-
101
%)
YT
D
Nov
’20
$1,6
06
$190
$211
$2,6
80
$8(4
%)
-$3
33(-
158
%)
+11
%
-40
%
Va
ria
nce
-U
nfa
vora
ble
Va
ria
nce
-F
avo
rab
le
Bu
dg
et
-$2
31
-$2
54
-$1
31
-$9
0
-$8
48
-$8
0
Ele
ctric
al
Tra
nsp
orta
tion
YT
D N
ov ’2
0
Infr
astr
uctu
re
Me
cha
nica
l
Po
we
r/S
ign
als
MO
W
$1,6
30
An
nual
bu
dget
Ad
opte
d: $
2,7
09K
For
eca
st: $
3,7
74
•O
vera
ll de
crea
se o
f -$
1,07
5K
or
40%
com
pare
d to
Nov
em
ber
YT
D 2
019
•-$
1,6
30K
or
101
% b
elo
w 2
020
YT
D b
udg
et
•M
ain
ten
ance
-$
1,4
02K
un
derr
un: -
$153
K w
eath
er
und
erru
n; r
em
aini
ng
unde
rru
n d
ue t
o w
ork
redu
ctio
n fr
om
CO
VID
-19
par
tly o
ffse
t by
CO
VID
-19
clea
ning
•S
ervi
ce -
$231
K u
nder
run:
-$
31K
wea
the
r un
der
run
; re
mai
ning
un
derr
un d
ue
to
red
uced
wor
k re
late
d to
CO
VID
-19
resp
onse
No
vem
be
r 2
020
an
d Y
TD
fo
reca
st v
s. v
ari
an
ce$K
Wea
the
r u
nder
run
of -
$62K
; re
mai
ning
un
derr
un
due
to r
educ
tion
in f
rom
CO
VID
-19
Und
erru
n o
f -$1
31K
due
to
red
uce
d w
ork
resu
lting
fr
om C
OV
ID-1
9
Und
erru
n o
f -$9
0K d
ue
to r
edu
ced
wor
k re
sulti
ng
fr
om C
OV
ID-1
9
Master Page # 183 of 228 - New York City Transit and Bus Committee Meeting 1/21/2021________________________________________________________________________________
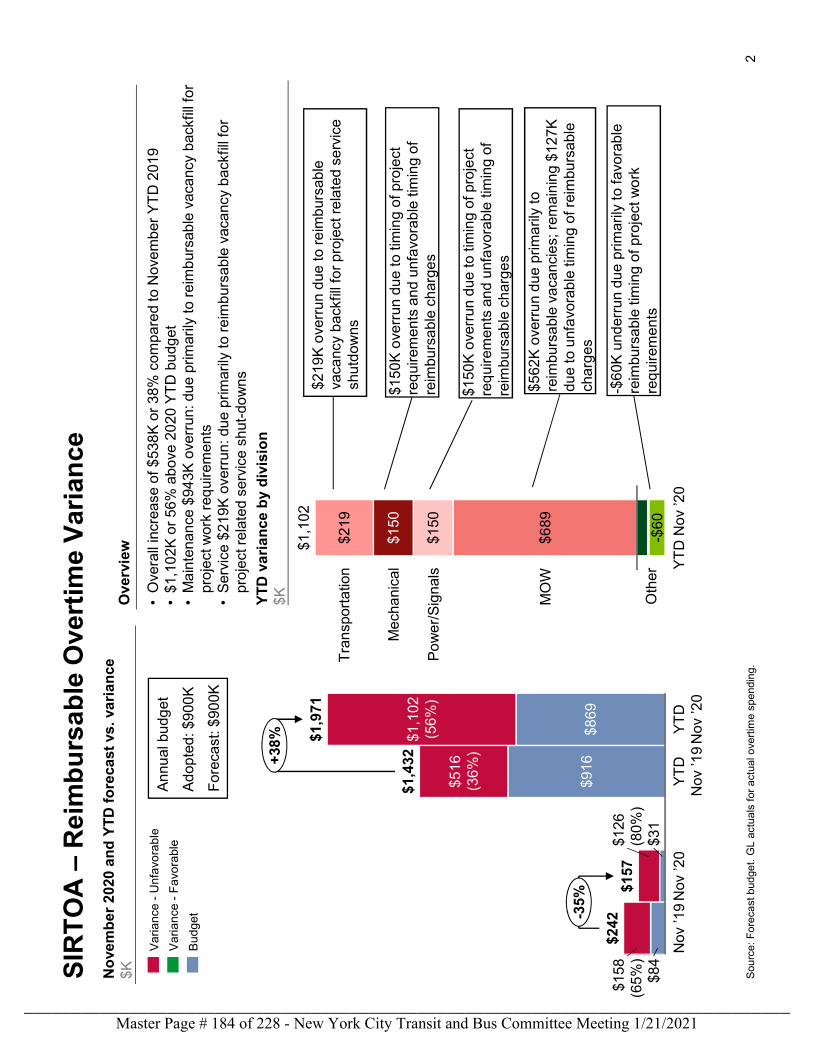
2
SIR
TO
A –
Re
imb
urs
ab
le O
vert
ime
Var
ian
ce
Sou
rce:
Fo
reca
st b
udge
t. G
L a
ctua
ls f
or a
ctua
l ove
rtim
e s
pend
ing.
No
vem
be
r 2
020
an
d Y
TD
fo
reca
st v
s. v
ari
an
ce$K
YT
D v
ari
an
ce b
y d
ivis
ion
$KOve
rvie
w
$84
$31
$916
$869
$126
(80
%)
$158
(65
%)
Nov
’19
YT
D
Nov
’19
Nov
’20
$516
(36
%)
$1,1
02(5
6%
)
YT
D
Nov
’20
$1,4
32
$242
$157
$1,9
71
-35
%
+38
%
Va
ria
nce
-U
nfa
vora
ble
Va
ria
nce
-F
avo
rab
le
Bu
dg
et
$689
$150
$150
$219
-$6
0O
ther
MO
W
Me
cha
nica
l
Po
we
r/S
ign
als Y
TD
Nov
’20
Tra
nsp
orta
tion
$1,1
02
An
nual
bu
dget
Ad
opte
d: $
900
K
For
eca
st: $
900K
$150
K o
verr
un d
ue to
tim
ing
of p
roje
ct
req
uire
men
ts a
nd
unf
avo
rab
le ti
min
g o
f re
imbu
rsa
ble
char
ge
s
$562
K o
verr
un
due
pri
ma
rily
to
reim
burs
abl
e va
canc
ies;
rem
ain
ing
$12
7K
due
to u
nfa
vora
ble
tim
ing
of r
eim
burs
abl
e ch
arg
es
-$6
0K u
nder
run
due
prim
arily
to
favo
rab
le
reim
burs
abl
e tim
ing
of p
roje
ct w
ork
re
qui
rem
ents
$219
K o
verr
un
due
to r
eim
bur
sab
le
vaca
ncy
bac
kfill
fo
r p
roje
ct r
ela
ted
serv
ice
shu
tdow
ns
•O
vera
ll in
crea
se o
f $53
8K
or
38%
com
pare
d to
Nov
em
ber
YT
D 2
019
•$1
,10
2K o
r 56
% a
bov
e 20
20 Y
TD
bu
dget
•M
ain
ten
ance
$94
3K o
verr
un: d
ue
prim
arily
to
re
imb
ursa
ble
vac
anc
y b
ackf
ill fo
rpr
oje
ct w
ork
req
uire
men
ts•
Ser
vice
$21
9K o
verr
un: d
ue
prim
arily
to
reim
bur
sab
le v
aca
ncy
bac
kfill
for
pro
ject
rel
ated
ser
vice
sh
ut-d
ow
ns
$150
K o
verr
un d
ue to
tim
ing
of p
roje
ct
req
uire
men
ts a
nd
unf
avo
rab
le ti
min
g o
f re
imbu
rsa
ble
char
ge
s
Master Page # 184 of 228 - New York City Transit and Bus Committee Meeting 1/21/2021________________________________________________________________________________
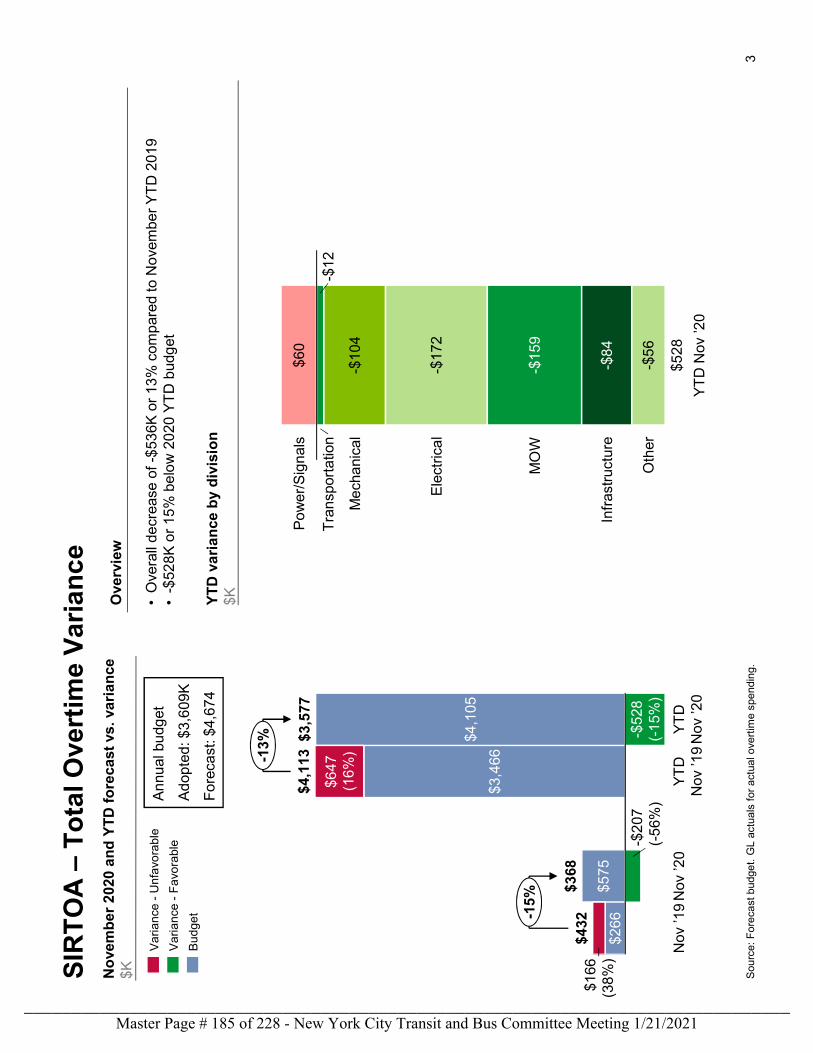
3
SIR
TO
A –
To
tal O
vert
ime
Va
ria
nc
e
Sou
rce:
Fo
reca
st b
udge
t. G
L a
ctua
ls f
or a
ctua
l ove
rtim
e s
pend
ing.
YT
D v
ari
an
ce b
y d
ivis
ion
$K•O
vera
ll de
crea
se o
f -$
536K
or
13%
com
par
ed to
No
vem
ber
YT
D 2
019
•-$
528K
or
15%
be
low
20
20 Y
TD
bud
get
Ove
rvie
w
$266
$575
$3,4
66
$4,1
05
Nov
’20
Nov
’19
$166
(38
%)
YT
D
Nov
’19
-$2
07(-
56%
)
$647
(16
%)
-$5
28(-
15%
)
YT
D
Nov
’20
$432
$3,5
77
$368
$4,1
13
-15
%
-13
%
$60
-$1
2
-$1
04
-$1
72
-$1
59
-$8
4
-$5
6
Infr
astr
uctu
re
Tra
nsp
orta
tion
Me
cha
nica
l
YT
D N
ov ’2
0
Ele
ctric
al
Po
we
r/S
ign
als
MO
W
Oth
er
$528
Bu
dg
et
An
nual
bu
dget
Ad
opte
d: $
3,6
09K
For
eca
st: $
4,6
74
No
vem
be
r 2
020
an
d Y
TD
fo
reca
st v
s. v
ari
an
ce$K
Va
ria
nce
-U
nfa
vora
ble
Va
ria
nce
-F
avo
rab
le
Master Page # 185 of 228 - New York City Transit and Bus Committee Meeting 1/21/2021________________________________________________________________________________
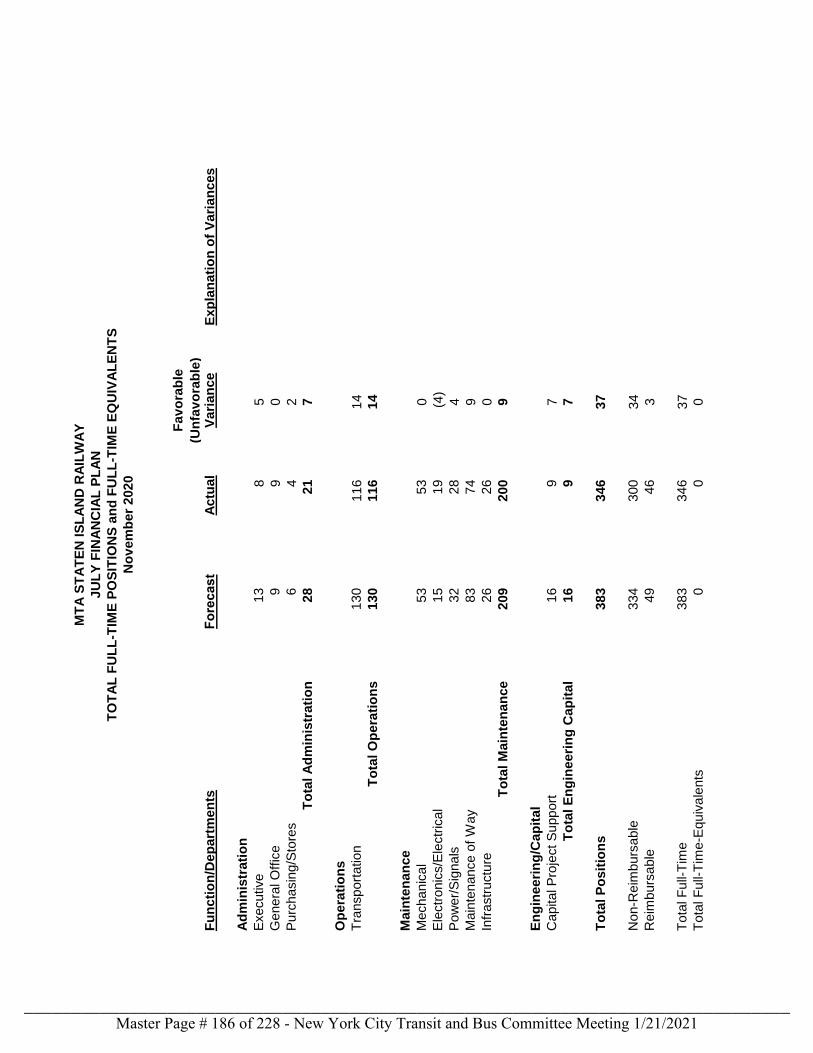
Fav
ora
ble
(Un
fav
ora
ble
)F
un
cti
on
/Dep
art
men
tsFo
recast
Actu
al
Vari
an
ce
Exp
lan
ati
on
of
Vari
an
ces
Ad
min
istr
ati
on
Executive
13
85
Genera
l O
ffic
e9
90
Purc
hasin
g/S
tore
s6
42
To
tal A
dm
inis
trati
on
28
21
7
Op
era
tio
ns
Tra
nsport
ation
130
116
14
To
tal O
pera
tio
ns
130
116
14
Main
ten
an
ce
Mechanic
al
53
53
0
Ele
ctr
onic
s/E
lectr
ical
15
19
(4)
Pow
er/
Sig
nals
32
28
4
Main
tenance o
f W
ay
83
74
9
Infr
astr
uctu
re26
26
0
To
tal M
ain
ten
an
ce
209
200
9
En
gin
eeri
ng
/Cap
ital
Capital P
roje
ct S
upport
16
97
To
tal E
ng
ineeri
ng
Cap
ital
16
97
To
tal P
osit
ion
s383
346
37
Non-R
eim
burs
able
334
300
34
Reim
burs
able
49
46
3
Tota
l F
ull-
Tim
e383
346
37
Tota
l F
ull-
Tim
e-E
quiv
ale
nts
00
0
MT
A S
TA
TE
N IS
LA
ND
RA
ILW
AY
JU
LY
FIN
AN
CIA
L P
LA
N
TO
TA
L F
UL
L-T
IME
PO
SIT
ION
S a
nd
FU
LL
-TIM
E E
QU
IVA
LE
NT
S
No
vem
ber
2020
Master Page # 186 of 228 - New York City Transit and Bus Committee Meeting 1/21/2021________________________________________________________________________________
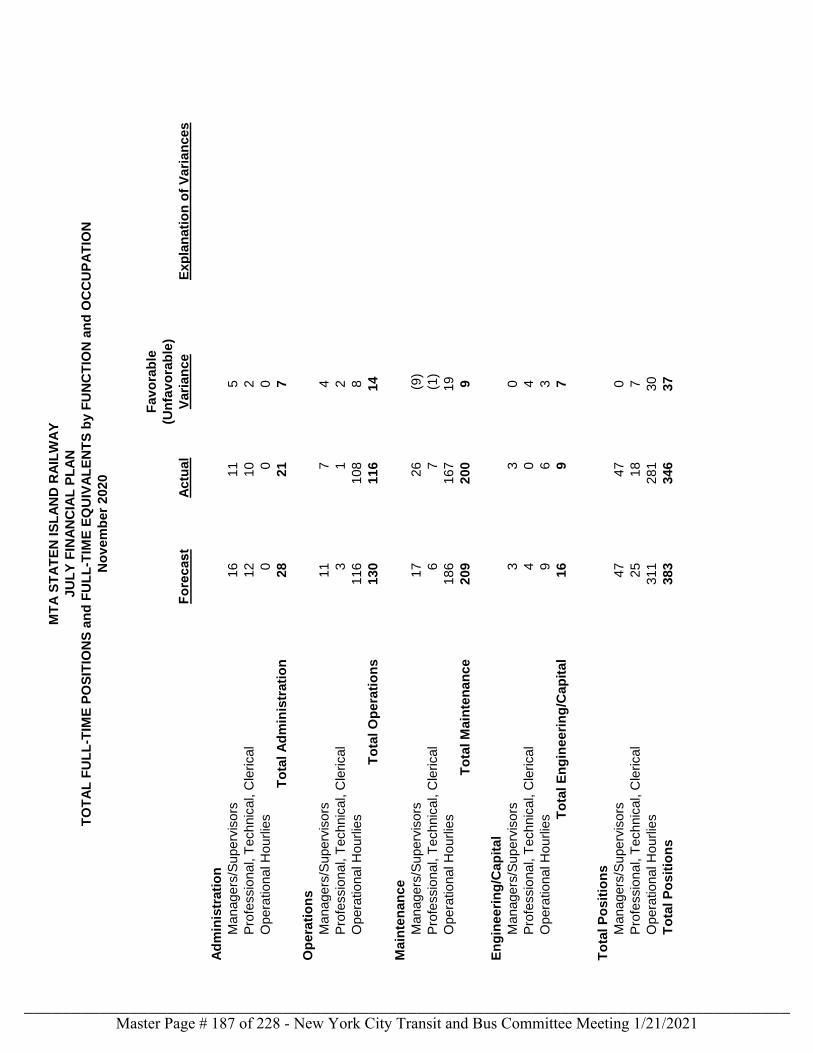
MT
A S
TA
TE
N IS
LA
ND
RA
ILW
AY
TO
TA
L F
UL
L-T
IME
PO
SIT
ION
S a
nd
FU
LL
-TIM
E E
QU
IVA
LE
NT
S b
y F
UN
CT
ION
an
d O
CC
UP
AT
ION
Fav
ora
ble
(Un
fav
ora
ble
)
Forecast
Actu
al
Vari
an
ce
Exp
lan
ati
on
of
Vari
an
ces
Ad
min
istr
ati
on
Managers
/Superv
isors
16
11
5
Pro
fessio
nal, T
echnic
al, C
lerical
12
10
2
Opera
tional H
ourlie
s0
00
To
tal A
dm
inis
trati
on
28
21
7
Op
era
tio
ns
Managers
/Superv
isors
11
74
Pro
fessio
nal, T
echnic
al, C
lerical
31
2
Opera
tional H
ourlie
s116
108
8
To
tal O
pera
tio
ns
130
116
14
Main
ten
an
ce
Managers
/Superv
isors
17
26
(9)
Pro
fessio
nal, T
echnic
al, C
lerical
67
(1)
Opera
tional H
ourlie
s186
167
19
To
tal M
ain
ten
an
ce
209
200
9
En
gin
eeri
ng
/Cap
ital
Managers
/Superv
isors
33
0
Pro
fessio
nal, T
echnic
al, C
lerical
40
4
Opera
tional H
ourlie
s9
63
To
tal E
ng
ineeri
ng
/Cap
ital
16
97
To
tal P
osit
ion
s
Managers
/Superv
isors
47
47
0
Pro
fessio
nal, T
echnic
al, C
lerical
25
18
7
Opera
tional H
ourlie
s311
281
30
To
tal P
osit
ion
s383
346
37
JU
LY
FIN
AN
CIA
L P
LA
N
No
vem
ber
2020
Master Page # 187 of 228 - New York City Transit and Bus Committee Meeting 1/21/2021________________________________________________________________________________
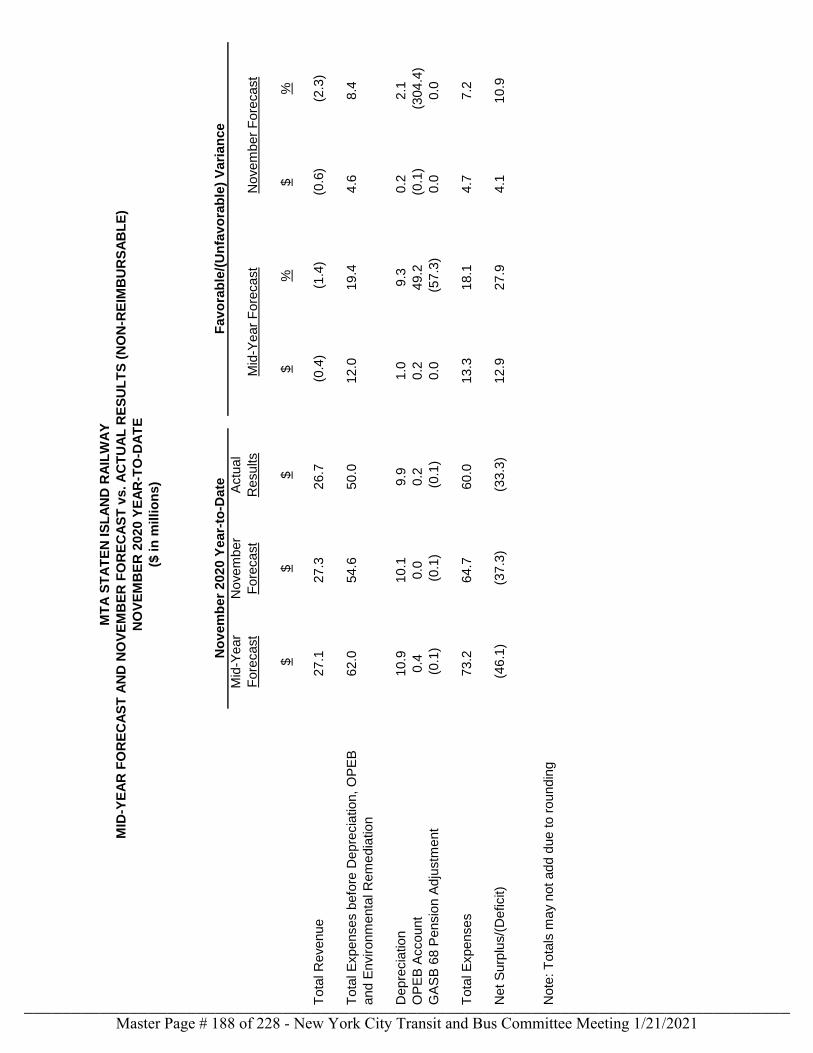
Fav
ora
ble
/(U
nfa
vo
rab
le)
Vari
an
ce
Mid
-Year
Fore
cast
Novem
ber
Fore
cast
Actu
al
Results
Mid
-Year
Fore
cast
Novem
ber
Fore
cast
$$
$$
%$
%
Tota
l R
evenue
27.1
27.3
26.7
(0.4
)(1
.4)
(0.6
)(2
.3)
Tota
l E
xpenses b
efo
re D
epre
cia
tion, O
PE
B62.0
54.6
50.0
12.0
19.4
4.6
8.4
and E
nvironm
enta
l R
em
edia
tion
Depre
cia
tion
10.9
10.1
9.9
1.0
9.3
0.2
2.1
OP
EB
Account
0.4
0.0
0.2
0.2
49.2
(0.1
)(3
04.4
)
GA
SB
68 P
ensio
n A
dju
stm
ent
(0.1
)(0
.1)
(0.1
)0.0
(57.3
)0.0
0.0
Tota
l E
xpenses
73.2
64.7
60.0
13.3
18.1
4.7
7.2
Net S
urp
lus/(
Deficit)
(46.1
)(3
7.3
)(3
3.3
)12.9
27.9
4.1
10.9
Note
: T
ota
ls m
ay
not add d
ue to r
oundin
g
No
vem
ber
2020 Y
ear-
to-D
ate
MT
A S
TA
TE
N IS
LA
ND
RA
ILW
AY
MID
-YE
AR
FO
RE
CA
ST
AN
D N
OV
EM
BE
R F
OR
EC
AS
T v
s. A
CT
UA
L R
ES
UL
TS
(N
ON
-RE
IMB
UR
SA
BL
E)
NO
VE
MB
ER
2020 Y
EA
R-T
O-D
AT
E
($ in
millio
ns)
Master Page # 188 of 228 - New York City Transit and Bus Committee Meeting 1/21/2021________________________________________________________________________________
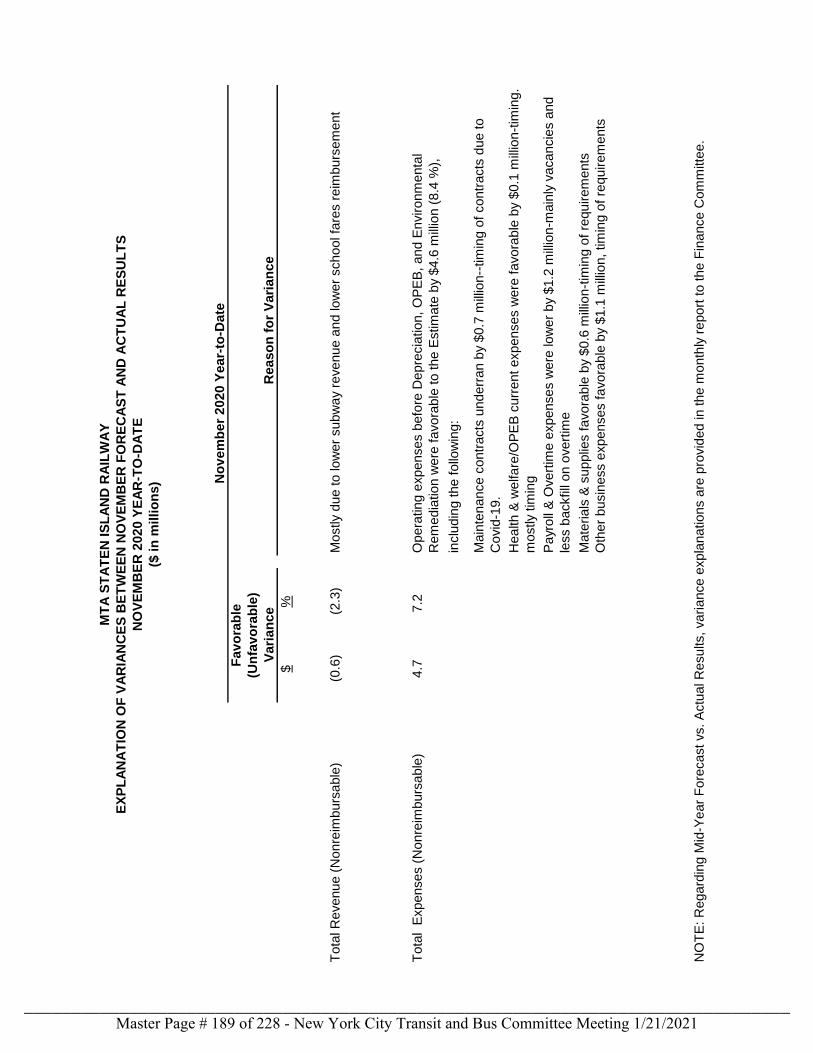
No
vem
ber
2020 Y
ear-
to-D
ate
$%
Tota
l R
evenue (
Nonre
imburs
able
)(0
.6)
(2.3
)
Tota
l E
xpenses (
Nonre
imburs
able
)4.7
7.2
inclu
din
g the f
ollo
win
g:
mostly tim
ing
Mate
rials
& s
upplie
s f
avora
ble
by $
0.6
mill
ion-t
imin
g o
f re
quirem
ents
NO
TE
: R
egard
ing M
id-Y
ear
Fore
cast vs. A
ctu
al R
esults, variance e
xpla
nations a
re p
rovid
ed in the m
onth
ly r
eport
to the F
inance C
om
mitte
e.
MT
A S
TA
TE
N IS
LA
ND
RA
ILW
AY
EX
PL
AN
AT
ION
OF
VA
RIA
NC
ES
BE
TW
EE
N N
OV
EM
BE
R F
OR
EC
AS
T A
ND
AC
TU
AL
RE
SU
LT
S
NO
VE
MB
ER
2020 Y
EA
R-T
O-D
AT
E
($ in
millio
ns)
Fav
ora
ble
(Un
fav
ora
ble
)
Vari
an
ce
Reaso
n f
or
Vari
an
ce
Mostly d
ue to low
er
subw
ay
revenue a
nd low
er
school fa
res r
eim
burs
em
ent
Payr
oll
& O
vert
ime e
xpenses w
ere
low
er
by $
1.2
mill
ion-m
ain
ly v
acancie
s a
nd
less b
ackfill
on o
vert
ime
Oth
er
busin
ess e
xpenses f
avora
ble
by $
1.1
mill
ion, tim
ing o
f re
quirem
ents
Main
tenance c
ontr
acts
underr
an b
y $0.7
mill
ion--
tim
ing o
f contr
acts
due to
Covid
-19.
Health &
welfare
/OP
EB
curr
ent expenses w
ere
favora
ble
by $
0.1
mill
ion-t
imin
g.
Opera
ting e
xpenses b
efo
re D
epre
cia
tion, O
PE
B, and E
nvironm
enta
l
Rem
edia
tion w
ere
favora
ble
to the E
stim
ate
by
$4.6
mill
ion (
8.4
%),
Master Page # 189 of 228 - New York City Transit and Bus Committee Meeting 1/21/2021________________________________________________________________________________
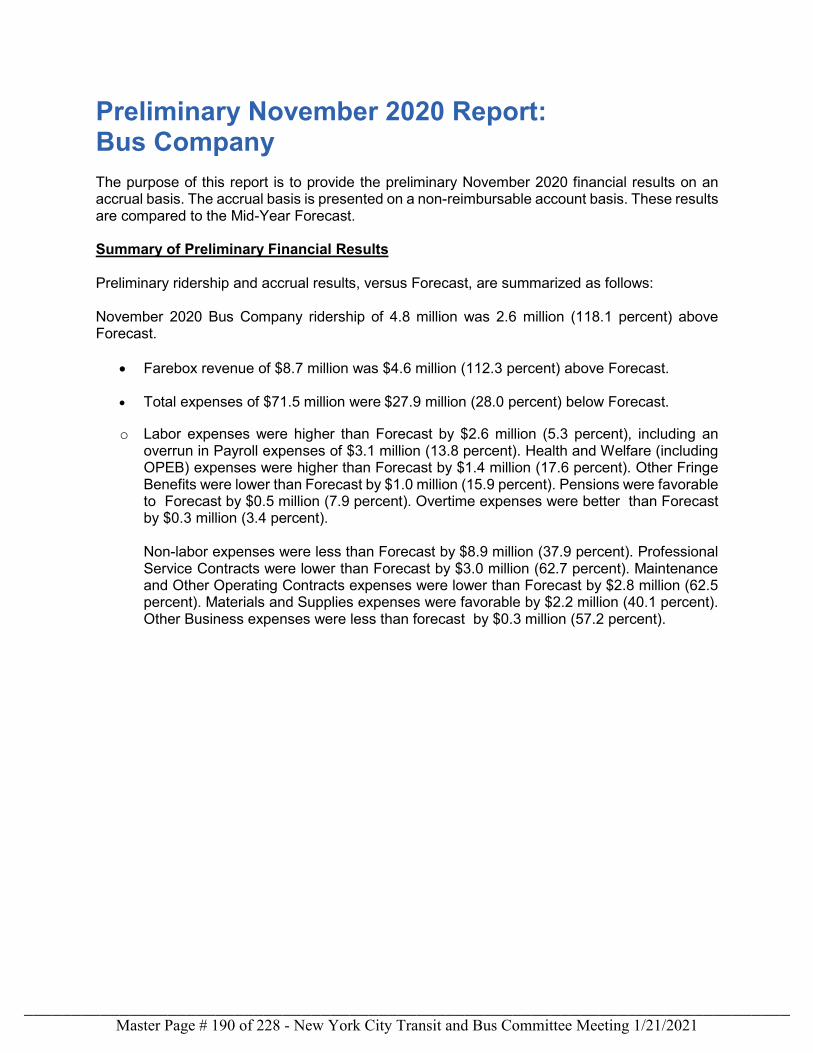
Preliminary November 2020 Report: Bus Company The purpose of this report is to provide the preliminary November 2020 financial results on an accrual basis. The accrual basis is presented on a non-reimbursable account basis. These results are compared to the Mid-Year Forecast. Summary of Preliminary Financial Results Preliminary ridership and accrual results, versus Forecast, are summarized as follows: November 2020 Bus Company ridership of 4.8 million was 2.6 million (118.1 percent) above Forecast.
• Farebox revenue of $8.7 million was $4.6 million (112.3 percent) above Forecast.
• Total expenses of $71.5 million were $27.9 million (28.0 percent) below Forecast.
o Labor expenses were higher than Forecast by $2.6 million (5.3 percent), including an
overrun in Payroll expenses of $3.1 million (13.8 percent). Health and Welfare (including OPEB) expenses were higher than Forecast by $1.4 million (17.6 percent). Other Fringe Benefits were lower than Forecast by $1.0 million (15.9 percent). Pensions were favorable to Forecast by $0.5 million (7.9 percent). Overtime expenses were better than Forecast by $0.3 million (3.4 percent). Non-labor expenses were less than Forecast by $8.9 million (37.9 percent). Professional Service Contracts were lower than Forecast by $3.0 million (62.7 percent). Maintenance and Other Operating Contracts expenses were lower than Forecast by $2.8 million (62.5 percent). Materials and Supplies expenses were favorable by $2.2 million (40.1 percent). Other Business expenses were less than forecast by $0.3 million (57.2 percent).
Master Page # 190 of 228 - New York City Transit and Bus Committee Meeting 1/21/2021________________________________________________________________________________
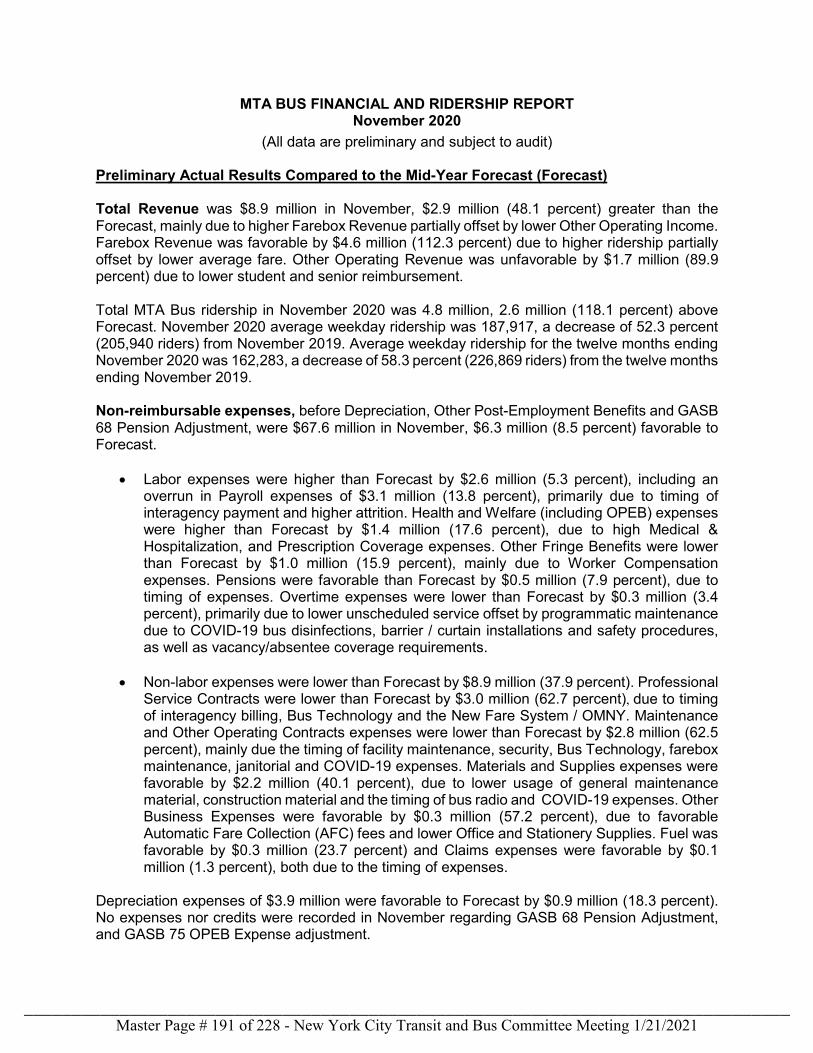
MTA BUS FINANCIAL AND RIDERSHIP REPORT November 2020
(All data are preliminary and subject to audit)
Preliminary Actual Results Compared to the Mid-Year Forecast (Forecast) Total Revenue was $8.9 million in November, $2.9 million (48.1 percent) greater than the Forecast, mainly due to higher Farebox Revenue partially offset by lower Other Operating Income. Farebox Revenue was favorable by $4.6 million (112.3 percent) due to higher ridership partially offset by lower average fare. Other Operating Revenue was unfavorable by $1.7 million (89.9 percent) due to lower student and senior reimbursement. Total MTA Bus ridership in November 2020 was 4.8 million, 2.6 million (118.1 percent) above Forecast. November 2020 average weekday ridership was 187,917, a decrease of 52.3 percent (205,940 riders) from November 2019. Average weekday ridership for the twelve months ending November 2020 was 162,283, a decrease of 58.3 percent (226,869 riders) from the twelve months ending November 2019. Non-reimbursable expenses, before Depreciation, Other Post-Employment Benefits and GASB 68 Pension Adjustment, were $67.6 million in November, $6.3 million (8.5 percent) favorable to Forecast.
• Labor expenses were higher than Forecast by $2.6 million (5.3 percent), including an
overrun in Payroll expenses of $3.1 million (13.8 percent), primarily due to timing of interagency payment and higher attrition. Health and Welfare (including OPEB) expenses were higher than Forecast by $1.4 million (17.6 percent), due to high Medical & Hospitalization, and Prescription Coverage expenses. Other Fringe Benefits were lower than Forecast by $1.0 million (15.9 percent), mainly due to Worker Compensation expenses. Pensions were favorable than Forecast by $0.5 million (7.9 percent), due to timing of expenses. Overtime expenses were lower than Forecast by $0.3 million (3.4 percent), primarily due to lower unscheduled service offset by programmatic maintenance due to COVID-19 bus disinfections, barrier / curtain installations and safety procedures, as well as vacancy/absentee coverage requirements.
• Non-labor expenses were lower than Forecast by $8.9 million (37.9 percent). Professional Service Contracts were lower than Forecast by $3.0 million (62.7 percent), due to timing of interagency billing, Bus Technology and the New Fare System / OMNY. Maintenance and Other Operating Contracts expenses were lower than Forecast by $2.8 million (62.5 percent), mainly due the timing of facility maintenance, security, Bus Technology, farebox maintenance, janitorial and COVID-19 expenses. Materials and Supplies expenses were favorable by $2.2 million (40.1 percent), due to lower usage of general maintenance material, construction material and the timing of bus radio and COVID-19 expenses. Other Business Expenses were favorable by $0.3 million (57.2 percent), due to favorable Automatic Fare Collection (AFC) fees and lower Office and Stationery Supplies. Fuel was favorable by $0.3 million (23.7 percent) and Claims expenses were favorable by $0.1 million (1.3 percent), both due to the timing of expenses.
Depreciation expenses of $3.9 million were favorable to Forecast by $0.9 million (18.3 percent). No expenses nor credits were recorded in November regarding GASB 68 Pension Adjustment, and GASB 75 OPEB Expense adjustment.
Master Page # 191 of 228 - New York City Transit and Bus Committee Meeting 1/21/2021________________________________________________________________________________
The operating cash deficit (excluding subsidies) was $44.3 million, $21.2 million (32.4 percent) favorable to the Forecast.
Master Page # 192 of 228 - New York City Transit and Bus Committee Meeting 1/21/2021________________________________________________________________________________
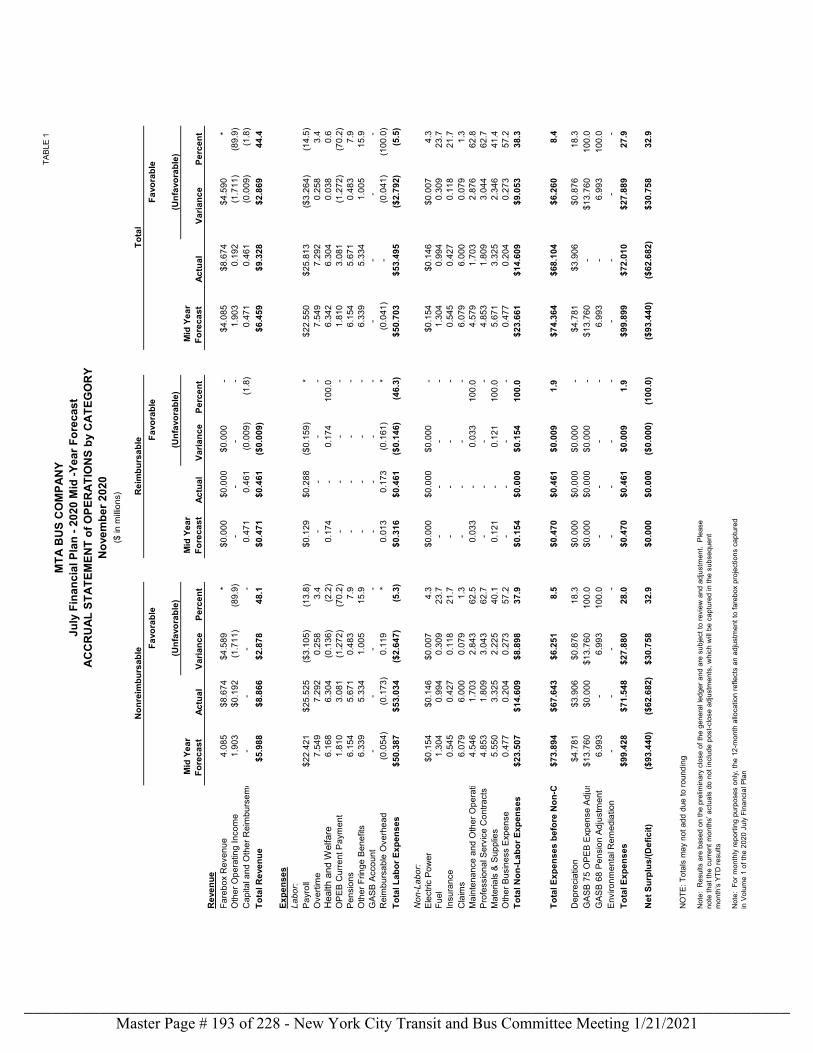
TABL
E 1
Mid
Yea
r Fo
reca
stAc
tual
Varia
nce
Perc
ent
Mid
Yea
r Fo
reca
stAc
tual
Varia
nce
Perc
ent
Mid
Yea
r Fo
reca
stAc
tual
Varia
nce
Perc
ent
Rev
enue
Fare
box
Rev
enue
4.08
5
$8
.674
$4.5
89
*$0
.000
$0.0
00$0
.000
-
$4.0
85$8
.674
$4.5
90
*O
ther
Ope
ratin
g In
com
e1.
903
$0.1
92(1
.711
)
(8
9.9)
-
-
-
-1.
903
0.
192
(1
.711
)
(89.
9)C
apita
l and
Oth
er R
eim
burs
eme
-
-
-
-
0.47
1
0.
461
(0
.009
)
(1
.8)
0.47
1
0.46
1
(0.0
09)
(1
.8)
Tota
l Rev
enue
$5.9
88$8
.866
$2.8
7848
.1$0
.471
$0.4
61($
0.00
9)
$6.4
59$9
.328
$2.8
6944
.4
Expe
nses
Labo
r:Pa
yrol
l$2
2.42
1$2
5.52
5($
3.10
5)(1
3.8)
$0.1
29$0
.288
($0.
159)
*
$22.
550
$25.
813
($3.
264)
(14.
5)O
verti
me
7.54
9
7.
292
0.25
8
3.4
-
-
-
-
7.54
9
7.29
2
0.25
8
3.4
Hea
lth a
nd W
elfa
re6.
168
6.30
4
(0
.136
)
(2
.2)
0.17
4
-
0.17
4
10
0.0
6.34
2
6.30
4
0.03
8
0.6
OPE
B C
urre
nt P
aym
ent
1.81
0
3.
081
(1.2
72)
(70.
2)-
-
-
-1.
810
3.
081
(1
.272
)
(70.
2)Pe
nsio
ns6.
154
5.67
1
0.
483
7.
9-
-
-
-6.
154
5.
671
0.
483
7.
9O
ther
Frin
ge B
enef
its6.
339
5.33
4
1.
005
15
.9-
-
-
-6.
339
5.
334
1.
005
15
.9G
ASB
Acco
unt
-
-
-
-
-
-
-
-
-
-
-
-
Rei
mbu
rsab
le O
verh
ead
(0.0
54)
(0
.173
)
0.11
9
*
0.01
3
0.
173
(0
.161
)
*(0
.041
)
-
(0.0
41)
(1
00.0
)To
tal L
abor
Exp
ense
s$5
0.38
7$5
3.03
4($
2.64
7)(5
.3)
$0.3
16$0
.461
($0.
146)
(46.
3)$5
0.70
3$5
3.49
5($
2.79
2)(5
.5)
Non
-Lab
or:
Elec
tric
Pow
er$0
.154
$0.1
46$0
.007
4.3
$0.0
00$0
.000
$0.0
00
-$0
.154
$0.1
46$0
.007
4.3
Fuel
1.30
4
0.
994
0.30
9
23.7
-
-
-
-1.
304
0.
994
0.
309
23
.7In
sura
nce
0.54
5
0.
427
0.11
8
21.7
-
-
-
-0.
545
0.
427
0.
118
21
.7C
laim
s6.
079
6.00
0
0.
079
1.
3-
-
-
-
6.07
9
6.00
0
0.07
9
1.3
Mai
nten
ance
and
Oth
er O
pera
ti
4.54
6
1.
703
2.84
3
62.5
0.03
3
-
0.03
3
10
0.0
4.57
9
1.70
3
2.87
6
62.8
Prof
essi
onal
Ser
vice
Con
tract
s4.
853
1.80
9
3.
043
62
.7-
-
-
-
4.85
3
1.80
9
3.04
4
62.7
Mat
eria
ls &
Sup
plie
s5.
550
3.32
5
2.
225
40
.10.
121
-
0.
121
100.
05.
671
3.
325
2.
346
41
.4O
ther
Bus
ines
s Ex
pens
e0.
477
0.20
4
0.
273
57
.2-
-
-
-
0.47
7
0.20
4
0.27
3
57.2
Tota
l Non
-Lab
or E
xpen
ses
$23.
507
$14.
609
$8.8
9837
.9$0
.154
$0.0
00$0
.154
100.
0$2
3.66
1$1
4.60
9$9
.053
38.3
Tota
l Exp
ense
s be
fore
Non
-C
$7
3.89
4$6
7.64
3$6
.251
8.5
$0.4
70$0
.461
$0.0
091.
9$7
4.36
4$6
8.10
4$6
.260
8.4
Dep
reci
atio
n $4
.781
$3.9
06$0
.876
18.3
$0.0
00$0
.000
$0.0
00
-$4
.781
$3.9
06$0
.876
18.3
GAS
B 75
OPE
B Ex
pens
e Ad
jus
$13.
760
$0.0
00$1
3.76
010
0.0
$0.0
00$0
.000
$0.0
00
-$1
3.76
0-
$1
3.76
010
0.0
GAS
B 68
Pen
sion
Adj
ustm
ent
6.99
3
-
6.99
3
100.
0-
-
-
-
6.99
3
-
6.99
3
100.
0En
viro
nmen
tal R
emed
iatio
n-
-
-
--
-
-
-
-
-
-
-
Tota
l Exp
ense
s$9
9.42
8$7
1.54
8$2
7.88
028
.0$0
.470
$0.4
61$0
.009
1.9
$99.
899
$72.
010
$27.
889
27.9
Net
Sur
plus
/(Def
icit)
($93
.440
)($
62.6
82)
$30.
758
32.9
$0.0
00$0
.000
($0.
000)
(100
.0)
($93
.440
)($
62.6
82)
$30.
758
32.9
NO
TE: T
otal
s m
ay n
ot a
dd d
ue to
roun
ding
MTA
BU
S C
OM
PAN
YJu
ly F
inan
cial
Pla
n - 2
020
Mid
-Yea
r For
ecas
t
Non
reim
burs
able
Tota
l
ACC
RU
AL S
TATE
MEN
T of
OPE
RAT
ION
S by
CAT
EGO
RY
Rei
mbu
rsab
le
Nov
embe
r 202
0($
in m
illion
s)
Favo
rabl
e
(Unf
avor
able
)(U
nfav
orab
le)
Favo
rabl
e
(Unf
avor
able
)
Favo
rabl
e
Not
e: F
or m
onth
ly re
porti
ng p
urpo
ses
only
, the
12-
mon
th a
lloca
tion
refle
cts
an a
djus
tmen
t to
fare
box
proj
ectio
ns c
aptu
red
in V
olum
e 1
of th
e 20
20 J
uly
Fina
ncia
l Pla
n
Not
e: R
esul
ts a
re b
ased
on
the
prel
imin
ary
clos
e of
the
gene
ral l
edge
r and
are
sub
ject
to re
view
and
adj
ustm
ent.
Ple
ase
note
that
the
curre
nt m
onth
s’ a
ctua
ls d
o no
t inc
lude
pos
t-clo
se a
djus
tmen
ts, w
hich
will
be c
aptu
red
in th
e su
bseq
uent
m
onth
’s Y
TD re
sults
Master Page # 193 of 228 - New York City Transit and Bus Committee Meeting 1/21/2021________________________________________________________________________________
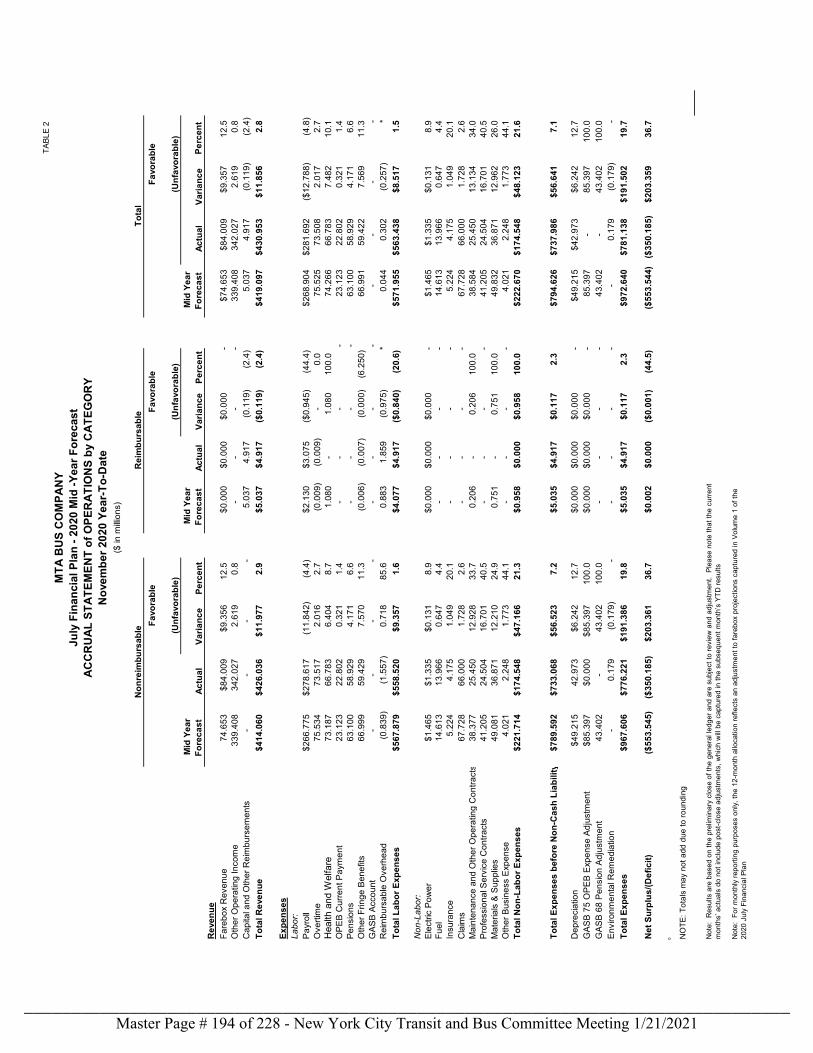
TABL
E 2
Mid
Yea
r Fo
reca
stAc
tual
Varia
nce
Perc
ent
Mid
Yea
r Fo
reca
stAc
tual
Varia
nce
Perc
ent
Mid
Yea
r Fo
reca
stAc
tual
Varia
nce
Perc
ent
Rev
enue
Fare
box
Rev
enue
74.6
53
$84.
009
$9.3
5612
.5$0
.000
$0.0
00$0
.000
-
$74.
653
$84.
009
$9.3
5712
.5O
ther
Ope
ratin
g In
com
e33
9.40
8
342.
027
2.61
9
0.
8-
-
-
-33
9.40
8
34
2.02
7
2.
619
0.
8C
apita
l and
Oth
er R
eim
burs
emen
ts-
-
-
-5.
037
4.
917
(0.1
19)
(2.4
)5.
037
4.
917
(0
.119
)
(2.4
)To
tal R
even
ue$4
14.0
60$4
26.0
36$1
1.97
72.
9$5
.037
$4.9
17($
0.11
9)(2
.4)
$419
.097
$430
.953
$11.
856
2.8
Expe
nses
Labo
r:Pa
yrol
l$2
66.7
75$2
78.6
17(1
1.84
2)
(4.4
)$2
.130
$3.0
75($
0.94
5)(4
4.4)
$268
.904
$281
.692
($12
.788
)(4
.8)
Ove
rtim
e75
.534
73
.517
2.
016
2.7
(0.0
09)
(0
.009
)
-
0.0
75.5
25
73.5
08
2.01
7
2.7
Hea
lth a
nd W
elfa
re73
.187
66
.783
6.
404
8.7
1.08
0
-
1.08
0
100.
074
.266
66
.783
7.
482
10
.1O
PEB
Cur
rent
Pay
men
t23
.123
22
.802
0.
321
1.4
-
-
-
-
23.1
23
22.8
02
0.32
1
1.4
Pens
ions
63.1
00
58.9
29
4.17
1
6.
6-
-
-
-63
.100
58
.929
4.
171
6.
6O
ther
Frin
ge B
enef
its66
.999
59
.429
7.
570
11.3
(0.0
06)
(0
.007
)
(0
.000
)
(6
.250
)
66.9
91
59.4
22
7.56
9
11.3
GAS
B Ac
coun
t-
-
-
--
-
-
--
-
-
-
Rei
mbu
rsab
le O
verh
ead
(0.8
39)
(1.5
57)
0.
718
85.6
0.88
3
1.85
9
(0
.975
)
*0.
044
0.
302
(0
.257
)
*
Tota
l Lab
or E
xpen
ses
$567
.879
$558
.520
$9.3
571.
6$4
.077
$4.9
17($
0.84
0)(2
0.6)
$571
.955
$563
.438
$8.5
171.
5
Non
-Lab
or:
Elec
tric
Pow
er$1
.465
$1.3
35$0
.131
8.9
$0.0
00$0
.000
$0.0
00
-$1
.465
$1.3
35$0
.131
8.9
Fuel
14.6
13
13.9
66
0.64
7
4.
4-
-
-
-14
.613
13
.966
0.
647
4.
4In
sura
nce
5.22
4
4.
175
1.04
9
20
.1-
-
-
-5.
224
4.
175
1.
049
20
.1C
laim
s67
.728
66
.000
1.
728
2.6
-
-
-
-
67.7
28
66.0
00
1.72
8
2.6
Mai
nten
ance
and
Oth
er O
pera
ting
Con
tract
s38
.377
25
.450
12
.928
33
.70.
206
-
0.
206
10
0.0
38.5
84
25.4
50
13.1
34
34.0
Prof
essi
onal
Ser
vice
Con
tract
s41
.205
24
.504
16
.701
40
.5-
-
-
-41
.205
24
.504
16
.701
40
.5M
ater
ials
& S
uppl
ies
49.0
81
36.8
71
12.2
10
24.9
0.75
1
-
0.75
1
100.
049
.832
36
.871
12
.962
26
.0O
ther
Bus
ines
s Ex
pens
e4.
021
2.24
8
1.
773
44.1
-
-
-
-
4.02
1
2.24
8
1.77
3
44.1
Tota
l Non
-Lab
or E
xpen
ses
$221
.714
$174
.548
$47.
166
21.3
$0.9
58$0
.000
$0.9
5810
0.0
$222
.670
$174
.548
$48.
123
21.6
Tota
l Exp
ense
s be
fore
Non
-Cas
h Li
abili
ty
$789
.592
$733
.068
$56.
523
7.2
$5.0
35$4
.917
$0.1
172.
3$7
94.6
26$7
37.9
86$5
6.64
17.
1
Dep
reci
atio
n $4
9.21
542
.973
$6
.242
12.7
$0.0
00$0
.000
$0.0
00
-$4
9.21
5$4
2.97
3$6
.242
12.7
GAS
B 75
OPE
B Ex
pens
e Ad
just
men
t$8
5.39
7$0
.000
$85.
397
100.
0$0
.000
$0.0
00$0
.000
-
85.3
97
-
85
.397
10
0.0
GAS
B 68
Pen
sion
Adj
ustm
ent
43.4
02
-
43
.402
10
0.0
-
-
-
-
43.4
02
-
43
.402
10
0.0
Envi
ronm
enta
l Rem
edia
tion
-
0.17
9
(0
.179
)
-
-
-
-
-
-
0.
179
(0
.179
)
-
Tota
l Exp
ense
s$9
67.6
06$7
76.2
21$1
91.3
8619
.8$5
.035
$4.9
17$0
.117
2.3
$972
.640
$781
.138
$191
.502
19.7
Net
Sur
plus
/(Def
icit)
($55
3.54
5)($
350.
185)
$203
.361
36.7
$0.0
02$0
.000
($0.
001)
(44.
5)($
553.
544)
($35
0.18
5)$2
03.3
5936
.7
0 NO
TE: T
otal
s m
ay n
ot a
dd d
ue to
roun
ding
MTA
BU
S C
OM
PAN
YJu
ly F
inan
cial
Pla
n - 2
020
Mid
-Yea
r For
ecas
tAC
CR
UAL
STA
TEM
ENT
of O
PER
ATIO
NS
by C
ATEG
OR
YN
ovem
ber 2
020
Year
-To-
Dat
e
Non
reim
burs
able
Rei
mbu
rsab
leTo
tal
(Unf
avor
able
)
($ in
milli
ons)
(Unf
avor
able
)
Favo
rabl
eFa
vora
ble
Favo
rabl
e
(Unf
avor
able
)
Not
e: F
or m
onth
ly re
porti
ng p
urpo
ses
only
, the
12-
mon
th a
lloca
tion
refle
cts
an a
djus
tmen
t to
fare
box
proj
ectio
ns c
aptu
red
in V
olum
e 1
of th
e 20
20 J
uly
Fina
ncia
l Pla
n
Not
e: R
esul
ts a
re b
ased
on
the
prel
imin
ary
clos
e of
the
gene
ral l
edge
r and
are
sub
ject
to re
view
and
adj
ustm
ent.
Ple
ase
note
that
the
curre
nt
mon
ths’
act
uals
do
not i
nclu
de p
ost-c
lose
adj
ustm
ents
, whi
ch w
ill be
cap
ture
d in
the
subs
eque
nt m
onth
’s Y
TD re
sults
Master Page # 194 of 228 - New York City Transit and Bus Committee Meeting 1/21/2021________________________________________________________________________________
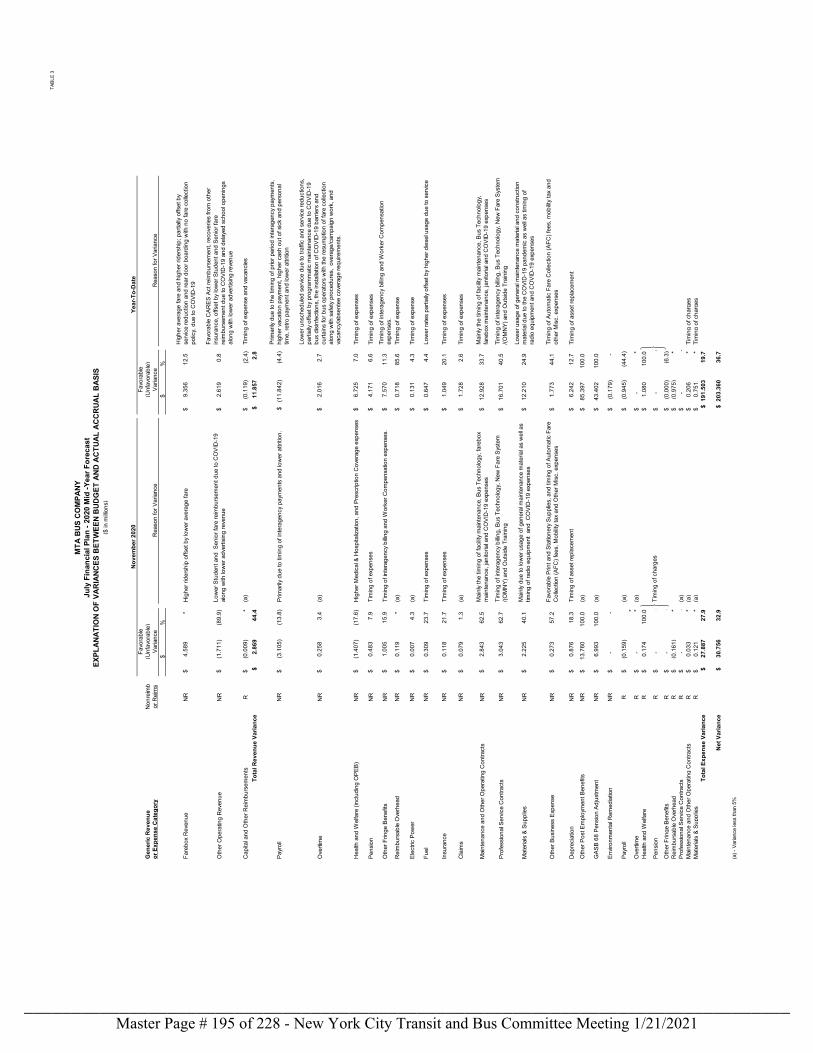
TABL
E 3
Favo
rabl
eFa
vora
ble
Gen
eric
Rev
enue
Non
reim
b(U
nfav
orab
le)
(Unf
avor
able
)or
Exp
ense
Cat
egor
yor
Rei
ms
Varia
nce
Rea
son
for V
aria
nce
Varia
nce
Rea
son
for V
aria
nce
$%
$%
Fare
box
Rev
enue
NR
4.58
9$
*H
ighe
r rid
ersh
ip o
ffset
by
low
er a
vera
ge fa
re9.
356
$
12
.5
Hig
her a
vera
ge fa
re a
nd h
ighe
r rid
ersh
ip; p
artia
lly o
ffset
by
serv
ice
redu
ctio
n an
d re
ar d
oor b
oard
ing
with
no
fare
col
lect
ion
polic
y, d
ue to
CO
VID
-19
Oth
er O
pera
ting
Rev
enue
NR
(1.7
11)
$
(89.
9)
Low
er S
tude
nt a
nd S
enio
r far
e re
imbu
rsem
ent d
ue to
CO
VID
-19
alon
g w
ith lo
wer
adv
ertis
ing
reve
nue
2.61
9$
0.8
Favo
rabl
e C
ARES
Act
reim
burs
emen
t, re
cove
ries
from
oth
er
insu
ranc
e, o
ffset
by
low
er S
tude
nt a
nd S
enio
r far
e re
imbu
rsem
ent d
ue to
CO
VID
-19
and
dela
yed
scho
ol o
peni
ngs
alon
g w
ith lo
wer
adv
ertis
ing
reve
nue
Cap
ital a
nd O
ther
Rei
mbu
rsem
ents
R(0
.009
)$
*
(a)
(0.1
19)
$
(
2.4)
Tim
ing
of e
xpen
se a
nd v
acan
cies
Tota
l Rev
enue
Var
ianc
e $
2.8
69
44.
4 $
1
1.85
7
2.8
Payr
oll
NR
$
(3
.105
)
(1
3.8)
Prim
arily
due
to ti
min
g of
inte
rage
ncy
paym
ents
and
low
er a
ttritio
n. $
(1
1.84
2)
(
4.4)
Prim
arily
due
to th
e tim
ing
of p
rior p
erio
d in
tera
genc
y pa
ymen
ts,
high
er v
acat
ion
paym
ent,
high
er c
ash
out o
f sic
k an
d pe
rson
al
time,
retro
pay
men
t and
low
er a
ttritio
n
Ove
rtim
eN
R0.
258
$
3.4
(a)
2.01
6$
2.7
Low
er u
nsch
edul
ed s
ervic
e du
e to
traf
fic a
nd s
ervic
e re
duct
ions
, pa
rtial
ly of
fset
by
prog
ram
mat
ic m
aint
enan
ce d
ue to
CO
VID
-19
bus
disin
fect
ions
, the
inst
alla
tion
of C
OVI
D-1
9 ba
rrier
s an
d cu
rtain
s fo
r bus
ope
rato
rs w
ith th
e re
sum
ptio
n of
fare
col
lect
ion
alon
g w
ith s
afet
y pr
oced
ures
, ov
erag
e/ca
mpa
ign
wor
k, a
nd
vaca
ncy/
abse
ntee
cov
erag
e re
quire
men
ts.
Hea
lth a
nd W
elfa
re (i
nclu
ding
OPE
B)N
R(1
.407
)$
(1
7.6)
H
ighe
r Med
ical
& H
ospi
taliz
atio
n, a
nd P
resc
riptio
n C
over
age
expe
nses
6.72
5$
7.0
Ti
min
g of
exp
ense
s
Pens
ion
NR
0.48
3$
7.
9
Ti
min
g of
exp
ense
s4.
171
$
6.
6
Tim
ing
of e
xpen
ses
Oth
er F
ringe
Ben
efits
NR
1.00
5$
15
.9
Tim
ing
of in
tera
genc
y bi
lling
and
Wor
ker C
ompe
nsat
ion
expe
nses
.7.
570
$
11
.3
Tim
ing
of in
tera
genc
y bi
lling
and
Wor
ker C
ompe
nsat
ion
expe
nses
.R
eim
burs
able
Ove
rhea
dN
R0.
119
$
*
(a)
0.71
8$
85.6
Ti
min
g of
exp
ense
Elec
tric
Pow
erN
R0.
007
$
4.3
(a)
0.13
1$
4.3
Ti
min
g of
exp
ense
Fuel
NR
0.30
9$
23
.7
Tim
ing
of e
xpen
ses
0.64
7$
4.4
Lo
wer
rate
s pa
rtial
ly of
fset
by
high
er d
iese
l usa
ge d
ue to
ser
vice
Insu
ranc
eN
R0.
118
$
21.7
Ti
min
g of
exp
ense
s1.
049
$
20
.1
Tim
ing
of e
xpen
ses
Cla
ims
NR
0.07
9$
1.
3
(a
)1.
728
$
2.
6
Tim
ing
of e
xpen
ses
Mai
nten
ance
and
Oth
er O
pera
ting
Con
tract
sN
R2.
843
$
62.5
M
ainl
y th
e tim
ing
of fa
cility
mai
nten
ance
, Bus
Tec
hnol
ogy,
fare
box
mai
nten
ance
, jan
itoria
l and
CO
VID
-19
expe
nses
12.9
28$
33.7
M
ainl
y th
e tim
ing
of fa
cility
mai
nten
ance
, Bus
Tec
hnol
ogy,
fa
rebo
x m
aint
enan
ce, j
anito
rial a
nd C
OVI
D-1
9 ex
pens
es
Prof
essio
nal S
ervic
e C
ontra
cts
NR
3.04
3$
62
.7
Tim
ing
of in
tera
genc
y bi
lling,
Bus
Tec
hnol
ogy,
New
Far
e Sy
stem
/(O
MN
Y) a
nd O
utsid
e Tr
aini
ng16
.701
$
40
.5
Tim
ing
of in
tera
genc
y bi
lling,
Bus
Tec
hnol
ogy,
New
Far
e Sy
stem
/(O
MN
Y) a
nd O
utsid
e Tr
aini
ng
Mat
eria
ls &
Supp
lies
NR
2.22
5$
40
.1
Mai
nly
due
to lo
wer
usa
ge o
f gen
eral
mai
nten
ance
mat
eria
l as
wel
l as
timin
g of
radi
o eq
uipm
ent
and
CO
VID
-19
expe
nses
12.2
10$
24.9
Lo
wer
usa
ge o
f gen
eral
mai
nten
ance
mat
eria
l and
con
stru
ctio
n m
ater
ial d
ue to
the
CO
VID
-19
pand
emic
as
wel
l as
timin
g of
ra
dio
equi
pmen
t and
CO
VID
-19
expe
nses
Oth
er B
usin
ess
Expe
nse
NR
0.27
3$
57
.2
Favo
rabl
e Pr
int a
nd S
tatio
nery
Sup
plie
s, a
nd ti
min
g of
Aut
omat
ic F
are
Col
lect
ion
(AFC
) fee
s, M
obilit
y ta
x an
d O
ther
Misc
. exp
ense
s1.
773
$
44
.1
Tim
ing
of A
utom
atic
Far
e C
olle
ctio
n (A
FC) f
ees,
mob
ility
tax
and
othe
r Misc
. exp
ense
s
Dep
reci
atio
nN
R0.
876
$
18.3
Ti
min
g of
ass
et re
plac
emen
t6.
242
$
12
.7
Tim
ing
of a
sset
repl
acem
ent
Oth
er P
ost E
mpl
oym
ent B
enef
itsN
R13
.760
$
10
0.0
(a)
85.3
97$
100.
0
GAS
B 68
Pen
sion
Adju
stm
ent
NR
6.99
3$
10
0.0
(a)
43.4
02$
100.
0
Envir
onm
enta
l Rem
edia
tion
NR
-$
-
(0.1
79)
$
-
Payr
oll
R(0
.159
)$
*
(a)
(0.9
45)
$
(4
4.4)
Ove
rtim
eR
-$
* (a
)-
$
* H
ealth
and
Wel
fare
R0.
174
$
100.
0 1.
080
$
100
.0
Pens
ion
R-
$
- -
$
-
Oth
er F
ringe
Ben
efits
R-
$
- (0
.000
)$
(6.
3)R
eim
burs
able
Ove
rhea
dR
(0.1
61)
$
* (0
.975
)$
* Pr
ofes
siona
l Ser
vice
Con
tract
sR
-$
-
(a)
-$
- M
aint
enan
ce a
nd O
ther
Ope
ratin
g C
ontra
cts
R0.
033
$
* (a
)0.
206
$
*
Tim
ing
of c
harg
esM
ater
ials
& Su
pplie
sR
0.12
1$
*
(a)
0.75
1$
* Ti
min
g of
cha
rges
Tota
l Exp
ense
Var
ianc
e $
27.8
87
27.
9 $
191
.503
1
9.7
Net
Var
ianc
e $
30.7
56
32.
9 $
203
.360
3
6.7
(a) -
Var
ianc
e le
ss th
an 5
%
MTA
BUS
CO
MPA
NY
($ in
milli
ons)
EXPL
ANAT
ION
OF
VAR
IANC
ES B
ETW
EEN
BUD
GET
AND
AC
TUAL
AC
CR
UAL
BAS
ISJu
ly F
inan
cial
Pla
n - 2
020
Mid
-Yea
r For
ecas
t
Tim
ing
of c
harg
es
Nov
embe
r 202
0Ye
ar-T
o-D
ate
Master Page # 195 of 228 - New York City Transit and Bus Committee Meeting 1/21/2021________________________________________________________________________________
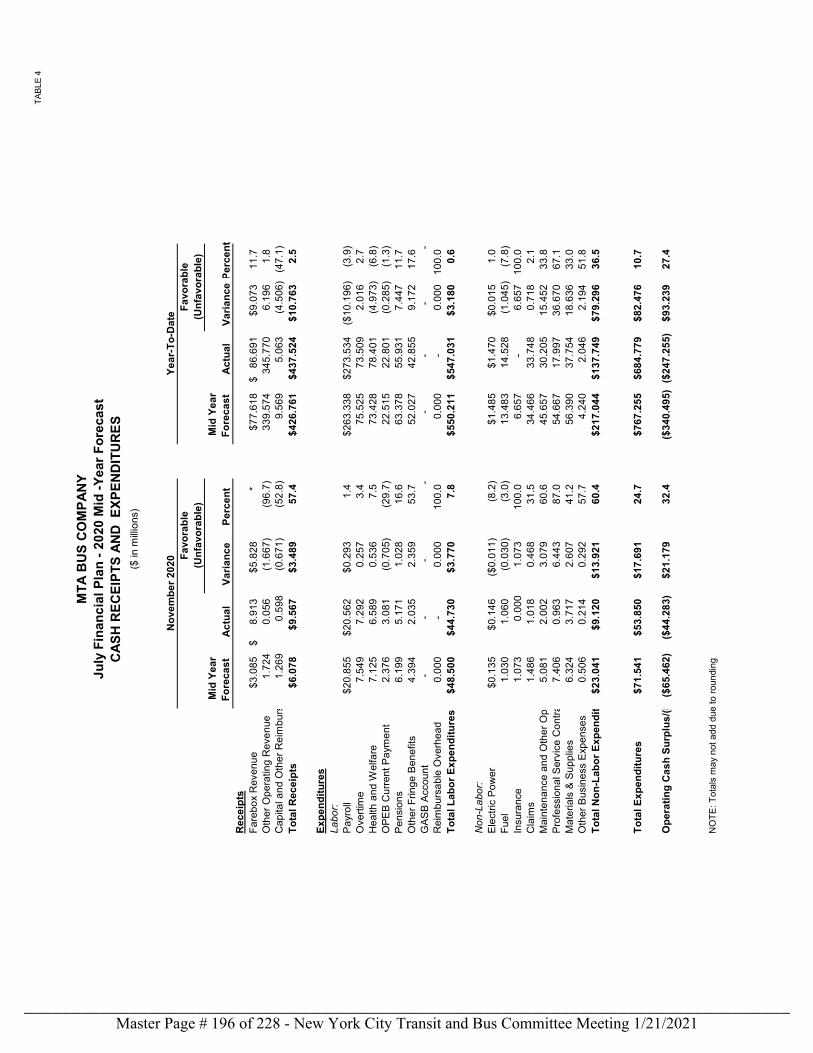
TABL
E 4
Mid
Yea
r Fo
reca
stAc
tual
Varia
nce
Perc
ent
Mid
Yea
r Fo
reca
stAc
tual
Varia
nce
Perc
ent
Rec
eipt
sFa
rebo
x R
even
ue$3
.085
8.91
3$
$5.8
28
*$7
7.61
886
.691
$
$9.0
7311
.7O
ther
Ope
ratin
g R
even
ue1.
724
0.05
6
(1.6
67)
(9
6.7)
339.
574
345.
770
6.19
6
1.
8C
apita
l and
Oth
er R
eim
burs
1.26
90.
598
(0.6
71)
(5
2.8)
9.56
9
5.06
3
(4.5
06)
(47.
1)To
tal R
ecei
pts
$6.0
78$9
.567
$3.4
8957
.4$4
26.7
61$4
37.5
24$1
0.76
32.
5
Expe
nditu
res
Labo
r:Pa
yrol
l$2
0.85
5$2
0.56
2$0
.293
1.4
$263
.338
$273
.534
($10
.196
)(3
.9)
Ove
rtim
e7.
549
7.
292
0.
257
3.
475
.525
73.5
09
2.
016
2.7
Hea
lth a
nd W
elfa
re
7.12
5
6.58
9
0.53
6
7.5
73.4
28
78
.401
(4.9
73)
(6.8
)O
PEB
Cur
rent
Pay
men
t2.
376
3.
081
(0
.705
)
(29.
7)22
.515
22.8
01
(0
.285
)
(1
.3)
Pens
ions
6.19
9
5.17
1
1.02
8
16.6
63.3
78
55
.931
7.44
7
11
.7O
ther
Frin
ge B
enef
its
4.39
4
2.03
5
2.35
9
53.7
52.0
27
42
.855
9.17
2
17
.6G
ASB
Acco
unt
-
-
-
--
-
-
-R
eim
burs
able
Ove
rhea
d 0.
000
-
0.00
0
100.
00.
000
-
0.
000
100.
0To
tal L
abor
Exp
endi
ture
s$4
8.50
0$4
4.73
0$3
.770
7.8
$550
.211
$547
.031
$3.1
800.
6
Non
-Lab
or:
Elec
tric
Pow
er$0
.135
$0.1
46($
0.01
1)(8
.2)
$1.4
85$1
.470
$0.0
151.
0Fu
el1.
030
1.
060
(0
.030
)
(3.0
)13
.483
14.5
28
(1
.045
)
(7
.8)
Insu
ranc
e1.
073
0.
000
1.07
3
100.
06.
657
-
6.
657
100.
0C
laim
s 1.
486
1.
018
0.
468
31
.534
.466
33.7
48
0.
718
2.1
Mai
nten
ance
and
Oth
er O
p 5.08
1
2.00
2
3.07
9
60.6
45.6
57
30
.205
15.4
52
33
.8Pr
ofes
sion
al S
ervi
ce C
ontra
7.40
6
0.96
3
6.44
3
87.0
54.6
67
17
.997
36.6
70
67
.1M
ater
ials
& S
uppl
ies
6.32
4
3.71
7
2.60
7
41.2
56.3
90
37
.754
18.6
36
33
.0O
ther
Bus
ines
s Ex
pens
es
0.50
6
0.21
4
0.29
2
57.7
4.24
0
2.04
6
2.19
4
51
.8To
tal N
on-L
abor
Exp
endi
t$2
3.04
1$9
.120
$13.
921
60.4
$217
.044
$137
.749
$79.
296
36.5
Tota
l Exp
endi
ture
s$7
1.54
1$5
3.85
0$1
7.69
124
.7$7
67.2
55$6
84.7
79$8
2.47
610
.7
Ope
ratin
g C
ash
Surp
lus/
(D($
65.4
62)
($44
.283
)$2
1.17
932
.4($
340.
495)
($24
7.25
5)$9
3.23
927
.4
NO
TE: T
otal
s m
ay n
ot a
dd d
ue to
roun
ding
July
Fin
anci
al P
lan
- 202
0 M
id -Y
ear F
orec
ast
MTA
BU
S C
OM
PAN
Y
(Unf
avor
able
)(U
nfav
orab
le)
($ in
milli
ons)
CAS
H R
ECEI
PTS
AND
EXP
END
ITU
RES
Nov
embe
r 202
0Ye
ar-T
o-D
ate
Favo
rabl
eFa
vora
ble
Master Page # 196 of 228 - New York City Transit and Bus Committee Meeting 1/21/2021________________________________________________________________________________
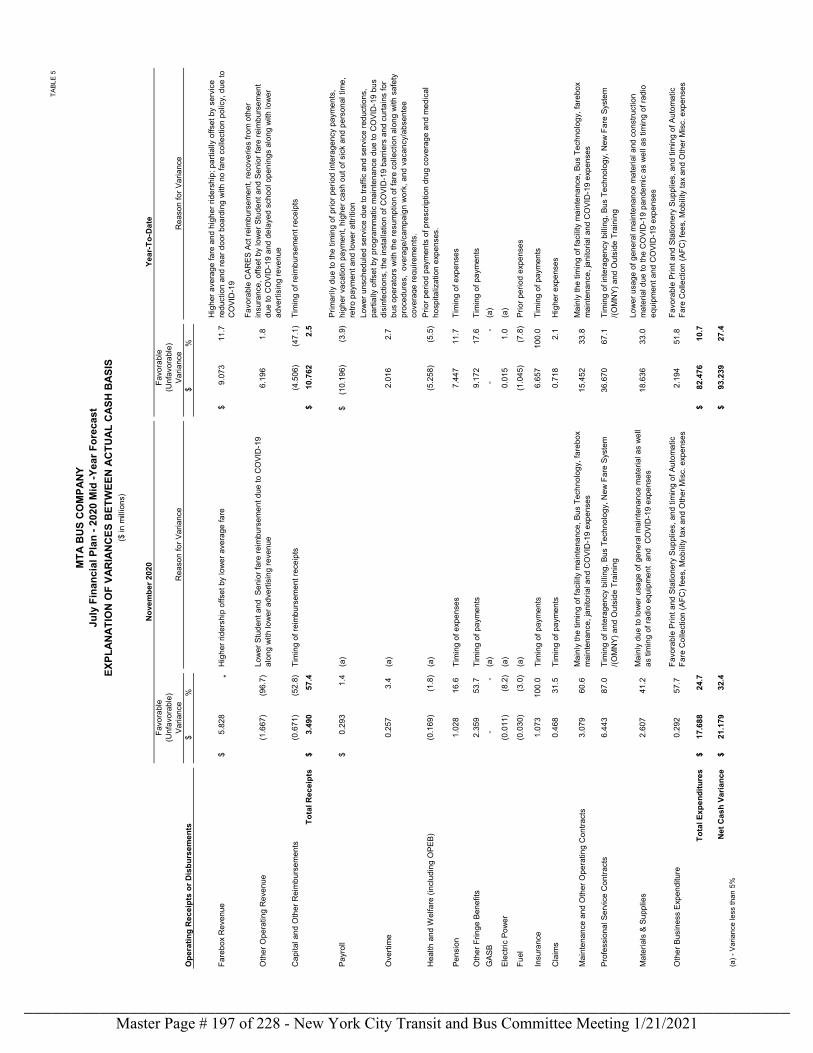
TABL
E 5
Favo
rabl
eFa
vora
ble
(Unf
avor
able
)(U
nfav
orab
le)
Varia
nce
Rea
son
for V
aria
nce
Varia
nce
Rea
son
for V
aria
nce
Ope
ratin
g R
ecei
pts
or D
isbu
rsem
ents
$%
$%
Fare
box
Rev
enue
$
5
.828
*
Hig
her r
ider
ship
offs
et b
y lo
wer
ave
rage
fare
$
9.07
3
1
1.7
Hig
her a
vera
ge fa
re a
nd h
ighe
r rid
ersh
ip; p
artia
lly o
ffset
by
serv
ice
redu
ctio
n an
d re
ar d
oor b
oard
ing
with
no
fare
col
lect
ion
polic
y, d
ue to
C
OVI
D-1
9
Oth
er O
pera
ting
Rev
enue
(1.6
67)
(9
6.7)
Low
er S
tude
nt a
nd S
enio
r far
e re
imbu
rsem
ent d
ue to
CO
VID
-19
alon
g w
ith lo
wer
adv
ertis
ing
reve
nue
6.19
6
1.
8
Favo
rabl
e C
ARES
Act
reim
burs
emen
t, re
cove
ries
from
oth
er
insu
ranc
e, o
ffset
by
low
er S
tude
nt a
nd S
enio
r far
e re
imbu
rsem
ent
due
to C
OVI
D-1
9 an
d de
laye
d sc
hool
ope
ning
s al
ong
with
low
er
adve
rtisi
ng re
venu
e
Cap
ital a
nd O
ther
Rei
mbu
rsem
ents
(0.6
71)
(5
2.8)
Tim
ing
of re
imbu
rsem
ent r
ecei
pts
(4
.506
)
(4
7.1)
Tim
ing
of re
imbu
rsem
ent r
ecei
pts
Tota
l Rec
eipt
s $
3.4
90
57.
4 $
10.
762
2
.5
Payr
oll
$
0
.293
1.4
(a
) $
(
10.1
96)
(3.
9)Pr
imar
ily d
ue to
the
timin
g of
prio
r per
iod
inte
rage
ncy
paym
ents
, hi
gher
vac
atio
n pa
ymen
t, hi
gher
cas
h ou
t of s
ick
and
pers
onal
tim
e,
retro
pay
men
t and
low
er a
ttriti
on
Ove
rtim
e0.
257
3.4
(a
)2.
016
2.7
Low
er u
nsch
edul
ed s
ervi
ce d
ue to
traf
fic a
nd s
ervi
ce re
duct
ions
, pa
rtial
ly o
ffset
by
prog
ram
mat
ic m
aint
enan
ce d
ue to
CO
VID
-19
bus
disi
nfec
tions
, the
inst
alla
tion
of C
OVI
D-1
9 ba
rrier
s an
d cu
rtain
s fo
r bu
s op
erat
ors
with
the
resu
mpt
ion
of fa
re c
olle
ctio
n al
ong
with
saf
ety
proc
edur
es,
over
age/
cam
paig
n w
ork,
and
vac
ancy
/abs
ente
e co
vera
ge re
quire
men
ts.
Hea
lth a
nd W
elfa
re (i
nclu
ding
OPE
B)(0
.169
)
(1.8
)
(a)
(5.2
58)
(5.5
)
Prio
r per
iod
paym
ents
of p
resc
riptio
n dr
ug c
over
age
and
med
ical
ho
spita
lizat
ion
expe
nses
.
Pens
ion
1.02
8
16
.6
Tim
ing
of e
xpen
ses
7.44
7
11
.7
Tim
ing
of e
xpen
ses
Oth
er F
ringe
Ben
efits
2.35
9
53
.7
Tim
ing
of p
aym
ents
9.17
2
17
.6
Tim
ing
of p
aym
ents
GAS
B-
-
(a)
-
-
(a)
Elec
tric
Pow
er(0
.011
)
(8.2
)
( a)
0.01
5
1.
0
(a)
Fuel
(0.0
30)
(3
.0)
(a
)(1
.045
)
(7
.8)
Pr
ior p
erio
d ex
pens
es
Insu
ranc
e1.
073
100.
0
Ti
min
g of
pay
men
ts6.
657
100.
0
Ti
min
g of
pay
men
ts
Cla
ims
0.46
8
31
.5
Tim
ing
of p
aym
ents
0.71
8
2.
1
Hig
her e
xpen
ses
Mai
nten
ance
and
Oth
er O
pera
ting
Con
tract
s3.
079
60.6
M
ainl
y th
e tim
ing
of fa
cilit
y m
aint
enan
ce, B
us T
echn
olog
y, fa
rebo
x m
aint
enan
ce, j
anito
rial a
nd C
OVI
D-1
9 ex
pens
es15
.452
33
.8
Mai
nly
the
timin
g of
faci
lity
mai
nten
ance
, Bus
Tec
hnol
ogy,
fare
box
mai
nten
ance
, jan
itoria
l and
CO
VID
-19
expe
nses
Prof
essi
onal
Ser
vice
Con
tract
s6.
443
87.0
Ti
min
g of
inte
rage
ncy
billi
ng, B
us T
echn
olog
y, N
ew F
are
Syst
em
/(OM
NY)
and
Out
side
Tra
inin
g36
.670
67
.1
Tim
ing
of in
tera
genc
y bi
lling
, Bus
Tec
hnol
ogy,
New
Far
e Sy
stem
/(O
MN
Y) a
nd O
utsi
de T
rain
ing
Mat
eria
ls &
Sup
plie
s2.
607
41.2
M
ainl
y du
e to
low
er u
sage
of g
ener
al m
aint
enan
ce m
ater
ial a
s w
ell
as ti
min
g of
radi
o eq
uipm
ent
and
CO
VID
-19
expe
nses
18.6
36
33.0
Lo
wer
usa
ge o
f gen
eral
mai
nten
ance
mat
eria
l and
con
stru
ctio
n m
ater
ial d
ue to
the
CO
VID
-19
pand
emic
as
wel
l as
timin
g of
radi
o eq
uipm
ent a
nd C
OVI
D-1
9 ex
pens
es
Oth
er B
usin
ess
Expe
nditu
re0.
292
57.7
Fa
vora
ble
Prin
t and
Sta
tione
ry S
uppl
ies,
and
tim
ing
of A
utom
atic
Fa
re C
olle
ctio
n (A
FC) f
ees,
Mob
ility
tax
and
Oth
er M
isc.
exp
ense
s2.
194
51.8
Fa
vora
ble
Prin
t and
Sta
tione
ry S
uppl
ies,
and
tim
ing
of A
utom
atic
Fa
re C
olle
ctio
n (A
FC) f
ees,
Mob
ility
tax
and
Oth
er M
isc.
exp
ense
s
Tota
l Exp
endi
ture
s $
17.6
88
24.
7 $
82.
476
10.
7
Net
Cas
h Va
rianc
e $
21.1
79
32.
4 $
93.
239
27.
4 (a
) - V
aria
nce
less
than
5%
Nov
embe
r 202
0Ye
ar-T
o-D
ate
EXPL
ANAT
ION
OF
VAR
IAN
CES
BET
WEE
N A
CTU
AL C
ASH
BAS
IS
MTA
BU
S C
OM
PAN
YJu
ly F
inan
cial
Pla
n - 2
020
Mid
-Yea
r For
ecas
t
($ in
mill
ions
)
Master Page # 197 of 228 - New York City Transit and Bus Committee Meeting 1/21/2021________________________________________________________________________________
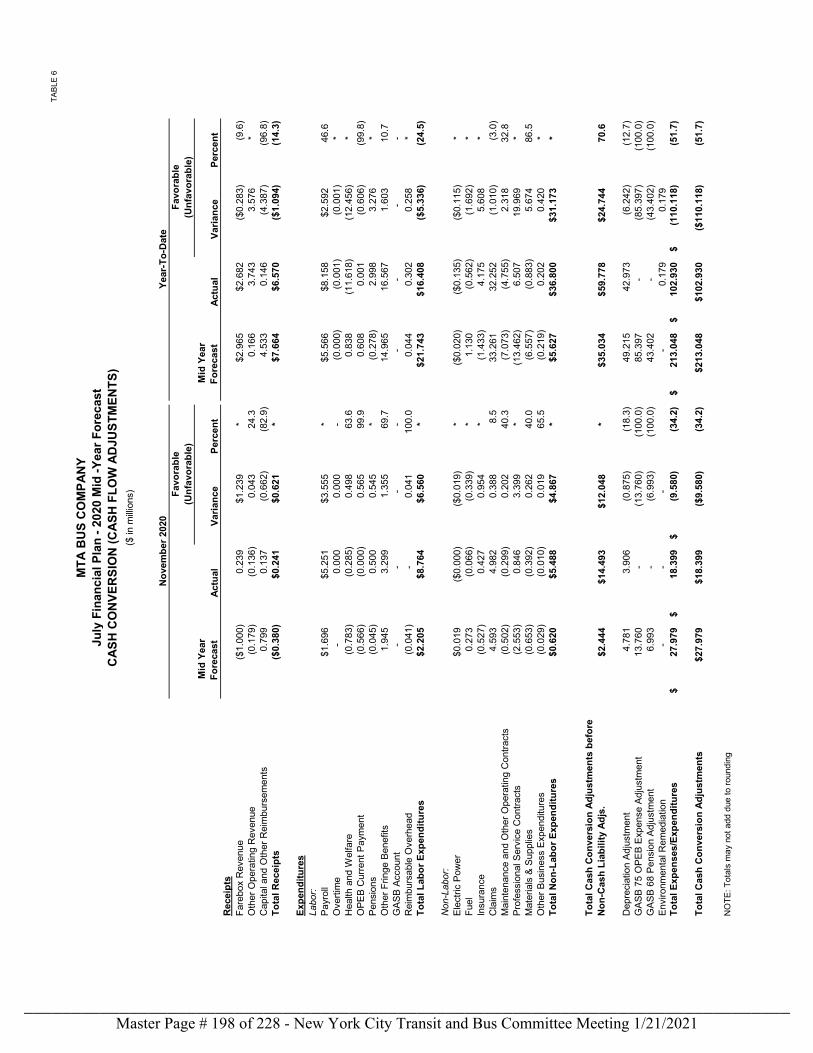
TABL
E 6
Mid
Yea
r Fo
reca
stAc
tual
Varia
nce
Perc
ent
Mid
Yea
r Fo
reca
stAc
tual
Varia
nce
Perc
ent
Rec
eipt
sFa
rebo
x R
even
ue($
1.00
0)0.
239
$1.2
39
*$2
.965
$2.6
82($
0.28
3)(9
.6)
Oth
er O
pera
ting
Rev
enue
(0.1
79)
(0
.136
)
0.04
3
24
.30.
166
3.
743
3.
576
*C
apita
l and
Oth
er R
eim
burs
emen
ts0.
799
0.13
7
(0
.662
)
(82.
9)4.
533
0.
146
(4
.387
)
(96.
8)To
tal R
ecei
pts
($0.
380)
$0.2
41$0
.621
*
$7.6
64$6
.570
($1.
094)
(14.
3)
Expe
nditu
res
Labo
r:Pa
yrol
l $1
.696
$5.2
51$3
.555
*
$5.5
66$8
.158
$2.5
9246
.6O
verti
me
-
0.
000
0.00
0
-(0
.000
)
(0.0
01)
(0
.001
)
*
Hea
lth a
nd W
elfa
re(0
.783
)
(0.2
85)
0.
498
63.6
0.83
8
(11.
618)
(12.
456)
*
OPE
B C
urre
nt P
aym
ent
(0.5
66)
(0
.000
)
0.56
5
99
.90.
608
0.
001
(0
.606
)
(99.
8)Pe
nsio
ns(0
.045
)
0.50
0
0.
545
*
(0.2
78)
2.
998
3.
276
*O
ther
Frin
ge B
enef
its1.
945
3.29
9
1.
355
69.7
14.9
65
16.5
67
1.
603
10
.7G
ASB
Acco
unt
-
-
-
--
-
-
-
Rei
mbu
rsab
le O
verh
ead
(0.0
41)
-
0.04
1
10
0.0
0.04
4
0.30
2
0.25
8
*
Tota
l Lab
or E
xpen
ditu
res
$2.2
05$8
.764
$6.5
60
*$2
1.74
3$1
6.40
8($
5.33
6)(2
4.5)
Non
-Lab
or:
Elec
tric
Pow
er$0
.019
($0.
000)
($0.
019)
*
($0.
020)
($0.
135)
($0.
115)
*
Fuel
0.27
3
(0
.066
)
(0.3
39)
*1.
130
(0
.562
)
(1.6
92)
*In
sura
nce
(0.5
27)
0.
427
0.95
4
*(1
.433
)
4.17
5
5.60
8
*
Cla
ims
4.59
3
4.
982
0.38
8
8.
533
.261
32
.252
(1.0
10)
(3
.0)
Mai
nten
ance
and
Oth
er O
pera
ting
Con
tract
s(0
.502
)
(0.2
99)
0.
202
40.3
(7.0
73)
(4
.755
)
2.31
8
32.8
Prof
essi
onal
Ser
vice
Con
tract
s(2
.553
)
0.84
6
3.
399
*
(13.
462)
6.50
7
19.9
69
*
Mat
eria
ls &
Sup
plie
s(0
.653
)
(0.3
92)
0.
262
40.0
(6.5
57)
(0
.883
)
5.67
4
86.5
Oth
er B
usin
ess
Expe
nditu
res
(0.0
29)
(0
.010
)
0.01
9
65
.5(0
.219
)
0.20
2
0.42
0
*
Tota
l Non
-Lab
or E
xpen
ditu
res
$0.6
20$5
.488
$4.8
67
*$5
.627
$36.
800
$31.
173
*
Tota
l Cas
h C
onve
rsio
n Ad
just
men
ts b
efor
e N
on-C
ash
Liab
ility
Adj
s.$2
.444
$14.
493
$12.
048
*
$35.
034
$59.
778
$24.
744
70.6
Dep
reci
atio
n Ad
just
men
t4.
781
3.90
6
(0
.875
)
(18.
3)49
.215
42
.973
(6.2
42)
(1
2.7)
GAS
B 75
OPE
B Ex
pens
e Ad
just
men
t13
.760
-
(13.
760)
(1
00.0
)85
.397
-
(85.
397)
(100
.0)
GAS
B 68
Pen
sion
Adj
ustm
ent
6.99
3
-
(6.9
93)
(1
00.0
)43
.402
-
(43.
402)
(100
.0)
Envi
ronm
enta
l Rem
edia
tion
-
-
-
-
0.17
9
0.17
9
Tota
l Exp
ense
s/Ex
pend
iture
s27
.979
$
18
.399
$
(9
.580
)$
(34.
2)21
3.04
8$
10
2.93
0$
(1
10.1
18)
$
(51.
7)
Tota
l Cas
h C
onve
rsio
n Ad
just
men
ts$2
7.97
9$1
8.39
9($
9.58
0)(3
4.2)
$213
.048
$102
.930
($11
0.11
8)(5
1.7)
NO
TE: T
otal
s m
ay n
ot a
dd d
ue to
roun
ding
(Unf
avor
able
)(U
nfav
orab
le)
MTA
BU
S C
OM
PAN
YJu
ly F
inan
cial
Pla
n - 2
020
Mid
-Yea
r For
ecas
tC
ASH
CO
NVE
RSI
ON
(CAS
H F
LOW
AD
JUST
MEN
TS)
($ in
milli
ons)
Nov
embe
r 202
0Ye
ar-T
o-D
ate
Favo
rabl
eFa
vora
ble
Master Page # 198 of 228 - New York City Transit and Bus Committee Meeting 1/21/2021________________________________________________________________________________
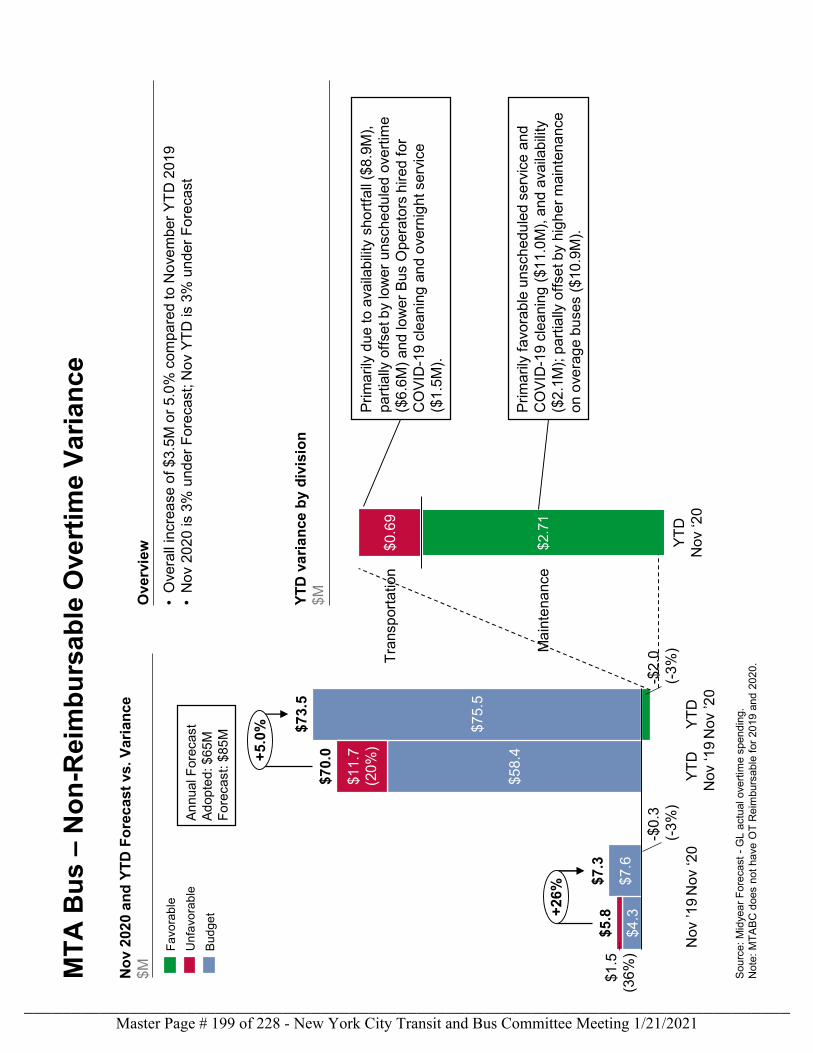
MT
A B
us
–N
on
-Rei
mb
urs
ab
le O
vert
ime
Va
ria
nce
Sou
rce:
Mid
yea
r F
ore
cast
-G
L a
ctu
al o
vert
ime
spen
din
g.N
ote:
MT
AB
C d
oes
not
have
OT
Re
imbu
rsab
le f
or 2
019
and
202
0.. N
ov
202
0 a
nd
YT
D F
ore
cas
t vs
. Var
ian
ce$M
YT
D v
ari
an
ce b
y d
ivis
ion
$M
Pri
ma
rily
due
to a
vaila
bili
ty s
hort
fall
($8.
9M),
pa
rtia
lly o
ffse
t by
low
er u
nsch
edu
led
over
time
($6
.6M
) an
d lo
wer
Bus
Ope
rato
rs h
ired
for
C
OV
ID-1
9 c
lea
ning
an
d o
vern
ight
se
rvic
e
($1
.5M
).
•O
vera
ll in
crea
se o
f $3.
5M
or
5.0
% c
ompa
red
to N
ove
mbe
r Y
TD
201
9•
No
v 20
20 is
3%
und
er F
ore
cast
; No
v Y
TD
is 3
% u
nde
r F
ore
cast
Ove
rvie
w
$4.3
$7.6
$58.
4
$75.
5
-$0
.3(-
3%
)
Nov
‘20
Nov
’19
$5.8
$1.5
(36
%)
YT
D
Nov
‘19
$11.
7(2
0%
)
-$2
.0(-
3%
)
YT
D
Nov
’20
$7.3
$70.
0
$73.
5
+26
%
+5.
0%
Fa
vora
ble
Un
favo
rab
le
Bu
dg
et
$0.6
9
$2.
71
Tra
nsp
orta
tion
YT
D
Nov
‘20
Ma
inte
nanc
e
An
nual
For
ecas
tA
dop
ted:
$65
MF
ore
cast
: $85
M
Pri
ma
rily
favo
rabl
e u
nsch
edu
led
serv
ice
and
C
OV
ID-1
9 c
lea
ning
($1
1.0
M),
and
ava
ilab
ility
($
2.1
M);
pa
rtia
lly o
ffse
t by
hig
her
mai
nten
anc
e
on o
vera
ge
buse
s ($
10.9
M).
Master Page # 199 of 228 - New York City Transit and Bus Committee Meeting 1/21/2021________________________________________________________________________________
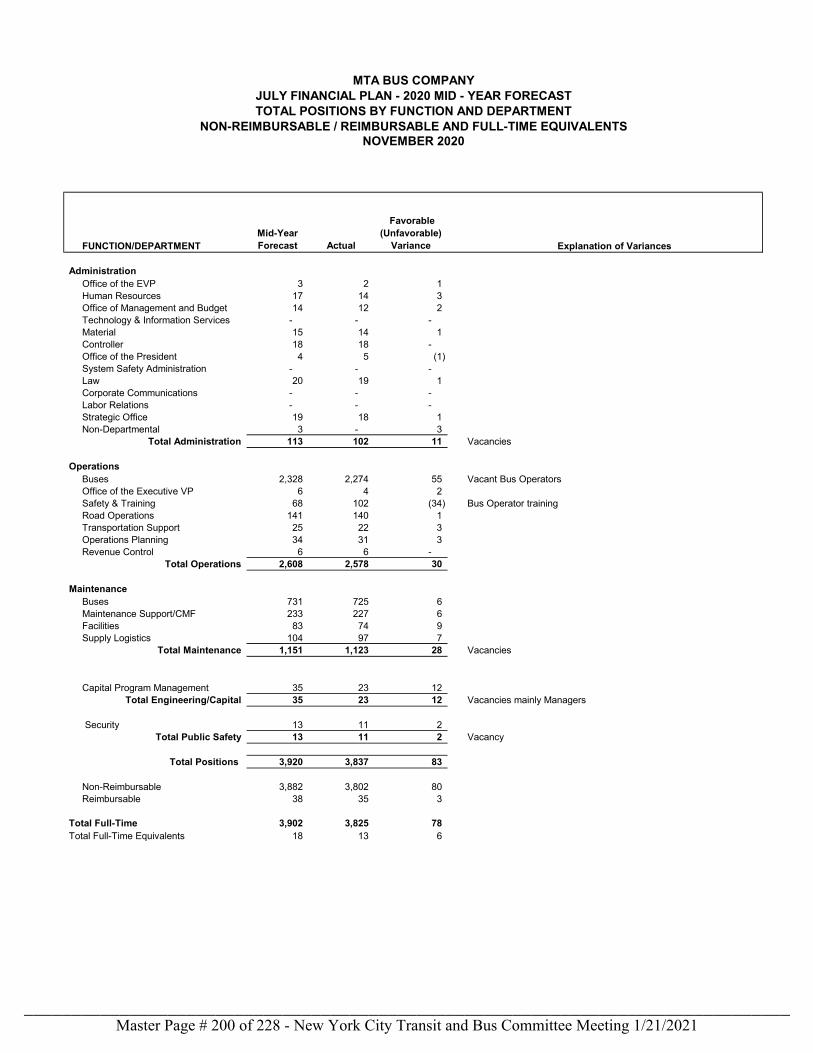
FUNCTION/DEPARTMENTMid-Year Forecast Actual
Favorable (Unfavorable)
Variance Explanation of Variances
AdministrationOffice of the EVP 3 2 1 Human Resources 17 14 3 Office of Management and Budget 14 12 2 Technology & Information Services - - - Material 15 14 1 Controller 18 18 - Office of the President 4 5 (1) System Safety Administration - - - Law 20 19 1 Corporate Communications - - - Labor Relations - - - Strategic Office 19 18 1 Non-Departmental 3 - 3
Total Administration 113 102 11 Vacancies
OperationsBuses 2,328 2,274 55 Vacant Bus OperatorsOffice of the Executive VP 6 4 2 Safety & Training 68 102 (34) Bus Operator training Road Operations 141 140 1 Transportation Support 25 22 3 Operations Planning 34 31 3 Revenue Control 6 6 -
Total Operations 2,608 2,578 30
MaintenanceBuses 731 725 6 Maintenance Support/CMF 233 227 6 Facilities 83 74 9 Supply Logistics 104 97 7
Total Maintenance 1,151 1,123 28 Vacancies
Capital Program Management 35 23 12 Total Engineering/Capital 35 23 12 Vacancies mainly Managers
Security 13 11 2 Total Public Safety 13 11 2 Vacancy
Total Positions 3,920 3,837 83
Non-Reimbursable 3,882 3,802 80 Reimbursable 38 35 3
Total Full-Time 3,902 3,825 78 Total Full-Time Equivalents 18 13 6
MTA BUS COMPANYJULY FINANCIAL PLAN - 2020 MID - YEAR FORECASTTOTAL POSITIONS BY FUNCTION AND DEPARTMENT
NON-REIMBURSABLE / REIMBURSABLE AND FULL-TIME EQUIVALENTSNOVEMBER 2020
Master Page # 200 of 228 - New York City Transit and Bus Committee Meeting 1/21/2021________________________________________________________________________________
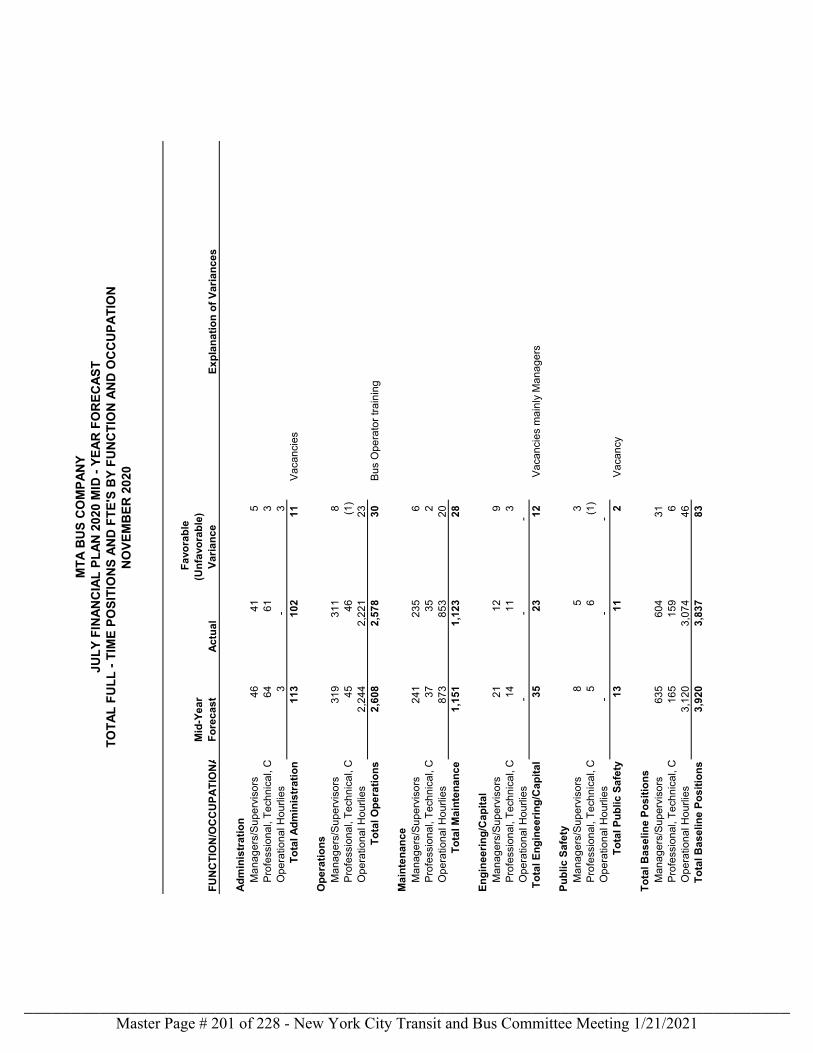
FUN
CTI
ON
/OC
CU
PATI
ON
A
Mid
-Yea
r Fo
reca
stAc
tual
Fav
orab
le
(Unf
avor
able
) Va
rianc
e Ex
plan
atio
n of
Var
ianc
es
Adm
inis
trat
ion
Man
ager
s/Su
perv
isor
s46
41
5
Prof
essi
onal
, Tec
hnic
al, C
64
613
O
pera
tiona
l Hou
rlies
3
-
3
To
tal A
dmin
istr
atio
n11
310
211
Va
canc
ies
Ope
ratio
nsM
anag
ers/
Supe
rvis
ors
319
311
8
Prof
essi
onal
, Tec
hnic
al, C
4546
(1)
O
pera
tiona
l Hou
rlies
2,24
42,
221
23
Tota
l Ope
ratio
ns2,
608
2,57
830
Bu
s O
pera
tor t
rain
ing
Mai
nten
ance
Man
ager
s/Su
perv
isor
s24
123
56
Pr
ofes
sion
al, T
echn
ical
, C37
352
O
pera
tiona
l Hou
rlies
873
853
20
Tota
l Mai
nten
ance
1,15
11,
123
28
Engi
neer
ing/
Cap
ital
Man
ager
s/Su
perv
isor
s21
129
Pr
ofes
sion
al, T
echn
ical
, C14
113
O
pera
tiona
l Hou
rlies
-
-
-
To
tal E
ngin
eerin
g/C
apita
l35
2312
Va
canc
ies
mai
nly
Man
ager
s
Publ
ic S
afet
yM
anag
ers/
Supe
rvis
ors
85
3
Prof
essi
onal
, Tec
hnic
al, C
56
(1)
O
pera
tiona
l Hou
rlies
-
-
-
To
tal P
ublic
Saf
ety
1311
2
Vaca
ncy
Tota
l Bas
elin
e Po
sitio
nsM
anag
ers/
Supe
rvis
ors
635
604
31
Prof
essi
onal
, Tec
hnic
al, C
165
159
6
Ope
ratio
nal H
ourli
es3,
120
3,07
446
To
tal B
asel
ine
Posi
tions
3,92
03,
837
83
MTA
BU
S C
OM
PAN
YJU
LY F
INAN
CIA
L PL
AN 2
020
MID
- YE
AR F
OR
ECAS
TTO
TAL
FULL
- TI
ME
POSI
TIO
NS
AND
FTE
'S B
Y FU
NC
TIO
N A
ND
OC
CU
PATI
ON
NO
VEM
BER
202
0
Master Page # 201 of 228 - New York City Transit and Bus Committee Meeting 1/21/2021________________________________________________________________________________
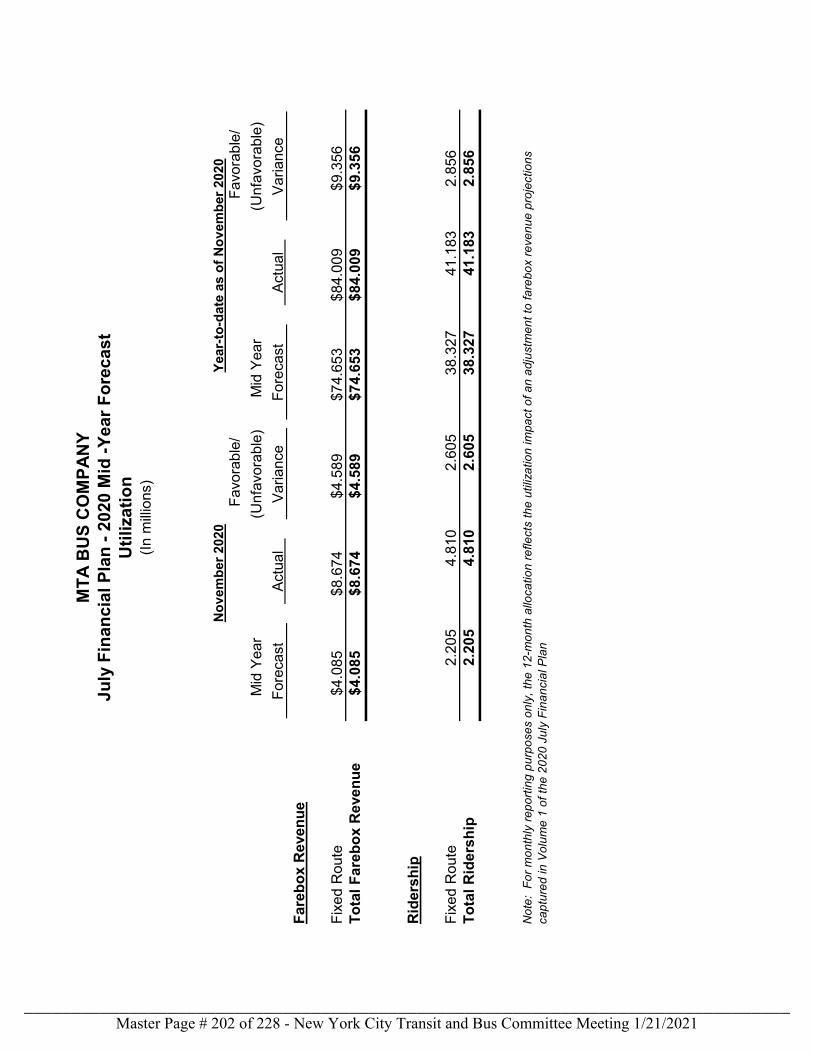
Mid
Yea
r Fo
reca
st
Ac
tual
Fav
orab
le/
(Unf
avor
able
)Va
rianc
e M
id Y
ear
Fore
cast
Actu
al
Fav
orab
le/
(Unf
avor
able
)Va
rianc
e Fa
rebo
x R
even
ue
Fixe
d R
oute
$4.0
85$8
.674
$4.5
89$7
4.65
3$8
4.00
9$9
.356
Tota
l Far
ebox
Rev
enue
$4.0
85$8
.674
$4.5
89$7
4.65
3$8
4.00
9$9
.356
Rid
ersh
ip
Fixe
d R
oute
2.20
5
4.
810
2.60
5
38
.327
41.1
83
2.
856
Tota
l Rid
ersh
ip2.
205
4.81
0
2.
605
38.3
27
41
.183
2.85
6
MTA
BU
S C
OM
PAN
YJu
ly F
inan
cial
Pla
n - 2
020
Mid
-Yea
r For
ecas
tU
tiliz
atio
n(In
milli
ons)
Not
e: F
or m
onth
ly re
porti
ng p
urpo
ses
only
, the
12-
mon
th a
lloca
tion
refle
cts
the
utili
zatio
n im
pact
of a
n ad
just
men
t to
fare
box
reve
nue
proj
ectio
ns
capt
ured
in V
olum
e 1
of th
e 20
20 J
uly
Fina
ncia
l Pla
n
Nov
embe
r 202
0Ye
ar-to
-dat
e as
of N
ovem
ber 2
020
Master Page # 202 of 228 - New York City Transit and Bus Committee Meeting 1/21/2021________________________________________________________________________________
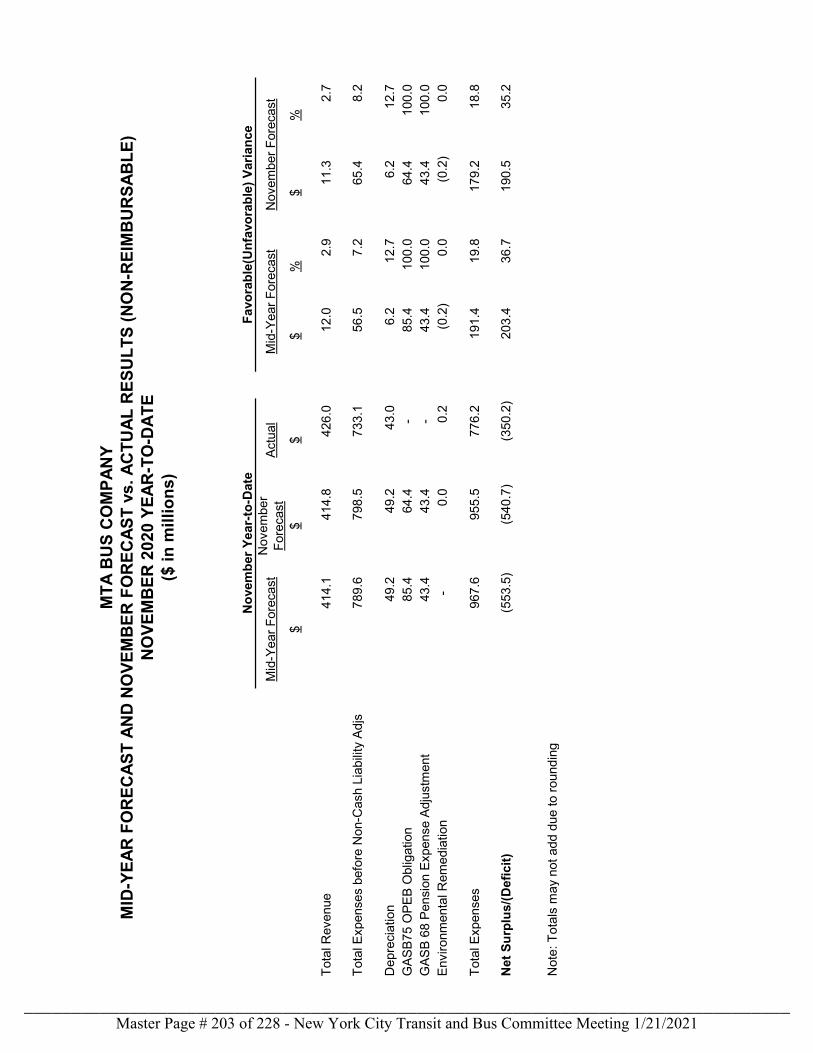
$$
$$
%$
%
Tota
l Rev
enue
414.
1
414.
8
426.
0
12
.0
2.
911
.3
2.
7
Tota
l Exp
ense
s be
fore
Non
-Cas
h Li
abilit
y Ad
js78
9.6
79
8.5
73
3.1
56.5
7.2
65.4
8.2
Dep
reci
atio
n 49
.2
49
.2
43.0
6.
2
12
.76.
2
12.7
GAS
B75
OPE
B O
blig
atio
n85
.4
64
.4
-
85.4
100.
064
.4
10
0.0
GAS
B 68
Pen
sion
Exp
ense
Adj
ustm
ent
43.4
43.4
-
43
.4
10
0.0
43.4
100.
0En
viro
nmen
tal R
emed
iatio
n-
0.
00.
2
(0
.2)
0.0
(0.2
)
0.0
Tota
l Exp
ense
s96
7.6
95
5.5
77
6.2
191.
4
19.8
179.
2
18
.8
Net
Sur
plus
/(Def
icit)
(553
.5)
(5
40.7
)
(3
50.2
)
20
3.4
36
.719
0.5
35.2
Not
e: T
otal
s m
ay n
ot a
dd d
ue to
roun
ding
Favo
rabl
e(U
nfav
orab
le) V
aria
nce
Nov
embe
r Yea
r-to
-Dat
e
Mid
-Yea
r For
ecas
tN
ovem
ber
Fore
cast
Actu
alM
id-Y
ear F
orec
ast
Nov
embe
r For
ecas
t
MTA
BU
S C
OM
PAN
YM
ID-Y
EAR
FO
REC
AST
AND
NO
VEM
BER
FO
REC
AST
vs. A
CTU
AL R
ESU
LTS
(NO
N-R
EIM
BU
RSA
BLE
)N
OVE
MB
ER 2
020
YEAR
-TO
-DAT
E($
in m
illio
ns)
Master Page # 203 of 228 - New York City Transit and Bus Committee Meeting 1/21/2021________________________________________________________________________________
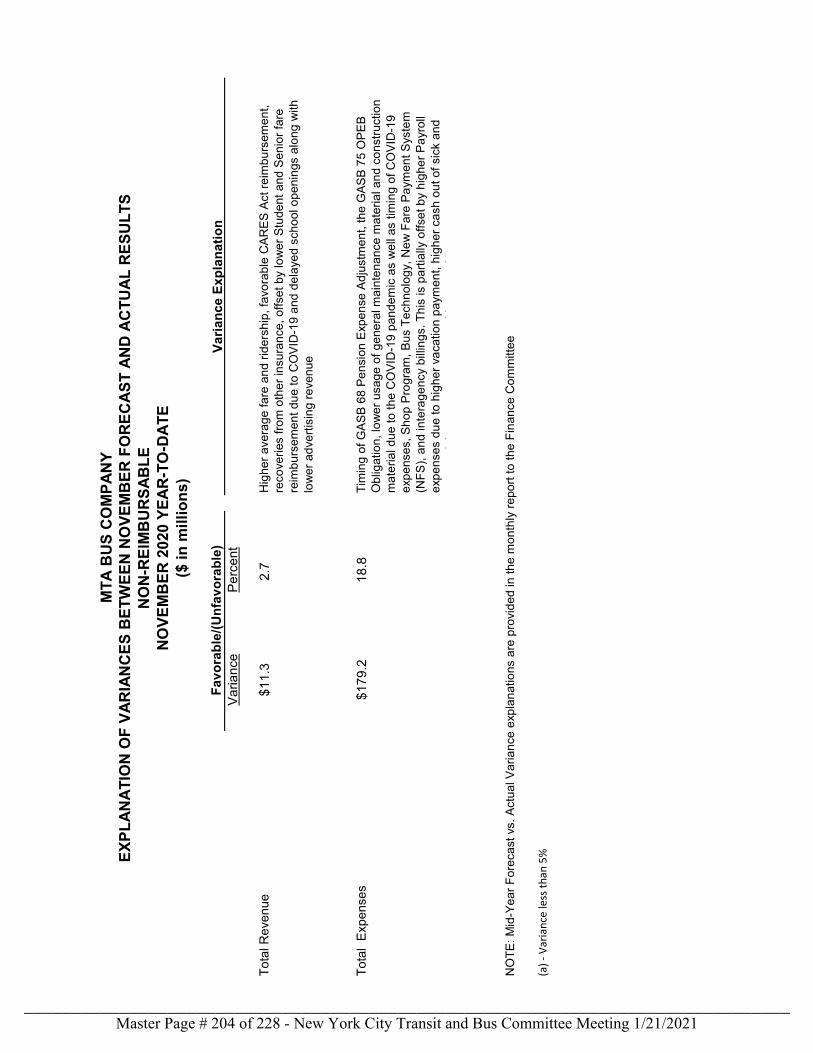
Varia
nce
Expl
anat
ion
Varia
nce
Perc
ent
Tota
l Rev
enue
$1
1.3
2.7
Hig
her a
vera
ge fa
re a
nd ri
ders
hip,
favo
rabl
e C
ARES
Act
reim
burs
emen
t, re
cove
ries
from
oth
er in
sura
nce,
offs
et b
y lo
wer
Stu
dent
and
Sen
ior f
are
reim
burs
emen
t due
to C
OVI
D-1
9 an
d de
laye
d sc
hool
ope
ning
s al
ong
with
lo
wer
adv
ertis
ing
reve
nue
Tota
l Ex
pens
es
$179
.2
18.8
NO
TE: M
id-Y
ear F
orec
ast v
s. A
ctua
l Var
ianc
e ex
plan
atio
ns a
re p
rovi
ded
in th
e m
onth
ly re
port
to th
e Fi
nanc
e C
omm
ittee
(a) -
Var
ianc
e le
ss th
an 5
%
Favo
rabl
e/(U
nfav
orab
le)
Tim
ing
of G
ASB
68 P
ensi
on E
xpen
se A
djus
tmen
t, th
e G
ASB
75 O
PEB
Obl
igat
ion,
low
er u
sage
of g
ener
al m
aint
enan
ce m
ater
ial a
nd c
onst
ruct
ion
mat
eria
l due
to th
e C
OVI
D-1
9 pa
ndem
ic a
s w
ell a
s tim
ing
of C
OVI
D-1
9 ex
pens
es, S
hop
Prog
ram
, Bus
Tec
hnol
ogy,
New
Far
e Pa
ymen
t Sys
tem
(N
FS),
and
inte
rage
ncy
billin
gs. T
his
is p
artia
lly o
ffset
by
high
er P
ayro
ll ex
pens
es d
ue to
hig
her v
acat
ion
paym
ent,
high
er c
ash
out o
f sic
k an
d l t
i
t
t d
l
ttiti
MTA
BU
S C
OM
PAN
YEX
PLAN
ATIO
N O
F VA
RIA
NC
ES B
ETW
EEN
NO
VEM
BER
FO
REC
AST
AND
AC
TUAL
RES
ULT
SN
ON
-REI
MB
UR
SAB
LEN
OVE
MB
ER 2
020
YEAR
-TO
-DAT
E($
in m
illio
ns)
Master Page # 204 of 228 - New York City Transit and Bus Committee Meeting 1/21/2021________________________________________________________________________________
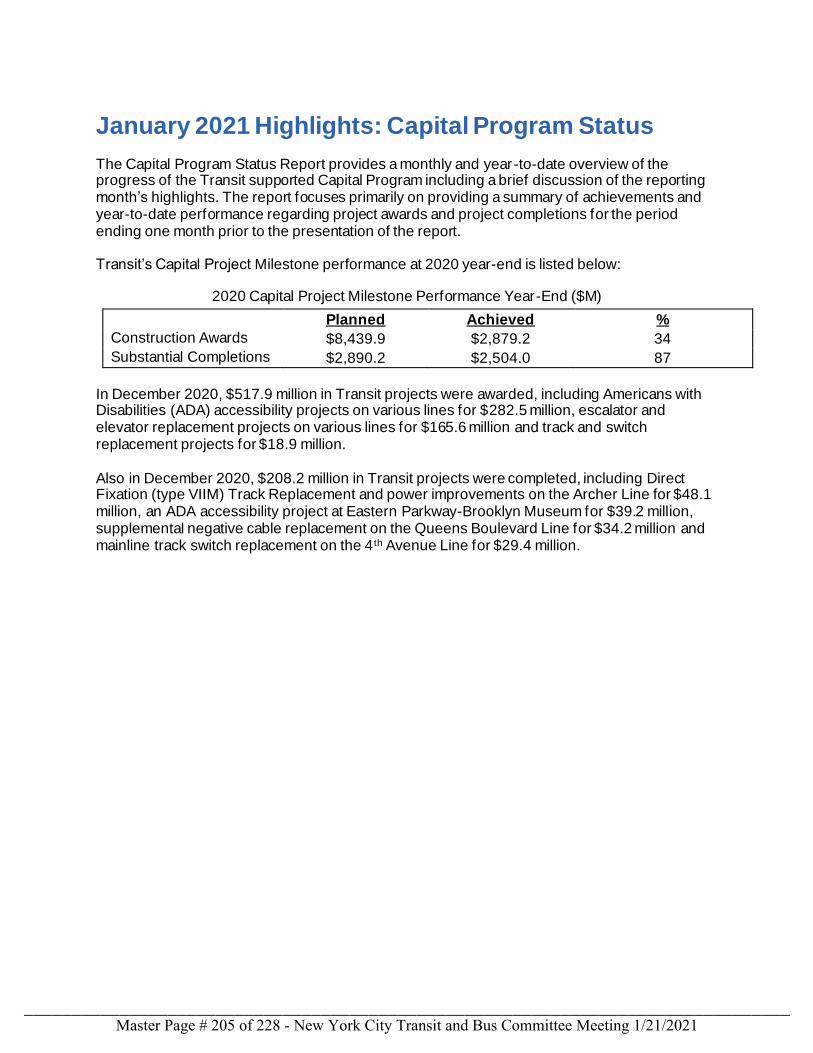
January 2021 Highlights: Capital Program Status
The Capital Program Status Report provides a monthly and year-to-date overview of the progress of the Transit supported Capital Program including a brief discussion of the reporting month’s highlights. The report focuses primarily on providing a summary of achievements and year-to-date performance regarding project awards and project completions for the period ending one month prior to the presentation of the report.
Transit’s Capital Project Milestone performance at 2020 year-end is listed below:
2020 Capital Project Milestone Performance Year-End ($M)
Planned Achieved %
Construction Awards $8,439.9 $2,879.2 34
Substantial Completions $2,890.2 $2,504.0 87
In December 2020, $517.9 million in Transit projects were awarded, including Americans with Disabilities (ADA) accessibility projects on various lines for $282.5 million, escalator and elevator replacement projects on various lines for $165.6 million and track and switch replacement projects for $18.9 million.
Also in December 2020, $208.2 million in Transit projects were completed, including Direct Fixation (type VIIM) Track Replacement and power improvements on the Archer Line for $48.1 million, an ADA accessibility project at Eastern Parkway-Brooklyn Museum for $39.2 million, supplemental negative cable replacement on the Queens Boulevard Line for $34.2 million and mainline track switch replacement on the 4 th Avenue Line for $29.4 million.
Master Page # 205 of 228 - New York City Transit and Bus Committee Meeting 1/21/2021________________________________________________________________________________
Capital Program Status
January 2021
In December 2020, $517.9 million in Transit projects were awarded, including Americans with Disabilities (ADA) accessibility projects on various lines for $282.5 million. ADA accessibility at these stations will be achieved through the installation of 17 ADA-compliant elevators, construction of elevator machine rooms, provision of accessible travel routes, modification of platforms to reduce gaps, installation of tactile warning strips, modification of gates, handrails and stairs, modification of the public address/customer information system (PA/CIS), signage and public toilets. The stations that will be made accessible are 7 th Avenue on the 6th Avenue Line in Brooklyn (F/G lines), New Dorp on the Staten Island Railroad (SIR), Beach 67th Street on the Rockaway Line in Queens (A line), Grand Street on the Canarsie Line in Brooklyn (L line), the northbound section of Dyckman Street on the 7 th Avenue-Broadway Line (southbound is already ADA accessible) in Manhattan (1 line), 149th Street on the Pelham Line in the Bronx (6 line) and the Metropolitan Avenue-Lorimer Street Complex in Brooklyn (G/L Lines) on the Crosstown and Canarsie Lines. Furthermore, select station components will be repaired or replaced at Metropolitan Avenue and New Dorp stations. Making the eight stations fully accessible to customers with disabilities highlights the Authority's ongoing commitment to system-wide accessibility.
Furthermore, escalator and elevator replacement projects were awarded on various lines for $165.6 million. Escalators were placed at the following stations: Pelham Parkway, White Plains Road Line (2 escalators), 125th Street, Broadway-7th Avenue Line (1 escalator), 181st Street, 8th Avenue Line (2 escalators), and Pelham Bay Park, Pelham Line (2 escalators). Hydraulic elevators will be replaced at the following stations: 207 Street, 8 Avenue Line (2 elevators), 34th Street, 6 Avenue Line (2 elevators), 34th Street-Penn Station, Broadway Line (6 elevators), Church Avenue, Nostrand Line (1 elevator), Flatbush Avenue, Nostrand Line (1 elevator), Jamaica Center-Parsons, Archer Line (2 elevators).
Lastly, track and switch replacement projects were awarded for $18.9 million. Mainline track and switches will be replaced throughout the Staten Island Railroad, as required and switches will be replaced on the Broadway Line. Mainline track replacement includes replacing equipment and materials such as signals, contact rails and ballast. Mainline switch replacement work includes replacement of existing turnouts, track switches, switch valves, connecting rails, contact rails, ties, ballast and signal cables.
In December 2020, $208.2 million in Transit projects were completed, including Direct Fixation (type VIIM) track replacement on the Archer Avenue Line for $48.1 million. Direct Fixation (type VIIM) track replacement included replacing components such as rubber rail seats, the epoxy-sand plinths that hold the rubber rail seats, lag bolts and remediating water conditions that corrode the base of the rail. The Direct Fixation track replacement was also coordinated with 84C contact rail and negative side feeder replacement for improved power on the line. The track and power replacement work ran from Sutphin to Parsons and Jamaica Van Wyck station.
Additionally, an ADA accessibility project at Eastern Parkway-Brooklyn Museum for $39.2 million. ADA accessibility was achieved through the installation of three ADA-compliant elevators-one from the street to the mezzanine and two from the mezzanine to the side platforms, construction of elevator machine rooms, provision of accessible travel routes, mezzanine expansion, modification of platforms to reduce gaps, installation of tactile warning
Master Page # 206 of 228 - New York City Transit and Bus Committee Meeting 1/21/2021________________________________________________________________________________
strips, modification of gates, handrails and stairs, modification of the public address/customer information system (PA/CIS), signage and public toilets.
Furthermore, supplemental negative cable replacement was completed on the Queens Boulevard Line for $34.2 million. The cables were installed at the following segments: Jamaica Center Station to the 45th Street Substation, Kew Gardens-Union Turnpike station to Hulst Street Substation, Roosevelt Island Substation to 50 th St-8th Avenue station and from 41st Avenue-24th Street Substation to the 63rd Street-2nd Avenue Substation. The cables will allow the traction power system to support additional train service from the Communications Based Train Control (CBTC) technology that is currently being implemented on the line.
Lastly, mainline track switch replacement was completed on the 4th Avenue Line for $29.4 million. Mainline switch replacement work includes replacement of existing turnouts, track switches, switch valves, connecting rails, contact rails, ties, ballast and signal cables.
Master Page # 207 of 228 - New York City Transit and Bus Committee Meeting 1/21/2021________________________________________________________________________________
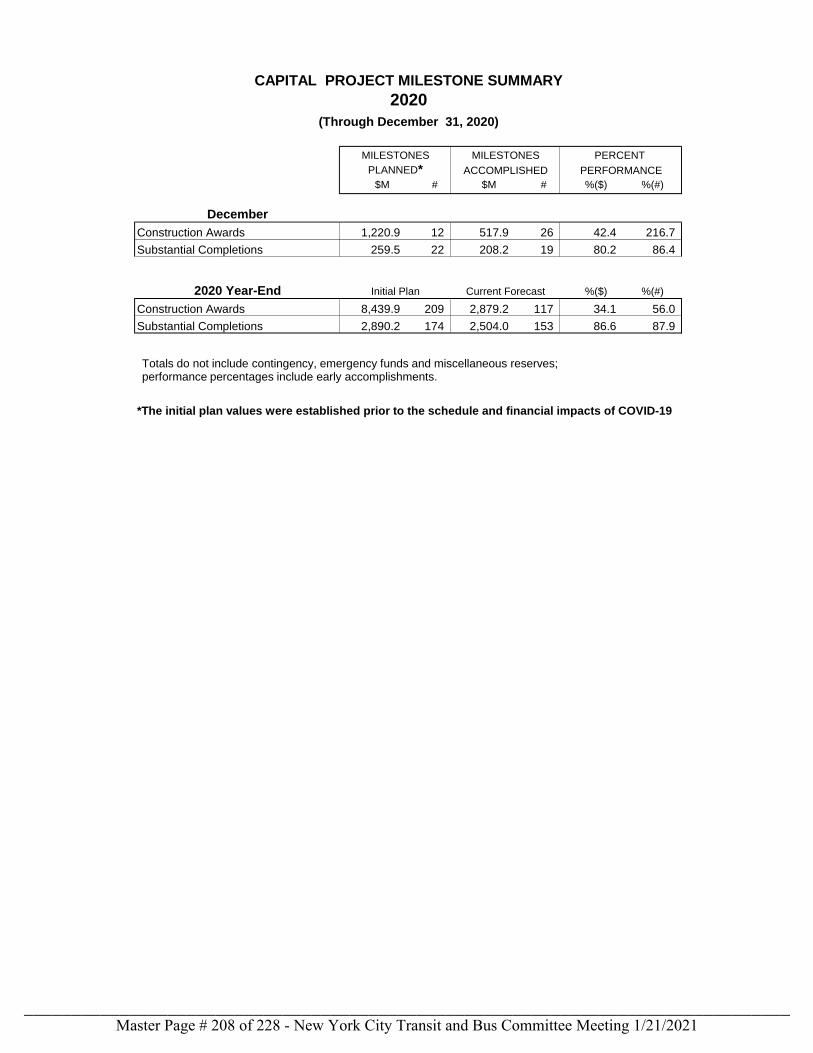
CAPITAL PROJECT MILESTONE SUMMARY
2020
(Through December 31, 2020)
MILESTONES MILESTONES PERCENT
PLANNED* ACCOMPLISHED PERFORMANCE
$M # $M # %($) %(#)
December
Construction Awards 1,220.9 12 517.9 26 42.4 216.7
Substantial Completions 259.5 22 208.2 19 80.2 86.4
2020 Year-End Initial Plan Current Forecast %($) %(#)
Construction Awards 8,439.9 209 2,879.2 117 34.1 56.0
Substantial Completions 2,890.2 174 2,504.0 153 86.6 87.9
*The initial plan values were established prior to the schedule and financial impacts of COVID-19
Totals do not include contingency, emergency funds and miscellaneous reserves;performance percentages include early accomplishments.
Master Page # 208 of 228 - New York City Transit and Bus Committee Meeting 1/21/2021________________________________________________________________________________
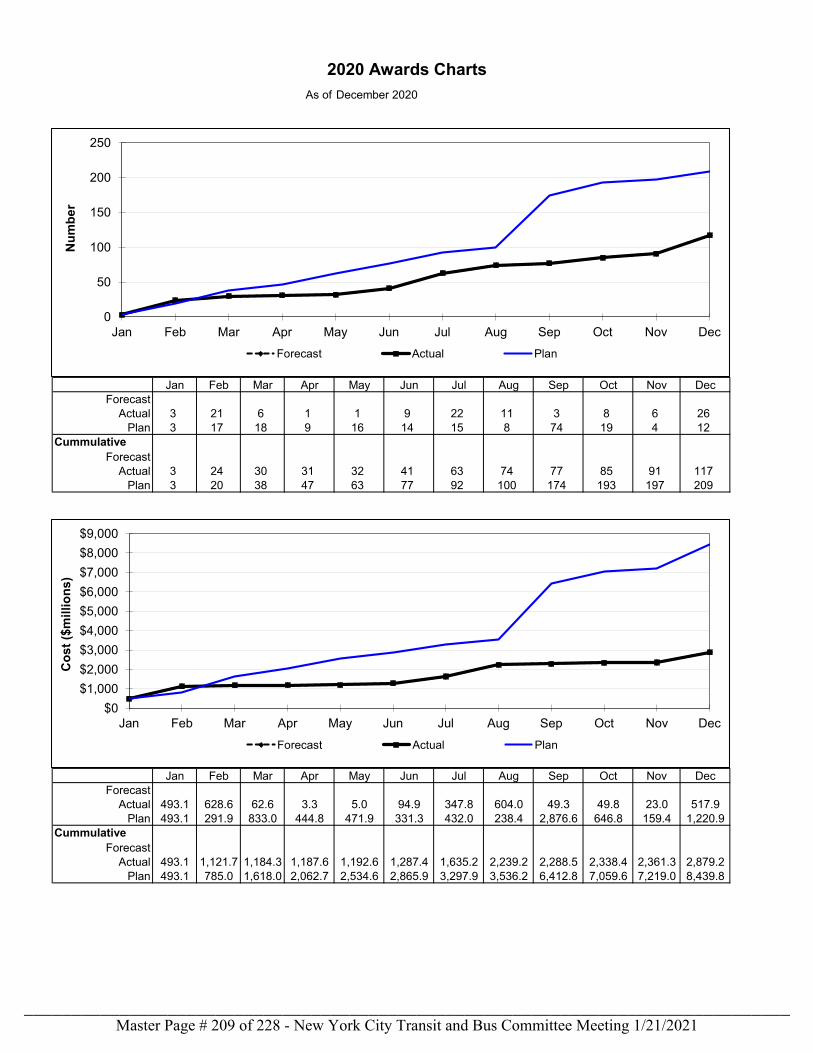
2020 Awards Charts
As of
Jan Feb Mar Apr May Jun Jul Aug Sep Oct Nov DecForecast 0 0 0 0 0 0 0 0 0 0 0 0
Actual 3 21 6 1 1 9 22 11 3 8 6 26Plan 3 17 18 9 16 14 15 8 74 19 4 12
CummulativeForecast 3 24 30 31 32 41 63 74 77 85 91 117
Actual 3 24 30 31 32 41 63 74 77 85 91 117Plan 3 20 38 47 63 77 92 100 174 193 197 209
Jan Feb Mar Apr May Jun Jul Aug Sep Oct Nov DecForecast 0.0 0.0 0.0 0.0 0.0 0.0 0.0 0.0 0.0 0.0 0.0 0.0
Actual 493.1 628.6 62.6 3.3 5.0 94.9 347.8 604.0 49.3 49.8 23.0 517.9Plan 493.1 291.9 833.0 444.8 471.9 331.3 432.0 238.4 2,876.6 646.8 159.4 1,220.9
CummulativeForecast 493.1 1,121.7 1,184.3 1,187.6 1,192.6 1,287.4 1,635.2 2,239.2 2,288.5 2,338.4 2,361.3 2,879.2
Actual 493.1 1,121.7 1,184.3 1,187.6 1,192.6 1,287.4 1,635.2 2,239.2 2,288.5 2,338.4 2,361.3 2,879.2Plan 493.1 785.0 1,618.0 2,062.7 2,534.6 2,865.9 3,297.9 3,536.2 6,412.8 7,059.6 7,219.0 8,439.8
December 2020
$0
$1,000
$2,000
$3,000
$4,000
$5,000
$6,000
$7,000
$8,000
$9,000
Jan Feb Mar Apr May Jun Jul Aug Sep Oct Nov Dec
Co
st (
$mill
ion
s)
Forecast Actual Plan
0
50
100
150
200
250
Jan Feb Mar Apr May Jun Jul Aug Sep Oct Nov Dec
Nu
mb
er
Forecast Actual Plan
Master Page # 209 of 228 - New York City Transit and Bus Committee Meeting 1/21/2021________________________________________________________________________________
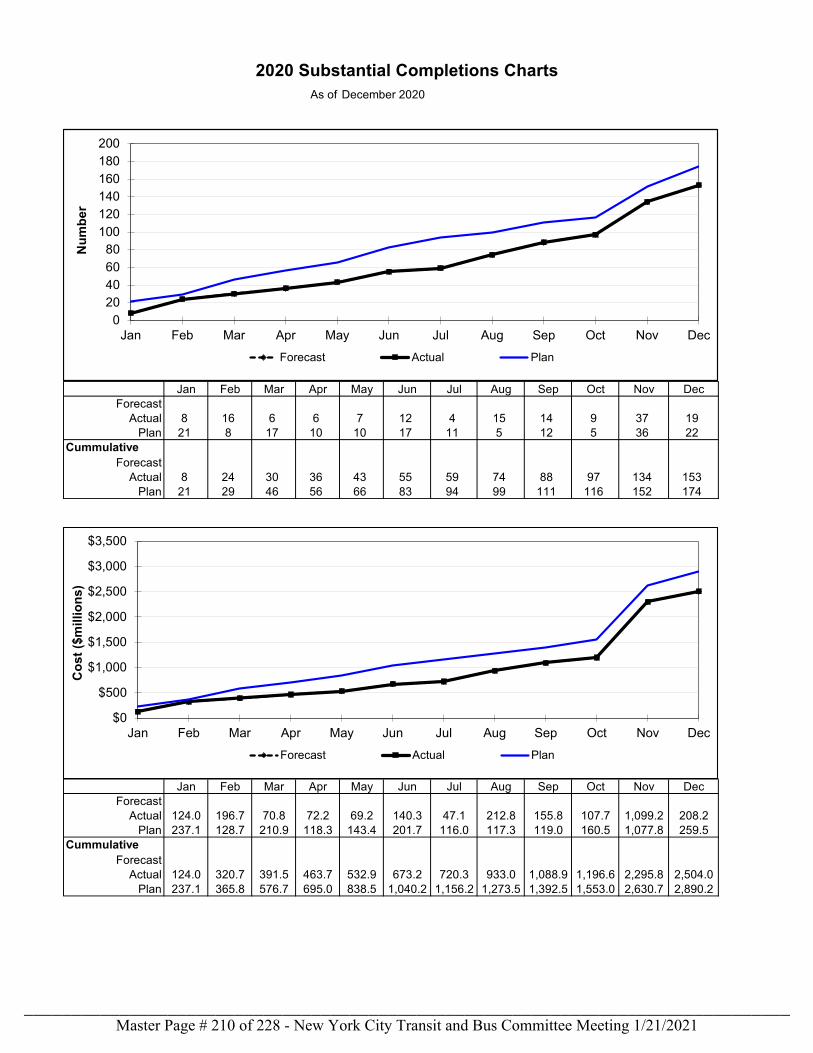
2020 Substantial Completions ChartsAs of
Jan Feb Mar Apr May Jun Jul Aug Sep Oct Nov DecForecast 0 0 0 0 0 0 0 0 0 0 0 0
Actual 8 16 6 6 7 12 4 15 14 9 37 19Plan 21 8 17 10 10 17 11 5 12 5 36 22
CummulativeForecast 8 24 30 36 43 55 59 74 88 97 134 153
Actual 8 24 30 36 43 55 59 74 88 97 134 153Plan 21 29 46 56 66 83 94 99 111 116 152 174
Jan Feb Mar Apr May Jun Jul Aug Sep Oct Nov DecForecast 0.0 0.0 0.0 0.0 0.0 0.0 0.0 0.0 0.0 0.0 0.0 0.0
Actual 124.0 196.7 70.8 72.2 69.2 140.3 47.1 212.8 155.8 107.7 1,099.2 208.2Plan 237.1 128.7 210.9 118.3 143.4 201.7 116.0 117.3 119.0 160.5 1,077.8 259.5
CummulativeForecast 124.0 320.7 391.5 463.7 532.9 673.2 720.3 933.0 1,088.9 1,196.6 2,295.8 2,504.0
Actual 124.0 320.7 391.5 463.7 532.9 673.2 720.3 933.0 1,088.9 1,196.6 2,295.8 2,504.0Plan 237.1 365.8 576.7 695.0 838.5 1,040.2 1,156.2 1,273.5 1,392.5 1,553.0 2,630.7 2,890.2
December 2020
$0
$500
$1,000
$1,500
$2,000
$2,500
$3,000
$3,500
Jan Feb Mar Apr May Jun Jul Aug Sep Oct Nov Dec
Co
st (
$mill
ion
s)
Forecast Actual Plan
020406080
100120140160180200
Jan Feb Mar Apr May Jun Jul Aug Sep Oct Nov Dec
Nu
mb
er
Forecast Actual Plan
Master Page # 210 of 228 - New York City Transit and Bus Committee Meeting 1/21/2021________________________________________________________________________________
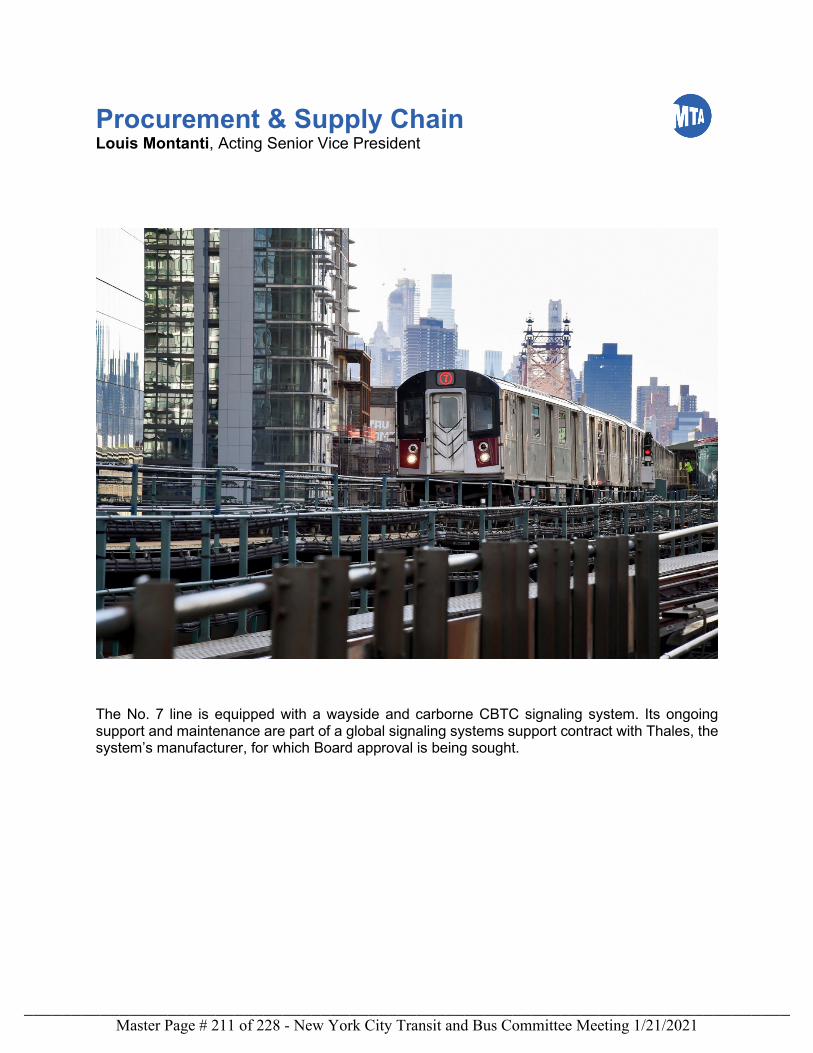
Procurement & Supply Chain Louis Montanti, Acting Senior Vice President
The No. 7 line is equipped with a wayside and carborne CBTC signaling system. Its ongoing support and maintenance are part of a global signaling systems support contract with Thales, the system’s manufacturer, for which Board approval is being sought.
Master Page # 211 of 228 - New York City Transit and Bus Committee Meeting 1/21/2021________________________________________________________________________________
PROCUREMENTS
The Procurement Agenda this month includes 2 actions for a proposed expenditure of $59.2M.
Master Page # 212 of 228 - New York City Transit and Bus Committee Meeting 1/21/2021________________________________________________________________________________
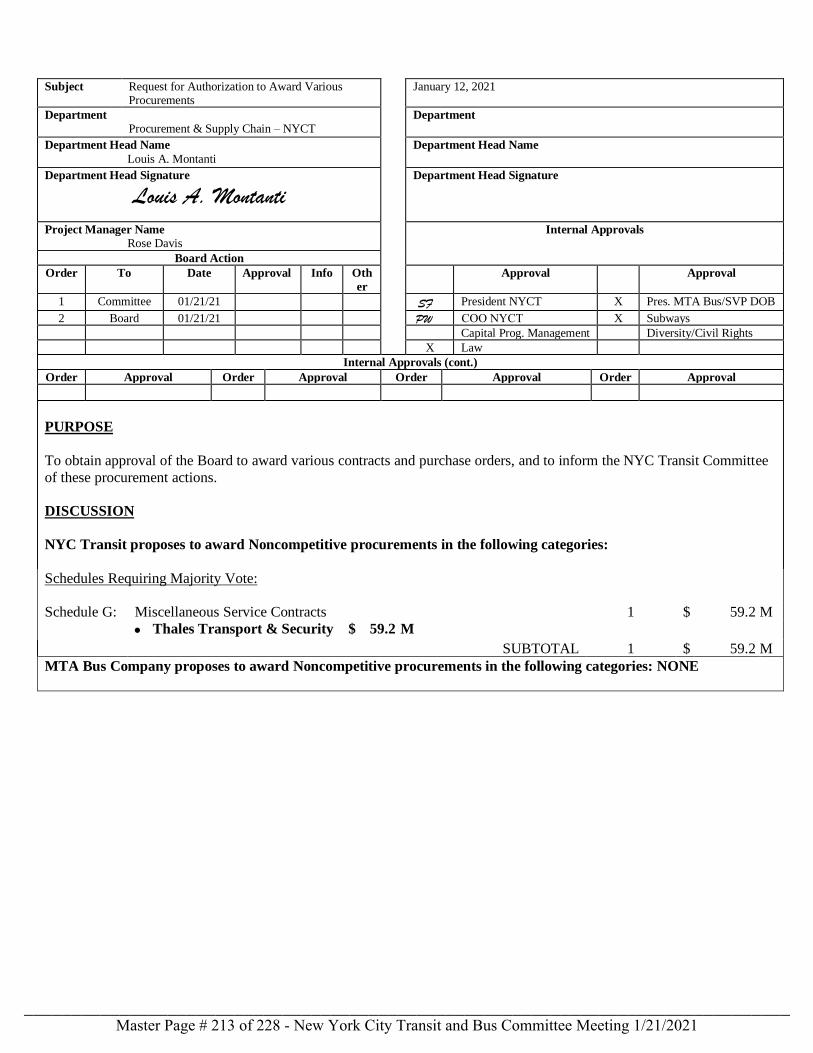
Subject Request for Authorization to Award Various Procurements
January 12, 2021
Department
Procurement & Supply Chain – NYCT Department
Department Head Name
Louis A. Montanti
Department Head Name
Department Head Signature
Louis A. Montanti Department Head Signature
Project Manager Name
Rose Davis Internal Approvals
Board Action
Order To Date Approval Info Oth
er
Approval Approval
1 Committee 01/21/21 President NYCT X Pres. MTA Bus/SVP DOB
2 Board 01/21/21 COO NYCT X Subways
Capital Prog. Management Diversity/Civil Rights
X Law
Internal Approvals (cont.)
Order Approval Order Approval Order Approval Order Approval
PURPOSE
To obtain approval of the Board to award various contracts and purchase orders, and to inform the NYC Transit Committee
of these procurement actions.
DISCUSSION
NYC Transit proposes to award Noncompetitive procurements in the following categories:
Schedules Requiring Majority Vote:
Schedule G: Miscellaneous Service Contracts 1 $ 59.2 M
• Thales Transport & Security $ 59.2 M
SUBTOTAL 1 $ 59.2 M
MTA Bus Company proposes to award Noncompetitive procurements in the following categories: NONE
SFPW
Master Page # 213 of 228 - New York City Transit and Bus Committee Meeting 1/21/2021________________________________________________________________________________
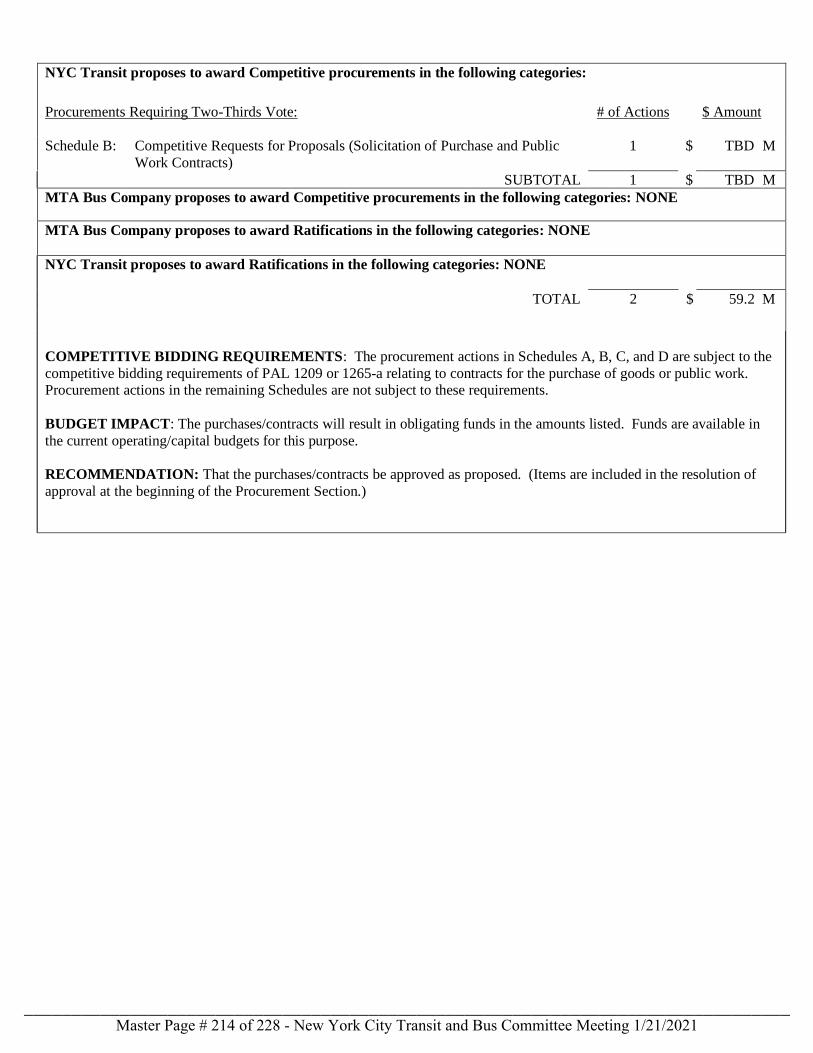
NYC Transit proposes to award Competitive procurements in the following categories:
Procurements Requiring Two-Thirds Vote: # of Actions $ Amount
Schedule B: Competitive Requests for Proposals (Solicitation of Purchase and Public
Work Contracts)
1 $ TBD M
SUBTOTAL 1 $ TBD M
MTA Bus Company proposes to award Competitive procurements in the following categories: NONE
MTA Bus Company proposes to award Ratifications in the following categories: NONE
NYC Transit proposes to award Ratifications in the following categories: NONE
TOTAL 2 $ 59.2 M
COMPETITIVE BIDDING REQUIREMENTS: The procurement actions in Schedules A, B, C, and D are subject to the
competitive bidding requirements of PAL 1209 or 1265-a relating to contracts for the purchase of goods or public work. Procurement actions in the remaining Schedules are not subject to these requirements.
BUDGET IMPACT: The purchases/contracts will result in obligating funds in the amounts listed. Funds are available in
the current operating/capital budgets for this purpose.
RECOMMENDATION: That the purchases/contracts be approved as proposed. (Items are included in the resolution of
approval at the beginning of the Procurement Section.)
Master Page # 214 of 228 - New York City Transit and Bus Committee Meeting 1/21/2021________________________________________________________________________________
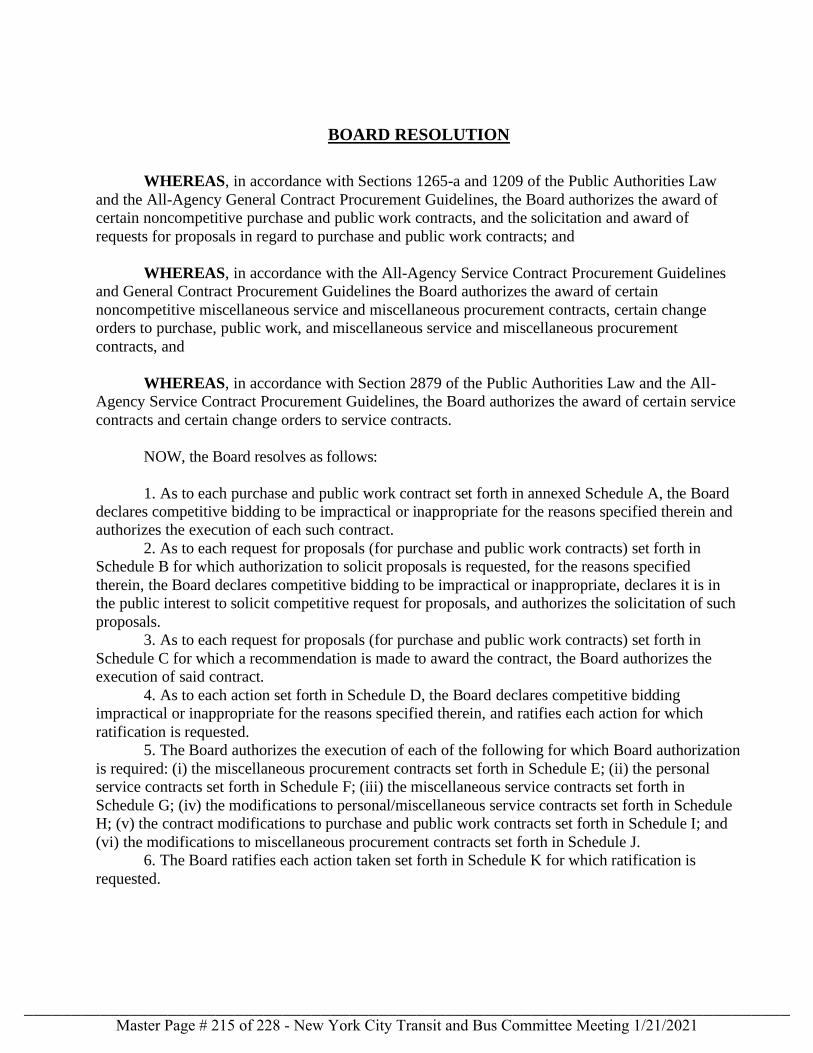
BOARD RESOLUTION
WHEREAS, in accordance with Sections 1265-a and 1209 of the Public Authorities Law
and the All-Agency General Contract Procurement Guidelines, the Board authorizes the award of
certain noncompetitive purchase and public work contracts, and the solicitation and award of
requests for proposals in regard to purchase and public work contracts; and
WHEREAS, in accordance with the All-Agency Service Contract Procurement Guidelines
and General Contract Procurement Guidelines the Board authorizes the award of certain
noncompetitive miscellaneous service and miscellaneous procurement contracts, certain change
orders to purchase, public work, and miscellaneous service and miscellaneous procurement
contracts, and
WHEREAS, in accordance with Section 2879 of the Public Authorities Law and the All-
Agency Service Contract Procurement Guidelines, the Board authorizes the award of certain service
contracts and certain change orders to service contracts.
NOW, the Board resolves as follows:
1. As to each purchase and public work contract set forth in annexed Schedule A, the Board
declares competitive bidding to be impractical or inappropriate for the reasons specified therein and
authorizes the execution of each such contract.
2. As to each request for proposals (for purchase and public work contracts) set forth in
Schedule B for which authorization to solicit proposals is requested, for the reasons specified
therein, the Board declares competitive bidding to be impractical or inappropriate, declares it is in
the public interest to solicit competitive request for proposals, and authorizes the solicitation of such
proposals.
3. As to each request for proposals (for purchase and public work contracts) set forth in
Schedule C for which a recommendation is made to award the contract, the Board authorizes the
execution of said contract.
4. As to each action set forth in Schedule D, the Board declares competitive bidding
impractical or inappropriate for the reasons specified therein, and ratifies each action for which
ratification is requested.
5. The Board authorizes the execution of each of the following for which Board authorization
is required: (i) the miscellaneous procurement contracts set forth in Schedule E; (ii) the personal
service contracts set forth in Schedule F; (iii) the miscellaneous service contracts set forth in
Schedule G; (iv) the modifications to personal/miscellaneous service contracts set forth in Schedule
H; (v) the contract modifications to purchase and public work contracts set forth in Schedule I; and
(vi) the modifications to miscellaneous procurement contracts set forth in Schedule J.
6. The Board ratifies each action taken set forth in Schedule K for which ratification is
requested.
Master Page # 215 of 228 - New York City Transit and Bus Committee Meeting 1/21/2021________________________________________________________________________________
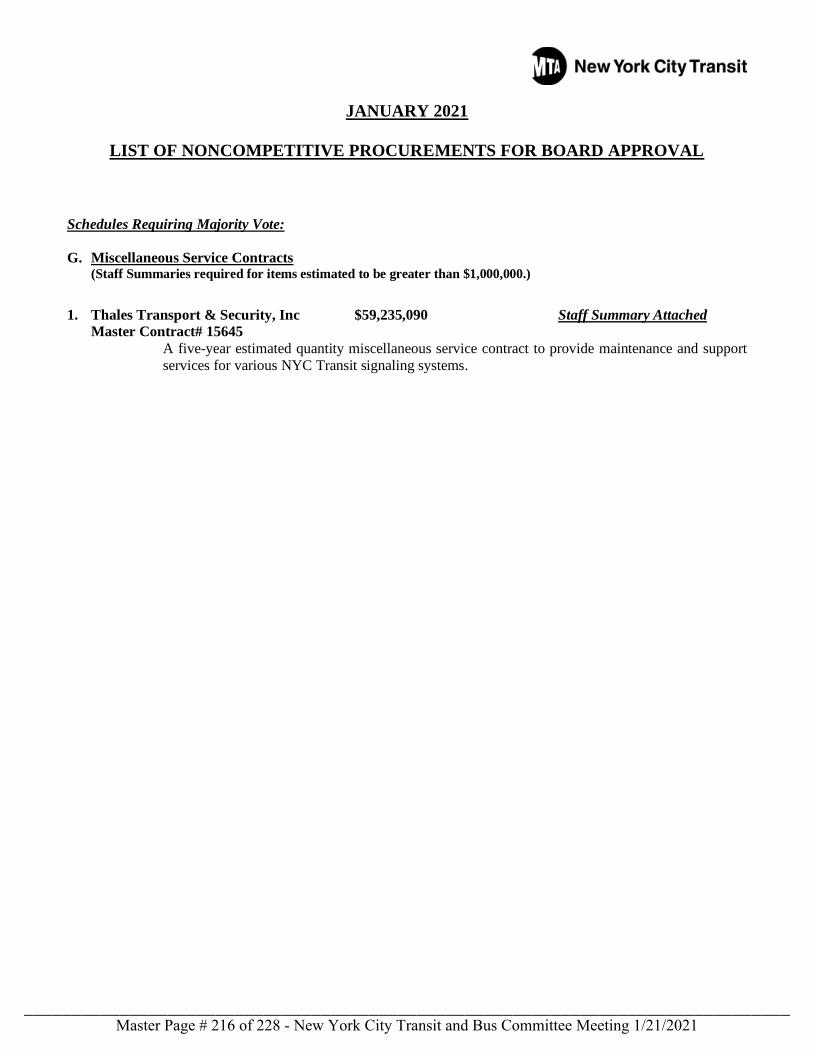
JANUARY 2021
LIST OF NONCOMPETITIVE PROCUREMENTS FOR BOARD APPROVAL
Schedules Requiring Majority Vote:
G. Miscellaneous Service Contracts (Staff Summaries required for items estimated to be greater than $1,000,000.)
1. Thales Transport & Security, Inc $59,235,090 Staff Summary Attached
Master Contract# 15645
A five-year estimated quantity miscellaneous service contract to provide maintenance and support
services for various NYC Transit signaling systems.
Master Page # 216 of 228 - New York City Transit and Bus Committee Meeting 1/21/2021________________________________________________________________________________
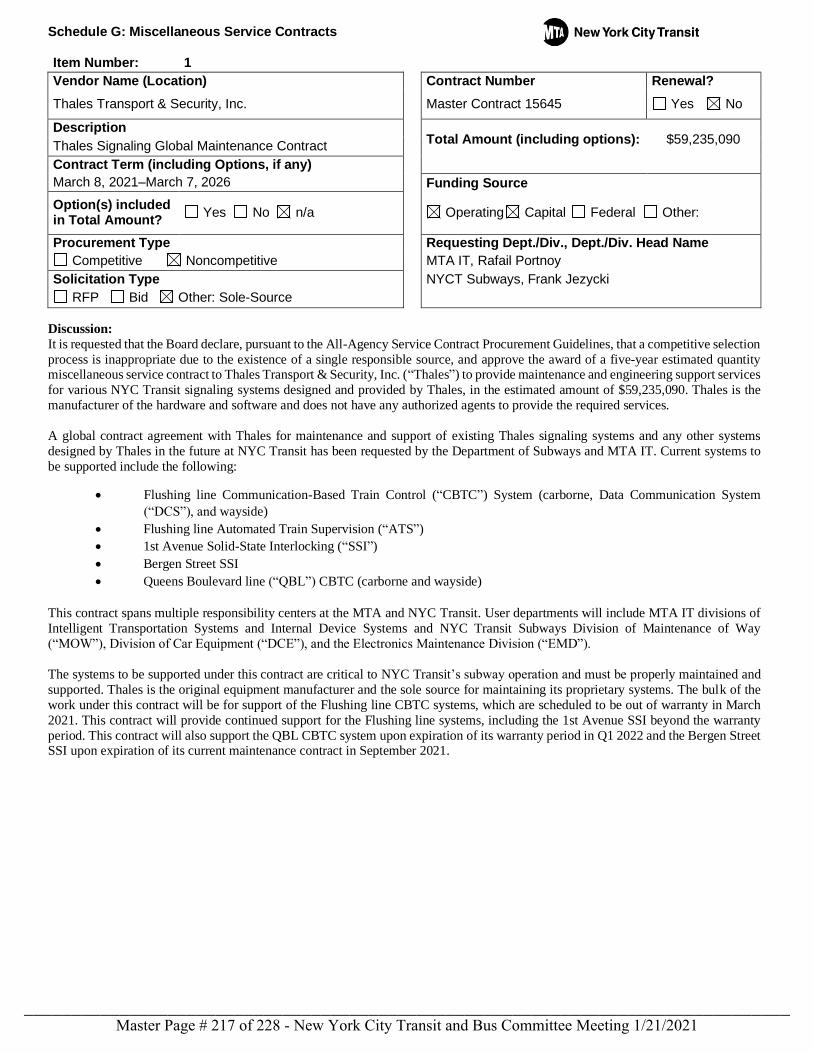
Schedule G: Miscellaneous Service Contracts
Item Number: 1
Vendor Name (Location) Contract Number Renewal?
Thales Transport & Security, Inc. Master Contract 15645 Yes No
Description Total Amount (including options):
$59,235,090
Thales Signaling Global Maintenance Contract
Contract Term (including Options, if any)
March 8, 2021–March 7, 2026 Funding Source
Option(s) included in Total Amount?
Yes No n/a Operating Capital Federal Other:
Procurement Type Requesting Dept./Div., Dept./Div. Head Name
Competitive Noncompetitive MTA IT, Rafail Portnoy
Solicitation Type NYCT Subways, Frank Jezycki
RFP Bid Other: Sole-Source
Discussion:
It is requested that the Board declare, pursuant to the All-Agency Service Contract Procurement Guidelines, that a competitive selection
process is inappropriate due to the existence of a single responsible source, and approve the award of a five-year estimated quantity miscellaneous service contract to Thales Transport & Security, Inc. (“Thales”) to provide maintenance and engineering support services
for various NYC Transit signaling systems designed and provided by Thales, in the estimated amount of $59,235,090. Thales is the
manufacturer of the hardware and software and does not have any authorized agents to provide the required services.
A global contract agreement with Thales for maintenance and support of existing Thales signaling systems and any other systems
designed by Thales in the future at NYC Transit has been requested by the Department of Subways and MTA IT. Current systems to
be supported include the following:
• Flushing line Communication-Based Train Control (“CBTC”) System (carborne, Data Communication System
(“DCS”), and wayside)
• Flushing line Automated Train Supervision (“ATS”)
• 1st Avenue Solid-State Interlocking (“SSI”)
• Bergen Street SSI
• Queens Boulevard line (“QBL”) CBTC (carborne and wayside)
This contract spans multiple responsibility centers at the MTA and NYC Transit. User departments will include MTA IT divisions of
Intelligent Transportation Systems and Internal Device Systems and NYC Transit Subways Division of Maintenance of Way
(“MOW”), Division of Car Equipment (“DCE”), and the Electronics Maintenance Division (“EMD”).
The systems to be supported under this contract are critical to NYC Transit’s subway operation and must be properly maintained and
supported. Thales is the original equipment manufacturer and the sole source for maintaining its proprietary systems. The bulk of the
work under this contract will be for support of the Flushing line CBTC systems, which are scheduled to be out of warranty in March
2021. This contract will provide continued support for the Flushing line systems, including the 1st Avenue SSI beyond the warranty
period. This contract will also support the QBL CBTC system upon expiration of its warranty period in Q1 2022 and the Bergen Street SSI upon expiration of its current maintenance contract in September 2021.
Master Page # 217 of 228 - New York City Transit and Bus Committee Meeting 1/21/2021________________________________________________________________________________
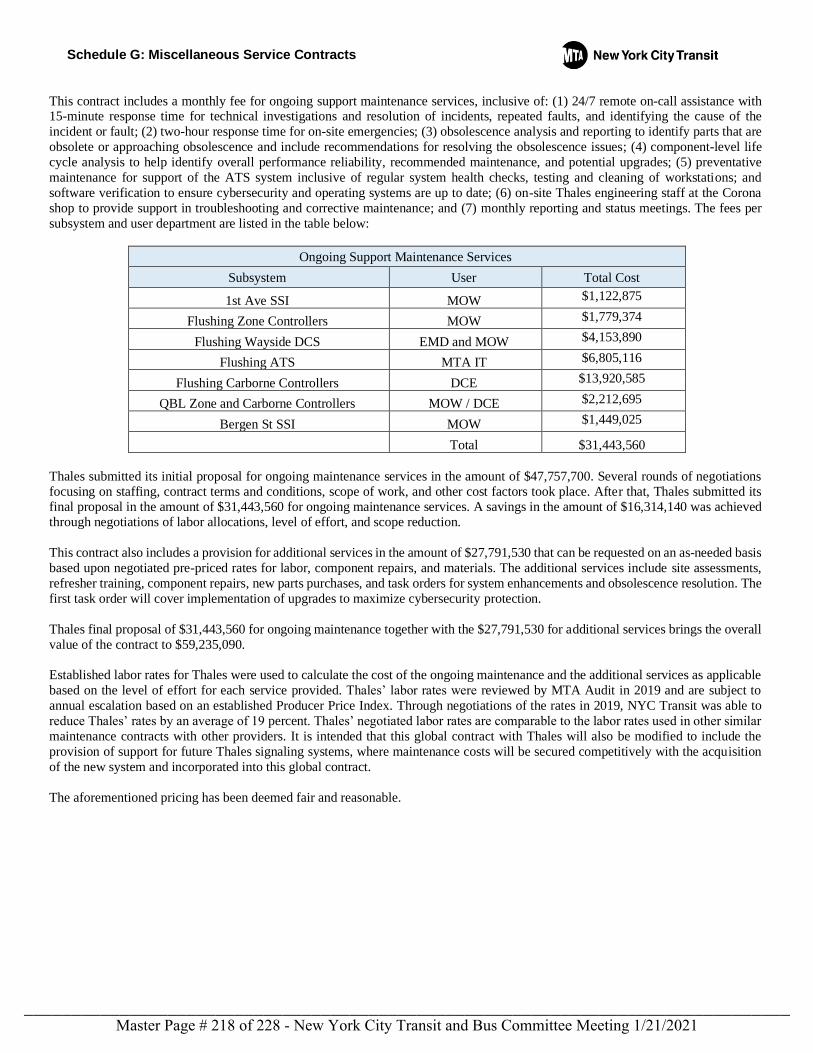
Schedule G: Miscellaneous Service Contracts
This contract includes a monthly fee for ongoing support maintenance services, inclusive of: (1) 24/7 remote on-call assistance with 15-minute response time for technical investigations and resolution of incidents, repeated faults, and identifying the cause of the
incident or fault; (2) two-hour response time for on-site emergencies; (3) obsolescence analysis and reporting to identify parts that are
obsolete or approaching obsolescence and include recommendations for resolving the obsolescence issues; (4) component-level life
cycle analysis to help identify overall performance reliability, recommended maintenance, and potential upgrades; (5) preventative
maintenance for support of the ATS system inclusive of regular system health checks, testing and cleaning of workstations; and
software verification to ensure cybersecurity and operating systems are up to date; (6) on-site Thales engineering staff at the Corona
shop to provide support in troubleshooting and corrective maintenance; and (7) monthly reporting and status meetings. The fees per
subsystem and user department are listed in the table below:
Ongoing Support Maintenance Services
Subsystem User Total Cost
1st Ave SSI MOW $1,122,875
Flushing Zone Controllers MOW $1,779,374
Flushing Wayside DCS EMD and MOW $4,153,890
Flushing ATS MTA IT $6,805,116
Flushing Carborne Controllers DCE $13,920,585
QBL Zone and Carborne Controllers MOW / DCE $2,212,695
Bergen St SSI MOW $1,449,025
Total $31,443,560
Thales submitted its initial proposal for ongoing maintenance services in the amount of $47,757,700. Several rounds of negotiations focusing on staffing, contract terms and conditions, scope of work, and other cost factors took place. After that, Thales submitted its final proposal in the amount of $31,443,560 for ongoing maintenance services. A savings in the amount of $16,314,140 was achieved through negotiations of labor allocations, level of effort, and scope reduction.
This contract also includes a provision for additional services in the amount of $27,791,530 that can be requested on an as-needed basis
based upon negotiated pre-priced rates for labor, component repairs, and materials. The additional services include site assessments,
refresher training, component repairs, new parts purchases, and task orders for system enhancements and obsolescence resolution. The
first task order will cover implementation of upgrades to maximize cybersecurity protection.
Thales final proposal of $31,443,560 for ongoing maintenance together with the $27,791,530 for additional services brings the overall
value of the contract to $59,235,090.
Established labor rates for Thales were used to calculate the cost of the ongoing maintenance and the additional services as applicable
based on the level of effort for each service provided. Thales’ labor rates were reviewed by MTA Audit in 2019 and are subject to
annual escalation based on an established Producer Price Index. Through negotiations of the rates in 2019, NYC Transit was able to
reduce Thales’ rates by an average of 19 percent. Thales’ negotiated labor rates are comparable to the labor rates used in other similar
maintenance contracts with other providers. It is intended that this global contract with Thales will also be modified to include the
provision of support for future Thales signaling systems, where maintenance costs will be secured competitively with the acquisition
of the new system and incorporated into this global contract.
The aforementioned pricing has been deemed fair and reasonable.
Master Page # 218 of 228 - New York City Transit and Bus Committee Meeting 1/21/2021________________________________________________________________________________
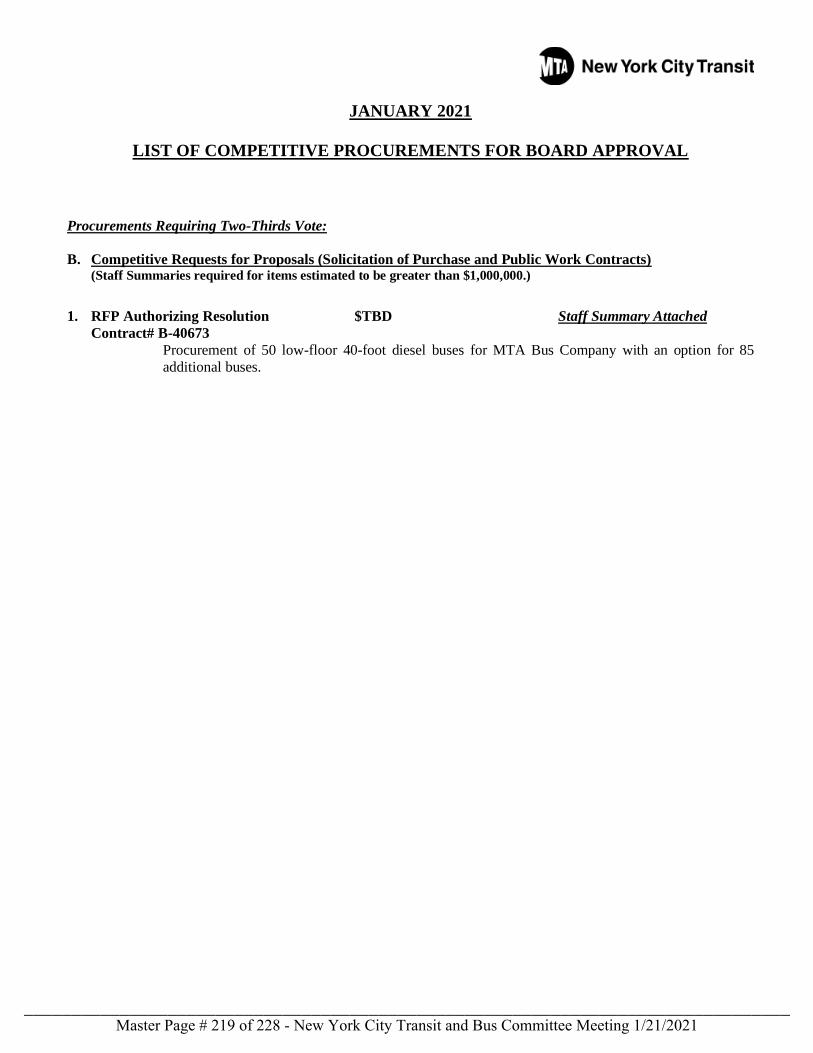
JANUARY 2021
LIST OF COMPETITIVE PROCUREMENTS FOR BOARD APPROVAL
Procurements Requiring Two-Thirds Vote:
B. Competitive Requests for Proposals (Solicitation of Purchase and Public Work Contracts) (Staff Summaries required for items estimated to be greater than $1,000,000.)
1. RFP Authorizing Resolution $TBD Staff Summary Attached
Contract# B-40673
Procurement of 50 low-floor 40-foot diesel buses for MTA Bus Company with an option for 85
additional buses.
Master Page # 219 of 228 - New York City Transit and Bus Committee Meeting 1/21/2021________________________________________________________________________________
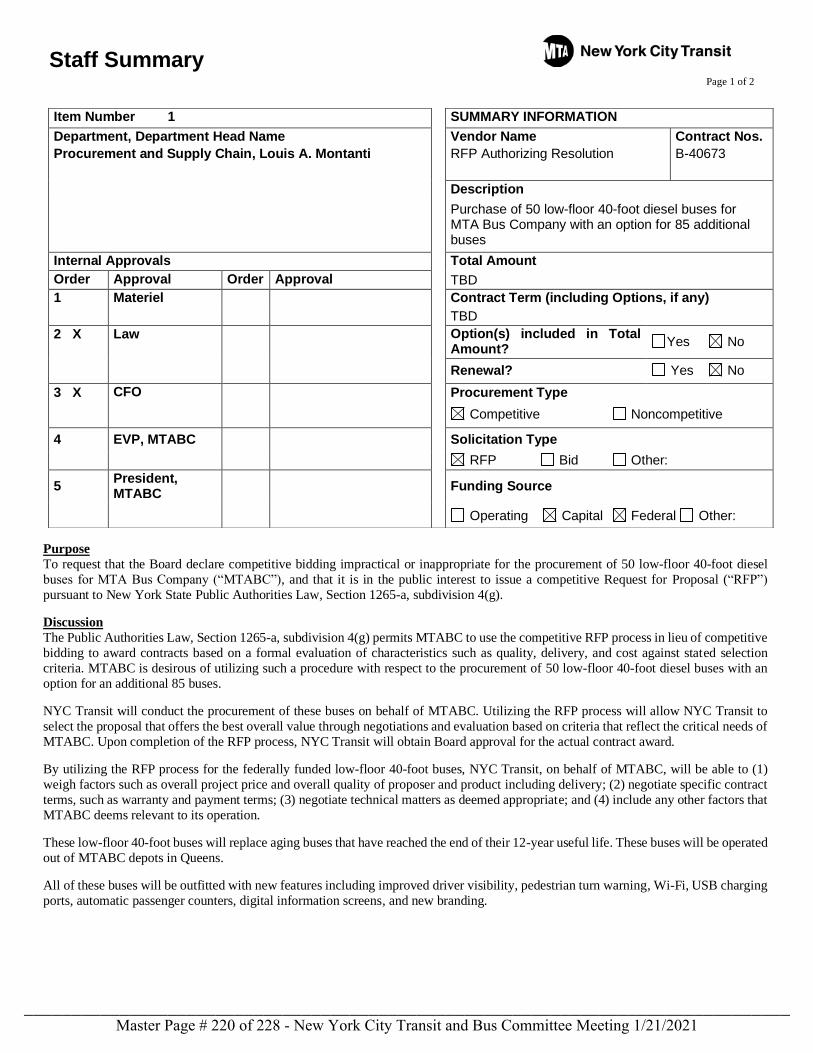
Staff Summary
Page 1 of 2
Purpose
To request that the Board declare competitive bidding impractical or inappropriate for the procurement of 50 low-floor 40-foot diesel
buses for MTA Bus Company (“MTABC”), and that it is in the public interest to issue a competitive Request for Proposal (“RFP”)
pursuant to New York State Public Authorities Law, Section 1265-a, subdivision 4(g).
Discussion
The Public Authorities Law, Section 1265-a, subdivision 4(g) permits MTABC to use the competitive RFP process in lieu of competitive
bidding to award contracts based on a formal evaluation of characteristics such as quality, delivery, and cost against stated selection
criteria. MTABC is desirous of utilizing such a procedure with respect to the procurement of 50 low-floor 40-foot diesel buses with an
option for an additional 85 buses.
NYC Transit will conduct the procurement of these buses on behalf of MTABC. Utilizing the RFP process will allow NYC Transit to
select the proposal that offers the best overall value through negotiations and evaluation based on criteria that reflect the critical needs of
MTABC. Upon completion of the RFP process, NYC Transit will obtain Board approval for the actual contract award.
By utilizing the RFP process for the federally funded low-floor 40-foot buses, NYC Transit, on behalf of MTABC, will be able to (1)
weigh factors such as overall project price and overall quality of proposer and product including delivery; (2) negotiate specific contract
terms, such as warranty and payment terms; (3) negotiate technical matters as deemed appropriate; and (4) include any other factors that
MTABC deems relevant to its operation.
These low-floor 40-foot buses will replace aging buses that have reached the end of their 12-year useful life. These buses will be operated
out of MTABC depots in Queens.
All of these buses will be outfitted with new features including improved driver visibility, pedestrian turn warning, Wi-Fi, USB charging
ports, automatic passenger counters, digital information screens, and new branding.
Item Number 1 SUMMARY INFORMATION
Department, Department Head Name
Procurement and Supply Chain, Louis A. Montanti
Vendor Name
RFP Authorizing Resolution
Contract Nos.
B-40673
Description
Purchase of 50 low-floor 40-foot diesel buses for MTA Bus Company with an option for 85 additional buses
Internal Approvals Total Amount
Order Approval Order Approval TBD
1 Materiel Contract Term (including Options, if any)
TBD
2 X Law Option(s) included in Total Amount?
Yes No
Renewal? Yes No
3 X CFO Procurement Type
Competitive Noncompetitive
4 EVP, MTABC Solicitation Type
RFP Bid Other:
5 President, MTABC
Funding Source
Operating Capital Federal Other:
Master Page # 220 of 228 - New York City Transit and Bus Committee Meeting 1/21/2021________________________________________________________________________________
Staff Summary
Page 2 of 2
Alternative
Issue a competitive Invitation for Bid. Not recommended given the complexity of this procurement and the advantages offered by the
RFP process.
Impact on Funding
The procurement of 25 low-floor 40-foot diesel buses are funded under U7030219/SF02-7927 as part of the approved 2015–2019 Capital
Program, and 25 low floor 40-foot diesel buses are funded under U8030202/SF02-8749 as part of the approved 2020–2024 Capital
Program. It is anticipated that this project will be 80 percent federally funded and 20 percent locally funded.
Recommendation
That the Board declare competitive bidding impractical or inappropriate for the procurement of 50 low-floor 40-foot diesel buses for
MTABC, and that it is in the public interest to issue a competitive RFP pursuant to New York State Public Authorities Law Section
1265-a, subdivision 4(g).
Master Page # 221 of 228 - New York City Transit and Bus Committee Meeting 1/21/2021________________________________________________________________________________
Contracts Department
Stephen Plochochi, Senior Vice President
Master Page # 222 of 228 - New York City Transit and Bus Committee Meeting 1/21/2021________________________________________________________________________________
PROCUREMENTS The Procurement Agenda this month includes one procurement action for a proposed expenditure of $3.6M
Master Page # 223 of 228 - New York City Transit and Bus Committee Meeting 1/21/2021________________________________________________________________________________
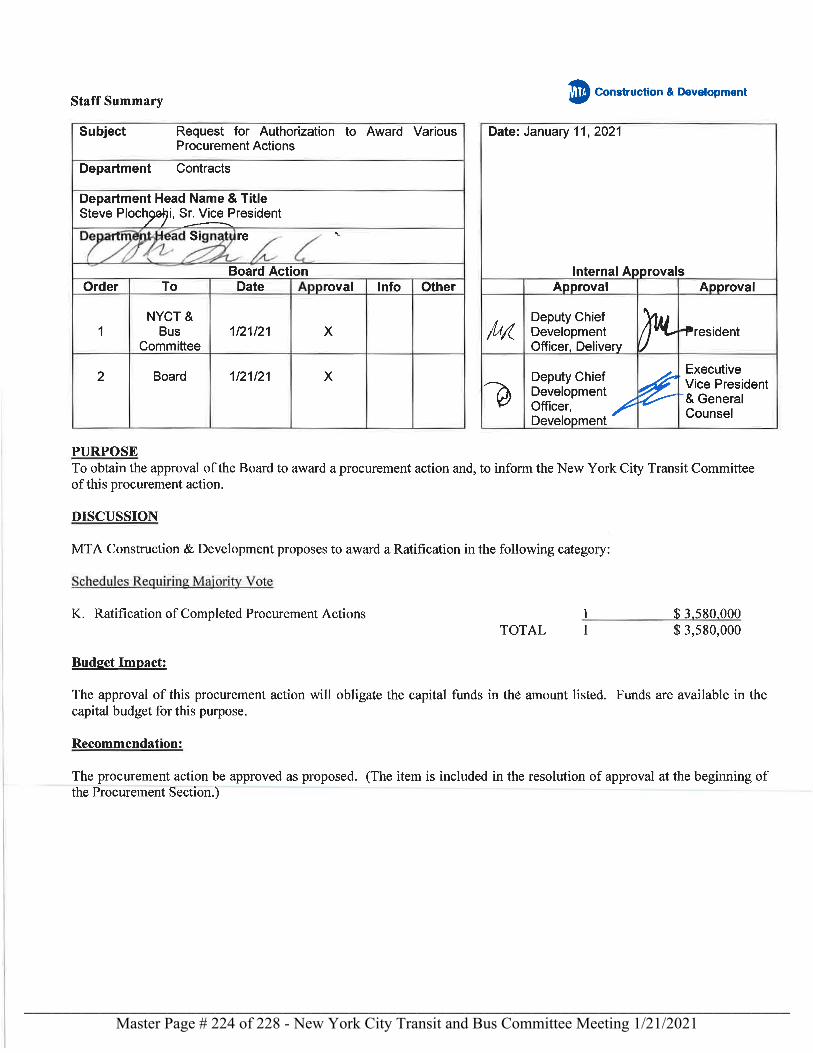
Master Page # 224 of 228 - New York City Transit and Bus Committee Meeting 1/21/2021________________________________________________________________________________
MTA Construction & Development
BOARD RESOLUTION
WHEREAS, in accordance with Sections 1265-a and 1209 of the Public Authorities Law and the All Agency Procurement Guidelines, the Board authorizes the award of certain non-competitive purchase and public works contracts, and the solicitation and award of request for proposals in regard to purchase and public work contracts; and WHEREAS, in accordance with the All Agency Procurement Guidelines, the Board authorizes the award of certain non-competitive miscellaneous service and miscellaneous procurement contracts, certain change orders to purchase, public work, and miscellaneous service and miscellaneous procurement contracts; WHEREAS, in accordance with Section 2879 of the Public Authorities Law and the All-Agency Guidelines for Procurement of Services, the Board authorizes the award of certain service contracts and certain change orders to service contracts. NOW, the Board resolves as follows: 1. As to each purchase and public work contract set forth in annexed Schedule A, the Board declares competitive bidding to be impractical or inappropriate for the reasons specified therein and authorizes the execution of each such contract. 2. As to each request for proposals (for purchase and public work contracts) set forth in Schedule B for which authorization to solicit proposals is requested, for the reasons specified therein, the Board declares competitive bidding to be impractical or inappropriate, declares it is in the public interest to solicit competitive request for proposals and authorizes the solicitation of such proposals. 3. As to each request for proposals (for purchase and public work contracts set forth in Schedule C for which a recommendation is made to award the contract), the Board authorizes the execution of said contract. 4. As to each action set forth in Schedule D, the Board declares competitive bidding impractical or inappropriate for the reasons specified therein, and ratifies each action for which ratification is requested. 5. The Board authorizes the execution of each of the following for which Board authorization is required: i) the miscellaneous procurement contracts set forth in Schedule E; ii) the personal service contracts set forth in Schedule F; iii) the miscellaneous service contracts set forth in Schedule G; iv) the modifications to personal/miscellaneous service contracts set forth in Schedule H; v) the contract modifications to purchase and public work contracts set forth in Schedule I; vi) the modifications to miscellaneous procurement contracts set forth in Schedule J. 6. The Board ratifies each action taken set forth in Schedule K for which ratification is requested.
Master Page # 225 of 228 - New York City Transit and Bus Committee Meeting 1/21/2021________________________________________________________________________________
JANUARY 2021
LIST OF RATIFICATIONS FOR BOARD APPROVAL
Procurements Requiring Majority Vote: Schedule K. Ratification of Completed Procurement Actions (Involving Schedules E-J)
(Staff Summaries required for items requiring Board Approval) 1. L.K. Comstock & Company, Inc. $3,580,000 Staff Summary Attached Contract No. P-36705.04
MTA Construction and Development requests the Board ratify a retroactive modification for the repair of existing ducts and replacing positive feeder cables located between the Central Substation and the 51st Street Circuit Breaker House on the 6th Avenue Line.
Master Page # 226 of 228 - New York City Transit and Bus Committee Meeting 1/21/2021________________________________________________________________________________
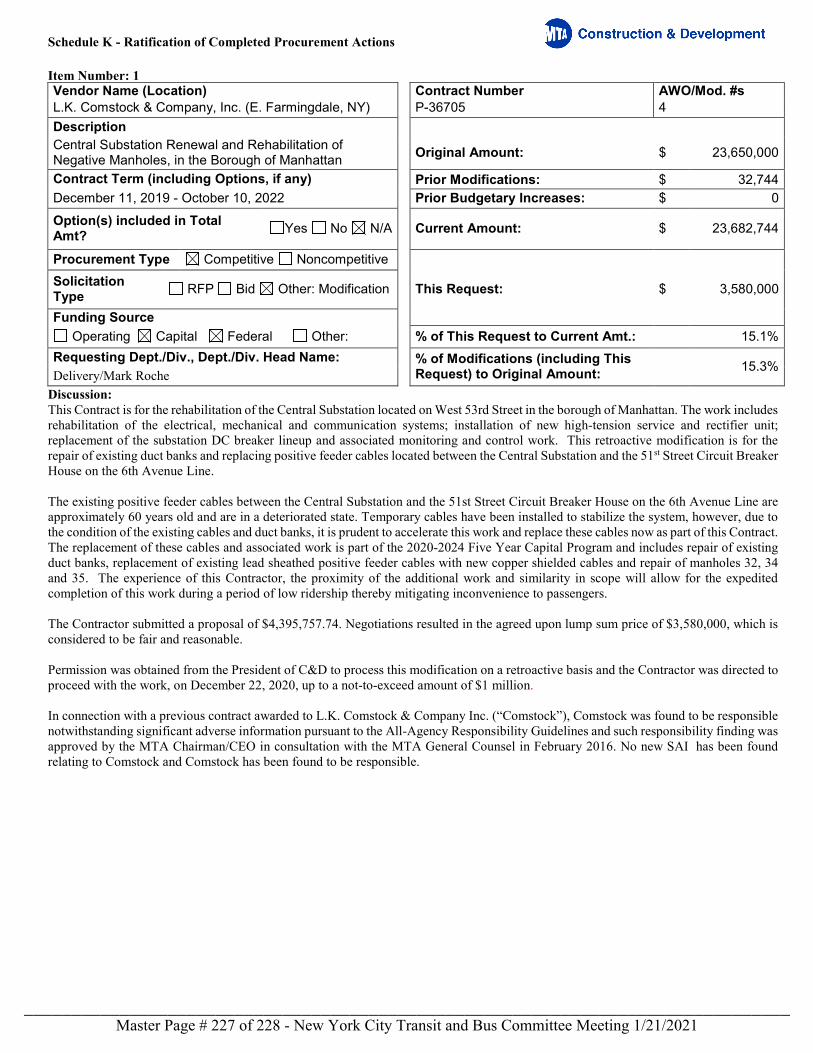
Schedule K - Ratification of Completed Procurement Actions
Item Number: 1 Vendor Name (Location) Contract Number AWO/Mod. #s L.K. Comstock & Company, Inc. (E. Farmingdale, NY) P-36705 4 Description Central Substation Renewal and Rehabilitation of Negative Manholes, in the Borough of Manhattan Original Amount: $ 23,650,000
Contract Term (including Options, if any) Prior Modifications: $ 32,744 December 11, 2019 - October 10, 2022 Prior Budgetary Increases: $ 0
Option(s) included in Total Amt? Yes No N/A Current Amount: $ 23,682,744
Procurement Type Competitive Noncompetitive Solicitation Type RFP Bid Other: Modification This Request: $ 3,580,000
Funding Source Operating Capital Federal Other: % of This Request to Current Amt.: 15.1%
Requesting Dept./Div., Dept./Div. Head Name: % of Modifications (including This Request) to Original Amount: 15.3%
Delivery/Mark Roche Discussion: This Contract is for the rehabilitation of the Central Substation located on West 53rd Street in the borough of Manhattan. The work includes rehabilitation of the electrical, mechanical and communication systems; installation of new high-tension service and rectifier unit; replacement of the substation DC breaker lineup and associated monitoring and control work. This retroactive modification is for the repair of existing duct banks and replacing positive feeder cables located between the Central Substation and the 51st Street Circuit Breaker House on the 6th Avenue Line. The existing positive feeder cables between the Central Substation and the 51st Street Circuit Breaker House on the 6th Avenue Line are approximately 60 years old and are in a deteriorated state. Temporary cables have been installed to stabilize the system, however, due to the condition of the existing cables and duct banks, it is prudent to accelerate this work and replace these cables now as part of this Contract. The replacement of these cables and associated work is part of the 2020-2024 Five Year Capital Program and includes repair of existing duct banks, replacement of existing lead sheathed positive feeder cables with new copper shielded cables and repair of manholes 32, 34 and 35. The experience of this Contractor, the proximity of the additional work and similarity in scope will allow for the expedited completion of this work during a period of low ridership thereby mitigating inconvenience to passengers. The Contractor submitted a proposal of $4,395,757.74. Negotiations resulted in the agreed upon lump sum price of $3,580,000, which is considered to be fair and reasonable. Permission was obtained from the President of C&D to process this modification on a retroactive basis and the Contractor was directed to proceed with the work, on December 22, 2020, up to a not-to-exceed amount of $1 million. In connection with a previous contract awarded to L.K. Comstock & Company Inc. (“Comstock”), Comstock was found to be responsible notwithstanding significant adverse information pursuant to the All-Agency Responsibility Guidelines and such responsibility finding was approved by the MTA Chairman/CEO in consultation with the MTA General Counsel in February 2016. No new SAI has been found relating to Comstock and Comstock has been found to be responsible.
Master Page # 227 of 228 - New York City Transit and Bus Committee Meeting 1/21/2021________________________________________________________________________________
MNSarah Feinberg
Interim PresidentNew York City Transit
M Bus Company
Craig Cipriano President
MTA Bus Company
2 BroadwayNew York, NY 10004-2207
Master Page # 228 of 228 - New York City Transit and Bus Committee Meeting 1/21/2021________________________________________________________________________________
Related Documents