© The Author(s) 2011. This article is published with open access at Springerlink.com csb.scichina.com www.springer.com/scp *Corresponding author (email: [email protected]) Article Engineering Thermophysics August 2011 Vol.56 No.23: 2486 − 2494 doi: 10.1007/s11434-011-4579-8 Transient pressure analysis for the reactor core and containment of a HTGR after a primary loop pressure boundary break accident LI XiaoWei, LI XiaoTian, SHI Li * & HE ShuYan Institute of Nuclear and New Energy Technology, Tsinghua University, Beijing 100084, China Received February 18, 2011; accepted May 11, 2011 The pressure variances in the reactor core and containment of a High Temperature Gas-cooled Reactor (HTGR) after a primary loop pressure boundary break accident determine the structural integrity and safety of the reactor. Based on mass conservation, energy conservation and state equations, explicit formulae for the transient pressure and temperature variances in the pressure vessels were deduced, and a set of differential equations for the transient pressure and temperature variances in the containment were developed. Numerical simulation was also conducted to investigate the transient pressure and temperature variances in the pressure vessels and containment. The results show that energy transformation due to expansion work cannot be neglected. The maximum pressure in the containment could increase by 40 percent due to blockage caused by air in the containment. Detailed numerical simulations of the transient pressure and temperature variance in the reactor core flow passages were also conducted. The results show that the pressures acting on the reactor core and containment are below acceptable values. transient pressure, theoretical analysis, numerical simulation, high temperature gas-cooled reactor, porous media, containment Citation: Li X W, Li X T, Shi L, et al. Transient pressure analysis for the reactor core and containment of a HTGR after a primary loop pressure boundary break accident. Chinese Sci Bull, 2011, 56: 2486−2494, doi: 10.1007/s11434-011-4579-8 Nuclear energy is important for solving the energy and en- vironmental problems in China. For nuclear reactors, safety is of the utmost importance. The recent nuclear accidents of reactors No. 1–4 at the Fukushima Daiichi nuclear power plant, initiated by a magnitude-9 earthquake and subsequent tsunami, are a reminder that safer reactors are paramount. High Temperature Gas-cooled Reactors (HTGRs) have char- acteristics of 4th generation reactors, it is especially excel- lent in the safety features [1–3]. These safety features have already been sufficiently demonstrated [4–6]. Both the Three Mile Island accident and now the Fuku- shima accident have proved the importance of reactor con- tainment. Even the concept of HTGR containment is some- what different from that of Pressurized Water Reactors (PWRs) and Boiling Water Reactors (BWRs) due to its par- ticular safety features. For PWRs, a hypothetic double- ended break of a coolant pipe can cause a most severe Loss Of Coolant Accident (LOCA). It is a complicated mass and energy release process. This has been extensively investi- gated and various specific software programs have been developed [7–10]. There is limited information however on the analysis of transient pressures in the pressure vessels and containment of HTGR after a primary loop pressure boundary break accident. In HTGRs, the coolant is pressurized helium, not pres- surized water as in PWRs, so there will be no phase change of the coolant after a LOCA. With HTGRs, if a large pri- mary loop pressure boundary break occurs, high pressure helium will be released from the pressure vessels and flow into the containment. The pressure variance in the reactor core and containment will threaten the structural integrity and safety of the pressure vessels and the containment. In this paper, the pressure variances in the reactor core flow passages and the pressure variances in the pressure vessels

Welcome message from author
This document is posted to help you gain knowledge. Please leave a comment to let me know what you think about it! Share it to your friends and learn new things together.
Transcript

© The Author(s) 2011. This article is published with open access at Springerlink.com csb.scichina.com www.springer.com/scp
*Corresponding author (email: [email protected])
Article
Engineering Thermophysics August 2011 Vol.56 No.23: 2486−2494
doi: 10.1007/s11434-011-4579-8
Transient pressure analysis for the reactor core and containment of a HTGR after a primary loop pressure boundary break accident
LI XiaoWei, LI XiaoTian, SHI Li* & HE ShuYan
Institute of Nuclear and New Energy Technology, Tsinghua University, Beijing 100084, China
Received February 18, 2011; accepted May 11, 2011
The pressure variances in the reactor core and containment of a High Temperature Gas-cooled Reactor (HTGR) after a primary loop pressure boundary break accident determine the structural integrity and safety of the reactor. Based on mass conservation, energy conservation and state equations, explicit formulae for the transient pressure and temperature variances in the pressure vessels were deduced, and a set of differential equations for the transient pressure and temperature variances in the containment were developed. Numerical simulation was also conducted to investigate the transient pressure and temperature variances in the pressure vessels and containment. The results show that energy transformation due to expansion work cannot be neglected. The maximum pressure in the containment could increase by 40 percent due to blockage caused by air in the containment. Detailed numerical simulations of the transient pressure and temperature variance in the reactor core flow passages were also conducted. The results show that the pressures acting on the reactor core and containment are below acceptable values.
transient pressure, theoretical analysis, numerical simulation, high temperature gas-cooled reactor, porous media, containment
Citation: Li X W, Li X T, Shi L, et al. Transient pressure analysis for the reactor core and containment of a HTGR after a primary loop pressure boundary break accident. Chinese Sci Bull, 2011, 56: 2486−2494, doi: 10.1007/s11434-011-4579-8
Nuclear energy is important for solving the energy and en-vironmental problems in China. For nuclear reactors, safety is of the utmost importance. The recent nuclear accidents of reactors No. 1–4 at the Fukushima Daiichi nuclear power plant, initiated by a magnitude-9 earthquake and subsequent tsunami, are a reminder that safer reactors are paramount. High Temperature Gas-cooled Reactors (HTGRs) have char- acteristics of 4th generation reactors, it is especially excel- lent in the safety features [1–3]. These safety features have already been sufficiently demonstrated [4–6].
Both the Three Mile Island accident and now the Fuku-shima accident have proved the importance of reactor con-tainment. Even the concept of HTGR containment is some-what different from that of Pressurized Water Reactors (PWRs) and Boiling Water Reactors (BWRs) due to its par-ticular safety features. For PWRs, a hypothetic double-
ended break of a coolant pipe can cause a most severe Loss Of Coolant Accident (LOCA). It is a complicated mass and energy release process. This has been extensively investi-gated and various specific software programs have been developed [7–10]. There is limited information however on the analysis of transient pressures in the pressure vessels and containment of HTGR after a primary loop pressure boundary break accident.
In HTGRs, the coolant is pressurized helium, not pres-surized water as in PWRs, so there will be no phase change of the coolant after a LOCA. With HTGRs, if a large pri-mary loop pressure boundary break occurs, high pressure helium will be released from the pressure vessels and flow into the containment. The pressure variance in the reactor core and containment will threaten the structural integrity and safety of the pressure vessels and the containment. In this paper, the pressure variances in the reactor core flow passages and the pressure variances in the pressure vessels
Li X W, et al. Chinese Sci Bull August (2011) Vol.56 No.23 2487
and containment are analyzed both theoretically and nu-merically.
1 Transient pressure in containment
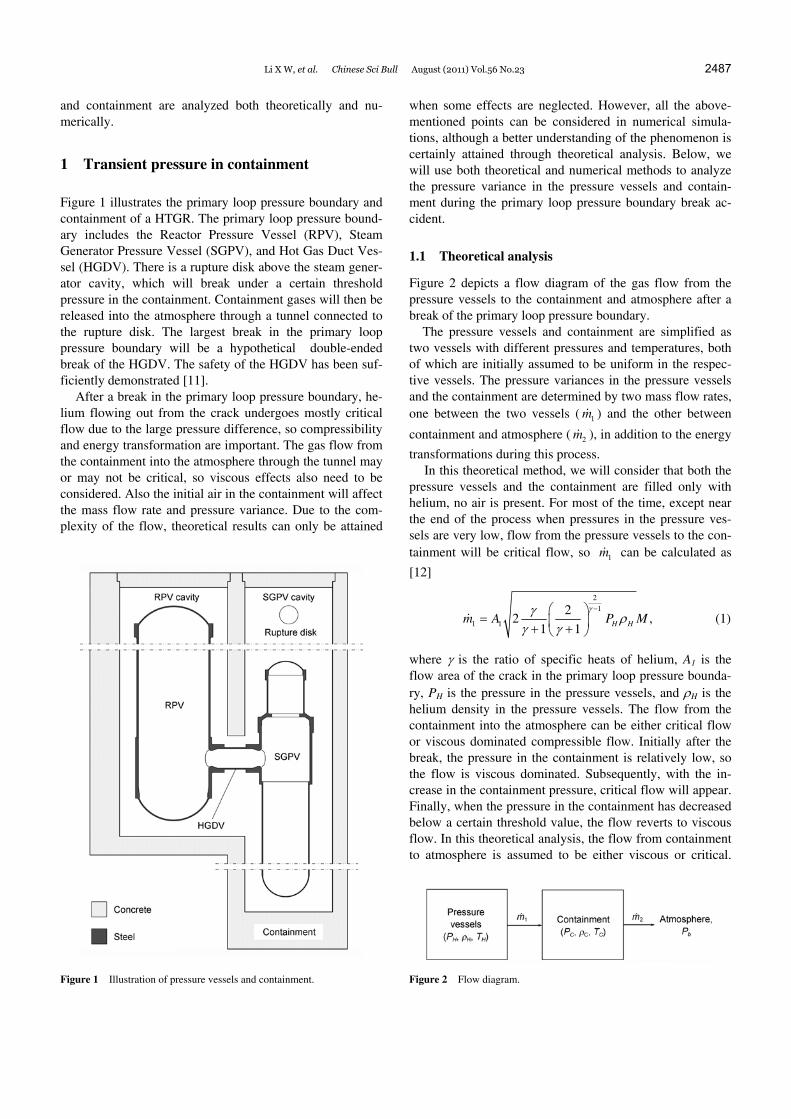
Figure 1 illustrates the primary loop pressure boundary and containment of a HTGR. The primary loop pressure bound-ary includes the Reactor Pressure Vessel (RPV), Steam Generator Pressure Vessel (SGPV), and Hot Gas Duct Ves-sel (HGDV). There is a rupture disk above the steam gener-ator cavity, which will break under a certain threshold pressure in the containment. Containment gases will then be released into the atmosphere through a tunnel connected to the rupture disk. The largest break in the primary loop pressure boundary will be a hypothetical double-ended break of the HGDV. The safety of the HGDV has been suf-ficiently demonstrated [11].
After a break in the primary loop pressure boundary, he-lium flowing out from the crack undergoes mostly critical flow due to the large pressure difference, so compressibility and energy transformation are important. The gas flow from the containment into the atmosphere through the tunnel may or may not be critical, so viscous effects also need to be considered. Also the initial air in the containment will affect the mass flow rate and pressure variance. Due to the com-plexity of the flow, theoretical results can only be attained
Figure 1 Illustration of pressure vessels and containment.
when some effects are neglected. However, all the above- mentioned points can be considered in numerical simula-tions, although a better understanding of the phenomenon is certainly attained through theoretical analysis. Below, we will use both theoretical and numerical methods to analyze the pressure variance in the pressure vessels and contain-ment during the primary loop pressure boundary break ac-cident.
1.1 Theoretical analysis
Figure 2 depicts a flow diagram of the gas flow from the pressure vessels to the containment and atmosphere after a break of the primary loop pressure boundary.
The pressure vessels and containment are simplified as two vessels with different pressures and temperatures, both of which are initially assumed to be uniform in the respec-tive vessels. The pressure variances in the pressure vessels and the containment are determined by two mass flow rates, one between the two vessels ( 1m& ) and the other between
containment and atmosphere ( 2m& ), in addition to the energy
transformations during this process. In this theoretical method, we will consider that both the
pressure vessels and the containment are filled only with helium, no air is present. For most of the time, except near the end of the process when pressures in the pressure ves-sels are very low, flow from the pressure vessels to the con-tainment will be critical flow, so 1m& can be calculated as
[12]
2
1
1 1
22 ,
1 1 H Hm A P Mγγ ρ
γ γ
−⎛ ⎞= ⎜ ⎟+ +⎝ ⎠
& (1)
where γ is the ratio of specific heats of helium, A1 is the flow area of the crack in the primary loop pressure bounda-ry, PH is the pressure in the pressure vessels, and ρH is the helium density in the pressure vessels. The flow from the containment into the atmosphere can be either critical flow or viscous dominated compressible flow. Initially after the break, the pressure in the containment is relatively low, so the flow is viscous dominated. Subsequently, with the in-crease in the containment pressure, critical flow will appear. Finally, when the pressure in the containment has decreased below a certain threshold value, the flow reverts to viscous flow. In this theoretical analysis, the flow from containment to atmosphere is assumed to be either viscous or critical.
Figure 2 Flow diagram.
2488 Li X W, et al. Chinese Sci Bull August (2011) Vol.56 No.23
For critical flow, 2m& is calculated as
2
1
2 2
22
1 1 C Cm A Pγγ ρ
γ γ
−⎛ ⎞= ⎜ ⎟+ +⎝ ⎠
& , (2)
where A2 is the minimum cross-sectional area in the tunnel, PC is the pressure in the containment, and ρC is the helium density in the containment. For viscous flow:
2 2 0.5C b
CC
P Pm Aρ
ξρ−
=& , (3)
where ξ is the friction factor caused by the tunnel and valves, and Pb is atmospheric pressure. With mass conser-vation, energy conservation and the state equations under the above assumptions, we can deduce the following gov-erning equations for the pressure in the pressure vessels:
ρ ρ
ρρ
ρ
•
•
⎧ = −⎪⎪⎪ = −⎨⎪⎪ =⎪⎩
,
,
,
H H H
HHH V H
H
H H M H
a P
PC T aP
P R T
(4)
whereγγ
γ γ
−⎛ ⎞= ⎜ ⎟+ +⎝ ⎠
2
11 2
2 ,1 1H
Aa
V
2
12 2
2 ,1 1C
Ab
V
γγγ γ
−⎛ ⎞= ⎜ ⎟+ +⎝ ⎠
Cv is the constant volume specific heat of helium, and RM is the gas constant for helium. Integration of eq. (4) gives the following:
( )
( )
ρ ρ
ρ
−
−−
−
−
⎛ ⎞− +⎜ ⎟⎜ ⎟
⎝ ⎠−−
⎧⎛ ⎞⎪⎜ ⎟⎪ = +⎜ ⎟⎪ ⎜ ⎟⎪ ⎝ ⎠
⎪⎛ ⎞⎪
⎪ ⎜ ⎟= +⎨ ⎜ ⎟⎜ ⎟⎪⎝ ⎠⎪
⎪⎛ ⎞⎪⎜ ⎟⎪ = +⎜ ⎟⎪ ⎜ ⎟⎪ ⎝ ⎠⎩
23
122
,0 ,0 ,0
23122,0
2 13122
,0 ,0 ,0
,2
,2
,2
V
MV
M
V
MV
M
C
RC
MRH H H H
V
MH H
V
C
RC
MRH H H M H
V
aRT t T
C
aRT t T
C
aRP T R t T
C
(5)
where t is time, TH, 0 is the original temperature, PH, 0 is the original pressure, ρH, 0 is the original helium density. Also we can deduce the following governing equations of the pressure in the containment. These are also composed of mass conservation, energy conservation and state equations. For critical flow:
( )
ρ ρ ρ
ρ ρ
ρ
•
•
⎧ = −⎪⎪⎪ ′+ − +⎨⎪ ′− =⎪⎪ =⎩
' ,
0,
,
C H H C C
CC V H M H V C H C M C
H M H
C C M C
a P b P
C T a R T C T T bP R T
a P R T
P R T
, (6)
where H
C
Va a
V′ = . For viscous flow:
( )
( )
ρ ρ ρ
ρ ρ
ρ
•
•
⎧ = − −⎪⎪⎪ ′+ − +⎨⎪ ′− =⎪⎪ =⎩
' ,
0,
,
C H H C C b
CC V H M H V C H C M C
H M H
C C M C
a P d P P
C T a R T C T T bP R T
a P R T
P R T
(7)
where 2
0.5C
Ad
V ξ= . There are no analytical solutions for
the differential eqs. (6) and (7). The two sets of equations are numerically solved by Matlab software using ODE45 method.
1.2 Numerical analysis
Using theoretical methods, one must neglect some effects in order to obtain analytic solutions. In effect, the flow from containment to atmosphere will be characterized as initially viscous, and subsequently either critical or compressible viscous. Of course, both compressible and viscous effects should be considered for greater realism of the results. Moreover, the gas in the containment initially should be air, not helium. Numerical simulation can consider all these factors, and the results will be more believable. In this sec-tion, the numerical method is introduced.
Figure 3 shows the picture of the numerical model of the three pressure vessels, the cavities, and the outlet tunnel. Assuming that there is a break on the HGDV, the flow area of the break opening is 0.1 m2 [11]. The volumes of the fuel spheres and the tube bundles are subtracted, so helium in the RPV and SGPV do not fill all the volume of the vessels. The free space volume in the pressure vessels is about 450 m3, while the free space volume in the containment is about 3000 m3. Figure 4 shows the grid distribution used in the numerical model. The grid density near the crack opening has been intensified. The total element number is about 1000000.
The governing equations are the Reynolds-averaged con-tinuity, momentum, energy and species equations. The k-ε model was used for turbulence closure. For detailed infor-mation about the governing equations and the assumptions please refer to [13].
Two cases were simulated. In the first, the fluid in the pressure vessels is helium at a gauge pressure of 7 MPa and an average temperature of 594.15 K. The initial temperature distribution in the pressure vessels is uniform. The fluid in the containment is air at zero gauge pressure. The tempera-ture above the SG cavity is 330 K. The average temperature in the containment is about 480 K. The fluid in the tunnel is air at zero gauge pressure and a lower temperature of 300 K. In the second case, the pressure vessels are also filled with

Li X W, et al. Chinese Sci Bull August (2011) Vol.56 No.23 2489
Figure 3 Numerical model. (a) Front view; (b) top view.
Figure 4 Grid distribution. (a) Vertical cross section; (b) horizontal cross section.
helium at 7 MPa, 594.15 K, but the containment is filled with helium with a gauge pressure of zero and uniform temperature of 480 K. The difference with the first case is that the gas in the containment is helium and the tempera-ture is uniform. The results from this case were used to compare with those obtained from the theoretical method.
The ideal gas model is used for the density of helium and the mixture of helium and air. The thermal conductivity, viscosity and specific heat of helium vary with temperature. The thermal properties of the mixture are calculated using
ideal-gas-mixing-law. The governing equations are solved by commercial software Fluent 6.3. The minimum time step at the beginning is 1×10⁻⁵ s, then is increased gradually. Adiabatic boundary conditions are used for all the walls.
2 Transient pressures in reactor core flow passages
In the reactor core, high pressure helium flows along pas-
2490 Li X W, et al. Chinese Sci Bull August (2011) Vol.56 No.23
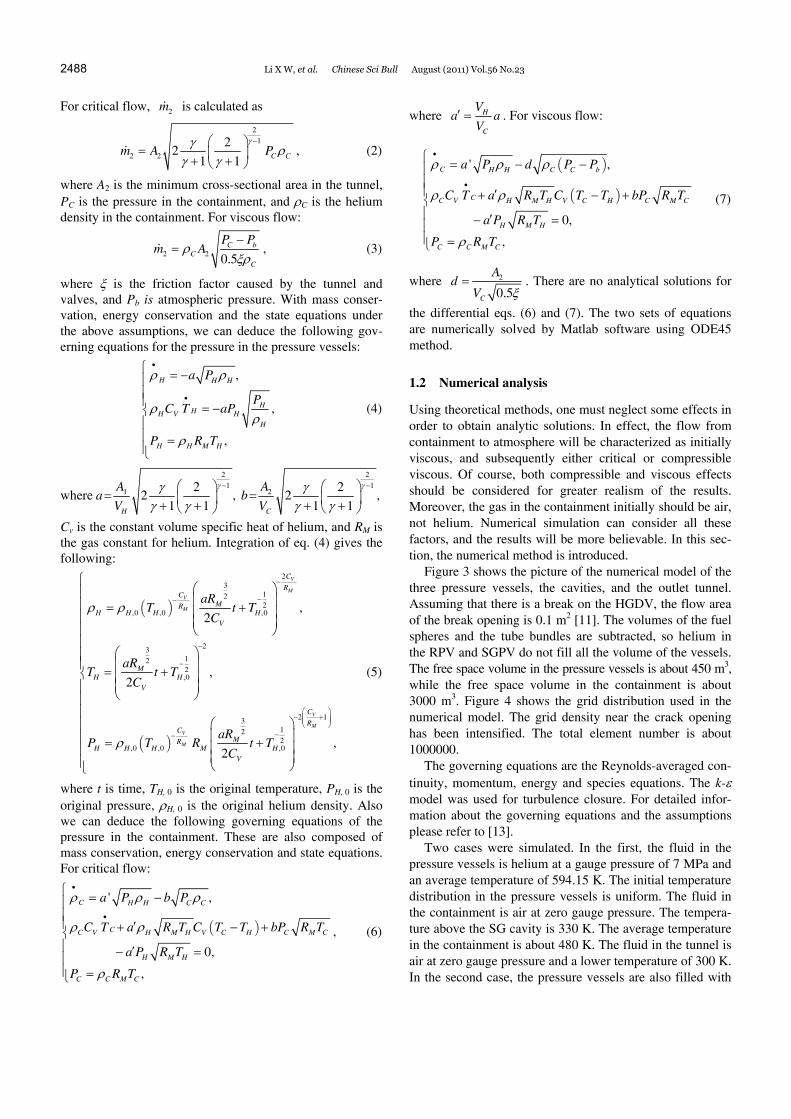
sages composed of ceramic (carbon or graphite) bricks. These ceramic bricks are packed together and supported by metallic internals. The structures are maintained by bonds, hold-down plates and hoops. During a hypothetic HGDV double-ended break accident, additional pressures will be introduced due to pressure differences in the flow passages. Figure 5 illustrates flow directions in the reactor core flow passages after a break. The flow and pressure variance in the passages of the core internals has been numerically sim-ulated.
As the helium flow passage in the reactor core is almost symmetrical, only 1/15 of the flow passage needs to be sim-ulated. Figure 6 shows the grid distributions of the numeri-cal model. An outlet vent is added to set the outlet mass flow rate. The gaps between the packed ceramic bricks are neglected, so the results will be more conservative. Figure 6(b) shows the grid distributions at six cross-sections marked in Figure 6(a). The grid in the cold helium tunnel, cold helium room, reactor core and hot helium room are intensified because of the small dimensions involved. Hex-ahedral elements are generated except in the lower and up-per plenum. The total number of grid elements is about 890000.
The governing equations include the Reynolds-averaged continuity, momentum and energy equations. Also the two equation k-ε model is used to model turbulence. Porous me-dia model is used to simulate the pressure drop in the reac-tor core [14–18]. Empirical pressure drop correlations for the packed beds are used [19] for the porous media model.
Figure 5 Illustration of helium flow in the reactor under a hypothetic HGDV double-ended break accident.
Figure 6 Numerical model and grid distribution. (a) Geometrical model; (b) grid distribution.
Li X W, et al. Chinese Sci Bull August (2011) Vol.56 No.23 2491
Adiabatic boundary conditions are used for all walls. The mass flow rate at the outlet vent is set by a user defined function. The transient outlet mass flow rate is obtained from the numerical simulation results as described in sec-tion 1.2. The initial helium gauge pressure is 7 MPa. The initial average helium temperature in the reactor core is 773.15 K, the initial temperature in the hot helium room is 1023.15 K, the initial temperature in the cold helium tunnel and cold helium room is 523.15 K. As in section 1.2, ideal gas model is used for the density of helium, the other prop-erties are functions of temperature. Fluent 6.3 was used for solving the governing equations.
3 Results and discussion
3.1 Transient pressure in containment
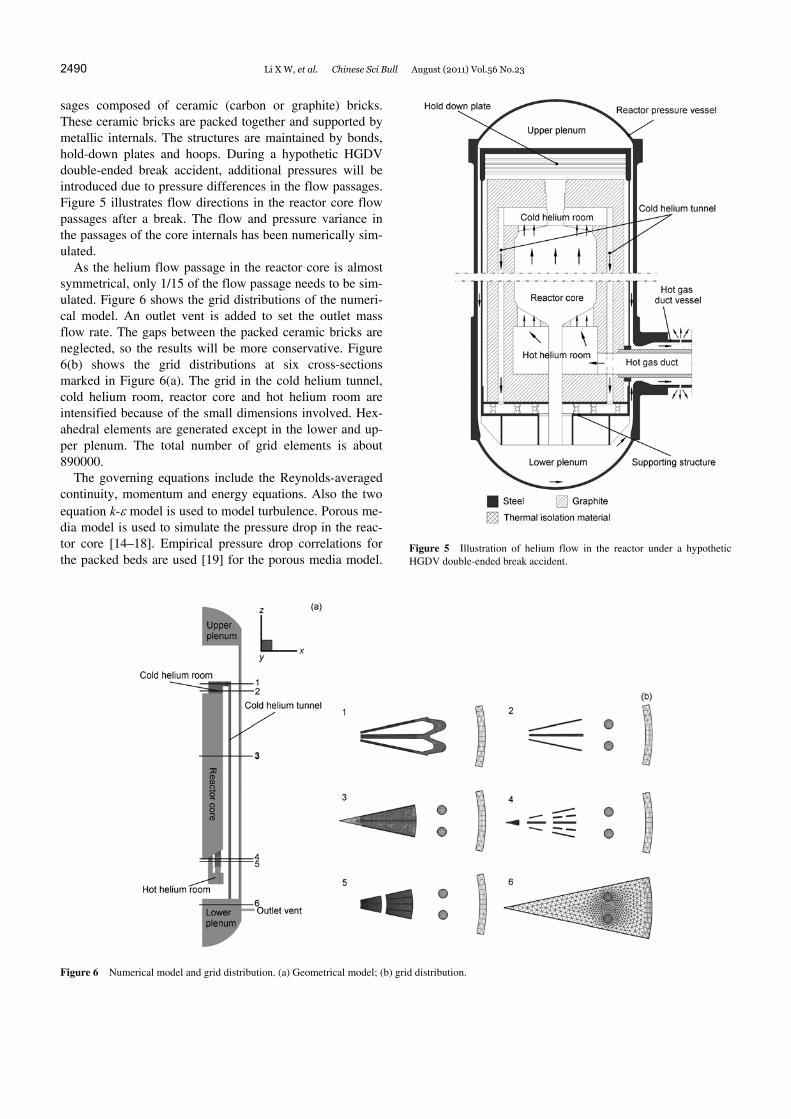
The results from theoretical and numerical methods are compared and analyzed. Figure 7 shows the transient pres-sure and temperature variances in the pressure vessels. The rectangular symbol represents the numerical simulation re-sults with no air in the containment. The solid line repre-sents the corresponding theoretical results. It can be seen that the results from the two methods agree well for both pressure and temperature variances. Figure 7(a) shows that the pressure drops sharply at the beginning and slows rela-tively after about 5 s. This is due to the slower mass flow rate following the decrease in the pressure in the pressure vessels. The pressure in these vessels falls below 2×10⁵ Pa after 13 seconds. Figure 7(b) shows that helium tempera-tures in the pressure vessels decrease remarkably. After 13 s, helium temperatures in the pressure vessels are below 200 K. This is due to the high pressure helium in the pressure vessels do work while expanding.
Figure 8 shows the numerical and theoretical results of the transient pressure and temperature variances in the con-tainment. Circular symbols represent numerical results of the case with containment air, rectangular symbols represent numerical results of the case without containment air. The solid line represents the theoretical result with critical flow assumed between containment and atmosphere, and the
dotted line represents the theoretical result with viscous flow between containment and atmosphere. For numerical simulations, the data sampling position is above the SGPV cavity. For theoretical analysis, the initial pressure and temperature in the pressure vessels are 7.1 MPa and 594.15 K respectively. The initial pressure and temperature in the containment is zero and 480 K respectively. The friction factor ξ is set to 15 in the theoretical analysis with viscous flow assumption. For the case with no air in the contain-ment, Figure 8 shows that the numerical results of both pressure and temperature agree well with theoretical results under the critical flow assumption between containment and atmosphere. The theoretical results subject to viscous flow between containment and atmosphere deviate a little from the corresponding numerical results. In Figure 8(a), the case with containment air shows that the pressure is 40 percent higher than that without containment air. This is due to that the density of air is more than 7 times that of helium, need-ing more momentum to push the air out of the containment, so that the pressure is higher due to air blocking. The max-imum pressure in the containment with break area of 0.1 m2 is 3.5×10⁵ Pa. This is lower than the maximum pressure the containment can withstand [11]. Figure 8(b) shows that the gas temperature variance of the case with containment air also deviates from that without containment air. This is due to differences in the specific heats of air and helium and also the lower initial air temperature above the steam gener-ator cavity in the case with containment air. The maximum gas temperature is about 690 K. Also, due to the very short process and the large heat capacity of concrete and steel, the large temperature variance of the gas in the containment will have no consequence on the pressure vessels or the containment.
Figure 9 shows the pressure, velocity, temperature and air mass fraction contours in the pressure vessels and con-tainment at 1.5 s after the accident. The pressure in the three pressure vessels and the containment (Figure 9(a)) is very uniform, so the two vessel assumption in the theoretical method is reasonable. The velocity contours (Figure 9(b)) show that velocities are above the speed of sound just around the crack region. Fluid velocities are relatively low
Figure 7 Transient pressure and temperature in pressure vessels. (a) Transient pressure; (b) transient temperature.

2492 Li X W, et al. Chinese Sci Bull August (2011) Vol.56 No.23
Figure 8 Transient pressure and temperature in containment. (a) Transient pressure; (b) transient temperature.
Figure 9 Parameter contours in pressure vessels and containment at t=1.5 s. (a) Pressure contour (Pa); (b) velocity contour (m/s); (c) temperature contour (K); (d) air mass fraction contour.
Li X W, et al. Chinese Sci Bull August (2011) Vol.56 No.23 2493
at elsewhere in the containment. In Figure 9(c), tempera-tures in the pressure vessels are seen to be very uniform, but in the containment, the temperature is not so uniform due to the complex geometry. Temperatures in the containment are higher at this stage than those in the pressure vessels. This is due to the expansion work the helium has done to the con-tainment gases. Figure 9(d) shows the distribution of air mass fraction. It can be seen that the air in the steam gener-ator cavity is evacuated more easily, while some air is blocked at the top of the reactor cavity.
3.2 Transient pressures in reactor core flow passages
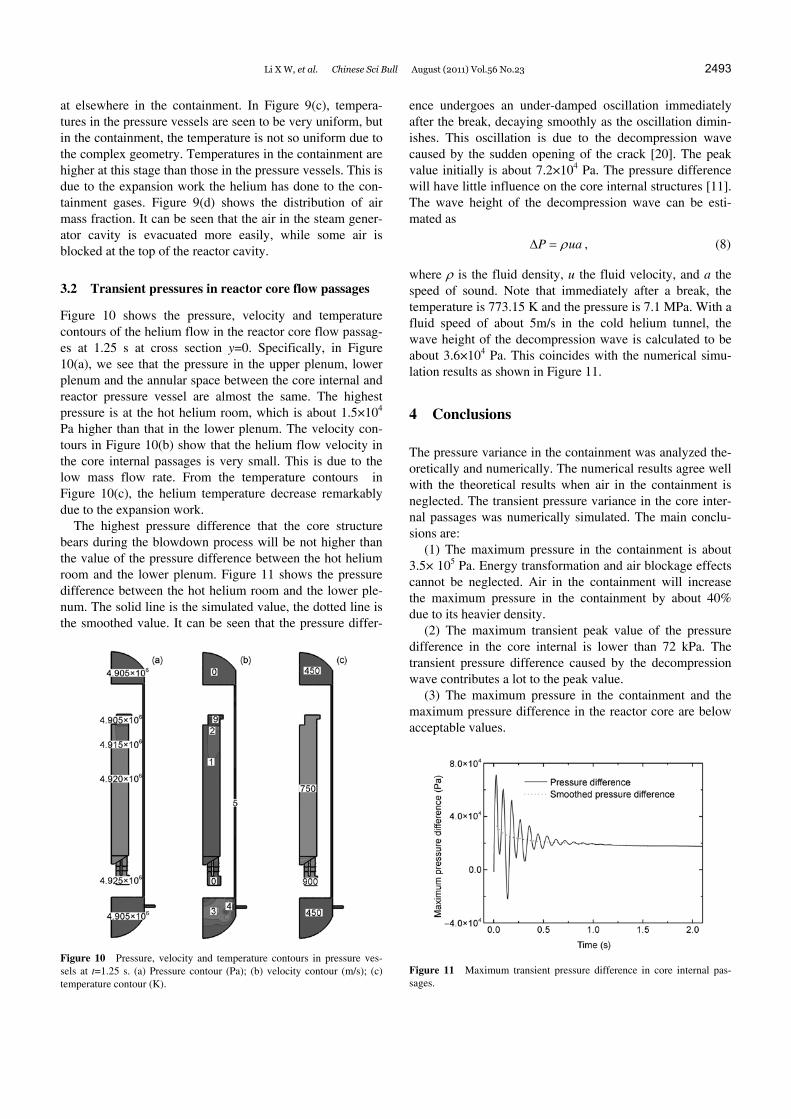
Figure 10 shows the pressure, velocity and temperature contours of the helium flow in the reactor core flow passag-es at 1.25 s at cross section y=0. Specifically, in Figure 10(a), we see that the pressure in the upper plenum, lower plenum and the annular space between the core internal and reactor pressure vessel are almost the same. The highest pressure is at the hot helium room, which is about 1.5×10⁴ Pa higher than that in the lower plenum. The velocity con-tours in Figure 10(b) show that the helium flow velocity in the core internal passages is very small. This is due to the low mass flow rate. From the temperature contours in Figure 10(c), the helium temperature decrease remarkably due to the expansion work.
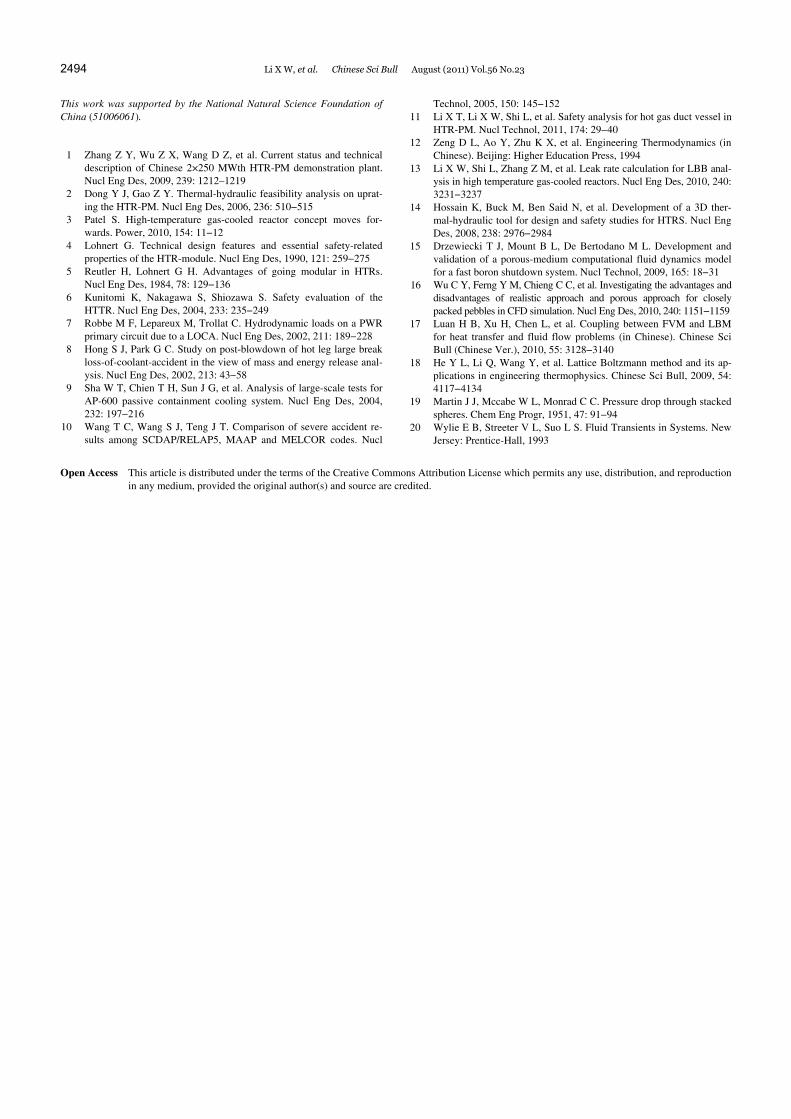
The highest pressure difference that the core structure bears during the blowdown process will be not higher than the value of the pressure difference between the hot helium room and the lower plenum. Figure 11 shows the pressure difference between the hot helium room and the lower ple-num. The solid line is the simulated value, the dotted line is the smoothed value. It can be seen that the pressure differ-
Figure 10 Pressure, velocity and temperature contours in pressure ves-sels at t=1.25 s. (a) Pressure contour (Pa); (b) velocity contour (m/s); (c) temperature contour (K).
ence undergoes an under-damped oscillation immediately after the break, decaying smoothly as the oscillation dimin-ishes. This oscillation is due to the decompression wave caused by the sudden opening of the crack [20]. The peak value initially is about 7.2×10⁴ Pa. The pressure difference will have little influence on the core internal structures [11]. The wave height of the decompression wave can be esti-mated as
P uaρΔ = , (8)
where ρ is the fluid density, u the fluid velocity, and a the speed of sound. Note that immediately after a break, the temperature is 773.15 K and the pressure is 7.1 MPa. With a fluid speed of about 5m/s in the cold helium tunnel, the wave height of the decompression wave is calculated to be about 3.6×10⁴ Pa. This coincides with the numerical simu-lation results as shown in Figure 11.
4 Conclusions
The pressure variance in the containment was analyzed the-oretically and numerically. The numerical results agree well with the theoretical results when air in the containment is neglected. The transient pressure variance in the core inter-nal passages was numerically simulated. The main conclu-sions are:
(1) The maximum pressure in the containment is about 3.5× 10⁵ Pa. Energy transformation and air blockage effects cannot be neglected. Air in the containment will increase the maximum pressure in the containment by about 40% due to its heavier density.
(2) The maximum transient peak value of the pressure difference in the core internal is lower than 72 kPa. The transient pressure difference caused by the decompression wave contributes a lot to the peak value.
(3) The maximum pressure in the containment and the maximum pressure difference in the reactor core are below acceptable values.
Figure 11 Maximum transient pressure difference in core internal pas-sages.
2494 Li X W, et al. Chinese Sci Bull August (2011) Vol.56 No.23
This work was supported by the National Natural Science Foundation of China (51006061).
1 Zhang Z Y, Wu Z X, Wang D Z, et al. Current status and technical description of Chinese 2×250 MWth HTR-PM demonstration plant. Nucl Eng Des, 2009, 239: 1212–1219
2 Dong Y J, Gao Z Y. Thermal-hydraulic feasibility analysis on uprat-ing the HTR-PM. Nucl Eng Des, 2006, 236: 510−515
3 Patel S. High-temperature gas-cooled reactor concept moves for-wards. Power, 2010, 154: 11−12
4 Lohnert G. Technical design features and essential safety-related properties of the HTR-module. Nucl Eng Des, 1990, 121: 259−275
5 Reutler H, Lohnert G H. Advantages of going modular in HTRs. Nucl Eng Des, 1984, 78: 129−136
6 Kunitomi K, Nakagawa S, Shiozawa S. Safety evaluation of the HTTR. Nucl Eng Des, 2004, 233: 235−249
7 Robbe M F, Lepareux M, Trollat C. Hydrodynamic loads on a PWR primary circuit due to a LOCA. Nucl Eng Des, 2002, 211: 189−228
8 Hong S J, Park G C. Study on post-blowdown of hot leg large break loss-of-coolant-accident in the view of mass and energy release anal-ysis. Nucl Eng Des, 2002, 213: 43−58
9 Sha W T, Chien T H, Sun J G, et al. Analysis of large-scale tests for AP-600 passive containment cooling system. Nucl Eng Des, 2004, 232: 197−216
10 Wang T C, Wang S J, Teng J T. Comparison of severe accident re-sults among SCDAP/RELAP5, MAAP and MELCOR codes. Nucl
Technol, 2005, 150: 145−152 11 Li X T, Li X W, Shi L, et al. Safety analysis for hot gas duct vessel in
HTR-PM. Nucl Technol, 2011, 174: 29−40 12 Zeng D L, Ao Y, Zhu K X, et al. Engineering Thermodynamics (in
Chinese). Beijing: Higher Education Press, 1994 13 Li X W, Shi L, Zhang Z M, et al. Leak rate calculation for LBB anal-
ysis in high temperature gas-cooled reactors. Nucl Eng Des, 2010, 240: 3231−3237
14 Hossain K, Buck M, Ben Said N, et al. Development of a 3D ther-mal-hydraulic tool for design and safety studies for HTRS. Nucl Eng Des, 2008, 238: 2976−2984
15 Drzewiecki T J, Mount B L, De Bertodano M L. Development and validation of a porous-medium computational fluid dynamics model for a fast boron shutdown system. Nucl Technol, 2009, 165: 18−31
16 Wu C Y, Ferng Y M, Chieng C C, et al. Investigating the advantages and disadvantages of realistic approach and porous approach for closely packed pebbles in CFD simulation. Nucl Eng Des, 2010, 240: 1151−1159
17 Luan H B, Xu H, Chen L, et al. Coupling between FVM and LBM for heat transfer and fluid flow problems (in Chinese). Chinese Sci Bull (Chinese Ver.), 2010, 55: 3128−3140
18 He Y L, Li Q, Wang Y, et al. Lattice Boltzmann method and its ap-plications in engineering thermophysics. Chinese Sci Bull, 2009, 54: 4117−4134
19 Martin J J, Mccabe W L, Monrad C C. Pressure drop through stacked spheres. Chem Eng Progr, 1951, 47: 91−94
20 Wylie E B, Streeter V L, Suo L S. Fluid Transients in Systems. New Jersey: Prentice-Hall, 1993
Open Access This article is distributed under the terms of the Creative Commons Attribution License which permits any use, distribution, and reproduction
in any medium, provided the original author(s) and source are credited.
Related Documents