Transient interfacial tension and dilatational rheology of diffuse polymer-polymer interfaces Gerrit W. M. Peters, a Alexander N. Zdravkov, and Han E. H. Meijer Dutch Polymer Institute, Materials Technology, Eindhoven University of Technology, 5600 MB Eindhoven, The Netherlands Received 14 June 2004; accepted 13 December 2004; published online 7 March 2005 We demonstrate the influence of molecular weight and molecular weight asymmetry across an interface on the transient behavior of the interfacial tension. The interfacial tension was measured as a function of time for a range of polymer combinations with a broad range of interfacial properties using a pendant/sessile drop apparatus. The results show that neglecting mutual solubility, assumed to be a reasonable approximation in many cases, very often does not sustain. Instead, a diffuse interface layer develops in time with a corresponding transient interfacial tension. Depending on the specific combination of polymers, the transient interfacial tension is found to increase or decrease with time. The results are interpreted in terms of a recently proposed model Shi et al., Macromolecules 37, 1591 2004, giving relative characteristic diffusion time scales in terms of molecular weight, molecular weight distribution, and viscosities. However, the time scales obtained from this theoretical approach do not give a conclusive trend. Using oscillatory dilatational interfacial experiments the viscoelastic behavior of these diffusive interfaces is demonstrated. The time evolution of the interfacial tension and the dilatational elasticity show the same trend as predicted by the theory of diffuse interfaces, supporting the idea that the polymer combinations under consideration indeed form diffuse interfaces. The dilatational elasticity and the dilatational viscosity show a frequency dependency that is described qualitatively by a simple Fickian diffusion model and quantitatively by a Maxwell model. The characteristic diffusion times provided by the latter show that the systems with thick interfaces tens of microseconds and more can be considered as slower diffusive systems compared to the systems with thinner interfaces a few micrometers in thickness and less can be considered as fast diffusive systems. © 2005 American Institute of Physics. DOI: 10.1063/1.1856454 I. INTRODUCTION Interfacial properties of immiscible and partially mis- cible polymer blends are of importance for processes related to structure development during mixing. Understanding polymer-polymer interface dynamics is a key issue for con- trolling processes such as drop break-up and coalescence. The mutual diffusion between two polymers that are not fully miscible is, at long times, restricted to a finite length scale. 1–3 The response of such diffusion layers to deforma- tions, caused by interaction between the bulk flow and the drops or by interaction between two or more drops, is one of the important factors determining the final morphology of a polymer blend. The discrepancies between theoretical predictions on structure development and experimental results 4–9 are, most likely, due to the complex interfacial properties of, and the mutual interaction between, the polymers. In many cases mutual solubility is considered to be negligible for practical purposes. 4–6,10–12 This seems reasonable since the polymers consist of long molecules, and mixing of those molecules is thermodynamically unfavorable. 13 Moreover, polymers pos- sess a high macroscopic viscosity typically from O1–10 3 Pa s and therefore mutual diffusion if present, is expected to be slow the mutual diffusion coefficient is of the order of 10 −13 cm 2 / s and smaller 14 . However, the picture is different when there is a large asymmetry in molecular weight across the interface and the two polymers can inter- change molecules for entropic reasons. Small molecules start to diffuse since they move faster than the slow entangled large molecules, creating in this way an increase in density in the interfacial zone that quickly settles down by the relax- ation of the large chains, resembling osmotic pressure effects. 14 Despite the fundamental and practical importance of the mutual diffusion effects on the interfacial properties of immiscible and partially miscible blends, only a limited number of experimental studies on these effects have been reported in the literature. LeGrand and Gains 15 were first to report on mutual solubility of homologous series of poly- isobutylenes PIB and polydimethylsiloxanes PDMS and on the molecular dependence of interfacial tension of these pairs. Grace 16 observed a decrease in the interfacial tension with time for the liquid pair Vorite 125/Si 1000 polymerized Castor oil/Silicon oil and attributed this to a slow mutual diffusion in the highly viscous system. More recently, con- firming these results, a decrease of the interfacial tension with time was found for several Newtonian systems. 17 A fast decrease, followed by an increase of the interfacial tension was reported 18 for a surfactant that is diffusing from the drop a Electronic mail: [email protected] THE JOURNAL OF CHEMICAL PHYSICS 122, 104901 2005 0021-9606/2005/12210/104901/10/$22.50 © 2005 American Institute of Physics 122, 104901-1 Downloaded 15 Apr 2005 to 131.155.54.18. Redistribution subject to AIP license or copyright, see http://jcp.aip.org/jcp/copyright.jsp

Welcome message from author
This document is posted to help you gain knowledge. Please leave a comment to let me know what you think about it! Share it to your friends and learn new things together.
Transcript
Transient interfacial tension and dilatational rheology of diffusepolymer-polymer interfaces
Gerrit W. M. Peters,a� Alexander N. Zdravkov, and Han E. H. MeijerDutch Polymer Institute, Materials Technology, Eindhoven University of Technology, 5600 MB Eindhoven,The Netherlands
�Received 14 June 2004; accepted 13 December 2004; published online 7 March 2005�
We demonstrate the influence of molecular weight and molecular weight asymmetry across aninterface on the transient behavior of the interfacial tension. The interfacial tension was measuredas a function of time for a range of polymer combinations with a broad range of interfacialproperties using a pendant/sessile drop apparatus. The results show that neglecting mutual solubility,assumed to be a reasonable approximation in many cases, very often does not sustain. Instead, adiffuse interface layer develops in time with a corresponding transient interfacial tension.Depending on the specific combination of polymers, the transient interfacial tension is found toincrease or decrease with time. The results are interpreted in terms of a recently proposed model�Shi et al., Macromolecules 37, 1591 �2004��, giving relative characteristic diffusion time scales interms of molecular weight, molecular weight distribution, and viscosities. However, the time scalesobtained from this theoretical approach do not give a conclusive trend. Using oscillatory dilatationalinterfacial experiments the viscoelastic behavior of these diffusive interfaces is demonstrated. Thetime evolution of the interfacial tension and the dilatational elasticity show the same trend aspredicted by the theory of diffuse interfaces, supporting the idea that the polymer combinationsunder consideration indeed form diffuse interfaces. The dilatational elasticity and the dilatationalviscosity show a frequency dependency that is described qualitatively by a simple Fickian diffusionmodel and quantitatively by a Maxwell model. The characteristic diffusion times provided by thelatter show that the systems with thick interfaces �tens of microseconds and more� can be consideredas slower diffusive systems compared to the systems with thinner interfaces �a few micrometers inthickness and less� can be considered as fast diffusive systems. © 2005 American Institute ofPhysics. �DOI: 10.1063/1.1856454�
I. INTRODUCTION
Interfacial properties of immiscible and partially mis-cible polymer blends are of importance for processes relatedto structure development during mixing. Understandingpolymer-polymer interface dynamics is a key issue for con-trolling processes such as drop break-up and coalescence.The mutual diffusion between two polymers that are notfully miscible is, at long times, restricted to a finite lengthscale.1–3 The response of such diffusion layers to deforma-tions, caused by interaction between the bulk flow and thedrops or by interaction between two or more drops, is one ofthe important factors determining the final morphology of apolymer blend.
The discrepancies between theoretical predictions onstructure development and experimental results4–9 are, mostlikely, due to the complex interfacial properties of, and themutual interaction between, the polymers. In many casesmutual solubility is considered to be negligible for practicalpurposes.4–6,10–12 This seems reasonable since the polymersconsist of long molecules, and mixing of those molecules isthermodynamically unfavorable.13 Moreover, polymers pos-sess a high �macroscopic� viscosity �typically fromO�1–103�Pa s� and therefore mutual diffusion if present, is
expected to be slow �the mutual diffusion coefficient is of theorder of 10−13 cm2/s and smaller14�. However, the picture isdifferent when there is a large asymmetry in molecularweight across the interface and the two polymers can inter-change molecules for entropic reasons. Small molecules startto diffuse since they move faster than the slow entangledlarge molecules, creating in this way an increase in density inthe interfacial zone that quickly settles down by the relax-ation of the large chains, resembling osmotic pressureeffects.14 Despite the fundamental and practical importanceof the mutual diffusion effects on the interfacial properties ofimmiscible and partially miscible blends, only a limitednumber of experimental studies on these effects have beenreported in the literature. LeGrand and Gains15 were first toreport on mutual solubility of homologous series of poly-isobutylenes �PIB� and polydimethylsiloxanes �PDMS� andon the molecular dependence of interfacial tension of thesepairs. Grace16 observed a decrease in the interfacial tensionwith time for the liquid pair Vorite 125/Si 1000 �polymerizedCastor oil/Silicon oil� and attributed this to a slow mutualdiffusion in the highly viscous system. More recently, con-firming these results, a decrease of the interfacial tensionwith time was found for several Newtonian systems.17 A fastdecrease, followed by an increase of the interfacial tensionwas reported18 for a surfactant that is diffusing from the dropa�Electronic mail: [email protected]
THE JOURNAL OF CHEMICAL PHYSICS 122, 104901 �2005�
0021-9606/2005/122�10�/104901/10/$22.50 © 2005 American Institute of Physics122, 104901-1
Downloaded 15 Apr 2005 to 131.155.54.18. Redistribution subject to AIP license or copyright, see http://jcp.aip.org/jcp/copyright.jsp
�limited, small volume� to the continuous phase �unlimited,large volume�. The increase of the interfacial tension wasfound to be due to the transfer of the surfactant into thecontinuous phase resulting in a depletion in the drop and inthe interfacial area. An increase of the interfacial tensionwith time was reported8 for a PIB/PDMS combination andthis was attributed to depletion of the PIB drop from smallmolecules through the dynamic interface subjected to steadyshear. Recently, Shi et al.19 reported experiments on similarmaterial combinations as we used �PIB/PDMS�. The experi-mentally observed decrease in interfacial tension, attributedto the transport of low molecular weight species across theinterface, was described with a kinetic model.
Little experimental work has been done to the viscoelas-tic properties of pure polymer-polymer interfaces. Most ofthe work involves polymer blends compatibilized with somesurfactant and subjected to oscillatory shear flow so the vis-coelastic interfacial properties could be estimated by usingthe Palierne model �for a review see Ref. 20�. None of thesestudies have included the effect of diffusion on the viscoelas-tic interfacial behavior. We report here the experimental re-sults of non-Newtonian behavior of a diffuse polymer-polymer interface.
In this work, we investigate the transient behavior of theinterfacial properties of polymer combinations with small,but still not zero, mutual solubility. The goal is to estimatethe time and length scale of the diffusion around a drop andto investigate the response of the diffuse layer to small dila-tational deformations of the drop surface. All measurementare done on a pendant/sessile drop apparatus. The results areinterpreted in terms of a diffuse interface with a thickness��t� and for two simple rheological models it is examined ifthey can describe the oscillatory results.
II. DILATATIONAL INTERFACIAL RHEOLOGY OFDIFFUSE INTERFACES
In the following we will focus on a rheological descrip-tion, rather than an “adsorption-desorption” description, of adiffuse interface subjected to oscillatory dilatational/compressional deformation. The reason for this is that it isnot possible to consider a diffuse interface layer as a discretetwo-dimensional �2D� layer where specific species �i.e., mol-ecules� set. Moreover, because the polydispersity causes dif-ferent concentration profiles for different fractions of the mo-lecular weight distribution, it is also not possible to defineone specific concentration. We should instead rather think interms of an averaged concentration.
Interfacial rheology21 is based on the well known bulkrheology22 and has been developed to describe the kinetics ofadsorption/desorption of surfactants and the rheological be-havior of adsorbed interface layers. The main differences be-tween the 2D interfacial and 3D bulk rheology is that theformer deals with open systems that are, in general, com-pressible. During dilatation/compression of a soluble adsorp-tion layer adsorption/desorption can take place. Analogous,during dilatation/compression of a diffuse polymer-polymerinterface a compression/expansion of the concentration pro-file in the direction perpendicular to the interface takes place.
In addition, during this deformation a flux of molecules intoor out of the diffuse layer can be initiated to restore theequilibrium thickness of deformed layer. The overall evolu-tion of the concentration profile is a superposition of thesetwo opposing processes.23 The deformation of a diffuse in-terface gives rise to excess elastic and viscous stresses, re-lated to the response of the changing interfacial tension �.Both the elastic and the viscous contributions can be affectedby diffusion, depending on the ratio of the characteristic de-formation and diffusion times.
A. Radial oscillatory expansion/contraction of asessile/pendant drop
The pendant/sessile drop technique24 allows for nearlyisotropic area changes by changing the volume of a drophanging or sitting at the tip of a capillary. The advantage ofthis method is that no flow perpendicular to the interface hasto be taken into account. During the area oscillations thedrop shape is recorded and analyzed as a function of timeusing an image analyzing system. From this data the interfa-cial tension response function can be calculated using Fou-rier analysis.24
The dilatational interfacial viscoelastic modulus E is de-fined as the change in the interfacial tension � as a functionof the interfacial area A, which is subjected to a dilatation ora compression:
E =d�
d ln A/A0. �1�
For oscillatory area change �for convenience in complex no-tation�:
�A�t� = A�t� − A0 = �A0 exp�i�t� , �2�
where A0 is the initial or the equilibrium area, �A0 and � arethe amplitude and frequency of the area oscillations, respec-tively. In this complex form of the oscillatory area changethe physical meaning is kept by the imaginary part. In caseof a linear response of the interfacial tension to the oscilla-tory area change, i.e., restriction to relatively small deforma-tion �a few percent�, the frequency is the same and ��t� canbe written as
���t� = ��t� − �0 = ��0 exp�i�t + i�� , �3�
where �0 is the initial or equilibrium interfacial tension,��0��� is the amplitude of the interfacial tension, and ����the phase angle between the area oscillations and the inter-facial tension oscillations. Then the dilatational modulus Ecan be conveniently written as
E = E���� + i�d���� = E���� + iE���� = E0 exp�i�� , �4�
with
E0 = �E�2 + E�2�1/2, tan��� =E�
E�, �5�
where E� is the dilatational elasticity or �in phase� dilata-tional modulus, E� is the �out phase� dilatational loss modu-lus �in analogy with the terminology in bulk rheology�. Thedilatational loss modulus is related to the dilatational viscos-
104901-2 Peters, Zdravkov, and Meijer J. Chem. Phys. 122, 104901 �2005�
Downloaded 15 Apr 2005 to 131.155.54.18. Redistribution subject to AIP license or copyright, see http://jcp.aip.org/jcp/copyright.jsp
ity by E�=�d�. The dilatational viscosity contains all relax-ation processes, i.e., intrinsic viscosity and, in this case, dif-fusion effects. The intrinsic elasticity and viscosity can, inprinciple, be separated from the apparent ones �due to diffu-sion� by applying an oscillatory interface deformation withperiod �T=2� /�� much smaller than the characteristic relax-ation time determined by the diffusion.
Combining Eqs. �1�–�4�, after simple transformations thefollowing relationship between ���t�, E�, and �d can be de-fined:
���t� = E���t� + �d��t� , �6�
where ��t�=ln�A�t� /A0� is the deformation and ��t�= A�t� /A is the rate of deformation. From the periodic signalsA�t� and ��t� provided by pendant/sessile drop apparatus, thein and out of phase contributions, E� and �d, respectively,can be calculated. The range of oscillations that can be ap-plied is limited to relatively small frequency, ��0–0.3 s−1
and small amplitudes, ��0–0.05. The former is determinedby the bulk viscosity of the materials while the latter is nec-essary in order to stay in the linear regime.
B. Models for the apparent dilatational elasticity andviscosity
The dependency of the dilatational elastic modulus andthe dilatational loss modulus on the oscillatory deformationfrequency is not known for systems with a diffuse interfacelayer. However, for diffusive systems with surfactants, theapproach based on a Fickian diffusion does give such a re-lation and, hereafter, it will be investigated to what extendthis relation �qualitatively� is applicable to diffuse interface.For a diffusion model with one characteristic time constantthe in phase and out of phase dilatational moduli are givenby
E���� = E01 + ��0/�
1 + 2��0/� + 2�0/�, �7�
and
E���� = E0
��0/�
1 + 2��0/� + 2�0/�, �8�
respectively,25,26 where �0 is a material parameter related toa characteristic diffusion relaxation time of the system underconsideration.
For fast deformations, i.e., a time period much shorterthan the specific diffusion time ���0�, diffusion does notchange the composition of the diffused layer, and a Kelvinmodel with a constant elastic modulus �equivalent to Ma-rangoni elasticity� and a constant intrinsic viscosity �ifpresent� applies �Eq. �6��. For slow deformations, i.e., a pe-riod of time much longer than a specific diffusion time ���0�, the changes in the surface tension should be pureviscous if diffusion is the only acting process, i.e., no Gibbselasticity is present, and, if no intrinsic viscosity is present,these changes should go to zero for a decreasing deformationfrequency.
Notice that E�, according to Eq. �8�, has a maximum,E�=0.21E0 for �=2�0. So, if such a one-mode model ap-plies and the experimental results for E� show this maximumit is easy to determine the parameters, E0 and �0.
In case of multiple diffusion processes that take place atthe same time and do not interfere with each other, a multi-mode model can be used, i.e., E�=�Ei�; E�=�Ei�, where forevery Ei� and Ei� Eqs. �7� and �8� apply with characteristicmaterial parameters E0,i and �0,i.
Another phenomenological approach that can be taken isto adopt the basic model for stress relaxation process in bulkrheology, the Maxwell model. In this case the one-mode ver-sion model reads:
E� = E0��/�0�2
1 + ��/�0�2, �9�
and
E� = E0�/�0
1 + ��/�0�2. �10�
Again, for a one-mode model, E� has a maximum, E�=0.5E0 for �=�0. In this case a multimode version reads:
E� =�i
E0,i��/�0,i�2
1 + ��/�0,i�2, �11�
E� =�i
E0,i�/�0,i
1 + ��/�0,i�2, �12�
in which every mode again has its own characteristic mate-rial parameters E0,i and �0,i. The results in this work will beinterpreted in terms of an effective diffuse layer thickness �as defined in the theory of diffuse interfaces.27,28 Within thisapproach the interfacial tension is inversely proportional tothis thickness, i.e., ��1/�. When the diffusion does not playa role, i.e., when deformations are fast, the layer thickness isrelated to the surface area by conservation of the volume,�0A0=�A, and thus, the dilatational elasticity too �see Eq.�6��. This implies that the long term behavior of the dilata-tional elastic modulus, when measured with a high enoughfrequency, should follow the long term behavior of the inter-facial tension. In next sections results will be presented thatcome close to these cases.
III. METHODS AND MATERIALS
The polymers used for the drop phase were polybutene�PB, BP Chemicals, UK�, polyisobutylene �PIB, Infineum,UK�, and polybutadiene �PBD, Aldrich�. For the bulk phasepolydimethylsiloxane �PDMS, United Chemical, USA� wasused. The polymers were chosen such that a broad range ofinterfacial properties were covered by varying the asymme-try in molecular weight across the interface. Their numberaverage molecular weight Mn and molecular weights poly-dispersity Mn /Mw are given in Table I. All materials wereused as supplied.
The zero shear viscosities ��d for the dispersed phaseand �c for the continuous phase� were measured using arotational viscometer �Rheometrics, ARES� using a plate-
104901-3 Diffuse polymer-polymer interfaces J. Chem. Phys. 122, 104901 �2005�
Downloaded 15 Apr 2005 to 131.155.54.18. Redistribution subject to AIP license or copyright, see http://jcp.aip.org/jcp/copyright.jsp
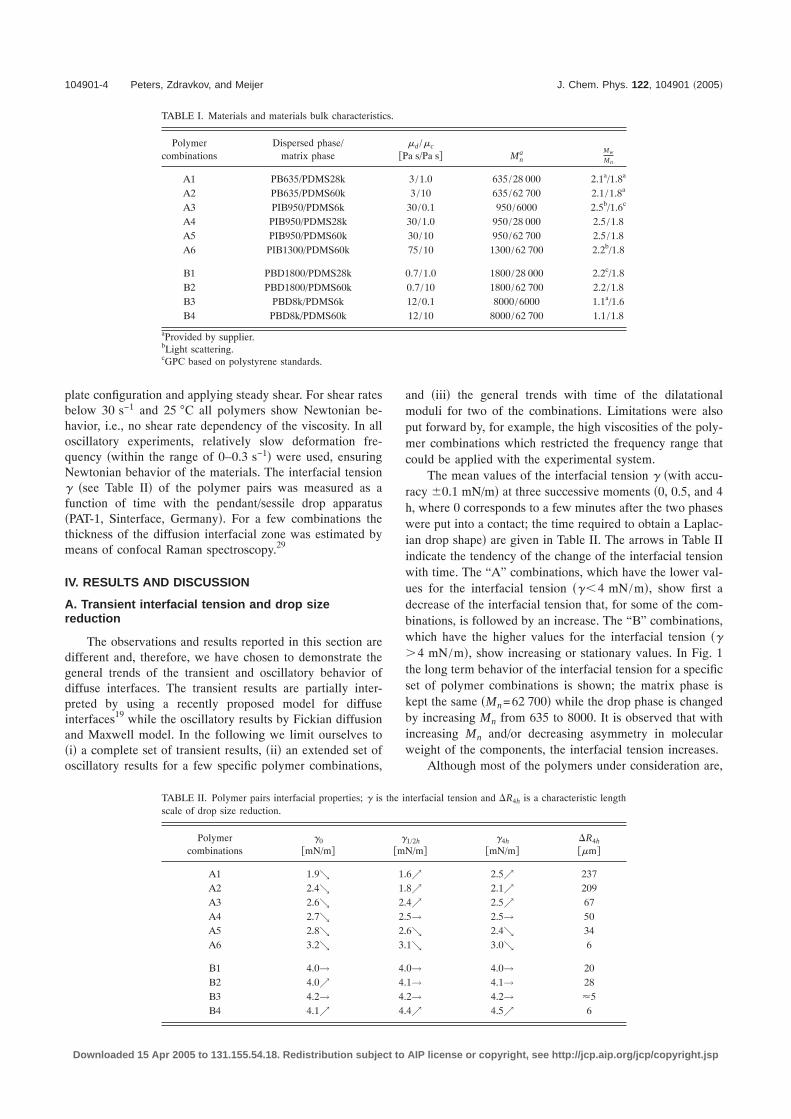
plate configuration and applying steady shear. For shear ratesbelow 30 s−1 and 25 °C all polymers show Newtonian be-havior, i.e., no shear rate dependency of the viscosity. In alloscillatory experiments, relatively slow deformation fre-quency �within the range of 0–0.3 s−1� were used, ensuringNewtonian behavior of the materials. The interfacial tension� �see Table II� of the polymer pairs was measured as afunction of time with the pendant/sessile drop apparatus�PAT-1, Sinterface, Germany�. For a few combinations thethickness of the diffusion interfacial zone was estimated bymeans of confocal Raman spectroscopy.29
IV. RESULTS AND DISCUSSION
A. Transient interfacial tension and drop sizereduction
The observations and results reported in this section aredifferent and, therefore, we have chosen to demonstrate thegeneral trends of the transient and oscillatory behavior ofdiffuse interfaces. The transient results are partially inter-preted by using a recently proposed model for diffuseinterfaces19 while the oscillatory results by Fickian diffusionand Maxwell model. In the following we limit ourselves to�i� a complete set of transient results, �ii� an extended set ofoscillatory results for a few specific polymer combinations,
and �iii� the general trends with time of the dilatationalmoduli for two of the combinations. Limitations were alsoput forward by, for example, the high viscosities of the poly-mer combinations which restricted the frequency range thatcould be applied with the experimental system.
The mean values of the interfacial tension � �with accu-racy 0.1 mN/m� at three successive moments �0, 0.5, and 4h, where 0 corresponds to a few minutes after the two phaseswere put into a contact; the time required to obtain a Laplac-ian drop shape� are given in Table II. The arrows in Table IIindicate the tendency of the change of the interfacial tensionwith time. The “A” combinations, which have the lower val-ues for the interfacial tension ���4 mN/m�, show first adecrease of the interfacial tension that, for some of the com-binations, is followed by an increase. The “B” combinations,which have the higher values for the interfacial tension ���4 mN/m�, show increasing or stationary values. In Fig. 1the long term behavior of the interfacial tension for a specificset of polymer combinations is shown; the matrix phase iskept the same �Mn=62 700� while the drop phase is changedby increasing Mn from 635 to 8000. It is observed that withincreasing Mn and/or decreasing asymmetry in molecularweight of the components, the interfacial tension increases.
Although most of the polymers under consideration are,
TABLE I. Materials and materials bulk characteristics.
Polymercombinations
Dispersed phase/matrix phase
�d /�c
�Pa s/Pa s� Mna Mw
Mn
A1 PB635/PDMS28k 3/1.0 635/28 000 2.1a/1.8a
A2 PB635/PDMS60k 3/10 635/62 700 2.1/1.8a
A3 PIB950/PDMS6k 30/0.1 950/6000 2.5b/1.6c
A4 PIB950/PDMS28k 30/1.0 950/28 000 2.5/1.8A5 PIB950/PDMS60k 30/10 950/62 700 2.5/1.8A6 PIB1300/PDMS60k 75/10 1300/62 700 2.2b/1.8
B1 PBD1800/PDMS28k 0.7/1.0 1800/28 000 2.2c/1.8B2 PBD1800/PDMS60k 0.7/10 1800/62 700 2.2/1.8B3 PBD8k/PDMS6k 12/0.1 8000/6000 1.1a/1.6B4 PBD8k/PDMS60k 12/10 8000/62 700 1.1/1.8
aProvided by supplier.bLight scattering.cGPC based on polystyrene standards.
TABLE II. Polymer pairs interfacial properties; � is the interfacial tension and �R4h is a characteristic lengthscale of drop size reduction.
Polymercombinations
�0�mN/m�
�1/2h
�mN/m��4h
�mN/m��R4h
��m�
A1 1.9↘ 1.6↗ 2.5↗ 237A2 2.4↘ 1.8↗ 2.1↗ 209A3 2.6↘ 2.4↗ 2.5↗ 67A4 2.7↘ 2.5→ 2.5→ 50A5 2.8↘ 2.6↘ 2.4↘ 34A6 3.2↘ 3.1↘ 3.0↘ 6
B1 4.0→ 4.0→ 4.0→ 20B2 4.0↗ 4.1→ 4.1→ 28B3 4.2→ 4.2→ 4.2→ �5B4 4.1↗ 4.4↗ 4.5↗ 6
104901-4 Peters, Zdravkov, and Meijer J. Chem. Phys. 122, 104901 �2005�
Downloaded 15 Apr 2005 to 131.155.54.18. Redistribution subject to AIP license or copyright, see http://jcp.aip.org/jcp/copyright.jsp
in the literature, assumed as immiscible, the decay and theincrease of the transient interfacial tension as seen in Fig. 1and in Table II can be explained by mutual diffusion. Forapolar/apolar interactions between polymers, the interfacialproperties mainly depend on the asymmetry across the inter-face �i.e., the molecular weight difference�, the average mo-lecular weight and the polydispersity of both phases. Thepolydispersity of the materials contributes to the interfaceformation since the mutual solubility is enhanced. First, be-cause the asymmetry across the interface is enlarged and,second, because the small molecules diffuse faster than thelarge ones. However, the polymer combinations were chosenin such way that they have similar polydispersity. Therefore,the effect of the polydispersity will not be discussed exten-sively hereafter.
The change of the drop volume after 4 h was used todefine a characteristic length scale, �R4h=V0
1/3−V4h1/3 �see
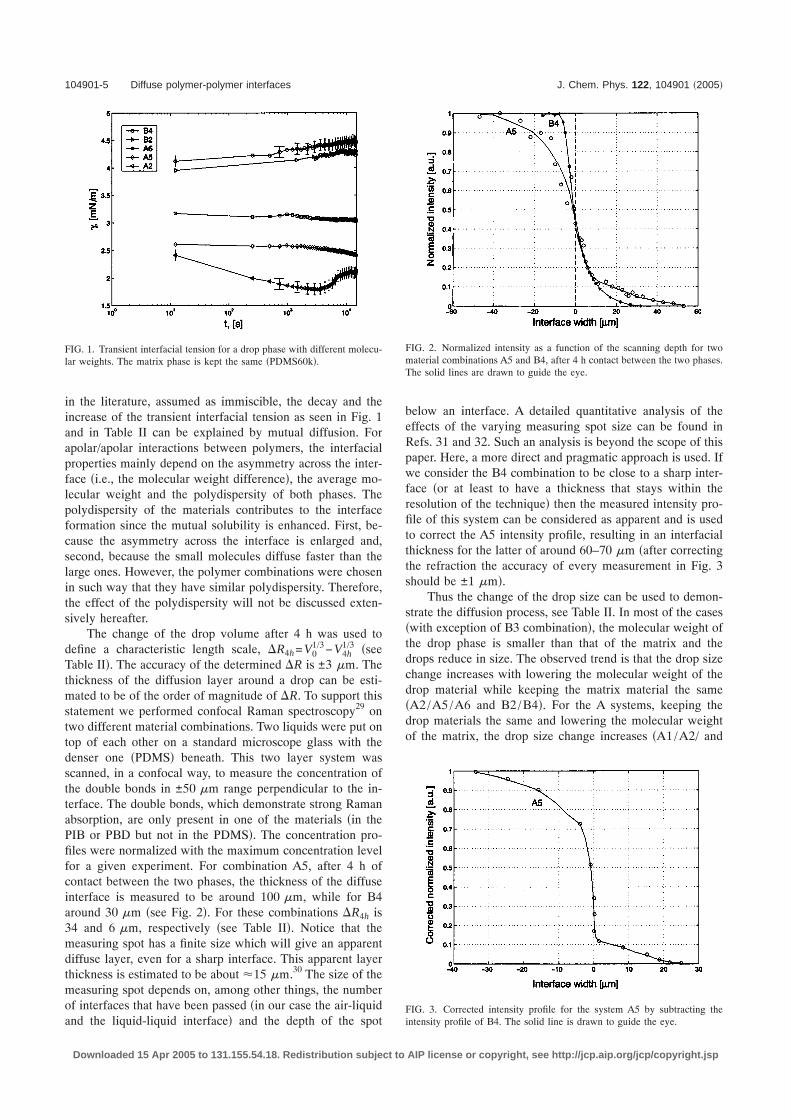
Table II�. The accuracy of the determined �R is ±3 �m. Thethickness of the diffusion layer around a drop can be esti-mated to be of the order of magnitude of �R. To support thisstatement we performed confocal Raman spectroscopy29 ontwo different material combinations. Two liquids were put ontop of each other on a standard microscope glass with thedenser one �PDMS� beneath. This two layer system wasscanned, in a confocal way, to measure the concentration ofthe double bonds in ±50 �m range perpendicular to the in-terface. The double bonds, which demonstrate strong Ramanabsorption, are only present in one of the materials �in thePIB or PBD but not in the PDMS�. The concentration pro-files were normalized with the maximum concentration levelfor a given experiment. For combination A5, after 4 h ofcontact between the two phases, the thickness of the diffuseinterface is measured to be around 100 �m, while for B4around 30 �m �see Fig. 2�. For these combinations �R4h is34 and 6 �m, respectively �see Table II�. Notice that themeasuring spot has a finite size which will give an apparentdiffuse layer, even for a sharp interface. This apparent layerthickness is estimated to be about �15 �m.30 The size of themeasuring spot depends on, among other things, the numberof interfaces that have been passed �in our case the air-liquidand the liquid-liquid interface� and the depth of the spot
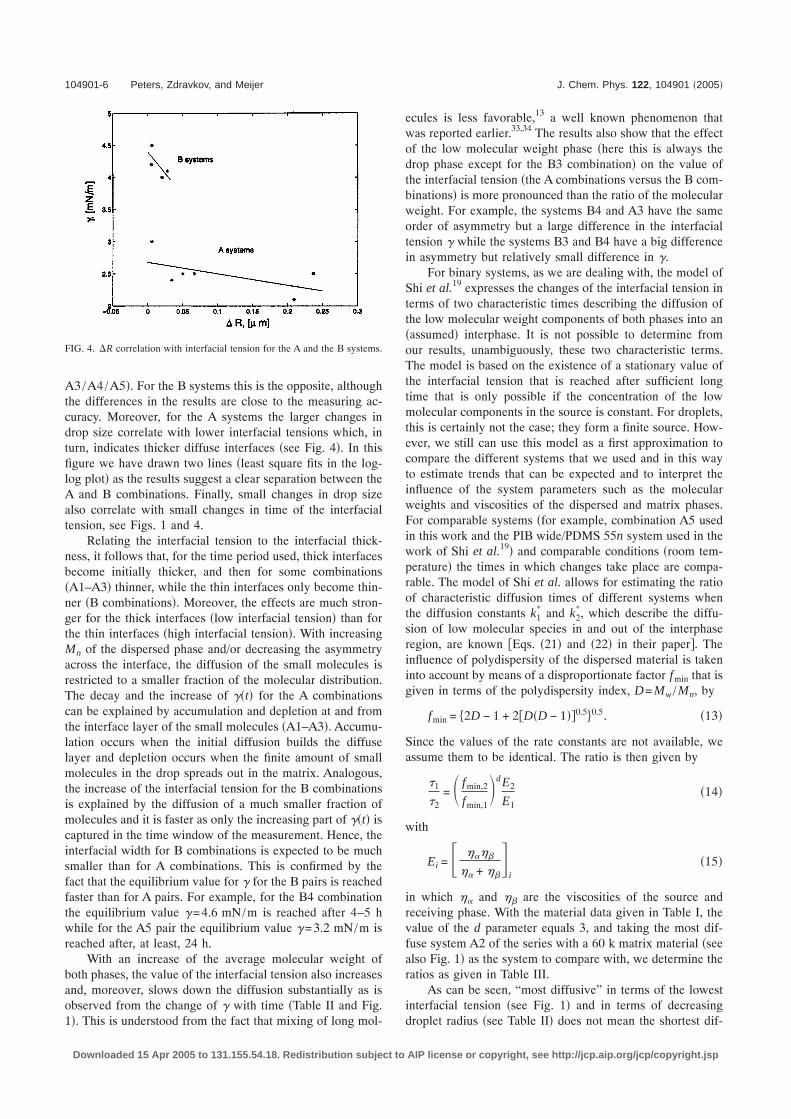
below an interface. A detailed quantitative analysis of theeffects of the varying measuring spot size can be found inRefs. 31 and 32. Such an analysis is beyond the scope of thispaper. Here, a more direct and pragmatic approach is used. Ifwe consider the B4 combination to be close to a sharp inter-face �or at least to have a thickness that stays within theresolution of the technique� then the measured intensity pro-file of this system can be considered as apparent and is usedto correct the A5 intensity profile, resulting in an interfacialthickness for the latter of around 60–70 �m �after correctingthe refraction the accuracy of every measurement in Fig. 3should be ±1 �m�.
Thus the change of the drop size can be used to demon-strate the diffusion process, see Table II. In most of the cases�with exception of B3 combination�, the molecular weight ofthe drop phase is smaller than that of the matrix and thedrops reduce in size. The observed trend is that the drop sizechange increases with lowering the molecular weight of thedrop material while keeping the matrix material the same�A2/A5/A6 and B2/B4�. For the A systems, keeping thedrop materials the same and lowering the molecular weightof the matrix, the drop size change increases �A1/A2/ and
FIG. 1. Transient interfacial tension for a drop phase with different molecu-lar weights. The matrix phase is kept the same �PDMS60k�.
FIG. 2. Normalized intensity as a function of the scanning depth for twomaterial combinations A5 and B4, after 4 h contact between the two phases.The solid lines are drawn to guide the eye.
FIG. 3. Corrected intensity profile for the system A5 by subtracting theintensity profile of B4. The solid line is drawn to guide the eye.
104901-5 Diffuse polymer-polymer interfaces J. Chem. Phys. 122, 104901 �2005�
Downloaded 15 Apr 2005 to 131.155.54.18. Redistribution subject to AIP license or copyright, see http://jcp.aip.org/jcp/copyright.jsp
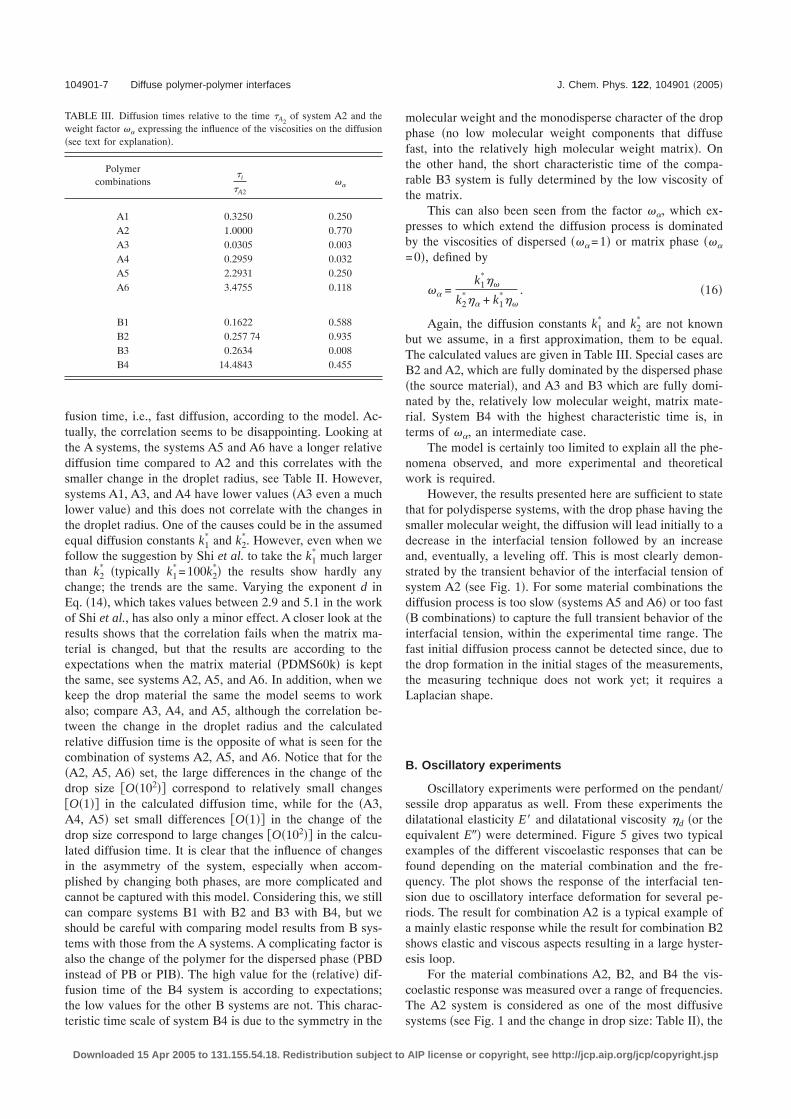
A3/A4/A5�. For the B systems this is the opposite, althoughthe differences in the results are close to the measuring ac-curacy. Moreover, for the A systems the larger changes indrop size correlate with lower interfacial tensions which, inturn, indicates thicker diffuse interfaces �see Fig. 4�. In thisfigure we have drawn two lines �least square fits in the log-log plot� as the results suggest a clear separation between theA and B combinations. Finally, small changes in drop sizealso correlate with small changes in time of the interfacialtension, see Figs. 1 and 4.
Relating the interfacial tension to the interfacial thick-ness, it follows that, for the time period used, thick interfacesbecome initially thicker, and then for some combinations�A1–A3� thinner, while the thin interfaces only become thin-ner �B combinations�. Moreover, the effects are much stron-ger for the thick interfaces �low interfacial tension� than forthe thin interfaces �high interfacial tension�. With increasingMn of the dispersed phase and/or decreasing the asymmetryacross the interface, the diffusion of the small molecules isrestricted to a smaller fraction of the molecular distribution.The decay and the increase of ��t� for the A combinationscan be explained by accumulation and depletion at and fromthe interface layer of the small molecules �A1–A3�. Accumu-lation occurs when the initial diffusion builds the diffuselayer and depletion occurs when the finite amount of smallmolecules in the drop spreads out in the matrix. Analogous,the increase of the interfacial tension for the B combinationsis explained by the diffusion of a much smaller fraction ofmolecules and it is faster as only the increasing part of ��t� iscaptured in the time window of the measurement. Hence, theinterfacial width for B combinations is expected to be muchsmaller than for A combinations. This is confirmed by thefact that the equilibrium value for � for the B pairs is reachedfaster than for A pairs. For example, for the B4 combinationthe equilibrium value �=4.6 mN/m is reached after 4–5 hwhile for the A5 pair the equilibrium value �=3.2 mN/m isreached after, at least, 24 h.
With an increase of the average molecular weight ofboth phases, the value of the interfacial tension also increasesand, moreover, slows down the diffusion substantially as isobserved from the change of � with time �Table II and Fig.1�. This is understood from the fact that mixing of long mol-
ecules is less favorable,13 a well known phenomenon thatwas reported earlier.33,34 The results also show that the effectof the low molecular weight phase �here this is always thedrop phase except for the B3 combination� on the value ofthe interfacial tension �the A combinations versus the B com-binations� is more pronounced than the ratio of the molecularweight. For example, the systems B4 and A3 have the sameorder of asymmetry but a large difference in the interfacialtension � while the systems B3 and B4 have a big differencein asymmetry but relatively small difference in �.
For binary systems, as we are dealing with, the model ofShi et al.19 expresses the changes of the interfacial tension interms of two characteristic times describing the diffusion ofthe low molecular weight components of both phases into an�assumed� interphase. It is not possible to determine fromour results, unambiguously, these two characteristic terms.The model is based on the existence of a stationary value ofthe interfacial tension that is reached after sufficient longtime that is only possible if the concentration of the lowmolecular components in the source is constant. For droplets,this is certainly not the case; they form a finite source. How-ever, we still can use this model as a first approximation tocompare the different systems that we used and in this wayto estimate trends that can be expected and to interpret theinfluence of the system parameters such as the molecularweights and viscosities of the dispersed and matrix phases.For comparable systems �for example, combination A5 usedin this work and the PIB wide/PDMS 55n system used in thework of Shi et al.19� and comparable conditions �room tem-perature� the times in which changes take place are compa-rable. The model of Shi et al. allows for estimating the ratioof characteristic diffusion times of different systems whenthe diffusion constants k1
* and k2*, which describe the diffu-
sion of low molecular species in and out of the interphaseregion, are known �Eqs. �21� and �22� in their paper�. Theinfluence of polydispersity of the dispersed material is takeninto account by means of a disproportionate factor fmin that isgiven in terms of the polydispersity index, D=Mw /Mn, by
fmin = 2D − 1 + 2�D�D − 1��0.50.5. �13�
Since the values of the rate constants are not available, weassume them to be identical. The ratio is then given by
�1�2= � fmin,2
fmin,1�dE2
E1�14�
with
Ei = ����
�� + ���
i
�15�
in which �� and �� are the viscosities of the source andreceiving phase. With the material data given in Table I, thevalue of the d parameter equals 3, and taking the most dif-fuse system A2 of the series with a 60 k matrix material �seealso Fig. 1� as the system to compare with, we determine theratios as given in Table III.
As can be seen, “most diffusive” in terms of the lowestinterfacial tension �see Fig. 1� and in terms of decreasingdroplet radius �see Table II� does not mean the shortest dif-
FIG. 4. �R correlation with interfacial tension for the A and the B systems.
104901-6 Peters, Zdravkov, and Meijer J. Chem. Phys. 122, 104901 �2005�
Downloaded 15 Apr 2005 to 131.155.54.18. Redistribution subject to AIP license or copyright, see http://jcp.aip.org/jcp/copyright.jsp
fusion time, i.e., fast diffusion, according to the model. Ac-tually, the correlation seems to be disappointing. Looking atthe A systems, the systems A5 and A6 have a longer relativediffusion time compared to A2 and this correlates with thesmaller change in the droplet radius, see Table II. However,systems A1, A3, and A4 have lower values �A3 even a muchlower value� and this does not correlate with the changes inthe droplet radius. One of the causes could be in the assumedequal diffusion constants k1
* and k2*. However, even when we
follow the suggestion by Shi et al. to take the k1* much larger
than k2* �typically k1
*=100k2*� the results show hardly any
change; the trends are the same. Varying the exponent d inEq. �14�, which takes values between 2.9 and 5.1 in the workof Shi et al., has also only a minor effect. A closer look at theresults shows that the correlation fails when the matrix ma-terial is changed, but that the results are according to theexpectations when the matrix material �PDMS60k� is keptthe same, see systems A2, A5, and A6. In addition, when wekeep the drop material the same the model seems to workalso; compare A3, A4, and A5, although the correlation be-tween the change in the droplet radius and the calculatedrelative diffusion time is the opposite of what is seen for thecombination of systems A2, A5, and A6. Notice that for the�A2, A5, A6� set, the large differences in the change of thedrop size �O�102�� correspond to relatively small changes�O�1�� in the calculated diffusion time, while for the �A3,A4, A5� set small differences �O�1�� in the change of thedrop size correspond to large changes �O�102�� in the calcu-lated diffusion time. It is clear that the influence of changesin the asymmetry of the system, especially when accom-plished by changing both phases, are more complicated andcannot be captured with this model. Considering this, we stillcan compare systems B1 with B2 and B3 with B4, but weshould be careful with comparing model results from B sys-tems with those from the A systems. A complicating factor isalso the change of the polymer for the dispersed phase �PBDinstead of PB or PIB�. The high value for the �relative� dif-fusion time of the B4 system is according to expectations;the low values for the other B systems are not. This charac-teristic time scale of system B4 is due to the symmetry in the
molecular weight and the monodisperse character of the dropphase �no low molecular weight components that diffusefast, into the relatively high molecular weight matrix�. Onthe other hand, the short characteristic time of the compa-rable B3 system is fully determined by the low viscosity ofthe matrix.
This can also been seen from the factor ��, which ex-presses to which extend the diffusion process is dominatedby the viscosities of dispersed ���=1� or matrix phase ���
=0�, defined by
�� =k1*��
k2*�� + k1
*��
. �16�
Again, the diffusion constants k1* and k2
* are not knownbut we assume, in a first approximation, them to be equal.The calculated values are given in Table III. Special cases areB2 and A2, which are fully dominated by the dispersed phase�the source material�, and A3 and B3 which are fully domi-nated by the, relatively low molecular weight, matrix mate-rial. System B4 with the highest characteristic time is, interms of ��, an intermediate case.
The model is certainly too limited to explain all the phe-nomena observed, and more experimental and theoreticalwork is required.
However, the results presented here are sufficient to statethat for polydisperse systems, with the drop phase having thesmaller molecular weight, the diffusion will lead initially to adecrease in the interfacial tension followed by an increaseand, eventually, a leveling off. This is most clearly demon-strated by the transient behavior of the interfacial tension ofsystem A2 �see Fig. 1�. For some material combinations thediffusion process is too slow �systems A5 and A6� or too fast�B combinations� to capture the full transient behavior of theinterfacial tension, within the experimental time range. Thefast initial diffusion process cannot be detected since, due tothe drop formation in the initial stages of the measurements,the measuring technique does not work yet; it requires aLaplacian shape.
B. Oscillatory experiments
Oscillatory experiments were performed on the pendant/sessile drop apparatus as well. From these experiments thedilatational elasticity E� and dilatational viscosity �d �or theequivalent E�� were determined. Figure 5 gives two typicalexamples of the different viscoelastic responses that can befound depending on the material combination and the fre-quency. The plot shows the response of the interfacial ten-sion due to oscillatory interface deformation for several pe-riods. The result for combination A2 is a typical example ofa mainly elastic response while the result for combination B2shows elastic and viscous aspects resulting in a large hyster-esis loop.
For the material combinations A2, B2, and B4 the vis-coelastic response was measured over a range of frequencies.The A2 system is considered as one of the most diffusivesystems �see Fig. 1 and the change in drop size: Table II�, the
TABLE III. Diffusion times relative to the time �A2of system A2 and the
weight factor �� expressing the influence of the viscosities on the diffusion�see text for explanation�.
Polymercombinations
�i
�A2��
A1 0.3250 0.250A2 1.0000 0.770A3 0.0305 0.003A4 0.2959 0.032A5 2.2931 0.250A6 3.4755 0.118
B1 0.1622 0.588B2 0.257 74 0.935B3 0.2634 0.008B4 14.4843 0.455
104901-7 Diffuse polymer-polymer interfaces J. Chem. Phys. 122, 104901 �2005�
Downloaded 15 Apr 2005 to 131.155.54.18. Redistribution subject to AIP license or copyright, see http://jcp.aip.org/jcp/copyright.jsp
B2 and B4 systems as medium and little diffusive, where B4has also the special property of a nearly monodisperse dropphase.
For all results presented here the deformation amplitudewas in the linear range. The range of linearity of the responsewas checked by varying the amplitude. Some of the mea-surements were repeated to demonstrate the reproducibility.For all three systems the results show the expected trends fora diffusion controlled interfacial response.
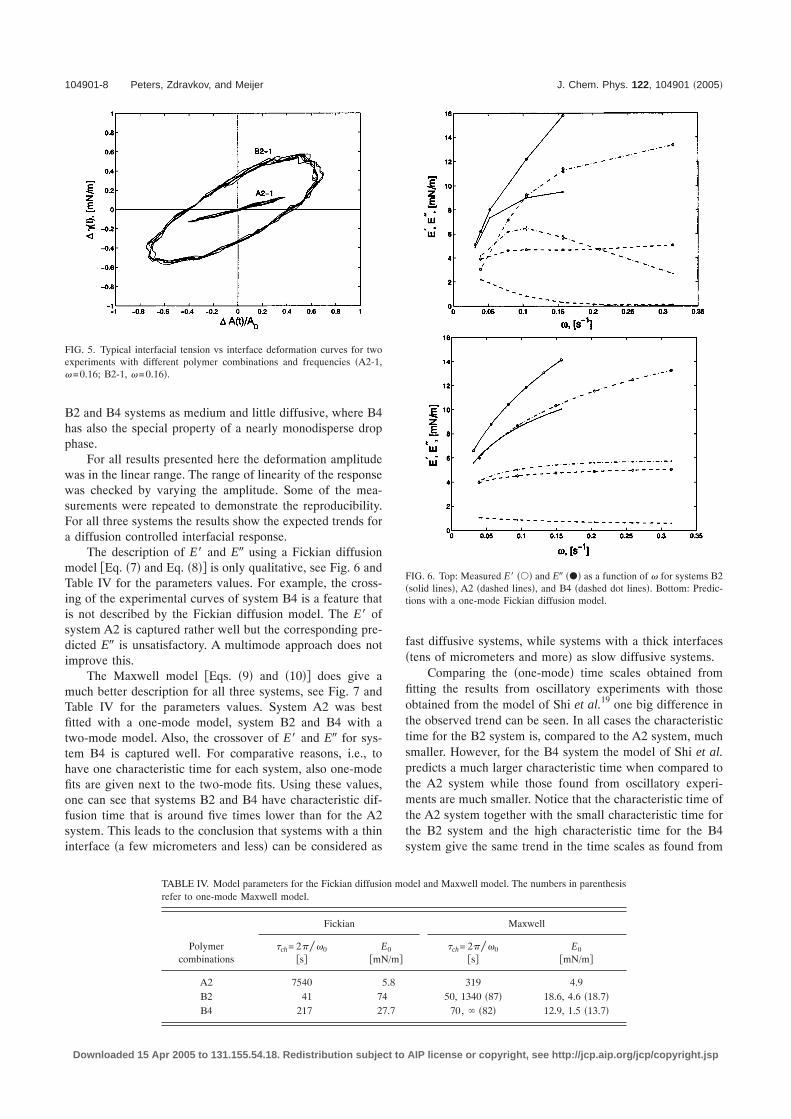
The description of E� and E� using a Fickian diffusionmodel �Eq. �7� and Eq. �8�� is only qualitative, see Fig. 6 andTable IV for the parameters values. For example, the cross-ing of the experimental curves of system B4 is a feature thatis not described by the Fickian diffusion model. The E� ofsystem A2 is captured rather well but the corresponding pre-dicted E� is unsatisfactory. A multimode approach does notimprove this.
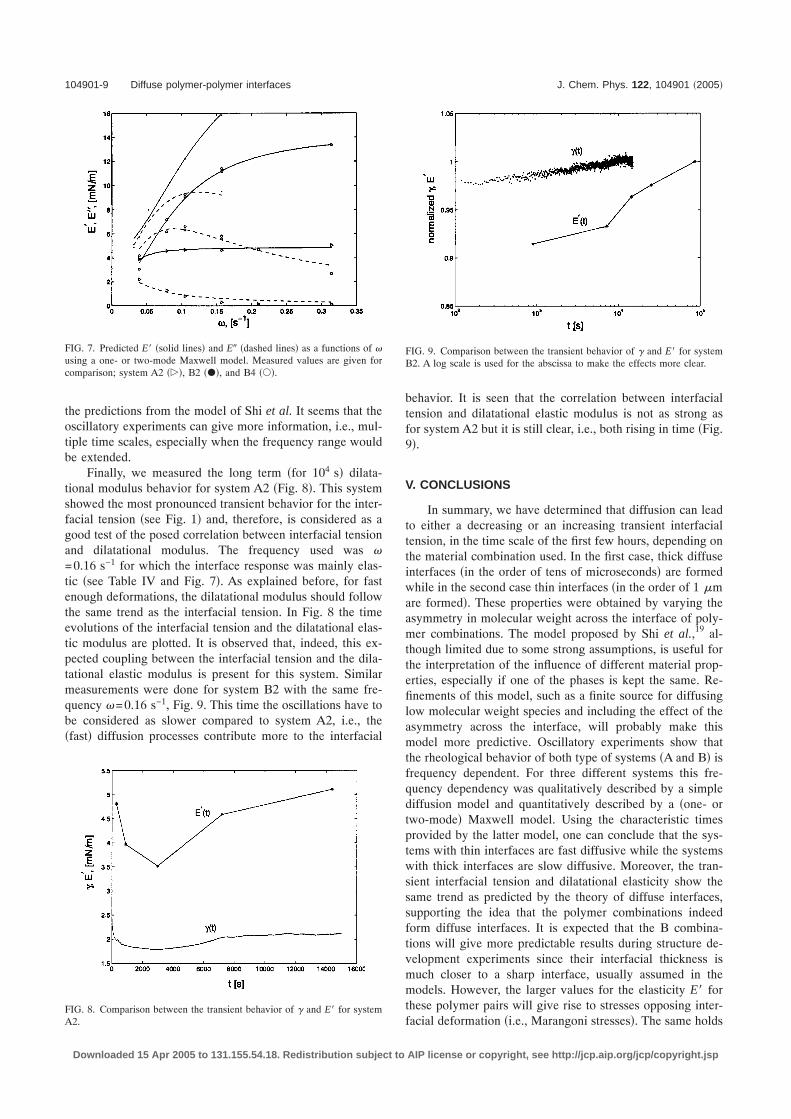
The Maxwell model �Eqs. �9� and �10�� does give amuch better description for all three systems, see Fig. 7 andTable IV for the parameters values. System A2 was bestfitted with a one-mode model, system B2 and B4 with atwo-mode model. Also, the crossover of E� and E� for sys-tem B4 is captured well. For comparative reasons, i.e., tohave one characteristic time for each system, also one-modefits are given next to the two-mode fits. Using these values,one can see that systems B2 and B4 have characteristic dif-fusion time that is around five times lower than for the A2system. This leads to the conclusion that systems with a thininterface �a few micrometers and less� can be considered as
fast diffusive systems, while systems with a thick interfaces�tens of micrometers and more� as slow diffusive systems.
Comparing the �one-mode� time scales obtained fromfitting the results from oscillatory experiments with thoseobtained from the model of Shi et al.19 one big difference inthe observed trend can be seen. In all cases the characteristictime for the B2 system is, compared to the A2 system, muchsmaller. However, for the B4 system the model of Shi et al.predicts a much larger characteristic time when compared tothe A2 system while those found from oscillatory experi-ments are much smaller. Notice that the characteristic time ofthe A2 system together with the small characteristic time forthe B2 system and the high characteristic time for the B4system give the same trend in the time scales as found from
TABLE IV. Model parameters for the Fickian diffusion model and Maxwell model. The numbers in parenthesisrefer to one-mode Maxwell model.
Polymercombinations
Fickian Maxwell
�ch= 2���0
�s�E0
�mN/m��ch= 2���0
�s�E0
�mN/m�
A2 7540 5.8 319 4.9B2 41 74 50, 1340 �87� 18.6, 4.6 �18.7�B4 217 27.7 70, � �82� 12.9, 1.5 �13.7�
FIG. 6. Top: Measured E� ��� and E� ��� as a function of � for systems B2�solid lines�, A2 �dashed lines�, and B4 �dashed dot lines�. Bottom: Predic-tions with a one-mode Fickian diffusion model.
FIG. 5. Typical interfacial tension vs interface deformation curves for twoexperiments with different polymer combinations and frequencies �A2-1,�=0.16; B2-1, �=0.16�.
104901-8 Peters, Zdravkov, and Meijer J. Chem. Phys. 122, 104901 �2005�
Downloaded 15 Apr 2005 to 131.155.54.18. Redistribution subject to AIP license or copyright, see http://jcp.aip.org/jcp/copyright.jsp
the predictions from the model of Shi et al. It seems that theoscillatory experiments can give more information, i.e., mul-tiple time scales, especially when the frequency range wouldbe extended.
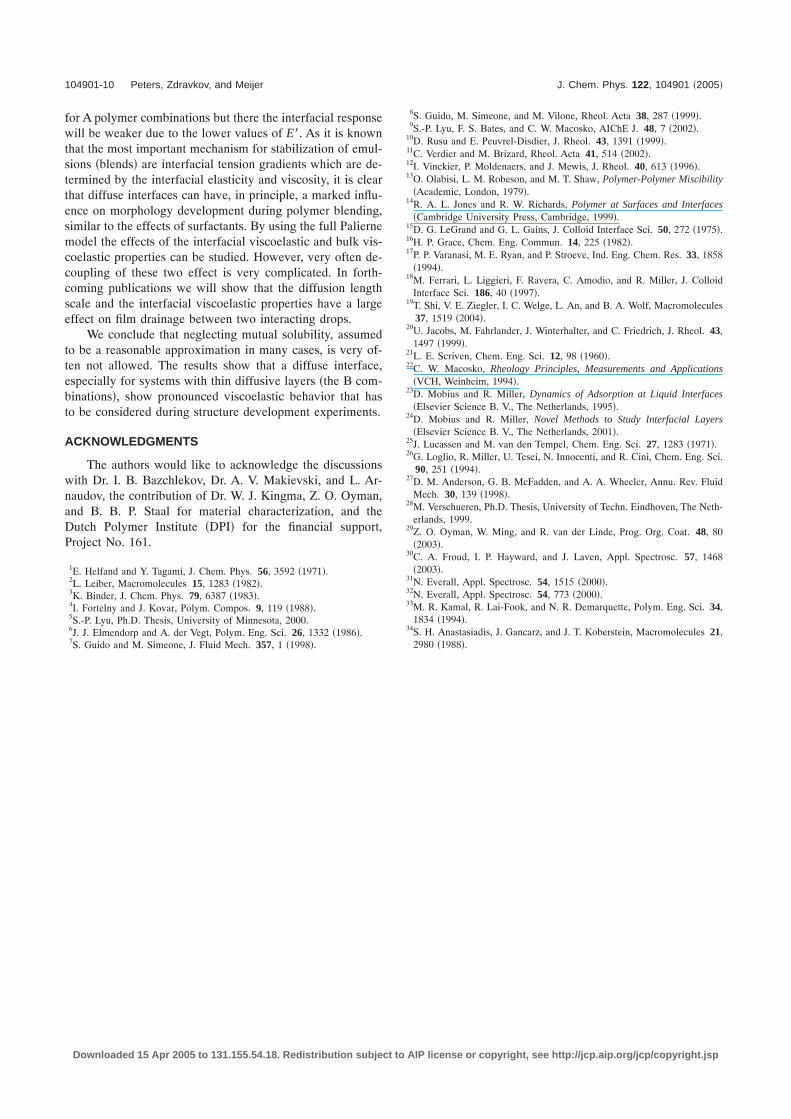
Finally, we measured the long term �for 104 s� dilata-tional modulus behavior for system A2 �Fig. 8�. This systemshowed the most pronounced transient behavior for the inter-facial tension �see Fig. 1� and, therefore, is considered as agood test of the posed correlation between interfacial tensionand dilatational modulus. The frequency used was �=0.16 s−1 for which the interface response was mainly elas-tic �see Table IV and Fig. 7�. As explained before, for fastenough deformations, the dilatational modulus should followthe same trend as the interfacial tension. In Fig. 8 the timeevolutions of the interfacial tension and the dilatational elas-tic modulus are plotted. It is observed that, indeed, this ex-pected coupling between the interfacial tension and the dila-tational elastic modulus is present for this system. Similarmeasurements were done for system B2 with the same fre-quency �=0.16 s−1, Fig. 9. This time the oscillations have tobe considered as slower compared to system A2, i.e., the�fast� diffusion processes contribute more to the interfacial
behavior. It is seen that the correlation between interfacialtension and dilatational elastic modulus is not as strong asfor system A2 but it is still clear, i.e., both rising in time �Fig.9�.
V. CONCLUSIONS
In summary, we have determined that diffusion can leadto either a decreasing or an increasing transient interfacialtension, in the time scale of the first few hours, depending onthe material combination used. In the first case, thick diffuseinterfaces �in the order of tens of microseconds� are formedwhile in the second case thin interfaces �in the order of 1 �mare formed�. These properties were obtained by varying theasymmetry in molecular weight across the interface of poly-mer combinations. The model proposed by Shi et al.,19 al-though limited due to some strong assumptions, is useful forthe interpretation of the influence of different material prop-erties, especially if one of the phases is kept the same. Re-finements of this model, such as a finite source for diffusinglow molecular weight species and including the effect of theasymmetry across the interface, will probably make thismodel more predictive. Oscillatory experiments show thatthe rheological behavior of both type of systems �A and B� isfrequency dependent. For three different systems this fre-quency dependency was qualitatively described by a simplediffusion model and quantitatively described by a �one- ortwo-mode� Maxwell model. Using the characteristic timesprovided by the latter model, one can conclude that the sys-tems with thin interfaces are fast diffusive while the systemswith thick interfaces are slow diffusive. Moreover, the tran-sient interfacial tension and dilatational elasticity show thesame trend as predicted by the theory of diffuse interfaces,supporting the idea that the polymer combinations indeedform diffuse interfaces. It is expected that the B combina-tions will give more predictable results during structure de-velopment experiments since their interfacial thickness ismuch closer to a sharp interface, usually assumed in themodels. However, the larger values for the elasticity E� forthese polymer pairs will give rise to stresses opposing inter-facial deformation �i.e., Marangoni stresses�. The same holds
FIG. 7. Predicted E� �solid lines� and E� �dashed lines� as a functions of �using a one- or two-mode Maxwell model. Measured values are given forcomparison; system A2 ���, B2 ���, and B4 ���.
FIG. 8. Comparison between the transient behavior of � and E� for systemA2.
FIG. 9. Comparison between the transient behavior of � and E� for systemB2. A log scale is used for the abscissa to make the effects more clear.
104901-9 Diffuse polymer-polymer interfaces J. Chem. Phys. 122, 104901 �2005�
Downloaded 15 Apr 2005 to 131.155.54.18. Redistribution subject to AIP license or copyright, see http://jcp.aip.org/jcp/copyright.jsp
for A polymer combinations but there the interfacial responsewill be weaker due to the lower values of E�. As it is knownthat the most important mechanism for stabilization of emul-sions �blends� are interfacial tension gradients which are de-termined by the interfacial elasticity and viscosity, it is clearthat diffuse interfaces can have, in principle, a marked influ-ence on morphology development during polymer blending,similar to the effects of surfactants. By using the full Paliernemodel the effects of the interfacial viscoelastic and bulk vis-coelastic properties can be studied. However, very often de-coupling of these two effect is very complicated. In forth-coming publications we will show that the diffusion lengthscale and the interfacial viscoelastic properties have a largeeffect on film drainage between two interacting drops.
We conclude that neglecting mutual solubility, assumedto be a reasonable approximation in many cases, is very of-ten not allowed. The results show that a diffuse interface,especially for systems with thin diffusive layers �the B com-binations�, show pronounced viscoelastic behavior that hasto be considered during structure development experiments.
ACKNOWLEDGMENTS
The authors would like to acknowledge the discussionswith Dr. I. B. Bazchlekov, Dr. A. V. Makievski, and L. Ar-naudov, the contribution of Dr. W. J. Kingma, Z. O. Oyman,and B. B. P. Staal for material characterization, and theDutch Polymer Institute �DPI� for the financial support,Project No. 161.
1E. Helfand and Y. Tagami, J. Chem. Phys. 56, 3592 �1971�.2L. Leiber, Macromolecules 15, 1283 �1982�.3K. Binder, J. Chem. Phys. 79, 6387 �1983�.4I. Fortelny and J. Kovar, Polym. Compos. 9, 119 �1988�.5S.-P. Lyu, Ph.D. Thesis, University of Minnesota, 2000.6J. J. Elmendorp and A. der Vegt, Polym. Eng. Sci. 26, 1332 �1986�.7S. Guido and M. Simeone, J. Fluid Mech. 357, 1 �1998�.
8S. Guido, M. Simeone, and M. Vilone, Rheol. Acta 38, 287 �1999�.9S.-P. Lyu, F. S. Bates, and C. W. Macosko, AIChE J. 48, 7 �2002�.10D. Rusu and E. Peuvrel-Disdier, J. Rheol. 43, 1391 �1999�.11C. Verdier and M. Brizard, Rheol. Acta 41, 514 �2002�.12I. Vinckier, P. Moldenaers, and J. Mewis, J. Rheol. 40, 613 �1996�.13O. Olabisi, L. M. Robeson, and M. T. Shaw, Polymer-Polymer Miscibility
�Academic, London, 1979�.14R. A. L. Jones and R. W. Richards, Polymer at Surfaces and Interfaces
�Cambridge University Press, Cambridge, 1999�.15D. G. LeGrand and G. L. Gains, J. Colloid Interface Sci. 50, 272 �1975�.16H. P. Grace, Chem. Eng. Commun. 14, 225 �1982�.17P. P. Varanasi, M. E. Ryan, and P. Stroeve, Ind. Eng. Chem. Res. 33, 1858
�1994�.18M. Ferrari, L. Liggieri, F. Ravera, C. Amodio, and R. Miller, J. ColloidInterface Sci. 186, 40 �1997�.
19T. Shi, V. E. Ziegler, I. C. Welge, L. An, and B. A. Wolf, Macromolecules37, 1519 �2004�.
20U. Jacobs, M. Fahrlander, J. Winterhalter, and C. Friedrich, J. Rheol. 43,1497 �1999�.
21L. E. Scriven, Chem. Eng. Sci. 12, 98 �1960�.22C. W. Macosko, Rheology Principles, Measurements and Applications
�VCH, Weinheim, 1994�.23D. Mobius and R. Miller, Dynamics of Adsorption at Liquid Interfaces
�Elsevier Science B. V., The Netherlands, 1995�.24D. Mobius and R. Miller, Novel Methods to Study Interfacial Layers
�Elsevier Science B. V., The Netherlands, 2001�.25J. Lucassen and M. van den Tempel, Chem. Eng. Sci. 27, 1283 �1971�.26G. Loglio, R. Miller, U. Tesei, N. Innocenti, and R. Cini, Chem. Eng. Sci.
90, 251 �1994�.27D. M. Anderson, G. B. McFadden, and A. A. Wheeler, Annu. Rev. FluidMech. 30, 139 �1998�.
28M. Verschueren, Ph.D. Thesis, University of Techn. Eindhoven, The Neth-erlands, 1999.
29Z. O. Oyman, W. Ming, and R. van der Linde, Prog. Org. Coat. 48, 80�2003�.
30C. A. Froud, I. P. Hayward, and J. Laven, Appl. Spectrosc. 57, 1468�2003�.
31N. Everall, Appl. Spectrosc. 54, 1515 �2000�.32N. Everall, Appl. Spectrosc. 54, 773 �2000�.33M. R. Kamal, R. Lai-Fook, and N. R. Demarquette, Polym. Eng. Sci. 34,1834 �1994�.
34S. H. Anastasiadis, J. Gancarz, and J. T. Koberstein, Macromolecules 21,2980 �1988�.
104901-10 Peters, Zdravkov, and Meijer J. Chem. Phys. 122, 104901 �2005�
Downloaded 15 Apr 2005 to 131.155.54.18. Redistribution subject to AIP license or copyright, see http://jcp.aip.org/jcp/copyright.jsp
Related Documents