Learning and Teaching Investment Fund final report Transforming learning and teaching with practical analytics Erika Beljaars-Harris, Howard Errey College of Design and Social Context 12 February 2016 Strategic objectives addressed: This project contributed to the achievement of the RMIT University 2011-15 Strategic Plan by addressing: • Priority 1. Transforming the student experience The project assisted with transforming the student experience by operationalising Priority 1, Enabler (i). Specifically, the project leveraged information and communication technology to improve online and blended learning to enhance student learning outcomes by collecting analytics (for early intervention, and then support academic staff to translate this into ongoing improvement of learning and teaching practice). • Priority 3. Determine and encourage best practice in program and curriculum design for delivery across RMIT’s tertiary range and varied locations, establishing a national reputation for RMIT excellence. The project built in professional development and engaged dissemination to support best practice and build sustainable change across RMIT nationally and internationally. • Priority 5. Ensure the development and transformation of the academic workforce, to deliver the academic educational goals in addition to the research goals identified in the Research and Innovation Plan. The project also supported, Priority 5, Enabler (v) to create spaces and opportunities to support staff to develop, experiment with, or refine teaching with technologies, which are informed by analytics. Internal order number: 360482 Project leader contact details: Howard Errey Email: [email protected] Phone: 0407770667

Welcome message from author
This document is posted to help you gain knowledge. Please leave a comment to let me know what you think about it! Share it to your friends and learn new things together.
Transcript

Learning and Teaching Investment Fund final report
Transforming learning and teaching with practical analytics Erika Beljaars-Harris, Howard Errey College of Design and Social Context
12 February 2016
Strategic objectives addressed:
This project contributed to the achievement of the RMIT University 2011-15 Strategic Plan by addressing:
• Priority 1. Transforming the student experience
The project assisted with transforming the student experience by operationalising Priority 1, Enabler (i). Specifically, the project leveraged information and communication technology to improve online and blended learning to enhance student learning outcomes by collecting analytics (for early intervention, and then support academic staff to translate this into ongoing improvement of learning and teaching practice).
• Priority 3. Determine and encourage best practice in program and curriculum design for delivery across RMIT’s tertiary range and varied locations, establishing a national reputation for RMIT excellence.
The project built in professional development and engaged dissemination to support best practice and build sustainable change across RMIT nationally and internationally.
• Priority 5. Ensure the development and transformation of the academic workforce, to deliver the academic educational goals in addition to the research goals identified in the Research and Innovation Plan.
The project also supported, Priority 5, Enabler (v) to create spaces and opportunities to support staff to develop, experiment with, or refine teaching with technologies, which are informed by analytics.
Internal order number: 360482
Project leader contact details:
Howard Errey
Email: [email protected]
Phone: 0407770667
Transforming learning and teaching with practical analytics
Page 2 of 21
Project team members:
• Erika Beljaars-Harris
• Howard Errey
• Peter Saunders
• Kat Daley
• Philip Craig
Funding scheme
LTIF contestable X
Program Development Fund
RMIT Vietnam Program Development Fund

Transforming learning and teaching with practical analytics
Page 3 of 21
1 Executive summary Prior to this project, academic and teaching staff did not have enough information indicating what their students were experiencing, nor did they have a great deal of understanding about analytics. Colleges had been provided with statistics tabulating Blackboard hits per class for each semester. This data had unfortunately been accepted on face value. Some teaching areas were concerned that data did not reflect online presence or valuable teaching practice. What was required was a forward thinking approach that provided a baseline understanding of what is useful and meaningful data. Methodologies for collating and applying data in practical ways could then be build on this baseline.
Many terms had been used used relating to analytics and data, such as Instructional Analytics, Learner/Learning Analytics, Academic Analytics, Predictive Analytics and more, for which there needed to be a clearer language. Teaching staff did not know how to access meaningful data, nor were they aware of what they could do with data in course design. Staff were required to have a Blackboard presence and many staff were teaching outside of Blackboard as the 2014 LTIF project Beyond Blackboard demonstrated. What was required was perspective, understanding and training in the use of analytics and predictive analytics that would aid staff in making data meaningful, regardless of their choice of platform.
Until a comprehensive analytics package could be adopted by the university, there existed a data gap that could be usefully attended to at more local levels. If done in a consistent and comprehensive manner the data could help fill in current gaps towards providing a value-add to students and a positive culture amongst staff, for the purpose of continuous improvement.
This project aimed to develop practical analytics to provide feedback to academic and teaching staff to enable meaningful blended delivery. The project was guided by the research question: how can data be consistently collected in relation to online learning and teaching to inform meaningful teaching practice? A key aspect of this project was to partner with academic and teaching staff as co-investigators to enable genuine, sustainable change. In addition, the project aimed to engage in active dissemination - using online and traditional avenues, embedding, systematic professional development. The project helped enable understanding of predictive analytics for early intervention in both established and new platforms, supporting academic staff to translate data into improvement in their teaching practice.
Activity focused on four areas. Firstly throughout the year workshops were held on various aspects of data and analytics. Recordings were made of these presentations and disseminated on the project blog at http://practicalanalytic.wordpress.com/ . Secondly focus groups of staff occurred teasing out answers to key questions around the value propositions associated with data and analytics. Thirdly we had a member of teaching staff apply techniques made available during the project, which enabled the improvement of feedback scores for online teaching exceeding face-to-face scores. Fourthly, a student survey about learning analytics was conducted.
2 Outcomes The main outcomes of the project can be divided into seven key areas:
1. Focus groups. A total of 17 staff members from across the university took part in focus groups. The findings from these focus groups led to the development of specific workshops to address staff needs, as well as resources requested from staff and ideas to help drive change in the university.
2. Workshops. There were 12 workshops held throughout the year. On average, 25 people attended each workshop with a wide representation from all colleges.
3. Connection between academics, colleges and LTIF projects. Workshops helped academics connect and share ideas from a wide range of different schools. Our LTIF project worked closely with another LTIF project, Improving the Learning Experience by Better Understanding One’s Own Learning Process.
Transforming learning and teaching with practical analytics
Page 4 of 21
4. Increasing engagement in the classroom. A lecturer from Global, Urban and Social Studies implemented an intervention with the aim of increasing engagement.
5. Student survey. Students from the School of Business were invited to take part in an online survey in order to hear the student voice. A total of 15 students agreed to take part in the study. The findings of this study have been used for a 2016 LTIF project that will impact over 300 students from Business and Global, Urban and Social Studies.
6. Project blog. The LTIF project maintained a blog throughout the year. The blog was used to share ideas about analytics and learning and teaching.
• Blog Posts 39, best views per day 83.
• Most popular post hits 173.
7. Videos. A majority of staff members in the focus group indicated that they had difficulties using learning analytics in Blackboard. A series of short videos were created demonstrating how to turn on and use analytics in Blackboard. These videos will be distributed to staff in 2016.
3 Project outcomes and impacts
3.1 Project scoping Initially given the blank slate of previous analytics activity at RMIT a considerable period was spent in scoping the 2016 project. Consultants from Dunn and Bradstreet and Accenture, were invited to both advise on initial approaches and give workshops on big data. This lead to the development of numerous questions directed toward what learning analytics could solve. These were later sorted into the following:
What are the definitions? What are the risks with data and analytics? What is the role of learning analytics for tertiary academics? What are staff going to be motivated to do? What practical help can we provide them? What big data do we have access to and how can this be of assistance?
Following on from these questions, direction for the project formulated into the staff consultation approach detailed below under Focus Groups.
3.2 Developing connections As part of the scoping phase, time was spent understanding previous analytics use at RMIT and to seek out other staff who were using analytics within the university. Numerous individuals were using learning analytics for teaching and learning but most of these individuals were using analytics on a small scale and in isolation from other staff. An important task of this project was to try to connect staff who were using learning analytics or wanted to know more about them.
We liaised with another LTIF project being supervised by Dr Christopher Cheong, Improving the Learning Experience by Better Understanding One’s Own Learning Process . From this connection we were able to share and develop ideas and use a software program he has developed called Task-Test-Monitor (TTM). Learning analytics are incorporated into TTM that enables students to see how they are progressing on assessments in comparison to other students. TTM played an important role in an intervention (see section 3.5) and a student survey (see section 3.6) we conducted.
Transforming learning and teaching with practical analytics
Page 5 of 21
3.3 Focus groups A series of focus groups were held with staff associated with learning and teaching across the University. The focus groups comprised a total of 17 staff. Staff were fielded with a range of questions that looked at the value proposition of data and analytics for learning and teaching. The aim of the focus groups were to examine academic attitudes towards learning analytics. The project aimed to gain an insight into the needs of teaching staff in addressing educational issues, or making improvements to their teaching, and to gain a more in depth understanding of academic attitudes towards online learning practices. Staff gave a wide range of responses. Themes from the focus group are summarised below:
• Student engagement. One of the major themes from the focus groups was that measuring and improving engagement is the potential greatest advantage of analytics. Student engagement was identified as the most important measure of what makes a good teacher. Staff reported that one of the primary benefits of analytics is that it could be potentially used to increase engagement and/or assist with measuring engagement.
• Feedback. Feedback was identified as an important issue associated with learning analytics. Some staff reported that it is difficult to obtain relevant and timely feedback. Staff suggested that learning analytics has the potential to improve the feedback they receive, including what is going on in their online teaching and learning spaces at any time.
• Pedagogical Motivation. Staff reported that pedagogical motivation is one of the first things that is needed for staff to make use of learning analytics. Staff reported that they need to be convinced that learning analytics can augment and facilitate teaching. Teachers are adaptive and want to increase student engagement but technology should only be incorporated if it fits with their pedagogical goals and will benefit the student.
• Reflection. Some staff reported that learning analytics encourages reflective practice. It allows students (and staff) to monitor and reflect on their own learning and provides a tool to help increase insight.
• Resources. Staff reported that they require further guidance and understanding on how to implement learning analytics. They suggested to implement Individualised dashboards for data and analytics that allow for keeping a simple approach.
We implemented a range of initiatives to address the issues raised by staff in the focus groups. Some of these included:
1. Workshops. Staff reported that they required further professional development and understanding in certain areas. We developed workshops to specifically address some of these needs (see section 3.4).
2. Videos. Staff reported that they had difficulties understanding how to use learning analytics and that they had no resources. How-to videos were created to demonstrate how to use learning analytics in Blackboard.
3. Increasing engagement. A staff member applied some ideas discussed into her classroom (see section 3.4).
4. Student voice. We surveyed students (see section 3.5) to determine if they see any benefits of using learning analytics.
3.4 Workshops Information workshops were held throughout the year on data in general and learning analytics in particular. Details about each presentation including videos can be found on the project blog http://practicalanalytic.wordpress.com/ . For our workshops we included local and international guests. Guests were chosen because they were seen as making positive contributions to the field of learning analytics and because they were developing tools for learning and teaching that were seen as useful and worthwhile to share. Numerous academics that we came across were doing inspiring things with learning analytics but felt isolated from other academics. We wanted to use the workshops as an opportunity for RMIT
Transforming learning and teaching with practical analytics
Page 6 of 21
University staff to share their ideas, inspire other staff members and also build connections with other staff members across the university. The topics of the workshops were also specifically chosen to address staff needs identified in the focus groups. In the focus groups staff identified a range of areas that they wanted further information in, including Google Analytics, understanding what learning analytics is and how to know when to use certain online tools. Attempts were made to create workshops to specifically address these areas. The workshops, the number of people who attended, the number of online views and a link to the blog post is presented below.
Workshop Attended Online Views
Link
Practical Analytics at the Coal Face, Dr James Baglin 25 15 https://goo.gl/ZwMtDr The Real World Value of Analytics, Philip Finocchiaro 30 45 https://goo.gl/H21Opr Using Blackboard Analytics to Change Student Learning, Dr Toby Juliff
26 55 https://goo.gl/cpnk9G
A Pragmatic Approach to Academic and Learning Analytics, Geoffrey Edlund and Tania Fernando
19 79 https://goo.gl/ixNMqf
Understanding One’s own Learning Process, Dr Christopher Cheong
16 45 https://goo.gl/oPXyi8
Learning Analytics across the Organisation, Pauline Farrell
39 173 https://goo.gl/G1dFjo
Google Analytics, Blake Seufert 57 134 https://goo.gl/cXKY6R
Learning Analytics: Separating the Hype from the Hope. Dr Grace Lynch
16 154 https://goo.gl/NxK0vm
Beginners guide to Online Feedback Tools Samantha Vardanega
29 116 https://goo.gl/QDOaSB
Creating Connections in Complexity: exploring the bright and dark of big data in our practice. Dr Teresa Anderson
24 128 https://goo.gl/O9JSWb
Google Analytics for Learner Analytics, Martin Hawksey and Nico Miceli
25 90 https://goo.gl/KcMDT2
Learning Analytics: current movements and future directions, Dr Grace Lynch
14 - No recording made
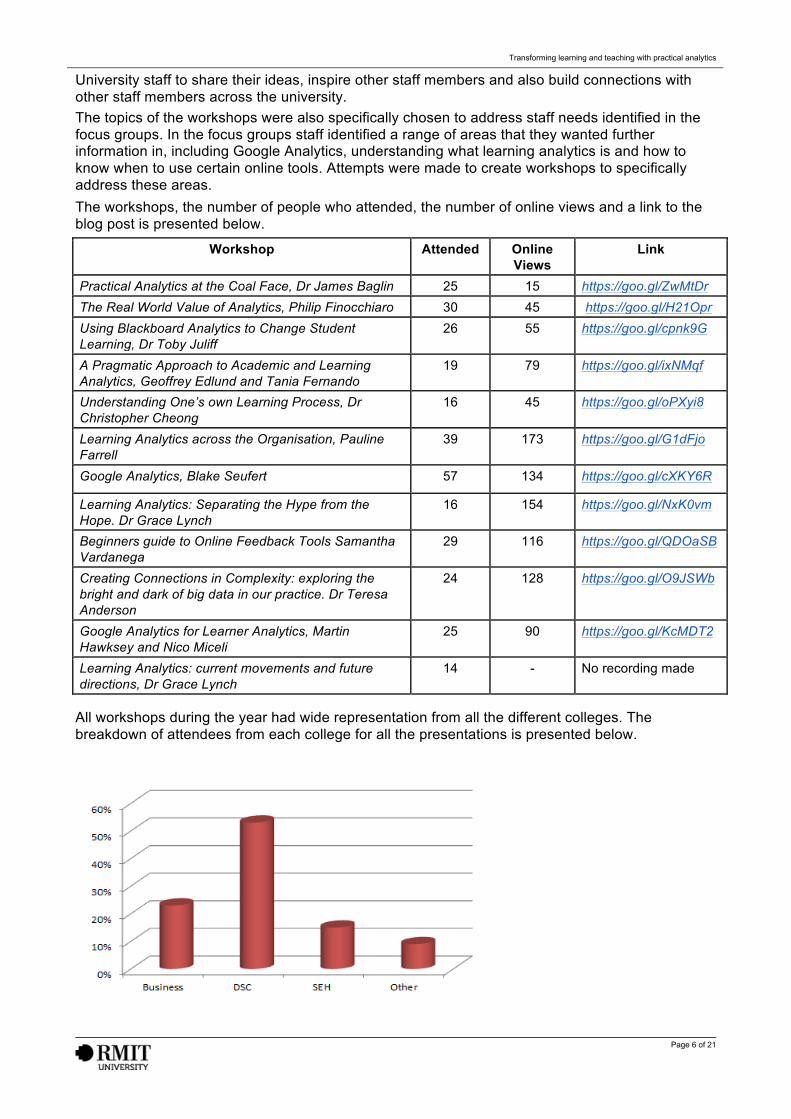
All workshops during the year had wide representation from all the different colleges. The breakdown of attendees from each college for all the presentations is presented below.
Transforming learning and teaching with practical analytics
Page 7 of 21
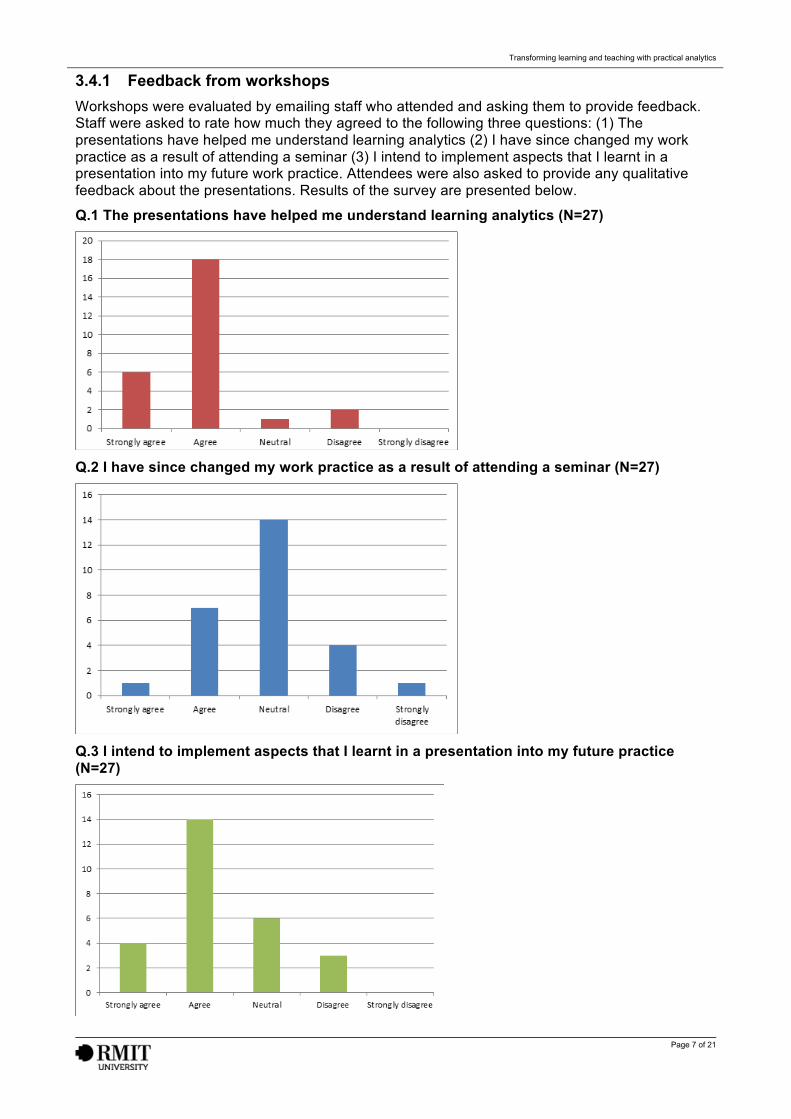
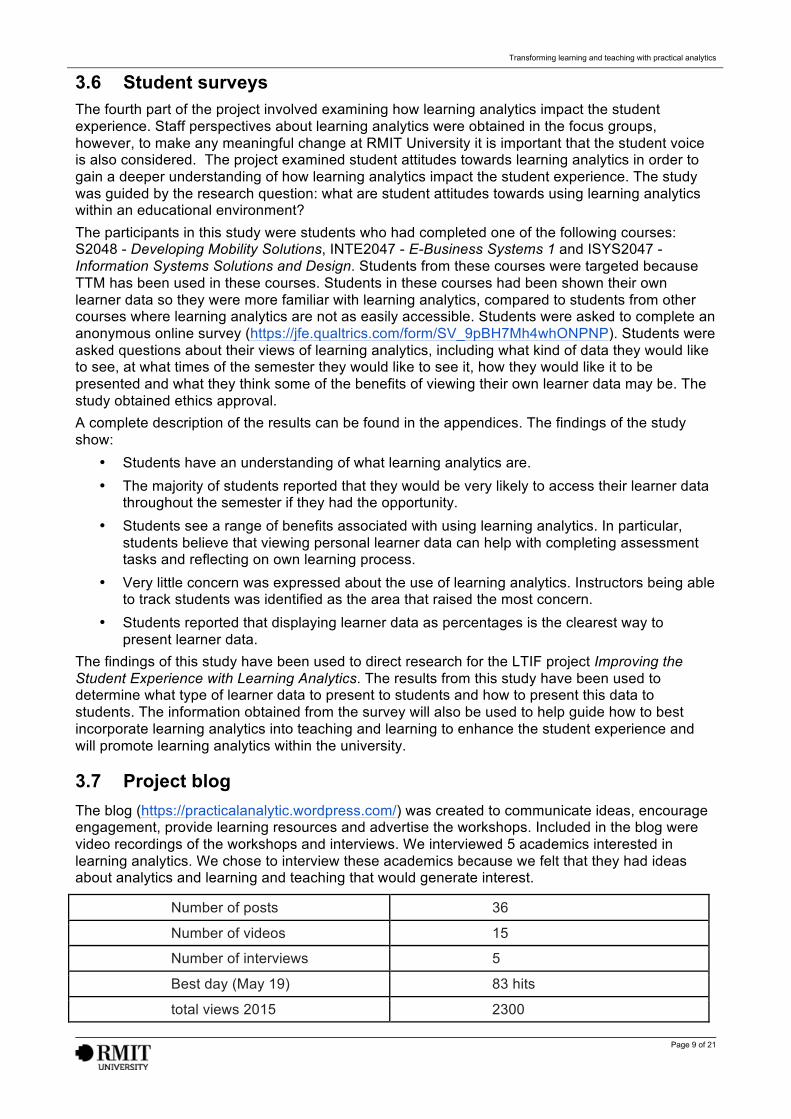
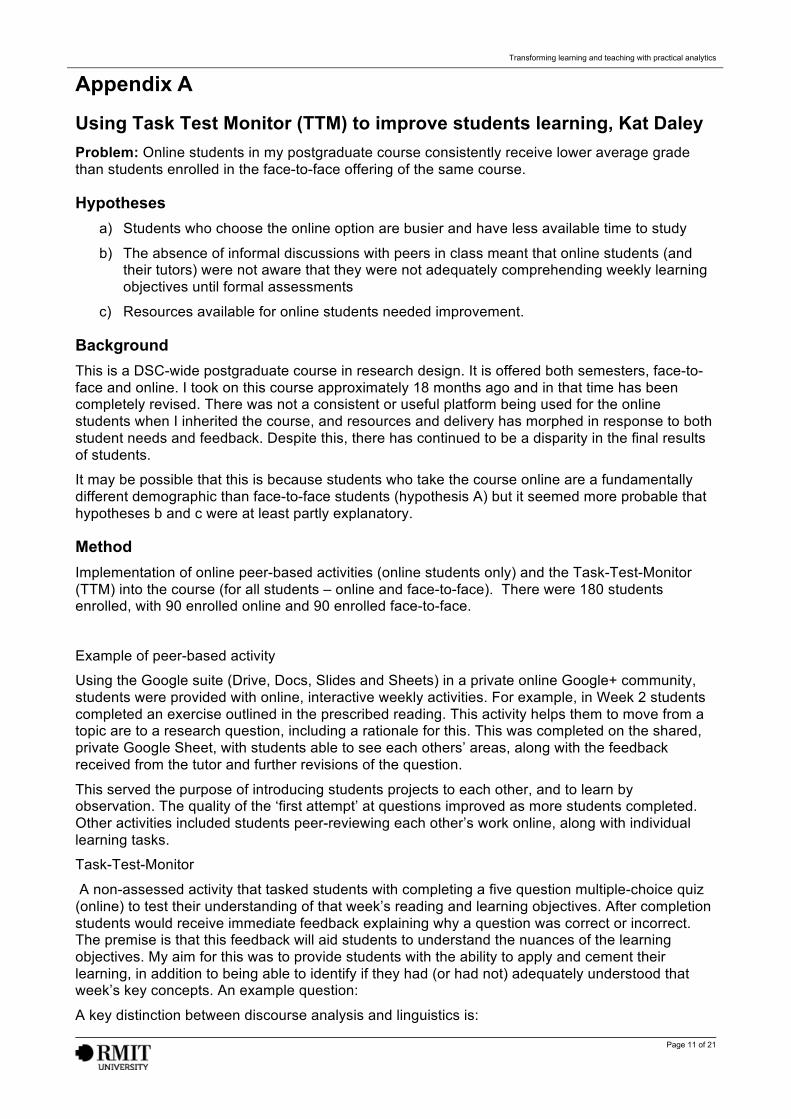
3.4.1 Feedback from workshops Workshops were evaluated by emailing staff who attended and asking them to provide feedback. Staff were asked to rate how much they agreed to the following three questions: (1) The presentations have helped me understand learning analytics (2) I have since changed my work practice as a result of attending a seminar (3) I intend to implement aspects that I learnt in a presentation into my future work practice. Attendees were also asked to provide any qualitative feedback about the presentations. Results of the survey are presented below.
Q.1 The presentations have helped me understand learning analytics (N=27)
Q.2 I have since changed my work practice as a result of attending a seminar (N=27)
Q.3 I intend to implement aspects that I learnt in a presentation into my future practice (N=27)

Transforming learning and teaching with practical analytics
Page 8 of 21
Q.4 Is there anything you would like to add about the presentations?
• Very interesting presentations. More tips and ideas on how to use analytics will be really helpful.
• Thank you for the opportunity to learn more about using learning analytics in my teaching
• I wished there was more presentations on the social, political and ethical concerns. These ARE practical concerns, especially in DSC - such as Art or Social Context. It appears to me at this point in time, that implementing learning analytics at this point in time is neither useful or maybe even wise.
• They were informative but much more effort is needed to encourage staff to adopt the strategies. Workloads are very high!
• Fantastic.
• Great sessions keep them coming.
• These should be better promoted - perhaps here: http://www1.rmit.edu.au/staff/professionaldevelopment/lt
• Fantastic work loved it all.
• Thanks for sharing.
• I was only advised about one seminar, held several months ago. Too short time to get into much detail.
These findings suggest that the workshops have been useful for the attendees. More specifically, they suggest that the workshops have helped increase staff and students understanding of learning analytics and have provided them with tools to help change their future practice.
3.5 Application in the classroom Lecturer Kat Daley was able to measure how an intervention in her online delivery could impact on student performance. After consistently lower performance from her online student group, Kat introduced the following interventions in her online delivery:
• Use of the suite of Google Apps (Google Drive, Docs, Sheets and Communities).
• Integrated via one platform (Communities).
• Students have access to a Drive folder, but links are also embedded everywhere.
• Materials distributed strategically throughout the week (Sat, Tues & Thurs).
• Students have a preparatory test on reading, then the lecture, then a weekly task.
By using the TTM with both the online and face-to-face student groups studying the same subject, Kat was able to give and equivalent feedback method. The following benefits ensued.
• Students were engaging with each other, achieving my aim of increasing lateral discussion.
• Once students learned how to use Google Apps, it was easy to use.
• Everything in one place (except for Turnitin).
• Live documents and conversations made the forum feel like a community.
• Most significantly, this semester was the first ever where online student out-performed face-to-face students (just … mean 64.48 cf. 67.48).
Further analysis is required to understand which aspects of the intervention were most successful in enabling this outcome. A summary of Kat’s methodology can be found in the appendices.
Transforming learning and teaching with practical analytics
Page 9 of 21
3.6 Student surveys The fourth part of the project involved examining how learning analytics impact the student experience. Staff perspectives about learning analytics were obtained in the focus groups, however, to make any meaningful change at RMIT University it is important that the student voice is also considered. The project examined student attitudes towards learning analytics in order to gain a deeper understanding of how learning analytics impact the student experience. The study was guided by the research question: what are student attitudes towards using learning analytics within an educational environment? The participants in this study were students who had completed one of the following courses: S2048 - Developing Mobility Solutions, INTE2047 - E-Business Systems 1 and ISYS2047 - Information Systems Solutions and Design. Students from these courses were targeted because TTM has been used in these courses. Students in these courses had been shown their own learner data so they were more familiar with learning analytics, compared to students from other courses where learning analytics are not as easily accessible. Students were asked to complete an anonymous online survey (https://jfe.qualtrics.com/form/SV_9pBH7Mh4whONPNP). Students were asked questions about their views of learning analytics, including what kind of data they would like to see, at what times of the semester they would like to see it, how they would like it to be presented and what they think some of the benefits of viewing their own learner data may be. The study obtained ethics approval. A complete description of the results can be found in the appendices. The findings of the study show:
• Students have an understanding of what learning analytics are. • The majority of students reported that they would be very likely to access their learner data
throughout the semester if they had the opportunity. • Students see a range of benefits associated with using learning analytics. In particular,
students believe that viewing personal learner data can help with completing assessment tasks and reflecting on own learning process.
• Very little concern was expressed about the use of learning analytics. Instructors being able to track students was identified as the area that raised the most concern.
• Students reported that displaying learner data as percentages is the clearest way to present learner data.
The findings of this study have been used to direct research for the LTIF project Improving the Student Experience with Learning Analytics. The results from this study have been used to determine what type of learner data to present to students and how to present this data to students. The information obtained from the survey will also be used to help guide how to best incorporate learning analytics into teaching and learning to enhance the student experience and will promote learning analytics within the university.
3.7 Project blog The blog (https://practicalanalytic.wordpress.com/) was created to communicate ideas, encourage engagement, provide learning resources and advertise the workshops. Included in the blog were video recordings of the workshops and interviews. We interviewed 5 academics interested in learning analytics. We chose to interview these academics because we felt that they had ideas about analytics and learning and teaching that would generate interest.
Number of posts 36
Number of videos 15
Number of interviews 5
Best day (May 19) 83 hits
total views 2015 2300

Transforming learning and teaching with practical analytics
Page 10 of 21
There was interest and engagement in the blog, however, the number of hits could be increased. It would have been beneficial to have encouraged more comments, to have spent longer cross posting and to have increased links with other blogs throughout the university.
4 Dissemination strategies and outputs Workshops were held throughout the year to bring presenters with expertise of relevance to the developing knowledge about analytics as the projects developed. Subjects included big picture as well as local application of learning analytics. As well expertise from inside and outside the university were highlighted. Approaches further advanced than contemporary Australian Higher Education (such as Vocational and K-12) were included. Workshops were video recorded and featured on the project blog.
The project blog was used to highlight knowledge gained from the project and to disseminate findings and details about and from the workshop. https://practicalanalytic.wordpress.com/.
A paper for a conference presentation, possibly at Ascilite 2016, is being prepared.
5 Evaluation of project outcomes As with the 2014 Whatonearth LTIF initiatives, this project did not entirely have definable activities or a clear, articulated pathway to an outcome. Rather activities were designed to support system change across the university, and focused on dynamic responses to emergent findings. The aim again was the the project learned from itself and adapted as needed through the reflective practice and learning of the project team and participants. Therefore, developmental evaluation approach was developed through implementation of the project. As well as the quantitative and qualitative data in the above pointing to the success of the project, we can use outcome harvesting to point to the following success indicators:
• Kat Daley was able to show with learning analytics that tools such as the TTM could be used to measure changes in online delivery. These measurements could not only improve online results but also increase performance of online students over face-to-face students. This counters the commonly held view that face-to-face is a better experience than online learning.
• While the above attendance numbers at workshops show a diverse and numerous audience, there has also been relationships built across colleges and with service areas such as IT and marketing because of this project. Those with interest and skill in data and analytics now have a network that will be built on for the 2016 analytics LTIF.
• An as yet unseen result of diverse network formation was the project preparation for mobile sensor data project joining expertise within Computer Science in SEH and IT toward the availability of learner analytics from sensor data. The 2016 project will look to encourage wider support for this project at RMIT.
• The fact that the project team has been awarded a 2016 LTIF project focusing on working with students and learning analytics is in itself a significant success indicator. As well as the specific student focus it enables an opportunity to build on these 2015 successes.
Transforming learning and teaching with practical analytics
Page 11 of 21
Appendix A
Using Task Test Monitor (TTM) to improve students learning, Kat Daley Problem: Online students in my postgraduate course consistently receive lower average grade than students enrolled in the face-to-face offering of the same course.
Hypotheses a) Students who choose the online option are busier and have less available time to study
b) The absence of informal discussions with peers in class meant that online students (and their tutors) were not aware that they were not adequately comprehending weekly learning objectives until formal assessments
c) Resources available for online students needed improvement.
Background This is a DSC-wide postgraduate course in research design. It is offered both semesters, face-to-face and online. I took on this course approximately 18 months ago and in that time has been completely revised. There was not a consistent or useful platform being used for the online students when I inherited the course, and resources and delivery has morphed in response to both student needs and feedback. Despite this, there has continued to be a disparity in the final results of students.
It may be possible that this is because students who take the course online are a fundamentally different demographic than face-to-face students (hypothesis A) but it seemed more probable that hypotheses b and c were at least partly explanatory.
Method Implementation of online peer-based activities (online students only) and the Task-Test-Monitor (TTM) into the course (for all students – online and face-to-face). There were 180 students enrolled, with 90 enrolled online and 90 enrolled face-to-face.
Example of peer-based activity
Using the Google suite (Drive, Docs, Slides and Sheets) in a private online Google+ community, students were provided with online, interactive weekly activities. For example, in Week 2 students completed an exercise outlined in the prescribed reading. This activity helps them to move from a topic are to a research question, including a rationale for this. This was completed on the shared, private Google Sheet, with students able to see each others’ areas, along with the feedback received from the tutor and further revisions of the question.
This served the purpose of introducing students projects to each other, and to learn by observation. The quality of the ‘first attempt’ at questions improved as more students completed. Other activities included students peer-reviewing each other’s work online, along with individual learning tasks.
Task-Test-Monitor
A non-assessed activity that tasked students with completing a five question multiple-choice quiz (online) to test their understanding of that week’s reading and learning objectives. After completion students would receive immediate feedback explaining why a question was correct or incorrect. The premise is that this feedback will aid students to understand the nuances of the learning objectives. My aim for this was to provide students with the ability to apply and cement their learning, in addition to being able to identify if they had (or had not) adequately understood that week’s key concepts. An example question:
A key distinction between discourse analysis and linguistics is:
Transforming learning and teaching with practical analytics
Page 12 of 21
a) Discourse analysis use middle-range theories better
Discourse analysis is abductive in that it is a forward and back process of analysis; however, this is not the distinction between DA and linguistics (INCORRECT)
b) Discourse analysis is abductive
Discourse analysis is eclectic in the methods used for analysis; however, this is not the distinction between DA and linguistics (INCORRECT)
c) Discourse analysis is eclectic in its methods
Discourse analysis is eclectic in the methods used for analysis; however, this is not the distinction between DA and linguistics (INCORRECT)
d) Discourse analysis is problem oriented
Discourse analysis starts with a problem; whereas linguistics starts with a text. DA will draw on multiple sources and methods to understand a social phenomenon through its discourse; whereas linguistics is about the study of language construction in a specific text. (CORRECT)
Outcomes
Both cohorts had the same average final grade (.03% higher for online students). There is insufficient evidence to identify the distribution of effect between hypotheses b & c; but this suggest that hypothesis a is not an adequate explanation for historically poorer outcomes for online students.
Transforming learning and teaching with practical analytics
Page 13 of 21
Appendix B
Student survey results There were a total of 15 participants who completed the survey. Of these participants 80% (12) identified themselves as male and 20% (3) identified themselves as female.
Age group n (%)
18 - 25 years 11 (73.3%)
26 - 40 years 4 (26.7%)
Understanding of Learning Analytics All of the participants surveyed had heard of the term learning analytics. The majority of participants (73.3%) reported that they know and understand the term learning analytics and 26.7% of participants reported that they have heard of the term but would not be able to define it.
Use of Test-Task-Monitor (TTM) Software All of the participants had used TTM; 60% of participants used TTM ‘often’ and 40% of participants used TTM ‘sometimes’ or ‘rarely.’ The majority of participants (80%) reported feeling ‘very confident’ using TTM.
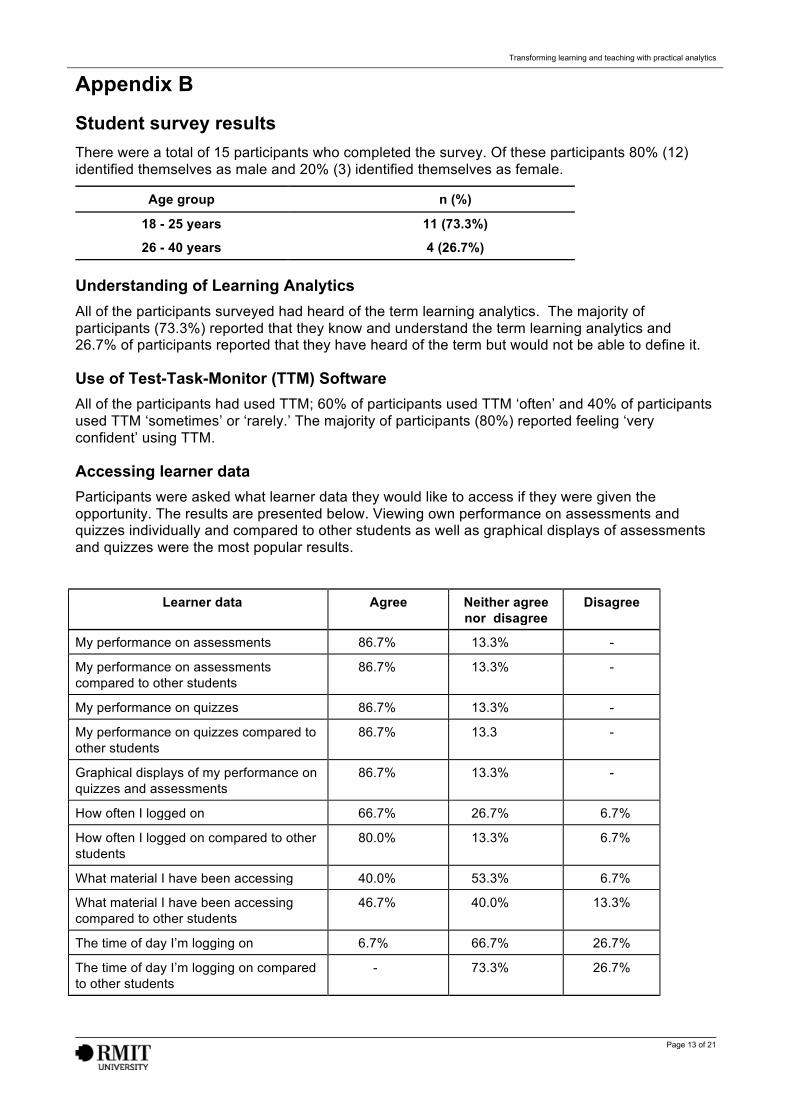
Accessing learner data Participants were asked what learner data they would like to access if they were given the opportunity. The results are presented below. Viewing own performance on assessments and quizzes individually and compared to other students as well as graphical displays of assessments and quizzes were the most popular results.
Learner data Agree Neither agree nor disagree
Disagree
My performance on assessments 86.7% 13.3% -
My performance on assessments compared to other students
86.7% 13.3% -
My performance on quizzes 86.7% 13.3% -
My performance on quizzes compared to other students
86.7% 13.3 -
Graphical displays of my performance on quizzes and assessments
86.7% 13.3% -
How often I logged on 66.7% 26.7% 6.7%
How often I logged on compared to other students
80.0% 13.3% 6.7%
What material I have been accessing 40.0% 53.3% 6.7%
What material I have been accessing compared to other students
46.7% 40.0% 13.3%
The time of day I’m logging on 6.7% 66.7% 26.7%
The time of day I’m logging on compared to other students
- 73.3% 26.7%

Transforming learning and teaching with practical analytics
Page 14 of 21
Benefits of viewing own learner data Participants were asked what they thought some of the benefits of viewing their own learner data may be. The quotes of participants are below.
Quote
“Helps me understand how I learn”
“You'll be able to see what you need to focus on”
“See how you are performing compared to others
“Help me monitor my progress”
“Help to remember data”
“Be able to see where I need to improve”
“Good to compare yourself to others”
“See how I'm progressing”
Participants were asked to rate how beneficial they thought viewing their own learner data would be in different areas. The bar chart below shows the percentage of participants who rated each area as ‘very beneficial.’
Problems Using Learner Data
Participants were asked, as students, if they see any potential problems with having their learner data used. Only two participants responded to this question. The quotes are presented below.
Quote
“You might stop studying an area you think you've over compensated in”
“Teachers using it against you”
Level of concern
Participants were asked about apprehensions they may have about having their learner data used. Participants were asked to rate their level of concern in a number of different areas. The results are presented below. The area that had the highest amount of concern was ‘Instructors being able to track my online activities.’
Area of concern Highly concerned
Concerned Neutral Not very concerned
Not concerned at all
Reducing learning to numbers
- - 46.7% - 53.3%
Privacy - 13.3% 6.7% 20% 60%
Ethics 13.3% 13.3% 26.7% 46.7%
Misuse of learner data 6.7% 13.3% 26.7% 20% 33.3%
Instructors being able to track my online activities
20% 33.3% 13.3% 6.7% 26.7%
Viewing learner data
Transforming learning and teaching with practical analytics
Page 15 of 21
Participants were asked how likely they would be to look at their learner data at different times throughout the semester. Results are presented below.
Time during semester Very likely
Likely Somewhat unlikely
Unlikely Very unlikely
Throughout the entire semester
73.3% 26.7% - - -
First week 6.7% 46.7% 33.3% 13.3% -
Census date 20% - 53.3% 13.3% 13.3%
Before an assessment 33.3% 60% 6.7% - -
After an assessment 40% 33.3% 20% - 6.7%
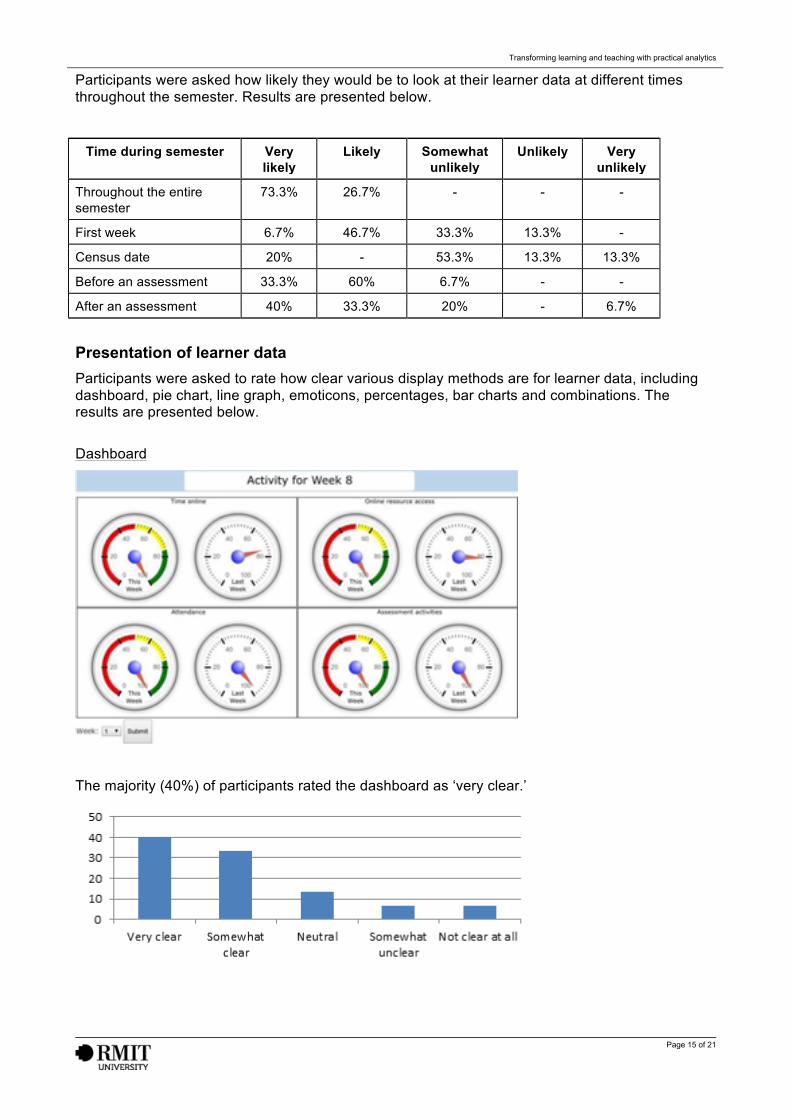
Presentation of learner data Participants were asked to rate how clear various display methods are for learner data, including dashboard, pie chart, line graph, emoticons, percentages, bar charts and combinations. The results are presented below.
Dashboard
The majority (40%) of participants rated the dashboard as ‘very clear.’
Transforming learning and teaching with practical analytics
Page 16 of 21
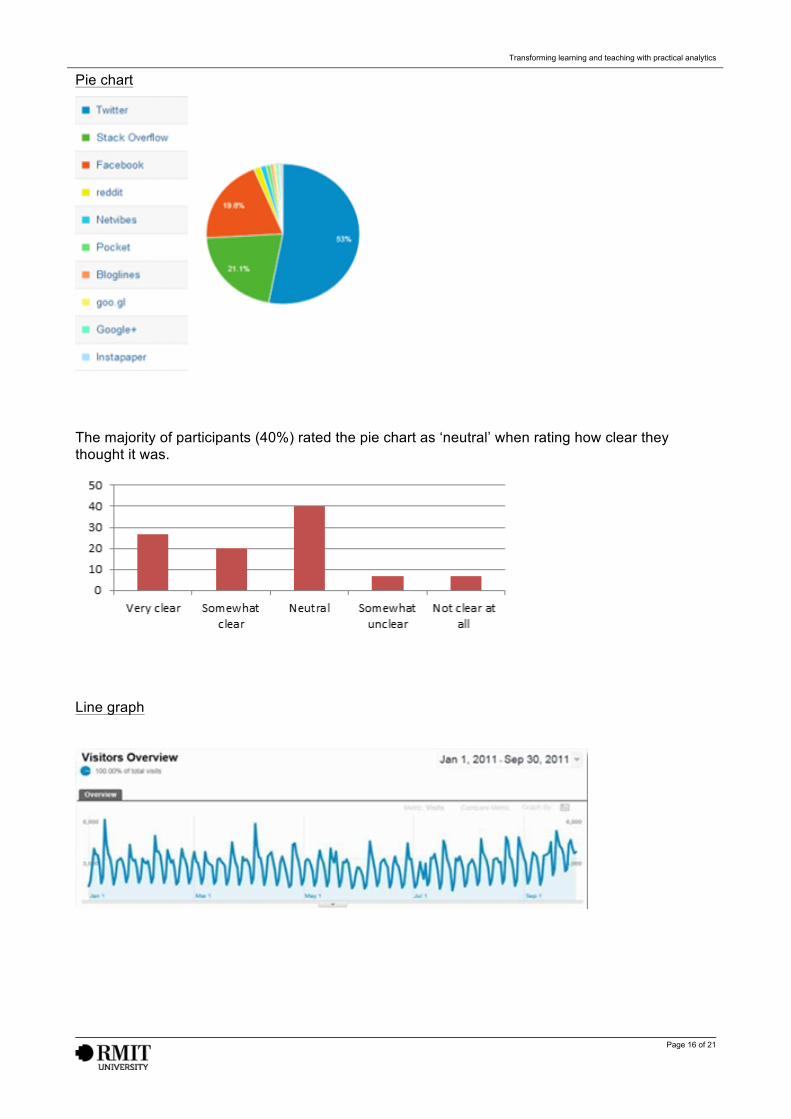
Pie chart
The majority of participants (40%) rated the pie chart as ‘neutral’ when rating how clear they thought it was.
Line graph
Transforming learning and teaching with practical analytics
Page 17 of 21
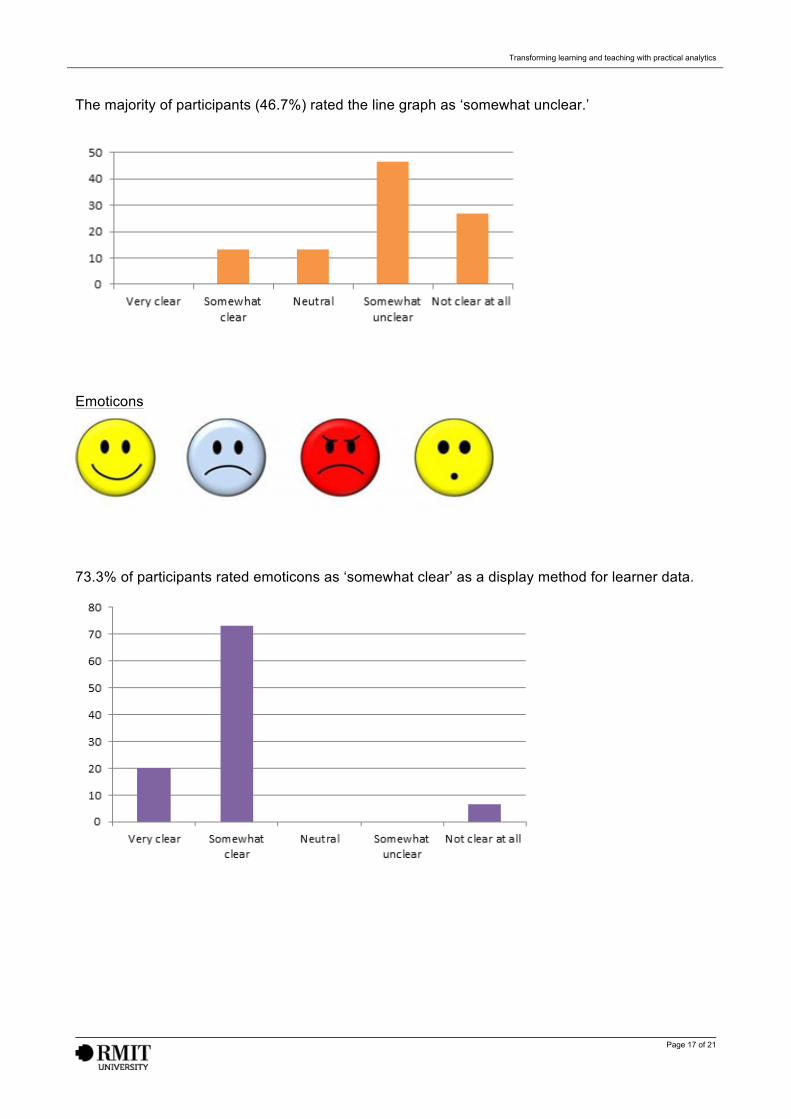
The majority of participants (46.7%) rated the line graph as ‘somewhat unclear.’
Emoticons
73.3% of participants rated emoticons as ‘somewhat clear’ as a display method for learner data.
Transforming learning and teaching with practical analytics
Page 18 of 21
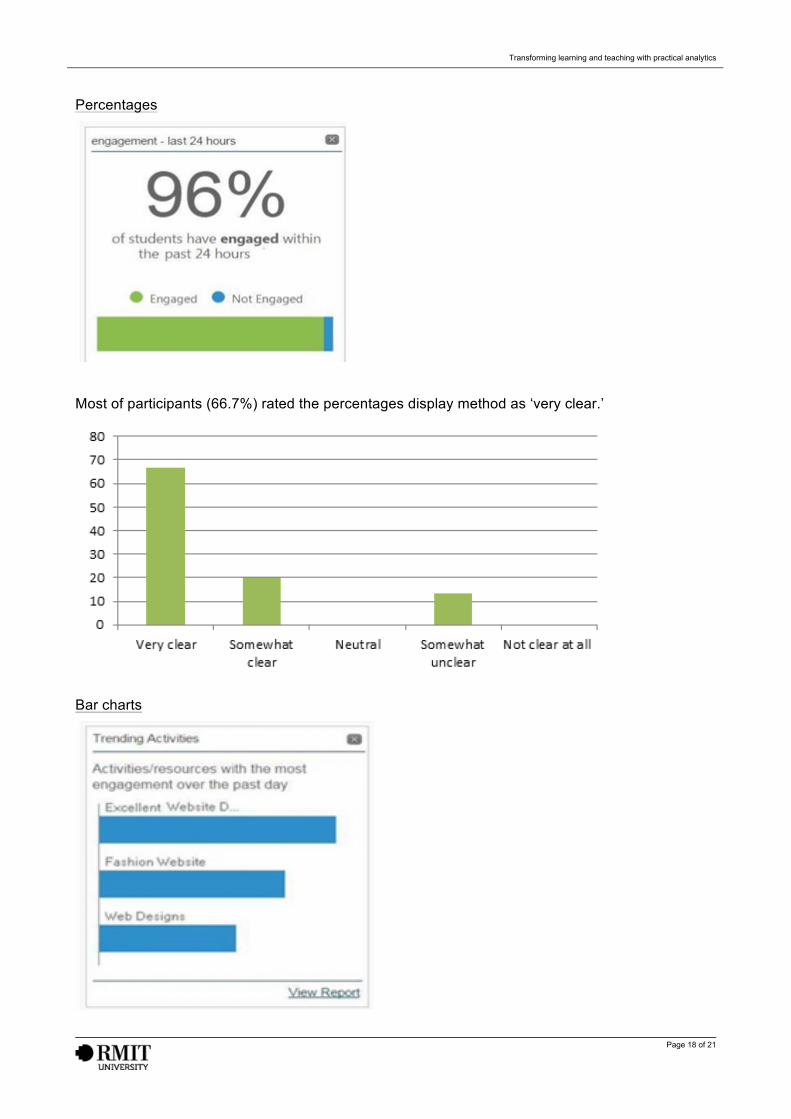
Percentages
Most of participants (66.7%) rated the percentages display method as ‘very clear.’
Bar charts

Transforming learning and teaching with practical analytics
Page 19 of 21
The majority of participants (53.3%) rated bar charts as ‘somewhat clear.’
Combination
The majority of participants (53.3%) rated combination as ‘not clear at all.’
Overall, the percentages display method was rated as the clearest way to present learner data.
Transforming learning and teaching with practical analytics
Page 20 of 21
Appendix C
Promotional bookmark images

Transforming learning and teaching with practical analytics
Page 21 of 21
Related Documents