TECHNIQUES AND RESOURCES RESEARCH REPORT Transfection of Capsaspora owczarzaki, a close unicellular relative of animals Helena Parra-Acero 1, *, Nu ́ ria Ros-Rocher 1, *, Alberto Perez-Posada 1 , Aleksandra Ko _ zyczkowska 1 , Nu ́ ria Sa ́ nchez-Pons 1 , Azusa Nakata 2 , Hiroshi Suga 2 , Sebastia ́ n R. Najle 1,3 and In ̃ aki Ruiz-Trillo 1,4,5, ‡ ABSTRACT How animals emerged from their unicellular ancestor remains a major evolutionary question. New genome data from the closest unicellular relatives of animals have provided important insights into the evolution of animal multicellularity. We know that the unicellular ancestor of animals had an unexpectedly complex genetic repertoire, including many genes that are key to animal development and multicellularity. Thus, assessing the function of these genes among unicellular relatives of animals is key to understanding how they were co-opted at the onset of the Metazoa. However, such analyses have been hampered by the lack of genetic tools. Progress has been made in choanoflagellates and teretosporeans, two of the three lineages closely related to animals, whereas no tools are yet available for functional analysis in the third lineage: the filastereans. Importantly, filastereans have a striking repertoire of genes involved in transcriptional regulation and other developmental processes. Here, we describe a reliable transfection method for the filasterean Capsaspora owczarzaki. We also provide a set of constructs for visualising subcellular structures in live cells. These tools convert Capsaspora into a unique experimentally tractable organism to use to investigate the origin and evolution of animal multicellularity. KEY WORDS: Transfection, Capsaspora owczarzaki, Holozoa, Multicellularity, Origin of Metazoa INTRODUCTION The transition to animal multicellularity from a single-celled ancestor is one of the most intriguing events in the history of life (King, 2004; Ruiz-Trillo et al., 2007; Rokas, 2008; Knoll, 2011; Richter and King, 2013; Cavalier-Smith, 2017; Sebé-Pedrós et al., 2017). Analysis of the genomes of extant unicellular relatives of animals, hereafter unicellular holozoans, recently showed that the unicellular ancestor of animals was genetically more complex than previously thought (Sebé-Pedrós et al., 2017). Strikingly, genes thought to be animal specific are now known to be present in unicellular holozoans. These include genes involved in cell adhesion, such as those encoding integrins and cadherins, cell-to- cell communication, such as those encoding tyrosine kinases, and transcriptional regulation, such as the developmental transcription factor Brachyury (Sebé-Pedrós et al., 2010, 2011; Sebé-Pedrós et al., 2013a; Nichols et al., 2012; Suga et al., 2012). These findings imply that the co-option of ancestral genes into new functions was an important mechanism for the transition to animal multicellularity. However, understanding how these genes were co-opted will only be possible through functional analyses in extant unicellular relatives of animals. There are three known lineages of unicellular holozoans: choanoflagellates, teretosporeans (ichthyosporeans and corallochytreans) and filastereans (Torruella et al., 2015; Grau- Bové et al., 2017). These three lineages show very different developmental modes, such as the clonal colony formation of choanoflagellates (Fairclough et al., 2013), the coenocytic growth of teretosporeans (Marshall et al., 2008; Suga and Ruiz-Trillo, 2013) and the aggregative behaviour present in filastereans (Sebé- Pedrós et al., 2013b). To develop a comprehensive view of the transition to multicellularity, we need to understand these three different modes of development. So far, a forward genetics approach has been developed in choanoflagellates, leading to the discovery of rosetteless, a gene related to colony formation in Salpingoeca rosetta (Levin et al., 2014). Efforts are also underway to develop transfection in choanoflagellates. Transfection has already been developed in the ichthyosporean Creolimax fragrantissima, where it allowed the description of synchronous nuclear division during coenocytic development (Suga and Ruiz- Trillo, 2013). To date, however, there are still no genetic tools reported in filastereans. Recent analysis of the genome, transcriptome, proteome and phosphoproteome of the filasterean amoeba Capsaspora owczarzaki (Fig. S1), hereafter Capsaspora, provided important insights into the origins of animal multicellularity and the nature of their unicellular ancestor (Suga et al., 2013; Sebé-Pedrós et al., 2016a,b). The Capsaspora genome encodes an unexpected set of transcription factors known to be involved in animal development that were previously thought to be metazoan specific, such as NFκB, Runx and T-box (Sebé-Pedrós et al., 2011; Suga et al., 2013; de Mendoza et al., 2013). Similar to animals, these transcription factors are differentially regulated at the transcriptional level and are also differentially phosphorylated during the Capsaspora life cycle (Sebé-Pedrós et al., 2016a,b). Capsaspora also contains the most complete set of proteins linked to cell–extracellular matrix adhesion (the Integrin adhesome) among unicellular holozoans (Sebé-Pedrós et al., 2010; Suga et al., 2013). This highlights Capsaspora as the closest relative of animals in which such genes can be studied. Received 5 December 2017; Accepted 25 April 2018 1 Institut de Biologia Evolutiva (CSIC-Universitat Pompeu Fabra), Passeig Marı ́ tim de la Barceloneta 37-49, 08003 Barcelona, Catalonia, Spain. 2 Faculty of Life and Environmental Sciences, Prefectural University of Hiroshima, Nanatsuka 5562, Shobara, Hiroshima 727-0023, Japan. 3 Instituto de Biologı ́ a Molecular y Celular de Rosario (IBR-CONICET) and Facultad de Ciencias Bioquı ́ micas y Farmacé uticas, Universidad Nacional de Rosario, Ocampo y Esmeralda s/n, Rosario S2000FHQ, Argentina. 4 Departament de Genètica, Microbiologia i Estadı ́ stica, Universitat de Barcelona, Av. Diagonal, 645, 08028 Barcelona, Catalonia, Spain. 5 ICREA, Passeig Lluı ́ s Companys 23, 08010, Barcelona, Catalonia, Spain. *These authors are co-first authors ‡ Author for correspondence ([email protected]) N.R., 0000-0003-0897-0186; I.R., 0000-0001-6547-5304 This is an Open Access article distributed under the terms of the Creative Commons Attribution License (http://creativecommons.org/licenses/by/3.0), which permits unrestricted use, distribution and reproduction in any medium provided that the original work is properly attributed. 1 © 2018. Published by The Company of Biologists Ltd | Development (2018) 145, dev162107. doi:10.1242/dev.162107 DEVELOPMENT

Welcome message from author
This document is posted to help you gain knowledge. Please leave a comment to let me know what you think about it! Share it to your friends and learn new things together.
Transcript

TECHNIQUES AND RESOURCES RESEARCH REPORT
Transfection of Capsaspora owczarzaki, a close unicellularrelative of animalsHelena Parra-Acero1,*, Nuria Ros-Rocher1,*, Alberto Perez-Posada1, Aleksandra Ko _zyczkowska1,Nuria Sanchez-Pons1, Azusa Nakata2, Hiroshi Suga2, Sebastian R. Najle1,3 and Inaki Ruiz-Trillo1,4,5,‡
ABSTRACTHow animals emerged from their unicellular ancestor remains a majorevolutionary question. New genome data from the closest unicellularrelatives of animals have provided important insights into the evolutionof animal multicellularity. We know that the unicellular ancestor ofanimals had an unexpectedly complex genetic repertoire, includingmany genes that are key to animal development and multicellularity.Thus, assessing the function of these genes among unicellularrelatives of animals is key to understanding how they were co-optedat the onset of the Metazoa. However, such analyses have beenhampered by the lack of genetic tools. Progress has been made inchoanoflagellates and teretosporeans, two of the three lineagesclosely related to animals, whereas no tools are yet available forfunctional analysis in the third lineage: the filastereans. Importantly,filastereans have a striking repertoire of genes involved intranscriptional regulation and other developmental processes. Here,we describe a reliable transfection method for the filastereanCapsaspora owczarzaki. We also provide a set of constructs forvisualising subcellular structures in live cells. These tools convertCapsaspora into a unique experimentally tractable organism to use toinvestigate the origin and evolution of animal multicellularity.
KEY WORDS: Transfection, Capsaspora owczarzaki, Holozoa,Multicellularity, Origin of Metazoa
INTRODUCTIONThe transition to animal multicellularity from a single-celledancestor is one of the most intriguing events in the history of life(King, 2004; Ruiz-Trillo et al., 2007; Rokas, 2008; Knoll, 2011;Richter and King, 2013; Cavalier-Smith, 2017; Sebé-Pedrós et al.,2017). Analysis of the genomes of extant unicellular relatives ofanimals, hereafter unicellular holozoans, recently showed that theunicellular ancestor of animals was genetically more complex than
previously thought (Sebé-Pedrós et al., 2017). Strikingly, genesthought to be animal specific are now known to be present inunicellular holozoans. These include genes involved in celladhesion, such as those encoding integrins and cadherins, cell-to-cell communication, such as those encoding tyrosine kinases, andtranscriptional regulation, such as the developmental transcriptionfactor Brachyury (Sebé-Pedrós et al., 2010, 2011; Sebé-Pedróset al., 2013a; Nichols et al., 2012; Suga et al., 2012). These findingsimply that the co-option of ancestral genes into new functions wasan important mechanism for the transition to animalmulticellularity. However, understanding how these genes wereco-opted will only be possible through functional analyses in extantunicellular relatives of animals.
There are three known lineages of unicellular holozoans:choanoflagellates, teretosporeans (ichthyosporeans andcorallochytreans) and filastereans (Torruella et al., 2015; Grau-Bové et al., 2017). These three lineages show very differentdevelopmental modes, such as the clonal colony formation ofchoanoflagellates (Fairclough et al., 2013), the coenocytic growthof teretosporeans (Marshall et al., 2008; Suga and Ruiz-Trillo,2013) and the aggregative behaviour present in filastereans (Sebé-Pedrós et al., 2013b). To develop a comprehensive view of thetransition to multicellularity, we need to understand these threedifferent modes of development. So far, a forward geneticsapproach has been developed in choanoflagellates, leading to thediscovery of rosetteless, a gene related to colony formation inSalpingoeca rosetta (Levin et al., 2014). Efforts are also underwayto develop transfection in choanoflagellates. Transfection hasalready been developed in the ichthyosporean Creolimaxfragrantissima, where it allowed the description of synchronousnuclear division during coenocytic development (Suga and Ruiz-Trillo, 2013). To date, however, there are still no genetic toolsreported in filastereans.
Recent analysis of the genome, transcriptome, proteome andphosphoproteome of the filasterean amoeba Capsasporaowczarzaki (Fig. S1), hereafter Capsaspora, provided importantinsights into the origins of animal multicellularity and the nature oftheir unicellular ancestor (Suga et al., 2013; Sebé-Pedrós et al.,2016a,b). The Capsaspora genome encodes an unexpected set oftranscription factors known to be involved in animal developmentthat were previously thought to be metazoan specific, such asNFκB, Runx and T-box (Sebé-Pedrós et al., 2011; Suga et al., 2013;de Mendoza et al., 2013). Similar to animals, these transcriptionfactors are differentially regulated at the transcriptional level and arealso differentially phosphorylated during the Capsaspora life cycle(Sebé-Pedrós et al., 2016a,b). Capsaspora also contains the mostcomplete set of proteins linked to cell–extracellular matrix adhesion(the Integrin adhesome) among unicellular holozoans (Sebé-Pedróset al., 2010; Suga et al., 2013). This highlights Capsaspora as theclosest relative of animals in which such genes can be studied.Received 5 December 2017; Accepted 25 April 2018
1Institut de Biologia Evolutiva (CSIC-Universitat Pompeu Fabra), PasseigMarıtim dela Barceloneta 37-49, 08003 Barcelona, Catalonia, Spain. 2Faculty of Life andEnvironmental Sciences, Prefectural University of Hiroshima, Nanatsuka 5562,Shobara, Hiroshima 727-0023, Japan. 3Instituto de Biologıa Molecular y Celular deRosario (IBR-CONICET) and Facultad de Ciencias Bioquımicas y Farmaceuticas,Universidad Nacional de Rosario, Ocampo y Esmeralda s/n, Rosario S2000FHQ,Argentina. 4Departament de Gene tica, Microbiologia i Estadıstica, Universitat deBarcelona, Av. Diagonal, 645, 08028 Barcelona, Catalonia, Spain. 5ICREA, PasseigLluıs Companys 23, 08010, Barcelona, Catalonia, Spain.*These authors are co-first authors
‡Author for correspondence ([email protected])
N.R., 0000-0003-0897-0186; I.R., 0000-0001-6547-5304
This is an Open Access article distributed under the terms of the Creative Commons AttributionLicense (http://creativecommons.org/licenses/by/3.0), which permits unrestricted use,distribution and reproduction in any medium provided that the original work is properly attributed.
1
© 2018. Published by The Company of Biologists Ltd | Development (2018) 145, dev162107. doi:10.1242/dev.162107
DEVELO
PM
ENT

Here, we present the first protocol for transfecting the filastereanCapsaspora with plasmid DNA. The protocol is based on theclassical calcium phosphate precipitation method (Graham and vander Eb, 1973), which we coupled with a glycerol shock to increasetransfection efficiency. We also constructed a set of expressionvectors containing an endogenous promoter and fluorescentreporters that allow labelling of multiple subcellular structuresin vivo. Altogether, this work provides the key step necessary toperform functional assays requiring foreign nucleic acid delivery,including overexpression, RNA interference and genome editing,rendering Capsaspora experimentally tractable towards addressingthe transition to animal multicellularity.
RESULTS AND DISCUSSIONCapsaspora transfection using calcium phosphateprecipitationThere are several protocols available for the transient transfection ofplasmid DNA for eukaryotic cells. For Capsaspora, we initially triedelectroporation because it has been successfully used to transientlytransfect the ichthyosporeanC. fragrantissima (Suga and Ruiz-Trillo,2013). However, we obtained no more than 20 positive cells out ofthousands of cells. We additionally tried lipid-based transfection(Felgner et al., 1987) and magnetofection (Buerli et al., 2007;Ensenauer et al., 2011), which have been reported to work ineukaryotic cells that are difficult to transfect. Nevertheless, bothapproaches resulted in few, if any, positive cells. Finally, we tested theclassical calcium phosphate precipitation-based transfection method(Graham and van der Eb, 1973), which has been reported tosuccessfully transfect Dictyostelium discoideum (Nellen et al., 1984;Gaudet et al., 2007), an amoebozoanwithout a cell wall. Given that weinitially obtained ∼100 times more cells that were positive cells withthe calcium phosphate precipitation protocol than with the othermethods, we focused on this protocol to further improve its efficiency.As a first step to increase the efficiency of transfection, we
investigated which life stage to transfect. Under culture conditions,Capsaspora presents three distinct life stages: adherent, cystic andaggregative (Sebé-Pedrós et al., 2013b). We tried using cells in theadherent stage because the culture is at its exponential growth phaseat this stage (Fig. 1A) (Sebé-Pedrós et al., 2013b). We observed thattransfecting Capsaspora adherent cells at 90-95% confluence froma fresh culture resulted in higher transfection efficiency.Next, we addressed crystal formation during DNA precipitation.
We sought the smallest size of crystals possible, because smallercrystals have been associated with higher transfection efficiency(Jordan et al., 1996; Jordan and Wurm, 2004). We achieved this bykeeping the same ratio of DNA, calcium and phosphate aspreviously described for D. discoideum (Gaudet et al., 2007), andsetting an incubation time of 10 min at 37°C (Fig. 1B-4).Additionally, we used a transfection medium containing minimalgrowth components but lacking phosphate (Fig. 1B-3,6), tomaintain the optimal concentration of calcium phosphate forDNA precipitation. This medium also contains buffering agents atpH 7.1 to avoid pH fluctuations that might affect the solubility ofany precipitates.Finally, to increase the number of transfected cells, we coupled
the protocol with a glycerol shock, because the latter has shown toincrease the transfection efficiency in other systems (Grosjean et al.,2006; Gaudet et al., 2007; Guo et al., 2017). We performed theshock using 10% glycerol in 1× HBS for 1 min (Fig. 1B-7) andimmediately added growth medium to avoid compromising cellviability (Fig. 1B-8, see Supplementary Materials and Methods forfurther details).
Analysis of transfected Capsaspora cells by flow cytometryTo evaluate DNA incorporation by Capsaspora, we constructedtwo expression vectors containing either Venus (pONSY-Venus) ormCherry (pONSY-mCherry) fluorescent proteins as cytosolicmarkers (Fig. 2A). These vectors contain the promoter andterminator regions of the endogenous elongation factor 1-α(EF1-α) gene (CAOG_07807) from Capsaspora (see Materialsand Methods). We confirmed the successful expression of bothfluorescent proteins by fluorescence microscopy (Fig. 2A′-A″) andflow cytometry. We performed an immunofluorescence assay onsorted cells and confirmed that the fluorescent population identifiedwas expressing Venus (Fig. S2).
Next, we analysed the transfection efficiency by quantifying thenumber of positive cells by flow cytometry (Fig. 3A,B). Weperformed single transfection experiments using either pONSY-Venus or pONSY-mCherry in seven independent experiments (eachexperiment performed with a different batch of cells) with at leastsix technical replicates each. In both cases, the positive populationswere defined using a negative control (Fig. S3). Capsasporatransfection efficiency was 1.132%±0.529 (mean±s.d.) with a 95%confidence interval of (0.983-1.281%) from a total of 4.9 millioncells (Fig. 3C). In these experiments, individual transfectionefficiencies ranged from 0.347%±0.193 to 2.083%±0.248(Table S1). Importantly, these transfection efficiencies aresufficient to screen for positive cells and perform furthermanipulations, because they correspond to thousands of positivecells per well. Additionally, we compared transfection rates betweenCapsaspora cells transfected with either pONSY-Venus orpONSY-mCherry (Fig. 3D, experiments 7a and 7b, respectively,in Table S1), but no significant difference was observed (P=0.5625,Wilcoxon Signed Rank Test).
Fig. 1. Protocol for transfection of plasmid DNA in Capsaspora.(A) Preparation of cells (1-2). (B) Calcium phosphate precipitation (3-8).(C) Screening of transformants. o/n, overnight.
2
TECHNIQUES AND RESOURCES Development (2018) 145, dev162107. doi:10.1242/dev.162107
DEVELO
PM
ENT
Given that transfection is transient, it is of interest to know howlong the expression of the reporter gene persists for. Thus, weperformed three independent experiments transfecting pONSY-Venus. We analysed the percentage of positive cells by flowcytometry every 24 h for 10 days (Fig. S4 and Table S2). Weobserved an exponential decrease in the number of positive cells.Although there was a significant reduction in the number of positivecells after 48 h (∼39% of the total of positive cells), positive cells(∼3%) could still be detected by Day 10. At this point, most of thecells are expected to be in the cystic stage (Sebé-Pedrós et al.,2013b), indicating that transient expression of a gene of interest canbe analysed during each of the life stages of Capsaspora.We also tested whether the two different constructs could express
a protein simultaneously by co-transfecting both pONSY-mCherryand pONSY-Venus at equimolar concentrations in sevenindependent experiments (Fig. 3E). The red (Q2) and green (Q4)positive populations were defined using their correspondingnegative controls (Fig. S5). The mean relative percentage of cellsshowing red and green fluorescence simultaneously (Q3 in Fig. 3F)from the total number of positive cells (sum of Q2, Q3 and Q4 inFig. 3F) was 72.909%±5.468, ranging from ∼65% to ∼83%(Fig. 3G, Table S3). Thus, it is possible to co-transfect two differentvectors with a high probability of incorporating both of them in thesame cell. This result is similar to those observed in other unicellulareukaryotes [40-80% in Volvox carteri (Schiedlmeier et al., 1994),84% in Pandorina morum (Lerche and Hallmann, 2014) and
50-100% in Eudorina elegans (Lerche and Hallmann, 2013)].Co-transfection is a useful strategy when more than one cassette isneeded, such as when labelling two different cellular structuressimultaneously, delivering resistance cassettes against an antibioticwith a reporter gene, or delivering different elements required forCRISPR/Cas9 assays.
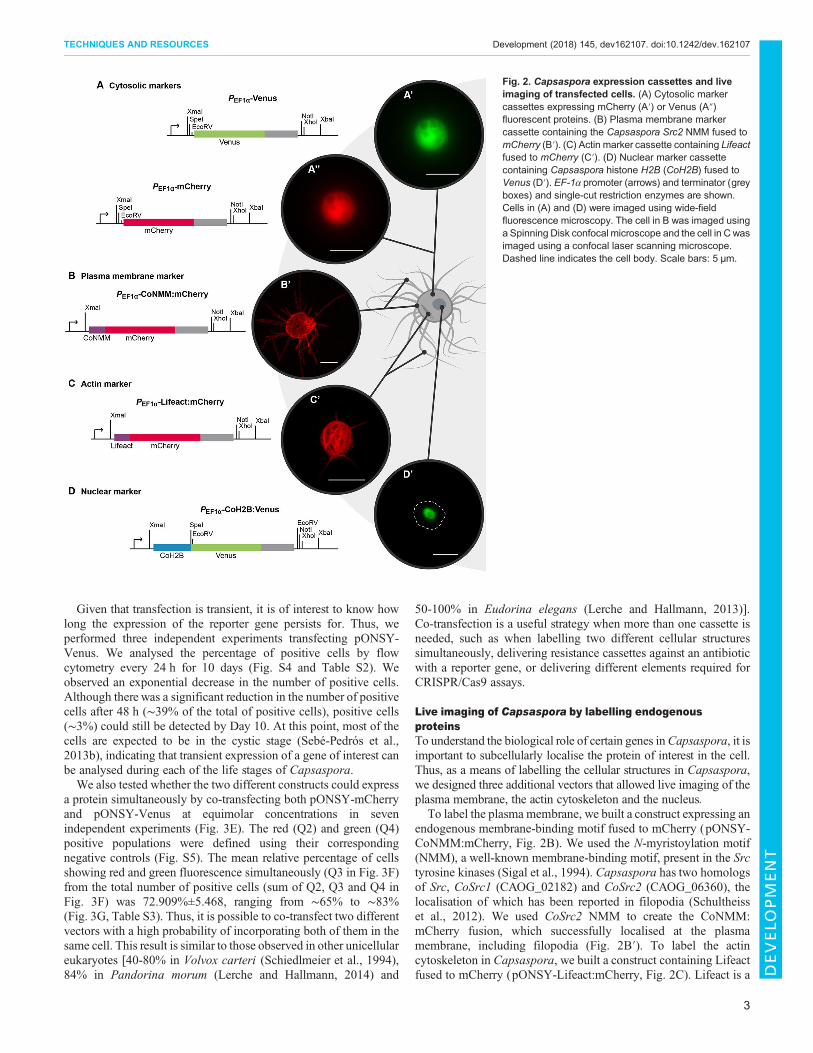
Live imaging of Capsaspora by labelling endogenousproteinsTo understand the biological role of certain genes inCapsaspora, it isimportant to subcellularly localise the protein of interest in the cell.Thus, as a means of labelling the cellular structures in Capsaspora,we designed three additional vectors that allowed live imaging of theplasma membrane, the actin cytoskeleton and the nucleus.
To label the plasma membrane, we built a construct expressing anendogenous membrane-binding motif fused to mCherry (pONSY-CoNMM:mCherry, Fig. 2B). We used the N-myristoylation motif(NMM), a well-known membrane-binding motif, present in the Srctyrosine kinases (Sigal et al., 1994). Capsaspora has two homologsof Src, CoSrc1 (CAOG_02182) and CoSrc2 (CAOG_06360), thelocalisation of which has been reported in filopodia (Schultheisset al., 2012). We used CoSrc2 NMM to create the CoNMM:mCherry fusion, which successfully localised at the plasmamembrane, including filopodia (Fig. 2B′). To label the actincytoskeleton in Capsaspora, we built a construct containing Lifeactfused to mCherry (pONSY-Lifeact:mCherry, Fig. 2C). Lifeact is a
Fig. 2. Capsaspora expression cassettes and liveimaging of transfected cells. (A) Cytosolic markercassettes expressing mCherry (A′) or Venus (A″)fluorescent proteins. (B) Plasma membrane markercassette containing the Capsaspora Src2 NMM fused tomCherry (B′). (C) Actin marker cassette containing Lifeactfused to mCherry (C′). (D) Nuclear marker cassettecontaining Capsaspora histone H2B (CoH2B) fused toVenus (D′). EF-1α promoter (arrows) and terminator (greyboxes) and single-cut restriction enzymes are shown.Cells in (A) and (D) were imaged using wide-fieldfluorescence microscopy. The cell in B was imaged usinga Spinning Disk confocal microscope and the cell in C wasimaged using a confocal laser scanning microscope.Dashed line indicates the cell body. Scale bars: 5 μm.
3
TECHNIQUES AND RESOURCES Development (2018) 145, dev162107. doi:10.1242/dev.162107
DEVELO
PM
ENT

17-amino acid peptide from the N-terminal region of yeast Abp140(Riedl et al., 2008) that works as a marker of filamentous actin. TheLifeact:mCherry fusion successfully labelled the actin cytoskeleton(Fig. 2C′). This construct also labels actin in filopodia (Fig. S7),although the signal is much weaker than that observed with themembrane marker. Finally, to label the nucleus, we built aconstruct containing the coding sequence of Capsaspora histoneH2B (CAOG_01818) fused to Venus (pONSY-CoH2B:Venus,Fig. 2D). We confirmed nuclear localisation by staining transfectedcells with DAPI (Fig. 2D′, Fig. S6).To better understand the subcellular structures of Capsaspora
cells, we combined the nuclear, plasma membrane and actinmarkers. We co-transfected pONSY-CoH2B:Venus with eitherpONSY-CoNMM:mCherry or pONSY-Lifeact:mCherry (Fig. 4A).Furthermore, we performed live imaging in cells transfected with
either the membrane marker or the actin marker. The use of themembrane marker allowed us to observe the dynamic behaviour offilopodia on the substrate with unprecedented detail. We observedthe retraction of filopodia, filopodia breakage and foci of membraneaccumulation (Fig. 4B andMovie 1). In particular, we observed thatfilopodia are distributed around the cell body. More importantly, theprojections constructed from the z-stack clearly demonstrated thatthe Capsaspora cell body is not in direct contact with the substrate,with the numerous filopodia instead holding the cell up (Fig. 4C).Moreover, we tracked a cell transfected with the actin cytoskeletonmarker and observed the organisation of actin bundles around thecell body (Fig. 4D,E and Movie 2).
The accumulated knowledge on its well-annotated genome,transcriptome, proteome and phosphoproteome and histonemodifications, and its key phylogenetic position as a close
Fig. 3. Transfection efficiency analysis of Capsaspora. (A) Flow cytometry distribution of pONSY-Venus transfected cells. Area selected (P+) represents theVenus-positive population. (B) Flow cytometry distribution of pONSY-mCherry transfected cells. Area selected (P+) represents the mCherry-positive population.(C) Percentage of positive cells in single transfection. The box plot represents the transfection efficiency distribution over seven independent experiments with atleast six technical replicates each (n=4.9 M cells). (D) Percentage of positive cells from a paired experiment with six technical replicates, transfecting eitherpONSY-Venus or pONSY-mCherry. Error bars represent s.d. (P=0.5625, Wilcoxon Signed Rank Test). (E) Wide-field fluorescence microscopy of a live cell co-transfected with pONSY-Venus and pONSY-mCherry. (F) Flow cytometry distribution of pONSY-Venus and pONSY-mCherry co-transfected cells. Cellpopulation was divided into quartiles: negative cells (Q1), fluorescent cells expressing mCherry only (Q2), co-transfected cells expressing both fluorescentproteins (Q3), and fluorescent cells expressing Venus only (Q4). (G) Relative percentage of positive cells co-transfected with pONSY-Venus and pONSY-mCherry; expressing both fluorescent proteins (double), mCherry only or Venus only, calculated from the total number of positive cells in seven independentexperiments with six replicates each (n=120,000 cells). Scale bar: 5 µm.
4
TECHNIQUES AND RESOURCES Development (2018) 145, dev162107. doi:10.1242/dev.162107
DEVELO
PM
ENT

unicellular relative to animals render Capsaspora as a powerfulsystem to understand the emergence of multicellular animals. Thereliable transfection protocol for Capsaspora presented here willallow us to study the function of genes that were key to the evolutionof multicellularity, opening new avenues of functional research tobetter understand the transition to animal multicellularity.
MATERIALS AND METHODSCell strain and growth conditionsC. owczarzaki cell cultures (strain ATCC®30864) were grown axenically in25 cm2 culture flasks (Falcon®VWR, #734-0044) with 5 ml ATCCmedium1034 (modified PYNFH medium), hereafter growth medium, in a 23°Cincubator (see supplementary Materials and Methods).
Construction of Capsaspora expression vectorsDNA from Capsaspora cells was extracted as in Suga et al. (2013). RNAwas extracted using a Trizol reagent (Invitrogen/Thermo Fisher Scientific,#15596026). cDNA was obtained by RT-PCR using SuperScript® IIIReverse Transcriptase (Invitrogen, #18080044) following themanufacturer’s instructions.
Capsaspora expression vectors, named pONSY, bear the promoter andterminator regions from the endogenous EF-1α gene (CAOG_07807). Tobuild the pONSY-Venus vector (5.849 kb), the EF-1α promoter (906 bpupstream from methionine) and terminator (320 bp downstream from the
stop codon) were amplified from gDNAwith primers 1 and 2 and primers 4and 5, respectively (Table S4). Venus was amplified from a plasmidavailable in H.P.-A.’s lab using primers 7 and 8, which contain overlapregions with the promoter and terminator regions, respectively. The threeamplicons were fused together by overlapping PCR using primers 1 and5. The resulting PEF1α-Venus-terminator cassette was digested using theKpnI restriction enzyme and cloned into the pCR2.1 vector (LifeTechnologies, #K203001) linearised at the KpnI restriction site.
To build pONSY-mCherry (5.828 kb), we followed the same strategy asdescribed above for the promoter, and used primers 4 and 6 to amplify theterminator region. This modification was introduced to eliminate an extraEcoRV site that affects further cloning. mCherry was amplified from aplasmid available in H.P.-A.’s lab using primers 9 and 10, which containoverlap regions with both the promoter and terminator regions. The threeamplicons were fused together by overlapping PCR using primers 1 and6. The resulting PEF1α-mCherry-terminator cassette was digested with KpnIand KspI enzymes and cloned into the respective restriction sites of thepCR2.1 vector.
A pONSY (empty) vector (5.127 kb) was created by releasing amCherry-terminator fragment from pONSY-mCherry using SpeI andKspI restriction enzymes and inserting the terminator in this backboneby Gibson Assembly® (New England Biolabs, E2611L) using primers 7and 8.
pONSY-CoH2B:Venus (6.230 kb) was created by fusing Capsasporahistone H2B (CAOG_01818) to Venus. CoH2B was PCR amplified from
Fig. 4. Live imaging of transfectedCapsaspora cells. (A) Wide-fieldfluorescence microscopy of live cells co-transfected with pONSY-CoNMM:mCherryand pONSY-CoH2B:Venus, and live cells co-transfected with pONSY-Lifeact:mCherry andpONSY-CoH2B:Venus. CoNMM:mCherrylabelling is presented as a maximumprojection of the cell. Dashed lines indicatecell bodies. (B) Time-points on a Capsasporacell transfected with pONSY-CoNMM:mCherry imaged using wide-fieldfluorescence microscopy. Filopodia attachedto the substrate are in focus. A retractingfilopodia can be observed (dotted line),whereas four filopodia are broken(arrowheads). (C) Maximum-intensityprojections in each axis of a cell transfectedwith pONSY-CoNMM:mCherry. Colour scalerepresents depth through the projection.Imaging was performed using confocalmicroscopy. (D) z-stack on a Capsaspora celltransfected with pONSY-Lifeact:mCherryimaged using confocal microscopy. Actinbundles can be observed shaping the cell in abasket-like structure that is hollow in themiddle. (E) Full z-stack maximum intensityprojection of cell in (D). Cells in (C-E) wereimaged using a Spinning Disk confocalmicroscope. Scale bars: 5 µm.
5
TECHNIQUES AND RESOURCES Development (2018) 145, dev162107. doi:10.1242/dev.162107
DEVELO
PM
ENT

cDNA using primers 13 and 14 and cloned into the pONSY-Venusmulticloning site using SmaI and SpeI restriction enzymes.
pONSY-CoNMM:mCherry (5.904 kb) was created by fusing an NMM tomCherry. NMM was predicted in the Capsaspora Src homolog CoSrc2(CAOG_06360) using ‘NMT - The MYR Predictor’ online software (http://mendel.imp.ac.at/myristate/SUPLpredictor.htm), which is based on an in-depth study of N-myristoyltransferase substrate proteins (Maurer-Strohet al., 2002). The NMM predicted sequence GCSNSKPHDPSDFKVSPplus seven extra amino acids (SGVASNS) and an mCherry overlap regionwere included in primer 11. Primers 11 and 12 were used to build aCoNMM-mCherry cassette by PCR using the pONSY-mCherry vector as atemplate. This cassette was then cloned into pONSY (empty) using XmaIand EcoRV restriction enzymes.
pONSY-Lifeact:mCherry (5.882 kb) was created by fusing the Lifeactpeptide MGVADLIKKFESISKEE(GDPP) (linker in parentheses) tomCherry using primers 15 and 16. The codons were optimised accordingto their usages in C. owczarzaki and C. fragrantissima. The Lifeact DNAfragment was first cloned into a pTAC-2 vector (BioDynamics Laboratory)by TA cloning, and the XmaI- and XbaI-excised fragment was cloned intothe pONSY:mCherry vector.
All plasmids DNAwere obtained using the plasmid GenElute™ PlasmidMidiprep Kit (Sigma, #NA0200-UKT), lyophilised and resuspended at anapproximate concentration of 1 µg/μl in distilled water.
Transfection of Capsaspora owczarzakiCapsaspora cells were transfected using a calcium-phosphate DNAprecipitation protocol coupled with a glycerol shock. At Day 0, 2×10⁶
cells were seeded in a 12-well plate (Nunc/DDBioLab, #55428) containinggrowth medium and grown at 23°C overnight.
At Day 1, growth medium was replaced by transfection medium (seeSupplementary Materials and Methods), and incubated for 30 min at roomtemperature (∼18°C). During incubation, the DNA mix was prepared with1.271 pmol of plasmid DNA for single transfection experiments or 0.636 pmolof each plasmidDNA for co-transfection experiments in 1×HBSBuffer. CaCl2was added dropwise to a final concentration of 125 mM. The DNA mix wasinverted immediately twice and incubated for 10 min at 37°C. After incubation,the transfection medium was removed gradually and the DNA mix was addeddropwise to the centre of each well. The cell:DNA mixes were incubated for30 min at room temperature, after which the transfection medium was added toeach well. Cells were incubated for 4 h at 23°C. After incubation, mediumwasremoved and an osmotic shock was performed using 10% glycerol in 1× HBSbuffer, for 1 min at room temperature. After the osmotic shock, the glycerolsolution was replaced by growth medium and cells were incubated at 23°Covernight. Screening of positive cells was performed 18 h post transfection.More details about the transfection protocol and preparation of transfectionreagents are listed in the Supplementary Materials and Methods.
Flow cytometry and FACSTransfection efficiency was analysed 18 h post transfection. pONSY(empty) transfected cells, mock-transfected cells and nontransfected cellswere used as controls for all transfection experiments to discriminateautofluorescence and to distinguish the positive population. Forco-transfection experiments, pONSY-mCherry and pONSY-Venus single-transfected controls were used to correctly identify double-positive cells.
Cells were scraped and harvested by centrifugation at 1500 ×g for 3 minat 18°C, washed once with 500 µl 1× PBS (Sigma, #P5368-10 PAK) anddiluted to a final concentration of 1×10⁶ cells ml−1 in a minimum volume of300 µl 1× PBS. Samples were analysed by flow cytometry using a BDLSRFortessa analyser (Becton Dickinson).
To evaluate plasmid persistence over time, transfected cells from 12 wellsper experiment were pooled to homogenise the sample, were then split againinto 12 newwells and grown for 10 days. Samples were scraped and harvestedby centrifugation at 1500 ×g for 3 min at 18°C. Samples were fixed with 4%formaldehyde (Sigma-Aldrich, #F8775-4X25ML) in 1× PBS for 10 min at18°C andwashed oncewith 500 µl 1× PBS (Sigma, #P5368-10 PAK). Finally,cells were re-suspended in 400 µl 1× PBS and kept at 4°C until analysed.
SSC-A and FSC-A parameters were used to detect populations of cells(P1). Single cells were gated by FSC-H and FSC-A (P2). Around 100,000
events were recorded from P2, whenever possible. Venus-positive cells (P+or Q1) were detected using a 488 nm laser with a 530/28 bandpass filter(green fluorescence) and differentiated from autofluorescent cells with a670/50 bandpass filter.
mCherry-positive cells (P+ or Q4) were detected using a 561 nm laserwith a 610/20 bandpass filter (red fluorescence) and differentiatedfrom autofluorescent cells with a 780/60 bandpass filter. Around 2000events in the population expressing both Venus and mCherry (Q2) wererecorded.
For immunofluorescence validation, pONSY-Venus transfected cellswere harvested as before and diluted to a concentration of 1×10⁷ cells ml−1
in a minimum volume of 500 µl 1× PBS. Cells from nine replicates werepooled. Then, 40,000 Venus-positive cells (P+) and 1 million Venus-negative cells (P−) were sorted using a BD FACSAria II SORP flowcytometer cell sorter (Becton Dickinson) equipped with a 100 µm nozzle.The cell population (P2) was gated as before. P+ and P−were detected usinga 488 nm laser with a 525/50 bandpass filter (green fluorescence) anddifferentiated from autofluorescent cells with a 605/40 bandpass filter. Flowcytometry datawere visualised and analysed using FlowJo software (FlowJoLLC, version 9.9.3).
ImmunostainingSorted cells were collected in 200 µl of 1× PBS and seeded in a Nunc glass-bottom dish (Thermo Fisher Scientific, #150680) previously treated with200 µl of 20 µg ml−1 fibronectin (Sigma-Aldrich, #F1141-2MG) overnightat 4°C. Cells were incubated for 3 h at 23°C, then 1× PBS was substitutedwith 200 µl growth medium and grown overnight at 23°C.
Cells were fixed for 5 min at room temperature with 4% formaldehyde in1× PBS and washed once with 200 µl 1× PBS. Cells were then blocked for30 min at room temperature in blocking solution [1% bovine serum albumin(Sigma-Aldrich, #A3294-10G), 0.1%Triton-X100 (Sigma-Aldrich, X100) in1× PBS] and incubated for 1.5 h at room temperature with 1:100 anti-greenfluorescent protein (GFP) primary antibody (Abcam, ab5450, LotGR277059-1) in blocking solution [Venus is an improved version of GFP(Nagai et al., 2002)]. Cells were washed twice for 10 min in blocking solutionand incubated for 1.5 h in the dark at room temperature with 1:1000 AlexaFluor 568 goat anti-rat IgG (Life Technologies, A11077, Lot 1512105) inthe blocking solution. After three washes of 10 min in 1× PBS, thepreparation was overlaid with fluorescence mounting media (DAKO/Agilent Technologies, #S3023), covered with a coverslip and sealed withnail polish.
Imaging of transfected cellsImmunostained samples were imaged using a Leica TCS SP5 II invertedconfocal microscope with a 63× immersion oil objective. Acquisitionsettings were adjusted using Venus-positive cells without primary antibodyand Venus-negative cells.
For live imaging, all samples were plated in a µ-Slide 4-well glass-bottomdish (Ibidi, #80427) and grown overnight at 23°C. In the case of pONSY-H2B:Venus transfected cell samples, plated cells were washed once with200 µl 1× PBS, fixed for 5 min at room temperature with 4% formaldehydein 1× PBS and washed again as before. Cells were covered using Vectashieldwith DAPI (Vector, #H-1200). For live imaging of the cytoskeleton, cellswere plated in a µ-Slide 4-well Ph+ glass-bottom dish (Ibidi, #80447) in800 µl of growth medium containing 0.1% low-melting agarose (Sudelab#8085). Wide-field microscopy was performed using a Zeiss Axio ObserverZ.1 epifluorescence inverted microscope equipped with LED illuminationand a Axiocam 503 mono camera.
Time-lapse videos were recorded using the same microscope. ForMovie 1, acquisition was performed at 1 frame/s (fps) and video export wasperformed at 10 fps. For Movie 2, images were taken every 10 min andvideo export was performed at 2 fps. A maximum intensity projection wasused of two slices from a z-stack.
When indicated, membrane and cytoskeleton labelling were additionallyimaged using confocal microscopy with an Andor Revolution XD SpinningDisk microscope equipped with an Andor Ixon 897E Dual Mode EM-CCDcamera. These images were deconvolved using The Huygens System 17.10-64 Multi-Processing edition software.
6
TECHNIQUES AND RESOURCES Development (2018) 145, dev162107. doi:10.1242/dev.162107
DEVELO
PM
ENT

Confocal microscopy was performed with a 63× immersion oil objectiveusing either a confocal laser scanning Leica TCS SP5 II microscope or anAndor Revolution XD Spinning Disk microscope equipped with an AndorIxon 897E Dual Mode EM-CCD camera. These images were deconvolvedusing The Huygens System 17.10-64 Multi-Processing edition software.
All images were edited using Fiji Imaging Software version 2.0.0-rc-44/1.50e (Schindelin et al., 2012).
Statistical analysisResults are shown as mean±standard deviation (s.d.) per experiment. The95% confidence intervals were calculated using the Student’s t-test. Thesignificance of differences in the percentage of positive cells from single-transfection experiments were tested using the non-parametric WilcoxonSigned Rank Test for paired samples. All statistical analyses were performedusing the R Stats Package version 3.3.1 (R Core Team, 2016).
AcknowledgementsWe thank UPF Flow Cytometry Core Facility staff for helpful discussions. We thankthe Advanced Light Microscopy Unit of the CRG for support on confocal imagesacquisition and edition. We thank Arnau Sebe-Pedros and Alex deMendoza for helpin the project design and the initial steps. We thank Omaya Dudin for fruitfuldiscussions on the manuscript. We also thank the many other people who haveworked in our lab and who have provided support and feedback over the years.
Competing interestsThe authors declare no competing or financial interests.
Author contributionsConceptualisation: H.P.-A., N.R.-R., S.R.N., I.R.-T.; Methodology: H.P.-A., N.R.-R.,A.P.-P., A.K., N.S.-P., S.R.N.; Formal analysis: H.P.-A., N.R.-R., A.P.-P., A.K.,N.S.-P., S.R.N.; Resources: A.N., H.S.; Writing - original draft: H.P.-A., N.R.-R.;Writing - review & editing: H.P.-A., N.R.-R., A.P.-P., S.R.N., I.R.-T.; Supervision:I.R.-T.; Funding acquisition: I.R.-T.
FundingThis work was supported by European Research Council Starting (ERC-2007-StG-206883) and Consolidator (ERC-2012-Co-616960) grants, and a grant (BFU2014-57779-P) from Ministerio de Economıa y Competitividad (MINECO) to I.R.-T., whichwas co-funded by the European Regional Development Fund (fondos FEDER). Wealso acknowledge financial support from Secretaria d’Universitats i Recerca delDepartament d’Economia i Coneixement de la Generalitat de Catalunya (Project2014 SGR 619) and ‘Formacion del Profesorado Universitario (FPU13/01840)’ fromMinisterio de Educacion, Cultura y Deporte (MECD) PhD fellowship to N.R.-R. and‘la Caixa’ Grant for Doctoral Studies from ‘la Caixa’ Banking Foundation (Spain) toA.P.-P. We also acknowledge financial support for H.S. from Japan Society for thePromotion of Science (KAKENHI 16K07468) and research grants from the Novartisfoundation for the Promotion of Science, ITOH Science Foundation, and NaitoFoundation.
Data availabilityCapsaspora expression vectors have been deposited in Addgene(www.addgene.org) under the following accession numbers: pONSY (empty)(111873), pONSY-mCherry (111874), pONSY-Venus (111875), pONSY-Lifeact:mCherry (111876), pONSY-CoH2B:Venus (111877) and pONSY-CoNMM:mCherry(111878). The Capsaspora transfection protocol has been uploaded to protocols.iounder dx.doi.org/10.17504/protocols.io.p4adqse
Supplementary informationSupplementary information available online athttp://dev.biologists.org/lookup/doi/10.1242/dev.162107.supplemental
ReferencesBuerli, T., Pellegrino, C., Baer, K., Lardi-Studler, B., Chudotvorova, I., Fritschy,J.-M., Medina, I. and Fuhrer, C. (2007). Efficient transfection of DNA or shRNAvectors into neurons using magnetofection. Nat. Protoc. 2, 3090-3101.
Cavalier-Smith, T. (2017). Origin of animal multicellularity: precursors, causes,consequences—the choanoflagellate/sponge transition, neurogenesis and theCambrian explosion. Philos. Trans. R. Soc. B Biol. Sci. 372, 20150476.
de Mendoza, A., Sebe-Pedros, A., Sestak, M. S., Matejcic, M., Torruella, G.,Domazet-Loso, T. and Ruiz-Trillo, I. (2013). Transcription factor evolution ineukaryotes and the assembly of the regulatory toolkit in multicellular lineages.Proc. Natl. Acad. Sci. USA 110, E4858-E4866.
Ensenauer, R., Hartl, D., Vockley, J., Roscher, A. A. and Fuchs, U. (2011).Efficient and gentle siRNA delivery by magnetofection. Biotech. Histochem. 86,226-231.
Fairclough, S. R., Chen, Z., Kramer, E., Zeng, Q., Young, S., Robertson, H. M.,Begovic, E., Richter, D. J., Russ, C., Westbrook, M. J. et al. (2013).Premetazoan genome evolution and the regulation of cell differentiation in thechoanoflagellate Salpingoeca rosetta. Genome Biol. 14, R15.
Felgner, P. L., Gadek, T. R., Holm, M., Roman, R., Chan, H. W., Wenz, M.,Northrop, J. P., Ringold, G. M. and Danielsen, M. (1987). Lipofection: a highlyefficient, lipid-mediated DNA-transfection procedure. Proc. Natl. Acad. Sci. USA84, 7413-7417.
Gaudet, P., Pilcher, K. E., Fey, P. and Chisholm, R. L. (2007). Transformation ofDictyostelium discoideum with plasmid DNA. Nat. Protoc. 2, 1317-1324.
Graham, F. L. and van der Eb, A. J. (1973). A new technique for the assay ofinfectivity of human adenovirus 5 DNA. Virology 52, 456-467.
Grau-Bove, X., Torruella, G., Donachie, S., Suga, H., Leonard, G., Richards,T. A. and Ruiz-Trillo, I. (2017). Dynamics of genomic innovation in the unicellularancestry of animals. eLife 6, e26036.
Grosjean, F., Bertschinger, M., Hacker, D. L. and Wurm, F. M. (2006). Multipleglycerol shocks increase the calcium phosphate transfection of non-synchronizedCHO cells. Biotechnol. Lett. 28, 1827-1833.
Guo, L., Wang, L., Yang, R., Feng, R., Li, Z., Zhou, X., Dong, Z., Ghartey-Kwansah, G., Xu, M. M., Nishi, M. et al. (2017). Optimizing conditions for calciumphosphate mediated transient transfection. Saudi J. Biol. Sci. 24, 622-629.
Jordan, M. and Wurm, F. (2004). Transfection of adherent and suspended cells bycalcium phosphate. Methods 33, 136-143.
Jordan, M., Schallhorn, A. and Wurm, F. M. (1996). Transfecting mammaliancells: optimization of critical parameters affecting calcium-phosphate precipitateformation. Nucleic Acids Res. 24, 596-601.
King, N. (2004). The unicellular ancestry of animal development. Dev. Cell 7,313-325.
Knoll, A. H. (2011). The multiple origins of complex multicellularity. Annu. Rev.Earth Planet. Sci. 39, 217-239.
Lerche, K. and Hallmann, A. (2013). Stable nuclear transformation of Eudorinaelegans. BMC Biotechnol. 13, 1-19.
Lerche, K. and Hallmann, A. (2014). Stable nuclear transformation of Pandorinamorum. BMC Biotechnol. 14, 1-16.
Levin, T. C., Greaney, A. J., Wetzel, L. and King, N. (2014). The rosetteless genecontrols development in the choanoflagellate S. rosetta. eLife 3, e04070.
Marshall, W. L., Celio, G., McLaughlin, D. J. and Berbee, M. L. (2008). Multipleisolations of a culturable, motile Ichthyosporean (Mesomycetozoa, Opisthokonta),Creolimax fragrantissima n. gen., n. sp., from marine invertebrate digestive tracts.Protist 159, 415-433.
Maurer-Stroh, S., Eisenhaber, B. and Eisenhaber, F. (2002). N-terminal N-myristoylation of proteins: refinement of the sequence motif and its taxon-specificdifferences. J. Mol. Biol. 317, 523-540.
Nagai, T., Ibata, K., Park, E. S., Kubota, M., Mikoshiba, K. and Miyawaki, A.(2002). A variant of yellow fluorescent protein with fast and efficient maturation forcell-biological applications. Nat. Biotechnol. 20, 87-90.
Nellen, W., Silan, C. and Firtel, R. A. (1984). DNA-mediated transformation inDictyostelium discoideum: regulated expression of an actin gene fusion.Mol. Cell.Biol. 4, 2890-2898.
Nichols, S. A., Roberts, B. W., Richter, D. J., Fairclough, S. R. and King, N.(2012). Origin of metazoan cadherin diversity and the antiquity of the classicalcadherin/β-catenin complex. Proc. Natl. Acad. Sci. USA 109, 13046-13051.
R Core Team (2016). R: A Language and Environment for Statistical Computing.Vienna, Austria: R Foundation for Statistical Computing. URL: https://www.R-project.org/.
Richter, D. J. and King, N. (2013). The genomic and cellular foundations of animalorigins. Annu. Rev. Genet. 47, 509-537.
Riedl, J., Crevenna, A. H., Kessenbrock, K., Yu, J. H., Neukirchen, D., Bista, M.,Bradke, F., Jenne, D., Holak, T. A., Werb, Z. et al. (2008). Lifeact: a versatilemarker to visualize F-actin. Nat. Methods 5, 605-607.
Rokas, A. (2008). The origins of multicellularity and the early history of the genetictoolkit for animal development. Annu. Rev. Genet. 42, 235-251.
Ruiz-Trillo, I., Burger, G., Holland, P.W. H., King, N., Lang, B. F., Roger, A. J. andGray, M. W. (2007). The origins of multicellularity: a multi-taxon genome initiative.Trends Genet. 23, 113-118.
Schiedlmeier, B., Schmitt, R., Muller, W., Kirk, M. M., Gruber, H., Mages, W. andKirk, D. L. (1994). Nuclear transformation of Volvox carteri. Proc. Natl. Acad. Sci.USA 91, 5080-5084.
Schindelin, J., Arganda-Carreras, I., Frise, E., Kaynig, V., Longair, M., Pietzsch,T., Preibisch, S., Rueden, C., Saalfeld, S., Schmid, B. et al. (2012). Fiji: anopen-source platform for biological-image analysis. Nat. Methods 9, 676-682.
Schultheiss, K. P., Suga, H., Ruiz-Trillo, I. and Miller, W. T. (2012). Lack of Csk-mediated negative regulation in a unicellular Src Kinase. Biochemistry 51,8267-8277.
Sebe-Pedros, A., Roger, A. J., Lang, F. B., King, N. and Ruiz-trillo, I. (2010).Ancient origin of the integrin-mediated adhesion and signaling machinery. Proc.Natl. Acad. Sci. USA 107, 10142-10147.
7
TECHNIQUES AND RESOURCES Development (2018) 145, dev162107. doi:10.1242/dev.162107
DEVELO
PM
ENT

Sebe-Pedros, A., de Mendoza, A., Lang, B. F., Degnan, B. M. andRuiz-Trillo, I. (2011). Unexpected repertoire of metazoan transcription factorsin the unicellular holozoan Capsaspora owczarzaki. Mol. Biol. Evol. 28,1241-1254.
Sebe-Pedros, A., Ariza-Cosano, A., Weirauch, M. T., Leininger, S., Yang, A.,Torruella, G., Adamski, M., Adamska, M., Hughes, T. R., Gomez-Skarmeta,J. L. et al. (2013a). Early evolution of the T-box transcription factor family. Proc.Natl. Acad. Sci. USA 110, 16050-16055.
Sebe-Pedros, A., Irimia, M., del Campo, J., Parra-Acero, H., Russ, C.,Nusbaum, C., Blencowe, B. J. and Ruiz-Trillo, I. (2013b). Regulatedaggregative multicellularity in a close unicellular relative of metazoa. eLife 2,e01287.
Sebe-Pedros, A., Ballare, C., Parra-Acero, H., Chiva, C., Tena, J. J., Sabido, E.,Gomez-Skarmeta, J. L., Di Croce, L. and Ruiz-Trillo, I. (2016a). The dynamicregulatory genome of Capsaspora and the origin of animal multicellularity. Cell165, 1224-1237.
Sebe-Pedros, A., Pen a,M. I., Capella-Gutierrez, S., Anto, M., Gabaldon, T., Ruiz-Trillo, I. and Sabido, E. (2016b). High-Throughput proteomics reveals theunicellular roots of animal phosphosignaling and cell differentiation. Dev. Cell 39,186-197.
Sebe-Pedros, A., Degnan, B. M. and Ruiz-Trillo, I. (2017). The origin of metazoa:a unicellular perspective. Nat. Rev. Genet. 18, 498-512.
Sigal, C. T., Zhou, W., Buser, C. A., McLaughlin, S. and Resh, M. D. (1994).Amino-terminal basic residues of Src mediate membrane binding throughelectrostatic interaction with acidic phospholipids. Proc. Natl. Acad. Sci. USA91, 12253-12257.
Suga, H. and Ruiz-Trillo, I. (2013). Development of ichthyosporeans sheds light onthe origin of metazoan multicellularity. Dev. Biol. 377, 284-292.
Suga, H., Dacre, M., de Mendoza, A., Shalchian-Tabrizi, K., Manning, G. andRuiz-Trillo, I. (2012). Genomic survey of premetazoans shows deep conservationof cytoplasmic Tyrosine Kinases and multiple radiations of receptor TyrosineKinases. Sci. Signal. 5, ra35.
Suga, H., Chen, Z., de Mendoza, A., Sebe-Pedros, A., Brown, M. W., Kramer, E.,Carr, M., Kerner, P., Vervoort, M., Sanchez-Pons, N. et al. (2013). TheCapsaspora genome reveals a complex unicellular prehistory of animals. Nat.Commun. 4, 2325.
Torruella, G., de Mendoza, A., Grau-Bove, X., Anto, M., Chaplin, M. A., delCampo, J., Eme, L., Perez-Cordon, G., Whipps, C. M., Nichols, K. M. et al.(2015). Phylogenomics reveals convergent evolution of lifestyles in close relativesof animals and fungi. Curr. Biol. 25, 2404-2410.
8
TECHNIQUES AND RESOURCES Development (2018) 145, dev162107. doi:10.1242/dev.162107
DEVELO
PM
ENT
Related Documents


